Condition-Based Maintenance: Algorithms and Applications...
23
Condition-Based Maintenance: Algorithms and Applications for Embedded High Performance Computing 1 Bonnie Holte Bennett, 2 Knowledge Partners of Minnesota, Inc., 3 George Hadden, Ph.D. 1 University of St. Thomas, 2115 Summit Avenue OSS 301, St. Paul, MN 55105, 651-962-5509 [email protected] 2 9 Salem Lane, Suite 100, St. Paul, MN 55118-4700, 612-720-4960 [email protected] 3 Honeywell Technology Center, 3660 Technology Drive, Minneapolis, MN 55418, 612-951-7769 [email protected] Abstract. Condition based maintenance (CBM) seeks to generate a design for a new ship wide CMB system that performs diagnoses and failure prediction on Navy shipboard machinery. Eventually, a variety of shipboard systems will be instrumented with embedded high-performance processors to monitor equipment performance, diagnosis failures, and predict anticipated failures. To illustrate the general principles of our design, we are currently building a research prototype of the CBM system that applies to the shipboard chilled water system. 1 Introduction System health management is a concerted effort with applicability to airline maintenance operations and support, refineries and other chemical processing facilities, commercial aircraft, and sensor interface modules for the space shuttle operational maintenance system. The current effort is a three-year demonstration of concept scheduled to conclude in late 1999. A team is accomplishing this work with members from industry, government labs, and academia. Our partners include The Georgia Institute of Technology, and PredictDLI. This paper will concern work on knowledge fusion performed by Knowledge Partners of Minnesota, Inc. (KPMI), rule-based system analysis by Graduate Programs in Software (GPS) at the University of St. Thomas, St. Paul, Minnesota, and system integration by Honeywell technology Center (HTC). The CBM program is extremely ambitious. Eventual implementations will instrument thousands (perhaps tens of thousands) of replaceable parts on shipboard systems. Fleet-wide, thousands of embedded processors will collect millions of data points per second of data from tens of thousands of locations each. These data will be
Transcript of Condition-Based Maintenance: Algorithms and Applications...

Condition-Based Maintenance: Algorithms andApplications for Embedded High Performance
Computing
1Bonnie Holte Bennett, 2 Knowledge Partners of Minnesota, Inc., 3 George Hadden,Ph.D.
1University of St. Thomas, 2115 Summit Avenue OSS 301, St. Paul, MN 55105,651-962-5509
[email protected] 9 Salem Lane, Suite 100, St. Paul, MN 55118-4700, 612-720-4960
[email protected] Honeywell Technology Center, 3660 Technology Drive, Minneapolis, MN 55418,
Abstract. Condition based maintenance (CBM) seeks to generate a design for anew ship wide CMB system that performs diagnoses and failure prediction onNavy shipboard machinery. Eventually, a variety of shipboard systems will beinstrumented with embedded high-performance processors to monitor equipmentperformance, diagnosis failures, and predict anticipated failures. To illustratethe general principles of our design, we are currently building a researchprototype of the CBM system that applies to the shipboard chilled water system.
1 Introduction
System health management is a concerted effort with applicability to airlinemaintenance operations and support, refineries and other chemical processingfacilities, commercial aircraft, and sensor interface modules for the space shuttleoperational maintenance system. The current effort is a three-year demonstration ofconcept scheduled to conclude in late 1999.
A team is accomplishing this work with members from industry, government labs,and academia. Our partners include The Georgia Institute of Technology, andPredictDLI. This paper will concern work on knowledge fusion performed byKnowledge Partners of Minnesota, Inc. (KPMI), rule-based system analysis byGraduate Programs in Software (GPS) at the University of St. Thomas, St. Paul,Minnesota, and system integration by Honeywell technology Center (HTC).
The CBM program is extremely ambitious. Eventual implementations willinstrument thousands (perhaps tens of thousands) of replaceable parts on shipboardsystems. Fleet-wide, thousands of embedded processors will collect millions of datapoints per second of data from tens of thousands of locations each. These data will be

processed by local software, and the results will be passed on to local “dataconcentrators” (DCs) that will concentrate reports from a number of different sensorsvia a variety of specialized analyzers, for example DLI’s Expert Alert expert systemfor vibration analysis. Results from hundreds of DCs per ship will be correlated at asystem level in another processor, the Prognostic/Diagnostic Monitoring Engine(PDME). The result is evident: significant data loads, multiple embedded processors,and critical high performance computing needs.
We are currently designing and refining a Machinery Prognostic and DiagnosticSystem (MPROS) system architecture with open interfaces to provide machinerycondition and raw sensor data to other shipboard systems such as ICAS (IntegratedCondition Assessment System, a product from IDAX). We have implemented anObject-Oriented Ship Model (OOSM) and knowledge fusion algorithms to integratethe data at PDME level.
The knowledge fusion algorithms currently use class heuristics andDempster/Schafer probability reasoning to scrutinize incoming reports for correlationwith others. We expect to implement a Bayesian Network probability theory whensufficient data exists for a priori dependence calculations. Our current prognosticextrapolation uses worst-case scenarios for failure prediction, but next generationsoftware will use more complex failure analysis using historical data, and learning torefine its estimates over time.
The high-performance computing issues related to this work are challenging, asdescribed above, the data rates are extremely high, data overload is rampant, and weare working to articulate the specific challenges here.
1.1 MPROS
The ONR CBM system, called MPROS (for Machinery Prognostics andDiagnostics System), is a distributed, open, extensible architecture for housingmultiple on-line diagnostic and prognostic algorithms. Additionally, our prototypecontains four sets of algorithms aimed specifically at centrifugal chillers. These are:
1 DLI’s (a company in Bainbridge Island, Washington that has a Navycontract for CBM on shipboard machinery) vibration based expertsystem adapted to run in a continuous mode.
2 State Based Feature Recognition (SBFR), an HTC-developedembeddable technique that facilitates recognition of time-correlatedevents in multiple data streams. Originally developed for Space StationFreedom, this technique has been used in a number of NASA relatedprograms.
3 Wavelet-Neural Network (WNN) diagnostics and prognostics developedby Professor George Vachtsevanos at Georgia Tech. This technique is,like DLI’s, aimed at vibration data, however, unlike DLI’s, their
algorithm will excel in drawing conclusions from transitory phenomenarather than steady state data.
4 Fuzzy Logic diagnostics and prognostics also developed by GeorgiaTech which draws diagnostic and prognostic conclusions from non-vibrational data.
Since these algorithms (and others we may add later) have overlapping areas ofexpertise, they may sometimes disagree about what is ailing the machine. They mayalso reinforce each other by reaching the same conclusions from similar data. In thesecases, another subsystem, called Knowledge Fusion, is invoked to make some sense ofthese conclusions. We use a technique called Dempster-Shafer Rules of Evidence tocombine conclusions reached by the various algorithms. It can be extended to handleany number of inputs.
MPROS is distributed in the following sense: Devices called Data Concentrators(DC) are placed near the ship’s machinery. Each of these is a computer in its ownright and has the major responsibility for diagnostics and prognostics. The algorithmsdescribed above run on the DC. Conclusions reached by these algorithms are thensent over the ship’s network to a centrally located machine containing the other part ofour system – the Prognostic/Diagnostic/Monitoring Engine (PDME). KF is located atthe PDME. Also on the PDME is the Object Oriented Ships Model (OOSM). TheOOSM represents parts of the ship (e.g. compressor, chiller, pump, etc.) and a numberof relationships among them (part-of, proximity, kind-of, etc.). It also serves as arepository of diagnostic conclusions – both those of the individual algorithms andthose reached by KF. Communication among the DC’s and the PDME is done usingDCOM (Distributed Common Object Modules), a standard developed by Microsoft.
The MPROS program is designed to comprise two phases. The first phase, whichwe have just finished, will see MPROS installed and running in the lab. The secondphase will extend MPROS’s capability somewhat and install it on a ship. The currentplan is to install it on the Navy Hospital Ship, Mercy, in San Diego.
1.2 Mission
Our central mission in this project is to design a shipwide CBM system to predictremaining life of all shipboard mechanical equipment. However, implementation ofsuch a system would be much too ambitious for the current project. In light of this, wehave chosen to illustrate the general principles of our design by implementing it in aspecific way on the Centrifugal Chilled Water System. The result of this philosophy isthat occasionally we will choose a more general way of solving a problem over a“centrifugal chiller-specific” solution.

2 Why Centrifugals?
There were two main reasons for our choice of centrifugal chillers: Systemcomplexity and commercial applicability.
These A/C systems combine several rotating machinery equipment types (i.e.induction motors, gear transmissions, pumps, and centrifugal compressors) with afluid power cycle to form a complex system with several different parameters tomonitor. This dictates the requirement for a correspondingly complex and versatilemonitoring system. Dynamic vibration signals must be acquired using high samplingrates and complex spectrum and waveform analysis. Slower changing parameterssuch as temperatures and pressures must also be monitored, but at a lower frequencyand can be treated as scalars rather than vectors as with vibration spectra.
All of these monitored parameters and analysis techniques are combined using aversatile diagnostic system. The final product has the inherent capability ofdiagnosing not just the whole A/C system, but each of its parts as well, making it apotentially very useful tool for monitoring any pump, motor, gearset, or centrifugalcompressor in the fleet.
Secondly, the selection of A/C system as the subject will provide a high probabilityof commercial applicability of the resultant monitoring system. There are a great dealof facilities industrial, military, commercial and institutional that use large centrifugalchiller based A/C systems throughout the US and the world.
Machinery Sensors
DLIExpertSystem
SBFRWaveletNeural
Network
DCOM Interface
Database
MUX MUX
DCOM Interface
OOShip
Model
KF
PDMEResident
Algorithms
UserInterface
DC
CrystalCard
PDME Executive
PCDC
Controlsignals
Ship’s Network
FuzzyLogic

Fig. 1. The MPROS System
3 Software
Figure 1 shows a diagram of the MPROS system. Here we describe the variousparts.
3.1 PDME
The Prognostic/Diagnostic Monitoring Engine (PDME) is the logical center of theMPROS system. Diagnostic and prognostic conclusions are collected from DC-resident algorithms as well as PDME-resident algorithms. Fusion of conflicting andreinforcing source conclusions is performed to form a prioritized list for the use ofmaintenance personnel.
The PDME is implemented on a Windows NT platform as a set of communicatingservers built using Microsoft’s Component Object Model (COM) libraries andservices. Choosing COM as the interface design technique has allowed us to buildsome components in C++ and others in Visual Basic, with an expected improvementin development productivity as the outcome. Some components were prototyped usingMicrosoft Excel and we continue to use Excel worksheets and macros to drive sometesting of the system. Communications between DC components and PDMEcomponents depend on Distributed COM (DCOM) services built into Microsoft’soperating systems.
3.2 User interface
As shown in Fig. 2. , an interface to the MPROS conclusions has been built. Thesample screen shown indicates that for machine A/C Compressor Motor 1, sixcondition reports from four different knowledge sources (expert systems) have beenreceived, some conflicting and some reinforcing.
After these reports are processed by the Knowledge Fusion component, thepredictions of failure for each machine condition group are shown at the bottom of thescreen.

Fig. 2. MPROS User Interface
This display is updated as new reports arrive at the PDME and are accumulated inthe OOSM.
3.3 Status
The PDME has been implemented and running since August, 1998. This work hasincluded a number of specification, analysis and design tasks. An RF survey wascompleted on the USNS Comfort, a Navy Hospital ship in San Diego. A failureeffects mode analysis (FMEA) was completed and used to select 12 candidate failuremodes. This work is being integrated with industry standards such as MachineryManagement Open Systems Alliance (MIMOSA), and related work at Penn State andBBN. Significant completed milestones include:
• Demonstrated an object-oriented Level5 Object ™ simulation of Carrier Chillerstartup.
• Instrumented a lab with an optical RIMS (Resonant Integrated Micro-Structure –a type of MEMS) for temperature, and are investigating it for accelerometer.
• Installed a state of the art DLI Fulltime ™ system on CVN-72 (Lincoln), theComfort, and at an HTC lab.
• Completed phase 1 design and implementation.• Integrated a vibration rule-base, and state based feature recognition for diagnosis.• Implemented knowlege fusion with prognostic reporting for “time to failure”
estimates.• Designed for integration of Wavelet Neural Net and Fuzzy Logic analysis from
Georgia Tech.

3.4 Going Forward
Preparation plans for shipboard deployment include continued testing andmonitoring, as the installed system will be disconnected from our labs for months at atime.
4 Object Oriented Ship Model
4.1 Objectives
The Object Oriented Ship Model (OOSM) is a persistent repository for machinerystate information used for communication between the various prognostic anddiagnostic software modules. In addition to diagnostic and prognostic reports, theOOSM also models the physical, mechanical and energy characteristics of themachinery being monitored. Exposing an integrated programming interface to all ofthis information eases the development of new knowledge-based algorithms fordiagnostics and prognostics.
4.2 Object Model
An object-oriented design was chosen to provide a consistent interface to all thedevelopers using the OOSM to store, retrieve and monitor changes to information ofinterest to MPROS components.
Entities in the OOSM are modeled as objects with properties and relationships toother entities. Some of the OOSM objects represent physical entities such as sensors,motors, compressors, decks, and ships while other OOSM objects represent moreabstract items such as a failure prediction report or a knowledge source. Somecommon properties include name, manufacturer, energy usage, capacity, and location.Common relationships include “part-of”, whole and refers-to.
As part of easing the use of an object-oriented model for developers, the persistenceis entirely managed in the background. In fact, save for retrieving the first object in aconnected graph of objects, no understanding of the persistence mechanism isnecessary.
4.3 Contents
While the preceding section described the form of objects in the OOSM, thissection briefly describes the contents. We have modeled a portion of the informationabout the system under observation in the OOSM. This includes information about the

motors, compressors and evaporators in the chillers we are working with. We havealso modeled relationships between the failure predictions and the relevant equipmentto provide for a future expert system to analyze interactions between equipmentsubsystems.
As we expand the scope of equipment this system is expected to monitor, thecontents of the OOSM will expand to match.
4.4 Applications Programming Interface (API)
As mentioned in preceding sections, a consistent API for developers has beendefined. Briefly, it consists of functions to retrieve specific object instances, to viewthe values of properties, to update their properties and relationships, and to create anddelete instances. This API, based upon COM, has been used from C++, Visual Basic,and Java programs to work with the OOSM.
4.5 Events
An event model has been implemented for the OOSM, which allows clientprograms to be notified of changes to property or relationship values without the needto poll. This facility is provided by OLE Automation events, making it usable fromC++, Visual Basic and Java. The Knowledge Fusion component uses this toautomatically process failure prediction reports as they are delivered to the OOSM.The PDME browser also uses events to update it’s display for users.
4.6 Database Mapping
Persistence of object state in the OOSM is implemented using a relational database.Object types are mapped to tables and properties and relationships are mapped tocolumns and helper tables. This mapping approach has helped in system debuggingand has proven to be very reliable in operation.
4.7 Implementation
The implementation of the OOSM is C++ using Microsoft’s Active TemplateLibrary (ATL) and Active Data Objects (ADO) library. This approach was chosenbecause of the control over object lifetime, performance, and reliability.
4.8 Status
The OOSM has been implemented and running since August, 1998.

4.9 Going Forward
As we prepare for shipboard deployment, we plan to exercise scenarios that willlikely be encountered. For example, power supply and communications are stable inour labs but may not be the same on board the ships. Simulating the range of problemsthat may arise will let us improve robustness to the point of long-term unattendedoperation.
5 Knowledge Fusion
5.1 Objectives
This section describes the objectives for knowledge fusion. It will start bydescribing the challenges presented by the data received as input for knowledgefusion. Then, it will continue to describe the functions required to deal with theseinputs.
Knowledge fusion is the coordination of individual data reports from a variety ofsensors. It is higher level than pure “data fusion” which generally seeks to correlatecommon-platform data. Knowledge fusion, for example, seeks to integrate reportsfrom acoustic, vibration, oil analysis, and other sources, and eventually to incorporatetrend data, histories, and other components necessary for true prognostics.
The knowledge fusion components must be able to accommodate inputs which areincomplete, time-disordered, fragmentary, and which have gaps, inconsistencies, andcontradictions. In addition, knowledge fusion components will have to be able tocollate, compare, integrate, and interpret the data from a variety of sources.
In order to this, it must provide inference control that accommodates a variety ofinput data, and fusion algorithms with the ability to deal with disparate inputs.
Knowledge fusion follows the general format:1 New reports arriving to the PDME are posted in the OOSM.
2 New reports posted in the OOSM generate “new data” messages to the knowledgefusion components.
3 The knowledge fusion components access the newly arrived data from the OOSM.They perform knowledge fusion of diagnostic reports and knowledge fusion ofprognostic reports.
4 Conclusions from the knowledge fusion components are posted to the OOSM andpresented in user displays in the graphical user interface.

5.2 Implementation
To date, two levels of knowledge fusion have been implemented one for diagnosticsand one for prognostics.
5.3 Knowledge Fusion for Diagnostics
The current approach for implementing knowledge fusion for diagnostics usesDempster-Shafer belief maintenance for correlating incoming reports. This isfacilitated by use of a heuristic that groups similar failures into logical groups.
Dempster-Shafer theory is a calculus for qualifying beliefs using numericalexpressions. Specifically, given two sets of beliefs. For example, given a belief of40% that A will occur and another belief of 75% that B or C will occur, it willconcluded that A is 14% likely, “B or C” is 64% likely and there is 22% of beliefassigned to unknown possibilities. This maintenance of the likelihood of unknownpossibilities is both a differentiator and a strength of Dempster-Shafer theory. It waschosen over other approaches like Bayes Nets because they require prior estimates ofthe conditional probability relating two failures. The data is not yet available for theCBM domain.
The system was augmented by a heuristic grouping similar failures into logicalgroups. This facilitates processing and streamlines operation. The reason for this isthat Dempster-Shafer analysis looks at each failure in light of every other failurepossible, and this is required to produce the likelihood of unknown possibilities. In theCBM case, this is inadequate because this would assumes mutual exclusivity offailures, in other words, it assumes that any one failure precludes any other failures.However this is not the case in CBM, there can, in fact, be several failures at one time,and two or more of them might be independent of one another. Thus, we developedthe concept of logical groups of failures. Failures, which are all part of the samelogical groups, are related to each other (for example, one group might be electricalfailures, another lubricant failures, etc.).
Moreover, failures within a group might be mistaken for one another, so they arelogically related and should share probabilities when they are both underconsideration. Note that this does not preclude multiple failures within a group to allbe suspect concurrently, it simply ensures that they are tracked correctly and weightedcorrectly given similar failures which might be related to them.
5.4 Knowledge Fusion for Prognostics
Prognostics are defined in this system as time point, probability pairs, and lists ofthese pairs. So for example, a prognostic of (3 months, .1) would indicate that thesystem has a 10% likelihood of failure within 3 months time from now. Subsequently,a prognostic list of ((2 weeks, .1) (1 month, .5) (2 months, .9)) would indicate a

likelihood of failure of 10% within 2 weeks, 50% at 1 month and 90% in 2 months.Knowledge fusion for prognostics is the combination of these lists of time and failurelikelihoods. Our approach in phase one has been to combine the lists taking the mostconservative estimate at any given time period, and interpolating a smooth curve frompoint to point.
So, for example, if we have a prognostic for a given component that indicates it willperform well for 3 months, then experience some trouble making it as likely to breakas not by 4 months, and almost surely break by 5 months: ((3 months, .01) (4 months,.5) (5 months. 99)) and we need to combine this with another report showing that thesame component will experience some small trouble at 4 1/2 months ((4.5 months,.12)), then we will ignore the second report, and stick with the first which is moreconservative.
If, however, the second report indicates a much higher likelihood of failure ((4.5months, .95)) then this report would dominate, and the extrapolation of the curvebeyond this point would indicate an even earlier demise of the component that theoriginal which would be some time after 5 months.
5.5 Interfaces Provided
The general incoming report format may contain the following data fields (not allreports need use all fields):
• DC ID–Identifyer of the data concentrator source of this report.• KS ID–Identifyer of the knowledge source generating this report.• Timestamp–Time that the report was issued.• Machine ID–Identifyer of the machine for which this report is generated.• Machine condition–Type of failure (e.g., motor imbalance, motor rotor bar
problem, pump bearing housing looseness, etc.).• Severity–DLI issues a severity rating of slight, moderate, serious, or extreme.• Belief–Some of DLI’s reports have a belief value less than 1.0 (on a scale of 0 to
1).• Explanation–There may be an explanation about the diagnosis.• Recommendation–This may indicate what action should be taken.• Prognostic vector–This vector of time point, probability pairs indicate projected
likelihood of failure in the given time period.
5.6 Knowledge Fusion Outputs
Diagnostic knowledge fusion generates a new fused belief whenever a diagnosticreport arrives for a suspect component. This updates the belief for that suspectcomponent and for every other failure in the logical group for that component. It alsoupdates the belief of “unknown” failure for that logical group for that component.

Prognostic knowledge fusion generates a new prognostic vector for each suspectcomponent whenever a new prognostic report arrives.
5.7 Resident Algorithms
As the reader can see from Figure 1, the PDME has the capability to host prognosticand diagnostic algorithms. Some reasons for placing the algorithms in the PDMErather than the DC include: the algorithm requires data from widely separate parts ofthe ship, the algorithm can reason from PDME resident components (a model-baseddiagnostic and prognostic system, for instance, might use only the OOSM), and so on.
Currently, our Phase 1 system does not place any diagnostic/prognostic algorithmsin the PDME – all of them run in the data concentrators.
5.8 Data Concentrator
The data concentrator is a open architecture ODBC compliant relational databasedesigned to store all of the instrumentation configuration information, machineryconfiguration information, test schedules, resultant measurements, diagnostic results,and condition reports. The database design is a commercially available database.
The DC software is coordinated by an event scheduler. It coordinates standardvibration test and including data acquisition and communication of the results. Insimilar fashion, the scheduler conducts wavelet and neural network testing andanalysis, and state based feature recognition routines to collect and analyze processvariables. The data is processed and then sent to an expert system DLL which appliesstored rules for each equipment type and derives the diagnoses. The DLL then passesthe results back to the DC database. Each of the components extract information fromand store data in the DC database which is configured as a database server and can beaccessed by client PC’s on the network. In this way, the PDME or any other client cancommand the scheduler to conduct another test and analysis routine.
6 Prognostic/Diagnostic Algorithms
6.1 DLI Expert System
Currently, all standard machinery vibration FFT analysis and associated diagnosticsin the Data Concentrator are handled by the DLI expert system. Over the past tenyears, this system has been installed in hundreds of industrial and manufacturingfacilities in addition to a variety of Navy ships. In one study, it was found that thesystem exceeds 95% agreement with human expert analysts for machinery aboard theNimitz class ships. The DLI expert system provides an intermediate level of sensor

and knowledge fusion. The frame based rules application method employed allowsthe spectral vibration features to be analyzed in conjunction with process parameterssuch as load or bearing temperatures to arrive at a more accurate and knowledgeablemachinery diagnosis.
For example since some compressors vibrate more at certain frequencies whenunloaded, the DLI expert system rule for bearing looseness can be sensitized toavailable load indicators (such as pre-rotation vane position) in order to ensure that afalse positive bearing looseness call is not made when the compressor enters a lowload period of operation. This kind of knowledge and sensor fusion is found again atthe PDME that ascertains the relative believability of the various diagnostic systemsand derives a reasonable conclusion. It is however advantageous for the vibrationexpert system to utilize all available known system responses when analyzing thevibration patterns because it minimizes the necessary PDME decisions and improvesoverall system accuracy.
An elementary level of machinery prognostics has always been provided by the DLIexpert system which since its inception, has provided a numerical severity score alongwith the fault diagnosis. This numerical score is interpreted through empiricalmethods which map it into four gradient categories.
These categories are Slight, Moderate, Serious and Extreme and correspond toexpected lengths of time to failure described loosely as: no foreseeable failure, failurein months, weeks, and days of operation. This approach to prognostics was developedand improved upon during the last 10 years and was refined further for the DataConcentrator and the PDME through the introduction of believability factors for eachof the diagnoses. These believability factors are based on DLI’s statistical databasethat demonstrates the individual accuracy of each diagnosis by tracking how ofteneach was reversed or modified by a human analyst prior to report approval.
6.2 Wavelet Neural Networks
The Wavelet Neural Network (WNN) belongs to a new class of neural networkswith such unique capabilities as multi-resolution and localization in addressingclassification problems. For fault diagnosis, the WNN serves as a classifier so as toclassify the occurring faults. CMB uses a fault diagnostic system based on the WNN.
Critical process variables are monitored via appropriate sensors. Features extractedfrom input data are organized into a feature vector, which is fed into the WNN. Then,the WNN carries out the fault diagnosis task. In most cases, the direct output of theWNN must be decoded in order to produce a feasible format for display or action.Results of the WNN can be used to perform fault diagnosis via classification usinginformation sucha as the peak of the signal amplitude, standard deviation, cepstrum,DCT coefficients, wavelt maps, temperature, humidity, speed, and mass

6.3 State Based Feature Recognition
SBFR is a technique for the hierarchical recognition of temporally correlatedfeatures in multi-channel input. It consists of a set of several enhanced finite-statemachines operating in parallel. Each state machine can transition based on sensorinput, its own state, the state of another state machine, measured elapsed time, or anylogical combination of these. This implies that systems based on SBFR can be builtwith a layered architecture, so that it is possible use them to draw complexconclusions, such as prognostic or diagnostic decisions.
Our implementation of the SBFR system requires very little memory (100 statemachines operating in parallel and their interpreter can fit in less than 32K bytes) andcan cycle with a period of less than 4 milliseconds. It is thus ideal for embedding intothe DC. We have successfully applied SBFR-based diagnostic and prognosticmodules to several problems and platforms, including:• valve degradation and failure prediction in the Space Shuttle’s Orbital
Maneuvering System,• imminent seize-up in Electro-Mechanical Actuators through electrical current
signature analysis and other parameters, and• failure prediction in several subsystems (including Control Moment Gyro bearing
failure) in the Space Station Freedom's Attitude Determination and ControlSystem.
SBFR embedded in the DC will take as input the raw sensor data and the output ofother algorithms (e.g., DLI’s vibration analysis and FFTs) and perform trendinganalysis, feature extraction, and some diagnostics and prognostics on this data. Localknowledge gained by these techniques will be delivered to ICAS and the subsystemscontained within ICAS for further analysis and crew alerting. Some level of localalerting (e.g., indicator lights) will also be made available. Under control of theSystem Executive running in the PDME under ICAS, new finite-state machines maybe downloaded into the smart sensor. This will allow the behavior of the sensor toadapt to its data in appropriate ways. It will have, for instance, the capability to take a"closer look" at a problem that has been discovered.
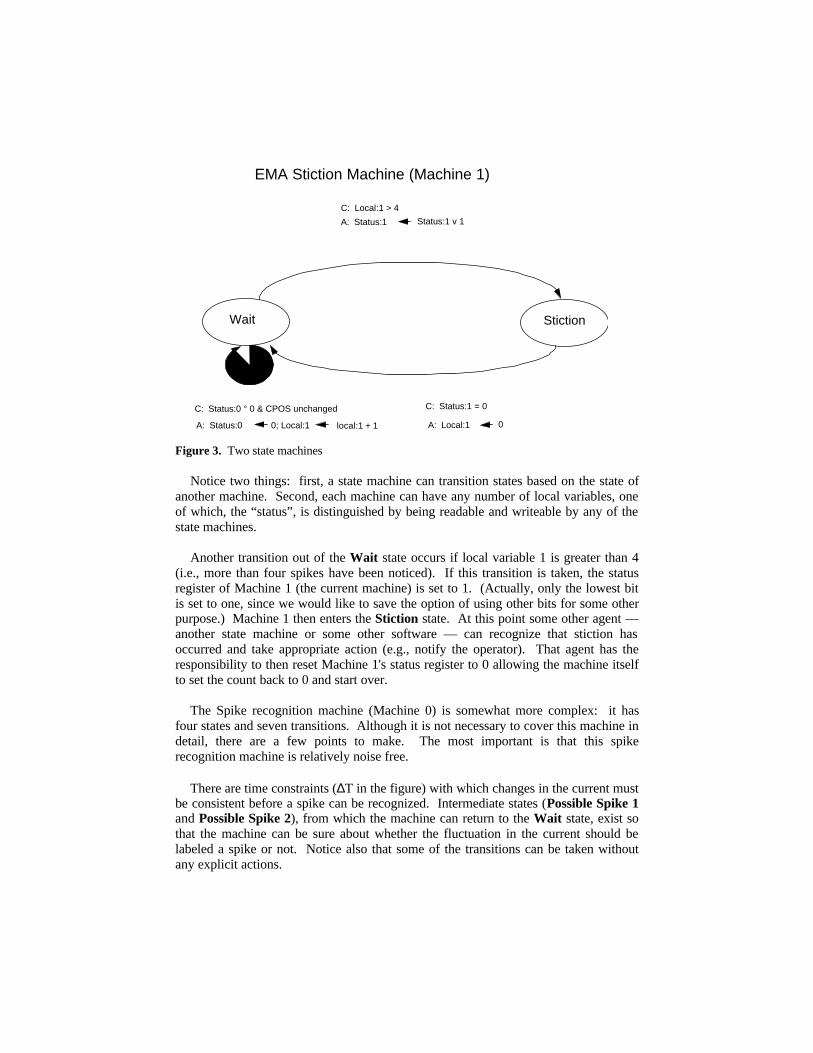
To give a sense for how SBFR works, here is an example. The two state machinesystem shown in Figure 3 was used to predict a seize-up failure mode in an electro-mechanical actuator (EMA). EMAs are essentially large solenoids meant to replacehydraulic actuators for the steering of rocket engines. Prediction of this fault was doneby recognizing stiction in the mechanism. Stiction is recognized by the two statemachines in the following way: Machine 0 recognizes spikes in the drive motorcurrent. Machine 1 counts the spikes that are not associated with a commandedposition change (CPOS). When the count is greater than 4, a stiction condition isflagged, and higher level software (e.g., the PDME) can conclude that a seize-upfailure is imminent.
We now consider these machines in more detail. Starting with Machine 1, noticethat it has two states labeled Wait and Stiction. Each state has transitions into and out

of it with labels C and A, standing for condition and action, respectively. Thecondition on one of the transitions out of the Wait state is "Status:0 - 0 & CPOSunchanged".
This means that the transition will be taken if both of the following are true: First,the status of Machine 0 (the other one) must be nonzero. This means that a spike hasoccurred. Second, no command has been issued to change the position of the EMA.If both of these are true, the action associated with this condition is executed. In thistransition, the action is 1) to set the status register of Machine 0 back to 0 so that it cancontinue looking for spikes in parallel with the actions of any other state machines and2) to increment local variable 1 (Local:1), which represents the number of spikesnoticed by Machine 1.
Current SPIKE Machine (Machine 0)
PossibleSPIKE 1
WaitPossibleSPIKE 2
SPIKEC: Current Decrease & ∆T ≤ 4
C: Current Increase
C: Status: 0 = 0A: Status:0 Status:0 v 1
C: ∆T>4
C: Current Increase & ∆T ≤ 4
C: Current Decrease & ∆T > 4
C: Current Increase & ∆ T ≤ 4
EMA Stiction Machine (Machine 1)
C: Local:1 > 4
A: Status:1 Status:1 v 1
C: Status:1 = 0
A: Local:1 0
C: Status:0 ° 0 & CPOS unchanged
A: Status:0 0; Local:1
Wait Stiction
local:1 + 1
Figure 3. Two state machines
Notice two things: first, a state machine can transition states based on the state ofanother machine. Second, each machine can have any number of local variables, oneof which, the “status”, is distinguished by being readable and writeable by any of thestate machines.
Another transition out of the Wait state occurs if local variable 1 is greater than 4(i.e., more than four spikes have been noticed). If this transition is taken, the statusregister of Machine 1 (the current machine) is set to 1. (Actually, only the lowest bitis set to one, since we would like to save the option of using other bits for some otherpurpose.) Machine 1 then enters the Stiction state. At this point some other agent —another state machine or some other software — can recognize that stiction hasoccurred and take appropriate action (e.g., notify the operator). That agent has theresponsibility to then reset Machine 1's status register to 0 allowing the machine itselfto set the count back to 0 and start over.
The Spike recognition machine (Machine 0) is somewhat more complex: it hasfour states and seven transitions. Although it is not necessary to cover this machine indetail, there are a few points to make. The most important is that this spikerecognition machine is relatively noise free.
There are time constraints (∆T in the figure) with which changes in the current mustbe consistent before a spike can be recognized. Intermediate states (Possible Spike 1and Possible Spike 2), from which the machine can return to the Wait state, exist sothat the machine can be sure about whether the fluctuation in the current should belabeled a spike or not. Notice also that some of the transitions can be taken withoutany explicit actions.

The Spike state has one transition out of it. This occurs when Machine 0’s statusregister (the current machine) is reset to 0. Recall that Machine 1 did this after it hadrecorded the existence of the spike.
The sizes of the current spike machine (Machine 0) and the stiction machine(Machine 1) are respectively 229 and 93 bytes. The interpreter that executes the SBFRsystem in the DCs is about 2000 bytes long.
7 Communication Protocols
7.1 Failure Prediction Reporting Protocol
One of the goals of the MPROS system is to encourage the incorporation of manydiverse expert systems supplying diagnostic and prognostic conclusions based uponsimilar, overlapping or entirely disjoint sensor readings. At the same time, werecognized that these diverse results must be unified into a meaningful report to thesystem’s users. To this end, a standard protocol has been defined for reporting failurepredictions to the PDME for fusion and display.
7.2 Diagnostic Data
1 KnowledgeSourceID: The unique MPROS object ID for the instance of theknowledge source.
2 SensedObjectID: The unique MPROS object ID for the sensed object to whichthis report applies.
3 MachineConditionID: The unique MPROS object ID for the diagnosed machinecondition.
4 Severity: Numeric value in range 0.0 to 1.0 indicating relative severity ofmachine condition to operation. Maximal severity is 1.0.
5 Belief: Numeric value in range 0.0 to 1.0 indicating belief that this diagnosis istrue. Maximal belief is 1.0.
6 Explanation: An optional text string (possibly very long) providing human-readable description of the diagnosis. Where information beyond defined theMachine Condition description is unnecessary or unavailable, this is allowed to beblank.

7 Recommendations: An optional text string (possibly very long) providing human-readable description of the recommended actions to take. Where informationbeyond defined Machine Condition description is unnecessary or unavailable, thisis allowed to be blank.
8 Timestamp: The timestamp for when this report should be considered "effective."
9 Additional Information: An optional text string (possibly very long) providinghuman-readable additional information.
7.3 Prognostics Vector
Zero to n ordered pairs of the form "(probability, time)." Each pair indicates theprobability that the given machine condition will lead to failure of the machine within'time' seconds from now.
8 Hardware
8.1 Prognostics/Diagnostics/Monitoring Engine
Unlike the Data Concentrator, the PDME is entirely software. It runs on anysufficiently powerful NT machine. Currently, the PDME runs in the office of one ofour developers communicating over HTC’s data network with the Data Concentratorin the basement.

Data Concentrator (DC)
Figure 4. Data Concentrator Installed at HTC
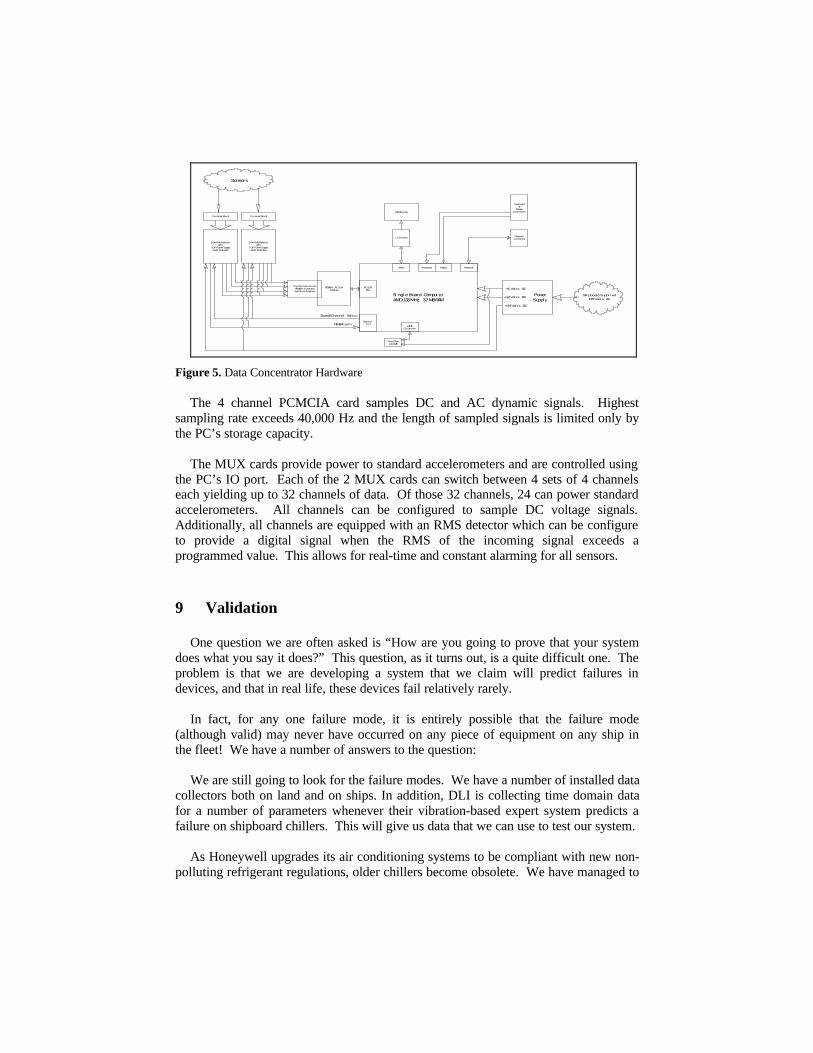
The DC hardware (figure 4 shows the HTC-installed DC) consists of a PC104single board Pentium PC (about 6”x6”) with flat screen LCD display monitor, aPCMCIA host board, a 4 channel PCMCIA DSP card, two multiplexer (MUX) cards,and a terminal bus for sensor cable connections. The operating system is Win95 andthere are connections for keyboard and mouse. Data is stored via DRAM.
The DC is enclosed in a NEMA enclosure with a transparent front door and fans forcooling. Overall dimensions are 10”x12”x4”. The system was built entirely withcommercial off the shelf components with the exception of the MUX cards which area DLI hardware subcomponent and the PCMCIA card which was modified from acommercial 2 channel unit to meet the needs of the project.
Si ngl e Board Comput erAMD 133 MHz, 32 MB RAM
PC-104Bus
DigitalI / O
Keyboard Mouse NetworkVideo
EIDEController
PCMCIA - PC-104Adapter
PowerSupply
+12 Vol ts DC
+5 Vol ts DC
+24 Vol ts DC
Crystal InstrumentsPCMCIA 4 Channel
Spectrum Analyzer
16x4 Multiplexerwith
I CP Power SupplyRMS Detectors
Terminal Block
Hard Disk1.44 GB
LCD Driver
LCD Display
NetworkConnector
Keyboard&
MouseConnectors
Shi pboard Suppl i ed115 Vol ts AC
Board/Channel Select
RMS Al arm
Sensors
16x4 Multiplexerwith
I CP Power SupplyRMS Detectors
Terminal Block
Figure 5. Data Concentrator Hardware
The 4 channel PCMCIA card samples DC and AC dynamic signals. Highestsampling rate exceeds 40,000 Hz and the length of sampled signals is limited only bythe PC’s storage capacity.
The MUX cards provide power to standard accelerometers and are controlled usingthe PC’s IO port. Each of the 2 MUX cards can switch between 4 sets of 4 channelseach yielding up to 32 channels of data. Of those 32 channels, 24 can power standardaccelerometers. All channels can be configured to sample DC voltage signals.Additionally, all channels are equipped with an RMS detector which can be configureto provide a digital signal when the RMS of the incoming signal exceeds aprogrammed value. This allows for real-time and constant alarming for all sensors.
9 Validation
One question we are often asked is “How are you going to prove that your systemdoes what you say it does?” This question, as it turns out, is a quite difficult one. Theproblem is that we are developing a system that we claim will predict failures indevices, and that in real life, these devices fail relatively rarely.
In fact, for any one failure mode, it is entirely possible that the failure mode(although valid) may never have occurred on any piece of equipment on any ship inthe fleet! We have a number of answers to the question:
We are still going to look for the failure modes. We have a number of installed datacollectors both on land and on ships. In addition, DLI is collecting time domain datafor a number of parameters whenever their vibration-based expert system predicts afailure on shipboard chillers. This will give us data that we can use to test our system.
As Honeywell upgrades its air conditioning systems to be compliant with new non-polluting refrigerant regulations, older chillers become obsolete. We have managed to

acquire one of these chillers that HTC replaced. It has been shipped to York, and weare now constructing a test plan to collect data from this chiller through carefullyorchestrated destructive testing.
Seeded faults are worth doing. Our partners in the Mechanical EngineeringDepartment of Georgia Tech are seeding faults in bearings and collecting the data.These tests have the drawback that they might not exhibit the same precursors as real-world failures, especially in the case of accelerated tests.
Honeywell, York, DLI, NRL, and WM Engineering have archives of maintenancedata that we will take full advantage of in constructing our prognostic and diagnosticmodels.
Similarly, these partners have human expertise that we are able to tap in buildingour models.
Although persuasive, these answers are far from conclusive. The authors wouldwelcome any input on how to validate a failure prediction system.
10 Current and Future Related Activities
We have just completed phase 1 of our program. The next phase calls for aninstallation on a Navy ship. Current plans are to install it on the Mercy, a hospital shipstationed in San Diego. This ship was chosen for a number of reasons:
1 It will be in a climate that is likely to require cooling during the winter shipboardtest phase of our centrifugal chiller prognostics and diagnostics system.
2 It is likely to stay stationary and not put out to sea (as, for instance, a carrierwould).
3 It contains pieces of equipment that are the target of our prognostics anddiagnostics efforts.
4 We have a good working relationship with the crew.
Other activities outside our current contract are:
The destructive centrifugal chiller test. Honeywell has donated a surpluscentrifugal chiller for use by the prognostics/diagnostics community. We are in the

process of assembling a test plan to take full advantage of this opportunity, both tovalidate our existing system and to discover new indicators of incipient failure that canbe incorporated into future versions of our and others’ systems.
1 RSVP (Reduced Shipboard manning through Virtual Presence).
2 Honeywell is teamed with Pennsylvania State University for this CBM follow-on.
3 ACI Integration. Honeywell has volunteered to lead this effort to combine theAdvanced Capability Initiatives.
These include CBM, Corrosion, Oil Debris Monitoring, and Human ComputerInteraction. Other potential CBM related activities. There are a number of these,both inside and outside our members’ companies.
10.1 Future Directions For Knowledge Fusion
Several high-level control extensions are under consideration for future extensions.First, multi-level data is represented the object-oriented ship model. We are notcurrently exploiting this fully. For example, we could reason about the health of asystem based on the health of a constituent part.
Currently, only the parts are tracked. Second, spatial reasoning using the object-oriented ship model could lead us to fuse information about spatially relatedcomponents. Examples of spatial relations are proximity (for example, a device isvibrating because a component next to it is broken and vibrating wildly) and flow.
Flows are relationships that represent either fluid flow through the system (onecomponent passing fouled fluids on to other components downstream), electrical flowor mechanical flow of physical energy. Third, temporal reasoning components couldbe implemented to scrutinize failure histories and provide better projections of futurefaults as they develop.
Two other aspects of knowledge fusion future directions will be the refinement ofspecific knowledge fusion components for diagnostics and prognostics. For example,Bayes’ Nets seem to be a promising approach to diagnostic knowledge fusion whencausal relations and a priori relationships can be teased out of historical data for thissystem.
Prognostic knowledge fusion could be improved with the addition of techniquesfrom the analysis of hazard and survival data. These approaches scrutinize historydata to refine the estimates of life-cycle performance for failures. These refined inputsto the prognostic analysis would yield better projections of future failures.