Condensate Removal
120
Condensate Removal Understanding stall
-
Upload
spirax-sarco-engineering-plc -
Category
Business
-
view
132 -
download
2
Transcript of Condensate Removal
Condensate Removal
Understanding stall

2
What is stall?
No movement of condensate = back-up in heater
Condensate Removal
3
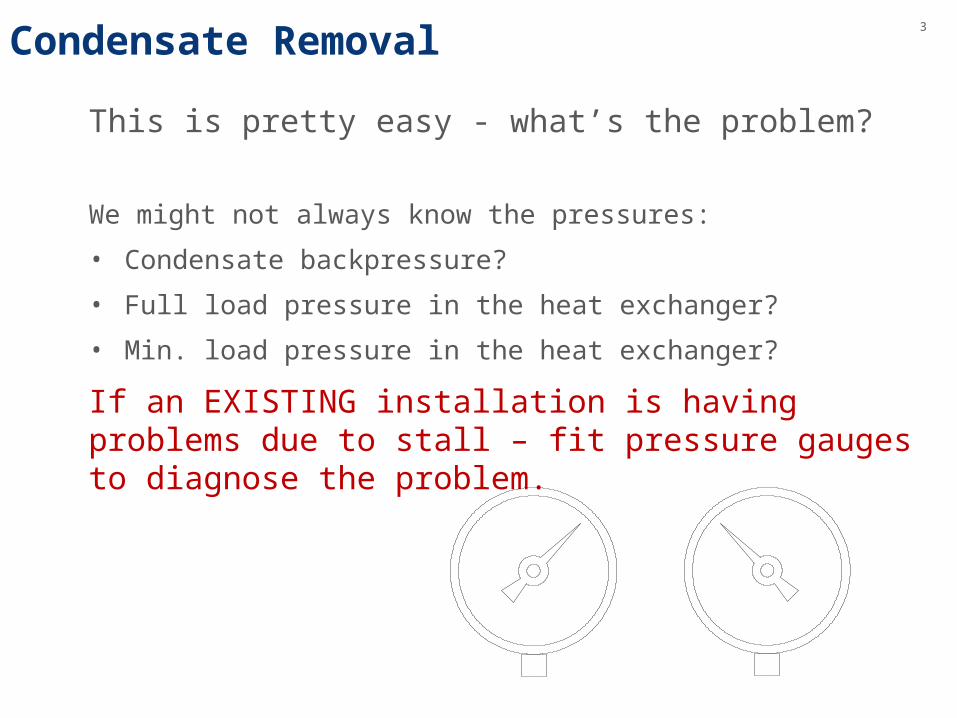
This is pretty easy - what’s the problem?
We might not always know the pressures:
• Condensate backpressure?
• Full load pressure in the heat exchanger?
• Min. load pressure in the heat exchanger?
If an EXISTING installation is having problems due to stall – fit pressure gauges to diagnose the problem.
Condensate Removal
4
Symptoms and effects of stall?
Condensate Removal
5
Calculating stall in a heat exchanger
Use a stall chart
Quick and good enough for most practical purposes
Condensate Removal
6
The Stall Chart
It predicts:
• How the steam temperature varies with load
• How the secondary water temperature varies with load
Condensate Removal
7
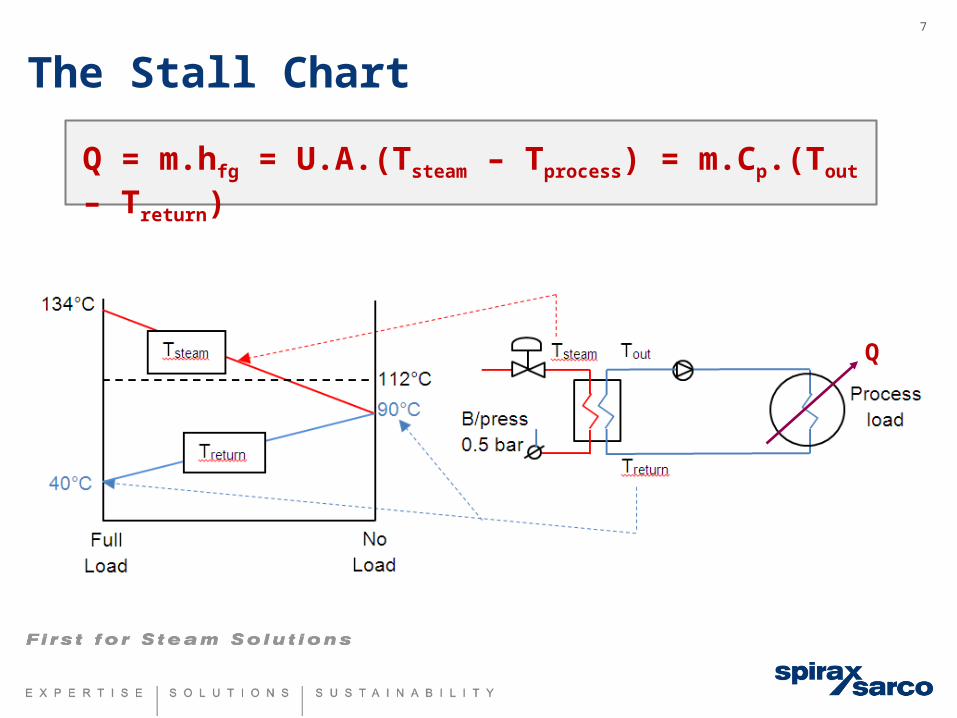
The Stall Chart
Q = m.hfg = U.A.(Tsteam – Tprocess) = m.Cp.(Tout – Treturn)
Q
8
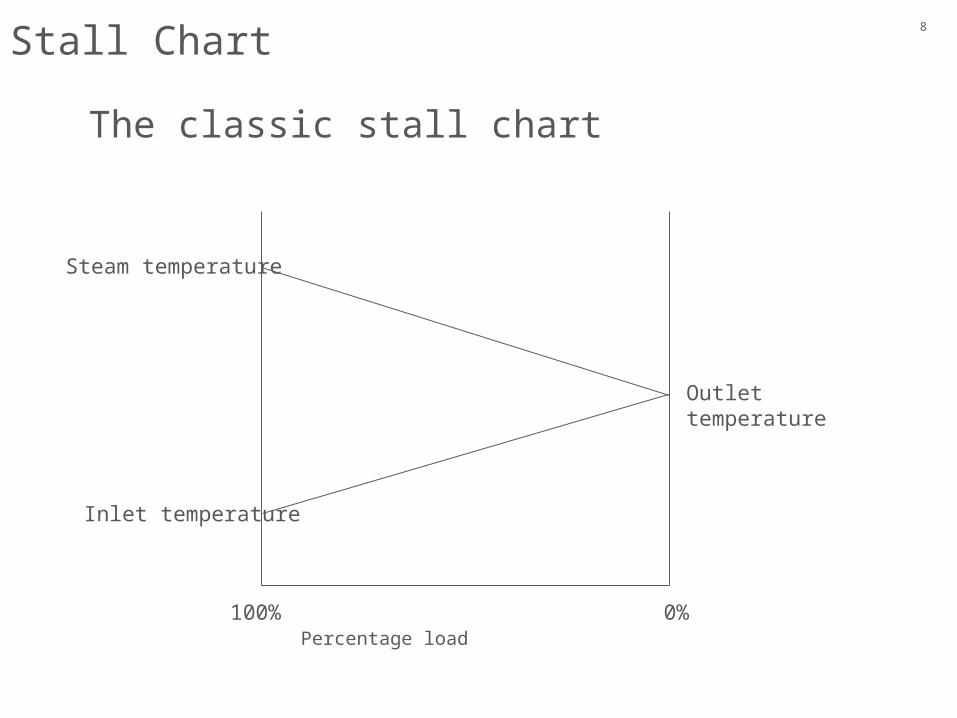
Steam temperature
Inlet temperature
Outlet temperature
100% 0%Percentage load
The classic stall chart
Stall Chart
9
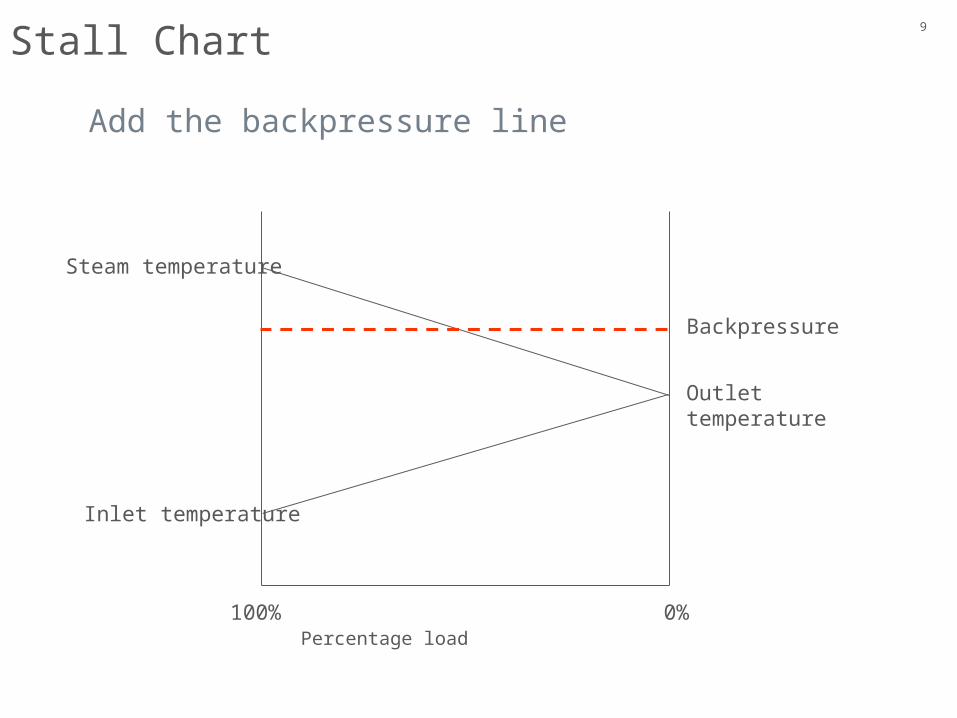
Steam temperature
Inlet temperature
Outlet temperature
Backpressure
Add the backpressure line
100% 0%Percentage load
Stall Chart
10
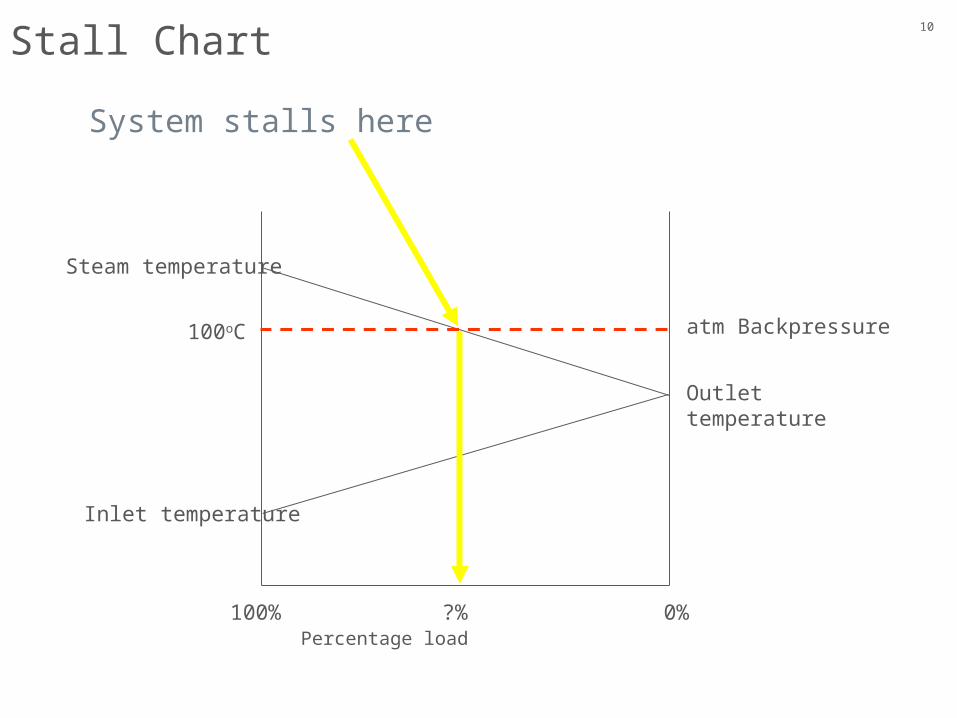
Steam temperature
Inlet temperature
Outlet temperature
atm Backpressure100oC
System stalls here
100% 0%Percentage load
?%
Stall Chart
11
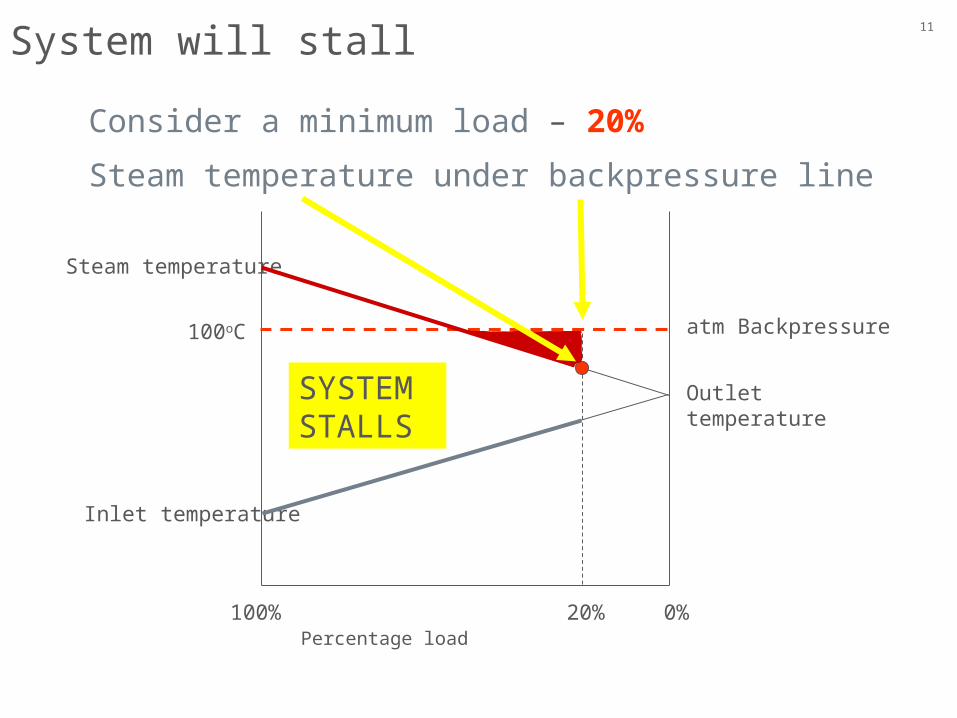
Steam temperature
Inlet temperature
Outlet temperature
atm Backpressure100oC
Consider a minimum load – 20%
Steam temperature under backpressure line
Percentage load100% 0%20%
System will stall
SYSTEM STALLS
12
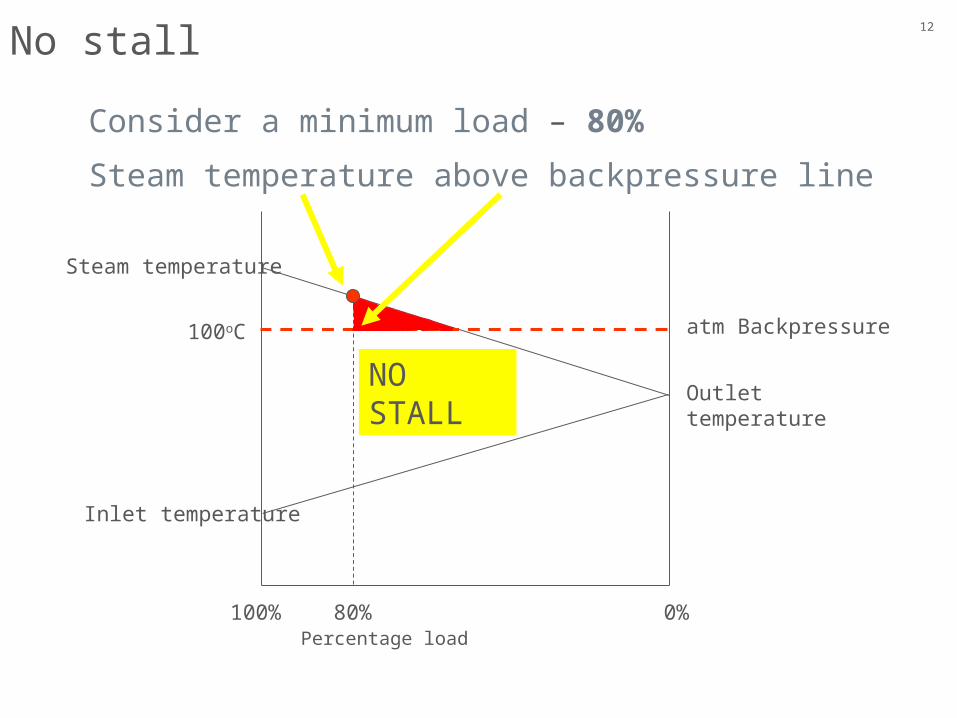
Steam temperature
Inlet temperature
Outlet temperature
atm Backpressure100oC
Consider a minimum load – 80%
Steam temperature above backpressure line
Percentage load100% 0%80%
No stall
NO STALL
13
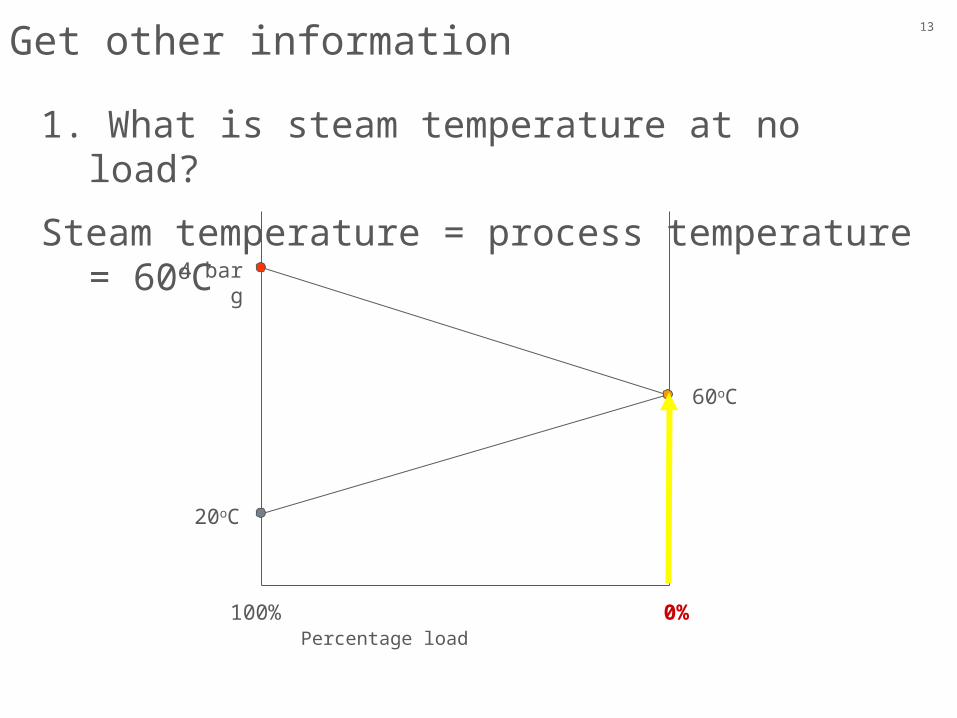
4 bar g
20o
C
100% 0%Percentage load
1. What is steam temperature at no load?
Steam temperature = process temperature = 60oC
60o
C
Get other information
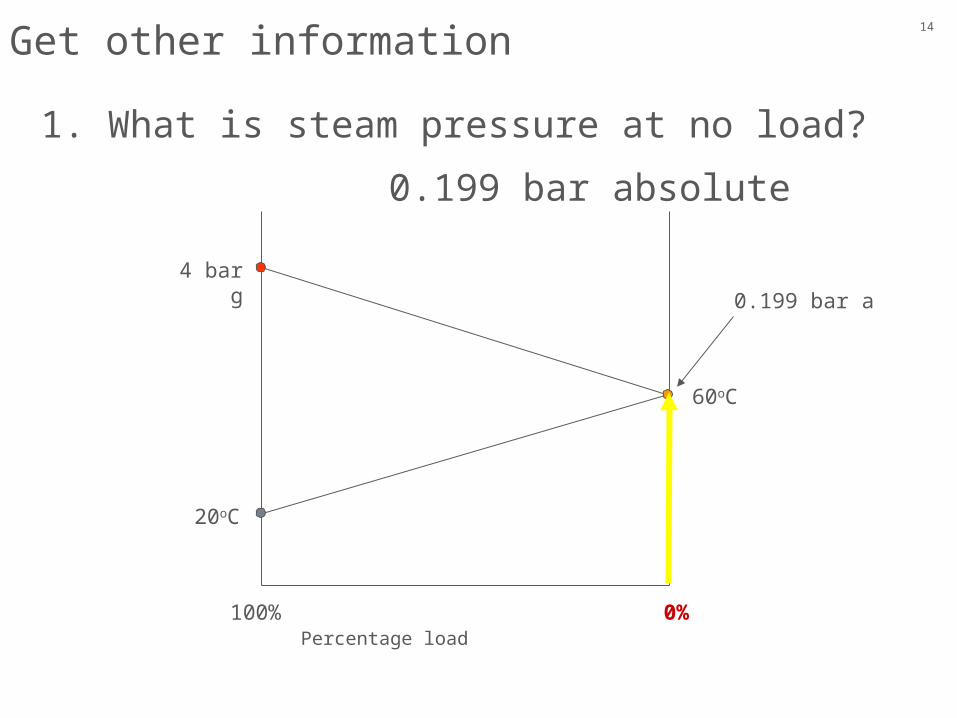
14
4 bar g
20o
C
100% 0%Percentage load
1. What is steam pressure at no load?
0.199 bar absolute
60o
C
0.199 bar a
Get other information
15
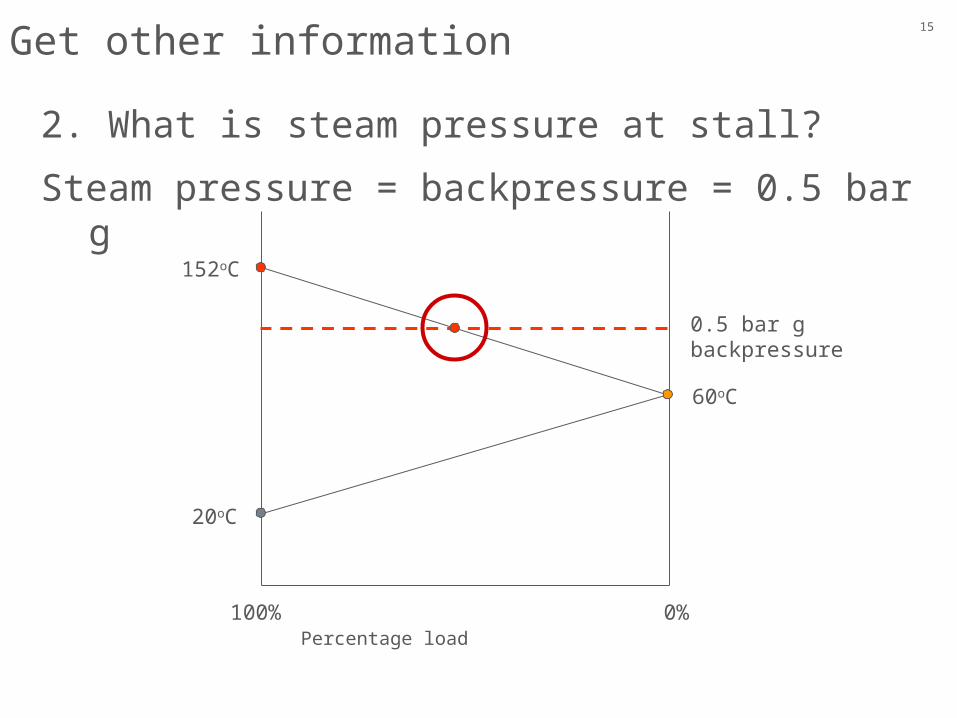
20o
C
100% 0%Percentage load
2. What is steam pressure at stall?
Steam pressure = backpressure = 0.5 bar g
60o
C
152oC
0.5 bar g backpressure
Get other information
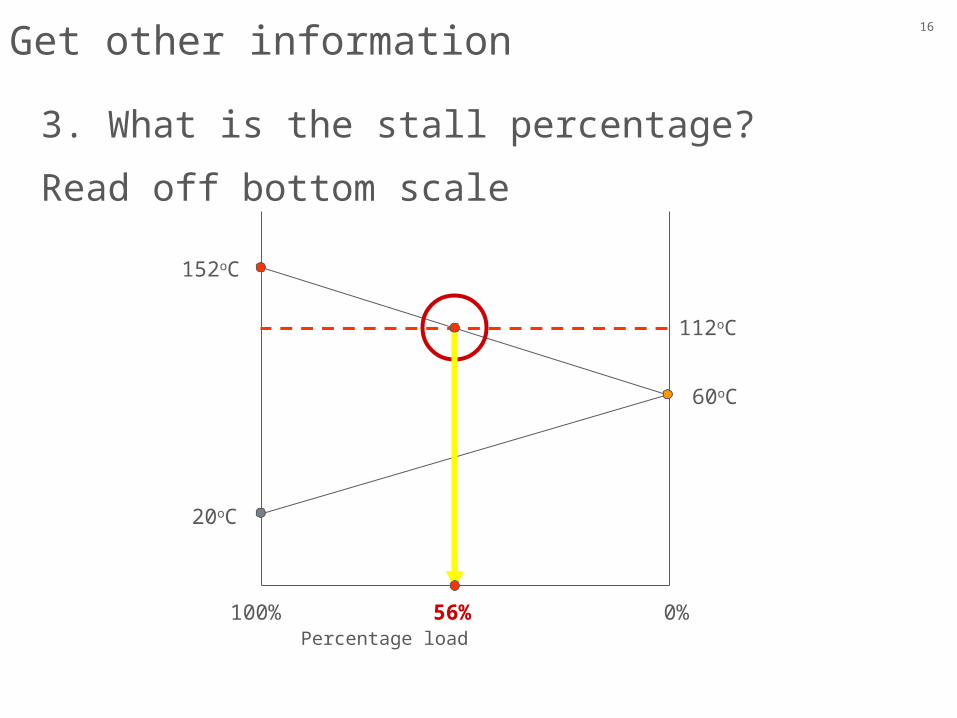
16
20o
C
100% 0%Percentage load
3. What is the stall percentage?
Read off bottom scale
60o
C
152oC
56%
112oC
Get other information
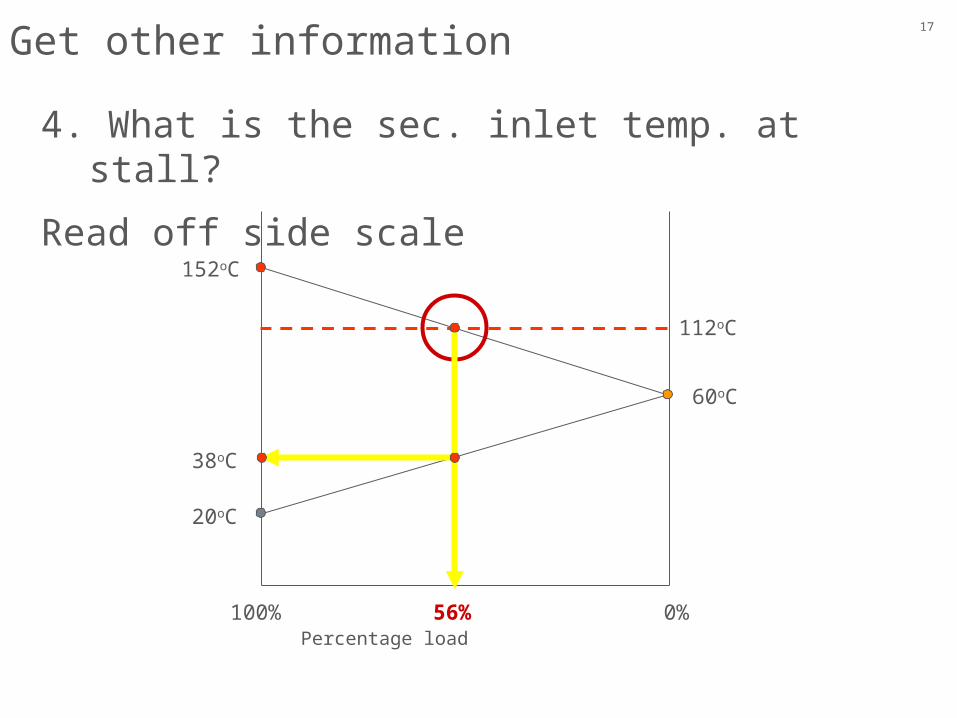
17
20o
C
100% 0%Percentage load
4. What is the sec. inlet temp. at stall?
Read off side scale
60o
C
152oC
56%
112oC
38o
C
Get other information
18
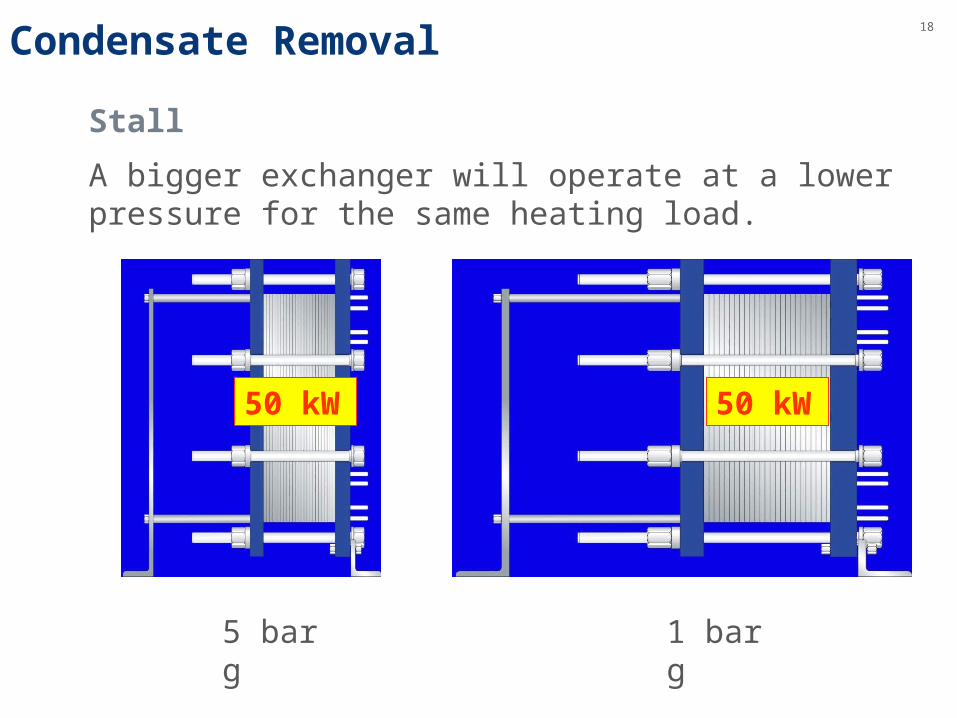
Stall
A bigger exchanger will operate at a lower pressure for the same heating load.
5 bar g 1 bar g
50 kW 50 kW
Condensate Removal
19
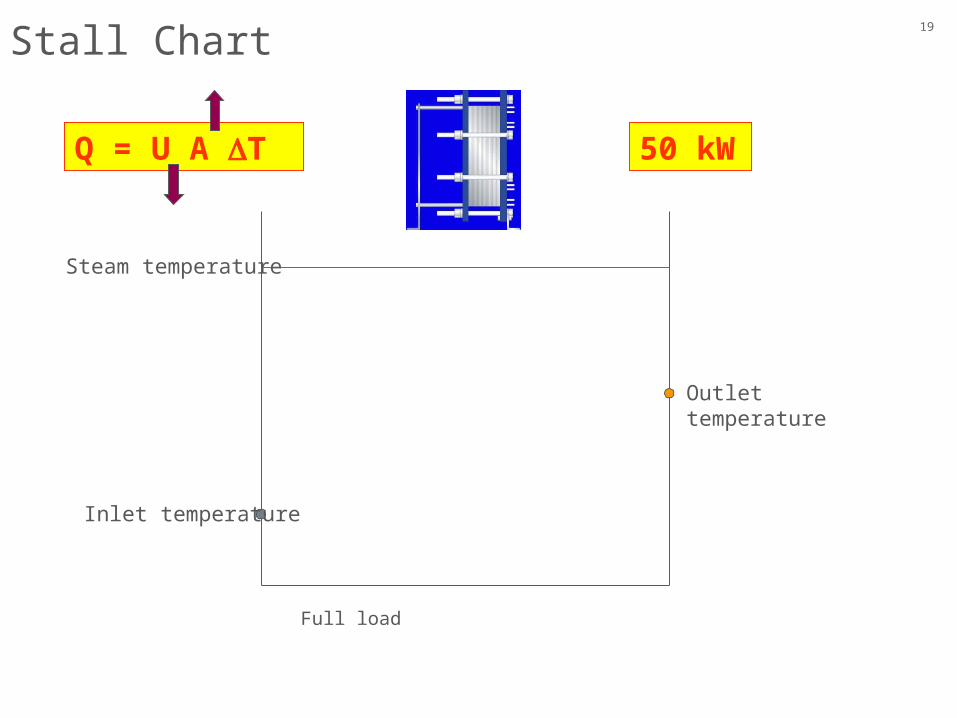
Full load
Steam temperature
Inlet temperature
Outlet temperature
50 kWQ = U A DT
Stall Chart
20
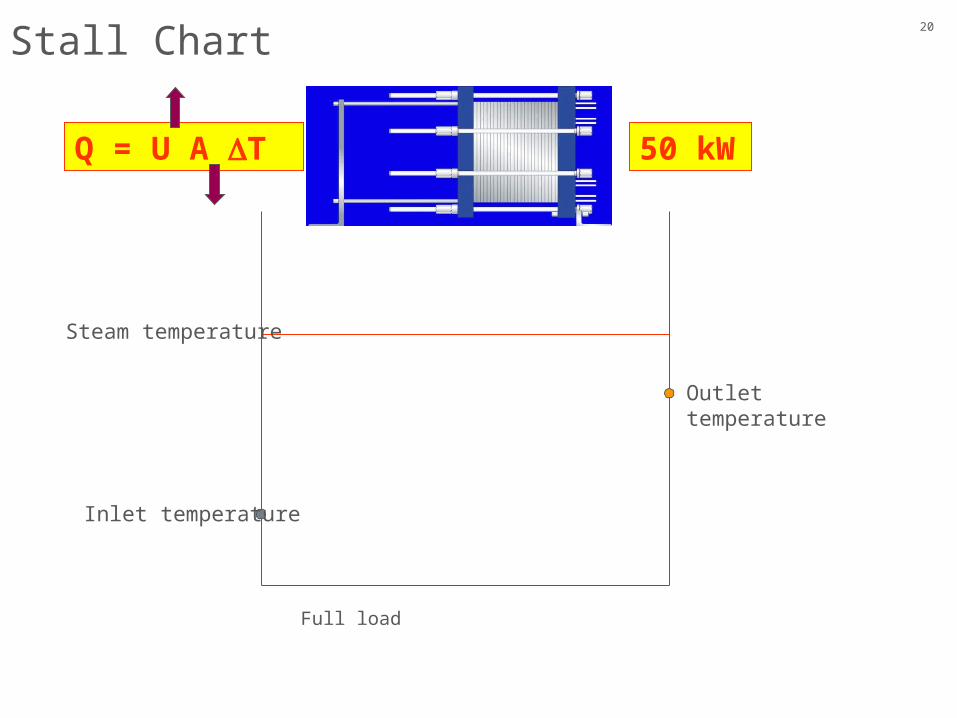
Full load
Steam temperature
Inlet temperature
Outlet temperature
50 kWQ = U A DT
Stall Chart
21
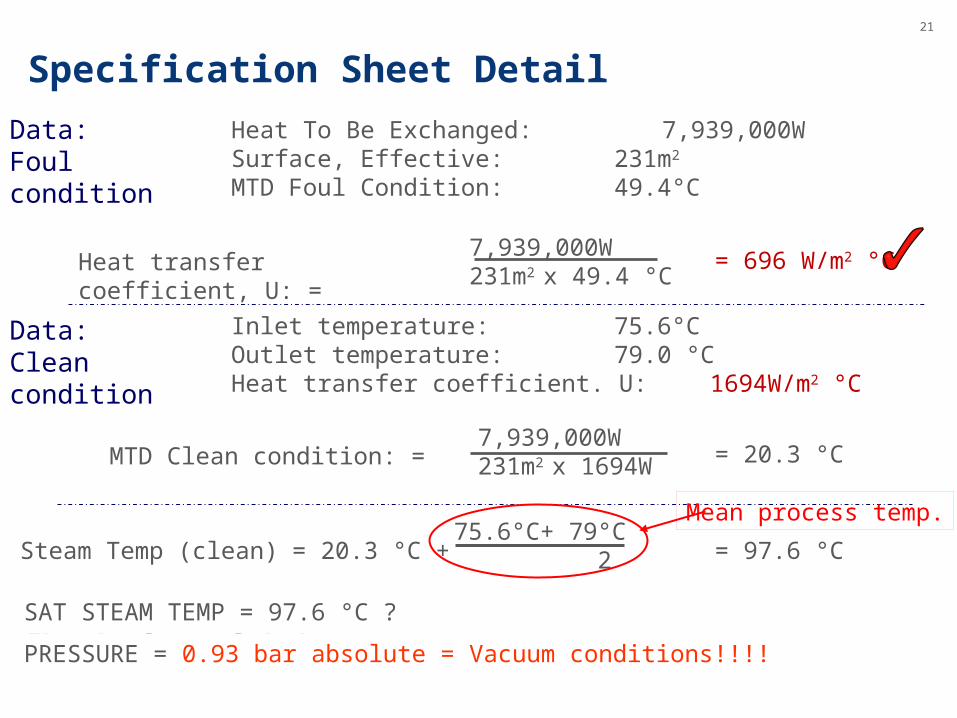
Specification Sheet Detail
Data: Foul condition
Heat To Be Exchanged: 7,939,000WSurface, Effective: 231m2
MTD Foul Condition: 49.4°C
Heat transfer coefficient, U: =7,939,000W231m2 x 49.4 °C
= 696 W/m2 °C
Data: Clean condition
Inlet temperature: 75.6°COutlet temperature: 79.0 °CHeat transfer coefficient. U: 1694W/m2 °C
MTD Clean condition: =7,939,000W231m2 x 1694W = 20.3 °C
SAT STEAM TEMP = 97.6 °C ?
PRESSURE = 0.93 bar absolute = Vacuum conditions!!!!
75.6°C+ 79°C 2Steam Temp (clean) = 97.6 °C= 20.3 °C +
Mean process temp.
22
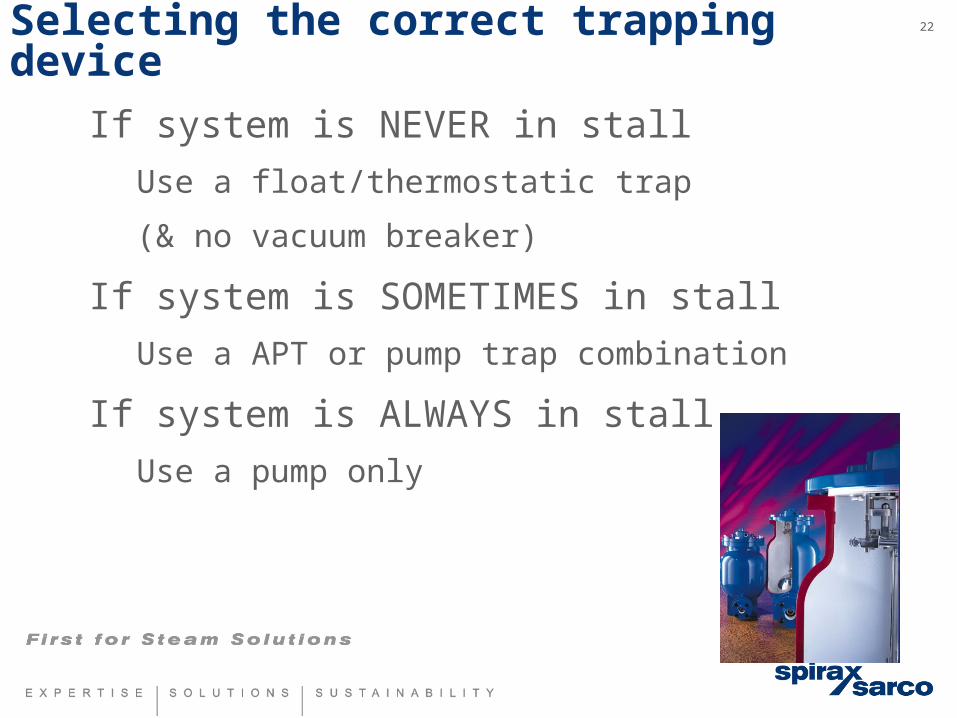
If system is NEVER in stall
Use a float/thermostatic trap
(& no vacuum breaker)
If system is SOMETIMES in stall
Use a APT or pump trap combination
If system is ALWAYS in stall
Use a pump only
Selecting the correct trapping device
Condensate Removal
Condensate line sizing - discharge lines and pumped lines

24
Condensate discharge line sizing
Piping condensate from:
• a steam trap
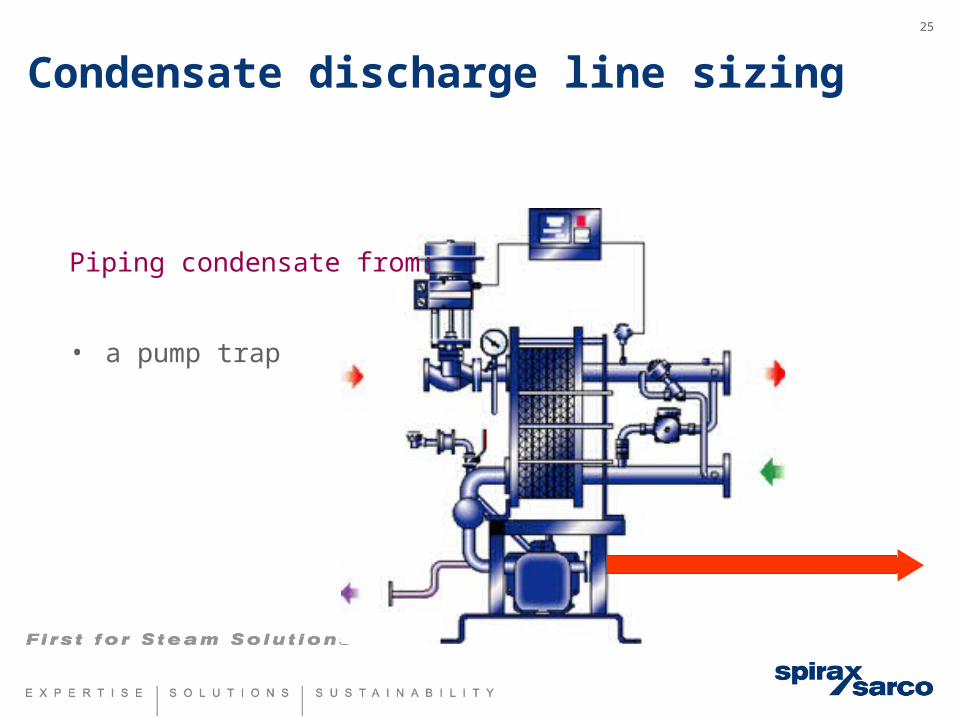
25
Piping condensate from:
• a pump trap
Condensate discharge line sizing
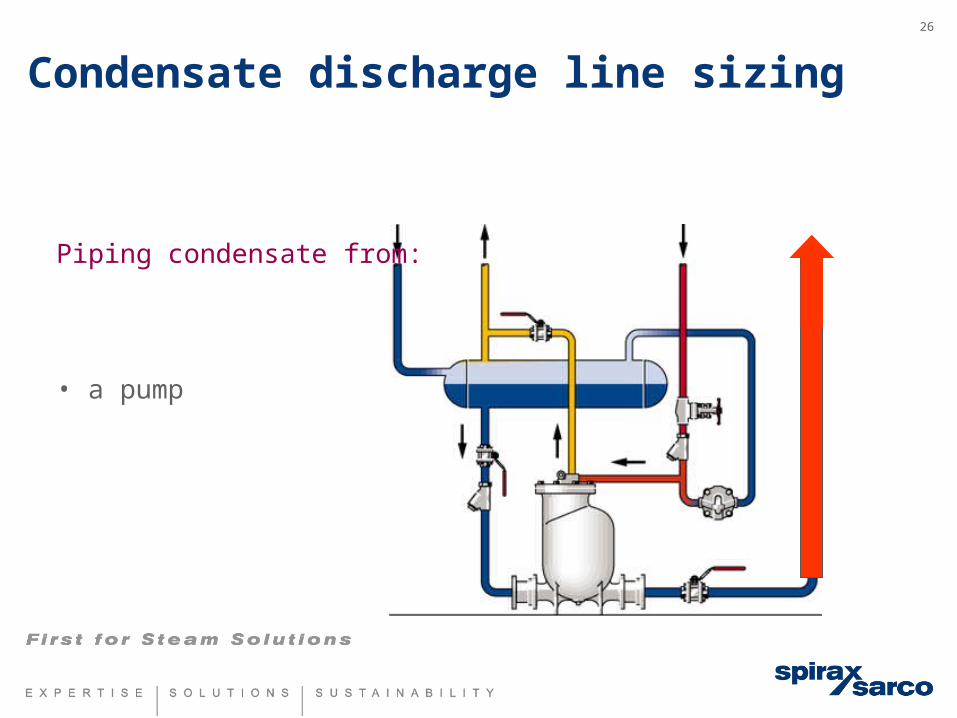
26
Piping condensate from:
• a steam trap
• a pump trap
• a pump
Condensate discharge line sizing
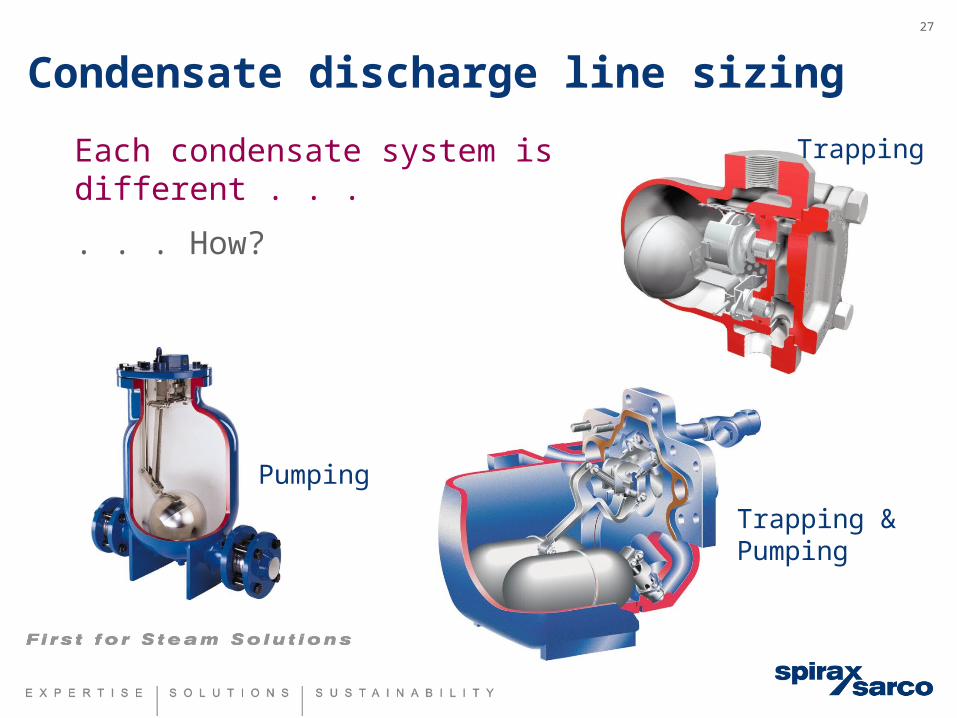
27
Pumping
Trapping
Trapping & Pumping
Each condensate system is different . . .
. . . How?
Condensate discharge line sizing
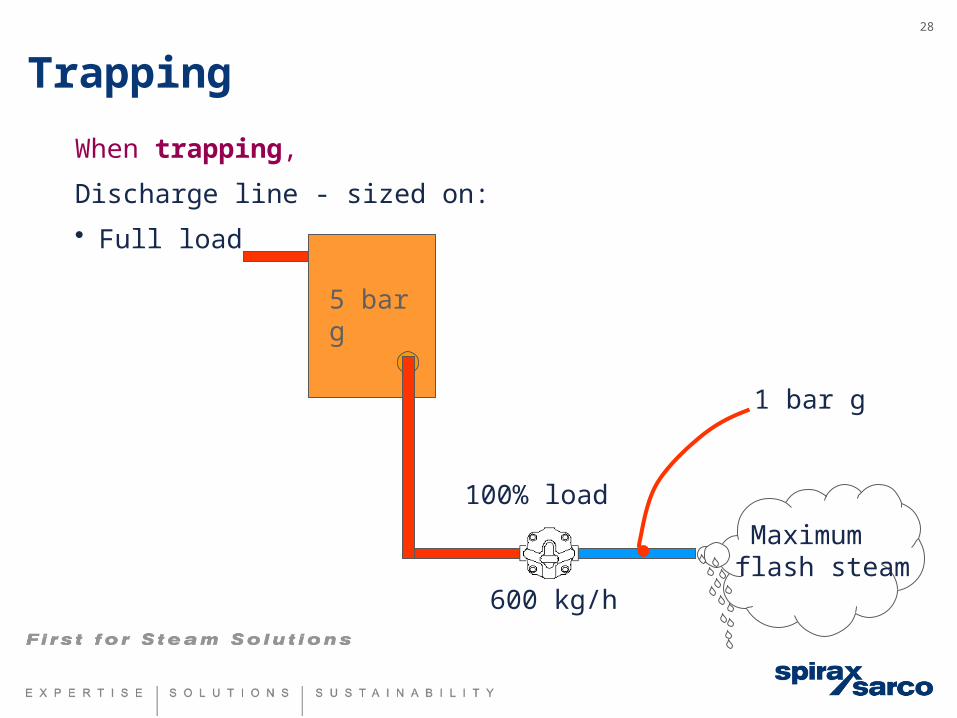
28
When trapping,
Discharge line - sized on:
• Full load
100% load
Maximum flash steam
600 kg/h
5 bar g
1 bar g
Trapping
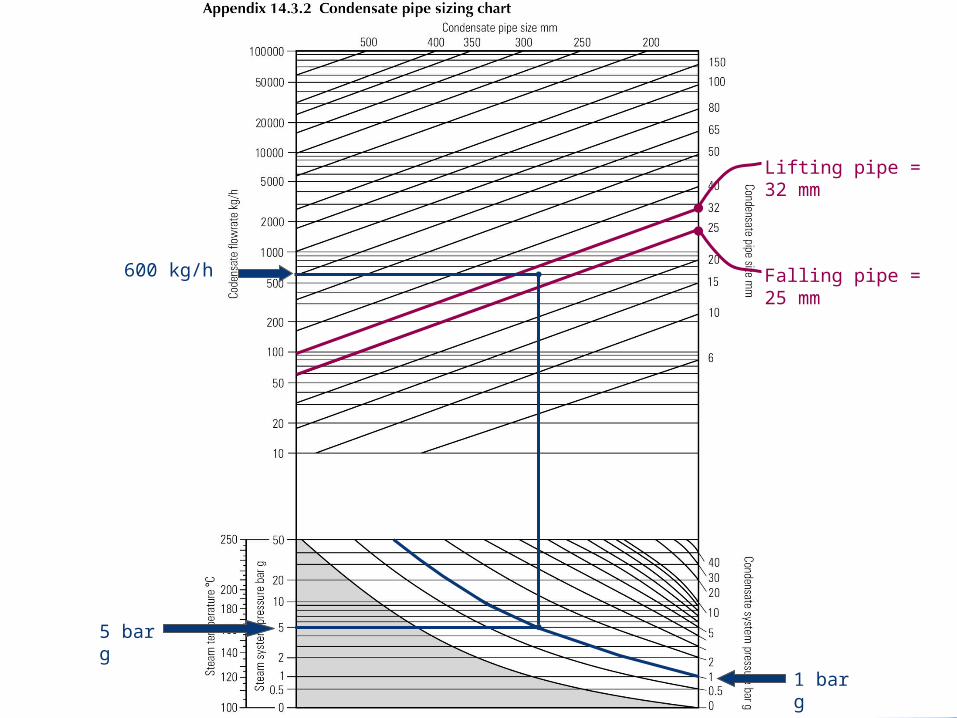
Lifting pipe = 32 mm
600 kg/h
5 bar g
1 bar g
Falling pipe = 25 mm
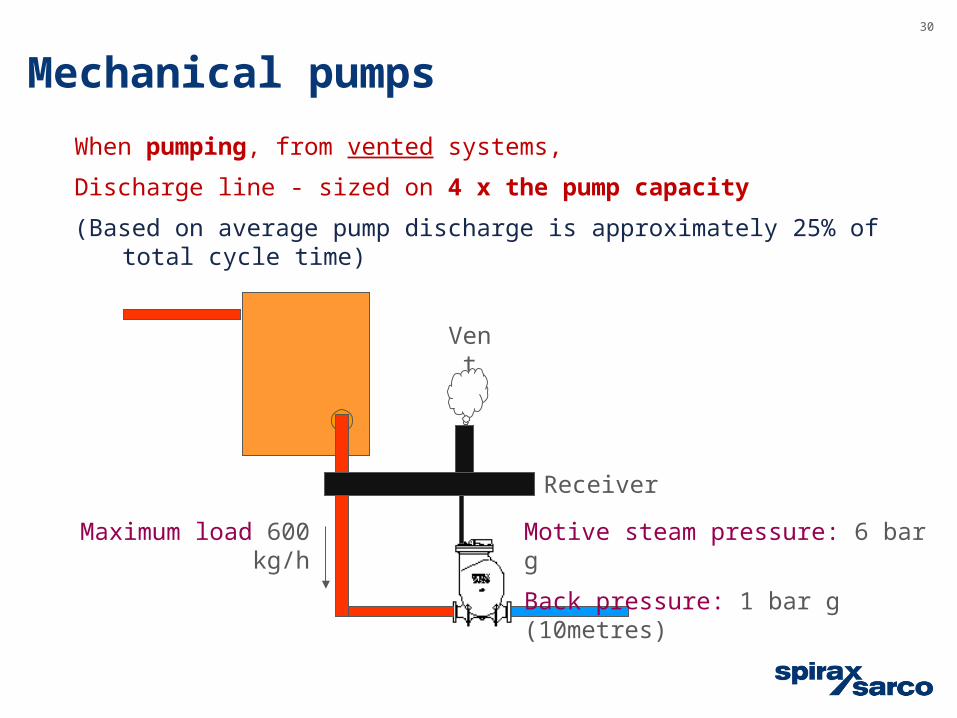
30
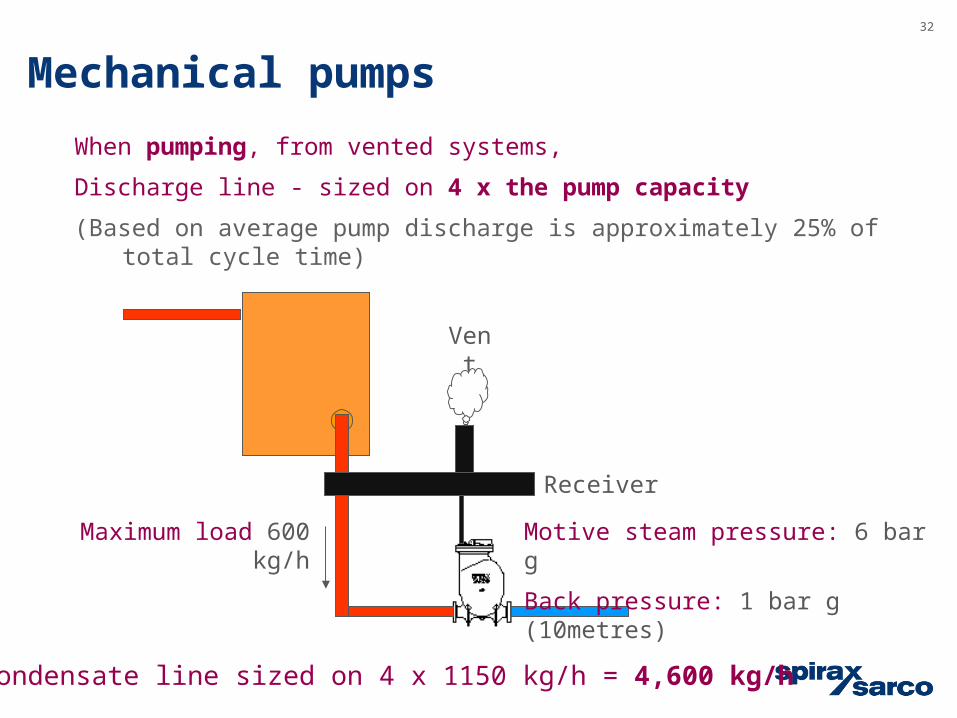
When pumping, from vented systems,
Discharge line - sized on 4 x the pump capacity
(Based on average pump discharge is approximately 25% of total cycle time)
Maximum load 600 kg/h
Vent
Receiver
Motive steam pressure: 6 bar g
Back pressure: 1 bar g (10metres)
Mechanical pumps
31
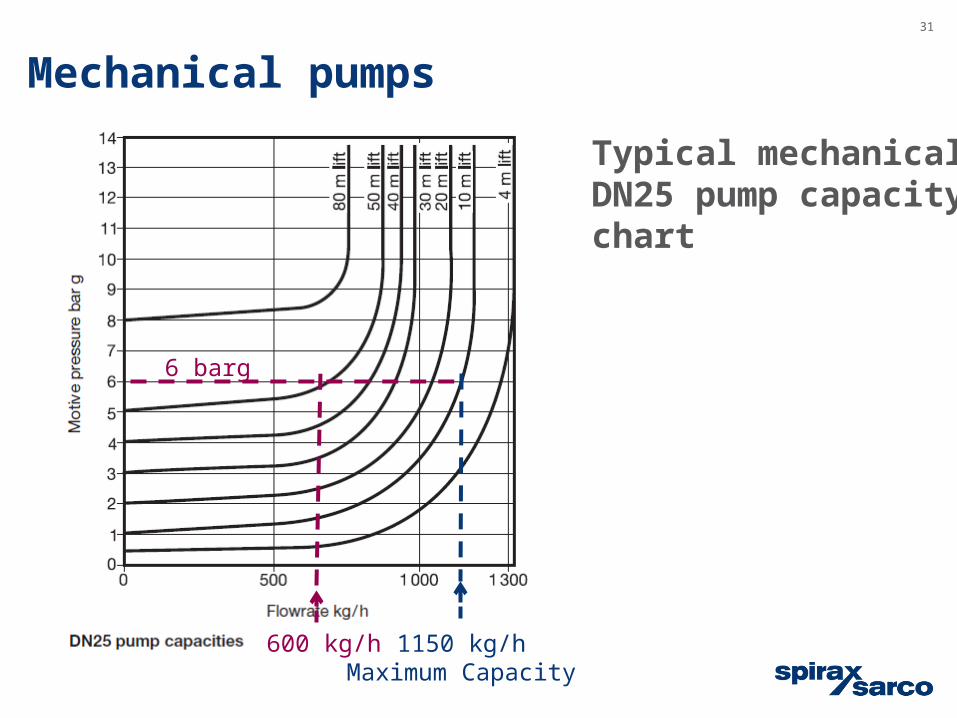
600 kg/h
6 barg
Mechanical pumps
Typical mechanical DN25 pump capacity chart
1150 kg/hMaximum Capacity
32
Condensate line sized on 4 x 1150 kg/h = 4,600 kg/h
When pumping, from vented systems,
Discharge line - sized on 4 x the pump capacity
(Based on average pump discharge is approximately 25% of total cycle time)
Maximum load 600 kg/h
Vent
Receiver
Motive steam pressure: 6 bar g
Back pressure: 1 bar g (10metres)
Mechanical pumps
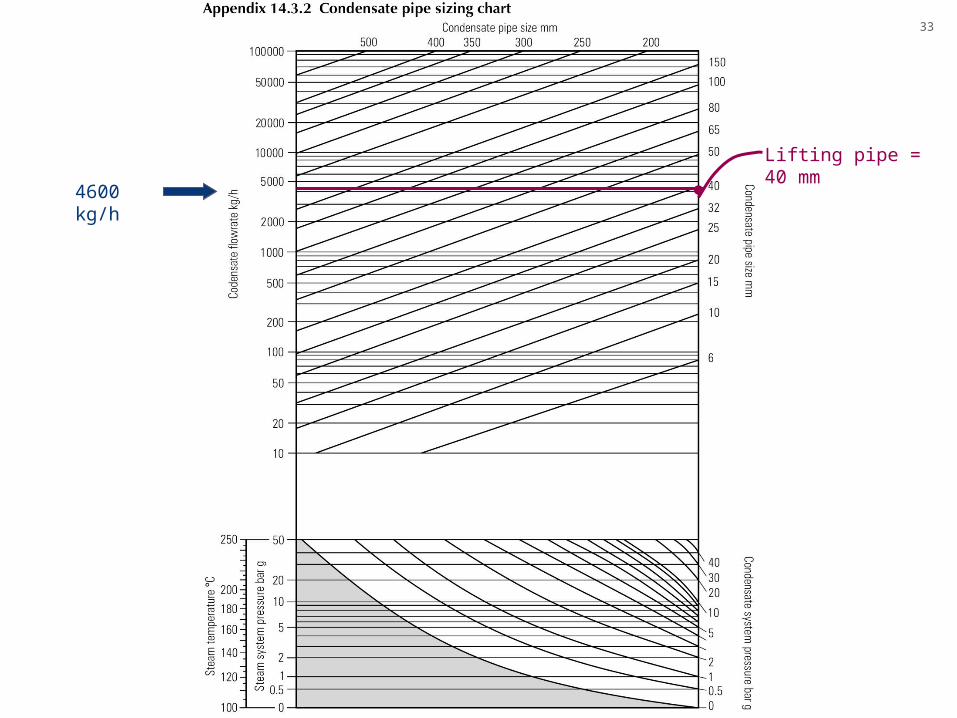
33
4600 kg/h
Lifting pipe = 40 mm
34
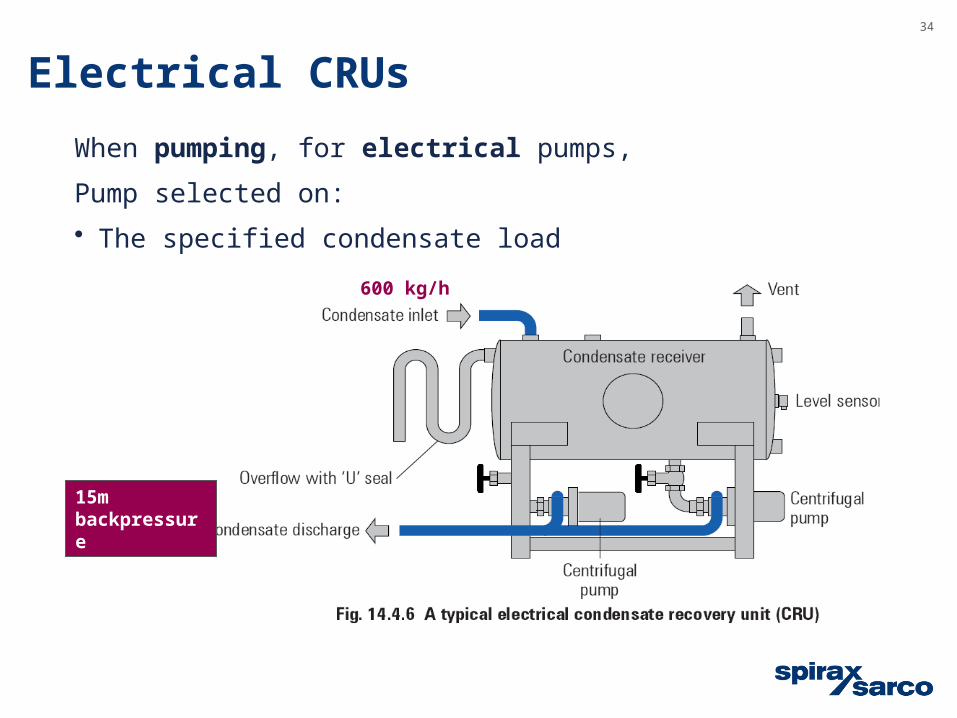
When pumping, for electrical pumps,
Pump selected on:
• The specified condensate load
600 kg/h
15m backpressure
Electrical CRUs
35
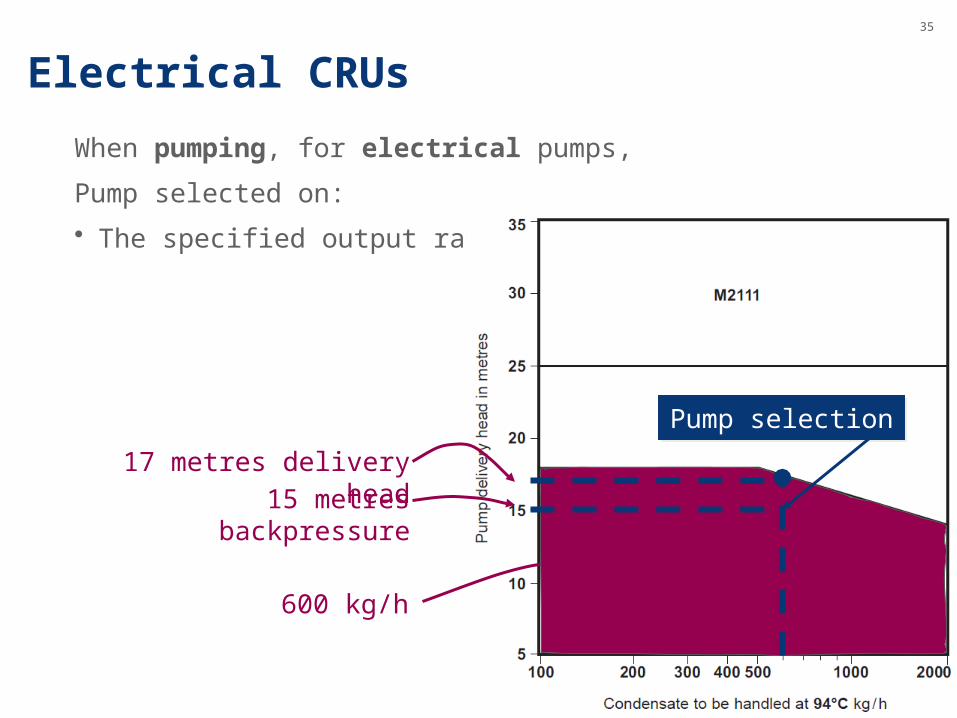
When pumping, for electrical pumps,
Pump selected on:
• The specified output rate
Electrical CRUs
600 kg/h
17 metres delivery head
Pump selectionPump selection
15 metres backpressure
36
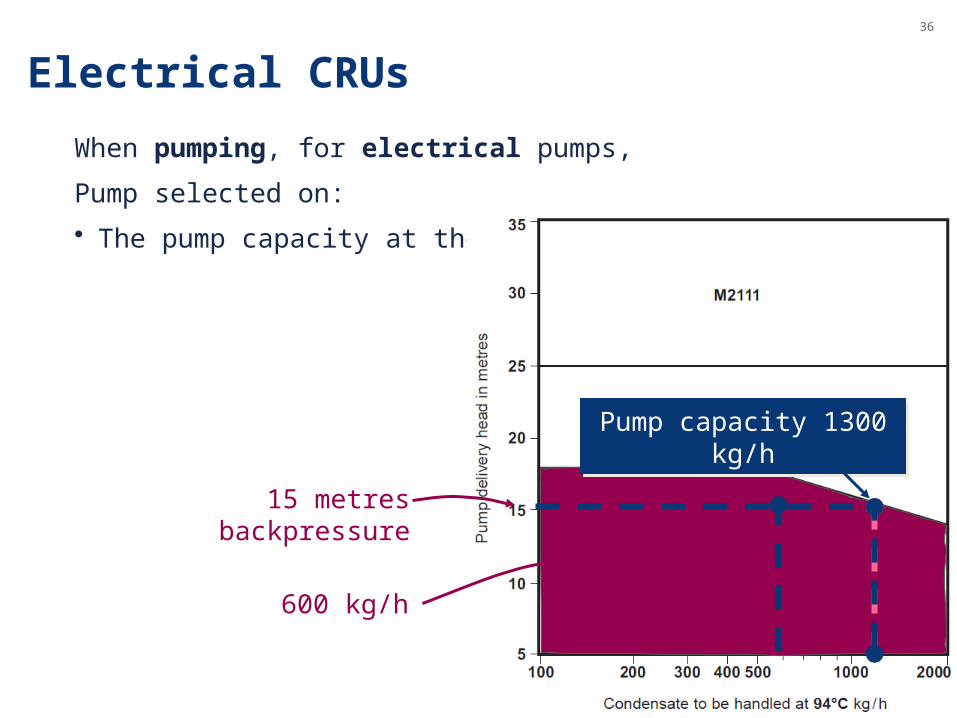
When pumping, for electrical pumps,
Pump selected on:
• The pump capacity at the PDH
Electrical CRUs
Pump capacity 1300 kg/hPump capacity 1300 kg/h
600 kg/h
15 metres backpressure
37
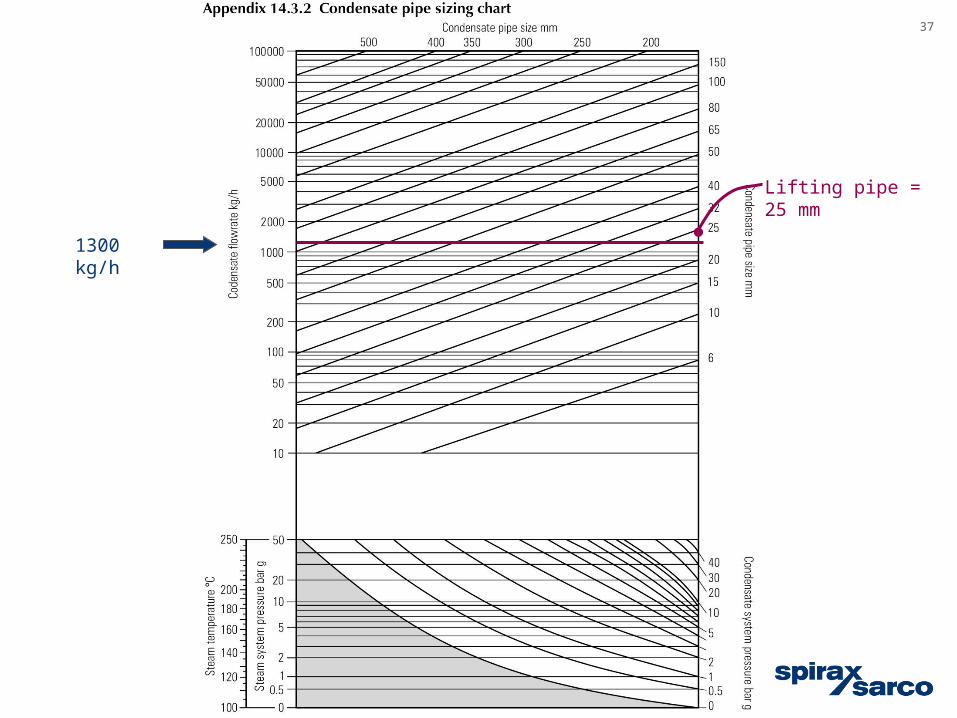
1300 kg/h
Lifting pipe = 25 mm
38
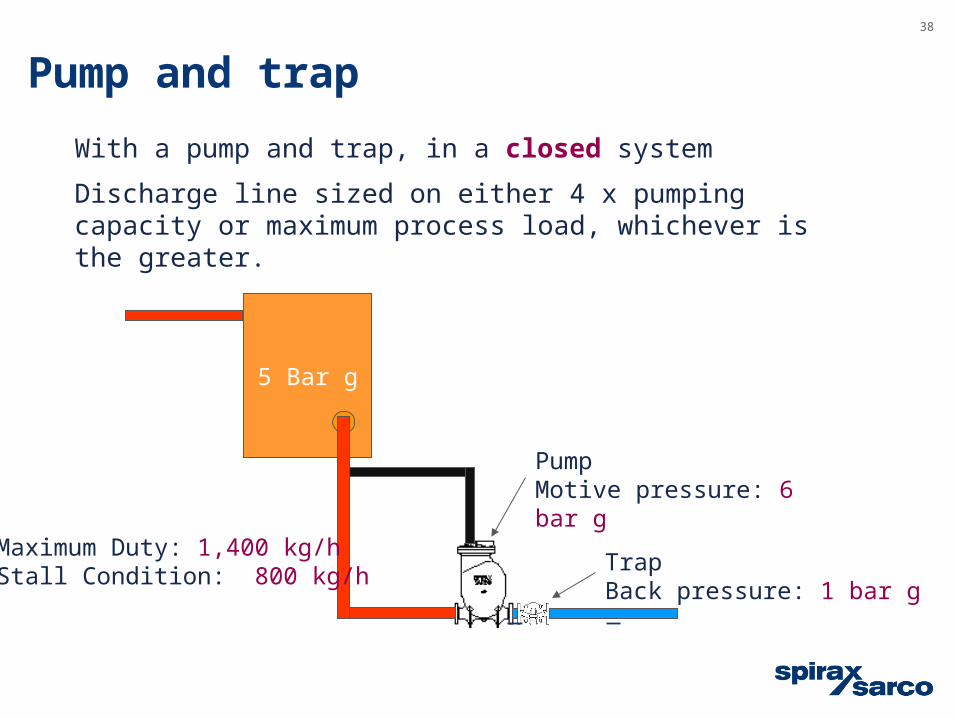
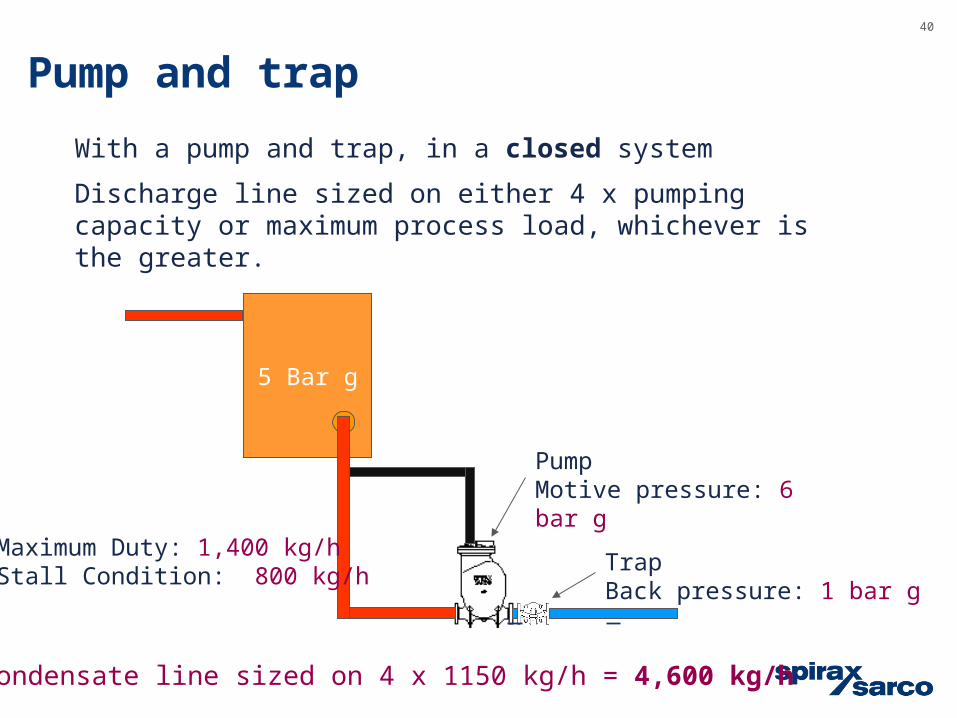
With a pump and trap, in a closed system
Discharge line sized on either 4 x pumping capacity or maximum process load, whichever is the greater.
5 Bar g
PumpMotive pressure: 6 bar g
TrapBack pressure: 1 bar g
Maximum Duty: 1,400 kg/hStall Condition: 800 kg/h
Pump and trap
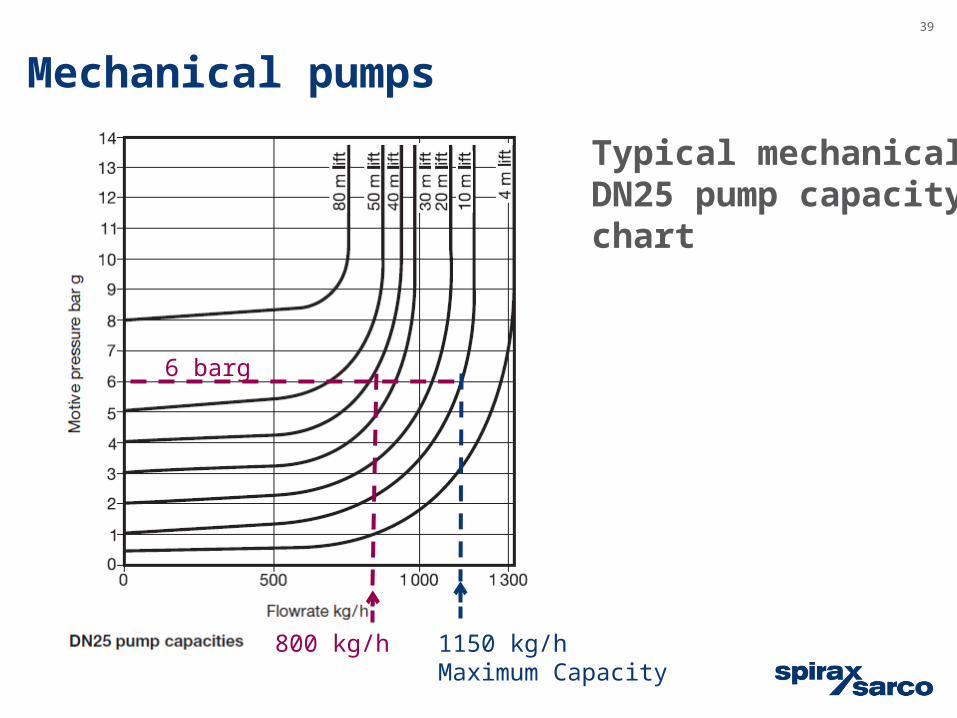
39
800 kg/h 1150 kg/hMaximum Capacity
6 barg
Mechanical pumps
Typical mechanical DN25 pump capacity chart
40
Condensate line sized on 4 x 1150 kg/h = 4,600 kg/h
With a pump and trap, in a closed system
Discharge line sized on either 4 x pumping capacity or maximum process load, whichever is the greater.
5 Bar g
PumpMotive pressure: 6 bar g
TrapBack pressure: 1 bar g
Maximum Duty: 1,400 kg/hStall Condition: 800 kg/h
Pump and trap
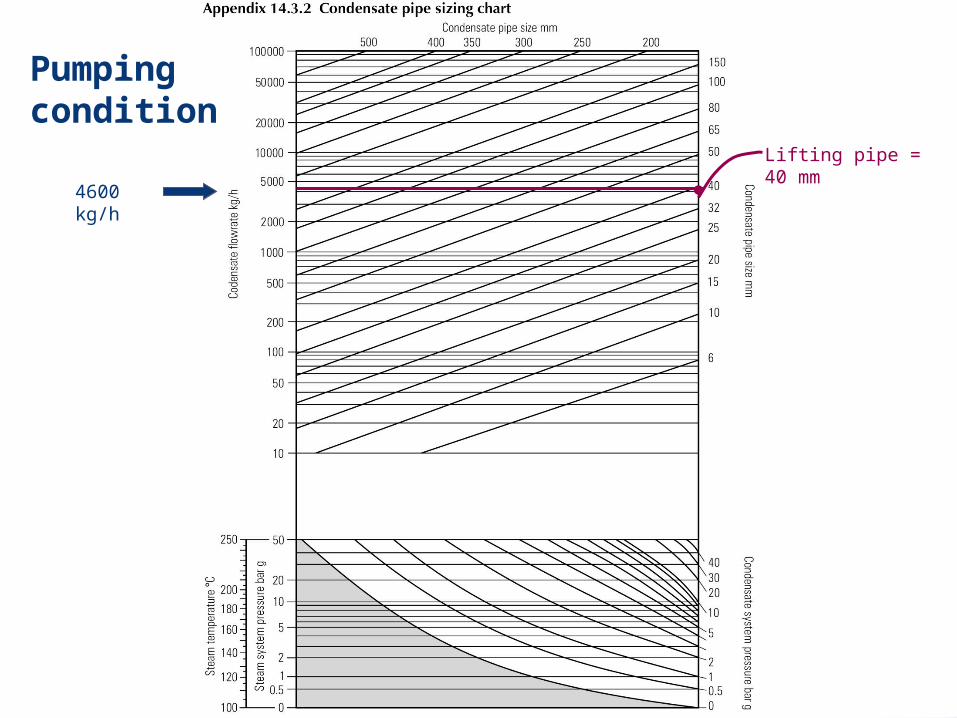
4600 kg/h
Lifting pipe = 40 mm
Pumping condition
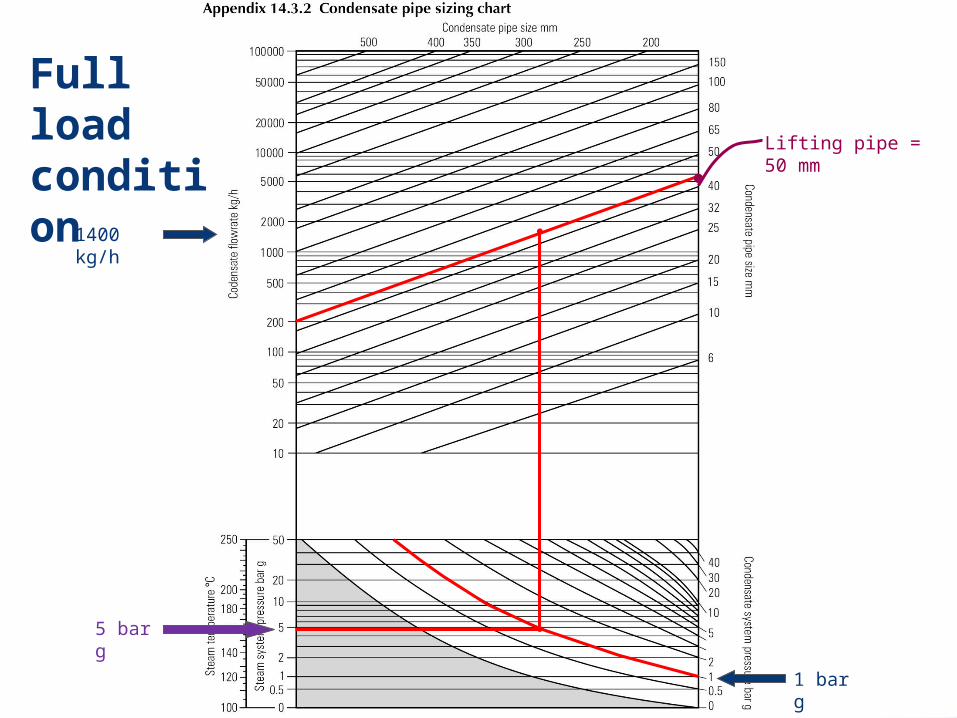
5 bar g
1 bar g
1400 kg/h
Lifting pipe = 50 mm
Full load condition
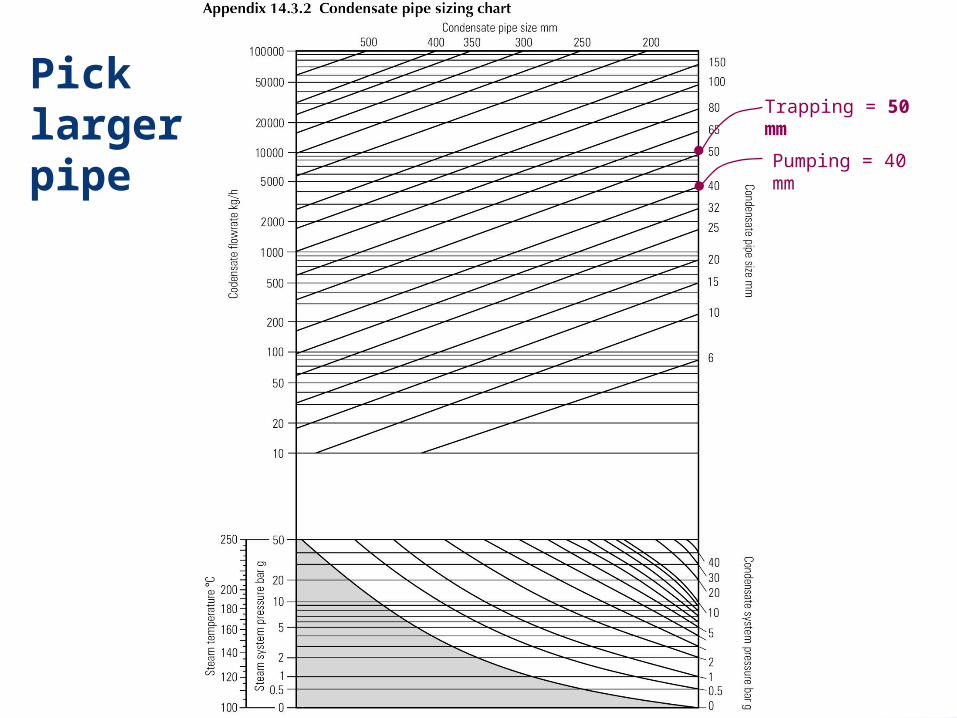
Trapping = 50 mm
Pumping = 40 mm
Pick larger pipe
Why bother to return condensate?• Pure water.
If thrown away, replaced with potable water + chemicals.• Hot water.
If thrown away, replaced with cold water + heat.• Disposal costs
Effluent charges can equal buying cost
Remember:• With higher operating pressures, more flash lost from vents
(a good case for using flash steam).• Higher feedwater temperature = less fuel.• More condensate returned = less blowdown.
Condensate Removal
Things to consider
• Mechanical or electrical pumps?
• Condensate pressures and loads
• Pump discharge pipe sizing
Condensate Removal
Electrical pumps?
• Electrical pumps have a higher capacity
• Electrical pumps usually require smaller discharge pipes
Mechanical pumps?
• Mechanical pumps need no electrics
• Mechanical pumps are safe in hazardous areas
• Mechanical pumps are versatile
Things to consider:
Mechanical or electrical pumps
Condensate Removal
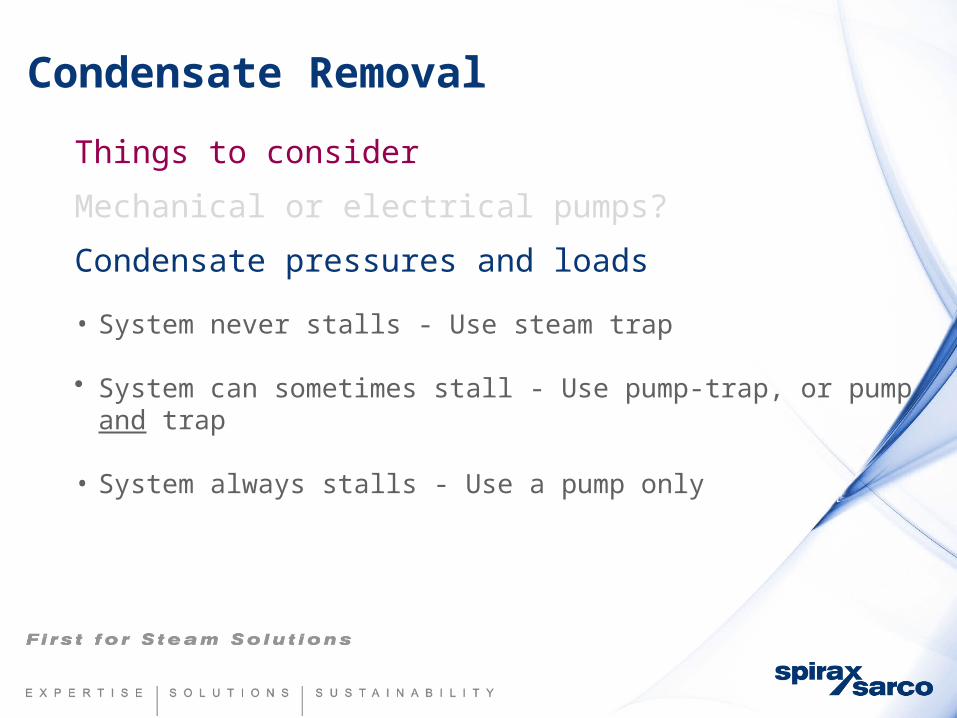
Things to consider
Mechanical or electrical pumps?
Condensate pressures and loads
• System never stalls - Use steam trap
• System can sometimes stall - Use pump-trap, or pump and trap
• System always stalls - Use a pump only
Condensate Removal
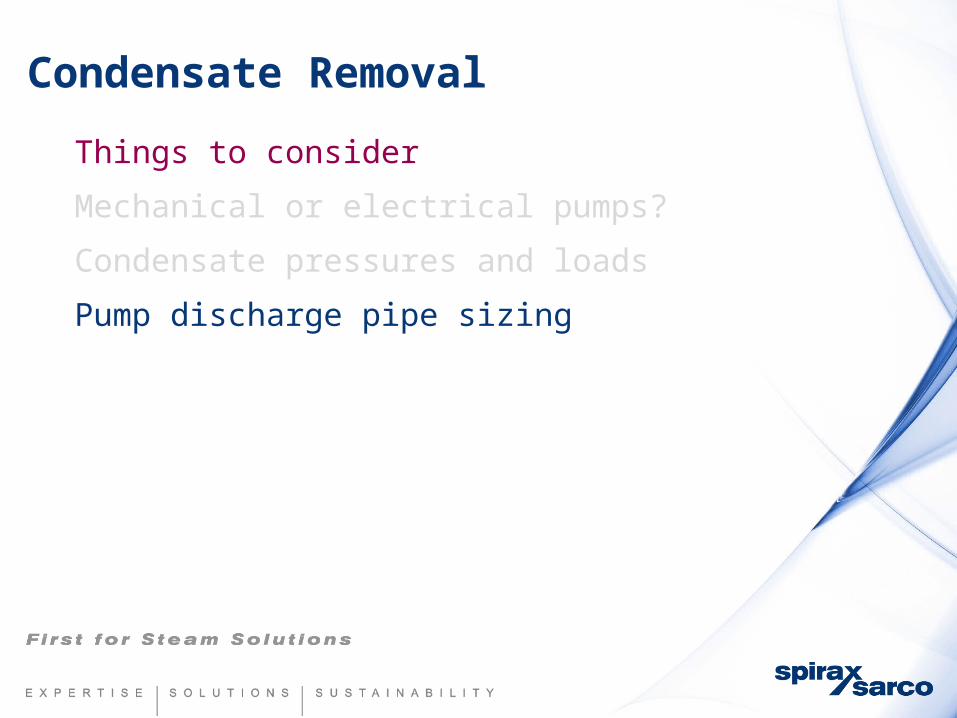
Things to consider
Mechanical or electrical pumps?
Condensate pressures and loads
Pump discharge pipe sizing
Condensate Removal

Example 1
Condensate Removal
50
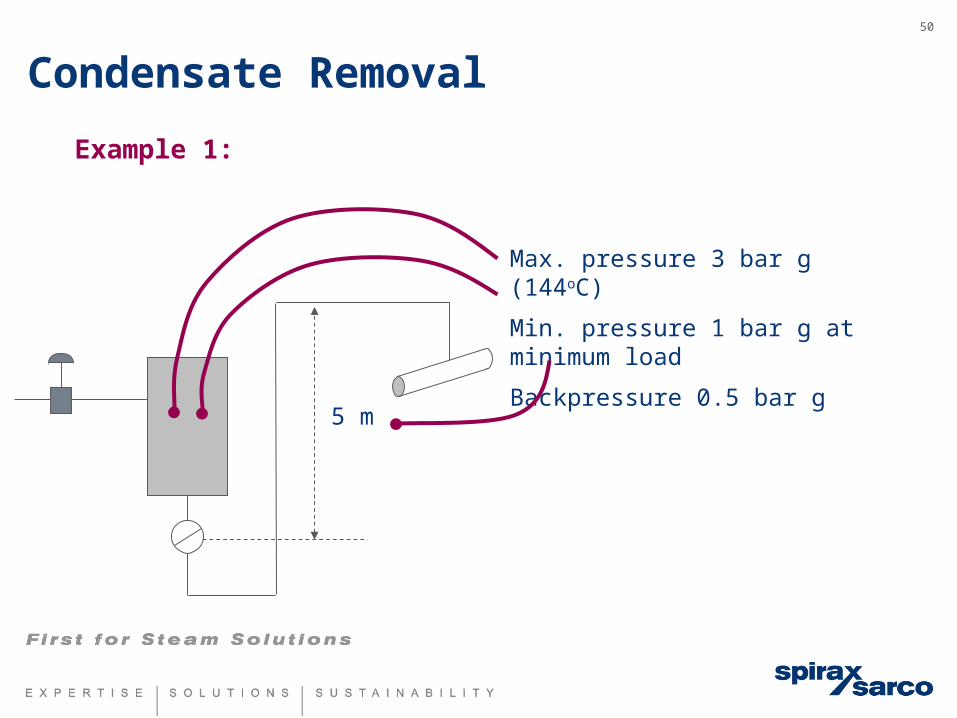
Example 1:
Max. pressure 3 bar g (144oC)
Min. pressure 1 bar g at minimum load
Backpressure 0.5 bar g
5 m
Condensate Removal
51
Max. pressure 3 bar g (144oC)
Min. pressure 1 bar g at minimum load
Backpressure 0.5 bar g
Stall?
5 m
Example 1:
?
Max. pressure 3 bar g (144oC)
Min. pressure 1 bar g at minimum load
Backpressure 0.5 bar g
Stall? No !
Min pressure >
Backpressure
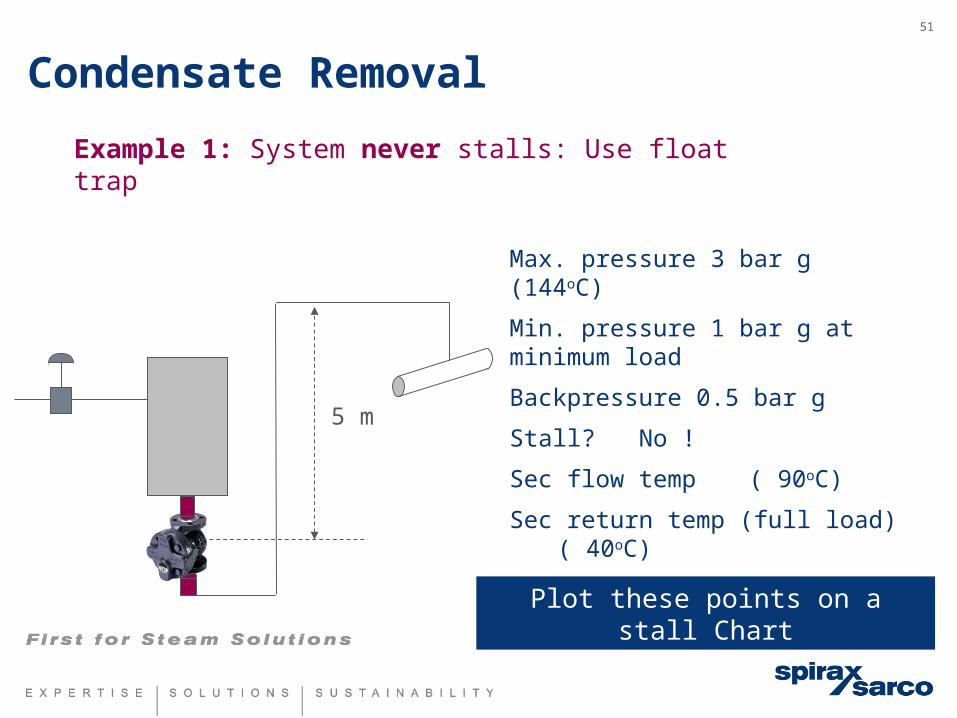
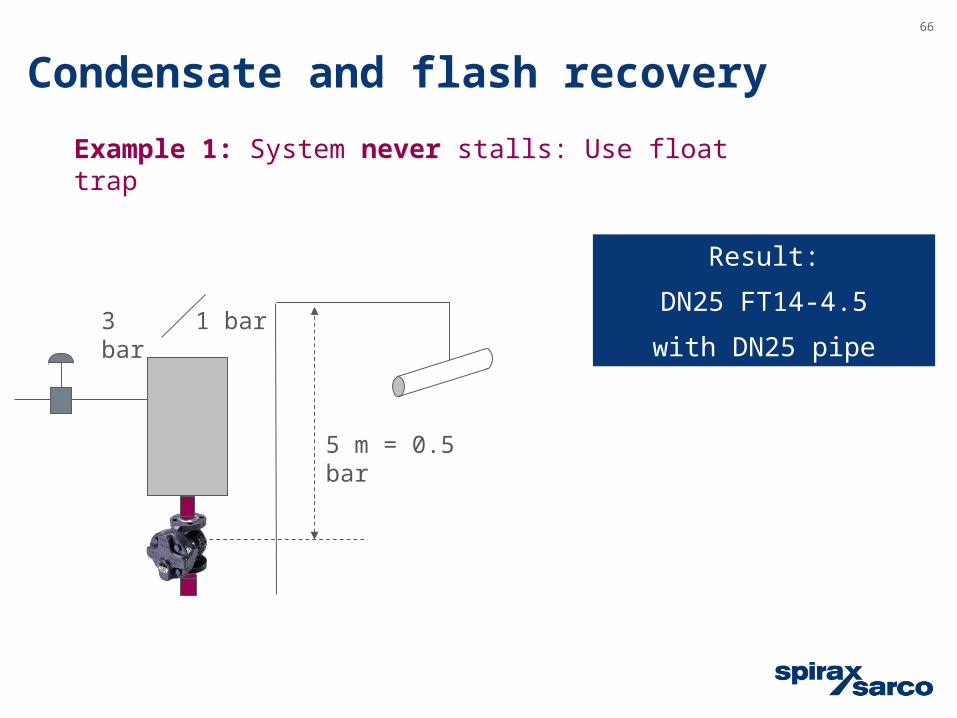
Example 1: System never stalls: Use float trap
Max. pressure 3 bar g (144oC)
Min. pressure 1 bar g at minimum load
Backpressure 0.5 bar g
Stall? No !
Sec flow temp ( 90oC)
Sec return temp (full load) ( 40oC)
Full load
Plot these points on a stall Chart
Condensate Removal
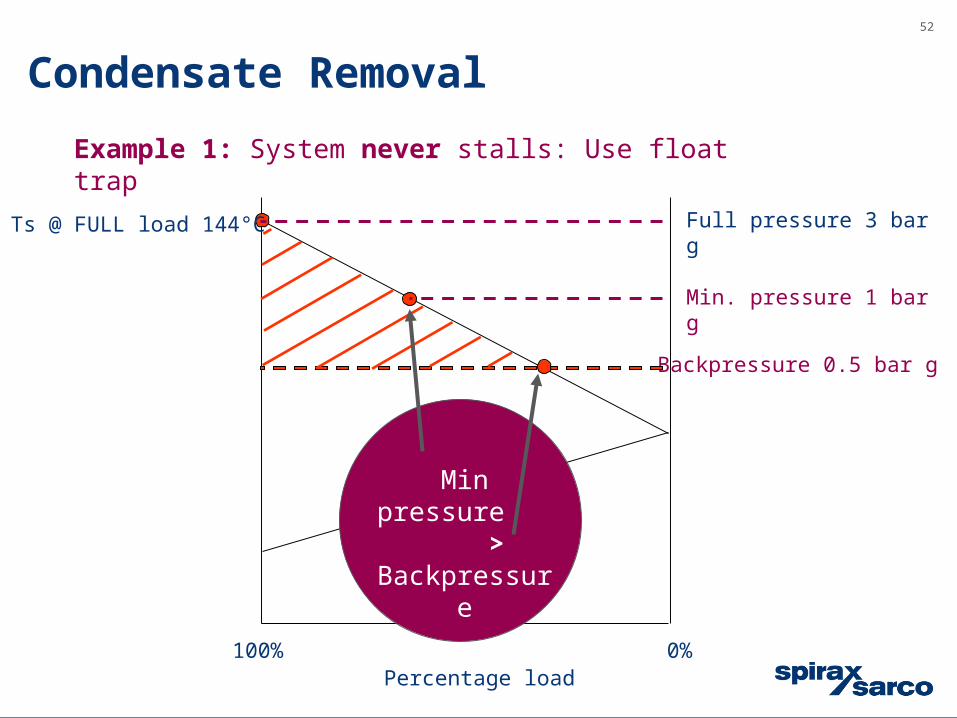
52
Backpressure 0.5 bar g
Percentage load100% 0%
Full pressure 3 bar g
Min. pressure 1 bar g
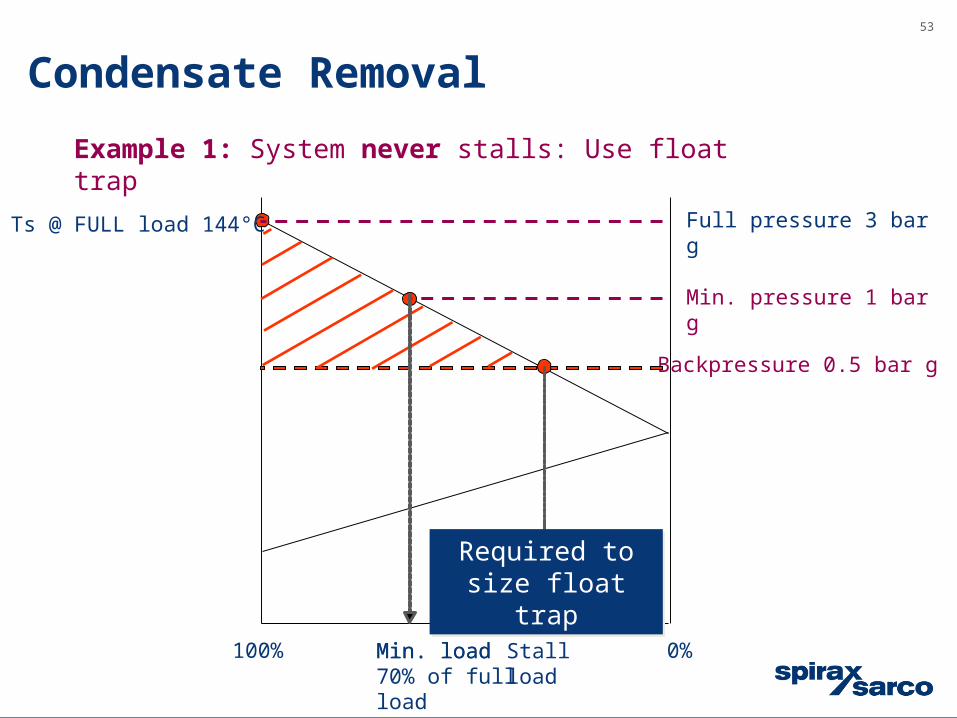
Example 1: System never stalls: Use float trap
Min pressure >
Backpressure
Ts @ FULL load 144°C
Condensate Removal
53
Min. load70% of full load
Backpressure 0.5 bar g
Min. pressure 1 bar g
Example 1: System never stalls: Use float trap
Min. load Stall load
Required to size float trap
Required to size float trap
100% 0%
Full pressure 3 bar g Ts @ FULL load 144°C
Condensate Removal
54
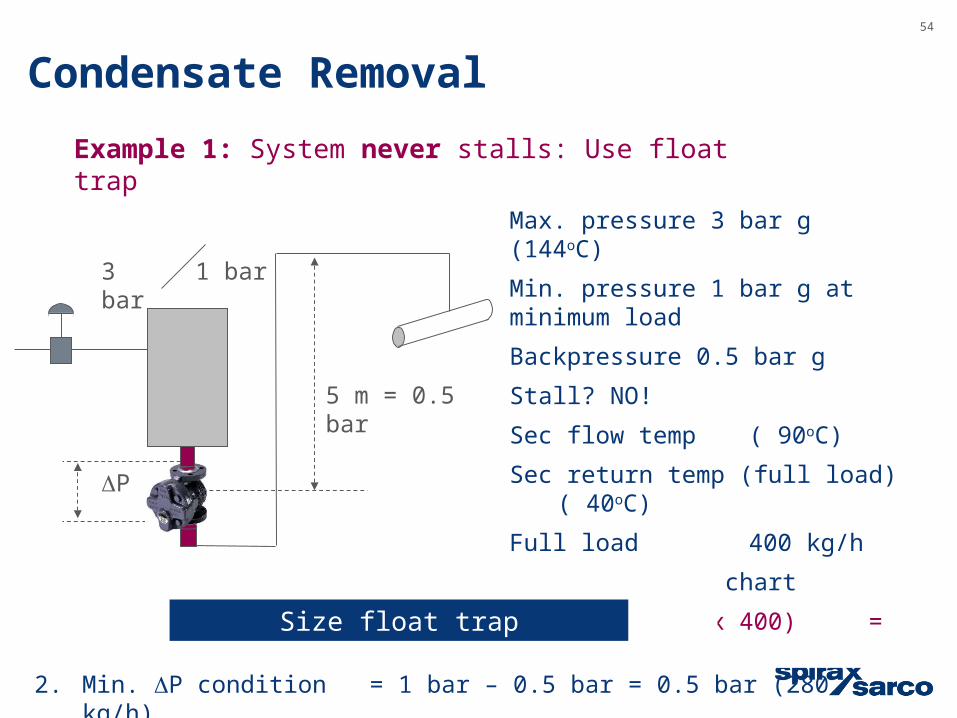
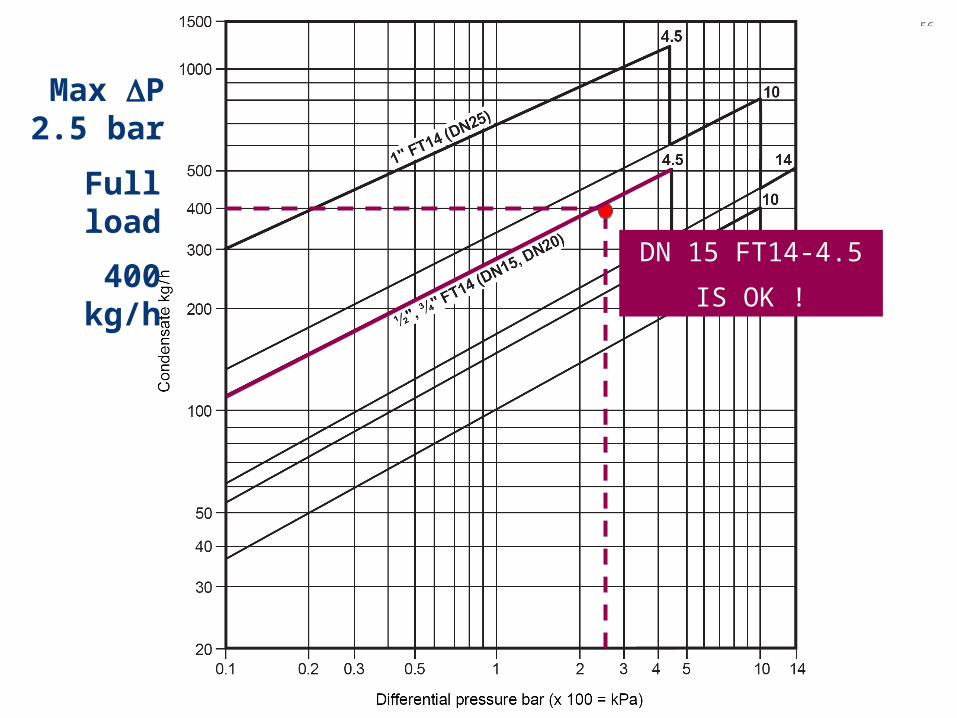
Summary:
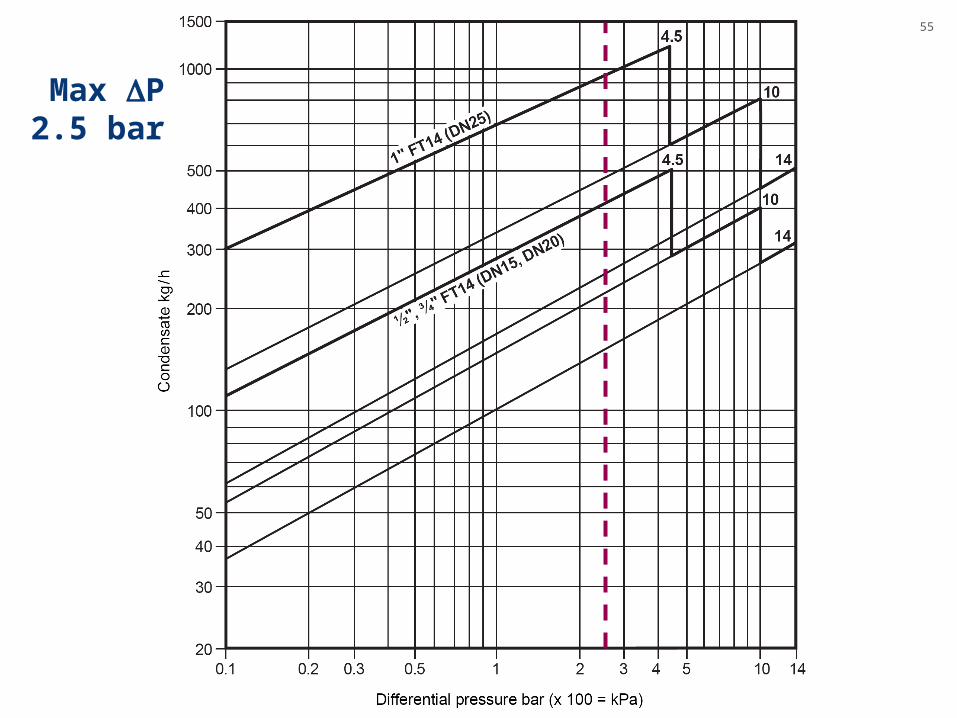
1. Max. DP condition = 3 bar – 0.5 bar = 2.5 bar (400 kg/h)
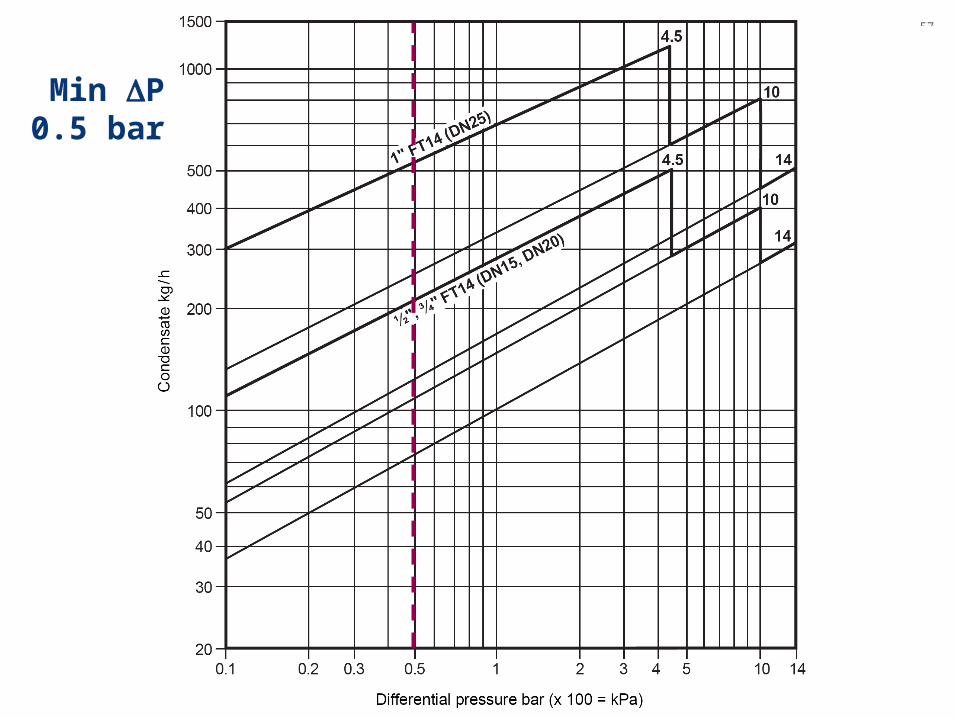
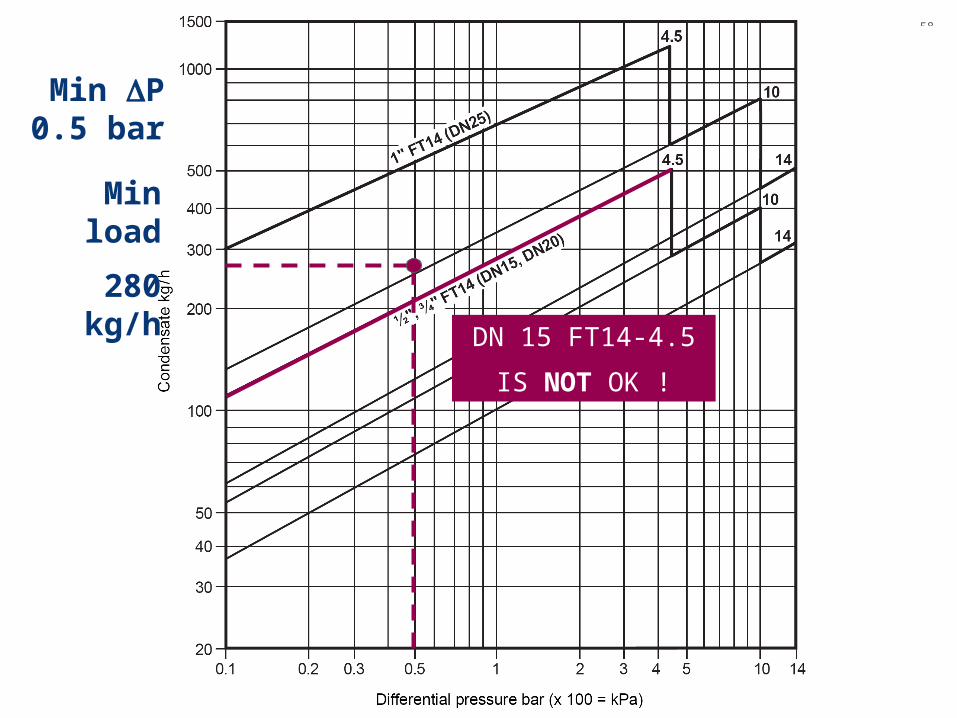
2. Min. DP condition = 1 bar – 0.5 bar = 0.5 bar (280 kg/h)
5 m = 0.5 bar
DP
3 bar 1 bar
Max. pressure 3 bar g (144oC)
Min. pressure 1 bar g at minimum load
Backpressure 0.5 bar g
Stall? NO!
Sec flow temp ( 90oC)
Sec return temp (full load) ( 40oC)
Full load 400 kg/h
From the stall chart
Min load (70% x 400) = 280 kg/h
Example 1: System never stalls: Use float trap
Size float trap
Condensate Removal
55
Max DP 2.5 bar
56
Full load
400 kg/h
Max DP 2.5 bar
DN 15 FT14-4.5
IS OK !
57
Min DP 0.5 bar
58
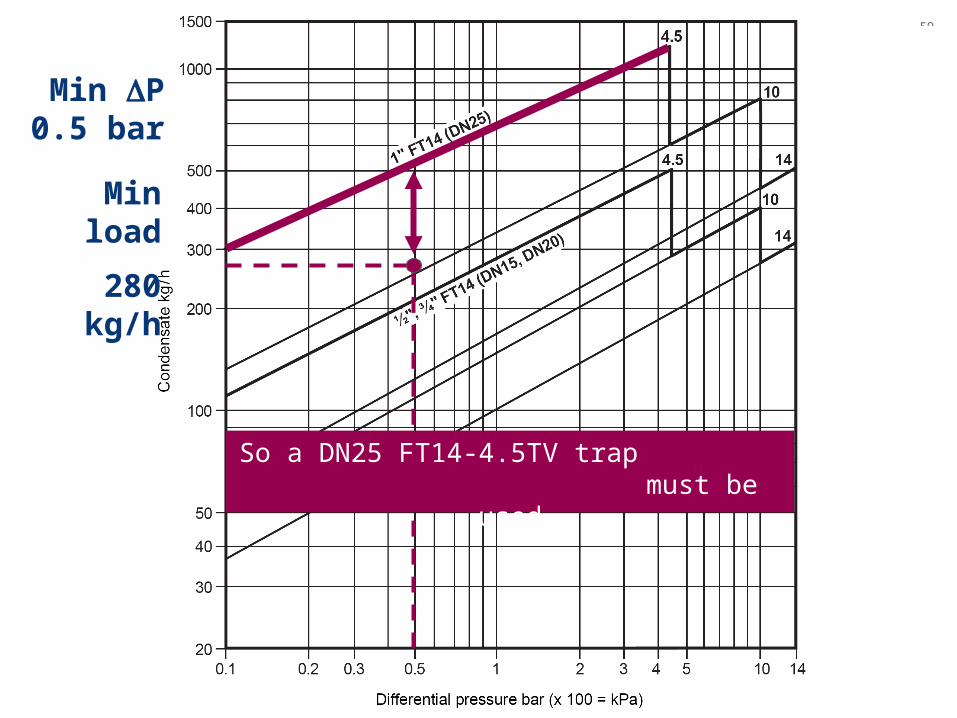
Min load
280 kg/h
Min DP 0.5 bar
DN 15 FT14-4.5
IS NOT OK !
59
Min load
280 kg/h
Min DP 0.5 bar
So a DN25 FT14-4.5TV trap must be used
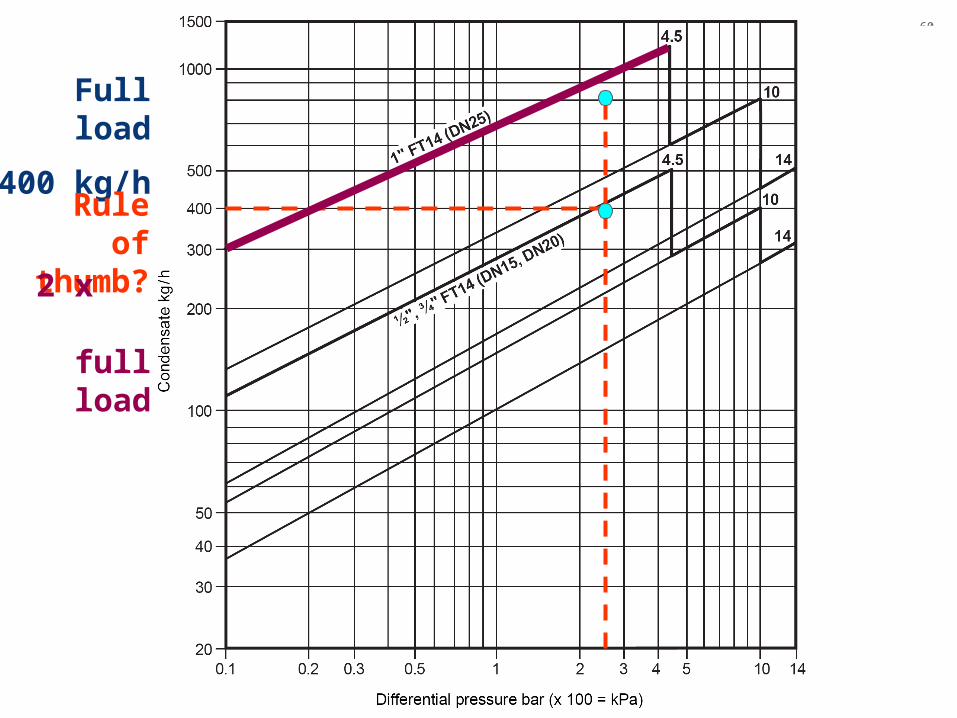
60
Full load
400 kg/h
Rule of thumb?2 x
full load
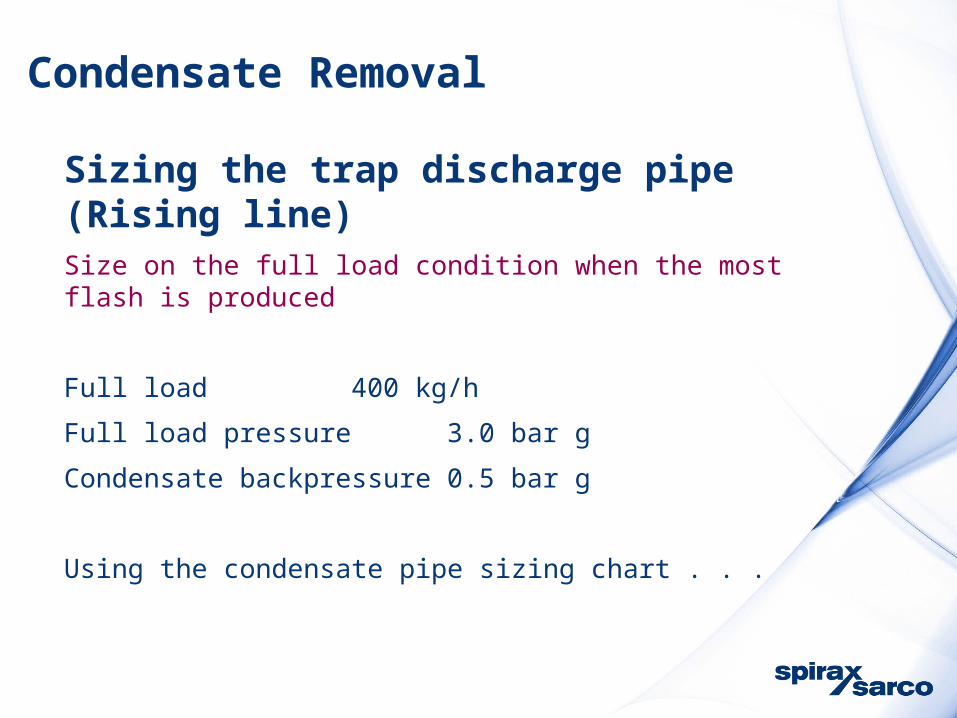
Sizing the trap discharge pipe (Rising line)Size on the full load condition when the most flash is produced
Full load 400 kg/h
Full load pressure 3.0 bar g
Condensate backpressure 0.5 bar g
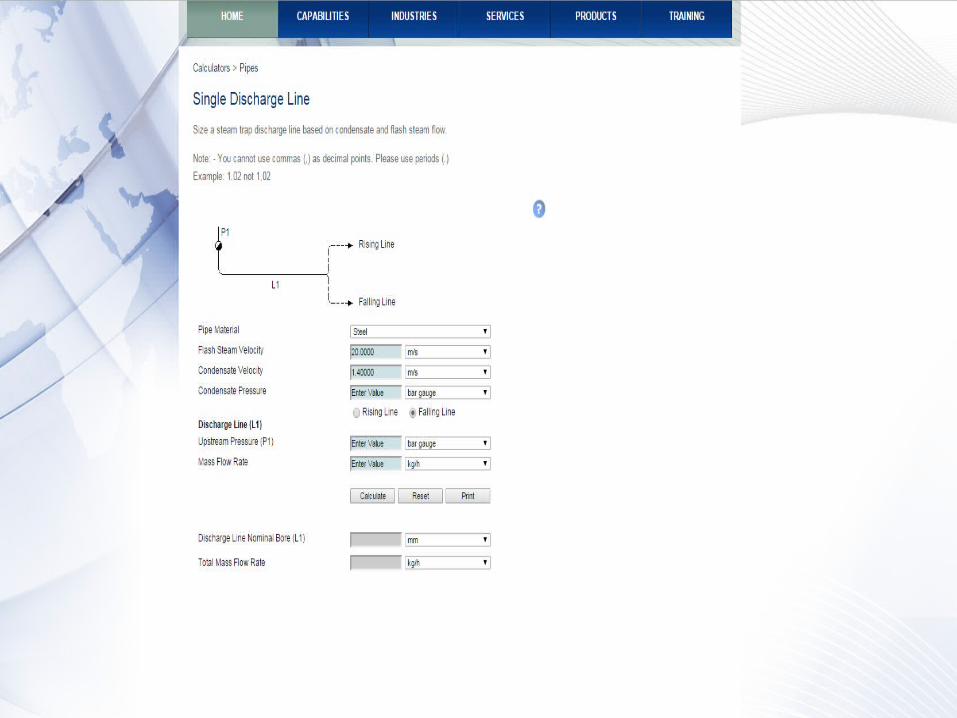
Using the condensate pipe sizing chart . . .
Condensate Removal
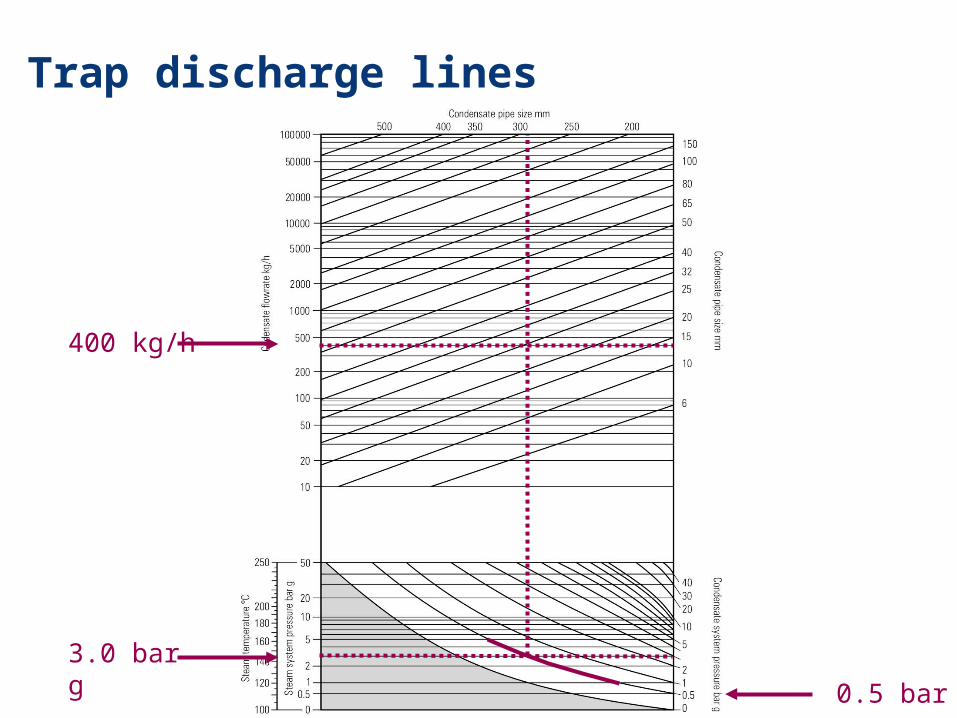
Trap discharge lines
3.0 bar g
0.5 bar g
400 kg/h
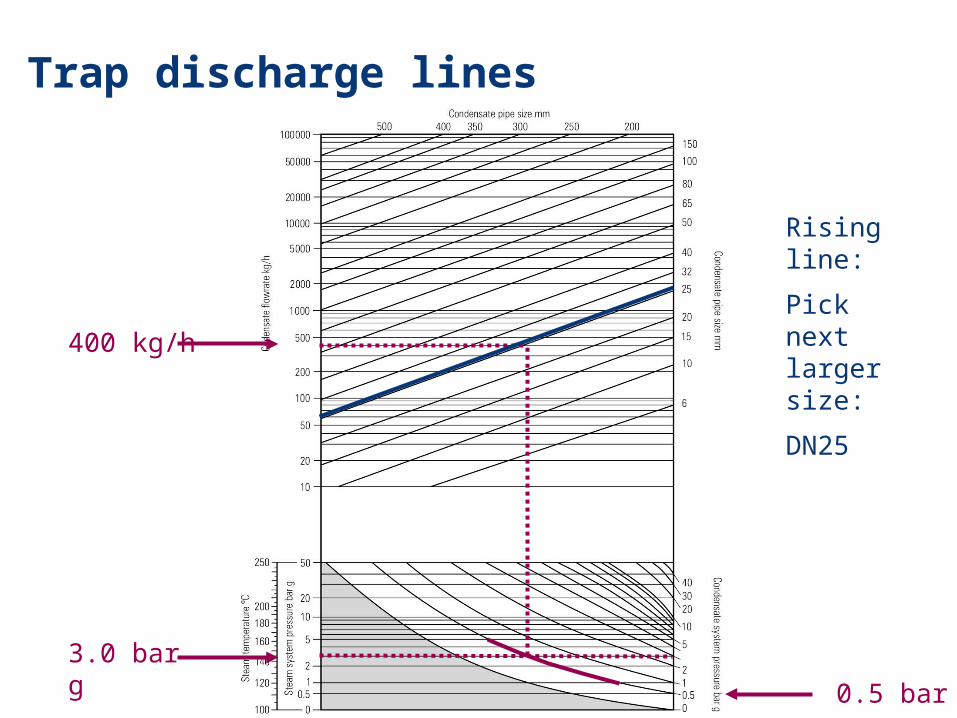
Trap discharge lines
3.0 bar g
0.5 bar g
400 kg/h
Rising line:
Pick next larger size:
DN25
The website calculator gives the same result
Condensate Removal
66
5 m = 0.5 bar
3 bar 1 bar
Example 1: System never stalls: Use float trap
Condensate and flash recovery
Result:
DN25 FT14-4.5
with DN25 pipe

Condensate and flash recovery
Example 2
68
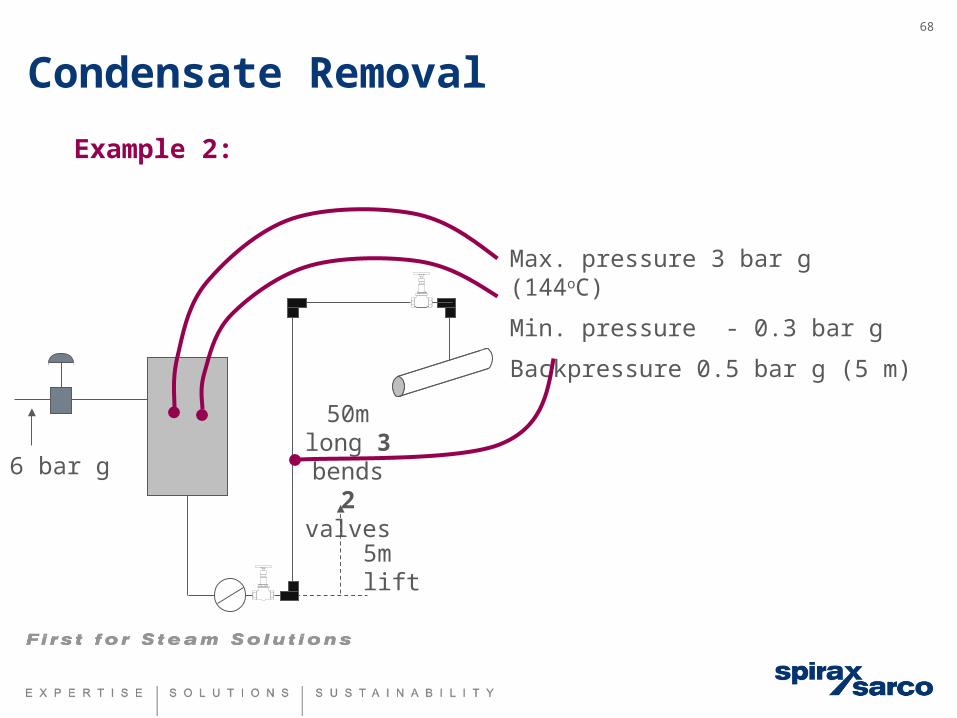
Max. pressure 3 bar g (144oC)
Min. pressure - 0.3 bar g
Backpressure 0.5 bar g (5 m)
6 bar g
50m long 3 bends 2 valves
5m lift
Example 2:
Condensate Removal
69
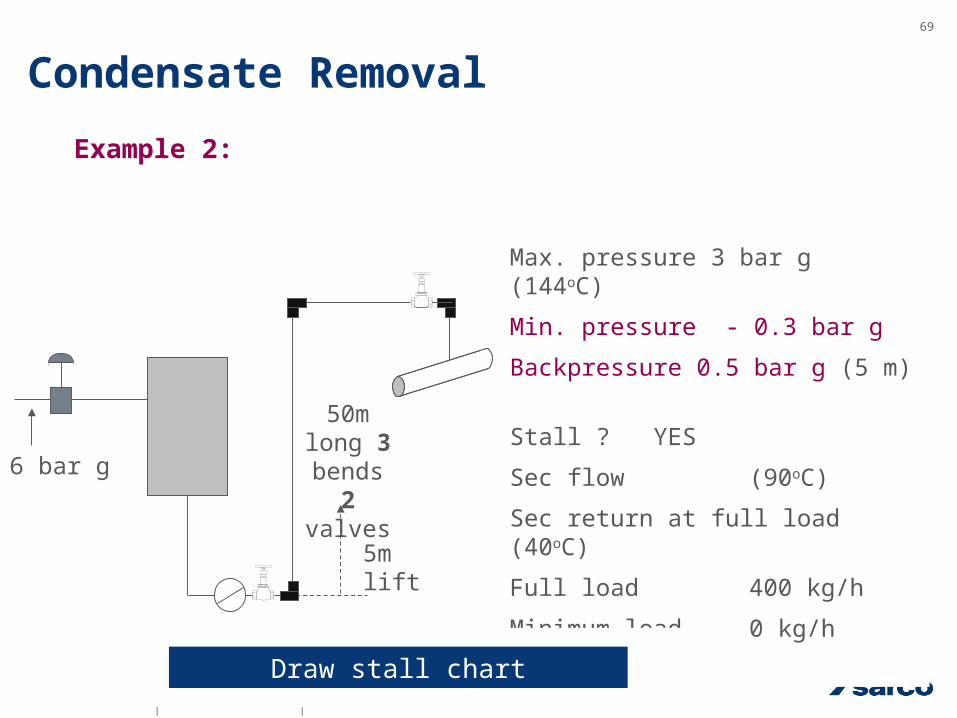
Max. pressure 3 bar g (144oC)
Min. pressure - 0.3 bar g
Backpressure 0.5 bar g (5 m)
Stall ?
6 bar g
50m long 3 bends 2 valves
5m lift
Example 2:
Max. pressure 3 bar g (144oC)
Min. pressure - 0.3 bar g
Backpressure 0.5 bar g (5 m)
Stall ?
??Min pressure
< Backpressure
Max. pressure 3 bar g (144oC)
Min. pressure - 0.3 bar g
Backpressure 0.5 bar g (5 m)
Stall ? YES
Max. pressure 3 bar g (144oC)
Min. pressure - 0.3 bar g
Backpressure 0.5 bar g (5 m)
Stall ? YES
Sec flow (90oC)
Sec return at full load (40oC)
Full load 400 kg/h
Minimum load 0 kg/h
Draw stall chart
Condensate Removal
70
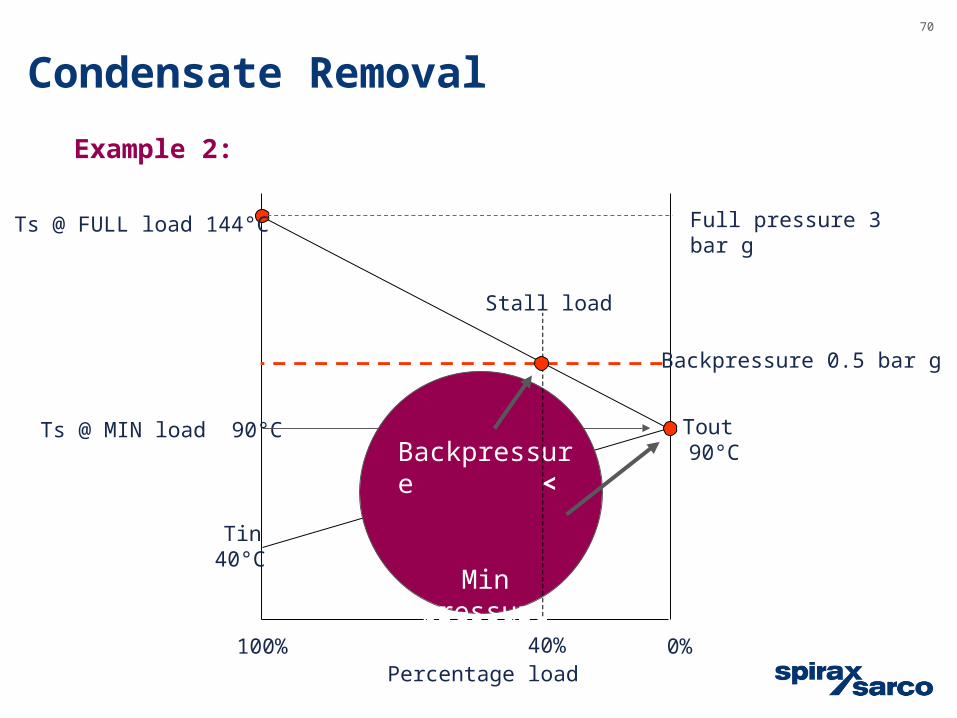
Tin 40°C
Tout 90°C
Percentage load100% 0%
Ts @ MIN load 90°C
Full pressure 3 bar g
Example 2:
Ts @ FULL load 144°C
Backpressure <
Min pressure
40%
Stall load
Backpressure 0.5 bar g
Condensate Removal
71
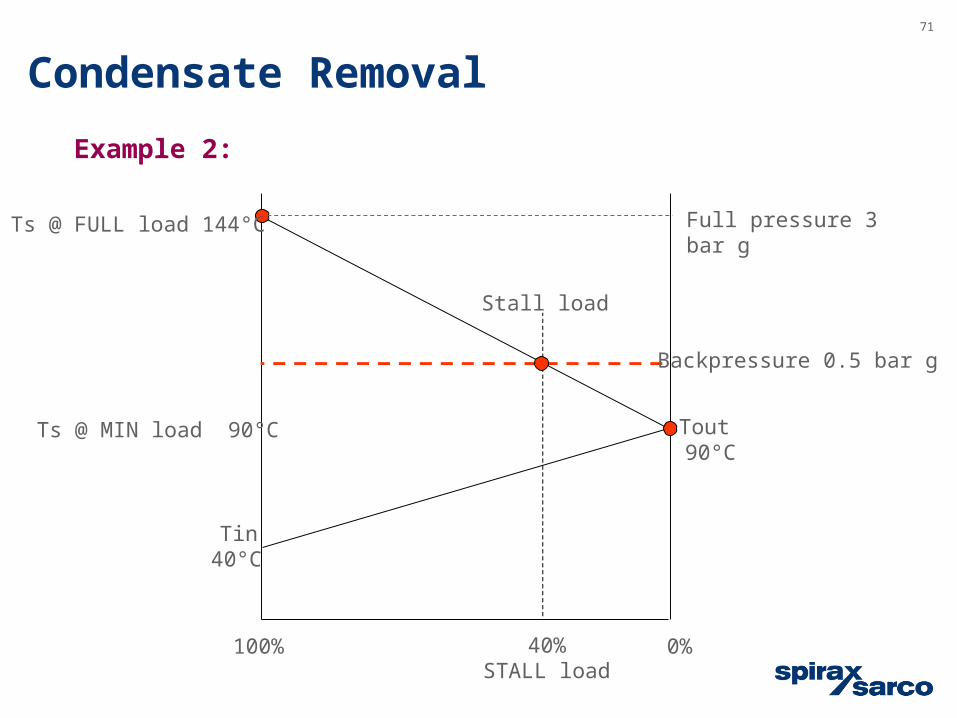
Tin 40°C
Tout 90°C
100% 0%
Ts @ MIN load 90°C
Full pressure 3 bar g
Example 2:
Ts @ FULL load 144°C
40%STALL load
Stall load
Backpressure 0.5 bar g
Condensate Removal
72
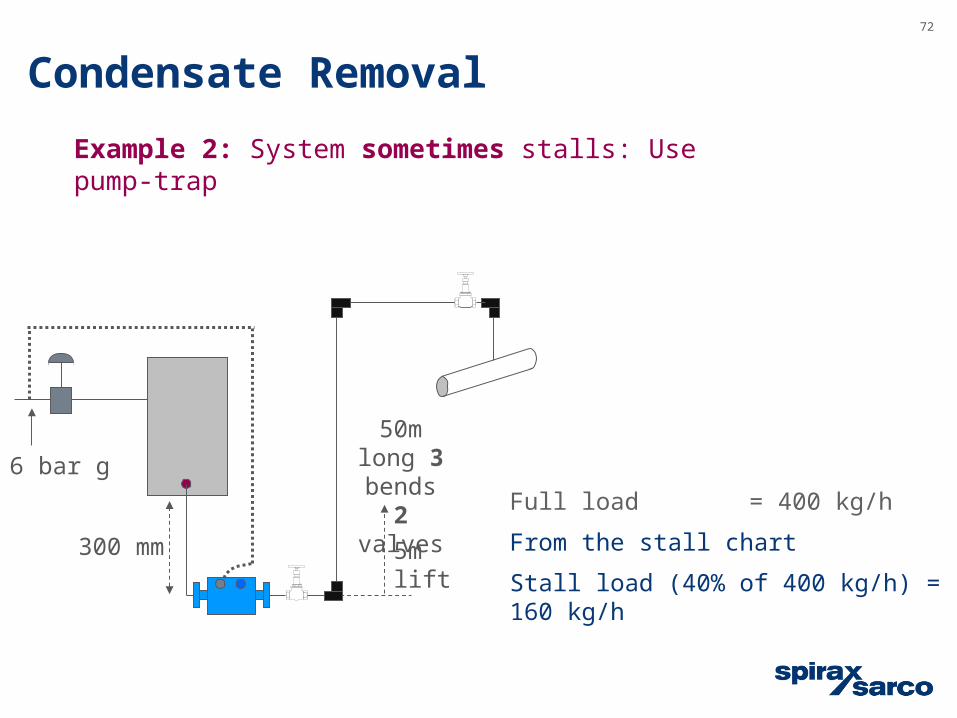
Example 2: System sometimes stalls: Use pump-trap
Max. pressure 3 bar g (144oC)
Min. pressure - 0.3 bar g
Backpressure 0.5 bar g (5 m)
Stall ? YES
Sec flow (90oC)
Sec return at full load (40oC)
Full load = 400 kg/h
From the stall chart
Stall load (40% of 400 kg/h) = 160 kg/h
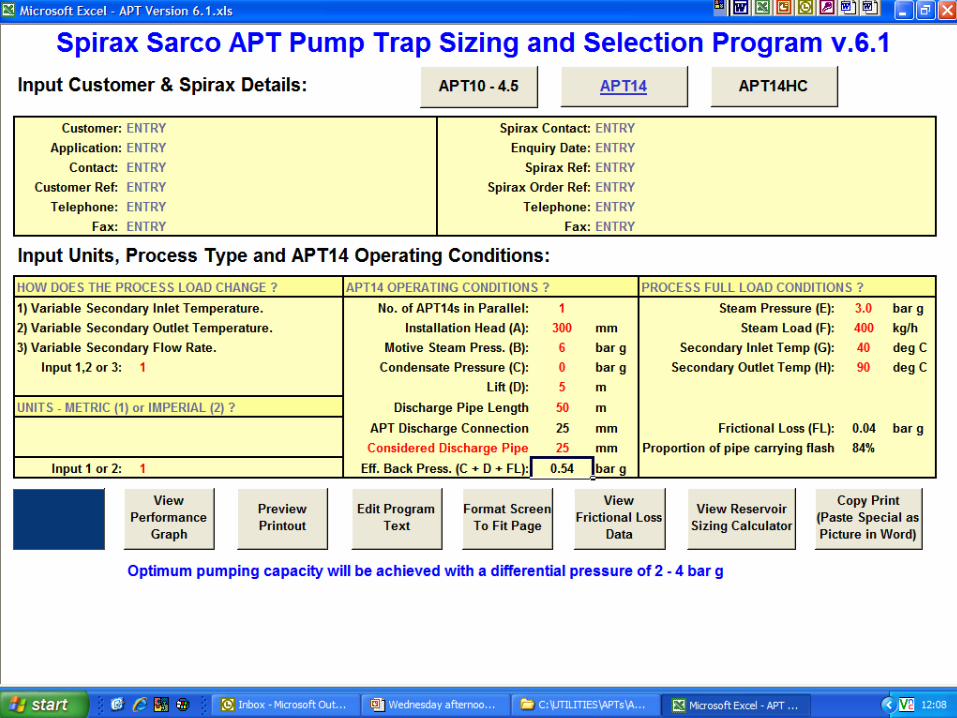
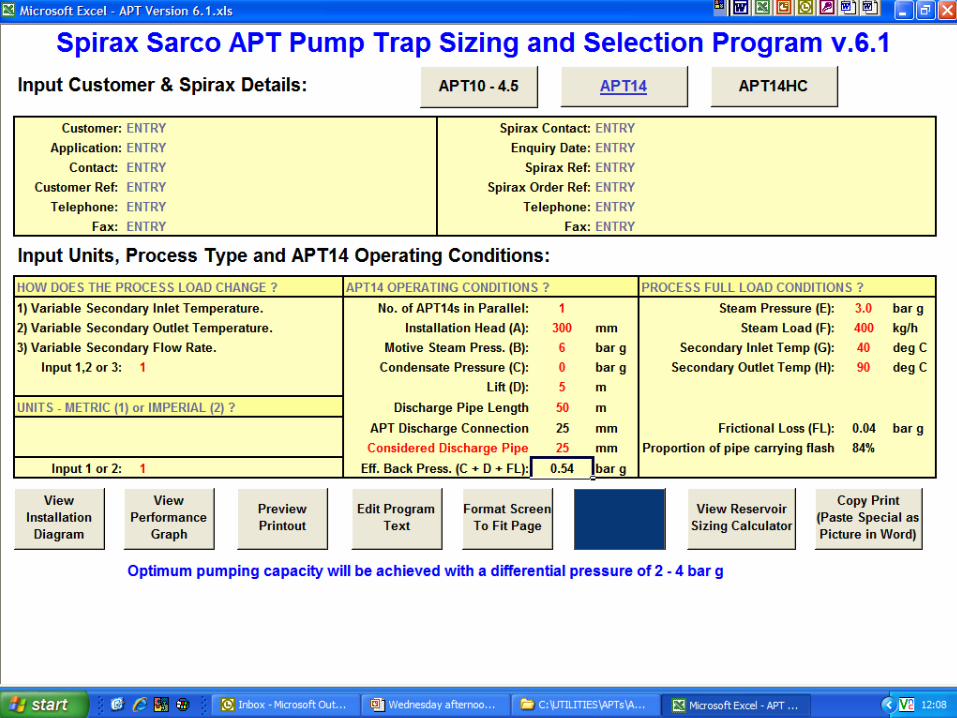
300 mm
6 bar g
5m lift
50m long 3 bends 2 valves
Condensate Removal
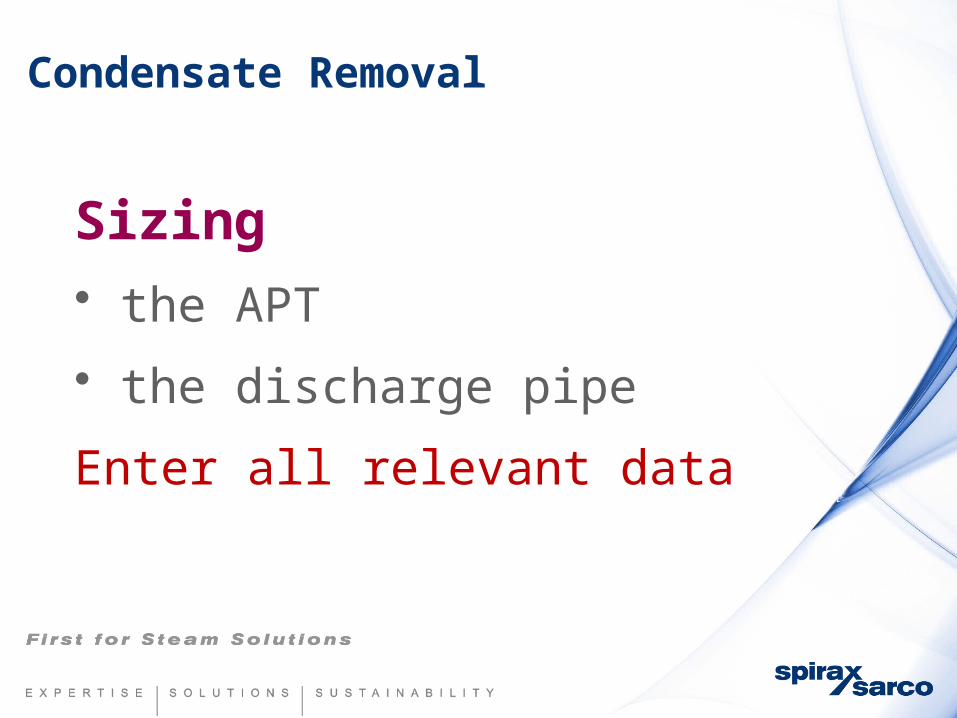
Sizing
• the APT
• the discharge pipe
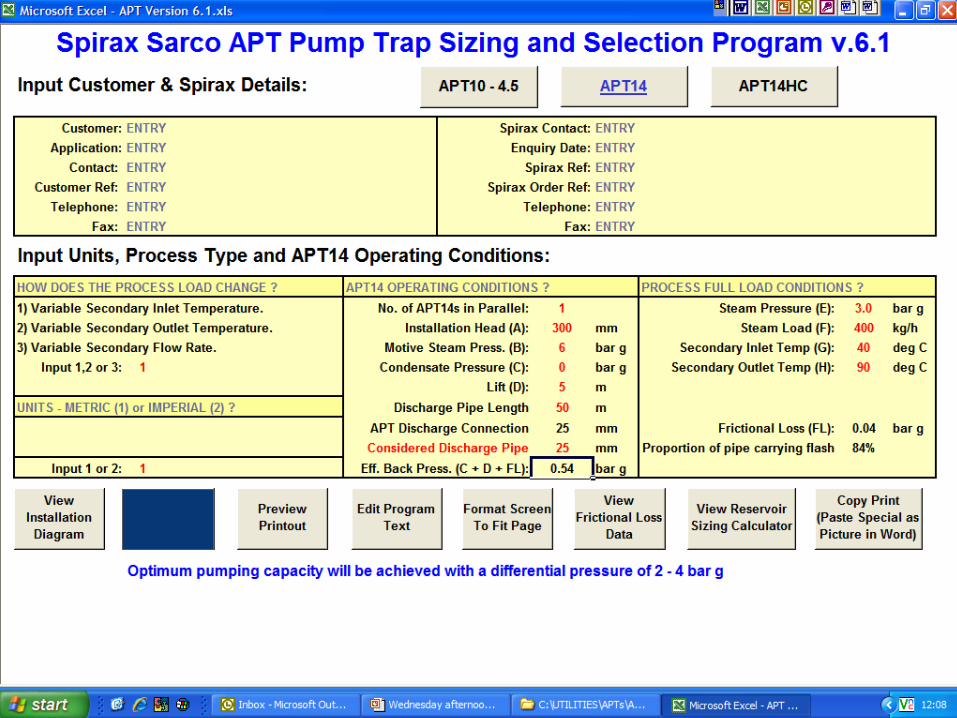
Enter all relevant data
Condensate Removal
75
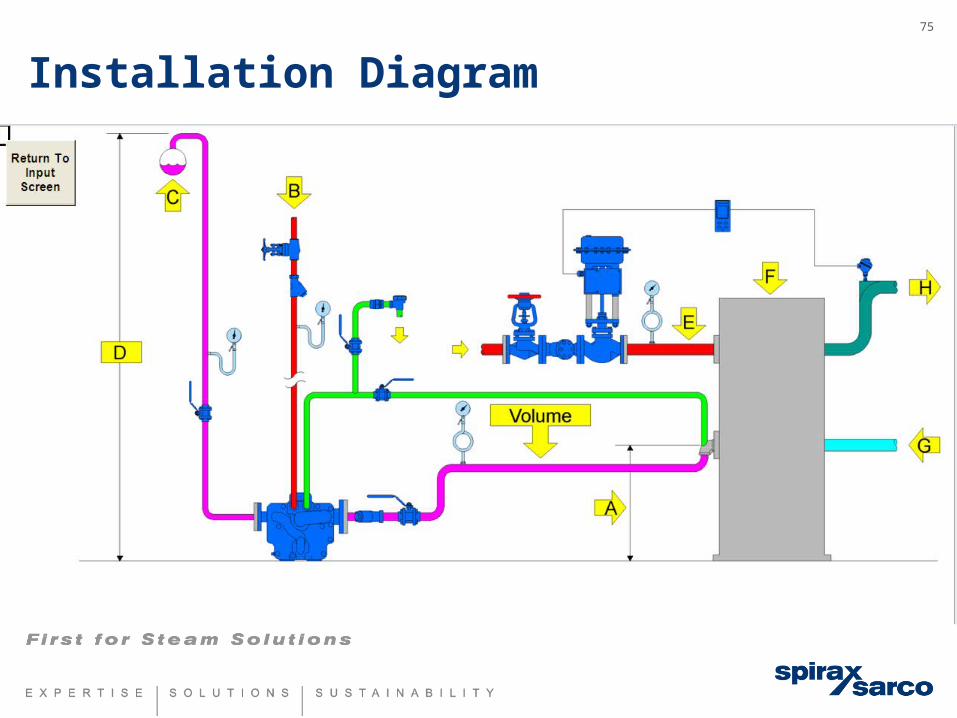
Installation Diagram
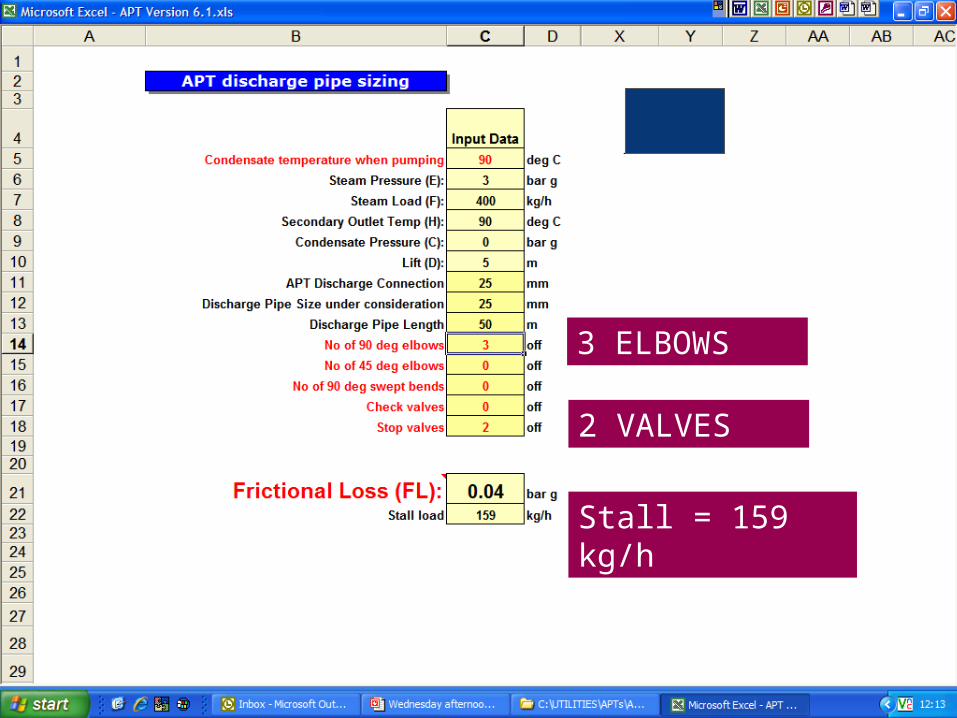
3 ELBOWS
2 VALVES
Stall = 159 kg/h
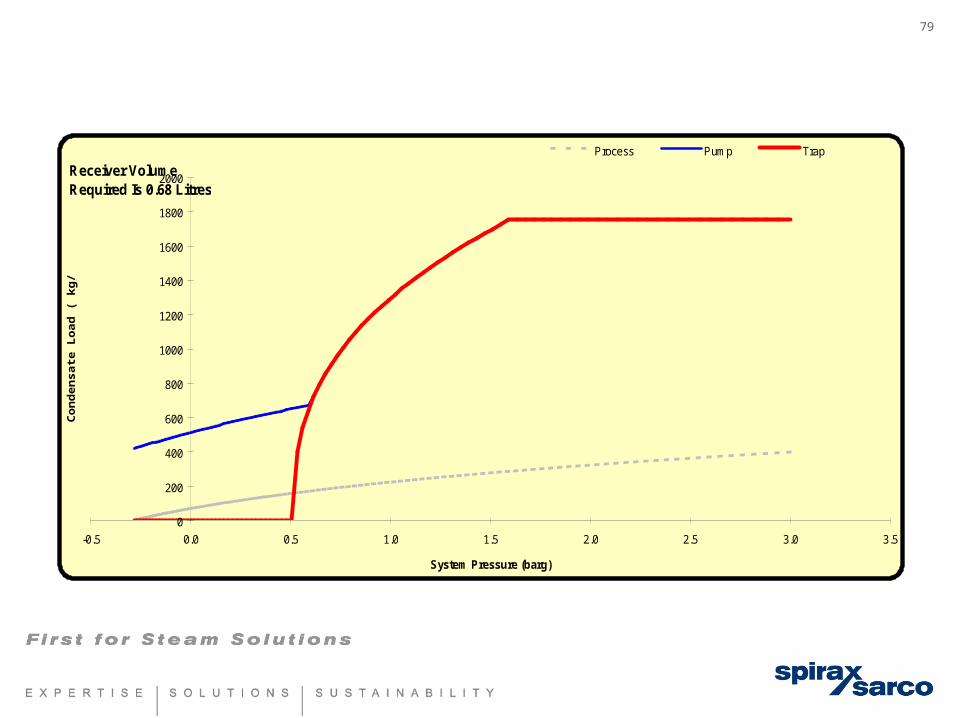
79
0
200
400
600
800
1000
1200
1400
1600
1800
2000
-0.5 0.0 0.5 1.0 1.5 2.0 2.5 3.0 3.5
System Pressure (barg)
Co
nd
ensa
te L
oad
( k
g/h
r )
Process Pump Trap
Receiver Volume Required Is 0.68 Litres
Stall = 159 kg/h
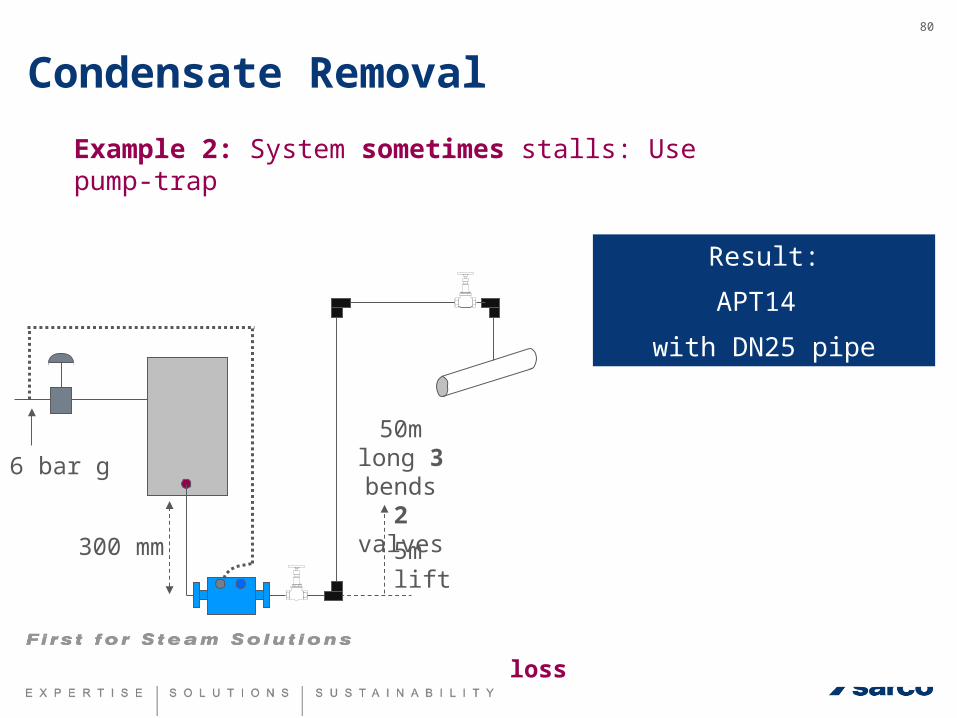
80
Example 2: System sometimes stalls: Use pump-trap
Max. pressure 3 bar g (144oC)
Min. pressure - 0.3 bar g
Backpressure 0.5 bar g (5 m)
Full load = 400 kg/h
From the stall chart
Stall load (40% of 400 kg/h) = 160 kg/h
From the APT software = 159 kg/h
??
Max. pressure 3 bar g (144oC)
Min. pressure - 0.3 bar g
Backpressure 0.5 bar g (5 m)
Full load = 400 kg/h
From the stall chart
Stall load (40% of 400 kg/h) = 160 kg/h
From the APT software = 159 kg/h
Difference due to friction loss
300 mm
6 bar g
5m lift
50m long 3 bends 2 valves
Result:
APT14
with DN25 pipe
Condensate Removal

Example 3
Condensate Removal
82
5 metre lift
3.8 Bar g
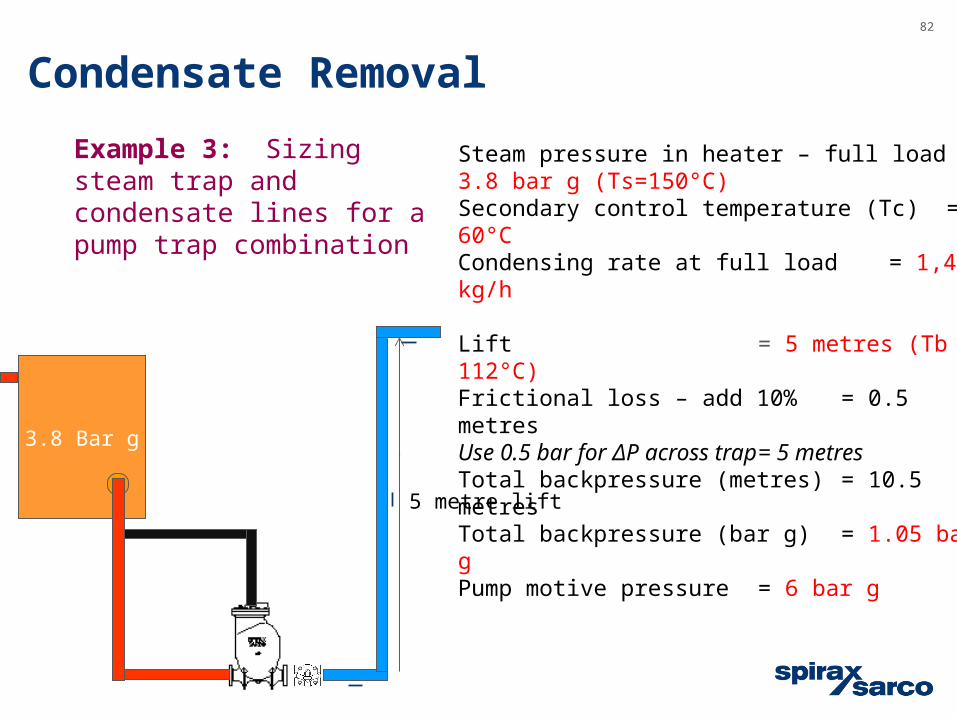
Steam pressure in heater – full load = 3.8 bar g (Ts=150°C)Secondary control temperature (Tc) = 60°CCondensing rate at full load = 1,400 kg/h
Lift = 5 metres (Tb = 112°C)Frictional loss – add 10% = 0.5 metres Use 0.5 bar for ΔP across trap = 5 metresTotal backpressure (metres) = 10.5 metresTotal backpressure (bar g) = 1.05 bar gPump motive pressure = 6 bar g
Example 3: Sizing steam trap and condensate lines for a pump trap combination
Condensate Removal
83
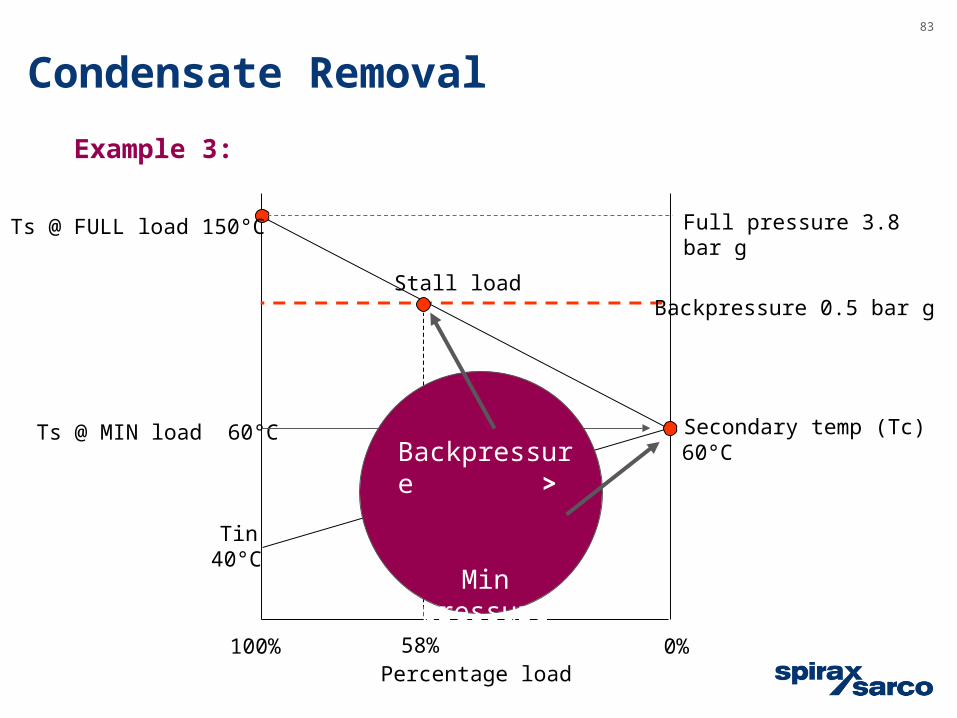
Tin 40°C
Secondary temp (Tc)60°C
Percentage load100% 0%
Ts @ MIN load 60°C
Full pressure 3.8 bar g
Example 3:
Ts @ FULL load 150°C
58%
Stall loadBackpressure 0.5 bar g
Backpressure >
Min pressure
Condensate Removal
84
5 metre lift
3.8 Bar g
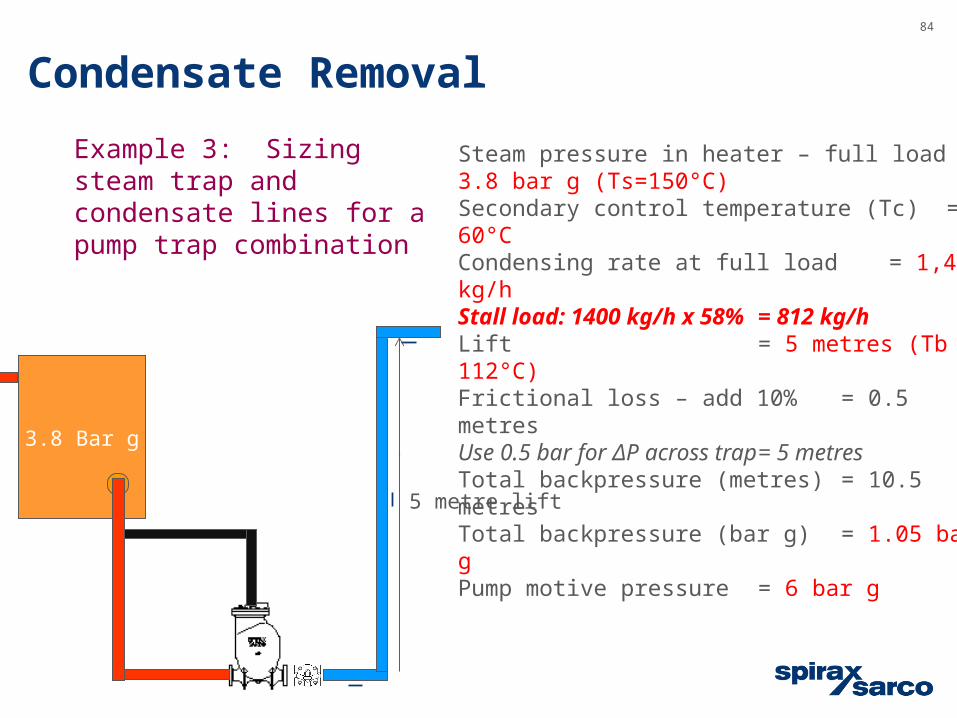
Steam pressure in heater – full load = 3.8 bar g (Ts=150°C)Secondary control temperature (Tc) = 60°CCondensing rate at full load = 1,400 kg/hStall load: 1400 kg/h x 58% = 812 kg/hLift = 5 metres (Tb = 112°C)Frictional loss – add 10% = 0.5 metres Use 0.5 bar for ΔP across trap = 5 metresTotal backpressure (metres) = 10.5 metresTotal backpressure (bar g) = 1.05 bar gPump motive pressure = 6 bar g
Example 3: Sizing steam trap and condensate lines for a pump trap combination
Condensate Removal
85
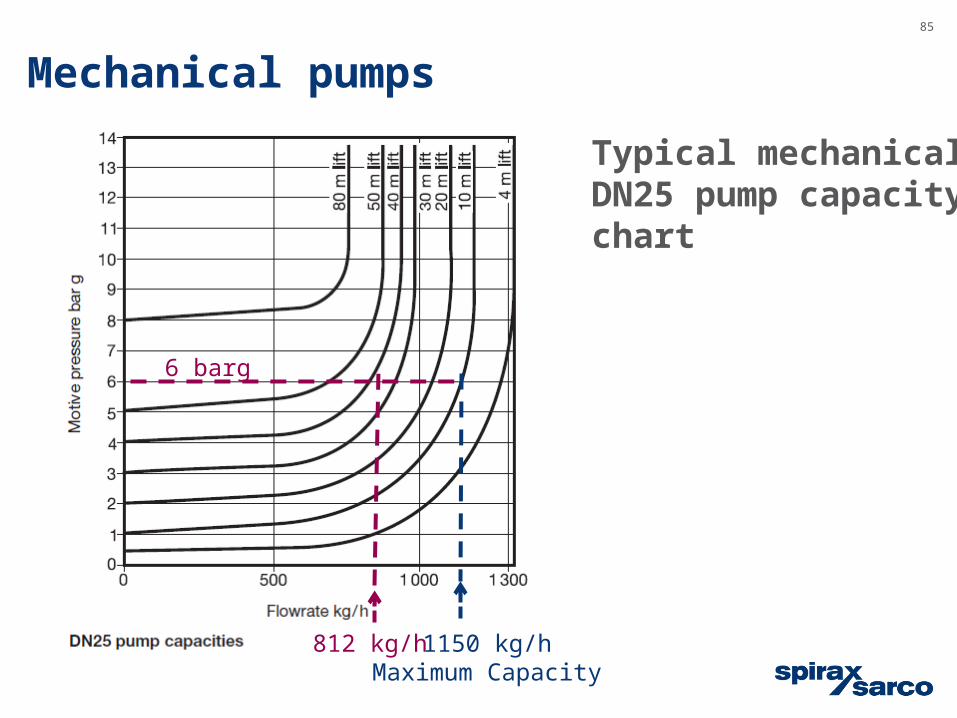
812 kg/h
6 barg
Mechanical pumps
Typical mechanical DN25 pump capacity chart
1150 kg/hMaximum Capacity
86
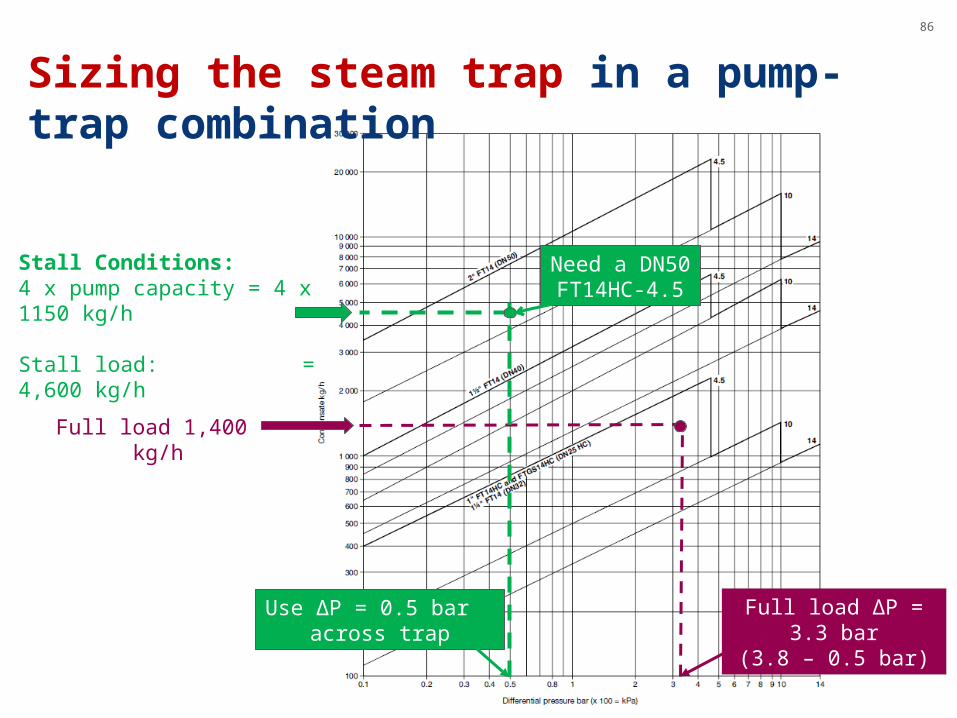
Full load 1,400 kg/h
Full load ΔP = 3.3 bar(3.8 – 0.5 bar)
Use ΔP = 0.5 bar across trap
Stall Conditions:4 x pump capacity = 4 x 1150 kg/h
Stall load: = 4,600 kg/h
Need a DN50 FT14HC-4.5
Sizing the steam trap in a pump-trap combination
87
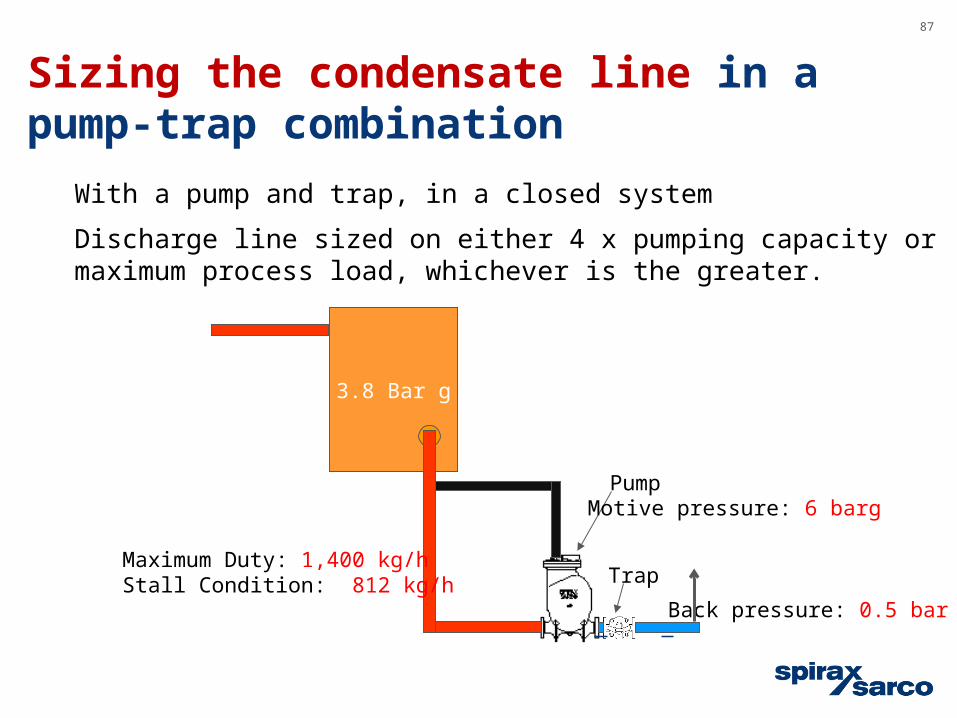
With a pump and trap, in a closed system
Discharge line sized on either 4 x pumping capacity or maximum process load, whichever is the greater.
3.8 Bar g
Pump
TrapMaximum Duty: 1,400 kg/hStall Condition: 812 kg/h
Back pressure: 0.5 bar g
Motive pressure: 6 barg
Sizing the condensate line in a pump-trap combination
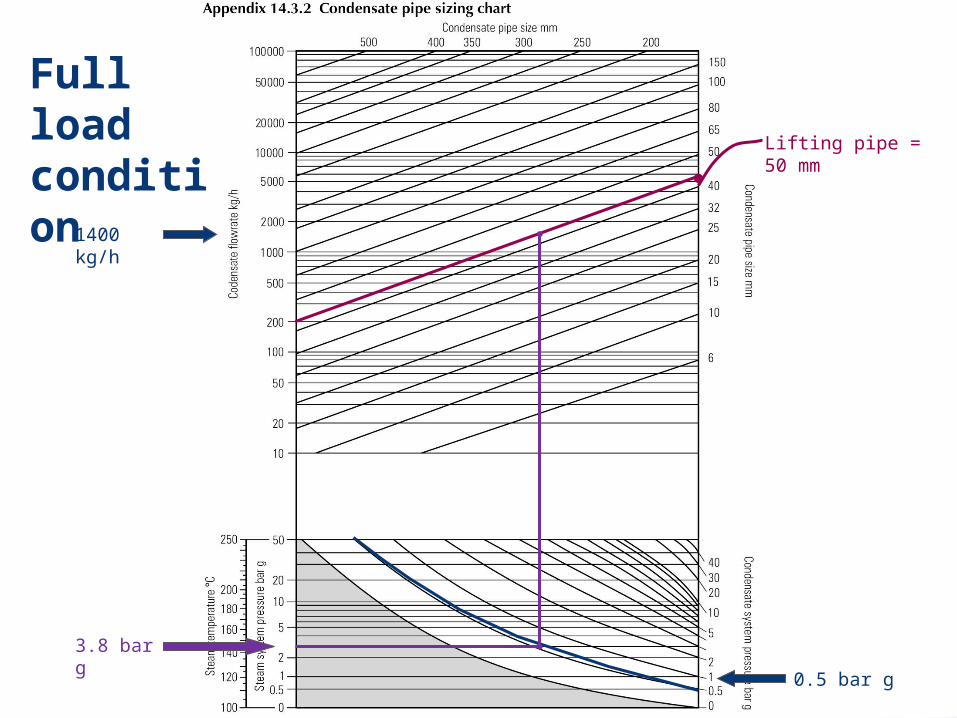
3.8 bar g
0.5 bar g
1400 kg/h
Lifting pipe = 50 mm
Full load condition

4600 kg/h
Lifting pipe = 40 mm
Pumping condition

Trapping = 50 mm
Pumping = 40 mm
Pick larger pipe
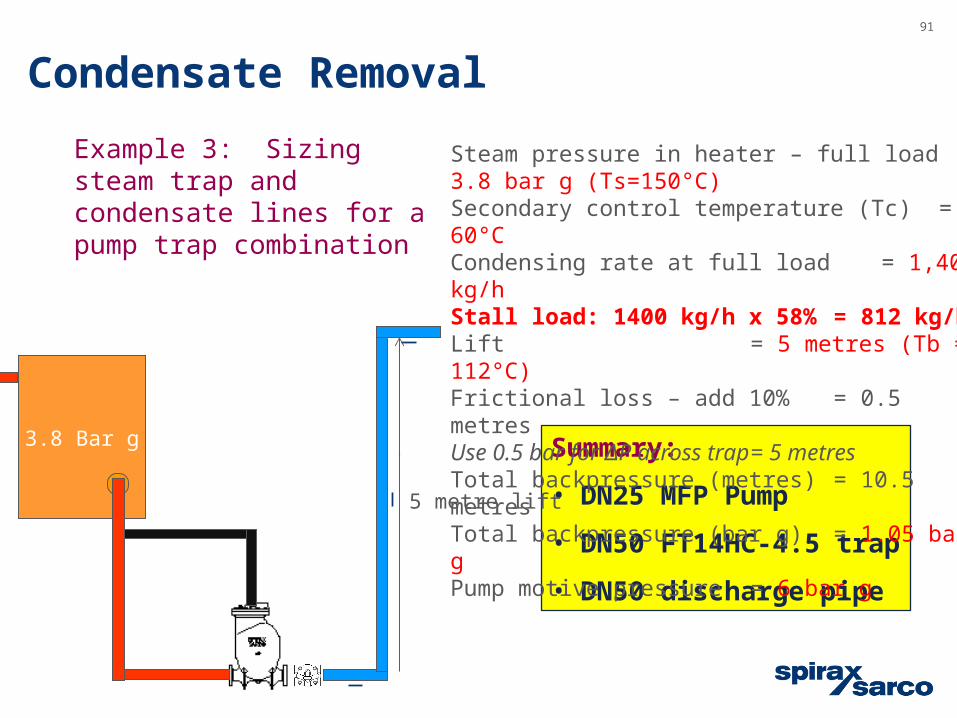
91
Summary:
• DN25 MFP Pump
• DN50 FT14HC-4.5 trap
• DN50 discharge pipe
5 metre lift
3.8 Bar g
Steam pressure in heater – full load = 3.8 bar g (Ts=150°C)Secondary control temperature (Tc) = 60°CCondensing rate at full load = 1,400 kg/hStall load: 1400 kg/h x 58% = 812 kg/hLift = 5 metres (Tb = 112°C)Frictional loss – add 10% = 0.5 metres Use 0.5 bar for ΔP across trap = 5 metresTotal backpressure (metres) = 10.5 metresTotal backpressure (bar g) = 1.05 bar gPump motive pressure = 6 bar g
Example 3: Sizing steam trap and condensate lines for a pump trap combination
Condensate Removal
Example 4
Condensate Removal
93
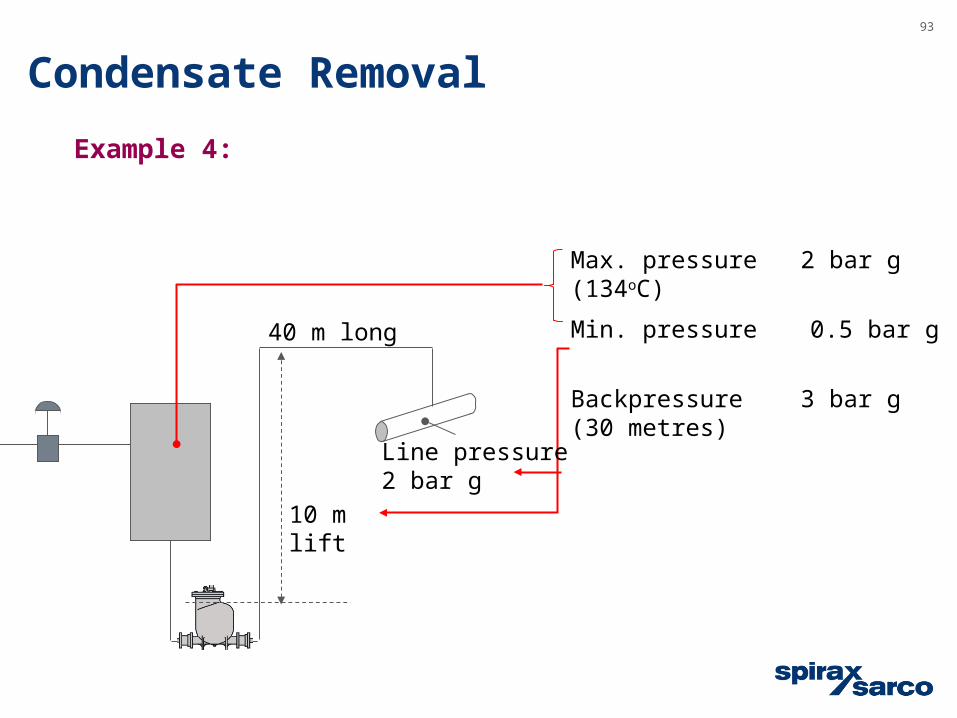
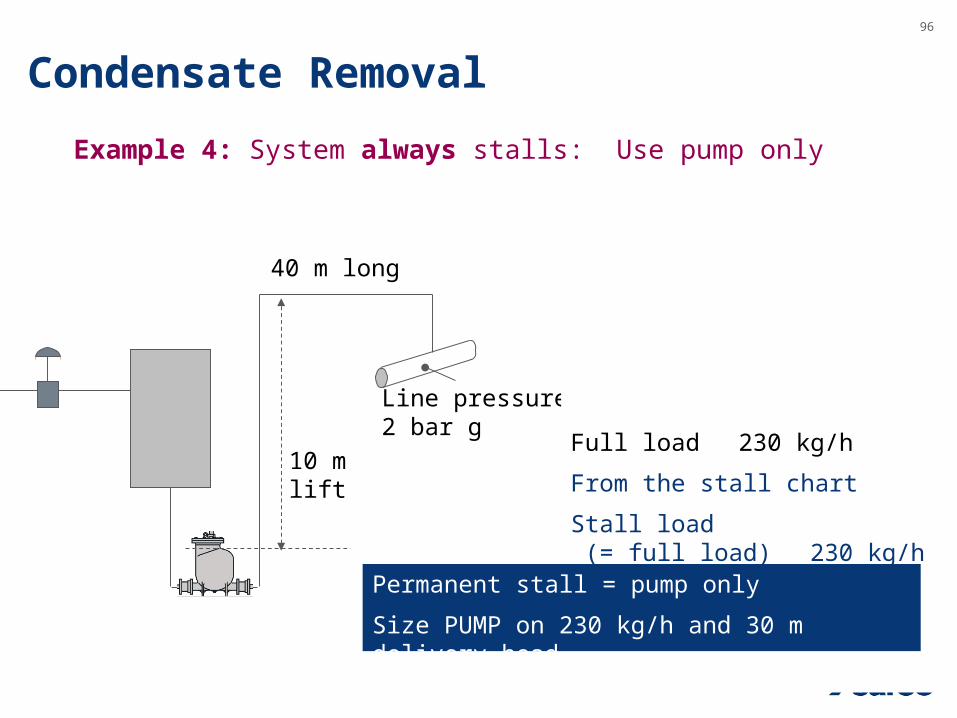
40 m long
10 m lift
Example 4:
Max. pressure 2 bar g (134oC)
Min. pressure 0.5 bar g
Backpressure 3 bar g (30 metres)
Line pressure 2 bar g
Condensate Removal
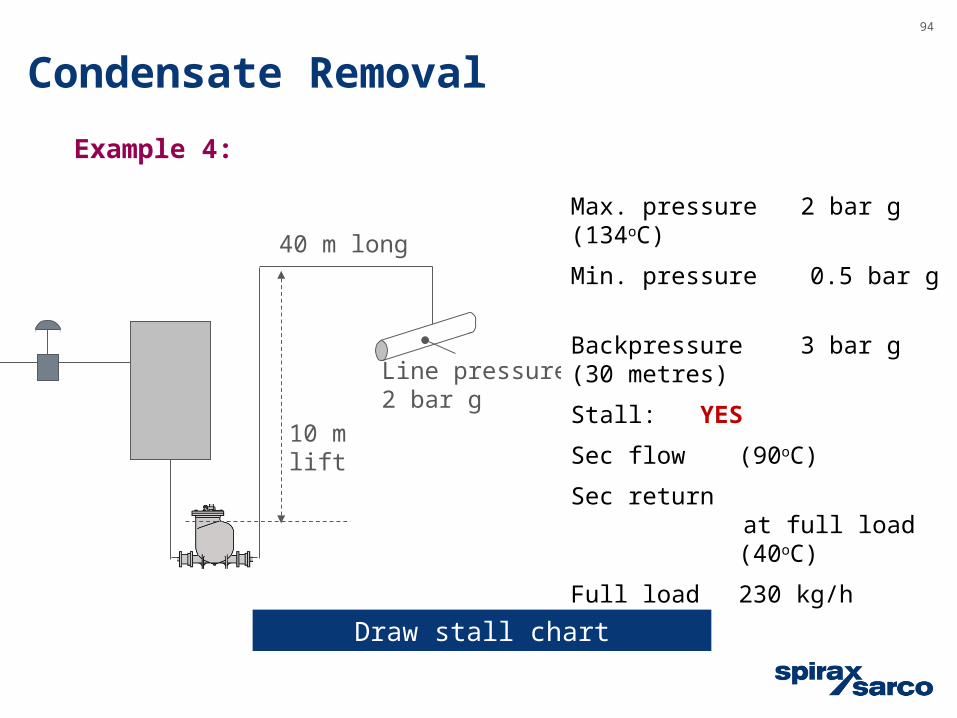
94
Max. pressure 2 bar g (134oC)
Min. pressure 0.5 bar g
Backpressure 3 bar g (30 metres)
Stall:
40 m long
10 m lift
Line pressure 2 bar g
Example 4:
?
Max. pressure 2 bar g (134oC)
Min. pressure 0.5 bar g
Backpressure 3 bar g (30 metres)
Stall: YES
Backpressure >
Max pressure
Max. pressure 2 bar g (134oC)
Min. pressure 0.5 bar g
Backpressure 3 bar g (30 metres)
Stall: YES
Sec flow (90oC)
Sec return at full load (40oC)
Full load 230 kg/h
Draw stall chart
Condensate Removal
95
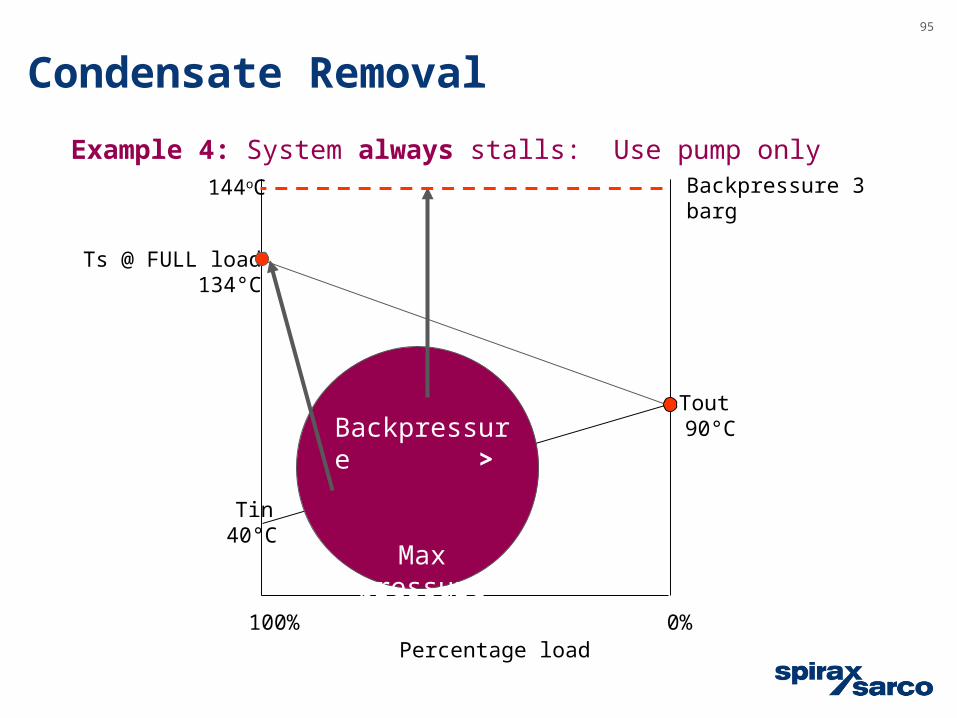
Tin
Tout 90°C
Percentage load100% 0%
Ts @ FULL load 134°C
Example 4:
40°C
Example 4: System always stalls: Use pump only
Backpressure >
Max pressure
Backpressure 3 barg144oC
Condensate Removal
96
Example 4: System always stalls: Use pump only
40 m long
10 m lift
Line pressure 2 bar g
Max. pressure 2 bar g (134oC)
Min. pressure 0.5 bar g
Backpressure 3 bar g (30 metres)
Stall: YES
Full load 230 kg/h
From the stall chart
Stall load (= full load) 230 kg/h
Permanent stall = pump only
Size PUMP on 230 kg/h and 30 m delivery head
Condensate Removal
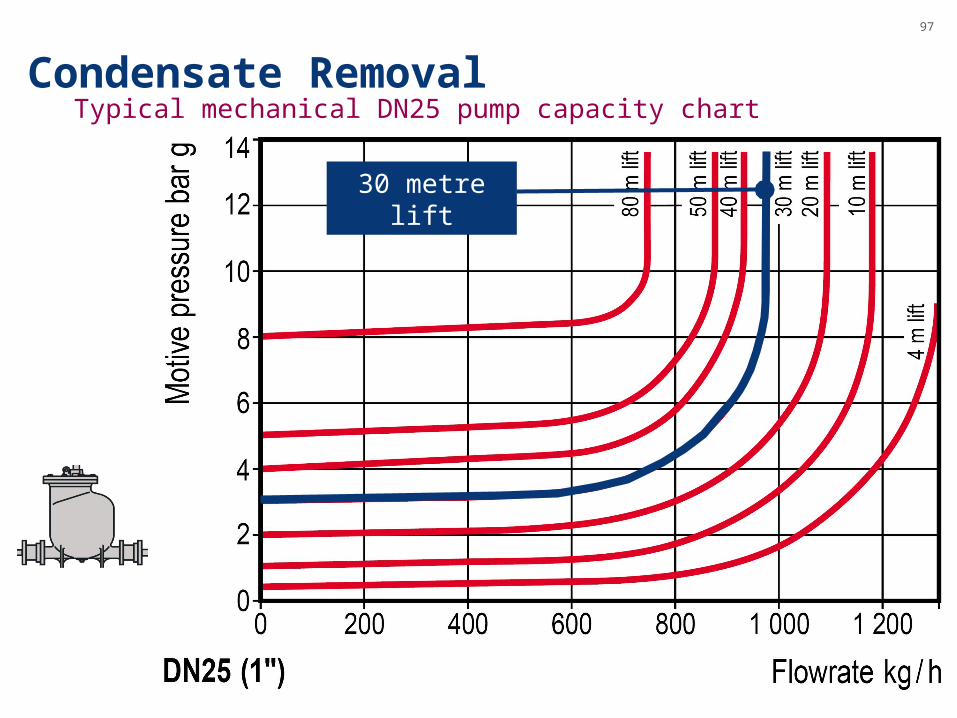
97
Typical mechanical DN25 pump capacity chart
30 metre lift
Condensate Removal
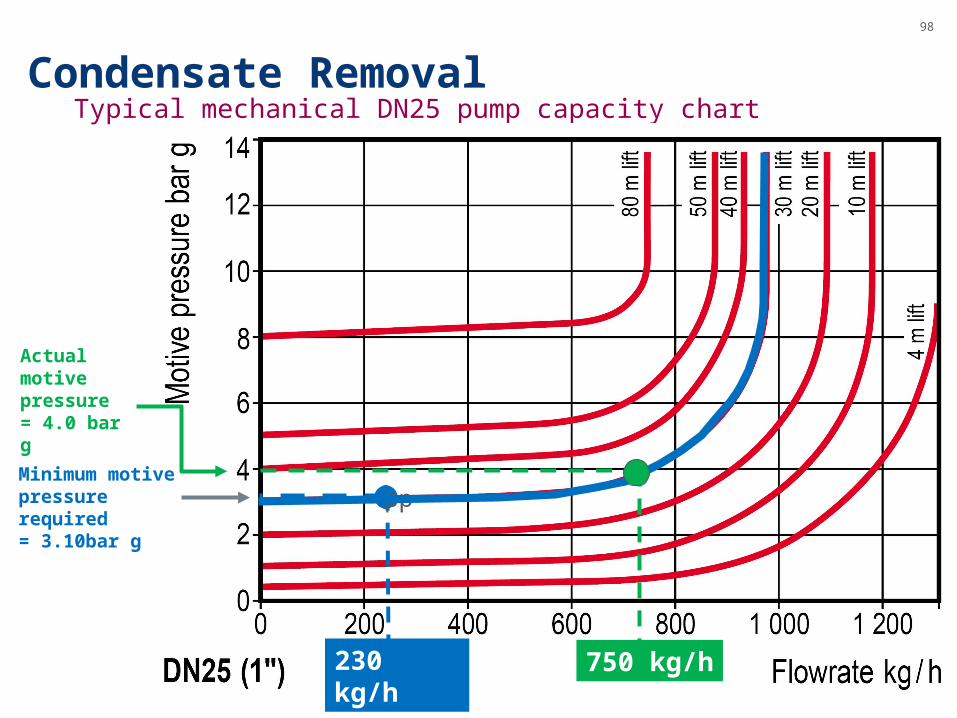
98
Typical mechanical DN25 pump capacity chart
pp
230 kg/h
Minimum motive pressure required = 3.10bar g
Actual motive pressure = 4.0 bar g
750 kg/h
Condensate Removal
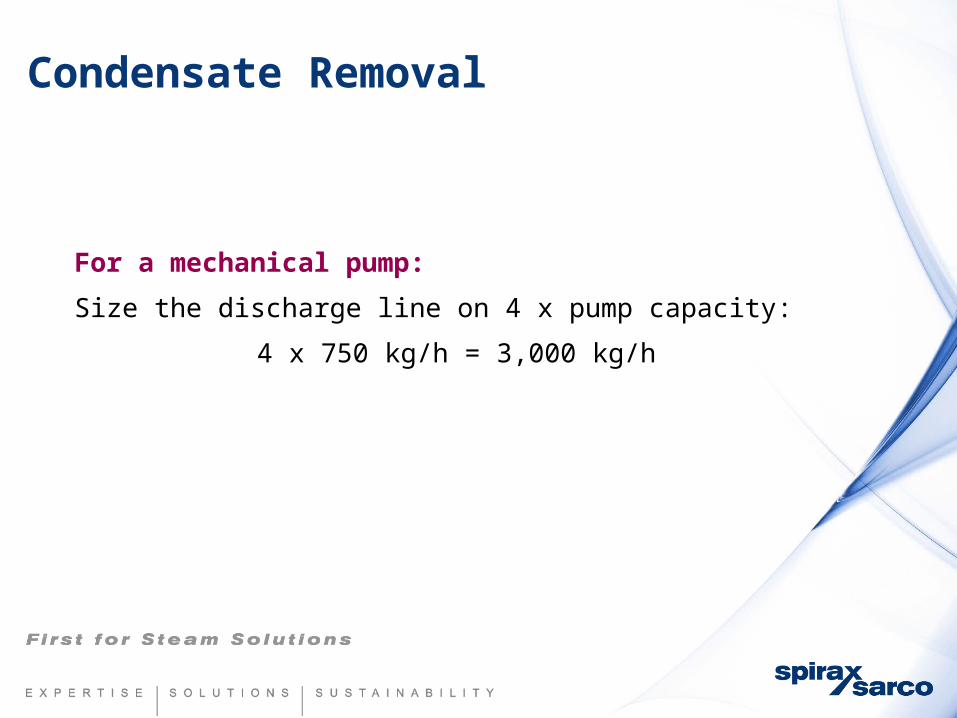
For a mechanical pump:
Size the discharge line on 4 x pump capacity:
4 x 750 kg/h = 3,000 kg/h
Condensate Removal
Using the condensate pipe sizing chart . . .
Sizing the pump discharge pipe
Size on 3,000 kg/h
Condensate Removal
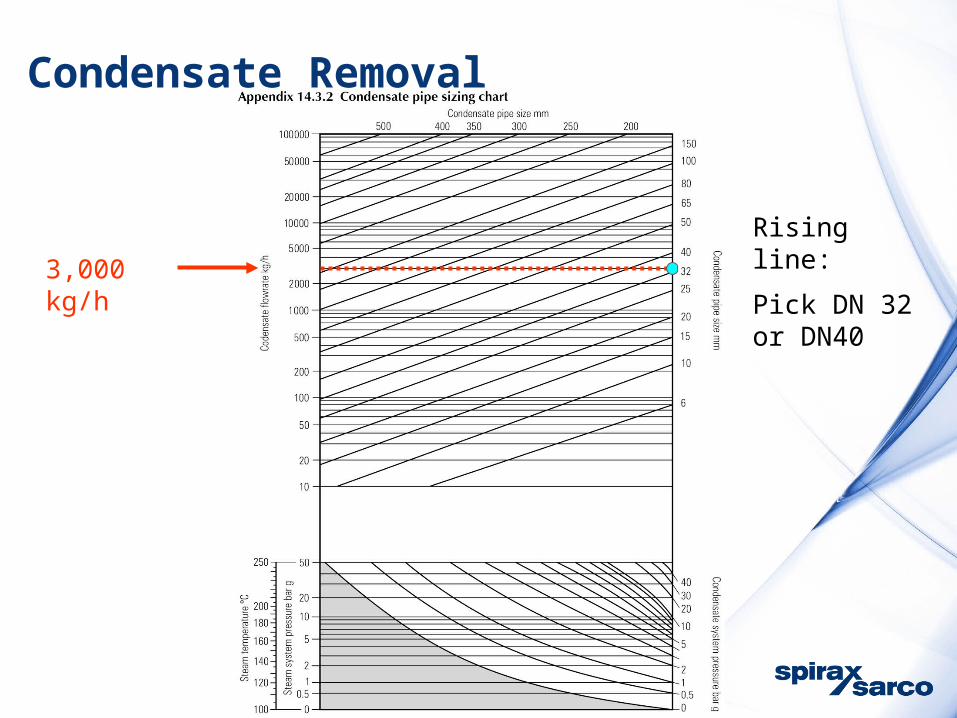
3,000 kg/h
Rising line:
Pick DN 32 or DN40
Condensate Removal
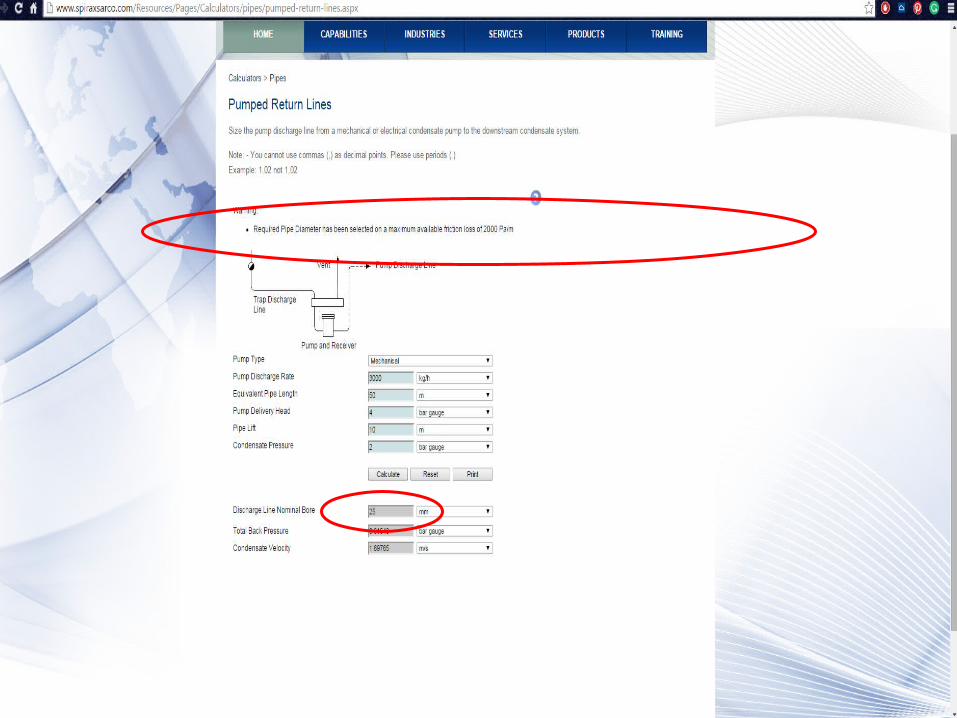
Using the Engineering Support Centre . . .
Sizing the pump discharge pipe
Size on 3,000kg/h
And a pump delivery head of 4.0 bar g
Condensate Removal
103
Checking the friction loss and velocity
Condensate Removal
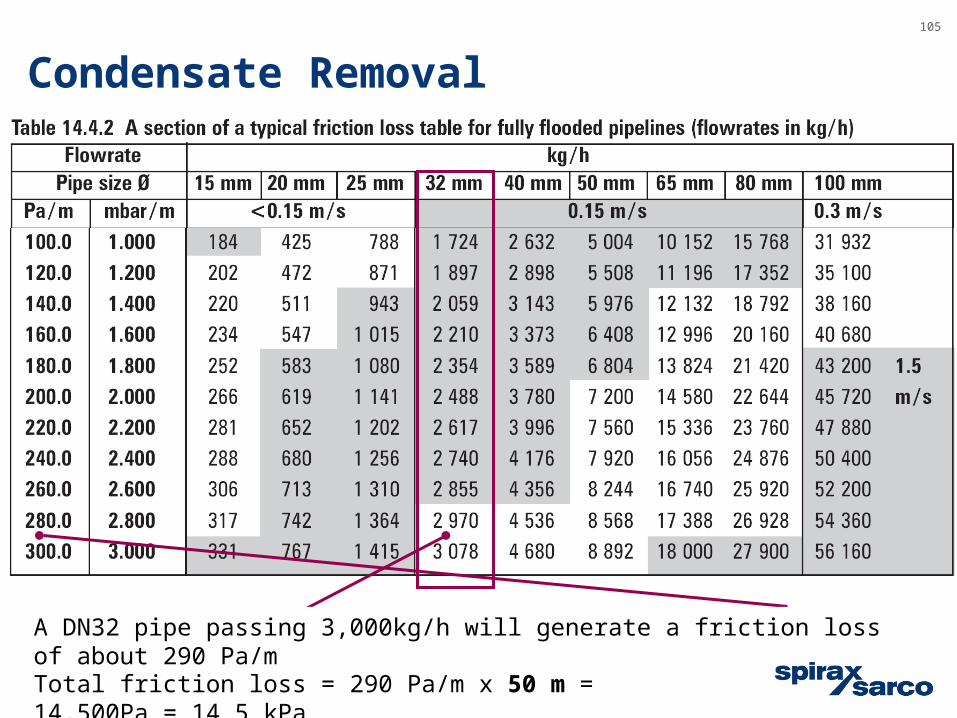
105
A DN32 pipe passing 3,000kg/hA DN32 pipe passing 3,000kg/h will generate a friction loss of about 290 Pa/m
Total friction loss = 290 Pa/m x 50 m = 14,500Pa = 14.5 kPa
Condensate Removal
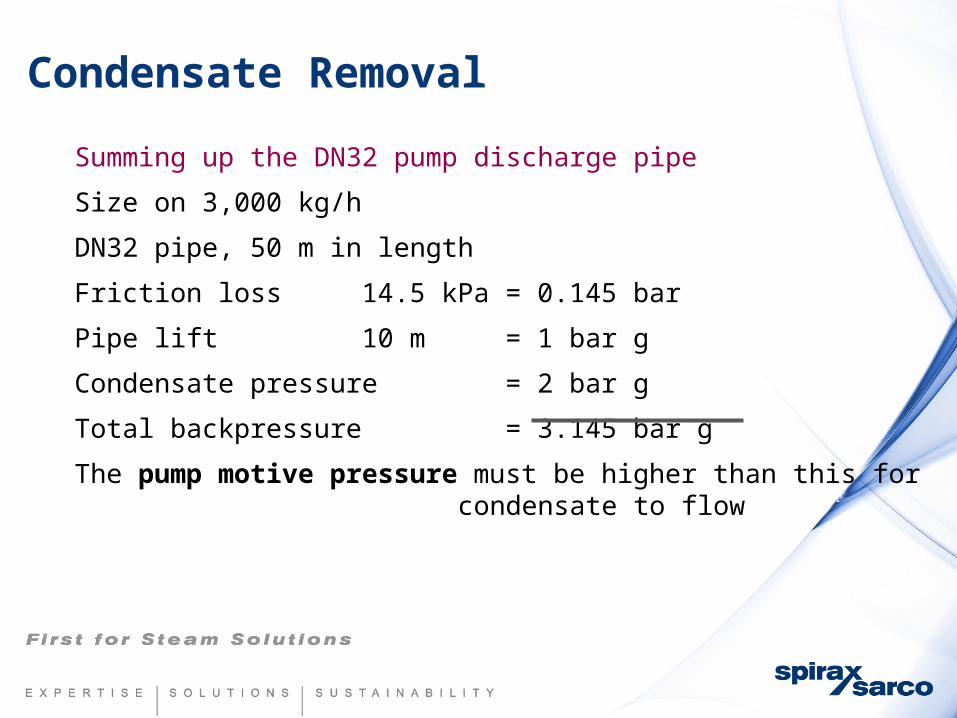
Summing up the DN32 pump discharge pipe
Size on 3,000 kg/h
DN32 pipe, 50 m in length
Friction loss 14.5 kPa = 0.145 bar
Pipe lift 10 m = 1 bar g
Condensate pressure = 2 bar g
Total backpressure = 3.145 bar g
The pump motive pressure must be higher than this for condensate to flow
Condensate Removal
Common condensate lines
Condensate Removal
108
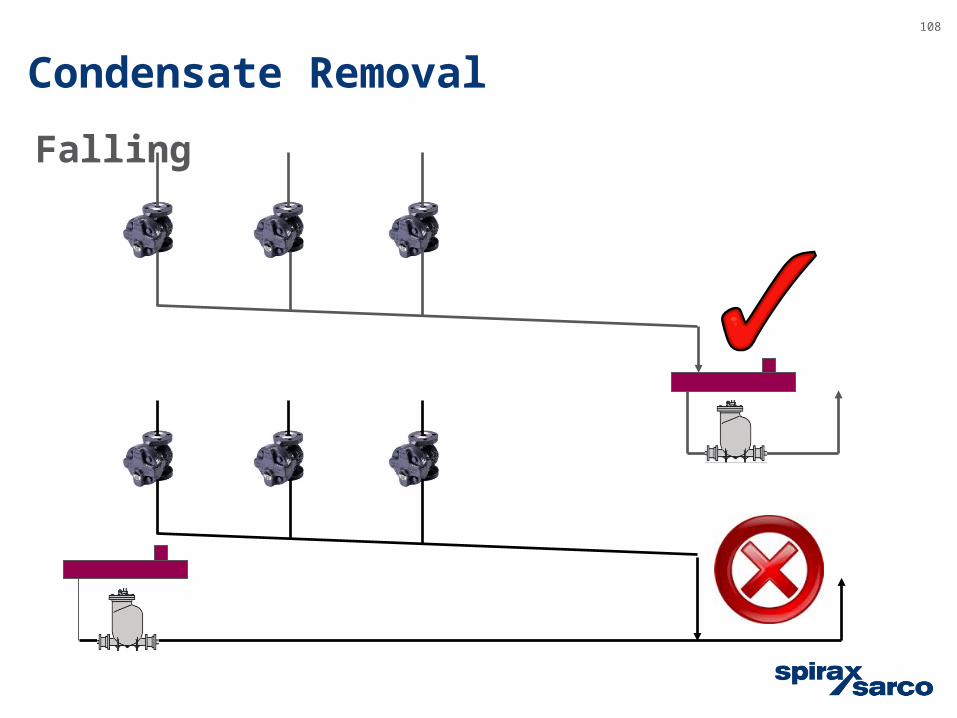
Falling
Condensate Removal
As long as each of the trap discharge lines has been sized using the condensate chart, the common line can be easily sized.
Falling
Condensate Removal
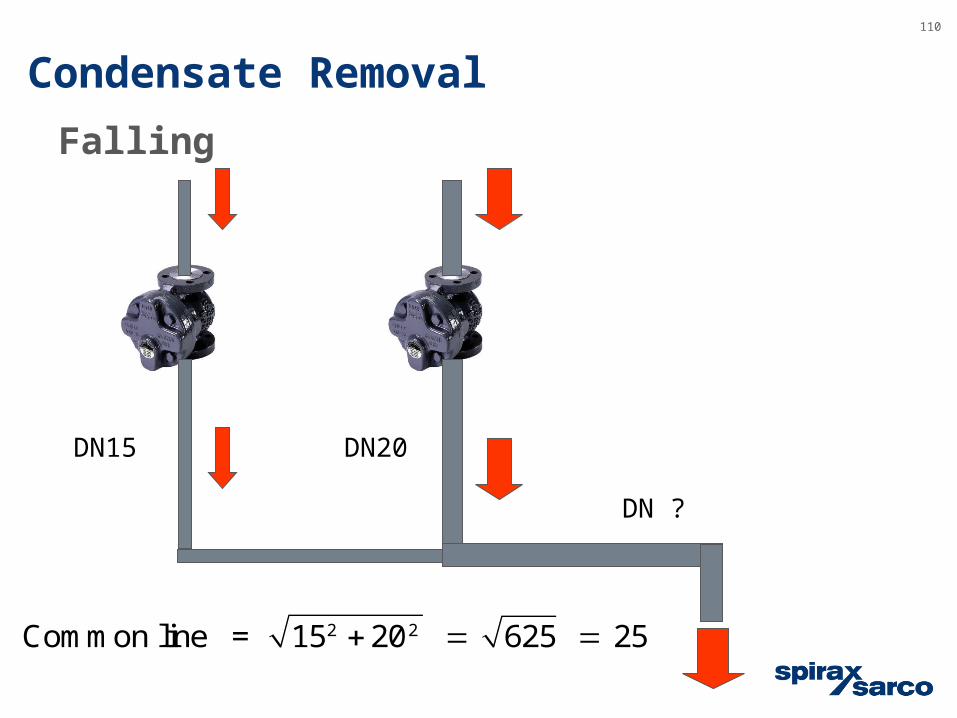
110
DN15 DN20
DN ?
Falling
2 2Common line = 15 20 625 25
Condensate Removal
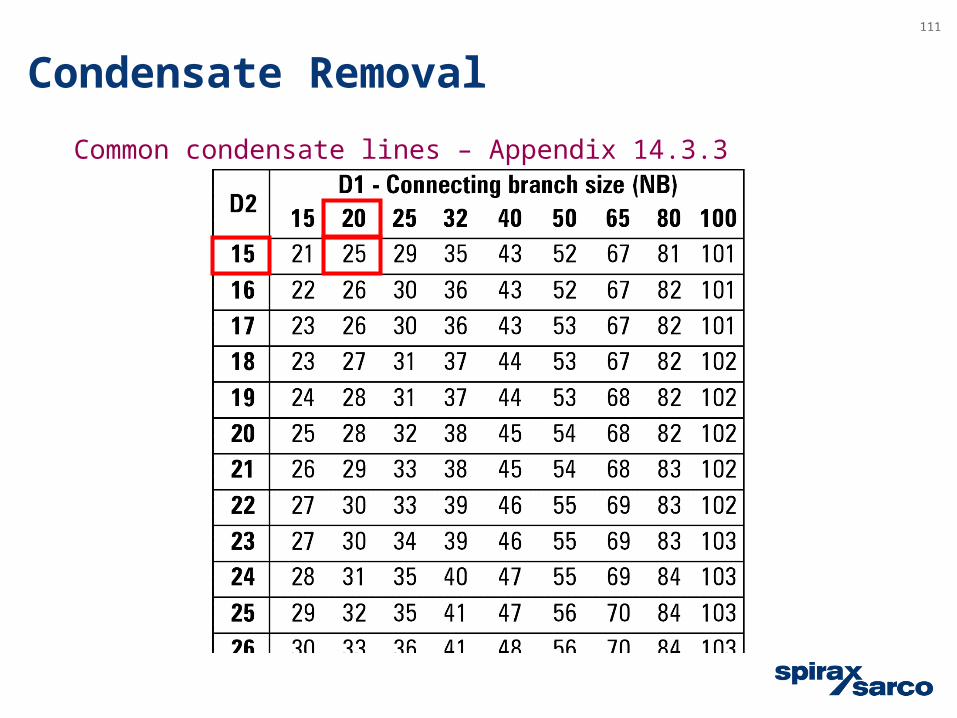
111
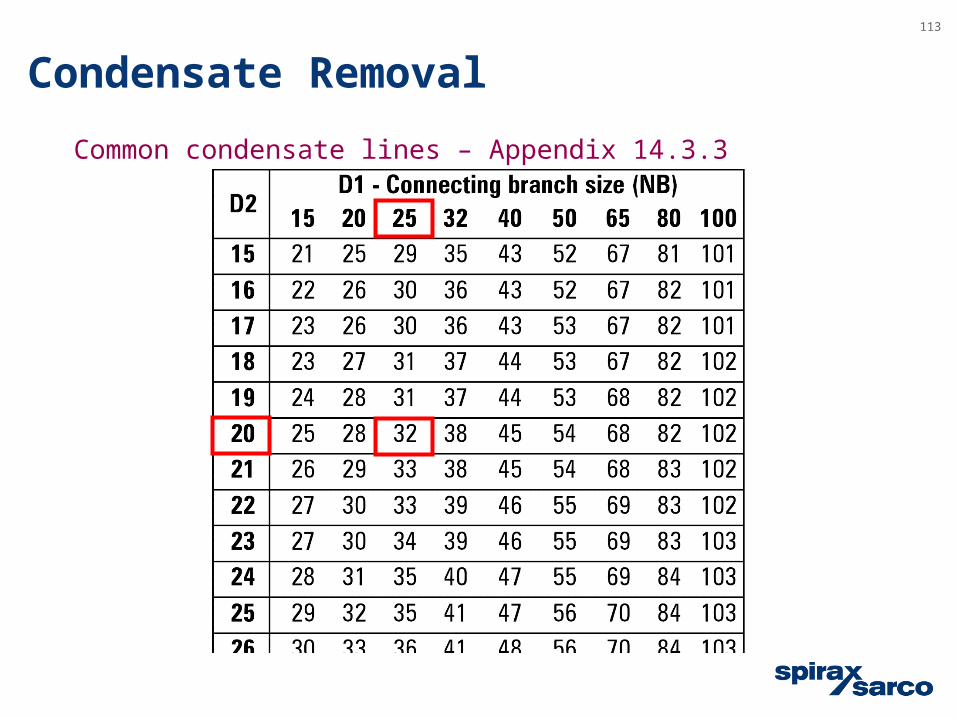
Common condensate lines – Appendix 14.3.3
Condensate Removal
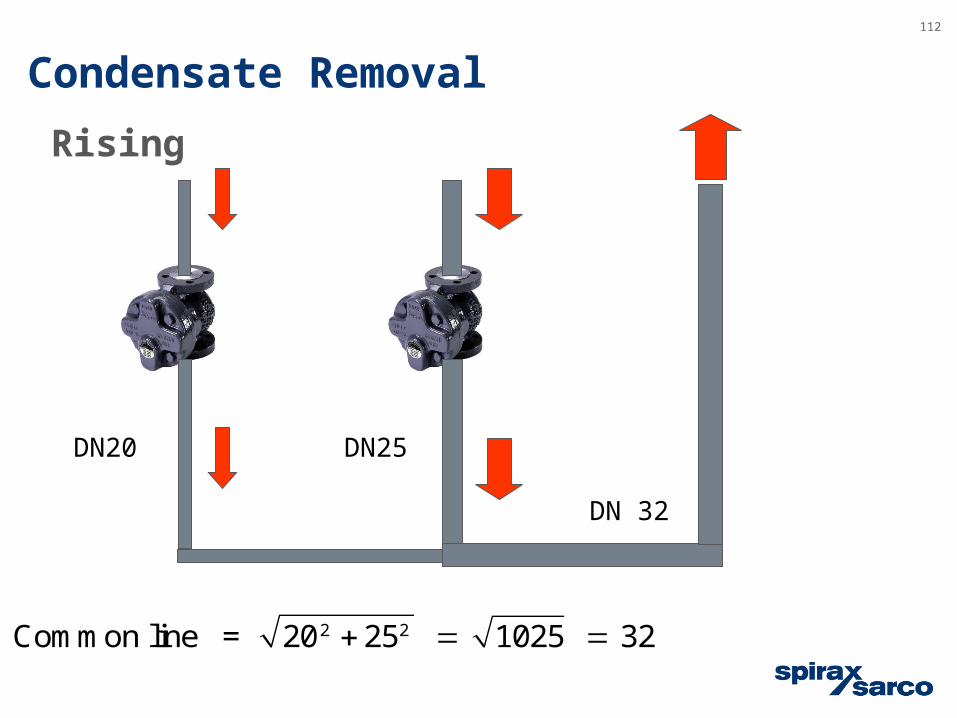
112
2 2Common line = 20 25 1025 32
DN20 DN25
DN 32
Rising
Condensate Removal
113
Common condensate lines – Appendix 14.3.3
Condensate Removal
114
Condensate Return
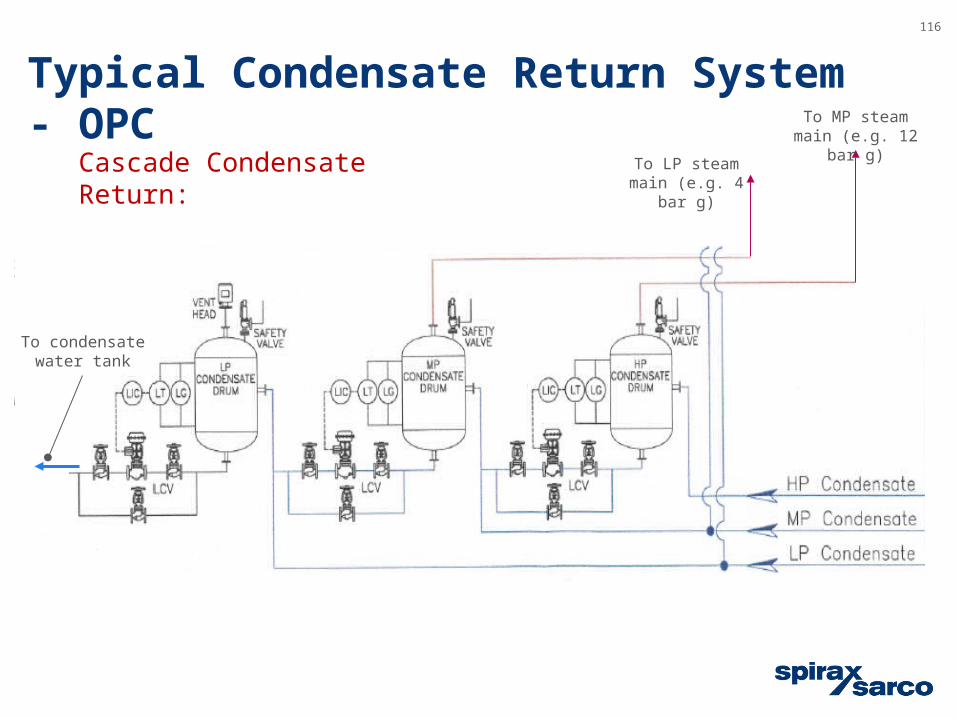
Typical Condensate Return System - OPC
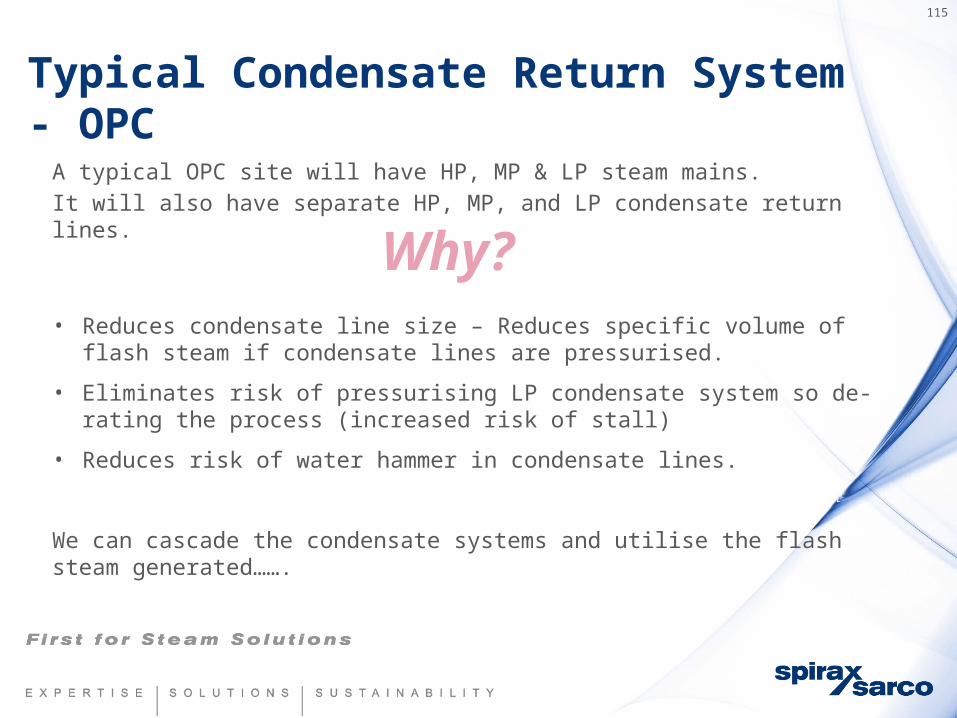
A typical OPC site will have HP, MP & LP steam mains.
It will also have separate HP, MP, and LP condensate return lines.
• Reduces condensate line size – Reduces specific volume of flash steam if condensate lines are pressurised.
• Eliminates risk of pressurising LP condensate system so de-rating the process (increased risk of stall)
• Reduces risk of water hammer in condensate lines.
We can cascade the condensate systems and utilise the flash steam generated…….
115
Why?
116
Typical Condensate Return System - OPC
To LP steam main (e.g. 4 bar g)
To MP steam main (e.g. 12 bar g)
Cascade Condensate Return:
To condensate water tank
117
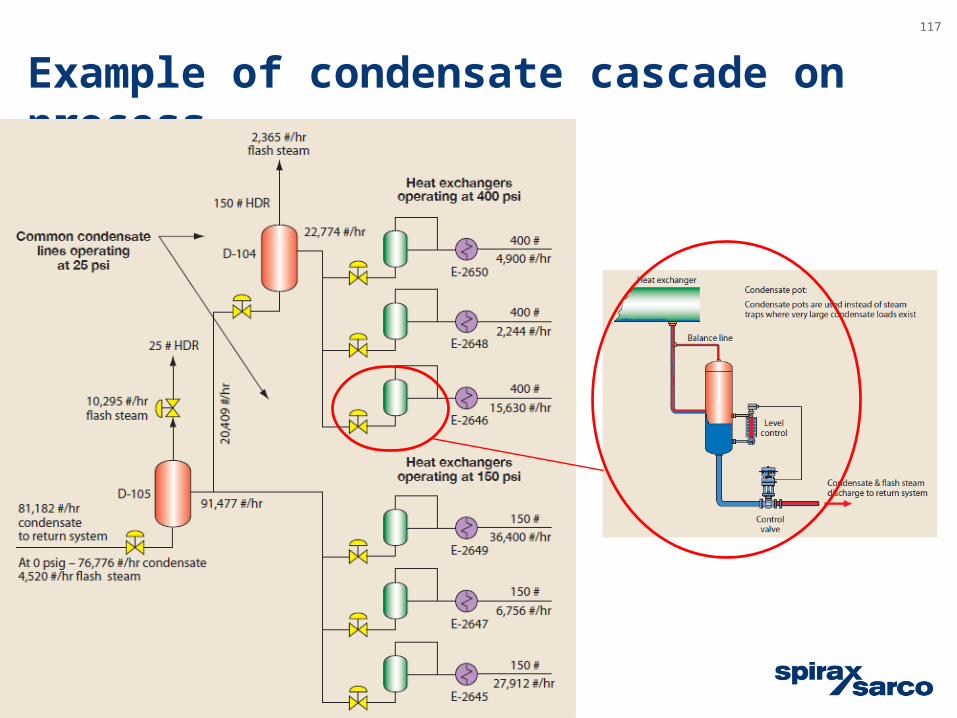
Example of condensate cascade on process
118
Typical issues on condensate return:
• Under sized condensate lines – no allowance for flash steam
• Thermal shock – mixing sub-cooled condensate with 2-phase condensate
• Water hammer – resulting from above two points
• Directly mixing condensate from HP steam line in to a L.P. condensate line.
• Using a lower pressure steam main as the condensate return from a HP steam line.
119
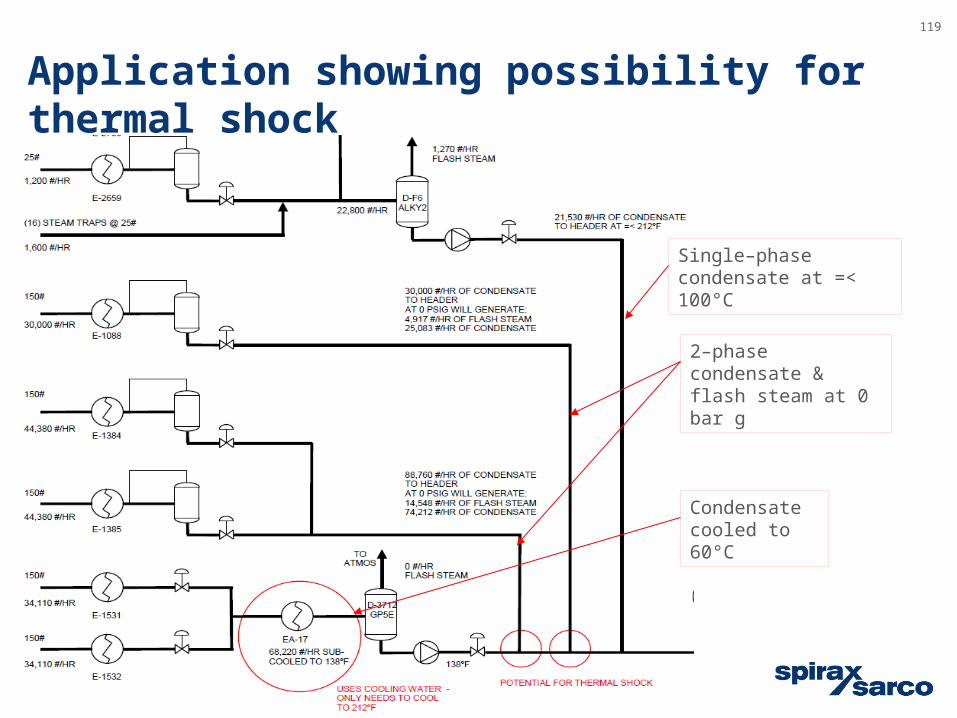
Application showing possibility for thermal shock
2–phase condensate & flash steam at 0 bar g
Condensate cooled to 60°C
Single–phase condensate at =< 100°C

Next…..
Flash steam recovery