
Concrete, practical solutions for large-scale EV deployment
47
3 rd E-MOBILITY STAKEHOLDER FORUM Concrete, practical solutions for large-scale EV deployment Green eMotion D9.7 Omar Usmani, ECN
Transcript of Concrete, practical solutions for large-scale EV deployment

3rd E-MOBILITY STAKEHOLDER FORUM
Concrete, practical solutions for large-scale EV deployment
Green eMotion D9.7
Omar Usmani, ECN
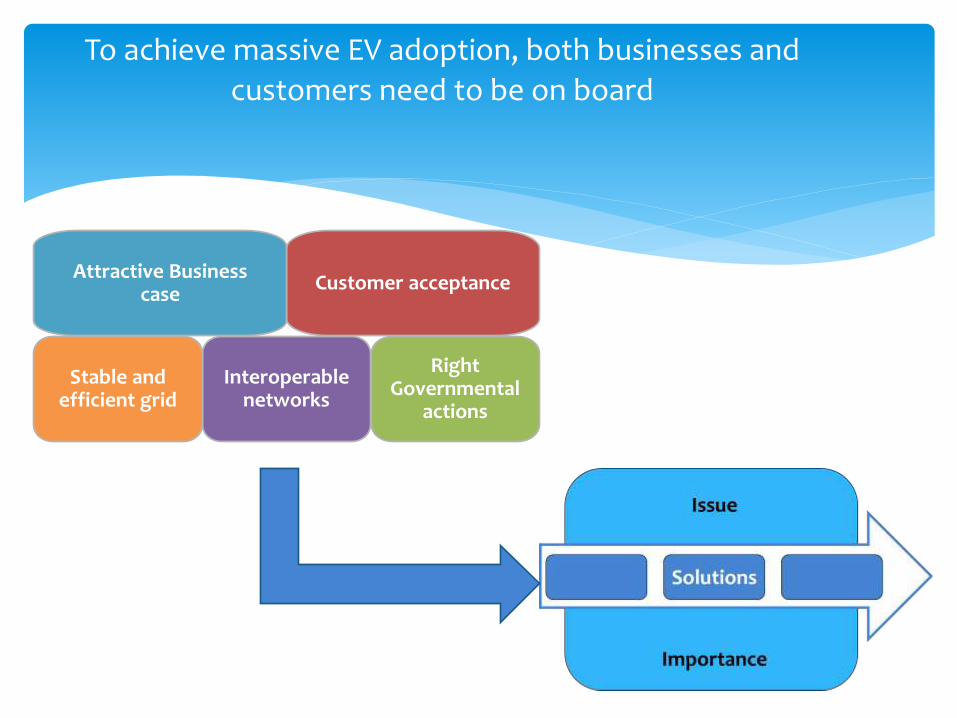
To achieve massive EV adoption, both businesses and
customers need to be on board
Right Governmental
actions
Interoperable networks
Stable and efficient grid
Customer acceptance Attractive Business
case

Subsidies, crowdfunding, time tariffs improve the
business of charging infrastructure
Acceptable price to drivers
Early stages Optimal situation
Utilisation
Profitability price
Utilisation
Subsidies •Consistent •Well-timed •Focused
Crowdfunding •Advanced cash flow •Customer lock-in •Higher awareness
Time tariffs •Force customer rotation •Only for daytime
Profitability price
Low Use
Low Margin High price

Subsidies, new ownership models and TCO information
bring EV purchase price down
Early stages Long term
ICE TCO EV TCO
Subsidies •Very effective •Costly •Need to justify
Ownership models •Overcome sticker shock •Battery lease
Information •TCO focus helps EV •Apps, dealership info rules
ICE TCO EV TCO
Importance to customers
ICE TCO EV TCO ICE
purchase EV
purchase

Smart charging spreads EV charging demand, avoids
excessive or inefficient electricity prices
Smart charging Today
•Simple tariffs, energy management
Short term •Advanced tariffs, energy management •Connect to grid
Long term •Local grid connection •V2G
EV charging demand
General electricity demand
People get home from work
Peak tariff TCO not competitive with ICE
Fixed tariff Inefficient pricing,
socialised among all users
Tariffs for EV users

Thank you

How to reach the goal
3rd E-MOBILITY STAKEHOLDER FORUM
Jonas Ericson, Stockholm Public Transport
2
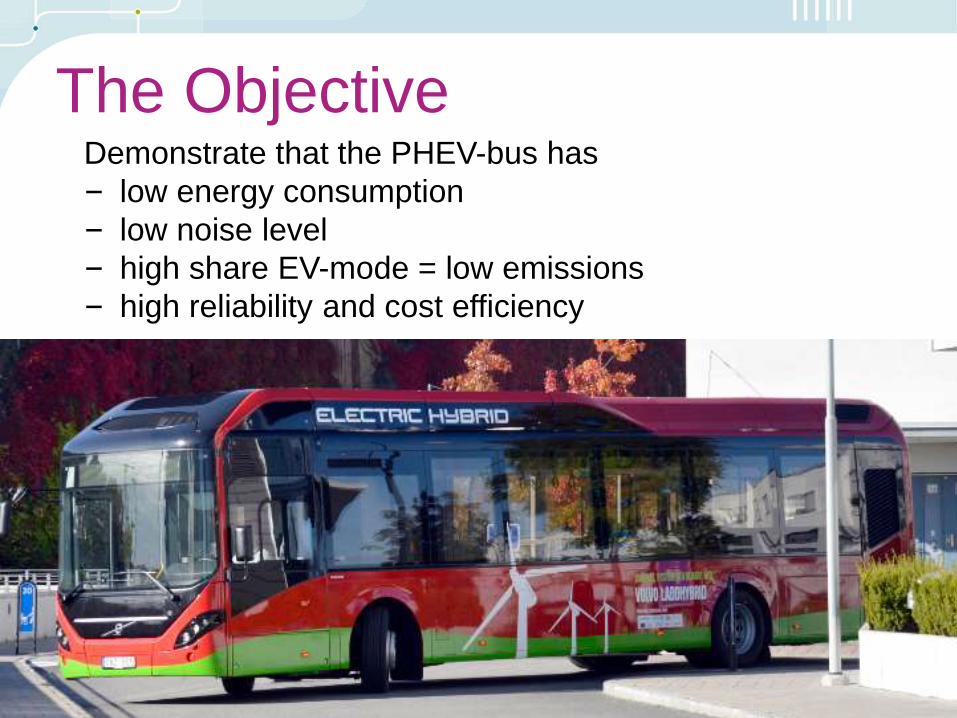
Demonstrate that the PHEV-bus has
– low energy consumption
– low noise level
– high share EV-mode = low emissions
– high reliability and cost efficiency
The Objective

4
The Bus Volvo 7900 12m Plugin Hybrid bus
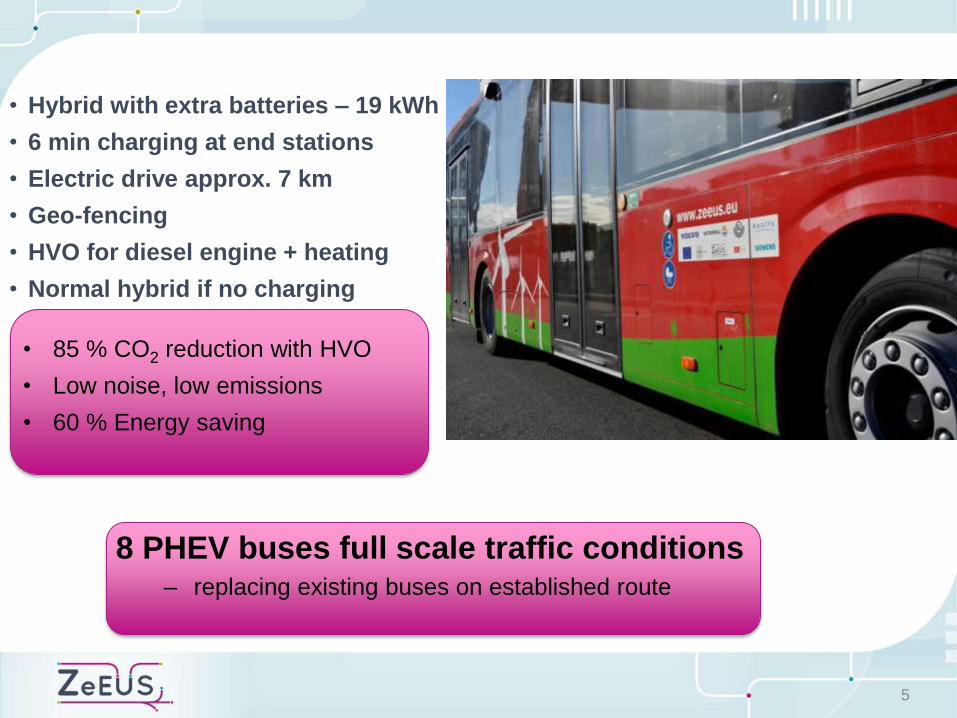
8 PHEV buses full scale traffic conditions – replacing existing buses on established route
5
• Hybrid with extra batteries – 19 kWh
• 6 min charging at end stations
• Electric drive approx. 7 km
• Geo-fencing
• HVO for diesel engine + heating
• Normal hybrid if no charging
• 85 % CO2 reduction with HVO
• Low noise, low emissions
• 60 % Energy saving

• Two charging stations, end of the route
• 150 kW, 400 V
• 6 min charging
7 km electric drive
• Slow charging
during night at depot
The Charging

Buses by Volvo
Charging system by Vattenfall
Technology Siemens
Operation by Stockholm Transport
through Keolis
Evaluation by Viktoria Institute
Who’s involved?

Surprises


14

15

16


Is this enough?
THE CITY OF STOCKHOLM
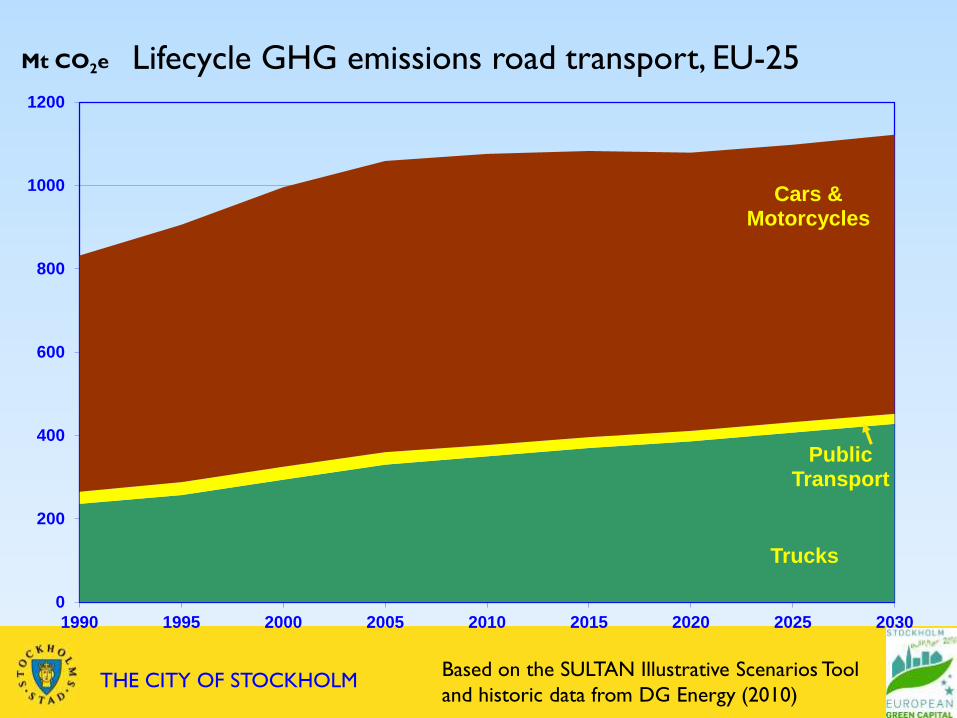
Trucks
Public Transport
Cars & Motorcycles
0
200
400
600
800
1000
1200
1990 1995 2000 2005 2010 2015 2020 2025 2030
Mt CO2e Lifecycle GHG emissions road transport, EU-25
Based on the SULTAN Illustrative Scenarios Tool
and historic data from DG Energy (2010)
THE CITY OF STOCKHOLM
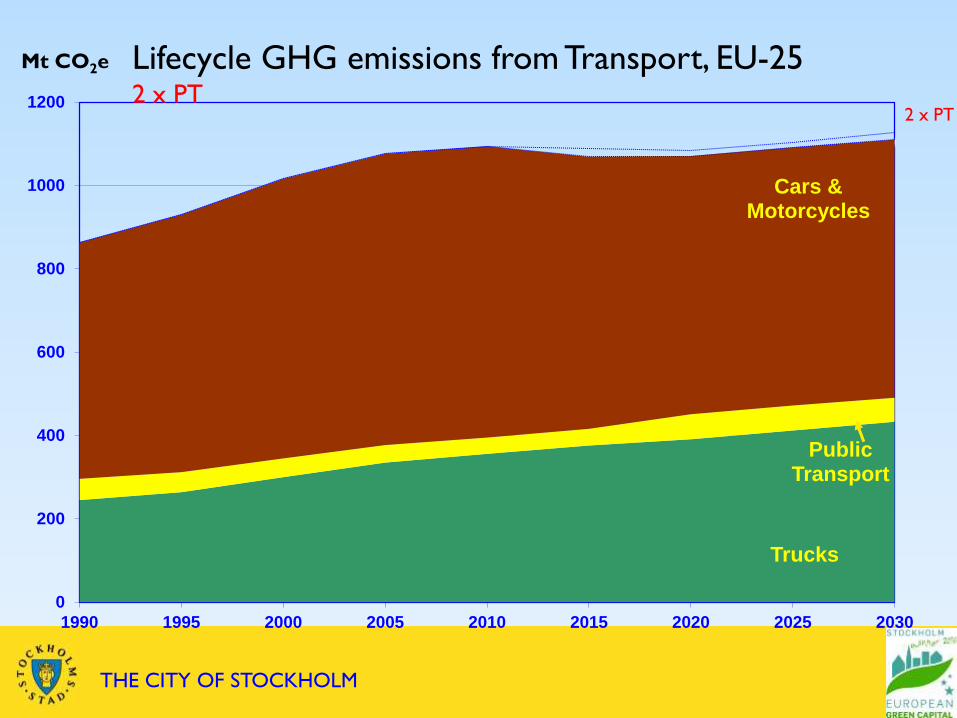
Trucks
Public Transport
Cars & Motorcycles
0
200
400
600
800
1000
1200
1990 1995 2000 2005 2010 2015 2020 2025 2030
Mt CO2e Lifecycle GHG emissions from Transport, EU-25 2 x PT
2 x PT
THE CITY OF STOCKHOLM
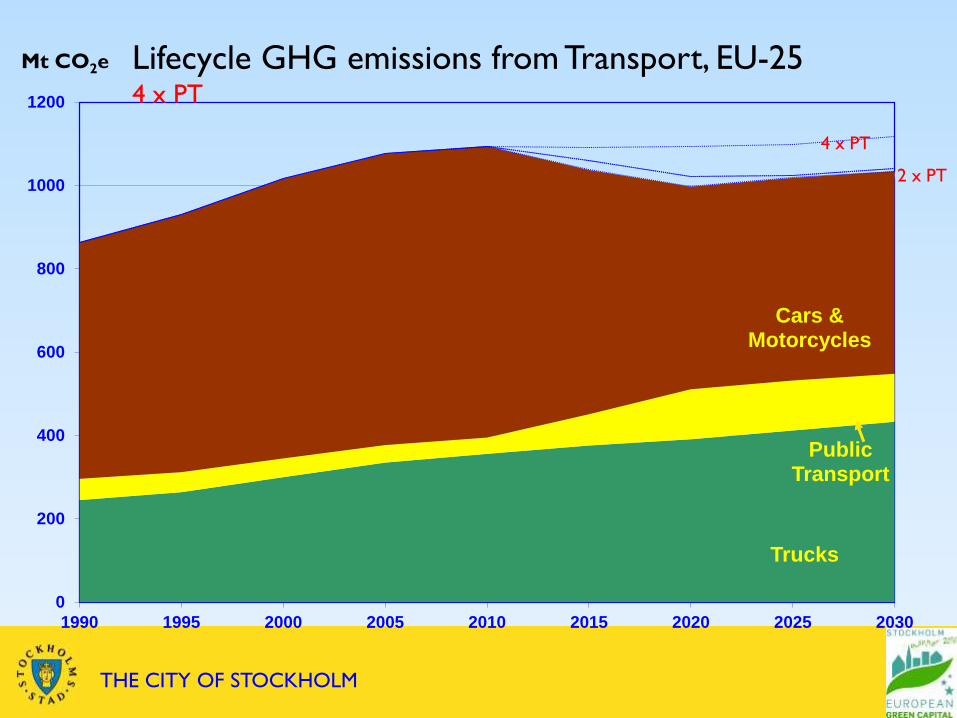
Trucks
Public Transport
Cars & Motorcycles
0
200
400
600
800
1000
1200
1990 1995 2000 2005 2010 2015 2020 2025 2030
Mt CO2e Lifecycle GHG emissions from Transport, EU-25 4 x PT
4 x PT
2 x PT

THE CITY OF STOCKHOLM
Trucks
Public Transport
Cars & Motorcycles
0
200
400
600
800
1000
1200
1990 1995 2000 2005 2010 2015 2020 2025 2030
Mt CO2e Lifecycle GHG emissions from Transport, EU-25 4 x PT, 130/95g regulation
4 x PT
130/95
2 x PT

THE CITY OF STOCKHOLM
Trucks
Public Transport
Cars & Motorcycles
0
200
400
600
800
1000
1200
1990 1995 2000 2005 2010 2015 2020 2025 2030
Mt CO2e Lifecycle GHG emissions from Transport, EU-25 4 x PT, 130/95g regulation, 10% renewables
4 x PT
lowblend
130/95
2 x PT

THE CITY OF STOCKHOLM
Trucks
Public Transport
Cars & Motorcycles
0
200
400
600
800
1000
1200
1990 1995 2000 2005 2010 2015 2020 2025 2030
renew PT
Mt CO2e Lifecycle GHG emissions from Transport, EU-25 4 x PT, 130/95g regulation, 10% renewables + renewable PT
4 x PT
lowblend
130/95
2 x PT

Moving people
THE CITY OF STOCKHOLM
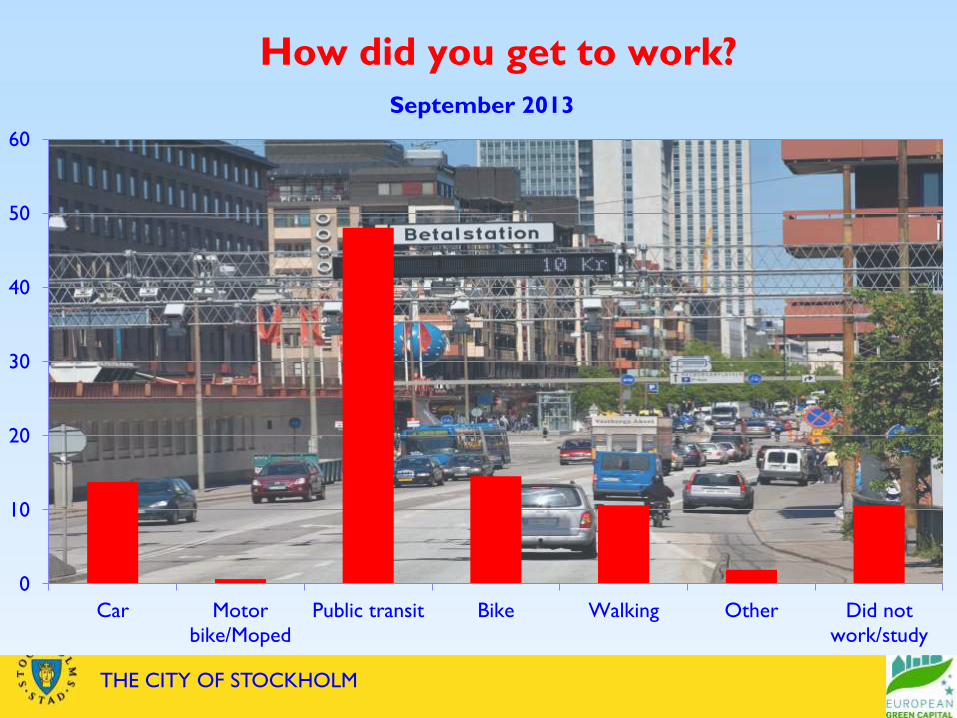
How did you get to work?
0
10
20
30
40
50
60
Car Motor
bike/Moped
Public transit Bike Walking Other Did not
work/study
September 2013

In work,
11%
To work,
21%
Food, 3%
Shopping,
6%
Leisure,
41%
Other, 18%
Car trips in Stockholm (pkm)
THE CITY OF STOCKHOLM

Moving stuff

CLEAN VEHICLES IN STOCKHOLM ENVIRONMENT & HEALTH ADM www.miljobilar.stockholm.se
Clean Vehicles in Stockholm
What goods is transported? (tonnes)
Earth, stone, gravel, sand
Snow
Empty containers and pallets
Cement, concrete, construction mtrl
Mixed cargoes
Recycling, scrap, debris
Food and feed
Petroleum
Household waste
95 %


Moving minds

985
kton
CO2e
1380
kton
CO2e
Efficient logistics
Transfer from
Car to PT
Reduced travelling
Transfer to bike/walk
Energy efficient vehicles
Electric & biofuels
”LCA-rest”
to compensate
BAU
2050
Today
Fossilfree transport 2050

3rd E-MOBILITY STAKEHOLDER FORUM
London’s Clean Transport Vision
Julia Poliscanova Senior EU Policy Officer
Greater London Authority
26 February 2015

Outline
o Action already taken
o Ultra Low Emission Zone (ULEZ)
o Transport Emissions Roadmap (TERM)

Measures implemented
Congestion charge Low Emission Zone Buses
Taxis Cycling and Walking Electric cars

Measures implemented
Air Quality Neutral Retrofit programmes Construction
Local measures Mayor’s Air Quality Fund Health and comms

Huge progress by 2020 but still won’t meet EU legal limits
NO2 2020 Annual Mean

Future measures
• Mayor has already put in place an ambitious package of measures –
but recognition more needs to be done
• Last summer Mayor set out a roadmap to compliance by 2020 in his
Air Quality Manifesto
• Centrepiece of this is ULEZ
• ULEZ delivers 2/3 of the emission reductions needed but further
action required at EU & national level if we’re to give Londoners the
air they deserve
• Transport for London have prepared TERM, setting their long-term
vision for zero emission mobility in London

Why an Ultra Low Emission Zone?
• Central London predicted to remain an
air quality focus area beyond 2020
• Greatest amount of public exposure and
highest emissions occurs in Central
London
• Building on Congestion Zone with
already established travel behaviour and
enforcement
• An opportunity to promote and
encourage use of ultra low emission
vehicles by building on existing Ultra
Low Emission Discount

ULEZ standards

TERM
Published in September 2014
Aims to engage stakeholders and drive action
Road & rail transport
CO2 and air pollution
54% reduction in NOx by 2020 (and a further 51% by 2025)

TERM
Tightening LEZ
Smarter traffic management
Driving uptake of LEVs
Transforming London’s bus fleet
Delivering zero emission taxis
and PHVs
Developing Low Emission
Neighbourhoods
Conclusion
• Mayor has put in place an ambitious package of measures
to drive clean mobility – but recognition more needs to be
done
• ULEZ is a key measure to improve air quality post-2020
• TERM offers a good platform to drive action on zero
emission mobility long-term
• Local level is not enough – significant policy and financial
support is required from both EU and national levels

Thank you