Concepts Managerial Accounting and Cost - MGMT … Accounting and Cost Concepts Chapter 2 Learning...
72
PowerPoint Authors: Susan Coomer Galbreath, Ph.D., CPA Charles W. Caldwell, D.B.A., CMA Jon A. Booker, Ph.D., CPA, CIA Cynthia J. Rooney, Ph.D., CPA Copyright © 2012 by The McGraw-Hill Companies, Inc. All rights reserved. Managerial Accounting and Cost Concepts Chapter 2
Transcript of Concepts Managerial Accounting and Cost - MGMT … Accounting and Cost Concepts Chapter 2 Learning...

PowerPoint Authors:Susan Coomer Galbreath, Ph.D., CPACharles W. Caldwell, D.B.A., CMAJon A. Booker, Ph.D., CPA, CIACynthia J. Rooney, Ph.D., CPA
Copyright © 2012 by The McGraw-Hill Companies, Inc. All rights reserved.
Managerial Accounting and Cost ConceptsChapter 2

2-2
Learning Objective 1
Identify and give examples of each of the
three basic manufacturing cost
categories.

2-3
The Product
DirectMaterials
DirectLabor
Manufacturing
Overhead
Classifications of Manufacturing Costs

2-4
Direct Materials
Raw materials that become an integral part of the product and that can be conveniently traced directly to it.
Example: A radio installed in an automobile

2-5
Direct Labor
Those labor costs that can be easily traced to individual units of product.
Example: Wages paid to automobile assembly workers

2-6
Manufacturing OverheadManufacturing costs that cannot be easily traced directly to specific units produced.
Examples: Indirect materials and indirect labor

2-7
Nonmanufacturing Costs
Administrative Costs
All executive, organizational, and
clerical costs.

2-8
Learning Objective 2
Distinguish between product costs and period costs and give examples
of each.

2-9
Product Costs Versus Period Costs
Product costs include direct materials, direct
labor, and manufacturing
overhead.
Period costs include all selling costs and
administrative costs.
Inventory Cost of Good Sold
BalanceSheet
IncomeStatement
Sale
Expense
IncomeStatement

2-10
Quick Check ✓
Which of the following costs would be considered a period rather than a product cost in a manufacturing company?A. Manufacturing equipment depreciation.B. Property taxes on corporate headquarters.C. Direct materials costs.D. Electrical costs to light the production facility.E. Sales commissions.

2-11
Quick Check ✓
Which of the following costs would be considered a period rather than a product cost in a manufacturing company?A. Manufacturing equipment depreciation.B. Property taxes on corporate headquarters.C. Direct materials costs.D. Electrical costs to light the production facility.E. Sales commissions.

2-12
Classifications of Costs
Manufacturing costs are oftenclassified as follows:
DirectMaterial
DirectLabor
ManufacturingOverhead
PrimeCost
ConversionCost

2-13
Learning Objective 3
Understand cost behavior patterns
including variable costs, fixed costs, and mixed
costs.

2-14
Cost Classifications for Predicting Cost Behavior
Cost behavior refers to how a cost will react to changes in the level of
activity. The most common
classifications are:▫ Variable costs.
▫ Fixed costs▫ Mixed costs.

2-15
Variable Cost
Your total texting bill is based on how many texts you send.
Number of Texts Sent
Tota
l Tex
ting
Bill

2-16
Variable Cost Per Unit
The cost per text sent is constant at 5 cents per text message.
Number of Texts Sent
Cos
t Per
Tex
t Sen
t

2-17
The Activity Base (Cost Driver)
A measure of what causes the
incurrence of a variable cost
Unitsproduced
Miles driven
Machine hours
Labor hours

2-18
Fixed Cost Your monthly contract fee for your cell phone is
fixed for the number of monthly minutes in your contract. The monthly contract fee does not change based on the number of calls you make.
Number of Minutes UsedWithin Monthly Plan
Mon
thly
Cel
l Pho
ne
Con
trac
t Fee

2-19
Fixed Cost Per Unit
Within the monthly contract allotment, the average fixed cost per cell phone call made decreases as
more calls are made.
Number of Minutes UsedWithin Monthly Plan
Mon
thly
Cel
l Pho
ne
Con
trac
t Fee

2-20
ExamplesAdvertising and Research and Development
ExamplesDepreciation on Buildings and Equipment and Real
Estate Taxes
Types of Fixed Costs
DiscretionaryMay be altered in the short-term by current managerial decisions
CommittedLong-term, cannot be
significantly reduced in the short term.

2-21
RelevantRange
A straight line closely
approximates a curvilinear
variable cost line within the
relevant range.
Activity
Tota
l Cos
t
Economist’sCurvilinear Cost
Function
The Linearity Assumption and the Relevant Range
Accountant’s Straight-Line Approximation (constant
unit variable cost)

2-22
Fixed Costs and the Relevant Range
Fixed costs would increase in a step fashion at a rate of $30,000 for each additional
1,000 square feet.
For example, assume office space is available at a rental rate of $30,000 per year in increments of
1,000 square feet.

2-23
Ren
t Cos
t in
Thou
sand
s of
Dol
lars
0 1,000 2,000 3,000 Rented Area (Square Feet)
0
30
60
Fixed Costs and the Relevant Range
90
Relevant Range
The relevant range of activity for a fixed cost is the range of activity over which the graph of the
cost is flat.

2-24
Cost Classifications for Predicting Cost Behavior

2-25
Quick Check ✓
Which of the following costs would be variable with respect to the number of cones sold at a Baskins & Robbins shop? (There may be more than one correct answer.)A. The cost of lighting the store.B. The wages of the store manager.C. The cost of ice cream.D. The cost of napkins for customers.

2-26
Quick Check ✓
Which of the following costs would be variable with respect to the number of cones sold at a Baskins & Robbins shop? (There may be more than one correct answer.)A. The cost of lighting the store.B. The wages of the store manager.C. The cost of ice cream.D. The cost of napkins for customers.

2-27
Fixed MonthlyUtility Charge
Variable Cost per KW
Activity (Kilowatt Hours)
Tota
l Util
ity C
ost
X
Y
A mixed cost contains both variable and fixed elements. Consider the example of utility cost.
Mixed Costs(also called semivariable costs)
Total mixed cost

2-28
Mixed Costs
Fixed MonthlyUtility Charge
Variable Cost per KW
Activity (Kilowatt Hours)
Tota
l Util
ity C
ost
X
Y
Total mixed cost

2-29
Mixed Costs – An ExampleIf your fixed monthly utility charge is $40, your
variable cost is $0.03 per kilowatt hour, and your monthly activity level is 2,000 kilowatt hours, what is
the amount of your utility bill?

2-30
Analysis of Mixed Costs
In account analysis, each account is classified as either variable or fixed based
on the analyst’s knowledge of how the account behaves.
The engineering approach classifies costs based upon an industrial engineer’s
evaluation of production methods, and material, labor, and overhead
requirements.
Account Analysis and the Engineering Approach

2-31
Learning Objective 4
Analyze a mixed cost using a scattergraph plot
and the high-low method.

2-32
Scattergraph Plots – An ExampleAssume the following hours of maintenance work
and the total maintenance costs for six months.

2-33
Plot the data points on a graph (Total Cost Y vs. Activity X).
The Scattergraph Method
X
Y
Hours of Maintenance
Tota
l Mai
nten
ance
Cos
t

2-34
The High-Low Method – An Example
The variable cost per hour of
maintenance is equal to the change
in cost divided by the change in hours.
= $6.00/hour$2,400 400
2-35
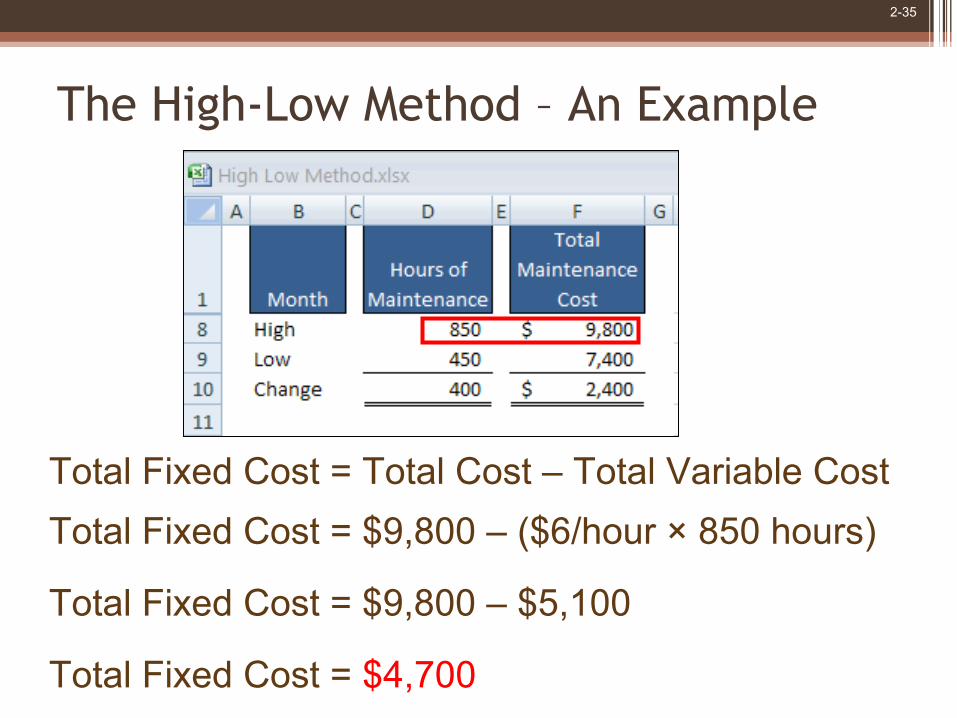
The High-Low Method – An Example
Total Fixed Cost = Total Cost – Total Variable CostTotal Fixed Cost = $9,800 – ($6/hour × 850 hours)
Total Fixed Cost = $9,800 – $5,100
Total Fixed Cost = $4,700

2-36
The High-Low Method – An Example
Y = $4,700 + $6.00XThe Cost Equation for Maintenance

2-37
Quick Check ✓ Sales salaries and commissions are $10,000
when 80,000 units are sold, and $14,000 when 120,000 units are sold. Using the high-low method, what is the variable portion of sales salaries and commission?a. $0.08 per unitb. $0.10 per unit c. $0.12 per unitd. $0.125 per unit

2-38
Sales salaries and commissions are $10,000 when 80,000 units are sold, and $14,000 when 120,000 units are sold. Using the high-low method, what is the variable portion of sales salaries and commission?a. $0.08 per unitb. $0.10 per unit c. $0.12 per unitd. $0.125 per unit
Quick Check ✓

2-39
Quick Check ✓ Sales salaries and commissions are $10,000
when 80,000 units are sold, and $14,000 when 120,000 units are sold. Using the high-low method, what is the fixed portion of sales salaries and commissions?a. $ 2,000b. $ 4,000 c. $10,000d. $12,000

2-40
Sales salaries and commissions are $10,000 when 80,000 units are sold, and $14,000 when 120,000 units are sold. Using the high-low method, what is the fixed portion of sales salaries and commissions?a. $ 2,000b. $ 4,000 c. $10,000d. $12,000
Quick Check ✓

2-41
Least-Squares Regression MethodA method used to analyze mixed costs if a
scattergraph plot reveals an approximately linear relationship between the X and Y variables.This method uses all of
thedata points to estimatethe fixed and variablecost components of a
mixed cost. The goal of this method isto fit a straight line to thedata that minimizes the
sum of the squared errors.

2-42
Least-Squares Regression Method
• Software can be used to fit a regression line through the data points.
• The cost analysis objective is the same: Y = a + bX
Least-squares regression also provides a statistic, called the R2, which is a measure of the goodness
of fit of the regression line to the data points.

2-43
Comparing Results Fromthe Two Methods
The two methods just discussed provide different estimates of the fixed and variable cost
components of a mixed cost.
This is to be expected because each method uses differing amounts of the data points to
provide estimates.
Least-squares regression provides the most accurate estimate because it uses all the data
points.

2-44
Learning Objective 5
Prepare income statements for a
merchandising company using the traditional and
contribution formats.

2-45
The Traditional and Contribution Formats
Used primarily forexternal reporting.

2-46
Uses of the Contribution Format
The contribution income statement format is used as an internal planning and decision-making tool.
We will use this approach for:
1.Cost-volume-profit analysis (Chapter 5).
2.Budgeting (Chapter 8).
3.Segmented reporting of profit data (Chapter 6).
4.Special decisions such as pricing and make-or-buy analysis (Chapter 12).

2-47
Learning Objective 6
Understand the differences between direct and indirect
costs.

2-48
Assigning Costs to Cost Objects
Direct costs• Costs that can be
easily and conveniently traced to a unit of product or other cost object.
• Examples: direct material and direct labor
Indirect costs• Costs that cannot
be easily and conveniently traced to a unit of product or other cost object.
• Example: manufacturing overhead

2-49
Learning Objective 7
Understand cost classifications used in
making decisions: differential costs,
opportunity costs, and sunk costs.

2-50
• Every decision involves a choice between at least two alternatives.
• Only those costs and benefits that differ between alternatives are relevant in a decision. All other costs and benefits can and should be ignored as irrelevant.
Cost Classifications for Decision Making

2-51
Differential Cost and Revenue
Costs and revenues that differ among alternatives.
Example: You have a job paying $1,500 per month in your hometown. You have a job offer in a neighboring city that pays $2,000 per month. The commuting cost to the city is $300 per month.
Differential revenue is: $2,000 – $1,500 = $500
Differential cost is: $300

2-52
Opportunity Cost
The potential benefit that is given up when one alternative
is selected over another.
Example: If you werenot attending college,you could be earning$15,000 per year. Your opportunity costof attending college for one year is $15,000.

2-53
Sunk Costs
Sunk costs have already been incurred and cannot be changed now or in the
future. These costs should be ignored when making decisions.
Example: Suppose you had purchased gold for
$400 an ounce, but now it is selling for $250 an ounce. Should you wait for the gold to reach $400 an ounce before selling it? You may say, “Yes” even though the $400 purchase is a sunk costs.

2-54
Quick Check ✓
Suppose you are trying to decide whether to drive or take the train to Portland to attend a concert. You have ample cash to do either, but you don’t want to waste money needlessly. Is the cost of the train ticket relevant in this decision? In other words, should the cost of the train ticket affect the decision of whether you drive or take the train to Portland?A. Yes, the cost of the train ticket is relevant.B. No, the cost of the train ticket is not relevant.

2-55
Quick Check ✓
Suppose you are trying to decide whether to drive or take the train to Portland to attend a concert. You have ample cash to do either, but you don’t want to waste money needlessly. Is the cost of the train ticket relevant in this decision? In other words, should the cost of the train ticket affect the decision of whether you drive or take the train to Portland?A. Yes, the cost of the train ticket is relevant.B. No, the cost of the train ticket is not relevant.

2-56
Quick Check ✓
Suppose you are trying to decide whether to drive or take the train to Portland to attend a concert. You have ample cash to do either, but you don’t want to waste money needlessly. Is the annual cost of licensing your car relevant in this decision?A. Yes, the licensing cost is relevant.B. No, the licensing cost is not relevant.

2-57
Quick Check ✓
Suppose you are trying to decide whether to drive or take the train to Portland to attend a concert. You have ample cash to do either, but you don’t want to waste money needlessly. Is the annual cost of licensing your car relevant in this decision?A. Yes, the licensing cost is relevant.B. No, the licensing cost is not relevant.

2-58
Quick Check ✓
Suppose that your car could be sold now for $5,000. Is this a sunk cost?A. Yes, it is a sunk cost.B. No, it is not a sunk cost.

2-59
Quick Check ✓
Suppose that your car could be sold now for $5,000. Is this a sunk cost?A. Yes, it is a sunk cost.B. No, it is not a sunk cost.

2-60
Summary of the Types of Cost Classifications
Financial Reporting
Predicting Cost Behavior
Assigning Costs to Cost Objects
Making Business Decisions

PowerPoint Authors:Susan Coomer Galbreath, Ph.D., CPACharles W. Caldwell, D.B.A., CMAJon A. Booker, Ph.D., CPA, CIACynthia J. Rooney, Ph.D., CPA
Copyright © 2012 by The McGraw-Hill Companies, Inc. All rights reserved.
Least-Squares Regression ComputationsAppendix 2A

2-62
Learning Objective 8
Analyze a mixed cost using a scattergraph plot
and the least-squares regression method.

2-63
Simple Regression Analysis
Matrix, Inc. wants to know its average
fixed cost and variable cost per
meals served.
Using the data to the right, let’s see how to do a regression using
Microsoft Excel.

2-64
Simple Regression Using Excel
You will need three pieces of information from your regression analysis:
1. Estimated Variable Cost Per Unit (line slope)
2. Estimated Fixed Costs (line intercept)
3. Goodness of fit, or R2
To get these three pieces information we will need to use three Excel functions.
SLOPE, INTERCEPT, and RSQ

2-65
Simple Regression Using Excel
Place your cursor in cell F4 and press the = key. Click on the
pull down menu and scroll down to “More
Functions . . .”

2-66
Scroll down to the “Statistical”
functions. Now scroll down the
statistical functions until you
highlight “SLOPE”
Simple Regression Using Excel

2-67
1. In the Known_y’s box, enter C4:C19 for the range.
2. In the Known_x’s box, enter D4:D19 for the range.
Simple Regression Using Excel

2-68
Here is the estimate of the
slope of the line.
1. In the Known_y’s box, enter C4:C19 for the range.
2. In the Known_x’s box, enter D4:D19 for the range.
Simple Regression Using Excel

2-69
With your cursor in cell F5, press the =
key and go to the pull down menu for
“Special Functions.” Select Statistical and
scroll down to highlight the
INTERCEPT function.
Simple Regression Using Excel

2-70
1. In the Known_y’s box, enter C4:C19 for the range.
2. In the Known_x’s box, enter D4:D19 for the range.
Here is the estimate of the
fixed costs.
Simple Regression Using Excel

2-71
Finally, we will determine the
“goodness of fit”, or R2, by using
the RSQ function.
Simple Regression Using Excel

2-72
1. In the Known_y’s box, enter C4:C19 for the range.
2. In the Known_x’s box, enter D4:D19 for the range.
Here is the estimate of R2.
Simple Regression Using Excel