Concepts and Measures: Empirical evidence on the i - CAMSIS
46
1 Paper presented to the RC28 Summer meeting, Montreal, 14-17 August 2007 “Concepts and Measures: Empirical evidence on the interpretation of ESeC and other occupation-based social classifications” 5 August 2007 [VERSION 1] Paul S. Lambert Stirling University, UK, [email protected] Erik Bihagen Stockholm University, Sweden, [email protected] Contact: Dr Paul S. Lambert Department of Applied Social Science Stirling University Stirling FK9 4LA United Kingdom Tel: +44 1786 467984 Fax: +44 1786 466299 Email: [email protected] Acknowledgements: Work on this project benefited from an ESRC Small Grant in E-Social Science (RES-149-25- 1015) and from the VR research grant ‘Occupation Information Depository’. Data used in this study was obtained from the UK Data Archive, University of Essex; and from the Swedish Level of Living Survey and through support from the Swedish Institute for Social Research. We thank Tomas Korpi for assistance with the data used, and Magnus Nermo, Ken Prandy and Vernon Gayle for comments on this work.
Transcript of Concepts and Measures: Empirical evidence on the i - CAMSIS

1
Paper presented to the RC28 Summer meeting, Montreal, 14-17 August 2007 “Concepts and Measures: Empirical evidence on the interpretation of ESeC and
other occupation-based social classifications”
5 August 2007 [VERSION 1]
Paul S. Lambert Stirling University, UK, [email protected] Erik Bihagen Stockholm University, Sweden, [email protected] Contact:
Dr Paul S. Lambert Department of Applied Social Science Stirling University Stirling FK9 4LA United Kingdom Tel: +44 1786 467984 Fax: +44 1786 466299 Email: [email protected]
Acknowledgements: Work on this project benefited from an ESRC Small Grant in E-Social Science (RES-149-25-1015) and from the VR research grant ‘Occupation Information Depository’. Data used in this study was obtained from the UK Data Archive, University of Essex; and from the Swedish Level of Living Survey and through support from the Swedish Institute for Social Research. We thank Tomas Korpi for assistance with the data used, and Magnus Nermo, Ken Prandy and Vernon Gayle for comments on this work.

2
Abstract: This paper discusses the linkage between ‘concepts’ and ‘measures’ across alternative occupation-based social classifications. We review empirical evidence from contemporary longitudinal survey data from the UK (British Household Panel Survey) and Sweden (Level of Living Survey), and discuss the properties of an array of alternative occupation-based social classifications. Our assertion is that social scientists frequently over-estimate the linkage between concepts and measures in occupation-based social classifications. The simple point is that measures do correlate strongly with features of the concept(s) on which they are theoretically based - as is demonstrated in valuable studies of criterion validity. However, what the same measures never achieve is an exclusive correlation with their concepts, and nothing else – yet, we argue, this is what many authors have effectively assumed. The result is something of a fallacy – that measures do not distinctively measure the concepts that are attributed to them. This is highly pertinent to stratification research, where the conceptual basis of social classifications is often used in empirical hypotheses concerning stratification processes (esp. Chan and Goldthorpe 2007). The ESeC classification (European Socio-economic Classification) is increasingly expected to be the most widely used occupation-based social classification across Europe and beyond in the next decade. This paper notes several favourable features of the ESeC derivation project and measure. However, it also cites the ESeC classification as a particularly problematic example of assumptions over the linkage between concepts and measures - embodied the ESeC project’s use of the slogan ‘One concept, one measure’ (Rose and Harrison 2007). Our analyses demonstrate emphatically that whilst ESeC may originate from one concept (employment relations), in empirical terms it measures many things (including employment relations, skill, socio-economic advantage, and social distance). These correlations have non-trivial implications for its interpretation and advocacy. Whilst ESeC is an especially influential occupation-based measure, it is important to realise that the opportunities for analysing occupations are many and varied. Major internet resources, such as the files distributed by Ganzeboom (e.g. http://home.fsw.vu.nl/~ganzeboom/pisa/), and by the GEODE project (www.geode.stir.ac.uk), allow rapid access to extensive collections of resources. This paper features a short discussion showcasing the facilities of one such resource (the GEODE project, on which both authors have worked). It illustrates how this new internet facility (launched January 2007) allows social scientists ready access to numerous occupational datasets and new opportunities in exploiting occupation-based social classifications. Accordingly, our analysis implements a wide selection of occupation-based social classifications (including the class schemes of ESeC, Wright, and the skill-based scheme advocated by Elias; and the stratification scales of ISEI and CAMSIS), as well as other indicators of occupational circumstances (including measures of the skill levels, income profiles, and gender segregation levels of jobs). By comparing

3
associations and correlations between these measures and key indicators of socio-economic circumstances, we emphasise how an array of alternative occupation-based measures overlap substantially in the factors which they empirically measure. Of course, not only do social scientists have numerous alternatives in how they code occupational data, they also have numerous alternatives in the analytical methods they may use when studying processes related to occupational measures. In this paper we explore the impact of alternative statistical formulations in the exploitation of occupation-based social classifications. We focus on the particular example of the prediction of unemployment risks (which has been used be previous authors as a test of the measurement properties of alternative social classifications), and paying attention to selection effects associated with industry. We find that such affect diminish the overall impact of occupation-based social classifications, though they do not entirely diminish small measurement differences between schemes. This paper concludes that there is work to be done in clarifying how we relate the concepts and measures of alternative occupation-based social classifications. We argue that the more favourable occupation-based social classifications are those that are explicit about their qualities as generalised summaries of stratification circumstances, and we challenge the important claim that the ESeC scheme can be taken as a clear measure of ‘one concept’. However, our analyses also demonstrate that occupational information remains the best way to understand micro-social inequalities and processes of social stratification. Indeed, returning to the theme of this conference, we suggest that longitudinal processes of cumulative advantage (in terms of unemployment risks) are ideally understood through the careful interpretation of occupation-based measures and their correlates.
4
1. Introduction: Concepts and measures in social science research This paper discusses the linkage between ‘concepts’ and ‘measures’ across alternative occupation-based social classifications. Our focus is the realm of survey-based quantitative research in sociology1. In this field, empirical investigation commonly proceeds according to a model which hinges upon an assumed relationship between concepts and measures. Ordinarily, theories and questions of interest are laid out in terms of possible relationships between concepts, but are analysed in terms of relationships between measures. Several commentators have argued convincingly that it is through understanding empirical patterns in carefully operationalised measures that social researchers have the best opportunity to undertake research of a scientific character contributing to the testing and development of social theories (e.g. Steuer, 2003; Goldthorpe, 2007). Measures in social survey research are therefore typically interpreted as potential (and potentially imperfect) indicators of the concepts of interest. Consequently, much methodological attention has been directed to the quality of survey measures across different domains of social science research. Literatures relevant to this discussion include prescriptive texts offering guidance on the qualities and mechanics of existing social science measures (e.g. Hoffmeyer-Zlotnik & Wolf, 2003; Rose & Pevalin, 2003; Shaw et al., 2007); focussed studies of the empirical properties and interpretations of existing measures (examples on occupation-based social classifications include Marshall et al., 1988; Chan & Goldthorpe, 2007; Rose & Harrison, 2007); and discussions covering procedures for choosing and identifying appropriate concepts to a relevant social science research question or theory (e.g. Goertz, 2006; Grusky & Kanbur, 2006; Goldthorpe, 2007)2. A complaint of some recent writers (e.g. Goertz, 2006) has been that social science methodologists have paid too much attention to the mechanics of measurements, to the neglect of underlying conceptualisations. On the one hand, it is easy to demonstrate that in the study of occupation-based social classifications, attempts to 1 Although the use of occupation-based social classifications – the focus of this study – does extend to other social research methodologies. Indeed, challenges in relating concepts and measures in the domain of social classifications have also been prominent in empirical research based upon extended interviews and focus groups (e.g. Devine, 2004, chpt 1). 2 Three literatures may be broadly distinguished. As well as concerns over which concepts should be focussed upon (conceptualisation) and how a measure should be operationalised from the original data (operationalisation), there are also many outputs concerned with how data should be collected in order to construct a measure (data collection). These three elements have distinctive features, but they are not independent of each other (indeed, the inter-dependence of conceptualisation, data collection and operationalisation is well illustrated in terms of National Statistics Institutes decisions on revisions to occupational classifications, whereby revisions to data collection instruments, revisions to tools for linking data resources, and revisions to substantive motivations in data collection, are often combined within the same methodological projects and reports – e.g. Rose & O'Reilly, 1997). This discussion is restricted to two features of methodological debate – conceptualisatons and operationalisations – since the field of data collection is typically outwith the control of secondary social survey researchers.

5
link measures with concepts are very well advanced, since such studies have been a staple component of sociological publications since the earliest empirical studies (e.g. Armstrong, 1972; Hauser & Warren, 1997; Grusky & Weeden, 2006), and continue to generate numerous alternative reviews (for recent examples, see Wright, 2005; Oesch, 2006; Lambert et al., 2008). However, we suggest below that many contemporary reviews of concepts and measures in occupation-based social classifications do suffer from limitations in the extent to which they compare an adequate range of alternative measures, and in certain features of their interpretations of empirical patterns of measurement. The first assumption in the use of occupation-based social classifications is that occupational circumstances of individuals (or indeed the occupations of their household sharers, their parents, and so forth) can be used to inform us about the experiences of individuals within a social structure of ‘stratification’ or ‘class’. Although there are important concerns involving the relationship between occupations and other social divisions both within and between societies and time periods (e.g. Abbott, 2006), this first key assumption of the relevance of occupations has garnered overwhelming empirical support across the range of societies and time periods over which sociological research has spanned3. A second assumption during the use of occupation-based social classification has been subject to far more methodological debate. It is that one or more set of rules (‘translation codes’) may be used to locate occupational positions into appropriate measures of ‘social class’ or ‘stratification’ positions. Classical approaches to measurement involve either grouping occupational titles into a small number of categorical locations (usually termed ‘class’ categories), or else scaling occupational titles with scores in one dimension of social inequality (usually referred to as ‘status’, ‘prestige’ or ‘stratification’ scales). Most contemporary research continues with one of these approaches4, and this is especially true of the many users of occupation-based social classifications who seek convenient measures without recourse to specialist methodological literatures. However, there is a great deal of inconsistency in contemporary survey research in how social scientists derive and exploit translation codes for occupation-based social classifications (Lambert et al., 2007), and there
3 There have been a number of well-publicised counter-claims over the value of researching occupational positions (e.g. Pakulski & Waters, 1996; Beck, 2000). These have highlighted the allegedly diminishing importance of occupational circumstances (and other economic structures) in defining social inequalities. Many such studies have been exposed as lacking in robust empirical foundations – and directly contrasted with empirical evidence which contradicts many of their claims (see for instance the review by Goldthorpe, 2007, Chapter 5). However, it is useful to recognise that many of these influential studies do include some commentary on the mediation of occupational influences (such as by age, gender and ethnic groups within a society) which is empirically persistent. Most multivariate analyses exploiting occupation-based social classifications do of course recognise such mediating influences (e.g. Svallfors, 2005; Morgan et al., 2006), a point which is perhaps not appreciated by critiques of research on occupational positions. 4 There have been a variety of alternative suggestions for measuring social inequalities on the basis of occupations which depart from such positions. These include advocacy of measurement scales involving multiple dimensions; of longitudinal measures of occupational trajectories or structures (Gershuny, 2002); and of categorisations which use much larger numbers of different categories (e.g. Weeden & Grusky, 2005).

6
continues to be much debate over what may be the best available classification for a given application. The focus of this discussion is that different occupation-based social classifications have been claimed to be associated with different underlying conceptual accounts of ‘class’ and ‘stratification’. One widely used family of occupation-based social classification measures of ‘class’ have been claimed to represent ‘employment relations’ (i.e. the ‘EGP’ or ‘Goldthorpe’ scheme and the related NS-SEC and ESeC schemes – for a summary see Rose & Harrison, 2007). Another widely used family of class measures are claimed to represent, first and foremost, economic relations of production and conflict (i.e. the ‘Wright’ class scheme, see e.g. Wright, 2005). Features of these and other measures are that the translation rules for deriving a measure are specified in a manner which the authors intend to emphasise their own conceptual account of class or stratification. Subsequently, empirical differences between the properties of different schemes are ordinarily interpreted at indicators of differences attributed to the underlying concepts (esp. Marshall et al., 1988; Chan & Goldthorpe, 2007). We argue in this paper that whilst occupation-based social classifications are powerful tools, there is a danger in that social scientists frequently over-estimate the linkage between concepts and measures in occupation-based social classifications. Some measures do correlate strongly with features of the concept(s) on which they are theoretically based. This has been demonstrated, for selected measures, in studies of ‘criterion validity’, which have reported correlations between occupation-based social classifications and alternative measures of underlying concepts. For instance, in the case of the EGP scheme, Evans and Mills (1998; 2000) have shown convincing patterns of association between that scheme and alternative indicators of employment relations and conditions. However, it is worth highlighting that many sociological studies have used alternative occupation-based social classifications which do not benefit from such consistent evidence of criterion validity, and correspondingly many measures may not be reliably assumed to correlate with their claimed properties. However, regardless of the extent to which ‘criterion validity’ has been established, a simple but important point is that all measures of occupation-based social classification, in large degree by dint of their operationalisation through occupations, can be shown to correlate with numerous other concepts aside from those directly attributed to them (we demonstrate this below). Thus, occupation-based social classification never achieve an exclusive correlation with their concepts, and nothing else. Nevertheless, this is what many authors have, effectively, assumed5. The result is
5 This issue reflects an enduring misconception in the field of measurement in the social sciences(Prandy, 2002). Whilst it is true that occupation-based social classifications can capture empirical patterns of difference between different groups in relevant concepts, the relationship is asymmetric – it does not follow that the same concepts are distinguished through the measurement, and in fact this is very unlikely to happen when the occupation-based social classification involves a relatively large degree of aggregation, as is inherent to a parsimonious classification based upon occupational locations.

7
something of a fallacy – that measures do not (and cannot) distinctively measure the concepts that are attributed to them. This is highly pertinent to stratification research, where the conceptual basis of social classifications is often used in empirical hypotheses concerning stratification processes (esp. Chan and Goldthorpe 2007). An instantiation of the lack of exclusivity between alternative occupation-based social classifications is well known to sociologists, although is not usually viewed from this perspective. The ‘Treiman constant’ refers to the empirical generalization that ‘occupations are ranked in the same order in most nations and over time’ (Hout & DiPrete, 2006, p2). A large volume of empirical studies have supported this claim, yet although this assertion has ordinarily been associated with scaling exercises concerned with hierarchies of advantage, it may equally be regarded as consistent with the view that alternative occupational measures tend in large part to measure the same structures of difference (esp. Ganzeboom, 2005). Whilst most occupation-based social classifications have been directly linked with specific concepts of class and stratification, some alternative classifications have been claimed to represent more generalised social structures of inequality. These include ‘stratification’ scales derived from patterns of social interactions (Rytina, 2000; Bottero & Prandy, 2003). This position is also held for the status and prestige approaches associated with Ganzeboom and Treiman (e.g. Ganzeboom & Treiman, 2003)6. We conclude, below, that these attempts offer a better appreciation of occupation-based social classifications, although we also emphasise that for many purposes, the differences between the empirical properties of such measures makes little impact. In this paper we review existing occupation-based social classifications. We discuss selected features of an array of alternative occupation-based social classifications, focussing upon empirical evidence from contemporary longitudinal survey data from the UK (British Household Panel Survey) and Sweden (Level of Living Survey, linked with administrative data). We focus upon claims made concerning the conceptualisation and operationalisation of the European Socio-Economic Classification (‘ESeC’), with particular attention to the relationship between the ESeC measure and patterns of subsequent experiences of unemployment (cf. Elias & McKnight, 2003; Goldthorpe & McKnight, 2006; Schizzerotto et al., 2006).
6 Though it is useful to distinguish the wider group of claims that occupation-based social classifications may represent a generalised structure of stratification (e.g. Prandy, Rytina, Ganzeboom, Trieman), from the sub-set of those claims which also assert that this occupational order is broadly fixed across different countries and time periods (e.g. Ganzeboom, Treiman). This latter claim has received much empirical support (cf. Hout and DiPrete 2006), but is not adopted by all advocates of measurements of a generalised structure stratification (cf. Lambert et al 2008).

8
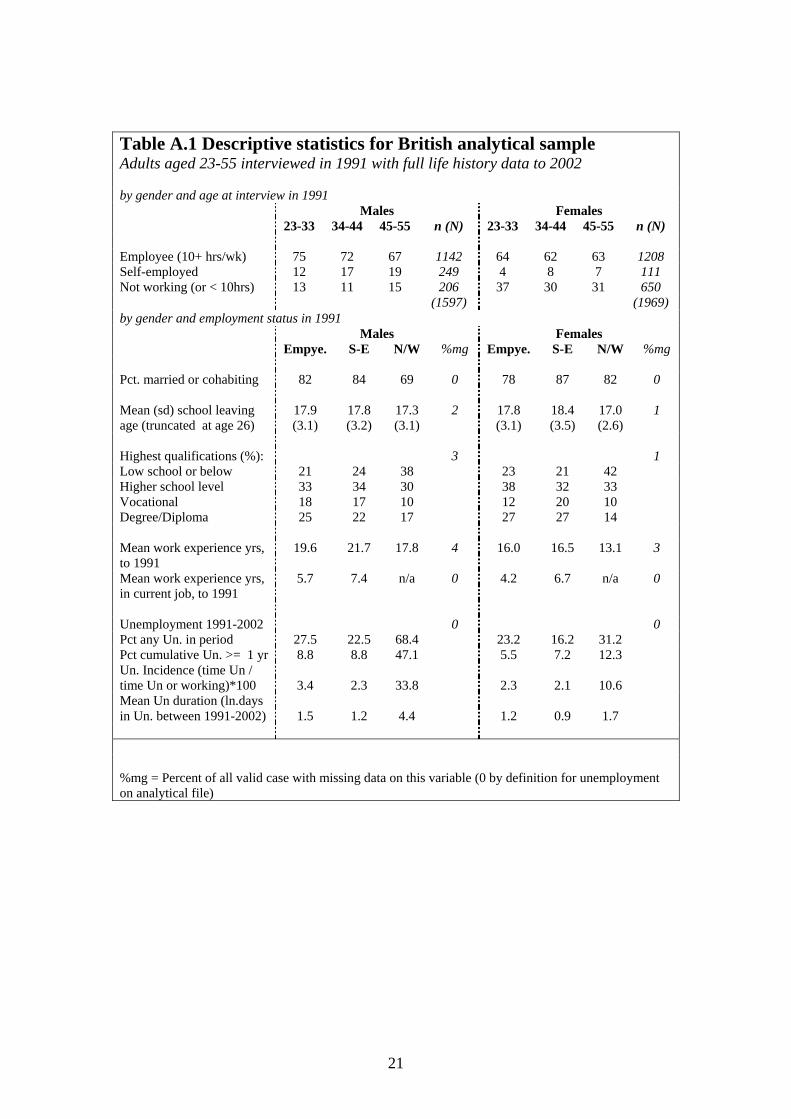
2. Data 2.1 Micro-Data Our analyses are based upon micro-data from random survey samples drawn in Britain and in Sweden in 1991. Since our analytical interest centres on the prediction of prospective unemployment, we required longitudinal micro-data. An implication of this requirement was that we worked with relatively small survey samples of individuals who were employed in 1991 and successfully re-interviewed in Britain (or traced in Sweden) over the period until 2002. This means that our survey micro-data is not necessarily the largest or most comprehensive dataset for the analyses of occupational structures around the period 19917. Basic parameters of the data used are described in Appendix Tables A.1-A.3. The British sample design using the British Household Panel Study (BHPS, Halpin, 2006; University of Essex & Institute for Social and Economic Research, 2007) begins with a nationally representative random sample of adults in 1991. We select only those adults aged 23-55 in 1991 with valid data on employment, since younger adults are argued to be increasingly likely to be in temporary and casual employment, and older adults as increasingly likely to voluntarily withdraw from the labour market within the period of the study observation (this age range was also used by Elias & McKnight, 2003). In Britain, the analysis is restricted only to the subsample of cases who were successfully re-interviewed every year from 1991 to 2002, and who also contributed complete responses on the work life history database (Halpin, 2006). This leads to approximately 50% attrition from the 1991 sample (compare Table A.1, which shows the data from the BHPS used in our analysis, and Table A.2, shows the full range of data that could potentially have been used). This attrition should be noted, although we argue that the BHPS is widely regarded as a high quality longitudinal survey where a complete case analysis can often be justified. Therefore, the analyses we undertake on the BHPS make the standard ‘missing at random’ assumption, that cases excluded from the sample are missing for reasons either outwith the scope of the analysis, or on the basis of factors which can be controlled for in the multivariate models (see Allison, 2002 for defence of this approach). In fact, similar data from the BHPS has also been used for comparable analyses by Elias and McKnight (2003); Goldthorpe and McKnight (2006); Schizzerotto et al. (2006) and Chan and Goldthorpe (2007). The Swedish data is not affected by attrition in the same way, since the longitudinal follow up is achieved by administrative data. The data is based on the LNU (Levnadsnivåundersökningen/ Level of living Survey) survey8 of 1991, with a response rate of 79 %. Thereafter administrative data was merged with the survey records as part of a larger research project at the Swedish Institute for Social Research 7 Indeed in Britain alternative resources such as the Labour Force Survey, the Employment in Britain survey; and the Social Class in Modern Britain survey – all available via the UK Data Archive http://www.data-archive.ac.uk/ - all feature more extensive cross-sectional micro-data on occupations. 8 http://www.sofi.su.se/LNU2000/english.htm

9
(SOFI)9. The administrative records, which cover data on future spells of unemployment experienced by the 1991 LNU respondents, come from the ‘PRESO’ register of employment and unemployment events, which is maintained by the ‘AMS’ (Arbetsmarknadsstyrelsen / The National Labour Market Board). The approach combining administrative and survey data is used and described in a study by Korpi and Stenberg (2001). Since people in Sweden who become unemployed register themselves at AMS in order to get unemployment insurance, the coverage of the PRESO register of all unemployment will be close to complete (cf. Levin, 1996). Hence, we have summed all episodes of unemployment on PRESO for the LNU-respondents for the years 1992-2002. 2.2 Occupation-based social classifications
“Sensible taxonomies can rarely be judged true or false, only more or less useful for a given purpose” (Mills & Evans, 2002, p80).
Evans and Mills’ statement with regard to occupation-based social classifications would appear to command widespread agreement amongst sociologists. Yet it carries two implications which are seldom developed within validation studies of the properties of occupation-based social classifications such as Mills and Evans’, or indeed in wider empirical applications. These are that there may be numerous alternative occupation-based taxonomies worthy of empirical attention; and that different taxonomies may be more suitable in a given empirical analysis (distinguished for instance by national and temporal context, or by analytical focus). In practice, most studies of the properties of occupation-based social classifications have focussed on just one or two taxonomies. Most empirical analyses using occupation-based social classifications have used just one taxonomy, whereas those which have used more than one have typically used only two or three (e.g. Heath et al., 2003; Weeden & Grusky, 2005; Chan & Goldthorpe, 2007). The total number of alternative occupation based-social classifications available to social scientists in any given context is much higher. In Britain for instance, Lambert et al noted that in 2005 alone, 6 new social classifications were proposed for contemporary analyses (Lambert et al., 2008). Although some decades ago Bechhofer (1969) urged researchers to stop adding to the already large number of alternative taxonomies, this advice was not followed either in Britain or elsewhere! There are considerable practical difficulties involved in comparing more than a small number of occupation-based social classifications. We attempt this in our analyses below (Figures 2.1 – 4.2, discussed below). Our results are largely of a descriptive and preliminary character, but one clear problem is the difficultly of conveying the wide range of details and associations summarised in the analyses – which involve
9 We are grateful for the work done by Tomas Korpi in order for us to be able to use this data.

10
thousands of different permutations in the relationships between different social classifications and other relevant measures - in a coherent way. A second practical difficulty involves facilities for operationalising occupation-based social classifications on the basis of ‘source occupational information’ (e.g. job titles) typically recorded by social surveys. A preferable model for a replicable research undertaking would involve using transparent translation codes on carefully preserved micro-data. However, the costs involved in implementing such codes (usually through bespoke software programming) are considerable for most social scientists. It is, moreover, easy to find numerous examples of research projects which do not keep strictly to such an approach to operationalisation (for an extended discussion see Lambert et al., 2007). Nevertheless, it may be argued that the barriers to empirical researchers considering a wider range of occupation-based social classifications are diminishing10. Social researchers’ capacities for exploiting internet provisions of occupational translation codes would ordinarily be expected to increase with improving computer literacy and software packages for data management. In addition, a recent project - involving the authors of this text - was specifically designed to improve social scientists’ access to occupational information resources, such as translation codes for occupation-based social classifications. The GEODE project (Grid Enabled Occupational Data Environment)11 involved developing web-pages and an open access internet ‘portal’ (a login web site – illustrated in Figure 1) which allows social scientists to search for and retrieve relevant information on occupation-based social classifications, as well as to deposit new occupational information resources in a coordinated manner. The range of facilities involved in this site – which includes a purpose built programme for linking micro-data files with selected occupation-based social classifications – are described on web-pages and working papers downloadable from the project website. The authors exploited resources from the GEODE site in order to access and implement the 31 different occupation-based social classifications covered in this paper. It is worthwhile to highlight to non-specialist users that the facilities on the GEODE web-site are not entirely finalised and user-friendly at time of writing, though the developers of this facility hope to continue improving its accessibility in response to users’ feedback. In this analysis, we depart from many previous reviews of occupation-based social classifications by comparing as wide a range of taxonomies as are available to us on our particular datasets. Our analyses proceed by operationalising 31 different occupation-based social classifications (these are drawn from thirteen traditions on occupational research – see the groups reported in Figures 2.1-3). The schemes – and the abbreviations we use in the figures – are described in Table 1. In both countries, occupational measures are based upon self-reported descriptions of current occupations 1991 (and self-reported descriptions of mother’s and father’s occupations when respondents were aged 14) coded to the UK and Swedish standardised 10 Motivations for considering wider ranges of classifications are also likely to grow, as secondary micro-data is increasingly available from a wider range of countries and time periods, which in turn feature different occupational data and potentially different classification schemes. 11 See http://www.geode.stir.ac.uk/ .
11
occupational classifications (for Britain, see OPCS, 1990). This data was subsequently translated to social classification schemes and other occupational measures using resources accessed from the GEODE website (Lambert, 2007), including measures derived from published texts (Chan & Goldthorpe, 2004; Oesch, 2006) and online occupational information provisions (including Leiulfsrud et al., 2005; Bihagen & Ohls, 2007; Ganzeboom, 2007; Lambert & Prandy, 2007). European Socio-Economic Classification (E9, E6, E5, E2) A particular interest in this study is in the ESeC classification (European Socio-economic Classification). These scheme is increasingly expected to be the most widely used occupation-based social classification across Europe and beyond in the next decade (Rose & Harrison, 2007). The ESeC scheme is broadly based upon the definitions used in the EGP classification, in which ‘employment relations’ are used to define a structure of occupational categories (see Rose & Harrison, 2007). Attractive features of the ESeC scheme include online facilities for implementing the scheme according to internationally standardised occupational classifications12; the development of the scheme during a collaborative project exploiting national expertise in occupational classifications and their engagement in a programme of research assessing aspects of the validity of the measurement13; and the engagement of the scheme with previous approaches to occupation-based social classifications, especially those of the EGP measures (cf. Rose et al., 2005). In fact, the most significant departures from the ESeC scheme and the EGP classifications lie in the mechanics of its operationalisation. For the period of our data (1991), specialist national operationalisations of EGP were available for both Britain and Sweden, whereas ESeC was operationalised using an internationally standardised classification to ESeC (using ISCO-88 3-digit occupations and employment status data). This meant the two schemes did not overlap in several cases – a consequence of which are differential patterns of association revealed between the schemes in our results (Figures 2.1 – 4.2). Despite its strengths, the ESeC derivation project and measure does appear to have one significant drawback, insofar as it has adopted very strong assumptions over the linkage between its concepts and measures. This has been embodied in the use by the developers of ESeC project’s use of the slogan ‘One concept, one measure’ (Rose and Harrison 2007). The claim is that the ESeC scheme – being a measure based strictly upon concepts of employment relations – is superior to alterative occupation based social classifications because it is known to measure one distinctive property (employment relations). As discussed above, this property of unique measurement is unlikely to be the case for any occupation-based social classification. In fact, our analyses below demonstrate that whilst ESeC may originate from one concept (employment relations), in empirical terms it measures many things (including employment relations, skill, socio-economic advantage, and social distance). 12 Resources are available at http://www.iser.essex.ac.uk/esec/; the ESeC translation codes have also been implemented into an ‘occupational matching’ programme within the GEODE web portal at www.geode.stir.ac.uk . 13 See especially http://www.iser.essex.ac.uk/esec/events/conferences/2006/2006-01-19/ .

12
Skill levels (K4) We use a 4-fold categorisation of the ISCO-88 scheme into skill levels typically associated with component jobs. This scheme, proposed by Elias (1996), excludes ISCO occupations in major groups 0 and 1 since they are considered ambiguous in their skill levels. Dumont (2006) has commented critically on the ability of ISCO based categorisations to identify different levels of skill in a reliable way. Manual / Non-manual classification (MN) An enduring analytical category in sociological commentaries is the simple dichotomy between occupations which are predominantly manual and non-manual in character. We classify occupations on the basis of a recoding scheme for ISCO88(COM) unit groups prepared by the authors and available for download from the GEODE web pages14. Work Logic classifications (O17; O8; O4) Oesch (2006) advocates alternative 17-, 8- and 4-category classifications of occupations which are differentiated in terms of the ‘work logic’ and technical content associated with jobs15. Oesch argues that this scheme reflects more salient features of contemporary occupational and social inequalities than do alternative classifications, because the work logics which define the scheme are sensitive to the social impact of recent occupational changes associated with recent processes of ‘tertiarisation’, ‘feminisation’ and ‘welfare statism’ in the European labour market This scheme is operationalised by Oesch (2006, p222-4)for Britain, Switzerland, and Germany on the basis of a classification of ISCO-88 unit groups; and for Sweden on the basis of a classification of Swedish NYK-83 and SEI units (for all countries these units are cross-classified with data on employment status, number of employees, and educational levels). A Stata format variant transcription of these codes was prepared by the authors and is available for download from the GEODE web pages. Wright class scheme (WR; WR9) The class categorisations advocated by Wright (1985) are conceptualised as reflecting differences associated with a Marxist employment and stratification structure. The categories are are notoriously difficult to derive for non-specialist data (cf. Marshall et al., 1988, chpt 3), since they require details of the autonomy, supervisory roles and 14 The coding schedule is available for inspection at www.geode.stir.ac.uk. This recoding involves the author’s own specification of ‘manual’ and ‘non-manual’ occupations. In our classification, all occupations in ISCO major groups 1 and 2 were coded as ‘non-manual’ (even though some occupations in major group 2, such as ‘athletes’ or ‘nursing professionals’, might be viewed by some as manual in nature). Occupations in major groups 3-9 were coded on a case by case basis. Our criterion for allocating jobs as ‘non-manual’ was that the jobs were judged by us to be to be wholly or largely achievable by individuals with limited physical capability; ‘manual’ jobs were those, in our interpretation, which could not readily be undertaken without a certain degree of physical capability. 15 The work logic components central to Oesch’s scheme share many features with the technical distinctions advocated in a study of Spanish occupations by Rodriguez (2008).

13
skills involved in a job. We use the macros provided by Leiulfsrud et al. (2005) which are derived for variables on the European Social Survey. For both the BHPS and LNU, there are limitations in the extent to which this macro is reliably implemented, since not all of the required differentiation in positions is available in either scheme. CAMSIS scales (CM, CF, CM2, CF2, CG) CAMSIS scale scores are argued to represent a generalised structure of stratification which is exhibited through relations of social interaction between the incumbents of occupational positions (Prandy & Lambert, 2003). However, Chan and Goldthorpe (2004; 2007) derive empirically equivalent classifications but interpret them as measures of a Weberian interpretation of social status. In either case, scores are assigned to occupations which are claimed to represent the average position of an occupational incumbent in the structure of stratification or status; these scores are empirically derived from a multidimensional model of social interaction, and there is some ambiguity over the extend to which any derivation may exclusively differentiate the dimension of stratification/status from other influences upon social interaction patterns in occupational unit holders (such as induced by gender segregation patterns, and institutionally connected occupations). Wage scores (WG1, WG2, WG3) These scores indicate measures of the average levels of income associated with relevant occupational positions. They are ordinarily interpreted as direct measures of relative economic advantage. Average Wage Mobility (AWM) Bihagen and Ohls (2007) have advocated a measure of occupational circumstances based upon empirical patterns of intra-occupational wage mobility. An analysis on Swedish data derived a scale score for Sweden which can also, via ISCO-88, be linked to occupations from other countries – with the obvious criteria that its reflection of occupational progression structures might not be thought to translate consistently across countries. Gender Segregation index (GN) Sociologists studying stratification and class inequalities often acknowledge the importance of occupational gender segregation in impacting our interpretation of occupational circumstances. For instance, Hakim (1998) has demonstrated that the gender segregation profile of jobs often relates to relations of occupational advantage and disadvantage; see also Charles and Grusky (2005).

14
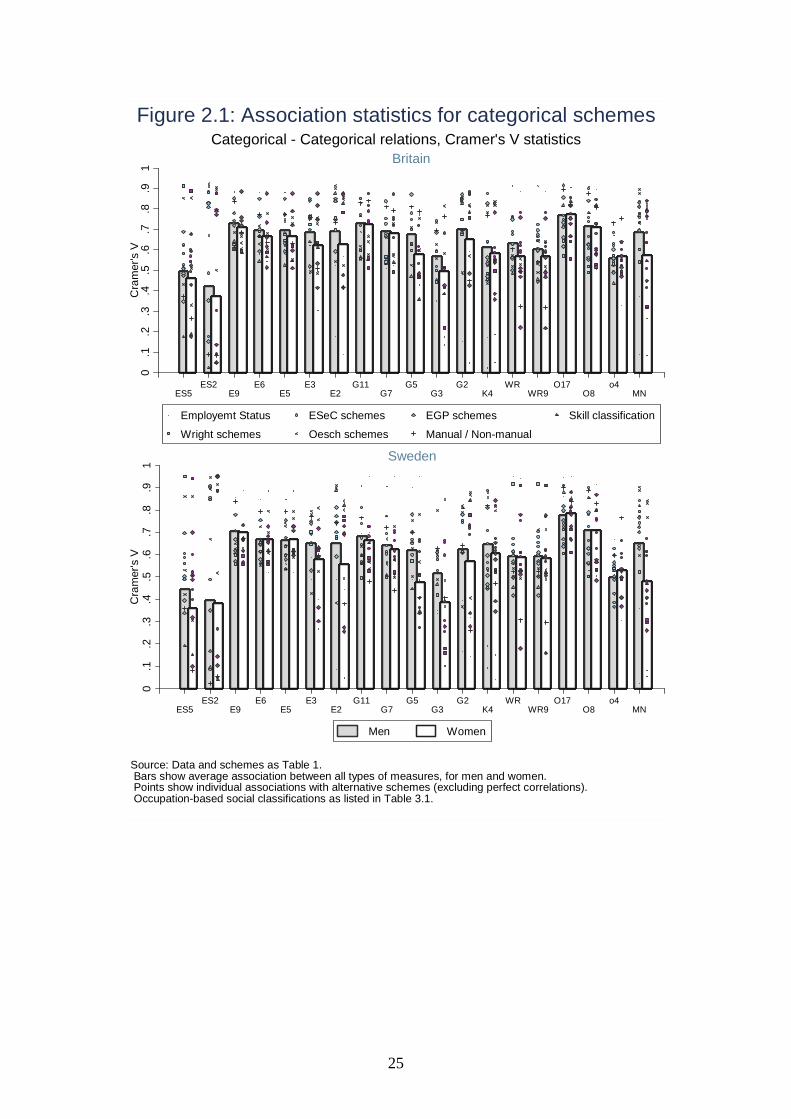
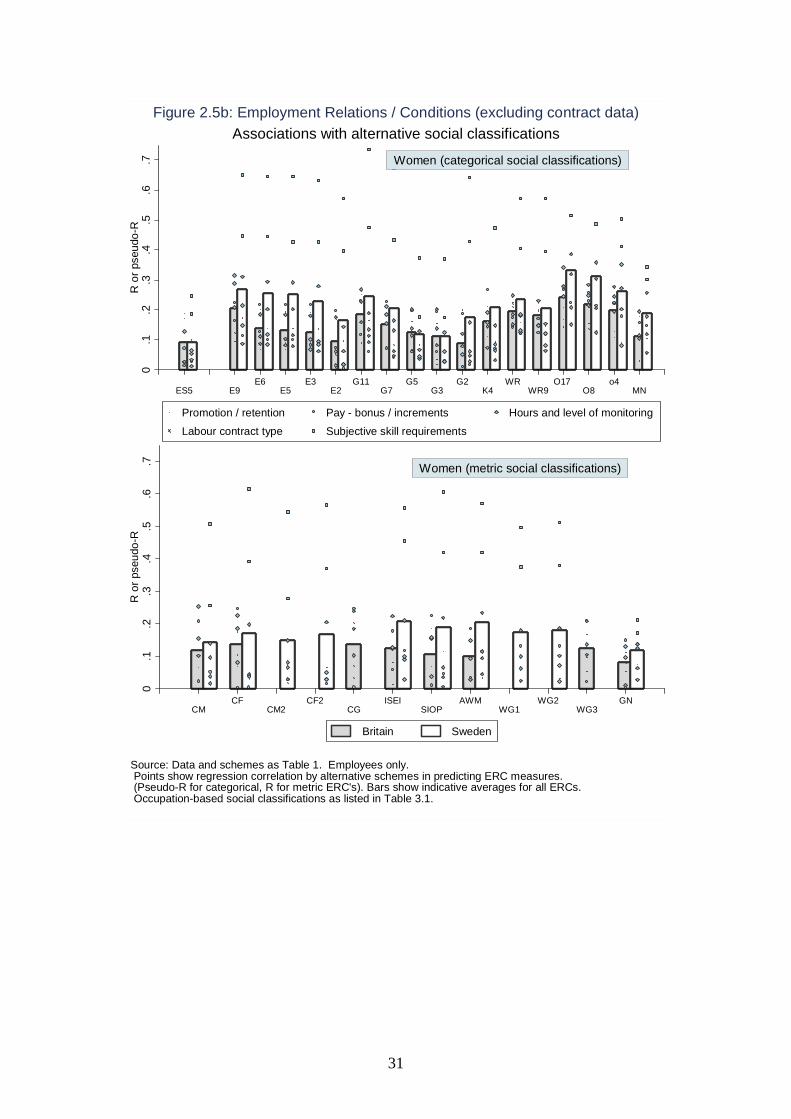
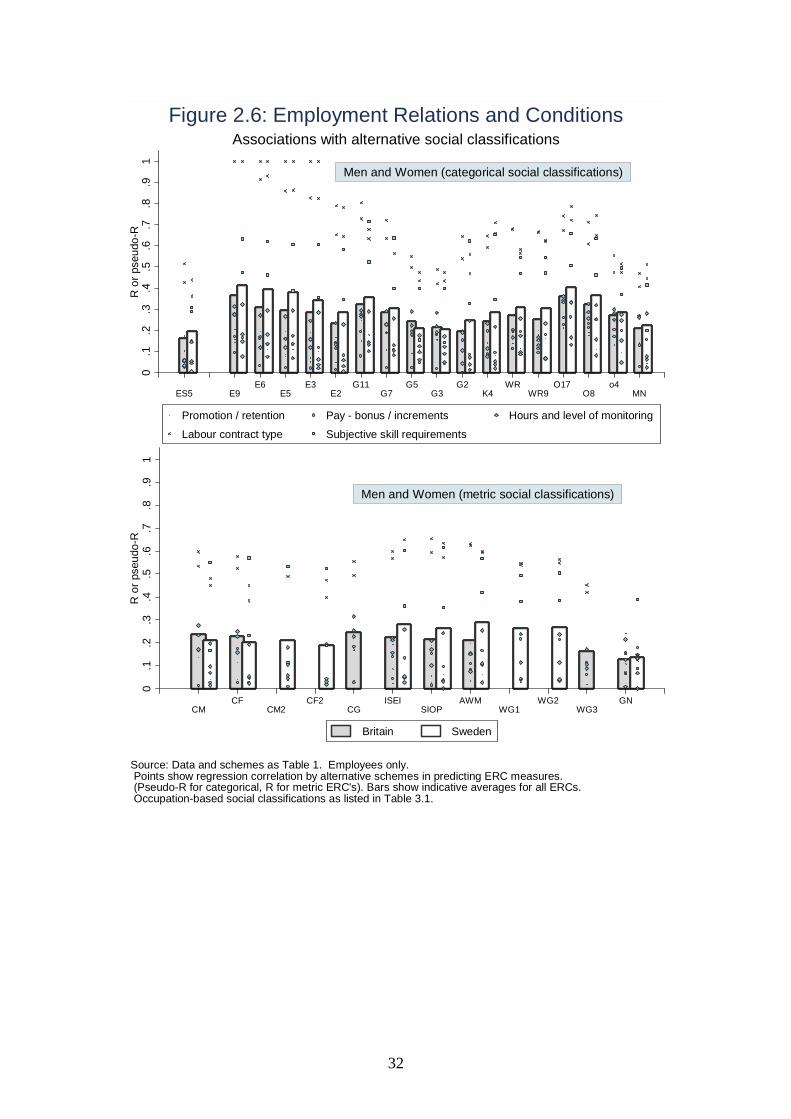
Result 1: The inter-relationship of occupation-based social classifications Few sociologists would dispute that most occupation-based social classification are highly correlated with each other (and with relevant other measures), yet the current authors know of only a few instances where such correlations have been explicitly published. Therefore, in Figures 2.1-2.3 we reiterate this point by attempting to summarise an array of correlations (31*31 associations, for each combination of men and women in Britain and Sweden). We use graphical representations of the average magnitude of each association16 and plot correlation points organised according to groups of related occupation-based social classifications. The first and core result is that almost all occupation-based social classifications have moderate correlations between each other (the only outliers are the gender segregation index and the dichotomous employment status categorisation). Moreover, occupational classifications which putatively have quite different conceptual foundations often turn out to be strongly correlated with each other. Indeed, in some instances, conceptually different schemes are more closely correlated than conceptually similar schemes. The above pattern of generalised similarity is the core result that we choose to emphasise. However, it would be wrong to claim that this generalised similarity has no structure within in. On the contrary, there are also significant patterns of difference in the magnitude of associations within Figure 2.1-2.3 which do suggest that different occupation-based social classifications are measuring somewhat different properties. To understand the nature of differences in occupation-based social classifications, Figures 2.4-2.7 are used to summarise patterns of ‘criterion’ validity, and Figures 3.4-3.7 are used to summarize patterns of ‘construct’ validity17. The multiple plots in Figures 2.4-2.7 show how different social classifications correlate with alternative indicators of ‘employment relations and conditions’. Measures of employment relations and conditions have been widely used to assess the criterion validity of the EGP and ESeC schemes. Our analysis, like those of several other papers, is restricted by the relatively limited volume of data in the LNU and BHPS surveys which could be interpreted as proxy measures of employment relations and conditions (esp. cf. Birkelund et al., 1996; Evans & Mills, 2000), and the lack of comparability between the countries. Moreover, many of the associations are heavily influenced by the high correlations between the measure of type of labour contract and the ESeC and EGP classifications (our measure of labour contract is, in fact, defined according to the ESeC categories, as specified in Rose & Harrison, 2007). For the latter reason, the Figures 2.4b-2.7b use equivalent data to 2.4-2.7, but exclude the labour contract measures from analysis.
16 The averages (of the association statistics) do not have any particular substantive significance – they are merely a function of the number of different social classifications operationalised. They are used in these and other figures as a convenient device to simplify the graphs. 17 Here, following the use of Rose and Harrison (2007), criterion validity is interpreted as the extend to which a measure is correlated to things it is designed to be related to, whilst construct validity is interpreted as the extent to which a measure is related to things which it is theorised to be correlated with.

15
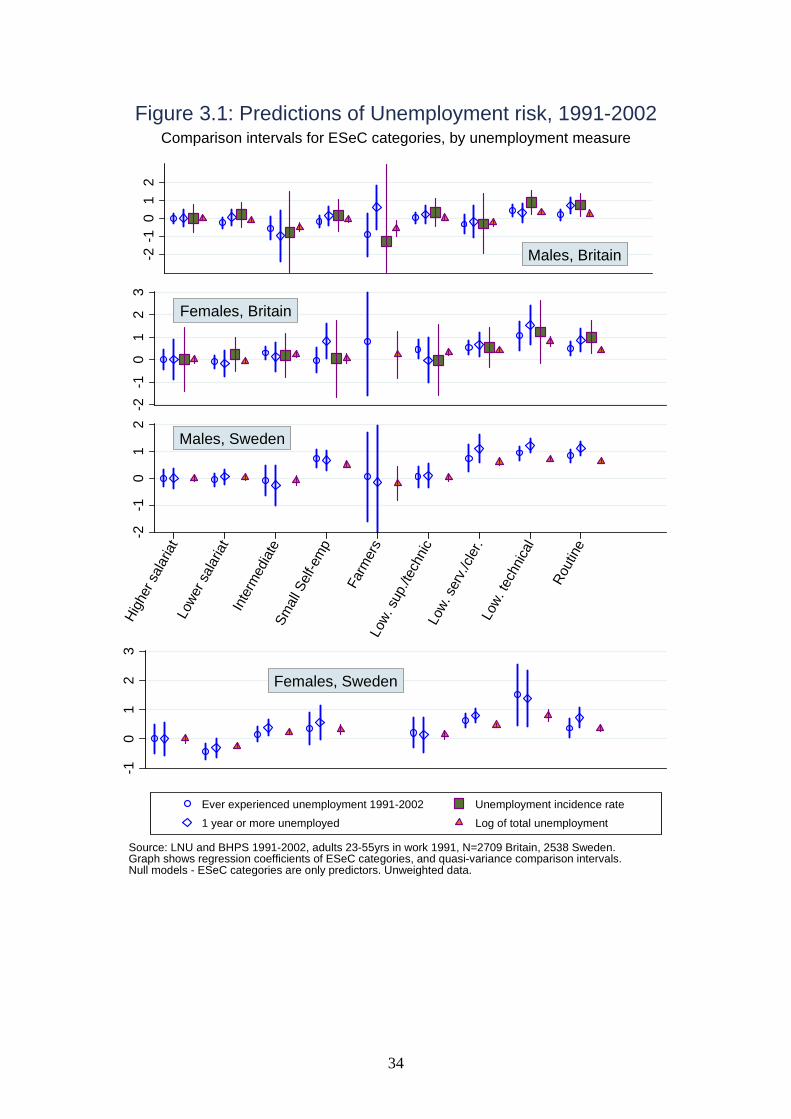
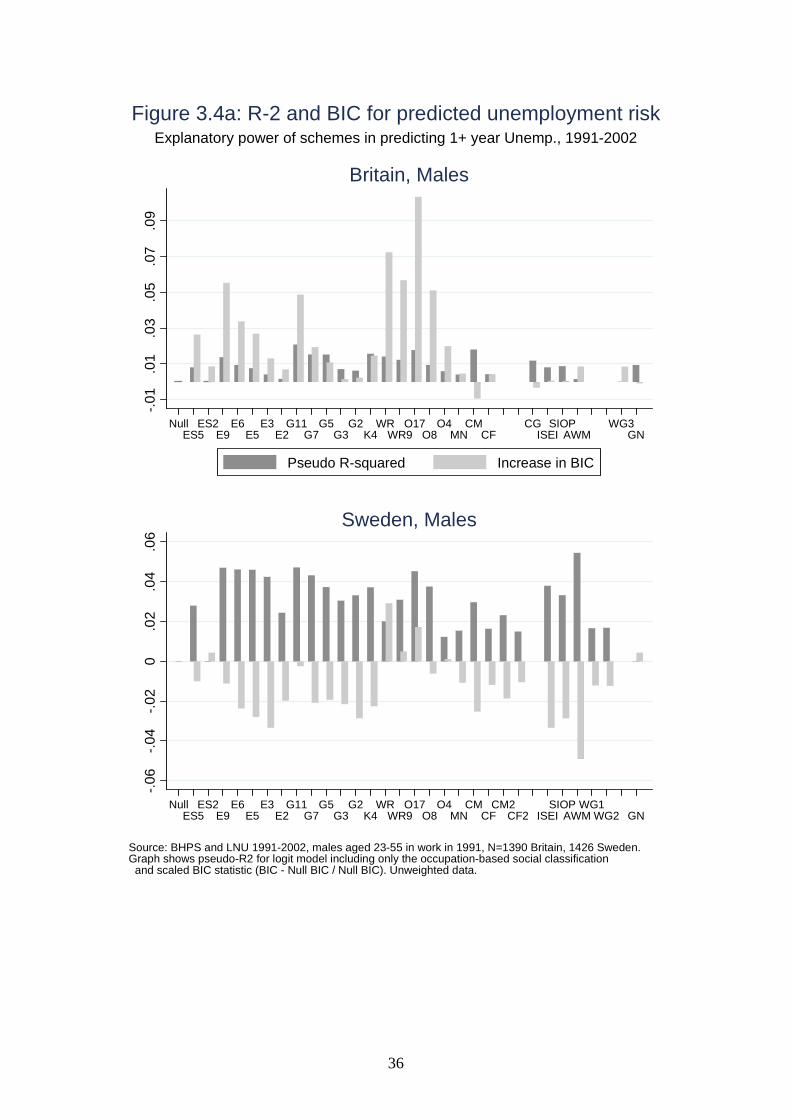
Again, the core interpretation from Figures 2.4-2.7 which we choose to emphasis is the degree of consistency between different occupation-based social classifications. Although this would naturally be expected given the correlations seen in Figures 2.1-2.3, it is nonetheless striking that patterns in employment relations and conditions tend to be shared, by and large homogenously, across schemes. The plots in Figures 3.4a, 3.4b, and 3.5 to 3.7 summarize the magnitude of association between the alternative social classifications and various measures of unemployment risks, educational levels, subjective health, and parental occupational advantage (all widely used measures of ‘construct’ validity, cf. Rose & Harrison, 2007). For the time being we will highlight only the first part of those figures, the darker bar plots indicating the magnitude of association between the measure and the social classification. At this point, we emphasis again the broad similarity in the order of magnitude between the schemes, and the apparent lack of systematic relationship between the conceptual foundations of the relevant schemes, and the magnitude of correlations (on the contrary, with the exception of the gender segregation measures which have very low correlations, we see that the magnitude seems to be related more strongly to the level of differentiation between categories – compare, say, G11 with G5 – than the conceptual origins of a measure). In summary, these simple reviews of patterns of correlation between measures show first and foremost a great deal of similarity between measures. 2.3 Other variables in the analysis Other measures used in our analysis are summarised in Tables A.1-A.3. Unemployment Our central interest was in studying patterns of unemployment risk. In both countries we operationalised several alternative measures of unemployment over the period 1991-200218. We derived two binary indicators, of whether or not an individual reported experiencing any unemployment over the period, or at least 12 months worth of unemployment in the period (cf. Elias & McKnight, 2003), which we analysed using logistic or probit regressions. To consider the impact of the extent of unemployment experienced, we also attempted to operationalise measures reflecting those used by Schizzerotto et al (2006), which cover the cumulative length of
18 For both countries, the categorisation of any period as one of ‘unemployment’ involves administrative criteria (of looking for work in Britain, and registering unemployed in Sweden). It is worth mentioning that Sweden has a long history of active social policy for keeping unemployment low. In the 1990s for instance when unemployment rose drastically one way of lowering it was to invest in the educational system, hence many people who would be unemployed or escaped unemployment ended up in educational programs. Thus, the unemployment we measure is clearly ‘open’ unemployment

16
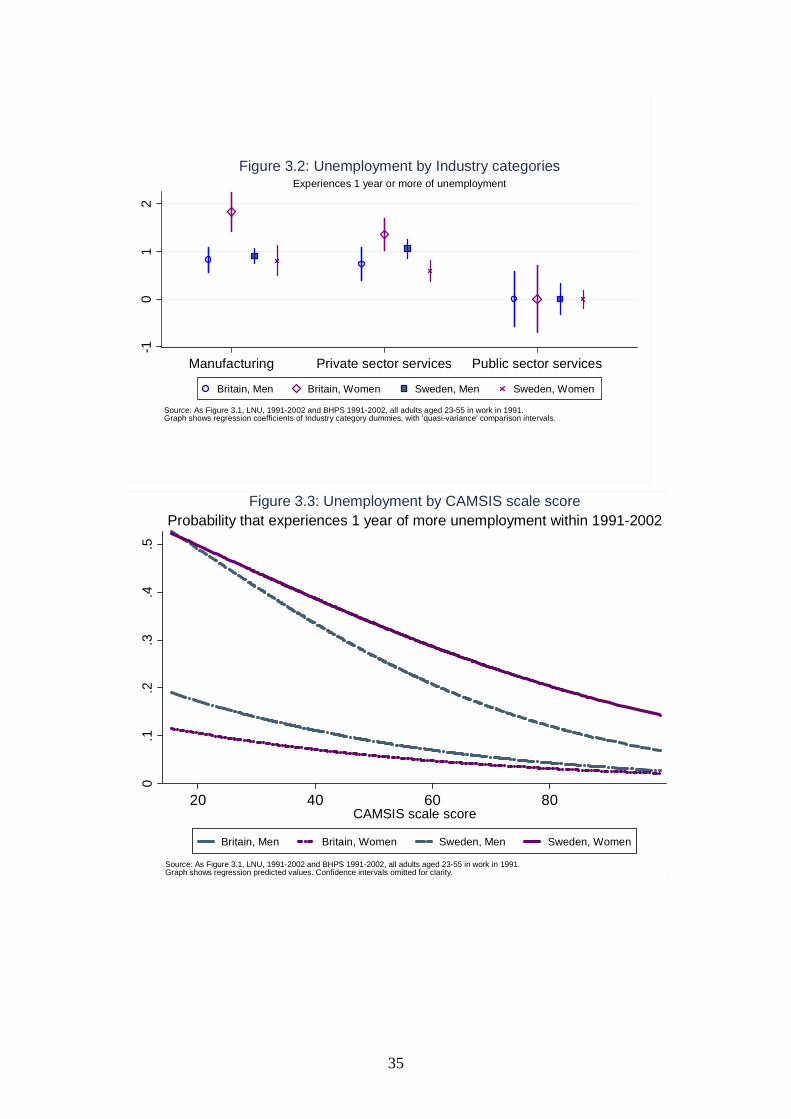
unemployment. For Britain only, we were able to construct a measure of unemployment incidence rate (proportion of time economically active in the period 1991/2002 which is spent in unemployment), and for both countries we were able to construct a measure of cumulative experience of unemployment (the log of the total number of days unemployed after 1991). Both variables have highly skewed distributions, for which reason we analysed them using Poisson and negative binomial regression models. In fact, the empirical associates of unemployment risks proved largely stable across different measures of unemployment (see Figure 3.1), as a consequence of which many of our analyses are restricted for convenience to one measure (whether or not the respondent experiences more than one year of unemployment within the period). 3. Empirical patterns: Construct validity and parsimony The devices used for comparison in Figures 3.1 to 3.7 attempts to jointly evaluate two conflicting intentions in most uses of occupation-based social classifications. On the one hand, to accurately measure structures of difference; on the other hand, to summarise this parsimoniously through occupational records. The latter aim is often not explicitly acknowledged as a feature of social classifications, though any review of published analyses of schemes reveals that social researchers have a strong preference for the most simplified possible social classifications (often summarising complex class classifications through a simple dichotomisation). In Figures 3.1-3.7 we summarise the strength of association, between social classifications for individuals19, and other variables, by using conventional association statistics and plots of predicted values, but we add an additional factor in Figures 3.4-3.7 by also summarising a widely used indicator of relative parsimony, the BIC statistic (Raftery, 1986)20. Firstly, in Figures 3.1-3.3, we show the magnitude of bivariate effects of alternative social classifications upon unemployment risks. This shows that the two social classifications focussed upon are only weakly predictive of unemployment risks, and, for a result which will be of relevant in section 4, we note that other measures related to occupational locations – industry of occupations – is much more clearly related to unemployment than the social classifications measured. Then, in Figures 3.4 to 3.7, we review more systematically the extend of the association between relevant constructs and alternative social classifications. 19 The plots of relationships with Father’s social classifications shown in Figure 3.4c are discussed in Section 4. 20 Some authors have been rightly sceptical that use of the BIC statistic can over-emphasise the importance parsimony. Since our analyses are entirely concerned with comparing relative degrees of parsimony this is not a relevant concern in this instance.

17
Result 2: The ambiguity of optimal social classifications The sentiment cited above by Mills and Evans (2003), that different measures are preferable in different circumstances, is difficult to act upon for the range of outcomes coved in this analysis, since alternative occupation-based social classifications do not have clear strengths and weaknesses in any outcome. Typically, we see that the association decreases, but parsimony improves, when related categorical measures reduce the number of categories, and we generally see that metric measures are often more promising in combining a moderate degree of association with above average parsimony. We also see that high-category categorisations, such as the Oesch 17-class scheme, and the Wright 12-class version, appear on national samples to have little to recommend them, since they lack parsimony but also do not feature notable additional association. However, despite these small differences, the order of magnitude is otherwise quite similar between different schemes, which might suggest that any measure would be adequate. Moreover, there are numerous small variations between gender and country which, if used to select alternative measure, might compromise the coherence of a comparative analysis. There are many interesting relationships within these patterns which are worthy of further commentary. Most obviously given our focus on ESeC, is the similarity between the ESeC and EGP schemes, but the relative strengths of the latter, at least in its 11 and 7 category versions, over comparable ESeC classifications in both countries. This suggests that in this periods, ESeC may be an adequate but imperfect alternative to EGP categorisations. 4. Empirical properties: Understanding social processes Hitherto, the results presented have concentrated upon bivariate or limited multivariate associations between occupation-based social classifications and putatively related measures. Of course, not only do social scientists have numerous alternatives in how they code occupational data, they also have numerous alternatives in the analytical methods they may use when studying processes related to occupational measures. Indeed, there are good grounds for anticipating that the story revealed when comparing occupation-based social classifications may change significantly when more complex analytical relationships are considered. One reason this may occur reflects simple demographic structures and their instability across time and between genders. For instance, some occupation-based social classifications have categories or positions which are dominated by one or another gender and/or by people at certain career stages. Entry into different locations in the classification is therefore partly determined by gender, age and time period; if these themselves are correlated to the outcome of interest (such as poor health) we could have a classically spurious interpretation of occupational effects. A subsequent

18
hypothesis may therefore be that the differences between occupation-based social classifications in discriminating other measures would themselves diminish when such endogenous processes are accounted for. Needless to say, however, there is little certainly over how much endogeneity could – or should – be accounted for. One relatively succinct way in which to try control for such effects is to concentrate upon the relative strengths of parental occupation-based social classifications (on the assumption that parental occupations are in large part independent of many of the individual level differences which may influence the properties of occupation-based social classifications. Therefore, the hypothesis that differences between occupation-based social classifications are in part a misleading function of endogenous occupational locations, would hold that differences between the influence of parental occupational positions would diminish compared to those between own occupational positions. We attempt to evaluate this in Figure 3.4c. Unfortunately, the magnitude of parental effects on current unemployment are too slight for an unambiguous interpretation. However, if anything the evidence runs against our hypothesis of diminishing differences between schemes, since the graphs show traces of differences between measures which resemble scaled down versions of the same differences between individual level occupations. The second, more conventional approach to accounting for spurious effects is to develop a multivariate model for all factors which might influence unemployment risks. In the case of simple socio-demographic measures this can conventionally be achieved by a univariate regression analysis. Figures 4.1 and 4.2 (Model 1) show the differences between 8 selected social classification schemes for men in these groups. However a more complex specification may be required to account for the possible role of industry in predicting unemployment. It may be expected that different industries would carry quite different risks of unemployment, which to an extent is embodied by our measure of 3 industrial sections and its influence on unemployment risks shown in Figure 3.221. Should we wish to differentiate the concept of industry from that of occupation-based social classification, we could simply enter industry of job in a regression model (Model 2 of Figures 4.1 and 4.2), however, this would still be flawed since we would have a model with endogenous predictors. A further alternative, therefore, would be to estimate a selection model in which the prediction of unemployment risks is undertaken within an industry group, after a previous related model is estimated predicting entry to the relevant industry. These are summarised in Models 3 and 4 of Figures 4.1 and 4.2. Our hypothesis was that the (already small) differences between occupation-based social classifications seen in the simpler analyses summarised in Figures 3.4-3.7, would diminish further when additional multivariate factors were accounted for. However, inspection of Figures 4.1 and 4.2 reveals that this does not particularly occur. Result 3: Persistence of small differences between conceptually distinct occupation-based social classifications
21 Of course, this 3-category measurement of the concept of industrial sector may seem inadequate, though a 9-category industrial classification led to similar results.
19
Our third core result runs counter to our own initial expectations. Differences between different occupation-based social classifications which can be given a conceptual interpretation do not diminish to insignificance when other factors are controlled for. On the contrary, there is a small premium to the EGP scheme, and to a lesser extent to the ESeC scheme, in predicting unemployment risks which does not seem to be related to the endogeneity of industry, life course stage and gender to class position. Contrary to the main thrust of our argument in this paper, this suggests that some level of difference between measures of social classifications do genuinely reflect conceptual foundations of the measurements. 5. Conclusions Sociologists make widespread use of occupation-based social classifications such as social class schemes and stratification scales. They frequently use these measures as summary indicators of individuals’ overall life chances or advantages. Contrary to certain speculative social commentaries, our results confirm, along with numerous other empirical analyses, the continued relevance of occupation-based social classifications to understanding life chances and advantages. The focus of our analyses was on the degree to which the properties that alternative occupation-based social classifications measure, are related to the differences between the concepts which underlie the alternative schemes. We found that an array of alternative occupation-based measures overlap substantially in the factors which they empirically measure. By showing high degrees of similarity between schemes in their correlations with each other and with other related factors, we argued that the extent to which different schemes measure different concepts is minimal. On the other hand, through finding small persistent differences in the properties of different classifications, we also find that while conceptually founded measurement differences between schemes may be minimal, they do exist. Important questions concern what which can recommend from this review. Firstly, with regard to the ESeC classification, we can emphasise that it is unrealistic to assert that the ESeC categorisation clearly measures concepts of employment relationships in a manner that is different from other alternative schemes. On the contrary, our analyses suggest that the ESeC scheme, along with all the other classifications reviewed, is first and foremost a measure of a generalised structure of stratification. In this respect, a stratification scheme which itself describes itself as such a generalised structure is arguably a more favourable option. As the ESeC scheme is an influential and significant endeavour in occupation-based social classifications, we can conclude that there is work to be done in clarifying how we relate the concepts and measures of alternative occupation-based social classifications.

20
Table 1: Occupation-based social classifications
(grouped according to conceptual foundations) Abbr. GB SW Comments
1 ES5 Y Y Employment status, 5 categories. (Employee; supervisor/manager; self-
employed > 10 empy.; self-emp. 1-10 empy.; self-emp. no employees) 2 ES2 Y Y Employment status, 2-categories. (Employee; self-employed) 3 E9 Y Y ESeC (full version). 9-categories: 4 E6 Y Y ESeC (reduced 6-category version). As ESC9 but merges categories 1 and
2; 3 and 6; 4 and 5 (see Rose and Harrison 2007, p464) 5 E5 Y Y ESeC (reduced 5-category version). As ESC6 but merges categories 5 and
6 (see Rose and Harrison 2007, p464) 6 E3 Y Y ESeC (reduced 3-category version). As ESC5 but merges categories 2 and
3; 4 and 5 (see Rose and Harrison 2007, p464) 7 E2 Y Y ESeC (reduced 2-category version). Separates ESeC 1 and 2 salariat, from
all other classes (see Rose and Harrison 2007, p464) 8 G11 Y Y EGP (11-category version). Erikson, Goldthorpe, Portacero class scheme
(see Erikson and Goldthorpe 1992, p38-9 for categories and versions) 9 G7 Y Y EGP 7-category scheme (Erikson and Goldthorpe 1992, p38-9) 10 G5 Y Y EGP 5-category scheme (Erikson and Goldthorpe 1992, p38-9) 11 G3 Y Y EGP 3-category scheme (Erikson and Goldthorpe 1992, p38-9) 12 G2 Y Y EGP 2-category scheme (separates Service classes I and II from others) 13 K4 Y Y Elias Skill levels. 4-category definition of skill levels associated with ISCO-
88 occupations (see Elias 1996) 14 WR Y Y Wright class scheme (12-categories). Derived using ISCO-88 occupations
via algorithm of Leisufrud et al (2005). British derivation requires imputations on job autonomy using managerial status questions.
15 WR9 Y Y Wright class scheme (9-categories). As WR, but recoding into 9 categories by merging workers and supervisors within skilled categories.
16 O17 Y Y Oesch ‘work logics’ class scheme (17 categories). Oesch (2006, p222), derived from ISCO-88 plus employment status data.
17 O8 Y Y Oesch class scheme (8 categories). Oesch (2006, p68). 18 O4 Y Y Oesch class scheme (4 categories). Oesch (2006, p82-3). 19 MN Y Y Manual / Non-Manual dichotomy (using ISCO-88 recode)
20 CM Y Y Male CAMSIS scale scores, national scales / units 21 CF Y Y Female CAMSIS scale scores, national scales / units 22 CM2 Y Male CAMSIS scales scores, national scales / ISCO 23 CF2 Y Male CAMSIS scales scores, national scales / ISCO 24 CG Y Chan-Goldthorpe Status-scale scores (dimension 1 from Chan and
Goldthorpe 2004) 25 ISEI Y Y ISEI : International Socio-Economic Status scale from ISCO88 (using
Ganzeboom et al 2003, 2007) 26 SIOP Y Y SIOPS : Standard International Occupational Prestige Scale scores, ISCO88
(using Ganzeboom et al 2003, 2007) 27 AWM Y Y Average Wage Mobility score: Estimated average wage mobility for
occupational units in Sweden (see Bihagen and Ohls 2006). For Britain, scores are calculated from Swedish data via ISCO88
28 WG1 Y Average wage of occupation - in Sweden, predicted by OLS controlling for age, gender, 1999 data
29 WG2 Y Average Wage of occupation - in Sweden, predicted by OLS controlling for age, gender, 2003 data
30 WG3 Y Average Wage of occupation - for male full time wage of occupation in Britain, using 1992 Labour Force Survey at SOC-90 2-digit level
31 GN1 Y Y Gender segregation index. Average percent of women in each occupational unit group. For Britain, averages for SOC-90 unit groups in 1991, using Hakim (1998).
21
Table A.1 Descriptive statistics for British analytical sample Adults aged 23-55 interviewed in 1991 with full life history data to 2002 by gender and age at interview in 1991 Males Females 23-33 34-44 45-55 n (N) 23-33 34-44 45-55 n (N) Employee (10+ hrs/wk) 75 72 67 1142 64 62 63 1208 Self-employed 12 17 19 249 4 8 7 111 Not working (or < 10hrs) 13 11 15 206 37 30 31 650 (1597) (1969) by gender and employment status in 1991 Males Females Empye. S-E N/W %mg Empye. S-E N/W %mg Pct. married or cohabiting 82 84 69 0 78 87 82 0 Mean (sd) school leaving age (truncated at age 26)
17.9 (3.1)
17.8 (3.2)
17.3 (3.1)
2 17.8 (3.1)
18.4 (3.5)
17.0 (2.6)
1
Highest qualifications (%): 3 1 Low school or below 21 24 38 23 21 42 Higher school level 33 34 30 38 32 33 Vocational 18 17 10 12 20 10 Degree/Diploma 25 22 17 27 27 14 Mean work experience yrs, to 1991
19.6 21.7 17.8 4 16.0 16.5 13.1 3
Mean work experience yrs, in current job, to 1991
5.7 7.4 n/a 0 4.2 6.7 n/a 0
Unemployment 1991-2002 0 0 Pct any Un. in period 27.5 22.5 68.4 23.2 16.2 31.2 Pct cumulative Un. >= 1 yr 8.8 8.8 47.1 5.5 7.2 12.3 Un. Incidence (time Un / time Un or working)*100
3.4
2.3
33.8
2.3
2.1
10.6
Mean Un duration (ln.days in Un. between 1991-2002)
1.5
1.2
4.4
1.2
0.9
1.7
%mg = Percent of all valid case with missing data on this variable (0 by definition for unemployment on analytical file)

22
Table A.2 Descriptive statistics for British random sample Adults aged 23-55 interviewed in 1991 by gender and age at interview in 1991 Males Females 23-33 34-44 45-55 n (N) 23-33 34-44 45-55 n (N) Employee (10+ hrs/wk) 72 67 64 1980 58 62 60 1897 Self-employed 12 19 19 482 4 6 7 178 Not working (or < 10hrs) 16 14 17 448 38 31 34 1095 (2910) (3170) by gender and employment status in 1991 Males Females Empye. S-E N/W %mg Empye. S-E N/W %mg Pct. married or cohabiting 79 83 64 0 77 85 76 0 Mean (sd) school leaving age (truncated at age 26)
17.8 (3.0)
17.6 (3.1)
17.2 (3.1)
4 17.8 (3.1)
18.3 (3.3)
16.8 (2.5)
2
Highest qualifications (%): 5 2 Low school or below 24 26 36 25 20 45 Higher school level 32 31 28 36 36 30 Vocational 17 17 12 12 16 10 Degree/Diploma 22 20 16 25 25 12 Mean work experience yrs, to 1991
17.8 19.9 16.6 10 14.9 15.5 12.8 9
Mean work experience yrs, in current job, to 1991
5.8 8.0 n/a 0 4.3 6.3 n/a 0
Unemployment 1991-2002 45 38 %mg = Percent of all valid case with missing data on this variable Unemployment: observed percentages for random sample are equal to those of analytical sample

23
Table A.3 Descriptive statistics for Swedish random sample Adults aged 23-55 interviewed in 1991 by gender and age at interview in 1991 Males Females 23-33 34-44 45-55 n (N) 23-33 34-44 45-55 n (N) col. % col. % Employee (10+ hrs/wk) 70 71 70 1224 55 69 69 1046 Self-employed (10+ hr/wk) 7 14 14 202 2 5 6 66 Not working or < 10hrs 23 15 16 316 44 27 25 519 (1742) (1631) by gender and employment status in 1991 Males Females Empye. S-E N/W %mg Empye. S-E N/W %mg % married or cohabiting 74 78 57 0 76 79 79 0 Mean (sd) years of educ. (truncated at 24yrs)
11.9 (3.3)
11.7 (3.1)
11.6 (3.6)
0* 11.8 (3.0)
11.9 (2.9)
11.4 (3.2)
0*
Highest qualifications (%): Lower gymnasium 68 73 69 0 70 71 75 0 Higher gymnasium 19 19 24 20 15 19 Academic 13 8 7 10 14 5 Mean work experience yrs, to 1991
18.9 21.3 15.9 0* 16.6 19.7 13.1 0*
Mean work experience yrs, in current job, to 1991
10.3 n/a n/a 14* 9.0 n/a n/a 11*
Unemployment 1991-2002 Pct any Un. in period 35.9 43.1 54.7 0 38.9 45.4 51.6 0 Pct cumulative Un. >= 1 yr 25.6 27.2 41.3 29.3 36.4 39.1 Mean Un duration (ln.days in Un. between 1991-2002)
2.3 2.7 3.6 2.3 3.1 3.4
%mg = Percent of all valid case with missing data on this variable * For work experience: total work experience data is missing for 5% of non-working sample, but is present for all employees / self-employed. Current job work experience is only interpretable for current employees, and is missing for 14% / 11% of the sample of male / female current employees.

24
Figures referred to in the text Figure 1: Screenshot of the GEODE portal www.geode.stir.ac.uk
25
0.1
.2.3
.4.5
.6.7
.8.9
1C
ram
er's
V
ES5
ES2E9
E6E5
E3E2
G11G7
G5G3
G2K4
WRWR9
O17 O8
o4MN
Employemt Status ESeC schemes EGP schemes Skill classification
Wright schemes Oesch schemes Manual / Non-manual
Britain0
.1.2
.3.4
.5.6
.7.8
.91
Cra
mer
's V
ES5
ES2E9
E6E5
E3E2
G11G7
G5G3
G2K4
WRWR9
O17 O8
o4MN
Men Women
Sweden
Source: Data and schemes as Table 1. Bars show average association between all types of measures, for men and women. Points show individual associations with alternative schemes (excluding perfect correlations). Occupation-based social classifications as listed in Table 3.1.
Categorical - Categorical relations, Cramer's V statisticsFigure 2.1: Association statistics for categorical schemes

26
0.1
.2.3
.4.5
.6.7
.8.9
1C
orre
latio
n
CM
CFCM2
CF2CG
ISEISIOP
AWMWG1
WG2WG3
GN1
CAMSIS / CG Scale ISEI SIOPS
AWM Income averages Gender segregation
Britain0
.1.2
.3.4
.5.6
.7.8
.91
Cor
rela
tion
CM
CFCM2
CF2CG
ISEISIOP
AWMWG1
WG2WG3
GN1
Men Women
Sweden
Source: Data and schemes as Table 1. Bars show average association between all types of measures, for men and women. Points show individual associations with alternative schemes. Occupation-based social classifications as listed in Table 3.1.
Metric-Metric relations, Linear correlationsFigure 2.2: Association statistics for metric scales

27
0.1
.2.3
.4.5
.6.7
.8.9
1A
nova
R
ES5
ES2E9
E6E5
E3E2
G11G7
G5G3
G2K4
WRWR9
O17 O8
o4MN
CAMSIS / CG Scale ISEI SIOPS
AWM Income averages Gender segregation
Britain0
.1.2
.3.4
.5.6
.7.8
.91
Ano
va R
ES5
ES2E9
E6E5
E3E2
G11G7
G5G3
G2K4
WRWR9
O17 O8
o4MN
Men Women
Sweden
Source: Data and schemes as Table 1. Bars show average association between all types of measures, for men and women. Points show individual associations with alternative schemes. Occupation-based social classifications as listed in Table 3.1.
Categorical-Metric relations, Anova RFigure 2.3: Association statistics (3)

28
Men (categorical social classifications)
0.1
.2.3
.4.5
.6.7
.8.9
1R
or p
seud
o-R
ES5
E9
E6E5
E3E2
G11G7
G5G3
G2K4
WRWR9
O17 O8
o4MN
Promotion / retention Pay - bonus / increments Hours and level of monitoring
Labour contract type Subjective skill requirements
Men (metric social classifications)
0.1
.2.3
.4.5
.6.7
.8.9
1R
or p
seud
o-R
CM
CFCM2
CF2CG
ISEISIOP
AWMWG1
WG2WG3
GN
Britain Sweden
Source: Data and schemes as Table 1. Employees only. Points show regression correlation for alternative schemes in predicting ERC measures. (Pseudo-R for categorical, R for metric ERC's). Bars show indicative averages for all ERCs. Occupation-based social classifications as listed in Table 3.1.
Associations with alternative social classificationsFigure 2.4: Employment Relations and Conditions

29
Men (categorical social classifications)0
.1.2
.3.4
.5.6
.7R
or p
seud
o-R
ES5
E9
E6E5
E3E2
G11G7
G5G3
G2K4
WRWR9
O17 O8
o4MN
Promotion / retention Pay - bonus / increments
Hours and level of monitoring Subjective skill requirements
Men (metric social classifications)
0.1
.2.3
.4.5
.6.7
R o
r pse
udo-
R
CM
CFCM2
CF2CG
ISEISIOP
AWMWG1
WG2WG3
GN
Britain Sweden
Source: Data and schemes as Table 1. Employees only. Points show regression correlation explained by alternative schemes in predicting ERC measures. (Pseudo-R for categorical, R for metric ERC's). Bars show indicative averages for all ERCs. Occupation-based social classifications as listed in Table 3.1.
Associations with alternative social classificationsFigure 2.4b: Employment Relations / Conditions (excluding contract data)

30
Women (categorical social classifications)
0.1
.2.3
.4.5
.6.7
.8.9
1R
or p
seud
o-R
ES5
E9
E6E5
E3E2
G11G7
G5G3
G2K4
WRWR9
O17 O8
o4MN
Promotion / retention Pay - bonus / increments Hours and level of monitoring
Labour contract type Subjective skill requirements
Women (metric social classifications)
0.1
.2.3
.4.5
.6.7
.8.9
1R
or p
seud
o-R
CM
CFCM2
CF2CG
ISEISIOP
AWMWG1
WG2WG3
GN
Britain Sweden
Source: Data and schemes as Table 1. Employees only. Points show regression correlation by alternative schemes in predicting ERC measures. (Pseudo-R for categorical, R for metric ERC's). Bars show indicative averages for all ERCs. Occupation-based social classifications as listed in Table 3.1.
Associations with alternative social classificationsFigure 2.5: Employment Relations and Conditions
31
Women (categorical social classifications)0
.1.2
.3.4
.5.6
.7R
or p
seud
o-R
ES5
E9
E6E5
E3E2
G11G7
G5G3
G2K4
WRWR9
O17 O8
o4MN
Promotion / retention Pay - bonus / increments Hours and level of monitoring
Labour contract type Subjective skill requirements
Women (metric social classifications)
0.1
.2.3
.4.5
.6.7
R o
r pse
udo-
R
CM
CFCM2
CF2CG
ISEISIOP
AWMWG1
WG2WG3
GN
Britain Sweden
Source: Data and schemes as Table 1. Employees only. Points show regression correlation by alternative schemes in predicting ERC measures. (Pseudo-R for categorical, R for metric ERC's). Bars show indicative averages for all ERCs. Occupation-based social classifications as listed in Table 3.1.
Associations with alternative social classificationsFigure 2.5b: Employment Relations / Conditions (excluding contract data)
32
Men and Women (categorical social classifications)
0.1
.2.3
.4.5
.6.7
.8.9
1R
or p
seud
o-R
ES5
E9
E6E5
E3E2
G11G7
G5G3
G2K4
WRWR9
O17 O8
o4MN
Promotion / retention Pay - bonus / increments Hours and level of monitoring
Labour contract type Subjective skill requirements
Men and Women (metric social classifications)
0.1
.2.3
.4.5
.6.7
.8.9
1R
or p
seud
o-R
CM
CFCM2
CF2CG
ISEISIOP
AWMWG1
WG2WG3
GN
Britain Sweden
Source: Data and schemes as Table 1. Employees only. Points show regression correlation by alternative schemes in predicting ERC measures. (Pseudo-R for categorical, R for metric ERC's). Bars show indicative averages for all ERCs. Occupation-based social classifications as listed in Table 3.1.
Associations with alternative social classificationsFigure 2.6: Employment Relations and Conditions

33
Men and Women (categorical social classifications)0
.1.2
.3.4
.5.6
.7R
or p
seud
o-R
ES5
E9
E6E5
E3E2
G11G7
G5G3
G2K4
WRWR9
O17 O8
o4MN
Promotion / retention Pay - bonus / increments Hours and level of monitoring
Labour contract type Subjective skill requirements
Men and Women (metric social classifications)
0.1
.2.3
.4.5
.6.7
R o
r pse
udo-
R
CM
CFCM2
CF2CG
ISEISIOP
AWMWG1
WG2WG3
GN
Britain Sweden
Source: Data and schemes as Table 1. Employees only. Points show regression correlation by alternative schemes in predicting ERC measures. (Pseudo-R for categorical, R for metric ERC's). Bars show indicative averages for all ERCs. Occupation-based social classifications as listed in Table 3.1.
Associations (excluding labour contract measures)Figure 2.6b: Employment Relations / Conditions (excluding contract data)
34
Males, Britain-2-1
01
2
Females, Britain
-2-1
01
23
Males, Sweden
-2-1
01
2Hi
gher
sal
aria
tLo
wer s
alar
iat
Inte
rmed
iate
Smal
l Sel
f-em
p
Farm
ers
Low.
sup
./tec
hnic
Low.
ser
v./c
ler.
Low.
tech
nica
l
Rout
ine
Females, Sweden
-10
12
3
Ever experienced unemployment 1991-2002 Unemployment incidence rate
1 year or more unemployed Log of total unemployment
Source: LNU and BHPS 1991-2002, adults 23-55yrs in work 1991, N=2709 Britain, 2538 Sweden. Graph shows regression coefficients of ESeC categories, and quasi-variance comparison intervals.Null models - ESeC categories are only predictors. Unweighted data.
Comparison intervals for ESeC categories, by unemployment measureFigure 3.1: Predictions of Unemployment risk, 1991-2002
35
-10
12
Manufacturing Private sector services Public sector services
Britain, Men Britain, Women Sweden, Men Sweden, Women
Source: As Figure 3.1, LNU, 1991-2002 and BHPS 1991-2002, all adults aged 23-55 in work in 1991. Graph shows regression coefficients of Industry category dummies, with 'quasi-variance' comparison intervals.
Experiences 1 year or more of unemploymentFigure 3.2: Unemployment by Industry categories
0.1
.2.3
.4.5
20 40 60 80CAMSIS scale score
Britain, Men Britain, Women Sweden, Men Sweden, Women
Source: As Figure 3.1, LNU, 1991-2002 and BHPS 1991-2002, all adults aged 23-55 in work in 1991. Graph shows regression predicted values. Confidence intervals omitted for clarity.
Probability that experiences 1 year of more unemployment within 1991-2002Figure 3.3: Unemployment by CAMSIS scale score
36
-.01
.01
.03
.05
.07
.09
NullES5
ES2E9
E6E5
E3E2
G11G7
G5G3
G2K4
WRWR9
O17O8
O4MN
CMCF
CGISEI
SIOPAWM
WG3
GN
Pseudo R-squared Increase in BIC
Britain, Males-.0
6-.0
4-.0
20
.02
.04
.06
NullES5
ES2E9
E6E5
E3E2
G11G7
G5G3
G2K4
WRWR9
O17O8
O4MN
CMCF
CM2CF2
ISEI
SIOPAWM
WG1WG2
GN
Sweden, Males
Source: BHPS and LNU 1991-2002, males aged 23-55 in work in 1991, N=1390 Britain, 1426 Sweden. Graph shows pseudo-R2 for logit model including only the occupation-based social classification and scaled BIC statistic (BIC - Null BIC / Null BIC). Unweighted data.
Explanatory power of schemes in predicting 1+ year Unemp., 1991-2002Figure 3.4a: R-2 and BIC for predicted unemployment risk

37
-.01
.01
.03
.05
.07
.09
NullES5
ES2E9
E6E5
E3E2
G11G7
G5G3
G2K4
WRWR9
O17O8
O4MN
CMCF
CGISEI
SIOPAWM
WG3
GN
Pseudo R-squared Increase in BIC
Britain, Females-.0
4-.0
20
.02
.04
.06
NullES5
ES2E9
E6E5
E3E2
G11G7
G5G3
G2K4
WRWR9
O17O8
O4MN
CMCF
CM2CF2
ISEI
SIOPAWM
WG1WG2
GN
Sweden, Females
Source: LNU and BHPS 1991-2002, females aged 23-55 in work in 1991, N=1319 Britain, 1112 Sweden. Graph shows pseudo-R2 for logit model including only the occupation-based social classification and scaled BIC statistic (BIC - Null BIC / Null BIC). Unweighted data.
Explanatory power of schemes in predicting 1+ year Unemp., 1991-2002Figure 3.4b: R-2 and BIC for predicted unemployment risk

38
-.01
.01
.03
.05
.07
.09
NullES5
ES2E9
E6E5
E3E2
G11G7
G5G3
G2K4
MN
CMCF
CGISEI
SIOPAWM
WG3
GN
Pseudo R-squared Increase in BIC
Britain, Males (Father's effects)-.0
1.0
1.0
3.0
5
NullES5
ES2E9
E6E5
E3E2
G11G7
G5G3
G2K4
MN
CMCF
CM2CF2
ISEI
SIOPAWM
WG1WG2
GN
Sweden, Males (Father's effects)
Source: As Figure 3.4a, males with valid parental occ data, N=1249 Britain, 1402 Sweden. Graph shows pseudo-R2 for logit model including only the occupation-based social classification and scaled BIC statistic (BIC - Null BIC / Null BIC). Unweighted data.
Explanatory power of father's scheme (1+ year Unemp., 1991-2002)Figure 3.4c: R-2 and BIC for predicted unemployment risk
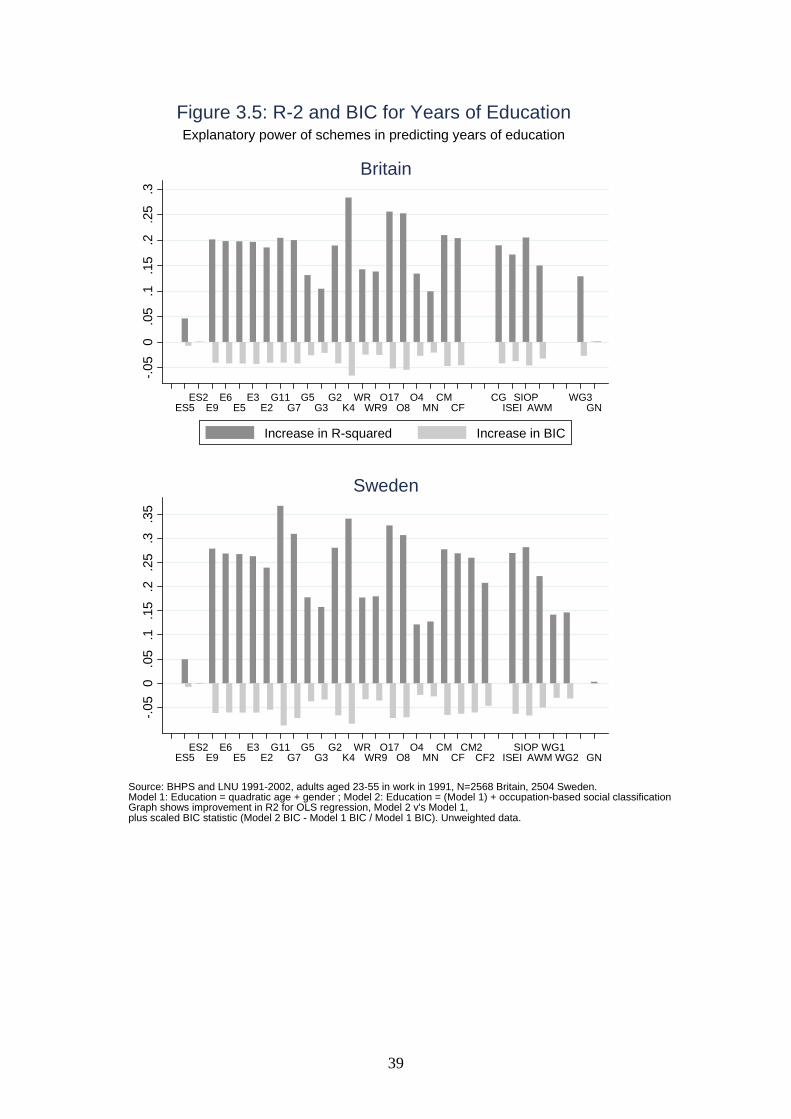
39
-.05
0.0
5.1
.15
.2.2
5.3
ES5
ES2E9
E6E5
E3E2
G11G7
G5G3
G2K4
WRWR9
O17O8
O4MN
CMCF
CGISEI
SIOPAWM
WG3
GN
Increase in R-squared Increase in BIC
Britain-.0
50
.05
.1.1
5.2
.25
.3.3
5
ES5
ES2E9
E6E5
E3E2
G11G7
G5G3
G2K4
WRWR9
O17O8
O4MN
CMCF
CM2CF2
ISEI
SIOPAWM
WG1WG2
GN
Sweden
Source: BHPS and LNU 1991-2002, adults aged 23-55 in work in 1991, N=2568 Britain, 2504 Sweden. Model 1: Education = quadratic age + gender ; Model 2: Education = (Model 1) + occupation-based social classificationGraph shows improvement in R2 for OLS regression, Model 2 v's Model 1,plus scaled BIC statistic (Model 2 BIC - Model 1 BIC / Model 1 BIC). Unweighted data.
Explanatory power of schemes in predicting years of educationFigure 3.5: R-2 and BIC for Years of Education

40
-.005
0.0
05.0
1.0
15.0
2.0
25.0
3
ES5
ES2E9
E6E5
E3E2
G11G7
G5G3
G2K4
WRWR9
O17O8
O4MN
CMCF
CGISEI
SIOPAWM
WG3
GN
Increase in R-squared Increase in BIC
Britain-.0
15-.0
05.0
05.0
15.0
25.0
35
ES5
ES2E9
E6E5
E3E2
G11G7
G5G3
G2K4
WRWR9
O17O8
O4MN
CMCF
CM2CF2
ISEI
SIOPAWM
WG1WG2
GN
Sweden
Source: BHPS and LNU 1991-2002, adults aged 23-55 in work in 1991, N=2568 Britain, 2504 Sweden. Model 1: Health = quadratic age + gender + age*gender; Model 2: Health = (Model 1) + occupation-based social classificationGraph shows improvement in Pseudo R2 for Logistic regression, Model 2 v's Model 1,plus scaled BIC statistic (Model 2 BIC - Model 1 BIC / Model 1 BIC). Unweighted data.
Explanatory power of schemes in predicting poor subjective healthFigure 3.6: R-2 and BIC for Poor Subjective Health
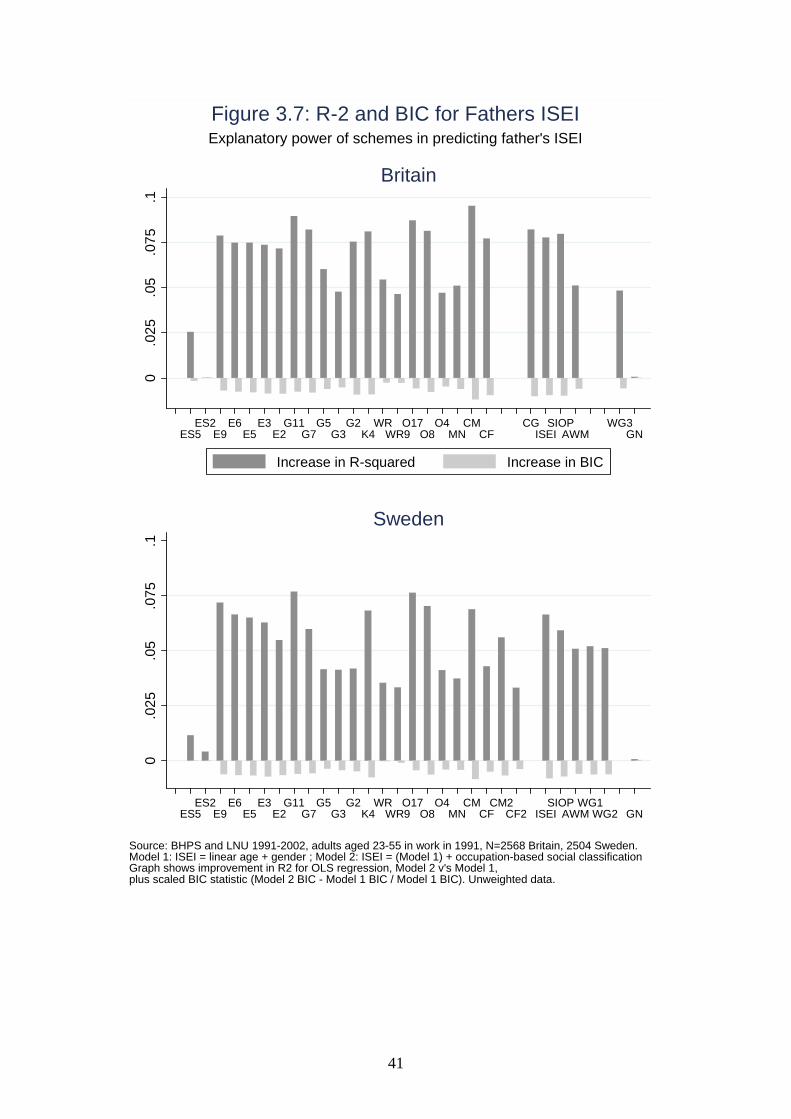
41
0.0
25.0
5.0
75.1
ES5
ES2E9
E6E5
E3E2
G11G7
G5G3
G2K4
WRWR9
O17O8
O4MN
CMCF
CGISEI
SIOPAWM
WG3
GN
Increase in R-squared Increase in BIC
Britain0
.025
.05
.075
.1
ES5
ES2E9
E6E5
E3E2
G11G7
G5G3
G2K4
WRWR9
O17O8
O4MN
CMCF
CM2CF2
ISEI
SIOPAWM
WG1WG2
GN
Sweden
Source: BHPS and LNU 1991-2002, adults aged 23-55 in work in 1991, N=2568 Britain, 2504 Sweden. Model 1: ISEI = linear age + gender ; Model 2: ISEI = (Model 1) + occupation-based social classificationGraph shows improvement in R2 for OLS regression, Model 2 v's Model 1,plus scaled BIC statistic (Model 2 BIC - Model 1 BIC / Model 1 BIC). Unweighted data.
Explanatory power of schemes in predicting father's ISEIFigure 3.7: R-2 and BIC for Fathers ISEI

42
0.0
25.0
5
E9
E3G11
G7K4
CMISEI
AWM
Decrease in log-like
Increase in BIC
with additional explanatory variablesModel 1
0.0
25.0
5.0
75
E9
E3G11
G7K4
CMISEI
AWM
Model 1 plus industry indicator variablesModel 2
0.0
25
E9
E3G11
G7K4
CMISEI
AWM
Heckman selection, Industry = public sector servicesModel 3
0.0
25
E9
E3G11
G7K4
CMISEI
AWM
Heckman selection, Industry = private manufacturingModel 4
Source: BHPS, males aged 23-55 in work in 1991, N=1319. Outcome variable: Whether expereinced one year or more of unemployment 1991-2002Graphs show incremental explanation associated with occupation-based social classificationModels 3 and 4 selection equation predictors: age, education, total work experience, regionModels 3 and 4 process equation predictors: marital studus, education, work experience in current jobGraph shows improvement in log-likelihood in model with and without occupation-based social classifications plus scaled BIC statistic (Model BIC - null Model BIC / null Model 1 BIC). Unweighted data.
Explanatory power of schemes, given alternative additional controlsFigure 4.1: Unemployment risks (British men)

43
0.0
25.0
5
E9
E3G11
G7K4
CMISEI
AWM
Decrease in log-like
Increase in BIC
with additional explanatory variablesModel 1
0.0
25.0
5
E9
E3G11
G7K4
CMISEI
AWM
Model 1 plus industry indicator variablesModel 2
0.0
25
E9
E3G11
G7K4
CMISEI
AWM
Heckman selection, Industry = public sector servicesModel 3
0.0
25
E9
E3G11
G7K4
CMISEI
AWM
Heckman selection, Industry = private manufacturingModel 4
Source: LNU, males aged 23-55 in work in 1991, N=1112. Outcome variable: Whether expereinced one year or more of unemployment 1991-2002Graphs show incremental explanation associated with occupation-based social classificationModels 3 and 4 selection equation predictors: age, education, total work experience, regionModels 3 and 4 process equation predictors: marital studus, education, work experience in current jobGraph shows improvement in log-likelihood in model with and without occupation-based social classifications plus scaled BIC statistic (Model BIC - null Model BIC / null Model 1 BIC). Unweighted data.
Explanatory power of schemes, given alternative additional controlsFigure 4.2: Unemployment risks (Swedish men)

44
References Abbott, A. (2006). Mobility: What? When? How? In S. L. Morgan, D. B. Grusky & G. S.
Fields (Eds.), Mobility and Inequality. Stanford: Stanford University Press. Allison, P. D. (2002). Missing Data. Thousand Oaks, Ca: Sage. Armstrong, W. M. (1972). The use of information about occupation. In E. A. Wrigley (Ed.),
Nineteenth Century Society: Essays in the use of quantitative methods for the study of social data (pp. 191-310). Cambridge: Cambridge University Press.
Bechhofer, F. (1969). Occupations. In M. Stacey (Ed.), Comparability in Social Research (pp. 94-122). London: Heinemann (in association with British Sociological Association / Social Science Research Council).
Beck, U. (2000). The Brave New World of Work. Cambridge: Polity Press. Bihagen, E., & Ohls, M. (2007). Are Women Over-represented in Dead-End Jobs: A Swedish
study using empirically derived measures of dead-end jobs. Social Indicators Research, in press.
Birkelund, G. E., Goodman, L. A., & Rose, D. (1996). The latent structure of job characteristics of men and women. American Journal of Sociology, 102(1), 80-113.
Bottero, W., & Prandy, K. (2003). Social interaction distance and stratification. British Journal of Sociology, 54(2), 177-197.
Chan, T. W., & Goldthorpe, J. H. (2004). Is There a Status Order in Contemporary British Society. European Sociological Review, 20(5), 383-401.
Chan, T. W., & Goldthorpe, J. H. (2007). Class and Status: The Conceptual Distinction and its Empirical Relevance. American Sociological Reivew, 72, 512-532.
Charles, M., & Grusky, D. B. (2005). Occupational Ghettos: The Worldwide Segregation of Women and Men. Stanford: Stanford University Press.
Devine, F. (2004). Class Practices: How parents help their children get good jobs. Cambridge: Cambridge University Press.
Dumont, M. (2006). The reliability - or lack thereof - of data on skills. Economics Letters, 93(3), 348-353.
Elias, P. (1996). Occupational Classification ISCO-88 : Concepts, Methods, Reliability, Validity and Cross-National Comparability. Paris: OECD.
Elias, P., & McKnight, A. (2003). Earnings, Unemployment and the NS-SEC. In D. Rose & D. J. Pevalin (Eds.), A Researcher's Guide to the National Statistics Socio-Economic Classification. London: Sage.
Evans, G., & Mills, C. (1998). Identifying class structure : A latent class analysis of the criterion-related and construct validity of the Goldthorpe class schema. European Sociological Review, 14(1), 87-106.
Evans, G., & Mills, C. (2000). In search of the wage-labour/service contract: new evidence on the validity of the Goldthorpe class schema. British Journal of Sociology, 51(4), 641-661.
Ganzeboom, H. B. G. (2005). On the Cost of Being Crude: A Comparison of Detailed and Coarse Occupational Coding. In J. H. P. Hoffmeyer-Zlotnick & J. Harkness (Eds.), Methodological Aspects in Cross-National Research (pp. 241-257). Mannheim: ZUMA, Nachrichten Spezial.
Ganzeboom, H. B. G. (2007). Tools for deriving status measures from ISKO-88 and ISCO-68. Retrieved 1 June, 2007, from http://home.fsw.vu.nl/~ganzeboom/PISA/
Ganzeboom, H. B. G., & Treiman, D. J. (2003). Three internationally standarised measures for comparative research on occupational status. In J. H. P. Hoffmeyer-Zlotnick & C. Wolf (Eds.), Advances in Cross-National Comparison. A European Working Book for Demographic and Socio-Economic Variables (pp. 159-193). New York: Kluwer Academic Press.
45
Gershuny, J. (2002). Beating the Odds (1): Inter-generational Social Mobility from a Human Capital Perspective. Colchester: Working paper 2002-17 of the Institute of Social and Economic Research, University of Essex.
Goertz, G. (2006). Social Science Concepts: A users guide. Princeton: Princeton University Press.
Goldthorpe, J. H. (2007). On Sociology, Second Editon: Volume Two - Illustration and Retrospect. Stanford: Stanford University Press.
Goldthorpe, J. H., & McKnight, A. (2006). The Economic Basis of Social Class. In S. L. Morgan, D. B. Grusky & G. S. Fields (Eds.), Mobility and Inequality. Stanford: Stanford University Press.
Grusky, D. B., & Kanbur, R. (Eds.). (2006). Poverty and Inequality. Stanford: Stanford University Press.
Grusky, D. B., & Weeden, K. A. (2006). Does the scoilogical approach to studying social mobility have a future? In S. L. Morgan, D. B. Grusky & G. S. Fields (Eds.), Mobility and Inequality. Stanford Stanford University Press.
Hakim, C. (1998). Social Change and Innovation in the Labour Market : Evidence from the Census SARs on Occupational Segregation and Labour Mobility, Part-Time work and Student Jobs, Homework and Self-Employment. Oxford: Oxford University Press.
Halpin, B. (2006). British Household Panel Survey Combined Work-Life History Data, 1990-2005 [computer file]. 5th ed. Colchester, Essex: Institute for Social and Economic Research, [original data producer(s)]. UK Data Archive [distributor], November 2006. SN: 3954. .
Hauser, R. M., & Warren, J. R. (1997). Socioeconomic indexes for occupations: A review, update, and critique. Sociological Methodology 1997, Vol 27, 27, 177-298.
Heath, A. F., Martin, J., & Beerten, R. (2003). Old and New Social Class Measures. In D. a. P. D. J. Rose (Ed.), A Researcher's Guide to the National Statistics Socio-Economic Classification (pp. 226-243). London: Sage.
Hoffmeyer-Zlotnik, J. H. P., & Wolf, C. (Eds.). (2003). Advances in Cross-national Comparison: A European Working Book for Demographic and Socio-economic Variables. Berlin: Kluwer Academic / Plenum Publishers.
Hout, M., & DiPrete, T. A. (2006). What we have learned: RC28s contributions to knowledge about social stratification. Research into Social Stratification and Mobility, 24, 1-20.
Korpi, T., & Stenberg, S.-A. (2001). Massarbetslöshetens Sverige: Arbetslöshetens karaktär och effekter på individers levnadsförhållanden. In J. Fritzell, M. Gähler & O. Lundberg (Eds.), Välfärd och arbete i arbetslöshetens årtionde (Welfare and work in the decade of unemployment), SOU 2001:53. Stockholm: Fritzes.
Lambert, P. S. (2007). GEODE - Grid Enabled Occupational Data Environment. Retrieved 1 June, 2007, from http://www.geode.stir.ac.uk/
Lambert, P. S., & Prandy, K. (2007). CAMSIS project webpages: Cambridge Social Interaction and Stratification Scales. Retrieved 1 June, 2007, from http://www.camsis.stir.ac.uk/
Lambert, P. S., Tan, K. L. L., Gayle, V., Prandy, K., & Turner, K. J. (2008). The importance of specificity in occupation-based social classifications. International Journal of Sociology and Social Policy, forthcoming, preprint: http://www.geode.stir.ac.uk/publications.html.
Lambert, P. S., Tan, K. L. L., Turner, K. J., Gayle, V., Prandy, K., & Sinnott, R. O. (2007). Data Curation and Social Science Occupational Information Resources. International Journal of Digital Curation, 2(1), 73-91.
Leiulfsrud, H., Bison, I., & Jensberg, H. (2005). Social Class in Europe: European Social Survey 2002/3. Trondheim: NTNU Samfunnsforskning/NTNU Social Research Ltd.
Levin, H. (1996). Vår bild av arbetslösheten. Arbetsmarknad & Arbetsliv, 2, 115-123. Marshall, G., Rose, D., Newby, H., & Vogler, C. (1988). Social Class in Modern Britain.
London: Routledge.

46
Mills, C., & Evans, G. (2002). Employment Relations, Employment Conditions and the NS-SEC. In D. Rose & D. J. Pevalin (Eds.), A Researchers Guide to the National Statistics Socio-economic Classification (pp. 77-106). London: Sage.
Morgan, S. L., Grusky, D. B., & Fields, G. S. (Eds.). (2006). Mobility and Inequality: Frontiers of Research in Sociology and Economics. Stanford: Stanford University Press.
Oesch, D. (2006). Redrawing the Class Map: Stratification and Institutions in Britain, German, Sweden and Switzerland. Basingstoke: Palgrave.
OPCS. (1990). Standard Occupational Classification, Volume 1: Structure and definition of major, minor and unit groups. London: Office for Population Censuses and Surveys.
Pakulski, J., & Waters, M. (1996). The Death of Class. London: Sage. Prandy, K. (2002). Ideal types, stereotypes and classes. British Journal of Sociology, 53(4),
583-601. Prandy, K., & Lambert, P. S. (2003). Marriage, Social Distance and the Social Space: An
alternative derivation and validation of the Cambridge Scale. Sociology, 37(3), 397-411.
Raftery, A. E. (1986). Choosing Models for Cross-Classifications. American Sociological Review, 51(1), 145-146.
Rodriguez, J. (2008). A New Indicator of Technical Complexity at Work. International Journal of Sociology and Social Policy, forthcoming.
Rose, D., & Harrison, E. (2007). The European Socio-economic Classification: A New Social Class Scheme for Comparative European Research. European Societies, 9(3), 459-490.
Rose, D., & O'Reilly, K. (Eds.). (1997). Constructing Classes : Towards a New Social Classification for the UK. Colchester: University of Essex.
Rose, D., Pevalin, D., & O'Reilly, K. (2005). The NS-SEC: Origins, Development and Use. Basingstoke: Palgrave Macmillan.
Rose, D., & Pevalin, D. J. (Eds.). (2003). A Researcher's Guide to the National Statistics Socio-economic Classification. London: Sage.
Rytina, S. (2000). Is occupational mobility declining in the United States? Social Forces, 78(4), 1227-1276.
Schizzerotto, A., Barone, R., & Arosio, L. (2006). Unemployment risks in four European countries: an attempt of testing the construct validity of the ESeC scheme. Bled, Slovenia, and http://www.iser.essex.ac.uk/esec/: Paper presented to the Workshop on the Application of ESeC within the European Union and Candidate Countries, 29-30 June 2006.
Shaw, M., Galobardes, B., Lawlor, D. A., Lynch, J., Wheeler, B., & Davey Smith, G. (2007). The Handbook of Inequality and Socioeconomic Position: Concepts and Measures. Bristol: Policy Press.
Steuer, M. (2003). The Scientific Study of Society. Boston: Kluwer Academic. Svallfors, S. (Ed.). (2005). Analyzing Inequality. Stanford: Stanford University Press. University of Essex, & Institute for Social and Economic Research. (2007). British Household
Panel Survey: Waves 1-15, 1991-2006 [computer file]. 3rd Edition. Colchester, Essex: UK Data Archive [distributor], SN:5151.
Weeden, K. A., & Grusky, D. B. (2005). The Case for a New Class Map. American Journal of Sociology, 111(1), 141-212.
Wright, E. O. (1985). Classes. London: Verso. Wright, E. O. (Ed.). (2005). Approaches to Class Analysis. Cambridge: Cambridge University
Press.