Concentrations of Selected Pharmaceuticals and … of Selected Pharmaceuticals and Antibiotics in...
109
In cooperation with the Pennsylvania Department of Environmental Protection Concentrations of Selected Pharmaceuticals and Antibiotics in South-Central Pennsylvania Waters, March through September 2006 U.S. Department of the Interior U.S. Geological Survey Data Series 300
Transcript of Concentrations of Selected Pharmaceuticals and … of Selected Pharmaceuticals and Antibiotics in...

In cooperation with the Pennsylvania Department of Environmental Protection
Concentrations of Selected Pharmaceuticals and Antibiotics in South-Central Pennsylvania Waters, March through September 2006
U.S. Department of the InteriorU.S. Geological Survey
Data Series 300


Concentrations of Selected Pharmaceuticals and Antibiotics in South-Central Pennsylvania Waters, March through September 2006
By Connie A. Loper, J. Kent Crawford, Kim L. Otto, Rhonda L. Manning1, Michael T. Meyer, and Edward T. Furlong
1Pennsylvania Department of Environmental Protection Bureau of Water Standards and Facility Regulation
In cooperation with the Pennsylvania Department of Environmental Protection
Data Series 300
U.S. Department of the InteriorU.S. Geological Survey

U.S. Department of the InteriorDIRK KEMPTHORNE, Secretary
U.S. Geological SurveyMark D. Myers, Director
U.S. Geological Survey, Reston, Virginia: 2007
For product and ordering information:World Wide Web: http://www.usgs.gov/pubprodTelephone: 1-888-ASK-USGS
For more information on the USGS—the Federal source for science about the Earth,its natural and living resources, natural hazards, and the environment:World Wide Web: http://www.usgs.govTelephone: 1-888-ASK-USGS
Any use of trade, product, or firm names is for descriptive purposes only and does not imply endorsement by the U.S. Government.
Although this report is in the public domain, permission must be secured from the individual copyright owners to reproduce any copyrighted material contained within this report.
Suggested citation:Loper, C.A., Crawford, J.K., Otto, K.L., Manning, R.L., Meyer, M.T., and Furlong, E.T., 2007, Concentrations of selectedpharmaceuticals and antibiotics in south-central Pennsylvania waters, March through September 2006: U.S. GeologicalSurvey Data Series 300, 101 p.

iii
Contents
Abstract . . . . . . . . . . . . . . . . . . . . . . . . . . . . . . . . . . . . . . . . . . . . . . . . . . . . . . . . . . . . . . . . . . . . . . . . . . . 1Introduction . . . . . . . . . . . . . . . . . . . . . . . . . . . . . . . . . . . . . . . . . . . . . . . . . . . . . . . . . . . . . . . . . . . . . . . . 1
Need for the Study . . . . . . . . . . . . . . . . . . . . . . . . . . . . . . . . . . . . . . . . . . . . . . . . . . . . . . . . . . . . . . . 2Purpose of the Report . . . . . . . . . . . . . . . . . . . . . . . . . . . . . . . . . . . . . . . . . . . . . . . . . . . . . . . . . . . . 3Scope of the Report . . . . . . . . . . . . . . . . . . . . . . . . . . . . . . . . . . . . . . . . . . . . . . . . . . . . . . . . . . . . . . 3
Methods . . . . . . . . . . . . . . . . . . . . . . . . . . . . . . . . . . . . . . . . . . . . . . . . . . . . . . . . . . . . . . . . . . . . . . . . . . . 3Site Selection and Sampling Locations . . . . . . . . . . . . . . . . . . . . . . . . . . . . . . . . . . . . . . . . . . . . . 3Streamflow Measurement . . . . . . . . . . . . . . . . . . . . . . . . . . . . . . . . . . . . . . . . . . . . . . . . . . . . . . . . 6Field Water Chemistry . . . . . . . . . . . . . . . . . . . . . . . . . . . . . . . . . . . . . . . . . . . . . . . . . . . . . . . . . . . . 6Water-Quality Sampling and Processing . . . . . . . . . . . . . . . . . . . . . . . . . . . . . . . . . . . . . . . . . . . . 6
Stream Water . . . . . . . . . . . . . . . . . . . . . . . . . . . . . . . . . . . . . . . . . . . . . . . . . . . . . . . . . . . . . . . . 6Well Water . . . . . . . . . . . . . . . . . . . . . . . . . . . . . . . . . . . . . . . . . . . . . . . . . . . . . . . . . . . . . . . . . . 7
Laboratory Analyses . . . . . . . . . . . . . . . . . . . . . . . . . . . . . . . . . . . . . . . . . . . . . . . . . . . . . . . . . . . . . 7Quality Assurance and Quality Control. . . . . . . . . . . . . . . . . . . . . . . . . . . . . . . . . . . . . . . . . . . . . . 8
Quality Control on Field Measurements. . . . . . . . . . . . . . . . . . . . . . . . . . . . . . . . . . . . . . . . . 11Quality Control on Water-Quality Samples . . . . . . . . . . . . . . . . . . . . . . . . . . . . . . . . . . . . . . 11
Blanks . . . . . . . . . . . . . . . . . . . . . . . . . . . . . . . . . . . . . . . . . . . . . . . . . . . . . . . . . . . . . . . 11Duplicates . . . . . . . . . . . . . . . . . . . . . . . . . . . . . . . . . . . . . . . . . . . . . . . . . . . . . . . . . . . . 11Laboratory-Spiked Environmental Samples. . . . . . . . . . . . . . . . . . . . . . . . . . . . . . . . . . . 11Laboratory Quality Control . . . . . . . . . . . . . . . . . . . . . . . . . . . . . . . . . . . . . . . . . . . . . . . . 12
Results for Quality-Control Samples . . . . . . . . . . . . . . . . . . . . . . . . . . . . . . . . . . . . . . . . . . . . . . . . . . 13Blanks. . . . . . . . . . . . . . . . . . . . . . . . . . . . . . . . . . . . . . . . . . . . . . . . . . . . . . . . . . . . . . . . . . . . . . . . . 13Duplicates . . . . . . . . . . . . . . . . . . . . . . . . . . . . . . . . . . . . . . . . . . . . . . . . . . . . . . . . . . . . . . . . . . . . . 13Laboratory-Spiked Environmental Samples. . . . . . . . . . . . . . . . . . . . . . . . . . . . . . . . . . . . . . . . . 13Laboratory Quality Control . . . . . . . . . . . . . . . . . . . . . . . . . . . . . . . . . . . . . . . . . . . . . . . . . . . . . . . 17
Concentrations of Selected Pharmaceuticals and Antibiotics . . . . . . . . . . . . . . . . . . . . . . . . . . . . 20Water Quality in Streams . . . . . . . . . . . . . . . . . . . . . . . . . . . . . . . . . . . . . . . . . . . . . . . . . . . . . . . . 21Water Quality in Wells. . . . . . . . . . . . . . . . . . . . . . . . . . . . . . . . . . . . . . . . . . . . . . . . . . . . . . . . . . . 21Water Quality at All Sites . . . . . . . . . . . . . . . . . . . . . . . . . . . . . . . . . . . . . . . . . . . . . . . . . . . . . . . . 21
Numbers of Detections of Compounds by Season . . . . . . . . . . . . . . . . . . . . . . . . . . . . . . . . . . . . . . 31Summary. . . . . . . . . . . . . . . . . . . . . . . . . . . . . . . . . . . . . . . . . . . . . . . . . . . . . . . . . . . . . . . . . . . . . . . . . . 42Acknowledgments . . . . . . . . . . . . . . . . . . . . . . . . . . . . . . . . . . . . . . . . . . . . . . . . . . . . . . . . . . . . . . . . . 42References Cited. . . . . . . . . . . . . . . . . . . . . . . . . . . . . . . . . . . . . . . . . . . . . . . . . . . . . . . . . . . . . . . . . . . 43Appendix 1.—Records of wells sampled in Adams, Lancaster, Lebanon,
Huntingdon, and Union Counties in 2006 . . . . . . . . . . . . . . . . . . . . . . . . . . . . . . . . . . . . . . . . . . 101
Figures
1. Map showing locations of sampling sites for the study, south-central Pennsylvania . . . . . . . . . . 4

iv
Tables
1. Sampling sites for this study, including site types, U.S. Geological Survey station identification numbers and names, latitude and longitude, and map identification number. . . . . . . .5
2. Field measurements, units, accuracies, and equipment types used for this study. . . . . . . . . . . . . . . . .73. List of target pharmaceutical and antibiotic compounds analyzed at the
U.S. Geological Survey National Water Quality Laboratory in Denver, Colorado . . . . . . . . . . . . . . . . . .94. List of target antibiotic and pharmaceutical compounds analyzed at the
U.S Geological Survey Organic Geochemistry Research Laboratory in Lawrence, Kansas . . . . . .105. Summary of quality-control samples analyzed at the U.S. Geological Survey
National Water Quality Laboratory (NWQL) and Organic Geochemistry Research Laboratory (OGRL). . . . . . . . . . . . . . . . . . . . . . . . . . . . . . . . . . . . . . . . . . . . . . . . . . . . . . . . . . . . . . . . . . . . . . . . . . . . . .12
6. Field chemistry and conditions, pharmaceutical, and antibiotic data, March to September 2006 . . . . . . . . . . . . . . . . . . . . . . . . . . . . . . . . . . . . . . . . . . . . . . . . . . . . . . . . . . . . . . . . . at back of report
7. Relative percent differences (RPD) in concentrations of primary environmental and quality-control sequential and split duplicate samples analyzed at the U.S. Geological Survey (USGS) National Water Quality Laboratory (NWQL) and Organic Geochemistry Research Laboratory (ORGL) . . . . . . . . . . . . . . . . . . . . . . . . . . . . . . . . . . . . . . . . . . . . . . . . . . . .14
8. Pharmaceutical and antibiotic recoveries in the laboratory-spiked environmental sample analyzed at the USGS National Water Quality Laboratory in Denver, Colorado . . . . . . . . . . . . . . . . . .16
9. Antibiotic and pharmaceutical recoveries in the laboratory-spiked environmental sample collected in March 2006 from Snitz Creek and analyzed at the U.S. Geological Survey Organic Geochemistry Research Laboratory in Lawrence, Kansas. . . . . . . . . . . . . . . . . . . . . . . . . . . . . .18
10. Antibiotic and pharmaceutical recoveries in the laboratory-spiked environmental sample collected in May 2006 from Snitz Creek and analyzed at U.S. Geological Survey OrganicGeochemistry Research Laboratory in Lawrence, Kansas . . . . . . . . . . . . . . . . . . . . . . . . . . . . . . . . . . . . . .19
11. Summary statistics for surrogate-spike recoveries by site type from samples collected for this study and from evaluation of long-term recoveries for U.S. Geological Survey National Water Quality Laboratory (NWQL) reagent spikes . . . . . . . . . . . . . . . . . . . . . . . . . . . . . . . . . . . . .20
12. Summary statistics for concentrations of selected pharmaceuticals and antibiotics analyzed at the U.S. Geological Survey National Water Quality Laboratory and Organic Geochemistry Laboratory for stream-water sites, south-central Pennsylvania, 2006. . . . . . . . . . . . .22
13. Summary of numbers of detections for selected pharmaceuticals and antibiotics for stream-water sites, south-central Pennsylvania, 2006 . . . . . . . . . . . . . . . . . . . . . . . . . . . . . . . . . . . . . . .26
14. Summary statistics for concentrations and numbers of detections of pharmaceuticals and antibiotics analyzed at the U.S. Geological Survey National Water Quality and Organic Geochemistry Research Laboratories for well-water sites, south-central Pennsylvania, 2006 . . . . . . . . . . . . . . . . . . . . . . . . . . . . . . . . . . . . . . . . . . . . . . . . . . . . . . . . . . . . . . . . . . . . . . . . . . . . .29
15. Concentration ranges of compounds with detections, numbers of seasonal samples with detections of specific compounds, and number of compounds detected by site . . . . . . . . . . .32
16. Summary of numbers of detections by season at stream-water sites sampled, south-central Pennsylvania, 2006 . . . . . . . . . . . . . . . . . . . . . . . . . . . . . . . . . . . . . . . . . . . . . . . . . . . . . . . . . . . . . . .38
17. Summary of numbers of detections by season at well-water sites sampled, south-central Pennsylvania, 2006 . . . . . . . . . . . . . . . . . . . . . . . . . . . . . . . . . . . . . . . . . . . . . . . . . . . . . . . . . . . . . . .40

v
Conversion Factors
Multiply By To obtain
Length
inch (in.) 2.54 centimeter (cm)
inch (in.) 25.4 millimeter (mm)
foot (ft) 0.3048 meter (m)
mile (mi) 1.609 kilometer (km)
Flow rate
cubic foot per second (ft3/s) 0.02832 cubic meter per second (m3/s)
Temperature in degrees Celsius (°C) may be converted to degrees Fahrenheit (°F) as follows:
°F = (1.8×°C) + 32
Vertical coordinate information is referenced to the North American Vertical Datum of 1988 (NAVD 88).
Horizontal coordinate information is referenced to the North American Datum of 1983 (NAD 83).
Altitude, as used in this report, refers to distance above the vertical datum.
Specific conductance is given in microsiemens per centimeter at 25 degrees Celsius (µS/cm at 25°C).


Concentrations of Selected Pharmaceuticals and Antibiotics in South-Central Pennsylvania Waters, March 2006 through September 2006
1By Connie A. Loper, J. Kent Crawford, Kim L. Otto, Rhonda L. Manning , Michael T. Meyer, and Edward T. Furlong
Abstract
This report presents environmental and quality-control data from analyses of 15 pharmaceutical and 31 antibiotic com-pounds in water samples from streams and wells in south-cen-tral Pennsylvania. The analyses are part of a study by the U.S. Geological Survey (USGS) in cooperation with the Pennsylva-nia Department of Environmental Protection (PADEP) to define concentrations of selected emerging contaminants in streams and well water in Pennsylvania. Sampling was con-ducted at 11 stream sites and at 6 wells in 9 counties of south-central Pennsylvania. Five of the streams received municipal wastewater and 6 of the streams received runoff from agricul-tural areas dominated by animal-feeding operations. For all 11 streams, samples were collected at locations upstream and downstream of the municipal effluents or animal-feeding oper-ations. All six wells were in agricultural settings.
A total of 120 environmental samples and 21 quality-con-trol samples were analyzed for the study. Samples were col-lected at each site in March/April, May, July, and September 2006 to obtain information on changes in concentration that could be related to seasonal use of compounds.
For streams, 13 pharmaceuticals and 11 antibiotics were detected at least 1 time. Detections included analytical results that were estimated or above the minimum reporting limits. Seventy-eight percent of all detections were analyzed in sam-ples collected downstream from municipal-wastewater efflu-ents. For streams receiving wastewater effluents, the pharma-ceuticals caffeine and para-xanthine (a degradation product of caffeine) had the greatest concentrations, 4.75 µg/L (micro-grams per liter) and 0.853 µg/L, respectively. Other pharmaceu-ticals and their respective maximum concentrations were car-bamazepine (0.516 µg/L) and ibuprofen (0.277 µg/L). For streams receiving wastewater effluents, the antibiotic azithro-mycin had the greatest concentration (1.65 µg/L), followed by sulfamethoxazole (1.34 µg/L), ofloxacin (0.329 µg/L), and tri-methoprim (0.256 µg/L).
For streams receiving runoff from animal-feeding opera-tions, the only pharmaceuticals detected were acetaminophen, caffeine, cotinine, diphenhydramine, and carbamazepine. The maximum concentration for pharmaceuticals was 0.053 µg/L. Three streams receiving runoff from animal-feeding operations had detections of one or more antibiotic compounds—oxytetra-cycline, sulfadimethoxine, sulfamethoxazole, and tylosin. The maximum concentration for antibiotics was 0.157 µg/L. The average number of compounds (pharmaceuticals and antibiot-ics) detected in sites downstream from animal-feeding opera-tions was three. The average number of compounds detected downstream from municipal-wastewater effluents was 13.
For wells used to supply livestock, four compounds were detected–two pharmaceuticals (cotinine and diphenhydramine) and two antibiotics (tylosin and sulfamethoxazole). There were five detections in all the well samples. The maximum concen-tration detected in well water was for cotinine, estimated to be 0.024 µg/L.
Seasonal occurrence of pharmaceutical and antibiotic compounds in stream water varied by compound and site type. At four stream sites, the same compounds were detected in all four seasonal samples. At other sites, pharmaceutical or antibi-otic compounds were detected only one time in seasonal sam-ples. Winter samples collected in streams receiving municipal-wastewater effluent had the greatest number of compounds detected (21).
Research analytical methods were used to determine con-centrations for pharmaceuticals and antibiotics. To assist in evaluating the quality of the analyses, detailed information is presented on laboratory methodology and results from quality-control samples. Quality-control data include results for nine blanks, nine duplicate environmental sample pairs, and three laboratory-spiked environmental samples as well as the recov-eries of compounds in laboratory surrogates and laboratory reagent spikes.
Introduction
In 2005, over $133 billion worth of pharmaceutical and antibiotic compounds for human and animal needs were
1Pennsylvania Department of Environmental Protection, Bureau of Water Standards and Facility Regulation.

2 Concentrations of Selected Pharmaceuticals and Antibiotics in South-Central Pennsylvania, March Through September 2006
shipped by pharmaceutical manufacturers in the United States (U.S. Census Bureau, 2006). Most of these compounds or their metabolites are excreted or discarded into waste systems and eventually are released into the environment through point sources, such as wastewater-treatment plants, and nonpoint sources, such as on-site septic systems, sewage sludge, and ani-mal manure.
Reconnaissance studies have measured pharmaceutical, antibiotic, and other compounds at low concentrations in sur-face waters across the United States and in Europe, particularly in waters receiving effluent from wastewater treatment plants (Kolpin and others, 2002; Sando and others, 2005; Buser and others, 1999; Fono and others, 2006). These compounds, termed “emerging contaminants,” include antibiotics, prescrip-tion and nonprescription drugs, animal and plant steroids, reproductive hormones, personal-care products, detergent metabolites, flame retardants, products of oil use and combus-tion, and other chemicals (Kolpin and others, 2002; Stackleberg and others, 2004; Colker and Day, 2006). Streams receiving agricultural, municipal, and industrial wastewaters appear to be the most affected (Kolpin and others, 2002). The occurrence and concentrations of the compounds reflect their physico-chemical behavior (Halling-Sorensen and others, 1998). Some compounds are lipophilic (fat loving); they are able to pass through membranes and are persistent. Therefore, these chemi-cals “have many of the necessary properties to bioaccumulate and provoke effects in the aquatic or terrestrial ecosystems” (Halling-Sorensen and others, 1998).
These emerging contaminants include endocrinologically active compounds termed “endocrine disruptors,” pharmaceuti-cally active compounds (PhACs) or drug residuals, and, more recently, personal care products (PCPs). Pharmaceutically active compounds are consumed by humans or animals. These compounds, “after having an internal curing effect somewhere in the human body, … will be excreted through urine or feces as a mixture of metabolites, as unchanged substances, or conju-gated with an inactivating substituent … ” (Rang and Dale, 1991). “The fate of these substances may be divided into three principle possible fates; i) the substance is ultimately mineral-ized to carbon dioxide and water, … ii) the substance is lipo-philic and not readily degradable so part of the substance will be retained in the sludge, or iii) the substance is metabolized to a more hydrophilic form of the parent lipophilic substance but still persistent and therefore it will pass the wastewater treat-ment plant and end up in the receiving waters and therefore affect the aquatic organisms if the metabolites are biologically active” (Halling-Sorensen and others, 1998).
These compounds commonly are found in natural waters at low concentrations, suggesting minimal environmental impact. But aquatic organisms are subjected to chronic expo-sure and exposure to mixtures of compounds with potential additive effects.
Many of these compounds are not removed by conven-tional drinking-water treatment such as slow sand, diatoma-ceous, or direct filtration technologies. Therefore, these chemi-cals may be present in the drinking water supplied to some
communities. Some studies (Stackleberg and others, 2004; Loraine and Pettigrove, 2006) have demonstrated that a subset of these chemicals present in source waters survives drinking-water processes and remains present in the finished water that is delivered to the customer.
Further, many rural residents use ground water as their drinking-water source. Typically, these waters receive no treat-ment. But, ground water may be susceptible to emerging con-taminants from on-lot sewage disposal, from agricultural land use, and from spray irrigation.
The environmental impacts of these commonly used chemicals are largely unknown. Research provides compelling evidence that endocrine systems of certain fish and wildlife have been affected by chemical contaminants, resulting in development and reproductive problems. For example, femini-zation of fish has been documented (Iguchi and others, 2001), and intersex fish have been found in the Potomac River Basin and elsewhere (Blazer and others, 2007; Hinck and others, 2006; Woodling and others, 2006). A study by Goni-Urriza and others (2000) demonstrated that natural populations of bacteria are capable of developing resistance to antibiotics. Because of the potential for environmental disruption and perhaps human health effects, a better understanding of emerging contaminants and their fate is needed.
Need for the Study
Few studies have been done in Pennsylvania waters to doc-ument the occurrence and distribution of emerging-contaminant compounds. During 1999-2000, the U.S. Geological Survey (USGS) collected samples from five streams in south-central Pennsylvania that were analyzed for antibiotics, prescription drugs, nonprescription drugs, and other wastewater-related compounds. Results from these analyses were used as part of the data set for the first nationwide reconnaissance of emerging contaminants in streams (Kolpin and others, 2002).
In 2005, a pilot study to evaluate the effects of on-site dis-posal of wastewater was conducted by the USGS in the Broad Run watershed of Chester County, Pa. (Senior and Cinotto, 2007). The study included an evaluation of wastewater com-pounds in ground water and stream base flow. Thirty different wastewater compounds out of a suite of 62 compounds ana-lyzed were detected at reporting levels ranging from less than 0.5 µg/L to less than 5 µg/L.
Senior and Cinotto (2007) also reported results from sam-ples collected in 2000 and 2002 in wells in Chester County, Pa. Twelve wells were sampled during the study period, and sam-ples were analyzed for a suite of compounds that included selected antibiotics, human drugs, hormones, and wastewater compounds. Several of the target compounds were detected at low concentrations. The 2002 samples were part of a national reconnaissance for contaminants in ground water (Barnes and others, 2005).
Additional studies are needed to determine if emerging-contaminant compounds are present in streams and wells in

Methods 3
Pennsylvania and to determine if there is a seasonal pattern of occurrence with specific compounds. In 2006, the USGS part-nered with the Pennsylvania Department of Environmental Pro-tection (PADEP) to conduct a survey of pharmaceutical and antibiotic compounds in ground water and stream water of south-central Pennsylvania. The analytical results of this study are presented in this report. The study included three primary objectives: 1) use current (research) analytical methodology to screen for pharmaceutical and antibiotic compounds present in streams and ground waters of south-central Pennsylvania and determine their concentrations, 2) determine seasonal variations in pharmaceutical and antibiotic concentrations, and 3) suggest source(s) of the pharmaceutical and antibiotic compounds. The study did not include examination of biological communities to determine if the detected compounds were impacting the ecol-ogy. Further, no correlation with human-health data was pro-posed to examine relations between human health and the phar-maceutical and antibiotic compounds analyzed for the study.
The data from this study will expand the current database of emerging contaminants in stream and well water and will identify potential target locations for further research.
Purpose of the Report
This report presents the results of analyses without inter-pretation for pharmaceuticals, antibiotics, and general water-quality indicators from stream-water and well-water samples collected for the south-central Pennsylvania emerging-contam-inant survey. Results are presented by site type, site, and season. Because analytical methods used for the pharmaceuticals and antibiotics currently (2007) are considered by the USGS as research methods, information on the analytical methods and the results of quality-control samples collected during the course of the study are presented and discussed in detail.
Scope of the Report
Samples were collected at each site in March/April, May, July, and September 2006. Samples were collected at 11 stream sites and 6 wells in 9 counties of south-central Pennsylvania (fig.1 and table 1). Five of the streams sampled received munic-ipal-wastewater effluent and 6 of the streams sampled received runoff from agricultural areas dominated by animal-feeding operations. For these 11 streams, samples were collected at locations upstream and downstream from the wastewater efflu-ents or animal-feeding operations. Data from an additional stream, Conoy Creek (sites 9 and 10 on figure 1), were origi-nally in the project design as a stream receiving municipal wastewater, but it was learned during the project that this stream does not actually receive municipal wastewater. The six wells were in agricultural land-use settings.
The data reported for each site include measurements of field characteristics and analytical results for 15 pharmaceuti-cals and 31 antibiotics. Laboratory analyses were completed at the USGS National Water Quality Laboratory (NWQL) in Den-
ver, Colo., and the Organic Geochemistry Research Laboratory (OGRL) in Lawrence, Kans. Analyses were completed on 120 environmental samples and 21 quality-control samples (9 blanks, 9 duplicates, 3 laboratory-spiked environmental sam-ples). Of the 120 environmental samples, 24 samples were col-lected from wells in agricultural areas used to supply water for livestock, and 96 samples were collected from stream-water locations (48 from stream-water locations adjacent to munici-pal-wastewater effluents and 48 from stream-water locations adjacent to animal-feeding operations).
Methods
Methods used for site selection, streamflow measure-ments, field water-chemistry measurements, water-quality sam-pling and processing, laboratory analyses, and quality assurance and quality control are described in this section. Added detail is included for the method description used at the OGRL because there is no citable reference at this time.
Site Selection and Sampling Locations
Three site types were sampled for this study: 1) streams receiving municipal-wastewater effluent, 2) streams receiving runoff from animal-feeding operations, and 3) wells in agricul-tural areas used to supply water for livestock. Sites selected for this study are summarized in figure 1 and table 1.
PADEP and the USGS worked cooperatively to select sampling locations for streams receiving municipal wastewater. Early in the study, PADEP provided the USGS with locations of municipal-wastewater-treatment plants. The following site-selection criteria were established by the USGS:
1. Streams had to receive wastewater effluent from one of the municipal-wastewater-plant locations provided by PADEP,
2. Stream locations would be in the south-central Pennsylvania study area,
3. Small streams were targeted so there would potentially be large impacts from the wastewater input, and
4. Permission could be obtained to access the stream upstream and downstream of the wastewater-discharge pipe.
Wastewater sites selected on Spring Creek, Middle Spring Creek, Mountain Creek, Killinger Creek, and Lititz Run met these criteria. A sixth stream, Conoy Creek, was originally in the project design as a stream receiving municipal wastewater, but it was learned during the project that effluent from the municipal treatment plant is piped to the Susquehanna River and not discharged to Conoy Creek. Therefore, for the purposes of presenting concentrations of compounds in streams receiving municipal wastewater, this site was not included. But, the data

4 Concentrations of Selected Pharmaceuticals and Antibiotics in South-Central Pennsylvania, March Through September 2006
YORK
CENTRE
BERKS
BEDFORD
CLINTON LUZERNECLEARFIELD
BLAIR
PERRY
LANCASTER
FRANKLIN
ADAMS
HUNTINGDON
SCHUYLKILL
DAUPHIN
FULTON
MIFFLIN
UNION
JUNIATA
COLUMBIA
SNYDER
CUMBERLAND
LEBANON
NORTHUMBERLAND
MONTOUR
78
96
54
3
2
1
30
292827
26
25
2423
121122
21
1020
19
18
17
1615
14
13
0 4020 MILES
0 4020 KILOMETERS
4
30
EXPLANATION
STREAM-WATER SITE AND IDENTIFIER IN TABLE 1
WELL-WATER SITE AND IDENTIFIER IN TABLE 1
PENNSYLVANIA COUNTY BOUNDARY
76°77°78°
41°
40°
Map projection: Universal Transverse Mercator (UTM), Zone 18, NAD 1983County boundary data: U.S. Geological Survey, 100,000 scale, 1980
PENNSYLVANIA
Figure 1. Locations of sampling sites for the study, south-central Pennsylvania.

Methods
5Table 1. Sampling sites for this study, including site types, U.S. Geological Survey station identification numbers and names, latitude and longitude, and map identification number.
[na, not applicable]
U.S. Geological Survey station identification
number
01470857
Map identifi-cation
number (fig. 1)1
1
Site or well name
Stream sites upstream and dSpring Creek near Wernersville, Pa.
County Location
ownstream of municipal-wastewater effluentsBerks Upstream
Latitude
40° 20’ 58"
Longitude
076° 05’ 03"
Drainage area,
in square miles
19.6
Type of animal
present in the watershed
na01470858 2 Spring Creek near Brownsville, Pa. Berks Downstream 40° 21’ 09" 076° 05’ 03" 19.6 na015693155 3 Middle Spring Creek at College at Shippensburg, Pa. Cumberland/Franklin Upstream 40° 03’ 23" 077° 31’ 43" 20.4 na015693158 4 Middle Spring Creek above Burd Run below Shippensburg, Pa. Cumberland/Franklin Downstream 40° 03’ 42" 077° 31’ 58" 20.7 na01571193 5 Mountain Creek at Mill Street at Mt. Holly Springs, Pa. Cumberland Upstream 40° 07’ 16" 077° 11’ 21" 45.8 na01571195 6 Mountain Creek at Mt. Zion at Mt. Holly Springs, Pa. Cumberland Downstream 40° 07’ 54" 077° 11’ 06" 47.1 na01573151 7 Killinger Creek Upstream of Treatment Plant near Annville, Pa. Lebanon Upstream 40° 19’ 27" 076° 33’ 22" 13.6 na01573153 8 Killinger Creek Downstream of Treatment Plant near Annville, Pa. Lebanon Downstream 40° 19’ 31" 076° 33’ 19" 13.8 na01576420 11 Lititz Run at Lititz, Pa. Lancaster Upstream 40° 09’ 12" 076° 17’ 10" 11.9 na01576422
01569346
12
13
Lititz Run at Rothsville, Pa. Lancaster Downstream
Stream sites upstream and downstream of animal-feeding operationsThree Square Hollow Run above Turnpike near Newburg, Pa. Cumberland Upstream
40° 08’ 51"
40° 11’ 46"
076° 16’ 13"
077° 32’ 50"
13.3
1.36
na
Cattle01569349 14 Three Square Hollow Run below Turnpike near Newburg, Pa. Cumberland Downstream 40° 09’ 55" 077° 30’ 53" 9.60 Cattle01572146 15 Trout Run near Ft. Indiantown Gap, Pa. Lebanon Upstream 40° 28’ 03" 076° 35’ 24" 1.29 Swine01572148 16 Trout Run at Scout Camp near Green Point, Pa. Lebanon Downstream 40° 28’ 30" 076° 34’ 22" 4.23 Swine401704076293101 17 Bachman Run at Fontana, Pa. Lebanon Upstream 40° 17’ 04" 076° 29’ 31" 3.10 Poultry01573095 18 Bachman Run at Annville, Pa. Lebanon Downstream 40° 18’ 58" 076° 30’ 58" 7.30 Poultry01574050 19 Snitz Creek near Falmouth, Pa. Lancaster Upstream 40° 08’ 02" 076° 39’ 17" .23 Cattle01574055 20 Snitz Creek near Bainbridge, Pa. Lancaster Downstream 40° 07’ 28" 076° 39’ 52" 2.02 Cattle01575771 21 Little Chickies Creek at Camp Road near Mastersonville, Pa. Lancaster Upstream 40° 13’ 12" 076° 27’ 56" .52 Poultry015757724 22 Little Chickies Creek at Elizabethtown Road near Milton Grove, Pa. Lancaster Downstream 40° 11’ 07" 076° 30’ 58" 7.57 Poultry01578349 23 Muddy Run at Cochranville near Parkesburg, Pa. Chester Upstream 39° 52’ 36" 075° 55’ 50" .48 Cattle015783492 24 Muddy Run at Glennville near Parkes
Wells in burg, Pa.
agricultural areas used to Chester Downstream
supply water for livestockLivestock
39° 52’ 39" 075° 57’ 14" 2.34 Cattle
394643077043101 25 AD 653
suppliedAdams Horses 39° 46’ 45" 077° 04’ 31" na na
400610076282501 26 LN 2114 Lancaster Chickens 40° 06’ 09" 076° 28’ 25" na na401712076235101 27 LB 1248 Lebanon Dairy cows 40° 17’ 12" 076° 23’ 51" na na401920078130101 28 HU 426 Huntingdon Dairy cows 40° 19’ 19" 078° 13’ 00" na na402052076160101 29 LB 1249 Lebanon Swine 40° 20’ 52" 076° 16’ 01" na na405931076555601 30 UN 205 Union
1A sixth stream, Conoy Creek, was originally in the project design as a stream receiving municipal wastewater, but it fluent from the municipal treatment plant is piped to the Susquehanna River and is not discharged to Conoy Creek. Mapidentification number 01574310, Conoy Creek near Elizabethtown, Pa.) and “10” (downstream, station identification nu
Dairy cows 40° 59’ 31" 076° 55’ 55" na na
was learned that this stream does not actually receive municipal wastewater. Instead, ef- identification numbers for Conoy Creek sampling locations are “9” (upstream, station mber 01574314, Conoy Creek near Stacktown, Pa.)

6 Concentrations of Selected Pharmaceuticals and Antibiotics in South-Central Pennsylvania, March Through September 2006
from samples collected at the upstream and downstream sites at Conoy Creek are included in the report and discussed as a back-ground site.
The Killinger Creek sites met the site-selection criteria, but following the sampling period, it was learned that the wastewa-ter plant on Killinger Creek was, at times, cleaned before or dur-ing sample collection. Upon further discussions with staff from the plant, the cleaning process takes place weekly on the same day, and three of the four samples at the downstream location (May, July, and September samples) were collected on the day of cleaning. Concentrations of compounds reported for this site may, therefore, reflect atypical concentrations of pharmaceuti-cals and antibiotics.
For the streams selected in agricultural areas, the USGS worked in cooperation with County Conservation District per-sonnel to determine the locations of animal-feeding operations that had streams in near proximity. The following site-selection criteria were established by the USGS:
1. Streams had to have inputs from agricultural areas dominated by animal-feeding operations,
2. Stream locations would be in the south-central Pennsylvania study area,
3. Small streams were targeted, and
4. Permission could be obtained to access the stream upstream and downstream of animal-feeding operations.
For the well-water sampling, wells were selected in agri-cultural areas. The following well-selection criteria were estab-lished by the USGS:
Wells would be
1. Located in the south-central Pennsylvania study area,
2. Currently used to supply water for livestock on a farm,
3. Used on a daily basis,
4. Representative of the aquifer,
5. Shallow [less than or equal to 300 ft] total depth,
6. Completed in a limestone aquifer, and
7. Of known completion with written records on file with the homeowner or Pennsylvania Geological Survey that would provide confirmation of the well depth and aquifer lithology (appendix1).
There also would need to be a raw (untreated) water sampling point where water-treatment systems could be by-passed during well sampling.
Streamflow Measurement
Streamflow measurements using a Sontek Flowtracker were made concurrently with the collection of water-quality samples. Computation of area (using stream width and depth) and procedures for making streamflow measurements followed documented USGS procedures (Rantz and others, 1982).
Field Water Chemistry
Field measurements of pH, specific conductance, dissolved oxygen, dissolved-oxygen saturation, and water temperature were made with a calibrated multi-parameter water-quality meter manufactured by the YSI Corporation. Calibration followed procedures documented by USGS (variously dated). Field measurements with equipment types and accuracies are shown in table 2. Stream depth was estimated to 0.10 ft using a standard USGS Hydrologic Instrumentation Facility (HIF) wading rod.
Water-chemistry readings and stream depth were measured to determine if the stream was well-mixed from bank to bank and if there was variability in the cross section due to depth. Water-chemistry readings in the stream cross section were made at 1-ft or 2-ft horizontal intervals (depending on stream width), at quarter-points of the stream width, and in the vertical at six-tenths of the depth of the stream. Stream depth was measured at each vertical prior to water-chemistry readings. Barometric pressure was recorded at the majority of sites using a Thommen field barometer; the field barometer also was used to check the internal barometer of the YSI multiparameter meter during calibration of dissolved oxygen.
Water-Quality Sampling and Processing
Water-quality sampling and processing for stream and well-water samples are described in this section. Procedures used for packing and shipping samples also are included.
Stream Water
Stream-water sampling equipment was cleaned thor-oughly prior to sample collection, following the USGS proto-cols for organic-compound sampling (Wilde, 2004), including a caveat in Wilde and others (update 5.6.1.F) (2004) that iden-tifies the need to use non-antibacterial detergents because of the analyses for antibiotic compounds. Special considerations related to personal safety and sample contamination specific to working in streams receiving potentially hazardous compounds from municipal-wastewater plants or animal-feeding operations also were followed (Wilde and others [update 5.6.1.F], 2004). Streams were sampled at low flow or during a falling stage after a rainfall event.
Water-quality samples for laboratory determination of pharmaceuticals and antibiotics were collected with a DH-81 hand-held sampler fitted with a Teflon nozzle holder, Teflon nozzle, and 1-L (liter) Teflon bottle. Typically, three separate 1-L samples were collected, each sample containing stream water collected at three depth-integrated verticals located at 25 percent, 50 percent, and 75 percent of the stream width. Each 1-L sample was sequentially poured into a single pre-cleaned and stream-rinsed 3-L Teflon bottle for the final composited sample. All locations of the verticals were noted on the field

Methods 7
data sheets. All samples were immediately placed on ice until they were returned to the laboratory for processing.
Sample-processing and shipping protocols developed for pharmaceutical and antibiotic compounds were followed (Wilde and others [update 5.6.1.F], 2004). During this step, spe-cial care was taken not to contaminate samples through labora-tory-processor inputs or laboratory-area inputs. The 3-L Teflon bottle containing the stream sample was first shaken to mix the water prior to filtration. A fluid-metering pump, fitted with a Teflon head and hoses, was used to draw the sample from the 3-L bottle to a pre-cleaned aluminum filter support (Geotech brand) with a baked, glass microfiber filter (147-mm diameter, 0.7 µm (micrometer) pore size). The sample was then filtered into two 1-L amber, cleaned-and-burned (baked at 450°C to burn off all residual organic compounds) glass bottles for phar-maceutical analyses (one bottle was held as an archive sample) and three 125-mL (milliliter) cleaned-and-burned glass bottles for antibiotic analyses. All bottles were wiped with clean, dis-posable isopropyl alcohol (70 percent) pads, inserted into foam sleeves, and immediately placed in the refrigerator at 4°C or packed for shipment to the USGS NWQL or OGRL. All sam-ples were double bagged and were shipped on ice within 2 days of collection via overnight delivery to the analytical laborato-ries. Lab benches were cleaned after sample filtration with a non-antibacterial soap solution and isopropyl alcohol.
Well Water
Well-water sampling equipment was cleaned thoroughly prior to sample collection, following the USGS protocols for organic-compound sampling (Wilde, 2004), including a caveat in Wilde and others (update 5.6.1.F) (2004) that identifies the need to use non-antibacterial detergents because of the analyses for antibiotic compounds. Collection of well-water samples fol-lowed protocols documented by Wilde and others (1999) with three modifications; modifications to the protocols included the use of brass fittings instead of Teflon to connect to water
sources and did not include the use of a flow manifold or pro-cessing chamber.
At all wells sampled, submersible pumps provided sample water to a tap either at the base of the pressure tank or at an out-side faucet. As the well was purged, pH, specific conductance, dissolved oxygen, and water temperature were monitored using a calibrated YSI 556 multiparameter meter. When readings became stable (variation between five or more 5-minute sequential field-measurement values: ± 0.05 units for pH; ± 0.2°C for water temperature; ± 0.3 mg/L for dissolved oxy-gen; and ± 3 percent for specific conductivities greater than 100 µS/cm), the well-water samples were collected.
All well-water samples were processed at the sampling site. A pre-cleaned Savillex Teflon in-line filter-unit holder with a baked, glass microfiber filter (47-mm diameter, 0.7µm pore-size) was used to filter the sample directly from the tap or faucet into two clean 1-L amber glass bottles that were cleaned and baked at 450°C to burn off all residual organic compounds for pharmaceutical analyses. The second bottle was held as an archive sample. Three 125-mL cleaned-and-burned glass bot-tles were used to collect filtered water for antibiotic analyses. All bottles were wiped with clean, disposable isopropyl alcohol (70 percent) pads, inserted into foam sleeves, and immediately placed on ice until they were returned to the laboratory where they were either placed in the refrigerator at 4°C or packed for shipment to the USGS NWQL or OGRL. All samples were dou-ble bagged and were shipped on ice within 2 days of collection via overnight delivery to the analytical laboratories.
Laboratory Analyses
Pharmaceutical compounds were analyzed by the USGS NWQL in Denver, Colo. The research analytical method used a solid-phase extraction followed by high performance liquid phase chromatography/mass spectrometry (HPLC-MS), using a polar reverse-phase octylsilane (C8) HPLC column following the procedure described in Cahill and others (2004). The com-
Table 2. Field measurements, units, accuracies, and equipment types used for this study.
[NWIS, National Water Information System; ft3/s, cubic feet per second; °C, degrees Celsius; YSI, Yellow Springs Instrument; µS/cm, microsiemens meter at 25°C; mm, millimeters; mg/L, milligrams per liter]
per centi-
Measurements NWIScode
Reportingunits
Reporting accuracy
Equipment/sensor type
Stream discharge 00061 ft3/s ± 0.003 ft3/s Sontek Flowtracker
Temperature 00010 °C ± 0.15°C YSI Precision Thermister
pH 00400 standard units ± 0.2 Glass combination electrode, YSI
Specific conductance 00095 µS/cm at 25°C ± 0.5% of the reading or ± 1 µS/cm; whichever is greater
4-electrode cell with auto-ranging, YSI
Dissolved oxygen 00300 mg/L ± 2% of the reading or 0.2 mg/L; whichever is greater
Steady state polarographic, YSI
Barometric pressure 00025 mm mercury ± 0.75 to 1.5 mm mercury Thommen Classic Altimeter Plus Barometer

8 Concentrations of Selected Pharmaceuticals and Antibiotics in South-Central Pennsylvania, March Through September 2006
pounds analyzed at the USGS NWQL and their minimum reporting levels (MRLs) and method detection limits (MDLs) are listed in table 3. The MRL is the smallest measured concen-tration of a substance that can be reliably measured using a given analytical method. The MDL is the minimum concentra-tion of a substance that can be measured and reported with 99 percent confidence that the analyte concentration is greater than zero. The USGS NWQL has established a data reporting convention described in Childress and others (1999). A qualify-ing remark code (‘E’ = estimated) is used for semi-quantitative analytical results to denote less certainty in quantification than the majority of the analyses. E-coding is used in the USGS National Water Information System to denote these semi-quan-titative results. For the purposes of this report, data are coded E(1)-E(4) to denote the reason for qualification. This conven-tion will be noted in the data tables and the discussion of con-centration of selected pharmaceuticals and antibiotics. Reported analytical concentrations are coded as follows:
• E(1) if concentration is below the long-term MDL (for information-rich methods only);
• E(2) if the concentration is greater than or equal to the long-term MDL but less than the MRL (lowest calibration standard is less than the MRL);
• E(3) if the median long-term recovery of the compound is between 30 and 60 percent or the relative standard deviation of long-term recoveries was greater than 25 percent,
• E(4) if data are reported above the MRL, but there was a failure in some aspect of lab quality control (for example, the laboratory-spike or surrogate recov-eries were low and the sample could not be re-ana-lyzed).
In this report, a compound is reported as a “detection” for any E-coded value as well as values reported without qualifica-tion above the MRL. No estimated values were reported for samples from the OGRL; all detections quantified were above the MRLs.
Antibiotics and selected pharmaceuticals were analyzed at the USGS OGRL in Lawrence, Kans., using a research method modified after an online solid phase extraction (SPE) method from Meyer and others (2007). Water samples were analyzed for antibiotics using online SPE and liquid phase chromatogra-phy/tandem mass spectrometry (LC/MS/MS) with electrospray ionization (ESI) using multiple reaction monitoring (MRM). This technique allowed quantitation of chloramphenicol, linco-mycin, ormetoprim, trimethoprim, five macrolides, six sulfona-mides, six quinolines, four tetracycline antibiotics, six antibi-otic degradation products, and two pharmaceuticals—carbamazepine and ibuprofen. Samples were analyzed in posi-tive-ion mode except for chloramphenicol and ibuprofen, which were analyzed in negative-ion mode. Samples were extracted using the HLB Prospekt cartridges (Waters Corp., Milford, Mass.). Demeclocycline, nalidixic acid, oleandomycin, and 13C6-Sulfamethazine were used as surrogate standards; clina-
floxacin, 13C2-erythromycin, 13C2-erythromycin-H2O, meclo-cycline, simatone, and 13C6-sulfomethoxazole were used as internal standards. The detected compounds were quantitated using the ratio of the area of the quantifying ion of the analyte to the area of the quantifying ion of the internal standard.
The compounds analyzed at the USGS OGRL and their MRLs are listed in table 4. The MRLs were determined by assessing the signal-to-noise ratio in 0.002, 0.005, and 0.010 µg/L laboratory reagent spiked (LRS) samples. A mini-mum signal-to-noise ratio of five was used to establish the reporting levels. The MRLs ranged from 0.005 to 0.010 µg/L for all the compounds analyzed except for ibuprofen, sulfadiaz-ine, chloramphenicol, and sulfathiazole; the MRL for these compounds was 0.050 µg/L; the MRL for sulfathiozole was 0.020 µg/L. MDLs for the compounds analyzed at the OGRL will be established when the analytical method is finalized; however, no results will be reported below the MRLs.
A method of standard addition (Harris, 2003) is also used by chemists at the OGRL if recoveries of compounds in internal quality-control samples (surrogates and laboratory-spiked environmental samples) are less than or greater than 35 percent of the expected concentration, providing those analytes were detected in the samples. Standard addition corrects for matrix effects and results in a more accurate quantitation of individual analytes. All wastewater influents and effluents are automatically analyzed using standard addition.
In standard addition, an unspiked-environmental and spiked-environmental sample aliquot are prepared and analyzed. The following equation was used to calculate analyte concentrations by standard addition:
C = (Rus / (Rsp – Rus)) Csp (1)
whereC is concentration of the analyte in the unspiked
sample,Rus is the ratio of area of the quantitation-ion of the ana-
lyte to the area of the quantitation-ion of the inter-nal standard in the unspiked sample,
Rsp is the ratio of area of the quantitation-ion of the analyte to the area of the quantitation-ion of the internal standard in the spiked sample,
andCsp is the concentration of the analytes in the spiked
sample due to the spike.
Quality Assurance and Quality Control
Quality-assurance procedures that provide controls to immeasurable components of a study that substantially improve the quality of the results (U.S. Geological Survey, variously dated) were followed in the field and Pennsylvania Water Sci-ence Center (PA WSC) laboratory. A sampling schedule was also developed to meet study goals for collection of samples during targeted seasonal periods. Once established, the sam-

Methods 9
Table 3. List of target pharmaceutical and antibiotic compounds analyzed at the U.S. Geological Survey National Water Quality Laboratory in Denver, Colorado.
[Italicized compounds were also analyzed at the USGS Organic Geochemistry Research Laboratory in Lawrence, Kans., using on-line solid phase extraction (SPE) and liquid phase chromatography/tandem mass spectrometry (LC/MS/MS) with electrospray ionization using multiple reaction monitoring; NWIS, National Water Information System; footnotes generally cite references for medicinal use; --, not available]
Compound NWIS
parametercode
Medicinal use
Minimumreporting
level, in
micrograms per liter
Method detection
limit, in
micrograms per liter
Human and veterinary drugs
Nonprescription pharmaceuticalsAcetaminophen
Caffeine2,3,4Para-xanthine
Codeine
Cotinine
Diphenhydramine
62000
50305 62030
62003
62005
62796
1Analgesic
Stimulant1
5Degradation product of caffeine1Analgesic
1Nicotine metabolite
Antihistamine, antiemetic (anti-6nausea), sleep aid, sedative
0.024
.015
.021
.022
.028
.023
0.012
.008
.010
.011
.014
.012
Prescription pharmaceuticals
Carbamazepine
Dehydronifedipine7Diltiazem
Fluoxetine
Ranitidine
Salbutamol
Thiabendazole
Warfarin
62793
62004
62008
62011
62019
62020
62801
62024
Anticonvulsant and antimanic agent6
1 Antianginal metabolite1Antihypertensive
Antidepressant1
Antacid1
1Antiasthmatic3,8Anthelmintics
(used to treat worm infections)
Anticoagulant1
.018
.022
.018
.016
.025
.014
.025
.019
.009
.011
.009
--
--
.007
.012
.009
Antibiotics
Sulfamethoxazole
Trimethoprim
62021
62023
1Antibiotic1Antibiotic
.024
.020
.012
.010
1U.S. Geological Survey, 2006. 2Degradation product. 3Edward Furlong, U.S. Geological Survey, written commun., 2007.4Para-xanthine also known as 1,7 dimethylxanthine. 5Long, 1995-2005. 6Couper and Logan, 2004.7 Routinely reported as an estimated concentration, indicated by an “E” qualifier.8Micromedex, Inc., 2006.

10 Concentrations of Selected Pharmaceuticals and Antibiotics in South-Central Pennsylvania, March Through September 2006
Table 4. List of target antibiotic and pharmaceutical compounds analyzed at the U.S Geological Survey Organic Geochemistry Research Laboratory in Lawrence, Kansas.
[Italicized compounds were also analyzed at the USGS National Water Quality Laboratory in Denver, Colo., using high performance liquid phase chromatography/mass spectrometry methodology (HPLC-MS); NWIS, National Water Information System]
CompoundNWIS
parameter codes
Minimumreporting
level, in
micrograms per liter
Macrolide antibioticsAzithromycinErythromycin
Erythromycin-H2O (anhydro-erythromycin)1
RoxithromycinTylosinVirginiamycin
627926279763674628956289662897
0.005.008.008.005.005.005
Quinoline antibiotics Ciprofloxacin EnrofloxacinLomefloxacinNorfloxacinOfloxacinSarafloxacin
62898(code not yet established)
629006275762899
62771
.005
.005
.005
.005
.005
.005
Sulfonamide antibioticsSulfachloropyridazineSulfadiazineSulfadimethoxineSulfamethazineSulfamethoxazole Sulfathiazole
62774 62963
62776 61762
6277562778
.005
.050
.005
.005
.005
.020
Tetracycline antibiotics and degradation productsChlorotetracycline
Epi-chlorotetracycline (4-EC-tetracycline HCl)1
Epi-iso-chlorotetracycline (Iso-epi-chlorotetracycline)1
1Iso-chlorotetracyclineDoxycycline Oxytetracycline
Epi-oxytetracycline (4-Epi-oxytetracycline) 1
TetracyclineEpi-tetracycline (4-Epi-tetracycline HCl)1
617446373164047641756269461759637296278163727
.010
.010
.010
.010
.010
.010
.010
.010
.010
Other antibioticsChloramphenicolLincomycinOrmetoprim
Trimethoprim
65194 62894 62962
62023
.050
.005
.005
.005
PharmaceuticalsCarbamazepineIbuprofen
6279362014
.005
.050
1Degradation product.

Methods 11
pling schedule needed few adjustments and was key to complet-ing all the work needed to accomplish the study objectives.
The USGS NWQL’s quality-assurance process is docu-mented in a Quality Management System (QMS) report by Mal-oney (2005). This QMS report is the framework for planning, implementing, and assessing work performed by the NWQL and for carrying out required quality assurance and quality con-trol for compliance with the standards set by the National Envi-ronmental Laboratory Accreditation Conference. All personnel associated with the NWQL are obligated to meet the require-ments described in the policies, processes, and standard operat-ing procedures (SOPs) included or referenced in this document.
Quality Control on Field Measurements
Prior to each sampling season, thermistors for field instru-ments were checked against an NIST-certified thermometer. Multiparameter meters used for field-chemistry readings were calibrated on the day of sampling using certified standards and buffers. A sodium sulfite/cobalt chloride zero dissolved-oxygen solution was prepared daily and was used to check the accuracy of the dissolved-oxygen reading near 0.0 mg/L dissolved oxy-gen. Any meter that showed a reading of greater than 0.3 mg/L oxygen in a zero dissolved-oxygen solution was not used until the membrane and electrode-filling solution could be changed. Barometric-pressure readings were cross-checked with a sec-ond barometer during dissolved-oxygen calibration to insure no change in calibration of the internal barometer had occurred.
Field meter log books, which accompanied the field meters at all times, were prepared to record calibration, performance, and service information as well as track the performance of each instrument over the course of the study. All field-meter calibra-tion information was copied on the site field-data sheet to insure the accuracy of the field-meter readings in case the log book would become lost or damaged.
Quality Control on Water-Quality Samples
Quality-control samples are those samples that are planned to provide data that can be used to estimate the magnitude of the bias or variability in the processes used to obtain the environ-mental data. Pharmaceutical and antibiotic quality-control sam-ples submitted included blanks, duplicates, and laboratory spikes (into environmental water). A summary of all quality-control samples submitted for this study is presented in table 5.
Blanks
For this study, equipment blanks and field blanks were collected and analyzed to determine if there was any bias due to contamination in any of the processing steps (equipment, field, transport, and laboratory). Blanks made up 6.4 percent of all pharmaceutical and antibiotic samples submitted for analyses. To evaluate the cleaning processes used on both stream-water equipment and well-water equipment, three equipment blanks
were collected in the PA WSC laboratory by pouring certified organic-free water through field equipment and processing the collected sample through the filter apparatuses used for envi-ronmental samples. In addition to equipment blanks, six field blanks were collected to evaluate contamination that might be introduced at the site. Three of the field blanks were collected at stream-water locations, and three were collected at well-water locations.
Duplicates
Four stream-water and four well-water field sequential duplicates (table 5) were collected and processed immediately following each associated primary environmental sample using identical procedures; sequential duplicates measure variability introduced during collection, processing, analytical methodol-ogy, and also reflect temporal changes in environmental condi-tions. In addition, one stream-water split duplicate (collected at station 015693158 on May 10, 2006) was submitted to the OGRL. A split duplicate is a single sample that is subdivided into two other samples; split duplicates give a measure of vari-ability (reproducibility) in analytical values produced by sam-ple processing and analytical methodology. Duplicates made up 6.4 percent of all samples submitted for analyses For these duplicates, a relative percent difference (RPD) was calculated between the two samples when both values had either estimated concentrations or concentrations above the MRL according to the following equation:
RPD = (d/s) X 100, (2)
whered is the difference in concentration between the pri-
mary environmental sample and the duplicate sample,
and s is the mean of the concentrations of the primary envi-
ronmental sample and the duplicate sample.
Laboratory-Spiked Environmental Samples
A laboratory-spiked environmental sample was prepared by adding a standard spike solution to a split of the environmen-tal sample water to assess the recovery efficiencies and matrix effects of the analytical methods. Over the course of the study, one stream-water quality-control sample was spiked with known concentrations of pharmaceuticals and antibiotics at the NWQL, and two stream-water quality-control samples were spiked with known concentrations of antibiotics and pharma-ceuticals at the OGRL. For the laboratory-spiked environmental sample collected at station 015693158 on May 10, 2006, an environmental sample was collected and split in the PA WSC laboratory using a Teflon, decaport cone splitter to create two identical samples. One sample was submitted as an environ-mental sample, and the second was sent to be spiked at the NWQL and analyzed in the same batch as the environmental sample. The laboratory-spiked samples for this study collected

12 Concentrations of Selected Pharmaceuticals and Antibiotics in South-Central Pennsylvania, March Through September 2006
at Snitz Creek on March 16 and May 1, 2006, were both split and spiked at the OGRL.
Laboratory Quality Control
The NWQL uses four types of quality-control samples for antibiotic and pharmaceutical analyses–two for instrument quality control and two for process quality control. Instrument quality-control samples are either continuing-calibration sam-ples (which ensure the acceptable calibration performance dur-ing analysis) or continuing-calibration blanks (which are used to monitor cross-contamination between injections). Eight stan-dards, ranging in concentration from 0.005 to 1.0 µg/L, and a reagent blank are used in instrument calibration. Acceptance criterion for calibration is an R-squared fit value of 0.995 or bet-ter for the standard curve of each compound, although fits of 0.998 and better are typical. The process quality-control sam-ples are laboratory reagent blanks (LRB) and laboratory reagent spikes (LRS). LRBs are used to monitor for inadvertent contam-ination during the extraction and analysis process. A LRS is made by adding a known volume of a spike solution, with known concentrations of compounds, to a known volume of organic-free grade water. LRSs are used to monitor method per-formance in the absence of a sample matrix; they also are used
in aggregate to monitor long-term method performance with multiple operators and multiple instruments. Process quality-control samples are put in the batch run every 10 samples. All these types of quality-control samples, therefore, collectively monitor for contamination and method performance throughout the laboratory process.
For the analytical work done at the NWQL, carbam-azepine-d10 and ethyl nicotinate-d4 were also added to each sample as surrogate spikes to evaluate the effect of bias and variability of recoveries in the environmental-sample matrix. Surrogates are similar in physical and chemical properties to the analytes of interest but usually are not found in environmental samples. These surrogates are used because they behave simi-larly in the analytical process to at least some of the analytes of interest but do not interfere with any analytes. Surrogates are added to all environmental and quality-control samples to mon-itor water-matrix effects and gross sample-processing errors. Samples reporting low surrogate recoveries usually indicate problematic sample matrices but may also indicate gross pro-cessing errors. Recovery of surrogates in the sample matrix should be reviewed in relation to recovery of surrogates in LRSs to evaluate possible matrix effects on recovery in environmen-tal samples.
Table 5. Summary of quality-control samples analyzed at the U.S. Geological Survey National Water Quality Laboratory (NWQL) and Organic Geochemistry Research Laboratory (OGRL).
U.S. Geological Survey Time Type of quality-control Station name station identification Date (first time listed –NWQL sample;
samplenumber second time listed – OGRL sample)
Equipment blanks Lemoyne Station 401435076540910 2/24/06 1430, 1431
Lemoyne Station 401435076540910 2/24/06 1445, 1446
Lemoyne Station 401435076540910 5/02/06 1530, 1531
Field blanks Spring Creek 01470857 5/08/06 1130, 1131
Middle Spring Creek 015693158 9/19/06 1120, 1121
Trout Run 01572146 7/31/06 0945, 0946
AD 653 394643077043101 3/09/06 1130, 1131
LN 2114 400610076282501 7/13/06 0940, 0945
LB 1248 401712076235101 9/20/06 1245, 1246
Duplicate samples Spring Creek 01470858 9/18/06 1125, 1126
Middle Spring Creek 015693158 5/10/06 1036 (OGRL schedule only)
Middle Spring Creek 015693158 7/06/06 1030, 1035
Killinger Creek 01573153 3/07/06 1235, 1236
Conoy Creek 01574314 5/01/06 1037, 1038
AD 653 394643077043101 5/04/06 1112, 1113
LN 2114 400610076282501 5/15/06 1317, 1318
LN 2114 400610076282501 9/07/06 1105, 1106
UN 205 405931076555601 7/11/06 1200, 1205
Laboratory-spiked environ- Middle Spring Creek 015693158 5/10/06 1035 (NWQL schedule only)mental samples Snitz Creek 01574050 3/16/06 1032 (OGRL schedule only)
Snitz Creek 01574055 5/01/06 1247 (OGRL schedule only)

Results for Quality-Control Samples 13
At the OGRL, nine standard curve solutions (ranging in concentration from 0.002 to 1.0 µg/L), LRBs, and LRSs are pre-pared in Na2PO4 (pH 7) buffered, laboratory-grade water. Acceptance criterion for calibration is an R-squared fit value of 0.99 or better. Every analytical sample run has a duplicate sam-ple, a 0.2 µg/L laboratory-spiked environmental sample, and a LRB after every tenth environmental sample and a LRS after every twentieth environmental sample. Two LRBs are also interspersed between the environmental samples. All standard solutions, blanks, and laboratory-spiked environmental samples are treated the same as the environmental water samples.
Results for Quality-Control Samples
Results for blanks, duplicates, laboratory-spiked environ-mental samples, and laboratory quality-control samples are dis-cussed in the following section. Because there was only one detection in a blank sample, a table showing results of all blank data is not included in this report. Primary environmental and duplicate paired data are shown in table 6 (at the end of the report).
Blanks
Only one antibiotic, tylosin, was measured above the MRL (< 0.005 µg/L) at 0.006 µg/L in an equipment blank. It was unclear if the contamination was due to the equipment or intro-duced during the analysis (OGRL statistics show 15 percent of all the LRBs had detections of tylosin, and the average concen-tration of these detections was 0.007 µg/L). There were no other detections in the remaining equipment or field blanks. This indi-cates that sampling procedures, sample equipment and contain-ers, cleaning procedures, and analytical processes were not con-tributing contamination to the samples collected for the study.
Duplicates
Of the four ground-water duplicate-sample pairs, none had detections of any pharmaceuticals or antibiotics; therefore, no RPDs could be calculated or are shown on table 7. At stream-water sites, RPDs of individual compounds in five duplicate sample pairs were generally less than or equal to 30 percent between each of the samples with the exception of diphenhy-dramine (36 and 39 percent), diltiazem (40 percent), azithromy-cin (140 percent), ofloxacin (88 percent), and sulfamethoxazole (84 and 35 percent). An explanation of the high RPDs by com-pound is as follows: diphenhydramine (both results in the pair had low concentrations; NWQL surrogate recovery data indi-cated matrix effects for both samples, and long-term mean recovery was 60 percent); diltiazem (both results in the pair had low concentrations; NWQL surrogate recovery data indicated matrix effects), azithromycin (standard deviation of percent recoveries in laboratory-reagent spikes was 93 percent), oflox-
acin (both results in the pair had low concentrations), and sul-famethoxazole (long-term mean recovery in laboratory-reagent spikes was 122 percent with associated standard deviation of percent recoveries equal to 28 percent).
Combining results for all sequential and split duplicate pairs, RPDs were first calculated for 52 pairs of compounds (all from stream-water sites) having measurable detections in both samples (table 7). Median RPDs were then calculated for indi-vidual pharmaceutical compounds. Median RPDs ranged from 2.3 percent for carbamazepine (NWQL) to 37.5 percent for diphenydramine. Using the same procedure, median RPDs for antibiotics (if only one RPD was available for a compound ana-lyzed, that result was used as a median) ranged from 5 percent for sulfamethoxazole (NWQL) to 33 percent for tylosin. Using all individually calculated RPDs, the overall median RPD for all samples and all compounds was 16 percent. An overall median RPD of 16 percent is very acceptable considering the generally low concentrations of data that push the quantification capabil-ities of the instrumentation and the added time-component vari-ability that is inherent in evaluating sequential-duplicate results (Edward Furlong, U.S. Geological Survey, oral commun., 2007).
Laboratory-Spiked Environmental Samples
Table 8 shows calculated recoveries of pharmaceuticals and antibiotics from the sample collected at Middle Spring Creek above Burd Run below Shippensburg, Pa., on May 10, 2006, that was spiked and analyzed at the NWQL. For the spike, 0.1 mL of 2,500 ng/mL (nanograms per milliliter) spike solu-tion was added to one of the two split samples. If the sample volume is exactly 1.0 L, the final concentration would be 0.25 µg/L. Because the volume varies slightly, adjustments for the actual volume are made during instrumental analysis, and the recoveries are calculated using the exact expected concen-tration. For example, for the purposes of the percent-recovery calculation, the spike concentration in the sample (‘calculated concentration in spike’ on table 9) was first adjusted to the vol-ume of the sample submitted (972 mL) by dividing 0.25 µg/L by 0.972 L. The formula for calculating recovery in percent is found in the heading of the table.
Calculated recoveries of pharmaceuticals in the labora-tory-spiked environmental sample analyzed at the USGS NWQL were generally ±30 percent of the spiked concentration. There were exceptions. Data for spikes (table 8) show poor recoveries for fluoxetine (3.5 percent), thiabendazole (38 per-cent), diltiazem and ranitidine (both 51 percent), and diphenhy-dramine (60 percent). Fluoxetine, diltiazem, and ranitidine were reported as “highly variable compounds” during methods development and have mean long-term recoveries ranging from 22 to 37 percent. In the final approved method, fluoxetine and ranitidine will be dropped except for custom analytical requests; diltiazem will be retained but will be reported as esti-mated data values (Edward Furlong, U.S. Geological Survey, oral commun., May 29, 2007). Therefore, the data reported for

14 Concentrations of Selected Pharmaceuticals and Antibiotics in South-Central Pennsylvania, March Through September 2006
Table 7. Relative percent differences (RPD) in concentrations of primary environmental and quality-control sequential and split duplicate samples analyzed at the U.S. Geological Survey (USGS) National Water Quality Laboratory (NWQL) and Organic Geochemistry Research Laboratory (ORGL).
[Sample data is only shown if both results of the duplicate pair were above the reporting limit or one or both were reported as estimated (E) values; env., environ-mental; na, no relative percent difference (RPD) could be calculated because either one or both concentrations were below the reporting limit (reported as a “<” value); --, either or both concentrations for compound were below the reporting limit (complete results of analyses are presented in table 6); compounds in italics were analyzed at both laboratories; E(1), concentration is below the long-term method detection limit (for information-rich methods only); E(2), concentration is greater than or equal to the long-term method detection limit but less than the minimum reporting level (lowest calibration standard is less than the minimum re-porting level); E(3), median long-term recovery of the compound is between 30 and 60 percent or the relative standard deviation of long-term recoveries was greater than 25 percent]
Spring Creek Middle Spring Creek Middle Spring Creek 01470858 0156931358 015693158
Concentration Concentration Concentration (µg/L) (µg/L) (µg/L)
Analyte Relative Relative Relative 9/18/2006 5/10/2006 7/6/20069/18/2006 5/10/2006 7/6/2006percent percent percent 1120,1121 1031 1020,10251125,1126 1036 1030,1035difference difference differenceprimary primary primary duplicate duplicate duplicate
env. env. env. sample sample samplesample sample sample
Compounds analyzed at the USGS NWQLHuman and veterinary drugsNonprescription pharmaceuticalsAcetaminophen -- -- na -- -- na -- -- naCaffeine 0.022 0.025 13 -- -- na -- -- na
1,2Para-xanthine -- -- na -- -- na -- -- naCodeine -- -- na -- -- na E(1) 0 .010 E(1) 0 .010 0Cotinine -- -- na -- -- na -- -- naDiphenhydramine -- -- na -- -- na E(2) .013 E(1) .009 36
Prescription pharmaceuticals Carbamazepine -- -- na -- -- na .050 .051 2.0
Dehydronifedipine -- -- na -- -- na -- -- naDiltiazem -- -- na -- -- na E(3) .024 E(3) .018 29Fluoxetine -- -- na -- -- na -- -- naRanitidine -- -- na -- -- na E(3) .007 E(3) .006 15Salbutamol -- -- na -- -- na E(1) .004 E(1) .004 0
AntibioticsSulfamethoxazole -- -- na -- -- na .082 .078 5.0
Trimethoprim -- -- na -- -- na .023 .023 0
Compounds analyzed at the USGS OGRLMacrolide antibioticsAzithromycin .031 .035 12 1.65 1.28 25 .078 .014 140Erythromycin -- -- na -- -- na -- -- na
Erythromycin-H2O (anhydro-erythromycin)1 -- -- na .081 .068 17 -- -- naTylosin -- -- na -- -- na -- -- na
Quinoline antibiotics Ciprofloxacin -- -- na -- -- na .007 .008 13Ofloxacin .012 .011 8.7 .009 .023 88 .022 .022 0
Sulfonamide antibioticsSulfadiazine -- -- na -- -- na -- -- na
Sulfamethoxazole .148 .159 7.2 .434 .426 1.9 .110 .268 84
Other antibioticsTrimethoprim .011 .010 10 .123 .114 7.6 .052 .058 11
PharmaceuticalsCarbamazepine .014 .015 6.9 .152 .151 .66 .086 .090 4.5
Ibuprofen -- -- na -- -- na -- -- na
1Degradation product.2Para-xanthine also known as 1,7 dimethylxanthine.

Results for Quality-Control Samples 15
Table 7. Relative percent differences (RPD) in concentrations of primary environmental and quality-control sequential and split duplicate samples analyzed at the U.S. Geological Survey (USGS) National Water Quality Laboratory (NWQL) and Organic Geochemistry Research Laboratory (ORGL).—Continued
[Sample data is only shown if both results of the duplicate pair were above the reporting limit or one or both were reported as estimated (E) values; env., environ-mental; na, no relative percent difference (RPD) could be calculated because either one or both concentrations were below the reporting limit (reported as a “<” value); --, either or both concentrations for compound were below the reporting limit (complete results of analyses are presented in table 6); compounds in italics were analyzed at both laboratories; E(1), concentration is below the long-term method detection limit (for information-rich methods only); E(2), concentration is greater than or equal to the long-term method detection limit but less than the minimum reporting level (lowest calibration standard is less than the minimum re-porting level); E(3), median long-term recovery of the compound is between 30 and 60 percent or the relative standard deviation of long-term recoveries was greater than 25 percent]
Killinger Creek Conoy Creek 01573153 01574314
Concentration Concentration (µg/L) (µg/L)
Analyte Relative Relative 3/7/2006 5/1/20063/7/2006 5/1/2006percent percent 1230,1231 1035,10361235,1236 1037,1038difference differenceprimary primary duplicate duplicate
env. env. sample samplesample sample
Compounds analyzed at the USGS NWQLHuman and veterinary drugsNonprescription pharmaceuticalsAcetaminophen 0.098 0.083 17 0.029 0.030 3.4Caffeine 4.75 6.12 25 .032 .035 9.0
1,2Para-xanthine .853 .997 16 -- -- naCodeine .056 .064 13 -- -- naCotinine .043 .055 22 E(1) .004 E(1) .005 22Diphenhydramine .066 .098 39 -- -- na
Prescription pharmaceuticalsCarbamazepine .079 .077 2.6 -- -- na
Dehydronifedipine E(1) .006 E(1) .007 15 -- -- naDiltiazem E(3) .026 E(3) .039 40 -- -- naFluoxetine -- -- na -- -- naRanitidine E(3) .019 E(3) .025 27 -- -- naSalbutamol E(2) .009 E(2) .010 10 -- -- na
AntibioticsSulfamethoxazole -- -- na -- -- na
Trimethoprim .105 .121 14 -- -- na
Compounds analyzed at the USGS OGRLMacrolide antibioticsAzithromycin .239 .180 28 -- -- --Erythromycin .015 .017 12 -- -- na
Erythromycin-H2O (anhydro-erythromycin)1 .025 .020 22 -- -- naTylosin -- -- na .025 .018 33
Quinoline antibioticsCiprofloxacin .075 .101 30 -- -- naOfloxacin .171 .204 18 -- -- na
Sulfonamide antibioticsSulfadiazine .121 .164 30 -- -- na
Sulfamethoxazole .355 .508 35 -- -- na
Other antibioticsTrimethoprim .140 .153 8.9 -- -- na
PharmaceuticalsCarbamazepine .164 .187 13 -- -- na
Ibuprofen .277 .366 28 -- -- na
1Degradation product.2Para-xanthine also known as 1,7 dimethylxanthine.

16 Concentrations of Selected Pharmaceuticals and Antibiotics in South-Central Pennsylvania, March Through September 2006
Table 8. Pharmaceutical and antibiotic recoveries in the laboratory-spiked environmental sample analyzed at the USGS National Wa-ter Quality Laboratory in Denver, Colorado.
[Less-than values were set equal to zero for calculations. E(1), concentration is below the long-term method detection limit (for information-rich methods only); E(3), median long-term recovery of the compound is between 30 and 60 percent or the relative standard deviation of long-term recoveries was greater than 25 percent; <, less than; shading indicates detection in primary environmental sample and subsequent addition to the theoretical concentration]
Concentration, in micrograms per liter
Measuredconcentration
Primary in laboratory-
environmental spiked sample Theoretical
environmental Middle Calculated concentration in Recovery, in Analyte sample,
Spring Creek concentration laboratory-spiked percentMiddle 015693158 in spike environmental
Spring Creek5/10/06 sample
0156931581030
5/10/061035
A B (A + B) = C (D/C) X 100D
Human and veterinary drugs
Nonprescription pharmaceuticalsAcetaminophen E(1) 0.008 0.257 0.265 0.269 100
Caffeine < .015 .257 .257 .280 1101,2Para-xanthine < .021 .257 .257 .243 95
Codeine .029 .257 .286 .293 100
Cotinine E(1) .004 .257 .261 .251 96
Diphenhydramine .071 .257 .328 .196 60
Prescription pharmaceuticalsCarbamazepine .108 .257 .365 .263 72
Dehydronifedipine < .022 .257 .257 .299 120
Diltiazem E(3) .032 .257 .289 E(3) .148 51
Fluoxetine < .016 .257 .257 E(3) .009 3.5
Ranitidine E(3) .051 .257 .308 E(3) .158 51
Salbutamol E(1) .005 .257 .262 .264 100
Thiabendazole < .025 .257 .257 .097 38
Warfarin < .019 .257 .257 E(3) .229 89
AntibioticsSulfamethoxazole .552 .257 .809 .621 77
Trimethoprim .117 .257 .374 .291 78
1Degradation product. 2Para-xanthine also known as 1,7 dimethylxanthine.

Results for Quality-Control Samples 17
fluoxetine (all non-detects), ranitidine, and diltiazem in table 6 will be qualified as estimated values. The low recovery for thi-abendazole in laboratory-spiked environmental samples is believed to be mainly because of field-matrix effects because mean long-term method performance has been acceptable for this compound (83 percent).
Tables 9 and 10 show calculated “apparent” recoveries or “matrix” effects of antibiotics and pharmaceuticals from sam-ples analyzed at the OGRL that were collected at the upstream station at Snitz Creek on March 16, 2006 (table 9), and at the downstream station at Snitz Creek on May 1, 2006 (table 10). In general, laboratory-spiked environmental samples (matrix spikes) provide information to evaluate method sample perfor-mance in environmental matrices. The recovery data from lab-oratory-spiked environmental samples, in conjunction with sur-rogate standard recoveries, is also used by OGRL chemists to determine if standard addition will be run on the sample in a next tier of work to better quantify the results and provide a higher degree of certainty in the occurrence and concentration of the compounds.
The recoveries of the two laboratory-spiked environmental samples (tables 9 and 10) were generally within ±40 percent of the spiked concentration. Azithromycin, chloramphenicol, ibu-profen, lincomycin, ormetoprim, tylosin, and trimethoprim exhibited the widest variation in “apparent” recoveries or “matrix” effects with variations from 18 to 220 percent of the spiked concentrations. Because of refinements of data prior to release, using standard addition, no OGRL results need to be qualified (Michael Meyer, U.S. Geological Survey, oral com-mun., May 2007).
Laboratory Quality Control
Summary statistics for surrogate (carbamazepine-d10 and ethyl nicotinate-d4) spike recoveries by site type (and upstream and downstream) for samples collected for this study and long-term recoveries in NWQL reagent spikes are shown in table 11. Surrogate recoveries from laboratory reagent spikes (LRS) reflect the absence of any sample matrix components, such as dissolved organic matter, that can affect the recovery of the sur-rogates and, by extension, the ambient pharmaceuticals.
Overall, recoveries of carbamazepine-d10 and ethyl nico-tinate-d4 in samples from this study were acceptable when com-pared to the long-term surrogates recoveries in LRS. In stream-water samples, mean and median carbamazepine-d10 recover-ies decreased at sites downstream from municipal-wastewater effluents, which may reflect the effect of the wastewater matrix on carbamazepine-d10 recoveries. Also, standard deviations and relative standard deviations (relative standard deviation equal to the standard deviation divided by the mean surrogate recovery) of carbamazepine-d10 in samples collected upstream and downstream from municipal-wastewater effluents were within two and three standard deviations, respectively, from that seen in laboratory reagent spikes.
Stream water from the Killinger Creek downstream loca-tion had the lowest consistent surrogate carbamazepine-d10 recoveries for the study—an average of 44 percent recovery for the four seasonal samples—that could indicate positive or neg-ative bias in reported concentrations in one or more compounds resulting from matrix effects. Carbamazepine-d10 recoveries in streams receiving runoff from animal-feeding operations did not demonstrate upstream versus downstream differences. Mean and median recoveries of ethyl nicotinate-d4 were rela-tively uniform in all stream-water samples. Recoveries of both surrogates were highest in well-water samples from wells in agricultural areas used to supply livestock and were equal to or better than the recoveries of the surrogate recoveries in LRS samples. Overall, the surrogate data for the samples in this study indicate that the method performed well (Edward Furlong, U.S. Geological Survey, oral commun., 2007).
Long-term mean recoveries and standard deviations for pharmaceutical and antibiotic compounds in LRSs varied by compound at the NWQL and OGRL. Summary statistics have been compiled for recoveries of method pharmaceuticals calcu-lated from 157 LRSs extracted and analyzed over a 1-year period (May 3, 2005–May 4, 2006) at the NWQL. “Long-term mean” recoveries for NWQL reagent spikes for pharmaceutical and antibiotic compounds ranged from 22 to 92 percent; the maximum standard deviation was 21 percent. Reported long-term mean recoveries of individual compounds analyzed at the USGS NWQL should be considered when interpreting results because there is the potential for the actual concentrations to be higher than reported. Although this data set does not cover the period of sample analyses, similar performance is expected because the methodology remained unchanged during sample analyses (Edward Furlong, U.S. Geological Survey, written commun., August 14, 2007).
Long-term mean “apparent” recoveries for the 28 com-pounds analyzed at the USGS OGRL have been calculated for the period February 2006–December 2006 for 25 to 29 LRS samples. The long-term mean recoveries generally reflect the recoveries found in LRSs during sample analyses at the OGRL (Michael Meyer, U.S. Geological Survey, oral commun., August 21, 2007). The mean recoveries ranged from 82 to 134 percent of the expected spiked concentrations. The percent standard deviations ranged from 17 to 37 percent for 21 of the compounds. The percent standard deviation ranged from 42 to 93 percent for azithromycin, roxithromycin, tylosin, and virgin-iamycin (four macrolides); the percent standard deviation for sulfadiazine was 61 percent, which was the earliest eluting and lowest responding compound, and ibuprofen and chloram-phenicol, the only two compounds analyzed in negative-ion mode, had percent standard deviations of 67 and 117 percent, respectively. As a research method, the analyzed compounds are being evaluated for 1) their environmental significance, 2) their method performance, and 3) the performance of specific compounds to the internal standards used for quantitation in varied matrices. Although the standard deviations for some of the compounds are larger than 40 percent, for the 4 macrolides, most of the increased deviation resulted from low values from

18 Concentrations of Selected Pharmaceuticals and Antibiotics in South-Central Pennsylvania, March Through September 2006
Table 9. Antibiotic and pharmaceutical recoveries in the laboratory-spiked environmental sample collected in March 2006 from Creek and analyzed at the U.S. Geological Survey Organic Geochemistry Research Laboratory in Lawrence, Kansas.
Snitz
[Less-than values were set equal to zero for calculations. <, less than]
Analyte
Concentration, in micrograms per liter
Primary Environmental
sample Snitz Creek
01574050 3/16/06
1031
Actual Concentration in laboratory-
Theoretical spiked Calculated concentration in environmental
concentration laboratory- sample,in spike spiked Snitz Creek
environmental 01574050sample 3/16/06
1032
Recovery, in percent
A B (A + B) = C D (D/C) X 100
Macrolide antibioticsAzithromycin < 0.005 0.2 0.2 0.449 220
Total Erythromycin (parent and 1 degradate) < .008 .2 .2 .152 76
Roxithromycin < .005 .2 .2 .110 55
Tylosin < .005 .2 .2 .108 54
Virginiamycin < .005 .2 .2 .315 160
Quinoline antibioticsCiprofloxacin < .005 .2 .2 .308 150
Enrofloxacin < .005 .2 .2 .183 92
Lomefloxacin < .005 .2 .2 .295 150
Norfloxacin < .005 .2 .2 .348 170
Ofloxacin < .005 .2 .2 .328 160
Sarafloxacin < .005 .2 .2 .237 120
Sulfonamide antibioticsSulfachloropyridazine < .005 .2 .2 .121 60
Sulfadiazine < .050 .2 .2 .181 90
Sulfadimethoxine < .005 .2 .2 .141 70
Sulfamethazine < .005 .2 .2 .145 72
Sulfamethoxazole < .005 .2 .2 .139 70
Sulfathiazole < .020 .2 .2 .115 58
Tetracycline antibiotics and degradation productsTotal Chlorotetracycline(parent and 3 degradates)
< .010 .2 .2 .262 130
Doxycycline < .010 .2 .2 .244 120
Oxytetracycline < .010 .2 .2 .239 120
Tetracycline < .010 .2 .2 .339 170
Other antibioticsChloramphenicol < .050 .2 .2 .071 36
Lincomycin < .005 .2 .2 .035 18
Ormetoprim < .005 .2 .2 .109 54
Trimethoprim < .005 .2 .2 .088 44
PharmaceuticalsCarbamazepine < .005 .2 .2 .111 56
Ibuprofen < .050 .2 .2 .069 34

Results for Quality-Control Samples 19
Table 10. Antibiotic and pharmaceutical recoveries in the laboratory-spiked environmental sample collected in May 2006 from Snitz Creek and analyzed at U.S. Geological Survey Organic Geochemistry Research Laboratory in Lawrence, Kansas.
[Less-than values were set equal to zero for calculations. <, less than; shading indicates detection in primary environmental sample and subsequent addition to the theoretical concentration]
Analyte
Concentration, in micrograms per liter
Primary environmental
sampleSnitz Creek
015740555/01/06
1246
Actual concentration in laboratory-
Theoretical spiked Calculated concentration in environmental
concentration laboratory-spiked sample, in spike environmental Snitz Creek
sample 015740555/01/06
1247
Recovery, in percent
A B (A + B) = C D (D/C) X 100
Macrolide antibioticsAzithromycin < 0.005 0.2 0.2 0.106 53
Total Erythromycin (parent and 1 degradate) < .008 .2 .2 .140 70
Roxithromycin < .005 .2 .2 .170 85
Tylosin .027 .2 .227 .365 160
Virginiamycin < .005 .2 .2 .150 75
Quinoline antibioticsCiprofloxacin < .005 .2 .2 .219 110
Enrofloxacin < .005 .2 .2 .288 140
Lomefloxacin < .005 .2 .2 .166 83
Norfloxacin < .005 .2 .2 .151 76
Ofloxacin < .005 .2 .2 .186 93
Sarafloxacin < .005 .2 .2 .189 94
Sulfonamide antibiotics Sulfachloropyridazine < .005 .2 .2 .269 130
Sulfadiazine < .050 .2 .2 .266 130
Sulfadimethoxine < .005 .2 .2 .244 120
Sulfamethazine < .005 .2 .2 .334 170
Sulfamethoxazole < .005 .2 .2 .229 110
Sulfathiazole < .020 .2 .2 .277 140
Tetracycline antibiotics and degradation productsTotal Chlorotetracycline(parent and 3 degradates)
< .010 .2 .2 .254 130
Doxycycline < .010 .2 .2 .292 150
Oxytetracycline < .010 .2 .2 .202 100
Tetracycline < .010 .2 .2 .236 120
Other antibioticsChloramphenicol < .050 .2 .2 .155 78
Lincomycin < .005 .2 .2 .107 54
Ormetoprim < .005 .2 .2 .334 170
Trimethoprim < .005 .2 .2 .338 170
PharmaceuticalsCarbamazepine < .005 .2 .2 .289 140
Ibuprofen < .050 .2 .2 .202 100

20 Concentrations of Selected Pharmaceuticals and Antibiotics in South-Central Pennsylvania, March Through September 2006
4 to 6 of the 25 samples. The large deviation from the expected concentration for ibuprofen and chloramphenicol was generally because of underestimated concentrations. Because of the use of close monitoring of the matrix spiked samples, surrogate standards, and the use of standard addition, the data for these six compounds have not been qualified.
Concentrations of Selected Pharmaceuticals and Antibiotics
Water samples were analyzed for 14 pharmaceuticals and 2 antibiotics at the USGS NWQL and 2 pharmaceuticals and 31 antibiotics (including degradation products) at the USGS OGRL. Data for all sites sampled are shown in table 6 at the end of this report. Results from respective laboratories are distin-guished in the table by analyzing-agency sample codes (NWQL or OGRL). The USGS NWQL has established a data reporting convention described in Childress and others (1999). A qualify-ing remark code (‘E’ = estimated) is used for semi-quantitative analytical results to denote the following:
• E(1) if concentration is below the long-term MDL (for information-rich methods only);
• E(2) if the concentration is greater than or equal to the long-term MDL but less than the MRL (lowest calibration standard is less than the MRL);
• E(3) if the median long-term recovery of the compound is between 30 and 60 percent or the relative standard deviation of long-term recoveries was greater than 25 percent,
• E(4) if data are reported above the MRL, but there was a failure in some aspect of lab quality control (for example, the laboratory-spike or surrogate recov-eries were low and the sample could not be re-ana-lyzed).
Two antibiotics, sulfamethoxazole and trimethoprim, and one pharmaceutical, carbamazepine, were part of both laboratory schedules; therefore, analyses were completed for 15 unique pharmaceuticals and 31 unique antibiotics. For the purposes of counting numbers of compounds detected over the course of the study, the antibiotics sulfamethoxazole and trimethoprim were counted as detected if they were detected at the OGRL regard-less if they were detected at the NWQL. The detection limit for
Table 11. Summary statistics for surrogate-spike recoveries by site type from samples collected for this study and from evaluation of long-term recoveries for U.S. Geological Survey National Water Quality Laboratory (NWQL) reagent spikes.
Streams receiving municipal Streams receiving runoff from Wells in Long-term
Surrogate wastewater effluent animal-feeding operations agricultural NWQL spike Statistics areas used
laboratory compounds to supply
reagent spikes Upstream Downstream Upstream Downstreamlivestock
Recovery, in percent
Carbamazepine-d10 Maximum 120 110 120 120 95 120
Median 98 98 85 100 96 110
Mean 98 94 79 96 95 110
Minimum 80 55 34 64 66 92
Standard deviation 7.4 15 22 12 10 6.9of recovery (percent)
Relative standard 7.6 16 28 13 10 6.5deviation of recovery (percent)
Ethyl nicotinate-d4 Maximum 117 110 110 120 120 110
Median 86 85 82 89 90 100
Mean 85 87 81 89 92 100
Minimum 51 72 47 61 75 88
Standard deviation 13 7.7 15 12 10 6.6of recovery (percent)
Relative standard 15 8.8 19 13 11 6.6deviation of recovery (percent)

Concentrations of Selected Pharmaceuticals and Antibiotics 21
these compounds was lower at the OGRL than at the NWQL and all the other antibiotics were analyzed at the OGRL. The pharmaceutical carbamazepine was counted as detected if it was detected a the NWQL regardless if it was detected at the OGRL. Except for ibuprofen, all pharmaceuticals were ana-lyzed at the NWQL.
Water Quality in Streams
A statistical summary of the reported concentrations of compounds detected in samples from streams and a summary of the numbers of detections are shown in tables 12 and 13. Detec-tions include estimated results and concentrations greater than the MRL. In these tables, counts of numbers of samples, num-bers of detections, and statistics related to concentrations of analytes do not include data for Conoy Creek, because the downstream site did not include outflow from a wastewater-treatment plant. For each compound, there were 44 samples from upstream locations (20 samples from streams receiving municipal-wastewater effluent and 24 samples from streams receiving runoff from animal-feeding operations) and 44 sam-ples from downstream locations (20 samples from streams receiving municipal-wastewater effluent and 24 samples from streams receiving runoff from animal-feeding operations). For the purpose of calculating medians, results reported as “less than” values were set equal to zero. For concentrations above the MRL and for estimated values, the actual concentration reported was used for determining the median. All assigned concentrations were ordered, and the median was selected.
In stream samples, 13 pharmaceuticals and 11 antibiotics were detected at least 1 time during the study. For pharmaceu-ticals, caffeine and para-xanthine (a degradation product of caf-feine) had the largest concentrations (both in the same sam-ple)—4.75 µg/L and 0.853 µg/L, respectively—followed by carbamazepine (OGRL) (0.516 µg/L) and ibuprofen (0.277 µg/L) (table 12). All of these pharmaceuticals were detected as maximum concentrations downstream of wastewa-ter effluent. Although the pharmaceuticals acetaminophen, caf-feine, cotinine, diphenhydramine, and carbamazepine were detected in some streams receiving runoff from animal-feeding operations, concentrations of these compounds were low (max-imum concentration equalled 0.053 µg/L).
A summary of detections for the 88 stream-water samples (11 streams with samples at upstream and downstream loca-tions over 4 seasons) is presented in table 13. The pharmaceuti-cal carbamazepine was detected in 23 samples (6 detections from upstream locations and 17 detections from downstream locations). Caffeine was detected in 14 samples (3 detections from upstream locations and 11 detections from downstream locations). Diphenhydramine was detected in 14 samples (1 detection from an upstream location and 13 detections from downstream locations).
Azithromycin had the highest concentration analyzed for antibiotic compounds—1.65 µg/L—followed by sulfamethox-azole (1.34 µg/L), ofloxacin (0.329 µg/L), and trimethoprim
(0.256 µg/L) (table 12). In some streams receiving runoff from animal-feeding operations, oxytetracycline, sulfadimethoxine, sulfamethoxazole, and tylosin were detected, but with one exception (sulfamethoxazole [OGRL—0.157 µg/L]), concen-trations of antibiotics were low (maximum concentration of E(4) 0.039 µg/L).
The antibiotic sulfamethoxazole was detected in 21 sam-ples (4 detections from upstream locations and 17 detections from downstream locations). Trimethoprim was detected in 17 samples (1 detection from an upstream location and 16 detec-tions from downstream locations). Ofloxacin was detected in 17 samples (1 detection from an upstream location and 16 detec-tions from downstream locations). Erythromycin-H2O was detected in 12 samples (1 detection from an upstream location and 11 detections from downstream locations). Azithromycin was detected in 11 samples (11 detections from downstream locations).
Some compounds were not detected above the MRLs in any stream samples. The compounds not detected were two pharmaceuticals (fluoxetine and thiabendazole), and for the antibiotics, two macrolides (roxithromycin and virginiamycin), four quinolines (enrofloxacin, lomefloxacin, norfloxacin, and sarafloxacin), three sulfonamides (sulfachloropyridazine, sul-famethazine, and sulfathiazole), and all the tetracyclines and degradation products with the exception of oxytetracycline, chloramphenicol, lincomycin, and ormetoprim.
Water Quality in Wells
A statistical summary of the reported concentrations of compounds detected in samples collected at well-water sites sampled is shown in table 14. Four compounds were detected in well water over the course of the project. Two wells had one detection of two different pharmaceuticals, cotinine and diphenhydramine, which were detected at estimated concentra-tions under the compound MRLs, E(2) 0.024 µg/L and E(1) 0.003 µg/L, respectively. A third well had detections of the antibiotics tylosin (0.017 µg/L) and sulfamethoxazole (0.006 µg/L), and a fourth well had one detection of tylosin (0.012 µg/L). Two wells had no detections of any pharmaceuti-cal or antibiotic compounds.
Water Quality at All Sites
Concentration maximums and minimums for compounds with detections, numbers of seasonal samples with detections, and number of compounds detected are shown in table 15 for individual streams and wells sampled. Seventy-eight percent of all detections were analyzed in samples collected downstream from municipal-wastewater effluents. At the downstream loca-tions, Killinger Creek had the greatest number of pharmaceuti-cal and antibiotic compounds detected in samples analyzed dur-ing the course of the study–20; followed by Lititz Run, 17; Middle Spring Creek, 14; Spring Creek, 12; and Mountain Creek, 6. Downstream locations with multiple maximum com-

22Concentrations of Selected Pharm
aceuticals and Antibiotics in South-Central Pennsylvania, M
arch Through September 2006
Table 12. Summary statistics for concentrations of selected pharmaceuticals and antibiotics analyzed at the U.S. Geological Survey National Water Quality Laboratory and Organic Geochemistry Laboratory for stream-water sites, south-central Pennsylvania, 2006.
[Concentrations are in micrograms per liter; compounds in italics were analyzed by both laboratories; <, less than; shading indicates one or more detections (E-coded [estimated] or above minimum reporting lev-el); E(1), concentration is below the long-term method detection limit (for information-rich methods only); E(2), concentration is greater than or equal to the long-term method detection limit but less than the min-imum reporting level (lowest calibration standard is less than the minimum reporting level); E(3), the median long-term recovery of the compound is between 30 and 60 percent or the relative standard deviation of long-term recoveries was greater than 25 percent; E(4), data are reported above the minimum reporting level, but there was a failure in some aspect of laboratory quality control (for example, the laboratory-spike or surrogate recoveries were low and the sample could not be re-analyzed); --, not available; U, upstream; D, downstream]
Long-term Standard Summary statisticsMethod Minimum Number of
mean deviation of detection reporting samples Streams receiving municipal- Streams receiving runoff from recovery in percent
limit, level, Loca- (surface- wastewater effluent2 animal-feeding operationsAnalyte laboratory recoveries in
in in tion water site reagent laboratory micrograms micrograms types spikes, reagent Minimum Median Maximum Minimum Median Maximum
per liter per liter combined)1in percent spikes
Compounds analyzed at the U.S. Geological Survey National Water Quality Laboratory Human and veterinary drugs Nonprescription pharmaceuticalsAcetaminophen 0.012 0.024 67 14 U 44 < 0.024 < 0.024 0.048 < 0.024 < 0.024 < 0.024
.012 .024 D 44 < .024 < .024 .098 < .024 < .024 E(2) .018Caffeine .008 .015 92 16 U 44 < .015 < .015 .065 < .015 < .015 .019
.008 .015 D 44 < .015 < .015 4.75 < .015 < .015 .0533,4 Para-xanthine .010 .021 84 21 U 44 < .021 < .021 E(2) .019 < .021 < .021 < .021
.010 .021 D 44 < .021 < .021 .853 < .021 < .021 < .021Codeine .011 .022 77 11 U 44 < .022 < .022 < .022 < .022 < .022 < .022
.011 .022 D 44 < .022 < .022 .155 < .022 < .022 < .022Cotinine .014 .028 92 11 U 44 < .028 < .028 E(1) .010 < .028 < .028 < .028
.014 .028 D 44 < .028 < .028 .043 < .028 < .028 E(1) .007Diphenhydramine .012 .023 60 8 U 44 < .023 < .023 < .023 < .023 < .023 E(1) .010
.012 .023 D 44 < .023 E(2) .014 .135 < .023 < .023 < .023
Prescription pharmaceuticals Carbamazepine .009 .018 85 10 U 44 < .018 < .018 E(2) .009 < .018 < .018 E(4) .025
.009 .018 D 44 < .018 .042 .276 < .018 < .018 E(1) .005Dehydronifedipine .011 .022 78 12 U 44 < .022 < .022 < .022 < .022 < .022 < .022
.011 .022 D 44 < .022 < .022 E(2) .015 < .022 < .022 < .022Diltiazem .009 .018 37 15 U 44 < .018 < .018 < .018 < .018 < .018 < .018
.009 .018 D 44 < .018 < .018 E(3) .079 < .018 < .018 < .018Fluoxetine -- .016 22 13 U 44 < .016 < .016 < .016 < .016 < .016 < .016
-- .016 D 44 < .016 < .016 < .016 < .016 < .016 < .016Ranitidine -- .025 30 12 U 44 < .025 < .025 < .025 < .025 < .025 < .025
-- .025 D 44 < .025 < .025 E(3) .051 < .025 < .025 < .025Salbutamol .007 .014 70 14 U 44 < .014 < .014 < .014 < .014 < .014 < .014
.007 .014 D 44 < .014 < .014 E(2) .012 < .014 < .014 < .014Thiabendazole .012 .025 83 11 U 44 < .025 < .025 < .025 < .025 < .025 < .025
.012 .025 D 44 < .025 < .025 < .025 < .025 < .025 < .025Warfarin .009 .019 53 17 U 44 < .019 < .019 < .019 < .019 < .019 < .019
.009 .019 D 44 < .019 < .019 E(3) .030 < .019 < .019 < .019

Concentrations of Selected Pharmaceuticals and A
ntibiotics23
Table 12. Summary statistics for concentrations of selected pharmaceuticals and antibiotics analyzed at the U.S. Geological Survey National Water Quality Laboratory and Organic Geochemistry Laboratory for stream-water sites, south-central Pennsylvania, 2006.—Continued
[Concentrations are in micrograms per el); E(1), concentration is below the lonimum reporting level (lowest calibration standard is less thanlong-term recoveries was greater than 2or surrogate recoveries were low and th
Analyte
AntibioticsSulfamethoxazole
liter; compounds in italics were analg-term method detection limit (for i
the minimum 5 percent; E(4), data are reported abe sample could not be re-analyzed);
Method Minimum detection reporting
limit, level, in in
micrograms micrograms per liter per liter
0.012 0.024
yzed by both lanformation-richreporting level); E(3), theove the minimu--, not availabl
Long-term mean
recovery in laboratory
reagent spikes,
in percent
74
boratories; <, le methods only);
medim reporting lev
e; U, upstream;
Standard deviation of
percent recoveries in
laboratory reagent spikes
11
ss than; sh E(2), concan long-terel, but therD, downstream]
Loca-tion
U
m recovery ofe was a failur
Number of samples (surface-water site
types combined)1
44
ading indicates one or more detections (E-coded [estimated] or above minimum reporting lev-entration is greater than or equal to the long-term method detection limit but less than the min-
the compound is between 30 and 60 percent or the relative standard deviation of e in some aspect of laboratory quality control (for example, the laboratory-spike
Summary statistics
Streams receiving municipal- Streams receiving runoff from wastewater effluent2 animal-feeding operations
Minimum Median Maximum Minimum Median Maximum
< 0.024 < 0.024 E(2) 0.022 < 0.024 < 0.024 E(4) 0.039.012 .024 D 44 < .024 .025 0.552 < .024 < .024 E(1) .008
Trimethoprim .010 .020 86 10 U 44 < .020 < .020 < .020 < .020 < .020 < .020
Macrolide antibioticsAzithromycin
.010 .020
Compounds analyzed
-- .005
at the U.S. Geological Survey
100 93
D 44 < .020
Organic Geochemistry Research
U 44 < .005
E(2) .016 .117
Laboratory
< .005 < .005
< .020
< .005
< .020
< .005
< .020
< .005-- .005 D 44 < .005 .026 1.65 < .005 < .005 < .005
Erythromycin -- .008 104 18 U 44 < .008 < .008 < .008 < .008 < .008 < .008-- .008 D 44 < .008 < .008 .016 < .008 < .008 < .008
Erythromycin-H203 -- .008 115 37 U 44 < .008 < .008 .011 < .008 < .008 < .008-- .008 D 44 < .008 .012 .168 < .008 < .008 < .008
Roxithromycin -- .005 95 49 U 44 < .005 < .005 < .005 < .005 < .005 < .005-- .005 D 44 < .005 < .005 < .005 < .005 < .005 < .005
Tylosin -- .005 136 70 U 44 < .005 < .005 .009 < .005 < .005 .017-- .005 D 44 < .005 < .005 .023 < .005 < .005 .027
Virginiamycin -- .005 108 42 U 44 < .005 < .005 < .005 < .005 < .005 < .005
Quinoline antibioticsCiprofloxacin
-- .005
-- .005 94 18
D
U
44
44
< .005
< .005
< .005
< .005
< .005
< .005
< .005
< .005
< .005
< .005
< .005
< .005-- .005 D 44 < .005 < .005 .182 < .005 < .005 < .005
Enrofloxacin -- .005 98 27 U 44 < .005 < .005 < .005 < .005 < .005 < .005-- .005 D 44 < .005 < .005 < .005 < .005 < .005 < .005
Lomefloxacin -- .005 99 20 U 44 < .005 < .005 < .005 < .005 < .005 < .005-- .005 D 44 < .005 < .005 < .005 < .005 < .005 < .005
Norfloxacin -- .005 94 22 U 44 < .005 < .005 < .005 < .005 < .005 < .005-- .005 D 44 < .005 < .005 < .005 < .005 < .005 < .005
Ofloxacin -- .005 100 22 U 44 < .005 < .005 .006 < .005 < .005 < .005-- .005 D 44 < .005 .020 .329 < .005 < .005 < .005
Sarafloxacin -- .005 96 17 U 44 < .005 < .005 < .005 < .005 < .005 < .005-- .005 D 44 < .005 < .005 < .005 < .005 < .005 < .005

24Concentrations of Selected Pharm
aceuticals and Antibiotics in South-Central Pennsylvania, M
arch Through September 2006
Table 12. Summary statistics for concentrations of selected pharmaceuticals and antibiotics analyzed at the U.S. Geological Survey National Water Quality Laboratory and Organic Geochemistry Laboratory for stream-water sites, south-central Pennsylvania, 2006.—Continued
[Concentrations are in micrograms per el); E(1), concentration is below the lonimum reporting level (lowest calibration standard is less thanlong-term recoveries was greater than 2or surrogate recoveries were low and th
Analyte
Sulfonamide antibioticsSulfachloropyridazine
liter; compounds in italics were anag-term method detection limit (for i
the minimum 5 percent; E(4), data are reported abe sample could not be re-analyzed);
Method Minimum detection reporting
limit, level, in in
micrograms micrograms per liter per liter
-- 0.005
lyzed by both lanformation-richreporting level)ove the minimu --, not availabl
Long-term mean
recovery in laboratory
reagent spikes,
in percent
110
boratories; <, les methods only); ; E(3), the mediam reporting lev
e; U, upstream;
Standard deviation of
percent recoveries in
laboratory reagent spikes
21
s than; shE(2), concn long-terel, but therD, downstream]
Loca-tion
U
m recovery ofe was a failur
Number of samples (surface-water site
types combined)1
44
ading indicates one or more detections (E-coded [estimated] or above minimum reporting lev-entration is greater than or equal to the long-term method detection limit but less than the min-
the compound is between 30 and 60 percent or the relative standard deviation of e in some aspect of laboratory quality control (for example, the laboratory-spike
Summary statistics
Streams receiving municipal- Streams receiving runoff from wastewater effluent2 animal-feeding operations
Minimum Median Maximum Minimum Median Maximum
< 0.005 < 0.005 < 0.005 < 0.005 < 0.005 < 0.005-- .005 D 44 < .005 < .005 < .005 < .005 < .005 < .005
Sulfadiazine -- .050 134 61 U 44 < .050 < .050 < .050 < .050 < .050 < .050-- .050 D 44 < .050 < .050 .121 < .050 < .050 < .050
Sulfadimethoxine -- .005 112 25 U 44 < .005 < .005 < .005 < .005 < .005 < .005-- .005 D 44 < .005 < .005 < .005 < .005 < .005 .026
Sulfamethazine -- .005 111 30 U 44 < .005 < .005 < .005 < .005 < .005 < .005-- .005 D 44 < .005 < .005 < .005 < .005 < .005 < .005
Sulfamethoxazole -- .005 122 28 U 44 < .005 < .005 .067 < .005 < .005 .157-- .005 D 44 < .005 .120 1.34 < .005 < .005 .019
Sulfathiazole -- .020 97 27 U 44 < .020 < .020 < .020 < .020 < .020 < .020
Tetracycline antibiotics and degradation Chlorotetracycline
Epi-chlorotetracycline (4-EC-tetracycline HCl)3
-- .020
products -- .010-- .010-- .010-- .010
Chlorotetra-cycline,
total = 103
Chlorotetra-cycline,
total = 36
D
UDUD
44
44444444
< .020
< .010< .010< .010< .010
< .020
< .010< .010< .010< .010
< .020
< .010< .010< .010< .010
< .020
< .010< .010< .010< .010
< .020
< .010< .010< .010< .010
< .020
< .010< .010< .010< .010
Epi-iso-chlorotetracycline (Iso-epi-chlorotetracycline)3
3Iso-chlorotetracycline
-- .010-- .010-- .010
UDU
444444
< .010< .010< .010
< .010< .010< .010
< .010< .010< .010
< .010< .010< .010
< .010< .010< .010
< .010< .010< .010
-- .010 D 44 < .010 < .010 < .010 < .010 < .010 < .010Doxycycline -- .010 104 32 U 44 < .010 < .010 < .010 < .010 < .010 < .010
-- .010 D 44 < .010 < .010 < .010 < .010 < .010 < .010Oxytetracycline -- .010 85 33 U 44 < .010 < .010 .040 < .010 < .010 < .010
-- .010 D 44 < .010 < .010 .010 < .010 < .010 .020Epi-oxytetracycline (4-Epi-
oxytetracycline)3-- .010-- .010
- - UD
4444
< .010< .010
< .010< .010
< .010< .010
< .010< .010
< .010< .010
< .010< .010
Tetracyclines -- .010 89 21 U 44 < .010 < .010 < .010 < .010 < .010 < .010-- .010 D 44 < .010 < .010 < .010 < .010 < .010 < .010
Epi-tetracycline (4-Epi-tetrecycline HCl)3
-- .010--
- - UD
4444
< .010< .010
< .010< .010
< .010< .010
< .010< .010
< .010< .010
< .010< .010

Concentrations of Selected Pharmaceuticals and A
ntibiotics25
Table 12. Summary statistics for concentrations of selected pharmaceuticals and antibiotics analyzed at the U.S. Geological Survey National Water Quality Laboratory and Organic Geochemistry Laboratory for stream-water sites, south-central Pennsylvania, 2006.—Continued
[Concentrations are in micrograms per lel); E(1), concentration is below the lonimum reporting level (lowest calibration standard is less thanlong-term recoveries was greater than 2or surrogate recoveries were low and th
Analyte
Other antibioticsChloramphenicol
iter; compounds in ig-term method detec
5 percent; E(4), datae sample could not
Method detection
limit, in
micrograms per liter
--
talics were analtion limit (for i the minimum
are reported abbe re-analyzed);
Minimum reporting
level, in
micrograms per liter
.050
yzed by both lanformation-richreporting level); E(3), theove the minimu--, not availabl
Long-term mean
recovery in laboratory
reagent spikes,
in percent
82
boratories; <, le methods only);
medim reporting lev
e; U, upstream;
Standard deviation of
percent recoveries in
laboratory reagent spikes
117
ss than; sh E(2), concan long-terel, but therD, downstr
Loca-tion
U
m recovery ofe was a failuream]
Number of samples (surface-water site
types combined)1
44
ading indicates one or more detections (E-coded [estimated] or above minimum reporting lev-entration is greater than or equal to the long-term method detection limit but less than the min-
the compound is between 30 and 60 percent or the relative standard deviation of e in some aspect of laboratory quality control (for example, the laboratory-spike
Summary statistics
Streams receiving municipal- Streams receiving runoff from wastewater effluent2 animal-feeding operations
Minimum Median Maximum Minimum Median Maximum
< 0.050 < 0.050 < 0.050 < 0.050 < 0.050 < 0.050-- .050 D 44 < .050 < .050 < .050 < .050 < .050 < .050
Lincomycin -- .005 100 37 U 44 < .005 < .005 < .005 < .005 < .005 < .005-- .005 D 44 < .005 < .005 < .005 < .005 < .005 < .005
Ormetoprim -- .005 83 34 U 44 < .005 < .005 < .005 < .005 < .005 < .005-- .005 D 44 < .005 < .005 < .005 < .005 < .005 < .005
Trimethoprim -- .005 85 32 U 44 < .005 < .005 .015 < .005 < .005 < .005
PharmaceuticalsCarbamazepine
--
--
.005
.005 98 25
D
U
44
44
< .005
< .005
.034
< .005
.256
.013
< .005
< .005
< .005
< .005
< .005
.021-- .005 D 44 < .005 .054 .516 < .005 < .005 .005
Ibuprofen -- .050 87 67 U 44 < .050 < .050 < .050 < .050 < .050 < .050-- .050 D 44 < .050
1Count does not include samples collected at upstream and downstream locations on Conoy Creek. The downstream site at Conoy Creek
< .050 .277 < .050 < .050 < .050
did not receive outflow from a wastewater-treatment plant.2Does not include results from samples collected at upstream and downstream locations on Conoy Creek. The downstream site at Conoy Creek did not receive outflow from a wastewater-treatment plant.3Degradation product. 4Para-xanthine also known as 1,7 dimethylxanthine.

26 Concentrations of Selected Pharmaceuticals and Antibiotics in South-Central Pennsylvania, March Through September 2006
Table 13. Summary of numbers of detections for selected pharmaceuticals and antibiotics for stream-water sites, south-central Pennsylvania, 2006.
[Compounds in italics were analyzed by both laboratories; <, less than; shading indicates one or more detections (E-coded [estimated] or above minimum report-ing level); U, upstream; D, downstream]
Detections (E-coded or above the minimum
reporting level)Method Minimum Number of Number of Number of detection reporting samples detections
detections limit, level, (surface- from Analyte Location from in in water site Number streams streams micrograms micrograms types of receiving receiving per liter per liter combined)1 2detections runoff from municipal
animal-wastewater feeding
effluent2operations
Compounds analyzed at the U.S. Geological Survey National Water Quality LaboratoryNonprescription pharmaceuticals Acetaminophen 0.012 0.024 U 44 1 1 0
.012 .024 D 44 9 5 4Caffeine .008 .015 U 44 3 1 2
.008 .015 D 44 11 7 43,4Para-xanthine .010 .021 U 44 1 1 0
.010 .021 D 44 1 1 0Codeine .011 .022 U 44 0 0 0
.011 .022 D 44 9 9 0Cotinine .014 .028 U 44 1 1 0
.014 .028 D 44 9 7 2Diphenhydramine .012 .023 U 44 1 0 1
.012 .023 D 44 13 13 0
Prescription pharmaceuticals Carbamazepine .009 .018 U 44 5 1 4
.009 .018 D 44 18 16 2Dehydronifedipine .011 .022 U 44 0 0 0
.011 .022 D 44 4 4 0Diltiazem .009 .018 U 44 0 0 0
.009 .018 D 44 10 10 0Fluoxetine -- .016 U 44 0 0 0
-- .016 D 44 0 0 0Ranitidine -- .025 U 44 0 0 0
-- .025 D 44 6 6 0Salbutamol .007 .014 U 44 0 0 0
.007 .014 D 44 4 4 0Thiabendazole .012 .025 U 44 0 0 0
.012 .025 D 44 0 0 0Warfarin .009 .019 U 44 0 0 0
.009 .019 D 44 1 1 0
AntibioticsSulfamethoxazole .012 .024 U 44 2 1 1
.012 .024 D 44 15 13 2
Trimethoprim .010 .020 U 44 0 0 0
.010 .020 D 44 12 12 0

Concentrations of Selected Pharmaceuticals and Antibiotics 27
Table 13. Summary of numbers of detections for selected pharmaceuticals and antibiotics for stream-water sites, south-central Pennsylvania, 2006.—Continued
[Compounds in italics were analyzed by both laboratories; <, less than; shading indicates one or more detections (E-coded [estimated] or above minimum report-ing level); U, upstream; D, downstream]
Detections (E-coded or above the minimum
reporting level)Method Minimum Number of Number of Number of detection reporting samples detections
detections limit, level, (surface- from Analyte Location from in in water site Number streams streams micrograms micrograms types of receiving receiving per liter per liter combined)1 2detections runoff from municipal
animal-wastewater feeding
effluent2operations
Compounds analyzed at the U.S. Geological Survey Organic Geochemistry Research LaboratoryMacrolide antibiotics Azithromycin -- 0.005 U 44 0 0 0
-- .005 D 44 11 11 0Erythromycin -- .008 U 44 0 0 0
-- .008 D 44 5 5 0Erythromycin-H203 -- .008 U 44 1 1 0
-- .008 D 44 11 11 0Roxithromycin -- .005 U 44 0 0 0
-- .005 D 44 0 0 0Tylosin -- .005 U 44 2 1 1
-- .005 D 44 5 3 2Virginiamycin -- .005 U 44 0 0 0
-- .005 D 44 0 0 0
Quinoline antibioticsCiprofloxacin -- .005 U 44 0 0 0
-- .005 D 44 7 7 0Enrofloxacin -- .005 U 44 0 0 0
-- .005 D 44 0 0 0Lomefloxacin -- .005 U 44 0 0 0
-- .005 D 44 0 0 0Norfloxacin -- .005 U 44 0 0 0
-- .005 D 44 0 0 0Ofloxacin -- .005 U 44 1 1 0
-- .005 D 44 16 16 0Sarafloxacin -- .005 U 44 0 0 0
-- .005 D 44 0 0 0
Sulfonamide antibioticsSulfachloropyridazine -- .005 U 44 0 0 0
-- .005 D 44 0 0 0Sulfadiazine -- .050 U 44 0 0 0
-- .050 D 44 1 1 0Sulfadimethoxine -- .005 U 44 0 0 0
-- .005 D 44 2 0 2Sulfamethazine -- .005 U 44 0 0 0
-- .005 D 44 0 0 0Sulfamethoxazole -- .005 U 44 4 2 2
-- .005 D 44 17 16 1Sulfathiazole -- .020 U 44 0 0 0
-- .020 D 44 0 0 0

28 Concentrations of Selected Pharmaceuticals and Antibiotics in South-Central Pennsylvania, March Through September 2006
Table 13. Summary of numbers of detections for selected pharmaceuticals and antibiotics for stream-water sites, south-central Pennsylvania, 2006.—Continued
[Compounds in italics were analyzed by both laboratories; <, less than; shading indicates one or more detections (E-coded [estimated] or above minimum report-ing level); U, upstream; D, downstream]
Detections (E-coded or above the minimum
reporting level)Method Minimum Number of Number of Number of detection reporting samples detections
detections limit, level, (surface- from Analyte Location from in in water site Number streams streams micrograms micrograms types of receiving receiving per liter per liter combined)1 2detections runoff from municipal
animal-wastewater feeding
effluent2operations
Tetracycline antibiotics and degradation products Chlorotetracycline -- 0.010 U 44 0 0 0
-- .010 D 44 0 0 0Epi-chlorotetracycline (4-EC-tetracycline -- .010 U 44 0 0 0
HCl)3 -- .010 D 44 0 0 0Epi-iso-chlorotetracycline (Iso-epi- -- .010 U 44 0 0 0
chlorotetracycline)3 -- .010 D 44 0 0 03Iso-chlorotetracycline -- .010 U 44 0 0 0
-- .010 D 44 0 0 0Doxycycline -- .010 U 44 0 0 0
-- .010 D 44 0 0 0Oxytetracycline -- .010 U 44 1 1 0
-- .010 D 44 2 1 1Epi-oxytetracycline (4-Epi-oxytetracycline)3 -- .010 U 44 0 0 0
-- .010 D 44 0 0 0Tetracyclines -- .010 U 44 0 0 0
-- .010 D 44 0 0 0Epi-tetracycline (4-Epi-tetracycline HCl)3 -- .010 U 44 0 0 0
-- .010 D 44 0 0 0
Other antibioticsChloramphenicol -- .050 U 44 0 0 0
-- .050 D 44 0 0 0Lincomycin -- .005 U 44 0 0 0
-- .005 D 44 0 0 0Ormetoprim -- .005 U 44 0 0 0
-- .005 D 44 0 0 0
Trimethoprim -- .005 U 44 1 1 0
-- .005 D 44 16 16 0
PharmaceuticalsCarbamazepine -- .005 U 44 6 3 3
-- .005 D 44 17 16 1Ibuprofen -- .050 U 44 0 0 0
-- .050 D 44 1 1 0
1Count does not include samples collected at upstream and downstream locations on Conoy Creek. The downstream site at Conoy Creek did not receive out-flow from a wastewater-treatment plant.
2Does not include results from samples collected at upstream and downstream locations on Conoy Creek. The downstream site at Conoy Creek did not re-ceive outflow from a wastewater-treatment plant.
3Degradation product. 4Para-xanthine also known as 1,7 dimethylxanthine.

Concentrations of Selected Pharmaceuticals and Antibiotics 29
Table 14. Summary statistics for concentrations and numbers of detections of pharmaceuticals and antibiotics analyzed at the U.S. Geo-logical Survey National Water Quality and Organic Geochemistry Research Laboratories for well-water sites, south-central Pennsylva-nia, 2006.
[Compounds in italics were analyzed by both laboratories; <, less than; shading indicates one or more detections (E-coded [estimated] or above minimum report-ing level); E(1), concentration is below the long-term method detection limit (for information-rich methods only); E(2), concentration is greater than or equal to the long-term method detection limit but less than the minimum reporting level (lowest calibration standard is less than the minimum reporting level); --, not avail-able]
AnalyteNumber
of samples
Method detection
limit, in
micrograms per liter
Minimum reporting
level, in
micrograms per liter
Number of detections
Long-term mean
recovery in laboratory
reagent spikes, in percent
Standard deviation of
percent recoveries
in laboratory
reagent spikes
Concentrations, in micrograms per liter
Wells in agricultural areas used to supply livestock
Minimum Median Maximum
Compounds analyzed at the U.S. Geological Survey National Water Quality LaboratoryHuman and veterinary drugs Nonprescription pharmaceuticalsAcetaminophenCaffeine
1,2Para-xanthineCodeineCotinineDiphenhydramine
242424242424
0.012.008.010.011.014.012
0.024.015.021.022.028.023
000011
679284779260
14162111118
< 0.024< .015< .021< .022< .028< .023
< 0.024< .015< .021< .022< .028< .023
< 0.024< .015< .021< .022
E(2) .024E(1) .003
Prescription pharmaceuticals Carbamazepine DehydronifedipineDiltiazemFluoxetineRanitidineSalbutamolThiabendazoleWarfarin
24
24242424242424
.009
.011
.009----
.007
.012
.009
.018
.022
.018
.016
.025
.014
.025
.019
0
0000000
85
78372230708353
10
12151312141117
< .018
< .022< .018< .016< .025< .014
< .025< .019
<
< < < < < < <
.018
.022
.018
.016
.025
.014
.025
.019
< .018
< .022< .018< .016< .025< .014
< .025< .019
AntibioticsSulfamethoxazole
Trimethoprim2424
.012
.010.024.020
00
7486
1110
< .024< .020
< <
.024
.020< .024< .020
Compounds analyzed at the U.S. Geological Survey Organic Geochemistry Research LaboratoryMacrolide antibiotics AzithromycinErythromycin
Erythromycin-H201
RoxithromycinTylosinVirginiamycin
242424242424
------------
.005
.008
.008
.005
.005
.005
000020
100104115
95136108
931837497042
< .005< .008< .008
< .005< .005< .005
< < < < < <
.005
.008
.008
.005
.005
.005
< .005< .008< .008
< .005.017
< .005
Quinoline antibiotics CiprofloxacinEnrofloxacinLomefloxacinNorfloxacinOfloxacinSarafloxacin
242424242424
------------
.005
.005
.005
.005
.005
.005
000000
94989994
10096
182720222217
< .005< .005< .005< .005< .005< .005
< < < < < <
.005
.005
.005
.005
.005
.005
< .005< .005< .005< .005< .005< .005
Sulfonamide antibiotics SulfachloropyridazineSulfadiazineSulfadimethoxineSulfamethazine
Sulfamethoxazole Sulfathiazole
2424242424
24
-- .005-- .050-- .005-- .005-- .005
-- .020
00001
0
110134112111122
97
2161253028
27
< .005< .050< .005< .005< .005
< .020
< < < < <
<
.005
.050
.005
.005
.005
.020
< .005< .050< .005< .005
.006
< .020

30 Concentrations of Selected Pharmaceuticals and Antibiotics in South-Central Pennsylvania, March Through September 2006
Table 14. Summary statistics for concentrations and numbers of detections of pharmaceuticals and antibiotics analyzed at the U.S. Geo-logical Survey National Water Quality and Organic Geochemistry Research Laboratories for well-water sites, south-central Pennsylva-nia, 2006.
[Compounds in italics were analyzed by both laboratories; <, less than; shading indicates one or more detections (E-coded [estimated] or above minimum report-ing level); E(1), concentration is below the long-term method detection limit (for information-rich methods only); E(2), concentration is greater than or equal to the long-term method detection limit but less than the minimum reporting level (lowest calibration standard is less than the minimum reporting level); --, not avail-able]
AnalyteNumber
of samples
Method detection
limit, in
micrograms per liter
Minimum reporting
level, in
micrograms per liter
Number of detections
Long-term mean
recovery in laboratory
reagent spikes, in percent
Standard deviation of
percent recoveries
in laboratory
reagent spikes
Concentrations, in micrograms per liter
Wells in agricultural areas used to supply livestock
Minimum Median Maximum
Tetracycline antibiotics and degradation products Chlorotetracycline
Epi-chlorotetracycline (4-EC-tetracycline HCl)1
Epi-iso-chlorotetracycline (Iso-epi-chlorotetracycline)1
1Iso-chlorotetracyclineDoxycyclineOxytetracycline
Epi-oxytetracycline (4-Epi-oxytetracycline)1
Tetracyclines Epi-tetracycline
(4-Epi-tetracycline HCl)1
2424
24
24242424
2424
----
--
--------
----
0.010.010
.010
.010
.010
.010
.010
.010
.010
00
0
0000
00
Chlorotetra-cycline,
total = 103
10485
-
89-
Chlorotetra-cycline,
total = 36
3233
21-
< 0.010< .010
< .010
< .010< .010< .010< .010
< .010< .010
< 0.010< .010
< .010
< .010< .010< .010< .010
< .010< .010
< 0.010< .010
< .010
< .010< .010< .010< .010
< .010< .010
Other antibioticsChloramphenicolLincomycinOrmetoprim
Trimethoprim
24242424
--------
.050
.005
.005
.005
0000
82100
8385
117373432
< .050< .005< .005< .005
< < < <
.050
.005
.005
.005
< .050< .005< .005< .005
PharmaceuticalsCarbamazepine Ibuprofen
24
24
--
--
.005
.050
0
0
98
87
25
67
< .005
< .050
<
<
.005
.050
< .005
< .050
1Degradation product.2Para-xanthine also known as 1.7 dimethylxanthine.

Numbers of Detections of Compounds by Season 31
pound concentrations for the study were Killinger Creek–16 compounds, Middle Spring Creek–4 compounds, and Lititz Run–2 compounds. For sites downstream from animal-feeding operations, Snitz Creek had the greatest number of compounds detected in samples analyzed, 8; followed by Little Chickies Creek, 4; and Muddy Run, 3. Three Square Hollow Run, Trout Run, and Bachman Run had one detection each.
Stream-water sites upstream from municipal-wastewater effluent outfalls had either no compounds detected (Spring and Middle Spring Creeks) or fewer compounds detected than at downstream locations. Oxytetracycline, however, had the max-imum concentration for the study (0.038 µg/L) in a sample col-lected from the upstream site at Lititz Run.
Even though Conoy Creek did not receive municipal wastewater effluent, three pharmaceuticals (acetaminophen, caffeine, cotinine) and one antibiotic (tylosin) were detected in 50 to 100 percent of the samples collected at both upstream and downstream locations. The maximum concentrations for the project for acetaminophen (0.35 µg/L) and tylosin (0.030 µg/L) were analyzed in samples collected at the upstream location on Conoy Creek. Determination of the source(s) of these contami-nants is not within the scope of this report.
Numbers of Detections of Compounds by Season
Over the course of the study, four samples were collected at each site to assess changes in concentration resulting from seasonal use of human or veterinary pharmaceuticals and anti-biotics. Samples were collected in March/April (considered winter sample), May (spring sample), July (summer sample), and September (fall sample). At four streams, at least one com-pound was detected in all four seasonal samples (table 15). The Middle Spring Creek downstream location had nine compounds (four antibiotics, five pharmaceuticals) that were detected in every sample. The Killinger Creek downstream location had six
compounds (five antibiotics, one pharmaceutical) that were detected in every sample. The Lititz Run downstream location had four compounds (three antibiotics, one pharmaceutical) that were detected in every sample. Other compounds were detected at these sites, but not in every seasonal sample. At other streams, like the Trout Run and Three Square Hollow down-stream locations, pharmaceutical or antibiotic compounds were only detected in one of the seasonal samples.
The number of detections and total numbers of compounds detected in seasonal samples collected for streams receiving municipal wastewater effluent and streams receiving runoff from animal-feeding operations are shown in table 16; results for Conoy Creek are not included in this table. For total number of compounds detected, carbamazepine was counted only if detected at the NWQL; sulfamethoxazole and trimethoprim were counted only if detected at the OGRL.
Seasonal occurrence of pharmaceutical and antibiotic compounds in stream water varied by compound and stream-water site type (table 16). Erythromycin-H20 was the only anti-biotic degradation product detected for the study; it was detected twice as often as the parent compound in most of the seasonal samples collected from streams receiving municipal-wastewater effluent. Samples collected during the winter period from streams receiving municipal-wastewater effluent had the greatest number of compounds detected (21).
For well-water samples, seasonal distributions for the number of detections and the number of compounds detected are shown in table 17. The total number of detections in well water was very low; tylosin was detected two times in winter samples, cotinine and sulfamethoxazole were each detected one time in fall samples, and diphenhydramine was detected one time in summer samples.

32Concentrations of Selected Pharm
aceuticals and Antibiotics in South-Central Pennsylvania, M
arch Through September 2006
Table 15. Concentration ranges of compounds with detections, numbers of seasonal samples with detections of specific compounds, and number of compounds detected by site.
[Statistic: Max, maximum concentration; min, minimum concentration; Numb, number of seasonal samples having detections of the compound (for example, "4" indicates the compound was detected in all four seasonal samples). --, no detections; <, less than; bolding indicates maximum concentration for project; shading indicates one or more detections (above minimum reporting level or E-coded [estimated]); E(1), concentration is below the long-term method detection limit (for information-rich methods only); E(2), the concentration is greater than or equal to the long-term method detection limit but less than the minimum reporting level (lowest calibration standard is less than the minimum reporting level); E(3), the median long-term recovery of the compound is between 30 and 60 percent or the relative standard devia-tion of long-term recoveries was greater than 25 percent; E(4), data are reported above the minimum reporting level, but there was a failure in some aspect of laboratory quality control (for example, the laborato-ry-spike or surrogate recoveries were low and the sample could not be re-analyzed)]
Concentration, in micrograms per liter
U.S. Geological Survey station Stream or Loca- Statis-identification well name tion tic
number N
umbe
r of c
ompo
unds
de
tect
ed M
arch
-Sep
tem
ber
Stream sites upstream and downstream from municipal-wastewater effluents01470857 Spring Creek U 0 Max -- -- -- -- -- -- -- -- -- -- -- -- -- --
Min -- -- -- -- -- -- -- -- -- -- -- -- -- --Numb -- -- -- -- -- -- -- -- -- -- -- -- -- --
01470858 D 12 Max E(1) 0.007 0.016 0.031 0.022 0.026 0.019 -- E(1) 0.007 E(1) 0.004 -- E(3) 0.005 0.024 -- --A
ceta
min
ophe
nMin < .024 < .008 < .005 < .015 < .005 < .018 -- < .022 < .028 -- < .018 < .023 -- --Numb 1 1 1 3 3 3 -- 2 2 -- 1 3 -- --
015693155 Middle Spring U 0 Max -- -- -- -- -- -- -- -- -- -- -- -- -- --Min -- -- -- -- -- -- -- -- -- -- -- -- -- --
Anh
ydro
-ery
thro
myc
in
CreekNumb -- -- -- -- -- -- -- -- -- -- -- -- -- --
(ery
thro
myc
in-H
20)
015693158 D 14 Max E(1) .008 .081 1.65 -- .152 .13 .021 .031 E(1) .004 -- E(3) .065 .071 -- --Min < .024 < .008 .078 -- .086 .05 < .005 E(1) .010 < .028 -- E(3) .023 E(2) .013 -- --Numb 1 3 4 -- 4 4 2 4 1 -- 4 4 -- --
Azi
thro
myc
in01571193 Mountain U 1 Max -- -- -- -- -- -- -- -- -- -- -- -- -- --
Creek Min -- -- -- -- -- -- -- -- -- -- -- -- -- --Numb -- -- -- -- -- -- -- -- -- -- -- -- -- --
Caffe
ine
01571195 D 6 Max -- -- -- .015 .005 E(2) .009 -- -- - -- -- -- -- --Min -- -- -- < .015 < .005 < .018 -- -- - -- -- -- -- --Numb -- -- -- 1 1 1 -- -- - -- -- -- -- --
01573151 Killinger Creek U 6 Max .048 -- -- .065 .011 E(2) .009 -- -- E(1) .010 -- -- -- -- --Ca
rbam
azep
ine
(OG
RL)
Min < .024 -- -- < .015 < .005 < .018 -- -- < .028 -- -- -- -- --Numb 1 -- -- 1 2 1 -- -- 1 -- -- -- -- --
01573153 D 20 Max .098 .168 .686 4.75 .516 .276 .182 .155 .043 E(2) 0.015 E(3) .079 .135 .015 0.277Ca
rbam
azep
ine
(NW
QL)
Min < .024 .008 .021 < .015 .045 .030 < .005 < .022 < .028 < .022 < .018 < .023 < .008 < .050Numb 2 4 4 3 4 4 3 2 2 3 3 3 3 1
01574310 Conoy Creek1 U 4 Max .35 -- -- .060 -- -- -- -- E(1) .005 -- -- -- -- --Min < .024 -- -- .019 -- -- -- -- < .028 -- -- -- -- --
Cipr
oflo
xaci
nNumb 3 -- -- 4 -- -- -- -- 2 -- -- -- -- --
01574314 D 4 Max .029 -- -- .363 -- -- -- -- E(2) .017 -- -- -- -- --Min E(1) .005 -- -- .015 -- -- -- -- < .028 -- -- -- -- --Numb 4 -- -- 4 -- -- -- -- 2 -- -- -- -- --
Code
ine
01576420 Lititz Run U 6 Max -- .011 -- -- .013 -- -- -- -- -- -- -- -- --Min -- < .008 -- -- < .005 -- -- -- -- -- -- -- -- --Numb -- 1 -- -- 1 -- -- -- -- -- -- -- -- --
01576422 D 17 Max E(1) .009 .152 .44 -- .142 .139 .015 .040 E(1) .008 E(1) .005 E(3) .043 .036 .016 --Min < .024 < .008 < .005 -- .054 .040 < .005 < .022 < .028 < .022 < .018 < .023 < .008 --
Cotin
ine
Numb 1 3 2 -- 4 4 2 1 2 1 2 3 2 --1The downstream site at Conoy Creek did not receive outflow from a wastewater-treatment plant.
Deh
ydro
nife
dipi
ne
Dilt
iaze
m
Diph
enhy
dram
ine
Eryt
hrom
ycin
Ibup
rofe
n

Num
bers of Detections of Com
pounds by Season33
Table 15. Concentration ranges of compounds with detections, numbers of seasonal samples with detections of specific compounds, and number of compounds detected by site.—Continued
[Statistic: Max, maximum concentration; min, minimum concentration; Numb, number of seasonal samples having detections of the compound (for example, "4" indicates the compound was detected in all four seasonal samples). --, no detections; <, less than; bolding indicates maximum concentration for project; shading indicates one or more detections (above minimum reporting level or E-coded [estimated]); E(1), concentration is below the long-term method detection limit (for information-rich methods only); E(2), the concentration is greater than or equal to the long-term method detection limit but less than the minimum reporting level (lowest calibration standard is less than the minimum reporting level); E(3), the median long-term recovery of the compound is between 30 and 60 percent or the relative standard devia-tion of long-term recoveries was greater than 25 percent; E(4), data are reported above the minimum reporting level, but there was a failure in some aspect of laboratory quality control (for example, the laborato-ry-spike or surrogate recoveries were low and the sample could not be re-analyzed)]
Concentration, in micrograms per liter
U.S. Geological Survey station Stream or Loca- Statis-identification well name tion
Num
ber o
f com
poun
ds
ticnumber
dete
cted
Mar
ch-S
epte
mbe
r
Stream sites upstream and downstream from animal-feeding operations01569346 Three Square U 0 Max -- -- -- -- -- -- -- -- -- -- -- -- -- --
Min -- -- -- -- -- -- -- -- -- -- -- -- -- --A
ceta
min
ophe
nHollow Run
Numb -- -- -- -- -- -- -- -- -- -- -- -- -- --01569349 D 1 Max -- -- -- -- -- -- -- -- -- -- -- -- -- --
Min -- -- -- -- -- -- -- -- -- -- -- -- -- --A
nhyd
ro-e
ryth
rom
ycin
Numb -- -- -- -- -- -- -- -- -- -- -- -- -- --
(ery
thro
myc
in-H
20)
01572146 Trout Run U 1 Max -- -- -- -- -- -- -- -- -- -- -- E(1) 0.010 -- --Min -- -- -- -- -- -- -- -- -- -- -- < .023 -- --Numb -- -- -- -- -- -- -- -- -- -- -- 1 -- --
Azi
thro
myc
in01572148 D 1 Max E(2) 0.018 -- -- -- -- -- -- -- -- -- -- -- -- --
Min < .024 -- -- -- -- -- -- -- -- -- -- -- -- --Numb 1 -- -- -- -- -- -- -- -- -- -- -- -- --
0.019 0.009 E(2) 0.010Ca
ffein
e401704076293101 Bachman Run U 2 Max -- -- -- -- -- -- -- -- -- -- --
Min -- -- -- < .015 < .005 < .018 -- -- -- -- -- -- -- --Numb -- -- -- 1 1 2 -- -- -- -- -- -- -- --
01573095 D 1 Max -- -- -- -- -- -- -- -- -- -- -- -- -- --Ca
rbam
azep
ine
(OG
RL)
Min -- -- -- -- -- -- -- -- -- -- -- -- -- --Numb -- -- -- -- -- -- -- -- -- -- -- -- -- --
01574050 Snitz Creek U 4 Max -- -- -- .016 .021 E(4) .025 -- -- -- -- -- -- -- --Min -- -- -- < .015 < .005 < .018 -- -- -- -- -- -- -- --
Carb
amaz
epin
e (N
WQ
L)Numb -- -- -- 1 2 2 -- -- -- -- -- -- -- --
01574055 D 8 Max E(1) .003 -- -- .053 -- E(1) .005 -- -- E(1) 0.007 -- -- -- -- --Min < .024 -- -- < .015 -- < .018 -- -- < .028 -- -- -- -- --Numb 1 -- -- 3 -- 1 -- -- 1 -- -- -- -- --
Cipr
oflo
xaci
n01575771 Little Chickies U 0 Max -- -- -- -- -- -- -- -- -- -- -- -- -- --
Creek Min -- -- -- -- -- -- -- -- -- -- -- -- -- --Numb -- -- -- -- -- -- -- -- -- -- -- -- -- --
015757724 D 4 Max E(1) .004 -- -- .018 -- E(1) .005 -- -- -- -- -- -- -- --Co
dein
eMin < .024 -- -- < .015 -- < .018 -- -- -- -- -- -- -- --Numb 1 -- -- 1 -- 1 -- -- -- -- -- -- -- --
01578349 Muddy Run U 0 Max -- -- -- -- -- -- -- -- -- -- -- -- -- --Min -- -- -- -- -- -- -- -- -- -- -- -- -- --
Cotin
ine
Numb -- -- -- -- -- -- -- -- -- -- -- -- -- --015783492 D 3 Max E(1) .009 -- -- -- .005 -- -- -- E(1) .007 -- -- -- -- --
Min < .024 -- -- -- < .005 -- -- -- < .028 -- -- -- -- --Numb 1 -- -- -- 1 -- -- -- 1 -- -- -- -- --
Deh
ydro
nife
dipi
ne
Dilt
iaze
m
Diph
enhy
dram
ine
Eryt
hrom
ycin
Ibup
rofe
n

34Concentrations of Selected Pharm
aceuticals and Antibiotics in South-Central Pennsylvania, M
arch Through September 2006
Table 15. Concentration ranges of compounds with detections, numbers of seasonal samples with detections of specific compounds, and number of compounds detected by site.—Continued
[Statistic: Max, maximum concentration; min, minimum concentration; Numb, number of seasonal samples having detections of the compound (for example, "4" indicates the compound was detected in all four seasonal samples). --, no detections; <, less than; bolding indicates maximum concentration for project; shading indicates one or more detections (above minimum reporting level or E-coded [estimated]); E(1), concentration is below the long-term method detection limit (for information-rich methods only); E(2), the concentration is greater than or equal to the long-term method detection limit but less than the minimum reporting level (lowest calibration standard is less than the minimum reporting level); E(3), the median long-term recovery of the compound is between 30 and 60 percent or the relative standard devia-tion of long-term recoveries was greater than 25 percent; E(4), data are reported above the minimum reporting level, but there was a failure in some aspect of laboratory quality control (for example, the laborato-ry-spike or surrogate recoveries were low and the sample could not be re-analyzed)]
Concentration, in micrograms per liter
U.S. Geological Survey station Stream or Loca- Statis-identification well name tion tic
number N
umbe
r of c
ompo
unds
de
tect
ed M
arch
-Sep
tem
ber
Wells in agricultural areas used to supply water to livestock394643077043101 AD 653 - 0 Max -- -- -- -- -- -- -- -- -- -- -- -- -- --
Min -- -- -- -- -- -- -- -- -- -- -- -- -- --Numb -- -- -- -- -- -- -- -- -- -- -- -- -- --
Ace
tam
inop
hen
400610076282501 LN 2114 - 1 Max -- -- -- -- -- -- -- -- -- -- -- -- -- --Min -- -- -- -- -- -- -- -- -- -- -- -- -- --Numb -- -- -- -- -- -- -- -- -- -- -- -- -- --
Anh
ydro
-ery
thro
myc
in
401712076235101 LB 1248 - 2 Max -- -- -- -- -- -- -- -- -- -- -- -- -- --Min -- --
(ery
thro
myc
in-H
20)
-- -- -- -- -- -- -- -- -- -- -- --Numb -- -- -- -- -- -- -- -- -- -- -- -- -- --
401920078130101 HU 426 - 1 Max -- -- -- -- -- -- -- -- -- -- -- E(1) 0.003 -- --A
zith
rom
ycin
Min -- -- -- -- -- -- -- -- -- -- -- < .023 -- --Numb -- -- -- -- -- -- -- -- -- -- -- 1 -- --
402052076160101 LB 1249 - 1 Max -- -- -- -- -- -- -- -- E(2) 0.024 -- -- -- -- --Min -- -- -- --
Caffe
ine
-- -- -- -- < .028 -- -- -- -- --Numb -- -- -- -- -- -- -- -- 1 -- -- -- -- --
405931076555601 UN 205 - 0 Max -- -- -- -- -- -- -- -- -- -- -- -- -- --Min -- -- -- -- -- -- -- -- -- -- -- -- -- --
Carb
amaz
epin
e (O
GRL
)-- -- -- -- -- -- -- -- -- -- -- -- -- --
Carb
amaz
epin
e (N
WQ
L)
Cipr
oflo
xaci
n
Code
ine
Cotin
ine
Deh
ydro
nife
dipi
ne
Dilt
iaze
m
Diph
enhy
dram
ine
Eryt
hrom
ycin
Ibup
rofe
n

Num
bers of Detections of Com
pounds by Season35
Table 15. Concentration ranges of compounds with detections, numbers of seasonal samples with detections of specific compounds, and number of compounds detected by site.—Continued
[Statistic: Max, maximum concentration; min, minimum concentration; Numb, number of seasonal samples having detections of the compound (for example, "4" indicates the compound was detected in all four seasonal samples). --, no detections; <, less than; bolding indicates maximum concentration for project; shading indicates one or more detections (above minimum reporting level or E-coded [estimated]); E(1), concentration is below the long-term method detection limit (for information-rich methods only); E(2), the concentration is greater than or equal to the long-term method detection limit but less than the minimum reporting level (lowest calibration standard is less than the minimum reporting level); E(3), the median long-term recovery of the compound is between 30 and 60 percent or the relative standard devia-tion of long-term recoveries was greater than 25 percent; E(4), data are reported above the minimum reporting level, but there was a failure in some aspect of laboratory quality control (for example, the laborato-ry-spike or surrogate recoveries were low and the sample could not be re-analyzed)]
Concentration, in micrograms per liter
U.S. Geological Survey station Stream or Loca- Statis-identification well name tion
Num
ber o
f com
poun
ds
ticnumber
dete
cted
Mar
ch-S
epte
mbe
r
Stream sites upstream and downstream from municipal-wastewater effluents01470857 Spring Creek U 0 Max -- -- -- -- -- -- -- -- -- -- -- -- --
Min -- -- -- -- -- -- -- -- -- -- -- -- --O
floxa
cin
Numb -- -- -- -- -- -- -- -- -- -- -- -- --01470858 D 12 Max 0.012 -- -- -- -- -- -- 0.212 0.148 E(2) 0.019 0.022 -- --
Min < .005 -- -- -- -- -- -- < .024 < .005 < .020 < .005 -- --Ox
ytet
racy
clin
eNumb 3 -- -- -- -- -- -- 3 3 3 3 -- --
015693155 Middle Spring U 0 Max -- -- -- -- -- -- -- -- -- -- -- -- --Creek Min -- -- -- -- -- -- -- -- -- -- -- -- --
Numb -- -- -- -- -- -- -- -- -- -- -- -- --015693158 D 14 Max .032 -- -- E(3) 0.051 E(1) 0.005 -- -- .552 .766 .117 .123 -- --
P-Xa
nthi
neMin .009 -- -- E(3) .007 < .014 -- -- < .027 .110 .023 .030 -- --Numb 4 -- -- 4 2 -- -- 3 4 4 4 -- --
01571193 Mountain U 1 Max -- -- -- -- -- -- -- -- -- -- -- 0.009 --Creek Min -- -- -- -- -- -- -- -- -- -- -- < .005 --
Rani
tidin
eNumb -- -- -- -- -- -- -- -- -- -- -- 1 --
01571195 D 6 Max .005 -- -- -- -- -- -- E(1) .006 .023 -- .009 .023 --Min < .005 -- -- -- -- -- -- < .024 < .005 -- < .005 < .005 --Numb 1 -- -- -- -- -- -- 1 1 -- 1 1 --
01573151 Killinger Creek U 6 Max -- -- E(2) 0.019 -- -- -- -- E(2) .022 .013 -- -- -- --Sa
lbut
amol
Min -- -- < .021 -- -- -- -- < .024 < .005 -- -- -- --Numb -- -- 1 -- -- -- -- 1 1 -- -- -- --
01573153 D 20 Max .329 -- .853 E(3) .040 E(2) .012 .121 -- E(4) .218 1.34 .106 .256 -- --Min .062 -- < .021 < .025 < .014 < .050 -- < .024 .042 < .020 .033 -- --
Sulfa
diaz
ine
Numb 4 -- 1 2 2 1 -- 2 4 2 4 -- --01574310 Conoy Creek1 U 4 Max -- -- -- -- -- -- -- -- -- -- -- .030 --
Min -- -- -- -- -- -- -- -- -- -- -- < .005 --Numb -- -- -- -- -- -- -- -- -- -- -- 3 --
Sulfa
dim
etho
xine
01574314 D 4 Max -- -- -- -- -- -- -- -- -- -- -- .025 --Min -- -- -- -- -- -- -- -- -- -- -- < .005 --Numb -- -- -- -- -- -- -- -- -- -- -- 3 --
Sulfa
met
hoxa
zole
01576420 Lititz Run U 6 Max .006 0.038 -- -- -- -- -- -- .067 -- .015 -- --
< .005 < .010 < .005 < .005(N
WQL
)Min -- -- -- -- -- -- -- -- --Numb 1 1 -- -- -- -- -- -- 1 -- 1 -- --
01576422 D 17 Max .069 .015 -- -- -- -- -- .262 .142 .060 .106 .007 E(3) .030Su
lfam
etho
xazo
leMin .023 < .010 -- -- -- -- -- E(4) .030 .108 < .020 .034 < .005 < .019
4 1 4 4 3 4 2 1(O
GRL)
Numb -- -- -- -- --1The downstream site at Conoy Creek did not receive outflow from a wastewater-treatment plant.
Trim
etho
prim
(N
WQL
)
Trim
etho
prim
(O
GRL)
Tylo
sin
War
fari
n

36Concentrations of Selected Pharm
aceuticals and Antibiotics in South-Central Pennsylvania, M
arch Through September 2006
Table 15. Concentration ranges of compounds with detections, numbers of seasonal samples with detections of specific compounds, and number of compounds detected by site.—Continued
[Statistic: Max, maximum concentration; min, minimum concentration; Numb, number of seasonal samples having detections of the compound (for example, "4" indicates the compound was detected in all four seasonal samples). --, no detections; <, less than; bolding indicates maximum concentration for project; shading indicates one or more detections (above minimum reporting level or E-coded [estimated]); E(1), concentration is below the long-term method detection limit (for information-rich methods only); E(2), the concentration is greater than or equal to the long-term method detection limit but less than the minimum reporting level (lowest calibration standard is less than the minimum reporting level); E(3), the median long-term recovery of the compound is between 30 and 60 percent or the relative standard devia-tion of long-term recoveries was greater than 25 percent; E(4), data are reported above the minimum reporting level, but there was a failure in some aspect of laboratory quality control (for example, the laborato-ry-spike or surrogate recoveries were low and the sample could not be re-analyzed)]
Concentration, in micrograms per liter
U.S. Geological Survey station Stream or Loca- Statis-identification well name tion tic
number N
umbe
r of c
ompo
unds
de
tect
ed M
arch
-Sep
tem
ber
Stream sites upstream and downstream from animal-feeding operations01569346 Three Square U 0 Max -- -- -- -- -- -- -- -- -- -- -- -- --
Hollow Run Min -- -- -- -- -- -- -- -- -- -- -- -- --Numb -- -- -- -- -- -- -- -- -- -- -- -- --
Oflo
xaci
n01569349 D 1 Max -- -- -- -- -- -- -- -- -- -- -- 0.007 --
Min -- -- -- -- -- -- -- -- -- -- -- < .005 --Numb -- -- -- -- -- -- -- -- -- -- -- 1 --
01572146 Trout Run U 1 Max -- -- -- -- -- -- -- -- -- -- -- -- --Ox
ytet
racy
clin
eMin -- -- -- -- -- -- -- -- -- -- -- -- --Numb -- -- -- -- -- -- -- -- -- -- -- -- --
01572148 D 1 Max -- -- -- -- -- -- -- -- -- -- -- -- --Min -- -- -- -- -- -- -- -- -- -- -- -- --
P-Xa
nthi
neNumb -- -- -- -- -- -- -- -- -- -- -- -- --
401704076293101 Bachman Run U 2 Max -- -- -- -- -- -- -- -- -- -- -- -- --Min -- -- -- -- -- -- -- -- -- -- -- -- --Numb -- -- -- -- -- -- -- -- -- -- -- -- --
Rani
tidin
e01573095 D 1 Max -- -- -- -- -- -- -- E(1) 0.008 -- -- -- -- --
Min -- -- -- -- -- -- -- < .024 -- -- -- -- --Numb -- -- -- -- -- -- -- 1 -- -- -- -- --
01574050 Snitz Creek U 4 Max -- -- -- -- -- -- -- E(4) .039 0.157 -- -- .017 --Sa
lbut
amol
Min -- -- -- -- -- -- -- < .024 < .005 -- -- < .005 --Numb -- -- -- -- -- -- -- 1 2 -- -- 1 --
01574055 D 8 Max -- 0.019 -- -- -- -- 0.005 E(1) .006 .019 -- -- .027 --Min -- < 0.010 -- -- -- -- < .005 < .024 < .005 -- -- < .005 --
Sulfa
diaz
ine
Numb -- 1 -- -- -- -- 1 1 1 -- -- 1 --01575771 Little Chickies U 0 Max -- -- -- -- -- -- -- -- -- -- -- -- --
Creek Min -- -- -- -- -- -- -- -- -- -- -- -- --Numb -- -- -- -- -- -- -- -- -- -- -- -- --
Sulfa
dim
etho
xine
015757724 D 4 Max -- -- -- -- -- -- .026 -- -- -- -- -- --Min -- -- -- -- -- -- < .005 -- -- -- -- -- --Numb -- -- -- -- -- -- 1 -- -- -- -- -- --
01578349 Muddy Run U 0 Max -- -- -- -- -- -- -- -- -- -- -- -- --Su
lfam
etho
xazo
le
Min -- -- -- -- -- -- -- -- -- -- -- -- --(N
WQL
)Numb -- -- -- -- -- -- -- -- -- -- -- -- --
015783492 D 3 Max -- -- -- -- -- -- -- -- -- -- -- -- --Min -- -- -- -- -- -- -- -- -- -- -- -- --
Sulfa
met
hoxa
zole
Numb -- -- -- -- -- -- -- -- -- -- -- -- --(O
GRL)
Trim
etho
prim
(N
WQL
)
Trim
etho
prim
(O
GRL)
Tylo
sin
War
fari
n

Num
bers of Detections of Com
pounds by Season37
Table 15. Concentration ranges of compounds with detections, numbers of seasonal samples with detections of specific compounds, and number of compounds detected by site.—Continued
[Statistic: Max, maximum concentration; min, minimum concentration; Numb, number of seasonal samples having detections of the compound (for example, "4" indicates the compound was detected in all four seasonal samples). --, no detections; <, less than; bolding indicates maximum concentration for project; shading indicates one or more detections (above minimum reporting level or E-coded [estimated]); E(1), concentration is below the long-term method detection limit (for information-rich methods only); E(2), the concentration is greater than or equal to the long-term method detection limit but less than the minimum reporting level (lowest calibration standard is less than the minimum reporting level); E(3), the median long-term recovery of the compound is between 30 and 60 percent or the relative standard devia-tion of long-term recoveries was greater than 25 percent; E(4), data are reported above the minimum reporting level, but there was a failure in some aspect of laboratory quality control (for example, the laborato-ry-spike or surrogate recoveries were low and the sample could not be re-analyzed)]
Concentration, in micrograms per liter
U.S. Geological Survey station Stream or Loca- Statis-identification well name tion
Num
ber o
f com
poun
ds
ticnumber
dete
cted
Mar
ch-S
epte
mbe
r
Wells in agricultural areas used to supply water to livestock394643077043101 AD 653 - 0 Max -- -- -- -- -- -- -- -- -- -- -- -- --
Min --O
floxa
cin
-- -- -- -- -- -- -- -- -- -- -- --Numb -- -- -- -- -- -- -- -- -- -- -- -- --
400610076282501 LN 2114 - 1 Max -- -- -- -- -- -- -- -- -- -- -- 0.012 --Min -- -- -- -- -- -- -- -- -- -- -- < .005 --Numb -- --
Oxyt
etra
cycl
ine
-- -- -- -- -- -- -- -- -- 1 --401712076235101 LB 1248 - 2 Max -- -- -- -- -- -- -- -- 0.006 -- -- .017 --
Min -- -- -- -- -- -- -- -- < .005 -- -- < .005 --Numb -- -- -- -- -- -- -- -- 1 -- -- 1 --
401920078130101 HU 426 - 1 Max -- -- --P-
Xant
hine
-- -- -- -- -- -- -- -- -- --Min -- -- -- -- -- -- -- -- -- -- -- -- --Numb -- -- -- -- -- -- -- -- -- -- -- -- --
402052076160101 LB 1249 - 1 Max -- -- -- -- -- -- -- -- -- -- -- -- --Min -- -- -- --
Rani
tidin
e-- -- -- -- -- -- -- -- --
Numb -- -- -- -- -- -- -- -- -- -- -- -- --405931076555601 UN 205 - 0 Max -- -- -- -- -- -- -- -- -- -- -- -- --
Min -- -- -- -- -- -- -- -- -- -- -- -- --Numb -- -- -- -- --
Salb
utam
ol-- -- -- -- -- -- -- --
Sulfa
diaz
ine
Sulfa
dim
etho
xine
Sulfa
met
hoxa
zole
(N
WQL
)
Sulfa
met
hoxa
zole
(OGR
L)
Trim
etho
prim
(N
WQL
)
Trim
etho
prim
(O
GRL)
Tylo
sin
War
fari
n

38 Concentrations of Selected Pharmaceuticals and Antibiotics in South-Central Pennsylvania, March Through September 2006
Table 16. Summary of numbers of detections by season at stream-water sites sampled, south-central Pennsylvania, 2006.
[Compounds in italics were analyzed by both laboratories; shading indicates one or more detections (E-coded [estimated] or above minimum reporting level); E-coded values are greater than the method detection limit but less than the minimum reporting level and are coded as estimated because of lower precision; --, not available]
Method Minimum Number of detections
AnalyteNumber of
1,2samples
detection limit,
in micrograms
per liter
reporting level,
in micrograms
per liter
Streams receiving municipal-wastewater effluent2
Streams receiving runoff from animal-feeding operations
Winter Spring Summer Fall Winter Spring Summer Fall
Compounds analyzed at the U.S. Geological Survey National Water Quality Laboratory
Human and veterinary drugs
Nonprescription pharmaceuticalsAcetaminophen 88 0.012 0.024 3 3 0 0 3 1 0 0
Caffeine 88 .008 .015 3 2 0 3 0 3 2 13,4Para-xanthine 88 .010 .021 2 0 0 0 0 0 0 0
Codeine 88 .011 .022 3 4 1 1 0 0 0 0
Cotinine 88 .014 .028 4 4 0 0 1 1 0 0
Diphenhydramine 88 .012 .023 4 4 3 2 0 0 1 0
Prescription pharmaceuticals Carbamazepine 88 .009 .018 4 4 4 5 0 2 1 3
Dehydronifedipine 88 .011 .022 1 1 0 2 0 0 0 0
Diltiazem 88 .009 .018 2 3 4 1 0 0 0 0
Fluoxetine 88 -- .016 0 0 0 0 0 0 0 0
Ranitidine 88 -- .025 2 2 1 1 0 0 0 0
Salbutamol 88 .007 .014 1 2 1 0 0 0 0 0
Thiabendazole 88 .012 .025 0 0 0 0 0 0 0 0
Warfarin 88 .009 .019 0 0 0 1 0 0 0 0
AntibioticsSulfamethoxazole 88 .012 .024 2 3 4 5 0 0 0 3
Trimethoprim 88 .010 .020 4 4 3 1 0
oratory0 0 0
Compounds analyzed at the U.S. Geological Survey Organic Geochemistry Research Lab
Macrolide antibiotics Azithromycin 88 -- .005 2 3 3 3 0 0 0 0
Erythromycin 88 -- .008 2 2 0 1 0 0 0 0
Erythromycin-H203 88 -- .008 4 4 2 2 0 0 0 0
Roxithromycin 88 -- .005 0 0 0 0 0 0 0 0
Tylosin 88 -- .005 3 1 0 0 1 2 0 0
Virginiamycin 88 -- .005 0 0 0 0 0 0 0 0
Quinoline antibiotics Ciprofloxacin 88 -- .005 2 1 1 3 0 0 0 0
Enrofloxacin 88 -- .005 0 0 0 0 0 0 0 0
Lomefloxacin 88 -- .005 0 0 0 0 0 0 0 0
Norfloxacin 88 -- .005 0 0 0 0 0 0 0 0
Ofloxacin 88 -- .005 4 4 5 4 0 0 0 0
Sarafloxacin 88 -- .005 0 0 0 0 0 0 0 0
Sulfonamide antibiotics Sulfachloropyridazine 88 -- .005 0 0 0 0 0 0 0 0
Sulfadiazine 88 -- .050 1 0 0 0 0 0 0 0
Sulfadimethoxine 88 -- .005 0 0 0 0 0 0 1 1
Sulfamethazine 88 -- .005 0 0 0 0 0 0 0 0
Sulfamethoxazole 88 -- .005 4 4 5 5 0 0 1 2
Sulfathiazole 88 -- .020 0 0 0 0 0 0 0 0
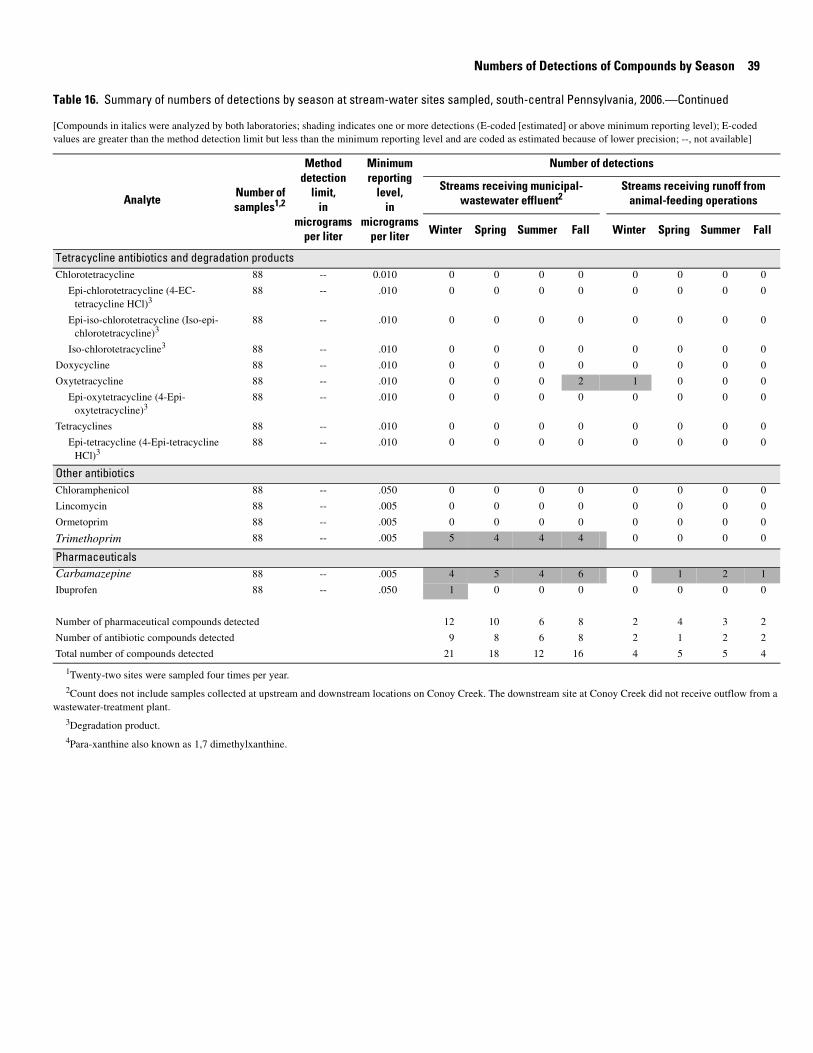
Numbers of Detections of Compounds by Season 39
Table 16. Summary of numbers of detections by season at stream-water sites sampled, south-central Pennsylvania, 2006.—Continued
[Compounds in italics were analyzed by both laboratories; shading indicates one or more detections (E-coded [estimated] or above minimum reporting level); E-coded values are greater than the method detection limit but less than the minimum reporting level and are coded as estimated because of lower precision; --, not available]
Method Minimum Number of detectionsdetection reporting
Streams receiving municipal- Streams receiving runoff from Number of limit, level, Analyte 1,2 wastewater effluent2 animal-feeding operationssamples in in
micrograms micrograms Winter Spring Summer Fall Winter Spring Summer Fallper liter per liter
Tetracycline antibiotics and degradation products Chlorotetracycline 88 -- 0.010 0 0 0 0 0 0 0 0
Epi-chlorotetracycline (4-EC- 88 -- .010 0 0 0 0 0 0 0 0tetracycline HCl)3
Epi-iso-chlorotetracycline (Iso-epi- 88 -- .010 0 0 0 0 0 0 0 0chlorotetracycline)3
3Iso-chlorotetracycline 88 -- .010 0 0 0 0 0 0 0 0
Doxycycline 88 -- .010 0 0 0 0 0 0 0 0
Oxytetracycline 88 -- .010 0 0 0 2 1 0 0 0
Epi-oxytetracycline (4-Epi- 88 -- .010 0 0 0 0 0 0 0 0oxytetracycline)3
Tetracyclines 88 -- .010 0 0 0 0 0 0 0 0
Epi-tetracycline (4-Epi-tetracycline 88 -- .010 0 0 0 0 0 0 0 0HCl)3
Other antibioticsChloramphenicol 88 -- .050 0 0 0 0 0 0 0 0
Lincomycin 88 -- .005 0 0 0 0 0 0 0 0
Ormetoprim 88 -- .005 0 0 0 0 0 0 0 0
Trimethoprim 88 -- .005 5 4 4 4 0 0 0 0
PharmaceuticalsCarbamazepine 88 -- .005 4 5 4 6 0 1 2 1
Ibuprofen 88 -- .050 1 0 0 0 0 0 0 0
Number of pharmaceutical compounds detected 12 10 6 8 2 4 3 2
Number of antibiotic compounds detected 9 8 6 8 2 1 2 2
Total number of compounds detected 21 18 12 16 4 5 5 4
1Twenty-two sites were sampled four times per year. 2Count does not include samples collected at upstream and downstream locations on Conoy Creek. The downstream site at Conoy Creek did not receive outflow from a
wastewater-treatment plant.3Degradation product. 4Para-xanthine also known as 1,7 dimethylxanthine.
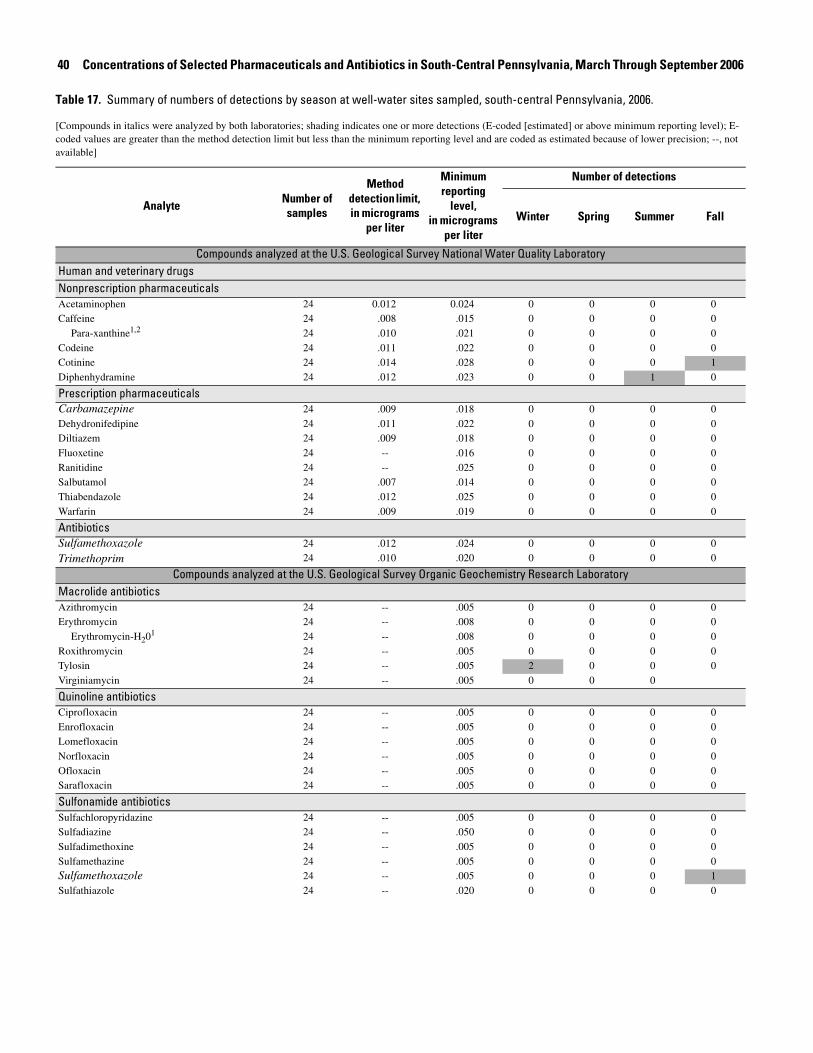
40 Concentrations of Selected Pharmaceuticals and Antibiotics in South-Central Pennsylvania, March Through September 2006
Table 17. Summary of numbers of detections by season at well-water sites sampled, south-central Pennsylvania, 2006.
[Compounds in italics were analyzed by both laboratories; shading indicates one or more detections (E-coded [estimated] or above minimum reporting level); E-coded values are greater than the method detection limit but less than the minimum reporting level and are coded as estimated because of lower precision; --, not available]
AnalyteNumber of samples
Method detection limit, in micrograms
per liter
Minimum reporting
level, in micrograms
per liter
Number of detections
Winter Spring Summer Fall
Compounds analyzed at the U.S. Geological Survey National Water Quality LaboratoryHuman and veterinary drugs Nonprescription pharmaceuticalsAcetaminophenCaffeine
1,2Para-xanthineCodeineCotinineDiphenhydramine
242424242424
0.012.008.010.011.014.012
0.024.015.021.022.028.023
000000
000000
000001
000010
Prescription pharmaceuticals CarbamazepineDehydronifedipineDiltiazemFluoxetineRanitidineSalbutamolThiabendazoleWarfarin
2424242424242424
.009
.011
.009----
.007
.012
.009
.018
.022
.018
.016
.025
.014
.025
.019
00000000
00000000
00000000
00000000
AntibioticsSulfamethoxazoleTrimethoprim
2424
.012
.010.024.020
00
00
00
00
Compounds analyzed at the U.S. Geological Survey Organic Geochemistry Research LaboratoryMacrolide antibiotics AzithromycinErythromycin
Erythromycin-H201
RoxithromycinTylosinVirginiamycin
24 -24 -24 -24 -24 -24 -
------
.005
.008
.008
.005
.005
.005
000020
000000
000000
00000
Quinoline antibiotics CiprofloxacinEnrofloxacinLomefloxacinNorfloxacinOfloxacinSarafloxacin
24 -24 -24 -24 -24 -24 -
------
.005
.005
.005
.005
.005
.005
000000
000000
000000
000000
Sulfonamide antibiotics SulfachloropyridazineSulfadiazineSulfadimethoxineSulfamethazineSulfamethoxazoleSulfathiazole
24 -24 -24 -24 -
24 -24 -
- .005- .050- .005- .005- .005- .020
000000
000000
000000
000010

Numbers of Detections of Compounds by Season 41
Table 17. Summary of numbers of detections by season at well-water sites sampled, south-central Pennsylvania, 2006.—Continued
[Compounds in italics were analyzed by both laboratories; shading indicates one or more detections (E-coded [estimated] or above minimum reporting level); E-coded values are greater than the method detection limit but less than the minimum reporting level and are coded as estimated because of lower precision; --, not available]
AnalyteNumber of samples
Method detection limit, in micrograms
per liter
Minimum reporting
level, in micrograms
per liter
Number of detections
Winter Spring Summer Fall
Tetracycline antibiotics and degradation products Chlorotetracycline
Epi-chlorotetracycline (4-EC-tetracycline HCl)1
Epi-iso-chlorotetracycline (Iso-epi-chlorotetracycline)1
1Iso-chlorotetracyclineDoxycyclineOxytetracycline
Epi-oxytetracycline (4-Epi-oxytetracycline)1
TetracyclinesEpi-tetracycline (4-Epi-tetracycline HCl)1
2424
24
24242424
2424
----
--
------------
0.010.010
.010
.010
.010
.010
.010
.010
.010
00
0
000000
00
0
000000
00
0
000000
00
0
000000
Other antibioticsChloramphenicolLincomycinOrmetoprim
Trimethoprim
24242424
--------
.050
.005
.005
.005
0000
0000
0000
0000
PharmaceuticalsCarbamazepineIbuprofen
Total number of pharmaceutical compounds detectedTotal number of antibiotic compounds detectedTotal number of compounds detected
2424
----
.005
.05000
011
00
000
00
101
00
112
1Degradation product. 2Para-xanthine also known as 1,7 dimethylxanthine.

42 Concentrations of Selected Pharmaceuticals and Antibiotics in South-Central Pennsylvania, March Through September 2006
Summary
Data are presented for pharmaceuticals and antibiotics from 11 stream sites and 6 wells in 9 counties of south-central Pennsylvania. Five of the streams received municipal wastewa-ter and 6 of the streams received runoff from agricultural areas containing animal-feeding operations. For all 11 streams, sam-ples were collected at locations upstream and downstream of the wastewater effluents or animal-feeding operations. A sixth stream, Conoy Creek, was originally in the project design as a stream receiving municipal wastewater, but it was learned dur-ing the project that effluent from the municipal treatment plant is piped to the Susquehanna River and not discharged to Conoy Creek. For this reason, Conoy Creek data are presented only as a background site.
There were 120 environmental samples and 21 quality-control samples analyzed for the study. Samples were collected one time at each site in March/April, May, July, and September 2006. Samples were analyzed for 15 pharmaceutical and 31 antibiotic compounds.
In stream samples, 13 pharmaceuticals and 11 antibiotics were detected at least 1 time. Considering all detections as the assessment levels, carbamazepine was the most frequently detected pharmaceutical in streams receiving municipal-waste-water effluent and streams receiving runoff from animal-feed-ing operations, followed by caffeine and diphenhydramine. Caffeine and para-xanthine (a degradation product of caffeine) had the greatest concentrations of pharmaceutical compounds analyzed for the study, 4.75 µg/L and 0.853 µg/L, respectively. Sulfamethoxazole was the most frequently detected antibiotic followed by trimethoprim, ofloxacin, erythromycin-H20, and azithromycin. Azithromycin and sulfamethoxazole had the largest concentrations for antibiotic compounds, 1.65 µg/L and 1.34 µg/L, respectively.
Seventy-eight percent of all detections were analyzed in samples collected downstream from municipal-wastewater effluents. Detections of compounds collected at sites down-stream, and in some cases upstream, from agricultural areas with animal-feeding operations were few.
Four compounds were detected in wells used to supply livestock–two pharmaceuticals (cotinine and diphenhydramine) and two antibiotics (tylosin and sulfamethoxazole). There were five detections in all well samples–three wells had one detec-tion, and one well had detections of two different compounds. The maximum concentration detected in well water was E(2) 0.024 µg/L for cotinine.
Seasonal occurrence of pharmaceutical and antibiotic compounds in stream water varied by compound and site type. At five stream sites, several compounds were detected in all four seasonal samples. The Middle Spring Creek downstream location had the most compounds that were detected in every sample–nine compounds (four antibiotics, five pharmaceuti-cals). At other sites, pharmaceutical or antibiotic compounds were detected only one time in seasonal samples. Winter sam-
ples collected in streams receiving municipal-wastewater efflu-ent had the greatest number (21) of compounds detected.
Research analytical methods were used to determine con-centrations for pharmaceuticals and antibiotics. To assist in evaluating the quality of the analyses, detailed information is presented on laboratory methodology and results from quality-control samples. Quality-control data include results for nine blanks, nine duplicate-environmental sample pairs, and three laboratory-spiked environmental samples as well as recoveries of compounds in laboratory surrogates and laboratory reagent spikes. Quality-control data indicate that several issues should be considered when evaluating the reported data.
1. Mean recoveries for the surrogate carbamazepine d-10 decreased at sites downstream from municipal-wastewater effluents, which may indicate matrix effects that could result in positive or negative bias in reported concentrations in one or more compounds.
2. Results for fluoxetine (all non-detects), ranitidine, warfarin, and diltiazem are qualified because of low long-term mean recoveries in laboratory reagent spikes.
3. Reported long-term mean recoveries of individual compounds analyzed at the USGS NWQL should be considered if interpreting results because there is the potential for the actual concentrations to be higher than reported.
4. Because of close monitoring of laboratory-spiked environmental samples, surrogate standards, and the use of standard addition, none of the data from samples analyzed at the USGS OGRL will be qualified.
Acknowledgments
The cooperation of Robert Titler, and Arianne Proctor of the Pennsylvania Department of Environmental Protection is gratefully acknowledged. Julie Dietze is acknowledged for graciously responding to inquiries throughout the course of the study. Jeffrey Bender, Heather Eggleston, David O’Brien, Mark Roland, Joanne Irvin, Dennis Low, John Nantz, and Linda Zarr of the USGS assisted with streamflow measurements, sample processing, or data management. Scott Hoffman of the USGS provided the Geographic Information System support. USGS reviewers Kevin Breen, Cherie Miller, Andrew Reif, Mark Burkhardt, and Stephen Werner offered valuable suggestions for improving the report. Finally, the authors wish to extend thanks to the landowners and wastewater treatment plant managers who graciously allowed access to the wells or streams.

References Cited 43
References Cited
Barnes, K.K., Kolpin, D.W., Furlong, E.T., Zaugg, S.D., Meyer, M.T., Barber, L.B., and Focazio, M.J., 2005, Studies examine contaminants—Pharmaceuticals, hormones, and other organic wastewater contaminants in ground water resources: National Driller Magazine, v. 26, no. 3, March 2005, p. 38-39.
Blazer, V.S., Iwanowicz, L., and Iwanowicz, D., 2007, Endo-crine disruption and fish health issues in the Chesapeake Bay Drainage: Presented at Society of Women Environmental Professionals conference, “Making Environmental Connec-tions,” March 1, 2007, Harrisburg, Pennsylvania.
Buser, H.R., Poiger, T., and Muller, M.D., 1999, Occurrence and environmental behavior of the chiral pharmaceutical drug ibuprofen in surface waters and in wastewater:Environmental Science and Technology, v. 33, p. 2529-2535.
Cahill, J.D., Furlong, E.T., Burkhardt, M.R., Kolpin, D.W., and Anderson, L.G., 2004, Determination of pharmaceutical compounds in surface- and well-water samples by solid-phase extraction and high-performance liquid chromatogra-phy/electrospray ionization mass spectrometry: Journal of Chromatography A, v. 1041, p 171-180.
Childress, C.J.O., Foreman, W.T., Connor, B.F., and Maloney, T.J., 1999, New reporting procedures based on long-term method detection levels and some considerations for inter-pretations of water-quality data provided by the U.S. Geolog-ical Survey National Water Quality Laboratory: U.S. Geo-logical Survey Open-File Report 99-193, 19 p.
Colker, R.M., and Day, R.D., 2006, Environmental impacts of emerging contaminants, executive summary: Renewable Resources Journal, v. 24, no. 1, p. 6-10.
Couper, F.J., and Logan, B.K., 2004, Drugs and human perfor-mance fact sheets - Diphenhydramine Fact Sheet: National Highway Traffic Safety Administration, accessed March 13, 2007, at http://www.nhtsa.dot.gov/PEOPLE/injury/research/job185drugs/diphenhydramine.htm.
Fono, L.J., Kolodziej, E.P., and Sedlak, D.L., 2006, Attenuation of wastewater-derived contaminants in an effluent-domi-nated river: Environmental Science and Technology, v. 36, no. 6, p. 7257-7262.
Goni-Urriza, M., Capdepuy, M., Arpin, C., Raymond, N., Cau-mette, P., and Quentin, C., 2000, Impact of an urban effluent on antibiotic resistance of riverine Enterobacteriaceae and Aeromonas spp.: Applied and Environmental Microbiology, v. 66, p. 125-132.
Halling-Sorensen, B., Nors Nielsen, S., Lansky, P.F., Ingerslev, F., Holten Lutzhoft, H.C., and Jorgensen, S.E., 1998, Occur-rence, fate, and effects of pharmaceutical substances in the environment—A review: Chemosphere, v. 36, no. 2, p. 357-393.
Harris, D.C., 2003, Quantitative chemical analysis (6th ed.):New York, W.H. Freeman, 928 p.
Hinck, J.E., Blazer, V.S., Denslow, N.D., Gross, T.S., Echols, K.R., Davis, A.P., May, T.W., Orazio, C.E., Coyle, J.J., and Tillet, D.E., 2006, Biomonitoring of environmental status and trends program—Environmental contaminants, health indicators, and reproductive biomarkers in fish from the Col-orado River Basin: U.S. Geological Survey Scientific Inves-tigations Report 2006-5163, 119 p.
Iguchi, T., Watanabe, H., and Katsu, Y., 2001, Developmental effects of estrogenic agents on mice, fish and frogs—A mini review: Hormonal Behavior, v. 40, p. 248-251.
Kolpin, D.W., Furlong, E.T., Meyer, M.T., Thurman, E.M., Zaugg, S.D., Barber, L.B., and Buxton, H.T., 2002, Pharma-ceuticals, hormones, and other organic wastewater contami-nants in US streams, 1999-2000—A national reconnaissance: Environmental Science and Technology, v. 36, p. 1202-1211.
Long, P.W., 1995-2005, Drug monograph—Carbamazepine: Internet Mental Health, accessed March 13, 2007, at http://www.mentalhealth.com/drug/p30-t01.html.
Loraine, G.A., and Pettigrove, M.E., 2006, Seasonal variations in concentrations of pharmaceuticals and personal care prod-ucts in drinking water and reclaimed wastewater in Southern California: Environmental Science and Technology, v. 40, no. 3, p. 687-695.
Maloney, T.J., 2005, Quality management system, U.S. Geo-logical Survey National Water Quality laboratory: U.S. Geo-logical Survey Open-File Report 2005-1263, version 1.3, November 9, 2005, chapters and appendixes variously paged, accessed June 21, 2007, at http://pubs.usgs.gov/of/2005/1263/.
Meyer, M.T., Lee, E.A., Ferrell, G.M., Bumgarner, J.E., and Varns, J., 2007, Evaluation of offline tandem and online solid-phase extraction with liquid chromatography/electro-spray ionization-mass spectrometry for analysis of antibiot-ics in ambient water and comparison to an independent method: U.S. Geological Survey Scientific Investigations Report 2007-5021, 28 p.
Micromedex, Inc., 2006, Drugs & supplements, thiabendazole: accessed March 13, 2007, at http://www.mayoclinic.com/health/drug-information/DR202559.
Rang, H.P., and Dale, M.M., 1991, Pharmacology (2nd ed.): London, Churchill Livingstone, 955 p.
Rantz, S.E., and others, 1982, Measurement and computation of streamflow: Volume 1: Measurement of stage and discharge. Volume 2: Computation of discharge: U.S. Geological Survey Water-Supply Paper 2175, 631 p.
Sando, S.K., Furlong, E.T., Meyer, M.T., and Bartholomay, R.C., 2005, Occurrence of organic wastewater compounds in wastewater effluent and the Big Souix River in the Upper Big Souix River Basin, South Dakota, 2003-2004: U.S. Geolog-ical Survey Scientific Investigations Report 2005-5249, 108 p.
Senior, L.A., and Cinotto, P.J., 2007, Effect of on-site wastewa-ter disposal on quality of ground water and base flow—A pilot study in Chester County, southeastern Pennsylvania, 2005: U.S. Geological Survey Open-File Report 2007-1253, 50 p.

44 Concentrations of Selected Pharmaceuticals and Antibiotics in South-Central Pennsylvania, March Through September 2006
Stackleberg, P.E., Furlong, E.T., Meyer, M.T., Zaugg, S.D., Henderson, A.K., and Reissman, D.B., 2004, Persistence of pharmaceutical compounds and other organic wastewater contaminants in a conventional drinking-water treatment plant: Science of the Total Environment, v. 329, p. 99-113.
U.S. Census Bureau, 2006, Statistics for industry groups and industries: 2005 Annual survey of manufactures: Economics and Statistics Administration, November 2006, 202 p. plus appendices A – F.
U.S. Geological Survey, variously dated, National field manual for the collection of water quality data: U.S. Geological Survey Techniques of Water-Resources Investigations, book 9, chaps. A1-A9, available online at http://pubs.water.usgs.gov/twri9A.
U.S. Geological Survey, 2006, Target compounds for national reconnaissance of emerging contaminants in US Streams: accessed March 13, 2007, at http://toxics.usgs.gov/regional/contaminants.html .
Wilde, F.D., ed., April 2004, Cleaning of equipment for water sampling (ver. 2.0): U.S. Geological Survey Techniques of Water-Resources Investigations, book 9, chap. A3, accessed August 9, 2007, at http://pubs.water.usgs.gov/twri9A3/.
Wilde, F.D., Radtke, D.B., Gibs, Jacob, and Iwatsubo, R.T., eds., September 1999, Collection of water samples: U.S. Geological Survey Techniques of Water-Resources Investi-gations, book 9, chap. A4, accessed August 7, 2007, at http://pubs.water.usgs.gov/twri9A4/.
Wilde, F.D., Radtke, D.B., Gibs, Jacob, and Iwatsubo, R.T., eds., April 2004, Processing of water samples (version 2.1): U.S. Geological Survey Techniques of Water-Resources Investigations, book 9, chap. A5, accessed March 15, 2007, at http://pubs.water.usgs.gov/twri9A5/ (Separate updates for 5.6.1.F, “Wastewater, pharmaceutical, and antibiotic com-pounds” are provided on the Web page.)
Woodling, J.D., Lopez, E.M., Maldonado, T.A., Norris, D.O., and Vajda, A.M., 2006, Intersex and other reproductive dis-ruption of fish in wastewater effluent dominated Colorado streams: Comparative Biochemistry and Physiology, Part C, v. 144, p. 10-15.

Table 6 45
Table 6. Field chemistry and conditions, pharmaceutical, and antibiotic data, March to September 2006.
[Compounds are listed alphabetically; shading indicates duplicate samples, duplicate samples are paired with bolded samples collected on the same day and sent to the same laboratory; time offset of one minute used to separate NWQL data from OGRL data for environmental samples collected at the same site on the same day; ft3/s, cubic feet per second; mm Hg, millimeters of mercury; mg/L, milligrams per liter; NWQL, National Water Quality Laboratory; OGRL, Organic Geochemistry Research Laboratory; µS/cm, microsiemens per centimeter at 25 degrees Celsius; °C, degrees Celsius; µg/L, micrograms per liter; fltrd, filtered; <, less than; E(1), concentration is below the long-term method detection limit (for information-rich methods only); E(2), concentration is greater than or equal to the long-term method detection limit but less than the minimum reporting level (lowest calibration standard is less than the minimum reporting level); E(3), the median long-term recovery of the compound is between 30 and 60 percent or the relative standard deviation of long-term recoveries was greater than 25 percent; E(4), if data are reported above the minimum reporting level, but there was a failure in some aspect of lab quality control (for example, the laboratory-spike or sur-rogate recoveries were low and the sample could not be re-analyzed)]

46 Concentrations of Selected Pharmaceuticals and Antibiotics in South-Central Pennsylvania, March Through September 2006
Station number
Station name
Date TimeAgency
analyzing sample
Instan-taneous
discharge (ft3/s)
(P00061)
Baro-metric
pressure (mm HG) (00025)
Dissolved oxygen (mg/L)(00300)
01470857 Spring Creek near Wernersville, Pa. 20060306 1130 NWQL 29 755 14.6
01470857 Spring Creek near Wernersville, Pa. 20060306 1131 OGRL 29 755 14.6
01470857 Spring Creek near Wernersville, Pa. 20060508 1215 NWQL 20 758 11.5
01470857 Spring Creek near Wernersville, Pa. 20060508 1216 OGRL 20 758 11.5
01470857 Spring Creek near Wernersville, Pa. 20060720 1130 NWQL 31 — 9.2
01470857 Spring Creek near Wernersville, Pa. 20060720 1131 OGRL 31 — 9.2
01470857 Spring Creek near Wernersville, Pa. 20060918 1235 NWQL 30 754 9.5
01470857 Spring Creek near Wernersville, Pa. 20060918 1236 OGRL 30 754 9.5
01470858 Spring Creek near Brownsville, Pa. 20060306 1300 NWQL 25 754 15.0
01470858 Spring Creek near Brownsville, Pa. 20060306 1301 OGRL 25 754 15.0
01470858 Spring Creek near Brownsville, Pa. 20060508 1100 NWQL 25 — 11.3
01470858 Spring Creek near Brownsville, Pa. 20060508 1101 OGRL 25 — 11.3
01470858 Spring Creek near Brownsville, Pa. 20060720 1030 NWQL 33 — 9.0
01470858 Spring Creek near Brownsville, Pa. 20060720 1031 OGRL 33 — 9.0
01470858 Spring Creek near Brownsville, Pa. 20060918 1120 NWQL 31 758 9.5
01470858 Spring Creek near Brownsville, Pa. 20060918 1121 OGRL 31 758 9.5
01470858 Spring Creek near Brownsville, Pa. 20060918 1125 NWQL — — —
01470858 Spring Creek near Brownsville, Pa. 20060918 1126 OGRL — — —
015693155 Middle Spring Creek at College at Shippensburg, Pa. 20060313 1100 NWQL 12 — 13.1
015693155 Middle Spring Creek at College at Shippensburg, Pa. 20060313 1101 OGRL 12 — 13.1
015693155 Middle Spring Creek at College at Shippensburg, Pa. 20060510 1145 NWQL 8.3 745 11.7
015693155 Middle Spring Creek at College at Shippensburg, Pa. 20060510 1146 OGRL 8.3 745 11.7
015693155 Middle Spring Creek at College at Shippensburg, Pa. 20060706 1130 NWQL 25 747 10.7
015693155 Middle Spring Creek at College at Shippensburg, Pa. 20060706 1135 OGRL 25 747 10.7
015693155 Middle Spring Creek at College at Shippensburg, Pa. 20060919 1020 NWQL 8.0 743 9.1
015693155 Middle Spring Creek at College at Shippensburg, Pa. 20060919 1021 OGRL 8.0 743 9.1
015693158 Middle Spring Cr ab Burd Run bl Shippensburg, Pa. 20060313 1300 NWQL 14 740 14.3
015693158 Middle Spring Cr ab Burd Run bl Shippensburg, Pa. 20060313 1301 OGRL 14 740 14.3
015693158 Middle Spring Cr ab Burd Run bl Shippensburg, Pa. 20060510 1030 NWQL 11 744 11.3
015693158 Middle Spring Cr ab Burd Run bl Shippensburg, Pa. 20060510 1031 OGRL 11 744 11.3
015693158 Middle Spring Cr ab Burd Run bl Shippensburg, Pa. 20060510 1036 OGRL — — —
015693158 Middle Spring Cr ab Burd Run bl Shippensburg, Pa. 20060706 1020 NWQL 30 746 10.3
015693158 Middle Spring Cr ab Burd Run bl Shippensburg, Pa. 20060706 1025 OGRL 30 746 10.3
015693158 Middle Spring Cr ab Burd Run bl Shippensburg, Pa. 20060706 1030 NWQL — — —
015693158 Middle Spring Cr ab Burd Run bl Shippensburg, Pa. 20060706 1035 OGRL — — —
015693158 Middle Spring Cr ab Burd Run bl Shippensburg, Pa. 20060919 1200 NWQL 11 743 8.9
015693158 Middle Spring Cr ab Burd Run bl Shippensburg, Pa. 20060919 1201 OGRL 11 743 8.9
01571193 Mountain Creek at Mill Street at Mt Holly Springs, Pa. 20060405 1600 NWQL 37 — 13.8
01571193 Mountain Creek at Mill Street at Mt Holly Springs, Pa. 20060405 1601 OGRL 37 — 13.8
01571193 Mountain Creek at Mill Street at Mt Holly Springs, Pa. 20060516 1210 NWQL 132 740 10.7
01571193 Mountain Creek at Mill Street at Mt Holly Springs, Pa. 20060516 1211 OGRL 132 740 10.7
01571193 Mountain Creek at Mill Street at Mt Holly Springs, Pa. 20060726 1500 NWQL 33 748 8.6
01571193 Mountain Creek at Mill Street at Mt Holly Springs, Pa. 20060726 1501 OGRL 33 748 8.6

Table 6 47
Station number
Station name
Date TimeAgency
analyzing sample
Instan-taneous
discharge (ft3/s)
(P00061)
Baro-metric
pressure (mm HG) (00025)
Dissolved oxygen (mg/L)(00300)
01571193 Mountain Creek at Mill Street at Mt Holly Springs, Pa. 20060905 1105 NWQL 24 754 9.5
01571193 Mountain Creek at Mill Street at Mt Holly Springs, Pa. 20060905 1106 OGRL 24 754 9.5
01571195 Mountain Creek at Mt Zion at Mt Holly Springs, Pa. 20060405 1800 NWQL 40 — 13.2
01571195 Mountain Creek at Mt Zion at Mt Holly Springs, Pa. 20060405 1801 OGRL 40 — 13.2
01571195 Mountain Creek at Mt Zion at Mt Holly Springs, Pa. 20060516 1050 NWQL 147 741 10.8
01571195 Mountain Creek at Mt Zion at Mt Holly Springs, Pa. 20060516 1051 OGRL 147 741 10.8
01571195 Mountain Creek at Mt Zion at Mt Holly Springs, Pa. 20060726 1600 NWQL 32 748 8.8
01571195 Mountain Creek at Mt Zion at Mt Holly Springs, Pa. 20060726 1601 OGRL 32 748 8.8
01571195 Mountain Creek at Mt Zion at Mt Holly Springs, Pa. 20060905 0950 NWQL 24 754 9.3
01571195 Mountain Creek at Mt Zion at Mt Holly Springs, Pa. 20060905 0951 OGRL 24 754 9.3
01573151 Killinger Creek US Treatment Plant nr Annville, Pa. 20060307 1415 NWQL 5.1 757 17.1
01573151 Killinger Creek US Treatment Plant nr Annville, Pa. 20060307 1416 OGRL 5.1 757 17.1
01573151 Killinger Creek US Treatment Plant nr Annville, Pa. 20060503 1040 NWQL .73 751 9.9
01573151 Killinger Creek US Treatment Plant nr Annville, Pa. 20060503 1041 OGRL .73 751 9.9
01573151 Killinger Creek US Treatment Plant nr Annville, Pa. 20060719 1110 NWQL 21 757 9.7
01573151 Killinger Creek US Treatment Plant nr Annville, Pa. 20060719 1111 OGRL 21 757 9.7
01573151 Killinger Creek US Treatment Plant nr Annville, Pa. 20060913 1100 NWQL .39 758 10.7
01573151
01573153
01573153
Killinger Creek US Treatment Plant nr Annville, Pa.
Killinger Creek DS Treatment Plant nr Annville, Pa.
Killinger Creek DS Treatment Plant nr Annville, Pa.
20060913
20060307
20060307
1101
1230
1231
OGRL
NWQL
OGRL
.39
6.1
6.1
758
759
759
10.7
14.7
14.7
01573153 Killinger Creek DS Treatment Plant nr Annville, Pa. 20060307 1235 NWQL — — —
01573153 Killinger Creek DS Treatment Plant nr Annville, Pa. 20060307 1236 OGRL — — —
01573153 Killinger Creek DS Treatment Plant nr Annville, Pa. 20060503 0940 NWQL 2.3 751 6.5
01573153 Killinger Creek DS Treatment Plant nr Annville, Pa. 20060503 0941 OGRL 2.3 751 6.5
01573153 Killinger Creek DS Treatment Plant nr Annville, Pa. 20060719 1010 NWQL 31 758 8.8
01573153 Killinger Creek DS Treatment Plant nr Annville, Pa. 20060719 1011 OGRL 31 758 8.8
01573153 Killinger Creek DS Treatment Plant nr Annville, Pa. 20060913 0950 NWQL 1.6 758 7.0
01573153 Killinger Creek DS Treatment Plant nr Annville, Pa. 20060913 0951 OGRL 1.6 758 7.0
01574310 Conoy Creek near Elizabethtown, Pa. 20060301 1600 NWQL 4.7 — 17.4
01574310 Conoy Creek near Elizabethtown, Pa. 20060301 1601 OGRL 4.7 — 17.4
01574310 Conoy Creek near Elizabethtown, Pa. 20060501 0940 NWQL 4.0 761 10.4
01574310 Conoy Creek near Elizabethtown, Pa. 20060501 0941 OGRL 4.0 761 10.4
01574310 Conoy Creek near Elizabethtown, Pa. 20060705 1420 NWQL 14 748 7.9
01574310 Conoy Creek near Elizabethtown, Pa. 20060705 1425 OGRL 14 748 7.9
01574310 Conoy Creek near Elizabethtown, Pa. 20060906 1200 NWQL 2.5 757 9.0
01574310 Conoy Creek near Elizabethtown, Pa. 20060906 1201 OGRL 2.5 757 9.0
01574314 Conoy Creek near Stacktown, Pa. 20060301 1500 NWQL 6.6 — 16.4
01574314
01574314
01574314
Conoy Creek near Stacktown, Pa.
Conoy Creek near Stacktown, Pa.
Conoy Creek near Stacktown, Pa.
20060301
20060501
20060501
1501
1035
1036
OGRL
NWQL
OGRL
6.6
4.5
4.5
—
762
762
16.4
12.5
12.5
01574314 Conoy Creek near Stacktown, Pa. 20060501 1037 NWQL — — —
01574314 Conoy Creek near Stacktown, Pa. 20060501 1038 OGRL — — —
01574314 Conoy Creek near Stacktown, Pa. 20060705 1310 NWQL 22 749 8.1
01574314 Conoy Creek near Stacktown, Pa. 20060705 1315 OGRL 22 749 8.1
01574314 Conoy Creek near Stacktown, Pa. 20060906 1300 NWQL 2.6 757 9.6
01574314 Conoy Creek near Stacktown, Pa. 20060906 1301 OGRL 2.6 757 9.6

48 Concentrations of Selected Pharmaceuticals and Antibiotics in South-Central Pennsylvania, March Through September 2006
Station number
Station name
Date TimeAgency
analyzing sample
Instan-taneous
discharge (ft3/s)
(P00061)
Baro-metric
pressure (mm HG) (00025)
Dissolved oxygen (mg/L)(00300)
01576420 Lititz Run at Lititz, Pa. 20060306 1600 NWQL 16 753 11
01576420 Lititz Run at Lititz, Pa. 20060306 1601 OGRL 16 753 11.0
01576420 Lititz Run at Lititz, Pa. 20060522 1150 NWQL 7.8 753 10.8
01576420 Lititz Run at Lititz, Pa. 20060522 1151 OGRL 7.8 753 10.8
01576420 Lititz Run at Lititz, Pa. 20060717 1150 NWQL 27 754 9.7
01576420 Lititz Run at Lititz, Pa. 20060717 1151 OGRL 27 754 9.7
01576420 Lititz Run at Lititz, Pa. 20060911 1100 NWQL 7.6 766 9.1
01576420 Lititz Run at Lititz, Pa. 20060911 1101 OGRL 7.6 766 9.1
01576422 Lititz Run at Rothsville, Pa. 20060306 1730 NWQL 26 753 —
01576422 Lititz Run at Rothsville, Pa. 20060306 1731 OGRL 26 753 —
01576422 Lititz Run at Rothsville, Pa. 20060522 1025 NWQL 17 754 11.6
01576422 Lititz Run at Rothsville, Pa. 20060522 1026 OGRL 17 754 11.6
01576422 Lititz Run at Rothsville, Pa. 20060717 1030 NWQL 35 755 9.7
01576422 Lititz Run at Rothsville, Pa. 20060717 1031 OGRL 35 755 9.7
01576422 Lititz Run at Rothsville, Pa. 20060911 1205 NWQL 14 767 9.5
01576422 Lititz Run at Rothsville, Pa. 20060911 1206 OGRL 14 767 9.5
01569346 Three Square Hollow Run ab Turnpike nr Newburg, Pa. 20060405 1300 NWQL 1.0 — 10.9
01569346 Three Square Hollow Run ab Turnpike nr Newburg, Pa. 20060405 1301 OGRL 1.0 — 10.9
01569346 Three Square Hollow Run ab Turnpike nr Newburg, Pa. 20060523 1115 NWQL 2.2 745 11.4
01569346 Three Square Hollow Run ab Turnpike nr Newburg, Pa. 20060523 1116 OGRL 2.2 745 11.4
01569346 Three Square Hollow Run ab Turnpike nr Newburg, Pa. 20060726 1045 NWQL 1.2 743 8.1
01569346 Three Square Hollow Run ab Turnpike nr Newburg, Pa. 20060726 1046 OGRL 1.2 743 8.1
01569346 Three Square Hollow Run ab Turnpike nr Newburg, Pa. 20060927 0955 NWQL .38 743 9.6
01569346 Three Square Hollow Run ab Turnpike nr Newburg, Pa. 20060927 0956 OGRL .38 743 9.6
01569349 Three Square Hollow Run bl Turnpike nr Newburg, Pa. 20060405 1130 NWQL 5.5 — 12.5
01569349 Three Square Hollow Run bl Turnpike nr Newburg, Pa. 20060405 1131 OGRL 5.5 — 12.5
01569349 Three Square Hollow Run bl Turnpike nr Newburg, Pa. 20060523 1000 NWQL 7.9 753 12.0
01569349 Three Square Hollow Run bl Turnpike nr Newburg, Pa. 20060523 1001 OGRL 7.9 753 12.0
01569349 Three Square Hollow Run bl Turnpike nr Newburg, Pa. 20060726 1245 NWQL 3.3 749 8.8
01569349 Three Square Hollow Run bl Turnpike nr Newburg, Pa. 20060726 1246 OGRL 3.3 749 8.8
01569349 Three Square Hollow Run bl Turnpike nr Newburg, Pa. 20060927 1100 NWQL .53 750 10.6
01569349 Three Square Hollow Run bl Turnpike nr Newburg, Pa. 20060927 1101 OGRL .53 750 10.6
01572146 Trout Run near Ft. Indiantown Gap, Pa. 20060320 1200 NWQL 1.2 748 15.0
01572146 Trout Run near Ft. Indiantown Gap, Pa. 20060320 1201 OGRL 1.2 748 15.0
01572146 Trout Run near Ft. Indiantown Gap, Pa. 20060518 1145 NWQL 2.3 734 10.6
01572146 Trout Run near Ft. Indiantown Gap, Pa. 20060518 1146 OGRL 2.3 734 10.6
01572146 Trout Run near Ft. Indiantown Gap, Pa. 20060731 1015 NWQL .8 745 8.4
01572146 Trout Run near Ft. Indiantown Gap, Pa. 20060731 1016 OGRL .8 745 8.4
01572146 Trout Run near Ft. Indiantown Gap, Pa. 20060926 0945 NWQL .3 748 10.3
01572146 Trout Run near Ft. Indiantown Gap, Pa. 20060926 0946 OGRL .3 748 10.3
01572148 Trout Run at Scout Camp near Green Point, Pa. 20060320 1445 NWQL 3.3 750 14.9
01572148 Trout Run at Scout Camp near Green Point, Pa. 20060320 1446 OGRL 3.3 750 14.9
01572148 Trout Run at Scout Camp near Green Point, Pa. 20060518 1030 NWQL 6.2 736 10.5
01572148 Trout Run at Scout Camp near Green Point, Pa. 20060518 1031 OGRL 6.2 736 10.5
01572148 Trout Run at Scout Camp near Green Point, Pa. 20060731 1110 NWQL 3.2 — 7.4
01572148 Trout Run at Scout Camp near Green Point, Pa. 20060731 1111 OGRL 3.2 — 7.4

Table 6 49
Station number
Station name
Date TimeAgency
analyzing sample
Instan-taneous
discharge (ft3/s)
(P00061)
Baro-metric
pressure (mm HG) (00025)
Dissolved oxygen (mg/L)(00300)
01572148 Trout Run at Scout Camp near Green Point, Pa. 20060926 1055 NWQL 1.5 750 9.2
01572148 Trout Run at Scout Camp near Green Point, Pa. 20060926 1056 OGRL 1.5 750 9.2
401704076293101 Bachman Run at Fontana, Pa. 20060315 1145 NWQL 4.4 748 14.1
401704076293101 Bachman Run at Fontana, Pa. 20060315 1146 OGRL 4.4 748 14.1
401704076293101 Bachman Run at Fontana, Pa. 20060503 1345 NWQL 3.6 748 8.0
401704076293101 Bachman Run at Fontana, Pa. 20060503 1346 OGRL 3.6 748 8.0
401704076293101 Bachman Run at Fontana, Pa. 20060719 1430 NWQL 5.9 754 9.5
401704076293101 Bachman Run at Fontana, Pa. 20060719 1431 OGRL 5.9 754 9.5
401704076293101 Bachman Run at Fontana, Pa. 20060913 1400 NWQL 3.4 755 9.4
401704076293101 Bachman Run at Fontana, Pa. 20060913 1401 OGRL 3.4 755 9.4
01573095 Bachman Run at Annville, Pa. 20060315 1030 NWQL 11 750 13.1
01573095 Bachman Run at Annville, Pa. 20060315 1031 OGRL 11 750 13.1
01573095 Bachman Run at Annville, Pa. 20060503 1245 NWQL 9.5 750 9.4
01573095 Bachman Run at Annville, Pa. 20060503 1246 OGRL 9.5 750 9.4
01573095 Bachman Run at Annville, Pa. 20060719 1330 NWQL 20 756 12.0
01573095 Bachman Run at Annville, Pa. 20060719 1331 OGRL 20 756 12.0
01573095 Bachman Run at Annville, Pa. 20060913 1305 NWQL 7.1 757 9.7
01573095 Bachman Run at Annville, Pa. 20060913 1306 OGRL 7.1 757 9.7
01574050 Snitz Creek near Falmouth, Pa. 20060316 1030 NWQL .57 753 14.5
01574050 Snitz Creek near Falmouth, Pa. 20060316 1031 OGRL .57 753 14.5
01574050 Snitz Creek near Falmouth, Pa. 20060501 1350 NWQL .28 759 12.3
01574050 Snitz Creek near Falmouth, Pa. 20060501 1351 OGRL .28 759 12.3
01574050 Snitz Creek near Falmouth, Pa. 20060705 1045 NWQL .85 747 7.1
01574050 Snitz Creek near Falmouth, Pa. 20060705 1050 OGRL .85 747 7.1
01574050 Snitz Creek near Falmouth, Pa. 20060906 1030 NWQL .22 756 7.7
01574050 Snitz Creek near Falmouth, Pa. 20060906 1031 OGRL .22 756 7.7
01574055 Snitz Creek near Bainbridge, Pa. 20060316 1130 NWQL 1.3 — 16.4
01574055 Snitz Creek near Bainbridge, Pa. 20060316 1131 OGRL 1.3 — 16.4
01574055 Snitz Creek near Bainbridge, Pa. 20060501 1245 NWQL .86 761 11.2
01574055 Snitz Creek near Bainbridge, Pa. 20060501 1246 OGRL .86 761 11.2
01574055 Snitz Creek near Bainbridge, Pa. 20060705 1145 NWQL 1.8 749 8.5
01574055 Snitz Creek near Bainbridge, Pa. 20060705 1150 OGRL 1.8 749 8.5
01574055 Snitz Creek near Bainbridge, Pa. 20060906 0925 NWQL .43 756 8.2
01574055 Snitz Creek near Bainbridge, Pa. 20060906 0926 OGRL .43 756 8.2
01575771 L Chickies Cr at Camp Road nr Mastersonville, Pa. 20060322 1000 NWQL .40 747 15.5
01575771 L Chickies Cr at Camp Road nr Mastersonville, Pa. 20060322 1001 OGRL .40 747 15.5
01575771 L Chickies Cr at Camp Road nr Mastersonville, Pa. 20060515 1055 NWQL .67 746 9.8
01575771 L Chickies Cr at Camp Road nr Mastersonville, Pa. 20060515 1056 OGRL .67 746 9.8
01575771 L Chickies Cr at Camp Road nr Mastersonville, Pa. 20060717 1410 NWQL .42 750 7.6
01575771 L Chickies Cr at Camp Road nr Mastersonville, Pa. 20060717 1411 OGRL .42 750 7.6
01575771 L Chickies Cr at Camp Road nr Mastersonville, Pa. 20060911 1450 NWQL .09 — 9.1
01575771 L Chickies Cr at Camp Road nr Mastersonville, Pa. 20060911 1451 OGRL .09 — 9.1
015757724 Little Chickies Cr at E-town road nr Milton Grove, Pa. 20060322 1100 NWQL 5.0 752 19.6
015757724 Little Chickies Cr at E-town road nr Milton Grove, Pa. 20060322 1101 OGRL 5.0 752 19.6
015757724 Little Chickies Cr at E-town road nr Milton Grove, Pa. 20060515 0915 NWQL 4.5 749 9.5
015757724 Little Chickies Cr at E-town road nr Milton Grove, Pa. 20060515 0916 OGRL 4.5 749 9.5

50 Concentrations of Selected Pharmaceuticals and Antibiotics in South-Central Pennsylvania, March Through September 2006
Station number
Station name
Date TimeAgency
analyzing sample
Instan-taneous
discharge (ft3/s)
(P00061)
Baro-metric
pressure (mm HG) (00025)
Dissolved oxygen (mg/L)(00300)
015757724 Little Chickies Cr at E-town road nr Milton Grove, Pa. 20060717 1310 NWQL 7.1 751 11.0
015757724 Little Chickies Cr at E-town road nr Milton Grove, Pa. 20060717 1311 OGRL 7.1 751 11.0
015757724 Little Chickies Cr at E-town road nr Milton Grove, Pa. 20060911 1550 NWQL 1.7 764 11.4
015757724 Little Chickies Cr at E-town road nr Milton Grove, Pa. 20060911 1551 OGRL 1.7 764 11.4
01578349
01578349
01578349
01578349
01578349
01578349
01578349
01578349
015783492
015783492
015783492
015783492
015783492
015783492
015783492
015783492
394643077043101
Muddy Run at Cochranville near Parkesburg, Pa.
Muddy Run at Cochranville near Parkesburg, Pa.
Muddy Run at Cochranville near Parkesburg, Pa.
Muddy Run at Cochranville near Parkesburg, Pa.
Muddy Run at Cochranville near Parkesburg, Pa.
Muddy Run at Cochranville near Parkesburg, Pa.
Muddy Run at Cochranville near Parkesburg, Pa.
Muddy Run at Cochranville near Parkesburg, Pa.
Muddy Run at Glennville near Parkesburg, Pa.
Muddy Run at Glennville near Parkesburg, Pa.
Muddy Run at Glennville near Parkesburg, Pa.
Muddy Run at Glennville near Parkesburg, Pa.
Muddy Run at Glennville near Parkesburg, Pa.
Muddy Run at Glennville near Parkesburg, Pa.
Muddy Run at Glennville near Parkesburg, Pa.
Muddy Run at Glennville near Parkesburg, Pa.
AD 653
20060314
20060314
20060511
20060511
20060718
20060718
20060912
20060912
20060314
20060314
20060511
20060511
20060718
20060718
20060912
20060912
20060309
1145
1146
1110
1111
1250
1251
1215
1216
1400
1401
1010
1011
1115
1116
1115
1116
1230
NWQL
OGRL
NWQL
OGRL
NWQL
OGRL
NWQL
OGRL
NWQL
OGRL
NWQL
OGRL
NWQL
OGRL
NWQL
OGRL
NWQL
.39
.39
.19
.19
.35
.35
.11
.11
2.7
2.7
1.6
1.6
5.2
5.2
1.3
1.3
—
—
—
744
744
748
748
758
758
742
742
746
746
750
750
762
762
742
10.9
10.9
9.5
9.5
8.4
8.4
8.8
8.8
9.8
9.8
8.1
8.1
6.4
6.4
7.7
7.7
6.5
394643077043101 AD 653 20060309 1231 OGRL — 742 6.5
394643077043101
394643077043101
AD 653
AD 653
20060504
20060504
1110
1111
NWQL
OGRL
—
—
746
746
6.2
6.2
394643077043101 AD 653 20060504 1112 NWQL — — —
394643077043101 AD 653 20060504 1113 OGRL — — —
394643077043101 AD 653 20060710 1125 NWQL — 748 6.2
394643077043101 AD 653 20060710 1130 OGRL — 748 6.2
394643077043101 AD 653 20060925 1055 NWQL — 745 6.6
394643077043101 AD 653 20060925 1056 OGRL — 745 6.6
400610076282501 LN 2114 20060406 1030 NWQL — 752 8.3
400610076282501 LN 2114 20060406 1031 OGRL — 752 8.3
400610076282501
400610076282501
LN 2114
LN 2114
20060515
20060515
1315
1316
NWQL
OGRL
—
—
751
751
7.9
7.9
400610076282501 LN 2114 20060515 1317 NWQL — — —
400610076282501 LN 2114 20060515 1318 OGRL — — —
400610076282501 LN 2114 20060713 1100 NWQL — 751 8.9
400610076282501 LN 2114 20060713 1101 OGRL — 751 8.9
400610076282501
400610076282501
LN 2114
LN 2114
20060907
20060907
1100
1101
NWQL
OGRL
—
—
760
760
8.1
8.1
400610076282501 LN 2114 20060907 1105 NWQL — — —
400610076282501 LN 2114 20060907 1106 OGRL — — —
401712076235101 LB 1248 20060403 1415 NWQL — — 4.3
401712076235101 LB 1248 20060403 1416 OGRL — — 4.3
401712076235101 LB 1248 20060517 1410 NWQL — 737 4.0
401712076235101 LB 1248 20060517 1411 OGRL — 737 4.0

Table 6 51
Station number
Station name
Date TimeAgency
analyzing sample
Instan-taneous
discharge (ft3/s)
(P00061)
Baro-metric
pressure (mm HG) (00025)
Dissolved oxygen (mg/L)(00300)
401712076235101 LB 1248 20060712 1355 NWQL — 748 3.6
401712076235101 LB 1248 20060712 1400 OGRL — 748 3.6
401712076235101 LB 1248 20060920 1400 NWQL — 743 4.1
401712076235101 LB 1248 20060920 1401 OGRL — 743 4.1
401920078130101 HU 426 20060329 1300 NWQL — 744 .1
401920078130101 HU 426 20060329 1301 OGRL — 744 .1
401920078130101 HU 426 20060509 1400 NWQL — 738 .1
401920078130101 HU 426 20060509 1401 OGRL — 738 .1
401920078130101 HU 426 20060725 1250 NWQL — 740 .1
401920078130101 HU 426 20060725 1251 OGRL — 740 .1
401920078130101 HU 426 20060914 1230 NWQL — 739 .2
401920078130101 HU 426 20060914 1231 OGRL — 739 .2
402052076160101 LB 1249 20060403 1130 NWQL — — 8.8
402052076160101 LB 1249 20060403 1131 OGRL — — 8.8
402052076160101 LB 1249 20060517 1135 NWQL — 741 8.9
402052076160101 LB 1249 20060517 1136 OGRL — 741 8.9
402052076160101 LB 1249 20060712 1140 NWQL — 752 8.9
402052076160101 LB 1249 20060712 1145 OGRL — 752 8.9
402052076160101 LB 1249 20060920 1050 NWQL — 745 8.4
402052076160101 LB 1249 20060920 1051 OGRL — 745 8.4
405931076555601 UN 205 20060323 1140 NWQL — — 1.4
405931076555601 UN 205 20060323 1141 OGRL — — 1.4
405931076555601 UN 205 20060502 1140 NWQL — 750 1.4
405931076555601 UN 205 20060502 1141 OGRL — 750 1.4
405931076555601 UN 205 20060711 1150 NWQL — 751 1.0
405931076555601 UN 205 20060711 1155 OGRL — 751 1.0
405931076555601 UN 205 20060711 1200 NWQL — — —
405931076555601 UN 205 20060711 1205 OGRL — — —
405931076555601 UN 205 20060921 1215 NWQL — 752 .7
405931076555601 UN 205 20060921 1216 OGRL — 752 .7

52 Concentrations of Selected Pharmaceuticals and Antibiotics in South-Central Pennsylvania, March Through September 2006
Station number
Date Time
Dissolved oxygen
(percentsaturation)
(00301)
pH, water,
unfiltered, field
(standard units)
(00400)
Specific conduc-tance, water,
unfiltered (µS/cm °C)
(00095)
Temper-ature,
air(°C)
(00020)
Temper-ature, water(°C)
(00010)
4-Epichlor-tetracycline
hydrochloride, water,
fltrd (µg/L)
(63731)
4-Epioxy-tetra-
cycline water,
fltrd (µg/L)
(63729)
4-Epitetra-cycline hydro-
chloride, water, fltrd
(µg/L)(63727)
01470857 20060306 1130 118 8.2 352 — 6.0 — — —
01470857 20060306 1131 118 8.2 352 — 6.0 < 0.010 < 0.010 < 0.010
01470857 20060508 1215 110 8.1 345 19.0 13.5 — — —
01470857 20060508 1216 110 8.1 345 19.0 13.5 < .010 < .010 < .010
01470857 20060720 1130 97 7.9 359 — 17.9 — — —
01470857 20060720 1131 97 7.9 359 — 17.9 < .010 < .010 < .010
01470857 20060918 1235 97 8.0 368 22.5 16.2 — — —
01470857 20060918 1236 97 8.0 368 22.5 16.2 < .010 < .010 < .010
01470858 20060306 1300 125 8.3 363 — 7.6 — — —
01470858 20060306 1301 125 8.3 363 — 7.6 < .010 < .010 < .010
01470858 20060508 1100 108 7.7 365 — 12.8 — — —
01470858 20060508 1101 108 7.7 365 — 12.8 < .010 < .010 < .010
01470858 20060720 1030 94 7.8 378 — 17.9 — — —
01470858 20060720 1031 94 7.8 378 — 17.9 < .010 < .010 < .010
01470858 20060918 1120 96 7.9 385 22.0 15.8 — — —
01470858 20060918 1121 96 7.9 385 22.0 15.8 < .010 < .010 < .010
01470858 20060918 1125 — — — — — — — —
01470858 20060918 1126 — — — — — < .010 < .010 < .010
015693155 20060313 1100 123 8.2 433 — 12.4 — — —
015693155 20060313 1101 123 8.2 433 — 12.4 < .010 < .010 < .010
015693155 20060510 1145 114 8.1 424 31.5 13.4 — — —
015693155 20060510 1146 114 8.1 424 31.5 13.4 < .010 < .010 < .010
015693155 20060706 1130 107 7.7 336 25.0 15.5 — — —
015693155 20060706 1135 107 7.7 336 25.0 15.5 < .010 < .010 < .010
015693155 20060919 1020 88 8.2 444 21.0 13.9 — — —
015693155 20060919 1021 88 8.2 444 21.0 13.9 < .010 < .010 < .010
015693158 20060313 1300 141 8.3 521 — 14.6 — — —
015693158 20060313 1301 141 8.3 521 — 14.6 < .010 < .010 < .010
015693158 20060510 1030 108 7.8 633 26.0 13.4 — — —
015693158 20060510 1031 108 7.8 633 26.0 13.4 < .010 < .010 < .010
015693158 20060510 1036 — — — — — < .010 < .010 < .010
015693158 20060706 1020 105 7.3 434 22.0 15.9 — — —
015693158 20060706 1025 105 7.3 434 22.0 15.9 < .010 < .010 < .010
015693158 20060706 1030 — — — — — — — —
015693158 20060706 1035 — — — — — < .010 < .010 < .010
015693158 20060919 1200 91 8.2 582 20.5 16.1 — — —
015693158 20060919 1201 91 8.2 582 20.5 16.1 < .010 < .010 < .010
01571193 20060405 1600 126 8.6 96 — 11.4 — — —
01571193 20060405 1601 126 8.6 96 — 11.4 < .010 < .010 < .010
01571193 20060516 1210 100 6.8 57 15.0 12.6 — — —
01571193 20060516 1211 100 6.8 57 15.0 12.6 < .010 < .010 < .010
01571193 20060726 1500 96 8.0 97 28.5 20.9 — — —
01571193 20060726 1501 96 8.0 97 28.5 20.9 < .010 < .010 < .010

Table 6 53
Station number
Date Time
Dissolved oxygen
(percentsaturation)
(00301)
pH, water,
unfiltered, field
(standard units)
(00400)
Specific conduc-tance, water,
unfiltered (µS/cm °C)
(00095)
Temper-ature,
air(°C)
(00020)
Temper-ature, water(°C)
(00010)
4-Epichlor-tetracycline
hydrochloride, water,
fltrd (µg/L)
(63731)
4-Epioxy-tetra-
cycline water,
fltrd (µg/L)
(63729)
4-Epitetra-cycline hydro-
chloride, water, fltrd
(µg/L)(63727)
01571193 20060905 1105 96 7.8 113 17.0 16.0 — — —
01571193 20060905 1106 96 7.8 113 17.0 16.0 < 0.010 < 0.010 < 0.010
01571195 20060405 1800 121 8.6 103 — 11.2 — — —
01571195 20060405 1801 121 8.6 103 — 11.2 < .010 < .010 < .010
01571195 20060516 1050 101 6.7 57 15.5 12.2 — — —
01571195 20060516 1051 101 6.7 57 15.5 12.2 < .010 < .010 < .010
01571195 20060726 1600 100 8.3 107 28.0 21.4 — — —
01571195 20060726 1601 100 8.3 107 28.0 21.4 < .010 < .010 < .010
01571195 20060905 0950 94 7.8 120 17.0 16.2 — — —
01571195 20060905 0951 94 7.8 120 17.0 16.2 < .010 < .010 < .010
01573151 20060307 1415 160 8.8 482 — 12.3 — — —
01573151 20060307 1416 160 8.8 482 — 12.3 < .010 < .010 < .010
01573151 20060503 1040 96 8.5 505 19.0 13.6 — — —
01573151 20060503 1041 96 8.5 505 19.0 13.6 < .010 < .010 < .010
01573151 20060719 1110 106 7.8 410 25.0 19.3 — — —
01573151 20060719 1111 106 7.8 410 25.0 19.3 < .010 < .010 < .010
01573151 20060913 1100 102 8.2 532 15.0 13.6 — — —
01573151
01573153
01573153
20060913
20060307
20060307
1101
1230
1231
102
135
135
8.2
8.2
8.2
532
693
693
15.0
—
—
13.6
11.4
11.4
< .010
—
< .010
< .010
—
< .010
< .010
—
< .010
01573153 20060307 1235 — — — — — — — —
01573153 20060307 1236 — — — — — < .010 < .010 < .010
01573153 20060503 0940 69 7.7 895 18.0 17.3 — — —
01573153 20060503 0941 69 7.7 895 18.0 17.3 < .010 < .010 < .010
01573153 20060719 1010 96 7.7 438 23.5 19.3 — — —
01573153 20060719 1011 96 7.7 438 23.5 19.3 < .010 < .010 < .010
01573153
01573153
01574310
20060913
20060913
20060301
0950
0951
1600
82
82
140
7.4
7.4
9.0
1,020
1,020
389
16.0
16.0
—
22.8
22.8
6.4
—
< .010
—
—
< .010
—
—
< .010
—
01574310 20060301 1601 140 9.0 389 — 6.4 < .010 < .010 < .010
01574310 20060501 0940 96 7.7 389 15.0 11.8 — — —
01574310 20060501 0941 96 7.7 389 15.0 11.8 < .010 < .010 < .010
01574310 20060705 1420 90 7.7 275 25.5 22.3 — — —
01574310 20060705 1425 90 7.7 275 25.5 22.3 < .010 < .010 < .010
01574310 20060906 1200 97 8.3 387 — 18.9 — — —
01574310 20060906 1201 97 8.3 387 — 18.9 < .010 < .010 < .010
01574314 20060301 1500 141 8.9 391 — 8.5 — — —
01574314
01574314
01574314
20060301
20060501
20060501
1501
1035
1036
141
120
120
8.9
8.0
8.0
391
392
392
—
16.0
16.0
8.5
13.9
13.9
< .010
—
< .010
< .010
—
< .010
< .010
—
< .010
01574314 20060501 1037 — — — — — — — —
01574314 20060501 1038 — — — — — < .010 < .010 < .010
01574314 20060705 1310 94 7.7 222 24.5 22.7 — — —
01574314 20060705 1315 94 7.7 222 24.5 22.7 < .010 < .010 < .010
01574314 20060906 1300 108 8.5 392 25.0 21.3 — — —
01574314 20060906 1301 108 8.5 392 25.0 21.3 < .010 < .010 < .010

54 Concentrations of Selected Pharmaceuticals and Antibiotics in South-Central Pennsylvania, March Through September 2006
pH, Specific 4-Epichlor- 4-Epioxy- 4-Epitetra-Dissolved water, conduc- Temper- Temper- tetracycline tetra- cycline
Station number
Date Timeoxygen
(percentsaturation)
unfiltered, field
(standard
tance, water,
unfiltered
ature, air(°C)
ature, water(°C)
hydrochloride, water,
fltrd
cycline water,
fltrd
hydro-chloride,
water, fltrd (00301) units) (µS/cm °C) (00020) (00010) (µg/L) (µg/L) (µg/L)
(00400) (00095) (63731) (63729) (63727)
01576420 20060306 1600 104 7.7 696 — 12.5 — — —
01576420 20060306 1601 104 7.7 696 — 12.5 < 0.010 < 0.010 < 0.010
01576420 20060522 1150 104 7.6 700 16.0 13.6 — — —
01576420 20060522 1151 104 7.6 700 16.0 13.6 < .010 < .010 < .010
01576420 20060717 1150 98 7.5 677 30.0 16.0 — — —
01576420 20060717 1151 98 7.5 677 30.0 16.0 < .010 < .010 < .010
01576420 20060911 1100 88 7.4 740 16.0 14.1 — — —
01576420 20060911 1101 88 7.4 740 16.0 14.1 < .010 < .010 < .010
01576422 20060306 1730 — 7.7 840 — 11.7 — — —
01576422 20060306 1731 — 7.7 840 — 11.7 < .010 < .010 < .010
01576422 20060522 1025 111 7.5 1,110 14.5 13.5 — — —
01576422 20060522 1026 111 7.5 1,110 14.5 13.5 < .010 < .010 < .010
01576422 20060717 1030 99 7.3 859 29.0 16.5 — — —
01576422 20060717 1031 99 7.3 859 29.0 16.5 < .010 < .010 < .010
01576422 20060911 1205 98 7.7 1,150 18.5 16.8 — — —
01576422 20060911 1206 98 7.7 1,150 18.5 16.8 < .010 < .010 < .010
01569346 20060405 1300 94 7.5 41 — 8.6 — — —
01569346 20060405 1301 94 7.5 41 — 8.6 < .010 < .010 < .010
01569346 20060523 1115 98 6.5 35 14.0 9.6 — — —
01569346 20060523 1116 98 6.5 35 14.0 9.6 < .010 < .010 < .010
01569346 20060726 1045 87 7.5 38 21.5 18.7 — — —
01569346 20060726 1046 87 7.5 38 21.5 18.7 < .010 < .010 < .010
01569346 20060927 0955 92 5.3 38 16.0 13.9 — — —
01569346 20060927 0956 92 5.3 38 16.0 13.9 < .010 < .010 < .010
01569349 20060405 1130 104 8.0 90 — 7.4 — — —
01569349 20060405 1131 104 8.0 90 — 7.4 < .010 < .010 < .010
01569349 20060523 1000 107 7.4 66 13.0 10.2 — — —
01569349 20060523 1001 107 7.4 66 13.0 10.2 < .010 < .010 < .010
01569349 20060726 1245 104 8.0 84 28.5 23.4 — — —
01569349 20060726 1246 104 8.0 84 28.5 23.4 < .010 < .010 < .010
01569349 20060927 1100 100 7.2 109 17.0 12.5 — — —
01569349 20060927 1101 100 7.2 109 17.0 12.5 < .010 < .010 < .010
01572146 20060320 1200 114 8.4 29 — 3.7 — — —
01572146 20060320 1201 114 8.4 29 — 3.7 .010 < .010 < .010
01572146 20060518 1145 96 6.6 28 17.0 10.9 — — —
01572146 20060518 1146 96 6.6 28 17.0 10.9 .010 < .010 < .010
01572146 20060731 1015 89 — 36 — 18.0 — — —
01572146 20060731 1016 89 — 36 — 18.0 .010 < .010 < .010
01572146 20060926 0945 96 4.8 36 15.0 12.2 — — —
01572146 20060926 0946 96 4.8 36 15.0 12.2 .010 < .010 < .010
01572148 20060320 1445 120 7.6 40 — 6.3 — — —
01572148 20060320 1446 120 7.6 40 — 6.3 .010 < .010 < .010
01572148 20060518 1030 98 6.6 38 18.0 12.3 — — —
01572148 20060518 1031 98 6.6 38 18.0 12.3 .010 < .010 < .010
01572148 20060731 1110 85 — 52 — 22.8 — — —
01572148 20060731 1111 85 — 52 — 22.8 .010 < .010 < .010

Table 6 55
pH, Specific 4-Epichlor- 4-Epioxy- 4-Epitetra-Dissolved water, conduc- Temper- Temper- tetracycline tetra- cycline
Station number
Date Timeoxygen
(percentsaturation)
unfiltered, field
(standard
tance, water,
unfiltered
ature, air(°C)
ature, water(°C)
hydrochloride, water,
fltrd
cycline water,
fltrd
hydro-chloride,
water, fltrd (00301) units) (µS/cm °C) (00020) (00010) (µg/L) (µg/L) (µg/L)
(00400) (00095) (63731) (63729) (63727)
01572148 20060926 1055 91 7.1 52 16.5 15.0 — — —
01572148 20060926 1056 91 7.1 52 16.5 15.0 0.010 < 0.010 < 0.010
401704076293101 20060315 1145 122 8.1 534 — 8.9 — — —
401704076293101 20060315 1146 122 8.1 534 — 8.9 < .010 < .010 < .010
401704076293101 20060503 1345 80 8.0 514 25.5 15.6 — — —
401704076293101 20060503 1346 80 8.0 514 25.5 15.6 < .010 < .010 < .010
401704076293101 20060719 1430 98 7.8 502 29.5 16.7 — — —
401704076293101 20060719 1431 98 7.8 502 29.5 16.7 < .010 < .010 < .010
401704076293101 20060913 1400 89 7.8 574 15.0 12.8 — — —
401704076293101 20060913 1401 89 7.8 574 15.0 12.8 < .010 < .010 < .010
01573095 20060315 1030 113 7.9 607 — 8.3 — — —
01573095 20060315 1031 113 7.9 607 — 8.3 < .010 < .010 < .010
01573095 20060503 1245 93 8.2 587 26.5 15.1 — — —
01573095 20060503 1246 93 8.2 587 26.5 15.1 < .010 < .010 < .010
01573095 20060719 1330 123 7.8 588 26.5 16.7 — — —
01573095 20060719 1331 123 7.8 588 26.5 16.7 < .010 < .010 < .010
01573095 20060913 1305 91 7.8 614 14.0 12.4 — — —
01573095 20060913 1306 91 7.8 614 14.0 12.4 < .010 < .010 < .010
01574050 20060316 1030 115 6.5 308 — 5.6 — — —
01574050 20060316 1031 115 6.5 308 — 5.6 < .010 < .010 < .010
01574050 20060501 1350 118 8.2 313 24.0 13.5 — — —
01574050 20060501 1351 118 8.2 313 24.0 13.5 < .010 < .010 < .010
01574050 20060705 1045 80 7.5 344 21.5 20.0 — — —
01574050 20060705 1050 80 7.5 344 21.5 20.0 < .010 < .010 < .010
01574050 20060906 1030 80 8.1 402 18.0 17.0 — — —
01574050 20060906 1031 80 8.1 402 18.0 17.0 < .010 < .010 < .010
01574055 20060316 1130 130 8.1 312 — 5.7 — — —
01574055 20060316 1131 130 8.1 312 — 5.7 < .010 < .010 < .010
01574055 20060501 1245 106 7.7 323 30.0 13.0 — — —
01574055 20060501 1246 106 7.7 323 30.0 13.0 < .010 < .010 < .010
01574055 20060705 1145 91 7.3 342 22.0 18.6 — — —
01574055 20060705 1150 91 7.3 342 22.0 18.6 < .010 < .010 < .010
01574055 20060906 0925 85 8.0 367 18.0 — — — —
01574055 20060906 0926 85 8.0 367 18.0 16.6 < .010 < .010 < .010
01575771 20060322 1000 121 7.7 248 — 5.0 — — —
01575771 20060322 1001 121 7.7 248 — 5.0 < .010 < .010 < .010
01575771 20060515 1055 90 7.3 247 10.0 11.8 — — —
01575771 20060515 1056 90 7.3 247 10.0 11.8 < .010 < .010 < .010
01575771 20060717 1410 86 7.4 238 31.0 21.3 — — —
01575771 20060717 1411 86 7.4 238 31.0 21.3 < .010 < .010 < .010
01575771 20060911 1450 93 7.6 242 — 16.2 — — —
01575771 20060911 1451 93 7.6 242 — 16.2 < .010 < .010 < .010
015757724 20060322 1100 150 8.8 279 — 4.2 — — —
015757724 20060322 1101 150 8.8 279 — 4.2 < .010 < .010 < .010
015757724 20060515 0915 90 7.0 280 10.0 12.9 — — —
015757724 20060515 0916 90 7.0 280 10.0 12.9 < .010 < .010 < .010

56 Concentrations of Selected Pharmaceuticals and Antibiotics in South-Central Pennsylvania, March Through September 2006
Station number
Date Time
Dissolved oxygen
(percentsaturation)
(00301)
pH, water,
unfiltered, field
(standard units)
(00400)
Specific conduc-tance, water,
unfiltered (µS/cm °C)
(00095)
Temper-ature,
air(°C)
(00020)
Temper-ature, water(°C)
(00010)
4-Epichlor-tetracycline
hydrochloride, water,
fltrd (µg/L)
(63731)
4-Epioxy-tetra-
cycline water,
fltrd (µg/L)
(63729)
4-Epitetra-cycline hydro-
chloride, water, fltrd
(µg/L)(63727)
015757724 20060717 1310 136 8.8 292 34.0 — — — —
015757724 20060717 1311 136 8.8 292 34.0 26.0 < 0.010 < 0.010 < 0.010
015757724 20060911 1550 124 8.7 306 19.5 19.1 — — —
015757724 20060911 1551 124 8.7 306 19.5 19.1 < .010 < .010 < .010
01578349 20060314 1145 100 6.7 205 — 11.5 — — —
01578349 20060314 1146 100 6.7 205 — 11.5 < .010 < .010 < .010
01578349 20060511 1110 88 6.7 196 22.0 12.4 — — —
01578349 20060511 1111 88 6.7 196 22.0 12.4 < .010 < .010 < .010
01578349 20060718 1250 88 6.5 200 30.0 17.6 — — —
01578349 20060718 1251 88 6.5 200 30.0 17.6 < .010 < .010 < .010
01578349 20060912 1215 85 6.9 197 22.0 14.0 — — —
01578349 20060912 1216 85 6.9 197 22.0 14.0 < .010 < .010 < .010
015783492 20060314 1400 98 7.4 262 — 15.4 — — —
015783492 20060314 1401 98 7.4 262 — 15.4 < .010 < .010 < .010
015783492 20060511 1010 86 7.6 239 23.0 18.4 — — —
015783492 20060511 1011 86 7.6 239 23.0 18.4 < .010 < .010 < .010
015783492 20060718 1115 83 7.4 246 33.0 28.6 — — —
015783492 20060718 1116 83 7.4 246 33.0 28.6 < .010 < .010 < .010
015783492 20060912 1115 83 7.6 250 19.5 19.1 — — —
015783492 20060912 1116 83 7.6 250 19.5 19.1 < .010 < .010 < .010
394643077043101 20060309 1230 61 7.2 542 — 11.9 — — —
394643077043101
394643077043101
394643077043101
20060309
20060504
20060504
1231
1110
1111
61
59
59
7.2
7.3
7.3
542
496
496
—
22.0
22.0
11.9
12.8
12.8
< .010
—
< .010
< .010
—
< .010
< .010
—
< .010
394643077043101 20060504 1112 — — — — — — — —
394643077043101 20060504 1113 — — — — — < .010 < .010 < .010
394643077043101 20060710 1125 60 7.0 526 28.0 12.9 — — —
394643077043101 20060710 1130 60 7.0 526 28.0 12.9 < .010 < .010 < .010
394643077043101 20060925 1055 67 7.4 514 17.0 12.7 — — —
394643077043101 20060925 1056 67 7.4 514 17.0 12.7 < .010 < .010 < .010
400610076282501 20060406 1030 77 7.2 544 — 12.5 — — —
400610076282501
400610076282501
400610076282501
20060406
20060515
20060515
1031
1315
1316
77
75
75
7.2
7.2
7.2
544
553
553
—
13.0
13.0
12.5
12.8
12.8
< .010
—
< .010
< .010
—
< .010
< .010
—
< .010
400610076282501 20060515 1317 — — — — — — — —
400610076282501 20060515 1318 — — — — — < .010 < .010 < .010
400610076282501 20060713 1100 86 6.6 546 26.5 13.2 — — —
400610076282501
400610076282501
400610076282501
20060713
20060907
20060907
1101
1100
1101
86
78
78
6.6
7.8
7.8
546
552
552
26.5
23.5
23.5
13.2
13.3
13.3
< .010
—
< .010
< .010
—
< .010
< .010
—
< .010
400610076282501 20060907 1105 — — — — — — — —
400610076282501 20060907 1106 — — — — — < .010 < .010 < .010
401712076235101 20060403 1415 — 7.2 695 — 11.8 — — —
401712076235101 20060403 1416 — 7.2 695 — 11.8 < .010 < .010 < .010
401712076235101 20060517 1410 38 7.3 673 19.5 11.8 — — —
401712076235101 20060517 1411 38 7.3 673 19.5 11.8 < .010 < .010 < .010

Table 6 57
pH, Specific 4-Epichlor- 4-Epioxy- 4-Epitetra-Dissolved water, conduc- Temper- Temper- tetracycline tetra- cycline
Station number
Date Timeoxygen
(percentsaturation)
unfiltered, field
(standard
tance, water,
unfiltered
ature, air(°C)
ature, water(°C)
hydrochloride, water,
fltrd
cycline water,
fltrd
hydro-chloride,
water, fltrd (00301) units) (µS/cm °C) (00020) (00010) (µg/L) (µg/L) (µg/L)
(00400) (00095) (63731) (63729) (63727)
401712076235101 20060712 1355 34 7.0 704 32.0 12.1 — — —
401712076235101 20060712 1400 34 7.0 704 32.0 12.1 < 0.010 < 0.010 < 0.010
401712076235101 20060920 1400 38 7.3 713 18.5 11.8 — — —
401712076235101 20060920 1401 38 7.3 713 18.5 11.8 < .010 < .010 < .010
401920078130101 20060329 1300 1 7.5 464 — 11.8 — — —
401920078130101 20060329 1301 1 7.5 464 — 11.8 < .010 < .010 < .010
401920078130101 20060509 1400 1 7.5 440 19.5 11.9 — — —
401920078130101 20060509 1401 1 7.5 440 19.5 11.9 < .010 < .010 < .010
401920078130101 20060725 1250 1 — 503 28.5 12.0 — — —
401920078130101 20060725 1251 1 — 503 28.5 12.0 < .010 < .010 < .010
401920078130101 20060914 1230 2 7.5 507 20.7 12.0 — — —
401920078130101 20060914 1231 2 7.5 507 20.7 12.0 < .010 < .010 < .010
402052076160101 20060403 1130 — 7.2 616 — 11.3 — — —
402052076160101 20060403 1131 — 7.2 616 — 11.3 < .010 < .010 < .010
402052076160101 20060517 1135 82 7.1 616 — 11.6 — — —
402052076160101 20060517 1136 82 7.1 616 — 11.6 < .010 < .010 < .010
402052076160101 20060712 1140 84 6.9 650 30.0 12.1 — — —
402052076160101 20060712 1145 84 6.9 650 30.0 12.1 < .010 < .010 < .010
402052076160101 20060920 1050 80 7.3 649 17.0 11.7 — — —
402052076160101 20060920 1051 80 7.3 649 17.0 11.7 < .010 < .010 < .010
405931076555601 20060323 1140 — 7.0 791 — 12.1 — — —
405931076555601 20060323 1141 — 7.0 791 — 12.1 < .010 < .010 < .010
405931076555601 20060502 1140 14 6.9 665 18.0 13.1 — — —
405931076555601 20060502 1141 14 6.9 665 18.0 13.1 < .010 < .010 < .010
405931076555601 20060711 1150 10 6.9 815 30.0 14.3 — — —
405931076555601 20060711 1155 10 6.9 815 30.0 14.3 < .010 < .010 < .010
405931076555601 20060711 1200 — — — — — — — —
405931076555601 20060711 1205 — — — — — < .010 < .010 < .010
405931076555601 20060921 1215 7 7.2 864 19.5 13.2 — — —
405931076555601 20060921 1216 7 7.2 864 19.5 13.2 < .010 < .010 < .010

58 Concentrations of Selected Pharmaceuticals and Antibiotics in South-Central Pennsylvania, March Through September 2006
Station number
Date Time
Acetamin-ophen, water,
fltrd (µg/L)
(62000)
Anhydro-erthromycin,
water,fltrd
(µg/L)(63674)
Azithro-mycin, water,
fltrd(µg/L)
(62792)
Caffeine, water,
fltrd (µg/L)
(50305)
Carbam-azepine, water,
fltrd(µg/L)
(62793)
Carbam-azepine-d10,
surrogate, pharma-ceutical
method, water, fltrd, percent
recovery (90797)1
Chloram-phenicol,
water, fltrd
(µg/L)(65194)
Chlorotetra-cycline, water,
fltrd (µg/L)
(61744)
01470857 20060306 1130 < 0.024 — — < 0.015 < 0.018 99.4 — —
01470857 20060306 1131 — < 0.008 < 0.005 — < .005 — < 0.050 < 0.010
01470857 20060508 1215 < .024 — — < .015 < .018 111 — —
01470857 20060508 1216 — < .008 < .005 — < .005 — < .050 < .010
01470857 20060720 1130 < .024 — — < .015 < .018 77.3 — —
01470857 20060720 1131 — < .008 < .005 — < .005 — < .050 < .010
01470857 20060918 1235 < .024 — — < .015 < .018 105 — —
01470857 20060918 1236 — < .008 < .005 — < .005 — < .050 < .010
01470858
01470858
20060306
20060306
1300
1301
E(1) .007
—
—
< .008
—
< .005
.018
—
E(2) .013
< .005
93.8
—
—
< .050
—
< .010
01470858 20060508 1100 < .024 — — .021 .019 105 — —
01470858 20060508 1101 — .016 < .005 — .026 — < .050 < .010
01470858
01470858
20060720
20060720
1030
1031
< .024
—
—
< .008
—
< .005
< .015
—
E(1) .008
.011
89.1
—
—
< .050
—
< .010
01470858 20060918 1120 < .024 — — .022 < .018 116 — —
01470858 20060918 1121 — < .008 .031 — .014 — < .050 < .010
01470858 20060918 1125 < .024 — — .025 E .019 132 — —
01470858 20060918 1126 — < .008 .035 — .015 — < .050 < .010
015693155 20060313 1100 < .024 — — < .015 < .018 106 — —
015693155 20060313 1101 — < .008 < .005 — < .005 — < .050 < .010
015693155 20060510 1145 < .024 — — < .015 < .018 109 — —
015693155 20060510 1146 — < .008 < .005 — < .005 — < .050 < .010
015693155 20060706 1130 < .024 — — < .015 < .018 86 — —
015693155 20060706 1135 — < .008 < .005 — < .005 — < .050 < .010
015693155 20060919 1020 < .024 — — < .015 < .018 106 — —
015693155 20060919 1021 — < .008 < .005 — < .005 — < .050 < .010
015693158 20060313 1300 < .024 — — < .015 .116 87.1 — —
015693158 20060313 1301 — .061 1.510 — .112 — < .050 < .010
015693158
015693158
20060510
20060510
1030
1031
E(1) .008
—
—
.081
—
1.650
< .025
—
.108
.152
68.6
—
—
< .050
—
< .010
015693158 20060510 1036 — .068 1.280 — .151 — < .050 < .010
015693158 20060706 1020 < .024 — — < .015 .050 68.3 — —
015693158 20060706 1025 — < .008 .078 — .086 — < .050 < .010
015693158 20060706 1030 < .024 — — < .015 .051 71.6 — —
015693158 20060706 1035 — < .008 .014 — .090 — < .050 < .010
015693158 20060919 1200 < .024 — — < .015 .130 79.2 — —
015693158 20060919 1201 — .027 .315 — .138 — < .050 < .010
01571193 20060405 1600 < .024 — — < .015 < .018 E 104 — —
01571193 20060405 1601 — < .008 < .005 — < .005 — < .050 < .010
01571193 20060516 1210 < .024 — — < .015 < .018 83.7 — —
01571193 20060516 1211 — < .008 < .005 — < .005 — < .050 < .010
01571193 20060726 1500 < .024 — — < .015 < .018 93.4 — —
01571193 20060726 1501 — < .008 < .005 — < .005 — < .050 < .0101For recoveries of surrogate compounds, an “E” designation indicates either (1) there was
continuing calibration verification sample values fell outside the limits of compliance. a potential interference with recovery, or (2) one or both of the two
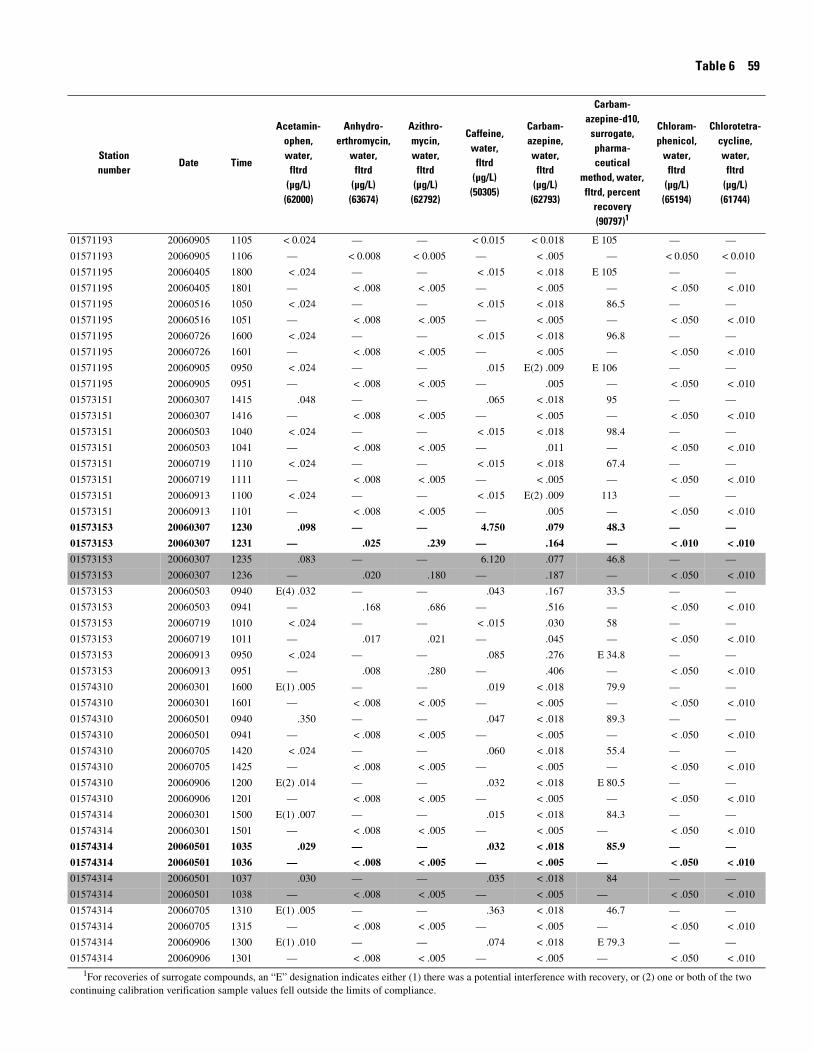
Table 6 59
Station number
Date Time
Acetamin-ophen, water,
fltrd (µg/L)
(62000)
Anhydro-erthromycin,
water,fltrd
(µg/L)(63674)
Azithro-mycin, water,
fltrd(µg/L)
(62792)
Caffeine, water,
fltrd (µg/L)
(50305)
Carbam-azepine, water,
fltrd(µg/L)
(62793)
Carbam-azepine-d10,
surrogate, pharma-ceutical
method, water, fltrd, percent
recovery (90797)1
Chloram-phenicol,
water, fltrd
(µg/L)(65194)
Chlorotetra-cycline, water,
fltrd (µg/L)
(61744)
01571193 20060905 1105 < 0.024 — — < 0.015 < 0.018 E 105 — —
01571193 20060905 1106 — < 0.008 < 0.005 — < .005 — < 0.050 < 0.010
01571195 20060405 1800 < .024 — — < .015 < .018 E 105 — —
01571195 20060405 1801 — < .008 < .005 — < .005 — < .050 < .010
01571195 20060516 1050 < .024 — — < .015 < .018 86.5 — —
01571195 20060516 1051 — < .008 < .005 — < .005 — < .050 < .010
01571195 20060726 1600 < .024 — — < .015 < .018 96.8 — —
01571195 20060726 1601 — < .008 < .005 — < .005 — < .050 < .010
01571195
01571195
20060905
20060905
0950
0951
< .024
—
—
< .008
—
< .005
.015
—
E(2) .009
.005
E 106
—
—
< .050
—
< .010
01573151 20060307 1415 .048 — — .065 < .018 95 — —
01573151 20060307 1416 — < .008 < .005 — < .005 — < .050 < .010
01573151 20060503 1040 < .024 — — < .015 < .018 98.4 — —
01573151 20060503 1041 — < .008 < .005 — .011 — < .050 < .010
01573151 20060719 1110 < .024 — — < .015 < .018 67.4 — —
01573151 20060719 1111 — < .008 < .005 — < .005 — < .050 < .010
01573151
01573151
01573153
01573153
20060913
20060913
20060307
20060307
1100
1101
1230
1231
< .024
—
.098
—
—
< .008
—
.025
—
< .005
—
.239
< .015
—
4.750
—
E(2) .009
.005
.079
.164
113
—
48.3
—
—
< .050
—
< .010
—
< .010
—
< .010
01573153 20060307 1235 .083 — — 6.120 .077 46.8 — —
01573153 20060307 1236 — .020 .180 — .187 — < .050 < .010
01573153
01573153
20060503
20060503
0940
0941
E(4) .032
—
—
.168
—
.686
.043
—
.167
.516
33.5
—
—
< .050
—
< .010
01573153 20060719 1010 < .024 — — < .015 .030 58 — —
01573153 20060719 1011 — .017 .021 — .045 — < .050 < .010
01573153 20060913 0950 < .024 — — .085 .276 E 34.8 — —
01573153 20060913 0951 — .008 .280 — .406 — < .050 < .010
01574310
01574310
20060301
20060301
1600
1601
E(1) .005
—
—
< .008
—
< .005
.019
—
< .018
< .005
79.9
—
—
< .050
—
< .010
01574310 20060501 0940 .350 — — .047 < .018 89.3 — —
01574310 20060501 0941 — < .008 < .005 — < .005 — < .050 < .010
01574310 20060705 1420 < .024 — — .060 < .018 55.4 — —
01574310 20060705 1425 — < .008 < .005 — < .005 — < .050 < .010
01574310
01574310
20060906
20060906
1200
1201
E(2) .014
—
—
< .008
—
< .005
.032
—
< .018
< .005
E 80.5
—
—
< .050
—
< .010
01574314
01574314
01574314
01574314
20060301
20060301
20060501
20060501
1500
1501
1035
1036
E(1) .007
—
.029
—
—
< .008
—
< .008
—
< .005
—
< .005
.015
—
.032
—
< .018
< .005
< .018
< .005
84.3
—
85.9
—
—
< .050
—
< .050
—
< .010
—
< .010
01574314 20060501 1037 .030 — — .035 < .018 84 — —
01574314 20060501 1038 — < .008 < .005 — < .005 — < .050 < .010
01574314
01574314
20060705
20060705
1310
1315
E(1) .005
—
—
< .008
—
< .005
.363
—
< .018
< .005
46.7
—
—
< .050
—
< .010
01574314
01574314
20060906
20060906
1300
1301
E(1) .010
—
—
< .008
—
< .005
.074
—
< .018
< .005
E 79.3
—
—
< .050
—
< .0101For recoveries of surrogate compounds, an “E” designation indicates either (1) there was
continuing calibration verification sample values fell outside the limits of compliance. a potential interference with recovery, or (2) one or both of the two

60 Concentrations of Selected Pharmaceuticals and Antibiotics in South-Central Pennsylvania, March Through September 2006
Station number
Date Time
Acetamin-ophen, water,
fltrd (µg/L)
(62000)
Anhydro-erthromycin,
water,fltrd
(µg/L)(63674)
Azithro-mycin, water,
fltrd(µg/L)
(62792)
Caffeine, water,
fltrd (µg/L)
(50305)
Carbam-azepine, water,
fltrd(µg/L)
(62793)
Carbam-azepine-d10,
surrogate, pharma-ceutical
method, water, fltrd, percent
recovery (90797)1
Chloram-phenicol,
water, fltrd
(µg/L)(65194)
Chlorotetra-cycline, water,
fltrd (µg/L)
(61744)
01576420
01576420
01576420
01576420
01576420
01576420
01576420
01576420
01576422
01576422
01576422
01576422
01576422
01576422
01576422
01576422
01569346
01569346
01569346
01569346
01569346
01569346
01569346
01569346
01569349
01569349
01569349
01569349
01569349
01569349
01569349
01569349
01572146
01572146
01572146
01572146
01572146
01572146
01572146
01572146
01572148
01572148
01572148
01572148
01572148
01572148
20060306
20060306
20060522
20060522
20060717
20060717
20060911
20060911
20060306
20060306
20060522
20060522
20060717
20060717
20060911
20060911
20060405
20060405
20060523
20060523
20060726
20060726
20060927
20060927
20060405
20060405
20060523
20060523
20060726
20060726
20060927
20060927
20060320
20060320
20060518
20060518
20060731
20060731
20060926
20060926
20060320
20060320
20060518
20060518
20060731
20060731
1600
1601
1150
1151
1150
1151
1100
1101
1730
1731
1025
1026
1030
1031
1205
1206
1300
1301
1115
1116
1045
1046
0955
0956
1130
1131
1000
1001
1245
1246
1100
1101
1200
1201
1145
1146
1015
1016
0945
0946
1445
1446
1030
1031
1110
1111
< 0.024
—
< .024
—
< .024
—
< .024
—
< .024
—
E(1) .009
—
< .024
—
< .024
—
< .024
—
< .024
—
< .024
—
< .024
—
< .024
—
< .024
—
< .024
—
< .024
—
< .024
—
< .024
—
< .024
—
< .024
—
E(2) .018
—
< .024
—
< .024
—
—
0.011
—
< .008
—
< .008
—
< .008
—
.028
—
.152
—
.036
—
< .008
—
< .008
—
< .008
—
< .008
—
< .008
—
< .008
—
< .008
—
< .008
—
< .008
—
< .008
—
< .008
—
< .008
—
< .008
—
< .008
—
< .008
—
< .008
—
< 0.005
—
< .005
—
< .005
—
< .005
—
< .005
—
.440
—
.076
—
< .005
—
< .005
—
< .005
—
< .005
—
< .005
—
< .005
—
< .005
—
< .005
—
< .005
—
< .005
—
< .005
—
< .005
—
< .005
—
< .005
—
< .005
—
< .005
< 0.015
—
< .015
—
< .015
—
< .015
—
< .015
—
< .015
—
< .015
—
< .015
—
< .015
—
< .015
—
< .015
—
< .015
—
< .015
—
< .015
—
.015
—
.015
—
< .015
—
< .015
—
< .015
—
< .015
—
< .015
—
< .015
—
< .015
—
< 0.018
.013
< .018
< .005
< .018
< .005
< .018
< .005
.040
.055
.083
.142
E(4) .043
.054
.139
.103
< .018
< .005
< .018
< .005
< .018
< .005
< .018
< .005
< .018
< .005
< .018
< .005
< .018
< .005
< .018
< .005
< .018
< .005
< .018
< .005
< .018
< .005
< .018
< .005
< .018
< .005
< .018
< .005
< .018
< .005
97.3
—
106
—
E 82.1
—
98.4
—
85.5
—
63.4
—
E 92.3
—
73.5
—
E 106
—
94.8
—
96.9
—
99.9
—
E 96.4
—
94.2
—
85.6
—
104
—
95.2
—
100
—
101
—
112
—
95.8
—
98.3
—
94.7
—
—
< 0.050
—
< .050
—
< .050
—
< .050
—
< .050
—
< .050
—
< .050
—
< .050
—
< .050
—
< .050
—
< .050
—
< .050
—
< .050
—
< .050
—
< .050
—
< .050
—
< .050
—
< .050
—
< .050
—
< .050
—
< .050
—
< .050
—
< .050
—
< 0.0010
—
< .010
—
< .010
—
< .010
—
< .010
—
< .010
—
< .010
—
< .010
—
< .010
—
< .010
—
< .010
—
< .010
—
< .010
—
< .010
—
< .010
—
< .010
—
< .010
—
< .010
—
< .010
—
< .010
—
< .010
—
< .010
—
< .010
1For recoveries of surrogate compounds, an “E” designation indicates either (1) there was continuing calibration verification sample values fell outside the limits of compliance.
a potential interference with recovery, or (2) one or both of the two

Table 6 61
Station number
Date Time
Acetamin-ophen, water,
fltrd (µg/L)
(62000)
Anhydro-erthromycin,
water,fltrd
(µg/L)(63674)
Azithro-mycin, water,
fltrd(µg/L)
(62792)
Caffeine, water,
fltrd (µg/L)
(50305)
Carbam-azepine, water,
fltrd(µg/L)
(62793)
Carbam-azepine-d10,
surrogate, pharma-ceutical
method, water, fltrd, percent
recovery (90797)1
Chloram-phenicol,
water, fltrd
(µg/L)(65194)
Chlorotetra-cycline, water,
fltrd (µg/L)
(61744)
01572148
01572148
401704076293101
401704076293101
401704076293101
401704076293101
401704076293101
401704076293101
401704076293101
401704076293101
01573095
01573095
01573095
01573095
01573095
01573095
01573095
01573095
01574050
01574050
01574050
01574050
01574050
01574050
01574050
01574050
01574055
01574055
01574055
01574055
01574055
01574055
01574055
01574055
01575771
01575771
01575771
01575771
01575771
01575771
01575771
01575771
015757724
015757724
015757724
015757724
20060926
20060926
20060315
20060315
20060503
20060503
20060719
20060719
20060913
20060913
20060315
20060315
20060503
20060503
20060719
20060719
20060913
20060913
20060316
20060316
20060501
20060501
20060705
20060705
20060906
20060906
20060316
20060316
20060501
20060501
20060705
20060705
20060906
20060906
20060322
20060322
20060515
20060515
20060717
20060717
20060911
20060911
20060322
20060322
20060515
20060515
1055
1056
1145
1146
1345
1346
1430
1431
1400
1401
1030
1031
1245
1246
1330
1331
1305
1306
1030
1031
1350
1351
1045
1050
1030
1031
1130
1131
1245
1246
1145
1150
0925
0926
1000
1001
1055
1056
1410
1411
1450
1451
1100
1101
0915
0916
< 0.024
—
< .024
—
< .024
—
< .024
—
< .024
—
< .024
—
< .024
—
< .024
—
< .024
—
< .024
—
< .024
—
< .024
—
< .024
—
E(1) .003
—
< .024
—
< .024
—
< .024
—
< .024
—
< .024
—
< .024
—
< .024
—
< .024
—
E(1) .004
—
—
< 0.008
—
< .008
—
< .008
—
< .008
—
< .008
—
< .008
—
< .008
—
< .008
—
< .008
—
< .008
—
< .008
—
< .008
—
< .008
—
< .008
—
< .008
—
< .008
—
< .008
—
< .008
—
< .008
—
< .008
—
< .008
—
< .008
—
< .008
—
< 0.005
—
< .005
—
< .005
—
< .005
—
< .005
—
< .005
—
< .005
—
< .005
—
< .005
—
< .005
—
< .005
—
< .005
—
< .005
—
< .005
—
< .005
—
< .005
—
< .005
—
< .005
—
< .005
—
< .005
—
< .005
—
< .005
—
< .005
< 0.015
—
< .015
—
.019
—
< .015
—
< .015
—
< .015
—
< .015
—
< .015
—
< .015
—
< .015
—
< .017
—
.016
—
< .015
—
< .017
—
.040
—
.030
—
.053
—
< .015
—
< .015
—
< .015
—
< .015
—
< .015
—
.018
—
< 0.018
< .005
< .018
< .005
E(2) .010
.009
< .018
< .005
E(1) .005
< .005
< .018
< .005
< .018
< .005
< .018
< .005
< .018
< .005
< .018
< .005
< .018
< .005
E(1) .006
.007
E(4) .025
.021
< .018
< .005
< .018
< .005
< .018
< .005
E .005
< .005
< .018
< .005
< .018
< .005
< .018
< .005
< .018
< .005
< .018
< .005
E(1) .005
< .005
100
—
99.4
—
103
—
79.8
—
E 104
—
99.3
—
101
—
95.4
—
E 110
—
85.4
—
92.4
—
76.3
—
E 88.3
—
91.3
—
90.4
—
80.3
—
E 105
—
105
—
82.6
—
E 64.3
—
118
—
107
—
84.1
—
—
< 0.050
—
< .050
—
< .050
—
< .050
—
< .050
—
< .050
—
< .050
—
< .050
—
< .050
—
< .050
—
< .050
—
< .050
—
< .050
—
< .050
—
< .050
—
< .050
—
< .050
—
< .050
—
< .050
—
< .050
—
< .050
—
< .050
—
< .050
—
< 0.010
—
< .010
—
< .010
—
< .010
—
< .010
—
< .010
—
< .010
—
< .010
—
< .010
—
< .010
—
< .010
—
< .010
—
< .010
—
< .010
—
< .010
—
< .010
—
< .010
—
< .010
—
< .010
—
< .010
—
< .010
—
< .010
—
< .010
1For recoveries of surrogate compounds, an “E” designation indicates either (1) there was continuing calibration verification sample values fell outside the limits of compliance.
a potential interference with recovery, or (2) one or both of the two

62 Concentrations of Selected Pharmaceuticals and Antibiotics in South-Central Pennsylvania, March Through September 2006
Station number
Date Time
Acetamin-ophen, water,
fltrd (µg/L)
(62000)
Anhydro-erthromycin,
water,fltrd
(µg/L)(63674)
Azithro-mycin, water,
fltrd(µg/L)
(62792)
Caffeine, water,
fltrd (µg/L)
(50305)
Carbam-azepine, water,
fltrd(µg/L)
(62793)
Carbam-azepine-d10,
surrogate, pharma-ceutical
method, water, fltrd, percent
recovery (90797)1
Chloram-phenicol,
water, fltrd
(µg/L)(65194)
Chlorotetra-cycline, water,
fltrd (µg/L)
(61744)
015757724 20060717 1310 < 0.024 — — < 0.015 < 0.018 E 97.2 — —
015757724 20060717 1311 — < 0.008 < 0.005 — < .005 — < 0.050 < 0.010
015757724 20060911 1550 < .024 — — < .015 < .018 103 — —
015757724 20060911 1551 — < .008 < .005 — < .005 — < .050 < .010
01578349 20060314 1145 < .024 — — < .015 < .018 106 — —
01578349 20060314 1146 — < .008 < .005 — < .005 — < .050 < .010
01578349 20060511 1110 < .024 — — < .015 < .018 107 — —
01578349 20060511 1111 — < .008 < .005 — < .005 — < .050 < .010
01578349 20060718 1250 < .024 — — < .015 < .018 E 90 — —
01578349 20060718 1251 — < .008 < .005 — < .005 — < .050 < .010
01578349 20060912 1215 < .024 — — < .015 < .018 102 — —
01578349 20060912 1216 — < .008 < .005 — < .005 — < .050 < .010
015783492
015783492
20060314
20060314
1400
1401
E(1) .009
—
—
< .008
—
< .005
< .015
—
< .018
< .005
87.5
—
—
< .050
—
< .010
015783492 20060511 1010 < .024 — — < .015 < .018 91.3 — —
015783492 20060511 1011 — < .008 < .005 — < .005 — < .050 < .010
015783492 20060718 1115 < .024 — — < .015 < .018 E 65.7 — —
015783492 20060718 1116 — < .008 < .005 — .005 — < .050 < .010
015783492 20060912 1115 < .024 — — < .015 < .018 102 — —
015783492 20060912 1116 — < .008 < .005 — < .005 — < .050 < .010
394643077043101 20060309 1230 < .024 — — < .026 < .018 108 — —
394643077043101
394643077043101
394643077043101
20060309
20060504
20060504
1231
1110
1111
—
< .024
—
< .008
—
< .008
< .005
—
< .005
—
< .015
—
< .005
< .018
< .005
—
111
—
< .050
—
< .050
< .010
—
< .010
394643077043101 20060504 1112 < .024 — — < .015 < .018 108 — —
394643077043101 20060504 1113 — < .008 < .005 — < .005 — < .050 < .010
394643077043101 20060710 1125 < .024 — — < .015 < .018 109 — —
394643077043101 20060710 1130 — < .008 < .005 — < .005 — < .050 < .010
394643077043101 20060925 1055 < .024 — — < .015 < .018 97.7 — —
394643077043101 20060925 1056 — < .008 < .005 — < .005 — < .050 < .010
400610076282501 20060406 1030 < .024 — — < .015 < .018 E 109 — —
400610076282501
400610076282501
400610076282501
20060406
20060515
20060515
1031
1315
1316
—
< .024
—
< .008
—
< .008
< .005
—
< .005
—
< .015
—
< .005
< .018
< .005
—
102
—
< .050
—
< .050
< .010
—
< .010
400610076282501 20060515 1317 < .024 — — < .015 < .018 100 — —
400610076282501 20060515 1318 — < .008 < .005 — < .005 — < .050 < .010
400610076282501 20060713 1100 < .024 — — < .015 < .018 110 — —
400610076282501
400610076282501
400610076282501
20060713
20060907
20060907
1101
1100
1101
—
< .024
—
< .008
—
< .008
< .005
—
< .005
—
< .015
—
< .005
< .018
< .005
—
E 113
—
< .050
—
< .050
< .010
—
< .010
400610076282501 20060907 1105 < .024 — — < .015 < .018 E 110 — —
400610076282501 20060907 1106 — < .008 < .005 — < .005 — < .050 < .010
401712076235101 20060403 1415 < .024 — — < .015 < .018 101 — —
401712076235101 20060403 1416 — < .008 < .005 — < .005 — < .050 < .010
401712076235101 20060517 1410 < .024 — — < .015 < .018 100 — —
401712076235101 20060517 1411 — < .008 < .005 — < .005 — < .050 < .0101For recoveries of surrogate compounds, an “E” designation indicates either (1) there was
continuing calibration verification sample values fell outside the limits of compliance. a potential interference with recovery, or (2) one or both of the two

Table 6 63
Station number
Date Time
Acetamin-ophen, water,
fltrd (µg/L)
(62000)
Anhydro-erthromycin,
water,fltrd
(µg/L)(63674)
Azithro-mycin, water,
fltrd(µg/L)
(62792)
Caffeine, water,
fltrd (µg/L)
(50305)
Carbam-azepine, water,
fltrd(µg/L)
(62793)
Carbam-azepine-d10,
surrogate, pharma-ceutical
method, water, fltrd, percent
recovery (90797)1
Chloram-phenicol,
water, fltrd
(µg/L)(65194)
Chlorotetra-cycline, water,
fltrd (µg/L)
(61744)
401712076235101
401712076235101
401712076235101
401712076235101
401920078130101
401920078130101
401920078130101
401920078130101
401920078130101
401920078130101
401920078130101
401920078130101
402052076160101
402052076160101
402052076160101
402052076160101
402052076160101
402052076160101
402052076160101
402052076160101
405931076555601
405931076555601
405931076555601
405931076555601
405931076555601
405931076555601
405931076555601
405931076555601
405931076555601
405931076555601
20060712
20060712
20060920
20060920
20060329
20060329
20060509
20060509
20060725
20060725
20060914
20060914
20060403
20060403
20060517
20060517
20060712
20060712
20060920
20060920
20060323
20060323
20060502
20060502
20060711
20060711
20060711
20060711
20060921
20060921
1355
1400
1400
1401
1300
1301
1400
1401
1250
1251
1230
1231
1130
1131
1135
1136
1140
1145
1050
1051
1140
1141
1140
1141
1150
1155
1200
1205
1215
1216
< 0.024
—
< .024
—
< .024
—
< .024
—
< .024
—
< .024
—
< .024
—
< .024
—
< .024
—
< .024
—
< .024
—
< .024
—
< .024
—
< .024
—
< .024
—
—
< 0.008
—
< .008
—
< .008
—
< .008
—
< .008
—
< .008
—
< .008
—
< .008
—
< .008
—
< .008
—
< .008
—
< .008
—
< .008
—
< .008
—
< .008
—
< 0.005
—
< .005
—
< .005
—
< .005
—
< .005
—
< .005
—
< .005
—
< .005
—
< .005
—
< .005
—
< .005
—
< .005
—
< .005
—
< .005
—
< .005
< 0.015
—
< .015
—
< .015
—
< .015
—
< .015
—
< .015
—
< .015
—
< .015
—
< .015
—
< .015
—
< .015
—
< .015
—
< .015
—
< .015
—
< .015
—
< 0.018
< .005
< .018
< .005
< .018
< .005
< .018
< .005
< .018
< .005
< .018
< .005
< .018
< .005
< .018
< .005
< .018
< .005
< .018
< .005
< .018
< .005
< .018
< .005
< .018
< .005
< .018
< .005
< .018
< .005
109
—
104
—
104
—
111
—
92.1
—
100
—
100
—
104
—
113
—
96.9
—
113
—
122
—
112
—
108
—
99.1
—
—
< 0.050
—
< .050
—
< .050
—
< .050
—
< .050
—
< .050
—
< .050
—
< .050
—
< .050
—
< .050
—
< .050
—
< .050
—
< .050
—
< .050
—
< .050
—
< 0.010
—
< .010
—
< .010
—
< .010
—
< .010
—
< .010
—
< .010
—
< .010
—
< .010
—
< .010
—
< .010
—
< .010
—
< .010
—
< .010
—
< .010
1For recoveries of surrogate compounds, an “E” designation indicates either (1) there was continuing calibration verification sample values fell outside the limits of compliance.
a potential interference with recovery, or (2) one or both of the two

64 Concentrations of Selected Pharmaceuticals and Antibiotics in South-Central Pennsylvania, March Through September 2006
Cipro- Dehydro- Diphen-Codeine, Cotinine, Diltiazem, Doxycycline,
floxacin, nifedipine, hydramine, Enrofloxacin, water, water, water, water,
Station water water, water, water,Date Time fltrd fltrd fltrd fltrd
number fltrd fltrd fltrd fltrd(µg/L) (µg/L) (µg/L) (µg/L)
(µg/L) (µg/L) (µg/L) (µg/L)(62003) (62005) (62008)2 (62694)
(62898) (62004) (62796)
01470857 20060306 1130 — < 0.022 < 0.028 < 0.022 < 0.018 < 0.023 — —
01470857 20060306 1131 < 0.005 — — — — — < 0.010 < 0.005
01470857 20060508 1215 — < .022 < .028 < .022 < .018 < .023 — —
01470857 20060508 1216 < .005 — — — — — < .010 < .005
01470857 20060720 1130 — < .022 < .028 < .022 < .018 < .023 — —
01470857 20060720 1131 < .005 — — — — — < .010 < .005
01470857 20060918 1235 — < .022 < .028 < .022 < .018 < .023 — —
01470857 20060918 1236 < .005 — — — — — < .010 < .005
01470858 20060306 1300 — E(1) .005 E(1) .004 < .022 < .018 .024 — —
01470858 20060306 1301 < .005 — — — — — < .010 < .005
01470858 20060508 1100 — E(1) .007 E(1) .003 < .022 < .018 E(2) .015 — —
01470858 20060508 1101 < .005 — — — — — < .010 < .005
01470858 20060720 1030 — < .022 < .028 < .022 E(3) .005 < .023 — —
01470858 20060720 1031 < .005 — — — — — < .010 < .005
01470858 20060918 1120 — < .022 < .028 < .022 < .018 E(1) .011 — —
01470858 20060918 1121 < .005 — — — — — < .010 < .005
01470858 20060918 1125 — < .022 E(1) .008 < .022 E(3) .017 < .023 — —
01470858 20060918 1126 < .005 — — — — — < .010 < .005
015693155 20060313 1100 — < .022 < .028 < .022 < .018 < .023 — —
015693155 20060313 1101 < .005 — — — — — < .010 < .005
015693155 20060510 1145 — < .022 < .028 < .022 < .018 < .023 — —
015693155 20060510 1146 < .005 — — — — — < .010 < .005
015693155 20060706 1130 — < .022 < .028 < .022 < .018 < .023 — —
015693155 20060706 1135 < .005 — — — — — < .010 < .005
015693155 20060919 1020 — < .022 < .028 < .022 < .018 < .023 — —
015693155 20060919 1021 < .005 — — — — — < .010 < .005
015693158 20060313 1300 — .031 < .028 < .022 E(3) .023 .026 — —
015693158 20060313 1301 < .005 — — — — — < .010 < .005
015693158 20060510 1030 — .029 E(1) .004 < .022 E(3) .032 .071 — —
015693158 20060510 1031 < .005 — — — — — < .010 < .005
015693158 20060510 1036 .010 — — — — — < .010 < .005
015693158 20060706 1020 — E(1) .010 < .028 < .022 E(3) .024 E(2) .013 — —
015693158 20060706 1025 .007 — — — — — < .010 < .005
015693158 20060706 1030 — E(1) .010 < .028 < .022 E(3) .018 E(1) .009 — —
015693158 20060706 1035 .008 — — — — — < .010 < .005
015693158 20060919 1200 — E(2) .011 < .028 < .022 E(3) .065 E(2) .019 — —
015693158 20060919 1201 .021 — — — — — < .010 < .005
01571193 20060405 1600 — < .022 < .028 < .022 < .018 < .023 — —
01571193 20060405 1601 < .005 — — — — — < .010 < .005
01571193 20060516 1210 — < .022 < .028 < .022 < .018 < .023 — —
01571193 20060516 1211 < .005 — — — — — < .010 < .005
01571193 20060726 1500 — < .022 < .028 < .022 < .018 < .023 — —
01571193 20060726 1501 < .005 — — — — — < .010 < .0052Because of low long-term recoveries, this compound will be qualified.

Table 6 65
Cipro- Dehydro- Diphen-Codeine, Cotinine, Diltiazem, Doxycycline,
floxacin, nifedipine, hydramine, Enrofloxacin, water, water, water, water,
Station water water, water, water,Date Time fltrd fltrd fltrd fltrd
number fltrd fltrd fltrd fltrd(µg/L) (µg/L) (µg/L) (µg/L)
(µg/L) (µg/L) (µg/L) (µg/L)(62003) (62005) (62008)2 (62694)
(62898) (62004) (62796)
01571193 20060905 1105 — < 0.022 < 0.028 < 0.022 < 0.018 < 0.023 — —
01571193 20060905 1106 < 0.005 — — — — — < 0.010 < 0.005
01571195 20060405 1800 — < .022 < .028 < .022 < .018 < .023 — —
01571195 20060405 1801 < .005 — — — — — < .010 < .005
01571195 20060516 1050 — < .022 < .028 < .022 < .018 < .023 — —
01571195 20060516 1051 < .005 — — — — — < .010 < .005
01571195 20060726 1600 — < .022 < .028 < .022 < .018 < .023 — —
01571195 20060726 1601 < .005 — — — — — < .010 < .005
01571195 20060905 0950 — < .022 < .028 < .022 < .018 < .023 — —
01571195 20060905 0951 < .005 — — — — — < .010 < .005
01573151 20060307 1415 — < .022 E(1) .010 < .022 < .018 < .023 — —
01573151 20060307 1416 < .005 — — — — — < .010 < .005
01573151 20060503 1040 — < .022 < .028 < .022 < .018 < .023 — —
01573151 20060503 1041 < .005 — — — — — < .010 < .005
01573151 20060719 1110 — < .022 < .028 < .022 < .018 < .023 — —
01573151 20060719 1111 < .005 — — — — — < .010 < .005
01573151 20060913 1100 — < .022 < .028 < .022 < .018 < .023 — —
01573151 20060913 1101 < .005 — — — — — < .010 < .005
01573153 20060307 1230 — .056 .043 E(1) .006 E(3) .026 .066 — —
01573153 20060307 1231 .075 — — — — — < .010 < .005
01573153 20060307 1235 — .064 .055 E(1) .007 E(3) .039 .098 — —
01573153 20060307 1236 .101 — — — — — < .010 < .005
01573153 20060503 0940 — .155 E(2) .017 E(2) .011 E(3) .079 .135 — —
01573153 20060503 0941 .182 — — — — — < .010 < .005
01573153 20060719 1010 — < .022 < .028 < .022 E(3) .032 E(2) .015 — —
01573153 20060719 1011 < .005 — — — — — < .010 < .005
01573153 20060913 0950 — < .046 < .028 E(2) .015 < .018 < .023 — —
01573153 20060913 0951 .068 — — — — — < .010 < .005
01574310 20060301 1600 — < .022 < .028 < .022 < .018 < .023 — —
01574310 20060301 1601 < .005 — — — — — < .010 < .005
01574310 20060501 0940 — < .022 E(1) .005 < .022 < .018 < .023 — —
01574310 20060501 0941 < .005 — — — — — < .010 < .005
01574310 20060705 1420 — < .022 E(1) .004 < .022 < .018 < .023 — —
01574310 20060705 1425 < .005 — — — — — < .010 < .005
01574310 20060906 1200 — < .022 < .028 < .022 < .018 < .023 — —
01574310 20060906 1201 < .005 — — — — — < .010 < .005
01574314 20060301 1500 — < .022 < .028 < .022 < .018 < .023 — —
01574314 20060301 1501 < .005 — — — — — < .010 < .005
01574314 20060501 1035 — < .022 E(1) .004 < .022 < .018 < .023 — —
01574314 20060501 1036 < .005 — — — — — < .010 < .005
01574314 20060501 1037 — < .022 E(1) .005 < .022 < .018 < .023 — —
01574314 20060501 1038 < .005 — — — — — < .010 < .005
01574314 20060705 1310 — < .022 E(2) .017 < .022 < .018 < .023 — —
01574314 20060705 1315 < .005 — — — — — < .010 < .005
01574314 20060906 1300 — < .022 < .028 < .022 < .018 < .023 — —
01574314 20060906 1301 < .005 — — — — — < .010 < .0052Because of low long-term recoveries, this compound will be qualified.
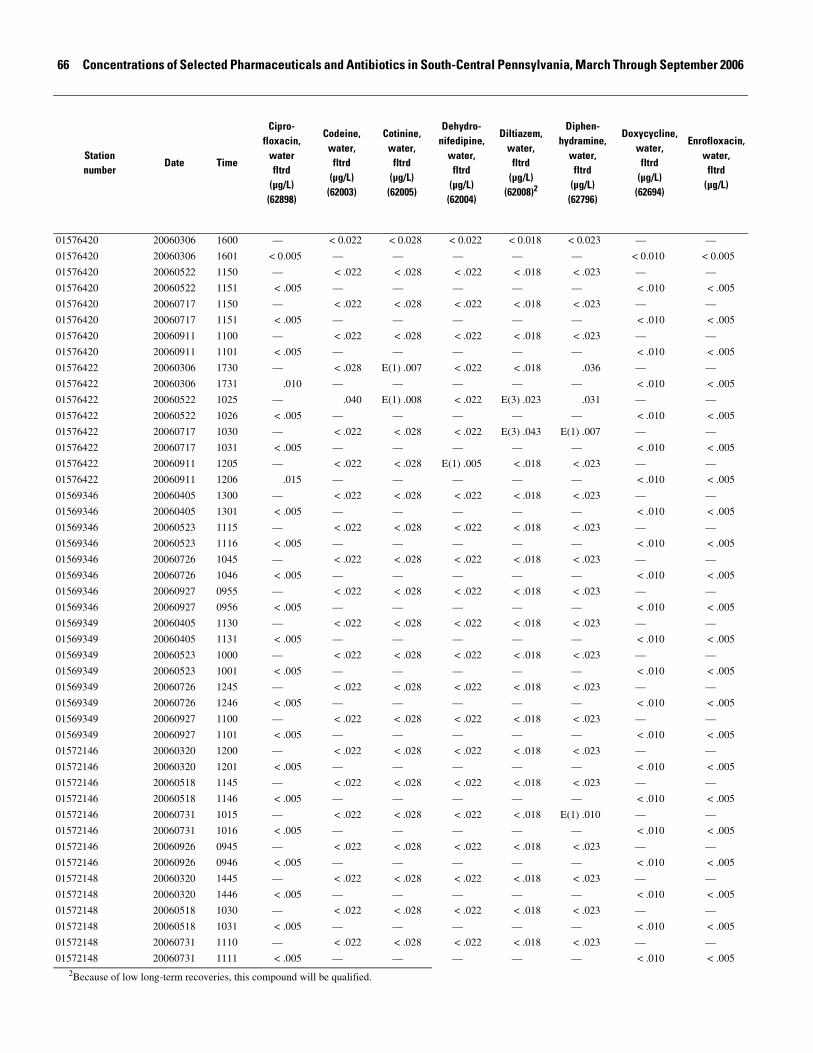
66 Concentrations of Selected Pharmaceuticals and Antibiotics in South-Central Pennsylvania, March Through September 2006
Cipro- Dehydro- Diphen-Codeine, Cotinine, Diltiazem, Doxycycline,
floxacin, nifedipine, hydramine, Enrofloxacin, water, water, water, water,
Station water water, water, water,Date Time fltrd fltrd fltrd fltrd
number fltrd fltrd fltrd fltrd(µg/L) (µg/L) (µg/L) (µg/L)
(µg/L) (µg/L) (µg/L) (µg/L)(62003) (62005) (62008)2 (62694)
(62898) (62004) (62796)
01576420 20060306 1600 — < 0.022 < 0.028 < 0.022 < 0.018 < 0.023 — —
01576420 20060306 1601 < 0.005 — — — — — < 0.010 < 0.005
01576420 20060522 1150 — < .022 < .028 < .022 < .018 < .023 — —
01576420 20060522 1151 < .005 — — — — — < .010 < .005
01576420 20060717 1150 — < .022 < .028 < .022 < .018 < .023 — —
01576420 20060717 1151 < .005 — — — — — < .010 < .005
01576420 20060911 1100 — < .022 < .028 < .022 < .018 < .023 — —
01576420 20060911 1101 < .005 — — — — — < .010 < .005
01576422 20060306 1730 — < .028 E(1) .007 < .022 < .018 .036 — —
01576422 20060306 1731 .010 — — — — — < .010 < .005
01576422 20060522 1025 — .040 E(1) .008 < .022 E(3) .023 .031 — —
01576422 20060522 1026 < .005 — — — — — < .010 < .005
01576422 20060717 1030 — < .022 < .028 < .022 E(3) .043 E(1) .007 — —
01576422 20060717 1031 < .005 — — — — — < .010 < .005
01576422 20060911 1205 — < .022 < .028 E(1) .005 < .018 < .023 — —
01576422 20060911 1206 .015 — — — — — < .010 < .005
01569346 20060405 1300 — < .022 < .028 < .022 < .018 < .023 — —
01569346 20060405 1301 < .005 — — — — — < .010 < .005
01569346 20060523 1115 — < .022 < .028 < .022 < .018 < .023 — —
01569346 20060523 1116 < .005 — — — — — < .010 < .005
01569346 20060726 1045 — < .022 < .028 < .022 < .018 < .023 — —
01569346 20060726 1046 < .005 — — — — — < .010 < .005
01569346 20060927 0955 — < .022 < .028 < .022 < .018 < .023 — —
01569346 20060927 0956 < .005 — — — — — < .010 < .005
01569349 20060405 1130 — < .022 < .028 < .022 < .018 < .023 — —
01569349 20060405 1131 < .005 — — — — — < .010 < .005
01569349 20060523 1000 — < .022 < .028 < .022 < .018 < .023 — —
01569349 20060523 1001 < .005 — — — — — < .010 < .005
01569349 20060726 1245 — < .022 < .028 < .022 < .018 < .023 — —
01569349 20060726 1246 < .005 — — — — — < .010 < .005
01569349 20060927 1100 — < .022 < .028 < .022 < .018 < .023 — —
01569349 20060927 1101 < .005 — — — — — < .010 < .005
01572146 20060320 1200 — < .022 < .028 < .022 < .018 < .023 — —
01572146 20060320 1201 < .005 — — — — — < .010 < .005
01572146 20060518 1145 — < .022 < .028 < .022 < .018 < .023 — —
01572146 20060518 1146 < .005 — — — — — < .010 < .005
01572146 20060731 1015 — < .022 < .028 < .022 < .018 E(1) .010 — —
01572146 20060731 1016 < .005 — — — — — < .010 < .005
01572146 20060926 0945 — < .022 < .028 < .022 < .018 < .023 — —
01572146 20060926 0946 < .005 — — — — — < .010 < .005
01572148 20060320 1445 — < .022 < .028 < .022 < .018 < .023 — —
01572148 20060320 1446 < .005 — — — — — < .010 < .005
01572148 20060518 1030 — < .022 < .028 < .022 < .018 < .023 — —
01572148 20060518 1031 < .005 — — — — — < .010 < .005
01572148 20060731 1110 — < .022 < .028 < .022 < .018 < .023 — —
01572148 20060731 1111 < .005 — — — — — < .010 < .0052Because of low long-term recoveries, this compound will be qualified.
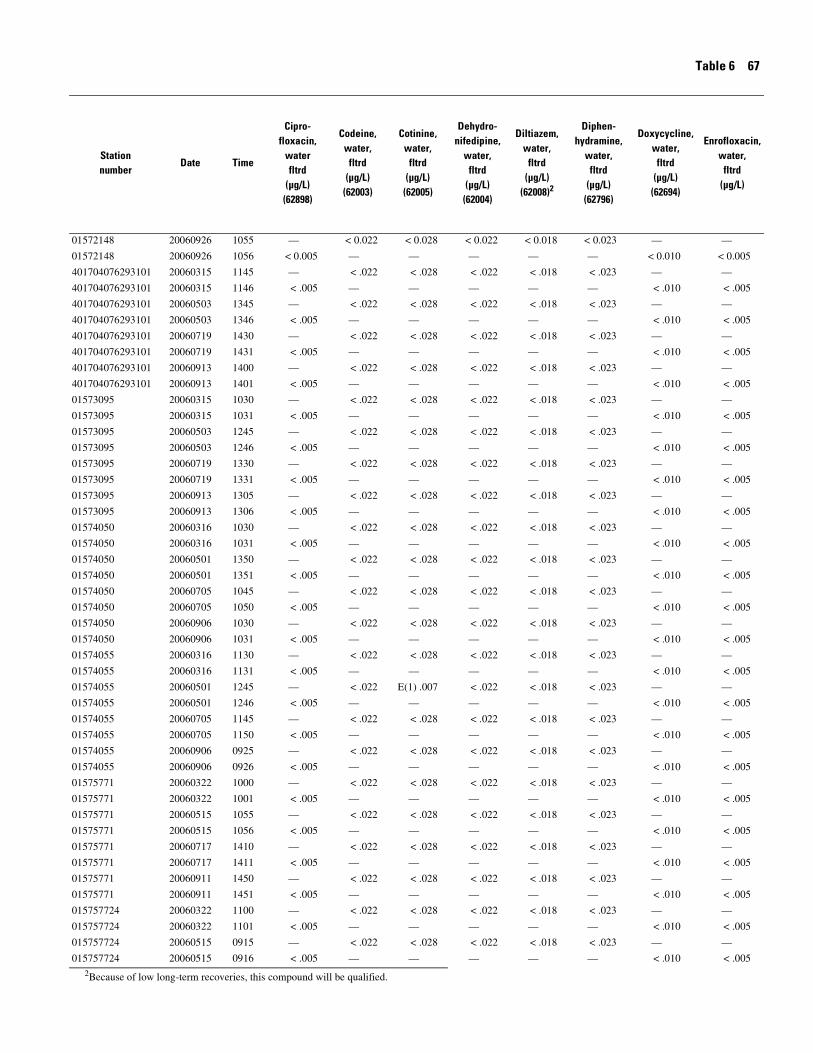
Table 6 67
Cipro- Dehydro- Diphen-Codeine, Cotinine, Diltiazem, Doxycycline,
floxacin, nifedipine, hydramine, Enrofloxacin, water, water, water, water,
Station water water, water, water,Date Time fltrd fltrd fltrd fltrd
number fltrd fltrd fltrd fltrd(µg/L) (µg/L) (µg/L) (µg/L)
(µg/L) (µg/L) (µg/L) (µg/L)(62003) (62005) (62008)2 (62694)
(62898) (62004) (62796)
01572148 20060926 1055 — < 0.022 < 0.028 < 0.022 < 0.018 < 0.023 — —
01572148 20060926 1056 < 0.005 — — — — — < 0.010 < 0.005
401704076293101 20060315 1145 — < .022 < .028 < .022 < .018 < .023 — —
401704076293101 20060315 1146 < .005 — — — — — < .010 < .005
401704076293101 20060503 1345 — < .022 < .028 < .022 < .018 < .023 — —
401704076293101 20060503 1346 < .005 — — — — — < .010 < .005
401704076293101 20060719 1430 — < .022 < .028 < .022 < .018 < .023 — —
401704076293101 20060719 1431 < .005 — — — — — < .010 < .005
401704076293101 20060913 1400 — < .022 < .028 < .022 < .018 < .023 — —
401704076293101 20060913 1401 < .005 — — — — — < .010 < .005
01573095 20060315 1030 — < .022 < .028 < .022 < .018 < .023 — —
01573095 20060315 1031 < .005 — — — — — < .010 < .005
01573095 20060503 1245 — < .022 < .028 < .022 < .018 < .023 — —
01573095 20060503 1246 < .005 — — — — — < .010 < .005
01573095 20060719 1330 — < .022 < .028 < .022 < .018 < .023 — —
01573095 20060719 1331 < .005 — — — — — < .010 < .005
01573095 20060913 1305 — < .022 < .028 < .022 < .018 < .023 — —
01573095 20060913 1306 < .005 — — — — — < .010 < .005
01574050 20060316 1030 — < .022 < .028 < .022 < .018 < .023 — —
01574050 20060316 1031 < .005 — — — — — < .010 < .005
01574050 20060501 1350 — < .022 < .028 < .022 < .018 < .023 — —
01574050 20060501 1351 < .005 — — — — — < .010 < .005
01574050 20060705 1045 — < .022 < .028 < .022 < .018 < .023 — —
01574050 20060705 1050 < .005 — — — — — < .010 < .005
01574050 20060906 1030 — < .022 < .028 < .022 < .018 < .023 — —
01574050 20060906 1031 < .005 — — — — — < .010 < .005
01574055 20060316 1130 — < .022 < .028 < .022 < .018 < .023 — —
01574055 20060316 1131 < .005 — — — — — < .010 < .005
01574055 20060501 1245 — < .022 E(1) .007 < .022 < .018 < .023 — —
01574055 20060501 1246 < .005 — — — — — < .010 < .005
01574055 20060705 1145 — < .022 < .028 < .022 < .018 < .023 — —
01574055 20060705 1150 < .005 — — — — — < .010 < .005
01574055 20060906 0925 — < .022 < .028 < .022 < .018 < .023 — —
01574055 20060906 0926 < .005 — — — — — < .010 < .005
01575771 20060322 1000 — < .022 < .028 < .022 < .018 < .023 — —
01575771 20060322 1001 < .005 — — — — — < .010 < .005
01575771 20060515 1055 — < .022 < .028 < .022 < .018 < .023 — —
01575771 20060515 1056 < .005 — — — — — < .010 < .005
01575771 20060717 1410 — < .022 < .028 < .022 < .018 < .023 — —
01575771 20060717 1411 < .005 — — — — — < .010 < .005
01575771 20060911 1450 — < .022 < .028 < .022 < .018 < .023 — —
01575771 20060911 1451 < .005 — — — — — < .010 < .005
015757724 20060322 1100 — < .022 < .028 < .022 < .018 < .023 — —
015757724 20060322 1101 < .005 — — — — — < .010 < .005
015757724 20060515 0915 — < .022 < .028 < .022 < .018 < .023 — —
015757724 20060515 0916 < .005 — — — — — < .010 < .0052Because of low long-term recoveries, this compound will be qualified.

68 Concentrations of Selected Pharmaceuticals and Antibiotics in South-Central Pennsylvania, March Through September 2006
Cipro- Dehydro- Diphen-Codeine, Cotinine, Diltiazem, Doxycycline,
floxacin, nifedipine, hydramine, Enrofloxacin, water, water, water, water,
Station water water, water, water,Date Time fltrd fltrd fltrd fltrd
number fltrd fltrd fltrd fltrd(µg/L) (µg/L) (µg/L) (µg/L)
(µg/L) (µg/L) (µg/L) (µg/L)(62003) (62005) (62008)2 (62694)
(62898) (62004) (62796)
015757724 20060717 1310 — < 0.022 < 0.028 < 0.022 < 0.018 < 0.023 — —
015757724 20060717 1311 < 0.005 — — — — — < 0.010 < 0.005
015757724 20060911 1550 — < .022 < .028 < .022 < .018 < .023 — —
015757724 20060911 1551 < .005 — — — — — < .010 < .005
01578349 20060314 1145 — < .022 < .028 < .022 < .018 < .023 — —
01578349 20060314 1146 < .005 — — — — — < .010 < .005
01578349 20060511 1110 — < .022 < .028 < .022 < .018 < .023 — —
01578349 20060511 1111 < .005 — — — — — < .010 < .005
01578349 20060718 1250 — < .022 < .028 < .022 < .018 < .023 — —
01578349 20060718 1251 < .005 — — — — — < .010 < .005
01578349 20060912 1215 — < .022 < .028 < .022 < .018 < .023 — —
01578349 20060912 1216 < .005 — — — — — < .010 < .005
015783492 20060314 1400 — < .022 E(1) .007 < .022 < .018 < .023 — —
015783492 20060314 1401 < .005 — — — — — < .010 < .005
015783492 20060511 1010 — < .022 < .028 < .022 < .018 < .023 — —
015783492 20060511 1011 < .005 — — — — — < .010 < .005
015783492 20060718 1115 — < .022 < .028 < .022 < .018 < .023 — —
015783492 20060718 1116 < .005 — — — — — < .010 < .005
015783492 20060912 1115 — < .022 < .028 < .022 < .018 < .023 — —
015783492 20060912 1116 < .005 — — — — — < .010 < .005
394643077043101 20060309 1230 — < .022 < .028 < .022 < .018 < .023 — —
394643077043101 20060309 1231 < .005 — — — — — < .010 < .005
394643077043101 20060504 1110 — < .022 < .028 < .022 < .018 < .023 — —
394643077043101 20060504 1111 < .005 — — — — — < .010 < .005
394643077043101 20060504 1112 — < .022 < .028 < .022 < .018 < .023 — —
394643077043101 20060504 1113 < .005 — — — — — < .010 < .005
394643077043101 20060710 1125 — < .022 < .028 < .022 < .018 < .023 — —
394643077043101 20060710 1130 < .005 — — — — — < .010 < .005
394643077043101 20060925 1055 — < .022 < .028 < .022 < .018 < .023 — —
394643077043101 20060925 1056 < .005 — — — — — < .010 < .005
400610076282501 20060406 1030 — < .022 < .028 < .022 < .018 < .023 — —
400610076282501 20060406 1031 < .005 — — — — — < .010 < .005
400610076282501 20060515 1315 — < .022 < .028 < .022 < .018 < .023 — —
400610076282501 20060515 1316 < .005 — — — — — < .010 < .005
400610076282501 20060515 1317 — < .022 < .028 < .022 < .018 < .023 — —
400610076282501 20060515 1318 < .005 — — — — — < .010 < .005
400610076282501 20060713 1100 — < .022 < .028 < .022 < .018 < .023 — —
400610076282501 20060713 1101 < .005 — — — — — < .010 < .005
400610076282501 20060907 1100 — < .022 < .028 < .022 < .018 < .023 — —
400610076282501 20060907 1101 < .005 — — — — — < .010 < .005
400610076282501 20060907 1105 — < .022 < .028 < .022 < .018 < .023 — —
400610076282501 20060907 1106 < .005 — — — — — < .010 < .005
401712076235101 20060403 1415 — < .022 < .028 < .022 < .018 < .023 — —
401712076235101 20060403 1416 < .005 — — — — — < .010 < .005
401712076235101 20060517 1410 — < .022 < .028 < .022 < .018 < .023 — —
401712076235101 20060517 1411 < .005 — — — — — < .010 < .0052Because of low long-term recoveries, this compound will be qualified.

Table 6 69
Cipro- Dehydro- Diphen-Codeine, Cotinine, Diltiazem, Doxycycline,
floxacin, nifedipine, hydramine, Enrofloxacin, water, water, water, water,
Station water water, water, water,Date Time fltrd fltrd fltrd fltrd
number fltrd fltrd fltrd fltrd(µg/L) (µg/L) (µg/L) (µg/L)
(µg/L) (µg/L) (µg/L) (µg/L)(62003) (62005) (62008)2 (62694)
(62898) (62004) (62796)
401712076235101 20060712 1355 — < 0.022 < 0.028 < 0.022 < 0.018 < 0.023 — —
401712076235101 20060712 1400 < 0.005 — — — — — < 0.010 < 0.005
401712076235101 20060920 1400 — < .022 < .028 < .022 < .018 < .023 — —
401712076235101 20060920 1401 < .005 — — — — — < .010 < .005
401920078130101 20060329 1300 — < .022 < .028 < .022 < .018 < .023 — —
401920078130101 20060329 1301 < .005 — — — — — < .010 < .005
401920078130101 20060509 1400 — < .022 < .028 < .022 < .018 < .023 — —
401920078130101 20060509 1401 < .005 — — — — — < .010 < .005
401920078130101 20060725 1250 — < .022 < .028 < .022 < .018 E(1) .003 — —
401920078130101 20060725 1251 < .005 — — — — — < .010 < .005
401920078130101 20060914 1230 — < .022 < .028 < .022 < .018 < .023 — —
401920078130101 20060914 1231 < .005 — — — — — < .010 < .005
402052076160101 20060403 1130 — < .022 < .028 < .022 < .018 < .023 — —
402052076160101 20060403 1131 < .005 — — — — — < .010 < .005
402052076160101 20060517 1135 — < .022 < .028 < .022 < .018 < .023 — —
402052076160101 20060517 1136 < .005 — — — — — < .010 < .005
402052076160101 20060712 1140 — < .022 < .028 < .022 < .018 < .023 — —
402052076160101 20060712 1145 < .005 — — — — — < .010 < .005
402052076160101 20060920 1050 — < .022 E(2) .024 < .022 < .018 < .023 — —
402052076160101 20060920 1051 < .005 — — — — — < .010 < .005
405931076555601 20060323 1140 — < .022 < .028 < .022 < .018 < .023 — —
405931076555601 20060323 1141 < .005 — — — — — < .010 < .005
405931076555601 20060502 1140 — < .022 < .028 < .022 < .018 < .023 — —
405931076555601 20060502 1141 < .005 — — — — — < .010 < .005
405931076555601 20060711 1150 — < .022 < .028 < .022 < .018 < .023 — —
405931076555601 20060711 1155 < .005 — — — — — < .010 < .005
405931076555601 20060711 1200 — < .022 < .028 < .022 < .018 < .023 — —
405931076555601 20060711 1205 < .005 — — — — — < .010 < .005
405931076555601 20060921 1215 — < .022 < .028 < .022 < .018 < .023 — —
405931076555601 20060921 1216 < .005 — — — — — < .010 < .0052Because of low long-term recoveries, this compound will be qualified.

70 Concentrations of Selected Pharmaceuticals and Antibiotics in South-Central Pennsylvania, March Through September 2006
Station number Date Time
Erythromycin, water,
fltrd (µg/L)
(62797)
Ethyl nicotinate-d4,
surrogate, water, fltrd,
percent recovery (99571)1
Fluoxetine, water,
fltrd (µg/L)
(62011)2
Ibuprofen, water,
fltrd(µg/L)
(62014)
Isochloro-tetracycline,
water, fltrd
(µg/L) (64175)
Isoepichloro-tetracycline,
water,fltrd
(µg/L)(64047)
Lincomycin, water,
fltrd (µg/L)
(62894)
01470857 20060306 1130 — 81.6 < 0.016 — — — —
01470857 20060306 1131 < 0.008 — — < 0.050 < 0.010 < 0.010 < 0.005
01470857 20060508 1215 — 98.8 < .016 — — — —
01470857 20060508 1216 < .008 — — < .050 < .010 < .010 < .005
01470857 20060720 1130 — E 72.2 < .016 — — — —
01470857 20060720 1131 < .008 — — < .050 < .010 < .010 < .005
01470857 20060918 1235 — 83.5 < .016 — — — —
01470857 20060918 1236 < .008 — — < .050 < .010 < .010 < .005
01470858 20060306 1300 — 80.2 < .016 — — — —
01470858 20060306 1301 < .008 — — < .050 < .010 < .010 < .005
01470858 20060508 1100 — 91.7 < .016 — — — —
01470858 20060508 1101 < .008 — — < .050 < .010 < .010 < .005
01470858 20060720 1030 — E 97 < .016 — — — —
01470858 20060720 1031 < .008 — — < .050 < .010 < .010 < .005
01470858 20060918 1120 — 87.2 < .016 — — — —
01470858 20060918 1121 < .008 — — < .050 < .010 < .010 < .005
01470858 20060918 1125 — 89.8 < .016 — — — —
01470858 20060918 1126 < .008 — — < .050 < .010 < .010 < .005
015693155 20060313 1100 — 88 < .016 — — — —
015693155 20060313 1101 < .008 — — < .050 < .010 < .010 < .005
015693155 20060510 1145 — 97.5 < .016 — — — —
015693155 20060510 1146 < .008 — — < .050 < .010 < .010 < .005
015693155 20060706 1130 — 94.7 < .016 — — — —
015693155 20060706 1135 < .008 — — < .050 < .010 < .010 < .005
015693155 20060919 1020 — 88.7 < .016 — — — —
015693155 20060919 1021 < .008 — — < .050 < .010 < .010 < .005
015693158 20060313 1300 — 77.3 < .016 — — — —
015693158 20060313 1301 < .008 — — < .050 < .010 < .010 < .005
015693158 20060510 1030 — 76.3 < .016 — — — —
015693158 20060510 1031 < .008 — — < .050 < .010 < .010 < .005
015693158 20060510 1036 < .008 — — < .050 < .010 < .010 < .005
015693158 20060706 1020 — 81.7 < .016 — — — —
015693158 20060706 1025 < .008 — — < .050 < .010 < .010 < .005
015693158 20060706 1030 — 82.4 < .016 — — — —
015693158 20060706 1035 < .008 — — < .050 < .010 < .010 < .005
015693158 20060919 1200 — 55.3 < .016 — — — —
015693158 20060919 1201 < .008 — — < .050 < .010 < .010 < .005
01571193 20060405 1600 — 95.4 < .016 — — — —
01571193 20060405 1601 < .008 — — < .050 < .010 < .010 < .005
01571193 20060516 1210 — 83.1 < .016 — — — —
01571193 20060516 1211 < .008 — — < .050 < .010 < .010 < .005
01571193 20060726 1500 — 106 < .016 — — — —
01571193 20060726 1501 < .008 — — < .050 < .010 < .010 < .0051For recoveries of surrogate compounds, an “E” designation indicates either (1) there was
two continuing calibration verification sample values fell outside the limits of compliance. 2Because of low long-term recoveries, this compound will be qualified.
a potential interference with recovery or (2) one or both of the

Table 6 71
Station number Date Time
Erythromycin, water,
fltrd (µg/L)
(62797)
Ethyl nicotinate-d4,
surrogate, water, fltrd,
percent recovery (99571)1
Fluoxetine, water,
fltrd (µg/L)
(62011)2
Ibuprofen, water,
fltrd(µg/L)
(62014)
Isochloro-tetracycline,
water, fltrd
(µg/L) (64175)
Isoepichloro-tetracycline,
water,fltrd
(µg/L)(64047)
Lincomycin, water,
fltrd (µg/L)
(62894)
01571193 20060905 1105 — 84.1 < 0.016 — — — —
01571193 20060905 1106 < 0.008 — — < 0.050 < 0.010 < 0.010 < 0.005
01571195 20060405 1800 — 96.2 < .016 — — — —
01571195 20060405 1801 < .008 — — < .050 < .010 < .010 < .005
01571195 20060516 1050 — 87.5 < .016 — — — —
01571195 20060516 1051 < .008 — — < .050 < .010 < .010 < .005
01571195 20060726 1600 — 110 < .016 — — — —
01571195 20060726 1601 < .008 — — < .050 < .010 < .010 < .005
01571195 20060905 0950 — 82.7 < .016 — — — —
01571195 20060905 0951 < .008 — — < .050 < .010 < .010 < .005
01573151 20060307 1415 — 82.1 < .016 — — — —
01573151 20060307 1416 < .008 — — < .050 < .010 < .010 < .005
01573151 20060503 1040 — 83.7 < .016 — — — —
01573151 20060503 1041 < .008 — — < .050 < .010 < .010 < .005
01573151 20060719 1110 — E 85.1 < .016 — — — —
01573151 20060719 1111 < .008 — — < .050 < .010 < .010 < .005
01573151 20060913 1100 — 82.2 < .016 — — — —
01573151 20060913 1101 < .008 — — < .050 < .010 < .010 < .005
01573153 20060307 1230 — 66.2 < .016 — — — —
01573153 20060307 1231 .015 — — .277 < .010 < .010 < .005
01573153 20060307 1235 — 61.6 < .016 — — — —
01573153 20060307 1236 .017 — — .366 < .010 < .010 < .005
01573153 20060503 0940 — 47.1 < .016
01573153 20060503 0941 .011 — — < .050 < .010 < .010 < .005
01573153 20060719 1010 — E 89.1 < .016 — — — —
01573153 20060719 1011 < .008 — — < .050 < .010 < .010 < .005
01573153 20060913 0950 — 54.8 < .016 — — — —
01573153 20060913 0951 .008 — — < .050 < .010 < .010 < .005
01574310 20060301 1600 — 83.8 < .016 — — — —
01574310 20060301 1601 < .008 — — < .050 < .010 < .010 < .005
01574310 20060501 0940 — 90.8 < .016 — — — —
01574310 20060501 0941 < .008 — — < .050 < .010 < .010 < .005
01574310 20060705 1420 — 83.8 < .016 — — — —
01574310 20060705 1425 < .008 — — < .050 < .010 < .010 < .005
01574310 20060906 1200 — 80.2 < .016 — — — —
01574310 20060906 1201 < .008 — — < .050 < .010 < .010 < .005
01574314 20060301 1500 — 90.2 < .016 — — — —
01574314 20060301 1501 < .008 — — < .050 < .010 < .010 < .005
01574314 20060501 1035 — 87.6 < .016 — — — —
01574314 20060501 1036 < .008 — — < .050 < .010 < .010 < .005
01574314 20060501 1037 — 88.2 < .016 — — — —
01574314 20060501 1038 < .008 — — < .050 < .010 < .010 < .005
01574314 20060705 1310 — 83.5 < .016 — — — —
01574314 20060705 1315 < .008 — — < .050 < .010 < .010 < .005
01574314 20060906 1300 — 82 < .016 — — — —
01574314 20060906 1301 < .008 — — < .050 < .010 < .010 < .0051For recoveries of surrogate compounds, an “E” designation indicates either (1) there was
two continuing calibration verification sample values fell outside the limits of compliance. 2Because of low long-term recoveries, this compound will be qualified.
a potential interference with recovery or (2) one or both of the

72 Concentrations of Selected Pharmaceuticals and Antibiotics in South-Central Pennsylvania, March Through September 2006
Station number Date Time
Erythromycin, water,
fltrd (µg/L)
(62797)
Ethyl nicotinate-d4,
surrogate, water, fltrd,
percent recovery (99571)1
Fluoxetine, water,
fltrd (µg/L)
(62011)2
Ibuprofen, water,
fltrd(µg/L)
(62014)
Isochloro-tetracycline,
water, fltrd
(µg/L) (64175)
Isoepichloro-tetracycline,
water,fltrd
(µg/L)(64047)
Lincomycin, water,
fltrd (µg/L)
(62894)
01576420
01576420
01576420
01576420
01576420
01576420
01576420
01576420
01576422
01576422
01576422
01576422
01576422
01576422
01576422
01576422
01569346
01569346
01569346
01569346
01569346
01569346
01569346
01569346
01569349
01569349
01569349
01569349
01569349
01569349
01569349
01569349
01572146
01572146
01572146
01572146
01572146
01572146
01572146
01572146
01572148
01572148
01572148
01572148
01572148
01572148
20060306
20060306
20060522
20060522
20060717
20060717
20060911
20060911
20060306
20060306
20060522
20060522
20060717
20060717
20060911
20060911
20060405
20060405
20060523
20060523
20060726
20060726
20060927
20060927
20060405
20060405
20060523
20060523
20060726
20060726
20060927
20060927
20060320
20060320
20060518
20060518
20060731
20060731
20060926
20060926
20060320
20060320
20060518
20060518
20060731
20060731
1600
1601
1150
1151
1150
1151
1100
1101
1730
1731
1025
1026
1030
1031
1205
1206
1300
1301
1115
1116
1045
1046
0955
0956
1130
1131
1000
1001
1245
1246
1100
1101
1200
1201
1145
1146
1015
1016
0945
0946
1445
1446
1030
1031
1110
1111
—
< 0.008
—
< .008
—
< .008
—
< .008
—
.016
—
.011
—
< .008
—
< .008
—
< .008
—
< .008
—
< .008
—
< .008
—
< .008
—
< .008
—
< .008
—
< .008
—
< .008
—
< .008
—
< .008
—
< .008
—
< .008
—
< .008
—
< .008
87.4
—
93.8
—
E 75.4
—
91.1
—
78.2
—
75.5
—
E 106
—
71.2
—
98.4
—
90.2
—
111
—
85.7
—
97.6
—
91.4
—
104
—
86
—
89.2
—
92.3
—
123
—
86.9
—
91.9
—
89.5
—
110
—
< 0.016
—
< .016
—
< .016
—
< .016
—
< .016
—
< .016
—
< .016
—
< .016
—
< .016
—
< .016
—
< .016
—
< .016
—
< .016
—
< .016
—
< .016
—
< .016
—
< .016
—
< .016
—
< .016
—
< .016
—
< .016
—
< .016
—
< .016
—
—
< 0.050
—
< .050
—
< .050
< .050
—
< .050
—
< .050
—
< .050
—
< .050
—
< .050
—
< .050
—
< .050
—
< .050
—
< .050
—
< .050
—
< .050
—
< .050
—
< .050
—
< .050
—
< .050
—
< .050
—
< .050
—
< .050
—
< .050
—
< 0.010
—
< .010
—
< .010
< .010
—
< .010
—
< .010
—
< .010
—
< .010
—
< .010
—
< .010
—
< .010
—
< .010
—
< .010
—
< .010
—
< .010
—
< .010
—
< .010
—
< .010
—
< .010
—
< .010
—
< .010
—
< .010
—
< .010
—
< 0.010
—
< .010
—
< .010
< .010
—
< .010
—
< .010
—
< .010
—
< .010
—
< .010
—
< .010
—
< .010
—
< .010
—
< .010
—
< .010
—
< .010
—
< .010
—
< .010
—
< .010
—
< .010
—
< .010
—
< .010
—
< .010
—
< .010
—
< 0.005
—
< .005
—
< .005
< .005
—
< .005
—
< .005
—
< .005
—
< .005
—
< .005
—
< .005
—
< .005
—
< .005
—
< .005
—
< .005
—
< .005
—
< .005
—
< .005
—
< .005
—
< .005
—
< .005
—
< .005
—
< .005
—
< .0051For recoveries of surrogate compounds, an “E” designation indicates either (1) there was
two continuing calibration verification sample values fell outside the limits of compliance. 2Because of low long-term recoveries, this compound will be qualified.
a potential interference with recovery or (2) one or both of the

Table 6 73
Station number Date Time
Erythromycin, water,
fltrd (µg/L)
(62797)
Ethyl nicotinate-d4,
surrogate, water, fltrd,
percent recovery (99571)1
Fluoxetine, water,
fltrd (µg/L)
(62011)2
Ibuprofen, water,
fltrd(µg/L)
(62014)
Isochloro-tetracycline,
water, fltrd
(µg/L) (64175)
Isoepichloro-tetracycline,
water,fltrd
(µg/L)(64047)
Lincomycin, water,
fltrd (µg/L)
(62894)
01572148
01572148
401704076293101
401704076293101
401704076293101
401704076293101
401704076293101
401704076293101
401704076293101
401704076293101
01573095
01573095
01573095
01573095
01573095
01573095
01573095
01573095
01574050
01574050
01574050
01574050
01574050
01574050
01574050
01574050
01574055
01574055
01574055
01574055
01574055
01574055
01574055
01574055
01575771
01575771
01575771
01575771
01575771
01575771
01575771
01575771
015757724
015757724
015757724
015757724
20060926
20060926
20060315
20060315
20060503
20060503
20060719
20060719
20060913
20060913
20060315
20060315
20060503
20060503
20060719
20060719
20060913
20060913
20060316
20060316
20060501
20060501
20060705
20060705
20060906
20060906
20060316
20060316
20060501
20060501
20060705
20060705
20060906
20060906
20060322
20060322
20060515
20060515
20060717
20060717
20060911
20060911
20060322
20060322
20060515
20060515
1055
1056
1145
1146
1345
1346
1430
1431
1400
1401
1030
1031
1245
1246
1330
1331
1305
1306
1030
1031
1350
1351
1045
1050
1030
1031
1130
1131
1245
1246
1145
1150
0925
0926
1000
1001
1055
1056
1410
1411
1450
1451
1100
1101
0915
0916
—
< 0.008
—
< .008
—
< .008
—
< .008
—
< .008
—
< .008
—
< .008
—
< .008
—
< .008
—
< .008
—
< .008
—
< .008
—
< .008
—
< .008
—
< .008
—
< .008
—
< .008
—
< .008
—
< .008
—
< .008
—
< .008
—
< .008
—
< .008
84.9
—
85.7
—
92
—
E 75.2
—
88.5
—
90.3
—
91.7
—
E 102
—
91
—
85.2
—
88.6
—
89.7
—
74.9
—
82.5
—
88.1
—
94.9
—
85.2
—
100
—
81.6
—
E 61.4
—
97.8
—
103
—
82.5
—
< 0.016
—
< .016
—
< .016
—
< .016
—
< .016
—
< .016
—
< .016
—
< .016
—
< .016
—
< .016
—
< .016
—
< .016
—
< .016
—
< .016
—
< .016
—
< .016
—
< .016
—
< .016
—
< .016
—
< .016
—
< .016
—
< .016
—
< .016
—
—
< 0.050
—
< .050
—
< .050
—
< .050
—
< .050
—
< .050
—
< .050
—
< .050
—
< .050
—
< .050
—
< .050
—
< .050
—
< .050
—
< .050
—
< .050
—
< .050
—
< .050
—
< .050
—
< .050
—
< .050
—
< .050
—
< .050
—
< .050
—
< 0.010
—
< .010
—
< .010
—
< .010
—
< .010
—
< .010
—
< .010
—
< .010
—
< .010
—
< .010
—
< .010
—
< .010
—
< .010
—
< .010
—
< .010
—
< .010
—
< .010
—
< .010
—
< .010
—
< .010
—
< .010
—
< .010
—
< .010
—
< 0.010
—
< .010
—
< .010
—
< .010
—
< .010
—
< .010
—
< .010
—
< .010
—
< .010
—
< .010
—
< .010
—
< .010
—
< .010
—
< .010
—
< .010
—
< .010
—
< .010
—
< .010
—
< .010
—
< .010
—
< .010
—
< .010
—
< .010
—
< 0.005
—
< .005
—
< .005
—
< .005
—
< .005
—
< .005
—
< .005
—
< .005
—
< .005
—
< .005
—
< .005
—
< .005
—
< .005
—
< .005
—
< .005
—
< .005
—
< .005
—
< .005
—
< .005
—
< .005
—
< .005
—
< .005
—
< .0051For recoveries of surrogate compounds, an “E” designation indicates either (1) there was
two continuing calibration verification sample values fell outside the limits of compliance. 2Because of low long-term recoveries, this compound will be qualified.
a potential interference with recovery or (2) one or both of the

74 Concentrations of Selected Pharmaceuticals and Antibiotics in South-Central Pennsylvania, March Through September 2006
Ethyl Isochloro- Isoepichloro-
Erythromycin, nicotinate-d4, Fluoxetine, Ibuprofen, Lincomycin, tetracycline, tetracycline,
water, surrogate, water, water, water, water, water,
Station number Date Time fltrd water, fltrd, fltrd fltrd fltrd fltrd fltrd
(µg/L) percent (µg/L) (µg/L) (µg/L)(µg/L) (µg/L)
(62797) recovery (62011)2 (62014) (62894)(64175) (64047)
(99571)1
015757724 20060717 1310 — E 121 < 0.016 — — — —
015757724 20060717 1311 < 0.008 — — < 0.050 < 0.010 < 0.010 < 0.005
015757724 20060911 1550 — 86.7 < .016 — — — —
015757724 20060911 1551 < .008 — — < .050 < .010 < .010 < .005
01578349 20060314 1145 — 89 < .016 — — — —
01578349 20060314 1146 < .008 — — < .050 < .010 < .010 < .005
01578349 20060511 1110 — 90.1 < .016 — — — —
01578349 20060511 1111 < .008 — — < .050 < .010 < .010 < .005
01578349 20060718 1250 — E 78.8 < .016 — — — —
01578349 20060718 1251 < .008 — — < .050 < .010 < .010 < .005
01578349 20060912 1215 — 85.8 < .016 — — — —
01578349 20060912 1216 < .008 — — < .050 < .010 < .010 < .005
015783492 20060314 1400 — 81.6 < .016 — — — —
015783492 20060314 1401 < .008 — — < .050 < .010 < .010 < .005
015783492 20060511 1010 — 84 < .016 — — — —
015783492 20060511 1011 < .008 — — < .050 < .010 < .010 < .005
015783492 20060718 1115 — E 75.1 < .016 — — — —
015783492 20060718 1116 < .008 — — < .050 < .010 < .010 < .005
015783492 20060912 1115 — 87.8 < .016 — — — —
015783492 20060912 1116 < .008 — — < .050 < .010 < .010 < .005
394643077043101 20060309 1230 — 99.5 < .016 — — — —
394643077043101 20060309 1231 < .008 — — < .050 < .010 < .010 < .005
394643077043101 20060504 1110 — 101 < .016 — — — —
394643077043101 20060504 1111 < .008 — — < .050 < .010 < .010 < .005
394643077043101 20060504 1112 — 98.2 < .016 — — — —
394643077043101 20060504 1113 < .008 — — < .050 < .010 < .010 < .005
394643077043101 20060710 1125 — 105 < .016 — — — —
394643077043101 20060710 1130 < .008 — — < .050 < .010 < .010 < .005
394643077043101 20060925 1055 — 88.8 < .016 — — — —
394643077043101 20060925 1056 < .008 — — < .050 < .010 < .010 < .005
400610076282501 20060406 1030 — 100.3 < .016 — — — —
400610076282501 20060406 1031 < .008 — — < .050 < .010 < .010 < .005
400610076282501 20060515 1315 — 95.1 < .016 — — — —
400610076282501 20060515 1316 < .008 — — < .050 < .010 < .010 < .005
400610076282501 20060515 1317 — 97.1 < .016 — — — —
400610076282501 20060515 1318 < .008 — — < .050 < .010 < .010 < .005
400610076282501 20060713 1100 — 106 < .016 — — — —
400610076282501 20060713 1101 < .008 — — < .050 < .010 < .010 < .005
400610076282501 20060907 1100 — 96.6 < .016 — — — —
400610076282501 20060907 1101 < .008 — — < .050 < .010 < .010 < .005
400610076282501 20060907 1105 — 96.4 < .016 — — — —
400610076282501 20060907 1106 < .008 — — < .050 < .010 < .010 < .005
401712076235101 20060403 1415 — 101 < .016 — — — —
401712076235101 20060403 1416 < .008 — — < .050 < .010 < .010 < .005
401712076235101 20060517 1410 — 93 < .016 — — — —
401712076235101 20060517 1411 < .008 — — < .050 < .010 < .010 < .0051For recoveries of surrogate compounds, an “E” designation indicates either (1) there was a potential interference with recovery or (2) one or both of the
two continuing calibration verification sample values fell outside the limits of compliance. 2Because of low long-term recoveries, this compound will be qualified.

Table 6 75
Station number Date Time
Erythromycin, water,
fltrd (µg/L)
(62797)
Ethyl nicotinate-d4,
surrogate, water, fltrd,
percent recovery (99571)1
Fluoxetine, water,
fltrd (µg/L)
(62011)2
Ibuprofen, water,
fltrd(µg/L)
(62014)
Isochloro-tetracycline,
water, fltrd
(µg/L) (64175)
Isoepichloro-tetracycline,
water,fltrd
(µg/L)(64047)
Lincomycin, water,
fltrd (µg/L)
(62894)
401712076235101
401712076235101
401712076235101
401712076235101
401920078130101
401920078130101
401920078130101
401920078130101
401920078130101
401920078130101
401920078130101
401920078130101
402052076160101
402052076160101
402052076160101
402052076160101
402052076160101
402052076160101
402052076160101
402052076160101
405931076555601
405931076555601
405931076555601
405931076555601
405931076555601
405931076555601
405931076555601
405931076555601
405931076555601
405931076555601
20060712
20060712
20060920
20060920
20060329
20060329
20060509
20060509
20060725
20060725
20060914
20060914
20060403
20060403
20060517
20060517
20060712
20060712
20060920
20060920
20060323
20060323
20060502
20060502
20060711
20060711
20060711
20060711
20060921
20060921
1355
1400
1400
1401
1300
1301
1400
1401
1250
1251
1230
1231
1130
1131
1135
1136
1140
1145
1050
1051
1140
1141
1140
1141
1150
1155
1200
1205
1215
1216
—
< 0.008
—
< .008
—
< .008
—
< .008
—
< .008
—
< .008
—
< .008
—
< .008
—
< .008
—
< .008
—
< .008
—
< .008
—
< .008
—
< .008
—
< .008
95.7
—
93.8
—
111
—
106
—
114
—
92.6
—
104
—
97.1
—
104
—
94.8
—
105
—
99.5
—
105
—
100
—
87.9
—
< 0.016
—
< .016
—
< .016
—
< .016
—
< .016
—
< .016
—
< .016
—
< .016
—
< .016
—
< .016
—
< .016
—
< .016
—
< .016
—
< .016
—
< .016
—
—
< 0.050
—
< .050
—
< .050
—
< .050
—
< .050
—
< .050
—
< .050
—
< .050
—
< .050
—
< .050
—
< .050
—
< .050
—
< .050
—
< .050
—
< .050
—
< 0.010
—
< .010
—
< .010
—
< .010
—
< .010
—
< .010
—
< .010
—
< .010
—
< .010
—
< .010
—
< .010
—
< .010
—
< .010
—
< .010
—
< .010
—
< 0.010
—
< .010
—
< .010
—
< .010
—
< .010
—
< .010
—
< .010
—
< .010
—
< .010
—
< .010
—
< .010
—
< .010
—
< .010
—
< .010
—
< .010
—
< 0.005
—
< .005
—
< .005
—
< .005
—
< .005
—
< .005
—
< .005
—
< .005
—
< .005
—
< .005
—
< .005
—
< .005
—
< .005
—
< .005
—
< .0051For recoveries of surrogate compounds, an “E” designation indicates either (1) there was
two continuing calibration verification sample values fell outside the limits of compliance. 2Because of low long-term recoveries, this compound will be qualified.
a potential interference with recovery or (2) one or both of the

76 Concentrations of Selected Pharmaceuticals and Antibiotics in South-Central Pennsylvania, March Through September 2006
Lome- Oxytetra-Norfloxacin, Ofloxacin, Ormetoprim, p-Xanthine, Ranitidine, Roxithromycin,
floxacin, cycline,water, water, water, water, water, water,
water, water,Station number Date Time fltrd fltrd fltrd fltrd fltrd fltrd
fltrd fltrd(µg/L) (µg/L) (µg/L) (µg/L) (µg/L) (µg/L)
(µg/L) (µg/L) (62757) (62899) (62962) (62030) (62019)2 (62895)
(62900) (61759)
01470857 20060306 1130 — — — — — < 0.021 < 0.025 —
01470857 20060306 1131 < 0.005 < 0.005 < 0.005 < 0.005 < 0.010 — — < 0.005
01470857 20060508 1215 — — — — — < .021 < .025 —
01470857 20060508 1216 < .005 < .005 < .005 < .005 < .010 — — < .005
01470857 20060720 1130 — — — — — < .021 < .025 —
01470857 20060720 1131 < .005 < .005 < .005 < .005 < .010 — — < .005
01470857 20060918 1235 — — — — — < .021 < .025 —
01470857 20060918 1236 < .005 < .005 < .005 < .005 < .010 — — < .005
01470858 20060306 1300 — — — — — < .021 < .025 —
01470858 20060306 1301 < .005 < .005 < .005 < .005 < .010 — — < .005
01470858 20060508 1100 — — — — — < .021 < .025 —
01470858 20060508 1101 < .005 < .005 .008 < .005 < .010 — — < .005
01470858 20060720 1030 — — — — — < .021 < .025 —
01470858 20060720 1031 < .005 < .005 .009 < .005 < .010 — — < .005
01470858 20060918 1120 — — — — — < .021 < .025 —
01470858 20060918 1121 < .005 < .005 .012 < .005 < .010 — — < .005
01470858 20060918 1125 — — — — — < .021 < .025 —
01470858 20060918 1126 < .005 < .005 .011 < .005 < .010 — — < .005
015693155 20060313 1100 — — — — — < .021 < .025 —
015693155 20060313 1101 < .005 < .005 < .005 < .005 < .010 — — < .005
015693155 20060510 1145 — — — — — < .021 < .025 —
015693155 20060510 1146 < .005 < .005 < .005 < .005 < .010 — — < .005
015693155 20060706 1130 — — — — — < .021 < .025 —
015693155 20060706 1135 < .005 < .005 < .005 < .005 < .010 — — < .005
015693155 20060919 1020 — — — — — < .021 < .025 —
015693155 20060919 1021 < .005 < .005 < .005 < .005 < .010 — — < .005
015693158 20060313 1300 — — — — — < .021 E(3) .015 —
015693158 20060313 1301 < .005 < .005 .032 < .005 < .010 — — < .005
015693158 20060510 1030 — — — — — < .021 E(3) .051 —
015693158 20060510 1031 < .005 < .005 .009 < .005 < .010 — — < .005
015693158 20060510 1036 < .005 < .005 .023 < .005 < .010 — — < .005
015693158 20060706 1020 — — — — — < .021 E(3) .007 —
015693158 20060706 1025 < .005 < .005 .022 < .005 < .010 — — < .005
015693158 20060706 1030 — — — — — < .021 E(3) .006 —
015693158 20060706 1035 < .005 < .005 .022 < .005 < .010 — — < .005
015693158 20060919 1200 — — — — — < .021 E(3) .018 —
015693158 20060919 1201 < .005 < .005 .017 < .005 < .010 — — < .005
01571193 20060405 1600 — — — — — < .021 < .025 —
01571193 20060405 1601 < .005 < .005 < .005 < .005 < .010 — — < .005
01571193 20060516 1210 — — — — — < .021 < .025 —
01571193 20060516 1211 < .005 < .005 < .005 < .005 < .010 — — < .005
01571193 20060726 1500 — — — — — < .021 < .025 —
01571193 20060726 1501 < .005 < .005 < .005 < .005 < .010 — — < .0052Because of low long-term recoveries, this compound will be qualified.

Table 6 77
Lome- Oxytetra-Norfloxacin, Ofloxacin, Ormetoprim, p-Xanthine, Ranitidine, Roxithromycin,
floxacin, cycline,water, water, water, water, water, water,
water, water,Station number Date Time fltrd fltrd fltrd fltrd fltrd fltrd
fltrd fltrd(µg/L) (µg/L) (µg/L) (µg/L) (µg/L) (µg/L)
(µg/L) (µg/L) (62757) (62899) (62962) (62030) (62019)2 (62895)
(62900) (61759)
01571193 20060905 1105 — — — — — < 0.021 < 0.025 —
01571193 20060905 1106 < 0.005 < 0.005 < 0.005 < 0.005 < 0.010 — — < 0.005
01571195 20060405 1800 — — — — — < .021 < .025 —
01571195 20060405 1801 < .005 < .005 < .005 < .005 < .010 — — < .005
01571195 20060516 1050 — — — — — < .021 < .025 —
01571195 20060516 1051 < .005 < .005 < .005 < .005 < .010 — — < .005
01571195 20060726 1600 — — — — — < .021 < .025 —
01571195 20060726 1601 < .005 < .005 .005 < .005 < .010 — — < .005
01571195 20060905 0950 — — — — — < .021 < .025 —
01571195 20060905 0951 < .005 < .005 < .005 < .005 < .010 — — < .005
01573151 20060307 1415 — — — — — E(2) .019 < .025 —
01573151 20060307 1416 < .005 < .005 < .005 < .005 < .010 — — < .005
01573151 20060503 1040 — — — — — < .021 < .025 —
01573151 20060503 1041 < .005 < .005 < .005 < .005 < .010 — — < .005
01573151 20060719 1110 — — — — — < .021 < .025 —
01573151 20060719 1111 < .005 < .005 < .005 < .005 < .010 — — < .005
01573151 20060913 1100 — — — — — < .021 < .025 —
01573151 20060913 1101 < .005 < .005 < .005 < .005 < .010 — — < .005
01573153 20060307 1230 — — — — — .853 E(3) .019 —
01573153 20060307 1231 < .005 < .005 .171 < .005 < .010 — — < .005
01573153 20060307 1235 — — — — — .997 E(3) .025 —
01573153 20060307 1236 < .005 < .005 .204 < .005 < .010 — — < .005
01573153 20060503 0940 — — — — — < .021 E(3) .040 —
01573153 20060503 0941 < .005 < .005 .267 < .005 < .010 — — < .005
01573153 20060719 1010 — — — — — < .021 < .025 —
01573153 20060719 1011 < .005 < .005 .062 < .005 < .010 — — < .005
01573153 20060913 0950 — — — — — < .021 < .025 —
01573153 20060913 0951 < .005 < .005 .329 < .005 < .010 — — < .005
01574310 20060301 1600 — — — — — < .021 < .025 —
01574310 20060301 1601 < .005 < .005 < .005 < .005 < .010 — — < .005
01574310 20060501 0940 — — — — — < .021 < .025 —
01574310 20060501 0941 < .005 < .005 < .005 < .005 < .010 — — < .005
01574310 20060705 1420 — — — — — < .021 < .025 —
01574310 20060705 1425 < .005 < .005 < .005 < .005 < .010 — — < .005
01574310 20060906 1200 — — — — — < .021 < .025 —
01574310 20060906 1201 < .005 < .005 < .005 < .005 < .010 — — < .005
01574314 20060301 1500 — — — — — < .021 < .025 —
01574314 20060301 1501 < .005 < .005 < .005 < .005 < .010 — — < .005
01574314 20060501 1035 — — — — — < .021 < .025 —
01574314 20060501 1036 < .005 < .005 < .005 < .005 < .010 — — < .005
01574314 20060501 1037 — — — — — < .021 < .025 —
01574314 20060501 1038 < .005 < .005 < .005 < .005 < .010 — — < .005
01574314 20060705 1310 — — — — — < .021 < .025 —
01574314 20060705 1315 < .005 < .005 < .005 < .005 < .010 — — < .005
01574314 20060906 1300 — — — — — < .021 < .025 —
01574314 20060906 1301 < .005 < .005 < .005 < .005 < .010 — — < .0052Because of low long-term recoveries, this compound will be qualified.

78 Concentrations of Selected Pharmaceuticals and Antibiotics in South-Central Pennsylvania, March Through September 2006
Lome- Oxytetra-Norfloxacin, Ofloxacin, Ormetoprim, p-Xanthine, Ranitidine, Roxithromycin,
floxacin, cycline,water, water, water, water, water, water,
water, water,Station number Date Time fltrd fltrd fltrd fltrd fltrd fltrd
fltrd fltrd(µg/L) (µg/L) (µg/L) (µg/L) (µg/L) (µg/L)
(µg/L) (µg/L) (62757) (62899) (62962) (62030) (62019)2 (62895)
(62900) (61759)
01576420 20060306 1600 — — — — — < 0.021 < 0.025 —
01576420 20060306 1601 < 0.005 < 0.005 0.006 < 0.005 < 0.010 — — < 0.005
01576420 20060522 1150 — — — — — < .021 < .025 —
01576420 20060522 1151 < .005 < .005 < .005 < .005 < .010 — — < .005
01576420 20060717 1150 — — — — — < .021 < .025 —
01576420 20060717 1151 < .005 < .005 < .005 < .005 < .010 — — < .005
01576420 20060911 1100 — — — — — < .021 < .025 —
01576420 20060911 1101 < .005 < .005 < .005 < .005 .038 — — < .005
01576422 20060306 1730 — — — — — < .021 < .025 —
01576422 20060306 1731 < .005 < .005 .056 < .005 < .010 — — < .005
01576422 20060522 1025 — — — — — < .021 < .025 —
01576422 20060522 1026 < .005 < .005 .023 < .005 < .010 — — < .005
01576422 20060717 1030 — — — — — < .021 < .025 —
01576422 20060717 1031 < .005 < .005 .036 < .005 < .010 — — < .005
01576422 20060911 1205 — — — — — < .021 < .025 —
01576422 20060911 1206 < .005 < .005 .069 < .005 .015 — — < .005
01569346 20060405 1300 — — — — — < .021 < .025 —
01569346 20060405 1301 < .005 < .005 < .005 < .005 < .010 — — < .005
01569346 20060523 1115 — — — — — < .021 < .025 —
01569346 20060523 1116 < .005 < .005 < .005 < .005 < .010 — — < .005
01569346 20060726 1045 — — — — — < .021 < .025 —
01569346 20060726 1046 < .005 < .005 < .005 < .005 < .010 — — < .005
01569346 20060927 0955 — — — — — < .021 < .025 —
01569346 20060927 0956 < .005 < .005 < .005 < .005 < .010 — — < .005
01569349 20060405 1130 — — — — — < .021 < .025 —
01569349 20060405 1131 < .005 < .005 < .005 < .005 < .010 — — < .005
01569349 20060523 1000 — — — — — < .021 < .025 —
01569349 20060523 1001 < .005 < .005 < .005 < .005 < .010 — — < .005
01569349 20060726 1245 — — — — — < .021 < .025 —
01569349 20060726 1246 < .005 < .005 < .005 < .005 < .010 — — < .005
01569349 20060927 1100 — — — — — < .021 < .025 —
01569349 20060927 1101 < .005 < .005 < .005 < .005 < .010 — — < .005
01572146 20060320 1200 — — — — — < .021 < .025 —
01572146 20060320 1201 < .005 < .005 < .005 < .005 < .010 — — < .005
01572146 20060518 1145 — — — — — < .021 < .025 —
01572146 20060518 1146 < .005 < .005 < .005 < .005 < .010 — — < .005
01572146 20060731 1015 — — — — — < .021 < .025 —
01572146 20060731 1016 < .005 < .005 < .005 < .005 < .010 — — < .005
01572146 20060926 0945 — — — — — < .021 < .025 —
01572146 20060926 0946 < .005 < .005 < .005 < .005 < .010 — — < .005
01572148 20060320 1445 — — — — — < .021 < .025 —
01572148 20060320 1446 < .005 < .005 < .005 < .005 < .010 — — < .005
01572148 20060518 1030 — — — — — < .021 < .025 —
01572148 20060518 1031 < .005 < .005 < .005 < .005 < .010 — — < .005
01572148 20060731 1110 — — — — — < .021 < .025 —
01572148 20060731 1111 < .005 < .005 < .005 < .005 < .010 — — < .0052Because of low long-term recoveries, this compound will be qualified.

Table 6 79
Lome- Oxytetra-Norfloxacin, Ofloxacin, Ormetoprim, p-Xanthine, Ranitidine, Roxithromycin,
floxacin, cycline,water, water, water, water, water, water,
water, water,Station number Date Time fltrd fltrd fltrd fltrd fltrd fltrd
fltrd fltrd(µg/L) (µg/L) (µg/L) (µg/L) (µg/L) (µg/L)
(µg/L) (µg/L) (62757) (62899) (62962) (62030) (62019)2 (62895)
(62900) (61759)
01572148 20060926 1055 — — — — — < 0.021 < 0.025 —
01572148 20060926 1056 < 0.005 < 0.005 < 0.005 < 0.005 < 0.010 — — < 0.005
401704076293101 20060315 1145 — — — — — < .021 < .025 —
401704076293101 20060315 1146 < .005 < .005 < .005 < .005 < .010 — — < .005
401704076293101 20060503 1345 — — — — — < .021 < .025 —
401704076293101 20060503 1346 < .005 < .005 < .005 < .005 < .010 — — < .005
401704076293101 20060719 1430 — — — — — < .021 < .025 —
401704076293101 20060719 1431 < .005 < .005 < .005 < .005 < .010 — — < .005
401704076293101 20060913 1400 — — — — — < .021 < .025 —
401704076293101 20060913 1401 < .005 < .005 < .005 < .005 < .010 — — < .005
01573095 20060315 1030 — — — — — < .021 < .025 —
01573095 20060315 1031 < .005 < .005 < .005 < .005 < .010 — — < .005
01573095 20060503 1245 — — — — — < .021 < .025 —
01573095 20060503 1246 < .005 < .005 < .005 < .005 < .010 — — < .005
01573095 20060719 1330 — — — — — < .021 < .025 —
01573095 20060719 1331 < .005 < .005 < .005 < .005 < .010 — — < .005
01573095 20060913 1305 — — — — — < .021 < .025 —
01573095 20060913 1306 < .005 < .005 < .005 < .005 < .010 — — < .005
01574050 20060316 1030 — — — — — < .021 < .025 —
01574050 20060316 1031 < .005 < .005 < .005 < .005 < .010 — — < .005
01574050 20060501 1350 — — — — — < .021 < .025 —
01574050 20060501 1351 < .005 < .005 < .005 < .005 < .010 — — < .005
01574050 20060705 1045 — — — — — < .021 < .025 —
01574050 20060705 1050 < .005 < .005 < .005 < .005 < .010 — — < .005
01574050 20060906 1030 — — — — — < .021 < .025 —
01574050 20060906 1031 < .005 < .005 < .005 < .005 < .010 — — < .005
01574055 20060316 1130 — — — — — < .021 < .025 —
01574055 20060316 1131 < .005 < .005 < .005 < .005 .019 — — < .005
01574055 20060501 1245 — — — — — < .021 < .025 —
01574055 20060501 1246 < .005 < .005 < .005 < .005 < .010 — — < .005
01574055 20060705 1145 — — — — — < .021 < .025 —
01574055 20060705 1150 < .005 < .005 < .005 < .005 < .010 — — < .005
01574055 20060906 0925 — — — — — < .021 < .025 —
01574055 20060906 0926 < .005 < .005 < .005 < .005 < .010 — — < .005
01575771 20060322 1000 — — — — — < .021 < .025 —
01575771 20060322 1001 < .005 < .005 < .005 < .005 < .010 — — < .005
01575771 20060515 1055 — — — — — < .021 < .025 —
01575771 20060515 1056 < .005 < .005 < .005 < .005 < .010 — — < .005
01575771 20060717 1410 — — — — — < .021 < .025 —
01575771 20060717 1411 < .005 < .005 < .005 < .005 < .010 — — < .005
01575771 20060911 1450 — — — — — < .021 < .025 —
01575771 20060911 1451 < .005 < .005 < .005 < .005 < .010 — — < .005
015757724 20060322 1100 — — — — — < .021 < .025 —
015757724 20060322 1101 < .005 < .005 < .005 < .005 < .010 — — < .005
015757724 20060515 0915 — — — — — < .021 < .025 —
015757724 20060515 0916 < .005 < .005 < .005 < .005 < .010 — — < .0052Because of low long-term recoveries, this compound will be qualified.

80 Concentrations of Selected Pharmaceuticals and Antibiotics in South-Central Pennsylvania, March Through September 2006
Lome- Oxytetra-Norfloxacin, Ofloxacin, Ormetoprim, p-Xanthine, Ranitidine, Roxithromycin,
floxacin, cycline,water, water, water, water, water, water,
water, water,Station number Date Time fltrd fltrd fltrd fltrd fltrd fltrd
fltrd fltrd(µg/L) (µg/L) (µg/L) (µg/L) (µg/L) (µg/L)
(µg/L) (µg/L) (62757) (62899) (62962) (62030) (62019)2 (62895)
(62900) (61759)
015757724 20060717 1310 — — — — — < 0.021 < 0.025 —
015757724 20060717 1311 < 0.005 < 0.005 < 0.005 < 0.005 < 0.010 — — < 0.005
015757724 20060911 1550 — — — — — < .021 < .025 —
015757724 20060911 1551 < .005 < .005 < .005 < .005 < .010 — — < .005
01578349 20060314 1145 — — — — — < .021 < .025 —
01578349 20060314 1146 < .005 < .005 < .005 < .005 < .010 — — < .005
01578349 20060511 1110 — — — — — < .021 < .025 —
01578349 20060511 1111 < .005 < .005 < .005 < .005 < .010 — — < .005
01578349 20060718 1250 — — — — — < .021 < .025 —
01578349 20060718 1251 < .005 < .005 < .005 < .005 < .010 — — < .005
01578349 20060912 1215 — — — — — < .021 < .025 —
01578349 20060912 1216 < .005 < .005 < .005 < .005 < .010 — — < .005
015783492 20060314 1400 — — — — — < .021 < .025 —
015783492 20060314 1401 < .005 < .005 < .005 < .005 < .010 — — < .005
015783492 20060511 1010 — — — — — < .021 < .025 —
015783492 20060511 1011 < .005 < .005 < .005 < .005 < .010 — — < .005
015783492 20060718 1115 — — — — — < .021 < .025 —
015783492 20060718 1116 < .005 < .005 < .005 < .005 < .010 — — < .005
015783492 20060912 1115 — — — — — < .021 < .025 —
015783492 20060912 1116 < .005 < .005 < .005 < .005 < .010 — — < .005
394643077043101 20060309 1230 — — — — — < .021 < .025 —
394643077043101 20060309 1231 < .005 < .005 < .005 < .005 < .010 — — < .005
394643077043101 20060504 1110 — — — — — < .021 < .025 —
394643077043101 20060504 1111 < .005 < .005 < .005 < .005 < .010 — — < .005
394643077043101 20060504 1112 — — — — — < .021 < .025 —
394643077043101 20060504 1113 < .005 < .005 < .005 < .005 < .010 — — < .005
394643077043101 20060710 1125 — — — — — < .021 < .025 —
394643077043101 20060710 1130 < .005 < .005 < .005 < .005 < .010 — — < .005
394643077043101 20060925 1055 — — — — — < .021 < .025 —
394643077043101 20060925 1056 < .005 < .005 < .005 < .005 < .010 — — < .005
400610076282501 20060406 1030 — — — — — < .021 < .025 —
400610076282501 20060406 1031 < .005 < .005 < .005 < .005 < .010 — — < .005
400610076282501 20060515 1315 — — — — — < .021 < .025 —
400610076282501 20060515 1316 < .005 < .005 < .005 < .005 < .010 — — < .005
400610076282501 20060515 1317 — — — — — < .021 < .025 —
400610076282501 20060515 1318 < .005 < .005 < .005 < .005 < .010 — — < .005
400610076282501 20060713 1100 — — — — — < .021 < .025 —
400610076282501 20060713 1101 < .005 < .005 < .005 < .005 < .010 — — < .005
400610076282501 20060907 1100 — — — — — < .021 < .025 —
400610076282501 20060907 1101 < .005 < .005 < .005 < .005 < .010 — — < .005
400610076282501 20060907 1105 — — — — — < .021 < .025 —
400610076282501 20060907 1106 < .005 < .005 < .005 < .005 < .010 — — < .005
401712076235101 20060403 1415 — — — — — < .021 < .025 —
401712076235101 20060403 1416 < .005 < .005 < .005 < .005 < .010 — — < .005
401712076235101 20060517 1410 — — — — — < .021 < .025 —
401712076235101 20060517 1411 < .005 < .005 < .005 < .005 < .010 — — < .0052Because of low long-term recoveries, this compound will be qualified.

Table 6 81
Lome- Oxytetra-Norfloxacin, Ofloxacin, Ormetoprim, p-Xanthine, Ranitidine, Roxithromycin,
floxacin, cycline,water, water, water, water, water, water,
water, water,Station number Date Time fltrd fltrd fltrd fltrd fltrd fltrd
fltrd fltrd(µg/L) (µg/L) (µg/L) (µg/L) (µg/L) (µg/L)
(µg/L) (µg/L) (62757) (62899) (62962) (62030) (62019)2 (62895)
(62900) (61759)
401712076235101 20060712 1355 — — — — — < 0.021 < 0.025 —
401712076235101 20060712 1400 < 0.005 < 0.005 < 0.005 < 0.005 < 0.010 — — < 0.005
401712076235101 20060920 1400 — — — — — < .021 < .025 —
401712076235101 20060920 1401 < .005 < .005 < .005 < .005 < .010 — — < .005
401920078130101 20060329 1300 — — — — — < .021 < .025 —
401920078130101 20060329 1301 < .005 < .005 < .005 < .005 < .010 — — < .005
401920078130101 20060509 1400 — — — — — < .021 < .025 —
401920078130101 20060509 1401 < .005 < .005 < .005 < .005 < .010 — — < .005
401920078130101 20060725 1250 — — — — — < .021 < .025 —
401920078130101 20060725 1251 < .005 < .005 < .005 < .005 < .010 — — < .005
401920078130101 20060914 1230 — — — — — < .021 < .025 —
401920078130101 20060914 1231 < .005 < .005 < .005 < .005 < .010 — — < .005
402052076160101 20060403 1130 — — — — — < .021 < .025 —
402052076160101 20060403 1131 < .005 < .005 < .005 < .005 < .010 — — < .005
402052076160101 20060517 1135 — — — — — < .021 < .025 —
402052076160101 20060517 1136 < .005 < .005 < .005 < .005 < .010 — — < .005
402052076160101 20060712 1140 — — — — — < .021 < .025 —
402052076160101 20060712 1145 < .005 < .005 < .005 < .005 < .010 — — < .005
402052076160101 20060920 1050 — — — — — < .021 < .025 —
402052076160101 20060920 1051 < .005 < .005 < .005 < .005 < .010 — — < .005
405931076555601 20060323 1140 — — — — — < .021 < .025 —
405931076555601 20060323 1141 < .005 < .005 < .005 < .005 < .010 — — < .005
405931076555601 20060502 1140 — — — — — < .021 < .025 —
405931076555601 20060502 1141 < .005 < .005 < .005 < .005 < .010 — — < .005
405931076555601 20060711 1150 — — — — — < .021 < .025 —
405931076555601 20060711 1155 < .005 < .005 < .005 < .005 < .010 — — < .005
405931076555601 20060711 1200 — — — — — < .021 < .025 —
405931076555601 20060711 1205 < .005 < .005 < .005 < .005 < .010 — — < .005
405931076555601 20060921 1215 — — — — — < .021 < .025 —
405931076555601 20060921 1216 < .005 < .005 < .005 < .005 < .010 — — < .0052Because of low long-term recoveries, this compound will be qualified.

82 Concentrations of Selected Pharmaceuticals and Antibiotics in South-Central Pennsylvania, March Through September 2006
Station number Date Time
Salbutamol, water,
fltrd(µg/L)
(62020)
Sarafloxacin, water,
fltrd (µg/L)
(62771)
Sulfachloro-pyridazine,
water, fltrd
(µg/L)(62774)
Sulfadiazine, water,
fltrd (µg/L)
(62963)
Sulfadimeth-ozine, water,
fltrd (µg/L)
(62776)
Sulfameth-azine, water,
fltrd (µg/L)
(61762)
Sulfameth-oxazole, water,
fltrd(µg/L)NWQL(62021)
Sulfameth-oxazole, water,
fltrd(µg/L)OGRL
(62775)
01470857 20060306 1130 < 0.014 — — — — — < 0.024 —
01470857 20060306 1131 — < 0.005 < 0.005 < 0.050 < 0.005 < 0.005 — < 0.005
01470857 20060508 1215 < .014 — — — — — < .024 —
01470857 20060508 1216 — < .005 < .005 < .050 < .005 < .005 — < .005
01470857 20060720 1130 < .014 — — — — — < .024 —
01470857 20060720 1131 — < .005 < .005 < .050 < .005 < .005 — < .005
01470857 20060918 1235 < .014 — — — — — < .024 —
01470857 20060918 1236 — < .005 < .005 < .050 < .005 < .005 — < .005
01470858 20060306 1300 < .014 — — — — — E(4) .042 —
01470858 20060306 1301 — < .005 < .005 < .050 < .005 < .005 — —
01470858 20060508 1100 < .014 — — — — — .212 —
01470858 20060508 1101 — < .005 < .005 < .050 < .005 < .005 — .123
01470858 20060720 1030 < .014 — — — — — E(2) .020 —
01470858 20060720 1031 — < .005 < .005 < .050 < .005 < .005 — .082
01470858 20060918 1120 < .014 — — — — — < .024 —
01470858 20060918 1121 — < .005 < .005 < .050 < .005 < .005 — .148
01470858 20060918 1125 < .014 — — — — — E(4) .072 —
01470858 20060918 1126 — < .005 < .005 < .050 < .005 < .005 — .159
015693155 20060313 1100 < .014 — — — — — < .024 —
015693155 20060313 1101 — < .005 < .005 < .050 < .005 < .005 — < .005
015693155 20060510 1145 < .014 — — — — — < .024 —
015693155 20060510 1146 — < .005 < .005 < .050 < .005 < .005 — < .005
015693155 20060706 1130 < .014 — — — — — < .024 —
015693155 20060706 1135 — < .005 < .005 < .050 < .005 < .005 — < .005
015693155 20060919 1020 < .014 — — — — — < .024 —
015693155 20060919 1021 — < .005 < .005 < .050 < .005 < .005 — < .005
015693158 20060313 1300 < .014 — — — — — < .027 —
015693158 20060313 1301 — < .005 < .005 < .050 < .005 < .005 — .150
015693158
015693158
20060510
20060510
1030
1031
E(1) .005
—
—
< .005
—
< .005
—
< .050
—
< .005
—
< .005
.552
—
—
.434
015693158 20060510 1036 — < .005 < .005 < .050 < .005 < .005 — .426
015693158
015693158
20060706
20060706
1020
1025
E(1) .004
—
—
< .005
—
< .005
—
< .050
—
< .005
—
< .005
.082
—
—
.110
015693158 20060706 1030 E(1) .004 — — — — — .078 —
015693158 20060706 1035 — < .005 < .005 < .050 < .005 < .005 — .268
015693158 20060919 1200 < .014 — — — — — .243 —
015693158 20060919 1201 — < .005 < .005 < .050 < .005 < .005 — .766
01571193 20060405 1600 < .014 — — — — — < .024 —
01571193 20060405 1601 — < .005 < .005 < .050 < .005 < .005 — < .005
01571193 20060516 1210 < .014 — — — — — < .024 —
01571193 20060516 1211 — < .005 < .005 < .050 < .005 < .005 — < .005
01571193 20060726 1500 < .014 — — — — — < .024 —
01571193 20060726 1501 — < .005 < .005 < .050 < .005 < .005 — < .005

Table 6 83
Station number Date Time
Salbutamol, water,
fltrd(µg/L)
(62020)
Sarafloxacin, water,
fltrd (µg/L)
(62771)
Sulfachloro-pyridazine,
water, fltrd
(µg/L)(62774)
Sulfadiazine, water,
fltrd (µg/L)
(62963)
Sulfadimeth-ozine, water,
fltrd (µg/L)
(62776)
Sulfameth-azine, water,
fltrd (µg/L)
(61762)
Sulfameth-oxazole, water,
fltrd(µg/L)NWQL(62021)
Sulfameth-oxazole, water,
fltrd(µg/L)OGRL
(62775)
01571193 20060905 1105 < 0.014 — — — — — < 0.024 —
01571193 20060905 1106 — < 0.005 < 0.005 < 0.050 < 0.005 < 0.005 — < 0.005
01571195 20060405 1800 < .014 — — — — — < .024 —
01571195 20060405 1801 — < .005 < .005 < .050 < .005 < .005 — < .005
01571195 20060516 1050 < .014 — — — — — < .024 —
01571195 20060516 1051 — < .005 < .005 < .050 < .005 < .005 — < .005
01571195 20060726 1600 < .014 — — — — — < .024 —
01571195 20060726 1601 — < .005 < .005 < .050 < .005 < .005 — .023
01571195 20060905 0950 < .014 — — — — — E(1) .006 —
01571195 20060905 0951 — < .005 < .005 < .050 < .005 < .005 — < .005
01573151 20060307 1415 < .014 — — — — — < .024 —
01573151 20060307 1416 — < .005 < .005 < .050 < .005 < .005 — < .005
01573151 20060503 1040 < .014 — — — — — < .024 —
01573151 20060503 1041 — < .005 < .005 < .050 < .005 < .005 — < .005
01573151 20060719 1110 < .014 — — — — — < .024 —
01573151 20060719 1111 — < .005 < .005 < .050 < .005 < .005 — < .005
01573151 20060913 1100 < .014 — — — — — E(2) .022 —
01573151 20060913 1101 — < .005 < .005 < .050 < .005 < .005 — .013
01573153
01573153
20060307
20060307
1230
1231
E(2) .009
—
—
< .005
—
< .005
—
.121
—
< .005
—
< .005
< .186
—
—
.355
01573153 20060307 1235 E(2) .010 — — — — — < .185 —
01573153 20060307 1236 — < .005 < .005 .164 < .005 < .005 — .508
01573153 20060503 0940 E(2) .012 — — — — — < .024 —
01573153 20060503 0941 — < .005 < .005 < .050 < .005 < .005 — .042
01573153 20060719 1010 < .014 — — — — — E(2) .020 —
01573153 20060719 1011 — < .005 < .005 < .050 < .005 < .005 — .149
01573153 20060913 0950 < .014 — — — — — E(4) .218 —
01573153 20060913 0951 — < .005 < .005 < .050 < .005 < .005 — 1.340
01574310 20060301 1600 < .014 — — — — — < .024 —
01574310 20060301 1601 — < .005 < .005 < .050 < .005 < .005 — < .005
01574310 20060501 0940 < .014 — — — — — < .024 —
01574310 20060501 0941 — < .005 < .005 < .050 < .005 < .005 — < .005
01574310 20060705 1420 < .014 — — — — — < .024 —
01574310 20060705 1425 — < .005 < .005 < .050 < .005 < .005 — < .005
01574310 20060906 1200 < .014 — — — — — < .024 —
01574310 20060906 1201 — < .005 < .005 < .050 < .005 < .005 — < .005
01574314 20060301 1500 < .014 — — — — — < .024 —
01574314 20060301 1501 — < .005 < .005 < .050 < .005 < .005 — < .005
01574314 20060501 1035 < .014 — — — — — < .024 —
01574314 20060501 1036 — < .005 < .005 < .050 < .005 < .005 — < .005
01574314 20060501 1037 < .014 — — — — — < .024 —
01574314 20060501 1038 — < .005 < .005 < .050 < .005 < .005 — < .055
01574314 20060705 1310 < .014 — — — — — < .024 —
01574314 20060705 1315 — < .005 < .005 < .050 < .005 < .005 — < .005
01574314 20060906 1300 < .014 — — — — — < .024 —
01574314 20060906 1301 — < .005 < .005 < .050 < .005 < .005 — < .005

84 Concentrations of Selected Pharmaceuticals and Antibiotics in South-Central Pennsylvania, March Through September 2006
Station number Date Time
Salbutamol, water,
fltrd(µg/L)
(62020)
Sarafloxacin, water,
fltrd (µg/L)
(62771)
Sulfachloro-pyridazine,
water, fltrd
(µg/L)(62774)
Sulfadiazine, water,
fltrd (µg/L)
(62963)
Sulfadimeth-ozine, water,
fltrd (µg/L)
(62776)
Sulfameth-azine, water,
fltrd (µg/L)
(61762)
Sulfameth-oxazole, water,
fltrd(µg/L)NWQL(62021)
Sulfameth-oxazole, water,
fltrd(µg/L)OGRL
(62775)
01576420 20060306 1600 < 0.014 — — — — — < 0.024 —
01576420 20060306 1601 — < 0.005 < 0.005 < 0.050 < 0.005 < 0.005 — < 0.067
01576420 20060522 1150 < .014 — — — — — < .024 —
01576420 20060522 1151 — < .005 < .005 < .050 < .005 < .005 — < .005
01576420 20060717 1150 < .014 — — — — — < .024 —
01576420 20060717 1151 — < .005 < .005 < .050 < .005 < .005 — < .005
01576420 20060911 1100 < .014 — — — — — < .024 —
01576420 20060911 1101 — < .005 < .005 < .050 < .005 < .005 — < .005
01576422 20060306 1730 < .014 — — — — — E(4) .091 —
01576422 20060306 1731 — < .005 < .005 < .050 < .005 < .005 — .142
01576422 20060522 1025 < .014 — — — — — .262 —
01576422 20060522 1026 — < .005 < .005 < .050 < .005 < .005 — .136
01576422 20060717 1030 < .014 — — — — — E(4) .030 —
01576422 20060717 1031 — < .005 < .005 < .050 < .005 < .005 — .117
01576422 20060911 1205 < .014 — — — — — E(4) .064 —
01576422 20060911 1206 — < .005 < .005 < .050 < .005 < .005 — .108
01569346 20060405 1300 < .014 — — — — — < .024 —
01569346 20060405 1301 — < .005 < .005 < .050 < .005 < .005 — < .005
01569346 20060523 1115 < .014 — — — — — < .024 —
01569346 20060523 1116 — < .005 < .005 < .050 < .005 < .005 — < .005
01569346 20060726 1045 < .014 — — — — — < .024 —
01569346 20060726 1046 — < .005 < .005 < .050 < .005 < .005 — < .005
01569346 20060927 0955 < .014 — — — — — < .024 —
01569346 20060927 0956 — < .005 < .005 < .050 < .005 < .005 — < .005
01569349 20060405 1130 < .014 — — — — — < .024 —
01569349 20060405 1131 — < .005 < .005 < .050 < .005 < .005 — < .005
01569349 20060523 1000 < .014 — — — — — < .024 —
01569349 20060523 1001 — < .005 < .005 < .050 < .005 < .005 — < .005
01569349 20060726 1245 < .014 — — — — — < .024 —
01569349 20060726 1246 — < .005 < .005 < .050 < .005 < .005 — < .005
01569349 20060927 1100 < .014 — — — — — < .024 —
01569349 20060927 1101 — < .005 < .005 < .050 < .005 < .005 — < .005
01572146 20060320 1200 < .014 — — — — — < .024 —
01572146 20060320 1201 — < .005 < .005 < .050 < .005 < .005 — < .005
01572146 20060518 1145 < .014 — — — — — < .024 —
01572146 20060518 1146 — < .005 < .005 < .050 < .005 < .005 — < .005
01572146 20060731 1015 < .014 — — — — — < .024 —
01572146 20060731 1016 — < .005 < .005 < .050 < .005 < .005 — < .005
01572146 20060926 0945 < .014 — — — — — < .024 —
01572146 20060926 0946 — < .005 < .005 < .050 < .005 < .005 — < .005
01572148 20060320 1445 < .014 — — — — — < .024 —
01572148 20060320 1446 — < .005 < .005 < .050 < .005 < .005 — < .005
01572148 20060518 1030 < .014 — — — — — < .024 —
01572148 20060518 1031 — < .005 < .005 < .050 < .005 < .005 — < .005
01572148 20060731 1110 < .014 — — — — — < .024 —
01572148 20060731 1111 — < .005 < .005 < .050 < .005 < .005 — < .005

Table 6 85
Station number Date Time
Salbutamol, water,
fltrd(µg/L)
(62020)
Sarafloxacin, water,
fltrd (µg/L)
(62771)
Sulfachloro-pyridazine,
water, fltrd
(µg/L)(62774)
Sulfadiazine, water,
fltrd (µg/L)
(62963)
Sulfadimeth-ozine, water,
fltrd (µg/L)
(62776)
Sulfameth-azine, water,
fltrd (µg/L)
(61762)
Sulfameth-oxazole, water,
fltrd(µg/L)NWQL(62021)
Sulfameth-oxazole, water,
fltrd(µg/L)OGRL
(62775)
01572148 20060926 1055 < 0.014 — — — — — < 0.024 —
01572148 20060926 1056 — < 0.005 < 0.005 < 0.050 < 0.005 < 0.005 — < 0.005
401704076293101 20060315 1145 < .014 — — — — — < .024 —
401704076293101 20060315 1146 — < .005 < .005 < .050 < .005 < .005 — < .005
401704076293101 20060503 1345 < .014 — — — — — < .024 —
401704076293101 20060503 1346 — < .005 < .005 < .050 < .005 < .005 — < .005
401704076293101 20060719 1430 < .014 — — — — — < .024 —
401704076293101 20060719 1431 — < .005 < .005 < .050 < .005 < .005 — < .005
401704076293101 20060913 1400 < .014 — — — — — < .024 —
401704076293101 20060913 1401 — < .005 < .005 < .050 < .005 < .005 — < .005
01573095 20060315 1030 < .014 — — — — — < .024 —
01573095 20060315 1031 — < .005 < .005 < .050 < .005 < .005 — < .005
01573095 20060503 1245 < .014 — — — — — < .024 —
01573095 20060503 1246 — < .005 < .005 < .050 < .005 < .005 — < .005
01573095 20060719 1330 < .014 — — — — — < .024 —
01573095 20060719 1331 — < .005 < .005 < .050 < .005 < .005 — < .005
01573095 20060913 1305 < .014 — — — — — E .008 —
01573095 20060913 1306 — < .005 < .005 < .050 < .005 < .005 — < .005
01574050 20060316 1030 < .014 — — — — — < .024 —
01574050 20060316 1031 — < .005 < .005 < .050 < .005 < .005 — < .005
01574050 20060501 1350 < .014 — — — — — < .024 —
01574050 20060501 1351 — < .005 < .005 < .050 < .005 < .005 — < .005
01574050 20060705 1045 < .014 — — — — — < .024 —
01574050 20060705 1050 — < .005 < .005 < .050 < .005 < .005 — .019
01574050 20060906 1030 < .014 — — — — — E(4) .039 —
01574050 20060906 1031 — < .005 < .005 < .050 < .005 < .005 — .157
01574055 20060316 1130 < .014 — — — — — < .024 —
01574055 20060316 1131 — < .005 < .005 < .050 < .005 < .005 — < .005
01574055 20060501 1245 < .014 — — — — — < .024 —
01574055 20060501 1246 — < .005 < .005 < .050 < .005 < .005 — < .005
01574055 20060705 1145 < .014 — — — — — < .024 —
01574055 20060705 1150 — < .005 < .005 < .050 .005 < .005 — < .005
01574055 20060906 9250 < .014 — — — — — E(1) .006 —
01574055 20060906 0926 — < .005 < .005 < .050 < .005 < .005 — .019
01575771 20060322 1000 < .014 — — — — — < .024 —
01575771 20060322 1001 — < .005 < .005 < .050 < .005 < .005 — < .005
01575771 20060515 1055 < .014 — — — — — < .024 —
01575771 20060515 1056 — < .005 < .005 < .050 < .005 < .005 — < .005
01575771 20060717 1410 < .014 — — — — — < .024 —
01575771 20060717 1411 — < .005 < .005 < .050 < .005 < .005 — < .005
01575771 20060911 1450 < .014 — — — — — < .024 —
01575771 20060911 1451 — < .005 < .005 < .050 < .005 < .005 — < .005
015757724 20060322 1100 < .014 — — — — — < .024 —
015757724 20060322 1101 — < .005 < .005 < .050 < .005 < .005 — < .005
015757724 20060515 0915 < .014 — — — — — < .024 —
015757724 20060515 0916 — < .005 < .005 < .050 < .005 < .005 — < .005

86 Concentrations of Selected Pharmaceuticals and Antibiotics in South-Central Pennsylvania, March Through September 2006
Station number Date Time
Salbutamol, water,
fltrd(µg/L)
(62020)
Sarafloxacin, water,
fltrd (µg/L)
(62771)
Sulfachloro-pyridazine,
water, fltrd
(µg/L)(62774)
Sulfadiazine, water,
fltrd (µg/L)
(62963)
Sulfadimeth-ozine, water,
fltrd (µg/L)
(62776)
Sulfameth-azine, water,
fltrd (µg/L)
(61762)
Sulfameth-oxazole, water,
fltrd(µg/L)NWQL(62021)
Sulfameth-oxazole, water,
fltrd(µg/L)OGRL
(62775)
015757724 20060717 1310 < 0.014 — — — — — < 0.024 —
015757724 20060717 1311 — < 0.005 < 0.005 < 0.050 < 0.005 < 0.005 — < 0.005
015757724 20060911 1550 < .014 — — — — — < .024 —
015757724 20060911 1551 — < .005 < .005 < .050 .026 < .005 — < .005
01578349 20060314 1145 < .014 — — — — — < .024 —
01578349 20060314 1146 — < .005 < .005 < .050 < .005 < .005 — < .005
01578349 20060511 1110 < .014 — — — — — < .024 —
01578349 20060511 1111 — < .005 < .005 < .050 < .005 < .005 — < .005
01578349 20060718 1250 < .014 — — — — — < .024 —
01578349 20060718 1251 — < .005 < .005 < .050 < .005 < .005 — < .005
01578349 20060912 1215 < .014 — — — — — < .024 —
01578349 20060912 1216 — < .005 < .005 < .050 < .005 < .005 — < .005
015783492 20060314 1400 < .014 — — — — — < .024 —
015783492 20060314 1401 — < .005 < .005 < .050 < .005 < .005 — < .005
015783492 20060511 1010 < .014 — — — — — < .024 —
015783492 20060511 1011 — < .005 < .005 < .050 < .005 < .005 < .005
015783492 20060718 1115 < .014 — — — — — < .024 —
015783492 20060718 1116 — < .005 < .005 < .050 < .005 < .005 — < .005
015783492 20060912 1115 < .014 — — — — — < .024 —
015783492 20060912 1116 — < .005 < .005 < .050 < .005 < .005 — < .005
394643077043101 20060309 1230 < .014 — — — — — < .024 —
394643077043101
394643077043101
394643077043101
20060309
20060504
20060504
1231
1110
1111
—
< .014
—
< .005
—
< .005
< .005
—
< .005
< .050
—
< .050
< .005
—
< .005
< .005
—
< .005
—
< .024
—
< .005
—
< .005
394643077043101 20060504 1112 < .014 — — — — — < .024 —
394643077043101 20060504 1113 — < .005 < .005 < .050 < .005 < .005 — < .005
394643077043101 20060710 1125 < .014 — — — — — < .024 —
394643077043101 20060710 1130 — < .005 < .005 < .050 < .005 < .005 — < .005
394643077043101 20060925 1055 < .014 — — — — — < .024 —
394643077043101 20060925 1056 — < .005 < .005 < .050 < .005 < .005 — < .005
400610076282501 20060406 1030 < .014 — — — — — < .024 —
400610076282501
400610076282501
400610076282501
20060406
20060515
20060515
1031
1315
1316
—
< .014
—
< .005
—
< .005
< .005
—
< .005
< .050
—
< .050
< .005
—
< .005
< .005
—
< .005
—
< .024
—
< .005
—
< .005
400610076282501 20060515 1317 < .014 — — — — — < .024 —
400610076282501 20060515 1318 — < .005 < .005 < .050 < .005 < .005 — < .005
400610076282501 20060713 1100 < .014 — — — — — < .024 —
400610076282501
400610076282501
400610076282501
20060713
20060907
20060907
1101
1100
1101
—
< .014
—
< .005
—
< .005
< .005
—
< .005
< .050
—
< .050
< .005
—
< .005
< .005
—
< .005
—
< .024
—
< .005
—
< .005
400610076282501 20060907 1105 < .014 — — — — — < .024 —
400610076282501 20060907 1106 — < .005 < .005 < .050 < .005 < .005 — < .005
401712076235101 20060403 1415 < .014 — — — — — < .024 —
401712076235101 20060403 1416 — < .005 < .005 < .050 < .005 < .005 — < .005
401712076235101 20060517 1410 < .014 — — — — — < .024 —
401712076235101 20060517 1411 — < .005 < .005 < .050 < .005 < .005 — < .005

Table 6 87
Station number Date Time
Salbutamol, water,
fltrd(µg/L)
(62020)
Sarafloxacin, water,
fltrd (µg/L)
(62771)
Sulfachloro-pyridazine,
water, fltrd
(µg/L)(62774)
Sulfadiazine, water,
fltrd (µg/L)
(62963)
Sulfadimeth-ozine, water,
fltrd (µg/L)
(62776)
Sulfameth-azine, water,
fltrd (µg/L)
(61762)
Sulfameth-oxazole, water,
fltrd(µg/L)NWQL(62021)
Sulfameth-oxazole, water,
fltrd(µg/L)OGRL
(62775)
401712076235101 20060712 1355 < 0.014 — — — — — < 0.024 —
401712076235101 20060712 1400 — < 0.005 < 0.005 < 0.050 < 0.005 < 0.005 — < 0.005
401712076235101 20060920 1400 < .014 — — — — — < .024 —
401712076235101 20060920 1401 — < .005 < .005 < .050 < .005 < .005 — .006
401920078130101 20060329 1300 < .014 — — — — — < .024 —
401920078130101 20060329 1301 — < .005 < .005 < .050 < .005 < .005 — < .005
401920078130101 20060509 1400 < .014 — — — — — < .024 —
401920078130101 20060509 1401 — < .005 < .005 < .050 < .005 < .005 — < .005
401920078130101 20060725 1250 < .014 — — — — — < .024 —
401920078130101 20060725 1251 — < .005 < .005 < .050 < .005 < .005 — < .005
401920078130101 20060914 1230 < .014 — — — — — < .024 —
401920078130101 20060914 1231 — < .005 < .005 < .050 < .005 < .005 — < .005
402052076160101 20060403 1130 < .014 — — — — — < .024 —
402052076160101 20060403 1131 — < .005 < .005 < .050 < .005 < .005 — < .005
402052076160101 20060517 1135 < .014 — — — — — < .024 —
402052076160101 20060517 1136 — < .005 < .005 < .050 < .005 < .005 — < .005
402052076160101 20060712 1140 < .014 — — — — — < .024 —
402052076160101 20060712 1145 — < .005 < .005 < .050 < .005 < .005 — < .005
402052076160101 20060920 1050 < .014 — — — — — < .024 —
402052076160101 20060920 1051 — < .005 < .005 < .050 < .005 < .005 — < .005
405931076555601 20060323 1140 < .014 — — — — — < .024 —
405931076555601 20060323 1141 — < .005 < .005 < .050 < .005 < .005 — < .005
405931076555601 20060502 1140 < .014 — — — — — < .024 —
405931076555601 20060502 1141 — < .005 < .005 < .050 < .005 < .005 — < .005
405931076555601 20060711 1150 < .014 — — — — — < .024 —
405931076555601 20060711 1155 — < .005 < .005 < .050 < .005 < .005 — < .005
405931076555601 20060711 1200 < .014 — — — — — < .024 —
405931076555601 20060711 1205 — < .005 < .005 < .050 < .005 < .005 — < .005
405931076555601 20060921 1215 < .014 — — — — — < .024 —
405931076555601 20060921 1216 — < .005 < .005 < .050 < .005 < .005 — < .005

88 Concentrations of Selected Pharmaceuticals and Antibiotics in South-Central Pennsylvania, March Through September 2006
Station number
Date Time
Sulfathiazole, water,
fltrd (µg/L)
(62778)
Tetracycline, water,
fltrd(µg/L)
(62781)
Thiaben-dazole, water,
fltrd (µg/L)
(62801)
Trimethoprim, water,
fltrd(µg/L)NWQL(62023)
Trimethoprim, water,
fltrd(µg/L)OGRL
(62023)
Tylosin, water,
fltrd (µg/L)
(62896)
01470857 20060306 1130 — — < 0.025 < 0.020 — —
01470857 20060306 1131 < 0.020 < 0.010 — — < 0.005 < 0.005
01470857 20060508 1215 — — < .025 < .020 — —
01470857 20060508 1216 < .020 < .010 — — < .005 < .005
01470857 20060720 1130 — — < .025 < .020 — —
01470857 20060720 1131 < .020 < .010 — — < .005 < .005
01470857 20060918 1235 — — < .025 < .020 — —
01470857 20060918 1236 < .020 < .010 — — < .005 < .005
01470858 20060306 1300 — — < .025 E(2) .014 — —
01470858 20060306 1301 < .020 < .010 — — < .005 < .005
01470858 20060508 1100 — — < .025 E(2) .019 — —
01470858 20060508 1101 < .020 < .010 — — .022 < .005
01470858 20060720 1030 — — < .025 E(1) .004 — —
01470858 20060720 1031 < .020 < .010 — — .014 < .005
01470858 20060918 1120 — — < .025 < .020 — —
01470858 20060918 1121 < .020 < .010 — — .011 < .005
01470858 20060918 1125 — — < .025 E(2) .010 — —
01470858 20060918 1126 < .020 < .010 — — .010 < .005
015693155 20060313 1100 — — < .025 < .020 — —
015693155 20060313 1101 < .020 < .010 — — < .005 < .005
015693155 20060510 1145 — — < .025 < .020 — —
015693155 20060510 1146 < .020 < .010 — — < .005 < .005
015693155 20060706 1130 — — < .025 < .020 — —
015693155 20060706 1135 < .020 < .010 — — < .005 < .005
015693155 20060919 1020 — — < .025 < .020 — —
015693155 20060919 1021 < .020 < .010 — — < .005 < .005
015693158 20060313 1300 — — < .025 .033 — —
015693158 20060313 1301 < .020 < .010 — — .030 < .005
015693158 20060510 1030 — — < .025 .117 — —
015693158 20060510 1031 < .020 < .010 — — .123 < .005
015693158 20060510 1036 < .020 < .010 — — .114 < .005
015693158 20060706 1020 — — < .025 .023 — —
015693158 20060706 1025 < .020 < .010 — — .052 < .005
015693158 20060706 1030 — — < .025 .023 — —
015693158 20060706 1035 < .020 < .010 — — .058 < .005
015693158 20060919 1200 — — < .025 .037 — —
015693158 20060919 1201 < .020 < .010 — — .080 < .005
01571193 20060405 1600 — — < .025 < .020 — —
01571193 20060405 1601 < .020 < .010 — — < .005 .009
01571193 20060516 1210 — — < .025 < .020 — —
01571193 20060516 1211 < .020 < .010 — — < .005 < .005
01571193 20060726 1500 — — < .025 < .020 — —
01571193 20060726 1501 < .020 < .010 — — < .005 < .005

Table 6 89
Station number
Date Time
Sulfathiazole, water,
fltrd (µg/L)
(62778)
Tetracycline, water,
fltrd(µg/L)
(62781)
Thiaben-dazole, water,
fltrd (µg/L)
(62801)
Trimethoprim, water,
fltrd(µg/L)NWQL(62023)
Trimethoprim, water,
fltrd(µg/L)OGRL
(62023)
Tylosin, water,
fltrd (µg/L)
(62896)
01571193 20060905 1105 — — < 0.025 < 0.020 — —
01571193 20060905 1106 < 0.020 < 0.010 — — < 0.005 < 0.005
01571195 20060405 1800 — — < .025 < .020 — —
01571195 20060405 1801 < .020 < .010 — — .009 .023
01571195 20060516 1050 — — < .025 < .020 — —
01571195 20060516 1051 < .020 < .010 — — < .005 < .005
01571195 20060726 1600 — — < .025 < .020 — —
01571195 20060726 1601 < .020 < .010 — — < .005 < .005
01571195 20060905 0950 — — < .025 < .020 — —
01571195 20060905 0951 < .020 < .010 — — < .005 < .005
01573151 20060307 1415 — — < .025 < .020 — —
01573151 20060307 1416 < .020 < .010 — — < .005 < .005
01573151 20060503 1040 — — < .025 < .020 — —
01573151 20060503 1041 < .020 < .010 — — < .005 < .005
01573151 20060719 1110 — — < .025 < .020 — —
01573151 20060719 1111 < .020 < .010 — — < .005 < .005
01573151 20060913 1100 — — < .025 < .020 — —
01573151
01573153
01573153
20060913
20060307
20060307
1101
1230
1231
< .020
—
< .020
< .010
—
< .010
—
< .025
—
—
.105
—
< .005
—
.140
< .005
—
< .005
01573153 20060307 1235 — — < .025 .121 — —
01573153 20060307 1236 < .020 < .010 — — .153 .006
01573153 20060503 0940 — — < .025 .106 — —
01573153 20060503 0941 < .020 < .010 — — .256 < .005
01573153 20060719 1010 — — < .025 < .020 — —
01573153 20060719 1011 < .020 < .010 — — .040 < .005
01573153 20060913 0950 — — < .025 < .020 — —
01573153 20060913 0951 < .020 < .010 — — .033 < .005
01574310 20060301 1600 — — < .025 < .020 — —
01574310 20060301 1601 < .020 < .010 — — < .005 .005
01574310 20060501 0940 — — < .025 < .020 — —
01574310 20060501 0941 < .020 < .010 — — < .005 .030
01574310 20060705 1420 — — < .025 < .020 — —
01574310 20060705 1425 < .020 < .010 — — < .005 .010
01574310 20060906 1200 — — < .025 < .020 — —
01574310 20060906 1201 < .020 < .010 — — < .005 < .005
01574314 20060301 1500 — — < .025 < .020 — —
01574314
01574314
01574314
20060301
20060501
20060501
1501
1035
1036
< .020
—
< .020
< .010
—
< .010
—
< .025
—
—
< .020
—
< .005
—
< .005
.007
—
.025
01574314 20060501 1037 — — < .025 < .020 — —
01574314 20060501 1038 < .020 < .010 — — < .005 .018
01574314 20060705 1310 — — < .025 < .020 — —
01574314 20060705 1315 < .020 < .010 — — < .005 .012
01574314 20060906 1300 — — < .025 < .020 — —
01574314 20060906 1301 < .020 < .010 — — < .005 < .005

90 Concentrations of Selected Pharmaceuticals and Antibiotics in South-Central Pennsylvania, March Through September 2006
Station number
Date Time
Sulfathiazole, water,
fltrd (µg/L)
(62778)
Tetracycline, water,
fltrd(µg/L)
(62781)
Thiaben-dazole, water,
fltrd (µg/L)
(62801)
Trimethoprim, water,
fltrd(µg/L)NWQL(62023)
Trimethoprim, water,
fltrd(µg/L)OGRL
(62023)
Tylosin, water,
fltrd (µg/L)
(62896)
01576420 20060306 1600 — — < 0.025 < 0.020 — —
01576420 20060306 1601 < 0.020 < 0.010 — — 0.015 < 0.005
01576420 20060522 1150 — — < .025 < .020 — —
01576420 20060522 1151 < .020 < .010 — — < .005 < .005
01576420 20060717 1150 — — < .025 < .020 — —
01576420 20060717 1151 < .020 < .010 — — < .005 < .005
01576420 20060911 1100 — — < .025 < .020 — —
01576420 20060911 1101 < .020 < .010 — — < .005 < .005
01576422 20060306 1730 — — < .025 .030 — —
01576422 20060306 1731 < .020 < .010 — — .034 .005
01576422 20060522 1025 — — < .025 .060 — —
01576422 20060522 1026 < .020 < .010 — — .106 .007
01576422 20060717 1030 — — < .025 E(4) .022 — —
01576422 20060717 1031 < .020 < .010 — — .054 < .005
01576422 20060911 1205 — — < .025 < .020 — —
01576422 20060911 1206 < .020 < .010 — — .069 < .005
01569346 20060405 1300 — — < .025 < .020 — —
01569346 20060405 1301 < .020 < .010 — — < .005 < .005
01569346 20060523 1115 — — < .025 < .020 — —
01569346 20060523 1116 < .020 < .010 — — < .005 < .005
01569346 20060726 1045 — — < .025 < .020 — —
01569346 20060726 1046 < .020 < .010 — — < .005 < .005
01569346 20060927 0955 — — < .025 < .020 — —
01569346 20060927 0956 < .020 < .010 — — < .005 < .005
01569349 20060405 1130 — — < .025 < .020 — —
01569349 20060405 1131 < .020 < .010 — — < .005 .007
01569349 20060523 1000 — — < .025 < .020 — —
01569349 20060523 1001 < .020 < .010 — — < .005 < .005
01569349 20060726 1245 — — < .025 < .020 — —
01569349 20060726 1246 < .020 < .010 — — < .005 < .005
01569349 20060927 1100 — — < .025 < .020 — —
01569349 20060927 1101 < .020 < .010 — — < .005 < .005
01572146 20060320 1200 — — < .025 < .020 — —
01572146 20060320 1201 < .020 < .010 — — < .005 < .005
01572146 20060518 1145 — — < .025 < .020 — —
01572146 20060518 1146 < .020 < .010 — — < .005 < .005
01572146 20060731 1015 — — < .025 < .020 — —
01572146 20060731 1016 < .020 < .010 — — < .005 < .005
01572146 20060926 0945 — — < .025 < .020 — —
01572146 20060926 0946 < .020 < .010 — — < .005 < .005
01572148 20060320 1445 — — < .025 < .020 — —
01572148 20060320 1446 < .020 < .010 — — < .005 < .005
01572148 20060518 1030 — — < .025 < .020 — —
01572148 20060518 1031 < .020 < .010 — — < .005 < .005
01572148 20060731 1110 — — < .025 < .020 — —
01572148 20060731 1111 < .020 < .010 — — < .005 < .005

Table 6 91
Station number
Date Time
Sulfathiazole, water,
fltrd (µg/L)
(62778)
Tetracycline, water,
fltrd(µg/L)
(62781)
Thiaben-dazole, water,
fltrd (µg/L)
(62801)
Trimethoprim, water,
fltrd(µg/L)NWQL(62023)
Trimethoprim, water,
fltrd(µg/L)OGRL
(62023)
Tylosin, water,
fltrd (µg/L)
(62896)
01572148 20060926 1055 — — < 0.025 < 0.020 — —
01572148 20060926 1056 < 0.020 < 0.010 — — < 0.005 < 0.005
401704076293101 20060315 1145 — — < .025 < .020 — —
401704076293101 20060315 1146 < .020 < .010 — — < .005 < .005
401704076293101 20060503 1345 — — < .025 < .020 — —
401704076293101 20060503 1346 < .020 < .010 — — < .005 < .005
401704076293101 20060719 1430 — — < .025 < .020 — —
401704076293101 20060719 1431 < .020 < .010 — — < .005 < .005
401704076293101 20060913 1400 — — < .025 < .020 — —
401704076293101 20060913 1401 < .020 < .010 — — < .005 < .005
01573095 20060315 1030 — — < .025 < .020 — —
01573095 20060315 1031 < .020 < .010 — — < .005 < .005
01573095 20060503 1245 — — < .025 < .020 — —
01573095 20060503 1246 < .020 < .010 — — < .005 < .005
01573095 20060719 1330 — — < .025 < .020 — —
01573095 20060719 1331 < .020 < .010 — — < .005 < .005
01573095 20060913 1305 — — < .025 < .020 — —
01573095 20060913 1306 < .020 < .010 — — < .005 < .005
01574050 20060316 1030 — — < .025 < .020 — —
01574050 20060316 1031 < .020 < .010 — — < .005 < .005
01574050 20060501 1350 — — < .025 < .020 — —
01574050 20060501 1351 < .020 < .010 — — < .005 .017
01574050 20060705 1045 — — < .025 < .020 — —
01574050 20060705 1050 < .020 < .010 — — < .005 < .005
01574050 20060906 1030 — — < .025 < .020 — —
01574050 20060906 1031 < .020 < .010 — — < .005 < .005
01574055 20060316 1130 — — < .025 < .020 — —
01574055 20060316 1131 < .020 < .010 — — < .005 < .005
01574055 20060501 1245 — — < .025 < .020 — —
01574055 20060501 1246 < .020 < .010 — — < .005 .027
01574055 20060705 1145 — — < .025 < .020 — —
01574055 20060705 1150 < .020 < .010 — — < .005 < .005
01574055 20060906 0925 — — < .025 < .020 — —
01574055 20060906 0926 < .020 < .010 — — < .005 < .005
01575771 20060322 1000 — — < .025 < .020 — —
01575771 20060322 1001 < .020 < .010 — — < .005 < .005
01575771 20060515 1055 — — < .025 < .020 — —
01575771 20060515 1056 < .020 < .010 — — < .005 < .005
01575771 20060717 1410 — — < .025 < .020 — —
01575771 20060717 1411 < .020 < .010 — — < .005 < .005
01575771 20060911 1450 — — < .025 < .020 — —
01575771 20060911 1451 < .020 < .010 — — < .005 < .005
015757724 20060322 1100 — — < .025 < .020 — —
015757724 20060322 1101 < .020 < .010 — — < .005 < .005
015757724 20060515 0915 — — < .025 < .020 — —
015757724 20060515 0916 < .020 < .010 — — < .005 < .005

92 Concentrations of Selected Pharmaceuticals and Antibiotics in South-Central Pennsylvania, March Through September 2006
Station number
Date Time
Sulfathiazole, water,
fltrd (µg/L)
(62778)
Tetracycline, water,
fltrd(µg/L)
(62781)
Thiaben-dazole, water,
fltrd (µg/L)
(62801)
Trimethoprim, water,
fltrd(µg/L)NWQL(62023)
Trimethoprim, water,
fltrd(µg/L)OGRL
(62023)
Tylosin, water,
fltrd (µg/L)
(62896)
015757724 20060717 1310 — — < 0.025 < 0.020 — —
015757724 20060717 1311 < 0.020 < 0.010 — — < 0.005 < 0.005
015757724 20060911 1550 — — < .025 < .020 — —
015757724 20060911 1551 < .020 < .010 — — < .005 < .005
01578349 20060314 1145 — — < .025 < .020 — —
01578349 20060314 1146 < .020 < .010 — — < .005 < .005
01578349 20060511 1110 — — < .025 < .020 — —
01578349 20060511 1111 < .020 < .010 — — < .005 < .005
01578349 20060718 1250 — — < .025 < .020 — —
01578349 20060718 1251 < .020 < .010 — — < .005 < .005
01578349 20060912 1215 — — < .025 < .020 — —
01578349 20060912 1216 < .020 < .010 — — < .005 < .005
015783492 20060314 1400 — — < .025 < .020 — —
015783492 20060314 1401 < .020 < .010 — — < .005 < .005
015783492 20060511 1010 — — < .025 < .020 — —
015783492 20060511 1011 < .020 < .010 — — < .005 < .005
015783492 20060718 1115 — — < .025 < .020 — —
015783492 20060718 1116 < .020 < .010 — — < .005 < .005
015783492 20060912 1115 — — < .025 < .020 — —
015783492 20060912 1116 < .020 < .010 — — < .005 < .005
394643077043101 20060309 1230 — — < .025 < .020 — —
394643077043101
394643077043101
394643077043101
20060309
20060504
20060504
1231
1110
1111
< .020
—
< .020
< .010
—
< .010
—
< .025
—
—
< .020
—
< .005
—
< .005
< .005
—
< .005
394643077043101 20060504 1112 — — < .025 < .020 — —
394643077043101 20060504 1113 < .020 < .010 — — < .005 < .005
394643077043101 20060710 1125 — — < .025 < .020 — —
394643077043101 20060710 1130 < .020 < .010 — — < .005 < .005
394643077043101 20060925 1055 — — < .025 < .020 — —
394643077043101 20060925 1056 < .020 < .010 — — < .005 < .005
400610076282501 20060406 1030 — — < .025 < .020 — —
400610076282501
400610076282501
400610076282501
20060406
20060515
20060515
1031
1315
1316
< .020
—
< .020
< .010
—
< .010
—
< .025
—
—
< .020
—
< .005
—
< .005
.012
—
< .005
400610076282501 20060515 1317 — — < .025 < .020 — —
400610076282501 20060515 1318 < .020 < .010 — — < .005 < .005
400610076282501 20060713 1100 — — < .025 < .020 — —
400610076282501
400610076282501
400610076282501
20060713
20060907
20060907
1101
1100
1101
< .020
—
< .020
< .010
—
< .010
—
< .025
—
—
< .020
—
< .005
—
< .005
< .005
—
< .005
400610076282501 20060907 1105 — — < .025 < .020 — —
400610076282501 20060907 1106 < .020 < .010 — — < .005 < .005
401712076235101 20060403 1415 — — < .025 < .020 — —
401712076235101 20060403 1416 < .020 < .010 — — < .005 .017
401712076235101 20060517 1410 — — < .025 < .020 — —
401712076235101 20060517 1411 < .020 < .010 — — < .005 < .005

Table 6 93
Station number
Date Time
Sulfathiazole, water,
fltrd (µg/L)
(62778)
Tetracycline, water,
fltrd(µg/L)
(62781)
Thiaben-dazole, water,
fltrd (µg/L)
(62801)
Trimethoprim, water,
fltrd(µg/L)NWQL(62023)
Trimethoprim, water,
fltrd(µg/L)OGRL
(62023)
Tylosin, water,
fltrd (µg/L)
(62896)
401712076235101 20060712 1355 — — < 0.025 < 0.020 — —
401712076235101 20060712 1400 < 0.020 < 0.010 — — < 0.005 < 0.005
401712076235101 20060920 1400 — — < .025 < .020 — —
401712076235101 20060920 1401 < .020 < .010 — — < .005 < .005
401920078130101 20060329 1300 — — < .025 < .020 — —
401920078130101 20060329 1301 < .020 < .010 — — < .005 < .005
401920078130101 20060509 1400 — — < .025 < .020 — —
401920078130101 20060509 1401 < .020 < .010 — — < .005 < .005
401920078130101 20060725 1250 — — < .025 < .020 — —
401920078130101 20060725 1251 < .020 < .010 — — < .005 < .005
401920078130101 20060914 1230 — — < .025 < .020 — —
401920078130101 20060914 1231 < .020 < .010 — — < .005 < .005
402052076160101 20060403 1130 — — < .025 < .020 — —
402052076160101 20060403 1131 < .020 < .010 — — < .005 < .005
402052076160101 20060517 1135 — — < .025 < .020 — —
402052076160101 20060517 1136 < .020 < .010 — — < .005 < .005
402052076160101 20060712 1140 — — < .025 < .020 — —
402052076160101 20060712 1145 < .020 < .010 — — < .005 < .005
402052076160101 20060920 1050 — — < .025 < .020 — —
402052076160101 20060920 1051 < .020 < .010 — — < .005 < .005
405931076555601 20060323 1140 — — < .025 < .020 — —
405931076555601 20060323 1141 < .020 < .010 — — < .005 < .005
405931076555601 20060502 1140 — — < .025 < .020 — —
405931076555601 20060502 1141 < .020 < .010 — — < .005 < .005
405931076555601 20060711 1150 — — < .025 < .020 — —
405931076555601 20060711 1155 < .020 < .010 — — < .005 < .005
405931076555601 20060711 1200 — — < .025 < .020 — —
405931076555601 20060711 1205 < .020 < .010 — — < .005 < .005
405931076555601 20060921 1215 — — < .025 < .020 — —
405931076555601 20060921 1216 < .020 < .010 — — < .005 < .005

94 Concentrations of Selected Pharmaceuticals and Antibiotics in South-Central Pennsylvania, March Through September 2006
Station number
Date Time
Virginia-mycin, water,
fltrd (µg/L)
(62897)
Warfarin, water,
fltrd(µg/L)
(62024)
Type of quality-assurance
dataassociated
with sample, code
(99111)
Type of replicate,
code (99105)
01470857 20060306 1130 — < 0.019 — —
01470857 20060306 1131 < 0.005 — — —
01470857 20060508 1215 — < .019 blank —
01470857 20060508 1216 < .005 — blank —
01470857 20060720 1130 — < .019 — —
01470857 20060720 1131 < .005 — — —
01470857 20060918 1235 — < .019 — —
01470857 20060918 1236 < .005 — — —
01470858 20060306 1300 — < .019 — —
01470858 20060306 1301 < .005 — — —
01470858 20060508 1100 — < .019 — —
01470858 20060508 1101 < .005 — — —
01470858 20060720 1030 — < .019 — —
01470858 20060720 1031 < .005 — — —
01470858 20060918 1120 — < .019 replicate sequential
01470858 20060918 1121 < .005 — replicate sequential
01470858 20060918 1125 — < .019 — sequential
01470858 20060918 1126 < .005 — — sequential
015693155 20060313 1100 — < .019 — —
015693155 20060313 1101 < .005 — — —
015693155 20060510 1145 — < .019 — —
015693155 20060510 1146 < .005 — — —
015693155 20060706 1130 — < .019 — —
015693155 20060706 1135 < .005 — — —
015693155 20060919 1020 — < .019 — —
015693155 20060919 1021 < .005 — — —
015693158 20060313 1300 — < .019 — —
015693158 20060313 1301 < .005 — — —
015693158 20060510 1030 — < .019 spike —
015693158 20060510 1031 < .005 — replicate split
015693158 20060510 1036 < .005 — — split
015693158 20060706 1020 — < .019 replicate sequential
015693158 20060706 1025 < .005 — replicate sequential
015693158 20060706 1030 — < .019 — sequential
015693158 20060706 1035 < .005 — — sequential
015693158 20060919 1200 — < .019 blank —
015693158 20060919 1201 < .005 — blank —
01571193 20060405 1600 — < .019 — —
01571193 20060405 1601 < .005 — — —
01571193 20060516 1210 — < .019 — —
01571193 20060516 1211 < .005 — — —
01571193 20060726 1500 — < .019 — —
01571193 20060726 1501 < .005 — — —

Table 6 95
Station number
Date Time
Virginia-mycin, water,
fltrd (µg/L)
(62897)
Warfarin, water,
fltrd(µg/L)
(62024)
Type of quality-assurance
dataassociated
with sample, code
(99111)
Type of replicate,
code (99105)
01571193 20060905 1105 — < 0.019 — —
01571193 20060905 1106 < 0.005 — — —
01571195 20060405 1800 — < .019 — —
01571195 20060405 1801 < .005 — — —
01571195 20060516 1050 — < .019 — —
01571195 20060516 1051 < .005 — — —
01571195 20060726 1600 — < .019 — —
01571195 20060726 1601 < .005 — — —
01571195 20060905 0950 — < .019 — —
01571195 20060905 0951 < .005 — — —
01573151 20060307 1415 — < .019 — —
01573151 20060307 1416 < .005 — — —
01573151 20060503 1040 — < .019 — —
01573151 20060503 1041 < .005 — — —
01573151 20060719 1110 — < .019 — —
01573151 20060719 1111 < .005 — — —
01573151 20060913 1100 — < .019 — —
01573151 20060913 1101 < .005 — — —
01573153
01573153
20060307
20060307
1230
1231
—
< .005
< .019
—
replicate
replicate
sequential
sequential
01573153 20060307 1235 — < .019 — sequential
01573153 20060307 1236 < .005 — — sequential
01573153 20060503 0940 — < .019 — —
01573153 20060503 0941 < .005 — — —
01573153 20060719 1010 — < .019 — —
01573153 20060719 1011 < .005 — — —
01573153 20060913 0950 — < .019 — —
01573153 20060913 0951 < .005 — — —
01574310 20060301 1600 — < .019 — —
01574310 20060301 1601 < .005 — — —
01574310 20060501 0940 — < .019 — —
01574310 20060501 0941 < .005 — — —
01574310 20060705 1420 — < .019 — —
01574310 20060705 1425 < .005 — — —
01574310 20060906 1200 — < .019 — —
01574310 20060906 1201 < .005 — — —
01574314 20060301 1500 — < .019 — —
01574314 20060301 1501 < .005 — — —
01574314
01574314
20060501
20060501
1035
1036
—
< .005
< .019
—
replicate
replicate
sequential
sequential
01574314 20060501 1037 — < .019 — sequential
01574314 20060501 1038 < .005 — — sequential
01574314 20060705 1310 — < .019 — —
01574314 20060705 1315 < .005 — — —
01574314 20060906 1300 — < .019 — —
01574314 20060906 1301 < .005 — — —

96 Concentrations of Selected Pharmaceuticals and Antibiotics in South-Central Pennsylvania, March Through September 2006
Station number
Date Time
Virginia-mycin, water,
fltrd (µg/L)
(62897)
Warfarin, water,
fltrd(µg/L)
(62024)
Type of quality-assurance
dataassociated
with sample, code
(99111)
Type of replicate,
code (99105)
01576420 20060306 1600 — < 0.019 — —
01576420 20060306 1601 < 0.005 — — —
01576420 20060522 1150 — < .019 — —
01576420 20060522 1151 < .005 — — —
01576420 20060717 1150 — < .019 — —
01576420 20060717 1151 < .005 — — —
01576420 20060911 1100 — < .019 — —
01576420 20060911 1101 < .005 — — —
01576422 20060306 1730 — < .019 — —
01576422 20060306 1731 < .005 — — —
01576422 20060522 1025 — < .019 — —
01576422 20060522 1026 < .005 — — —
01576422 20060717 1030 — < .019 — —
01576422 20060717 1031 < .005 — — —
01576422 20060911 1205 — E(3) .030 — —
01576422 20060911 1206 < .005 — — —
01569346 20060405 1300 — < .019 — —
01569346 20060405 1301 < .005 — — —
01569346 20060523 1115 — < .019 — —
01569346 20060523 1116 < .005 — — —
01569346 20060726 1045 — < .019 — —
01569346 20060726 1046 < .005 — — —
01569346 20060927 0955 — < .019 — —
01569346 20060927 0956 < .005 — — —
01569349 20060405 1130 — < .019 — —
01569349 20060405 1131 < .005 — — —
01569349 20060523 1000 — < .019 — —
01569349 20060523 1001 < .005 — — —
01569349 20060726 1245 — < .019 — —
01569349 20060726 1246 < .005 — — —
01569349 20060927 1100 — < .019 — —
01569349 20060927 1101 < .005 — — —
01572146 20060320 1200 — < .019 — —
01572146 20060320 1201 < .005 — — —
01572146 20060518 1145 — < .019 — —
01572146 20060518 1146 < .005 — — —
01572146 20060731 1015 — < .019 blank —
01572146 20060731 1016 < .005 — blank —
01572146 20060926 0945 — < .019 — —
01572146 20060926 0946 < .005 — — —
01572148 20060320 1445 — < .019 — —
01572148 20060320 1446 < .005 — — —
01572148 20060518 1030 — < .019 — —
01572148 20060518 1031 < .005 — — —
01572148 20060731 1110 — < .019 — —
01572148 20060731 1111 < .005 — — —

Table 6 97
Station number
Date Time
Virginia-mycin, water,
fltrd (µg/L)
(62897)
Warfarin, water,
fltrd(µg/L)
(62024)
Type of quality-assurance
dataassociated
with sample, code
(99111)
Type of replicate,
code (99105)
01572148 20060926 1055 — < 0.019 — —
01572148 20060926 1056 < 0.005 — — —
401704076293101 20060315 1145 — < .019 — —
401704076293101 20060315 1146 < .005 — — —
401704076293101 20060503 1345 — < .019 — —
401704076293101 20060503 1346 < .005 — — —
401704076293101 20060719 1430 — < .019 — —
401704076293101 20060719 1431 < .005 — — —
401704076293101 20060913 1400 — < .019 — —
401704076293101 20060913 1401 < .005 — — —
01573095 20060315 1030 — < .019 — —
01573095 20060315 1031 < .005 — — —
01573095 20060503 1245 — < .019 — —
01573095 20060503 1246 < .005 — — —
01573095 20060719 1330 — < .019 — —
01573095 20060719 1331 < .005 — — —
01573095 20060913 1305 — < .019 — —
01573095 20060913 1306 < .005 — — —
01574050 20060316 1030 — < .019 — —
01574050 20060316 1031 < .005 — spike —
01574050 20060501 1350 — < .019 — —
01574050 20060501 1351 < .005 — — —
01574050 20060705 1045 — < .019 — —
01574050 20060705 1050 < .005 — — —
01574050 20060906 1030 — < .019 — —
01574050 20060906 1031 < .005 — — —
01574055 20060316 1130 — < .019 — —
01574055 20060316 1131 < .005 — — —
01574055 20060501 1245 — < .019 — —
01574055 20060501 1246 < .005 — spike —
01574055 20060705 1145 — < .019 — —
01574055 20060705 1150 < .005 — — —
01574055 20060906 0925 — < .019 — —
01574055 20060906 0926 < .005 — — —
01575771 20060322 1000 — < .019 — —
01575771 20060322 1001 < .005 — — —
01575771 20060515 1055 — < .019 — —
01575771 20060515 1056 < .005 — — —
01575771 20060717 1410 — < .019 — —
01575771 20060717 1411 < .005 — — —
01575771 20060911 1450 — < .019 — —
01575771 20060911 1451 < .005 — — —
015757724 20060322 1100 — < .019 — —
015757724 20060322 1101 < .005 — — —
015757724 20060515 0915 — < .019 — —
015757724 20060515 0916 < .005 — — —

98 Concentrations of Selected Pharmaceuticals and Antibiotics in South-Central Pennsylvania, March Through September 2006
Station number
Date Time
Virginia-mycin, water,
fltrd (µg/L)
(62897)
Warfarin, water,
fltrd(µg/L)
(62024)
Type of quality-assurance
dataassociated
with sample, code
(99111)
Type of replicate,
code (99105)
015757724 20060717 1310 — < 0.019 — —
015757724 20060717 1311 < 0.005 — — —
015757724 20060911 1550 — < .019 — —
015757724 20060911 1551 < .005 — — —
01578349 20060314 1145 — < .019 — —
01578349 20060314 1146 < .005 — — —
01578349 20060511 1110 — < .019 — —
01578349 20060511 1111 < .005 — — —
01578349 20060718 1250 — < .019 — —
01578349 20060718 1251 < .005 — — —
01578349 20060912 1215 — < .019 — —
01578349 20060912 1216 < .005 — — —
015783492 20060314 1400 — < .019 — —
015783492 20060314 1401 < .005 — — —
015783492 20060511 1010 — < .019 — —
015783492 20060511 1011 < .005 — — —
015783492 20060718 1115 — < .019 — —
015783492 20060718 1116 < .005 — — —
015783492 20060912 1115 — < .019 — —
015783492 20060912 1116 < .005 — — —
394643077043101 20060309 1230 — < .019 blank —
394643077043101 20060309 1231 < .005 — blank —
394643077043101
394643077043101
20060504
20060504
1110
1111
—
< .005
< .019
—
replicate
replicate
sequential
sequential
394643077043101 20060504 1112 — < .019 — sequential
394643077043101 20060504 1113 < .005 — — sequential
394643077043101 20060710 1125 — < .019 — —
394643077043101 20060710 1130 < .005 — — —
394643077043101 20060925 1055 — < .019 — —
394643077043101 20060925 1056 < .005 — — —
400610076282501 20060406 1030 — < .019 — —
400610076282501 20060406 1031 < .005 — — —
400610076282501
400610076282501
20060515
20060515
1315
1316
—
< .005
< .019
—
replicate
replicate
sequential
sequential
400610076282501 20060515 1317 — < .019 — sequential
400610076282501 20060515 1318 < .005 — — sequential
400610076282501 20060713 1100 — < .019 blank —
400610076282501 20060713 1101 < .005 — blank —
400610076282501
400610076282501
20060907
20060907
1100
1101
—
< .005
< .019
—
replicate
replicate
sequential
sequential
400610076282501 20060907 1105 — < .019 sequential
400610076282501 20060907 1106 < .005 — — sequential
401712076235101 20060403 1415 — < .019 — —
401712076235101 20060403 1416 < .005 — — —
401712076235101 20060517 1410 — < .019 — —
401712076235101 20060517 1411 < .005 — — —

Table 6 99
Station number
Date Time
Virginia-mycin, water,
fltrd (µg/L)
(62897)
Warfarin, water,
fltrd(µg/L)
(62024)
Type of quality-assurance
dataassociated
with sample, code
(99111)
Type of replicate,
code (99105)
401712076235101 20060712 1355 — < 0.019 — —
401712076235101 20060712 1400 < 0.005 — — —
401712076235101 20060920 1400 — < .019 blank —
401712076235101 20060920 1401 < .005 — blank —
401920078130101 20060329 1300 — < .019 — —
401920078130101 20060329 1301 < .005 — — —
401920078130101 20060509 1400 — < .019 — —
401920078130101 20060509 1401 < .005 — — —
401920078130101 20060725 1250 — < .019 — —
401920078130101 20060725 1251 < .005 — — —
401920078130101 20060914 1230 — < .019 — —
401920078130101 20060914 1231 < .005 — — —
402052076160101 20060403 1130 — < .019 — —
402052076160101 20060403 1131 < .005 — — —
402052076160101 20060517 1135 — < .019 — —
402052076160101 20060517 1136 < .005 — — —
402052076160101 20060712 1140 — < .019 — —
402052076160101 20060712 1145 < .005 — — —
402052076160101 20060920 1050 — < .019 — —
402052076160101 20060920 1051 < .005 — — —
405931076555601 20060323 1140 — < .019 — —
405931076555601 20060323 1141 < .005 — — —
405931076555601 20060502 1140 — < .019 — —
405931076555601 20060502 1141 < .005 —
405931076555601 20060711 1150 — < .019 replicate sequential
405931076555601 20060711 1155 < .005 — replicate sequential
405931076555601 20060711 1200 — < .019 — sequential
405931076555601 20060711 1205 < .005 — — sequential
405931076555601 20060921 1215 — < .019 — —
405931076555601 20060921 1216 < .005 — — —


Appendix 1
101
Appendix 1. Records of wells sampled in Adams, Lancaster, Lebanon, Huntingdon, and Union Counties in 2006.
[gal/min, gallons per minute; Y, yes; N, no; aquifer code, abbreviation of carbonate-rock geologic unit where well is completed: 377LDGR, Ledger Formation (Lower Cambrian); 347KRTL, Keyser, Tonoloway Formations, Undifferentiated (Lower Devonian); 374BSPG, Buffalo Springs Formation (Middle Cambrian); 367EPLR, Epler Formation (Lower Ordovician); 367SNNG, Stonehenge Formation (Lower Ordovi-cian); --, not available]
Static water level
Local Depth Casing Date Well yield at Aquifer Casing Grouted Water level (unless
well Latitude Longitude of well length well construction code material (Y/N) date indicated number (feet) (feet) construction (gal/min)
otherwise) (feet)
AD 653 39° 46’ 45" 077° 04’ 31" 377LDGR 150 42.5 Steel Y 06/82 45 03/09/06 --05/04/06 --07/10/06 --09/25/06 --
HU 426 40° 19’ 19" 078° 13’ 00" 347KRTL 247 21 Steel N 10/22/99 30 03/29/06 13.3105/09/06 13.4807/25/06 13.6209/14/06 14.60
LB 1248 40° 17’ 12" 076° 23’ 51" 374BSPG 300 102 Steel N 11/11/03 40 04/03/06 45.3105/17/06 43.1107/12/06 30.3609/20/06 42.75
LB 1249 40° 20’ 52" 076° 16’ 01" 367EPLR 240 121 Steel N 05/25/04 60+ Not static04/03/06 59.6005/17/06 62.8507/12/06 44.5009/20/06 59.58
LN 2114 40° 06’ 09" 076° 28’ 25" 367SNNG 175 61 Steel N 07/16/87 100+ Not static04/06/06 48.3705/15/06 49.9607/13/06 44.5709/07/06 50.49
UN 205 40° 59’ 31" 076° 55’ 55" 347KRTL 147 42 Steel N 01/91 20 03/23/06 38.0505/02/06 38.3707/11/06 36.0609/21/06 37.18