CONCENTRATION AND COMPETITION IN BANKING...
9
- 884 - Uluslararası Sosyal Araştırmalar Dergisi The Journal of International Social Research Cilt: 9 Sayı: 46 Volume: 9 Issue: 46 Ekim 2016 October 2016 www.sosyalarastirmalar.com Issn: 1307-9581 CONCENTRATION AND COMPETITION IN BANKING SECTOR: TURKEY CASE (2001-2015) Filiz YILDIZ CONTUK * Hümeyra BURUCU ** Abstract A bank based structure is prevalent in Turkish finance system. In this respect, it is extremely important to know about the structure of the market in which the banks carry on business. Although there are various studies related with the field conducted from different viewpoints and through different methods, every information presented in the literature about the subject is highly important. In this study, the competition level experienced in Turkish banking sector between 2001-2015 was calculated by using Herfindahl- Hirschman Index (HHI) and concentration ratio (CR-5) and then, the findings were compared. As a result of the study, it was determined that when all the banks operating in Turkish banking sector in the period of 2001-2015 were taken into account, a monopolistic competition was prevalent among the perfectly competitive state and private capitalized deposit banks, and an oligopoly competitive structure was dominant among the foreign invested, development and investment banks. Keywords: Banking Sector, Herfindahl-Hirschman Index (HHI), Concentration Ratio. Jel Classification: G21, F65 1. Introduction The structure and competition level of the Turkish banking sector, which has a crucial importance in financial system, have been influenced by governmet policies and economic developments. In the sector, which operated under the state control without competition until 1980s, banking transactions, entering into the sector, interest rates and amount of loans were strictly limited. However, beginning from 1980s, thanks to financial deregulation and foreign expansion, the sector was opened to competition, new banks were allowed to open and interest rates, amount of loan and money on deposit could be determined independently. Thus, Turkish banking sector has entered into a rapid development process both through government policies and with the effect of globalization and technological innovations(www.rekabet.gov.tr). Currently, a bank based financial system, in which the tools like deposit money, deposit insurance and loan are used densely, is prevailing in Turkey. Savings made by economic units are transferred into the units in need of this fund in the optimally most efficient way and at minimum cost thanks to this system. In this respect, building the functioning of the banks, which are the most significant actors in the system, on a solid ground is a crucial parameter that influences the running of the economy directly. Although banks, as a commercial unit, esentially serves to the purpose of making profit, since they form the basis of the financial structure, the activities they perform influence not only themselves but also the micro and macro level economic units. Therefore, it is extremely important to know the concentration and competition structure of the market in which the banks, the profitability of which increases based upon their ability to provide the financial products and services at the desirable quality but with a lower cost, carry on business (Öztürk et al., 2010: 96; Ünal, 2014: 8; Coşkun et al., 2012:1). In this study, it was aimed to determine the concentration and competition level of the Turkish banking sector. In the study, in which the concentration rate (CR-5) andHerfindhal-Hirsman Index(HHI) were used as the method, the condition of sectoral competition of the banking sector for the period of 2001- 2015 was evaluated with the help of the data obtained from the state, private and foreign capital deposit banks as well as development and investment banks operating in Turkey in the period of 2001 and later on. In terms of its investigation period, the study is quite extensive. Furthermore, the concentration and competition levels of the banks investigated in the study were evaluated in three different dimensions based upon their areas of specialization, ownership structures, and whether they were national or foreign investedand thus a significant contribution was made to the literature. * Öğr. Gör.Dr., Muğla Sıtkı Koçman Üniversitesi, Fethiye A.S.M.K. MYO, [email protected] ** Yrd. Doç. Dr., Atatürk Üniversitesi, Oltu Beşeri ve Sosyal Bilimler Fakültesi, [email protected]
Transcript of CONCENTRATION AND COMPETITION IN BANKING...
- 884 -
Uluslararası Sosyal Araştırmalar Dergisi
The Journal of International Social Research
Cilt: 9 Sayı: 46 Volume: 9 Issue: 46
Ekim 2016 October 2016
www.sosyalarastirmalar.com Issn: 1307-9581
CONCENTRATION AND COMPETITION IN BANKING SECTOR: TURKEY CASE (2001-2015) Filiz YILDIZ CONTUK* Hümeyra BURUCU**
Abstract A bank based structure is prevalent in Turkish finance system. In this respect, it is extremely important to know about the
structure of the market in which the banks carry on business. Although there are various studies related with the field conducted from different viewpoints and through different methods, every information presented in the literature about the subject is highly important. In this study, the competition level experienced in Turkish banking sector between 2001-2015 was calculated by using Herfindahl-Hirschman Index (HHI) and concentration ratio (CR-5) and then, the findings were compared. As a result of the study, it was determined that when all the banks operating in Turkish banking sector in the period of 2001-2015 were taken into account, a monopolistic competition was prevalent among the perfectly competitive state and private capitalized deposit banks, and an oligopoly competitive structure was dominant among the foreign invested, development and investment banks.
Keywords: Banking Sector, Herfindahl-Hirschman Index (HHI), Concentration Ratio. Jel Classification: G21, F65 1. Introduction The structure and competition level of the Turkish banking sector, which has a crucial importance in
financial system, have been influenced by governmet policies and economic developments. In the sector, which operated under the state control without competition until 1980s, banking transactions, entering into the sector, interest rates and amount of loans were strictly limited. However, beginning from 1980s, thanks to financial deregulation and foreign expansion, the sector was opened to competition, new banks were allowed to open and interest rates, amount of loan and money on deposit could be determined independently. Thus, Turkish banking sector has entered into a rapid development process both through government policies and with the effect of globalization and technological innovations(www.rekabet.gov.tr).
Currently, a bank based financial system, in which the tools like deposit money, deposit insurance and loan are used densely, is prevailing in Turkey. Savings made by economic units are transferred into the units in need of this fund in the optimally most efficient way and at minimum cost thanks to this system. In this respect, building the functioning of the banks, which are the most significant actors in the system, on a solid ground is a crucial parameter that influences the running of the economy directly. Although banks, as a commercial unit, esentially serves to the purpose of making profit, since they form the basis of the financial structure, the activities they perform influence not only themselves but also the micro and macro level economic units. Therefore, it is extremely important to know the concentration and competition structure of the market in which the banks, the profitability of which increases based upon their ability to provide the financial products and services at the desirable quality but with a lower cost, carry on business (Öztürk et al., 2010: 96; Ünal, 2014: 8; Coşkun et al., 2012:1).
In this study, it was aimed to determine the concentration and competition level of the Turkish banking sector. In the study, in which the concentration rate (CR-5) andHerfindhal-Hirsman Index(HHI) were used as the method, the condition of sectoral competition of the banking sector for the period of 2001-2015 was evaluated with the help of the data obtained from the state, private and foreign capital deposit banks as well as development and investment banks operating in Turkey in the period of 2001 and later on. In terms of its investigation period, the study is quite extensive. Furthermore, the concentration and competition levels of the banks investigated in the study were evaluated in three different dimensions based upon their areas of specialization, ownership structures, and whether they were national or foreign investedand thus a significant contribution was made to the literature.
* Öğr. Gör.Dr., Muğla Sıtkı Koçman Üniversitesi, Fethiye A.S.M.K. MYO, [email protected] ** Yrd. Doç. Dr., Atatürk Üniversitesi, Oltu Beşeri ve Sosyal Bilimler Fakültesi, [email protected]
- 885 -
In the study, at first, a review of the domestic and foreign studies made about this subject was carried out. Then, the method and analyses employed and the findings obtained in the study were mentioned and finally the conclusion part was written.
2. Literature The existing studies related to competition measurement in banking have been conducted
methodologically by using structural and non-structural methods. Some of the studies carried out on the subject were included in the following lines.
The first of the studies reviewed was by Çelik and Kaplan (2010),in which the efficiency and competition relationship in Turkish banking sector was investigatedfor the period of 2002-2007by using Panzar-Rosse model. According to the study results, since there were so many active banks in the sector in the years of 2005-2006, the competition was extremely high during these years. However, it was determined that the competition level was low in the other years of the period studied.
In another study, the competition level and the factors that influence the competition level were investigated by Yağcılar (2011)by using Lerner index, which is one of the nonstructural approaches. Looking into the index values, it was indicated that although the concentration in terms of bank assets, deposits and loans generally increased from 1992 to 2007 and the variety of the products and services used in banks continuously expanded, the banks operated far from an ideal competitive environment due to the fact that capital markets and nonbank financial institutions did not develop sufficiently. Moreover, it was also stated that as a result of the lessons taken from the crises, it became difficult to enter into the banking sector but, rather, easy to exit, and thus, the number of the banks decreased, the concentration level increased and competitive pressure on the banking sector remained low.
The market concentration of Nepal banking sector for the period of 2001-2009 was investigated by using HHI index and concentration rate and the market competition was studied via Panzar- Rosse approach by Gajurel and Pradhan (2012). According to the study results, it was determined that the market concentration of Nepal banking sectorwas at low level. Moreover, both monopolistic and perfect competition hypotheses that indicated the monopolistic structure among Nepal banks were rejected.
In the study made by Uddinand Suzuki in 2012, the concentration and competition levels in Bangladesh banking sector in the period of 1980-2013 were studied by using CR-1,CR-3,CR-5, CR-7, HHI, HHT, CCI, Entropi Indexand the Panzar-Rosse model, a non-structural approach. As a result of the study, it was determined that the Bangladesh banking sector increasingly turned into a competitive structure.
In a study conducted by Uzgören and Tarhan in 2012, CR-4 (Concentration Ratio-4) and Herfindhal-Hirsman Indexes (HHE) were used to identify the market structure of Turkish banking and then, the findings obtained were compared. As a result of the study made by using the dataobtained from 2008,the concentration in the Turkish banking market was found as 52,77%according to CR-4 Index and as 935 according to HHE. Accordingly, it was indicated that the banking market in Turkey had a convenience with the monopolistic competition market conditions and it was necessary to use the opportunity of new mergers and purchases given by the market.
In the study conducted by Coşkun et. al. in 2012, both structural and non-structural approaches were used in measuring the competition level. The results in Bresnahan-Lau modeland Panzar-Rosse model, which are among non-structural approaches, support each other andindicates the formation of a monopolistic competition. It was determined that while the major banks in the banking sector displayed oligopolistic behaviour in the Boone coefficient method, which was among the structural approaches, there were monopolistic tendencies in terms of the whole sector, that is to say, there was a competitive structure about market share between large and small banks. However, the large banks did not show a significant competitive tendency among themselves. Looking into the concentration rates, it can be seen that a different aspect became prominent with each method applied. While the oligopoly structure expanded especially after 2001 in domination index, according to the calculated Entropy Index, although the concentration has increased since 2001,a competitive structure was observed. However, according to Hannah and Kay Index,it was deduced that in Turkish banking sector, the competition level was high among small banks,whereas the competition among the large banks was lower. According to HHI, it was stated that after 2000,Turkish banking sector had the monopolistic competition market characteristics.
In the study conducted by Özcan in 2012, the competition level of deposit banks for the period of 2002-2009 was investigated through Panzar-Rosse Model. As a result of the study, it was indicated that the market reflected not the characteristics of the pure monopolyor perfect competition market but those of the monopolistic competitive market. Moreover, it was stated that the scale size of the competition between the banks in the market was significant and efficient and in the Turkish Banking System, which was restructured after the crises, the banks which were relatively few but economically more powerfulwere competing eachother.
- 886 -
In a study made by Altunöz (2013),the competition level of the banks operatingin Turkishbanking sector was measured through Lerner index. Detection of the determiners in the bank scale of Lerner Index was performed through panel data analysis. As a result of the analysis, the factors which were influential on competitive behaviour in Turkish banking sector were found as loans/total assets, loans/deposits, non-interest revenues/total assets, total revenues/total expenditures, return on assets (roa), risk, equities/total assets, balance sheet structureand pure interest margin.
In a study carried out in 2014, Matruku and Gjoka looked into the competition level of Albania’s banks. In the study in which the period of 2003-2012 was investigated, in order to measure the competition for assets, loans and deposits, HHI, CR4 and CR 5 rates were calculated. In conclusion, it was determined that the HH index for assets, loans and deposits had gradually decreased since 2003 and the greatest concentration was on deposits. It was indicated that the banking sector in Albania had the features of monopolistic competition market which was between the perfect competition market and the monopolistic market.
Another study was conducted by Rimavičiūtė and Vilys in 2014. In the study, which measured the competition structure of Lithuanian banks, from the structural approaches, the concentration rates (CR-3), HHI and Lerner indexmethods were used. As a result of the study, in which the period of 2005-2012 was investigated, it was determined that in Lithuania, where 81% of the financial system was made up of banks, the banking sector concentrated at a high degree andit looked likean oligopoly as a market structure.
3. The Implementation Aimed at Measuring the Competition in Banking Sector There are two fundemental approaches concerning with measuring competition in literature, one is
structural and the other one is non-structural. It is implied that when concentration is high in structural approach models, competition decreases. That is, new etries into the sector increase the number of the active firms in that sector and cause the concentration rates to decrease, and thus, the competition level increases (Çelik and Kaplan, 2010: 9).
Concentration is generally expressed as the function of the number of the firms in a sector and the size of those firms. The methods used in structural models includeConcentration Rates (C-Bank Concentration Index, Herfindahl-Hirschman Index, Rosenbluth-Hall-Tideman Index, Extensive Concentration Index, Hannah and Kay Index, Hause Index, Entropy Index, Domination Index ) and Boone Coefficient (Boone Model, Translog Cost Function).
However, in non-structural approaches, competitiveness is not only associated with the market structure but also measured through the response of price and output to costs (Kurul, 2011: 2). The models used in this method include Bresnahan-Lau Model (Panel Data Analysis, Time Series Analysis) and Panzar-Rosse Model (Coşkun et al., 2012).
In the present study, the concentration in the market between 2001-2015 was investigated with the purpose of measuring competition in state and private capitalised deposit banks, foreign invested deposit banksand development and investment banks. Herfindahl-Hirschman Index (HHI), which is a structural approach, and concentration rate (CR-5) were used to measure concentration.
HHI is one of the most successful indexes, first proposed by Hirschman and thenby Herfindahl and used to measure the market concentration. HHI is calculated as the total of the square of the market shares of all the firms in the market. If there are “n” firms in the market, HHI can be expressed as:
(Si) the market shares of the firms in percentages
HHI= 2 i=1 ....n (1) HHI= (s1)2 + (s2)2 + (s3)2 + (s4)2 +……………+ sn2 For example; HHI= (10)² + (10) ² + (10) ² + (10) ² + (10) ² + (25) ² + (25) ² = 100+100+100+100+100+625+625 = 1.750
If there is only one firm in the sector, the market share is 100%. Then, HHI is calculated as 10.000 and this is the highest value that the index can get. In this case, the market is called as the monopoly. On the contrary, if so many firms have fractional market shares, almost near zero, HHI is near-zero. In this case, it can be said that there is a perfect competition in the market (Uysal and Özütürk, 2005: 276). Such competitive markets are called as atomistic markets.
HHI has been one of the most popular market structure identification methods since 1980. In the treatment, the markets in which H - H Indexis lower than 1000 (H - H < 1000) can be called as a perfect competition, those between 1000 – 1800 (H- H; 1000-1800) can be called as monopolistic competition and those higher than 1800 (H - H > 1800) can be called as oligopolistic market structure (Yazıcı, 2013: 139).
- 887 -
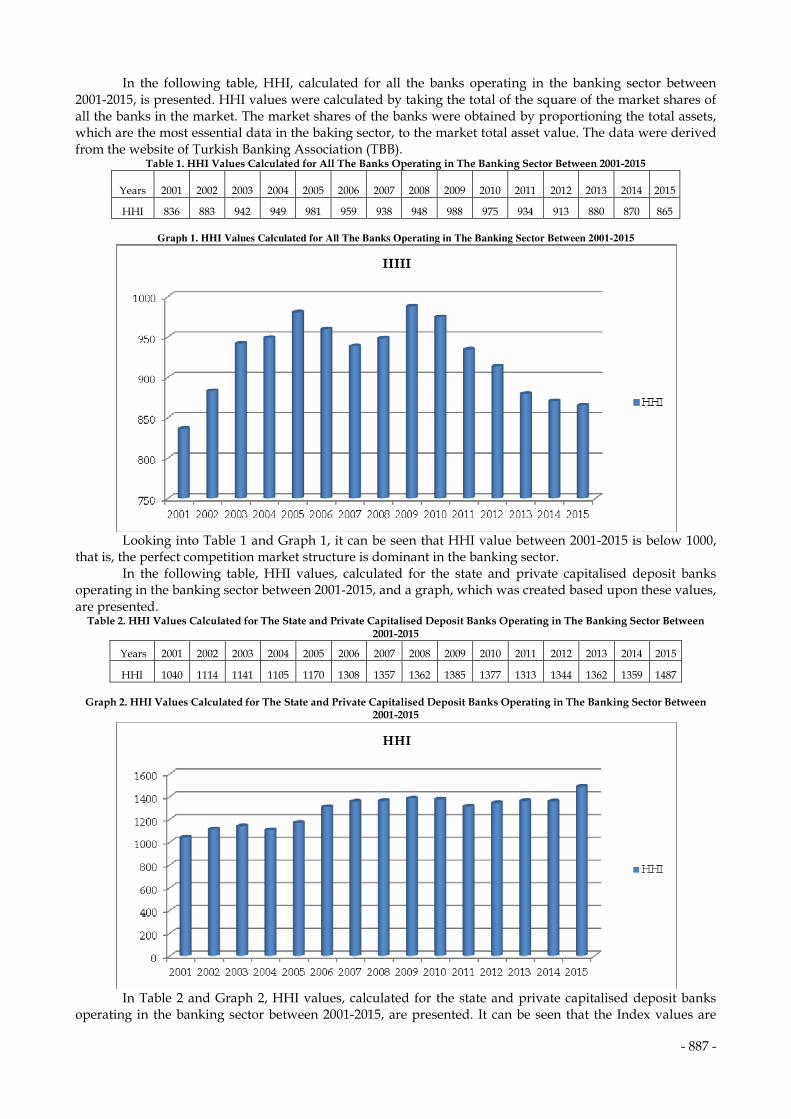
In the following table, HHI, calculated for all the banks operating in the banking sector between 2001-2015, is presented. HHI values were calculated by taking the total of the square of the market shares of all the banks in the market. The market shares of the banks were obtained by proportioning the total assets, which are the most essential data in the baking sector, to the market total asset value. The data were derived from the website of Turkish Banking Association (TBB).
Table 1. HHI Values Calculated for All The Banks Operating in The Banking Sector Between 2001-2015
Years 2001 2002 2003 2004 2005 2006 2007 2008 2009 2010 2011 2012 2013 2014 2015
HHI 836 883 942 949 981 959 938 948 988 975 934 913 880 870 865
Graph 1. HHI Values Calculated for All The Banks Operating in The Banking Sector Between 2001-2015
Looking into Table 1 and Graph 1, it can be seen that HHI value between 2001-2015 is below 1000, that is, the perfect competition market structure is dominant in the banking sector.
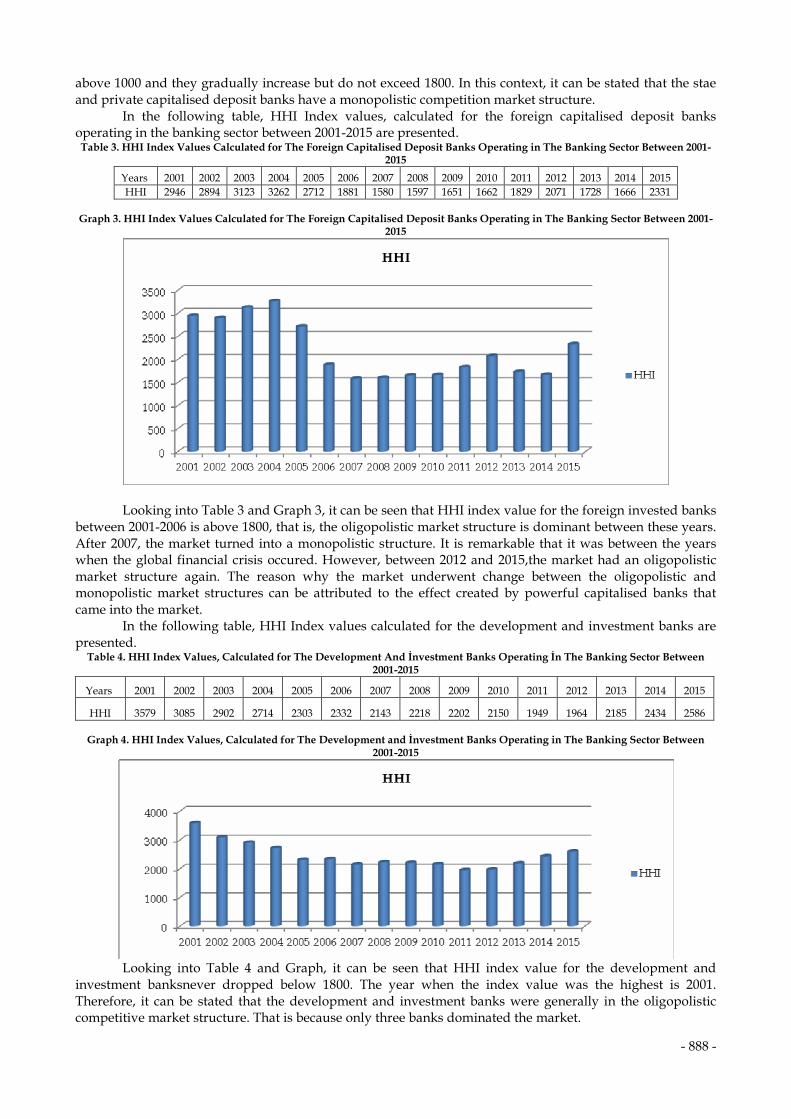
In the following table, HHI values, calculated for the state and private capitalised deposit banks operating in the banking sector between 2001-2015, and a graph, which was created based upon these values, are presented.
Table 2. HHI Values Calculated for The State and Private Capitalised Deposit Banks Operating in The Banking Sector Between 2001-2015
Years 2001 2002 2003 2004 2005 2006 2007 2008 2009 2010 2011 2012 2013 2014 2015
HHI 1040 1114 1141 1105 1170 1308 1357 1362 1385 1377 1313 1344 1362 1359 1487
Graph 2. HHI Values Calculated for The State and Private Capitalised Deposit Banks Operating in The Banking Sector Between 2001-2015
In Table 2 and Graph 2, HHI values, calculated for the state and private capitalised deposit banks operating in the banking sector between 2001-2015, are presented. It can be seen that the Index values are
- 888 -
above 1000 and they gradually increase but do not exceed 1800. In this context, it can be stated that the stae and private capitalised deposit banks have a monopolistic competition market structure.
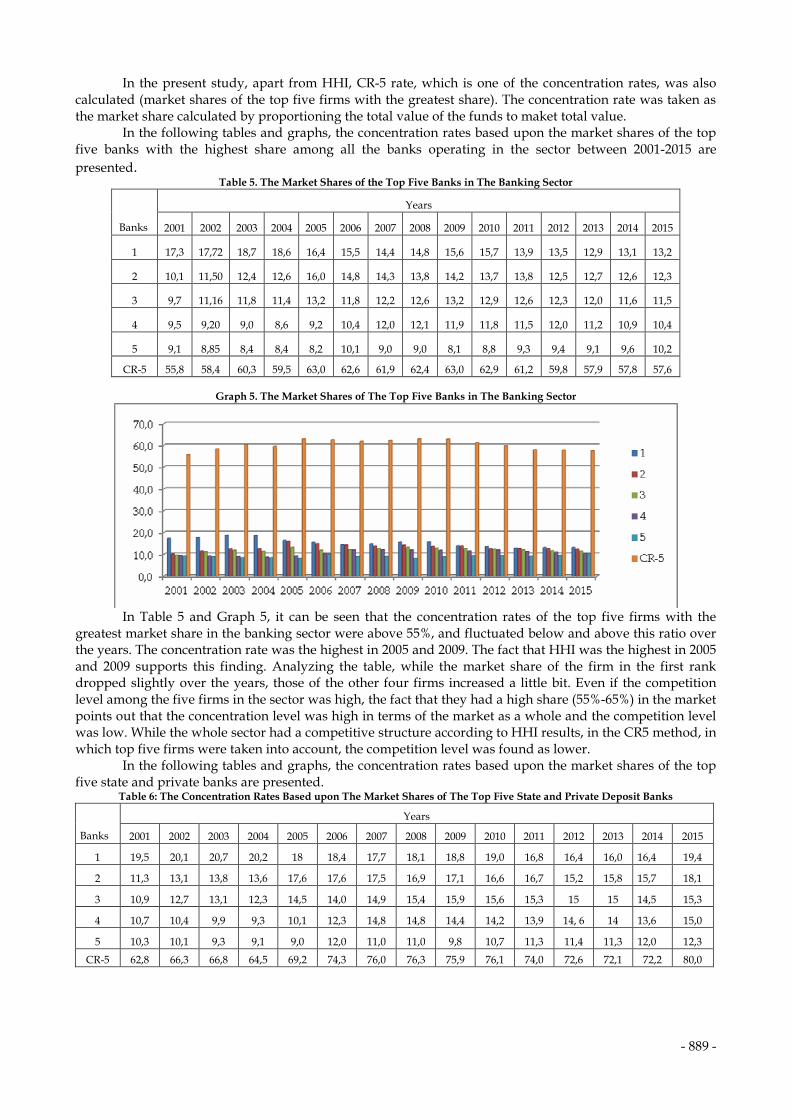
In the following table, HHI Index values, calculated for the foreign capitalised deposit banks operating in the banking sector between 2001-2015 are presented. Table 3. HHI Index Values Calculated for The Foreign Capitalised Deposit Banks Operating in The Banking Sector Between 2001-
2015
Years 2001 2002 2003 2004 2005 2006 2007 2008 2009 2010 2011 2012 2013 2014 2015 HHI 2946 2894 3123 3262 2712 1881 1580 1597 1651 1662 1829 2071 1728 1666 2331
Graph 3. HHI Index Values Calculated for The Foreign Capitalised Deposit Banks Operating in The Banking Sector Between 2001-
2015
Looking into Table 3 and Graph 3, it can be seen that HHI index value for the foreign invested banks between 2001-2006 is above 1800, that is, the oligopolistic market structure is dominant between these years. After 2007, the market turned into a monopolistic structure. It is remarkable that it was between the years when the global financial crisis occured. However, between 2012 and 2015,the market had an oligopolistic market structure again. The reason why the market underwent change between the oligopolistic and monopolistic market structures can be attributed to the effect created by powerful capitalised banks that came into the market.
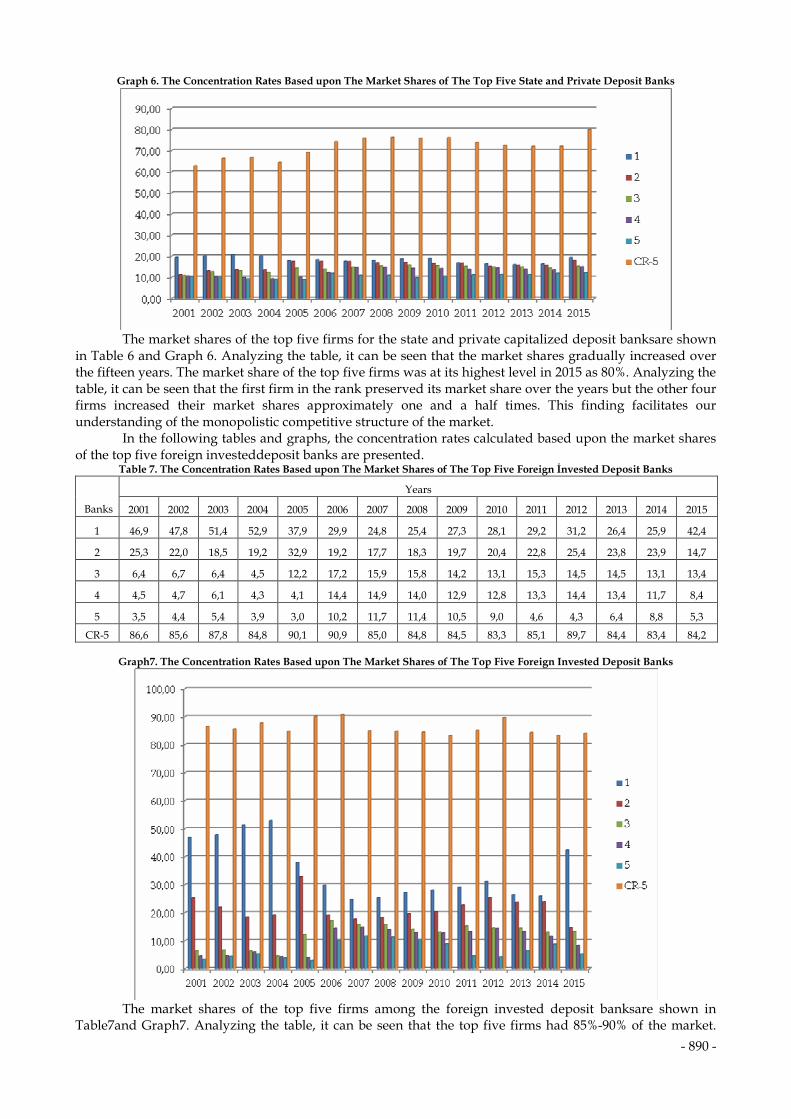
In the following table, HHI Index values calculated for the development and investment banks are presented.
Table 4. HHI Index Values, Calculated for The Development And İnvestment Banks Operating İn The Banking Sector Between 2001-2015
Years 2001 2002 2003 2004 2005 2006 2007 2008 2009 2010 2011 2012 2013 2014 2015
HHI 3579 3085 2902 2714 2303 2332 2143 2218 2202 2150 1949 1964 2185 2434 2586
Graph 4. HHI Index Values, Calculated for The Development and İnvestment Banks Operating in The Banking Sector Between 2001-2015
Looking into Table 4 and Graph, it can be seen that HHI index value for the development and investment banksnever dropped below 1800. The year when the index value was the highest is 2001. Therefore, it can be stated that the development and investment banks were generally in the oligopolistic competitive market structure. That is because only three banks dominated the market.
- 889 -
In the present study, apart from HHI, CR-5 rate, which is one of the concentration rates, was also calculated (market shares of the top five firms with the greatest share). The concentration rate was taken as the market share calculated by proportioning the total value of the funds to maket total value.
In the following tables and graphs, the concentration rates based upon the market shares of the top five banks with the highest share among all the banks operating in the sector between 2001-2015 are presented.
Table 5. The Market Shares of the Top Five Banks in The Banking Sector
Years
Banks 2001 2002 2003 2004 2005 2006 2007 2008 2009 2010 2011 2012 2013 2014 2015
1 17,3 17,72 18,7 18,6 16,4 15,5 14,4 14,8 15,6 15,7 13,9 13,5 12,9 13,1 13,2
2 10,1 11,50 12,4 12,6 16,0 14,8 14,3 13,8 14,2 13,7 13,8 12,5 12,7 12,6 12,3
3 9,7 11,16 11,8 11,4 13,2 11,8 12,2 12,6 13,2 12,9 12,6 12,3 12,0 11,6 11,5
4 9,5 9,20 9,0 8,6 9,2 10,4 12,0 12,1 11,9 11,8 11,5 12,0 11,2 10,9 10,4
5 9,1 8,85 8,4 8,4 8,2 10,1 9,0 9,0 8,1 8,8 9,3 9,4 9,1 9,6 10,2
CR-5 55,8 58,4 60,3 59,5 63,0 62,6 61,9 62,4 63,0 62,9 61,2 59,8 57,9 57,8 57,6
Graph 5. The Market Shares of The Top Five Banks in The Banking Sector
In Table 5 and Graph 5, it can be seen that the concentration rates of the top five firms with the greatest market share in the banking sector were above 55%, and fluctuated below and above this ratio over the years. The concentration rate was the highest in 2005 and 2009. The fact that HHI was the highest in 2005 and 2009 supports this finding. Analyzing the table, while the market share of the firm in the first rank dropped slightly over the years, those of the other four firms increased a little bit. Even if the competition level among the five firms in the sector was high, the fact that they had a high share (55%-65%) in the market points out that the concentration level was high in terms of the market as a whole and the competition level was low. While the whole sector had a competitive structure according to HHI results, in the CR5 method, in which top five firms were taken into account, the competition level was found as lower.
In the following tables and graphs, the concentration rates based upon the market shares of the top five state and private banks are presented.
Table 6: The Concentration Rates Based upon The Market Shares of The Top Five State and Private Deposit Banks
Years
Banks 2001 2002 2003 2004 2005 2006 2007 2008 2009 2010 2011 2012 2013 2014 2015
1 19,5 20,1 20,7 20,2 18 18,4 17,7 18,1 18,8 19,0 16,8 16,4 16,0 16,4 19,4
2 11,3 13,1 13,8 13,6 17,6 17,6 17,5 16,9 17,1 16,6 16,7 15,2 15,8 15,7 18,1
3 10,9 12,7 13,1 12,3 14,5 14,0 14,9 15,4 15,9 15,6 15,3 15 15 14,5 15,3
4 10,7 10,4 9,9 9,3 10,1 12,3 14,8 14,8 14,4 14,2 13,9 14, 6 14 13,6 15,0
5 10,3 10,1 9,3 9,1 9,0 12,0 11,0 11,0 9,8 10,7 11,3 11,4 11,3 12,0 12,3
CR-5 62,8 66,3 66,8 64,5 69,2 74,3 76,0 76,3 75,9 76,1 74,0 72,6 72,1 72,2 80,0
- 890 -
Graph 6. The Concentration Rates Based upon The Market Shares of The Top Five State and Private Deposit Banks
The market shares of the top five firms for the state and private capitalized deposit banksare shown
in Table 6 and Graph 6. Analyzing the table, it can be seen that the market shares gradually increased over the fifteen years. The market share of the top five firms was at its highest level in 2015 as 80%. Analyzing the table, it can be seen that the first firm in the rank preserved its market share over the years but the other four firms increased their market shares approximately one and a half times. This finding facilitates our understanding of the monopolistic competitive structure of the market.
In the following tables and graphs, the concentration rates calculated based upon the market shares of the top five foreign investeddeposit banks are presented.
Table 7. The Concentration Rates Based upon The Market Shares of The Top Five Foreign İnvested Deposit Banks
Years
Banks 2001 2002 2003 2004 2005 2006 2007 2008 2009 2010 2011 2012 2013 2014 2015
1 46,9 47,8 51,4 52,9 37,9 29,9 24,8 25,4 27,3 28,1 29,2 31,2 26,4 25,9 42,4
2 25,3 22,0 18,5 19,2 32,9 19,2 17,7 18,3 19,7 20,4 22,8 25,4 23,8 23,9 14,7
3 6,4 6,7 6,4 4,5 12,2 17,2 15,9 15,8 14,2 13,1 15,3 14,5 14,5 13,1 13,4
4 4,5 4,7 6,1 4,3 4,1 14,4 14,9 14,0 12,9 12,8 13,3 14,4 13,4 11,7 8,4
5 3,5 4,4 5,4 3,9 3,0 10,2 11,7 11,4 10,5 9,0 4,6 4,3 6,4 8,8 5,3
CR-5 86,6 85,6 87,8 84,8 90,1 90,9 85,0 84,8 84,5 83,3 85,1 89,7 84,4 83,4 84,2
Graph7. The Concentration Rates Based upon The Market Shares of The Top Five Foreign Invested Deposit Banks
The market shares of the top five firms among the foreign invested deposit banksare shown in Table7and Graph7. Analyzing the table, it can be seen that the top five firms had 85%-90% of the market.
- 891 -
This situation is convenient with the oligopolistic competition market that arouse in the HHI index. It is seen that between 2001-2014 the market share of the first firm in the rank gradually decreased but in 2015 it increased almost as much as 60%. Although the firm in the second rank experienced some small fluctuations in its market share, it preserved its share until 2014 but lost almost half of it in 2015.The other three firms redoubled their market shares until 2014 but their market shares reduced significantly in 2015.On the whole, compared with the state and private capitalized banks, it can be said that foreign invested deposit banks are less competitive.
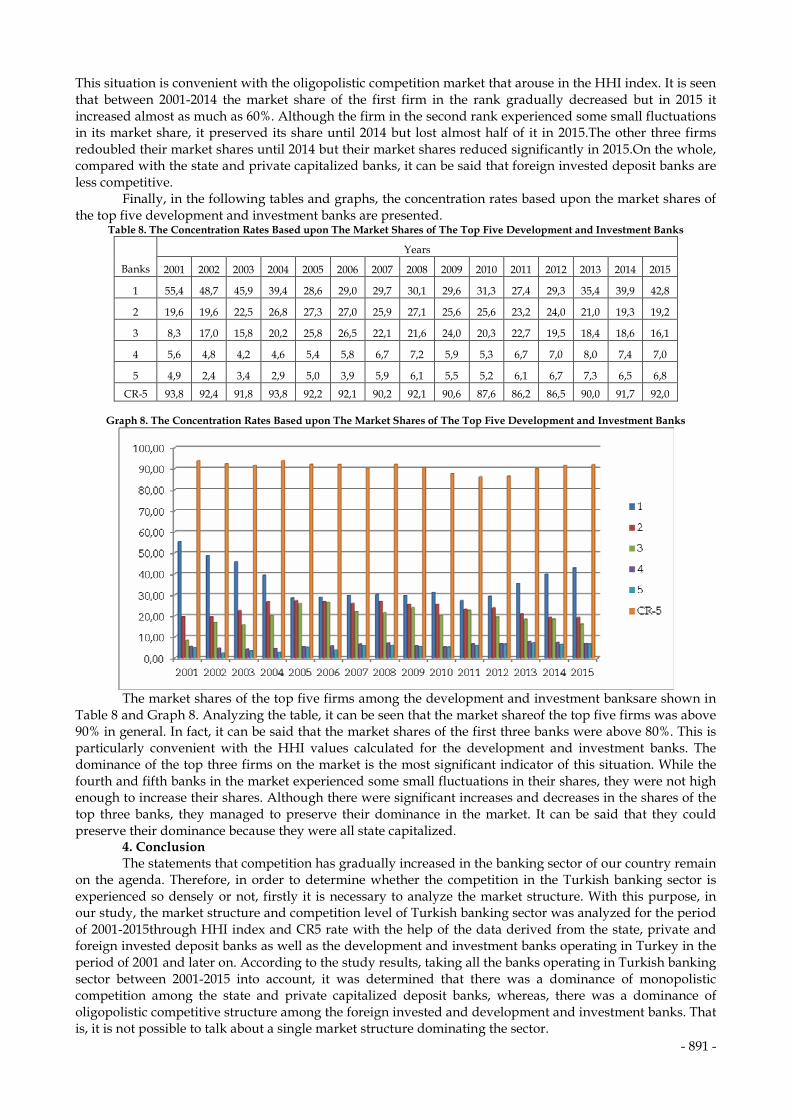
Finally, in the following tables and graphs, the concentration rates based upon the market shares of the top five development and investment banks are presented.
Table 8. The Concentration Rates Based upon The Market Shares of The Top Five Development and Investment Banks
Years
Banks 2001 2002 2003 2004 2005 2006 2007 2008 2009 2010 2011 2012 2013 2014 2015
1 55,4 48,7 45,9 39,4 28,6 29,0 29,7 30,1 29,6 31,3 27,4 29,3 35,4 39,9 42,8
2 19,6 19,6 22,5 26,8 27,3 27,0 25,9 27,1 25,6 25,6 23,2 24,0 21,0 19,3 19,2
3 8,3 17,0 15,8 20,2 25,8 26,5 22,1 21,6 24,0 20,3 22,7 19,5 18,4 18,6 16,1
4 5,6 4,8 4,2 4,6 5,4 5,8 6,7 7,2 5,9 5,3 6,7 7,0 8,0 7,4 7,0
5 4,9 2,4 3,4 2,9 5,0 3,9 5,9 6,1 5,5 5,2 6,1 6,7 7,3 6,5 6,8
CR-5 93,8 92,4 91,8 93,8 92,2 92,1 90,2 92,1 90,6 87,6 86,2 86,5 90,0 91,7 92,0
Graph 8. The Concentration Rates Based upon The Market Shares of The Top Five Development and Investment Banks
The market shares of the top five firms among the development and investment banksare shown in Table 8 and Graph 8. Analyzing the table, it can be seen that the market shareof the top five firms was above 90% in general. In fact, it can be said that the market shares of the first three banks were above 80%. This is particularly convenient with the HHI values calculated for the development and investment banks. The dominance of the top three firms on the market is the most significant indicator of this situation. While the fourth and fifth banks in the market experienced some small fluctuations in their shares, they were not high enough to increase their shares. Although there were significant increases and decreases in the shares of the top three banks, they managed to preserve their dominance in the market. It can be said that they could preserve their dominance because they were all state capitalized.
4. Conclusion The statements that competition has gradually increased in the banking sector of our country remain
on the agenda. Therefore, in order to determine whether the competition in the Turkish banking sector is experienced so densely or not, firstly it is necessary to analyze the market structure. With this purpose, in our study, the market structure and competition level of Turkish banking sector was analyzed for the period of 2001-2015through HHI index and CR5 rate with the help of the data derived from the state, private and foreign invested deposit banks as well as the development and investment banks operating in Turkey in the period of 2001 and later on. According to the study results, taking all the banks operating in Turkish banking sector between 2001-2015 into account, it was determined that there was a dominance of monopolistic competition among the state and private capitalized deposit banks, whereas, there was a dominance of oligopolistic competitive structure among the foreign invested and development and investment banks. That is, it is not possible to talk about a single market structure dominating the sector.
- 892 -
REFERENCES ALTUNÖZ, Utku (2013). “Türk Bankacılığında Rekabet Değerlendirme Yaklaşımları ile Rekabet Dinamiklerinin Ampirik Analizi”, International Conference On Eurasıan Economies, ss. 812-821. COŞKUN, M. Necat;, ARDOR, H. Naim; ÇERMİKLİ, A. Hakan; ERUYGUR, H. Ozan; ÖZTÜRK, Fahriye; TOKATLIOĞLU; İbrahim, AYKAÇ, Gökhan and DARLAROĞLU, Tolga. (2012). Türkiye’de Bankacılık Sektörü Piyasa Yapısı, Firma Davranışları ve Rekabet Analizi, İstanbul: Türkiye Banklar Birliği. www.tbb.org.tr. ÇELİK, Tuncay and KAPLAN, Muhittin (2010). “Türk Bankacılık Sektöründe Etkinlik ve Rekabet: 2002-2007”, Sosyoekonomi, Cilt 13, Sayı 13, ss. 7-28. GAJUREL, D. Prasad and PRADHAN, R. Shyam (2012). “Concentration And Competition in Nepalese Banking”, Journal of Business, Economics & Finance, Vol.1 (1), ss. 5-16. KURUL, D. Mutluer (2011). “Türk Bankacılık Sektörüne İlişkin Yoğunlaşma ve Hâkimiyet Göstergeleri”, Türkiye Cumhuriyeti Merkez Bankası Ekonomi Notları, Sayı 5, ss. 1-7. MATRAKU, Doriana and GJOKA, Eri (2014). “Competition in Albanian Banking Sector”, International Journal of Business and Management, Vol. II (1), ss. 18-28. ÖZCAN, Abdulvahap (2012). “Türkiye’de Ticari Bankacılık Sektöründe Rekabet Düzeyinin Belirlenmesi (2002-2009)”, C.Ü. İktisadi ve İdari Bilimler Dergisi, Cilt 13, Sayı 1, ss. 195-211. ÖZTÜRK, Nurettin, BARIŞIK, Salih and DARICI H. Kılıç (2010). “Gelişmekte Olan Piyasalarda Finansal Derinleşme ve Büyüme İlişkisi: Panel Veri Analizi”, ZKÜ Sosyal Bilimler Dergisi, Cilt 6, Sayı 12, ss. 95–11. RİMAVİČİŪTĖ, Sandra and MANTAS Vilys (2014). “Assessment of Competition in the Banking Sector of Lithuania”, Science – Future of Lithuania / Mokslas – Lietuvos Ateitis, Vol 6, No 1, ss. 56-63. UYSAL, Erkan and ÖZÜTÜRK, Bülent (2005). “Türk Menkul Kıymet Yatırım Fonlarında Yoğunlaşma”, İstanbul Üniversitesi İktisat Fakültesi Maliye Araştırma Merkezi Konferansları, 47. Seri, ss. 273-285. UZGÖREN, Ergin and TARHAN, Ali (2012). “Türkiye’de Bankacılık Piyasasında Yoğunlaşma - CR4 ve Herfindhal-Hirsman Endeksleri ile Analiz”, Akademik Bakış Dergisi, Sayı 28, ss. 1-16. ÜNAL, Müge (2014). “ Türkiye’de Finans Sektöründe Bankacılığın Yeri”, İzmir Ticaret Odası Ar-Ge Bülteni, ss. 8-14 YAĞCILAR, G. Göçmen (2011). Türk Bankacılık Sektörünün Rekabet Yapısının Analizi, Ankara: BDDK Kitapları. YAZICI, Tolga. (2013). Medya Mülkiyetine İlişkin Düzenlemeler Ve Dünyadaki Örnekler Bağlamında Türkiye İçin Bir Medya Mülkiyeti Modeli Önerisi, Yayımlanmış Doktora Tezi, İstanbul: Maltepe Üniversitesi Sosyal Bilimler Enstitüsü. http://www.okanacar.com/2013/04/herfindahl-endeksi-ve-ulkemiz-bankaclk.html http://www.rekabet.gov.tr/File/?path=ROOT%2F1%2FDocuments%2FUzmanl%25c4%25b1k%2BTezi%2F11selvikocabay.pdf