UBS 2004 Natural Gas & Electric Utilities Conference Gerry Anderson February 12, 2004 New York, NY.
Upload
vuongnguyetCategory
view
214download
0
1
Con Edison, Inc. UBS Natural Gas & ElectricUtilities Conference
New York, NYFebruary 28, 2007
2
Forward-Looking Statements
This presentation contains certain forward-looking statements of future expectations and financial measures not determined in accordance with Generally Accepted Accounting Principles (non-GAAP) financial measures. Actual results might differ materially from those projected in the forward-looking statements because of factors such as those identified in reports the company has filed with the Securities and Exchange Commission.
For more information, contact:
Jan Childress, Director, Investor Relations 1-212-460-6611Ellen Socolow, Manager, Investor Relations 1-212-460-4986
www.conEdison.com

3
Long Tradition, Solid Performance
Con Edison, Inc. Parent Net Loss: $32 million – (4)%
Con Edison of New YorkNet Income: $686 million – 93%
Orange and RocklandNet Income: $45 million – 6%
Con Edison SolutionsNet Income:
$8 million – 1%
Con Edison Energy
Net Income:$1 million – 0%
Con Edison Development
Net Income:$30 million – 4%
Regulated Utilities
Competitive Energy Businesses
Note: For the year ended December 31, 2006
4
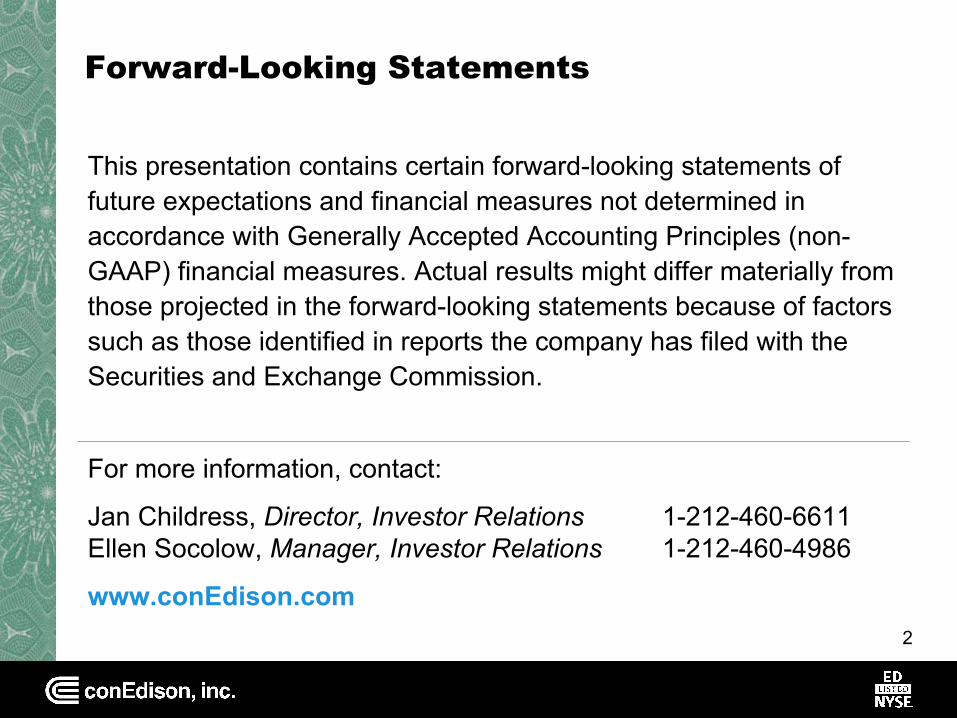
Competitive Energy Business Focus
• Own or lease1,668 MW of generation
• Leases and investments
Con Edison Development
• Asset optimization
• Fuel management
• Retail supply management
• Wholesale supply– Standard offer service
Con Edison Energy
• Commodity Supply– Commercial, industrial,
governmental, residential
– Green power
– Aggregation
• Energy Services– Government performance
contracting
– Utility based DSM programs
– Utility area-wide contracts
Con Edison Solutions
Asset ownershipand operation Wholesale Retail
2006 Net Income$8 million (reported)
$28 million (excluding MTM)
2006 Net Income$1 million (reported)
$2 million (excluding MTM)
2006 Net Income$30 million (reported)
$31 million (excluding MTM)

5
Overview of Con Edison DevelopmentCon Edison Development
1,6681,778Total Capacity
335335Gas100.0%PeakingMarylandRock Springs
330330Gas100.0%PeakingNew JerseyOcean Peaking
156156Gas/Oil100.0%PeakingMassachusettsCEEMI
189236 (c)Gas/Oil80.0%IntermediateNew JerseyLakewood
125125 (d)Gas/Oil/Hydro100.0%IntermediateMassachusettsCEEMI
2042Oil49.5%IntermediateGuatemalaGENOR
1429 (b)Gas48.0%BaseMichiganADA
499525Gas/Oil95.0%BaseNew HampshireNewington (a)
Owned Capacity(in MW)
Aggregate Capacity(in MW)
Fuel SourceOwnershipPower PlantTypeBase/Peak/Intermediate
LocationName
(a) Leased pursuant to a consolidated lease transaction.
(b) Subject to a power purchase agreement expiring in 2026.
(c) Subject to a power purchase agreement expiring in 2014.
(d) Includes 18MW from five small hydroelectric facilities.
Newington, NH1
West Springfield, MA2
Lakewood, NJ3
Rising Sun, MD4
12
3
4
NEISO
NYISO
PJMISO

6
Con Edison Solutions Highlights
• Ninth largest ESCO nationwide
• Profitable every year since 2001
• Provides commodity service in eight states and the District of Columbia
• 200,000 plus customers
• 10.6 million MWhrs sold in 2006 –7% greater than 2005
• Supplies green power in New York and Massachusetts
Con Edison Solutions
NY
DEMD
NJ
CT
NH
MA
TX

7
Regulated Business Service Area
• 3.2 million electric customers
• 1.1 million gas customers
• 1,800 steam customers
• 709 MW of regulated generation
• 36,000 miles of overhead transmission and distribution lines
• 93,000 miles of underground transmission and distribution lines
• 4,300 miles of gas mains
• 105 miles of steam mains and lines
Con Edison of New York

8
New York City Job Growth By Sector — 2006Con Edison of New York
16,300
8,200
6,900
6,200
5,200
3,300
3,200
(1,300)
(2,500)
Education and health services
Financial services
Leisure and hospitality
Professional and business services
Construction
Trade, transportation, and utility
Other services
Information
Manufacturing
Source: New York State Department of Labor

9
New York City and WestchesterHousing Permits
Con Edison of New York
2004
8,652
Represents New32-Year Record for
New York City
30,000
25,000
20,000
15,000
10,000
5,000
0
Number of New Dwelling Units
20032002200120001999199819971996 20062005
35,000
40-year average of 14,434 for New York City
Source: U.S. Census Bureau
30,927
2005 – 2006 marked the highest two-year stretch since the first reliable construction figures became available in 1965.
31,5991,006
1,493
New York City Westchester
1,364

10
New York City Is the Most Energy Efficient Large City in America
Con Edison of New York
4,696New York
Source: Energy Velocity; U.S. Census 2000
San Francisco
Chicago
Phoenix
Houston
Dallas
6,753
8,143
13,344
14,542
16,116
New York
San Francisco
Chicago
Philadelphia
Atlanta
Los Angeles
Houston
Dallas
53%
31%
26%
25%
15%
10%
6%
5%
Average annual residential electricity usage by city — 2000 – 2005
Incidence of commuters using public transportation — 2000
KWh/customer

11
Growth in Electric Peak Usage 2006 – 2011 Five-Year Compounded Annual Growth
Con Edison of New York
> 3.0%
> 1.5% and ≤ 3.0%
≤ 1.5%
New York City WestchesterCompounded Growth Rate

12
System Peak Demand ForecastCon Edison of New York
MW
20060
2,000
4,000
6,000
8,000
10,000
12,000
14,000
16,000
2007 2008 2009 2010 2011 2012 2013 2014 2015 2016
New York City Westchester
13,141
1,797
11,344
13,575
1,795
11,780
13,800
1,825
11,975
14,000
1,850
12,150
14,200
1,875
12,325
14,375
1,895
12,480
14,550
1,905
12,645
14,700
1,920
12,780
14,850
1,935
12,915
14,975
1,945
13,030
15,100
1,960
13,140

13
Major Substation Construction Program 1948 – 2016
Con Edison of New York
Planned Construction
Transmission Switching Station
DistributionSubstation
1948
1950
1952
1954
1956
1958
1960
1962
1964
1966
1968
1970
1972
1974
1976
1978
1980
1982
1984
1986
1988
1990
1992
1994
1996
1998
2000
2002
2004
2006
2008
2010
2012
2014
2016
14
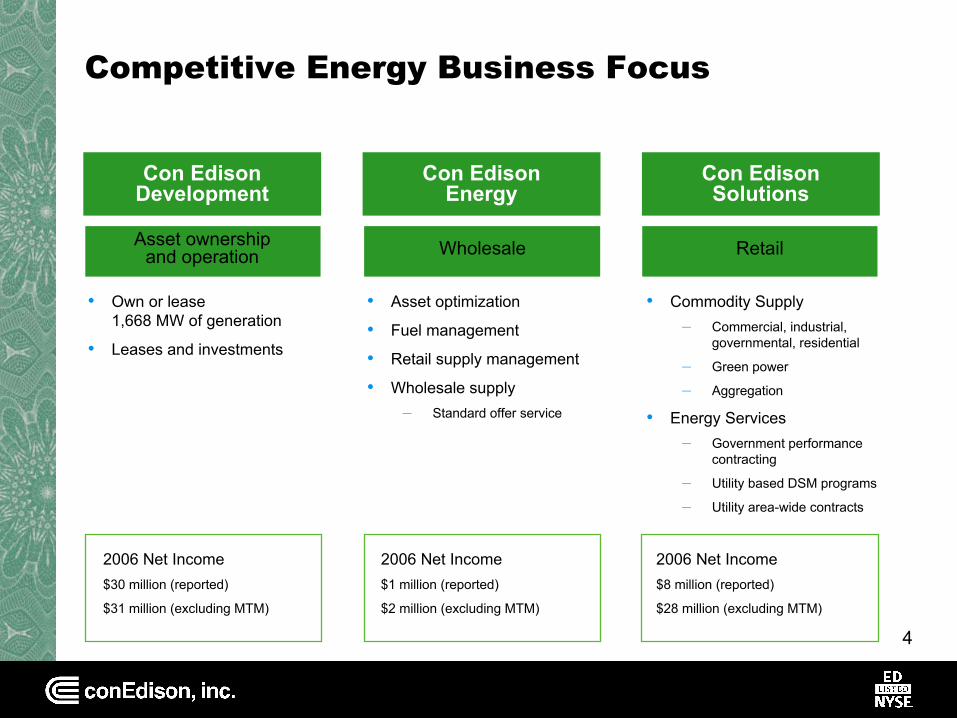
M29 Transmission Line Project
• 9.5-mile, 345-kV line connecting Westchester with upper Manhattan
• Will add 300 MW to New York City’s import capability– Improve the system’s reliability
– Allow increased delivery of lower-cost power to customers
• Will serve portions of Bronx and upper Manhattan
• Expect to begin construction in 2007 and go in service by 2009
• The project is pending regulatory approvals
Con Edison of New York

15
Unparalleled ReliabilityCon Edison of New York
Interruptions per 1,000 customers served, excluding major storms
National(USA)
1,200
1,000
200
0New York State
(w/o Con Edison of NY)Con Edison of NY
(non-network)Con Edison of NY
(overall)Con Edison of NY
(network)
2005 2006
800
600
400

16
System Challenges
• High cost of building and maintaining system
• Low equipment utilization
• Real estate scarcity and price
• Implementing emerging technology, including distributed generation
• Office buildings constructed in the 1960s planned for average loads of 4-5 watts per square foot
• Office buildings today are experiencing average loads of8-9 watts per square foot
Con Edison of New York

17
Evolution of Electric Delivery System
• 1900s – 1920s– Manhattan served by multiple electric
companies
• 1920s – 1940s– Creation of secondary 120V network
systems
– Motivation for network design: load management using substations
• 1940s – 1960s– Continued to break up Manhattan into
more, smaller networks
• 1960s – Today – Design networks and area substation
supplies as second contingency
– Manually alter network sizes as required to defer installing assets
• Today – Second contingency design of
34 networks in Manhattan supplied by24 area substations
Con Edison of New York
1900 1961 2006
Generating StationTransmission SubstationArea Substation

18
System of the FutureCon Edison of New York
Area Substation
Feeders
Network Customers
Transmission
Conventional Design System of the Future Concept
Switch
Shared Network Load
Shared Substation Transformers

19
Regulated Business Service Area
• 296,000 electric customers
• 126,000 gas customers
• 5,800 miles of transmission and distribution lines
• 1,830 miles ofgas mains
Orange and Rockland
Orange and Rockland
Rockland Electric
Pike County Light & Power
New York
Pennsylvania
New Jersey
Connecticut
New York City

20
New Development Spurs 2.3% Annual Growth in Electric Peak Usage
Orange and Rockland
Brigadoon housing development in Highland Mills, Orange County
Harbors at Haverstraw development in Rockland County

21
Major Substation Construction Program 1999 – 2014
Orange and Rockland
Planned Construction
1999
2000
2001
2002
2003
2004
2005
2006
2007
2008
2009
2010
2011
2012
2013
2014
Transmission Switching Station
DistributionSubstation

22
Building Substations to Meet Growing DemandOrange and Rockland
Darlington Substation, Ramsey, NJ
Orangeburg Substation, Orangeburg, NYChester Substation, Chester, NY

23
Financial Overview
• Proven track record in regulatory relations– Current recovery of all energy costs
– Reconciliation of major uncontrollable costs
– Weather normalization for gas
• Stable balance sheet
• Earnings growth consistent with conservative,low-risk business model
Strategy Provide current income and consistent total returns for shareholders at low risk.

24
Infrastructure InvestmentCon Edison of New York
Millions
2008Forecast
$1,911
2003Actual$1,167
2005Actual$1,541
1,700
Common Plant
Steam
Gas
Electric
2006Actual$1,782
2004Actual$1,235
1,6001,5001,4001,3001,2001,1001,000
900800700600500400300200100
0
Depreciation
1,900
2007Budget$1,870
1,800
2009Forecast
$1,790
$2,000

25
Infrastructure InvestmentOrange and Rockland
Gas
Electric
2003Actual$71
2004Actual$79
2005Actual$87
2006Actual$110
110
90
80
70
60
50
40
30
20
10
0
Depreciation
2008Forecast
$127
Millions
100
2007Budget$125
120
$130
2009Forecast
$125

26
Growing Rate Base and Solid Balance Sheet(as of December 31, 2006)
Rate Base ($ millions)
Orange and Rockland
Pike Gas $ 1Pike Electric $ 9Rockland Electric $ 140O&R Gas $ 210O&R Electric $ 375
Con Edison of New York
Electric $ 10,415Gas $ 2,271Steam $ 1,340
Total Rate Base $ 14,761
Long-TermDebt
50.2%$8,298
Capital Structure ($ millions)
Target Equity Ratio 48%–50%
CommonEquity48.5%$8,004
Preferred Stock1.3%$213
• Expected issuances of new equity: $500 million - $700 million (above issuances through DRIP and employee stock plans).
• Expected issuances of new l-t debt: $900 million - $1.3 billion.
2007

27
Drivers for Change in Earnings Per Share
• Return to normal weather
• Queens outage
• Other non-recurring items
• Sales growth
• Rate increases
• Regulatory amortizations
• Incremental capital carrying charge
• Competitive energy businesses
• Dilution
2006 2007
$3.05
$3.25
High
$3.05
Low

28
A Compelling Dividend Record: 33 Consecutive Years of Dividend Increases
Annualized Dividend 1975 - 2007
$0.50
$1.00
$1.50
$2.00
$2.50
1975
1977
1979
1981
1983
1985
1987
1989
1991
1993
1995
1997
1999
2001
2003
$0.30
$2.32One of two utilities in S&P 500 with 25 or more consecutive years of dividend increases
2005
2007
$0.00

29
Total Return to Shareholders
Source: Bloomberg
Average Annual Total Return for Period Ended December 31, 2006
10 Year 25 Year5 Year
9.1
6.2
11.1
8.4
14.613.4
Con Edison
S&P 5009.1
15.8
1 Year
30
Con Edison’s Investment Thesis
• Low-risk T&D model
• Strong balance sheet
• “A” credit rating
• Deep management
• Superior dividend track record

31
Appendix

32
Con Edison of New York
Electric Apr. 2005 – Yr. 1 – $9.3 b Yr. 1 – $104.6 m Yr. 1 – $128 m $60 m of 11.40% 11.4% – 13% – 50/50Mar. 2008 Yr. 2 – $9.6 b Yr. 2 – None Yr. 2 – $173 m annual TCC >13% – 25/75
Yr. 3 – $10.3 b Yr. 3 – $220.4 m**** Yr. 3 – $249 m revenues
Gas Oct. 2004 – Yr. 1 – $2.0 b Yr. 1 – $46.8 m $41 m $35 m of 11.75% 50/50Sept. 2007 Yr. 2 – $2.1 b Yr. 2 – None over 3 yrs annual non-
Yr. 3 – $2.2 b Yr. 3 – None firm revenues
Steam Oct. 2006 – Yr. 1 – $1.3 b None $53 m — 11.00% 11% – 12% – 50/50 Sept. 2008 Yr. 2 – $1.3 b over 2 yrs >12% – 25/75
Orange and Rockland
Gas Nov. 2006 – Yr. 1 – $235 m Yr. 1 – $6.5 m $(3) m — 11.00% 11% – 12% – 50/50 Oct. 2009 Yr. 2 – $242 m Yr. 2 – $6.5 m over 3 yrs 12% – 14% – 35/65
Yr. 3 – $251 m Yr. 3 – $6.3 m >14% – 0/100
Summary of Rate Plans
Effective Rate Rate Amortization Other ROE Sharing Earnings Sharing Terms ***Period Base * Increases ** of Credits Increases Threshold (Shareholders/Customers)
* Under Con Edison of New York’s electric rate plan, the company is allowed to accrue a full return on increases in net electric transmission and distribution plant above the levels reflected in rates. For the period from April 1, 2005 through December 31, 2006, actual net transmission and distribution has exceeded the net transmission and distribution reflected in rates by $1 billion. The company accrued revenues of $115 million and $38 million in 2006 and 2005, respectively, to reflect the revenue requirement impact of net transmission and distribution difference.
** The Orange and Rockland gas rate plan provides for rate increases in base rates of $12 million in the first year, $0.7 million in the second year, and $1.1 million in the third year. To phase in the effect of the increase for customers, the rate plan provides for O&R to accrue revenues for, but defer billing to customers of, $5.5 million of the first rate year increase by establishing a regulatory asset which, together with interest, will be billed to customers in the second and third years. This chart reflects the phase-in of those rate increases.
*** Subject to limitation for cost reconciliations.
**** $60 million accrued to income in rate year two.
33
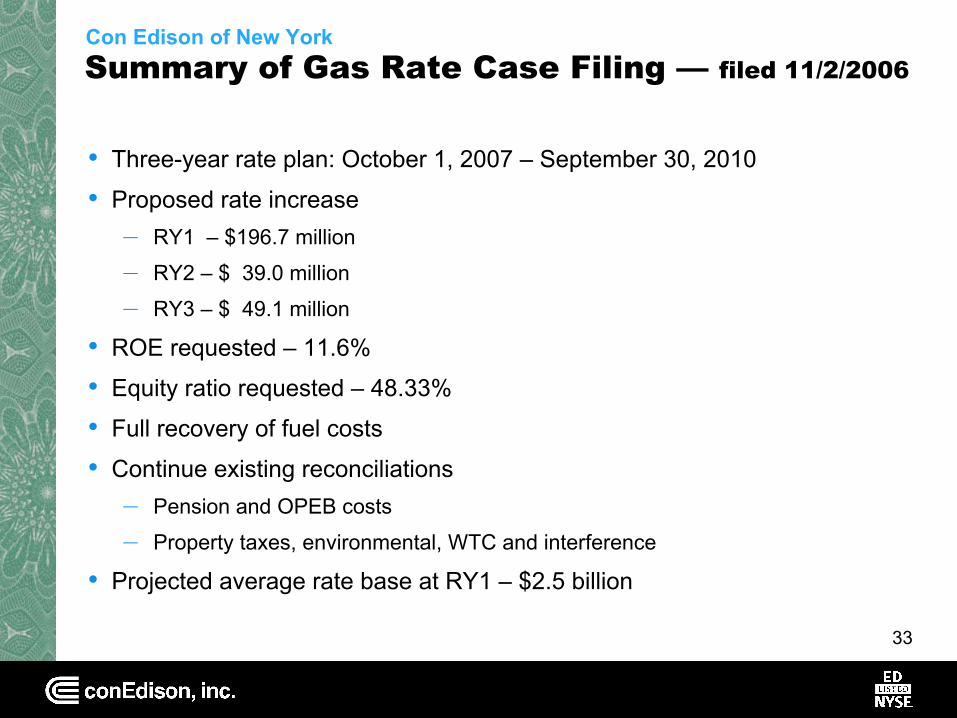
Summary of Gas Rate Case Filing — filed 11/2/2006
• Three-year rate plan: October 1, 2007 – September 30, 2010
• Proposed rate increase– RY1 – $196.7 million
– RY2 – $ 39.0 million
– RY3 – $ 49.1 million
• ROE requested – 11.6%
• Equity ratio requested – 48.33%
• Full recovery of fuel costs
• Continue existing reconciliations– Pension and OPEB costs
– Property taxes, environmental, WTC and interference
• Projected average rate base at RY1 – $2.5 billion
Con Edison of New York

34
Summary of Rockland Electric Rate Case Filing
• Filed on June 30, 2006 with New Jersey BPU
• One-year rate plan: April 2007 through March 2008
• Proposed rate increase of $13.2 million, or 7.5%
• ROE requested – 11.0%
• Equity ratio requested – 49.7%
• Proposed reconciliations– Pension and OPEB costs
• Projected T&D rate base at June 2007 – $153.2 million
Orange and Rockland

35
Summary of Gas Rate Plan
• Three year rate plan: November 1, 2006 – October 31, 2009
• Rate increases to be phased in over three years– RY1 – $6.5 million
– RY2 – $6.5 million
– RY3 – $6.3 million
• Continued full recovery of fuel costs
• Reconciliation of pension and OPEB costs, property taxes, and environmental costs
• 9.8% authorized ROE with earnings sharing threshold of 11%– Based on actual equity ratio – up to 50%
– Deferral limitation for earnings above 11%
• Potential penalties of $1.2 million geared toward gas safety performance and customer service
Orange and Rockland

36
Profit Model For a Cost-of-ServiceRate-Regulated Utility
• Capital spending leads to rate base growth, which generallyleads to net income growth
• Growth in rate base requires significant external financing
Debt Percent of Capital
Preferred Percent
of Capital
Common Percent
of Capital
Rate Base
Deferred taxes-Working capital+Regulatory items+/-
+
+
+
+
InterestRate
DividendRate
Cost ofEquity Net Income
Recovered
Recovered
Net Plant

37
Growing Earnings Through Infrastructure Investment — An Illustration
• We spend $1.8 billion each year in cap ex
• One-third, or nearly $600 million, is funded through depreciation
• The balance of $1.2 billion is funded 50/50 with debt/equity
• About one-third of the equity funding requirement is met with retained earnings
• Earnings on the total equity investment at 10% would be approximately $60 million

38
Con Edison’s Financing Activities
• Issued $447 million in common stock in September 2006
• Raised $120 million in equity through DRIP and employee stock plans
• Issued $1,200 million in Con Edison of New York bonds for general purposes
• Issued $500 million in Con Edison of New York bonds to redeem maturing bonds
• Issued $75 million of O&R bonds for general purposes
• Expected issuances of new equity: $500 million - $700 million (above issuances through DRIP and employee stock plans)
• Expected issuances of new l-t debt: $900 million - $1.3 billion
2006 2007

39
Unparalleled ReliabilityCon Edison of New York
2005 Customer Interruption Rate
0.00
0.140.25
0.50
0.75
1.00
1.25
1.50
1.75
2.00
2.25
2.50
0.410.50
0.64
0.79 0.81 0.84 0.90
1.11 1.13 1.18 1.21 1.24 1.261.37 1.39
1.811.88
2.41
Average Rate = 0.97
1 2 3 4 5 6 7 8 9 10 11 12 13 14 15 16 17 18 19Con Edison
Major Utilities
Source: Salt River Project – Large City Survey

40
The Electric System
Generating Station(electricity generated at 13.8 to 22.0 kV)
Transformers(voltage stepped up to transmission voltage)
Transmission Substation
Area Substation(voltage stepped down to distribution voltage)
Transformers(voltage stepped down to 480, 208, or 120 V)
Feeders
Connection To Others
Network Customers(residential, commercial, industrial, hospitals, schools, and street and traffic lights)
Radial Customers
Transmission Distribution
Con Edison of New York

41
Meeting Customers’ Needs New York City Area Substation Capacity – 2006
Above 100%
95% to 100%
90% to 94%
below 90%
Con Edison of New York

42
Meeting Customers’ Needs New York City Area Substation Capacity – 2011
Con Edison of New York
Without Capital Projects With Capital Projects
Above 100%
95% to 100%
90% to 94%
below 90%

432002 – 2006 volumes are weather normalized
Firm Gas Delivery Volumes ForecastCon Edison of New York
BCF
2003 2004 2005 20062002 2007
98
101 101103 104
106
2008
109
Forecast

44
New York City EmploymentCon Edison of New York
2005
3,600
3,400
3,200
3,000
Thousands
20042003200220012000199919981997 2006
3,800
Source: New York State Department of Labor

45