Computing Camp for Junior College & High School Students ...bleong/stereo/sworkshop.pdf · 1...
13
1 Computing Camp for Junior College & High School Students Stereogram Generation Workshop organized by School of Computing National University of Singapore Welcome to NUS! In this workshop, you will learn about how stereograms and anaglyphs are created and try your hand at creating some stereograms yourself! In the process, you will also learn a simple programming language called Scheme and you will hopefully come to appreciate that programming is fun! :-) Introduction To begin, we first need to understand how our eyes work to produce stereo vision, i.e. vision with a perception of depth. We see 3D in the world around us because we each have two eyes that are spaced a small distance apart horizontally. When we look at an object, both eyes will converge on the object but due to the eyes’ horizontal separation, each eye will see a slightly different perspective of the object. The difference between the images seen by each eye is known as horizontal disparity. Why then don’t we see double all the time since our left and right eyes receive different images at each instant? It must feel terrible if we do. In a wonderful process known as stereopsis, our brains will fuse the images from the left and right eyes together and infer depth information in the process. The earliest stereograms were made from a pair of photographs which were specially taken so that the photographs capture the slight horizontal disparity perceived by our eyes. Stereoscopes are devices that present the correct image to each eye using mirrors or prisms. Anaglyph images are another popular stereogram technology. You may have seen such images in comic books or 3D movies. The image meant for the left eye is printed in red and the image meant for the right eye is then superimposed over the red image using cyan. Anaglyph images look to the naked eye quite like what you will see when you experience double-vision. However, special “anaglyph glasses” which filter red images to one eye and cyan images to the other can be used to provide the appropriate image to each eye. The stereograms that we are more interested about are the same ones popularised by the “Magic Eye” series of books which have fascinated many—have you seen them? These stereograms are known as autostereograms or Single Image Stereograms (SIS) because all of the depth informa- tion in the stereogram is contained within one image, in contrast to the pairs of images (stereo pairs) used by earlier methods. Figure 1 shows a sample autostereogram. How to view stereograms Two mechanisms are at play to help us see the world around us: first, our eyes roll inwards towards each other so that each eye points towards the same object (convergence). Second, our eye lenses adjust to get a clear image (focus). The trick to viewing stereograms lies in decoupling these two mechanisms so that our eyes are converged at a point behind the stereogram picture so
Transcript of Computing Camp for Junior College & High School Students ...bleong/stereo/sworkshop.pdf · 1...

1
Computing Camp for Junior College & High School StudentsStereogram Generation Workshop
organized by
School of ComputingNational University of Singapore
Welcome to NUS! In this workshop, you will learn about how stereograms and anaglyphs arecreated and try your hand at creating some stereograms yourself! In the process, you will alsolearn a simple programming language called Scheme and you will hopefully come to appreciatethat programming is fun! :-)
Introduction
To begin, we first need to understand how our eyes work to produce stereo vision, i.e. visionwith a perception of depth. We see 3D in the world around us because we each have two eyesthat are spaced a small distance apart horizontally. When we look at an object, both eyes willconverge on the object but due to the eyes’ horizontal separation, each eye will see a slightlydifferent perspective of the object. The difference between the images seen by each eye is knownas horizontal disparity. Why then don’t we see double all the time since our left and right eyesreceive different images at each instant? It must feel terrible if we do. In a wonderful processknown as stereopsis, our brains will fuse the images from the left and right eyes together and inferdepth information in the process.
The earliest stereograms were made from a pair of photographs which were specially taken sothat the photographs capture the slight horizontal disparity perceived by our eyes. Stereoscopesare devices that present the correct image to each eye using mirrors or prisms.
Anaglyph images are another popular stereogram technology. You may have seen such images incomic books or 3D movies. The image meant for the left eye is printed in red and the image meantfor the right eye is then superimposed over the red image using cyan. Anaglyph images look tothe naked eye quite like what you will see when you experience double-vision. However, special“anaglyph glasses” which filter red images to one eye and cyan images to the other can be usedto provide the appropriate image to each eye.
The stereograms that we are more interested about are the same ones popularised by the “MagicEye” series of books which have fascinated many—have you seen them? These stereograms areknown as autostereograms or Single Image Stereograms (SIS) because all of the depth informa-tion in the stereogram is contained within one image, in contrast to the pairs of images (stereopairs) used by earlier methods. Figure 1 shows a sample autostereogram.
How to view stereograms
Two mechanisms are at play to help us see the world around us: first, our eyes roll inwardstowards each other so that each eye points towards the same object (convergence). Second, oureye lenses adjust to get a clear image (focus). The trick to viewing stereograms lies in decouplingthese two mechanisms so that our eyes are converged at a point behind the stereogram picture so

2
Figure 1: A sample stereogram. When viewed with the right technique, a shape will appear to“pop out .” Can you see the stereogram and describe the shape?
the eyes are looking almost in parallel at the picture, but at the same time focused on the picture.This way of viewing stereograms is known as wall-eyed viewing.
One way to view stereograms is to imagine that you are looking at an object some distance behindthe stereogram picture. It feels somewhat like looking at your reflection in glass. When you arelooking at your reflection, your eyes are actually converged at a point behind the glass pane. Ifyou switch between looking at the glass pane itself to looking at your reflection, then you wouldhave gotten a sense of what it feels like to look at an object behind the stereogram. If you cando this, you will see double after some time because your eyes are looking at different places inthe picture. Hopefully your brain will put two and two together and voila! You will see beautiful 3Dshape pop out at you.
Another popular way to view stereograms is to bring the picture close to your face. It’s best to buryyour nose into the picture. At such a close distance, your eyes give up on trying to converge uponan object and roll back into wall-eyed viewing positions, just like if you were looking at an objectextremely far away. Now, slowly pull the picture away from your face, or your face away from thepicture, but keep the same relaxed sensation in your eyes so that you see double. At some point,you will see your stereogram. Try to see the stereogram in Figure 1.
It is not natural for us to view stereograms because decoupling focus from convergence goesagainst our instincts and serves no useful purpose in daily life. Early humans could ill afford to

3
Object
A
B
C D Eimage plane
E
Left eye Right eye
z
z=0
Figure 2: Points of projection from a 3D object.
decouple convergence from focus by mistake just when they were chasing their dinner or runningaway from a lion!
However, it is not that hard to view stereograms too — it just takes a bit of practice, like learninghow to swim or how a ride a bicycle. Remember to try easy, not hard; viewing stereograms doesnot involve straining your eyes. Don’t worry if it does not come to you naturally — you do not needto be able to view stereograms to do the next exercise.
How do stereograms work?
So, how do autostereograms work? We treat the stereogram as points of projection from the 3-Dobject onto an image plane situated between the object and the eyes, as shown in Figure 2. Sincepoints A and C are projected from the same point on the object (to different eyes), they shouldhave the same color. Similarly, points B and D should have the same color too. Note that by thesame reasoning, point E must have the same color as point C and thus, A, C and E must be of thesame color. If we continue this process for the whole image plane, we will eventually determinethe groups of points that are constrained to be of the same color. We can then either allocatecolors randomly (by which we will get a stereogram similar shown in Figure 1) or allocate colorsaccording to some pattern or image.
An important note that applies to all stereogram generation methods: we need only work with onescan line at a time. A scan line is a line on the image plane that is horizontal with respect to thetwo eyes (see Figure 3). This is true because all pairs of projected points (from the same point onthe object) form line segments that are parallel to LR (the line segment between the two eyes).

4
x
y
C
A
B
Left eye
Right eyescan line
Figure 3: AB and BC are parallel to LR.
Theory behind Stereogram Generation
As we need to model 3-dimensional objects, we need to use coordinates x, y and z. Let x be thehorizontal coordinate from the left eye to the right eye and y be the vertical coordinate, where bothx and y are parallel to the image plane (see Figure 3). z will be the normal that is perpendicularto the image plane. It is zero on the image plane, positive when between the eyes and the imageplane, and negative beyond the image plane.
����
����
����������������������������������������������������������������������������������������������������������������������������������������������������������������������������������������������������������������������������������������������������������������������������������������������������������������������������������������������������������������������������������������������������������������������������������������������������������������������������������������������������������������������������������������
����������������������������������������������������������������������������������������������������������������������������������������������������������������������������������������������������������������������������������������������������������������������������������������������������������������������������������������������������������������������������������������������������������������������������������������������������������������������������������������������������������������������������������������
L’ R’
EL R
Figure 4: Simplification of Model: Viewer views “straight” at every point on the object.
To simplify the computations, we shall assume that the eyes look “straight” at every point in thestereogram (see Figure 4). The rationale behind this model is that the viewer may not have anypreference for viewing positions. This model will also come in handy when we do visibility tracing.

5
By similar triangles, separation of two points constrained to be the same color,
s = − zE
D − z=
zE
z −D
This separation is called the stereo separation, and it is an important value that we will use in allstereogram generation algorithms.
Given the value for z for a particular point on a 3D object, we can calculate the stereo separationand find the two points which must be constrained to having the same color on the stereogramimage (see Figure 4).
A 3D object can be described by a function f(x, y) that returns the z value given a point (x, y).This function is sometimes referred to as a z-function. A 2D greyscale image can be used as agraphical representation of a z-function. Such images are known as depth maps. The lightness ordarkness of each point on the depth map represents its depth in the 3D scene.
The basic theory behind stereograms is very simple: groups of points which are constrainedto have the same color. In our algorithm, we simply allocate random colors to groups of con-strained points and so our stereograms are also known as Single Image Random Dot Stereograms(SIRDS).
Getting Started
Now you are ready to try your hand at creating your own stereograms. We will be using a programwritten in the Scheme programming language. Download the file stereogram.scm from the URLthat is written on the whiteboard. Next, double-click on the file and it should start DrScheme.
When you first start up DrScheme, you will need to use the Languagemenu’s Choose Language...option to select the “Pretty Big” language. Then, click on “Ok”. The language currently selectedwill be indicated at the lower left corner of your DrScheme window so you will know if you havedone this correctly.
DrScheme is divided into two portions. You should type in your code towards the end of the topportion and press the “Run” button at the top right of DrScheme. Alternatively, you can use thebottom portion which is the interactive window, but note that your work will not be saved. Whenyou press “Run”, another window will appear. This window is called the viewport.

6
Manipulating the Depth Maps
The following is a list of the basic building blocks that you can use to build your stereogram:
• rcross-bb
• sail-bb
• corner-bb
• nova-bb
• black-bb
• white-bb
• circle-bb
• heart-bb
• spiral-bb
You can use the show command to see these basic building blocks. For example, you can paintrcross-bb to the viewport with the following command:
(show rcross-bb)
Don’t forget to clear the viewport when necessary with (clear).
As explained, the following procedures are available for you to manipulate these basic buildingblocks:
• (quarter-turn-right <obj>): Turns an object 90 degrees clockwise.
• (turn-upside-down <obj>): Turns an object 180 degrees.
• (quarter-turn-left <obj>): Turns an object 90 degrees anti-clockwise.
• (flip-horiz <obj>) : Flips an object horizontally.
• (flip-vert <obj>) : Flips an object vertically.
• (stack <obj1> <obj2>) : Stacks <obj1> on top of <obj2>.
• (beside <obj1> <obj2>) : Puts <obj1> beside (left of) <obj2>.
• (stack-frac <fraction> <obj1> <obj2>) : Stacks <obj1> on top of <obj2> such that<obj1> takes up the specified fraction of the space.

7
• (make-cross <obj>) : Makes a cross out of the object.
• (repeat-pattern n <pattern> <obj>): Repeats an pattern n times.
• (stackn n <obj>): Stacks n objects on top of each other.
• (nxn n <obj>): Creates an n× n grid of the specified object.
Manipulating the shapes in 3D
In our depth maps, the convention we adopt is that the darker areas are closer to you and lighterareas are further from you. The following diagram illustrates how depth maps are interpreted.If you can somehow view the 3D scene represented by the nova-bb pattern from an isometricperspective (use your imagination), the following diagram is what you will see:
The nova-bb pattern will appear to be floating above the background.
Let us take a look at a slightly more complicated depth map and its isometric projection:
In this depth map, the nova-bb pattern is in black (darker) and hence is closer to you than thercross-bb pattern, which is in grey (lighter).
Now, let us try generating our first stereogram. Use the command stereogram instead of showto generate stereograms instead of depth maps. For example, make sure the viewport is clearedusing (clear), then run the command

8
(stereogram nova-bb)
to generate the stereogram for nova-bb (see Figure 1).
It’s nice to be able to generate and view stereograms, but knowing how to interpret depth maps isenough to do this exercise. To do anything useful, you will need the following three new combina-tors: overlay, overlay-frac and scale.
overlay does exactly what its name suggests: it overlays two painters given as arguments. Forexample,
(show (overlay sail-bb rcross-bb))
overlays sail-bb painter on top of rcross-bb.
Each painter now occupies half of the depth range of the resulting depth map.
Here is another interesting example: the following command overlays white-bb over heart-bb.
(show (overlay white-bb heart-bb))
This results in the following depth map:
What happens when we nest overlay commands?
(show (overlay (overlay nova-bb heart-bb) rcross-bb))
9
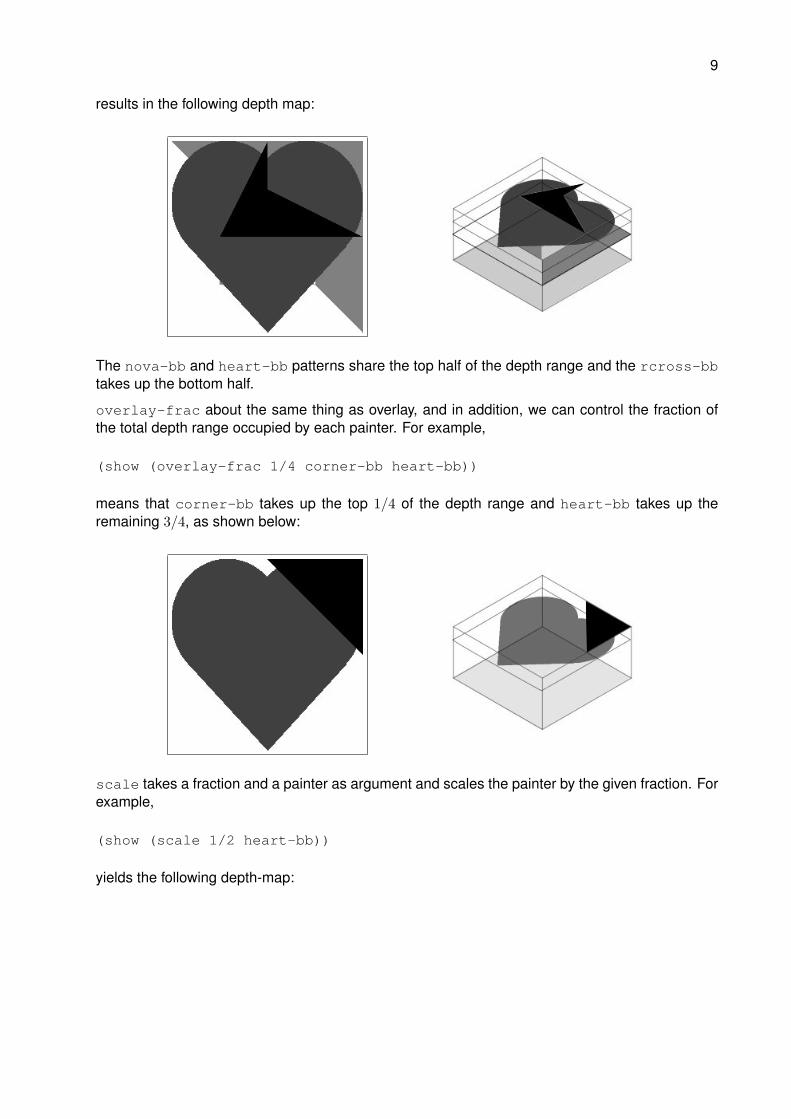
results in the following depth map:
The nova-bb and heart-bb patterns share the top half of the depth range and the rcross-bbtakes up the bottom half.
overlay-frac about the same thing as overlay, and in addition, we can control the fraction ofthe total depth range occupied by each painter. For example,
(show (overlay-frac 1/4 corner-bb heart-bb))
means that corner-bb takes up the top 1/4 of the depth range and heart-bb takes up theremaining 3/4, as shown below:
scale takes a fraction and a painter as argument and scales the painter by the given fraction. Forexample,
(show (scale 1/2 heart-bb))
yields the following depth-map:

10
Other ways to manipulate depth maps
a. Persian Carpets. The following depth maps can be created with the command persian:
with:
(show (persian 5 (make-cross rcross-bb)))
and
(show (persian 9 (make-cross rcross-bb)))
respectively. Experiment with persian and see what sorts of patterns you can create.
b. Another interesting command is tree, which creates a tree. The following command willcreate a tree with 4 levels of circles:
(show (tree 4 circle-bb))

11
Loading a depth map from an image file
In addition to creating images from the basic building blocks we have provided, you can also createdepth maps from image files using the command load-map. For example, the command:
(stereogram (overlay (load-map "nus.jpg") heart-bb))
will create the depth map from the image file nus.jpg:
and generate the stereogram shown in Figure 5 by overlaying “NUS” over a heart. Please bepatient because it takes a while to load the image and generate the stereogram.
Please note that our current system expected the input image to be 600×600 pixels in size. If yourimage is bigger than this, it will be cropped. Note also that loading images might take quite sometime, so be patient!
You can use Microsoft Paint to create your own custom depth maps!
Saving your work to file
You can save the viewport to file using the save command, i.e.
(save "mypic.bmp")
Fun with Stereograms
You now have the tools required to create your very own stereograms! Try out what you havelearnt and express your creativity. Our lab assistants will be around to help you out if you have anyquestions.

12
Figure 5: Stereogram with words “NUS” floating over a heart.
Cannot See Stereograms?
It might take a while to learn how to see autostereograms. To speed things up, you can alsogenerate 3D anaglyphs with the same image objects and use the 3D glasses provided to seethem. For example, you can use the command:
(anaglyph (overlay (load-map "nus.jpg") heart-bb))
to generate the 3D anaglyph in Figure 6.
Simulating 3D Effects with Animation
Finally, we can also try to create the illusion of 3D by generating slightly displaced images andanimating them using the hollusion command as follows:
(hollusion (overlay (load-map "nus.jpg") heart-bb))
You can save the hollusion to file using the save command as well, i.e.
(save "myhollusion.gif")

13
Figure 6: 3D red-cyan anaglyph with words “NUS” floating over a heart.