Computerization and Immigration - Banca d'Italia
88
Computerization and Immigration: Theory and Evidence from the United States 1 Gaetano Basso (Banca d’Italia), Giovanni Peri (UC Davis and NBER), Ahmed Rahman (USNA) BdI-CEPR Conference, Roma - March 16th, 2018 1 The views expressed in the paper are those of the authors only and do not involve the responsibility of the Bank of Italy. 1 / 33 G. Basso (BdI) Computerization & Immigration
Transcript of Computerization and Immigration - Banca d'Italia

Computerization and Immigration:
Theory and Evidence from the United States 1
Gaetano Basso (Banca d’Italia),Giovanni Peri (UC Davis and NBER), Ahmed Rahman (USNA)
BdI-CEPR Conference, Roma - March 16th, 2018
1The views expressed in the paper are those of the authors only and do notinvolve the responsibility of the Bank of Italy.
1 / 33 G. Basso (BdI) Computerization & Immigration

Technology and Polarization
Labor market polarization likely due toroutine-substituting technological innovation (Autor et al.,2003; Autor & Dorn, 2013)
Changes Employment (Natives+Foreign Born) by Skill Percentile, 1980-2010Source: Figure 1 in Autor & Dorn (2013)
2 / 33 G. Basso (BdI) Computerization & Immigration

Immigration
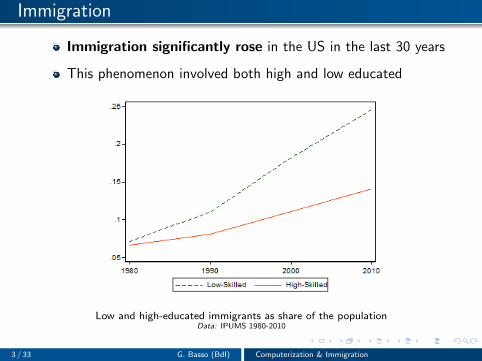
Immigration significantly rose in the US in the last 30 years
This phenomenon involved both high and low educated
Low and high-educated immigrants as share of the populationData: IPUMS 1980-2010
3 / 33 G. Basso (BdI) Computerization & Immigration

Immigration
Immigration significantly rose in the US in the last 30 years
This phenomenon involved both high and low educated
Low and high-educated immigrants as share of the populationData: IPUMS 1980-2010
3 / 33 G. Basso (BdI) Computerization & Immigration
Immigration
Immigration significantly rose in the US in the last 30 years
This phenomenon involved both high and low educated
Low and high-educated immigrants as share of the populationData: IPUMS 1980-2010
3 / 33 G. Basso (BdI) Computerization & Immigration

Research question
The goal of this paper is to answer two simple, yet extremelyrelevant, questions we know little about
1 Does technological growth attract migrants?
Is it true for both high and low educated (skilled)?
2 Does immigration attenuate or exacerbate the tendency ofnative job polarization?
Can cross-regional variation in technology adoption informus on natives and immigrants job polarization?How the combination of technology and immigration impact(native) welfare in the long-run?
4 / 33 G. Basso (BdI) Computerization & Immigration

In this paper
We provide empirical evidence and theoretical support tounderstand the following:
1 In the data, is technology adoption (computer use on thejob) associated with immigration inflows (andpolarization)?
2 We then rationalize these facts in a simple GE model with 3tasks, exogenous routine-substituting technologicalchange and endogenous immigration
3 Finally, we simulate the model equilibrium to providecounterfactual scenarios and back out welfare for natives
5 / 33 G. Basso (BdI) Computerization & Immigration

Immigration and Polarization
Immigrants substantially change the shape of thepolarization
-.2
-.1
0.1
.2.3
.4
0 20 40 60 80 100Skill Percentile (Ranked by Occupational Mean Wage)
Foreign-born Natives
100
x C
hang
e in
Em
ploy
men
t Sha
re
Changes in Foreign-born and Natives’ Employment by Skill Percentile 1980-2010
6 / 33 G. Basso (BdI) Computerization & Immigration

Preview of results
Empirically, we observe that
immigrant inflows are associated with routine-substitutingtechnology adoption
job polarization at the low-end can be mainly attributed toimmigrants
The model simulations predict that immigration:
contributes to technological progress
combined with technology adoption, induces occupationalupgrading
is net welfare enhancing for natives
7 / 33 G. Basso (BdI) Computerization & Immigration

Outline
1 Introduction
2 Contributions to the literature
3 Immigration and Technology Shocks: Definition andIdentification
4 Empirical Results
5 Model and Simulations
6 Conclusions
8 / 33 G. Basso (BdI) Computerization & Immigration

This paper contributes to
An extensive literature on polarization and routine-substituting(Autor et al., 2003; Goos & Manning, 2007; Autor & Dorn, 2013)
Labor supply matters too (Cerina et al., 2017):
Low-end polarization is mitigated by undocumentedmigrants (Mandelman & Zlate, 2014)
We extend AD’s framework to endogenous immigration
Even more literature on immigration (Card, 2001; Peri & Sparber,
2009; Ottaviano & Peri, 2012; Dustmann & al., 2015; Lull, 2017)
We are the first to show that:
Areas with technological progress attracts low-skilledmigrants (Cadena & Kovak, 2016; Jaimovich & Siu, 2017: high-skilled
↑ only)
Absent immigration, polarization, capital accumulation andgrowth would change
9 / 33 G. Basso (BdI) Computerization & Immigration

Technology and immigration
722 self-contained local labor markets: Commuting Zones (CZs)
Change in routine-substituting technology (proxy: PC use), 1980-2010
(.0028228,.0033891](.0026977,.0028228](.0026139,.0026977][.0022631,.0026139]
Change in foreign-born share, 1980-2010
(.0678924,.3024885](.03496,.0678924](.0154054,.03496][-.0221565,.0154054]
10 / 33 G. Basso (BdI) Computerization & Immigration

Identification of technology adoption (I)
Hard to identify localized technology progress. Few examples:
Beaudry et al. (2010) use survey firm-level computer adoptionfor ∼ 200 city
AD proxy technological change with task-basedroutine-intensity of CZs
We use an inferred measure of PC adoption for all 722 CZs (∼ to
Autor et al., 2003):
Industry-level PC use from the CPS as of mid-2000s
We exploit variation in 1980 local labor markets industrialcomposition
11 / 33 G. Basso (BdI) Computerization & Immigration

Identification of technology adoption (II)
PC usec,t = ∑j
ωj ,c,1980 ∗ ∆PC at workj ,US,t
emplj ,US,1980
where:
∆ PC at workj ,US ,t
emplj ,US ,1980=
PC at workj ,US,2005
emplj ,US,1980−
PC at workj ,US ,1980
emplj ,US,1980︸ ︷︷ ︸∼0
∆ PC at workj ,US ,t
emplj ,US ,1980∼ PC at workj ,US,2005
emplj ,US,1980
ωj ,c,1980 =emplj ,c,1980
∑j emplj ,c,1980
c: CZ; t: survey year; j : industry
We control for generic labor demand shocks (Bartik-style proxy):
Labor Productivityc,t = ∑j ωj ,c,1980 ∗ ∆log(wage)j ,−c,t
12 / 33 G. Basso (BdI) Computerization & Immigration

Identification of technology adoption (III)
PC use proxy positively correlates with other measure ofRBTC
4045
5055
6065
PC
Use
-.5 0 .5 1BDL (2010) Firm-Level PCs
PC Use and BDL’s (2010) PCFirm-level Use
4045
5055
6065
PC
Use
.15 .2 .25 .3 .35 .4 .45AD (2013) Routine Share
PC Use and AD’s (2013) CZ-RoutineIntensity
13 / 33 G. Basso (BdI) Computerization & Immigration

US and foreign born migration and PC adoption
∆Popc,h,t
Popc,1980= α + β∆PC usec,t + γ∆Labor Productivityc,t + φs + ∆εs,h,t (1)
for each skill h, CZ c between 1980 and 2010.
Low Skilled High Skilled
Panel A: NativesPC use 0.219 2.419∗∗
(0.314) (0.641)
Labor Productivity -0.790 -4.008∗
(0.893) (1.913)Obs. 722 722R2 0.64 0.55Panel B: Foreign BornPC use 0.555+ 1.038∗∗
(0.299) (0.210)
Labor Productivity 0.187 1.028+
(0.562) (0.556)Obs. 722 722R2 0.67 0.79
Note: 722 CZs, 1980-2010. Standard errors (in parentheses) are clustered at the state level. **, *, + indicate
significance at 1-percent, 5-percent and 10-percent level, respectively.
US and foreign born employment
14 / 33 G. Basso (BdI) Computerization & Immigration

US and foreign born migration and PC adoption
∆Popc,h,t
Popc,1980= α + β∆PC usec,t + γ∆Labor Productivityc,t + φs + ∆εs,h,t (1)
for each skill h, CZ c between 1980 and 2010.
Low Skilled High Skilled
Panel A: NativesPC use 0.219 2.419∗∗
(0.314) (0.641)
Labor Productivity -0.790 -4.008∗
(0.893) (1.913)Obs. 722 722R2 0.64 0.55Panel B: Foreign BornPC use 0.555+ 1.038∗∗
(0.299) (0.210)
Labor Productivity 0.187 1.028+
(0.562) (0.556)Obs. 722 722R2 0.67 0.79
Note: 722 CZs, 1980-2010. Standard errors (in parentheses) are clustered at the state level. **, *, + indicate
significance at 1-percent, 5-percent and 10-percent level, respectively. US and foreign born employment
14 / 33 G. Basso (BdI) Computerization & Immigration

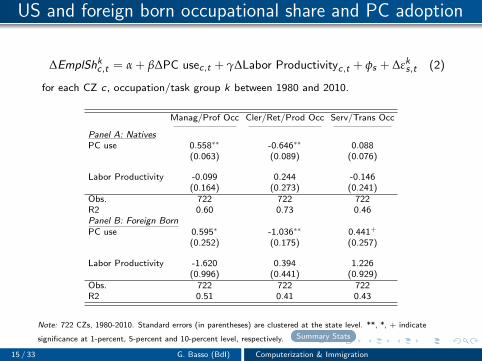
US and foreign born occupational share and PC adoption
∆EmplShkc,t = α + β∆PC usec,t + γ∆Labor Productivityc,t + φs + ∆εks,t (2)
for each CZ c, occupation/task group k between 1980 and 2010.
Manag/Prof Occ Cler/Ret/Prod Occ Serv/Trans Occ
Panel A: NativesPC use 0.558∗∗ -0.646∗∗ 0.088
(0.063) (0.089) (0.076)
Labor Productivity -0.099 0.244 -0.146(0.164) (0.273) (0.241)
Obs. 722 722 722R2 0.60 0.73 0.46Panel B: Foreign BornPC use 0.595∗ -1.036∗∗ 0.441+
(0.252) (0.175) (0.257)
Labor Productivity -1.620 0.394 1.226(0.996) (0.441) (0.929)
Obs. 722 722 722R2 0.51 0.41 0.43
Note: 722 CZs, 1980-2010. Standard errors (in parentheses) are clustered at the state level. **, *, + indicate
significance at 1-percent, 5-percent and 10-percent level, respectively.
Summary Stats
15 / 33 G. Basso (BdI) Computerization & Immigration
US and foreign born occupational share and PC adoption
∆EmplShkc,t = α + β∆PC usec,t + γ∆Labor Productivityc,t + φs + ∆εks,t (2)
for each CZ c, occupation/task group k between 1980 and 2010.
Manag/Prof Occ Cler/Ret/Prod Occ Serv/Trans Occ
Panel A: NativesPC use 0.558∗∗ -0.646∗∗ 0.088
(0.063) (0.089) (0.076)
Labor Productivity -0.099 0.244 -0.146(0.164) (0.273) (0.241)
Obs. 722 722 722R2 0.60 0.73 0.46Panel B: Foreign BornPC use 0.595∗ -1.036∗∗ 0.441+
(0.252) (0.175) (0.257)
Labor Productivity -1.620 0.394 1.226(0.996) (0.441) (0.929)
Obs. 722 722 722R2 0.51 0.41 0.43
Note: 722 CZs, 1980-2010. Standard errors (in parentheses) are clustered at the state level. **, *, + indicate
significance at 1-percent, 5-percent and 10-percent level, respectively. Summary Stats
15 / 33 G. Basso (BdI) Computerization & Immigration

Additional Results
Similar results using task specialization indexes Tasks
Additional results on US wages Wages
Preliminary IV results exploiting early ‘PC-adopters’ CZsproduce consistent results (forthcoming)
Pre-trends indicates no patterns in group-specific migrationMigration Pre-Trends
16 / 33 G. Basso (BdI) Computerization & Immigration

Summary of stylized facts
Our reduced form approach identifies few interesting facts:
1 Immigrants inflows are associated with PC adoptionIt holds both for low-skilled (new results) and high-skilled
2 PC adoption also correlated with natives’ job polarizationImmigrants contribute to low-end polarization
3 Effects on wages are consistent with a labor demand shock
17 / 33 G. Basso (BdI) Computerization & Immigration

A model to rationalize automation and immigration builton A&D(2013)
Two sectors, goods and services are complementary in utility:1 CES utility
U = (ρCσ−1
σs + (1− ρ)C
σ−1σ
g )σ
σ−1 , with σ ∈ (0, 1]
2 Goods can be saved to accumulate capital and humancapital
Cg = Yg − pkK − paLa; Cs = Ys
Service production linear (Ys = Ls). Goods production:1 Complementarity between K and La
Yg =[(αaLa)
β + X β]1/β
, β < 0, αa > 1
2 Substitution between K and Lr
X =[L
γr +Kγ
]1/γ, γ ∈ (0, 1)
3 pk ↓ exogenously
18 / 33 G. Basso (BdI) Computerization & Immigration

Labor amounts and migration (I)
Labor ability is ranked: manual simpler than routine, simplerthan analytical
Each worker i has ηi amount of routine ability (manual abilitystand’d to 1)
Workers can upgrade to analytical ability (φηi , φ > 1) atcost pa
Two thresholds: Equilibrium wages makes workers indifferentbetween manual and routine and routine and analytical
wrη∗ = ws ,
waφη̂ − pa = wr η̂
19 / 33 G. Basso (BdI) Computerization & Immigration

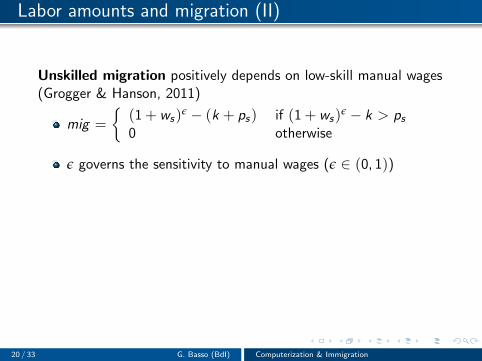
Labor amounts and migration (II)
Unskilled migration positively depends on low-skill manual wages(Grogger & Hanson, 2011)
mig =
{(1 + ws)ε − (k + ps) if (1 + ws)ε − k > ps0 otherwise
ε governs the sensitivity to manual wages (ε ∈ (0, 1))
Assuming η ∼ f (η) = e−η, labor amounts are:
Lr =∫ η̂
η∗ ηe−ηdη
La =∫ ∞
η̂ φηe−ηdη
Lm = 1 + mig− e−η∗
20 / 33 G. Basso (BdI) Computerization & Immigration

Partial Equilibrium Intuition
Supply of low-educated migration and service wages:No migration, no tech (εs given)
21 / 33 G. Basso (BdI) Computerization & Immigration

Partial Equilibrium Intuition
Supply of low-educated migration and service wages:↓ pk (εs given)
21 / 33 G. Basso (BdI) Computerization & Immigration

Partial Equilibrium Intuition
Supply of low-educated migration and service wages:↓ pk & demand effect (εs given)
21 / 33 G. Basso (BdI) Computerization & Immigration

With respect to Autor and Dorn (2013)
We depart from Autor and Dorn (2013) in three ways:
1 Native workers can upgrade their skills and occupation (byaccumulating human capital endogenously):
2 Endogenous migration in response to pk ↓⇒ We simulate the model to evaluate counterfactual scenarios
22 / 33 G. Basso (BdI) Computerization & Immigration

Simulation setup
We set the parameters as to match initial labor shares andlow-skilled migration inflows in the last 30 years:
1 Elasticity of substitution in production higher than that inconsumption ( 1
1−γ > σ)
σ = 0.5, β = −10,γ = 0.5ρ = 0.025, αa = 7.5
2 Other parameters
φ = 2, pm = 0.25 (simulation with pa ongoing work)εs = 0.2
⇒ We simulate the model for a 225% exogenous decline of pkcumulated over 30 years
23 / 33 G. Basso (BdI) Computerization & Immigration

Model simulations (figures)
1) Technological progress without migration generates employmentpolarization:
Changes in Native Employment Levels from Higher Computerization
time5 10 15 20 25 30
0.1
0.2
0.3
0.4
0.5
0.6
Analytical Labor Share (no migration)Routine Labor Share (no migration)Service Labor Share (no migration)
24 / 33 G. Basso (BdI) Computerization & Immigration

Model simulations (figures)
2) Technological progress attracts low-skilled migrants:
Changes in Unskilled Migrants from Higher Computerization
time5 10 15 20 25 30
0
0.05
0.1
0.15
25 / 33 G. Basso (BdI) Computerization & Immigration

Model simulations (figures)
3) Immigration allows natives to upgrade their skills:
time5 10 15 20 25 30
0.1
0.15
0.2
0.25
0.3
0.35Routine Labor Share (no migration)Routine Labor Share (baseline migration)
time5 10 15 20 25 30
0.3
0.35
0.4
0.45
0.5
0.55
0.6Abstract Labor Share (no migration)Abstract Labor Share (baseline migration)
Changes in Native Routine and Analytical Employment Levels from HigherComputerization and Immigration
26 / 33 G. Basso (BdI) Computerization & Immigration
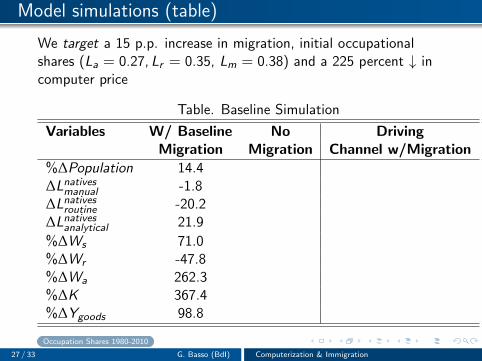
Model simulations (table)
We target a 15 p.p. increase in migration, initial occupationalshares (La = 0.27, Lr = 0.35, Lm = 0.38) and a 225 percent ↓ incomputer price
Table. Baseline Simulation
Variables W/ Baseline No DrivingMigration Migration Channel w/Migration
%∆Population 14.4
0 ↑ ws given εs > 0
∆Lnativesmanual -1.8
4.6 ↓ η̂, η∗
∆Lnativesroutine -20.2
-22.9 ↓ η∗
∆Lnativesanalytical 21.9
18.3 ↓ η̂
%∆Ws 71.0
160.1 ↑ mig
%∆Wr -47.8
-51.5 ↑ Lr
%∆Wa 262.3
236.1 La,K complements
%∆K 367.4
333.6 La,K complements
%∆Ygoods 98.8
84.5
Occupation Shares 1980-2010
27 / 33 G. Basso (BdI) Computerization & Immigration

Model simulations (table)
We target a 15 p.p. increase in migration, initial occupationalshares (La = 0.27, Lr = 0.35, Lm = 0.38) and a 225 percent ↓ incomputer price
Table. Baseline Simulation
Variables W/ Baseline No DrivingMigration Migration Channel w/Migration
%∆Population 14.4 0 ↑ ws given εs > 0
∆Lnativesmanual -1.8 4.6 ↓ η̂, η∗
∆Lnativesroutine -20.2 -22.9 ↓ η∗
∆Lnativesanalytical 21.9 18.3 ↓ η̂
%∆Ws 71.0 160.1 ↑ mig
%∆Wr -47.8 -51.5 ↑ Lr%∆Wa 262.3 236.1 La,K complements
%∆K 367.4 333.6 La,K complements
%∆Ygoods 98.8 84.5
Occupation Shares 1980-2010
27 / 33 G. Basso (BdI) Computerization & Immigration

Extension: High-skilled migrants
High-skill migrants supply analytical tasks depending on the levelof analytical wages:
ηs
[(1 + wa)
εa − k]≥ pam
Now, we have two sources of analytical labor, possibly competing:
La =∫ ∞
η̂φηe−ηdη +
∫ ∞
η̄φηse
−ηdη (3)
Skilled migration:
εa > 0s: drop in pk raises skilled migration to ∼ 7.5 percentof total native skilled population
Allows for more capital accumulation (through productioncomplementarities)
Favor unskilled migrants inflows (through demand)
⇒ Although quantitatively different, main results hold
Graphs
28 / 33 G. Basso (BdI) Computerization & Immigration

Extension: High-skilled migrants
High-skill migrants supply analytical tasks depending on the levelof analytical wages:
ηs
[(1 + wa)
εa − k]≥ pam
Now, we have two sources of analytical labor, possibly competing:
La =∫ ∞
η̂φηe−ηdη +
∫ ∞
η̄φηse
−ηdη (3)
Skilled migration:
εa > 0s: drop in pk raises skilled migration to ∼ 7.5 percentof total native skilled population
Allows for more capital accumulation (through productioncomplementarities)
Favor unskilled migrants inflows (through demand)
⇒ Although quantitatively different, main results holdGraphs
28 / 33 G. Basso (BdI) Computerization & Immigration

Model simulations (figures)
Technological progress attracts high-skilled migrants:
Changes in Unskilled Migrants from Higher Computerization
time5 10 15 20 25 30
0
0.05
0.1
0.15
0.2Unksilled Migrants (Ns,mig)Skilled Migrants (Na,mig)
29 / 33 G. Basso (BdI) Computerization & Immigration

Aggregate Welfare – Indirect Utility Calculations (I)
Natives in manufacturing gain (higher earnings and cheaperservices):
Utilmanuf =(
ρ1+σw−σs +(1−ρ)1+σ
(1−ρ)σ+ρσw1−σs
)(wrLr + waLa) (La + Lr ) .
Natives who work in services lose as lower wages more than offsetcheaper services:
Utilserv =(
ρ1+σw−σs +(1−ρ)1+σ
(1−ρ)σ+ρσw1−σs
)(wsLs,natLs,nat).
What is the net effect of immigration?
30 / 33 G. Basso (BdI) Computerization & Immigration

Aggregate Welfare – Indirect Utility Calculations (II)
Migration in the U.S. has been net positive for overall welfare:
time5 10 15 20 25 30
×10-3
4.5
5
5.5
6
6.5
Aggregate Utility (no migrants)Aggregate Utility (unskilled migrants)Aggregate Utility (unskilled & skilled migrants)
Changes in Native Aggregate Utility with Both Types of Migration
Computerization alone raises welfare by 5.4 percent (blue line)Computerization and both types of migration raises welfare by21.8 percent (green line)As long as native labor share in services is not too large(∼< 50%), aggregate utility improves with unskilled migrants31 / 33 G. Basso (BdI) Computerization & Immigration

Summary - Connecting model to empirics (I)
Routine-substituting technological progress proxied bycountry-wise PC use:
1 attracts low-skilled immigrants through higher servicewages
We document unskilled migration response whichcomplements existing work (Moretti, 2013; Cadena & Kovak,2016): due to an increase demand for manual tasks (Mazzolari& Ragusa, 2013)High-skilled migration response comes at no surprise
2 Associated with job polarizationConsistent with previous literatureBut no effect on service employment for natives
32 / 33 G. Basso (BdI) Computerization & Immigration

Summary of results - Connecting model and empirics (II)
Immigration:
1 Further hastens technological progress
2 Induces occupational upgrading among natives in the longrun: natives join more routine & analytical occupations(i.e., balance back unbalanced growth)
3 Has negative effects on service wages
⇒ Natives’ welfare depends on the share of service workers at t0
Overall welfare increased in the baseline parametrization
33 / 33 G. Basso (BdI) Computerization & Immigration

Appendix
33 / 33 G. Basso (BdI) Computerization & Immigration

US and foreign born employment and PC adoption
∆Emplc,h,t
Emplc,1980= α + β∆PC usec,t + γ∆Labor Productivityc,t + φs + ∆εs,h,t (4)
for each skill h, CZ c between 1980 and 2010.
Low Skilled High Skilled
Panel A: NativesPC use 0.115 2.047∗∗
(0.304) (0.635)
Labor Productivity -0.681 -3.745+
(0.896) (2.080)Obs. 722 722R2 0.59 0.52Panel B: Foreign BornPC use 0.416 1.008∗∗
(0.301) (0.199)
Labor Productivity 0.247 1.078+
(0.549) (0.539)Obs. 722 722R2 0.66 0.79
Note: 722 CZs, 1980-2010. Standard errors (in parentheses) are clustered at the state level. **, *, + indicate
significance at 1-percent, 5-percent and 10-percent level, respectively.
Back
33 / 33 G. Basso (BdI) Computerization & Immigration

US and foreign born employment and PC adoption
∆Emplc,h,t
Emplc,1980= α + β∆PC usec,t + γ∆Labor Productivityc,t + φs + ∆εs,h,t (4)
for each skill h, CZ c between 1980 and 2010.
Low Skilled High Skilled
Panel A: NativesPC use 0.115 2.047∗∗
(0.304) (0.635)
Labor Productivity -0.681 -3.745+
(0.896) (2.080)Obs. 722 722R2 0.59 0.52Panel B: Foreign BornPC use 0.416 1.008∗∗
(0.301) (0.199)
Labor Productivity 0.247 1.078+
(0.549) (0.539)Obs. 722 722R2 0.66 0.79
Note: 722 CZs, 1980-2010. Standard errors (in parentheses) are clustered at the state level. **, *, + indicate
significance at 1-percent, 5-percent and 10-percent level, respectively. Back
33 / 33 G. Basso (BdI) Computerization & Immigration

Observed Occupational Share Changes
Table. Occupational Employment Shares
Managers/prof/ Clerical/sales/ Services/transp/tech operators construct
Prevalently Analytical/Cognitive Routine Manual
Panel A: Natives1980 0.276 0.409 0.3152010 0.405 0.304 0.292
Delta 0.129 -0.106 -0.023Panel B: Foreign born
1980 0.241 0.420 0.3392010 0.294 0.250 0.456
Delta 0.053 -0.169 0.116
Back to Regressions Back to Simulation
33 / 33 G. Basso (BdI) Computerization & Immigration

Job polarization: Task supply approach
We construct measures of task supply based on the DOT indexesof Manual, Routine and Analytical Task intensity (Peri & Sparber,2009; Autor & Dorn, 2013)
Occupations and Task Index in 1980
Analytical/ Routine Manual/Cognitive Communication
Managers/prof/tech 0.807 0.343 0.478Clerical/sales/operators 0.415 0.664 0.358Services/construct/transp 0.322 0.451 0.737
Average Specialization 0.493 0.505 0.517% of Total 32% 34% 34%
33 / 33 G. Basso (BdI) Computerization & Immigration

Natives and Immigrants Tasks: Table
Natives and Foreign-born Task Specialization Indexes
Analytical Manual Routine
Panel A. Natives All
1980 0.321 0.339 0.3402010 0.370 0.331 0.299
Delta % 15.26 -2.36 -12.06
Panel B. Foreign-born All
1980 0.292 0.353 0.3552010 0.313 0.367 0.319
Delta % 7.19 3.97 -10.14
33 / 33 G. Basso (BdI) Computerization & Immigration

US and foreign born task specialization and PC adoption
∆EmplShkc,h,t = α+ β∆PC usec,t +γ∆Labor Productivityc,t +φs +∆εks,h,t (5)
for each skill h, CZ c, occupation/task group k between 1980 and 2010.
Analytical Task Routine Task Manual Task
Panel A: NativesPC use 0.142∗∗ -0.255∗∗ 0.113∗∗
(0.036) (0.025) (0.016)
Labor Productivity -0.075 0.093 -0.018(0.074) (0.064) (0.044)
Obs. 722 722 722R2 0.52 0.74 0.57Panel B: Foreign BornPC use 0.078 -0.208∗∗ 0.130+
(0.104) (0.068) (0.066)
Labor Productivity -0.318 0.049 0.269(0.385) (0.148) (0.284)
Obs. 722 722 722R2 0.54 0.40 0.43
Note: 722 CZs, 1980-2010. Standard errors (in parentheses) are clustered at the state level. **, *, + indicate
significance at 1-percent, 5-percent and 10-percent level, respectively.
Back
33 / 33 G. Basso (BdI) Computerization & Immigration

US and foreign born task specialization and PC adoption
∆EmplShkc,h,t = α+ β∆PC usec,t +γ∆Labor Productivityc,t +φs +∆εks,h,t (5)
for each skill h, CZ c, occupation/task group k between 1980 and 2010.
Analytical Task Routine Task Manual Task
Panel A: NativesPC use 0.142∗∗ -0.255∗∗ 0.113∗∗
(0.036) (0.025) (0.016)
Labor Productivity -0.075 0.093 -0.018(0.074) (0.064) (0.044)
Obs. 722 722 722R2 0.52 0.74 0.57Panel B: Foreign BornPC use 0.078 -0.208∗∗ 0.130+
(0.104) (0.068) (0.066)
Labor Productivity -0.318 0.049 0.269(0.385) (0.148) (0.284)
Obs. 722 722 722R2 0.54 0.40 0.43
Note: 722 CZs, 1980-2010. Standard errors (in parentheses) are clustered at the state level. **, *, + indicate
significance at 1-percent, 5-percent and 10-percent level, respectively. Back
33 / 33 G. Basso (BdI) Computerization & Immigration

1950-1980 migration and 1980-2010 PCs adoption
∆Popc,h,t
Popc,1950= α+ β∆PC usec,1980−2010 +γ∆Labor Productivityc,1980−2010 +φs +∆εks,h,t
(6)for each skill h, CZ c, occupation/task group k between 1950 and 1980.
Low Skilled High Skilled
Panel A: NativesPC use 4.565 3.321
(4.946) (3.789)
Labor Productivity -4.648 -3.541(8.080) (7.774)
Obs. 722 722R2 0.48 0.51Panel B: Foreign BornPC use 0.458 0.426
(0.761) (0.386)
Labor Productivity -0.385 -0.479(1.125) (0.766)
Obs. 722 722R2 0.52 0.54
Note: 722 CZs, 1950-1980. Standard errors (in parentheses) are clustered at the state level. **, *, + indicate
significance at 1-percent, 5-percent and 10-percent level, respectively.
Back
33 / 33 G. Basso (BdI) Computerization & Immigration

1950-1980 migration and 1980-2010 PCs adoption
∆Popc,h,t
Popc,1950= α+ β∆PC usec,1980−2010 +γ∆Labor Productivityc,1980−2010 +φs +∆εks,h,t
(6)for each skill h, CZ c, occupation/task group k between 1950 and 1980.
Low Skilled High Skilled
Panel A: NativesPC use 4.565 3.321
(4.946) (3.789)
Labor Productivity -4.648 -3.541(8.080) (7.774)
Obs. 722 722R2 0.48 0.51Panel B: Foreign BornPC use 0.458 0.426
(0.761) (0.386)
Labor Productivity -0.385 -0.479(1.125) (0.766)
Obs. 722 722R2 0.52 0.54
Note: 722 CZs, 1950-1980. Standard errors (in parentheses) are clustered at the state level. **, *, + indicate
significance at 1-percent, 5-percent and 10-percent level, respectively. Back
33 / 33 G. Basso (BdI) Computerization & Immigration

US wages and PC adoption
∆log(w)kc,t = α + β∆PC usec,t + γ∆Labor Productivityc,t + φs + ∆εks,t (7)
for each skill h, CZ c, occupation/task group k between 1980 and 2010.
Manag/Prof Occ Cler/Ret/Prod Occ Serv/Trans OccPC use 0.046∗∗ -0.045∗∗ 0.006
(0.004) (0.006) (0.005)
Labor Productivity -0.000 0.031+ -0.002(0.012) (0.018) (0.016)
Obs. 722 722 722R2 0.66 0.73 0.46
Note: 722 CZs, 1980-2010. Standard errors (in parentheses) are clustered at the state level. **, *, + indicate
significance at 1-percent, 5-percent and 10-percent level, respectively.
Back
33 / 33 G. Basso (BdI) Computerization & Immigration

US wages and PC adoption
∆log(w)kc,t = α + β∆PC usec,t + γ∆Labor Productivityc,t + φs + ∆εks,t (7)
for each skill h, CZ c, occupation/task group k between 1980 and 2010.
Manag/Prof Occ Cler/Ret/Prod Occ Serv/Trans OccPC use 0.046∗∗ -0.045∗∗ 0.006
(0.004) (0.006) (0.005)
Labor Productivity -0.000 0.031+ -0.002(0.012) (0.018) (0.016)
Obs. 722 722 722R2 0.66 0.73 0.46
Note: 722 CZs, 1980-2010. Standard errors (in parentheses) are clustered at the state level. **, *, + indicate
significance at 1-percent, 5-percent and 10-percent level, respectively. Back
33 / 33 G. Basso (BdI) Computerization & Immigration

Skilled migration: Employment
Routine and Analytical Employment w/out and w/Skilled Migration
time5 10 15 20 25 30
0.1
0.15
0.2
0.25
0.3
0.35
Routine Labor Share (no migration)Routine Labor Share (baseline unskilled migration)Routine Labor Share (unskilled and skilled migration)
time5 10 15 20 25 30
0.2
0.3
0.4
0.5
0.6
Abstract Labor Share (no migration)Abstract Labor Share (baseline unskilled migration)Abstract Labor Share (unskilled and skilled migration)
Back
33 / 33 G. Basso (BdI) Computerization & Immigration