Computer simulation for improving radio frequency (RF...
26
Computer simulation for improving radio frequency (RF) heating uniformity of food products: A review Zhi Huang, Francesco Marra, Jeyamkondan Subbiah, and Shaojin Wang QUERY SHEET This page lists questions we have about your paper. The numbers displayed at left can be found in the text of the paper for reference. In addition, please review your paper as a whole for correctness. There are no Editor Queries in this paper. TABLE OF CONTENTS LISTING The table of contents for the journal will list your paper exactly as it appears below: Computer simulation for improving radio frequency (RF) heating uniformity of food products: A review Zhi Huang, Francesco Marra, Jeyamkondan Subbiah, and Shaojin Wang BFSN #1253000, VOL 0, ISS 0
Transcript of Computer simulation for improving radio frequency (RF...
Computer simulation for improving radio frequency (RF) heating uniformity of foodproducts: A review
Zhi Huang, Francesco Marra, Jeyamkondan Subbiah, and Shaojin Wang
QUERY SHEET
This page lists questions we have about your paper. The numbers displayed at left can be found in the text of the paper forreference. In addition, please review your paper as a whole for correctness.
There are no Editor Queries in this paper.
TABLE OF CONTENTS LISTING
The table of contents for the journal will list your paper exactly as it appears below:
Computer simulation for improving radio frequency (RF) heating uniformity of food products: A reviewZhi Huang, Francesco Marra, Jeyamkondan Subbiah, and Shaojin Wang
BFSN #1253000, VOL 0, ISS 0

Computer simulation for improving radio frequency (RF) heating uniformity of foodproducts: A review
Zhi Huanga, Francesco Marrab, Jeyamkondan Subbiahc, and Shaojin Wanga,d
aCollege of Mechanical and Electronic Engineering, Northwest A&F University, Yangling, Shaanxi, China; bDipartimento di Ingegneria Industriale,5 Universit�adeglistudi di Salerno, Fisciano, SA, Italy; cDepartments of Biological Systems Engineering and Food Science & Technology, University of
Nebraska-Lincoln, Lincoln, Nebraska, USA; dDepartment of Biological Systems Engineering, Washington State University, Pullman, Washington, USA
ABSTRACTRadio frequency (RF) heating has great potential for achieving rapid and volumetric heating in foods,providing safe and high-quality food products due to deep penetration depth, moisture self-
10 balanceeffects, and leaving no chemical residues. However, the nonuniform heating problem (usuallyresulting in hot and cold spots in the heated product) needs to be resolved. The inhomogeneoustemperature distribution not only affects the quality of the food but also raises the issue of food safetywhen the microorganisms or insects may not be controlled in the cold spots. The mathematical modelingfor RF heating processes has been extensivelystudied in a wide variety of agricultural products recently.
15 This paper presents a comprehensive review of recent progresses in computer simulation for RF heatinguniformity improvement and the offered solutions to reduce the heating nonuniformity. It provides a briefintroduction on the basic principle of RF heating technology, analyzes the applications of numericalsimulation, and discusses the factors influencing the RF heating uniformity and the possible methods toimprove heating uniformity. Mathematical modeling improves the understanding of RF heating of food
20 and is essential to optimizethe RF treatment protocol for pasteurization and disinfestation applications.Recommendations for future research have been proposed to further improve the accuracy of numericalmodels, by covering both heat and mass transfers in the model, validating these models with samplemovement and mixing, and identifying the importantmodelparameters by sensitivity analysis.
KEYWORDSComputer simulation; foodproducts; heating uniformity;model; radio frequency
1. Introduction
25 Radiofrequency (RF) heating (also known as capacitive dielec-tric heating) is a recognized rapid electro-heating technology,which forms a part of innovative techniques based on electro-magnetic heating and other nonthermal methods. The availablesystems for producing and transferring RF power to dielectric
30 heating can be divided into two distinct groups: the more wide-spread conventional RF healing equipment and the more recent50-V RF heating equipment (Marchand and Meunier, 1990).Whether conventional or 50-V dielectric heating systems areused, the RF applicator has to be designed for the particular
35 product being heated. Although the size and shape of the appli-cator can vary enormously, they mostly fall into one of threemain types: the through field applicator, the fringe field applica-tor, and the staggered through field applicator (Jones and Row-ley, 1996). Conceptually, a through field RF applicator (with a
40 pair of parallel plates) is the simplest and the most commondesign of RF applicators in which the lossy material is placedbetween the two electrodes to form a parallel plate capacitor.This type of applicator is mainly used for heating bulk materialsor related large and thick objects. High voltage is applied onto
45 one of the electrodes while the other is grounded, thus causingpropagation of electromagnetic waves between the electrodes.
During RF treatments, heat is generated within the product dueto molecular friction resulting from oscillating dipole moleculesand migrating ions caused by the applied alternating electric
50field (Piyasena et al., 2003). Theoretically, therefore, RF heatingis expected to deliver more uniform heat at a faster rate thanconventional heating. Conventional heating relies on conduc-tion and convection to transport heat from the heating sourcesto the product, which requires relatively longer period of time,
55whereas RF heating has the potential to deliver heat instantlythroughout the product (Zhao et al., 2000). RF heating offersthe advantages of providing more uniform heating over samplegeometry than microwave heating does due to deeper wavepenetration into the sample and is more economical than
60microwave at higher power levels (Luechapattanaporn et al.,2004). These features of RF heating have generated great inter-ests for applications in the food-processing industry.
The potential use of RF technology for food processing wasrecognized since the 1940s (McCormick, 1988). These early
65efforts employed RF energy for applications, such as the cook-ing of processed meat products, heating of bread, dehydration,and blanching of vegetables at 150 MHz (Moyer and Stotz,1947). The next generation of commercial applications for RFenergy in the food industry was postbake drying of cookies and
CONTACT Shaojin Wang, Ph.D, Professor [email protected] College of Mechanical and Electronic Engineering, Northwest A&F University, Yangling,Shaanxi 712100, China.
Color versions of one or more of the figures in the article can be found online at www.tandfonline.com/bfsn.© 2017 Taylor & Francis Group, LLC
CRITICAL REVIEWS IN FOOD SCIENCE AND NUTRITION2017, VOL. 0, NO. 0, 1–25http://dx.doi.org/10.1080/10408398.2016.1253000
70 snack foods, which began in the late 1970s (Holland, 1974).Later in 1990s, the area of RF pasteurization was studied withattempts made to improve energy efficiency and solve technicalproblems (Zhao et al., 2000). This in turn has led to recentinvestigations on RF heating applications in food processing, as
75 well as dielectric properties of the product and system specificfactors that influence the RF heating (Piyasena et al., 2003).Subsequently, Marra et al. (2009) and Jojo and Mahendran(2013) reviewed several additional applications for RF heatingin food processing and their impacts on general quality aspects
80 of foods. The most recent focus of this novel heating technol-ogy was investigated for baking and roasting (Awuah et al.,2014a), cooking (Kirmaci and Singh, 2012; Laycock et al., 2003;Marra et al., 2007; Rincon et al., 2015), controlling insects (Houet al., 2016; Jiao et al., 2012; Wang et al., 2007a, b), defrosting
85 (Farag et al., 2009; Llave et al., 2014, 2015), drying (Jumah,2005; Wang et al., 2011, 2014), pasteurization (Awuah et al.,2005; Gao et al., 2011; Geveke et al., 2002; Ha et al., 2013; Kimet al., 2012; Liu et al., 2011; Nagaraj et al., 2016), sterilization(Guan et al., 2004; Wang et al., 2003b), thawing (Farag et al.,
90 2008a, 2011; Uyar et al., 2015), and many more.Although there are many research evidences suggesting pos-
sible advantages in the food industry, RF energy has not yetbeen exploited to its fullest potential in the industrial applica-tions. One of the major drawbacks of RF heating is the exis-
95 tence of hot spots in several zones depending on product
geometry (Alfaifi et al., 2014; Fu, 2004; Tiwari et al., 2011b;Wang et al., 2006b; Wang et al., 2008a). Sample size, shape, andnonhomogeneous dielectric properties (DPs) could result innonuniform electric field distribution, which in turn causes
100nonuniform temperature distribution (Birla et al., 2008a; Marraet al., 2007; Tiwari et al., 2011a). The nonuniform temperaturedistribution has been studied in different agricultural commod-ities, such as dry nuts (Wang et al., 2001, 2002, 2005; Wanget al., 2014), dried fruits (Alfaifi et al., 2014), eggs (Lau et al.,
1052016), fresh fruits (Birla et al., 2004, 2005; Tiwari et al., 2008;Wang et al., 2006a), legumes (Huang et al., 2015c; Jiao et al.,2011; Wang et al., 2008c, 2010) and meat (Llave et al., 2015;Marra et al., 2007; Romano and Marra, 2008; Uyar et al., 2014,2016). Major problems in RF heating, such as poor end quality,
110pathogens/insects survivals, microbial safety concerns, andoverheating, are related to nonuniform heating during RF treat-ment (Birla et al., 2004; Brunton et al., 2005; Jiao et al., 2012;Kim et al., 2012; Kirmaci and Singh, 2012). Several researchershave studied the temperature distribution during RF heating in
115food materials and suggested measures to reduce the nonuni-form temperature distribution (Chen et al., 2015b; Huang et al.,2016b; Ikediala et al., 2002; Jiao et al., 2014a; Tiwari et al.,2011a). The trial and error procedures are time consuming,costly, and often provide limited information. Due to rapid
120progress in computing capability, computational modeling hasincreasingly been used to predict RF power and temperature
a) NomenclatureA plate area of an electrode (m2)!B magnetic flux density (dimensionless)c speed of light in free space (3£108 m/s)C capacitance (F)cp heat capacity (J/kg K)ce empirical constantin Eq. (32) (J/kgK)d plate distance between the two electrodes (m)dp penetration depth (m)D empirical constants in Eq. (32) (J/Knkg)!D electric flux density (dimensionless)!E electric field vector (dimensionless)E electric field intensity (V/m)h overall external convective heat transfer coefficient (W/
m2K)!H magnetic field intensity (dimensionless)f frequency (Hz)
IC electric current (A)!J current density (dimensionless)k thermal conductivity (W/mK)ke empirical constantin Eq. (33) (W/mK)
mw evaporating flux of water (kg/m2 s)n empirical constants in Eq. (32) (dimensionless)!n normal vector of the sample surface (dimensionless)P power density generated by electric field (W/m3)Sd changes in density per unit change in temperature (kg/
m3 K)Sk changes in thermal conductivity per unit change in
temperature (W/mK2)t time (s)T sample temperature (K)
tan d dielectric loss tangent (dimensionless)@T/@t temperature rate of change (K/s)
V electric potential (V)Vvol material volume (m3)v angular frequency (rad/s)
SD standard deviationd dielectric loss angle (rad)e permittivity (dimensionless)e0 free space permittivity (F/m)e0 dielectric constant (F/m)e00 dielectric loss factor (F/m)er relative permittivity (dimensionless)e0r relative dielectric constant (dimensionless)e00r relative dielectric loss factor (dimensionless)
r gradient operatorλ latent heat of vaporization per unit mass of evaporated
water (J/kg)m magnetic permeability (H/m)r density (kg/m3)re empirical constant in Eq. (31) (kg/m3)s electrical conductivity (S/m)
b) Subscriptsa airav averagei insect
mat food materialp products solid
sh initial freezing pointsw normal freezing point of pure water
2 Z. HUANG ET AL.
distribution in food products without the necessity of extensiveexperiments.
Numerical techniques, such as the finite element method125 (FEM), have been extensively used in simulations of RF heat-
ing. Its capability was first investigated by Baginski et al. (1989)and again later by Choi and Konrad (1991). Starting from themid 1990s, a number of papers have appeared in the literatureand have discussed mathematical modeling and the computer
130 simulation of RF systems. Neophytou and Metaxas (1996,1997, 1998, 1999) attempted to model the electrical field forindustrial-scale RF heating systems and compared solutionsfrom both electrostatic and wave equations. Later on, Marraet al. (2007) proposed and experimentally validated a mathe-
135 matical model for RF heating of solid-like food (meat batter),based on so-called quasi-static approach, where the Gauss lawwas coupled with classical transient heat transfer equation, tak-ing into account, beside the conductive term, a volumetricpower generation. After that, further steps towards improving
140 the understanding of RF heating were taken for various foodproducts, such asdry foods (Huang et al., 2016a; Jiao et al.,2015a; Tiwari et al., 2011a, b), fruits (Birla et al., 2008a, b),meat lasagna (Wang et al., 2012), peanut butter (Jiao et al.,2014a, b), and raisins (Alfaifi et al., 2014). Overall, the consen-
145 sus is that RF heating is only able to heat certain food productsuniformly, and sometimes processing aids (Jiao et al., 2015b) ormodifications to the RF applicator (Tiwari et al., 2011a) areneeded to achieve good RF heating uniformity. These includehot water-assisted treatment (Tiwari et al., 2008), combining
150 with moving or rotating method (Birla et al., 2008a; Chen et al.,2016), intermittent mixing (Chen et al., 2015b), electrode typemodification (Tiwari et al., 2011a), and similar dielectric mate-rial surrounding methods (Huang et al., 2015c; Jiao et al.,2015b).
155 The general purpose of this paper was to review the currentstate of numerical modeling of overheating that usually occursat corners and edges of the RF-treated products in rectangularcontainers for better understanding the causes of nonuniformtemperature distributions in foods and provide an optimal
160 solution for improving the RF heating uniformity in thesefoods. The prospects of further research were examined andvarious applications of numerical models were discussed. Thespecific objectives of this review were (1) to introduce the basicmechanism of RF heating and present the fundamental of
165 mathematical modeling of RF heating, (2) to review the litera-tures of computer simulation on RF heating applications infood processing, (3) to explore the nonuniform RF heatingbehavior with the developed simulation model, (4) to analyzethe main factors that affect the RF heating uniformity and dis-
170 cuss the simulated methods to improve RF heating uniformityin food processing, and (5) to propose recommendations fordeveloping computer aided engineering of RF processes on anindustrial-scale.
2. Overview of RF heating modeling
175 2.1. RF heating system
RF technology uses electromagnetic energy within a frequencyrange of 3 kHz to 300 MHz to heat target foods. Federal
Communication Commission (FCC) assigned 13.56 § 0.00678,27.12 § 0.16272, and 40.68 § 0.02034 MHz for RF treatments
180in industrial, scientific and medical (ISM) applications to pre-vent disturbance in telecommunications (Jones and Rowley,1996). RF heating is based on the transformation of alternatingelectromagnetic field energy into thermal energy by affectingthe polar molecules and charged ions of a material. Dielectric
185materials are composed of atoms or molecules irrespective ofits phase (solid, liquid, or gas) and atoms or molecules are com-posed of negatively charged electrons and positively chargednucleus. These constituents may belocked into regular struc-tures of crystals or free to wander through the structure. There-
190fore, several types of electric displacements of theseconstituents, such as electronic, atomic, molecular, and ionic,are possible (Hartshorn, 1949). The molecular displacementinvolves molecules that are initially asymmetrical in structureand have a definite electric moment in addition to their own
195electric field when placed in an external electric field (Piyasenaet al., 2003). When an external electric field is applied, the bipo-lar molecules tend to behave like microscopic magnets andattempt to align themselves with the field. When the electricalfield is changing millions of times per second (e.g. 27.12 MHz),
200these molecular magnets are unable to withstand the forces act-ing to slow them. This resistance to the rapid movement of thebipolar molecules creates friction and results in heat dissipationin the material exposed to the RF radiation. This interactionresults in translation motions of free or bound charges and
205rotation of dipoles, and causes losses that, in turn, produce thevolumetric heating (Piyasena et al., 2003). The ability of RFradiation to penetrate and couple with materials provides anattractive method for obtaining controlled and precise heating.
In RF treatment, heat is generated throughout the material210by molecular friction in high-frequency alternating electric
fields, leading to faster heating rates, which was similar to themicrowave (MW) heating (Tang et al., 2005). Both RF andMW heating methods are nonionizing radiation since the fre-quencies in RF and MW ranges cannot produce sufficient
215energy to ionize molecules (Awuah et al., 2014b). Therefore, RFand MW heating is also called dielectric heating or dielectricloss heating. RF and MW systems have been recognized to be50–70% heating efficient in comparison to 10% efficiency withconventional heating ovens (Mermelstein, 1997). RF heating
220also differs from the higher frequency MW heating (915 MHzand 2450 MHz). In RF heating, the electrical field is commonlygenerated in a directional manner between a pair of electrodeplates, but the electrical field could approach the product fromall directions in MW heating depending on different mode
225designs. RF and MW system configurations are totally different,since MW energy is generated by special oscillator tubes, mag-netrons or klystrons, and can be transmitted to an applicator orantenna through a waveguide or coaxial transmission line. Theoutput of such tubes tends to be in a range from 0.5 to 100 kW
230and requires a special power supply (Piyasena et al., 2003). RFsystems are generally simpler to construct than MW systems,which usually contain an oscillator and applicator circuit. TheRF heating also offers simple uniform field patterns as opposedto the complex nonuniform standing wave patterns in a MW
235oven (Piyasena et al., 2003). Compared with MW energy, RFenergy has the advantage of heating bulk food because of its
CRITICAL REVIEWS IN FOOD SCIENCE AND NUTRITION 3
relatively longer wavelength (7.4–22.1 m in vacuum). As aresult, a better heating pattern for RF processing would beobtained compared to MW processing.
240 A typical RF system consists of two main components: gen-erator and applicator. The generator part is mainly used to gen-erate the RF energy, and the applicator is a metal structure,which directs the RF field to the product or load to be heated.Two main kinds of RF systems are used in commercial applica-
245 tions: the open circuit (also called free running oscillator) andthe 50 V technology based on their wave generation mecha-nisms, components, and properties (Marra et al., 2009). Theopen circuit RF system is used widely in many industrial appli-cations, but the 50-V system is a relatively new technology to
250 provide a fixed frequency compared to self-oscillatory circuit,and also to precisely control power and feedback (Jones andRowley, 1996). Thus the heating rate can be tightly controlledand precise final temperatures can be achieved easily in a 50-Vsystem. Because power is fed through standard 50-V cables, the
255 generator can be remotely located and can be quickly con-nected. It has a more stable frequency output since the match-ing system in the RF heater is automatically adjusted tomaintain the load impedance at 50 V. The 50-V systems aremore expensive than the open circuit ones, and have not been
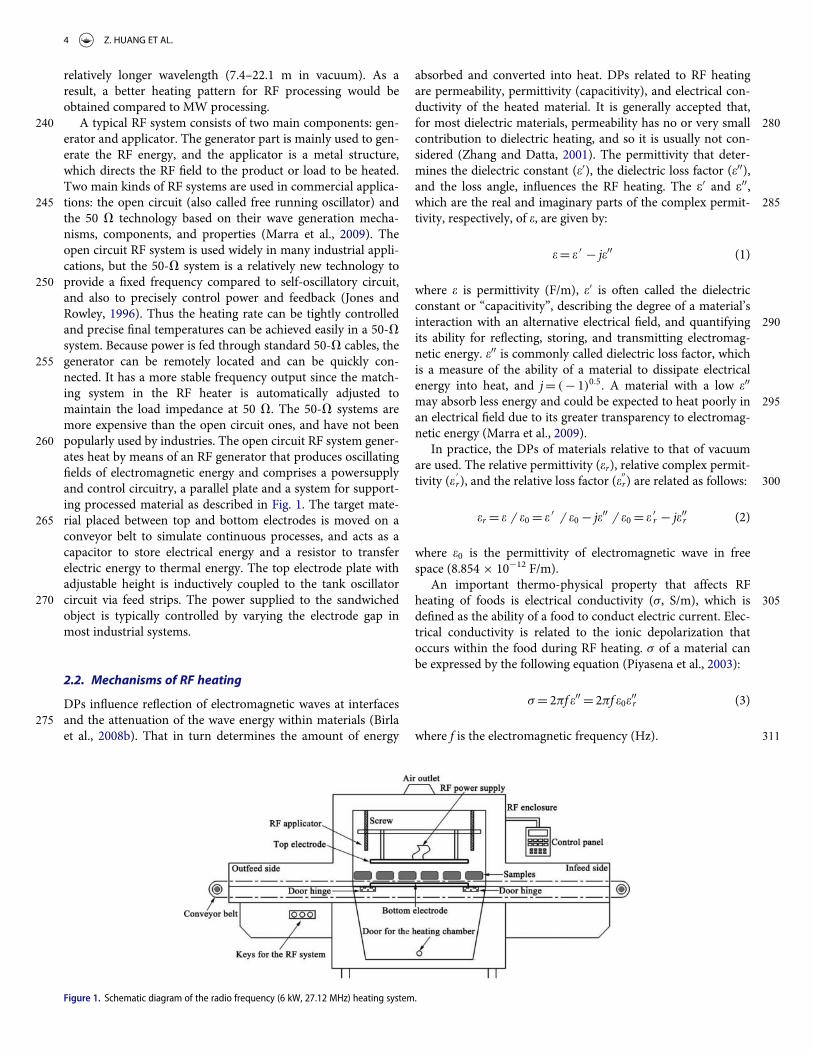
260 popularly used by industries. The open circuit RF system gener-ates heat by means of an RF generator that produces oscillatingfields of electromagnetic energy and comprises a powersupplyand control circuitry, a parallel plate and a system for support-ing processed material as described in Fig. 1. The target mate-
265 rial placed between top and bottom electrodes is moved on aconveyor belt to simulate continuous processes, and acts as acapacitor to store electrical energy and a resistor to transferelectric energy to thermal energy. The top electrode plate withadjustable height is inductively coupled to the tank oscillator
270 circuit via feed strips. The power supplied to the sandwichedobject is typically controlled by varying the electrode gap inmost industrial systems.
2.2. Mechanisms of RF heating
DPs influence reflection of electromagnetic waves at interfaces275 and the attenuation of the wave energy within materials (Birla
et al., 2008b). That in turn determines the amount of energy
absorbed and converted into heat. DPs related to RF heatingare permeability, permittivity (capacitivity), and electrical con-ductivity of the heated material. It is generally accepted that,
280for most dielectric materials, permeability has no or very smallcontribution to dielectric heating, and so it is usually not con-sidered (Zhang and Datta, 2001). The permittivity that deter-mines the dielectric constant (e0), the dielectric loss factor (e00),and the loss angle, influences the RF heating. The e0 and e00,
285which are the real and imaginary parts of the complex permit-tivity, respectively, of e, are given by:
eD e 0 ¡ je00 (1)
where e is permittivity (F/m), e0 is often called the dielectricconstant or “capacitivity”, describing the degree of a material’s
290interaction with an alternative electrical field, and quantifyingits ability for reflecting, storing, and transmitting electromag-netic energy. e00 is commonly called dielectric loss factor, whichis a measure of the ability of a material to dissipate electricalenergy into heat, and jD .¡ 1/0:5. A material with a low e00
295may absorb less energy and could be expected to heat poorly inan electrical field due to its greater transparency to electromag-netic energy (Marra et al., 2009).
In practice, the DPs of materials relative to that of vacuumare used. The relative permittivity (er), relative complex permit-
300tivity (e0r), and the relative loss factor (e
00r) are related as follows:
er D e 6 e0 D e 0 6 e0 ¡ je00 6 e0 D e 0r ¡ je00r (2)
where e0 is the permittivity of electromagnetic wave in freespace (8.854 £ 10¡12 F/m).
An important thermo-physical property that affects RF305heating of foods is electrical conductivity (s, S/m), which is
defined as the ability of a food to conduct electric current. Elec-trical conductivity is related to the ionic depolarization thatoccurs within the food during RF heating. s of a material canbe expressed by the following equation (Piyasena et al., 2003):
sD 2pf e00 D 2pf e0e00r (3)
311where f is the electromagnetic frequency (Hz).
Figure 1. Schematic diagram of the radio frequency (6 kW, 27.12 MHz) heating system.
4 Z. HUANG ET AL.
The tangent of the dielectric loss angle (tan d) is often calledthe loss tangent or the dissipation (power) factor of the mate-rial. For a given material, this is equivalent to the ratio of e
00
315 over e 0 :
tandD e00 6 e 0 D e00r 6 e 0r (4)
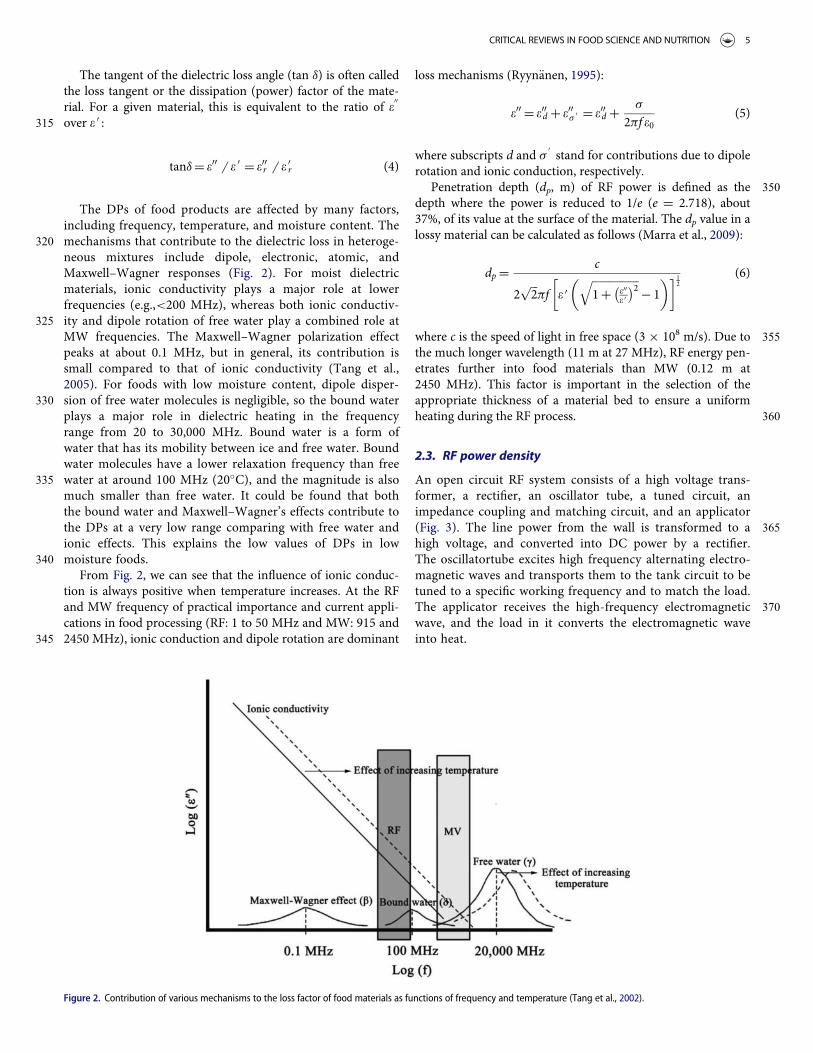
The DPs of food products are affected by many factors,including frequency, temperature, and moisture content. The
320 mechanisms that contribute to the dielectric loss in heteroge-neous mixtures include dipole, electronic, atomic, andMaxwell–Wagner responses (Fig. 2). For moist dielectricmaterials, ionic conductivity plays a major role at lowerfrequencies (e.g.,<200 MHz), whereas both ionic conductiv-
325 ity and dipole rotation of free water play a combined role atMW frequencies. The Maxwell–Wagner polarization effectpeaks at about 0.1 MHz, but in general, its contribution issmall compared to that of ionic conductivity (Tang et al.,2005). For foods with low moisture content, dipole disper-
330 sion of free water molecules is negligible, so the bound waterplays a major role in dielectric heating in the frequencyrange from 20 to 30,000 MHz. Bound water is a form ofwater that has its mobility between ice and free water. Boundwater molecules have a lower relaxation frequency than free
335 water at around 100 MHz (20�C), and the magnitude is alsomuch smaller than free water. It could be found that boththe bound water and Maxwell–Wagner’s effects contribute tothe DPs at a very low range comparing with free water andionic effects. This explains the low values of DPs in low
340 moisture foods.From Fig. 2, we can see that the influence of ionic conduc-
tion is always positive when temperature increases. At the RFand MW frequency of practical importance and current appli-cations in food processing (RF: 1 to 50 MHz and MW: 915 and
345 2450 MHz), ionic conduction and dipole rotation are dominant
loss mechanisms (Ryyn€anen, 1995):
e00 D e00d C e00s 0 D e00d C s
2pf e0(5)
where subscripts d and s0stand for contributions due to dipole
rotation and ionic conduction, respectively.350Penetration depth (dp, m) of RF power is defined as the
depth where the power is reduced to 1/e (e D 2.718), about37%, of its value at the surface of the material. The dp value in alossy material can be calculated as follows (Marra et al., 2009):
dp D c
2ffiffiffi2
ppf e 0
ffiffiffiffiffiffiffiffiffiffiffiffiffiffiffiffiffi1C e00
e 0� �2q
¡ 1
� �� �12
(6)
355where c is the speed of light in free space (3 £ 108 m/s). Due tothe much longer wavelength (11 m at 27 MHz), RF energy pen-etrates further into food materials than MW (0.12 m at2450 MHz). This factor is important in the selection of theappropriate thickness of a material bed to ensure a uniform
360heating during the RF process.
2.3. RF power density
An open circuit RF system consists of a high voltage trans-former, a rectifier, an oscillator tube, a tuned circuit, animpedance coupling and matching circuit, and an applicator
365(Fig. 3). The line power from the wall is transformed to ahigh voltage, and converted into DC power by a rectifier.The oscillatortube excites high frequency alternating electro-magnetic waves and transports them to the tank circuit to betuned to a specific working frequency and to match the load.
370The applicator receives the high-frequency electromagneticwave, and the load in it converts the electromagnetic waveinto heat.
Figure 2. Contribution of various mechanisms to the loss factor of food materials as functions of frequency and temperature (Tang et al., 2002).
CRITICAL REVIEWS IN FOOD SCIENCE AND NUTRITION 5
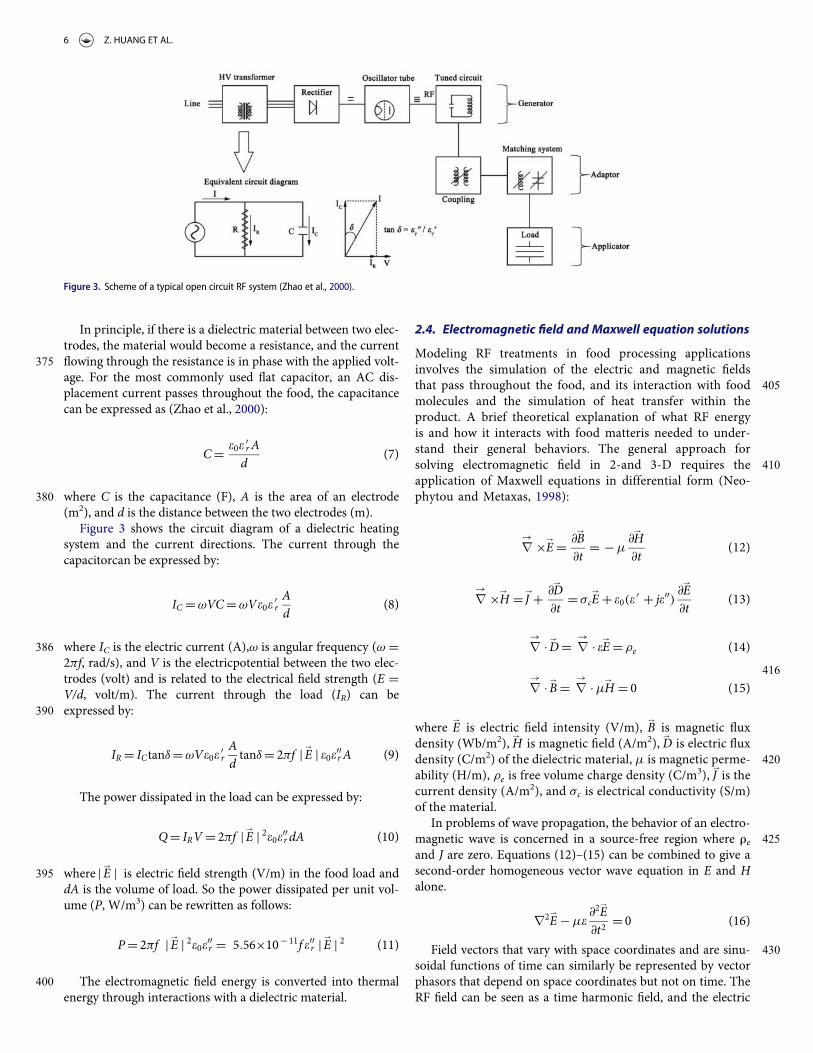
In principle, if there is a dielectric material between two elec-trodes, the material would become a resistance, and the current
375 flowing through the resistance is in phase with the applied volt-age. For the most commonly used flat capacitor, an AC dis-placement current passes throughout the food, the capacitancecan be expressed as (Zhao et al., 2000):
CD e0e 0r Ad
(7)
380 where C is the capacitance (F), A is the area of an electrode(m2), and d is the distance between the two electrodes (m).
Figure 3 shows the circuit diagram of a dielectric heatingsystem and the current directions. The current through thecapacitorcan be expressed by:
IC DvVCDvVe0e 0rAd
(8)
386 where IC is the electric current (A),v is angular frequency (v D2pf, rad/s), and V is the electricpotential between the two elec-trodes (volt) and is related to the electrical field strength (E DV/d, volt/m). The current through the load (IR) can be
390 expressed by:
IR D ICtandDvVe0e 0rAdtandD 2pf j !
E j e0e00r A (9)
The power dissipated in the load can be expressed by:
QD IRV D 2pf j !E j 2e0e00r dA (10)
395 where j !E j is electric field strength (V/m) in the food load and
dA is the volume of load. So the power dissipated per unit vol-ume (P, W/m3) can be rewritten as follows:
PD 2pf j !E j 2e0e00r D 5:56£10¡ 11f e00r j !
E j 2 (11)
400 The electromagnetic field energy is converted into thermalenergy through interactions with a dielectric material.
2.4. Electromagnetic field and Maxwell equation solutions
Modeling RF treatments in food processing applicationsinvolves the simulation of the electric and magnetic fields
405that pass throughout the food, and its interaction with foodmolecules and the simulation of heat transfer within theproduct. A brief theoretical explanation of what RF energyis and how it interacts with food matteris needed to under-stand their general behaviors. The general approach for
410solving electromagnetic field in 2-and 3-D requires theapplication of Maxwell equations in differential form (Neo-phytou and Metaxas, 1998):
r! £!
ED @!B@t
D ¡m@!H@t
(12)
r! £!
H D!J C @
!D@t
D sc!E C e0.e 0 C je00/
@!E@t
(13)
r!
� !DD r
!� e!ED re (14)
416
r!
� !BD r
!�m!
H D 0 (15)
where!E is electric field intensity (V/m),
!B is magnetic flux
density (Wb/m2),!H is magnetic field (A/m2),
!D is electric flux
420density (C/m2) of the dielectric material, m is magnetic perme-ability (H/m), re is free volume charge density (C/m3),
!J is the
current density (A/m2), and sc is electrical conductivity (S/m)of the material.
In problems of wave propagation, the behavior of an electro-425magnetic wave is concerned in a source-free region where re
and J are zero. Equations (12)–(15) can be combined to give asecond-order homogeneous vector wave equation in E and Halone.
r2!E ¡me@2
!E
@t2D 0 (16)
430Field vectors that vary with space coordinates and are sinu-soidal functions of time can similarly be represented by vectorphasors that depend on space coordinates but not on time. TheRF field can be seen as a time harmonic field, and the electric
Figure 3. Scheme of a typical open circuit RF system (Zhao et al., 2000).
6 Z. HUANG ET AL.
435 field strength can be expressed below:
!E.x; y; z; t/DRe½!E.x; y; z/ejvt� (17)
where Re[E(x,y,z)ejvt] is the real part of [E(x,y,z)ejvt], and t isthe time period (s). When the time harmonic assumption ismade, Eqs. (12)–(15) become:
r! £!
ED ¡ jmv!H (18)
441 r! £!
H D je0erv!E (19)
Under time harmonic condition, the effect of the magnetic445 field is negligible, Eq. (18) can be ignored and Eq. (19) can be
changed to:
r! £!
H D .sC jve/!E D jv e� C s
jv
� �!ED jvec
!ED!
J (20)
In existing RF applicators, the wavelength in the RF450 range is often much larger than the maximum size of the
object to be heated, quasi-static approximation can beapplied for the solution of Maxwell’s electromagnetic fieldequations. Since the scalar voltage potential (V) is related toelectric field by
!E D ¡!r V , and current density
!r �!J D 0,455 Eq. (20) can also be modified to Laplace equation (Metaxas,
1996):
¡ r!
�..sC j2pf e0e 0 / r!
V/D 0 (21)
The electric field at any point inside the electrodes is460 governed by Eq. (21). In this case, as boundary conditions,
the top electrode is set as the electromagnetic source sinceit introduces the high frequency electromagnetic energy andthe bottom electrode is set as ground conditions (V D 0).RF applicator walls are electrically insulated, so last bound-
465 ary conditions are:
r!
�!E D 0 (22)
The analytical solution of La place equation for the electricpotential between RF electrodes and heat dissipation in a slab
470 sandwiched between electrodes can be coupled together, andan expression for electric potential on upper electrode can beobtained as (Birla et al., 2008a):
V D dair
ffiffiffiffiffiffiffiffiffiffiffiffiffiffiffiffiffiffiffiffiffiffiffiffiffie 0ð Þ2 C e00ð Þ2
qC dmat
� � ffiffiffiffiffiffiffiffiffiffiffiffiffiffiffiffiffiffiffircp
pf e0e00dTdt
s !(23)
where dair is the air gap between top electrode and food sample475 (m), and dmat is the height of the food material (m). The elec-
trode voltage would change as a function of spatial locationbetween the two electrodes.
2.5. Heat transfer modeling
The common objective in modeling RF heating is to obtain480 the temperature profile inside the food. The equations rep-
resenting the electromagnetic and the thermal phenomena
must be solved inside the food itself. Once electromagneticmodel has been solved, heat generation can be derived fromelectromagnetic fields and material properties. Therefore, a
485link has to be created between the electromagneticequationsand heat transfer equations. The amount of power (P, W/m3) converted from electromagnetic energy to thermalenergy is related to the DPs of treated materials. For a givenelectric field intensity ( j !
E j , V/m), P was already introduced490above (Eq. (11)), as described below (Choi and Konrad, 1991):
PD 2pf e0e00 j !E j 2 Dv e0e00 j !
E j 2 (24)
where j !E j is the modulus of the E-field, that—in case of RF
heating—can be evaluated in accordance with the La placeequation (Eq. (21)), stated for electroquasi-static conduction
495in inhomogeneous materials. Here, volumetric energy genera-tion term depends on the electric fieldsexperienced within thefood, the frequency of electromagnetic field, and DPs of thematerial to be heated.
The mathematical description of heat transfer within the500food product placed between the electrodes, is given by
unsteady heat-conduction equation (assuming that a solid-likefoodstuff is processed in the RF applicator) with a generationterm, coupled with the quasi-static electro-magnetic field equa-tions:
rcp@T@t
D r!
k �r!
T C P (25)
506where r is density (kg/m3), cp is specific heat (J/kgK), k isthermal conductivity (W/m K), T is the temperature (K),and t is the time (s). While the solution of heat transfer isneeded just within the sample, the Gauss law must be eval-
510uated for the space between the two electrodes, whichincludes the sample and the air around it (Marra et al.,2007).
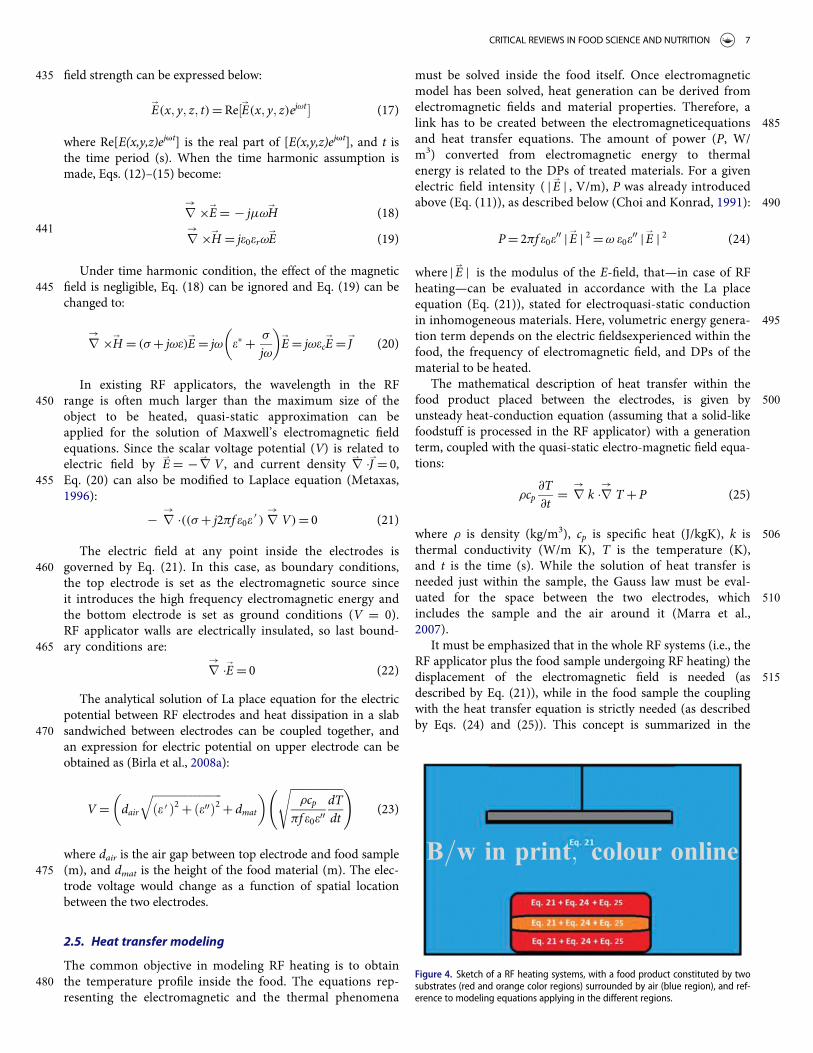
It must be emphasized that in the whole RF systems (i.e., theRF applicator plus the food sample undergoing RF heating) the
515displacement of the electromagnetic field is needed (asdescribed by Eq. (21)), while in the food sample the couplingwith the heat transfer equation is strictly needed (as describedby Eqs. (24) and (25)). This concept is summarized in the
Figure 4. Sketch of a RF heating systems, with a food product constituted by twosubstrates (red and orange color regions) surrounded by air (blue region), and ref-erence to modeling equations applying in the different regions.
B=w in print; colour online
CRITICAL REVIEWS IN FOOD SCIENCE AND NUTRITION 7
following Fig. 4, where—as an example—the case of RF heating520 of a food product constituted by two components is sketched,
together with the reference to the equations needed to mathe-matically describe the RF heating of the considered food prod-uct. It is clear from this sketch that, while solving the set ofequations, one has to take into account the physical (density,
525 specific heat, and thermal conductivity) and the dielectric(dielectric constant and loss factor) properties of the materialin which that equation is considered. In this way, it is possibleto model the selective RF heating, since different substratesmay heat faster or slower depending on their different loss fac-
530 tors. The same concept applies when the goal is to study theeffect of RF heating on insects in host products (such as fruits).When the applied frequency and electric fields are the sameboth for the pests and the host products, the heat produced inthe insects and the host products might be different, resulting
535 in the different final temperatures of the insects and the hostproducts after the same period of RF heating (Huang et al.,2015a).
For the heat transfer equation to determine the temperaturedistribution inside the food undergoing RF heating, initial and
540 boundary conditions are needed. A uniform temperature T0
can be assumed within the food sampleas initial condition. Onboundary conditions, convective heat transfer from the externalsurfaces, in accordance with the Newton lawformulated as fol-lows:
¡ k �r!T � n! D h .T ¡Tair/: (26)
546 where h is the overall external convective heat transfer coeffi-cient (W/m2K), Tair is the air temperature inside the RF cavity(K) and
!n is the normal vector of the surface.
Moisture transfer can occur during many heating operations550 whena certain amount of the energy being transferred to the
food sample. The amount of thermal energy required to changethe state of water (that is contained in the food) from liquid tovapor at a given saturation temperature and pressure is calledthe latent heat of evaporation. Under such condition, the latent
555 heat of evaporation must be supplied. The internal vapor pres-sure caused by evaporation of the liquid water is generatedquickly, and this pressure is possibly the main driving forcebehind moisture transfer into vapor and/or liquid forms. Thevapor pressure of a liquid increases with increasing tempera-
560 ture. The molecules in the liquid are more energetic at highertemperatures, and more molecules can escape from the liquidphase into the gas phase. A pressure of 20 kPa and a tempera-ture of 60�C correspond to the “liquid-vapor” separate region.Therefore, the driving force of the moisture transfer from the
565 sample to the surrounding air starts to be important when pro-cesses characterized by temperatures above 60�C (it means thatthe vapour pressure is higher than 20 kPa) for long time. Inoperations conducted below 60�C and for short processingtimes, in a first mathematical model formulation of RF heating,
570 the moisture transfer and its effect on the heat transfer can beignored.
When the moisture transfer from the sample to the sur-rounding aircannot be ignored, the thermal effects of evapo-ration must be taken into account at least at the boundaries
575 between the sample and the surrounding air. On these
surfaces, the internal conduction is balanced by the externalconvective heat transfer and by the heat loss due to theevaporation of moisture, as in the following expression(Marra et al., 2007):
¡ k r!T �n! j boundary ¡ D ½h.T ¡Tair/C _mwλ� j boundary C (27)
581where _mw is the amount of water evaporated per unit of time-and surface area (kg/m2 s) and λ is the latent heat of vaporisa-tionper unit mass of evaporated water (J/kg).
Of course, the amount of water evaporated per unit of time-585and surface area ( _mw) could be computed by adding another
equation that describes the mass transfer at the boundarybetween the food sample and the surrounding air:
_mw D km cws ¡ cwairð Þ (28)
where cws and cwair are the mass concentration of water (kg/m3)590at the food external surface and in the air far from the food
sample, respectively and km (m/s) represents a coefficient ofconvective mass transfer.
A finer modeling approach would also require coupling themass transfer (Dhall and Datta, 2011; Pace et al., 2011; Zhu
595et al., 2015), thus adding another partial differential equation ina porous-media (Datta et al., 2007; Ni et al., 1999) or conjugateapproach (Marra et al., 2010).
2.6. Computer simulation of RF heating in food processing
Activities of computer simulation fall into two general cat-600egories, the first being the simulation of heat transfer
within the product (load) between the electrodes andfocusing mainly on the description of transport phenom-ena inside the food. The second area has been modelingRF heating in terms its electric and magnetic fields. Table 1
605gives a summary of recent development of computer simu-lation for RF heating in food processing and postharvesttreatments. It can be seen from literatures that the com-puter simulation could be used to understand the mecha-nisms, test new strategies, optimize parameters, and design
610appropriate RF treatment conditions for specific foodproducts.
2.6.1. Computer simulation of RF heating and dryingThe first attempt to model RF systems was reported in the1990s (Baginski et al., 1989, 1990). These efforts attempted
615to model the electromagnetic and thermodynamic phenom-ena for industrial-scale RF drying chambers. Subsequently,Neophytou and Metaxas (1996, 1997, 1998, 1999) recom-mended that solution of Laplace equation is adequate forsmall-sized applicators, whereas wave equations should be
620used for large size electrodes. This opened opportunity foranalyzing the electromagnetic field distribution, heatingrate, and heating pattern in foods with FEM during RFheating. The application of a three-dimensional (3D) finite-element computer program package, TLM-FOODHEAT-
625ING, on the simulation of capacitive RF dielectric heatingofradish and alfalfa seeds was investigated by Yang et al.
8 Z. HUANG ET AL.
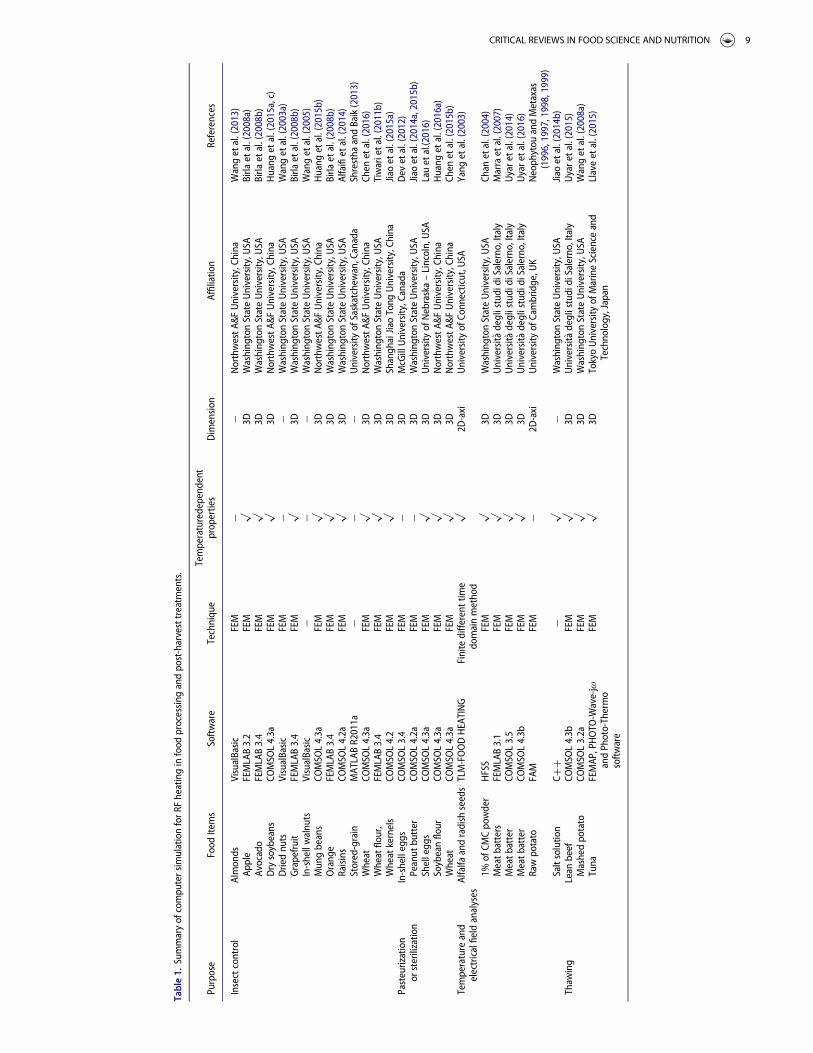
Table1.
Summaryofcompu
tersimulationforR
Fheatinginfood
processing
andpost-harvesttreatm
ents.
Purpose
Food
Items
Software
Techniqu
eTemperaturedepend
ent
properties
Dimension
Affiliatio
nReferences
Insectcontrol
Almonds
VisualBasic
FEM
¡¡
NorthwestA
&FUniversity,China
Wanget
al.(2013)
Apple
FEMLAB3.2
FEM
x3D
Washing
tonStateUniversity,U
SABirla
etal.(2008a)
Avocado
FEMLAB3.4
FEM
x3D
Washing
tonStateUniversity,U
SABirla
etal.(2008b)
Drysoybeans
COMSO
L4.3a
FEM
x3D
NorthwestA
&FUniversity,China
Huang
etal.(2015a,c)
Driednu
tsVisualBasic
FEM
¡¡
Washing
tonStateUniversity,U
SAWanget
al.(2003a)
Grapefruit
FEMLAB3.4
FEM
x3D
Washing
tonStateUniversity,U
SABirla
etal.(2008b)
In-shellwalnuts
VisualBasic
¡¡
¡Washing
tonStateUniversity,U
SAWanget
al.(2005)
Mun
gbeans
COMSO
L4.3a
FEM
x3D
NorthwestA
&FUniversity,China
Huang
etal.(2015b)
Orang
eFEMLAB3.4
FEM
x3D
Washing
tonStateUniversity,U
SABirla
etal.(2008b)
Raisins
COMSO
L4.2a
FEM
x3D
Washing
tonStateUniversity,U
SAAlfaifietal.(2014)
Stored-grain
MATLABR2011a
¡¡
¡University
ofSaskatchew
an,Canada
Shrestha
andBaik(2013)
Wheat
COMSO
L4.3a
FEM
x3D
NorthwestA
&FUniversity,China
Chen
etal.(2016)
Wheatflour,
FEMLAB3.4
FEM
x3D
Washing
tonStateUniversity,U
SATiwarietal.(2011b)
Wheatkernels
COMSO
L4.2
FEM
x3D
Shangh
aiJiaoTong
University,China
Jiaoet
al.(2015a)
Pasteurization
orsterilizatio
nIn-shelleggs
COMSO
L3.4
FEM
¡3D
McGillUniversity,Canada
Dev
etal.(2012)
Peanut
butter
COMSO
L4.2a
FEM
¡3D
Washing
tonStateUniversity,U
SAJiaoet
al.(2014a,2015b)
Shellegg
sCO
MSO
L4.3a
FEM
x3D
University
ofNebraska–Lincoln,USA
Lauet
al.(2016)
Soybeanflour
COMSO
L4.3a
FEM
x3D
NorthwestA
&FUniversity,China
Huang
etal.(2016a)
Wheat
COMSO
L4.3a
FEM
x3D
NorthwestA
&FUniversity,China
Chen
etal.(2015b)
Temperatureand
electricalfieldanalyses
Alfalfa
andradish
seedsTLM-FOODHEATING
Finite
different
time
domainmethod
x2D
-axi
University
ofConnecticut,U
SAYang
etal.(2003)
1%of
CMCpowder
HFSS
FEM
x3D
Washing
tonStateUniversity,U
SACh
anetal.(2004)
Meatb
atters
FEMLAB3.1
FEM
x3D
Universit� a
deglistudidiSalerno,Italy
Marraetal.(2007)
Meatb
atter
COMSO
L3.5
FEM
x3D
Universit� a
deglistudidiSalerno,Italy
Uyaretal.(2014)
Meatb
atter
COMSO
L4.3b
FEM
x3D
Universit� a
deglistudidiSalerno,Italy
Uyaretal.(2016)
Rawpotato
FAM
FEM
¡2D
-axi
University
ofCambridge,U
KNeoph
ytou
andMetaxas
(1996,1997,1998,1999)
Saltsolutio
nCC
C¡
x¡
Washing
tonStateUniversity,U
SAJiaoet
al.(2014b)
Thaw
ing
Lean
beef
COMSO
L4.3b
FEM
x3D
Universit� a
deglistudidiSalerno,Italy
Uyaretal.(2015)
Mashedpotato
COMSO
L3.2a
FEM
x3D
Washing
tonStateUniversity,U
SAWanget
al.(2008a)
Tuna
FEMAP
,PHOTO
-Wave-jv
andPhoto-Thermo
software
FEM
x3D
TokyoUniversity
ofMarineScienceand
Technology,Japan
Llaveet
al.(2015)
CRITICAL REVIEWS IN FOOD SCIENCE AND NUTRITION 9
(2003). They successfully solved the EM field by the trans-mission line method and the heat diffusion by the standardexplicit finite difference time domain method. Chan et al.
630 (2004) developed an effective model to simulate an actualRF heating cavity using the wave equation applied in 3Dinstead of the conventional electrostatic method. Similarly,Jumah (2005) solved the partial differential equations formodeling the RF-assisted fluidized bed drying of grains.
635 The temperature profiles and the nonuniformity of tem-perature distribution occurring during RF heating of cylin-drical meat batters, were analyzed by mathematicalmodeling of both electromagnetic and thermal phenomena(Marra et al., 2007). The goodness of model fit was evalu-
640 ated by comparing numerical results with measured tem-perature profiles. Multiphysics phenomena during RFheating of a foodstuff, shaped as cube, cylinder, or sphere,have been theoretically studied by Romano and Marra(2008). Tiwari et al. (2011a) employed a finite element
645 model to explore the effects of sample size, shape, position,and dielectric properties of wheat flour and the surroundingmedium, electrode gap, and top electrode configuration onthe RF power uniformity in wheat flour placed into a12 kW, 27.12 MHz parallel plate RF system and showed
650 that these factors significantly affected the RF power distri-bution in RF-treated flour. Then, a sensitivity study indi-cated that the heating uniformity of the raisins was mostaffected by the density of the samples followed by the topelectrode voltage, the DPs, the thermal conductivity and the
655 heat transfer coefficient (Alfaifi et al., 2014). Simulationresults also demonstrated that the variation in sample den-sity and specific heat, especially thermal conductivity, had arelatively slight effect on RF heating rate (Huang et al.,2015b). The RF heating rate was significantly influenced by
660 electrode gap, top electrode voltage, and the DPs and mois-ture content of the sample (Jiao et al., 2014b).
Huang et al. (2015c) developed a computer simulationmodel using a finite element-based commercial softwareand validated it using experimental dry soybeans packed
665 in a rectangular container (300 £ 220 £ 60 mm3) andheated in a 6 kW, 27.12 MHz RF system. The experimen-tal results were in good agreement with the simulationones, and both showed higher temperature values in themiddle and bottom layers compared with those of the top
670 layers. Corners and edges were heated more than centerareas in all layers. Therefore, rounding the edges and cor-ners in the containers or bending the top and bottom elec-trodes was key methods to control the electrical fieldinside the RF system (Alfaifi et al., 2016; Huang et al.,
675 2016b). More recently, Uyar et al. (2016) developed anumerical model to analyze power absorption, temperaturedistribution, heating rates and heating uniformity in proc-essed food material during RF heating when different pro-jection areas and different distances between electrodes
680 were considered. Results showed that geometrical factors,such as the projection of sample exposed surfaceon elec-trode surface and the distance between electrodes, have asignificant influence on heating rate, heating uniformityand power absorption in block-shaped foods undergoing
685 RF heating.
2.6.2. Computer simulation of RF pasteurization andsterilizationIn the specific application of RF energy to food sterilizationprocesses, both simulation and experiment results confirmed
690that the hot spots were located at the places near the corner ofthe sample (mashed potato), and the cold spots were at the cen-ter of the sample (Wang et al., 2008a). The temperature differ-ences between the simulation and experiment at cold spotswere within 5% (i.e., 6�C at 120�C), which limited the steriliza-
695tion value (F0) error to 3 min. During the food sterilization pro-cess, due to the exponential nature of the sterilizationcalculation, a small difference at temperatures above 121�C canintroduce a large variation in sterilization value. For example,an 11% temperature difference at 121�C represents a 13�C tem-
700perature difference between experiment and simulation, whichwould cause a significant error in predicting the F0 by simula-tion results. To guarantee the safety of commercially sterilizedfood, it is necessary to assure that the F0 of the cold spot reachesthe designated value.
705According to the recommendations of USDA-FSIS for thepasteurization of eggs, egg white must be heated up to 57.5�C,and the egg yolk has to be heated up to 61.1�C for 2 min (Devet al., 2012). For the individual whole eggs, which heated withRF heating in a vertical alignment in air would form a coagula-
710tion ring at the interface between the albumen, air cell, andshell before the yolk was sufficiently pasteurized. This phenom-enon was caused by redirection and concentration of the elec-tric field in the shell-air cell-albumen interface due to starklydifferent dielectric properties (Lau et al., 2016). Maxwell’s equa-
715tions and Fourier’s equation were solved for obtainingthe tem-perature distribution in eggs and the locations of hot and coldspots were determined (Dev et al., 2012). Their results showedthat egg white gets heated up faster than the egg yolk in the par-allel plate RF applicator, which was not desirable to sustain the
720functional properties of the egg. When the individual wholeeggs were rotated between the electrodes, the egg yolk washeated more than the egg white as preferred. For the egg prod-ucts in packages, it was possible to achieve more heating of theyolk than the white when the eggs were kept static and heated
725in the coaxial cavity RF applicator (Dev et al., 2012). This setup would be suitable for applications at an industrial scale.Therefore, two types of RF applicators namely parallel plate RFapplicator and coaxial cavity design were simulated and it wasfound that both the processes would be suitable for in-shell pas-
730teurization of eggs.Commercial peanut butter in a cylindrical jar was used as a
model of low moisture food subjected to RF heating when thecold spot location reached the target pasteurizing temperature(70�C) in a 6 kW, 27.12 MHz RF system. Based on both experi-
735ment and simulation results, the cold spot location was found tobe at the center of top and bottom surfaces for samples with orwithout PEI sheets. Their results indicated that the use of thePEI addition method has improved heating uniformity by reduc-ing themaximum temperature differencefrom 28 to 18�C in the
740peanut butter and therefore enhanced the potential for pasteuri-zation of low moisture foods heated in RF systems. After that,Jiao et al. (2015b) showed that a pair of PEI blocks with adiameter of 8 cm among all five diameters (2, 4, 6, 8, and 10 cm)added to the cold spots of a given peanut butter sample could
10 Z. HUANG ET AL.

745 make the sample reach the best heating uniformity. Further-more, the best height of PEI blocks with a diameter of 8 cm thatallows the sample to be heated most uniformly was found to be1.3 cm after sweeping from 0.1 to 2.3 cm with a step of 0.1 cm.
2.6.3. Computer simulation of RF disinfestations750 Differential heating or selective heating is a main advantage of
RF heating as compared to the conventional and MW heatingfor disinfestations. To provide a theoretical basis and experi-mental evidence to support the hypothesis that insect larvaecan be preferentially heated in food products by RF heating for
755 pest control. Wang et al. (2003a) developed a mathematicalmodel based on heat transfer and dielectric heating to predictpreferential heating of insect pests in dry nuts. The modelresults showed that the temperature of insects is 14.3 § 1.1�Chigher after 4 min of RF heating at 27 MHz than that of the
760 walnut kernels. The heating rate for the insect slurry is 1.4–1.7 times faster than for walnut kernels, confirming that theinsects are indeed preferentially heated in walnuts. Therefore,when the applied frequency and intensity of the electric fieldsare the same both for the pests and the host products, the heat
765 produced in the insects and the host products might be differ-ent due to different loss factor, resulting in different final tem-peratures of the insects and the host products after the sameperiod of RF heating (Huang et al., 2015a). To examine the rel-ative electric field intensities in the insects (Ei) and the host
770 products (Ep), a theoretical model was developed on the basisof interaction of electromagnetic waves with multi-phase mate-rials as following (Shrestha and Baik, 2013):
Ei D Ep3ep
2ep C ei
� �(29)
where ei is the relative complex permittivity of the insect (F/m),775 ep is the relative complex permittivity of host products (F/m),
Ei is the electric field within insect bodies (V/m), and Ep is theelectric field within host products (V/m).
To analyze the electric field distribution of insects under dif-ferent conditions, Eq. (29) can be shown as:
Eip D EiEp
D 31
2C ei 6 ep
� �(30)
781 where Eip is the ratio of E-fields per unit volume in the insectrelative to that in host medium.
To investigate the feasibility of RF selective heating of insectlarvae in soybeans, Huang et al. (2015a) solved the coupled
785 electromagnetic and heat transfer equations for developing asimulation model. Simulated and experimental results bothshowed that cold spots were located at the center part of eachlayer. After 6 min RF heating, the mean temperature differencesbetween insects and soybeans at the top, middle, and bottom
790 layers were 5.9, 6.6, and 6.2�C, respectively. Their resultsrevealed that the heating rate of insects was 1.4 times greaterthan that of soybeans. The simulated selective heating of insectsin soybeans may provide potential benefits in developing prac-tical RF treatments to ensure reliable control of insect pests
795 without adverse effects on product quality.
2.6.4. Computer simulation of RF thawingThe coupled electro-thermal problem of modeling an RF pro-cess becomes more complicated for simulation of thawing sincethe phase change process requires dealing with evolving large
800latent heat over a small range of temperature. Llave et al.(2015) constructed a 3D geometric model using FEMAP, theboundary and loading conditions, electric intensity, and otherparameters used in the model were set in Photo-Wave-jv foranalysis of the electromagnetic field, and set in Photo-Thermo
805for the heat transfer analysis to estimate the temperature distri-bution. To validate the simulated results, the tuna samples werethawed from ¡60 to ¡3�C (center temperature) using a13.56 MHz parallel plate RF system and by thawing in air. Thevalidated model was then successfully applied to studying the
810effects of electrode size on temperature uniformity in the RFthawing of frozen tuna muscle.
Uyar et al. (2015) also developed a computational modelin a3D domain with temperature-dependent thermo-physicalproperties (TPs) and DPs to improve the heating uniformity
815and to minimize runaway heating in a 50-V and a free runningoscillator RF system. The boxed frozen lean beef sample(�3.84 kg), shaped as a parallelepiped (200 £ 200 £ 100 mm3)was placed in a polypropylene container (not immersed inwater) on the center of the bottom electrode during RF experi-
820ments. Nonuniform temperature distribution during thawing,especially high temperatures encountered along the surface andcorners of the product, is a major disadvantage of a RF thawingsystem. As demonstrated by Uyar et al. (2015), during defrost-ing, thawing of outer surfaces occurs at the initial stages, while
825still frozen inside as parts are being surrounded by a low ther-mal conductivity layer leading to longer thawing times. There-fore, the thawing times are always higher for the larger sizes,and this issue makes the RF processes an unavailable industrialprocess. Therefore, it is necessary to systematically study the
830RF thawing characteristics and evaluate treatment parameterstoimprove the RF thawing uniformity in food industry basedonthe validated computer model.
3. Computer simulation for evaluating RF heatinguniformity in food processing
8353.1. The nonuniform RF heating characteristics
The sheer number of research on using RF heating in foodapplications gives a wealth of information for understandingthe process better (Fu, 2004; Hou et al., 2016; Marra et al.,2009; Piyasena et al., 2003). However, wide temperature varia-
840tions were observed within heated samples during RF heatingof different kinds of fruits (Alfaifi et al., 2014), grains (Jiaoet al., 2015a), meat (Llave et al., 2015; Zhang et al., 2004), modelfoods (Birla et al., 2008a), ready-to-eat meals (Orsat et al.,2001), vegetables (Liu et al., 2015), and various agricultural
845products (Fu, 2004; Gao et al., 2010). Moisture accumulationatthe surface of food during RF heating was studied by Datta andNi (2002). The temperature difference between the hottest andthe coldest spots in mashed potatoes (295 £ 235 £ 42 mm3)was greater than 30�C, after 320 s of RF heating (Wang et al.,
8502008a). Cold and hot spots occur in food load during dielectricheating due to nonuniform electrical field distribution.
CRITICAL REVIEWS IN FOOD SCIENCE AND NUTRITION 11
Temperature variation over the cross section of apple was dis-tinct with contour of maximum temperature (80�C) at fruitcore and minimum temperature (55�C) at surface from the
855 simulation results (Birla et al., 2008b). Both simulated andexperimental results showedthat immersion of the centerplacedmodel fruit in waterslightly shifted the hot spot toward the coreof the modelfruit. Moreover, the presence of water radicallyenhanced power coupling as it took only half time (7 min)
860 what required for RF heating of the fruits in air to reach »50�Ctemperature. Under similar conditions, very high electric fieldconcentrations occurred at the corners and edges of the cube,edges and the middle of the cylinder, whereas maximum E-fieldwas at the bottom of the sphere (Birla et al., 2008a). Tiwari et al.
865 (2011b) reported that nonuniform temperature distributionmay cause quality loss due to over or underheating in differentparts of a food product. Nonuniform temperature distributionresulting in cold spot has serious concerns in meat products
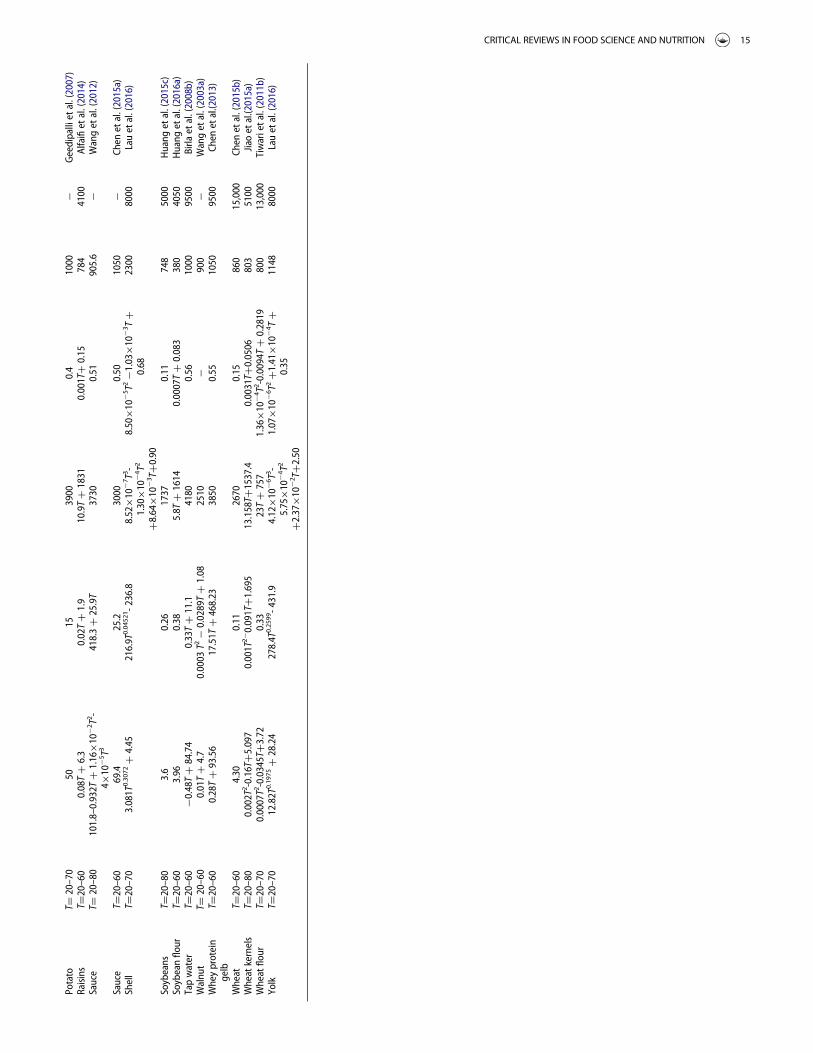
because of the survival of the bacteria resulting in health haz-870ards (Rincon et al., 2015).
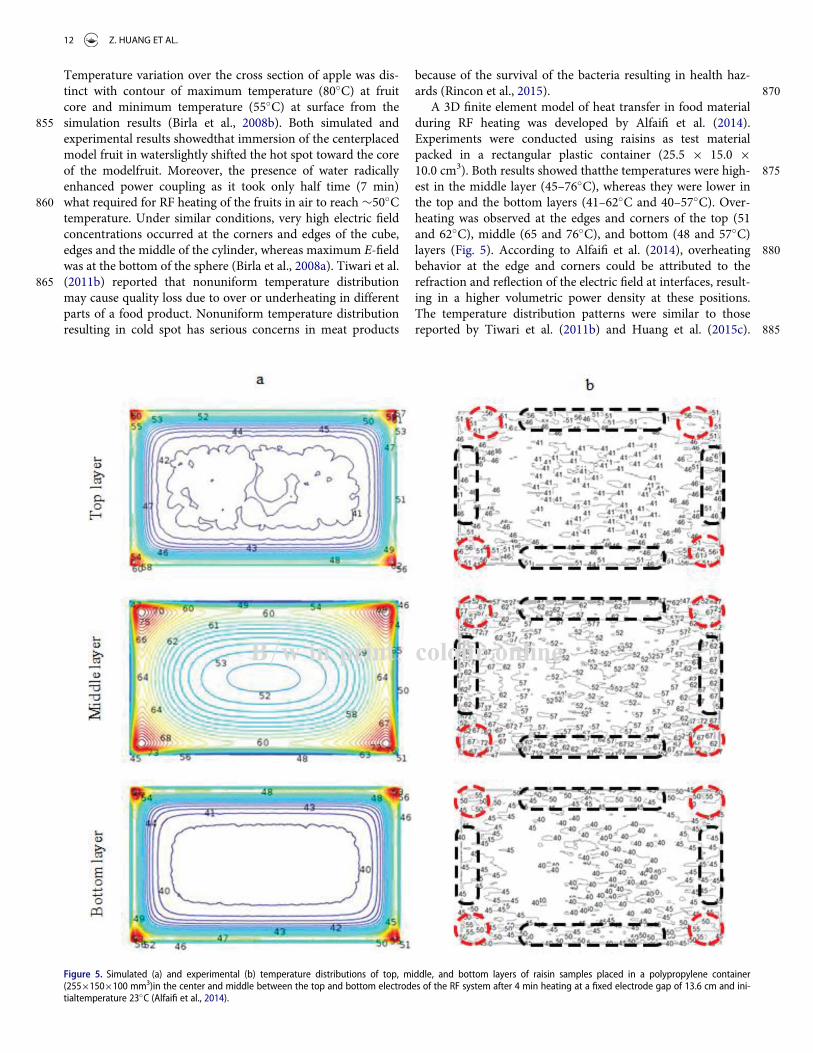
A 3D finite element model of heat transfer in food materialduring RF heating was developed by Alfaifi et al. (2014).Experiments were conducted using raisins as test materialpacked in a rectangular plastic container (25.5 £ 15.0 £
87510.0 cm3). Both results showed thatthe temperatures were high-est in the middle layer (45–76�C), whereas they were lower inthe top and the bottom layers (41–62�C and 40–57�C). Over-heating was observed at the edges and corners of the top (51and 62�C), middle (65 and 76�C), and bottom (48 and 57�C)
880layers (Fig. 5). According to Alfaifi et al. (2014), overheatingbehavior at the edge and corners could be attributed to therefraction and reflection of the electric field at interfaces, result-ing in a higher volumetric power density at these positions.The temperature distribution patterns were similar to those
885reported by Tiwari et al. (2011b) and Huang et al. (2015c).
Figure 5. Simulated (a) and experimental (b) temperature distributions of top, middle, and bottom layers of raisin samples placed in a polypropylene container(255£150£100 mm3)in the center and middle between the top and bottom electrodes of the RF system after 4 min heating at a fixed electrode gap of 13.6 cm and ini-tialtemperature 23�C (Alfaifi et al., 2014).
B=w in print; colour online
12 Z. HUANG ET AL.
Tiwari et al. (2011b) claimed that the temperature values werehigher at the middle layers and temperature at the top surfacewas lower than that in the middle layer because of a large evap-oration at the top surface. It is clear from the literature that
890 with the help of simulations, it may be possible to find newways to overcome nonuniform RF heating and speed up theincorporation of RF heating in the food industry with accept-able heating uniformity and product quality.
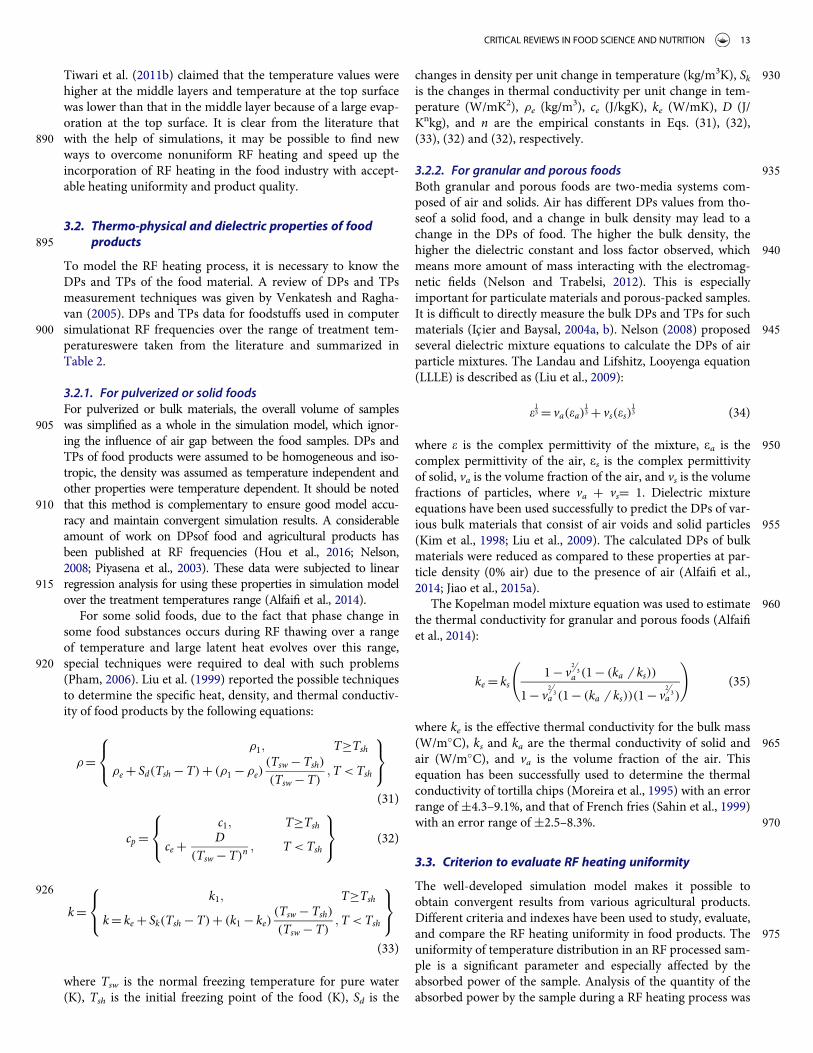
3.2. Thermo-physical and dielectric properties of food895 products
To model the RF heating process, it is necessary to know theDPs and TPs of the food material. A review of DPs and TPsmeasurement techniques was given by Venkatesh and Ragha-van (2005). DPs and TPs data for foodstuffs used in computer
900 simulationat RF frequencies over the range of treatment tem-peratureswere taken from the literature and summarized inTable 2.
3.2.1. For pulverized or solid foodsFor pulverized or bulk materials, the overall volume of samples
905 was simplified as a whole in the simulation model, which ignor-ing the influence of air gap between the food samples. DPs andTPs of food products were assumed to be homogeneous and iso-tropic, the density was assumed as temperature independent andother properties were temperature dependent. It should be noted
910 that this method is complementary to ensure good model accu-racy and maintain convergent simulation results. A considerableamount of work on DPsof food and agricultural products hasbeen published at RF frequencies (Hou et al., 2016; Nelson,2008; Piyasena et al., 2003). These data were subjected to linear
915 regression analysis for using these properties in simulation modelover the treatment temperatures range (Alfaifi et al., 2014).
For some solid foods, due to the fact that phase change insome food substances occurs during RF thawing over a rangeof temperature and large latent heat evolves over this range,
920 special techniques were required to deal with such problems(Pham, 2006). Liu et al. (1999) reported the possible techniquesto determine the specific heat, density, and thermal conductiv-ity of food products by the following equations:
rDr1; T�Tsh
re C Sd.Tsh ¡T/C .r1 ¡ re/.Tsw ¡Tsh/
.Tsw ¡T/;T <Tsh
8<:
9=;(31)
cp Dc1; T�Tsh
ce C D.Tsw ¡T/n
; T <Tsh
8<:
9=; (32)
926
kDk1; T�Tsh
kD ke C Sk.Tsh ¡T/C .k1 ¡ ke/.Tsw ¡Tsh/
.Tsw ¡T/;T <Tsh
8<:
9=;(33)
where Tsw is the normal freezing temperature for pure water(K), Tsh is the initial freezing point of the food (K), Sd is the
930changes in density per unit change in temperature (kg/m3K), Skis the changes in thermal conductivity per unit change in tem-perature (W/mK2), re (kg/m
3), ce (J/kgK), ke (W/mK), D (J/Knkg), and n are the empirical constants in Eqs. (31), (32),(33), (32) and (32), respectively.
9353.2.2. For granular and porous foodsBoth granular and porous foods are two-media systems com-posed of air and solids. Air has different DPs values from tho-seof a solid food, and a change in bulk density may lead to achange in the DPs of food. The higher the bulk density, the
940higher the dielectric constant and loss factor observed, whichmeans more amount of mass interacting with the electromag-netic fields (Nelson and Trabelsi, 2012). This is especiallyimportant for particulate materials and porous-packed samples.It is difficult to directly measure the bulk DPs and TPs for such
945materials (Icier and Baysal, 2004a, b). Nelson (2008) proposedseveral dielectric mixture equations to calculate the DPs of airparticle mixtures. The Landau and Lifshitz, Looyenga equation(LLLE) is described as (Liu et al., 2009):
e13 D va.ea/
13 C vs.es/
13 (34)
950where e is the complex permittivity of the mixture, ea is thecomplex permittivity of the air, es is the complex permittivityof solid, va is the volume fraction of the air, and vs is the volumefractions of particles, where va C vsD 1. Dielectric mixtureequations have been used successfully to predict the DPs of var-
955ious bulk materials that consist of air voids and solid particles(Kim et al., 1998; Liu et al., 2009). The calculated DPs of bulkmaterials were reduced as compared to these properties at par-ticle density (0% air) due to the presence of air (Alfaifi et al.,2014; Jiao et al., 2015a).
960The Kopelman model mixture equation was used to estimatethe thermal conductivity for granular and porous foods (Alfaifiet al., 2014):
ke D ks1¡ v
2=3a .1¡ .ka 6 ks//
1¡ v2=3a .1¡ .ka 6 ks//.1¡ v
2=3a /
!(35)
where ke is the effective thermal conductivity for the bulk mass965(W/m�C), ks and ka are the thermal conductivity of solid and
air (W/m�C), and va is the volume fraction of the air. Thisequation has been successfully used to determine the thermalconductivity of tortilla chips (Moreira et al., 1995) with an errorrange of §4.3–9.1%, and that of French fries (Sahin et al., 1999)
970with an error range of §2.5–8.3%.
3.3. Criterion to evaluate RF heating uniformity
The well-developed simulation model makes it possible toobtain convergent results from various agricultural products.Different criteria and indexes have been used to study, evaluate,
975and compare the RF heating uniformity in food products. Theuniformity of temperature distribution in an RF processed sam-ple is a significant parameter and especially affected by theabsorbed power of the sample. Analysis of the quantity of theabsorbed power by the sample during a RF heating process was
CRITICAL REVIEWS IN FOOD SCIENCE AND NUTRITION 13
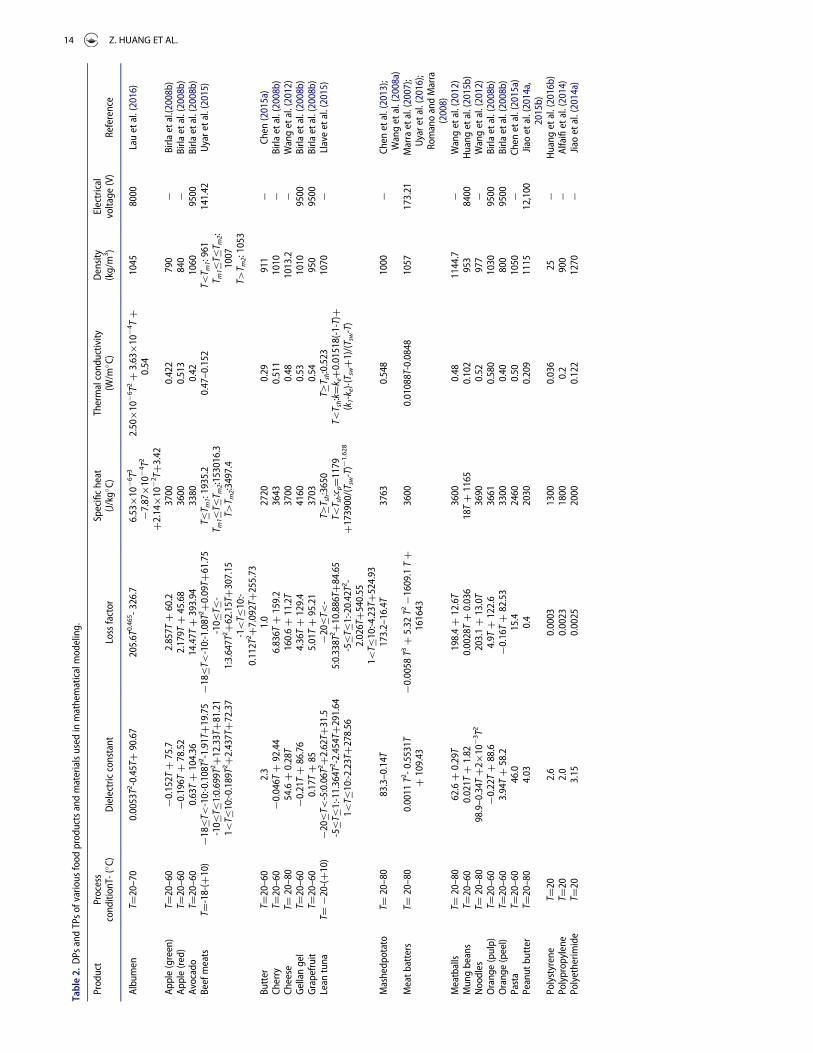
Table2.
DPs
andTPsof
vario
usfood
productsandmaterialsused
inmathematicalmodeling.
Product
Process
cond
itionT-(�C)
Dielectric
constant
Lossfactor
Specificheat
(J/kg�C)
Thermalcond
uctivity
(W/m
� C)
Density
(kg/m
3 )Electrical
voltage
(V)
Reference
Albu
men
TD20–70
0.0053T2-0.45TC
90.67
205.6T
0.465 -326.7
6.53£1
0¡6 T
3
¡7.87£
10¡4T2
C2.14£
10¡2TC
3.42
2.50£1
0¡6 T
2C
3.63£1
0¡4 T
C0.54
1045
8000
Lauetal.(2016)
Apple(green)
TD20–60
¡0.152TC
75.7
2.857T
C60.2
3700
0.422
790
¡Birla
etal.(2008b)
Apple(red)
TD20–60
¡0.196TC
78.52
2.179T
C45.68
3600
0.513
840
¡Birla
etal.(2008b)
Avocado
TD20–60
0.63TC
104.36
14.47T
C393.94
3380
0.42
1060
9500
Birla
etal.(2008b)
Beefmeats
TD-18-(C
10)
¡18�
T<-10:-0.108T2-1.91TC1
9.75
-10�
T�1:0.699T
2 C12.33TC8
1.21
1<T�
10:-0.189T2C2
.437TC
72.37
¡18�
T<-10:-1.08T
2 C0.09TC
61.75
-10�
T�-
1:3.647T
2 C62.15TC3
07.15
-1<T�
10:-
0.112T
2 C7.092TC2
55.73
T�T m
1:1935.2
T m1�
T�T m
2:153016.3
T>T m
2:3497.4
0.47–0.152
T<T m
1:961
T m1�
T�T m
2:1007
T>T m
2:1053
141.42
Uyare
tal.(2015)
Butter
TD20–60
2.3
1.0
2720
0.29
911
¡Ch
en(2015a)
Cherry
TD20–60
¡0.046TC
92.44
6.836T
C159.2
3643
0.511
1010
¡Birla
etal.(2008b)
Cheese
TD20–80
54.6C
0.28T
160.6C
11.2T
3700
0.48
1013.2
¡Wanget
al.(2012)
Gellangel
TD20–60
¡0.21T
C86.76
4.36TC
129.4
4160
0.53
1010
9500
Birla
etal.(2008b)
Grapefruit
TD20–60
0.17TC
855.01TC
95.21
3703
0.54
950
9500
Birla
etal.(2008b)
Lean
tuna
TD¡2
0-(C
10)
¡20�
T<-5:0.06T
2 C2.62TC
31.5
-5�T
�1:-11.364T
2 -2.454TC2
91.64
1<T�
10:-2.23TC2
78.56
¡20�
T<-
5:0.338T
2 C10.886TC
84.65
-5�T
�1:-20.42T2-
2.026TC5
40.55
1<T�
10:-4.23TC5
24.93
T�T sh:3
650
T<T sh:c
pD1179
C173900/(Tsw-T)¡
1.628
T�T sh:0
.523
T<T sh:kDk
eC0.01518(-1-T)C
(k1-k e)¢(T
swC1
)/(Tsw-T)
1070
¡Llaveetal.(2015)
Mashedp
otato
TD20–80
83.3–0.14T
173.2–16.4T
3763
0.548
1000
¡Ch
enetal.(2013);
Wanget
al.(2008a)
Meatb
atters
TD20–80
0.0011
T2-0
.5531T
C109.43
¡0.0058T3
C5.32
T2¡1
609.1TC
161643
3600
0.01088T-0.0848
1057
173.21
Marraetal.(2007);
Uyare
tal.(2016);
RomanoandMarra
(2008)
Meatballs
TD20–80
62.6C
0.29T
198.4C
12.6T
3600
0.48
1144.7
¡Wanget
al.(2012)
Mungbeans
TD20–60
0.021T
C1.82
0.0028TC
0.036
18TC
1165
0.102
953
8400
Huang
etal.(2015b)
Noodles
TD20–80
98.9–0.34T
C2£1
0¡3 T
2203.1C
13.0T
3690
0.52
977
¡Wanget
al.(2012)
Orang
e(pulp)
TD20–60
¡0.22T
C88.6
4.9T
C122.6
3661
0.580
1030
9500
Birla
etal.(2008b)
Orang
e(peel)
TD20–60
3.94TC
58.2
¡0.16T
C82.53
3300
0.40
800
9500
Birla
etal.(2008b)
Pasta
TD20–60
46.0
15.4
2460
0.50
1050
¡Ch
enet
al.(2015a)
Peanut
butter
TD20–80
4.03
0.4
2030
0.209
1115
12,100
Jiaoetal.(2014a,
2015b)
Polystyrene
TD20
2.6
0.0003
1300
0.036
25¡
Huang
etal.(2016b)
Polypropylene
TD20
2.0
0.0023
1800
0.2
900
¡Alfaifiet
al.(2014)
Polyetherim
ide
TD20
3.15
0.0025
2000
0.122
1270
¡Jiaoetal.(2014a)
14 Z. HUANG ET AL.
Potato
TD20–70
5015
3900
0.4
1000
¡Geedipallietal.(2007)
Raisins
TD20–60
0.08TC
6.3
0.02TC
1.9
10.9TC
1831
0.001TC
0.15
784
4100
Alfaifiet
al.(2014)
Sauce
TD20–80
101.8–0.932T
C1.16£1
0¡2 T
2 -4£
10¡5T3
418.3C
25.9T
3730
0.51
905.6
¡Wanget
al.(2012)
Sauce
TD20–60
69.4
25.2
3000
0.50
1050
¡Ch
enet
al.(2015a)
Shell
TD20–70
3.081T
0.3072C
4.45
216.9T
0.04521 -236.8
8.52£1
0¡7 T
3 -1.30£1
0¡4 T
2
C8.64£
10¡3TC
0.90
8.50£1
0¡5 T
2¡1
.03£
10¡3TC
0.68
2300
8000
Lauetal.(2016)
Soybeans
TD20–80
3.6
0.26
1737
0.11
748
5000
Huang
etal.(2015c)
Soybeanflour
TD20–60
3.96
0.38
5.8T
C1614
0.0007TC
0.083
380
4050
Huang
etal.(2016a)
Tapwater
TD20–60
¡0.48T
C84.74
0.33TC
11.1
4180
0.56
1000
9500
Birla
etal.(2008b)
Walnu
tTD
20–60
0.01TC
4.7
0.0003
T2¡
0.0289TC
1.08
2510
¡900
¡Wangetal.(2003a)
Wheyprotein
gelb
TD20–60
0.28TC
93.56
17.51T
C468.23
3850
0.55
1050
9500
Chen
etal.(2013)
Wheat
TD20–60
4.30
0.11
2670
0.15
860
15,000
Chen
etal.(2015b)
Wheatkernels
TD20–80
0.002T
2 -0.16TC
5.097
0.001T
2¡0.091TC1
.695
13.158TC
1537.4
0.0031TC
0.0506
803
5100
Jiaoetal.(2015a)
Wheatflour
TD20–70
0.0007T2-0.0345TC3
.72
0.33
23TC
757
1.36£1
0¡4 T
2 -0.0094TC
0.2819
800
13,000
Tiwarietal.(2011b)
Yolk
TD20–70
12.82T
0.1975C
28.24
278.4T
0.2599-4
31.9
4.12£1
0¡6 T
3 -5.75£1
0¡4 T
2
C2.37£
10¡2TC
2.50
1.07£1
0¡6 T
2C1
.41£
10¡4TC
0.35
1148
8000
Lauetal.(2016)
CRITICAL REVIEWS IN FOOD SCIENCE AND NUTRITION 15

980 conducted by Neophytou and Metaxas (1998). Tiwari et al.(2011a) defined the power uniformity index (PUI) where thesmaller PUI value demonstrates an improved power uniformityin the processed sample, and a well-designed RF system wasreported to result in lower PUI values:
PUID1
Vvol
RVvol
sqrt..Q¡Qav/2/dVvol
Qav(36)
986 where the minimum value of PUI is zero, which indicates uni-form RF power in dielectric materials.
The average RF power density (Qav, W/m3) in a dielectricmaterial is defined as the volume integral of the RF power den-
990 sity (Q, W/m3) divided by material volume (Vvol, m3).
Qav D 1Vvol
RVvol
QdVvol (37)
Besides the changes in the processed and absorbed powers,temperature-related calculations were other approaches to
995 determine the temperature distribution uniformity in thetreated products. The heating uniformity of the treated sampleswas evaluated using the heating uniformity index (λ). It isdefined as the ratio of the rise in standard deviation of sampletemperature to the rise in average sample temperature during-
1000 treatment and can be calculated by the following equation(Wang et al., 2005):
λD Ds
DmD
ffiffiffiffiffiffiffiffiffiffiffiffiffiffiffis2 ¡ s2
0
pm¡m0
(38)
where s0 and s are the standard deviations of the initial andfinal temperature distributions, respectively. m0 and m are the
1005 means of the initial and final temperature distributions, respec-tively. The smaller the λ value, the better the RF heating unifor-mity. Heating uniformity index was used for evaluating RFheating uniformity in almond (Gao et al., 2010), corn (Zhenget al., 2016), coffee bean (Pan et al., 2012), legumes (Jiao et al.,
1010 2012; Wang et al., 2010), rice (Zhou and Wang, 2016), and wal-nut (Wang et al., 2007a).
Another formulation of a temperature uniformity index(UI) of the treated samples in simulation is given by the follow-ing equation (Alfaifi et al., 2014):
UID1
Vvol
RVvol
ffiffiffiffiffiffiffiffiffiffiffiffiffiffiffiffiffiffiffiffiffi.T ¡Tav/
2p
dVvol
Tav ¡Tinitial(39)
1016 where Vvol is the material volume (m3), T and Tav are local andaverage temperatures (K) inside the dielectric material over thevolume (Vvol, m
3). This index is a useful tool to evaluate theheating uniformity when using a fixed configuration and a spe-
1020 cific RF unit. The smaller UI values indicate an improvedRFheating uniformity.
A new temperature uniformity index (TUI) was proposedbased on Alfaifi’s UI by replacing the average temperature (Tav)with the target temperature (Tt) in the following form (Jiao
1025et al., 2015b):
TUIDRVvol
jT ¡Tt j dVvol
.Tt ¡Tinitial/Vvol(40)
where Tt is the target heating temperature (K). Also in this case,a smaller index corresponds to better heating uniformity. Thenew TUI might be more suitable for describing the heating uni-
1030formity of a pasteurization/sterilization process, which requiresthe cold spot location to reach a certain target temperatureneeded for controlling pathogens. It would reflect the degree towhich temperature in the volume deviated from the targettemperature.
10353.4. Factors influencing RF heating uniformity
During RF processing, several interacting factors influenceheating uniformity. These factors include the design of RF heat-ing systems (e.g. the inductance positions and feeding strips,electrode shape and electrode configuration), packaging geome-
1040tries, DPs, and TPs of the treated materials, position of thetreated materials within the RF units, and the surroundingmedia (Fu, 2004). The following subsection summarizes variousfactors that influence RF heating uniformity.
3.4.1. Nonuniformity due to electromagnetic field1045The nonuniform electromagnetic field distribution is the major
factor resulting in nonuniform heating during RF treatments(Wang et al., 2007a). Many factors are included in the design ofRF heating systems, such as the voltage of the top electrode,electrode shape, and power output, shape, TPs and DPs of the
1050samples, and position of the samples in the RF units, whichmay influence electromagnetic field distributions in RF-treatedagricultural products (Fu, 2004; Marra et al., 2009; Tiwari et al.,2011a).
The electric field between two parallel plate electrodes was in1055parallel lines uniformly spaced throughout the region between
two electrodes, and perpendicular to their surfaces with nodielectric material placed in it (Huang et al., 2016a). Fig. 6shows a typical electromagnetic field distribution for a rectan-gular-shaped dielectric material placed between two parallel
1060plate electrodes. When the dielectric material was placed at thecenter of the bottom electrode with an air gap over it, the pres-ence of the surrounding air causes an intensification of theheating near the top of the electrode space at the edges of thematerial, forming hot spots and cold spots. Samples placed in
1065the middle of RF electrodes showed higher electricfield inten-sity at their central section as electric field deflected by both(top and bottom) edges with increased electricfield concentra-tion at the central parts of the sample (Uyar et al., 2015). There-fore, it is essential that the electromagnetic field within food
1070geometry should be uniform to ensure even heating. To achievethis, some additional methods (electrode attachments, samplemovement, and/or mixing) could be used to ensure RF heatinguniformity in industrial applications. According to Alfaifi et al.(2016) and Huang et al. (2016b), the uniformity of electromag-
1075netic field for a rectangular shaped food sample was improved
16 Z. HUANG ET AL.
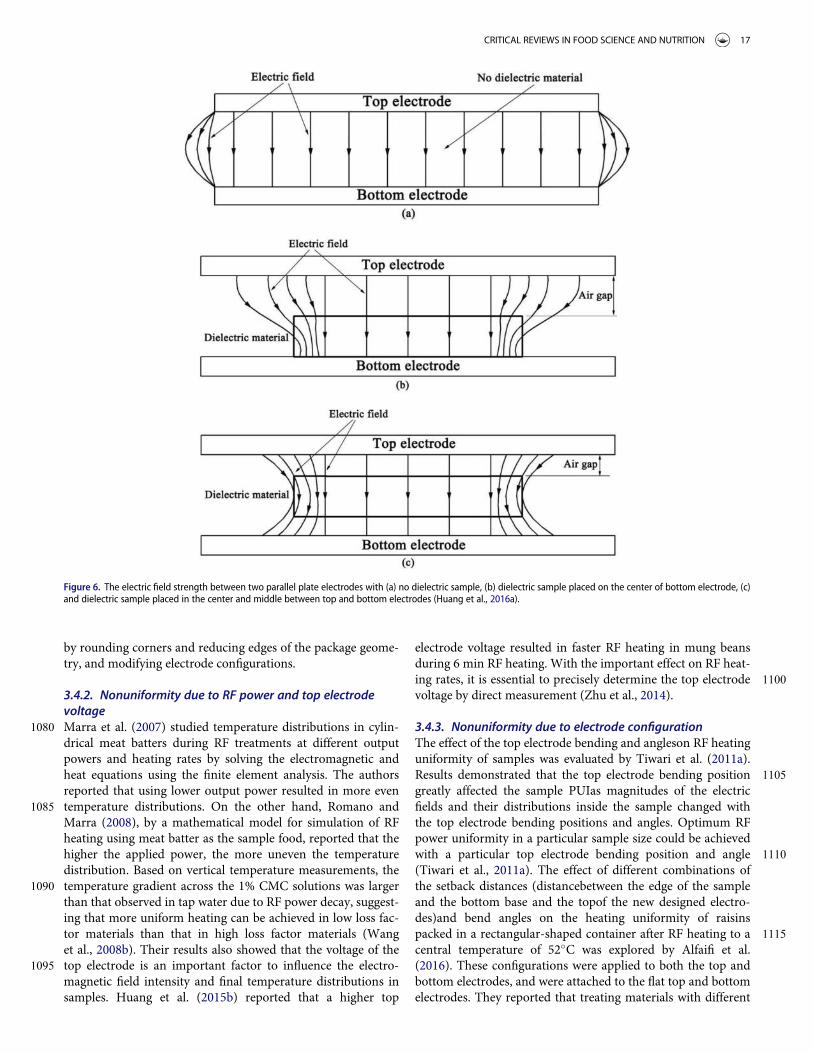
by rounding corners and reducing edges of the package geome-try, and modifying electrode configurations.
3.4.2. Nonuniformity due to RF power and top electrodevoltage
1080 Marra et al. (2007) studied temperature distributions in cylin-drical meat batters during RF treatments at different outputpowers and heating rates by solving the electromagnetic andheat equations using the finite element analysis. The authorsreported that using lower output power resulted in more even
1085 temperature distributions. On the other hand, Romano andMarra (2008), by a mathematical model for simulation of RFheating using meat batter as the sample food, reported that thehigher the applied power, the more uneven the temperaturedistribution. Based on vertical temperature measurements, the
1090 temperature gradient across the 1% CMC solutions was largerthan that observed in tap water due to RF power decay, suggest-ing that more uniform heating can be achieved in low loss fac-tor materials than that in high loss factor materials (Wanget al., 2008b). Their results also showed that the voltage of the
1095 top electrode is an important factor to influence the electro-magnetic field intensity and final temperature distributions insamples. Huang et al. (2015b) reported that a higher top
electrode voltage resulted in faster RF heating in mung beansduring 6 min RF heating. With the important effect on RF heat-
1100ing rates, it is essential to precisely determine the top electrodevoltage by direct measurement (Zhu et al., 2014).
3.4.3. Nonuniformity due to electrode configurationThe effect of the top electrode bending and angleson RF heatinguniformity of samples was evaluated by Tiwari et al. (2011a).
1105Results demonstrated that the top electrode bending positiongreatly affected the sample PUIas magnitudes of the electricfields and their distributions inside the sample changed withthe top electrode bending positions and angles. Optimum RFpower uniformity in a particular sample size could be achieved
1110with a particular top electrode bending position and angle(Tiwari et al., 2011a). The effect of different combinations ofthe setback distances (distancebetween the edge of the sampleand the bottom base and the topof the new designed electro-des)and bend angles on the heating uniformity of raisins
1115packed in a rectangular-shaped container after RF heating to acentral temperature of 52�C was explored by Alfaifi et al.(2016). These configurations were applied to both the top andbottom electrodes, and were attached to the flat top and bottomelectrodes. They reported that treating materials with different
Figure 6. The electric field strength between two parallel plate electrodes with (a) no dielectric sample, (b) dielectric sample placed on the center of bottom electrode, (c)and dielectric sample placed in the center and middle between top and bottom electrodes (Huang et al., 2016a).
CRITICAL REVIEWS IN FOOD SCIENCE AND NUTRITION 17
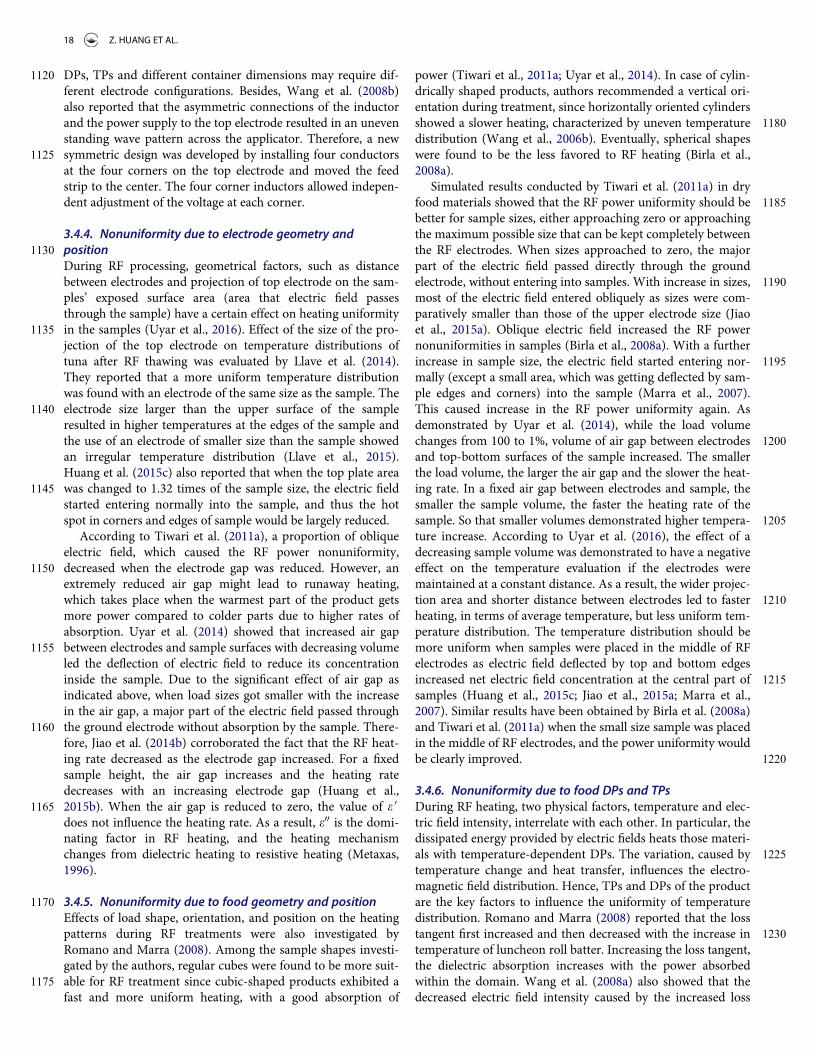
1120 DPs, TPs and different container dimensions may require dif-ferent electrode configurations. Besides, Wang et al. (2008b)also reported that the asymmetric connections of the inductorand the power supply to the top electrode resulted in an unevenstanding wave pattern across the applicator. Therefore, a new
1125 symmetric design was developed by installing four conductorsat the four corners on the top electrode and moved the feedstrip to the center. The four corner inductors allowed indepen-dent adjustment of the voltage at each corner.
3.4.4. Nonuniformity due to electrode geometry and1130 position
During RF processing, geometrical factors, such as distancebetween electrodes and projection of top electrode on the sam-ples’ exposed surface area (area that electric field passesthrough the sample) have a certain effect on heating uniformity
1135 in the samples (Uyar et al., 2016). Effect of the size of the pro-jection of the top electrode on temperature distributions oftuna after RF thawing was evaluated by Llave et al. (2014).They reported that a more uniform temperature distributionwas found with an electrode of the same size as the sample. The
1140 electrode size larger than the upper surface of the sampleresulted in higher temperatures at the edges of the sample andthe use of an electrode of smaller size than the sample showedan irregular temperature distribution (Llave et al., 2015).Huang et al. (2015c) also reported that when the top plate area
1145 was changed to 1.32 times of the sample size, the electric fieldstarted entering normally into the sample, and thus the hotspot in corners and edges of sample would be largely reduced.
According to Tiwari et al. (2011a), a proportion of obliqueelectric field, which caused the RF power nonuniformity,
1150 decreased when the electrode gap was reduced. However, anextremely reduced air gap might lead to runaway heating,which takes place when the warmest part of the product getsmore power compared to colder parts due to higher rates ofabsorption. Uyar et al. (2014) showed that increased air gap
1155 between electrodes and sample surfaces with decreasing volumeled the deflection of electric field to reduce its concentrationinside the sample. Due to the significant effect of air gap asindicated above, when load sizes got smaller with the increasein the air gap, a major part of the electric field passed through
1160 the ground electrode without absorption by the sample. There-fore, Jiao et al. (2014b) corroborated the fact that the RF heat-ing rate decreased as the electrode gap increased. For a fixedsample height, the air gap increases and the heating ratedecreases with an increasing electrode gap (Huang et al.,
1165 2015b). When the air gap is reduced to zero, the value of e 0does not influence the heating rate. As a result, e00 is the domi-nating factor in RF heating, and the heating mechanismchanges from dielectric heating to resistive heating (Metaxas,1996).
1170 3.4.5. Nonuniformity due to food geometry and positionEffects of load shape, orientation, and position on the heatingpatterns during RF treatments were also investigated byRomano and Marra (2008). Among the sample shapes investi-gated by the authors, regular cubes were found to be more suit-
1175 able for RF treatment since cubic-shaped products exhibited afast and more uniform heating, with a good absorption of
power (Tiwari et al., 2011a; Uyar et al., 2014). In case of cylin-drically shaped products, authors recommended a vertical ori-entation during treatment, since horizontally oriented cylinders
1180showed a slower heating, characterized by uneven temperaturedistribution (Wang et al., 2006b). Eventually, spherical shapeswere found to be the less favored to RF heating (Birla et al.,2008a).
Simulated results conducted by Tiwari et al. (2011a) in dry1185food materials showed that the RF power uniformity should be
better for sample sizes, either approaching zero or approachingthe maximum possible size that can be kept completely betweenthe RF electrodes. When sizes approached to zero, the majorpart of the electric field passed directly through the ground
1190electrode, without entering into samples. With increase in sizes,most of the electric field entered obliquely as sizes were com-paratively smaller than those of the upper electrode size (Jiaoet al., 2015a). Oblique electric field increased the RF powernonuniformities in samples (Birla et al., 2008a). With a further
1195increase in sample size, the electric field started entering nor-mally (except a small area, which was getting deflected by sam-ple edges and corners) into the sample (Marra et al., 2007).This caused increase in the RF power uniformity again. Asdemonstrated by Uyar et al. (2014), while the load volume
1200changes from 100 to 1%, volume of air gap between electrodesand top-bottom surfaces of the sample increased. The smallerthe load volume, the larger the air gap and the slower the heat-ing rate. In a fixed air gap between electrodes and sample, thesmaller the sample volume, the faster the heating rate of the
1205sample. So that smaller volumes demonstrated higher tempera-ture increase. According to Uyar et al. (2016), the effect of adecreasing sample volume was demonstrated to have a negativeeffect on the temperature evaluation if the electrodes weremaintained at a constant distance. As a result, the wider projec-
1210tion area and shorter distance between electrodes led to fasterheating, in terms of average temperature, but less uniform tem-perature distribution. The temperature distribution should bemore uniform when samples were placed in the middle of RFelectrodes as electric field deflected by top and bottom edges
1215increased net electric field concentration at the central part ofsamples (Huang et al., 2015c; Jiao et al., 2015a; Marra et al.,2007). Similar results have been obtained by Birla et al. (2008a)and Tiwari et al. (2011a) when the small size sample was placedin the middle of RF electrodes, and the power uniformity would
1220be clearly improved.
3.4.6. Nonuniformity due to food DPs and TPsDuring RF heating, two physical factors, temperature and elec-tric field intensity, interrelate with each other. In particular, thedissipated energy provided by electric fields heats those materi-
1225als with temperature-dependent DPs. The variation, caused bytemperature change and heat transfer, influences the electro-magnetic field distribution. Hence, TPs and DPs of the productare the key factors to influence the uniformity of temperaturedistribution. Romano and Marra (2008) reported that the loss
1230tangent first increased and then decreased with the increase intemperature of luncheon roll batter. Increasing the loss tangent,the dielectric absorption increases with the power absorbedwithin the domain. Wang et al. (2008a) also showed that thedecreased electric field intensity caused by the increased loss
18 Z. HUANG ET AL.
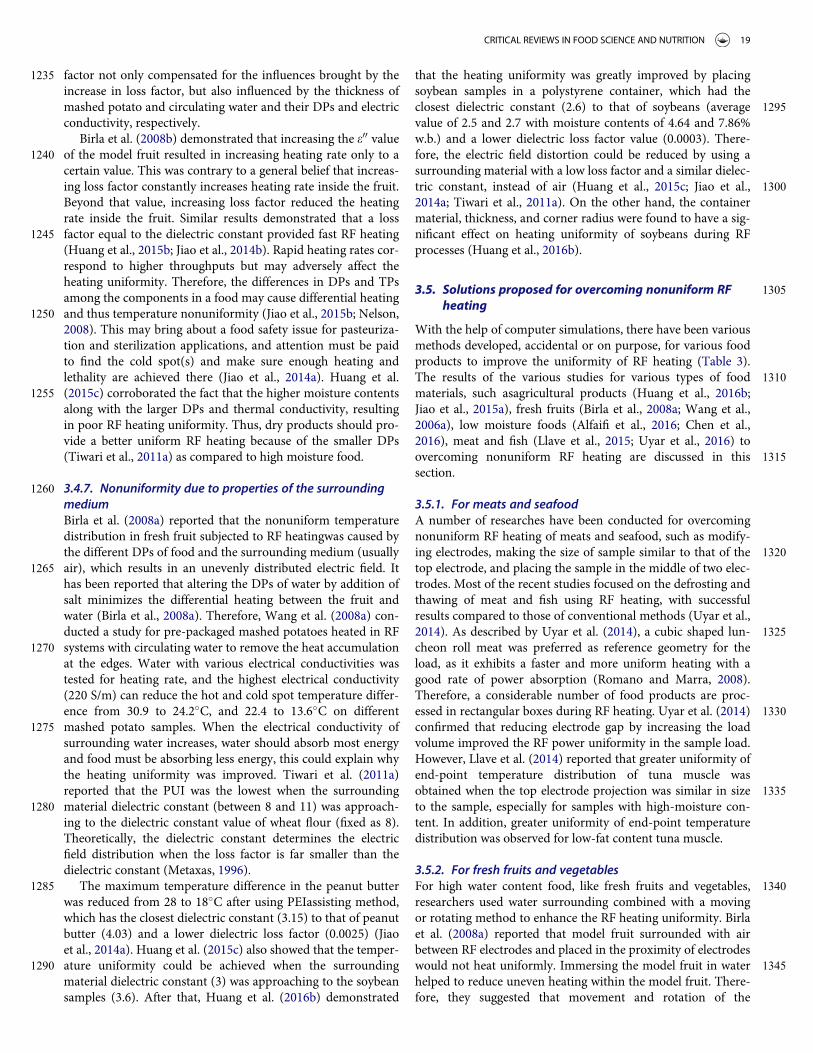
1235 factor not only compensated for the influences brought by theincrease in loss factor, but also influenced by the thickness ofmashed potato and circulating water and their DPs and electricconductivity, respectively.
Birla et al. (2008b) demonstrated that increasing the e00 value1240 of the model fruit resulted in increasing heating rate only to a
certain value. This was contrary to a general belief that increas-ing loss factor constantly increases heating rate inside the fruit.Beyond that value, increasing loss factor reduced the heatingrate inside the fruit. Similar results demonstrated that a loss
1245 factor equal to the dielectric constant provided fast RF heating(Huang et al., 2015b; Jiao et al., 2014b). Rapid heating rates cor-respond to higher throughputs but may adversely affect theheating uniformity. Therefore, the differences in DPs and TPsamong the components in a food may cause differential heating
1250 and thus temperature nonuniformity (Jiao et al., 2015b; Nelson,2008). This may bring about a food safety issue for pasteuriza-tion and sterilization applications, and attention must be paidto find the cold spot(s) and make sure enough heating andlethality are achieved there (Jiao et al., 2014a). Huang et al.
1255 (2015c) corroborated the fact that the higher moisture contentsalong with the larger DPs and thermal conductivity, resultingin poor RF heating uniformity. Thus, dry products should pro-vide a better uniform RF heating because of the smaller DPs(Tiwari et al., 2011a) as compared to high moisture food.
1260 3.4.7. Nonuniformity due to properties of the surroundingmediumBirla et al. (2008a) reported that the nonuniform temperaturedistribution in fresh fruit subjected to RF heatingwas caused bythe different DPs of food and the surrounding medium (usually
1265 air), which results in an unevenly distributed electric field. Ithas been reported that altering the DPs of water by addition ofsalt minimizes the differential heating between the fruit andwater (Birla et al., 2008a). Therefore, Wang et al. (2008a) con-ducted a study for pre-packaged mashed potatoes heated in RF
1270 systems with circulating water to remove the heat accumulationat the edges. Water with various electrical conductivities wastested for heating rate, and the highest electrical conductivity(220 S/m) can reduce the hot and cold spot temperature differ-ence from 30.9 to 24.2�C, and 22.4 to 13.6�C on different
1275 mashed potato samples. When the electrical conductivity ofsurrounding water increases, water should absorb most energyand food must be absorbing less energy, this could explain whythe heating uniformity was improved. Tiwari et al. (2011a)reported that the PUI was the lowest when the surrounding
1280 material dielectric constant (between 8 and 11) was approach-ing to the dielectric constant value of wheat flour (fixed as 8).Theoretically, the dielectric constant determines the electricfield distribution when the loss factor is far smaller than thedielectric constant (Metaxas, 1996).
1285 The maximum temperature difference in the peanut butterwas reduced from 28 to 18�C after using PEIassisting method,which has the closest dielectric constant (3.15) to that of peanutbutter (4.03) and a lower dielectric loss factor (0.0025) (Jiaoet al., 2014a). Huang et al. (2015c) also showed that the temper-
1290 ature uniformity could be achieved when the surroundingmaterial dielectric constant (3) was approaching to the soybeansamples (3.6). After that, Huang et al. (2016b) demonstrated
that the heating uniformity was greatly improved by placingsoybean samples in a polystyrene container, which had the
1295closest dielectric constant (2.6) to that of soybeans (averagevalue of 2.5 and 2.7 with moisture contents of 4.64 and 7.86%w.b.) and a lower dielectric loss factor value (0.0003). There-fore, the electric field distortion could be reduced by using asurrounding material with a low loss factor and a similar dielec-
1300tric constant, instead of air (Huang et al., 2015c; Jiao et al.,2014a; Tiwari et al., 2011a). On the other hand, the containermaterial, thickness, and corner radius were found to have a sig-nificant effect on heating uniformity of soybeans during RFprocesses (Huang et al., 2016b).
13053.5. Solutions proposed for overcoming nonuniform RFheating
With the help of computer simulations, there have been variousmethods developed, accidental or on purpose, for various foodproducts to improve the uniformity of RF heating (Table 3).
1310The results of the various studies for various types of foodmaterials, such asagricultural products (Huang et al., 2016b;Jiao et al., 2015a), fresh fruits (Birla et al., 2008a; Wang et al.,2006a), low moisture foods (Alfaifi et al., 2016; Chen et al.,2016), meat and fish (Llave et al., 2015; Uyar et al., 2016) to
1315overcoming nonuniform RF heating are discussed in thissection.
3.5.1. For meats and seafoodA number of researches have been conducted for overcomingnonuniform RF heating of meats and seafood, such as modify-
1320ing electrodes, making the size of sample similar to that of thetop electrode, and placing the sample in the middle of two elec-trodes. Most of the recent studies focused on the defrosting andthawing of meat and fish using RF heating, with successfulresults compared to those of conventional methods (Uyar et al.,
13252014). As described by Uyar et al. (2014), a cubic shaped lun-cheon roll meat was preferred as reference geometry for theload, as it exhibits a faster and more uniform heating with agood rate of power absorption (Romano and Marra, 2008).Therefore, a considerable number of food products are proc-
1330essed in rectangular boxes during RF heating. Uyar et al. (2014)confirmed that reducing electrode gap by increasing the loadvolume improved the RF power uniformity in the sample load.However, Llave et al. (2014) reported that greater uniformity ofend-point temperature distribution of tuna muscle was
1335obtained when the top electrode projection was similar in sizeto the sample, especially for samples with high-moisture con-tent. In addition, greater uniformity of end-point temperaturedistribution was observed for low-fat content tuna muscle.
3.5.2. For fresh fruits and vegetables1340For high water content food, like fresh fruits and vegetables,
researchers used water surrounding combined with a movingor rotating method to enhance the RF heating uniformity. Birlaet al. (2008a) reported that model fruit surrounded with airbetween RF electrodes and placed in the proximity of electrodes
1345would not heat uniformly. Immersing the model fruit in waterhelped to reduce uneven heating within the model fruit. There-fore, they suggested that movement and rotation of the
CRITICAL REVIEWS IN FOOD SCIENCE AND NUTRITION 19
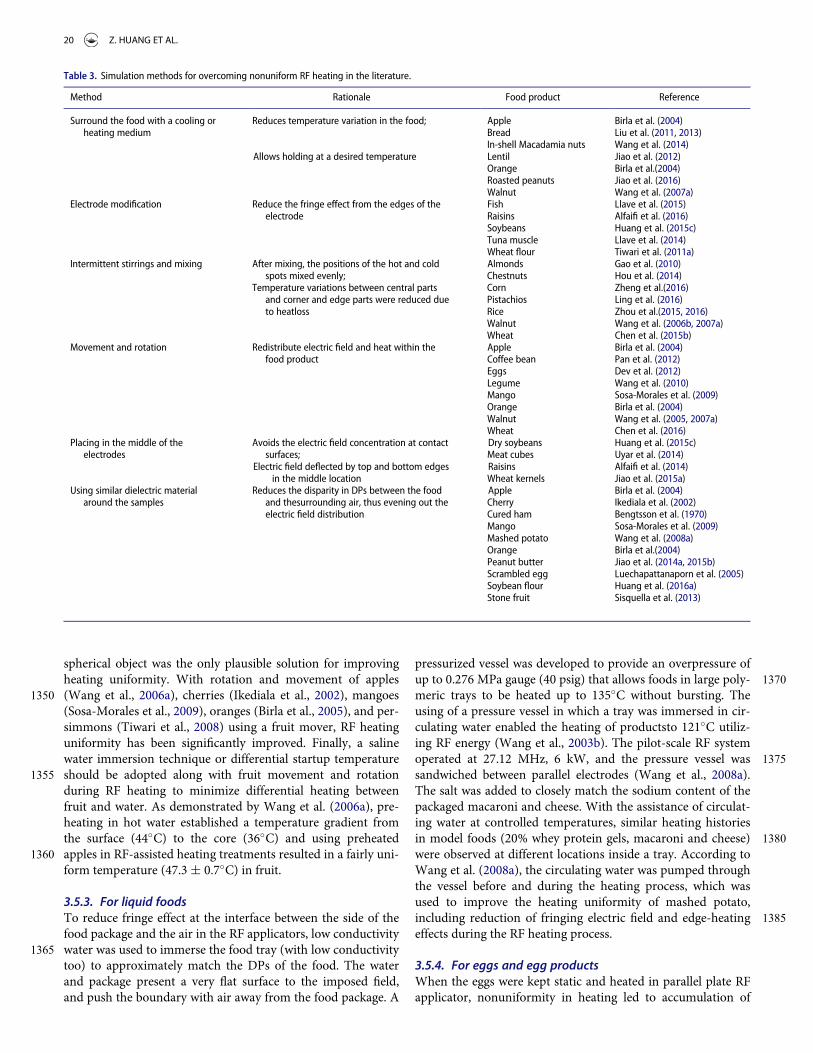
spherical object was the only plausible solution for improvingheating uniformity. With rotation and movement of apples
1350 (Wang et al., 2006a), cherries (Ikediala et al., 2002), mangoes(Sosa-Morales et al., 2009), oranges (Birla et al., 2005), and per-simmons (Tiwari et al., 2008) using a fruit mover, RF heatinguniformity has been significantly improved. Finally, a salinewater immersion technique or differential startup temperature
1355 should be adopted along with fruit movement and rotationduring RF heating to minimize differential heating betweenfruit and water. As demonstrated by Wang et al. (2006a), pre-heating in hot water established a temperature gradient fromthe surface (44�C) to the core (36�C) and using preheated
1360 apples in RF-assisted heating treatments resulted in a fairly uni-form temperature (47.3 § 0.7�C) in fruit.
3.5.3. For liquid foodsTo reduce fringe effect at the interface between the side of thefood package and the air in the RF applicators, low conductivity
1365 water was used to immerse the food tray (with low conductivitytoo) to approximately match the DPs of the food. The waterand package present a very flat surface to the imposed field,and push the boundary with air away from the food package. A
pressurized vessel was developed to provide an overpressure of1370up to 0.276 MPa gauge (40 psig) that allows foods in large poly-
meric trays to be heated up to 135�C without bursting. Theusing of a pressure vessel in which a tray was immersed in cir-culating water enabled the heating of productsto 121�C utiliz-ing RF energy (Wang et al., 2003b). The pilot-scale RF system
1375operated at 27.12 MHz, 6 kW, and the pressure vessel wassandwiched between parallel electrodes (Wang et al., 2008a).The salt was added to closely match the sodium content of thepackaged macaroni and cheese. With the assistance of circulat-ing water at controlled temperatures, similar heating histories
1380in model foods (20% whey protein gels, macaroni and cheese)were observed at different locations inside a tray. According toWang et al. (2008a), the circulating water was pumped throughthe vessel before and during the heating process, which wasused to improve the heating uniformity of mashed potato,
1385including reduction of fringing electric field and edge-heatingeffects during the RF heating process.
3.5.4. For eggs and egg productsWhen the eggs were kept static and heated in parallel plate RFapplicator, nonuniformity in heating led to accumulation of
Table 3. Simulation methods for overcoming nonuniform RF heating in the literature.
Method Rationale Food product Reference
Surround the food with a cooling orheating medium
Reduces temperature variation in the food; Apple Birla et al. (2004)Bread Liu et al. (2011, 2013)In-shell Macadamia nuts Wang et al. (2014)
Allows holding at a desired temperature Lentil Jiao et al. (2012)Orange Birla et al.(2004)Roasted peanuts Jiao et al. (2016)Walnut Wang et al. (2007a)
Electrode modification Reduce the fringe effect from the edges of theelectrode
Fish Llave et al. (2015)Raisins Alfaifi et al. (2016)Soybeans Huang et al. (2015c)Tuna muscle Llave et al. (2014)Wheat flour Tiwari et al. (2011a)
Intermittent stirrings and mixing After mixing, the positions of the hot and coldspots mixed evenly;
Temperature variations between central partsand corner and edge parts were reduced dueto heatloss
AlmondsChestnutsCornPistachiosRiceWalnutWheat
Gao et al. (2010)Hou et al. (2014)Zheng et al.(2016)Ling et al. (2016)Zhou et al.(2015, 2016)Wang et al. (2006b, 2007a)Chen et al. (2015b)
Movement and rotation Redistribute electric field and heat within thefood product
Apple Birla et al. (2004)Coffee bean Pan et al. (2012)Eggs Dev et al. (2012)Legume Wang et al. (2010)Mango Sosa-Morales et al. (2009)Orange Birla et al. (2004)Walnut Wang et al. (2005, 2007a)Wheat Chen et al. (2016)
Placing in the middle of theelectrodes
Avoids the electric field concentration at contactsurfaces;
Dry soybeans Huang et al. (2015c)Meat cubes Uyar et al. (2014)
Electric field deflected by top and bottom edgesin the middle location
Raisins Alfaifi et al. (2014)Wheat kernels Jiao et al. (2015a)
Using similar dielectric materialaround the samples
Reduces the disparity in DPs between the foodand thesurrounding air, thus evening out theelectric field distribution
Apple Birla et al. (2004)Cherry Ikediala et al. (2002)Cured ham Bengtsson et al. (1970)Mango Sosa-Morales et al. (2009)Mashed potato Wang et al. (2008a)Orange Birla et al.(2004)Peanut butter Jiao et al. (2014a, 2015b)Scrambled egg Luechapattanaporn et al. (2005)Soybean flour Huang et al. (2016a)Stone fruit Sisquella et al. (2013)
20 Z. HUANG ET AL.

1390 cooked egg white at the top of the eggs (Dev et al., 2012). Thiswas because the eggs were kept in a position where the heatingtook place from top to bottom in the parallel plate RF applica-tor. The nonuniformity in heating was convincingly reducedwhen the eggs were rotated between the electrodes. As the egg
1395 rotates, different region of the eggs were in close proximity tothe electrodes at different times (Dev et al., 2012). Additionalprocessing aids, such as cooling of the air cell, were recom-mended to ensure successful pasteurization of eggs using RFheating within a reasonable timeframe and with minimal qual-
1400 ity issues (Lau et al., 2016). In addition, air bubbles could alsobe removed from food products using methods, such as ultra-sonic treatment, to achieve better RF heating uniformity.
3.5.5. For low moisture foodsSeveral practical means can be used to minimize nonuniform
1405 RF heating in intermediate/low moisture foods, i.e. addingforced hot air to the product surface to increase the energyexchange between the product surface and surrounding air,sample movement and rotation or mixing during RF treatment(Birla et al., 2008a; Chen et al., 2015b, 2016; Tiwari et al., 2008).
1410 Wang et al. (2005) developed an intermittent stirring methodduring RF treatments to improve the heating uniformity for in-shell walnut. Their results showed a minimum of two stirringswere needed for desired uniformity and insect mortality. Tiwariet al. (2011a) confirmed that increasing electrode gap by reduc-
1415 ing the load volume and the upper electrode bent to a certainangle improved the RF heating uniformity in the sample load.
The heating uniformity of RF-treated raisins were signifi-cantly improved when containers with rounded edges and cor-ners were used, with a maximum temperature difference of
1420 about 12�C (Alfaifi et al., 2016). Using RF heating with a 2 cmset back distance and 90� angle of the newly designed electro-des, followed by forced hot air at 60�C improved the heatinguniformity of the whole raisin samples with a temperature dif-ference of about 5�C. Similarly, based on the heating unifor-
1425 mity studies for disinfesting chest nuts conducted by Hou et al.(2014), a RF treatment protocol was finally developed to com-bine 0.6 kW RF powers with a forced hot air at 55�C, move-ment of the conveyor, mixing twice, and holding at 55�C hotair for 5 min, followed by forced room air cooling through sin-
1430 gle-layer samples.Subsequently, a simulation method of adding PEI cylindrical
blocks on top of and at the bottom of peanut butter samples ina cylindrical jar has been evaluated, showing effective results toimprove the RF heating uniformity (Jiao et al., 2015b). Their
1435 results revealed that the combination of PEI surrounding andthe addition of 8 cm diameter PEI blocks could further reducethe temperature distribution range in peanut butter within7.1�C when the peanut butter was heated from 23 to 70�C.Huang et al. (2016a) also demonstrated that the RF heating
1440 uniformity could be improved when the surrounding containerdielectric constant was in a comparable range of the sample’s,with the loss factor values of surrounding container lyingbetween 0.01 and 0.1% of the sample’s. Therefore, in practicalapplications for an industrial-scale RF system, which was
1445 equipped with an auxiliary hot air system and conveyor belt,choosing an optimum container material could be effectivelyminimize the effect of electric field bending and distortion
within the corners and edges of food products during RFtreatment.
14503.5.6. For agricultural productsThe heating uniformity of RF treated wheat samples wasimproved with the increasing mixing times based on experi-ment and simulation results (Chen et al., 2015b). Under mixingconditions, the maximum temperature of top layer in wheat
1455sample reduced from 66.5�C to 51.0�C in experiment and from68.3�C to 56.1�C in simulation after three time mixing during3.5 min RF heating. Chen et al. (2015b) reported that in practi-cal applications using several RF systems in series with mixingsin between, forced hot air should be used to minimize the
1460amount of heat loss during the mixing process. The sameresults have also been reported for stirring and mixing chest-nut, lentil, soybean, walnuts, and wheat (Hou et al., 2014;Wang et al., 2007a, b; Wang et al., 2008c). Simulated resultsfrom Chen et al. (2016) demonstrated that moving and turning
1465the container by 90� could improve the RF heating uniformity.During RF heating with three speeds of conveyor belt (v1 D8.57 m/h, v2 D 14.23 m/h, and v3 D 17.14 m/h) at a fixed gap of120 mm, lower speeds of movement had a better heating uni-formity. To get a better heating uniformity for agricultural
1470products, they proposed to combine conveyor movement withadding forced hot air and mixing.
Moreover, according to the simulated results of Huang et al.(2015c), the RF heating uniformity of dry soybeans could beimproved by using a suitable container material (with a similar
1475dielectric constant to that of the sample), a smaller upper platearea (similar to the sample size), and placing the samples in themiddle of two plate electrodes. In addition to this, the rectangu-lar-shaped polystyrene container with rounded edges and cor-ners (inner corner radius of 8 cm) combined with container
1480thickness of 8 cm could provide good heating uniformity forsoybeans (Huang et al., 2016b).
4. Suggestions for future research
Although continuous progress has been made in recent years inimproving the accuracy of the modeling, much research work
1485still needs to be carried out. The following section discusses thepossible areas where further research could be performed toimprove the accuracy of model prediction. More efforts arealso needed to develop computer-aided engineering for a highdegree of automation in industrial RF heating processes.
14904.1. Surface heat and mass transfer coefficients
Heat and mass transfer coefficients are important parameters inmodeling heating, drying, and cooling processes. The mass andmomentum transfers of water within the food are commonlyignored due to a short RF heating time (< 5 min) and the influ-
1495ence on moisture content reduction is unnoticeable (< 2%)based on the reported research. For a long time RF heating (>5 min) in high moisture content foods, three phases are consid-ered in the treatment: solid (skeleton), liquid (water), and gas(water, vapor, and air). Based on the theory of mixtures (water,
1500vapor, and air), the coupled electromagnetic and transportmodel needs to be developed for obtaining the moisture
CRITICAL REVIEWS IN FOOD SCIENCE AND NUTRITION 21
content and mass fraction of vapor. Therefore, more reliablemathematical models need to be establishedby considering theheat and mass transfer coefficientsunder the given range of
1505 operating conditions.
4.2. Food properties and geometries
Food properties (DPs and TPs) are one of the most importantfactors determining the accuracy of model predictions. There isa critical need for the production of more DPs and TPs data on
1510 foodstuffs and potential packaging. This information is the keyto improve understanding of temperature distribution but alsois important in the design of RF heating systems. To simplifythe model, bulk food products placed in the box or container issimplified as a whole in the simulation model. TPs and DPs of
1515 air particles mixtures are calculated by the dielectric and ther-mal mixture equations. This may be available for the small par-ticle materials (almond, legume, peanut, raisin, and wheatkernel). But for the large particle products (apricot, date, fig,prune, and walnut) treated in RF systems, each single material
1520 should be constructedin a realistic geometric model. Thus, thecomputer program allows an independent and accurate simula-tion of solid-air interaction using a single particle approach.
4.3. Shrinkage and deformation during RF heating
Water in high moisture foods could be lost in an open package1525 during the RF heating process. This water loss could result in
an important size change that hinders the analysis of heat andmass transport and obtaining a convergent heating model.Shrinkage and deformation in foods occur due to moisture lossduring thermal processes. Effects of shrinkage and deformation
1530 on the accuracy of RF heating models are sometimes signifi-cant. Therefore, both the water transport model and themechanical deformation model should be taken into account inthe future.
4.4. Coupling the heat and mass transfer model with1535 other models
One of the critical roles of numerical modeling in the foodindustry is to analyze a heating process for producing a foodproduct with high safety and quality. To obtain better under-standing of the RF heating mechanism and improve the
1540 heating uniformity of various agricultural products in foodindustry, more attempts can be made to combine other mod-els (biochemical reaction, microbial deactivation, andmechanics models) with the current heat and mass transfermodels for further evaluating the safety and quality of foods
1545 during RF heating processes. Therefore, it is necessary todevelop an advanced simulation model to simulate theindustrial scale RF heating system, which combined thehot air-assisted RF heating with conveyor movement undermixing conditions.
1550 4.5. Model library for various food products
There have been a number of publications in the area of com-puter simulation for the use of RF technology for food
processing and preservation. Therefore, a simulation modellibrary and the corresponding heat treatment process should be
1555developed for various food materials processed in different con-ditions. When DPs and TPs of any kind of foods were enteredto the model library, the best heat treatment protocol could bematched intelligently.
4.6. Computer-assisted design and automatic heat1560treatment process control
The application of numerical modeling of RF heating pro-cesses may benefit the understanding of the physics of afood processing operation and thus aid in design, optimiza-tion and control of a processing system. With a largestore
1565and highspeed of models available in the food industry,more research should be stressed to practically use thosemodels in design and control of a thermal processing sys-tem. The treatment parameter scan be controlled withoutdelay by comparing 3D computer simulation results with
1570the online real-time monitoring. The whole process of RFheat treatment can be realized automatically by using thecomputer control methods. The adjustment of the platespacing, conveyor belt movement, and the application ofthe auxiliary measures (hot air) can all be changed automat-
1575ically, which is applicable to industrial online production.Therefore, it is necessary to develop an advanced controlsystem integrated with process optimization for a thermalprocess.
5. Conclusions
1580This paper has systematically reviewed recent developments incomputer simulation for improving RF heating uniformity inthe processed food. These methods include combination withan external heating or cooling device, enclosing in anothermedium, mixing or rotating food, modifying electrode shapes,
1585and sample movement. Mathematical modeling improves theunderstanding of interaction of RF waves with food and isessential to the continued development of this novel technol-ogy. More research should be conducted to improve the accu-racy of models by finding sufficientinformation on surface heat
1590and mass transfer coefficients, food properties, and geometriesduring RF processing. More research should also be carried outon the heat and mass transfer through high moisture foods,deformation and shrinkage in RF heating processes. Moreefforts are also needed to establish a model library, couple the
1595heat and mass transfer model with other models, and developcomputer-aided engineering of RF processes on an industrialscale.
Acknowledgments
This research was conducted in the College of Mechanical and Electronic1600Engineering, Northwest A&F University. We acknowledge thefinancial
support by research grants from General Program of National Natural Sci-ence Foundation of China (31371853) and Program of Introducing Inter-national Advanced Agricultural Science and Technologies (948 Program)of Ministry of Agriculture of China (2014-Z21). The authors thank Qian
1605Hao, Xiaoxi Kou, Lixia Hou, Rui Li, Shuang Zhang, and Bo Zhang for theirhelps in collecting materials.
22 Z. HUANG ET AL.
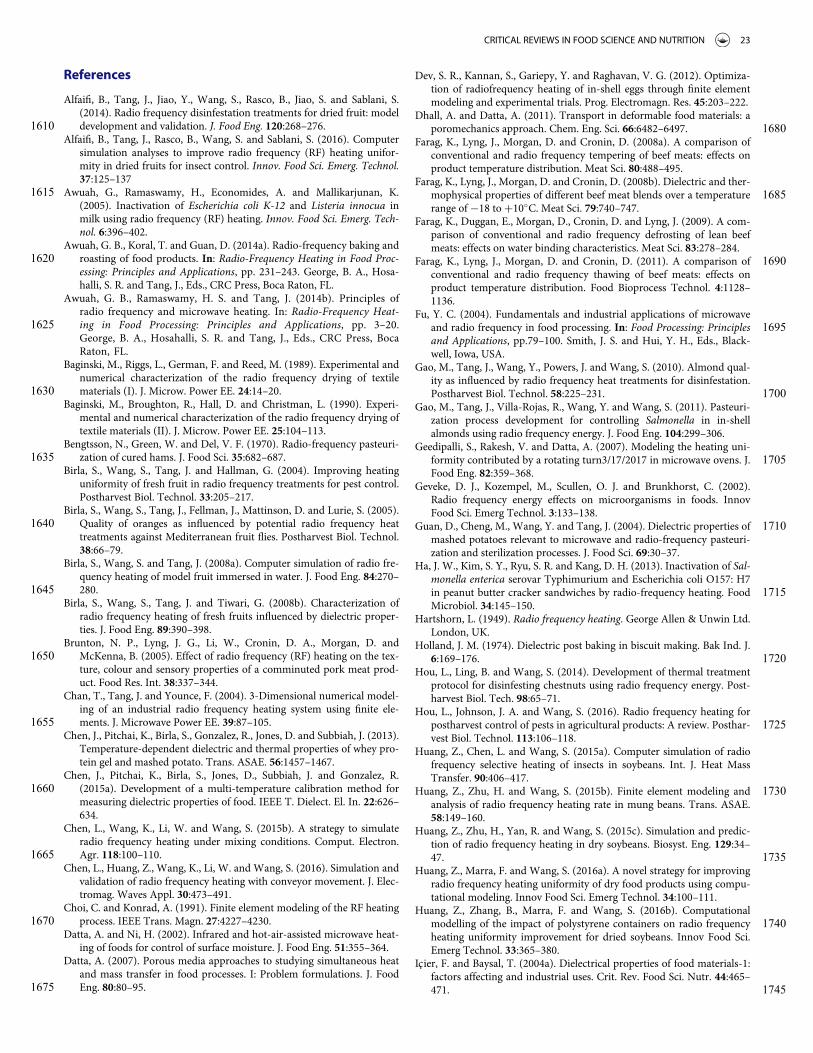
References
Alfaifi, B., Tang, J., Jiao, Y., Wang, S., Rasco, B., Jiao, S. and Sablani, S.(2014). Radio frequency disinfestation treatments for dried fruit: model
1610 development and validation. J. Food Eng. 120:268–276.Alfaifi, B., Tang, J., Rasco, B., Wang, S. and Sablani, S. (2016). Computer
simulation analyses to improve radio frequency (RF) heating unifor-mity in dried fruits for insect control. Innov. Food Sci. Emerg. Technol.37:125–137
1615 Awuah, G., Ramaswamy, H., Economides, A. and Mallikarjunan, K.(2005). Inactivation of Escherichia coli K-12 and Listeria innocua inmilk using radio frequency (RF) heating. Innov. Food Sci. Emerg. Tech-nol. 6:396–402.
Awuah, G. B., Koral, T. and Guan, D. (2014a). Radio-frequency baking and1620 roasting of food products. In: Radio-Frequency Heating in Food Proc-
essing: Principles and Applications, pp. 231–243. George, B. A., Hosa-halli, S. R. and Tang, J., Eds., CRC Press, Boca Raton, FL.
Awuah, G. B., Ramaswamy, H. S. and Tang, J. (2014b). Principles ofradio frequency and microwave heating. In: Radio-Frequency Heat-
1625 ing in Food Processing: Principles and Applications, pp. 3–20.George, B. A., Hosahalli, S. R. and Tang, J., Eds., CRC Press, BocaRaton, FL.
Baginski, M., Riggs, L., German, F. and Reed, M. (1989). Experimental andnumerical characterization of the radio frequency drying of textile
1630 materials (I). J. Microw. Power EE. 24:14–20.Baginski, M., Broughton, R., Hall, D. and Christman, L. (1990). Experi-
mental and numerical characterization of the radio frequency drying oftextile materials (II). J. Microw. Power EE. 25:104–113.
Bengtsson, N., Green, W. and Del, V. F. (1970). Radio-frequency pasteuri-1635 zation of cured hams. J. Food Sci. 35:682–687.
Birla, S., Wang, S., Tang, J. and Hallman, G. (2004). Improving heatinguniformity of fresh fruit in radio frequency treatments for pest control.Postharvest Biol. Technol. 33:205–217.
Birla, S., Wang, S., Tang, J., Fellman, J., Mattinson, D. and Lurie, S. (2005).1640 Quality of oranges as influenced by potential radio frequency heat
treatments against Mediterranean fruit flies. Postharvest Biol. Technol.38:66–79.
Birla, S., Wang, S. and Tang, J. (2008a). Computer simulation of radio fre-quency heating of model fruit immersed in water. J. Food Eng. 84:270–
1645 280.Birla, S., Wang, S., Tang, J. and Tiwari, G. (2008b). Characterization of
radio frequency heating of fresh fruits influenced by dielectric proper-ties. J. Food Eng. 89:390–398.
Brunton, N. P., Lyng, J. G., Li, W., Cronin, D. A., Morgan, D. and1650 McKenna, B. (2005). Effect of radio frequency (RF) heating on the tex-
ture, colour and sensory properties of a comminuted pork meat prod-uct. Food Res. Int. 38:337–344.
Chan, T., Tang, J. and Younce, F. (2004). 3-Dimensional numerical model-ing of an industrial radio frequency heating system using finite ele-
1655 ments. J. Microwave Power EE. 39:87–105.Chen, J., Pitchai, K., Birla, S., Gonzalez, R., Jones, D. and Subbiah, J. (2013).
Temperature-dependent dielectric and thermal properties of whey pro-tein gel and mashed potato. Trans. ASAE. 56:1457–1467.
Chen, J., Pitchai, K., Birla, S., Jones, D., Subbiah, J. and Gonzalez, R.1660 (2015a). Development of a multi-temperature calibration method for
measuring dielectric properties of food. IEEE T. Dielect. El. In. 22:626–634.
Chen, L., Wang, K., Li, W. and Wang, S. (2015b). A strategy to simulateradio frequency heating under mixing conditions. Comput. Electron.
1665 Agr. 118:100–110.Chen, L., Huang, Z., Wang, K., Li, W. and Wang, S. (2016). Simulation and
validation of radio frequency heating with conveyor movement. J. Elec-tromag. Waves Appl. 30:473–491.
Choi, C. and Konrad, A. (1991). Finite element modeling of the RF heating1670 process. IEEE Trans. Magn. 27:4227–4230.
Datta, A. and Ni, H. (2002). Infrared and hot-air-assisted microwave heat-ing of foods for control of surface moisture. J. Food Eng. 51:355–364.
Datta, A. (2007). Porous media approaches to studying simultaneous heatand mass transfer in food processes. I: Problem formulations. J. Food
1675 Eng. 80:80–95.
Dev, S. R., Kannan, S., Gariepy, Y. and Raghavan, V. G. (2012). Optimiza-tion of radiofrequency heating of in-shell eggs through finite elementmodeling and experimental trials. Prog. Electromagn. Res. 45:203–222.
Dhall, A. and Datta, A. (2011). Transport in deformable food materials: a1680poromechanics approach. Chem. Eng. Sci. 66:6482–6497.
Farag, K., Lyng, J., Morgan, D. and Cronin, D. (2008a). A comparison ofconventional and radio frequency tempering of beef meats: effects onproduct temperature distribution. Meat Sci. 80:488–495.
Farag, K., Lyng, J., Morgan, D. and Cronin, D. (2008b). Dielectric and ther-1685mophysical properties of different beef meat blends over a temperature
range of ¡18 to C10�C. Meat Sci. 79:740–747.Farag, K., Duggan, E., Morgan, D., Cronin, D. and Lyng, J. (2009). A com-
parison of conventional and radio frequency defrosting of lean beefmeats: effects on water binding characteristics. Meat Sci. 83:278–284.
1690Farag, K., Lyng, J., Morgan, D. and Cronin, D. (2011). A comparison ofconventional and radio frequency thawing of beef meats: effects onproduct temperature distribution. Food Bioprocess Technol. 4:1128–1136.
Fu, Y. C. (2004). Fundamentals and industrial applications of microwave1695and radio frequency in food processing. In: Food Processing: Principles
and Applications, pp.79–100. Smith, J. S. and Hui, Y. H., Eds., Black-well, Iowa, USA.
Gao, M., Tang, J., Wang, Y., Powers, J. and Wang, S. (2010). Almond qual-ity as influenced by radio frequency heat treatments for disinfestation.
1700Postharvest Biol. Technol. 58:225–231.Gao, M., Tang, J., Villa-Rojas, R., Wang, Y. and Wang, S. (2011). Pasteuri-
zation process development for controlling Salmonella in in-shellalmonds using radio frequency energy. J. Food Eng. 104:299–306.
Geedipalli, S., Rakesh, V. and Datta, A. (2007). Modeling the heating uni-1705formity contributed by a rotating turn3/17/2017 in microwave ovens. J.
Food Eng. 82:359–368.Geveke, D. J., Kozempel, M., Scullen, O. J. and Brunkhorst, C. (2002).
Radio frequency energy effects on microorganisms in foods. InnovFood Sci. Emerg Technol. 3:133–138.
1710Guan, D., Cheng, M., Wang, Y. and Tang, J. (2004). Dielectric properties ofmashed potatoes relevant to microwave and radio-frequency pasteuri-zation and sterilization processes. J. Food Sci. 69:30–37.
Ha, J. W., Kim, S. Y., Ryu, S. R. and Kang, D. H. (2013). Inactivation of Sal-monella enterica serovar Typhimurium and Escherichia coli O157: H7
1715in peanut butter cracker sandwiches by radio-frequency heating. FoodMicrobiol. 34:145–150.
Hartshorn, L. (1949). Radio frequency heating. George Allen & Unwin Ltd.London, UK.
Holland, J. M. (1974). Dielectric post baking in biscuit making. Bak Ind. J.17206:169–176.
Hou, L., Ling, B. and Wang, S. (2014). Development of thermal treatmentprotocol for disinfesting chestnuts using radio frequency energy. Post-harvest Biol. Tech. 98:65–71.
Hou, L., Johnson, J. A. and Wang, S. (2016). Radio frequency heating for1725postharvest control of pests in agricultural products: A review. Posthar-
vest Biol. Technol. 113:106–118.Huang, Z., Chen, L. and Wang, S. (2015a). Computer simulation of radio
frequency selective heating of insects in soybeans. Int. J. Heat MassTransfer. 90:406–417.
1730Huang, Z., Zhu, H. and Wang, S. (2015b). Finite element modeling andanalysis of radio frequency heating rate in mung beans. Trans. ASAE.58:149–160.
Huang, Z., Zhu, H., Yan, R. and Wang, S. (2015c). Simulation and predic-tion of radio frequency heating in dry soybeans. Biosyst. Eng. 129:34–
173547.Huang, Z., Marra, F. and Wang, S. (2016a). A novel strategy for improving
radio frequency heating uniformity of dry food products using compu-tational modeling. Innov Food Sci. Emerg Technol. 34:100–111.
Huang, Z., Zhang, B., Marra, F. and Wang, S. (2016b). Computational1740modelling of the impact of polystyrene containers on radio frequency
heating uniformity improvement for dried soybeans. Innov Food Sci.Emerg Technol. 33:365–380.
Icier, F. and Baysal, T. (2004a). Dielectrical properties of food materials-1:factors affecting and industrial uses. Crit. Rev. Food Sci. Nutr. 44:465–
1745471.
CRITICAL REVIEWS IN FOOD SCIENCE AND NUTRITION 23

Icier, F. and Baysal, T. (2004b). Dielectrical properties of food materials-2:Measurement techniques. Crit. Rev. Food Sci. Nutr. 44:473–478.
Ikediala, J., Hansen, J., Tang, J., Drake, S. and Wang, S. (2002). Develop-ment of a saline water immersion technique with RF energy as a post-
1750 harvest treatment against codling moth in cherries. Postharvest Biol.Tech. 24:209–221.
Jiao, S., Tang, J., Johnson, J., Tiwari, G. and Wang, S. (2011). Determiningradio frequency heating uniformity of mixed beans for disinfestationtreatments. Trans. ASAE. 54:1847–1855.
1755 Jiao, S., Johnson, J., Tang, J. and Wang, S. (2012). Industrial-scale radio fre-quency treatments for insect control in lentils. J. Stored Prod. Res.48:143–148.
Jiao, S., Deng, Y., Zhong, Y., Wang, D. and Zhao, Y. (2015a). Investigationof radio frequency heating uniformity of wheat kernels by using the
1760 developed computer simulation model. Food Res. Int. 71:41–49.Jiao, S., Zhu, D., Deng, Y. and Zhao, Y. (2016). Effects of hot air-assisted
radio frequency heating on quality and shelf-life of roasted peanuts.Food Bioprocess Technol. 9:308–319.
Jiao, Y., Tang, J. and Wang, S. (2014a). A new strategy to improve heating1765 uniformity of low moisture foods in radio frequency treatment for
pathogen control. J. Food Eng. 141:128–138.Jiao, Y., Tang, J., Wang, S. and Koral, T. (2014b). Influence of dielectric
properties on the heating rate in free-running oscillator radio frequencysystems. J. Food Eng. 120:197–203.
1770 Jiao, Y., Shi, H., Tang, J., Li, F. and Wang, S. (2015b). Improvement ofradio frequency (RF) heating uniformity on low moisture foods withPolyetherimide (PEI) blocks. Food Res. Int. 74:106–114.
Jojo, S. and Mahendran, R. (2013). Radio frequency heating and its appli-cation in food processing: A review. Int. J. Curr. Agric Res. 1:42–46.
1775 Jones, P. L. and Rowley, A. T. (1996). Dielectric drying. Drying Technol.14:1063–1098.
Jumah, R. (2005). Modelling and simulation of continuous and intermit-tent radio frequency-assisted fluidized bed drying of grains. Food Bio-prod. Process. 83:203–210.
1780 Kim, S. Y., Sagong, H. G., Choi, S. H., Ryu, S. and Kang, D. H. (2012).Radio-frequency heating to inactivate Salmonella Typhimurium andEscherichia coli O157: H7 on black and red pepper spice. Int. J. FoodMicrobiol. 153:171–175.
Kim, Y. R., Morgan, M., Okos, M. and Stroshine, R. (1998). Measurement1785 and prediction of dielectric properties of biscuit dough at 27 MHz. J.
Microw. Power EE. 33:184–194.Kirmaci, B. and Singh, R. K. (2012). Quality of chicken breast meat cooked
in a pilot-scale radio frequency oven. Innov Food Sci. Emerg Technol.14:77–84.
1790 Lau, S. K., Thippareddi, H., Jones, D., Negahban, M. and Subbiah, J.(2016). Challenges in radio frequency pasteurization of shell eggs:Coagulation rings. J. Food Sci. 81:2492–2502.
Laycock, L., Piyasena, P. and Mittal, G. (2003). Radio frequency cook-ing of ground, comminuted and muscle meat products. Meat Sci.
1795 65:959–965.Ling, B., Hou, L., Li, R. and Wang, S. (2016). Storage stability of pistachios
as influenced by radio frequency treatments for postharvest disinfesta-tions. Innov Food Sci. Emerg Technol. 33:257–364.
Liu, C. M., Sakai, N. and Hanzawa, T. (1999). Three dimensional analysis1800 of heat transfer during food thawing by far-infrared radiation. Food
Sci. Technol. Res. 5:294–299.Liu, Q., Zhang, M., Xu, B., Fang, Z. and Zheng, D. (2015). Effect of radio
frequency heating on the sterilization and product quality of vacuumpackaged Caixin. Food Bioprod. Process. 95:47–54.
1805 Liu, Y., Tang, J. and Mao, Z. (2009). Analysis of bread dielectric propertiesusing mixture equations. J. Food Eng. 93:72–79.
Liu, Y., Tang, J., Mao, Z., Mah, J. H., Jiao, S. and Wang, S. (2011). Qualityand mold control of enriched white bread by combined radio frequencyand hot air treatment. J. Food Eng. 104:492–498.
1810 Liu, Y., Wang, S., Mao, Z., Tang, J. and Tiwari, G. (2013). Heating patternsof white bread loaf in combined radio frequency and hot air treatment.J. Food Eng. 116:472–477.
Llave, Y., Terada, Y., Fukuoka, M. and Sakai, N. (2014). Dielectric proper-ties of frozen tuna and analysis of defrosting using a radio-frequency
1815 system at low frequencies. J. Food Eng. 139:1–9.
Llave, Y., Liu, S., Fukuoka, M. and Sakai, N. (2015). Computer simula-tion of radiofrequency defrosting of frozen foods. J. Food Eng.152:32–42.
Luechapattanaporn, K., Wang, Y., Wang, J., Al-Holy, M., Kang, D. H.,1820Tang, J. and Hallberg, L. M. (2004). Microbial safety in radio frequency
processing of packaged foods. J. Food Sci. 69:201–206.Luechapattanaporn, K., Wang, Y., Wang, J., Tang, J., Hallberg, L. M. and
Dunne, C. P. (2005). Sterilization of scrambled eggs in military poly-meric trays by radio frequency energy. J. Food Sci. 70:288–294.
1825Marchand, C. and Meunier, T. (1990). Recent developments in industrialradio-frequency technology. J. Microwave Power EE. 25:39–46.
Marra, F., Lyng, J., Romano, V. and McKenna, B. (2007). Radio-frequencyheating of foodstuff: solution and validation of a mathematical model.J. Food Eng. 79:998–1006.
1830Marra, F., Zhang, L. and Lyng, J. G. (2009). Radio frequency treatment offoods: review of recent advances. J. Food Eng. 91:497–508.
Marra, F., De Bonis, M. V. and Ruocco, G. (2010). Combined microwavesand convection heating: A conjugate approach. J. Food Eng. 97:31–39.
Marshall, M. and Metaxas, A. (1998). Modeling of the radio frequency1835electric field strength developed during the RF assisted heat pump dry-
ing of particulates. J. Microwave Power EE. 33:167–177.McCormick, R. (1988). Dielectric heat seeks low moisture applications.
Prepared Foods. 162:139–140.Mermelstein, N. (1997). Interest in radio frequency heating heats up. Food
1840Technol. 50:94–95.Metaxas, A. (1996). Foundations of electroheat: a unified approach. John
Wiley & Sons, New York.Moreira, R., Palau, J., Sweat, V. and Sun, X. (1995). Thermal and physical
properties of tortilla chips as a function of frying time. J. Food Process1845Pres. 19:175–189.
Moyer, J. and Stotz, E. (1947). The blanching of vegetables by electronics.Food Technol. 1:252–257.
Nagaraj, G., Purohit, A., Harrison, M., Singh, R., Hung, Y. C. and Mohan,A. (2016). Radio frequency pasteurization of inoculated ground beef
1850homogenate. Food Control. 59:59–67.Nelson, S. O. (2008). Dielectric properties of agricultural products and
some applications. Res. Agric. Eng. 54:104–112.Nelson, S. O. and Trabelsi, S. (2012). Factors influencing the dielectric
properties of agricultural and food products. J. Microw. Power EE.185546:93–107.
Neophytou, R. and Metaxas, A. (1996). Computer simulation of a radiofrequency industrial system. J. Microw. Power EE. 31:251–259.
Neophytou, R. and Metaxas, A. (1997). Characterisation of radio frequencyheating systems in industry using a network analyser. IEE P. Sci. Meas.
1860Tech. 144:215–222.Neophytou, R. and Metaxas, A. (1998). Combined 3D FE and circuit
modeling of radio frequency heating systems. J. Microw. Power EE.33:243–262.
Neophytou, R. and Metaxas, A. (1999). Combined tank and applicator1865design of radio frequency heating systems, IEEE P-Microw. Anten P.
146:311–318.Ni, H., Datta, A. K. and Torrance, K. E. (1999). Moisture transport in
intensive microwave heating of biomaterials: a multiphase porousmedia model. Int. J. Heat Mass Transfer. 42:1501–1512.
1870Orsat, V., Gariepy, Y., Raghavan, G. and Lyew, D. (2001). Radio-frequencytreatment for ready-to-eat fresh carrots. Food Res. Int. 34:527–536.
Pace, M., De Bonis, M. V., Marra, F. and Ruocco, G. (2011). Characteriza-tion of a combination oven prototype: Effects of microwave exposureand enhanced convection to local temperature rise in a moist substrate.
1875Int. Commun. Heat Mass Transfer. 38:557–564.Pan, L., Jiao, S., Gautz, L., Tu, K. and Wang, S. (2012). Coffee bean heating
uniformity and quality as influenced by radio frequency treatments forpostharvest disinfestations. Trans. ASAE. 55:2293–2300.
Pham, Q. T. (2006). Modelling heat and mass transfer in frozen foods: a1880review. Int. J. Refrig. 29:876–888.
Piyasena, P., Dussault, C., Koutchma, T., Ramaswamy, H. and Awuah, G.(2003). Radio frequency heating of foods: principles, applications andrelated properties-a review. Crit. Rev. Food Sci. Nutr. 43:587–606.
Rincon, A. M., Singh, R. K. and Stelzleni, A. M. (2015). Effects of endpoint1885temperature and thickness on quality of whole muscle non-intact
24 Z. HUANG ET AL.
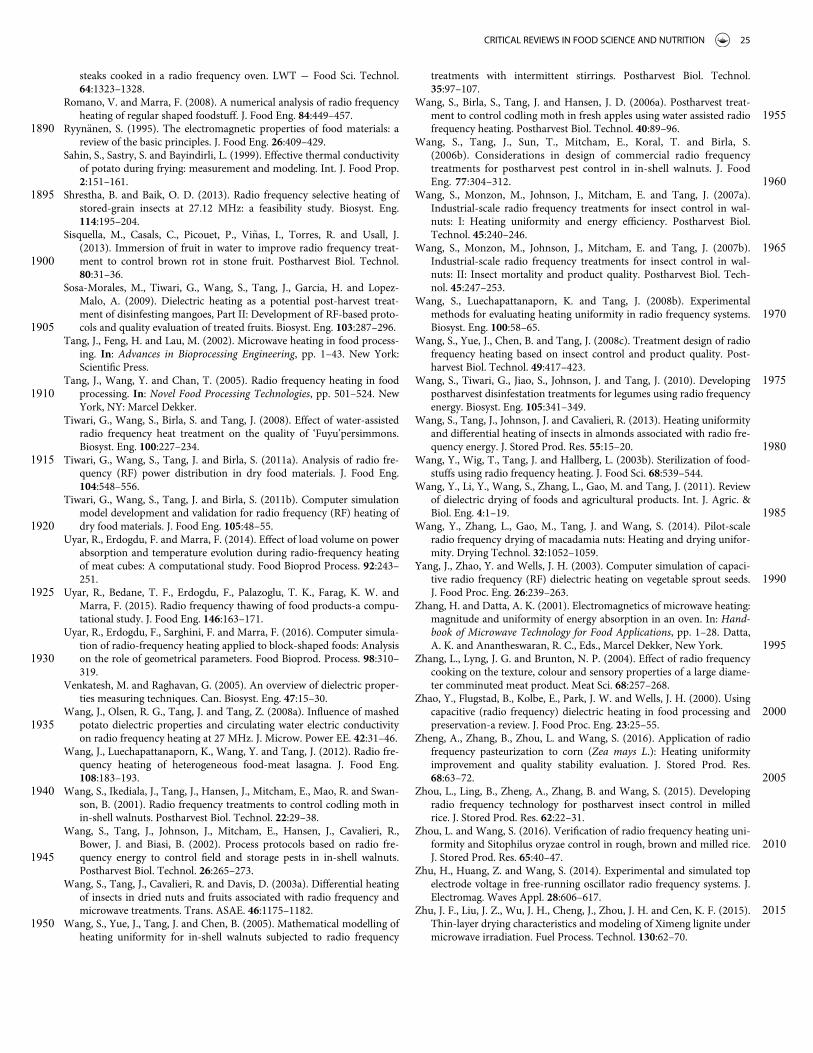
steaks cooked in a radio frequency oven. LWT ¡ Food Sci. Technol.64:1323–1328.
Romano, V. and Marra, F. (2008). A numerical analysis of radio frequencyheating of regular shaped foodstuff. J. Food Eng. 84:449–457.
1890 Ryyn€anen, S. (1995). The electromagnetic properties of food materials: areview of the basic principles. J. Food Eng. 26:409–429.
Sahin, S., Sastry, S. and Bayindirli, L. (1999). Effective thermal conductivityof potato during frying: measurement and modeling. Int. J. Food Prop.2:151–161.
1895 Shrestha, B. and Baik, O. D. (2013). Radio frequency selective heating ofstored-grain insects at 27.12 MHz: a feasibility study. Biosyst. Eng.114:195–204.
Sisquella, M., Casals, C., Picouet, P., Vi~nas, I., Torres, R. and Usall, J.(2013). Immersion of fruit in water to improve radio frequency treat-
1900 ment to control brown rot in stone fruit. Postharvest Biol. Technol.80:31–36.
Sosa-Morales, M., Tiwari, G., Wang, S., Tang, J., Garcia, H. and Lopez-Malo, A. (2009). Dielectric heating as a potential post-harvest treat-ment of disinfesting mangoes, Part II: Development of RF-based proto-
1905 cols and quality evaluation of treated fruits. Biosyst. Eng. 103:287–296.Tang, J., Feng, H. and Lau, M. (2002). Microwave heating in food process-
ing. In: Advances in Bioprocessing Engineering, pp. 1–43. New York:Scientific Press.
Tang, J., Wang, Y. and Chan, T. (2005). Radio frequency heating in food1910 processing. In: Novel Food Processing Technologies, pp. 501–524. New
York, NY: Marcel Dekker.Tiwari, G., Wang, S., Birla, S. and Tang, J. (2008). Effect of water-assisted
radio frequency heat treatment on the quality of ‘Fuyu’persimmons.Biosyst. Eng. 100:227–234.
1915 Tiwari, G., Wang, S., Tang, J. and Birla, S. (2011a). Analysis of radio fre-quency (RF) power distribution in dry food materials. J. Food Eng.104:548–556.
Tiwari, G., Wang, S., Tang, J. and Birla, S. (2011b). Computer simulationmodel development and validation for radio frequency (RF) heating of
1920 dry food materials. J. Food Eng. 105:48–55.Uyar, R., Erdogdu, F. and Marra, F. (2014). Effect of load volume on power
absorption and temperature evolution during radio-frequency heatingof meat cubes: A computational study. Food Bioprod Process. 92:243–251.
1925 Uyar, R., Bedane, T. F., Erdogdu, F., Palazoglu, T. K., Farag, K. W. andMarra, F. (2015). Radio frequency thawing of food products-a compu-tational study. J. Food Eng. 146:163–171.
Uyar, R., Erdogdu, F., Sarghini, F. and Marra, F. (2016). Computer simula-tion of radio-frequency heating applied to block-shaped foods: Analysis
1930 on the role of geometrical parameters. Food Bioprod. Process. 98:310–319.
Venkatesh, M. and Raghavan, G. (2005). An overview of dielectric proper-ties measuring techniques. Can. Biosyst. Eng. 47:15–30.
Wang, J., Olsen, R. G., Tang, J. and Tang, Z. (2008a). Influence of mashed1935 potato dielectric properties and circulating water electric conductivity
on radio frequency heating at 27 MHz. J. Microw. Power EE. 42:31–46.Wang, J., Luechapattanaporn, K., Wang, Y. and Tang, J. (2012). Radio fre-
quency heating of heterogeneous food-meat lasagna. J. Food Eng.108:183–193.
1940 Wang, S., Ikediala, J., Tang, J., Hansen, J., Mitcham, E., Mao, R. and Swan-son, B. (2001). Radio frequency treatments to control codling moth inin-shell walnuts. Postharvest Biol. Technol. 22:29–38.
Wang, S., Tang, J., Johnson, J., Mitcham, E., Hansen, J., Cavalieri, R.,Bower, J. and Biasi, B. (2002). Process protocols based on radio fre-
1945 quency energy to control field and storage pests in in-shell walnuts.Postharvest Biol. Technol. 26:265–273.
Wang, S., Tang, J., Cavalieri, R. and Davis, D. (2003a). Differential heatingof insects in dried nuts and fruits associated with radio frequency andmicrowave treatments. Trans. ASAE. 46:1175–1182.
1950 Wang, S., Yue, J., Tang, J. and Chen, B. (2005). Mathematical modelling ofheating uniformity for in-shell walnuts subjected to radio frequency
treatments with intermittent stirrings. Postharvest Biol. Technol.35:97–107.
Wang, S., Birla, S., Tang, J. and Hansen, J. D. (2006a). Postharvest treat-1955ment to control codling moth in fresh apples using water assisted radio
frequency heating. Postharvest Biol. Technol. 40:89–96.Wang, S., Tang, J., Sun, T., Mitcham, E., Koral, T. and Birla, S.
(2006b). Considerations in design of commercial radio frequencytreatments for postharvest pest control in in-shell walnuts. J. Food
1960Eng. 77:304–312.Wang, S., Monzon, M., Johnson, J., Mitcham, E. and Tang, J. (2007a).
Industrial-scale radio frequency treatments for insect control in wal-nuts: I: Heating uniformity and energy efficiency. Postharvest Biol.Technol. 45:240–246.
1965Wang, S., Monzon, M., Johnson, J., Mitcham, E. and Tang, J. (2007b).Industrial-scale radio frequency treatments for insect control in wal-nuts: II: Insect mortality and product quality. Postharvest Biol. Tech-nol. 45:247–253.
Wang, S., Luechapattanaporn, K. and Tang, J. (2008b). Experimental1970methods for evaluating heating uniformity in radio frequency systems.
Biosyst. Eng. 100:58–65.Wang, S., Yue, J., Chen, B. and Tang, J. (2008c). Treatment design of radio
frequency heating based on insect control and product quality. Post-harvest Biol. Technol. 49:417–423.
1975Wang, S., Tiwari, G., Jiao, S., Johnson, J. and Tang, J. (2010). Developingpostharvest disinfestation treatments for legumes using radio frequencyenergy. Biosyst. Eng. 105:341–349.
Wang, S., Tang, J., Johnson, J. and Cavalieri, R. (2013). Heating uniformityand differential heating of insects in almonds associated with radio fre-
1980quency energy. J. Stored Prod. Res. 55:15–20.Wang, Y., Wig, T., Tang, J. and Hallberg, L. (2003b). Sterilization of food-
stuffs using radio frequency heating. J. Food Sci. 68:539–544.Wang, Y., Li, Y., Wang, S., Zhang, L., Gao, M. and Tang, J. (2011). Review
of dielectric drying of foods and agricultural products. Int. J. Agric. &1985Biol. Eng. 4:1–19.
Wang, Y., Zhang, L., Gao, M., Tang, J. and Wang, S. (2014). Pilot-scaleradio frequency drying of macadamia nuts: Heating and drying unifor-mity. Drying Technol. 32:1052–1059.
Yang, J., Zhao, Y. and Wells, J. H. (2003). Computer simulation of capaci-1990tive radio frequency (RF) dielectric heating on vegetable sprout seeds.
J. Food Proc. Eng. 26:239–263.Zhang, H. and Datta, A. K. (2001). Electromagnetics of microwave heating:
magnitude and uniformity of energy absorption in an oven. In: Hand-book of Microwave Technology for Food Applications, pp. 1–28. Datta,
1995A. K. and Anantheswaran, R. C., Eds., Marcel Dekker, New York.Zhang, L., Lyng, J. G. and Brunton, N. P. (2004). Effect of radio frequency
cooking on the texture, colour and sensory properties of a large diame-ter comminuted meat product. Meat Sci. 68:257–268.
Zhao, Y., Flugstad, B., Kolbe, E., Park, J. W. and Wells, J. H. (2000). Using2000capacitive (radio frequency) dielectric heating in food processing and
preservation-a review. J. Food Proc. Eng. 23:25–55.Zheng, A., Zhang, B., Zhou, L. and Wang, S. (2016). Application of radio
frequency pasteurization to corn (Zea mays L.): Heating uniformityimprovement and quality stability evaluation. J. Stored Prod. Res.
200568:63–72.Zhou, L., Ling, B., Zheng, A., Zhang, B. and Wang, S. (2015). Developing
radio frequency technology for postharvest insect control in milledrice. J. Stored Prod. Res. 62:22–31.
Zhou, L. and Wang, S. (2016). Verification of radio frequency heating uni-2010formity and Sitophilus oryzae control in rough, brown and milled rice.
J. Stored Prod. Res. 65:40–47.Zhu, H., Huang, Z. and Wang, S. (2014). Experimental and simulated top
electrode voltage in free-running oscillator radio frequency systems. J.Electromag. Waves Appl. 28:606–617.
2015Zhu, J. F., Liu, J. Z., Wu, J. H., Cheng, J., Zhou, J. H. and Cen, K. F. (2015).Thin-layer drying characteristics and modeling of Ximeng lignite undermicrowave irradiation. Fuel Process. Technol. 130:62–70.
CRITICAL REVIEWS IN FOOD SCIENCE AND NUTRITION 25