Computer Programming course - bdigital.unal.edu.co±uelavega.2015.pdf · g enero), y el...
110
Student profiling model for the “Computer Programming” course Camilo Orlando Pe˜ nuela Vega Universidad Nacional de Colombia Facultad de Ingenier´ ıa. Departamento de Ingenier´ ıa de Sistemas e Industrial Bogot´ a, Colombia 2015
Transcript of Computer Programming course - bdigital.unal.edu.co±uelavega.2015.pdf · g enero), y el...
Student profiling model for the“Computer Programming” course
Camilo Orlando Penuela Vega
Universidad Nacional de Colombia
Facultad de Ingenierıa. Departamento de Ingenierıa de Sistemas e Industrial
Bogota, Colombia
2015


Student profiling model for the“Computer Programming” course
Camilo Orlando Penuela Vega
Thesis work to obtain the degree of:
Master in Systems and Computer Engineering
Advisor:
Elizabeth Leon Guzman, Ph.D.
Co-Advisor:
Jonatan Gomez Perdomo, Ph.D.
Research Line:
Educational Data Mining
Research Group:
MIDAS
Universidad Nacional de Colombia
Facultad de Ingenierıa. Departamento de Ingenierıa de Sistemas e Industrial
Bogota, Colombia
2015


v
Resumen
El trabajo de investigacion presenta un modelo de perfilamiento de estudiantes, y sus resul-
tados al haberlo aplicado al curso “Programacion de Computadores”, el cual es dictado de
manera parcialmente virtual, por medio de la Plataforma Inteligente de Aprendizaje Virtual,
este es un Sistema en Lınea, que permite la consulta del material de estudio y la presentacion
de los examenes. El modelo identifica los perfiles a partir de datos socioeconomicos (edad y
genero), y el comportamiento en la Plataforma (Cantidad de consultas a documentos, ejer-
cicios o videos, porcentaje de consultas realizadas en clase, tamano promedio de la sesion y
tiempo promedio de ausencia). Los perfiles son analizados para definir si estan relacionados
con el rendimiento academico. Se utilizaron los datos de aproximadamente 1000 estudiantes
(inscritos en 2014) y 20500 sesiones. Los perfiles fueron identificados por medio del algoritmo
de agrupacion k-Means, y para cada uno, se identificaron las secuencias comunes de nave-
gacion. Se propone un sistema de alertas, que utiliza un clasificador perezoso para asignar
al estudiante actual un perfil, y a partir de este, da sugerencias de manera oportuna. Se
propone un sistema de recomendacion, que muestra al estudiante sugerencias sobre cuales
recursos se deberıan consultar, con el objetivo de mejorar su rendimiento academico.
Palabras clave: Minerıa de datos, Minerıa educativa, Entorno virtual de aprendizaje.
Abstract
The research work presents a student profiling model, and the results after applying it
to the “Computer Programming” course, which is developed partially virtual through the
Virtual Intelligent Learning Platform, this is an E-Learning system that allows the students
to consult the course material and to take the tests. The model identifies the profiles based
on socio-economic data (age and gender), and students’ behavior when using the Platform
(Number of accesses to documents, exercises or videos, percentage of accesses performed in
class, average session length and average absence time). The profiles found are analyzed in
order to define if they are connected to the academic performance. Data of around 1000
students (those enrolled in 2014) and 20500 sessions, were used. The profiles were found
through the k-Means clustering algorithm. Per each profile, the common sequences of navi-
gation were identified. A warnings system is proposed, it uses a lazy classifier to assign a
profile to the current student, and based on this profile, give timely feedback by showing
alerts. A recommender system is proposed, it shows suggestions of resources that should be
accessed, in order to improve the academic performance.
Keywords: Data mining, Educational data mining, Learning management system.
Contents
Resumen V
1. Introduction 2
1.1. Objectives . . . . . . . . . . . . . . . . . . . . . . . . . . . . . . . . . . . . . 3
1.2. Contributions . . . . . . . . . . . . . . . . . . . . . . . . . . . . . . . . . . . 4
1.3. Methodology . . . . . . . . . . . . . . . . . . . . . . . . . . . . . . . . . . . 4
1.4. Document Structure . . . . . . . . . . . . . . . . . . . . . . . . . . . . . . . 5
2. Background 6
2.1. Electronic Learning . . . . . . . . . . . . . . . . . . . . . . . . . . . . . . . . 6
2.1.1. Learning styles . . . . . . . . . . . . . . . . . . . . . . . . . . . . . . 7
2.1.2. Learning objects . . . . . . . . . . . . . . . . . . . . . . . . . . . . . 8
2.2. Analytics in the educational context . . . . . . . . . . . . . . . . . . . . . . . 9
2.2.1. Academic analytics . . . . . . . . . . . . . . . . . . . . . . . . . . . . 9
2.2.2. Learning analytics . . . . . . . . . . . . . . . . . . . . . . . . . . . . 10
2.3. Data mining . . . . . . . . . . . . . . . . . . . . . . . . . . . . . . . . . . . . 10
2.3.1. Educational Data Mining . . . . . . . . . . . . . . . . . . . . . . . . 11
2.3.2. Web mining . . . . . . . . . . . . . . . . . . . . . . . . . . . . . . . . 11
2.3.3. User profiles . . . . . . . . . . . . . . . . . . . . . . . . . . . . . . . . 15
2.3.4. K-Means Clustering . . . . . . . . . . . . . . . . . . . . . . . . . . . . 16
2.3.5. K-Nearest-Neighbor Classifier . . . . . . . . . . . . . . . . . . . . . . 18
2.4. Recommender System . . . . . . . . . . . . . . . . . . . . . . . . . . . . . . 20
2.5. Summary . . . . . . . . . . . . . . . . . . . . . . . . . . . . . . . . . . . . . 21
3. Data understanding and Exploratory data analysis 23
3.1. Virtual Intelligent Learning Platform . . . . . . . . . . . . . . . . . . . . . . 23
3.2. Data cleansing and data selection . . . . . . . . . . . . . . . . . . . . . . . . 24
3.2.1. Identification and mixing of duplicated accounts . . . . . . . . . . . . 25
3.3. Session identification . . . . . . . . . . . . . . . . . . . . . . . . . . . . . . . 26
3.4. Data integration: Data warehouse . . . . . . . . . . . . . . . . . . . . . . . . 27
3.5. Exploratory data analysis . . . . . . . . . . . . . . . . . . . . . . . . . . . . 29
3.5.1. Analysis of accesses . . . . . . . . . . . . . . . . . . . . . . . . . . . . 30
3.5.2. Analysis of sessions . . . . . . . . . . . . . . . . . . . . . . . . . . . . 36

Contents 1
3.5.3. Analysis of test attempts . . . . . . . . . . . . . . . . . . . . . . . . . 39
3.6. Summary . . . . . . . . . . . . . . . . . . . . . . . . . . . . . . . . . . . . . 40
4. Profiling model and Common sequences identification 42
4.1. Model design . . . . . . . . . . . . . . . . . . . . . . . . . . . . . . . . . . . 42
4.1.1. Data aggregation . . . . . . . . . . . . . . . . . . . . . . . . . . . . . 43
4.1.2. Data preparation . . . . . . . . . . . . . . . . . . . . . . . . . . . . . 44
4.1.3. Clustering . . . . . . . . . . . . . . . . . . . . . . . . . . . . . . . . . 46
4.1.4. Identification of sequences . . . . . . . . . . . . . . . . . . . . . . . . 47
4.1.5. Aggregation of sequences . . . . . . . . . . . . . . . . . . . . . . . . . 48
4.2. Parameter settings . . . . . . . . . . . . . . . . . . . . . . . . . . . . . . . . 49
4.3. Results . . . . . . . . . . . . . . . . . . . . . . . . . . . . . . . . . . . . . . . 50
4.3.1. Profiles found with data of each term . . . . . . . . . . . . . . . . . . 50
4.3.2. Profiles found with data of both terms . . . . . . . . . . . . . . . . . 76
4.3.3. Profiles evolution across term . . . . . . . . . . . . . . . . . . . . . . 82
4.4. Summary . . . . . . . . . . . . . . . . . . . . . . . . . . . . . . . . . . . . . 85
5. Warnings and Recommendation system 87
5.1. System design . . . . . . . . . . . . . . . . . . . . . . . . . . . . . . . . . . . 87
5.1.1. Assignment of a profile to each active student . . . . . . . . . . . . . 89
5.1.2. Show warning message to the current student . . . . . . . . . . . . . 92
5.1.3. Recommendation of resources . . . . . . . . . . . . . . . . . . . . . . 93
5.2. System implementation . . . . . . . . . . . . . . . . . . . . . . . . . . . . . . 93
5.3. Summary . . . . . . . . . . . . . . . . . . . . . . . . . . . . . . . . . . . . . 96
6. Conclusions and future work 97
6.1. Conclusions . . . . . . . . . . . . . . . . . . . . . . . . . . . . . . . . . . . . 97
6.2. Future work . . . . . . . . . . . . . . . . . . . . . . . . . . . . . . . . . . . . 99
References 100

1 Introduction
The “Computer Programming” course is offered to several undergraduate programs, it has
been taken by approximately 1000 students in 2014, and it was developed partially virtual,
with a didactic e-learning platform[19], called “Virtual Intelligent Learning Platform”, this
platform is the implementation made by the Universidad Nacional de Colombia, of an adap-
tive E-learning system[19], this kind of systems has several advantages over the traditional
methodology. The traditional methodology is built upon a long established set of customs,
the professor can transmit in a well established place (class room) the knowledge by giving
a talk to his/her passive students. Among other advantages over the traditional methodo-
logy, the E-Learning systems allow the students to learn in their own way and at their own
rhythm[19].
The E-Learning systems are collecting a huge amount of data that can be used for evaluating
and improving the learning strategies of such systems[15]. In particular, three emerging fields
are using such data in that direction: Academic analytics, which aims to the organizational
efficiency[25], Learning Analytics, which focuses on the actors who perform the teaching
process[25], and the Educational Data Mining, which is the application of data mining tech-
niques on educational contexts[25]. As part of the effort made on those three fields, there are
several research works trying to link data related to a student with his/her academic per-
formance. Several factors that affect students’ academic performance have been found using
data mining techniques, including familiar, personal, economic and geographic[43, 12, 5].
In [43] the research work aims to classify the students into three groups, based on the risk
of losing the course: low, medium and high, it discovered that variables with the highest
correlation coefficients, were related to student’s scholastic history and its socio-economic
background. In [12] the research work examines the relationship between students’ demograp-
hic data (such as age, gender and employment status) and current student status (graduate,
delay or dropout), it discovered that the location of students is related to their dropout de-
cision. In [5], it was discovered that the academic performance is connected to the students’
nationality, while students’ gender and type of residence, had no significant effect.
There are different data mining techniques that allow anyone to identify student profiles
from the set of tasks carried out by them in the E-Learning system[36]. In [36], interesting
connections between the number of completed assignments, number of read messages, quiz-
zes taken and course approval, were obtained when the K-Means algorithm was applied to
1.1 Objectives 3
the web behavior data. Also, the C4.5 decision tree algorithm was used to predict when a
new enrolled student will have learning problems. In [38], the Markov Clustering algorithm
(MCL) was used to identify profiles of students who have accessed common resources. Ba-
sically, each student was represented as a node in a graph, and that student was connected
to another students, the connection weight depends on the number of common resources
they have accessed. In [15], an automatic tool for identifying learning styles is presented.
Learning styles are approaches or ways of learning[15], they can be detected from learners’
different patterns of behavior, such as the number of visits in a forum, the number of times
they participate in a chat, and more. The tool presented in [15] uses the learners’ behavior
data while they are consulting their favorite web pages.
The Universidad Nacional de Colombia has developed some efforts in order to discover
valuable knowledege in academic data through data mining techniques, like a research work
about socio economic profiles linked to dropout rates[25], the development of a Learning
Management System (LMS) called “Virtual Intelligent Learning Platform”[19], this LMS
performs adaptive tests, the test difficulty is adapted as the student gives answers[28].
For the “Computer Programming” course team, it is of great interest to know how the
students are using the Virtual Intelligent Learning Platform, which improvements can be
made to this tool, and how the academic performance is affected by the way the students
use the platform.
1.1. Objectives
General objective
To design and to develop a student profiling model for the Virtual Intelligent Learning
Platform, from academic, socio-economic and web behavior data.
Specific Objectives
Choose, pre-process and explore the data collected by the Virtual Intelligent Learning
Platform.
Research and choose data mining algorithms, to be used to identify the profiles.
Design a model to detect student profiles using clustering techniques, from socio-
economic, academic and web behavior data, and to incrementally update these profiles
as time passes by.
Design a system that, from the profiles found, identifies the students who are likely to
have a poor academic performance, and warns them if necessary.

4 1 Introduction
1.2. Contributions
A state of the art about finding student profiles, from different kinds of collected data,
including socio-economic, academic and web behavior.
A preprocessed data set, from the data collected by the Virtual Intelligent Learning
Platform in 2014, this includes socio-economic data (age and gender), academic per-
formance data (grades gotten in tests) and web behavior data (browsing history of
interesting resources: documents, exercises and videos).
A student profiling and common sequences identification model, based on the prepro-
cessed data set.
A warnings and recommender system, based on the profiling and common sequences
identification model, and its results.
The paper titled “Identification of student profiles of a Learning Management System”.
The paper titled “Warnings and Recommendation System for an E-Learning Platform”,
which was sent to MICAI 2015, and accepted for oral presentation and publication on
Polibits journal.
1.3. Methodology
All the data used in this research were collected by the Virtual Intelligent Learning Platform:
demographic data (birth date and gender) are asked only once at registration, transactional
web behavior data (accesses to each resource) are recorded along the term as the student
consults the course material, and academic data are recorded each time a student takes a test.
For developing this thesis work, the KDD process presented in [16] was followed, perfor-
ming the steps: i) Data cleaning, based on predefined criteria and a density based algorithm,
ii) Data integration, when gathering data coming from several terms, into one unique schema,
iii) Data selection, only the accesses to resources, grades gotten and start time of test at-
tempts, and students’ age and gender, were selected, iv) Data transformation, when splitting
the behavioral data by test attempt, and then aggregating these behavioral data to build
the minable view, v) Data mining, when discovering clusters (which are potential profiles)
and common sequences of navigation performed by students of each profile. Data mining
techniques were also applied when defining if the student who is currently using the plat-
form, is likely to have a poor academic performance. vi) Pattern evaluation, when reviewing
each cluster properties, and choosing those clusters that can give useful information due to
academic performance or number of accesses, also, connecting the common sequences of navi-
gation found for each profile, to a specific academic performance, and defining which profiles
1.4 Document Structure 5
are characterized by a low academic performance, in order to allow the system to warn the
students who are classified in one of these profiles. vii) Knowledge presentation, building bar
graphics, that describe each cluster properties, and showing in tables, the sequences with
strongest connections to a specific academic performance.
1.4. Document Structure
The document is organized as follows: Chapter 2 presents the background, an introduction to
the basic concepts and techniques, which are applicable in the context of this research work.
Chapter 3 presents the data used, along with the selection criteria, exploratory data analysis
and sessions identified. Chapter 4 presents the profiling model and its results. Chapter 5
presents the proposed warnings and recommender system. Finally, Chapter 6 presents the
conclusions and future work.

2 Background
This chapter introduces basic concepts, and techniques, which are applicable in the context
of this research. Since the “Virtual Intelligent Learning Platform”1 is an online tool for de-
veloping courses, the first concepts presented are “Electronic Learning”, “Learning Styles”,
“Learning Objects”, and Analytics (Learning analytics, Academic analytcs and Educatio-
nal data mining). Then, the data mining techniques such as clustering, and specifically the
K-Means algorithm, path traversal patterns and the K-Nearest-Neighbor classifier are pre-
sented. Finally, a brief introduction to Recommendation Systems is done.
2.1. Electronic Learning
The E-Learning is a distance educational model which integrates information technologies
with pedagogical elements, to teach students, on-line[19]. It is composed by several subsys-
tems, including[19]:
Learning Management System -LMS-: It manages, distributes and controls the training
activities[19]. It is also defined as a tool that offers a lot of methods for the distribution
of information and for the communication between the participants on a course[38], it
allows instructors to deliver assignments to the students, produce and publish educatio-
nal material, prepare assessments and test, tutor distant classes and activate archive
storage, they also enhance collaborative learning with discussion forums, chats and
wikis[38].
Content Management System -CMS-: It defines and maintains the educational program
content[19]. The acronym CMS is also understood as Course Management System[36],
it can offer a great variety of channels and workspaces to facilitate information sharing
and communication among participants in a course[36]. It lets educators distribute
information to students, produce content material, prepare assignments and tests, en-
gage in discussions, manage distance classes and enable collaborative learning with
forums[36].
Intelligent Tutoring System: It guides the student, in an interactive form, through the
educational program content[19].
1This is the system which has collected all the data used in this research work

2.1 Electronic Learning 7
Computer Adaptive Test: It maintains and applies adaptive tests to students, an adap-
tive test is able to change questions, according to previous student’s responses[19].
Topic interaction and Simulation tools: Set of tools integrated to the E-Learning sys-
tem, that allows the students apply their acquired skills[19].
The e-Learning is also defined in [13], as an electronically mediated communication with the
pourpose of constructing and confirming knowledge, authors of [13] present e-Learning sys-
tems from a conceptual point of view[28], by giving theoretical foundations, fundamental con-
cepts of education, theoretical principles, how to apply them, and learning communities[28].
They also recognize three important factors: social presence, cognitive presence and teaching
presence[28].
The E-Learning’s goal is to create a research community that is independent of time and
location, through the use of communication technologies and information[28].
2.1.1. Learning styles
Learning styles are various approaches or ways of learning[15], they can be defined as stra-
tegies or regular mental behaviors, applied by an individual, to learn and built on her/his
underlying potentials[7], these favorite strategies are, more specifically, methods of gathering,
interpret, organize and think about the new information[35]. The learning style definition,
also includes, the complex manner in which, and the conditions under which, learners most
efficiently and most effectively perceive, process, store and recall what they are attempting
to learn[26]. Students can learn in several ways: watch, listen, reflect, act, reason logically
and intuitively, memorize and visualize, construct analogies and mathematical models[35],
learning styles are the methods or strategies the students use, to learn something[35], and
despite the learning styles depend on the subject of study, the student tends to develop
global preferences[35].
Learning styles are considered one of the most important factors influencing E-Learning
and personal academic performance[7], they involve educating methods, particular to an in-
dividual, which are presumed to allow that individual to learn best[15], and they represent
a combination of cognitive, affective and other psychological characteristics that serve as
relatively stable indicators of the way a learner perceives, interacts with and responds to the
learning environment[26]. Identify students’ learning styles is a critical step in understanding
how to improve the learning process[15], every student has a learning style[15], and if he/she
knows how to absorb and retain information, he/she can recognize its strong points, as well
as its not so strong areas[15]. The challenge for each E-Learning researcher developer, is
to establish the optimal structure of the learner model for one’s application[7], such as the
personalization of E-Learning experience according to one’s learning style[7].

8 2 Background
There are two methods of finding learner’s style, finding it from the user input or auto-
matic extraction of learner’s style with less user input[26]. For the first method, a learning
style of a specific student can be determined by long questionnaires[26], such as online lear-
ning styles and personality assessments[30], a standard questionnaire[7], which depends on
the Learning Style model[7]. In this method users give their maximum input which makes
the user to get into bored learning[26]. For the second method, the learning style can be
discovered from his/her behavior within the learner system[7], by processing the students’
favorite web pages, in order to gather hints about their learning style[15], e.g. students choo-
sing the same learning sequence, may have the same learner style [7]. It is also possible to
profile the students, and associate a learning style to each profile[7].
2.1.2. Learning objects
A Learning object (LO) is any digital resource that can be reused to support learning[2],
it provides learning or teaching content[6]. It can be the smallest unit of the learning pro-
cess, such as a letter, word, sentence, lesson[40], image, animation, simulation, video, audio
recording[34], or even, a videogame[41]. It is the multimedia content including a lesson,
piece of the lesson, software for creating the lesson, tool for creating the lesson, and crea-
tors of the technology in faciliating the learning system[40], that focus on an specific lear-
ning objective[34]. A learning object covers all types of learning materials, both digital and
non-digital objects[40]. Also, it can be considered as the technology supporting learning
process[40].
As modern student-centered methodology requires involving learner into his or her acti-
ve knowledge construction, applying a wide range of active learning methods, reflecting,
sharing teachers’ experience and more[6], the teachers should find and publish not only lear-
ning resources, providing learning content, but a wide spectrum of methodological materials
as well that help them to make teaching process more effective[6].
There are several models for designing educational content for learning objects[45]. The-
se models are based on the aggregation of learning resources in rational wholes that serve
concrete learning objectives[45]. Balatsoukas, Morris and O’ Brian, proposed in 2008, a or-
ganization of object oriented educational content, in three general aggregation levels[45]: i)
digital resources such as raw data (e.g. audio files, text files, video or image fragments,etc),
ii) Learning objects are created through the combination of raw data, as well as information
objects. A learning object can serve more than one learning objective, while others tend to
equate it with a lesson. iii) Learning objects are aggregated in larger wholes and are used
for planning lessons, modules and courses. Certain designers believe that the term can be
equated with a syllabus, or even with a course or a seminar[45].
2.2 Analytics in the educational context 9
Learning objects can be reused, or used in different instructional context, by different
educators[34], they have been referred to as the building blocks of educational context[34].
There are standardized formats to store and distribute learning objects[41], allowing the
content to be reused across platforms and contexts[41]. This standardization guarantees the
simplicity of the deployment of these contents in heterogeneous LMS[41]. The co-dependence
between the reusability and educational context of LOs is clearly stated: the bigger the
content aggregation, the stronger its dependence on context, thus, the possibilities for its
reusability decrease[45].
2.2. Analytics in the educational context
Technology has been an enabler for education[25], initially by improving the ways of commu-
nication and extending coverage through virtual courses[25], however, as many other fields,
education can be improved by the use of analytics, to enable a better decision making[25].
“Analytics” is a term used in business and science to refer to computational support for
capturing digital data to help inform decision-making[42]. Analytics programs evaluate lar-
ge data sets to provide decision makers with information that can help determine the best
course of action for an organization[11]. They can be seen, as a “digital nervious system”,
that provides real time feedback on the external environment and effects of actions[42].
The emergence of analytics is the result of the evolution of enterprise and instructional
systems[30], initially, teaching and learning systems were fragmented, but, by the late 1990s,
enterprise systems were becoming better integrated[30], resulting in data better integrated,
which allowed greater transactional efficiency, information integration, reporting and bu-
siness analytics[30]. Despite academic systems were slower to develop, the development of
course information systems, course management systems and learning management systems,
allowed the convergence of administrative and academic systems, at enterprise level[30].
Three emerging fields use data and technology approaches to improve Education and Lear-
ning: Academic analytics, Learning Analytics and Educational Data Mining[25]. Educational
Data Mining is presented in Data mining section.
2.2.1. Academic analytics
Academic analytics was introduced as an application of business intelligence practices in
Academia[25], by studying how technology is used to support the decision making process[25],
including then, the application and culture around it[25]. The Academic Analytics, aims to
the organizational efficiency[25], its definition is about “how academic enterprises use infor-
mation to support decision making”[25].

10 2 Background
Academic Analytics marries large data sets with statistical techniques and predictive mode-
ling to improve decision making[3]. Current initiatives use such data to predict which students
might be in academic difficulty, allowing intervention[3], in this way, academic analytics has
the potential to improve teaching, learning and student success[3].
2.2.2. Learning analytics
Learning analytics takes “digital nervious system” approach with the goal of improving lear-
ning outcomes, which could be measured by grades, retention, or completion[11]. It was
defined by the Society for Learning Analytics Research (SoLAR)2 as the “measurement,
collection, analysis and reporting of data about learners and their contexts, for purposes of
understanding and optimizing learning and the environments in which it occurs”[25]. Lear-
ning Analytics collects and analyses the data collected by systems that interact with students,
to look for correlations between the activities done by students, and learning outcomes[11],
it focuses on the actors who perform the teaching process[25], and it capitalizes on the vast
quantities of data collected by educational systems, to find patterns that can be used to
improve learning[11].
The most common use of learning analyics is to identify students who appear less likely
to succeed academically and to enable (or even initiate) targeted interventions to help them
achieve better outcomes[11].
2.3. Data mining
The Data mining is the process of discovering interesting patterns and knowledge from lar-
ge amounts of data[16], these patterns are previously unknown, valid, and they are hidden
in large data sets[37]. The extraction of this relevant information, can be done by applying
techniques or algorithms, which attempt to localize non trivial information[4], it was made
possible by the exponential increase in storage capacity and computing power[4].
The Knowledge Discovery from Data is the complete set of processes for knowledge
discovery in databases[38], in order to detect valid information, and recognize patterns in
raw data[38], it is an iterative process of the steps[16]:
Data cleaning: Remove noise and inconsistent data
Data integration: Combine multiple data sources
Data selection: Retrieve from the database, data relevant to the analysis
2This definition is available at http://www.solaresearch.org/mission/about/
2.3 Data mining 11
Data transformation: Transformation and consolidation of data into forms appropriate
for mining
Data mining: The essential process where intelligent methods are applied to extract
data patterns
Pattern evaluation: Identify the truly interesting patterns representing knowledge based
on interestingness measures
Knowledge presentation: Use of visualization and knowledge representation techniques,
to represent mined knowledge to users
As indicated above, Data mining is one step in the Knowledge Discovery from Data[16].
2.3.1. Educational Data Mining
The Educational Data Mining is an emerging discipline[25, 21], it applies data mining
techniques on educational contexts[25, 37], it is concerned with the development of new met-
hods for exploring the unique types of data that come from the educational context[36], and
to discover knowledge from educational databases[37], it is used to study the data available
in the educational field, and bring out the hidden knowledge[21], in order to study students’
trends and behaviors toward education[37].
The Educational Data Mining has several applications: Classification methods can be ap-
plied in order to predict students’ behavior[21], academic performance[21], or drop out[25].
Clustering methods, to find student profiles[25, 36], or patterns in consultations to the cour-
se material[38]. In a closer look, the methods applied in educational data mining, are usual
tasks of data mining, such as Classification, Clustering and Association Rule Analysis[25].
2.3.2. Web mining
The Web mining is a sub-category of data mining[38], it is the application of data mining
to data collected from the web[16], its goal is to capture, model and analyse the behavioral
patterns and profiles of users interacting with a web site[27], the discovered patterns are
usually represented as collections of pages, objects, or resources that are frequently accessed
by groups of users with common needs or interests[27].
The Web mining has three main categories: content mining (which analyses the web con-
tent), structure mining (which uses graph and network mining theory, it analyses the links
between pages), and usage mining (which extracts useful information from server logs)[16].
Regarding usage mining, a web site is administered by a Web server[20], which logs all

12 2 Background
activities done by the web site, including all traces left by the Web users, in a file called
Web server log[20]. These data include the URL requested, the IP address from which the
request originated, and a timestamp[32], they allow capture user-access patterns in a Web
environment[20]. These web usage data (and another transactional data) are considered
categorical[46], because these records are made up of non numerical attributes[46], thus, fast
and effective clustering of transactional databases is extremely difficult because of the high
dimensionality, sparsity and huge volumes[46].
Web usage mining, also known as Web log mining is the process of extracting interesting
patterns in web access log[32], it is also referred to as mining path-traversal patterns[20]. In
order to apply a web usage mining process, it is necessary to follow the steps: i) Data clea-
ning (which removes all content that does not provide additional information, like queries
to images or scripts, linked by html content, that was queried previously), ii)Identification
of user (Identification of accesses that were carried out by the same user), iii)Identification
of session (Split the accesses carried out by one specific user, it can be done by applying a
time threshold, commonly 30 minutes), and iv)Reconstruction of the session (Recover tho-
se accesses carried out by the user, but that were not registered, due to cache loading, or
proxies, through the identification of possible paths based on the website structure tree)[31].
Then, it is necessary to find similarities between user’s paths across the web, through the
mining of path traversal patterns[20], in order to do this, several factors must be taken into
account, for example, not all pages across the web are of equal importance to students[20],
many pages and documents are consulted just for location rather than for content[20], some
accesses are not registered due to cache loading[31], and it is necessary to face local caches,
corporative firewalls and proxy servers, in order to identify queries performed by the same
web user[31], these facts increase the difficulty of extracting meaningful information[20, 31].
The goal is to discover long sequences having a frequency higher than a certain threshold[20].
There are several strategies to identify similar browsing patterns, In [46], the transactional
data are considered a special type of categorical data, having boolean value, with all possible
items as attributes, thus, each attribute has a value of true, if the item was accessed by the
user. It is proposed a clustering algorithm named CLOPE, which makes geometric calcula-
tions to find groups, depending on the items that have been accessed. Another approaches,
such as the proposed in [32] and [20], also consider the order of the resources accessed.
Path traversal patterns identification
A web access pattern is a sequential pattern in a large set of pieces of web logs, which is
pursued frequently by users[32]. A sequence is defined as an ordered list of items, web pages
in this case[20], ordered by time of access[20]. The log file is a multiset of recorded sequences,
a sequence may appear more than once[20]. Analysis of log files shows that Web users tend
2.3 Data mining 13
to move backwards and revisit pages with a high frequency[20]. The notation
s = x y
is used to inform that the sequence s is the concatenation of the consecutive subsequences x
and y [20].
The goal of sequence mining is to discover sequences of maximal length that appear mo-
re frequently than a given percentage threshold, based on a given collection of sequences
ordered in time[20]. There are several efforts to emply techniques of sequential pattern mi-
ning, which are mostly based on association rule mining[32]. The designer of the site can say
which sequences found are trivial[20].
In [32] is presented an algorithm for mining access patterns from web logs, each access
is denoted as an event, and an access sequence consists of a set of events, allowing repetition,
it means, the access sequence:
{a a b}
And the another access sequence:
{a b}
Are different, in which a and b are two events[32]. The length of an access sequence, is the
number of accesses performed[32]. A set of access sequences is called Web access sequence
database -WAS-, and only access sequences whose support is greater than a threshold, are
taken into account[32]. The problem statement is: given a Web access sequence database -
WAS-, and support threshold ξ, mine the complete set of patterns with a support of at least
ξ (A pattern of this set, is denoted as a ξ-pattern), of WAS [32].
The approach is composed by three steps, the first one is scan WAS once, and fill all frequent
items[32], then WAS is scanned again, to construct the Web access pattern three (WAP-tree)
over the set of frequent events[32], this tree is conformed by nodes with two properties: label
(the event) and count (number of times the event was accessed), denoted as label:count, being
the the root empty:0 [32]. The insertion is started from the root, considering the first event,
denoted as e, increment the count of child node with label e by 1 if there exists one[32],
otherwise create a child labeled by e and set the count to 1[32]. Then, recursively insert
the rest of the frequent subsequence to the subtree rooted at that child labeled e[32]. e.g.,
consider the access sequence[32]:
{a b a c}
The WAP-tree is[32]:
{(empty : 0)→ (a : 1)→ (b : 1)→ (a : 1)→ (c : 1)}

14 2 Background
Figure 2-1: Example of WAP-tree[32]
So far, then, this tree is updated by processing the next access sequence[32]:
{a b c a c}
The algorithm starts at the root, it contains a child labeled as a, then this node is increased
by 1, similarly the second access of the sequence is processed, b is increased by 1, but this
node does not have a child labeled as c, then a new node c:1 is created[32].
Once all the access sequences were processed, the third step is to recursively mine the WAP-
tree[32], by creating a set of Web access patternt -WAP-, each event in WAP-tree is itself
an Web access pattern, it is necessary to insert them into WAP [32]. Then, for each event in
WAP-tree (being ei the event being processed), a Conditional sequence base is constructed,
and the process counts the conditional frequent events at the same time[32], if the set of
conditional frequent events is not empty, a conditional WAP-tree is built, using the same
algorithm for building the initial WAP-tree. The conditional WAP-tree is then recursively
mined[32]. For example, based on the WAP-tree shown in figure 2-1, the conditional sequence
base of c is listed as follows[32]:
aba : 2, ab : 1, abca : 1, ab : −1, baba : 1, abac : 1, aba : −1
For each web access pattern returned from mining the conditional WAP tree, the ei event is
concatenated to it, and then the web access pattern is added to WAP [32].
In [20] the solution proposed for mining traversal patterns, consists of two steps: i) The
original sequence of log data, is converted into a set of traversal subsequences, each one
representing a maximum forward reference from the starting point of a user access. ii) A se-
parate algorithm is used to determine the frequent traversal patterns, termed large reference
sequences. Finally, maximal references are formed, from large reference sequences. Maxi-
mal references are large reference sequences that are not contained in any other maximal
reference sequence. For example, a given user contains the following path[20]:
{A B C D C B E G H G W A O U O V }
2.3 Data mining 15
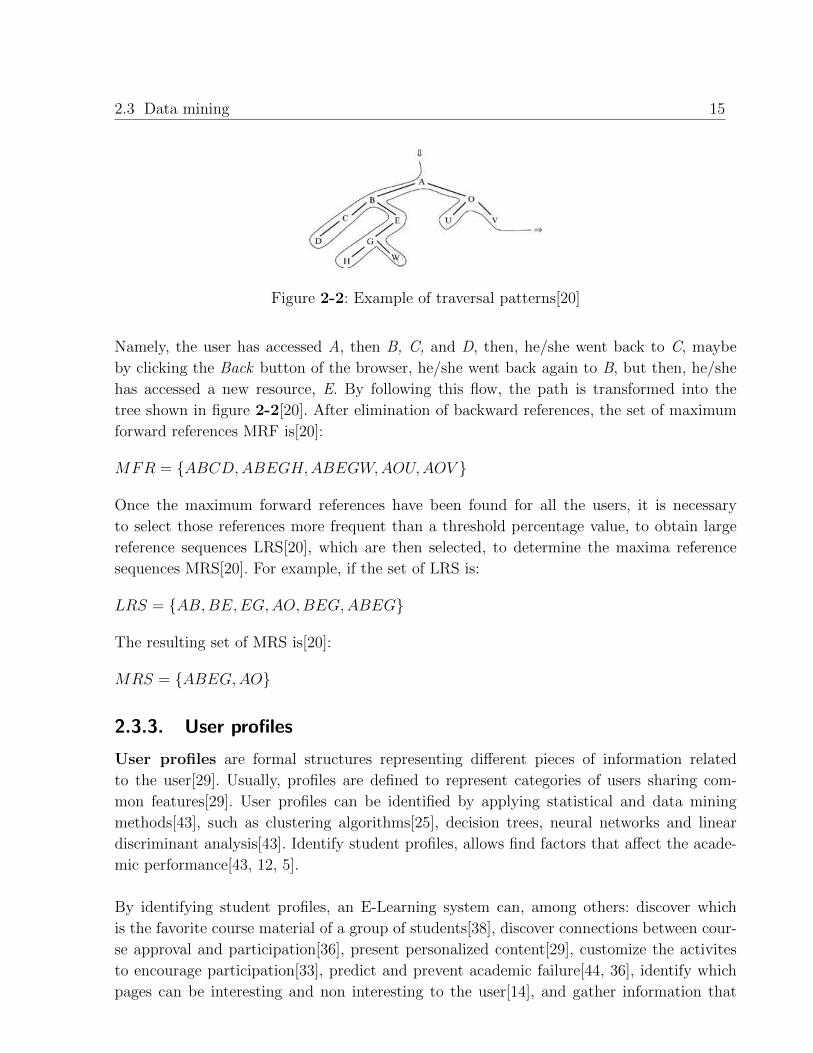
Figure 2-2: Example of traversal patterns[20]
Namely, the user has accessed A, then B, C, and D, then, he/she went back to C, maybe
by clicking the Back button of the browser, he/she went back again to B, but then, he/she
has accessed a new resource, E. By following this flow, the path is transformed into the
tree shown in figure 2-2[20]. After elimination of backward references, the set of maximum
forward references MRF is[20]:
MFR = {ABCD,ABEGH,ABEGW,AOU,AOV }
Once the maximum forward references have been found for all the users, it is necessary
to select those references more frequent than a threshold percentage value, to obtain large
reference sequences LRS[20], which are then selected, to determine the maxima reference
sequences MRS[20]. For example, if the set of LRS is:
LRS = {AB,BE,EG,AO,BEG,ABEG}
The resulting set of MRS is[20]:
MRS = {ABEG,AO}
2.3.3. User profiles
User profiles are formal structures representing different pieces of information related
to the user[29]. Usually, profiles are defined to represent categories of users sharing com-
mon features[29]. User profiles can be identified by applying statistical and data mining
methods[43], such as clustering algorithms[25], decision trees, neural networks and linear
discriminant analysis[43]. Identify student profiles, allows find factors that affect the acade-
mic performance[43, 12, 5].
By identifying student profiles, an E-Learning system can, among others: discover which
is the favorite course material of a group of students[38], discover connections between cour-
se approval and participation[36], present personalized content[29], customize the activites
to encourage participation[33], predict and prevent academic failure[44, 36], identify which
pages can be interesting and non interesting to the user[14], and gather information that

16 2 Background
allows to improve the course by reducing the drop out ratio and increasing the students’
performance[37].
There are several data mining techniques (like classification, clustering and association rule),
that allow to identify profiles of students from the set of tasks carried out by them in the
E-Learning system[36]. Connections between the participation in a LMS and course appro-
val, can be found by applying the k-Means algorithm[36]. Resources of the course material,
that are commonly accessed by groups of students, can be found by applying the Markov
Clustering Algorithm (MCL)[38].
The results of the studies that identify profiles, depend on the kind of data used to identify
these profiles, for example, personal data (age, gender, social data, etc.), number of accesses
to the course material[38], time spent by students in consulting the material[18, 14], and web
server logs[24]. In particular, web logs can be used to identify users (students) navigation
profiles.
User profiles can be broadly classified into two main approaches[14]: i) Document based
(It aims at capturing users’ clicking and browsing behaviors, users’ document preferences
are first extracted from the click through data, and then, used to learn the user beha-
vior model)[14], and ii) Concept-based (It aims at capturing users’ conceptual needs, users’
browsed documents and search histories are automatically mapped into a set of topical ca-
tegories, user profiles are created based on the users’ preferences of the extracted topical
categories)[14].
2.3.4. K-Means Clustering
Cluster analysis or clustering, is the process of partitioning a set of data objects into sub-
sets, each one is a cluster[16], so that, objects in a cluster are similar to one another[16], yet
dissimilar to objects in other clusters[16]. There are different clustering methods, each one
generates different clusters on the same data set[16]. It may discover previously unknown
groups within the data, because the process is done by an algorithm rather than a human[16].
There are different types of clusters and clusterings[39]. A Prototype based cluster, is a
set of objects in which each object is closer (more similar) to the prototype that defines the
cluster than to the prototype of any other cluster[39]. A partitional clustering, is simply a
division of the set of data objects into non-overlaping subsets such that each data object
is in exaclty one subset[39]. K-Means is a prototype based, partitional clustering technique
that attempts to find a user-specified number of clusters (K), which are represented by their
centroids[39]. K-Means defines a prototype in terms of a centroid, which is usually the mean of
a group of points, and is typically applied to objects in a continuous n-dimensional space[39].

2.3 Data mining 17
Figure 2-3: Using K-Means algorithm to find three clusters in sample data[39]
The first step of the algorithm, is to choose k initial centroids, where k is a user-specified
parameter[39], namely, the number of clusters desired[39]. Each point is then assigned to the
closest centroid, and each collection of points assigned to a centroid, is a cluster[39]. The
centroid of each cluster is then updated based on the points assigned[39]. This assignment
is repeated, until no point changes clusters[39]. The figure 2-3 shows the convergence of the
algorithm. In 2-3 (a), points are assigned to the initial centroids[39], then, the centroids
are updated, and in 2-3 (b) the points are assigned to the updated centroids[39]. Then,
the centroids move to the two small groups of points at the bottom[39], and the algorithm
terminates, because no more changes occur[39].
Since K-Means method is not guaranteed to converge to the global optimum and often
terminates at a local optimum (depending on the initial random selection of centroids)[16],
it is common to run the K-Means algorithm multiple times with different initial cluster
centers[16].
Outlier detection
Outliers are extreme values that lie near the limits of the data range or go against the trend
of the remaining data[22]. Identifying outliers is important because they may represent errors
in data entry[22]. Also, even if an outlier is a valid data point and not in error, certain statis-
tical methods are sensitive to the presence of outliers and may deliver unstable results[22].
Considering data whose proximity measure is Euclidean distance, one function that mea-
sures the quality of a clustering (built by K-Means algorithm), is the sum of the squared
error (SSE)[39], also known as scatter[39], it calculates the error of each data point, its
Euclidean distance to the closest centroid, and then compute the total sum of the squared
errors[39].
18 2 Background
When the squared error criterion is used, outliers can unduly influence the clusters that
are found[39]. In particular, when outliers are present, the resulting cluster centroids (pro-
totypes) may not be as representative as they otherwise would be and thus, SSE will be
higher as well[39]. Because of this, it is often useful to discover outliers and eliminate them
beforehand[39].
There are several algorithms that remove outliers, like the implemented one in the De-
tect Outliers (Densities) RapidMiner operator[17]. All fields were normalized using range
transformation, new range is [0.0 1.0], then, the outliers are identified based on the data
density[17]. The Detect Outliers (Densities) operator, finds the outliers of a given Example
Set[17]. An outlier is an object which is at least D distance away from at least p proportion
of all objects[17].
Davies Bouldin index
The Davies Bouldin index is a measure which indicates the similarity of clusters[8], it assumes
that the density of a cluster, is a decreasing function of distance from a vector characteristic
of this cluster[8]. This measure allows computation of the average similarity of each cluster,
with its most similar cluster[8].
The Davies Bouldin index formula is defined as[10]:
DB =1
k
k∑i=1
maxi 6=j
(Sk(Qi) + Sk(Qj)
S(Qi, Qj)
)Being k the number of clusters, Sk the average distance of all objects of a cluster, to its
centroid, and S(Qi, Qj) the distance between two cluster centroids[10].
The Davies Bouldin index was defined under certain limitations, its value is non-negative[8],
the similarity between clusters is zero only if their dispersion functions vanish[8]. If the dis-
tance between clusters increases while their dispersions remain constant, the similarity of the
clusters decreases[8], and if the distance between clusters remains constant while the disper-
sions increase, the similarity increases[8]. A set of clusters with low intra-cluster distances
and high inter-cluster distances, has a low Davies Bouldin index[17], a small Davies Bouldin
index is considered better based on this criterion[17].
2.3.5. K-Nearest-Neighbor Classifier
Classification is the task of assigning objects to one of several predefined categories[39]. The
k-Nearest-Neighbor Classifier is a lazy learner, because it delays the process of modeling the
training data until it is needed to classify the test examples[39]. It is opposite to eager learner,
2.3 Data mining 19
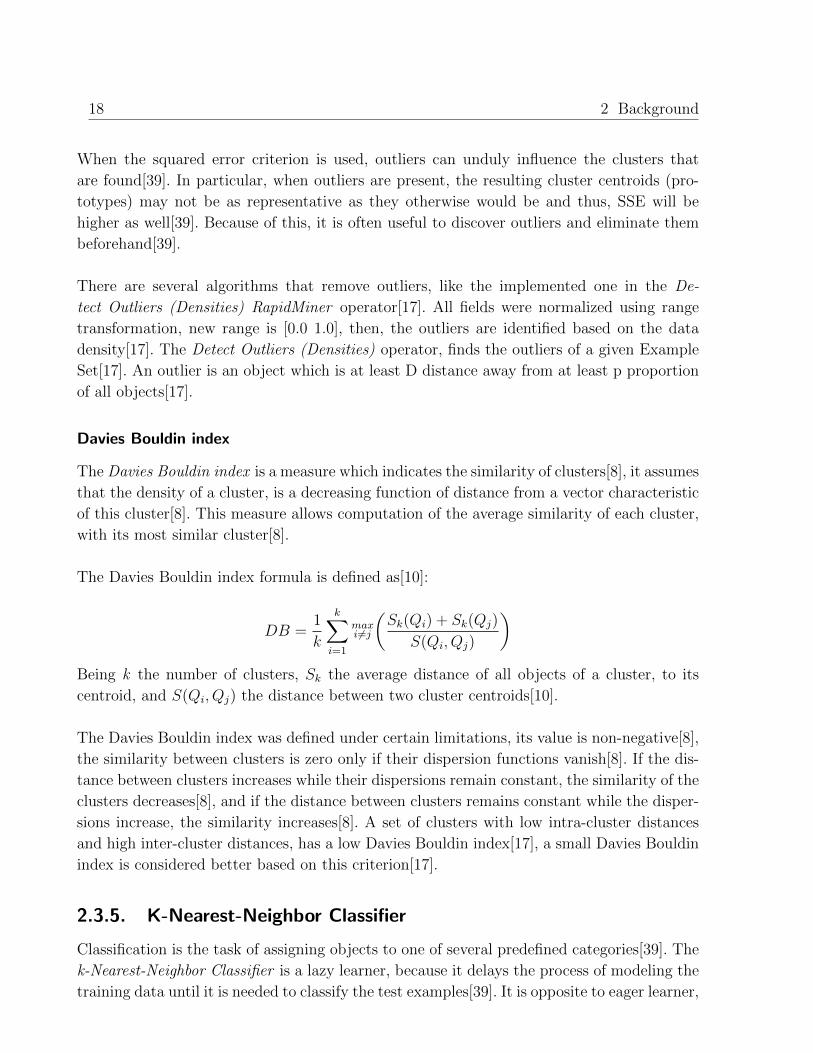
Figure 2-4: The 1-,2- and 3-nearest neighbors of an instance[39]
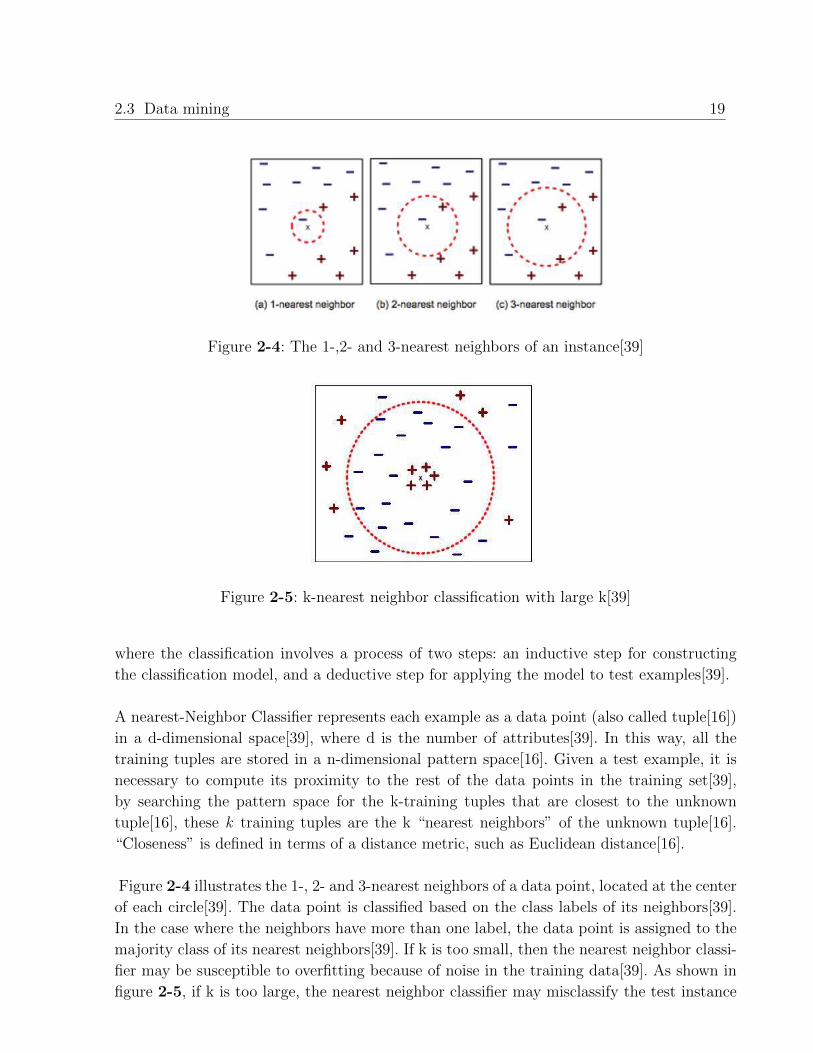
Figure 2-5: k-nearest neighbor classification with large k[39]
where the classification involves a process of two steps: an inductive step for constructing
the classification model, and a deductive step for applying the model to test examples[39].
A nearest-Neighbor Classifier represents each example as a data point (also called tuple[16])
in a d-dimensional space[39], where d is the number of attributes[39]. In this way, all the
training tuples are stored in a n-dimensional pattern space[16]. Given a test example, it is
necessary to compute its proximity to the rest of the data points in the training set[39],
by searching the pattern space for the k-training tuples that are closest to the unknown
tuple[16], these k training tuples are the k “nearest neighbors” of the unknown tuple[16].
“Closeness” is defined in terms of a distance metric, such as Euclidean distance[16].
Figure 2-4 illustrates the 1-, 2- and 3-nearest neighbors of a data point, located at the center
of each circle[39]. The data point is classified based on the class labels of its neighbors[39].
In the case where the neighbors have more than one label, the data point is assigned to the
majority class of its nearest neighbors[39]. If k is too small, then the nearest neighbor classi-
fier may be susceptible to overfitting because of noise in the training data[39]. As shown in
figure 2-5, if k is too large, the nearest neighbor classifier may misclassify the test instance

20 2 Background
because its list of nearest neighbors may include data points that are located far away from
its neighborhood[39].
2.4. Recommender System
A Recommender System was defined as a system able to make predictions, from the fact that
a user likes or does not like, a given item, object or information, accessible to the user[35].
The main goal of the recommender system is to improve Web site usability[9], by giving the
user suitable resources and guidance in a large space of possible options[7], thus increasing
the visibility of proper e-learning resources[7]. The main beneficiaries of recommender sys-
tems are individuals who lack sufficient subjective personal experience in a specific field[7],
or they do not have the competence, or sometimes the time, to evaluate the potentially
overwhelming number of alternative items that are available online[7].
Recommender systems are widely used on the web[23], there are several kinds of recom-
mender systems, each one can be used in different approaches, according to the needs[35].
They have two important functions: i) Help users deal with the information overload by gi-
ving them personalized recommendations[23], and ii) Help businesses make more profits[23].
Recommendations are based on user profiles[35]. The Recommender systems are classified
in[35]:
Content based: The user will be recommended items similar to the ones the user pre-
ferred in the past[23]. An item is usually represented by a set of features[23], these
features allow discover similarities between the items, through an “item by item” algo-
rithm built from correlation rules between these items[35], it allows predict the utility
of items for a particular user based on how “similar” the items are to those that he/she
liked in the past[23].
Collaborative recommendation: The user will be recommended items that people with
similar tastes and preferences liked in the past[23]. It is based on the fact that similar
users have similar preferences in consulting the material[35]. The system has a set of
users U, and a set of items I to be recommended, then, each user u in U is defined
with a User profile[23]. Given a new user u, who has accessed a set of pages Pu, so far,
it is possible to measure the similarity of Pu to the discovered profiles, and recommend
to the user those pages in matching profiles which have not yet been accessed by the
user[23].
The process is structured according to two components performed online and off-line with
respect to Web server activity[9]. Offline component builds the knowledge base by analyzing
historical data, like the log file[9], then, the result is used in the online component for
capturing the intuition list of the user so as to recommend items[9].
2.5 Summary 21
2.5. Summary
Online courses are developed through course management systems (CMS), they are web
platforms that facilitate distribution of course material by professors to learners, in form
of Learning Objects, they are digital resources that support learning, they provide learning
or teaching content. This platform allows the students to learn in their own way and at
their own rhythm, thus, it allows the students develop their own Learning Style, this style
is an approach or way of learning, applied by an individual, to learn and built on her/his
underlying potentials.
Several analytics are useful for improving the learning process: Academic Analytics aims to
the organizational efficiency, by using large datasets with statistical techniques and predicti-
ve modeling to improve decision making. Learning Analytics is the measurement, collection,
analysis and reporting of data about learners and their contexts, by analysing data collected
by systems that interact with students, to look for correlations between students’ activities
and learning outcomes, and in this way, understand and optimize the learning process. Edu-
cational data mining is the application of data mining techniques on educational contexts,
to study the data available in the educational field, and bring out the hidden knowledge.
Profiles are formal structures representing pieces of information related to the user, they
are defined to represent categories of users sharing common features. It is possible to iden-
tify student profiles by processing the data collected by a CMS. K-Means is a partitional
clustering algorithm that allows identify the student profiles (being each cluster a potential
profile). The path traversals are identified to know which sequences of navigation appear
more frequently than a threshold. The set of clusters, common navigation sequences and
academic data gathered by the CMS, can be used to recommend a student which resources
may be accessed, it is done by a recommender system.
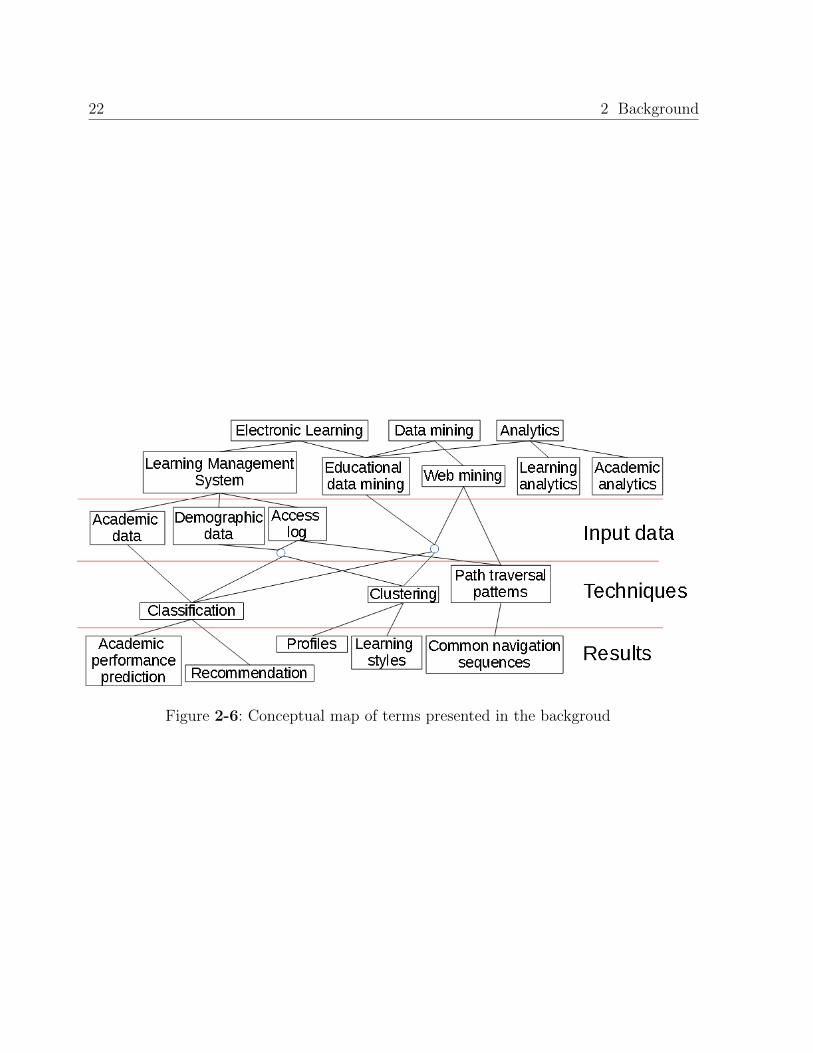
The figure 2-6 shows the conceptual map of the terms presented in this chapter.
22 2 Background
Figure 2-6: Conceptual map of terms presented in the backgroud
3 Data understanding and Exploratory
data analysis
This chapter presents the data collected by the Virtual Intelligent Learning Platform, in-
cluding their volume and the data warehouse design. This chapter presents the first data
cleansing process (based on a selection criteria), the identification of sessions, and an explo-
ratory data analysis as well, this analysis has covered the accesses to resources, sessions and
test attempts, its results allowed notice several data properties, and take pertinent decisions.
The data obtained as the result of those procedures, are used to perform the data mining
processes, which are further developed in chapter 4.
3.1. Virtual Intelligent Learning Platform
The Virtual Intelligent Learning Platform is the implementation of an adaptive E-Learning
system, made by the Universidad Nacional de Colombia[19], its content management system
is defined and implemented as a directed graph (non linear structure) of content units[19],
each unit is defined as a set of short videos (each video has an associated set of exercises and
a document)[19]. This platform is able to perform adaptive tests, namely, when the student
is taking a test, the difficulty of the current question depends on the answer the student gave
for the previous question[28].
When the student has just registered in the platform, he/she may log in and enroll in a
course, the student watches a list of all courses he/she is enrolled in, the student may click
one, then he/she watches a list of all topics covered by the course, the student may enter
to any topic by clicking its name, then he/she watches a list of the available resource types:
Classes (videos), Documents or Exercises, the student can click any of these types and start
consulting the course material.
The data collected by the platform, can be grouped into three categories:
Demographic and socio-economic data:
Group of structural or stable variables, they include several things related to the perso-
nal history of the student and his/her environment, these can be considered “factual”
24 3 Data understanding and Exploratory data analysis
data and describe who the user is [1]. The platform collects these data by asking
them at registration: gender, birth date (which allows calculate the age), country and
hometown.
Behavioral data:
Data that describe the behavior of the student when he/she is interacting with the
platform, these are also called “transactional” data and describe what the user does
[1]. The platform registers all the entries to topics and all the accesses to resources (in-
cluding date and time in both cases). In summary, student identifier, topic or resource
(document, video or exercises file) identifier, date and time are stored.
Academic data:
The platform allows the students to take three adaptive tests in each term. Therefore,
when a student has taken a test, the platform has registered all the answers given by
him/her (including the question identifiers), the grade he/she has gotten, and the time
of beginning and ending of the test attempt.
3.2. Data cleansing and data selection
The database contains data for testing purposes, all of these data were discarded: Accounts
with emails marked for testing or development, Tests for demonstration and testing, and
Groups of students that are not registered in the Academic Information System (Sistema de
Informacion Academica, -SIA-) of the Universidad Nacional de Colombia, when these groups
are deleted, all the students enrolled in them are deleted too.
The Platform had been online since the first term of 2012, however, the students started
to take the tests since the first term of 2013, thus, the academic performance data could
not be collected in 2012. In addition, the Platform had been registering only one entry per
resource-student pair into the database in 2013, so that, the first time a student accessed a
resource, one entry is inserted into the database, but when the student accessed that resour-
ce again, the previous inserted entry was updated, changing the date/time value, thus, the
previous accesses were lost. Because of this, this research had used the data registered in 2014.
Since the platform is world web open, any person can register, join a course and start con-
sulting any resource of any topic, however, only the students registered on an undergraduate
program of the Universidad Nacional de Colombia are able to take the tests. As one of the
objectives of this research work is to identify a connection between the web behavior and
the academic performance, all the test attempts that were not finished (namely, the students
who have presented them but were not graded), were removed, then, all students who have
not taken any test, were discarded. Only one attempt per test is allowed, if a student has
3.2 Data cleansing and data selection 25
performed several attempts of the same test, only the first one is processed.
Since the level of academic preparation the course is aimed to, it is expected that the youn-
gest person that can join a course, is at least fifteen years old, so that, all the people who
entered a birth date that implies they are younger than fifteen years, were updated (their
birth dates have been voided), however their other data (including their accesses) were kept.
Having done the exploratory data analysis, it was noticed that the percentage of students
who are older tan 25 years, is at most 3 %, then it was decided to void ages of students older
than 25 years.
Students are expected to take at least the first test, some students can leave the course,
and the remaining ones would take the second test, and so forth. The drop out can be cal-
culated by identifying the students who have taken the first test, but they have not taken
the second one. The cases when a student has not taken one test, but he/she then took a
later test, are considered incoherent, all of these cases were discarded.
Students are expected to enroll in only one group. Group related data, like the start ti-
me classes, are used by the data mining process. Since it is not possible to determine which
is the real group of a student who joined several ones, all the students who joined more than
one group, were discarded.
3.2.1. Identification and mixing of duplicated accounts
Anyone who has an email, can register into the platform, so that, several students have
registered more than once, and there are several accounts describing an unique behavior of
only one student. It was assumed that two or more accounts belong to the same user, if at
least one of the following conditions is met:
The database contains several accounts with the same user name, only the first one is
selected when user attempts to log in. If several accounts have the same user name,
those accounts belong to the same person.
The platform allows the existence of accounts with the same email, then, if several
accounts have the same email, those accounts belong to the same person.
The platform asks the name and last name at the registration. It is expected that the
user enters two names and two last names. Assuming that it is very improbable that
two people have the same two names and the same two last names, if several accounts
(with at least two names or two last names) have the same names and last names, then
those accounts belong to the same person.
Two accounts also belong to the same person if the first account has only one name
and two last names (or two names and only one last name) and the second one has two

26 3 Data understanding and Exploratory data analysis
names and two last names, and there is a coincidence if the additional name or last
name (that must be the second one) is removed, e.g. If there are two accounts, the first
account name is “Name1” and that account last name is “LastName1 LastName2”,
and the second account name is “Name1 Name2”, and that account last name is
“LastName1 LastName2”, then the name “Name2” can be removed and after that,
there is a coincidence on the name and last name of those two accounts, and thus,
both accounts belong to the same person.
3.3. Session identification
It was defined a session as the set of accesses carried out by one student, in the lapse between
the time when the student logged in and the time when the student stopped consulting for
a least half an hour, namely, if the student started consulting by carrying out one access,
ten minutes later he/she carries out another access, and 40 minutes later he/she carries out
another access, then one session comprised of the first two accesses is recognized. The last
of the three accesses, is the beginning of a new session.
Identify these sessions gives useful information, such as how much time was spent by each
student in his/her sessions, the resources that have been consulted, the students’ behavior
between the log in and the ending of the consulting process, the number of resources that
the students used to consult per session, the resources that tend to be consulted on the sa-
me session, to know whether the students used to consult only one topic or more, and so forth.
It is necessary to run a procedure to identify the sessions. Many session identification pro-
cedures, process the log file created by the server application, and take several user-related
data into account, including the I.P. address, web browser, operating system and its version,
and other data[31], then, the additional hits that do not provide additional information (such
as styles sheets, background images, scripts) are removed, and the resulting hits are grouped
by their date/time, so that, the time between a randomly chosen element and its next or
previous element, is never more than a predefined threshold, generally, half an hour[31]. Fi-
nally, the lost queries (due to local cache loading) must be recovered by recognizing the tree
design of the website, and identify which sequences of queries could not be done, because
there are hits from one page to another unrelated page, then, the lost-middle pages accesses
are discovered[31].
Although the Virtual Intelligent Learning Platform also creates the log file, it is not ne-
cessary to process it, because the Platform recognizes all accesses to resources, and the
platform registers them to the database, this behavior, has the following advantages:
It is not necessary to process changing data (such as the I.P. address) to identify the

3.4 Data integration: Data warehouse 27
user, the Platform identifies the user who performs the access, and registers both ids
of user and resource.
It is not necessary to identify lost queries, because the Platform registers any access,
even if the web browser has a cached content, and opens it instead of downloading it
again.
It is not necessary to remove queries that do not provide additional information, be-
cause the Platform registers only the accesses to documents, exercises and videos, and
registers in another table, the entries to each topic. Hits to another files like styles
sheets or images, are not registered.
All the accesses data are available. The log file contains all the hits to files, performed by
all the users, so that, all the downloads have been registered. As the videos were hosted
on a third party video streaming website, and they were linked from the Platform
instead of being hosted in the server, the final user’s client does not have to download
it from the Platform, and thus, this access is not registered into the log file.
It was determined that the maximum waiting time between two accesses of the same session,
is half an hour. All the accesses of each user were sorted by date and time, and the pairs of
accesses that are further apart than half an hour, were split.
3.4. Data integration: Data warehouse
The Data warehouse was designed to be updated incrementally, each time all the students
have taken one test, when the deadline of the test attempt is reached for the group with
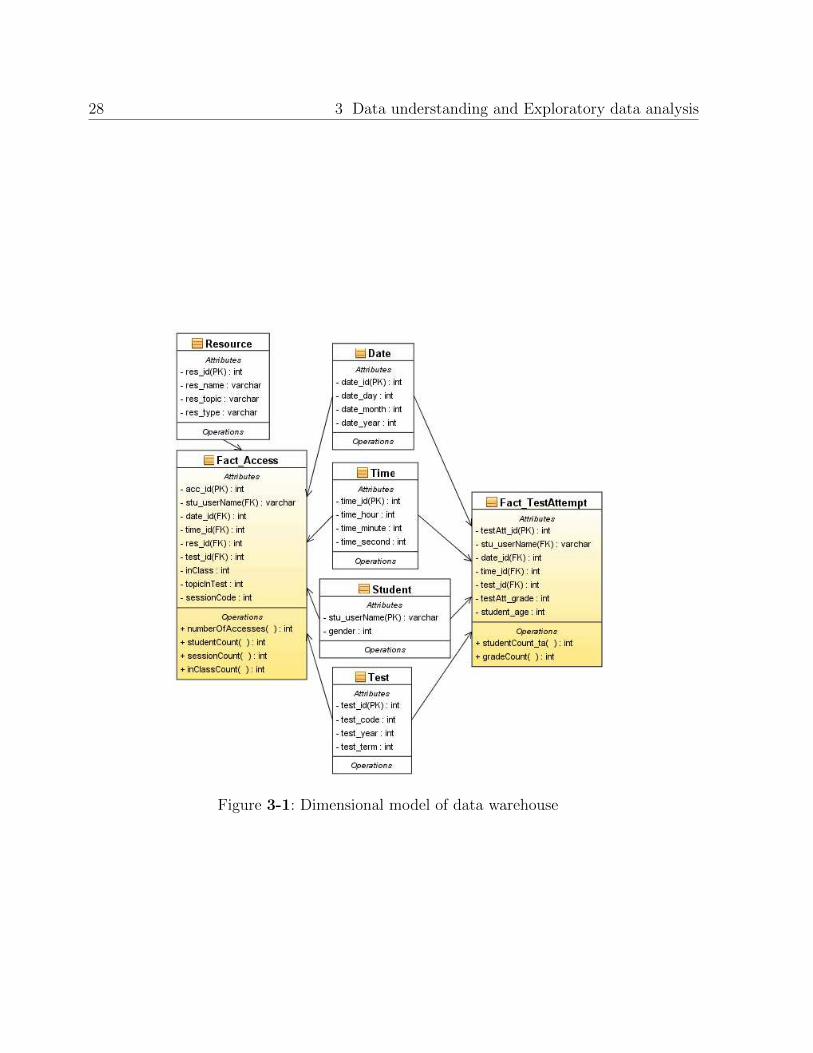
the latest deadline. As shown in figure 3-1, the data warehouse contains two fact tables:
Fact Access and Fact TestAttempt, and several dimension tables that links the access to
the student who performed it, the resource consulted and the date and time data. The
Fact TestAttempt table contains all the test attempts performed by the student, including
their beginning date and time.
The property “inClass” has a value of 1 (one) if the access was performed during class,
otherwise it has a value of 0 (zero). The property ’topicInTest’ is 1 if the resource being
consulted, belongs to a topic, which was covered by the next scheduled test. The “Student”
dimension table and the “Fact TestAttempt” fact table contain foreign keys of the date/time
dimension tables, in order to register the student’s birth date and the beginning of the test
attempt.
The ETL for this data warehouse, is run every time the latest deadline of test attempt
of a given test (first, second or third), is reached, it loads the data as follows:
28 3 Data understanding and Exploratory data analysis
Figure 3-1: Dimensional model of data warehouse
3.5 Exploratory data analysis 29
If the test is the first one of the current term, the students who are going to be registered
in the Data warehouse, are chosen by the selection criteria described previously.
Any unfinished test attempt (the student started it, but left it before being graded),
is removed.
All the test attempts of the test being processed, and accesses linked to that test
(namely, all accesses carried out after the ending of the previous test attempt), carried
out by students already registered in the Data warehouse, are registered.
The following measures of the Fact Access table, have been defined for this data warehouse:
numberOfAccesses: It is the distinct count of accesses
studentCount: It is the distinct count of students
sessionCount: It is the distinct count of sessions
inClassCount: It is the sum of the “inClass” variable
The Fact Access table contains approximately 40000 records per term. The measures of the
Fact TestAttempt table, are:
studentCount ta: It is the distinct count of students
gradeCount: It is the distinct count of grades gotten
3.5. Exploratory data analysis
The accesses carried out by the students have been aggregated, by session and test attempt.
The recognized session, is each entry of the student to the platform, and all the accesses
he/she carried out until he/she stopped accessing for at least half an hour. It is possible to
find which accesses were carried out per session, it gives useful information, such as their
order of consultation, which resources have been accessed, the order of the accesses by date
and time, which accesses were performed in class, and more. It is also possible to summarize
the student’s behavior between each test attempt, it also gives useful information, such as
the behavior before the test was taken, the grade gotten, all the accesses carried out by the
student between the previous test attempt and the current one, all of those accesses are
assigned to the current test attempt. As one of the objectives of this research is to identify a
connection between the web behavior and the academic performance, these aggregations are
used in the profile identification, e.g. if a student logs in and reads an exercise, it is assumed
that the user is studying for the next scheduled test, and the way he/she studies (including
this and previous sessions) will have an impact on the grade of that test.

30 3 Data understanding and Exploratory data analysis
Ter1 T.1 Ter1 T.2 Ter1 T.3 Ter2 T.1 Ter2 T.2 Ter2 T.3
0
100
200
300
400
500
Term and Test
Num
ber
ofp
eople
MenWomen
Figure 3-2: Number of people who have taken each test, grouped by gender.
3.5.1. Analysis of accesses
As presented previously, each access is assigned to one test attempt, depending on the date
and time of each access, and date and time of each test attempt. The number of students
who have taken each test, and the sessions and accesses assigned to the attempt of that test,
are presented in Table 3-1.
Table 3-1: Counts by test attempt
Test Students Sessions Accesses
First. 2014-1 544 4675 25205
Second. 2014-1 469 3313 10734
Third. 2014-1 360 2272 5549
First. 2014-2 469 5022 24721
Second. 2014-2 412 3593 12190
Third. 2014-2 312 1698 3795
Since the students have to take the course in person at the Universidad Nacional de Colom-
bia (Bogota campus), it is expected that they are living in Bogota, Colombia. It is observed
that only a few students registered a country other than Colombia. Approximately 90 % of
students, have registered Bogota as their hometown. Due to the very low variability of those
two data, they have been discarded.

3.5 Exploratory data analysis 31
As shown in figure 3-2, commonly the number of men is approximately five times larger
than that of women.
The topics covered by each test were:
First test of term 2014-1: Languages, Logic, Set theory and “Relations and Functions”
Second test of term 2014-1: Flows, Recursive functions and “Relations and Functions”
Third test of term 2014-1: Loops, Arrays, Strings and Matrices
First test of term 2014-2: Languages, Logic, Sets and “Relations and Functions”
Second test of term 2014-2: Flows, Recursive functions and “Relations and Functions”
Third test of term 2014-2: Loops, Arrays, Strings and Matrices
It was expected that the first test of term 2014-1 and the first one of term 2014-2, would
cover the same topics, but there is a little difference in one topic name: “Set theory” and
“Sets”. It is assumed that those two topics, cover the same theory, and thus, they are the
same topic but with different name. Namely, all tests of one term are comparable with those
of another term, because they have covered the same topics.
The platform hosts 141 resources, of which, two have several types, the files “libro programacion-
cap4-ejers1.pdf” and “libro programacion-cap9-ejers1.pdf” were registered as both docu-
ments and exercises for the term 2014-1, while they are registered only as exercises for the
term 2014-2. The resource consulted is considered as of the type chosen by the student, thus,
if the student chose “Exercises” and then, he/she chose any of the files listed previously, the
type of resource registered is “Exercise”. The video entitled “Data flow and persistence”
(Original title: “Flujo de datos y persistencia”) was available just for the term 2014-1, while
all the resources available for the term 2014-2 were also available for the term 2014-1, there
is no equivalent for this resource in term 2014-2. Namely, the resources available in 2014-1
are comparable with those of term 2014-2, because the resources were the same.
The figure 3-3 shows the number of hosted resources by their type. The figure 3.5.1 shows
the total number of accesses to each resource type per term, by all students. It is noticeable
that the number of videos is notoriously higher than any other type, however the most con-
sulted type of resource is “Document”.
The table 3-2 presents the number of accesses to all the resources, and the properties of
those accesses. The field “Accesses” is the total number of accesses that were carried out by
all students, and that were assigned to the attempt of the test indicated at the “Test” field.
The “In class” field is the number of accesses carried out by the student during class time.

32 3 Data understanding and Exploratory data analysis
Document Exercise Video
20
40
60
80
100
Type of resource
Num
ber
ofhos
ted
reso
urc
es
Figure 3-3: Number of available resources by type
Table 3-2: Properties of accesses
Test Accesses In class % Topic in test %
First 2014-1 25205 7156 28 % 24062 95 %
Second 2014-1 10734 3054 28 % 9152 85 %
Third 2014-1 5549 1762 31 % 4298 77 %
First 2014-2 24721 8331 33 % 24175 97 %
Second 2014-2 12190 4110 33 % 10518 86 %
Third 2014-2 3795 1208 31 % 2945 77 %
It is noticeable the decrease of the number of accesses as time passes by. Approximately
30 % of accesses were carried out during class time. This table suggests that the platform
is mainly used as an “out of class” academic tool, with a very high preference for accessing
resources that explains topics covered by the test, thus, it can be concluded that the user
was studying for that test. Due to its very low variability, this field “topicInTest” was not
used in the data mining process.
The figure 3-5 shows the box plot of the total number of accesses performed by each
student. There is a tendency of decreasing the number of accesses as time passes by, all the
tests have one minimum value, it is an outlier close to the 25 % quartile, they also have a
maximum value, it is also an outlier, but very far from the 75 % quartile. Thus, it is con-
cluded that for each test, there are few people who decided to carry out a lot of accesses,
and that behavior converted them into outliers, while most people decided to carry out a
moderate number of accesses.

3.5 Exploratory data analysis 33
Document Exercise Video
0,5
1
1,5·104
First of 2014-1
Num
ber
ofac
cess
es
Document Exercise Video0
0,5
1
1,5·104
Second of 2014-1
Num
ber
ofac
cess
es
Document Exercise Video
0
0,5
1
1,5·104
Third of 2014-1
Num
ber
ofac
cess
es
Document Exercise Video
0,5
1
1,5·104
First of 2014-2
Num
ber
ofac
cess
es
Document Exercise Video
0,5
1
1,5·104
Second of 2014-2
Num
ber
ofac
cess
es
Document Exercise Video
0
0,5
1
1,5·104
Third of 2014-2
Num
ber
ofac
cess
es
Figure 3-4: Number of accesses per test attempt

34 3 Data understanding and Exploratory data analysis
0 50 100 150 200 250 300
First test 2014-1
Second test 2014-1
Third test 2014-1
First test 2014-2
Second test 2014-2
Third test 2014-2
Figure 3-5: Box plot of number of accesses per test
The figure 3.5.1 is the scatter plot for each test, of grades vs number of accesses. Every
figure contains one point per student.
Regarding first test of term 2014-1, the data become more dispersed as the number of ac-
cesses increases, this may be, the platform was useful as an academic support tool, since the
students tended to get higher grades as their number of accesses increases. This test could
be too easy, since most points are located over the passing grade. Regarding second test of
term 2014-1, like the previous test, the data also become more dispersed as the number of
accesses increases, thus, the platform was useful as an academic support tool for this test too,
however, it is noticeable that the test difficulty has increased, since the points are now better
balanced between all the possible grades. Almost all the points of third test of term 2014-1,
are uniformly distributed between 0 and 50 accesses, and all the possible grades, namely, the
number of accesses was not important in defining the students’ grades, this could be due to
several factors, like the ending term pressure, which implies lack of time, or some students
have already passed the course and they would have no interest in passing this test, among
other factors.
The data of first test of term 2014-2, become again more dispersed as the number of ac-
cesses increases, nonetheless, the difficulty is higher than that of previous term, the points
are better balanced between passing and failing grades, thus, this behavior is closer to the
second test of previous term, than the first one. The data of second test of term 2014-2,
become more dispersed as the number of accesses increases, but this behavior is less remar-
kable, as most points are concentrated between 0 and 60 accesses, and all the possible grades.
The remaining points, visually tend to be atypical. The points of third test of term 2014-2,
as points of third test of previous term, did not become more dispersed as the number of
accesses increases. This may be, like the term 2014-1, the ending of term pressure, could be

3.5 Exploratory data analysis 35
0 100 200 300
0
1
2
3
4
5
First of 2014-1
Gra
de
0 50 100 150
0
1
2
3
4
5
Second of 2014-1
Gra
de
0 100 200
0
1
2
3
4
5
Third of 2014-1
Gra
de
0 100 200 300
0
1
2
3
4
5
First of 2014-2
Gra
de
0 100 200 300
0
1
2
3
4
5
Second of 2014-2
Gra
de
0 50 100
0
1
2
3
4
5
Third of 2014-2
Gra
de
Figure 3-6: Scatter plot of grades vs number of accesses
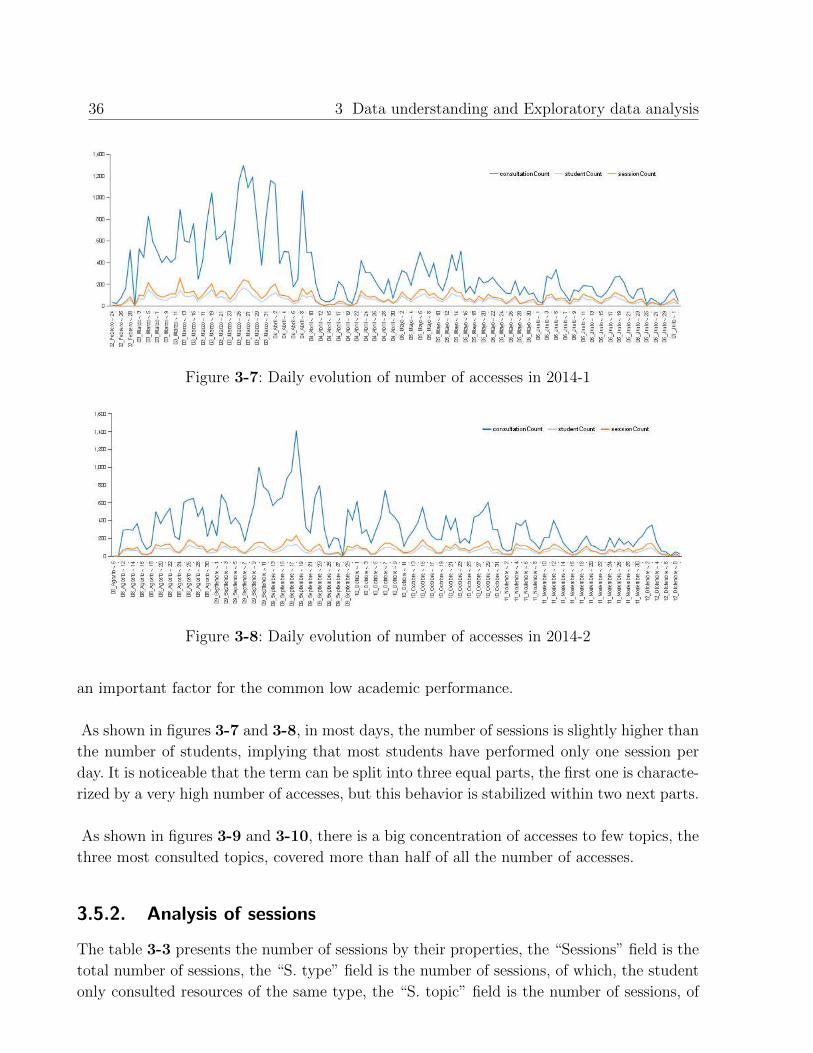
36 3 Data understanding and Exploratory data analysis
Figure 3-7: Daily evolution of number of accesses in 2014-1
Figure 3-8: Daily evolution of number of accesses in 2014-2
an important factor for the common low academic performance.
As shown in figures 3-7 and 3-8, in most days, the number of sessions is slightly higher than
the number of students, implying that most students have performed only one session per
day. It is noticeable that the term can be split into three equal parts, the first one is characte-
rized by a very high number of accesses, but this behavior is stabilized within two next parts.
As shown in figures 3-9 and 3-10, there is a big concentration of accesses to few topics, the
three most consulted topics, covered more than half of all the number of accesses.
3.5.2. Analysis of sessions
The table 3-3 presents the number of sessions by their properties, the “Sessions” field is the
total number of sessions, the “S. type” field is the number of sessions, of which, the student
only consulted resources of the same type, the “S. topic” field is the number of sessions, of

3.5 Exploratory data analysis 37
Relations and Functions
Sets
Logic
Flows
Languages
Recursive functions
Arrays
Bucles
Matrices
Strings
Abstract data types
25,5 %
20,5 %20 %
8 %
7,5 %
5 %4 %
3,5 %3 %2 %1 %
Figure 3-9: Topics of resources consulted in term 2014-1
Relations and Functions
Sets
Logic
Flows
Languages
Recursive functions
Arrays
Bucles
Matrices
Strings
Abstract data types
27 %
21,5 % 20 %
8 %
7,5 %
6 %3 %3 %2 %1,5 %0,5 %
Figure 3-10: Topics of resources consulted in term 2014-2
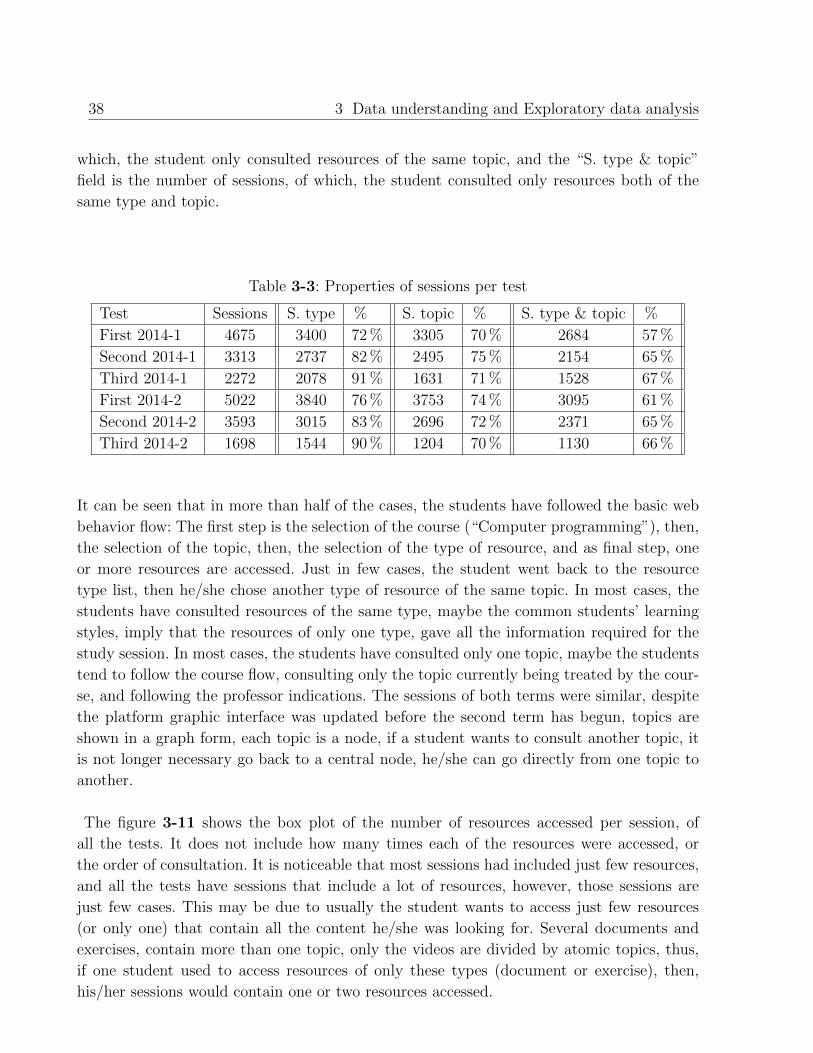
38 3 Data understanding and Exploratory data analysis
which, the student only consulted resources of the same topic, and the “S. type & topic”
field is the number of sessions, of which, the student consulted only resources both of the
same type and topic.
Table 3-3: Properties of sessions per test
Test Sessions S. type % S. topic % S. type & topic %
First 2014-1 4675 3400 72 % 3305 70 % 2684 57 %
Second 2014-1 3313 2737 82 % 2495 75 % 2154 65 %
Third 2014-1 2272 2078 91 % 1631 71 % 1528 67 %
First 2014-2 5022 3840 76 % 3753 74 % 3095 61 %
Second 2014-2 3593 3015 83 % 2696 72 % 2371 65 %
Third 2014-2 1698 1544 90 % 1204 70 % 1130 66 %
It can be seen that in more than half of the cases, the students have followed the basic web
behavior flow: The first step is the selection of the course (“Computer programming”), then,
the selection of the topic, then, the selection of the type of resource, and as final step, one
or more resources are accessed. Just in few cases, the student went back to the resource
type list, then he/she chose another type of resource of the same topic. In most cases, the
students have consulted resources of the same type, maybe the common students’ learning
styles, imply that the resources of only one type, gave all the information required for the
study session. In most cases, the students have consulted only one topic, maybe the students
tend to follow the course flow, consulting only the topic currently being treated by the cour-
se, and following the professor indications. The sessions of both terms were similar, despite
the platform graphic interface was updated before the second term has begun, topics are
shown in a graph form, each topic is a node, if a student wants to consult another topic, it
is not longer necessary go back to a central node, he/she can go directly from one topic to
another.
The figure 3-11 shows the box plot of the number of resources accessed per session, of
all the tests. It does not include how many times each of the resources were accessed, or
the order of consultation. It is noticeable that most sessions had included just few resources,
and all the tests have sessions that include a lot of resources, however, those sessions are
just few cases. This may be due to usually the student wants to access just few resources
(or only one) that contain all the content he/she was looking for. Several documents and
exercises, contain more than one topic, only the videos are divided by atomic topics, thus,
if one student used to access resources of only these types (document or exercise), then,
his/her sessions would contain one or two resources accessed.

3.5 Exploratory data analysis 39
0 20 40 60 80
First test 2014-1
Second test 2014-1
Third test 2014-1
First test 2014-2
Second test 2014-2
Third test 2014-2
Figure 3-11: Box plot of number of resources consulted by session
0 1 2 3 4 5
First test 2014-1
Second test 2014-1
Third test 2014-1
First test 2014-2
Second test 2014-2
Third test 2014-2
Figure 3-12: Box plot of grades gotten in attempts of each test
3.5.3. Analysis of test attempts
The figure 3-12 shows the box plot of grades gotten in attempts of each test. It shows a high
concentration of people who were graded close to 4.0 on the first test of term 2014-1. It also
shows the evolution of this behavior on the next tests, these behaviors have a higher number
of common grades (there are no only grades close to 4.0), even, their boxes included failing
grades and the maximum one. It is also noticeable that this behavior was not replicated in
the next term (2014-2), the box of first test of term 2014-2, is larger than that of first test of
term 2014-1, even, it contains failing grades, and the median is approximately the borderline
passing grade, thus, the first test of term 2014-2 is better balanced than that of term 2014-1.
Since some students had been updated by voiding their ages (as part of the selection cri-

40 3 Data understanding and Exploratory data analysis
14 16 18 20 22 24 26
First test 2014-1
Second test 2014-1
Third test 2014-1
First test 2014-2
Second test 2014-2
Third test 2014-2
Figure 3-13: Box plot of ages per test attempt
teria), all of them were updated again, it was recognized the first test taken by each one of
those students, and their birth date was updated as the average birth date of all the students
who also took that test. The figure 3-13 shows the box plot of ages per test, it is noticeable
that the behavior of the “age” variable is similar for all the tests, despite the difference in
number of people.
The drop out can be calculated by checking the tests attempts, e.g., if one student had
taken the first test, but he has not taken both the second and third ones, it should be, that
student left the course. In 2014-1, 40 students took the first test, but they did not take the
second one, 82 students took the second test, but they did not take the third one. In 2014-2,
42 students took the first test, but they did not take the second one, 69 students took the
second test, but they did not take the third one.
3.6. Summary
The Virtual Intelligent Learning Platform has collected three kinds of data: demographic
(age and gender), academic (grades gotten in test attempts) and behavioral (all the accesses
to resources, which allowed identify the sessions). Around 40000 accesses records per term
were registered into the data warehouse.
The exploratory data analysis has allowed notice several data properties, the number of
sessions and accesses, decreases as time passes by, even in the case of accesses, this number
is reduced by half per test attempt. Approximately a third of students who have taken the
first test, did not take the third one, i.e., there was a drop out rate of around 33 %. After
watching the daily evolution of number of accesses of both terms, it is noticeable that there

3.6 Summary 41
was a first lapse (around one third of the entire term) where the students carried out many
accesses, the behavior was then stabilized. The tests difficulty was different among terms,
the term 2014-1 was noticeably easier than 2014-2.
Regarding students’ behavior, it was noticed that commonly the students tended to per-
form only one session a day (based on the daily evolution figures), it was also noticed that
commonly the students performed a moderated number of sessions, and by each session, the
student only accesses few resources, but there were few students who carry out many accesses
by test, and many accesses in few sessions, this behavior has converted them into outliers.
In at least half of the cases, the student performed the basic web behavior flow: Selection of
topic, selection of resource type, and finally, he/she accessed one or more resources.

4 Profiling model and Common
sequences identification
This chapter presents the proposed student profiling and sequence identification model. This
model is comprised of two processes: the first one, aggregates the behavioral data, to one row
by student, this process clusters then these rows, to identify the student profiles, being each
cluster a profile. The second process identifies the common sequences of navigation by each
profile, and connect each sequence to an academic performance. Those sequences connected
to a high academic performance, may be the input of the recommender system.
4.1. Model design
The proposed approach extracts and transforms features from the log data, in particular,
the number of accesses to resources was aggregated, and sequences of navigation were built.
The model design is shown in figure 4-1, it finds the clusters of students, being each cluster
a potential profile. For each cluster, it finds the common sequences, and calculates several
variables for each sequence, that can be used to connect that sequence to an academic per-
formance.
This model is flexible, it can be applied to individual terms as well as all terms in one.
Each one of these strategies, has different advantages.
Due to the fact that the questions bag is still being filled, new questions are proposed and
registered every term, and their difficulty level (a numeric value) must be assigned manually
so far. The exploratory data analysis (shown in chapter 3) allows notice that the questions
of term 2014-1 were easier than those of term 2014-2, thus, a term is also the only one time
granularity where the difficulty of tests, is the same for all students. If two sets of clusters
(coming from two different terms) are compared, it allows notice the evolution of the web
behavior, it allows know how the pedagogical choices applied in these terms, affected the stu-
dents’ behavior, and the connection between these behaviors and the academic performances.
On the other hand, integrate the data of a specific test (first, second or third) coming from
all terms, allows build incremental profiles, that can be used by the recommender system,
because that system uses historical data, i.e., data coming from past terms, to recommend

4.1 Model design 43
Figure 4-1: General model of the Profiling, and Common sequences identifier System
resources to the student who is currently using the platform. It also allows identify the con-
vergence of the profiles as time passes by.
The profiling model has several input data, coming from the platform database:
Web usage log: The browsing history, performed by each student, to any resource
(document, exercise or video). Basically, student identifier, resource identifier, date
and time.
Students’ birth date and gender: The data asked to each student at registration, they
include the birth date and gender of each student. The birth date is then used to
calculate the age.
Test attempts: The academic performance data. Basically, student identifier, test iden-
tifier, start date and time, and grade gotten by the student.
The processes shown in figure 4-1 are explained below.
4.1.1. Data aggregation
The Data aggregation process, uses the Web usage log and Test attempts data, to count the
number of accesses, carried out by each student, for each test attempt. The input data of
Web usage log were aggregated one row by student. By each student, all of his/her accesses
and test attempts are listed and sorted by their date and time; then, the list of accesses was
split according to test attempts dates; thus, any access carried out between the first day of
the academic term and the day when the first test was taken by the student, was assigned
44 4 Profiling model and Common sequences identification
to the first test; any access carried out between the day when the first test was taken and
the day when the second test was taken, was assigned to the second test, and so forth. The
number of accesses to each resource type was aggregated and split in two groups: accessed
during class time or non-class time. Another calculations were performed: the average of time
the student spent in his/her sessions, and the average of absence time (the time between two
sessions).
Because of the design of the Data aggregation process, the smallest time granularity is the
entire lapse between the first day of the academic term, and the day when the student takes
the first test, or the entire lapse between the day when the student takes the first test, and
the second one, and so forth. A smaller lapse implies the process aggregates incomplete data.
This process builds a minable view for each test (three a term), and it is necessary to
perform independent KDD processes, because each test has covered different topics, and the
number of registered accesses is different among tests (Table 3-1).
4.1.2. Data preparation
The Data preparation process, transforms the data given by the Data aggregation process,
in order to allow the clustering process to use them, without obtaining adverse results. It
consists of two subprocesses: Outlier identification and Data normalization. An independent
Data preparation process is run for each term.
Outlier identification
This subprocess is applied to the minable view, each row of that view is a specific test at-
tempt, performed by one student, to a test (first, second or third), its properties are presented
in table 4-1. It was determined that each point tends to be an outlier mainly by its fields
that do not have a theoretical maximum value, e.g., each student could log in and carry out
as many accesses as he/she wanted, so, it is possible that at least one student has carried
out a lot of accesses, and that behavior converted him/her into an outlier, however, all the
grades are between the minimum (0.0), and the maximum (5.0), and all of these are valid.
In this way, the number of accesses is used for discovering outliers, while the grade, is not
used.
The fields that have been used for detecting outliers are: number of accesses to each resource
type, average absence time, and average session length. These fields have been normalized
using range transformation, to [0.0 , 1.0]. The outliers were identified by applying a density
based process[17], any point which is farther away than 0.7 compared with at least 70 % of
all other points, is marked as an outlier. There are 2930 test attempts, of which, 89 have
been marked as outliers. The distance has been calculated with the euclidean formula. As

4.1 Model design 45
0 0,1 0,2 0,3 0,4 0,5 0,6 0,7 0,8 0,9 1
00,10,20,30,40,50,60,70,80,9
1
Number of accesses to videos
Ave
rage
sess
ion
lapse
Non outlierOutlier
Figure 4-2: Scatter plot of number of accesses to videos vs average session length, of first
test in 2014-2
0 0,1 0,2 0,3 0,4 0,5 0,6 0,7 0,8 0,9 1
00,10,20,30,40,50,60,70,80,9
1
Number of accesses to documents
Num
ber
ofac
cess
esto
exer
cise
s
Non outlierOutlier
Figure 4-3: Scatter plot of number of accesses to documents vs number of accesses to exer-
cises, of first test in 2014-2
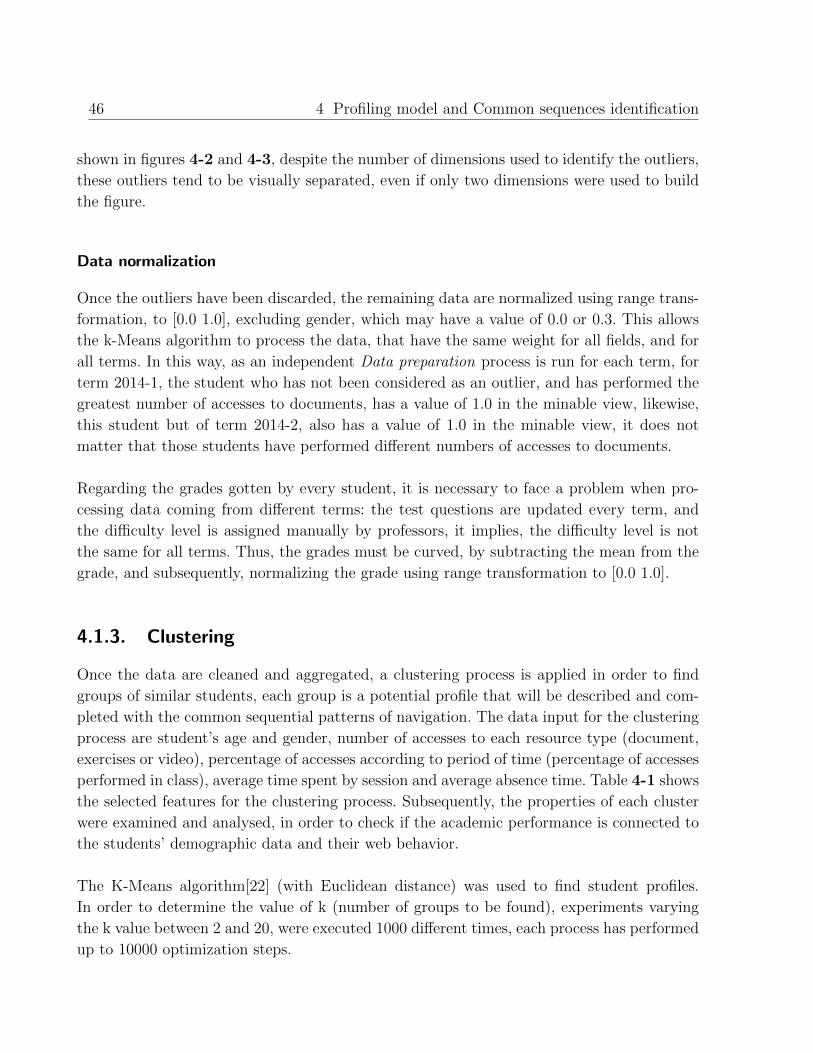
46 4 Profiling model and Common sequences identification
shown in figures 4-2 and 4-3, despite the number of dimensions used to identify the outliers,
these outliers tend to be visually separated, even if only two dimensions were used to build
the figure.
Data normalization
Once the outliers have been discarded, the remaining data are normalized using range trans-
formation, to [0.0 1.0], excluding gender, which may have a value of 0.0 or 0.3. This allows
the k-Means algorithm to process the data, that have the same weight for all fields, and for
all terms. In this way, as an independent Data preparation process is run for each term, for
term 2014-1, the student who has not been considered as an outlier, and has performed the
greatest number of accesses to documents, has a value of 1.0 in the minable view, likewise,
this student but of term 2014-2, also has a value of 1.0 in the minable view, it does not
matter that those students have performed different numbers of accesses to documents.
Regarding the grades gotten by every student, it is necessary to face a problem when pro-
cessing data coming from different terms: the test questions are updated every term, and
the difficulty level is assigned manually by professors, it implies, the difficulty level is not
the same for all terms. Thus, the grades must be curved, by subtracting the mean from the
grade, and subsequently, normalizing the grade using range transformation to [0.0 1.0].
4.1.3. Clustering
Once the data are cleaned and aggregated, a clustering process is applied in order to find
groups of similar students, each group is a potential profile that will be described and com-
pleted with the common sequential patterns of navigation. The data input for the clustering
process are student’s age and gender, number of accesses to each resource type (document,
exercises or video), percentage of accesses according to period of time (percentage of accesses
performed in class), average time spent by session and average absence time. Table 4-1 shows
the selected features for the clustering process. Subsequently, the properties of each cluster
were examined and analysed, in order to check if the academic performance is connected to
the students’ demographic data and their web behavior.
The K-Means algorithm[22] (with Euclidean distance) was used to find student profiles.
In order to determine the value of k (number of groups to be found), experiments varying
the k value between 2 and 20, were executed 1000 different times, each process has performed
up to 10000 optimization steps.

4.1 Model design 47
Table 4-1: Features used for the clustering process
Feature Description
ag Student’s age
gd Student’s gender
nD Number of accesses to documents
nE Number of accesses to exercises
nV Number of accesses to videos
dC Percentage of accesses to documents in class time
eC Percentage of accesses to exercises in class time
vC Percentage of accesses to videos in class time
sl Average time spent by session
ta Average absence time between sessions
The values of sl and ta were used in milliseconds, and ag in days, by the clustering algo-
rithm, however, ag is shown in years, sl in minutes, and ta in hours, in the cluster descriptions.
In some cases, a field of the minable view, could not be calculated because of lack of data,
e.g., if a student has never watched a video, it is not possible to calculate the percentage of
accesses to videos, that were carried out during class time, or, if a student have performed
only one session, it is not possible to calculate the average absence time (average time bet-
ween sessions), in both cases, the formula implies a division by zero. In such cases, the null
value was changed by the average of another students’ values, of the same term.
When profiling with data coming from all terms, each time a term has been finished, the data
collected in that term are inserted into the minable view, the previous set of clusters (built
with data coming from all terms) is discarded, and the clusters are rebuilt from scratch,
the common sequences connected to a high academic performance, are then identified from
scratch. In this way, the data of the term that has just finished, are used for complementing
and improving the recommender system.
4.1.4. Identification of sequences
Once students are profiled by each test, the common sequences of navigation are identified.
This process is based on web usage mining. Due to platform flow design, it is not necessary to
identify the structure tree: a student chooses the course, then he/she chooses the topic, then
the resource type, and then, he/she can navigate through a list of all the resources available.
The resources list is accessible while he/she pulls out an specific resource, thus, the student
can change the resource being accessed, by clicking other item on the list, instead of going
back to the last page visited. Moreover, it is not necessary to deal with user’s changing or
incomplete data, this is further explained in Session identification section of chapter 3.
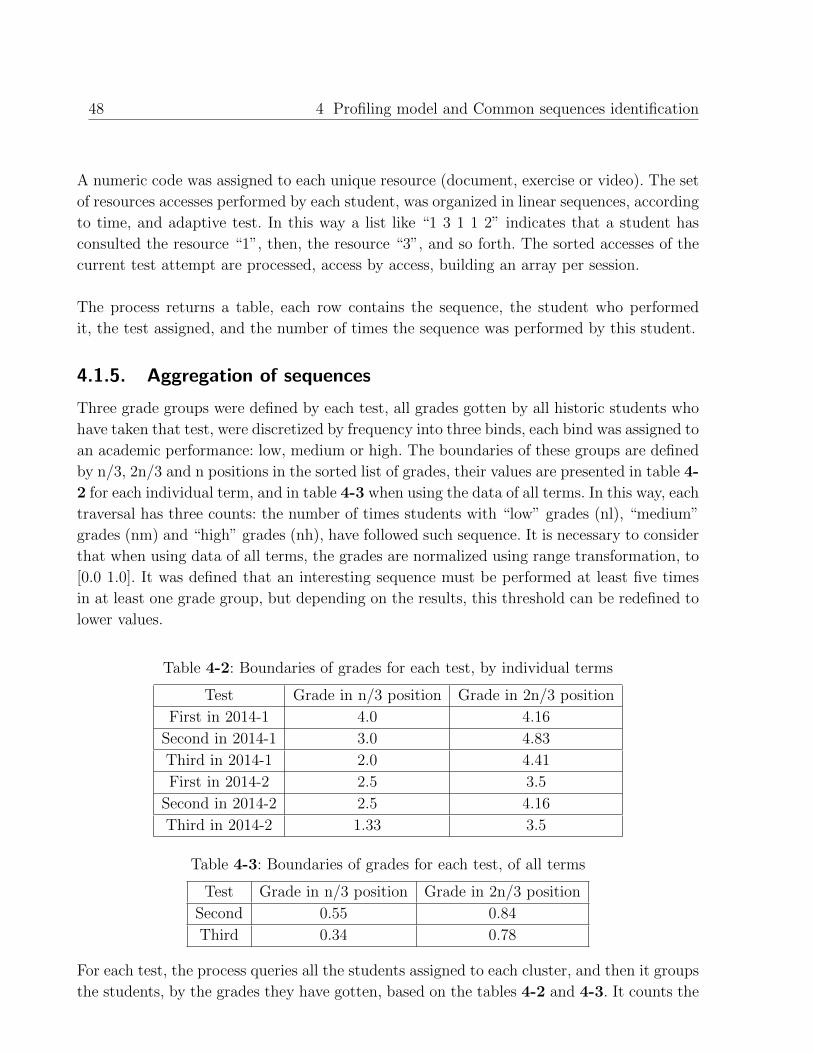
48 4 Profiling model and Common sequences identification
A numeric code was assigned to each unique resource (document, exercise or video). The set
of resources accesses performed by each student, was organized in linear sequences, according
to time, and adaptive test. In this way a list like “1 3 1 1 2” indicates that a student has
consulted the resource “1”, then, the resource “3”, and so forth. The sorted accesses of the
current test attempt are processed, access by access, building an array per session.
The process returns a table, each row contains the sequence, the student who performed
it, the test assigned, and the number of times the sequence was performed by this student.
4.1.5. Aggregation of sequences
Three grade groups were defined by each test, all grades gotten by all historic students who
have taken that test, were discretized by frequency into three binds, each bind was assigned to
an academic performance: low, medium or high. The boundaries of these groups are defined
by n/3, 2n/3 and n positions in the sorted list of grades, their values are presented in table 4-
2 for each individual term, and in table 4-3 when using the data of all terms. In this way, each
traversal has three counts: the number of times students with “low” grades (nl), “medium”
grades (nm) and “high” grades (nh), have followed such sequence. It is necessary to consider
that when using data of all terms, the grades are normalized using range transformation, to
[0.0 1.0]. It was defined that an interesting sequence must be performed at least five times
in at least one grade group, but depending on the results, this threshold can be redefined to
lower values.
Table 4-2: Boundaries of grades for each test, by individual terms
Test Grade in n/3 position Grade in 2n/3 position
First in 2014-1 4.0 4.16
Second in 2014-1 3.0 4.83
Third in 2014-1 2.0 4.41
First in 2014-2 2.5 3.5
Second in 2014-2 2.5 4.16
Third in 2014-2 1.33 3.5
Table 4-3: Boundaries of grades for each test, of all terms
Test Grade in n/3 position Grade in 2n/3 position
Second 0.55 0.84
Third 0.34 0.78
For each test, the process queries all the students assigned to each cluster, and then it groups
the students, by the grades they have gotten, based on the tables 4-2 and 4-3. It counts the

4.2 Parameter settings 49
number of times a given sequence was performed by students assigned to the first group, and
sets this value to nl, likewise, the process assigns the values to variables nm and nh. Having
each sequence and its three counts: nl, nm and nh, it is necessary to assign the sequence
to an academic performance: low, medium or high. It is possible to use the sequence as an
input in the recommender system, if it was assigned to high.
In order to identify which sequences are connected to a specific academic performance, it is
necessary to compare those counters values. Assuming that it is necessary to know which
sequences are connected to a high academic performance, the sequences are sorted in reverse
from the value of nh/(nl+nm+nh) (in other cases, such as sequences connected to a low aca-
demic performance, the formula is nl/(nl+nm+nh)). It was defined, any sequence whose nh
value is greater than nl and greater than nm, is connected to a high academic performance.
In this way, another sequence whose nl value is greater than nh and greater than nm, is
connected to a low academic performance.
4.2. Parameter settings
Each test has a set of data assigned to it, each set is comprised of all the accesses carried
out in the lapse of study of that test, namely all the accesses carried out between the first
academic day and the day when the first test was taken, were assigned to the first test, and
so forth. For that reason, three independent processes were run, one per test.
The data volume is presented in table 3-1, it is necessary to subtract 89 test attempts
that were marked as outliers (this is further explained in Data preparation section).
As stated earlier, the model is flexible and can be applied to individual terms and all terms
in one as well, in both cases, the value of k was defined based on the average centroid dis-
tance versus number of clusters, a figure of k vs average centroid distance was built, it is
shown in 4-4 for the case of applying the model to individual terms, and in 4-5 for the case of
applying the model to all terms in one. These figures indicate that in both cases the marginal
gain tends to drop at a k-Value of six (6) for all adaptive tests, thus it is the chosen value of k.
The quality of the set of clusters was calculated through the Davies Bouldin index. In
order to notice the quality convergence, a figure of k vs Davies Bouldin index was built in
each case, regarding the case of applying the model to individual terms, this convergence is
shown in figures 4-6 and 4-7. Regarding the case of applying the model to all terms in one,
this convergence is shown in figure 4-8. These figures indicate that in both cases the selection
of the k-Value was adequate, because there is no a significant improvement in quality after
increasing it.
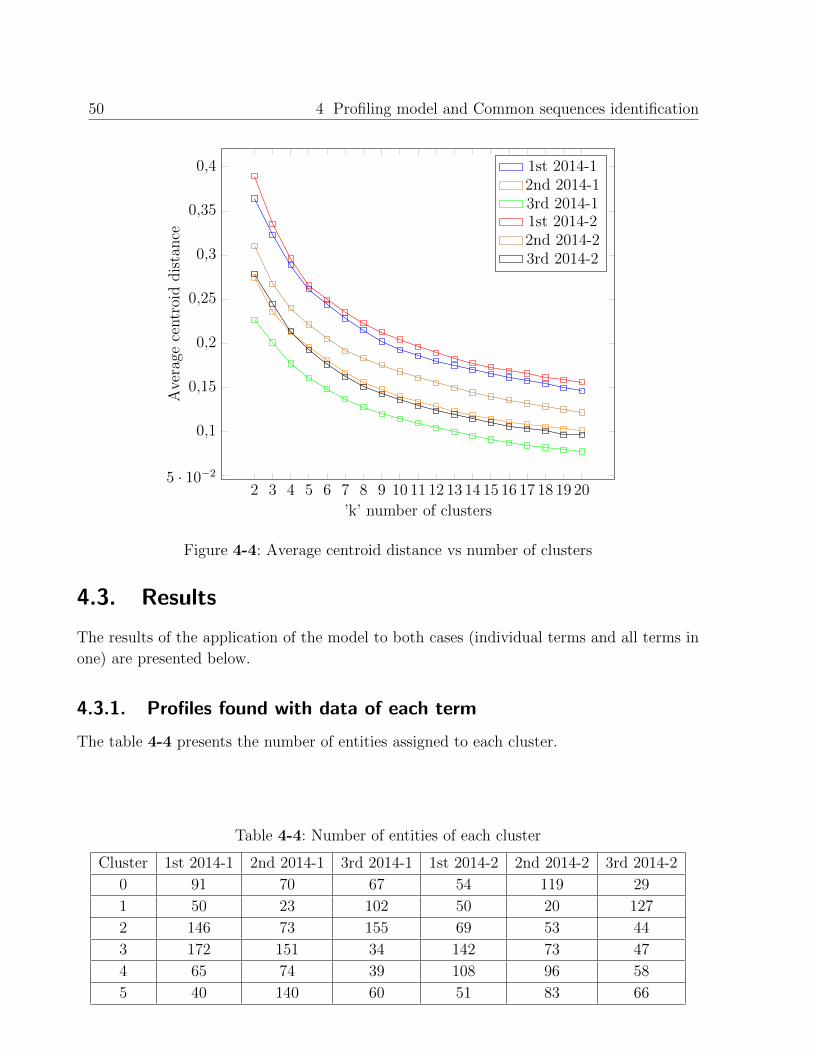
50 4 Profiling model and Common sequences identification
2 3 4 5 6 7 8 9 10 11 12 13 14 15 16 17 18 19 205 · 10−2
0,1
0,15
0,2
0,25
0,3
0,35
0,4
’k’ number of clusters
Ave
rage
centr
oid
dis
tance
1st 2014-12nd 2014-13rd 2014-11st 2014-22nd 2014-23rd 2014-2
Figure 4-4: Average centroid distance vs number of clusters
4.3. Results
The results of the application of the model to both cases (individual terms and all terms in
one) are presented below.
4.3.1. Profiles found with data of each term
The table 4-4 presents the number of entities assigned to each cluster.
Table 4-4: Number of entities of each cluster
Cluster 1st 2014-1 2nd 2014-1 3rd 2014-1 1st 2014-2 2nd 2014-2 3rd 2014-2
0 91 70 67 54 119 29
1 50 23 102 50 20 127
2 146 73 155 69 53 44
3 172 151 34 142 73 47
4 65 74 39 108 96 58
5 40 140 60 51 83 66
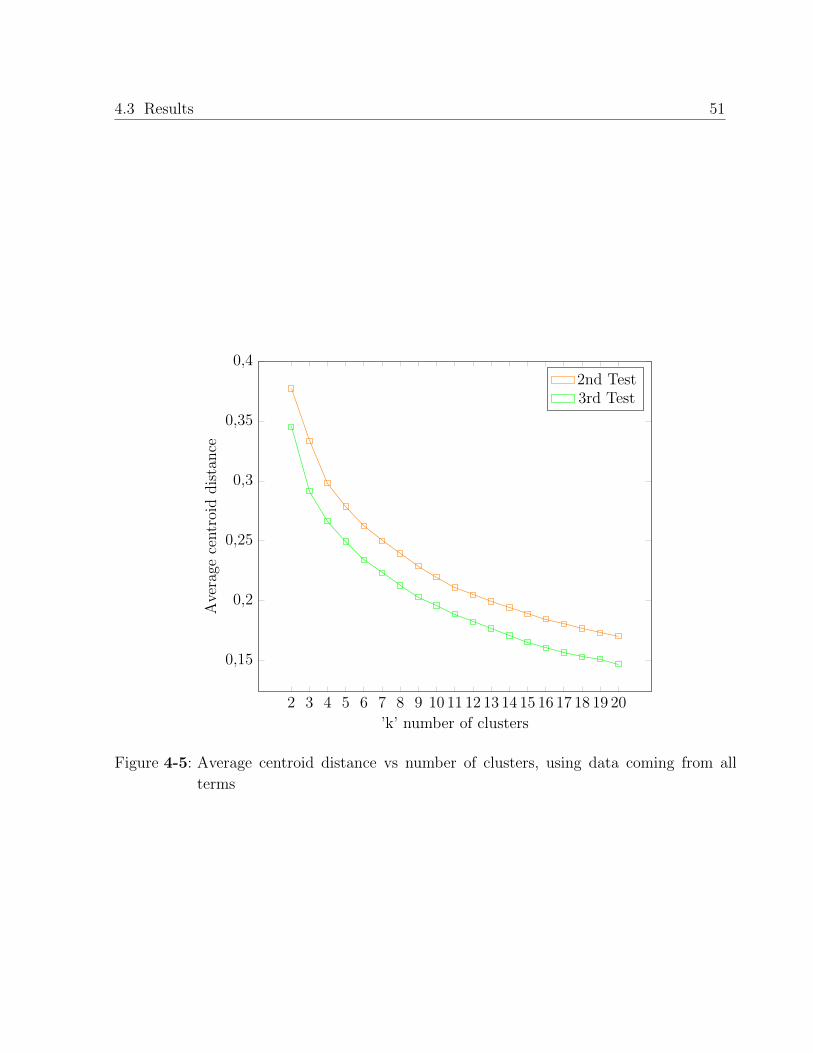
4.3 Results 51
2 3 4 5 6 7 8 9 10 11 12 13 14 15 16 17 18 19 20
0,15
0,2
0,25
0,3
0,35
0,4
’k’ number of clusters
Ave
rage
centr
oid
dis
tance
2nd Test3rd Test
Figure 4-5: Average centroid distance vs number of clusters, using data coming from all
terms

52 4 Profiling model and Common sequences identification
2 3 4 5 6 7 8 9 10 11 12 13 14 15 16 17 18 19 20
1,2
1,3
1,4
1,5
1,6
1,7
1,8
1,9
2
’k’ number of clusters
Dav
ies
Bou
ldin
index
1st 2014-12nd 2014-13rd 2014-1
Figure 4-6: Davies Bouldin index vs number of clusters, for term 2014-1
2 3 4 5 6 7 8 9 10 11 12 13 14 15 16 17 18 19 201,1
1,2
1,3
1,4
1,5
1,6
1,7
1,8
’k’ number of clusters
Dav
ies
Bou
ldin
index
1st 2014-22nd 2014-23rd 2014-2
Figure 4-7: Davies Bouldin index vs number of clusters, for term 2014-2

4.3 Results 53
2 3 4 5 6 7 8 9 10 11 12 13 14 15 16 17 18 19 20
1,4
1,5
1,6
1,7
1,8
1,9
’k’ number of clusters
Dav
ies
Bou
ldin
index
2nd Test3rd Test
Figure 4-8: Davies Bouldin index vs number of clusters, using data coming from all terms
Most interesting sequences are one or two accesses long, this behavior was predicted since
the review of the numbers of accesses per session (Figure 3-11).
As a general view, the dispersion of the sequences, by academic performance, can be graphed
through a three dimensional figure, each point is a sequence, and the value in each axis, is
the number of times, that this sequence was performed, by students who have gotten a grade
of a specific grade group (nl,nm or nh). No remarkable groups of sequences, concentrated
in high values of a specific axis, and low values of another two axes, were found in any
test, however, it was possible to identify which sequences tended to be more connected to a
specific academic performance, e.g, in order to identify such sequences connected to a high
academic performance, they are sorted in reverse from the value of nh/(nl+nm+nh), and
those whose nh value was greater than nm and greater than nl, are selected. For each test,
two figures of dispersion of the sequences are shown, one with the sequences of the cluster
with the best academic performances, and other with the sequences of the cluster with the
greatest numbers of accesses.
The sequences connected to a specific academic performance, are shown in a table, the
Sequence field of that table, presents the resources accessed and the order, the value C.
“Topic” indicates a chapter of the book, about the Topic indicated in quotes, P. indicates a
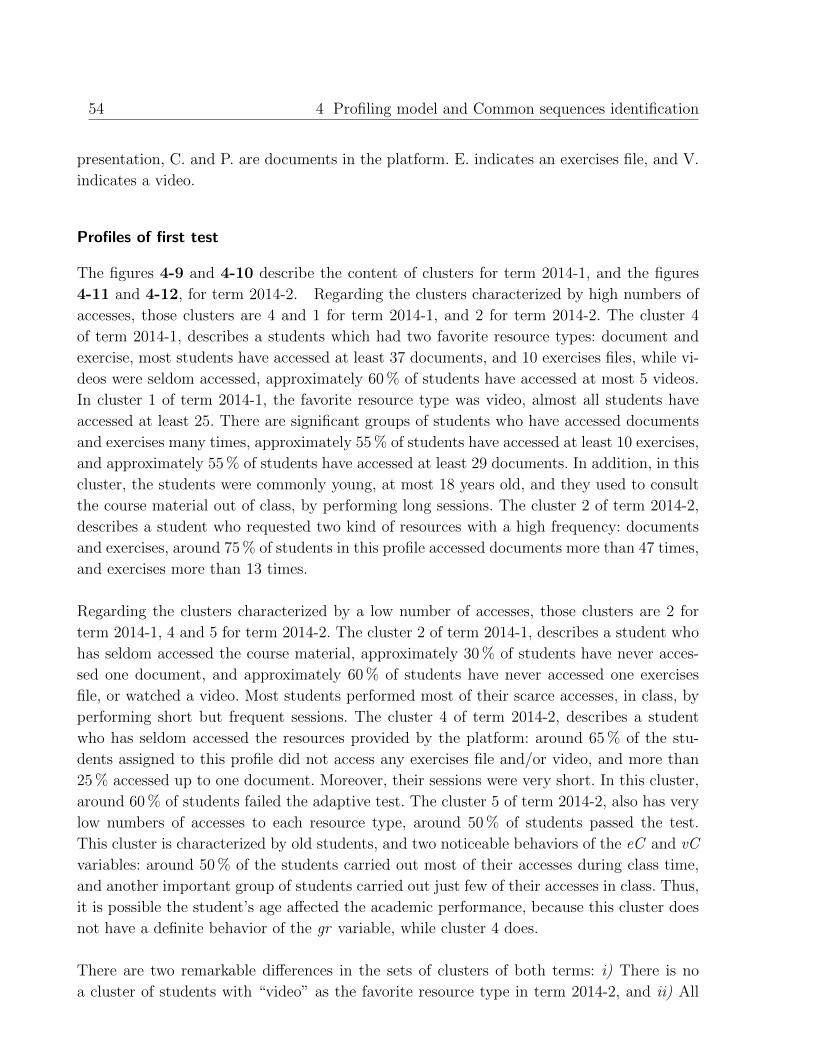
54 4 Profiling model and Common sequences identification
presentation, C. and P. are documents in the platform. E. indicates an exercises file, and V.
indicates a video.
Profiles of first test
The figures 4-9 and 4-10 describe the content of clusters for term 2014-1, and the figures
4-11 and 4-12, for term 2014-2. Regarding the clusters characterized by high numbers of
accesses, those clusters are 4 and 1 for term 2014-1, and 2 for term 2014-2. The cluster 4
of term 2014-1, describes a students which had two favorite resource types: document and
exercise, most students have accessed at least 37 documents, and 10 exercises files, while vi-
deos were seldom accessed, approximately 60 % of students have accessed at most 5 videos.
In cluster 1 of term 2014-1, the favorite resource type was video, almost all students have
accessed at least 25. There are significant groups of students who have accessed documents
and exercises many times, approximately 55 % of students have accessed at least 10 exercises,
and approximately 55 % of students have accessed at least 29 documents. In addition, in this
cluster, the students were commonly young, at most 18 years old, and they used to consult
the course material out of class, by performing long sessions. The cluster 2 of term 2014-2,
describes a student who requested two kind of resources with a high frequency: documents
and exercises, around 75 % of students in this profile accessed documents more than 47 times,
and exercises more than 13 times.
Regarding the clusters characterized by a low number of accesses, those clusters are 2 for
term 2014-1, 4 and 5 for term 2014-2. The cluster 2 of term 2014-1, describes a student who
has seldom accessed the course material, approximately 30 % of students have never acces-
sed one document, and approximately 60 % of students have never accessed one exercises
file, or watched a video. Most students performed most of their scarce accesses, in class, by
performing short but frequent sessions. The cluster 4 of term 2014-2, describes a student
who has seldom accessed the resources provided by the platform: around 65 % of the stu-
dents assigned to this profile did not access any exercises file and/or video, and more than
25 % accessed up to one document. Moreover, their sessions were very short. In this cluster,
around 60 % of students failed the adaptive test. The cluster 5 of term 2014-2, also has very
low numbers of accesses to each resource type, around 50 % of students passed the test.
This cluster is characterized by old students, and two noticeable behaviors of the eC and vC
variables: around 50 % of the students carried out most of their accesses during class time,
and another important group of students carried out just few of their accesses in class. Thus,
it is possible the student’s age affected the academic performance, because this cluster does
not have a definite behavior of the gr variable, while cluster 4 does.
There are two remarkable differences in the sets of clusters of both terms: i) There is no
a cluster of students with “video” as the favorite resource type in term 2014-2, and ii) All
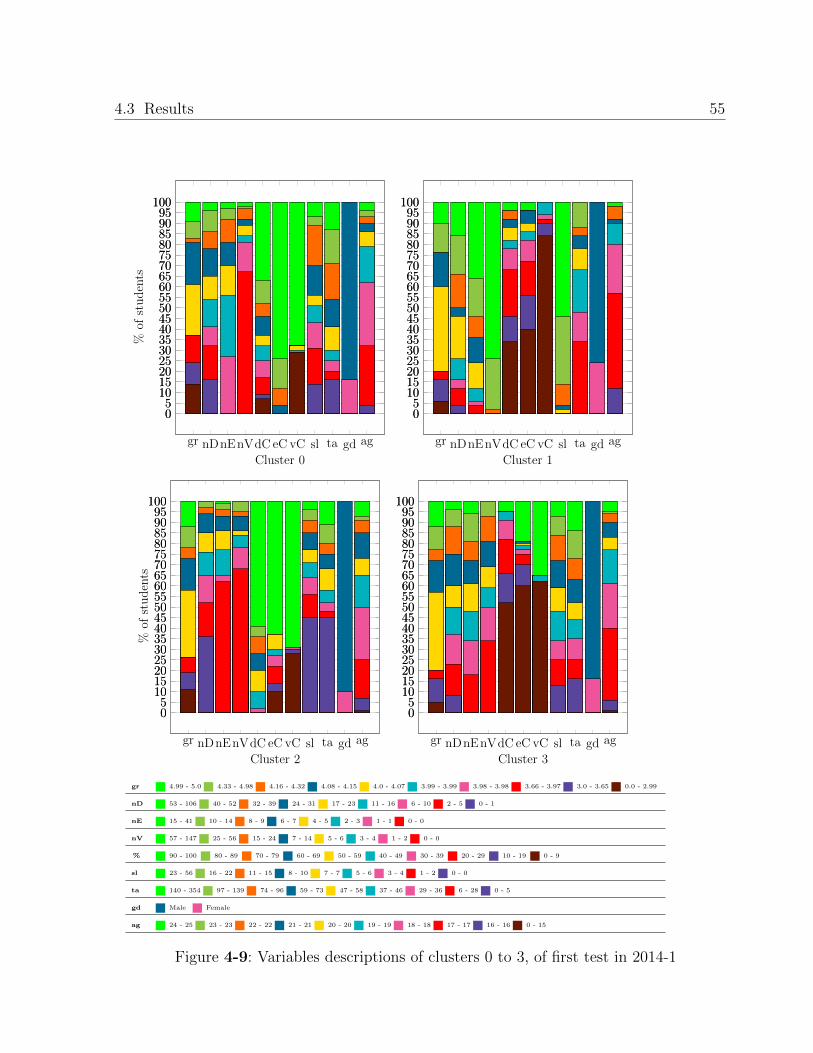
4.3 Results 55
gr nDnEnVdC eC vC sl ta gd ag
05
101520253035404550556065707580859095
100
05
101520253035404550556065707580859095
100
Cluster 0
%of
studen
ts
gr nDnEnVdC eC vC sl ta gd ag
05
101520253035404550556065707580859095
100
05
101520253035404550556065707580859095
100
Cluster 1
gr nDnEnVdC eC vC sl ta gd ag
05
101520253035404550556065707580859095
100
05
101520253035404550556065707580859095
100
Cluster 2
%of
studen
ts
gr nDnEnVdC eC vC sl ta gd ag
05
101520253035404550556065707580859095
100
05
101520253035404550556065707580859095
100
Cluster 3
gr 4.99 - 5.0 4.33 - 4.98 4.16 - 4.32 4.08 - 4.15 4.0 - 4.07 3.99 - 3.99 3.98 - 3.98 3.66 - 3.97 3.0 - 3.65 0.0 - 2.99
nD 53 - 106 40 - 52 32 - 39 24 - 31 17 - 23 11 - 16 6 - 10 2 - 5 0 - 1
nE 15 - 41 10 - 14 8 - 9 6 - 7 4 - 5 2 - 3 1 - 1 0 - 0
nV 57 - 147 25 - 56 15 - 24 7 - 14 5 - 6 3 - 4 1 - 2 0 - 0
% 90 - 100 80 - 89 70 - 79 60 - 69 50 - 59 40 - 49 30 - 39 20 - 29 10 - 19 0 - 9
sl 23 - 56 16 - 22 11 - 15 8 - 10 7 - 7 5 - 6 3 - 4 1 - 2 0 - 0
ta 140 - 354 97 - 139 74 - 96 59 - 73 47 - 58 37 - 46 29 - 36 6 - 28 0 - 5
gd Male Female
ag 24 - 25 23 - 23 22 - 22 21 - 21 20 - 20 19 - 19 18 - 18 17 - 17 16 - 16 0 - 15
Figure 4-9: Variables descriptions of clusters 0 to 3, of first test in 2014-1

56 4 Profiling model and Common sequences identification
gr nDnEnVdC eC vC sl ta gd ag
05
101520253035404550556065707580859095
100
05
101520253035404550556065707580859095
100
Cluster 4
%of
studen
ts
gr nDnEnVdC eC vC sl ta gd ag
05
101520253035404550556065707580859095
100
05
101520253035404550556065707580859095
100
Cluster 5
gr 4.99 - 5.0 4.33 - 4.98 4.16 - 4.32 4.08 - 4.15 4.0 - 4.07 3.99 - 3.99 3.98 - 3.98 3.66 - 3.97 3.0 - 3.65 0.0 - 2.99
nD 53 - 106 40 - 52 32 - 39 24 - 31 17 - 23 11 - 16 6 - 10 2 - 5 0 - 1
nE 15 - 41 10 - 14 8 - 9 6 - 7 4 - 5 2 - 3 1 - 1 0 - 0
nV 57 - 147 25 - 56 15 - 24 7 - 14 5 - 6 3 - 4 1 - 2 0 - 0
% 90 - 100 80 - 89 70 - 79 60 - 69 50 - 59 40 - 49 30 - 39 20 - 29 10 - 19 0 - 9
sl 23 - 56 16 - 22 11 - 15 8 - 10 7 - 7 5 - 6 3 - 4 1 - 2 0 - 0
ta 140 - 354 97 - 139 74 - 96 59 - 73 47 - 58 37 - 46 29 - 36 6 - 28 0 - 5
gd Male Female
ag 24 - 25 23 - 23 22 - 22 21 - 21 20 - 20 19 - 19 18 - 18 17 - 17 16 - 16 0 - 15
Figure 4-10: Variables descriptions of clusters 4 to 5, of first test in 2014-1

4.3 Results 57
gr nDnEnVdC eC vC sl ta gd ag
05
101520253035404550556065707580859095
100
05
101520253035404550556065707580859095
100
Cluster 0
%of
studen
ts
gr nDnEnVdC eC vC sl ta gd ag
05
101520253035404550556065707580859095
100
05
101520253035404550556065707580859095
100
Cluster 1
gr nDnEnVdC eC vC sl ta gd ag
05
101520253035404550556065707580859095
100
05
101520253035404550556065707580859095
100
Cluster 2
%of
studen
ts
gr nDnEnVdC eC vC sl ta gd ag
05
101520253035404550556065707580859095
100
05
101520253035404550556065707580859095
100
Cluster 3
gr 4.99 - 5.0 4.58 - 4.98 3.83 - 4.57 3.33 - 3.82 3.0 - 3.32 2.58 - 2.99 2.5 - 2.57 1.83 - 2.49 0.83 - 1.82 0.0 - 0.82
nD 69 - 120 51 - 68 38 - 50 28 - 37 20 - 27 15 - 19 9 - 14 5 - 8 1 - 4 0 - 0
nE 18 - 35 13 - 17 8 - 12 6 - 7 4 - 5 2 - 3 1 - 1 0 - 0
nV 42 - 144 23 - 41 12 - 22 7 - 11 4 - 6 2 - 3 1 - 1 0 - 0
% 90 - 100 80 - 89 70 - 79 60 - 69 50 - 59 40 - 49 30 - 39 20 - 29 10 - 19 0 - 9
sl 16 - 41 13 - 15 10 - 12 8 - 9 6 - 7 4 - 5 3 - 3 1 - 2 0 - 0
ta 143 - 358 111 - 142 91 - 110 73 - 90 61 - 72 49 - 60 38 - 48 24 - 37 0 - 23
gd Male Female
ag 24 - 25 23 - 23 22 - 22 21 - 21 20 - 20 19 - 19 18 - 18 17 - 17 16 - 16 0 - 15
Figure 4-11: Variables descriptions of clusters 0 to 3, of first test in 2014-2

58 4 Profiling model and Common sequences identification
gr nDnEnVdC eC vC sl ta gd ag
05
101520253035404550556065707580859095
100
05
101520253035404550556065707580859095
100
Cluster 4
%of
studen
ts
gr nDnEnVdC eC vC sl ta gd ag
05
101520253035404550556065707580859095
100
05
101520253035404550556065707580859095
100
Cluster 5
gr 4.99 - 5.0 4.58 - 4.98 3.83 - 4.57 3.33 - 3.82 3.0 - 3.32 2.58 - 2.99 2.5 - 2.57 1.83 - 2.49 0.83 - 1.82 0.0 - 0.82
nD 69 - 120 51 - 68 38 - 50 28 - 37 20 - 27 15 - 19 9 - 14 5 - 8 1 - 4 0 - 0
nE 18 - 35 13 - 17 8 - 12 6 - 7 4 - 5 2 - 3 1 - 1 0 - 0
nV 42 - 144 23 - 41 12 - 22 7 - 11 4 - 6 2 - 3 1 - 1 0 - 0
% 90 - 100 80 - 89 70 - 79 60 - 69 50 - 59 40 - 49 30 - 39 20 - 29 10 - 19 0 - 9
sl 16 - 41 13 - 15 10 - 12 8 - 9 6 - 7 4 - 5 3 - 3 1 - 2 0 - 0
ta 143 - 358 111 - 142 91 - 110 73 - 90 61 - 72 49 - 60 38 - 48 24 - 37 0 - 23
gd Male Female
ag 24 - 25 23 - 23 22 - 22 21 - 21 20 - 20 19 - 19 18 - 18 17 - 17 16 - 16 0 - 15
Figure 4-12: Variables descriptions of clusters 4 to 5, of first test in 2014-2
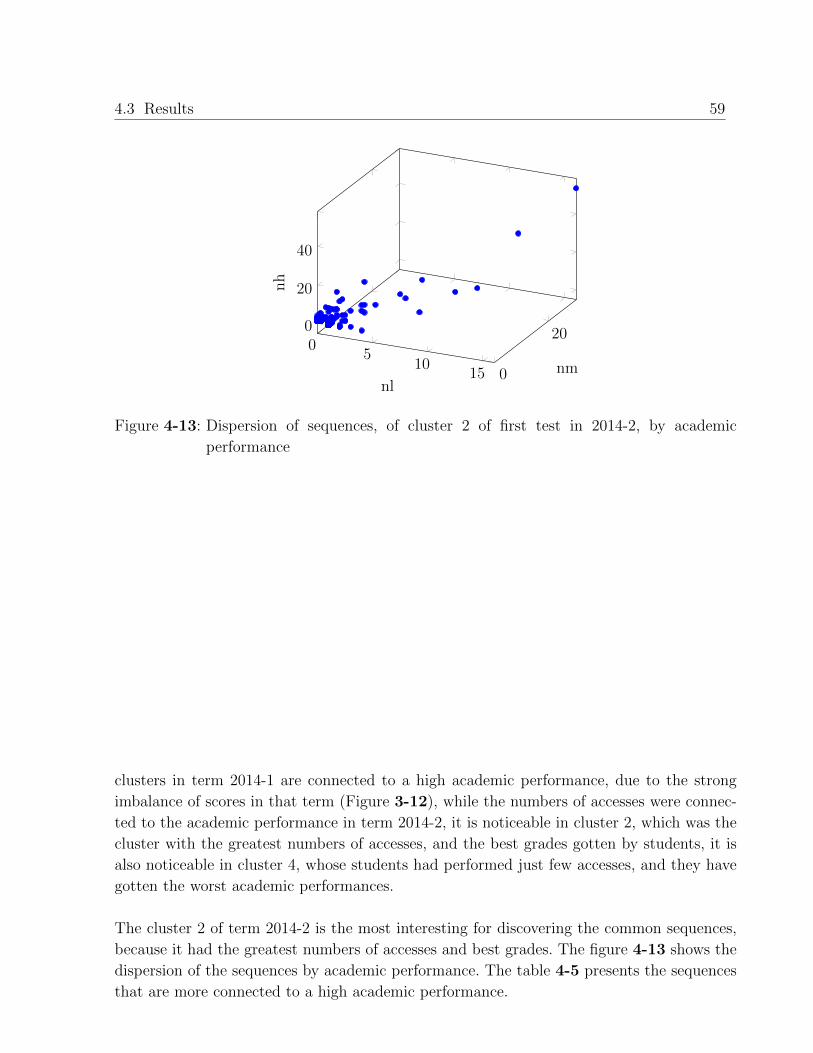
4.3 Results 59
05
1015 0
200
20
40
nlnm
nh
Figure 4-13: Dispersion of sequences, of cluster 2 of first test in 2014-2, by academic
performance
clusters in term 2014-1 are connected to a high academic performance, due to the strong
imbalance of scores in that term (Figure 3-12), while the numbers of accesses were connec-
ted to the academic performance in term 2014-2, it is noticeable in cluster 2, which was the
cluster with the greatest numbers of accesses, and the best grades gotten by students, it is
also noticeable in cluster 4, whose students had performed just few accesses, and they have
gotten the worst academic performances.
The cluster 2 of term 2014-2 is the most interesting for discovering the common sequences,
because it had the greatest numbers of accesses and best grades. The figure 4-13 shows the
dispersion of the sequences by academic performance. The table 4-5 presents the sequences
that are more connected to a high academic performance.

60 4 Profiling model and Common sequences identification
Table 4-5: Common sequences connected to a high academic performance, of cluster 2 of
first test in 2014-2
Sequence nl nm nh
C. “Sets theory” 1 0 9
C. “Introduction”, P. “Programming Languages” 1 0 7
E. “Sets theory” 1 3 14
C. “Mathematical logic” 3 5 19
E. “Sets theory”, E. “Introduction to programming languages” 1 2 6
C. “Introduction to programming languages”, P. “Introduction to pro-
gramming languages II: Operators, arithmetic expressions and evalua-
tion”
0 3 5
P. “Introduction to programming languages II: Operators, arithmetic ex-
pressions and evaluation”, P. “Introduction to programming languages
II: Operators, arithmetic expressions and evaluation”
2 1 5
P. “Programming Languages” 1 4 8
P. “Functions” 1 5 8
P. “Introduction to programming languages I: Identificators, variables,
types”
1 3 5
E. “Mathematical logic”, E. “Mathematical logic”, E. “Mathematical
logic”
1 3 5
The table 4-6 presents the sequences connected to a low academic performance. Despite
around 35 % of students failed the test, it was necessary to redefine the threshold, new
threshold is: an interesting sequence must be performed at least twice.
Table 4-6: Common sequences connected to a low academic performance, of cluster 2 of
first test in 2014-2
Sequence nl nm nh
C. “Relations and Functions”, P. “Relations and Functions II: Functions” 2 0 0
E. “Sets theory’, P. “Sets theory: Concepts and Operations” 4 0 0
P. “Predicate logic’, C. “Mathematical logic”, P. “Predicate logic”, E.
“Mathematical Logic”
2 0 0
P. “Functions of one or more parameters” 3 0 1
C. “Introduction”, E. “Mathematical logic” 2 0 1
Profiles of second test
The figures 4-14 and 4-15 describe the content of clusters, for term 2014-1, and the figures
4-16 and 4-17, for term 2014-2. Regarding the volume of accesses, the numbers of accesses

4.3 Results 61
gr nDnEnVdC eC vC sl ta gd ag
05
101520253035404550556065707580859095
100
05
101520253035404550556065707580859095
100
Cluster 0
%of
studen
ts
gr nDnEnVdC eC vC sl ta gd ag
05
101520253035404550556065707580859095
100
05
101520253035404550556065707580859095
100
Cluster 1
gr nDnEnVdC eC vC sl ta gd ag
05
101520253035404550556065707580859095
100
05
101520253035404550556065707580859095
100
Cluster 2
%of
studen
ts
gr nDnEnVdC eC vC sl ta gd ag
05
101520253035404550556065707580859095
100
05
101520253035404550556065707580859095
100
Cluster 3
gr 4.99 - 5.0 4.98 - 4.98 4.91 - 4.97 4.16 - 4.90 3.83 - 4.15 3.33 - 3.82 3.0 - 3.32 2.25 - 2.99 0.83 - 2.24 0.0 - 0.82
nD 35 - 108 24 - 34 17 - 23 12 - 16 8 - 11 5 - 7 3 - 4 1 - 2 0 - 0
nE 10 - 31 7 - 9 6 - 6 4 - 5 3 - 3 2 - 2 1 - 1 0 - 0
nV 27 - 71 15 - 26 8 - 14 5 - 7 4 - 4 2 - 3 1 - 1 0 - 0
% 90 - 100 80 - 89 70 - 79 60 - 69 50 - 59 40 - 49 30 - 39 20 - 29 10 - 19 0 - 9
sl 14 - 39 9 - 13 6 - 8 5 - 5 4 - 4 2 - 3 1 - 1 0 - 0
ta 166 - 373 122 - 165 96 - 121 81 - 95 68 - 80 51 - 67 37 - 50 0 - 36
gd Male Female
ag 24 - 25 23 - 23 22 - 22 21 - 21 20 - 20 19 - 19 18 - 18 17 - 17 16 - 16 0 - 15
Figure 4-14: Variables descriptions of clusters 0 to 3, of second test in 2014-1
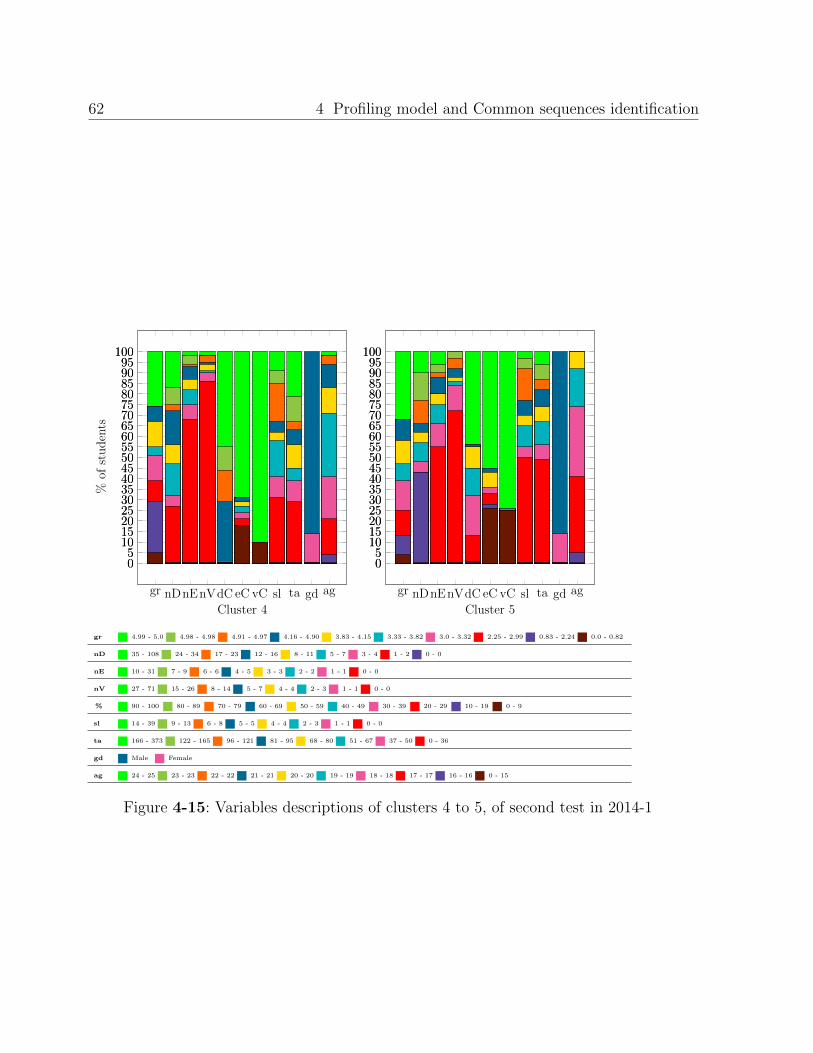
62 4 Profiling model and Common sequences identification
gr nDnEnVdC eC vC sl ta gd ag
05
101520253035404550556065707580859095
100
05
101520253035404550556065707580859095
100
Cluster 4
%of
studen
ts
gr nDnEnVdC eC vC sl ta gd ag
05
101520253035404550556065707580859095
100
05
101520253035404550556065707580859095
100
Cluster 5
gr 4.99 - 5.0 4.98 - 4.98 4.91 - 4.97 4.16 - 4.90 3.83 - 4.15 3.33 - 3.82 3.0 - 3.32 2.25 - 2.99 0.83 - 2.24 0.0 - 0.82
nD 35 - 108 24 - 34 17 - 23 12 - 16 8 - 11 5 - 7 3 - 4 1 - 2 0 - 0
nE 10 - 31 7 - 9 6 - 6 4 - 5 3 - 3 2 - 2 1 - 1 0 - 0
nV 27 - 71 15 - 26 8 - 14 5 - 7 4 - 4 2 - 3 1 - 1 0 - 0
% 90 - 100 80 - 89 70 - 79 60 - 69 50 - 59 40 - 49 30 - 39 20 - 29 10 - 19 0 - 9
sl 14 - 39 9 - 13 6 - 8 5 - 5 4 - 4 2 - 3 1 - 1 0 - 0
ta 166 - 373 122 - 165 96 - 121 81 - 95 68 - 80 51 - 67 37 - 50 0 - 36
gd Male Female
ag 24 - 25 23 - 23 22 - 22 21 - 21 20 - 20 19 - 19 18 - 18 17 - 17 16 - 16 0 - 15
Figure 4-15: Variables descriptions of clusters 4 to 5, of second test in 2014-1
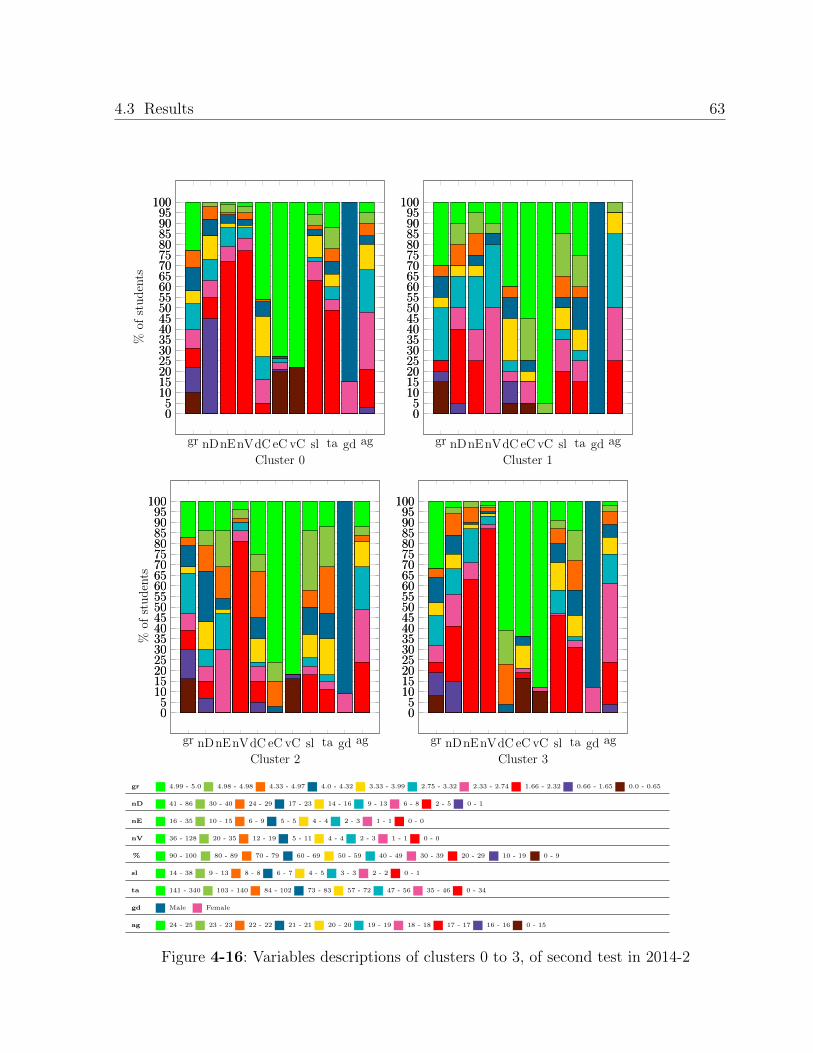
4.3 Results 63
gr nDnEnVdC eC vC sl ta gd ag
05
101520253035404550556065707580859095
100
05
101520253035404550556065707580859095
100
Cluster 0
%of
studen
ts
gr nDnEnVdC eC vC sl ta gd ag
05
101520253035404550556065707580859095
100
05
101520253035404550556065707580859095
100
Cluster 1
gr nDnEnVdC eC vC sl ta gd ag
05
101520253035404550556065707580859095
100
05
101520253035404550556065707580859095
100
Cluster 2
%of
studen
ts
gr nDnEnVdC eC vC sl ta gd ag
05
101520253035404550556065707580859095
100
05
101520253035404550556065707580859095
100
Cluster 3
gr 4.99 - 5.0 4.98 - 4.98 4.33 - 4.97 4.0 - 4.32 3.33 - 3.99 2.75 - 3.32 2.33 - 2.74 1.66 - 2.32 0.66 - 1.65 0.0 - 0.65
nD 41 - 86 30 - 40 24 - 29 17 - 23 14 - 16 9 - 13 6 - 8 2 - 5 0 - 1
nE 16 - 35 10 - 15 6 - 9 5 - 5 4 - 4 2 - 3 1 - 1 0 - 0
nV 36 - 128 20 - 35 12 - 19 5 - 11 4 - 4 2 - 3 1 - 1 0 - 0
% 90 - 100 80 - 89 70 - 79 60 - 69 50 - 59 40 - 49 30 - 39 20 - 29 10 - 19 0 - 9
sl 14 - 38 9 - 13 8 - 8 6 - 7 4 - 5 3 - 3 2 - 2 0 - 1
ta 141 - 340 103 - 140 84 - 102 73 - 83 57 - 72 47 - 56 35 - 46 0 - 34
gd Male Female
ag 24 - 25 23 - 23 22 - 22 21 - 21 20 - 20 19 - 19 18 - 18 17 - 17 16 - 16 0 - 15
Figure 4-16: Variables descriptions of clusters 0 to 3, of second test in 2014-2

64 4 Profiling model and Common sequences identification
gr nDnEnVdC eC vC sl ta gd ag
05
101520253035404550556065707580859095
100
05
101520253035404550556065707580859095
100
Cluster 4
%of
studen
ts
gr nDnEnVdC eC vC sl ta gd ag
05
101520253035404550556065707580859095
100
05
101520253035404550556065707580859095
100
Cluster 5
gr 4.99 - 5.0 4.98 - 4.98 4.33 - 4.97 4.0 - 4.32 3.33 - 3.99 2.75 - 3.32 2.33 - 2.74 1.66 - 2.32 0.66 - 1.65 0.0 - 0.65
nD 41 - 86 30 - 40 24 - 29 17 - 23 14 - 16 9 - 13 6 - 8 2 - 5 0 - 1
nE 16 - 35 10 - 15 6 - 9 5 - 5 4 - 4 2 - 3 1 - 1 0 - 0
nV 36 - 128 20 - 35 12 - 19 5 - 11 4 - 4 2 - 3 1 - 1 0 - 0
% 90 - 100 80 - 89 70 - 79 60 - 69 50 - 59 40 - 49 30 - 39 20 - 29 10 - 19 0 - 9
sl 14 - 38 9 - 13 8 - 8 6 - 7 4 - 5 3 - 3 2 - 2 0 - 1
ta 141 - 340 103 - 140 84 - 102 73 - 83 57 - 72 47 - 56 35 - 46 0 - 34
gd Male Female
ag 24 - 25 23 - 23 22 - 22 21 - 21 20 - 20 19 - 19 18 - 18 17 - 17 16 - 16 0 - 15
Figure 4-17: Variables descriptions of clusters 4 to 5, of second test in 2014-2
4.3 Results 65
to documents were varied in most clusters of term 2014-1, the clusters 0 and 4 do not have
a remarkable group of students who have accessed many documents, but their numbers of
accesses to documents were slightly superior than other clusters. The Cluster 0 describes a
student who has seldom accessed exercises files, mostly in class, and rarely watched videos.
The cluster 4 describes a student who almost never accessed exercises files, or watched a
video, and the few students who did it, they have decided to do it in class, however, cluster
0 has an important minority (approximately 20 %) of students who have performed most
of their accesses to videos, out of class. The only cluster characterized by high numbers of
accesses to resources, is the cluster 1, it describes a student with a favorite resource type:
video, 60 % of students have accessed at least 23, this contrasts with the number of acces-
ses to exercises, approximately 60 % of students have never accessed one exercises file. The
numbers of accesses to documents were varied. Most accesses to documents and videos were
performed out of class, this contrasts with the exercises, there are two noticeable behaviors:
approximately 60 % of students have performed most of their accesses in class, and approxi-
mately 35 % of students have performed most of their accesses, out of class.
On the other hand, the only cluster of term 2014-2 with high numbers of accesses, is the
cluster 5, it describes a student who had a favorite resource type: document. Around 85 %
of students accessed more than 28, this contrasts with the number of accesses to exercises
and videos, just few in both cases. Its academic performance was slightly good, around 55 %
of students passed the test, around 30 % with good grades.
Regarding the academic performance, in term 2014-1, although the clusters describe se-
veral user profiles with different web behaviors, and the grades are better balanced than the
first test (Figures 3-12 and 3.5.1), most clusters are characterized by high passing grades, at
least 60 % of students have passed in all clusters, of which, an important group of students,
have gotten very high grades, due to this behavior, it is not possible to connect these profiles
to an academic performance. In term 2014-2, the best academic performances were gotten
by students of cluster 1, around 70 % of students passed, 45 % obtaining high grades, despite
all the resource types were accessed a moderated number of times. Most of these accesses,
were carried out during class time.
As with the first test, there is a noticeable difference between the set of clusters of term
2014-1, and that of term 2014-2, the favorite resource type of the cluster with the greatest
numbers of accesses, was “video” for term 2014-1, and “document” for term 2014-2. It is
also noticeable, while for term 2014-1, it was not possible to connect an web behavior to
an academic performance, in term 2014-2, the cluster with the best academic performances,
describes a student with a moderated number of accesses, followed by cluster 3, which des-
cribes a student who seldom consults the course material, while the academic performance
of the cluster of term 2014-1, with the greatest numbers of accesses (cluster 5), was slightly

66 4 Profiling model and Common sequences identification
020
4060 0
20
400
50
nlnm
nh
02
46 0
2
4
60
2
4
nlnm
nh
Figure 4-18: Dispersion of sequences, of clusters 5 (left) and 1 (right), of second test in
2014-2, by academic performance
good.
In term 2014-2, the greatest numbers of accesses, were concentrated in cluster 5, but the
best grades were gotten by students of cluster 1. The figure 4.3.1 shows the dispersion of
sequences by academic performance. There were few sequences in cluster 1, they were ge-
nerally long, and they were performed just a few times, this behavior could be due to the
small number of students assigned to the cluster (Table 4-4), and the moderated number
of accesses, carried out by the students. The threshold was redefined to: a sequence must
be performed at least twice for being considered as of interest. The only sequence found, is
shown in table 4-7.
Table 4-7: Common sequences connected to a high academic performance, of cluster 1 of
second test in 2014-2
Sequence nl nm nh
E. “Input and Output flows” 3 0 4
The sequences connected to a low academic performance, with the same threshold, are shown
in table 4-8.
Table 4-8: Common sequences connected to a low academic performance, of cluster 1 of
second test in 2014-2
Sequence nl nm nh
P. “Conditional structures and data validation” 6 0 2
P. “Input and Output flows” 2 1 1

4.3 Results 67
The students of cluster 5, have carried out a lot of accesses to documents, and around 55 %
of students, passed the test. The threshold was not redefined. The top ten of sequences
connected to a high performance are shown in table 4-9. The sequences connected to a low
performance, are shown in table 4-10.
Table 4-9: Common sequences connected to a high academic performance, of cluster 5 of
second test in 2014-2
Sequence nl nm nh
C. “Recursive functions”, E. “Recursive functions” 2 0 6
C. “Programming functions and conditional structure” 3 4 14
C. “Input and Output flows”, C. “Recursive functions” 2 1 5
C. “Input and Output flows” 13 9 26
C. “Relations and Functions” 4 1 5
C. “Recursive functions”, C. “Input and Output flows” 4 1 5
P. “Input and Output flows” 24 23 37
P. “Relations and Functions II: Functions” 4 14 14
P. “Conditional structures and data validation” 20 28 35
C. “Recursive functions” 67 41 68
Table 4-10: Common sequences connected to a low academic performance, of cluster 5 of
second test in 2014-2
Sequence nl nm nh
P. “Functions of one or more parameters”, P. “Functions of one or more
parameters”
6 1 0
P. “Relations and Functions II: Functions”, P. “Functions of one or more
parameters”
8 1 4
P. “Input and Output flows”, P. “Input and Output flows” 5 2 2
C. “Recursive functions’, C. “Recursive functions” 14 5 7
P. “Conditional structures and data validation”, P. “Conditional struc-
tures and data validation”
7 2 4
E. “Recursive functions” 13 4 8
Profiles of third test
The figures 4-19 and 4-20 describe the content of clusters for term 2014-1, the figures 4-21
and 4-22, for term 2014-2. Regarding the volume of accesses, in term 2014-1, the cluster
with the greatest numbers of accesses, is the number 4, the favorite resource type was docu-
ment, approximately 55 % of students have accessed at least 17. Exercises files were seldom
accessed, approximately 75 % of students, have accessed at most 3. The numbers of accesses

68 4 Profiling model and Common sequences identification
gr nDnEnVdC eC vC sl ta gd ag
05
101520253035404550556065707580859095
100
05
101520253035404550556065707580859095
100
Cluster 0
%of
studen
ts
gr nDnEnVdC eC vC sl ta gd ag
05
101520253035404550556065707580859095
100
05
101520253035404550556065707580859095
100
Cluster 1
gr nDnEnVdC eC vC sl ta gd ag
05
101520253035404550556065707580859095
100
05
101520253035404550556065707580859095
100
Cluster 2
%of
studen
ts
gr nDnEnVdC eC vC sl ta gd ag
05
101520253035404550556065707580859095
100
05
101520253035404550556065707580859095
100
Cluster 3
gr 4.99 - 5.0 4.98 - 4.98 4.75 - 4.97 3.91 - 4.74 3.33 - 3.90 2.5 - 3.32 1.75 - 2.49 1.0 - 1.74 0.16 - 0.99 0.0 - 0.15
nD 25 - 68 17 - 24 12 - 16 8 - 11 6 - 7 4 - 5 2 - 3 0 - 1
nE 10 - 29 7 - 9 6 - 6 4 - 5 3 - 3 2 - 2 1 - 1 0 - 0
nV 9 - 11 6 - 8 5 - 5 4 - 4 3 - 3 2 - 2 1 - 1 0 - 0
% 90 - 100 80 - 89 70 - 79 60 - 69 50 - 59 40 - 49 30 - 39 20 - 29 10 - 19 0 - 9
sl 12 - 32 8 - 11 6 - 7 5 - 5 4 - 4 3 - 3 1 - 2 0 - 0
ta 151 - 330 109 - 150 92 - 108 79 - 91 64 - 78 52 - 63 29 - 51 0 - 28
gd Male Female
ag 24 - 25 23 - 23 22 - 22 21 - 21 20 - 20 19 - 19 18 - 18 17 - 17 16 - 16 0 - 15
Figure 4-19: Variables descriptions of clusters 0 to 3, of third test in 2014-1

4.3 Results 69
gr nDnEnVdC eC vC sl ta gd ag
05
101520253035404550556065707580859095
100
05
101520253035404550556065707580859095
100
Cluster 4
%of
studen
ts
gr nDnEnVdC eC vC sl ta gd ag
05
101520253035404550556065707580859095
100
05
101520253035404550556065707580859095
100
Cluster 5
gr 4.99 - 5.0 4.98 - 4.98 4.75 - 4.97 3.91 - 4.74 3.33 - 3.90 2.5 - 3.32 1.75 - 2.49 1.0 - 1.74 0.16 - 0.99 0.0 - 0.15
nD 25 - 68 17 - 24 12 - 16 8 - 11 6 - 7 4 - 5 2 - 3 0 - 1
nE 10 - 29 7 - 9 6 - 6 4 - 5 3 - 3 2 - 2 1 - 1 0 - 0
nV 9 - 11 6 - 8 5 - 5 4 - 4 3 - 3 2 - 2 1 - 1 0 - 0
% 90 - 100 80 - 89 70 - 79 60 - 69 50 - 59 40 - 49 30 - 39 20 - 29 10 - 19 0 - 9
sl 12 - 32 8 - 11 6 - 7 5 - 5 4 - 4 3 - 3 1 - 2 0 - 0
ta 151 - 330 109 - 150 92 - 108 79 - 91 64 - 78 52 - 63 29 - 51 0 - 28
gd Male Female
ag 24 - 25 23 - 23 22 - 22 21 - 21 20 - 20 19 - 19 18 - 18 17 - 17 16 - 16 0 - 15
Figure 4-20: Variables descriptions of clusters 4 to 5, of third test in 2014-1
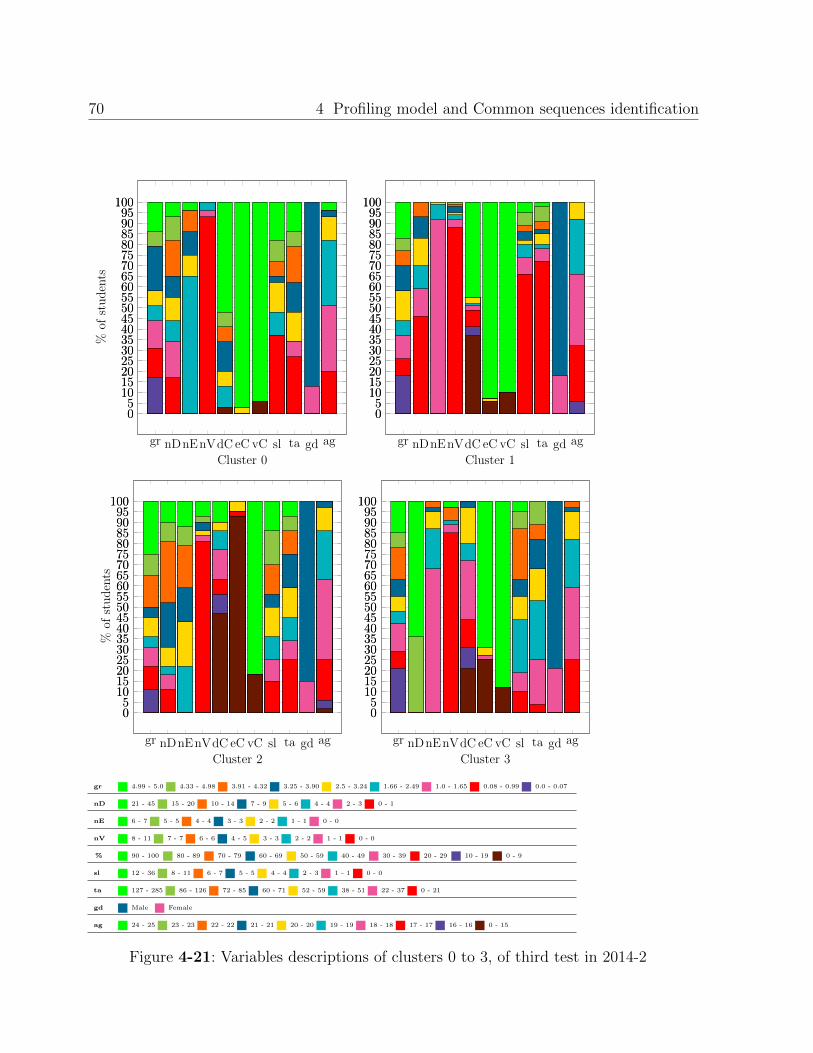
70 4 Profiling model and Common sequences identification
gr nDnEnVdC eC vC sl ta gd ag
05
101520253035404550556065707580859095
100
05
101520253035404550556065707580859095
100
Cluster 0
%of
studen
ts
gr nDnEnVdC eC vC sl ta gd ag
05
101520253035404550556065707580859095
100
05
101520253035404550556065707580859095
100
Cluster 1
gr nDnEnVdC eC vC sl ta gd ag
05
101520253035404550556065707580859095
100
05
101520253035404550556065707580859095
100
Cluster 2
%of
studen
ts
gr nDnEnVdC eC vC sl ta gd ag
05
101520253035404550556065707580859095
100
05
101520253035404550556065707580859095
100
Cluster 3
gr 4.99 - 5.0 4.33 - 4.98 3.91 - 4.32 3.25 - 3.90 2.5 - 3.24 1.66 - 2.49 1.0 - 1.65 0.08 - 0.99 0.0 - 0.07
nD 21 - 45 15 - 20 10 - 14 7 - 9 5 - 6 4 - 4 2 - 3 0 - 1
nE 6 - 7 5 - 5 4 - 4 3 - 3 2 - 2 1 - 1 0 - 0
nV 8 - 11 7 - 7 6 - 6 4 - 5 3 - 3 2 - 2 1 - 1 0 - 0
% 90 - 100 80 - 89 70 - 79 60 - 69 50 - 59 40 - 49 30 - 39 20 - 29 10 - 19 0 - 9
sl 12 - 36 8 - 11 6 - 7 5 - 5 4 - 4 2 - 3 1 - 1 0 - 0
ta 127 - 285 86 - 126 72 - 85 60 - 71 52 - 59 38 - 51 22 - 37 0 - 21
gd Male Female
ag 24 - 25 23 - 23 22 - 22 21 - 21 20 - 20 19 - 19 18 - 18 17 - 17 16 - 16 0 - 15
Figure 4-21: Variables descriptions of clusters 0 to 3, of third test in 2014-2

4.3 Results 71
gr nDnEnVdC eC vC sl ta gd ag
05
101520253035404550556065707580859095
100
05
101520253035404550556065707580859095
100
Cluster 4
%of
studen
ts
gr nDnEnVdC eC vC sl ta gd ag
05
101520253035404550556065707580859095
100
05
101520253035404550556065707580859095
100
Cluster 5
gr 4.99 - 5.0 4.33 - 4.98 3.91 - 4.32 3.25 - 3.90 2.5 - 3.24 1.66 - 2.49 1.0 - 1.65 0.08 - 0.99 0.0 - 0.07
nD 21 - 45 15 - 20 10 - 14 7 - 9 5 - 6 4 - 4 2 - 3 0 - 1
nE 6 - 7 5 - 5 4 - 4 3 - 3 2 - 2 1 - 1 0 - 0
nV 8 - 11 7 - 7 6 - 6 4 - 5 3 - 3 2 - 2 1 - 1 0 - 0
% 90 - 100 80 - 89 70 - 79 60 - 69 50 - 59 40 - 49 30 - 39 20 - 29 10 - 19 0 - 9
sl 12 - 36 8 - 11 6 - 7 5 - 5 4 - 4 2 - 3 1 - 1 0 - 0
ta 127 - 285 86 - 126 72 - 85 60 - 71 52 - 59 38 - 51 22 - 37 0 - 21
gd Male Female
ag 24 - 25 23 - 23 22 - 22 21 - 21 20 - 20 19 - 19 18 - 18 17 - 17 16 - 16 0 - 15
Figure 4-22: Variables descriptions of clusters 4 to 5, of third test in 2014-2

72 4 Profiling model and Common sequences identification
to videos, were varied. Most accesses were performed out of class, however, there is an im-
portant minority of students (approximately 40 %) who have performed at least 90 % of their
accesses to exercises, in class. Despite the high volume of accesses, this was the cluster with
the worst academic performance, approximately 55 % of students have failed the test. In term
2014-2, the cluster with the greatest number of accesses, is the number 3, all students have
carried out at least 15 accesses to documents, but they have consulted just a few exercises,
and most of they have not accessed videos, most of these scarce accesses were carried out
in class, while most students have carried out at most, 50 % of their accesses to documents,
in class, namely, the students of this cluster, tended to access exercises and videos in class,
maybe following the professor’s indications, but they liked to access documents, when they
were out of class. Despite the high number of accesses to documents, around 50 % of stu-
dents, passed the test.
Regarding the academic performance, in term 2014-1, unlike last two tests, the set of clus-
ters found for the third test, allows identify a connection between the web behavior and the
academic performance. The clusters 0 and 1, have the best academic performances, approxi-
mately 60 % of students of cluster 0, and 65 % of cluster 1, have passed the test, a significant
group of students (approximately 45 %, of cluster 0 and 1) has gotten high grades. These
clusters describe a student who has seldom accessed the course material, most students have
never accessed an exercises file, or watched a video. The numbers of accesses to documents
were varied, however the cluster 0 has an important minority (30 % of students) who has
accessed at most one. The main differences between these clusters, are the students’ age
(Students of cluster 0 are commonly older), and the percentage of accesses to documents
performed in class, most students of cluster 1 have performed most of their accesses out of
class, while these percentages are varied for cluster 0. In term 2014-2, the cluster with the
best academic performance, is the number 2, around 60 % of students passed, 50 % obtaining
high grades. This cluster is characterized by a moderate number of accesses to documents
and exercises, and no accesses to videos, the few students who have accessed videos, they
did it during class time. Most students have carried out most of their accesses to exercises
out of class. The clusters with the worst academic performance, are: 4 and 5, the accesses to
videos were very scarce (more than 90 % of students have never watched a video), at least
85 % of students have accessed up to 3 exercises, and the numbers of accesses to documents,
were varied, however, around 45 % of students of cluster 4, accessed up to 1 document. Most
accesses were carried out in class (however, the cluster 4, has an important minority, around
25 % of students who have carried out, most of their accesses to documents, out of class).
The sessions were short but frequent. Around 65 % of students failed the test.
A noticeable difference between the set of clusters of term 2014-1 and that of term 2014-2, is
the existence of a cluster where most of the students have accessed to a resource type many
times in term 2014-2, the cluster 3 has “document” as its favorite resource type, all students
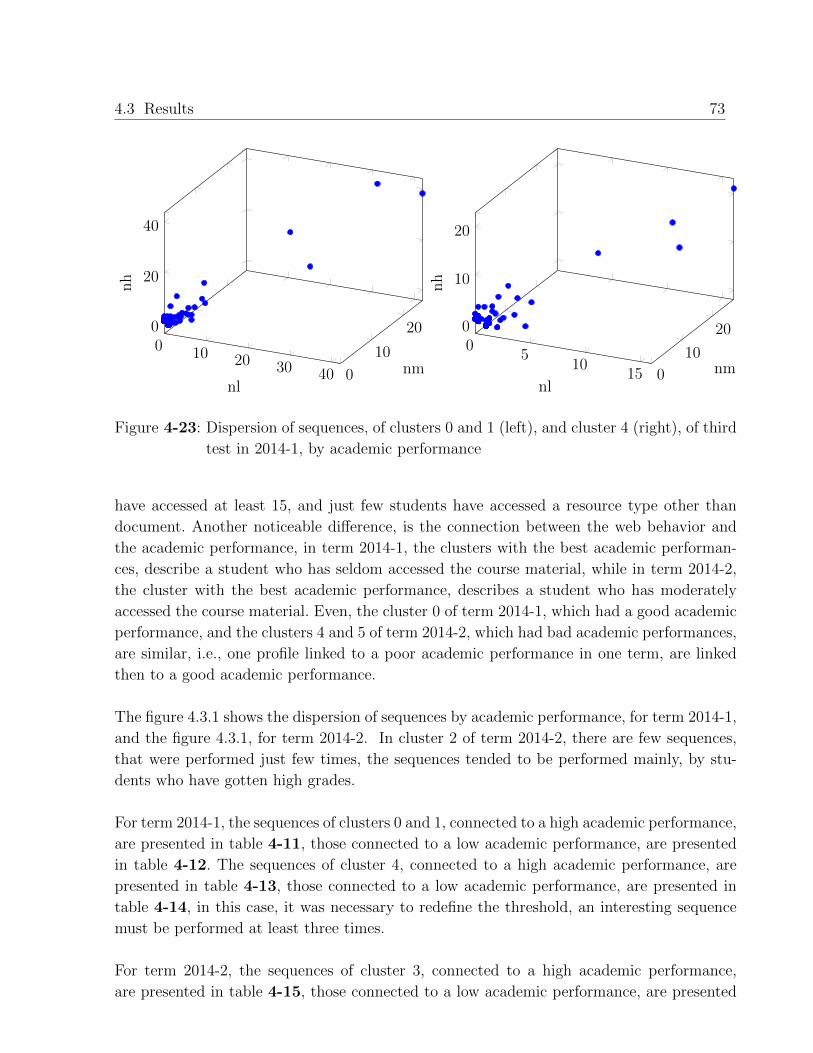
4.3 Results 73
0 10 20 30 40 0
10
200
20
40
nlnm
nh
05
1015 0
10
200
10
20
nlnm
nh
Figure 4-23: Dispersion of sequences, of clusters 0 and 1 (left), and cluster 4 (right), of third
test in 2014-1, by academic performance
have accessed at least 15, and just few students have accessed a resource type other than
document. Another noticeable difference, is the connection between the web behavior and
the academic performance, in term 2014-1, the clusters with the best academic performan-
ces, describe a student who has seldom accessed the course material, while in term 2014-2,
the cluster with the best academic performance, describes a student who has moderately
accessed the course material. Even, the cluster 0 of term 2014-1, which had a good academic
performance, and the clusters 4 and 5 of term 2014-2, which had bad academic performances,
are similar, i.e., one profile linked to a poor academic performance in one term, are linked
then to a good academic performance.
The figure 4.3.1 shows the dispersion of sequences by academic performance, for term 2014-1,
and the figure 4.3.1, for term 2014-2. In cluster 2 of term 2014-2, there are few sequences,
that were performed just few times, the sequences tended to be performed mainly, by stu-
dents who have gotten high grades.
For term 2014-1, the sequences of clusters 0 and 1, connected to a high academic performance,
are presented in table 4-11, those connected to a low academic performance, are presented
in table 4-12. The sequences of cluster 4, connected to a high academic performance, are
presented in table 4-13, those connected to a low academic performance, are presented in
table 4-14, in this case, it was necessary to redefine the threshold, an interesting sequence
must be performed at least three times.
For term 2014-2, the sequences of cluster 3, connected to a high academic performance,
are presented in table 4-15, those connected to a low academic performance, are presented

74 4 Profiling model and Common sequences identification
010
20 0
10
200
20
40
nlnm
nh
02
46 0
50
20
nl
nm
nh
Figure 4-24: Dispersion of sequences, of clusters 3 (left) and 2 (right), of third test in 2014-2,
by academic performance
in table 4-16. The sequences of cluster 2, connected to a high academic performance, are
presented in table 4-17, those connected to a low academic performance, are presented in
table 4-18.
Table 4-11: Common sequences connected to a high academic performance, of clusters 0
and 1 of third test in 2014-1
Sequence nl nm nh
C. “Dimensional vectors or arrays”, C. “Strings” 0 2 5
C. “Arrays or two-dimensional arrays”, C. “Arrays or two-dimensional
arrays”
0 4 7
C. “Arrays or two-dimensional arrays” 32 25 40
C. “Programming cyclic structures” 15 20 21
Table 4-12: Common sequences connected to a low academic performance, of clusters 0
and 1 of third test in 2014-1
Sequence nl nm nh
C. “Dimensional vectors or arrays”, C. “Strings”, C. “Arrays or two-
dimensional arrays”
5 2 1
P. “Input and Output flows” 5 2 3
C. “Dimensional vectors or arrays”, C. “Dimensional vectors or arrays” 5 1 4
C. “Strings” 25 13 17
C. “Dimensional vectors or arrays” 42 26 38
C. “Input and Output flows” 6 5 5

4.3 Results 75
Table 4-13: Common sequences connected to a high academic performance, of cluster 4
of third test in 2014-1
Sequence nl nm nh
C. “Dimensional vectors or arrays”, C. “Dimensional vectors or arrays” 3 0 9
C. “Arrays or two-dimensional arrays”, C. “Arrays or two-dimensional
arrays”
3 3 5
Table 4-14: Common sequences connected to a low academic performance, of cluster 4 of
third test in 2014-1
Sequence nl nm nh
C. “Dimensional vectors or arrays”, C. “Strings”, C. “Arrays or two-
dimensional arrays”
4 2 0
C. “Recursive functions” 3 2 2
Table 4-15: Common sequences connected to a high academic performance, of cluster 3 of
third test in 2014-2
Sequence nl nm nh
C. “Dimensional vectors or arrays”, C. “Dimensional vectors or arrays” 1 1 7
C. “Input and Output flows” 3 0 6
C. “Strings”, C. “Arrays or two-dimensional arrays” 0 4 6
C. “Dimensional vectors or arrays”, C. “Strings”, C. “Arrays or two-
dimensional arrays”
1 3 6
C. “Programming cyclic structures” 23 27 42
C. “Dimensional vectors or arrays” 25 28 37
C. “Arrays or two-dimensional arrays” 12 11 14
Table 4-16: Common sequences connected to a low academic performance, of cluster 3 of
third test in 2014-2
Sequence nl nm nh
C. “Programming cyclic structures”, C. “Programming cyclic structures” 8 5 3
C. “Strings” 16 15 14

76 4 Profiling model and Common sequences identification
Table 4-17: Common sequences connected to a high academic performance, of cluster 2
of third test in 2014-2
Sequence nl nm nh
E. “Programming cyclic structures” 0 0 5
P. “Input and Output flows” 0 0 5
C. “Input and Output flows” 1 1 7
C. “Programming cyclic structures” 3 7 25
C. “Dimensional vectors or arrays” 4 9 21
C. “Arrays or two-dimensional arrays” 4 4 12
C. “Strings” 6 1 8
Table 4-18: Common sequences connected to a low academic performance, of cluster 2 of
third test in 2014-2
Sequence nl nm nh
E. “Strings” 2 0 0
4.3.2. Profiles found with data of both terms
In order to connect a web behavior with an academic performance, it is necessary to discard
those cases when the grades are concentrated on few scores, in this case, only the data of
first test in term 2014-1 were discarded. As this research has used data coming from only
two terms, the clustering process for the first test, is the same as the previously applied to
data of first test in term 2014-2, resulting in clusters described in figures 4-11 and 4-12.
As for the other tests, the table 4-19 presents the size of each cluster.
Table 4-19: Size of clusters
Cluster 2nd Test 3rd Test
0 246 89
1 33 64
2 204 137
3 257 277
4 123 74
5 112 187
The figures 4-25 to 4-28, describe each cluster content, all variables are normalized to [0.0
1.0].
These clusters are used by the recommendation system, to identify which students are likely
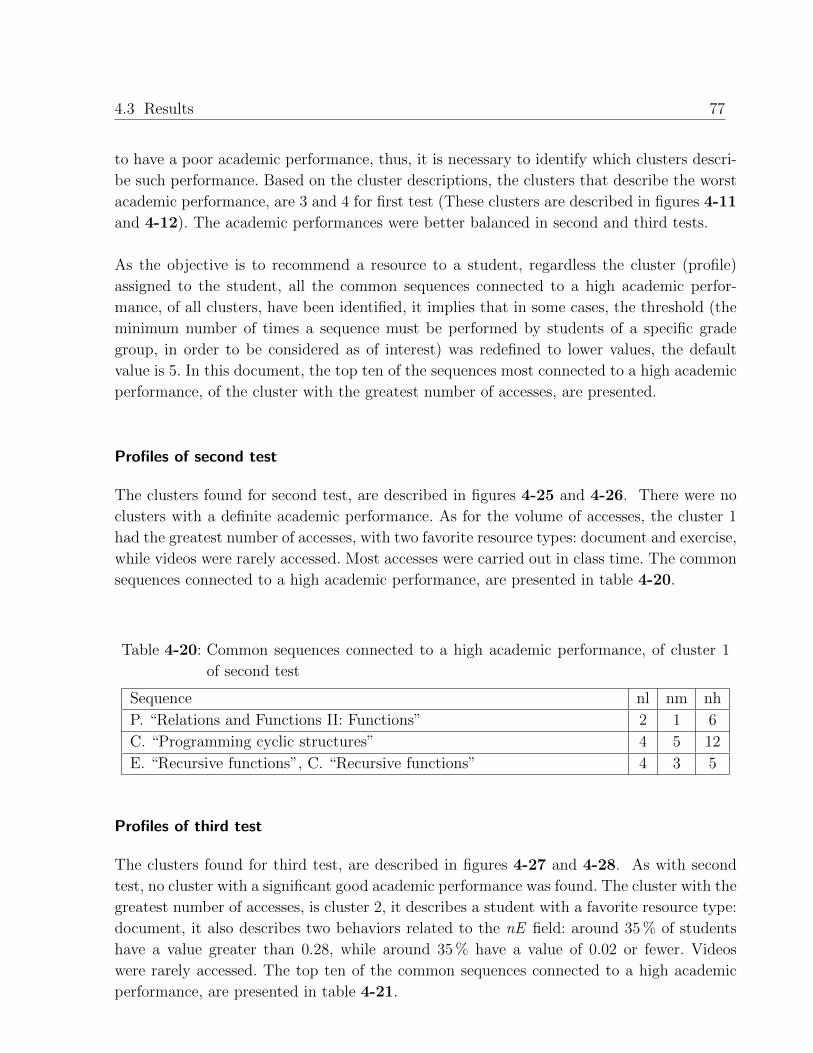
4.3 Results 77
to have a poor academic performance, thus, it is necessary to identify which clusters descri-
be such performance. Based on the cluster descriptions, the clusters that describe the worst
academic performance, are 3 and 4 for first test (These clusters are described in figures 4-11
and 4-12). The academic performances were better balanced in second and third tests.
As the objective is to recommend a resource to a student, regardless the cluster (profile)
assigned to the student, all the common sequences connected to a high academic perfor-
mance, of all clusters, have been identified, it implies that in some cases, the threshold (the
minimum number of times a sequence must be performed by students of a specific grade
group, in order to be considered as of interest) was redefined to lower values, the default
value is 5. In this document, the top ten of the sequences most connected to a high academic
performance, of the cluster with the greatest number of accesses, are presented.
Profiles of second test
The clusters found for second test, are described in figures 4-25 and 4-26. There were no
clusters with a definite academic performance. As for the volume of accesses, the cluster 1
had the greatest number of accesses, with two favorite resource types: document and exercise,
while videos were rarely accessed. Most accesses were carried out in class time. The common
sequences connected to a high academic performance, are presented in table 4-20.
Table 4-20: Common sequences connected to a high academic performance, of cluster 1
of second test
Sequence nl nm nh
P. “Relations and Functions II: Functions” 2 1 6
C. “Programming cyclic structures” 4 5 12
E. “Recursive functions”, C. “Recursive functions” 4 3 5
Profiles of third test
The clusters found for third test, are described in figures 4-27 and 4-28. As with second
test, no cluster with a significant good academic performance was found. The cluster with the
greatest number of accesses, is cluster 2, it describes a student with a favorite resource type:
document, it also describes two behaviors related to the nE field: around 35 % of students
have a value greater than 0.28, while around 35 % have a value of 0.02 or fewer. Videos
were rarely accessed. The top ten of the common sequences connected to a high academic
performance, are presented in table 4-21.
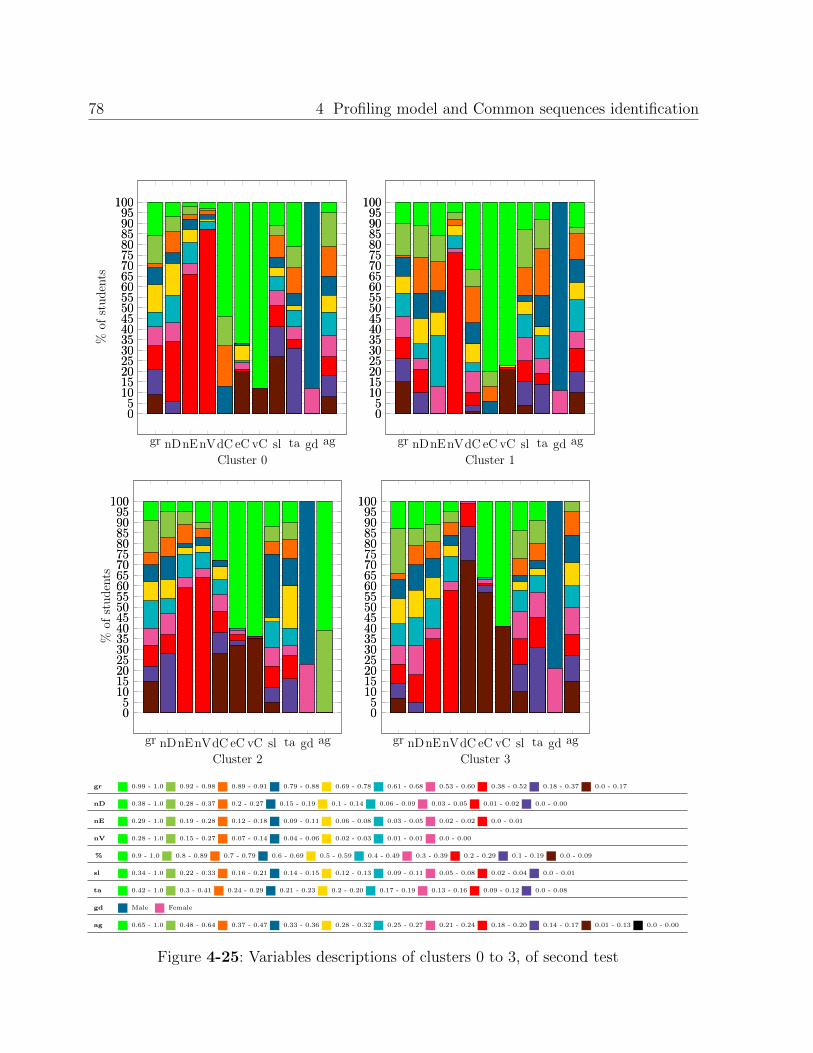
78 4 Profiling model and Common sequences identification
gr nDnEnVdC eC vC sl ta gd ag
05
101520253035404550556065707580859095
100
05
101520253035404550556065707580859095
100
Cluster 0
%of
studen
ts
gr nDnEnVdC eC vC sl ta gd ag
05
101520253035404550556065707580859095
100
05
101520253035404550556065707580859095
100
Cluster 1
gr nDnEnVdC eC vC sl ta gd ag
05
101520253035404550556065707580859095
100
05
101520253035404550556065707580859095
100
Cluster 2
%of
studen
ts
gr nDnEnVdC eC vC sl ta gd ag
05
101520253035404550556065707580859095
100
05
101520253035404550556065707580859095
100
Cluster 3
gr 0.99 - 1.0 0.92 - 0.98 0.89 - 0.91 0.79 - 0.88 0.69 - 0.78 0.61 - 0.68 0.53 - 0.60 0.38 - 0.52 0.18 - 0.37 0.0 - 0.17
nD 0.38 - 1.0 0.28 - 0.37 0.2 - 0.27 0.15 - 0.19 0.1 - 0.14 0.06 - 0.09 0.03 - 0.05 0.01 - 0.02 0.0 - 0.00
nE 0.29 - 1.0 0.19 - 0.28 0.12 - 0.18 0.09 - 0.11 0.06 - 0.08 0.03 - 0.05 0.02 - 0.02 0.0 - 0.01
nV 0.28 - 1.0 0.15 - 0.27 0.07 - 0.14 0.04 - 0.06 0.02 - 0.03 0.01 - 0.01 0.0 - 0.00
% 0.9 - 1.0 0.8 - 0.89 0.7 - 0.79 0.6 - 0.69 0.5 - 0.59 0.4 - 0.49 0.3 - 0.39 0.2 - 0.29 0.1 - 0.19 0.0 - 0.09
sl 0.34 - 1.0 0.22 - 0.33 0.16 - 0.21 0.14 - 0.15 0.12 - 0.13 0.09 - 0.11 0.05 - 0.08 0.02 - 0.04 0.0 - 0.01
ta 0.42 - 1.0 0.3 - 0.41 0.24 - 0.29 0.21 - 0.23 0.2 - 0.20 0.17 - 0.19 0.13 - 0.16 0.09 - 0.12 0.0 - 0.08
gd Male Female
ag 0.65 - 1.0 0.48 - 0.64 0.37 - 0.47 0.33 - 0.36 0.28 - 0.32 0.25 - 0.27 0.21 - 0.24 0.18 - 0.20 0.14 - 0.17 0.01 - 0.13 0.0 - 0.00
Figure 4-25: Variables descriptions of clusters 0 to 3, of second test

4.3 Results 79
gr nDnEnVdC eC vC sl ta gd ag
05
101520253035404550556065707580859095
100
05
101520253035404550556065707580859095
100
Cluster 4
%of
studen
ts
gr nDnEnVdC eC vC sl ta gd ag
05
101520253035404550556065707580859095
100
05
101520253035404550556065707580859095
100
Cluster 5
gr 0.99 - 1.0 0.92 - 0.98 0.89 - 0.91 0.79 - 0.88 0.69 - 0.78 0.61 - 0.68 0.53 - 0.60 0.38 - 0.52 0.18 - 0.37 0.0 - 0.17
nD 0.38 - 1.0 0.28 - 0.37 0.2 - 0.27 0.15 - 0.19 0.1 - 0.14 0.06 - 0.09 0.03 - 0.05 0.01 - 0.02 0.0 - 0.00
nE 0.29 - 1.0 0.19 - 0.28 0.12 - 0.18 0.09 - 0.11 0.06 - 0.08 0.03 - 0.05 0.02 - 0.02 0.0 - 0.01
nV 0.28 - 1.0 0.15 - 0.27 0.07 - 0.14 0.04 - 0.06 0.02 - 0.03 0.01 - 0.01 0.0 - 0.00
% 0.9 - 1.0 0.8 - 0.89 0.7 - 0.79 0.6 - 0.69 0.5 - 0.59 0.4 - 0.49 0.3 - 0.39 0.2 - 0.29 0.1 - 0.19 0.0 - 0.09
sl 0.34 - 1.0 0.22 - 0.33 0.16 - 0.21 0.14 - 0.15 0.12 - 0.13 0.09 - 0.11 0.05 - 0.08 0.02 - 0.04 0.0 - 0.01
ta 0.42 - 1.0 0.3 - 0.41 0.24 - 0.29 0.21 - 0.23 0.2 - 0.20 0.17 - 0.19 0.13 - 0.16 0.09 - 0.12 0.0 - 0.08
gd Male Female
ag 0.65 - 1.0 0.48 - 0.64 0.37 - 0.47 0.33 - 0.36 0.28 - 0.32 0.25 - 0.27 0.21 - 0.24 0.18 - 0.20 0.14 - 0.17 0.01 - 0.13 0.0 - 0.00
Figure 4-26: Variables descriptions of clusters 4 to 5, of second test
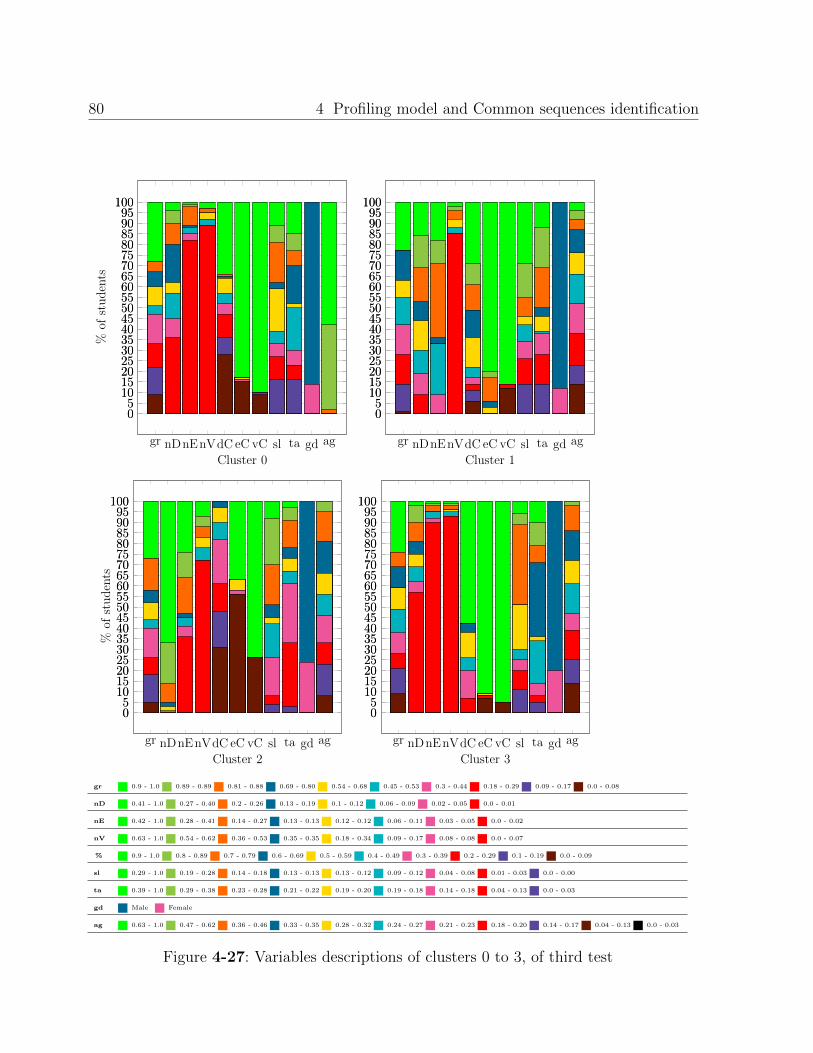
80 4 Profiling model and Common sequences identification
gr nDnEnVdC eC vC sl ta gd ag
05
101520253035404550556065707580859095
100
05
101520253035404550556065707580859095
100
Cluster 0
%of
studen
ts
gr nDnEnVdC eC vC sl ta gd ag
05
101520253035404550556065707580859095
100
05
101520253035404550556065707580859095
100
Cluster 1
gr nDnEnVdC eC vC sl ta gd ag
05
101520253035404550556065707580859095
100
05
101520253035404550556065707580859095
100
Cluster 2
%of
studen
ts
gr nDnEnVdC eC vC sl ta gd ag
05
101520253035404550556065707580859095
100
05
101520253035404550556065707580859095
100
Cluster 3
gr 0.9 - 1.0 0.89 - 0.89 0.81 - 0.88 0.69 - 0.80 0.54 - 0.68 0.45 - 0.53 0.3 - 0.44 0.18 - 0.29 0.09 - 0.17 0.0 - 0.08
nD 0.41 - 1.0 0.27 - 0.40 0.2 - 0.26 0.13 - 0.19 0.1 - 0.12 0.06 - 0.09 0.02 - 0.05 0.0 - 0.01
nE 0.42 - 1.0 0.28 - 0.41 0.14 - 0.27 0.13 - 0.13 0.12 - 0.12 0.06 - 0.11 0.03 - 0.05 0.0 - 0.02
nV 0.63 - 1.0 0.54 - 0.62 0.36 - 0.53 0.35 - 0.35 0.18 - 0.34 0.09 - 0.17 0.08 - 0.08 0.0 - 0.07
% 0.9 - 1.0 0.8 - 0.89 0.7 - 0.79 0.6 - 0.69 0.5 - 0.59 0.4 - 0.49 0.3 - 0.39 0.2 - 0.29 0.1 - 0.19 0.0 - 0.09
sl 0.29 - 1.0 0.19 - 0.28 0.14 - 0.18 0.13 - 0.13 0.13 - 0.12 0.09 - 0.12 0.04 - 0.08 0.01 - 0.03 0.0 - 0.00
ta 0.39 - 1.0 0.29 - 0.38 0.23 - 0.28 0.21 - 0.22 0.19 - 0.20 0.19 - 0.18 0.14 - 0.18 0.04 - 0.13 0.0 - 0.03
gd Male Female
ag 0.63 - 1.0 0.47 - 0.62 0.36 - 0.46 0.33 - 0.35 0.28 - 0.32 0.24 - 0.27 0.21 - 0.23 0.18 - 0.20 0.14 - 0.17 0.04 - 0.13 0.0 - 0.03
Figure 4-27: Variables descriptions of clusters 0 to 3, of third test

4.3 Results 81
gr nDnEnVdC eC vC sl ta gd ag
05
101520253035404550556065707580859095
100
05
101520253035404550556065707580859095
100
Cluster 4
%of
studen
ts
gr nDnEnVdC eC vC sl ta gd ag
05
101520253035404550556065707580859095
100
05
101520253035404550556065707580859095
100
Cluster 5
gr 0.9 - 1.0 0.89 - 0.89 0.81 - 0.88 0.69 - 0.80 0.54 - 0.68 0.45 - 0.53 0.3 - 0.44 0.18 - 0.29 0.09 - 0.17 0.0 - 0.08
nD 0.41 - 1.0 0.27 - 0.40 0.2 - 0.26 0.13 - 0.19 0.1 - 0.12 0.06 - 0.09 0.02 - 0.05 0.0 - 0.01
nE 0.42 - 1.0 0.28 - 0.41 0.14 - 0.27 0.13 - 0.13 0.12 - 0.12 0.06 - 0.11 0.03 - 0.05 0.0 - 0.02
nV 0.63 - 1.0 0.54 - 0.62 0.36 - 0.53 0.35 - 0.35 0.18 - 0.34 0.09 - 0.17 0.08 - 0.08 0.0 - 0.07
% 0.9 - 1.0 0.8 - 0.89 0.7 - 0.79 0.6 - 0.69 0.5 - 0.59 0.4 - 0.49 0.3 - 0.39 0.2 - 0.29 0.1 - 0.19 0.0 - 0.09
sl 0.29 - 1.0 0.19 - 0.28 0.14 - 0.18 0.13 - 0.13 0.13 - 0.12 0.09 - 0.12 0.04 - 0.08 0.01 - 0.03 0.0 - 0.00
ta 0.39 - 1.0 0.29 - 0.38 0.23 - 0.28 0.21 - 0.22 0.19 - 0.20 0.19 - 0.18 0.14 - 0.18 0.04 - 0.13 0.0 - 0.03
gd Male Female
ag 0.63 - 1.0 0.47 - 0.62 0.36 - 0.46 0.33 - 0.35 0.28 - 0.32 0.24 - 0.27 0.21 - 0.23 0.18 - 0.20 0.14 - 0.17 0.04 - 0.13 0.0 - 0.03
Figure 4-28: Variables descriptions of clusters 4 to 5, of third test

82 4 Profiling model and Common sequences identification
Table 4-21: Top ten of common sequences connected to a high academic performance, of
cluster 2 of third test
Sequence nl nm nh
E. “Programming cyclic structures” 0 1 7
C. “Arrays or two-dimensional arrays”, C. “Dimensional vectors or
arrays”
1 0 5
C. “Dimensional vectors or arrays”, C. “Dimensional vectors or arrays” 6 1 18
C. “Input and Output flows” 3 4 13
C. “Strings”, C. “Arrays or two-dimensional arrays” 2 3 9
C. “Strings”, C. “Strings” 3 2 9
C. “Dimensional vectors or arrays”, C. “Strings” 3 2 8
C. “Arrays or two-dimensional arrays”, C. “Arrays or two-dimensional
arrays”,
5 2 11
C. “Strings” 16 14 43
C. “Programming cyclic structures”, C. “Dimensional vectors or arrays” 2 2 5
4.3.3. Profiles evolution across term
It is desired to know the evolution of the profiles as the student takes tests, across the term,
i.e., notice the profile of a student after he/she took the first test, notice then the profile
after he/she took the second test, and look for the differences. In this way, it is possible to
observe how the profiles are affected by test attempts, and build an incremental profile of a
student as he/she takes tests.
To identify these incremental profiles, there were used data coming from all terms. For
each pair of profiles (a,b), the students who were assigned to profile a of the first test, and to
profile b of the second test, have been counted, and compared to the number of all students
who have been assigned to profile a in order to calculate the percentage. This process is also
run for noticing the evolution of profile from second test to third one.

4.3 Results 83
0 1 2 3 4 5
05
101520253035404550556065707580859095
100
05
101520253035404550556065707580859095
100
First test to Second test
%of
studen
ts
0 1 2 3 4 505
101520253035404550556065707580859095
100
05
101520253035404550556065707580859095
100
Second test to Third test
To profile: profile 0 profile 1 profile 2 profile 3 profile 4 profile 5
Figure 4-29: Profiles evolution across the term
Table 4-22: Equivalent profiles
Profile(s) Is/are equivalent to
0 of 1st test 5 of 2nd test
1 of 1st test 1 of 2nd test
3 of 1st test 3 of 2nd test
4 of 1st test 0 of 2nd test
5 of 1st test 2 and 4 of 2nd test
0 and 4 of second test 0,3 and 5 of 3rd test
1 of second test 1 of 3rd test
3 of second test 4 of 3rd test
Based on the clusters’ properties (each cluster is a profile), the table 4-22 presents the equi-
valences of each profile, i.e., identify which profiles of first and second tests are reasonably
similar, the same applies to second and third tests. If a student was assigned to a profile of
the first test, and then to an equivalent profile of the second test, then that student did not
change his/her learning style.
The figure 4-29 presents the evolution of profiles of first test to second one (left), and
second test to third one (right). Each bar indicates the profile of origin, and the color indi-
cates the profile of destination, the size of the band indicates the percentage of the students
who were initially assigned to the profile indicated by the bar, and then they were assig-
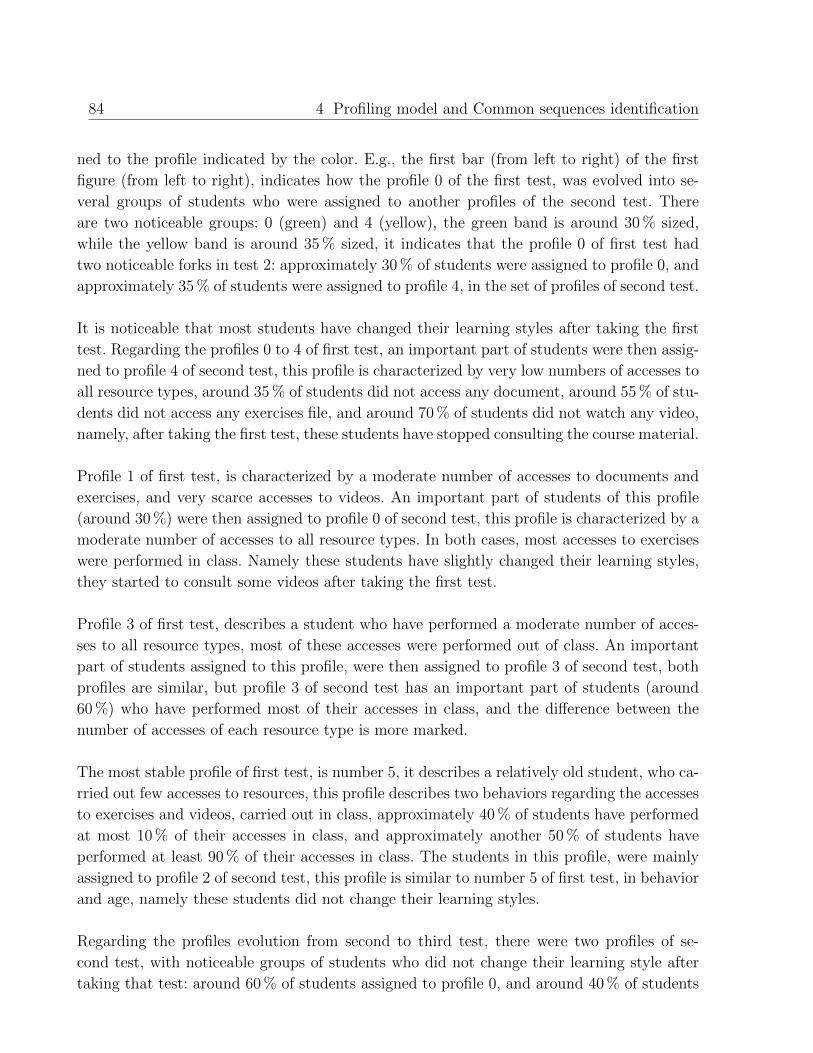
84 4 Profiling model and Common sequences identification
ned to the profile indicated by the color. E.g., the first bar (from left to right) of the first
figure (from left to right), indicates how the profile 0 of the first test, was evolved into se-
veral groups of students who were assigned to another profiles of the second test. There
are two noticeable groups: 0 (green) and 4 (yellow), the green band is around 30 % sized,
while the yellow band is around 35 % sized, it indicates that the profile 0 of first test had
two noticeable forks in test 2: approximately 30 % of students were assigned to profile 0, and
approximately 35 % of students were assigned to profile 4, in the set of profiles of second test.
It is noticeable that most students have changed their learning styles after taking the first
test. Regarding the profiles 0 to 4 of first test, an important part of students were then assig-
ned to profile 4 of second test, this profile is characterized by very low numbers of accesses to
all resource types, around 35 % of students did not access any document, around 55 % of stu-
dents did not access any exercises file, and around 70 % of students did not watch any video,
namely, after taking the first test, these students have stopped consulting the course material.
Profile 1 of first test, is characterized by a moderate number of accesses to documents and
exercises, and very scarce accesses to videos. An important part of students of this profile
(around 30 %) were then assigned to profile 0 of second test, this profile is characterized by a
moderate number of accesses to all resource types. In both cases, most accesses to exercises
were performed in class. Namely these students have slightly changed their learning styles,
they started to consult some videos after taking the first test.
Profile 3 of first test, describes a student who have performed a moderate number of acces-
ses to all resource types, most of these accesses were performed out of class. An important
part of students assigned to this profile, were then assigned to profile 3 of second test, both
profiles are similar, but profile 3 of second test has an important part of students (around
60 %) who have performed most of their accesses in class, and the difference between the
number of accesses of each resource type is more marked.
The most stable profile of first test, is number 5, it describes a relatively old student, who ca-
rried out few accesses to resources, this profile describes two behaviors regarding the accesses
to exercises and videos, carried out in class, approximately 40 % of students have performed
at most 10 % of their accesses in class, and approximately another 50 % of students have
performed at least 90 % of their accesses in class. The students in this profile, were mainly
assigned to profile 2 of second test, this profile is similar to number 5 of first test, in behavior
and age, namely these students did not change their learning styles.
Regarding the profiles evolution from second to third test, there were two profiles of se-
cond test, with noticeable groups of students who did not change their learning style after
taking that test: around 60 % of students assigned to profile 0, and around 40 % of students
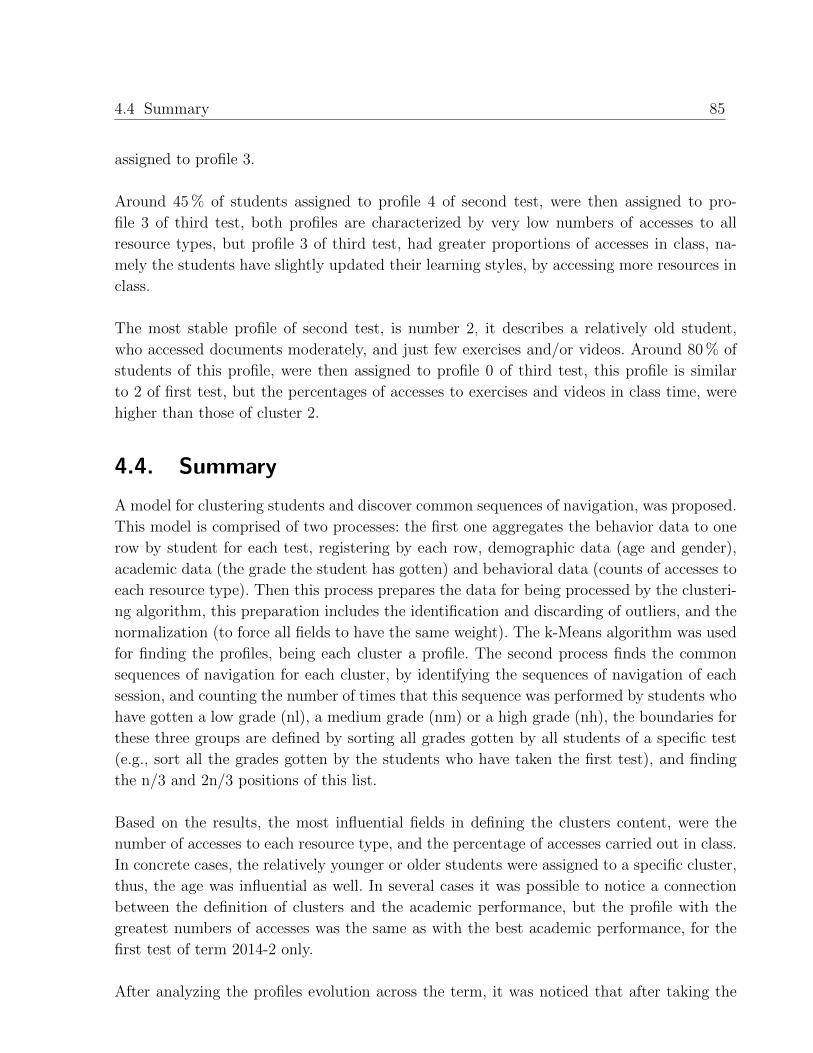
4.4 Summary 85
assigned to profile 3.
Around 45 % of students assigned to profile 4 of second test, were then assigned to pro-
file 3 of third test, both profiles are characterized by very low numbers of accesses to all
resource types, but profile 3 of third test, had greater proportions of accesses in class, na-
mely the students have slightly updated their learning styles, by accessing more resources in
class.
The most stable profile of second test, is number 2, it describes a relatively old student,
who accessed documents moderately, and just few exercises and/or videos. Around 80 % of
students of this profile, were then assigned to profile 0 of third test, this profile is similar
to 2 of first test, but the percentages of accesses to exercises and videos in class time, were
higher than those of cluster 2.
4.4. Summary
A model for clustering students and discover common sequences of navigation, was proposed.
This model is comprised of two processes: the first one aggregates the behavior data to one
row by student for each test, registering by each row, demographic data (age and gender),
academic data (the grade the student has gotten) and behavioral data (counts of accesses to
each resource type). Then this process prepares the data for being processed by the clusteri-
ng algorithm, this preparation includes the identification and discarding of outliers, and the
normalization (to force all fields to have the same weight). The k-Means algorithm was used
for finding the profiles, being each cluster a profile. The second process finds the common
sequences of navigation for each cluster, by identifying the sequences of navigation of each
session, and counting the number of times that this sequence was performed by students who
have gotten a low grade (nl), a medium grade (nm) or a high grade (nh), the boundaries for
these three groups are defined by sorting all grades gotten by all students of a specific test
(e.g., sort all the grades gotten by the students who have taken the first test), and finding
the n/3 and 2n/3 positions of this list.
Based on the results, the most influential fields in defining the clusters content, were the
number of accesses to each resource type, and the percentage of accesses carried out in class.
In concrete cases, the relatively younger or older students were assigned to a specific cluster,
thus, the age was influential as well. In several cases it was possible to notice a connection
between the definition of clusters and the academic performance, but the profile with the
greatest numbers of accesses was the same as with the best academic performance, for the
first test of term 2014-2 only.
After analyzing the profiles evolution across the term, it was noticed that after taking the

86 4 Profiling model and Common sequences identification
first test, many students tended to change their learning styles, the new learning style im-
plies the student makes little use of the course material. The second test was more stable in
this aspect, there were two profiles, with a majority of students who have not changed their
learning styles.

5 Warnings and Recommendation
system
This chapter presents the proposed warnings system, it is comprised of a process that assigns
a previously known profile (by using a lazy classifier, being the profile the label to be assigned)
to the student, if that profile has a warning message, then the platform will show that
message to the student, it is necessary to assign a message to each profile with a poor
academic performance. The recommender system is also presented, it has a process that
queries the common sequences of navigation previously found for the selected profile, which
are connected to a high academic performance, and finally this process finds those sequences
most similar to the sequence performed by the current student so far, in order to select the
resources to be recommended.
5.1. System design
The main goal of the warnings system is to give timely feedback to the student who is
currently using the Platform (the current student) in order to improve his/her academic
performance, by suggesting actions based on the profile assigned to him/her. As a further
step, the recommender system goal is to suggest resources (videos, documents, or exercises)
to the current student, this system uses the sequences of navigation found for the profile
assigned to the student, to choose which resources will be recommended. A first approach
for the warnings selection and recommendation strategy is proposed, their design is shown
in figure 5-1. This system has several input data, coming from the platform database, and
the clustering model. The input data are:
Web usage log: All the browsing history, each row includes the resource, student, date
and time.
Test attempts: All the test attempts performed by the students, each row includes the
test, student, grade, beginning date and time of the attempt.
Students’ birth date and gender: The socio-economic data collected by the platform
and used in this research work: Students’ gender and birth date, which allow calculate
the age of each student.
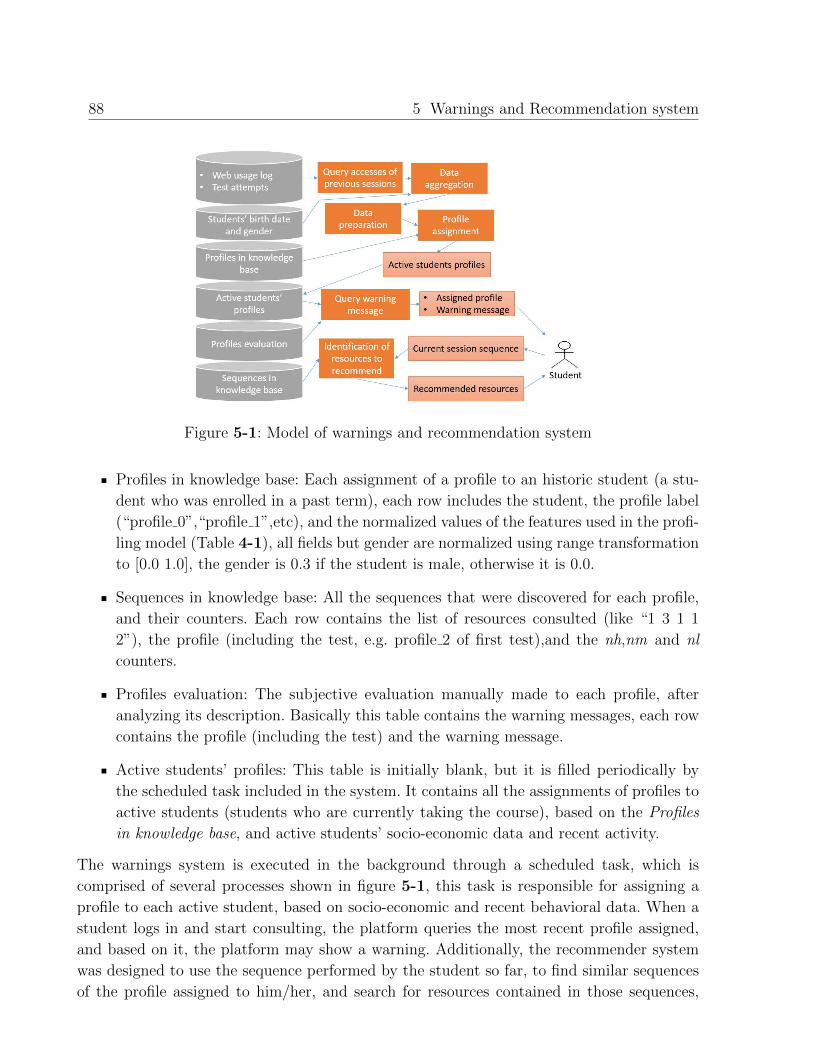
88 5 Warnings and Recommendation system
Figure 5-1: Model of warnings and recommendation system
Profiles in knowledge base: Each assignment of a profile to an historic student (a stu-
dent who was enrolled in a past term), each row includes the student, the profile label
(“profile 0”,“profile 1”,etc), and the normalized values of the features used in the profi-
ling model (Table 4-1), all fields but gender are normalized using range transformation
to [0.0 1.0], the gender is 0.3 if the student is male, otherwise it is 0.0.
Sequences in knowledge base: All the sequences that were discovered for each profile,
and their counters. Each row contains the list of resources consulted (like “1 3 1 1
2”), the profile (including the test, e.g. profile 2 of first test),and the nh,nm and nl
counters.
Profiles evaluation: The subjective evaluation manually made to each profile, after
analyzing its description. Basically this table contains the warning messages, each row
contains the profile (including the test) and the warning message.
Active students’ profiles: This table is initially blank, but it is filled periodically by
the scheduled task included in the system. It contains all the assignments of profiles to
active students (students who are currently taking the course), based on the Profiles
in knowledge base, and active students’ socio-economic data and recent activity.
The warnings system is executed in the background through a scheduled task, which is
comprised of several processes shown in figure 5-1, this task is responsible for assigning a
profile to each active student, based on socio-economic and recent behavioral data. When a
student logs in and start consulting, the platform queries the most recent profile assigned,
and based on it, the platform may show a warning. Additionally, the recommender system
was designed to use the sequence performed by the student so far, to find similar sequences
of the profile assigned to him/her, and search for resources contained in those sequences,

5.1 System design 89
which were not accessed by the current student so far, then these resources are selected for
recommendation. Each time a student accesses a resource, the Current session sequence is
updated, and it affects the recommendations he/she is going to receive.
5.1.1. Assignment of a profile to each active student
The first thing that must be considered, is that warning and recommender systems work with
incomplete data, i.e., the current student still has enough time to carry out more accesses,
while the data of the knowledge base were built with complete lapses, because the data
warehouse and the minable view, were filled immediately after the historic students (those
enrolled in a course of past terms) have taken each test. Because of this, the numbers of
accesses carried out by active students, should not be directly compared with the numbers
of accesses carried out by historic students, the behavioral data of active students must be
normalized instead, then these data will be comparable to the data registered in Profiles in
knowledge base, which are previously normalized.
function assignProfileToActiveStudentsEntryPoint()
activeStudentList = list of all students currenlty enrolled in the course;
normalizedRowsHistoricStudents = normalized values of knowledge base, and assigned
profile;
validPastAccessesByUser = queryAccessesOfPreviousSessions(activeStudentList);
countsByStudent = aggregateData(validPastAccessesByUser);
normalizedRowsActiveStudents =
normalizeTableUsingRangeTransformation(countsByStudent,[0.0 1.0]);
discardOutliers(normalizedRowsActiveStudents);
normalizedRowsActiveStudents =
normalizeTableUsingRangeTransformation(normalizedRowsActiveStudents,[0.0 1.0]);
assignProfileToActiveStudents(normalizedRowsActiveStudents,normalizedRowsHistoricStudents);
endAlgorithm 1: General algorithm to assign a profile to active students
This process was broadly presented in algorithm 1, functions used in this algorithm, are
presented below.
As presented previously, the assignment of a profile to each active student is performed
by a scheduled task, it is comprised of the Query accesses of previous sessions, Data ag-
gregation, Data preparation and Profile assignment processes, they are further explained
below.

90 5 Warnings and Recommendation system
Query accesses of previous sessions
The first process to be run is Query accesses of previous sessions, it processes all the ac-
tive students, one at a time. For each student, this process uses the test attempts data
to define if the student has taken all the tests with reached deadlines (e.g. define if the
student did not take the second test, but now it is too late for taking that, if so, that
student has dropped out the course), if the student has not dropped out the course, the
process uses the date of the last test attempt, to define the beginning date of the lapse
of study for the next scheduled test, thus, the process queries all the accesses that we-
re carried out later than that beginning date. This process is described in algorithm 2.
function queryAccessesOfPreviousSessions(activeStudentList)
validPastAccessesByUser=new List();
foreach (activeStudent in activeStudentList) do
lastTestAttempt = find last test attempt performed by activeStudent;
find test attempt deadlines for group in which activeStudent is enrolled;
if (activeStudent has taken all tests with deadline reached) then
//activeStudent has not dropped out;
validAccesses = accesses performed by activeStudent later than
lastTestAttempt;
validPastAccessesByUser.add(activeStudent,validAccesses);
end
end
return validPastAccessesByUser;
endAlgorithm 2: Query accesses of previous sessions
Data aggregation
For each active student, the Data aggregation process converts all the data returned by
the Query accesses of previous sessions process into one row. The Data aggregation process
counts the number of accesses to each resource type, calculates the percentage of accesses to
each resource type, that were performed in class, and calculates the average session length,
and average absence time. Additionally, the student’s age and gender are added to the row.
As a result, a table with one row by student is built. This process is described in algorithm
3.

5.1 System design 91
function aggregateData(validPastAccesses)
countsByStudent = new List();
foreach (validPastAccess in validPastAccesses) do
Get validPastAccess.getActiveStudent()’s gender and age ;
Based on validPastAccess.getValidAccesses():;
* Count accesses to every resource type (document, exercise, video);
* Calculate percentage of accesses performed in class, for each resource type;
* Calculate average session length and average absence time;
Instance a row and add to it the values presented previously, add that row to
countsByStudent;
end
return countsByStudent;
endAlgorithm 3: Aggregation of behavioral data to one row by student
Data preparation
The data returned by Data aggregation process, are prepared in order to let the lazy classifier
assign a profile to the current student without adverse results, the data are normalized and
the outliers are identified and discarded. As first step, the fields used for finding outliers
are normalized using range transformation to [0.0 1.0], a density based algorithm was run
over the table returned by Data aggregation process, to identify and discard any row that
is farther away than 0.7 to at least 70 % of all other rows, after calculating the euclidean
distance with the fields: nD, nE, nV, sl and ta. The complete list of features is presented in
table 4-1. This process is described in algorithm 4.
function discardOutliers(normalizedRowsActiveStudents)
foreach (currentRow in normalizedRowsActiveStudents) do
Calculate distance to all other elements in normalizedRowsActiveStudents;
if (at least 70 % of other elements are farther away than 0.7) then
mark row for removing;
end
end
remove all rows marked for removing;
endAlgorithm 4: Identification and discarding of outliers
Finally, the remaining data are normalized using range transformation to [0.0 1.0], in order
to avoid concentrations of non discarded rows on few values, due to few outliers that were
far away.

92 5 Warnings and Recommendation system
Profile assignment
The Profile assignment process, assigns a profile previously identified (by the Clustering
process of the profiling model) to each active student, by processing the table returned by
Data preparation process, a row at a time. This process, uses a lazy classifier to assign a
profile previously found to the active student. It was decided to use the K-Nearest-Neighbor
classifier, k was set to the 10 % of the number of historic students who have taken the test
that the current student is going to take. The set of historical rows (rows contained in the
Profiles in knowledge base table) of attempts to the test that the current student is going
to take, is identified. For each row of an active student, the distance to each historical row
of the set described previously, is calculated, using euclidean distance, the historical rows
list is sorted based on that distance. The most common profile of the 10 % closest historical
rows, is assigned to the row of the active student. This row is added to the Active students’
profiles table, after deleting any previously assignment of the active student to any profile.
This process is described in algorithm 5.
function
assignProfileToActiveStudents(normalizedRowsActiveStudents,normalizedRowsHistoricStudents)
refKnowledgeBaseSize = (number of rows in normalizedRowsHistoricStudents)/10;
foreach (currentRowActiveStudent in normalizedRowsActiveStudents) do
distances = new List();
foreach (currentRowHistoricStudent in normalizedRowsHistoricStudents) docurrentDistance = Euclidean distance between currentRowActiveStudent and
currentRowHistoricStudent;
currentProfileLabel = currentRowHistoricStudent profile label;
distances.add(currentProfileLabel,currentDistance);
end
sort distances based on currentDistance property;
chosenProfileLabel = most common currentProfileLabel in the first
refKnowledgeBaseSize positions of distances;
currentRowActiveStudent.setProfileLabel(chosenProfileLabel);
end
endAlgorithm 5: Assignment of a profile to active students
5.1.2. Show warning message to the current student
Each time the student logs in and watches the topic list (after the selection of the course), the
platform queries the last assigned profile, and checks if that profile has a warning message, if
so, that message is shown in the platform. The process to be run is Query assigned profile, it
queries an assignment of a cluster to the current student in Active students’ profiles table, if
a profile is found, the process queries a warning message assigned to this profile, in Profiles
5.2 System implementation 93
evaluation table, if that message is found, it is shown in the platform.
5.1.3. Recommendation of resources
The Recommender system process uses the profile returned by the Query assigned profile
process, to find all the sequences contained in Sequences in knowledge base that are assigned
to this profile. This set of sequences is used to find those sequences that are similar to Cu-
rrent session sequence, that are assigned to a high academic performance, and that contains
resources that were not accessed by the current student so far, these resources are selected
for recommendation.
5.2. System implementation
The warnings system was fully implemented, the scheduled task takes few minutes when
updating the assignments of profiles to students. Once the profiling model has used the data
coming from all terms to update the profiles, it is necessary to manually watch the profi-
les and define which ones are characterized by a low academic performance, and what are
their behavioral properties (such as the number of accesses to each resource type), then it
is necessary to manually write the warning message for each cluster, the students who are
assigned to a cluster without warning, will not be warned.
In this case, the profiles to be analyzed are described in figures 4-11 and 4-12 (First test),
4-25 and 4-26 (Second test), 4-27 and 4-28 (Third test). The academic performance and
warning message assigned, are shown in table 5-1. As presented in descriptions of profiles of
second test, they are similar in academic performance, because of this, those profiles with a
slightly lower academic performance, were marked as of “Low” Academic Performance.
The table 5-2 presents some cases of students who were assigned to different profiles, along
with the data used to perform this assignment.
The figure 5-2 shows a warning example, it asks the student more accesses to exercises
and videos, because the cluster assigned to him, was recognized as of poor academic perfor-
mance, and it was characterized by low accesses to those resource types.
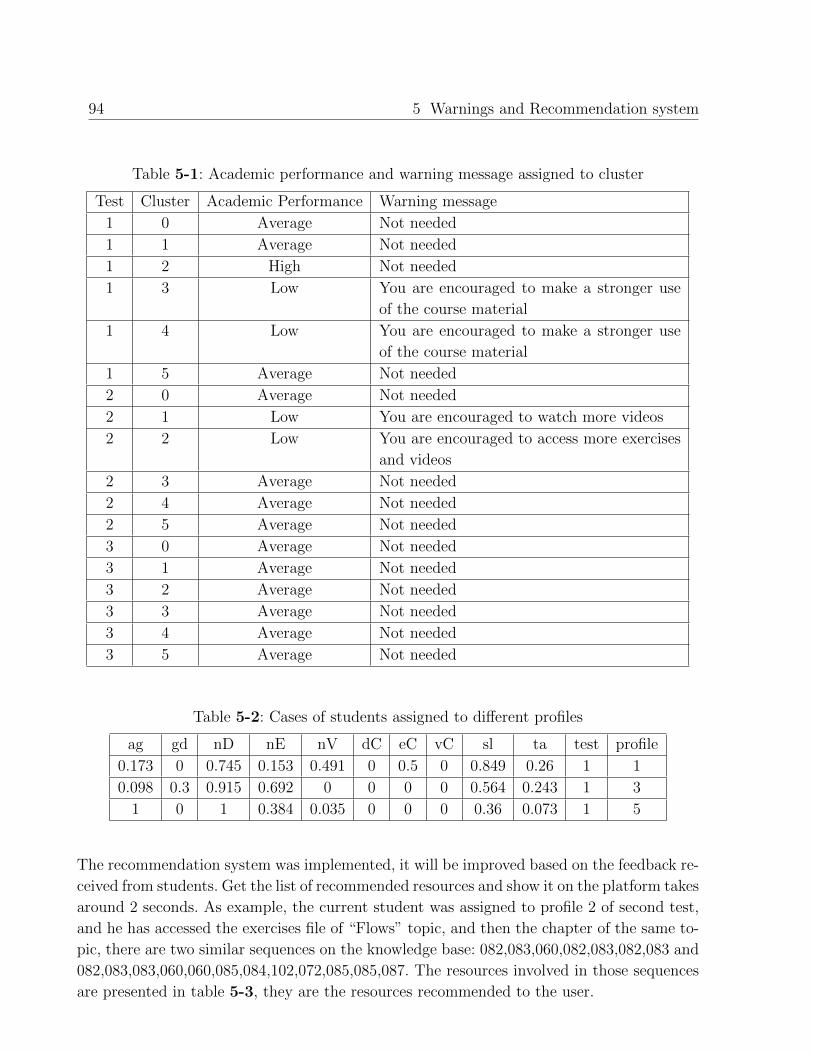
94 5 Warnings and Recommendation system
Table 5-1: Academic performance and warning message assigned to cluster
Test Cluster Academic Performance Warning message
1 0 Average Not needed
1 1 Average Not needed
1 2 High Not needed
1 3 Low You are encouraged to make a stronger use
of the course material
1 4 Low You are encouraged to make a stronger use
of the course material
1 5 Average Not needed
2 0 Average Not needed
2 1 Low You are encouraged to watch more videos
2 2 Low You are encouraged to access more exercises
and videos
2 3 Average Not needed
2 4 Average Not needed
2 5 Average Not needed
3 0 Average Not needed
3 1 Average Not needed
3 2 Average Not needed
3 3 Average Not needed
3 4 Average Not needed
3 5 Average Not needed
Table 5-2: Cases of students assigned to different profiles
ag gd nD nE nV dC eC vC sl ta test profile
0.173 0 0.745 0.153 0.491 0 0.5 0 0.849 0.26 1 1
0.098 0.3 0.915 0.692 0 0 0 0 0.564 0.243 1 3
1 0 1 0.384 0.035 0 0 0 0.36 0.073 1 5
The recommendation system was implemented, it will be improved based on the feedback re-
ceived from students. Get the list of recommended resources and show it on the platform takes
around 2 seconds. As example, the current student was assigned to profile 2 of second test,
and he has accessed the exercises file of “Flows” topic, and then the chapter of the same to-
pic, there are two similar sequences on the knowledge base: 082,083,060,082,083,082,083 and
082,083,083,060,060,085,084,102,072,085,085,087. The resources involved in those sequences
are presented in table 5-3, they are the resources recommended to the user.
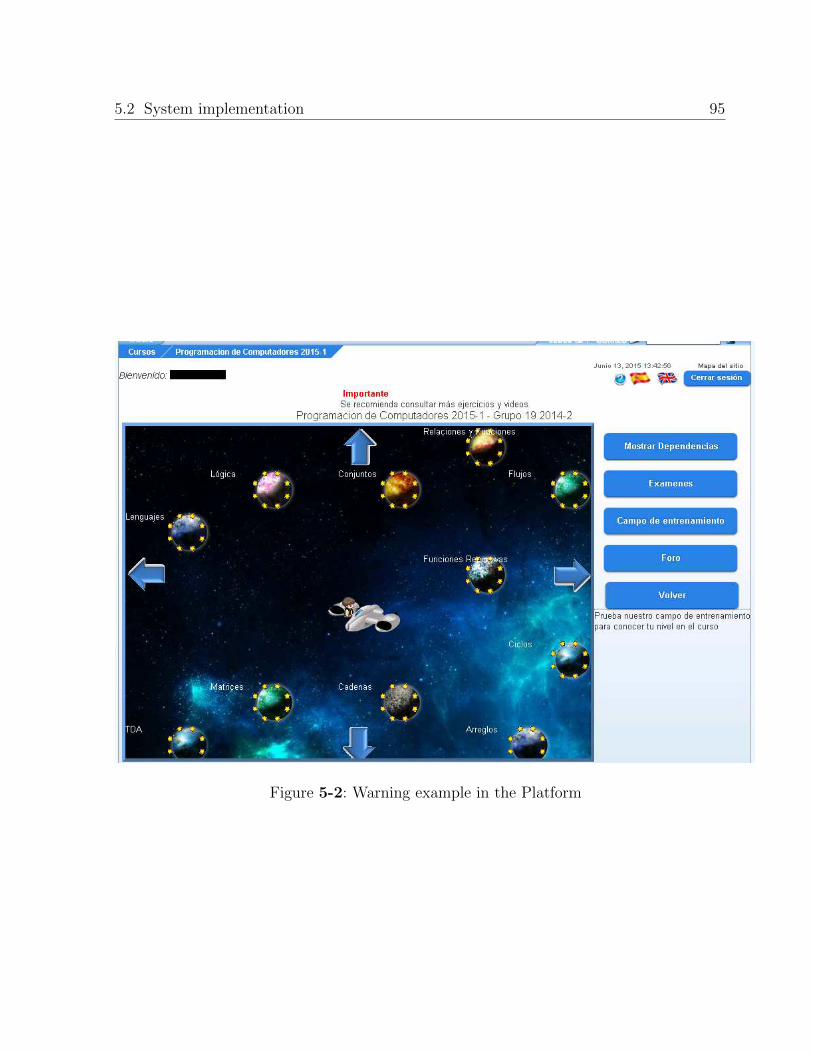
5.2 System implementation 95
Figure 5-2: Warning example in the Platform

96 5 Warnings and Recommendation system
Table 5-3: Resources involved in example sequences
Code Resource Topic
72 Exercises of Logic Logic
84 Exercises of Recursion Recursive functions
85 Chapter of Recursion Recursive functions
87 Chapter of Loops Loops
102 Presentation of Languages Languages
5.3. Summary
The warnings system was proposed, it is aimed to give timely feedback to students who
are likely to have a poor academic performance, this system is comprised of a process that
assigns a profile previously known to the student. In order to compare the behavior of the
current student to the behavior of historic students, it is necessary to retrieve all the accesses
carried out so far by all active students, that have been performed later than the last test
attempt (or the first academic day, in case of recommending for the first test), these data
must be aggregated by counting the number of accesses to each resource type, and how many
accesses were carried out in class, and calculating additional data like the average absence
time and average session length, resulting in one row by student, all of these rows are nor-
malized using range transformation to [0.0 1.0], the outlier identification process (the same
as the previously used by the profiling model) is run, and the remaining rows are normalized
again. The knowledge base of the warnings system, includes a minable view, that contains
the aggregated behavioral data of all historic students, they are normalized to [0.0 1.0] as
well, and they cover all the entire lapse between the last test attempt (or first academic day,
in case the data is registered for first test) and the day of the test attempt. The profile is
assigned to the current student by using a k-Nearest-Neighbor classifier, the row that belongs
to the current student (which was obtained by processing the accesses performed so far by
active students) is used to calculate all distances to all historic students, the most common
profile assigned to the 10 % closest historic students, is assigned to the current student. For
each known profile, it is necessary to watch its academic performance and its behavioral
properties, and based on these data, manually register a warning message, this message will
be shown to all students who are assigned to this cluster.
The recommender system was proposed, it queries the common sequences of navigation that
are connected to a high academic performance, then the similar sequences to the sequence
performed by the current student so far, that contain resources that the current student has
not accessed yet, are used for choosing which resource should be recommended.

6 Conclusions and future work
6.1. Conclusions
A data mining model for profiling students, which allows identify common sequences of navi-
gation, and use them to recommend content to consult, was proposed. The model identifies
a student’s profile based on his/her age, gender, and the behavior during web browsing
through a “Virtual Intelligent Learning Platform” (number of queries to resources, percen-
tage of accesses performed in class time, average session length and average absence time),
of approximately 1000 students enrolled in the “Computer Programming” course in 2014.
The model finds the groups of similar students using the k-means algorithm (to choose the
appropriated k-Value the average centroid distance was used). Then the grades gotten by
all the students for each test, were used to define the boundaries of three grade groups:
low, medium, and high academic performance, each group was segmented according to the
grades gotten by its students. Each subgroup was enriched using the common sequences
found by mining path traversal patterns. Each detected profile was described in terms of
the characteristics used for clustering,academic performance and the sequences of naviga-
tion. Profiles were identified and related to academic performance, it was noticed that some
behaviors in navigation through the resources are reflected in the grades of the test attempts.
Several properties of students’ behavior were discovered, the students usually carry out
many accesses at the beginning of the term, but the number of sessions and accesses, de-
creases as time passes by. The term can be divided into three equal parts, the first one is
characterized by a very high number of accesses, but this behavior is stabilized within two
next parts. Despite most resources are videos, the most accessed resource type was document.
Based on the platform flow design, and after analyzing the percentages of sessions, in which,
only resources of the same topic, or resource type, or both, were accessed, it can be concluded
that in at least 50 % of sessions, the students have followed the basic web behavior flow: Selec-
tion of topic, selection of resource type, and then, the student accesses one or more resources.
It was possible identify properties of students and their behaviors, and connect these pro-
perties to an academic performance, through the clusters found. The students’ behaviors
varied among tests: for the first one in 2014-2, the student with a profile with high acade-
mic performance, carried out many accesses to documents and exercises, but for the second

98 6 Conclusions and future work
test in 2014-2, there were two noticeable profiles, the first one is a student with a favorite
resource type: document, he/she carried out many accesses to this resource type, however,
this behavior did not affect his/her academic perfomance, approximately 50 % of students
have passed the test. The second profile, describes a student with high academic perfomance,
it is characterized by a moderated number of accesses to all resource types, performed in
class. For the third test, also two noticeable profiles were found: a student who has carried
out many accesses with a favorite resource type: document, generally, out of class, but this
behavior did not affect the academic perfomance. Another profile, describes a student who
has seldom accessed any resource type, generally in class, and he/she has a poor academic
performance.
The model is also applicable to data coming from all terms, it could be noticed that re-
garding second test, a profile with a slightly lower academic performance, is characterized
by a moderate number of accesses to documents and exercises, and too few accesses to videos.
It was noticed that after taking the first test, many students tended to change their learning
styles, the new learning style implies the students make little use of the course material,
this is coherent with the daily evolution of accesses in both terms (Figures 3-7 and 3-8),
the decrease of the number of accesses, is done approximately when the first test was taken.
Then, there are several students who did not change their learning styles between the se-
cond test attempt and the third one, two cases are remarkable: profiles 0 and 3 of second test.
Most common sequences were short, up to three resources found. This behavior was expec-
ted, since the average accesses per session (for each test) was calculated. For each sequence,
three values were calculated: the number of times the sequence was performed by students
with a low (nl), medium (nm) or high (nh) academic performance. Despite no remarkable
groups of sequences concentrated in high values of one variable (nl, nm or nh) and low values
of another two variables were found, it was possible to identify which sequences are more
connected to a specific academic performance (low, medium or high). Those connected to
high, can be used as input in the recommender system.
The warnings system was proposed, it is aimed to give timely feedback to students who
are likely to have a poor academic performance, based on the assignment to a previously
known profile, this is done through a lazy classifier (k-Nearest-Neighbor, being k the 10 %
of the number of historic students), each known cluster is a profile, and the profile is the
label to be assigned. It is necessary to manually assign a warning message to each known
profile, based on its academic performance and behavioral properties, this message will be
shown to all students assigned to this profile, if the profile does not have a message, the
student will not be warned. A design of a recommender system was presented, the assign-
ment to a profile, done by the warnings system is used to find those sequences assigned to a
6.2 Future work 99
high academic performance, and use them to choose which resources should be recommended.
The profiles are incrementally updated, each time all students have taken a specific test,
the new data help identify better profiles, that will be used for selecting resources to recom-
mend, in the future. Based on the results, the approach for finding the profiles is appropriate,
because it is able to find clusters that describe specific performances, and it weighs the grades
to face the problem of variability in difficulty among terms.
6.2. Future work
As future work, the warnings and recommendation system will be released. For testing the
warning messages and recommendations, it is necessary to get feedback from students, in
particular, their perceptions about the recommendations. The material exposed in the plat-
form could be divided by learning objects, which treat atomic topics, they will allow identify
more specific sequence patterns.
Other variables (including categorical data) can be considered when clustering, such as: un-
dergraduate program, additional academic data contained in SIA (Sistema de Informacion
Academica), socio-economic data contained in other databases of the Universidad Nacio-
nal de Colombia (such as those of the “Division de Registro” or “Direccion de Bienestar”).
Another kinds of aggregations could be performed.
The platform is course independent, another courses can be developed through it, and the
profiling model can be applied to them, it would allow notice the differences in profiles among
courses.
References
[1] Adomavicius, Gediminas ; Tuzhilin, Alexander: Using Data Mining Met-
hods to Build Customer Profiles. In: IEEE Computer 34 (2001), Nr. 2, 74–82.
http://dx.doi.org/10.1109/2.901170. – DOI 10.1109/2.901170
[2] Benıtez, Julio ; Gimenez, Marcos H. ; Hueso, Jose L. ; Martınez, Eulalia ; Rie-
ra, Jaime: Design and use of a learning object for finding complex polynomial roots.
In: International Journal of Mathematical Education in Science and Technology 44
(2013), Nr. 3, 365-376. http://dx.doi.org/10.1080/0020739X.2012.729678. – DOI
10.1080/0020739X.2012.729678
[3] Campbell J., Oblinger D.: Academic Analytics. In: EDUCAUSE (2007), oct
[4] Castro, Maria ; Lizasoain, Luis: Las tecnicas de modelizacion estadıstica en la
investigacion educativa: minerıa de datos, modelos de ecuaciones estructurales y modelos
jerarquicos lineales. In: Revista espanola de Pedagogıa (2012), Nr. 251, S. 131–148
[5] Chansarkar, B. A. ; Michaeloudis, A.: Student profiles and factors affecting per-
formance. In: Int. J. Math. Educ. Sci. Technol 32 (2001), S. 97–104
[6] Dagiene, Valentina ; Jevsikova, Tatjana ; Kubilinskiene, Svetlana: An Integration
of Methodological Resources into Learning Object Metadata Repository. In: Informa-
tica, Lith. Acad. Sci. 24 (2013), Nr. 1, S. 13–34
[7] Dascalu, Maria-Iuliana ; Bodea, Constanta-Nicoleta ; Moldoveanu, Alin ;
Mohora, Anca ; Lytras, Miltiadis ; Pablos, Patricia O.: A recommen-
der agent based on learning styles for better virtual collaborative learning
experiences. In: Computers in Human Behavior 45 (2015), Nr. 0, 243 -
253. http://dx.doi.org/http://dx.doi.org/10.1016/j.chb.2014.12.027. – DOI
http://dx.doi.org/10.1016/j.chb.2014.12.027. – ISSN 0747–5632
[8] Davies, David L. ; Bouldin, Donald W.: A Cluster Separation Measure.
In: IEEE Trans. Pattern Anal. Mach. Intell. 1 (1979), Februar, Nr. 2, 224–
227. http://dx.doi.org/10.1109/TPAMI.1979.4766909. – DOI 10.1109/TPA-
MI.1979.4766909. – ISSN 0162–8828
[9] Dixit, Dipa ; Gadge, Jayant: Automatic Recommendation for Online Users Using Web
Usage Mining. In: CoRR abs/1009.0433 (2010). http://arxiv.org/abs/1009.0433
References 101
[10] Dussan, Miguel: Sistema de recomendacion web basado en la actividad de los usuarios
de la Universidad Nacional de Colombia, Universidad Nacional de Colombia, Diplomar-
beit, 2012
[11] EDUCAUSE: 7 Things you should know about Learning
Analytics. In: EDUCAUSE Learning Initiative Briefing (2011).
http://www.educause.edu/ir/library/pdf/ELI7079.pdf
[12] Fethi A. Inan, Erman Y. ; Grant, Michael M.: Profiling potential dropout students
by individual characteristics in an online certificate program. In: Int’l J of Instructional
Media 36 (2009)
[13] Garrison, D. R. ; Anderson, Terry ; Garrison, Randy: E-Learning in the 21st Cen-
tury: A Framework for Research and Practice. 1st. New York, NY, 10001 : Routledge,
2003. – ISBN 0415263468
[14] Grace, L.K. J. ; Maheswari, V ; Nagamalai, Dhinaharan: Effective Personalized
Web Mining by Utilizing the Most Utilized Data. In: IJDMS 3 (2011), aug, Nr. 3, 100–
108. http://dx.doi.org/10.5121/ijdms.2011.3309. – DOI 10.5121/ijdms.2011.3309
[15] Hamada, Abdelaziz K. ; Rashad, Magdy Z. ; Darwesh, Mohamed G.: Behavior
Analysis in a learning Environment to Identify the Suitable Learning Style. In: In-
ternational Journal of Computer Science and Information Technology 3 (2011), apr,
Nr. 2, 48–59. http://dx.doi.org/10.5121/ijcsit.2011.3204. – DOI 10.5121/ijc-
sit.2011.3204
[16] Han, Jiawei ; Kamber, Micheline: Data Mining: Concepts and Techniques. San Fran-
cisco, CA, USA : Morgan Kaufmann Publishers Inc., 2000. – ISBN 1–55860–489–8
[17] I, Rapid: Rapid Miner 5.0 User Manual, 2010.
http://docs.rapid-i.com/r/rm-manual-en
[18] Istvan K. Nagy, Csaba Gaspar-Papanek: User Behaviour Analysis Based on Time
Spent on Web Pages. Springer-Verlag Berlin Heidelberg, 2009. – 117–135 S.
[19] Jonatan Gomez, Arles Rodriguez Edwin Camilo Cubides Julian Mahecha Juan
Camilo R. Elizabeth Leon L. Elizabeth Leon ; Prado, William: A Didactic E-
learning Platform with Open Content Navigation and Adaptive Exercises. (2012),
S. 1–6. http://dx.doi.org/10.1109/ICEELI.2012.6360625. – DOI 10.1109/ICEE-
LI.2012.6360625. ISBN 978–1–4673–2226–3
[20] Kantardzic, Mehmed: Data Mining: Concepts, Models, Methods and Algorithms. New
York, NY, USA : John Wiley & Sons, Inc., 2002. – ISBN 0471228524

102 References
[21] Kumar, Anupama ; Vijayalakshmi: Implication Of Classification Techni-
ques In Predicting Student’s Recital. In: IJDKP 1 (2011), sep, Nr. 5, 41–51.
http://dx.doi.org/10.5121/ijdkp.2011.1504. – DOI 10.5121/ijdkp.2011.1504
[22] Larose, Daniel T.: Discovering Knowledge in Data: An Introduction to Data Mining.
Wiley-Interscience, 2004. – ISBN 0471666572
[23] Liu, Bing ; Mobasher, Bamshad ; Nasraoui, Olfa: Web Usage Mining. In: Web
Data Mining. Springer Science + Business Media, 2011, S. 527–603
[24] Liu, Haibin ; Keselj, Vlado: Combined Mining of Web Server Logs
and Web Contents for Classifying User Navigation Patterns and Predic-
ting Users’ Future Requests. In: Data Knowl. Eng. 61 (2007), Mai, Nr.
2, 304–330. http://dx.doi.org/10.1016/j.datak.2006.06.001. – DOI
10.1016/j.datak.2006.06.001. – ISSN 0169–023X
[25] Lopez, Camilo: Data Mining Model to Predict Academic Performance at the Univer-
sidad Nacional de Colombia, Universidad Nacional de Colombia, Diplomarbeit, 2013
[26] M, Farida B. ; Ganapathy, Gopinath: Adaptive Learning Management System
Using Semantic Web Technologies. In: International Journal on Soft Computing
4 (2013), feb, Nr. 1, 1–8. http://dx.doi.org/10.5121/ijsc.2013.4101. – DOI
10.5121/ijsc.2013.4101
[27] Madhuri, Ch B. ; Chandulal, J A. ; Ramya, K ; Phanidra, M: Analysis of Users’
Web Navigation Behavior using GRPA with Variable Length Markov Chains. In: IJDKP
1 (2011), mar, Nr. 2, 1–20. http://dx.doi.org/10.5121/ijdkp.2011.1201. – DOI
10.5121/ijdkp.2011.1201
[28] Mahecha, Julian: Computer Adaptive Testing for an Intelligent E-Learning Platform,
Universidad Nacional de Colombia, Diplomarbeit, 2014
[29] Mencar, Corrado ; Castiello, Ciro ; Fanelli, Anna M.: A Profile Modelling Ap-
proach for E-Learning Systems. In: Gervasi, Osvaldo (Hrsg.) ; Murgante, Beniamino
(Hrsg.) ; LaganA , Antonio (Hrsg.) ; Taniar, David (Hrsg.) ; Mun, Youngsong (Hrsg.)
; Gavrilova, Marina L. (Hrsg.): ICCSA (2) Bd. 5073, Springer, 2008 (Lecture Notes
in Computer Science). – ISBN 978–3–540–69840–1, 275-290
[30] Oblinger, Diana G.: Game Changers: Education and Information Technologies. EDU-
CAUSE, 2012. – ISBN 1933046007
[31] Ortega Priego, Jose L. ; Aguillo Cano, Isidro F.: Minerıa del uso de webs: Web
usage data mining. In: El Profesional de la Informacion 18 (2009), Nr. 1, S. 20–26+. –
ISSN 1386–6710

References 103
[32] Pei, Jian ; Han, Jiawei ; Mortazavi-Asl, Behzad ; Zhu, Hua: Mining Access Pat-
terns Efficiently from Web Logs. In: Proceedings of the 4th Pacific-Asia Conference on
Knowledge Discovery and Data Mining, Current Issues and New Applications. London,
UK, UK : Springer-Verlag, 2000 (PADKK ’00). – ISBN 3–540–67382–2, 396–407
[33] Quevedo, J.R. ; nes, E. M. ; Ranilla, J. ; Bahamonde, A.: Automatic Choice of
Topics for Seminars by Clustering Students According to Their Profile. 3 (2009), Nr. 6,
473 - 477. http://waset.org/Publications?p=30. – ISSN 1307–6892
[34] Quimet, Thomas C. ; Rusczek, Robert A.: Video-Based Learning Objects. Creating
& Using Videos to Enhance Your Safety Training. In: Professional Safety (2014), june
[35] Rodrıguez, Paula: Modelo de recomendacion adaptativa de objetos de aprendizaje en
el marco de una federacion de repositorios, apoyado en agentes inteligentes y perfiles de
usuario, Universidad Nacional de Colombia, Diplomarbeit, 2013
[36] Romero, Cristobal ; Ventura, Sebastian ; Garcıa, Enrique: Da-
ta mining in course management systems: Moodle case study and
tutorial. In: Computers & Education 51 (2008), Nr. 1, 368-384.
http://dblp.uni-trier.de/db/journals/ce/ce51.html#RomeroVG08
[37] Shaeela Ayesha, Ahsan Raza Sattar M.Inayat K. Tasleem Mustafa M. Tasleem Mus-
tafa: Data Mining Model for Higher Education System. In: European Journal of Scien-
tific Research 43 (2010), S. 24–29
[38] Stavros Valsamidis, Ioannis Kazanidis Theodosios T. Sotirios Kontogiannis K. Soti-
rios Kontogiannis ; Karakos, Alexandros: A Clustering Methodology of Web Log Data
for Learning Management Systems. In: Educational Technology & Society 15 (2011), S.
154–167
[39] Tan, Pang-Ning ; Steinbach, Michael ; Kumar, Vipin: Introduction to Data Mining.
Addison-Wesley, 2005. – ISBN 0321321367
[40] TAWSOPAR, Kattiya ; MEKHABUNCHAKIJ, Kittima: Linking Learning Objects
to eMM Metrics on Learning Delivery: A Case Study of IT Curriculum Development.
In: Walailak Journal (2012), july
[41] Torrente, Javier ; Moreno-Ger, Pablo ; Martınez-Ortiz, Ivan ; Fernandez-
Manjon, Baltasar: Integration and Deployment of Educational Games in e-Learning
Environments: The Learning Object Model Meets Educational Gaming. In: Educational
Technology & Society 12 (2009), Nr. 4, S. 359–371
[42] UNESCO: Learning Analytics. In: UNESCO Institute for Information Technologies
in Education (2012), nov. http://iite.unesco.org/publications/3214711/

104 References
[43] Vandamme, J. P. ; Meskens, N. ; Superby, J. F.: Predicting Academic Perfor-
mance by Data Mining Methods. In: Education Economics 15 (2007), Nr. 4, 405-419.
http://EconPapers.repec.org/RePEc:taf:edecon:v:15:y:2007:i:4:p:405-419
[44] Vasile Paul Bresfelean, Nicolae Ghisoiu Calin-Adrian C. Mihaela Bresfelean B.
Mihaela Bresfelean: Determining Students’ Academic Failure Profile Founded on Data
Mining Methods. In: ITI 30th Int. Conf. on Information Technology Interfaces (2008)
[45] Vorvilas, George ; Karalis, Thanassis ; Ravanis, Konstanti-
nos: DESIGNING LEARNING OBJECTS: A GENRE-BASED AP-
PROACH. In: Journal of Baltic Science Education 10 (2011), June/2011.
http://journals.indexcopernicus.com/abstracted.php?level=5&icid=953997. –
ISSN 1648–3898
[46] Yang, Yiling ; Guan, Xudong ; You, Jinyuan: CLOPE: A Fast and Effective Clus-
tering Algorithm for Transactional Data. In: Proceedings of the Eighth ACM SIGKDD
International Conference on Knowledge Discovery and Data Mining. New York, NY,
USA : ACM, 2002 (KDD ’02). – ISBN 1–58113–567–X, 682–687