Computer Graphics: Programming, Problem Solving, and Visual Communication
23
Computer Graphics: Programming, Problem Solving, and Visual Communication Steve Cunningham California State University Stanislaus and Grinnell College PowerPoint Instructor’s Resource
-
Upload
brenna-gilbert -
Category
Documents
-
view
34 -
download
1
description
Computer Graphics: Programming, Problem Solving, and Visual Communication. Steve Cunningham California State University Stanislaus and Grinnell College PowerPoint Instructor’s Resource. Color and Blending. Specifying and working with color in your images. Color is Fundamental in Graphics. - PowerPoint PPT Presentation
Transcript of Computer Graphics: Programming, Problem Solving, and Visual Communication
Computer Graphics:Programming, Problem Solving,
and Visual Communication
Steve CunninghamCalifornia State University Stanislaus and Grinnell College
PowerPoint Instructor’s Resource
Color and Blending
Specifying and working with color in your images

Color is Fundamental in Graphics
• Having full-capability color available everywhere was a great breakthrough in computing when it finally happened
• In order to use color, we need to know how to specify it and how to work with it
• We also need to know how color affects the way our audience understands our images
The Human Visual System
• Our eyes have two main kinds of cells involved in vision– Rods -- sense luminance or brightness– Cones -- sense chroma or color
• Three kinds of photosensitive chemicals in cones
• Generally these are sensitive to red, green, and blue light wavelengths

Computer Graphics Simulates These Capabilities
• Images are created using red, green, and blue primaries
• Primaries may be phosphors in screen or film
• Primaries may be created by complements in print– See the hardcopy chapter for more details

The RGB Color Model
• Colors are specified by naming their red, green, and blue components
• These are usually taken to be relative components with real-valued numbers in [0,1] each
• Devices will have a more discrete color space, but the [0,1] space is mapped to this as needed
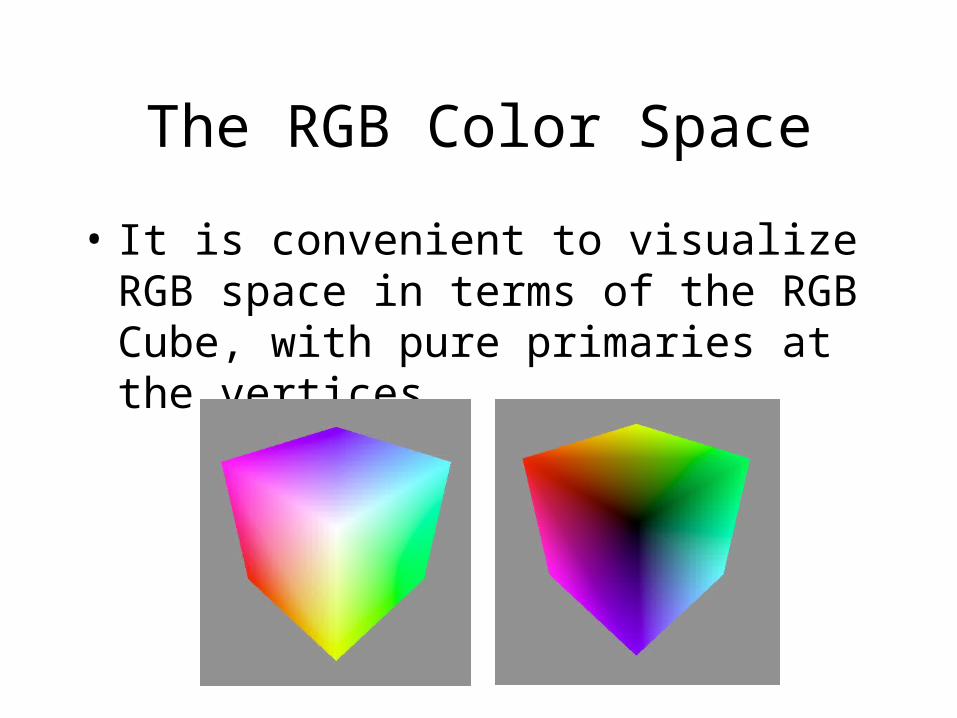
The RGB Color Space
• It is convenient to visualize RGB space in terms of the RGB Cube, with pure primaries at the vertices

Color and Luminance
• It can be important to think of the luminance of a color as well as the chroma (RGB values) of the color
• Luminance can be approximated by0.30*red + 0.59*green + 0.11*blue
• If a viewer has color deficiencies, he can usually distinguish color by luminance

Luminance Example
• The RGB cube clipped by a plane, shown in both color and grayscale
• The grayscale conversion is computer-based, not visually-based; is it right?
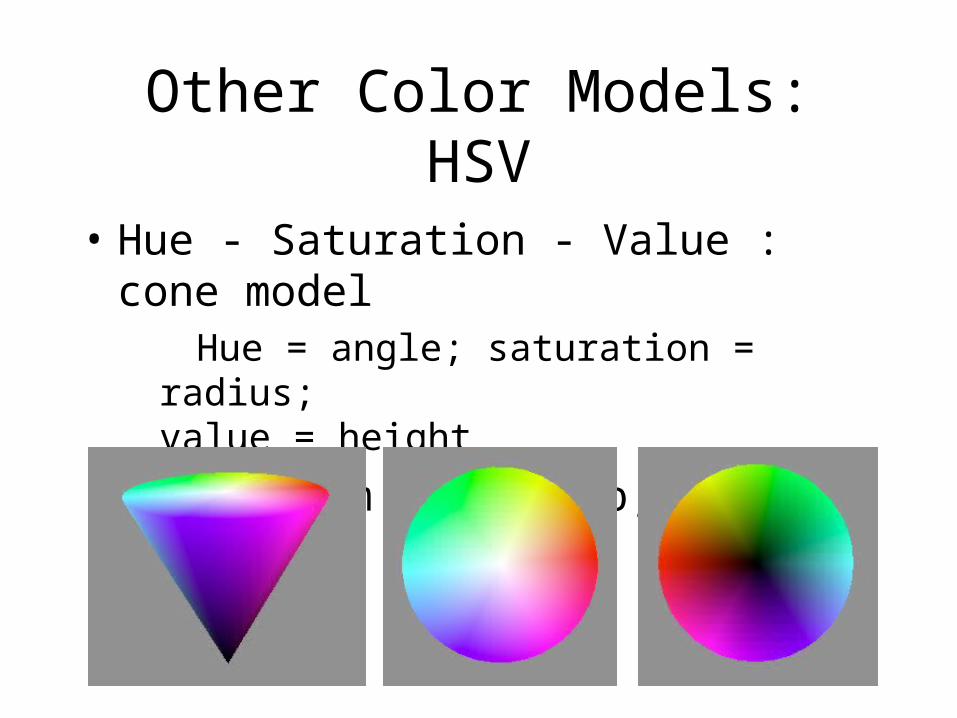
Other Color Models: HSV
• Hue - Saturation - Value : cone model Hue = angle; saturation = radius;
value = height
• Views from side, top, and bottom
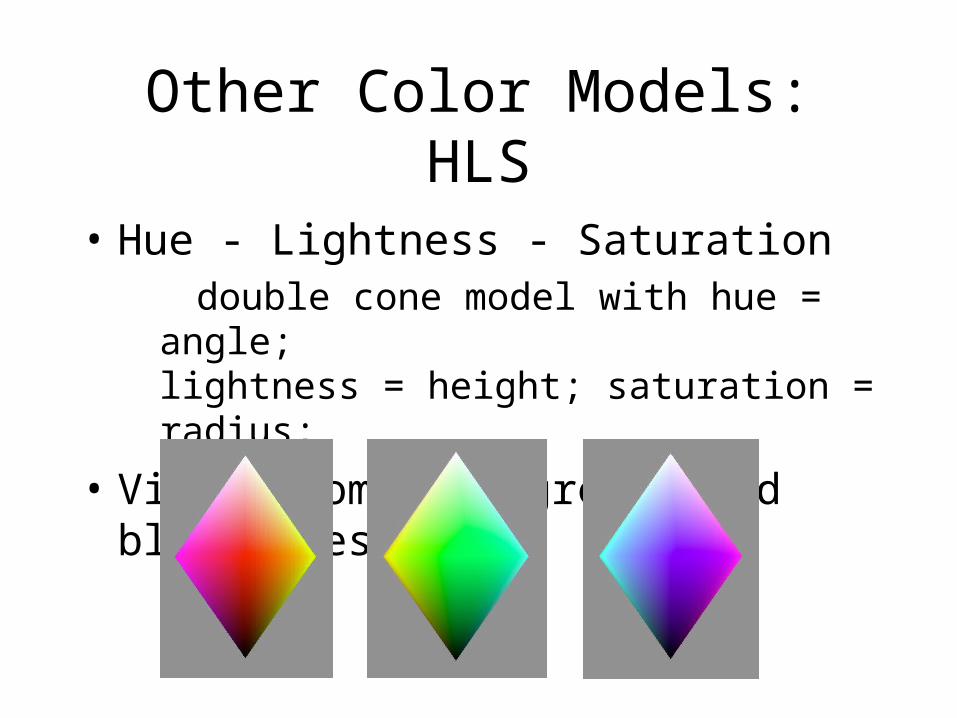
Other Color Models: HLS
• Hue - Lightness - Saturation double cone model with hue = angle;
lightness = height; saturation = radius;
• Views from red, green, and blue sides

Emissive vs Transmissive Colors
• Emissive colors are from screen
• Transmissive colors are from inks
• RGB emissive model (left)
• CMYK transmissive model (right)

Color Depth
• Depth is number of bits to store color
• Current standard is at least 8 bits/color
• With smaller color depth, you can get more mach banding(some may alwaysbe there!)
• See them in figure

Color Gamut
• The color gamut is the range of colors that can be created compared to the number that can be seen
• The CIE color space helps to see the gamut of any device (see triangle)
Color Blending and theAlpha Channel
• The RGB color model is extended to the RGBA model by adding an alpha value
• This value represents the proportion of color this contributes when it is blended with other colors
• 1 = complete coverage; 0 = no coverage
• Blending models transparency but does not actually provide it
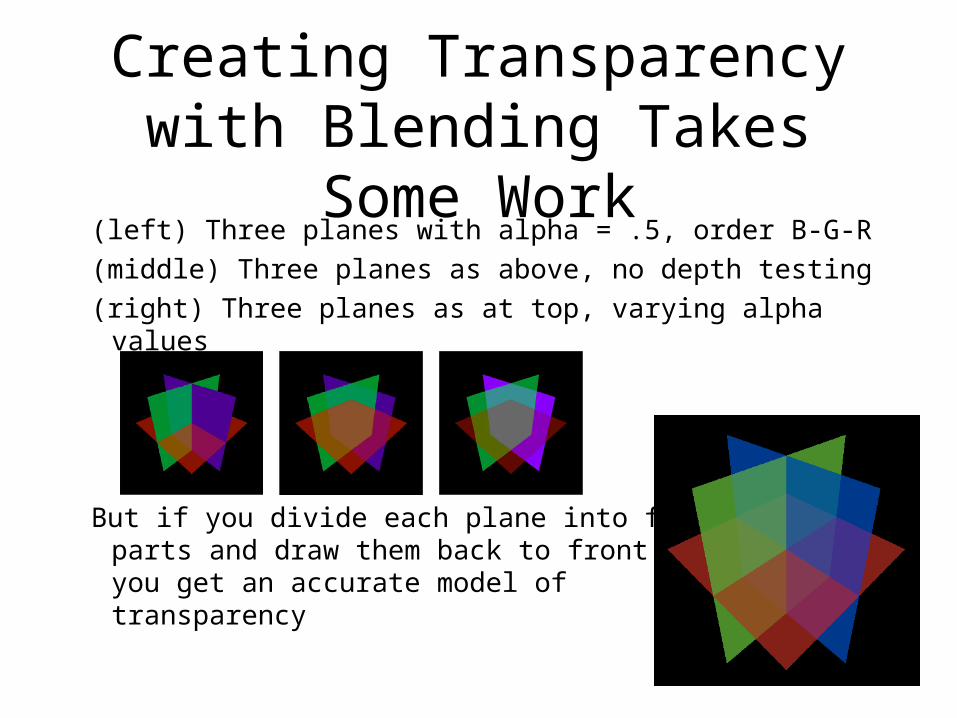
Creating Transparency with Blending Takes Some Work
(left) Three planes with alpha = .5, order B-G-R
(middle) Three planes as above, no depth testing
(right) Three planes as at top, varying alpha values
But if you divide each plane into four parts and draw them back to front, you get an accurate model oftransparency

Color for Visual Communication
• Color can be used in many ways
• Highlight color (left) and background color (right) are two important ones

Color for Visual Communication (2)
• Pseudocolor is another very important use of color for communication
• Use color to show the value of data
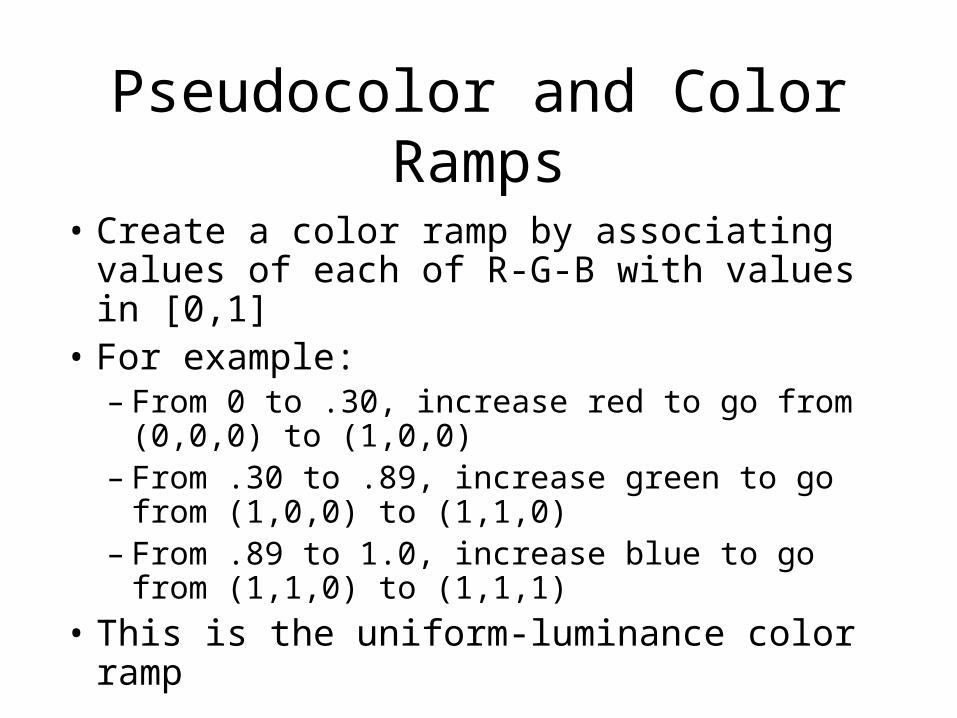
Pseudocolor and Color Ramps
• Create a color ramp by associating values of each of R-G-B with values in [0,1]
• For example:– From 0 to .30, increase red to go from (0,0,0)
to (1,0,0)– From .30 to .89, increase green to go from
(1,0,0) to (1,1,0)– From .89 to 1.0, increase blue to go from
(1,1,0) to (1,1,1)
• This is the uniform-luminance color ramp
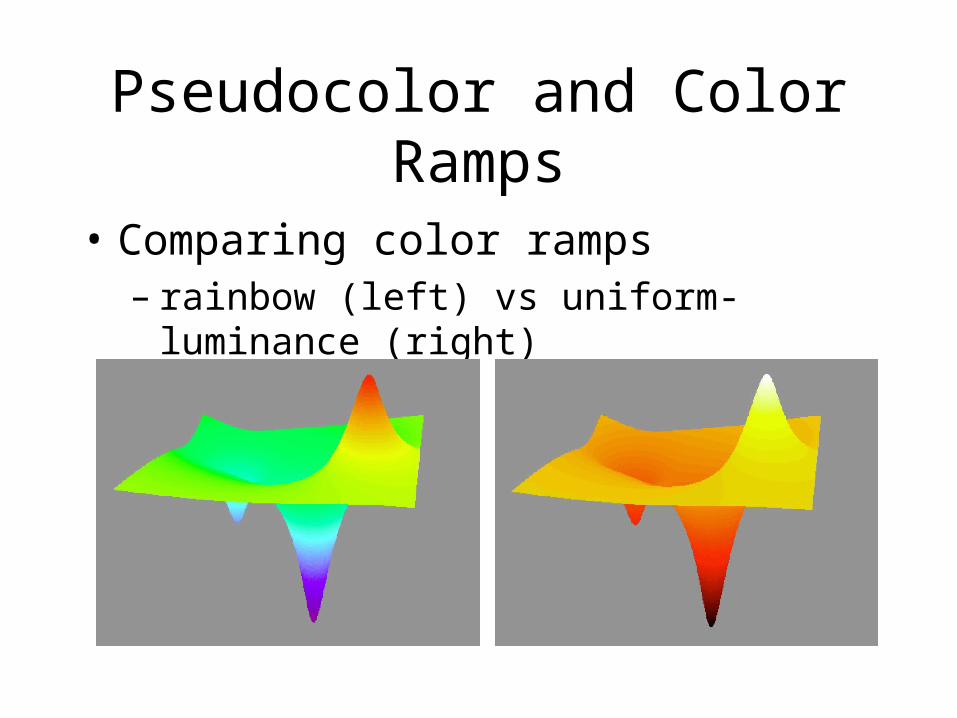
Pseudocolor and Color Ramps
• Comparing color ramps– rainbow (left) vs uniform-luminance (right)
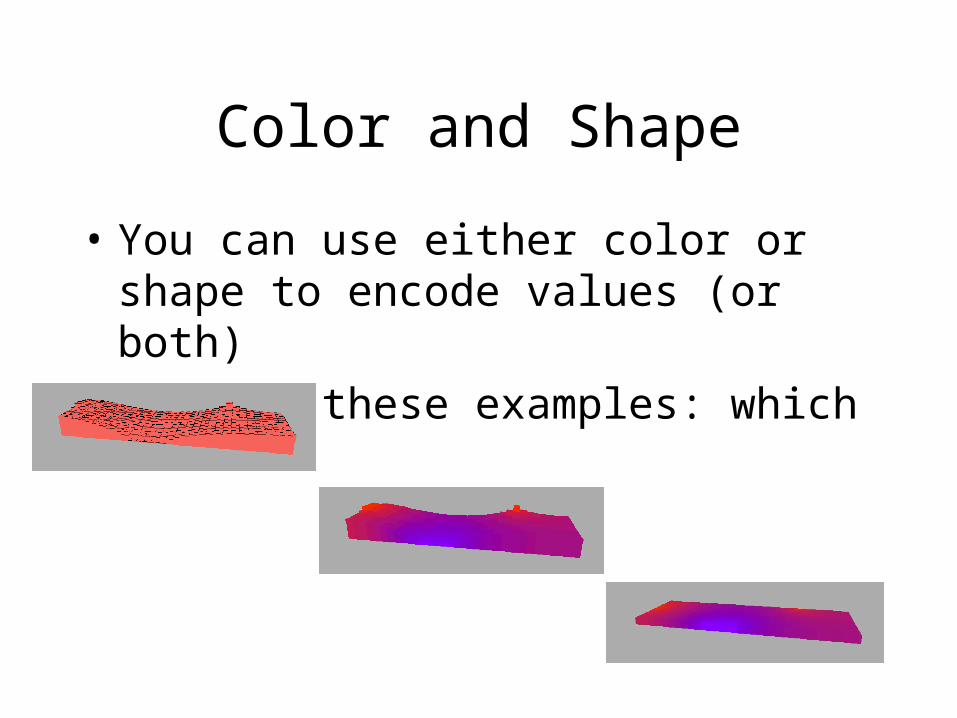
Color and Shape
• You can use either color or shape to encode values (or both)
• Compare these examples: which works?

Other Color Issues
• Color has some very specific meanings to people
• You need to respect those if you want your images to communicate well to a number of audiences
• Meanings can be professional, cultural, or even emotional

Perception Issues With Color
• There are problems with sharp contrasts in color along edges
• These come from the way our vision system works