
computer-assisted instruction in computer programming - Collected


COMPUTER ASSISTED INTERPRETATION OF
THE HUMAN EEG
IMPROVING DIAGNOSTIC EFFICIENCY AND
CONSISTENCY IN CLINICAL REVIEWS
SHAUN S. LODDER
Chairman:
Prof. dr. Gerard van der Steenhoven University of Twente
Promotor:
Prof. dr. ir. Michel J.A.M. van Puen University of Twente
Commiee members:
Dr. Harald Aurlien Haukeland University Hospital, Norway
Prof. dr. Fernando H. Lopes da Silva University of Amsterdam
Prof. dr. Cornelis J. Stam VU University Medical Center, Amsterdam
Dr. Frans S.S. Leijten University Medical Center, Utrecht
Prof. dr. Stephan A. van Gils University of Twente
Prof. dr. ir. Raymond N.J. Veldhuis University of Twente
Computer Assisted Interpretation of the Human EEG
Shaun S. Lodder
Printed by Gildeprint, Enschede, The Netherlands
ISBN: 978-90-365-3592-2
DOI: 10.3990./1.9789036535922
Cover design by Shaun Lodder. The picture depicts a brain drawn with 1485 templates
of inter-ictal epileptiform discharges extracted from routine scalp EEG recordings.
© 2013 Shaun S. Lodder

COMPUTER ASSISTED INTERPRETATION OF
THE HUMAN EEG
IMPROVING DIAGNOSTIC EFFICIENCY AND
CONSISTENCY IN CLINICAL REVIEWS
DISSERTATION
to obtain
the degree of doctor at the University of Twente,
on the authority of the rector magnificus,
Prof. dr. H. Brinksma,
on account of the decision of the graduation commiee,
to be publicly defended on
Friday, 31st January 2014, at 14:45
by
Shaun Sandy Lodder
born on October 20th 1984
in Kimberley, South Africa

This thesis has been approved by:
Promotor
Prof. dr. ir. Michel J.A.M. van Puen

To My Parents
Hugo and Leonie Lodder
Try. Make mistake. Fail. Learn.
Try beer. Make mistake. Fail. Learn.
Try beer still. Make mistake. Fail. Learn.
Repeat until...
Try. Succeed.
(Ken Evoy)


Contents
Chapter 1 Introduction 1
Part I EEG background paern 15
Chapter 2 Estimation of the Posterior Dominant Rhythm 17
Chapter 3 antification of the adult EEG background paern 35
Chapter 4 Clinical evaluation of computer-assisted interpretation 59
Part II Inter-ictal epileptiform discharges 75
Chapter 5 Inter-ictal spike detection using smart templates 77
Chapter 6 A self-adapting system for finding inter-ictal epileptiform
discharges 95
Chapter 7 Summary and general discussion 113
Chapter 8 Nederlandse samenvaing 127
References 133
Acknowledgments 151
About the author 155


Chapter 1
Introduction

2 | Chapter 1
Scalp electroencephalography (EEG) is one of the most commonly used tech-
niques for non-invasive measurements of cortical brain activity. With the first
recording made in humans close to a century ago, this technology is far from new
(Berger, 1929). Even so, interpretation of the signals has remained too complex
to completely automate, and experienced clinicians are still required to analyze the
data through a tedious process of visual inspection (Ebersole and Pedley, 2003; Nie-
dermeyer and da Silva, 2004). In contrast to other modern day technologies such
as fMRI and PET which make extensive use of computational methods to visualize
the recorded brain activity, EEG is mostly still reviewed in its raw form, i.e. multiple
lines of time series each representing the electrical activity measured by individual
electrodes on the scalp, as illustrated in Fig. 1.1.
EEG measures tiny voltage fluctuations of electrical activity on the scalp result-
ing from ionic currents produced by the firing of neurons in the brain (Niedermeyer
and da Silva, 2004). Due to low voltages and interference from muscle activity and
other artifacts (EEG voltages are typically within the 50 µV range where artifacts
can be one or two orders of magnitude higher), the signals have a low signal to
noise ratio and the captured neuronal activity is mostly limited to the cortical lay-
ers close to the scalp. The result of volume conduction from bone and cerebrospinal
fluid also causes a “smearing” eect across neighboring electrode channels, yield-
ing a lower spatial resolution than some other non-invasive techniques (Ebersole
and Pedley, 2003). However, in contrast to other non-invasive methods, EEG has
a high temporal resolution and provides a portable and cost-eective technology
for many diagnostic procedures. Given the general availability of EEG equipment
and its flexibility in recording environments, it will continue to play an important
role in clinical procedures ranging from epilepsy diagnostics and ICUmonitoring to
rehabilitative technologies and in-home patient monitoring (Wilson and Emerson,
2002; Thakor and Tong, 2004; Friedman and Hirsch, 2009; Kurtz et al., 2009; Young,
2009; Casson and Rodriguez-Villegas, 2009; Arciniegas, 2011; Faulkner et al., 2012;
Beniczky et al., 2013; Sanchez et al., 2013; Halford et al., 2010).
Common EEG properties
The common properties observed in EEG recordings can be divided into twomain
categories: (i) background activity, and (ii) transients (Ebersole and Pedley, 2003;
Niedermeyer and da Silva, 2004). During a routine EEG review, the properties in
these two categories are carefully evaluated in order to search for abnormalities or

Introduction | 3
Fig. 1.1: A 19-channel scalp EEG recording in common reference montage showing a reactive pos-terior dominant rhythm, most clearly seen over the occipital region (channels O1 and O2) aer theeyes are closed at 3.5 s.
deviations from the norm. Transient activity in the form of inter-ictal epileptiform
discharges are especially relevant for the diagnosis of epilepsy, and most routine
EEGs are typicallymade based on this as diagnostic purpose. Below is a brief outline
of the most common EEG properties.
Background activity
Background activity describes the mean properties observed on a global scale in
the EEG (Ebersole and Pedley, 2003; Niedermeyer and da Silva, 2004). Most of these
properties relate to rhythmic behavior as observed on the scalp, and these rhythms
are typically described within the frequency bands that they occur: delta (<4 Hz),
theta (4-8 Hz), alpha (8-12 Hz), beta (12-30 Hz) and gamma (30-100+ Hz) (Nieder-
meyer and da Silva, 2004). Well known properties exist for each type, and abnor-
malities or deviations most oen point to disease or brain damage.
A very well known part of the EEG background activity, and also the first rhythm
to be discovered, is the alpha rhythm (Berger, 1929). Its peak frequency is an impor-
tant marker to monitor maturation of the human brain in early life (Niedermeyer

4 | Chapter 1
and da Silva, 2004; Aurlien et al., 2004), and slowing in adults is coupled with various
neurodegenerative diseases (Jeong, 2004; Dauwels et al., 2010). The alpha rhythm,
also referred to as the posterior dominant rhythm, is best seen over the occipital
region in a healthy subject. It gradually decreases in amplitude as it moves towards
the anterior, and has a peak frequency related to the subject’s age (Niedermeyer
and da Silva, 2004). The alpha rhythm is most clearly observed during a relaxed
state of wakefulness, typically when the eyes are closed, and it is reactive to exter-
nal stimuli such as auditory or visual input.
Other well known background rhythms are the mu (8-13 Hz) and beta rhythms
(Ebersole and Pedley, 2003). The mu rhythm is most prominent over the motor
cortex and responds to motor execution and imagery. Beta rhythms are mostly
observed during an active awake state and are related to cognitive and motor ex-
ecution tasks. Lastly, considering slower activity, children display more delta and
theta activity, whereas in adults a significant presence of slow activity is considered
to be abnormal.
Apart from the frequency and amplitude of the oscillations themselves, the back-
ground activity also has a number of other relevant properties (Beniczky et al.,
2013). A healthy brain shows a high degree of symmetry between le and right
hemispheres. Symmetry can be seen in both the frequency and amplitude, and
asymmetries usually point to focal abnormalities associated with many pathologi-
cal conditions, ranging from ischaemia and trauma to space occupying lesions (Eber-
sole and Pedley, 2003; Niedermeyer and da Silva, 2004). In addition to symmetry,
the EEG also shows an anterior-to-posterior gradient in both frequency and ampli-
tude. Rhythms with higher frequencies and lower amplitudes are most dominant
over the anterior, whereas slower oscillations with higher amplitudes are commonly
observed over posterior regions. A lack of fast activity or no anterior-posterior gra-
dient, especially in adults, is considered abnormal and can for example be observed
in coma and neurodegenerative diseases (Ebersole and Pedley, 2003).
Transients
Transients refer to short, abrupt changes in the EEG and can be caused by both
normal and abnormal processes in the brain (Ebersole and Pedley, 2003; Nieder-
meyer and da Silva, 2004). Examples of normal transients are sleep spindles, K-
complexes, lambda waves and wicket waves (Niedermeyer and da Silva, 2004). The
most common form of abnormal transients are inter-ictal epileptiform discharges

Introduction | 5
(IEDs). These appear in the form of spikes, sharp waves, poly-spikes and spike and
slow-wave discharges (Niedermeyer and da Silva, 2004). An example of spike and
slow-wave discharges is shown in Fig. 1.2 with the IEDs marked in gray. In EEG,
the presence of IEDs are correlated with a high likelihood of recurrent seizures.
They are almost exclusively present in epileptic patients, and their presence play
an important role in the diagnosis and classification of epilepsy, in particular when
seizures themselves cannot be observed. Hyperventilation is the most eective
method for activating ictal and inter-ictal epileptiform activity in children with ab-
sence epilepsy. For provoking generalized seizures or inter-ictal discharges related
to reflex epilepsy, external stimuli such as photic stimulation works best (Ebersole
and Pedley, 2003). In addition to performing hyperventilation and photic stimula-
tion during routine epilepsy screening, sleep deprivation can also be used to im-
prove the chances of finding inter-ictal events. Sleep activates the occurrence of
epileptiform discharges in about one third of epilepsy patients (Ebersole and Ped-
ley, 2003).
Artifacts
Apart from background activity and transients, EEGs are also plagued by artifacts
which do not originate from neuronal activity. This is also one of the main reasons
why the automation of EEG analysis have remained so diicult until now (Anderson
and Doolile, 2010; Tatum et al., 2011a). Although more exist, common artifacts
are: (i) myogenic artifacts caused by muscle movements, (ii) eye-blink artifacts,
(iii) pulsation artifacts from electrodes placed on top of arteries, (iv) electrodermal
artifacts causing slow DC shis, (v) power line noise (50 or 60 Hz depending on
the region), and (vi) electrical or mechanical noise from nearby instrumentation
(Klass, 1995; Ille et al., 2002; Tatum et al., 2011b; Niedermeyer and da Silva, 2004).
In Fig. 1.2 an example of a muscle artifact can be seen in approximately the middle
of the epoch, mostly over the frontal and temporal regions.
Many artifact detection and removal techniques have been suggested, all with
their own strengths and weaknesses (van de Velde et al., 1999; Vigário et al., 2000;
Castellanos and Makarov, 2006; Delorme et al., 2007). Popular solutions are spatial
filtering and independent component analysis (ICA) based filters. Spatial filters
aempt to separate signal sources generated from the cerebral cortex from other
contributions unrelated to neuronal activity (Ille et al., 2002). ICA filters use the con-
cept of blind source separation to obtain individual sources of activity (Vigário et al.,

6 | Chapter 1
Fig. 1.2: An example of four consecutive spike and slow-wave discharges (marked in gray) that formpart of inter-ictal epileptiform activity (IEDs). The presence of IEDs in an EEG are correlated witha high likelihood of recurrent seizures and their presence therefore plays an important role in the
diagnosis of epilepsy. A muscle artifact is also seen at 6s. Artifacts corrupt the signal and can makeit diicult to measure the underlying neuronal activity.
2000). Aer the individual sources have been obtained, artifact sources are identi-
fied and removed, and the remaining sources are mapped back to their original
space. Regardless of the technique used to remove artifacts, human intervention is
still required to confirm that no important information will be lost during filtering.
This intermediate step prevents full automation, but the (reasonably) artifact-free
EEG allows quantitative algorithms to achieve higher accuracies.
Visual inspection and conventional reviews
Given the complexity and variability in EEG recordings, conventional reviews
consist of analyzing the EEG in its raw form, as shown in Fig. 1.1 and 1.2. Using a
number of dierent referencing montages (eg. bi-polar, source, common-reference),
the reviewer looks for abnormalities or deviations in the EEG properties described
above. Depending on the clinical question at hand, the reviewer can then create a
report and make an interpretation based on his findings from the review (Ebersole

Introduction | 7
and Pedley, 2003; Niedermeyer and da Silva, 2004). Unfortunately, this process is
slow and requires an expert to perform. EEGs are typically viewed iteratively over
short epochs of ten to thirty seconds at a time. For long recordings this process be-
comes very tedious and lowers a reviewers concentration. Given this visual burden
and the costs involved in reviewing, routine EEG recordings are typically limited
to 20 or 30 min in length. For epilepsy however, it has been shown that a longer
recording window can improve the chances of finding inter-ictal epileptiform ac-
tivity. In many cases, a single long-term ambulatory recording can therefore avoid
the need for patients to return for follow-up recordings (Doppelbauer et al., 1993;
Faulkner et al., 2012; Halford et al., 2010).
Although automated analysis is not yet accurate or diverse enough to replace
visual reviews, a computer’s ability to perform complex calculations can be of great
benefit to the reviewer. By having an automated method search for areas of interest
in the EEG and then presenting only these findings to the reviewer, the visual bur-
den can be minimized and review times can be reduced significantly (Scherg et al.,
2012; Anderson and Doolile, 2010). In addition, consistent feedback from the au-
tomated methods and more rigid definitions can improve inter-rater reliability and
allow for more consistent reports (Halford et al., 2011). Computer-assisted EEG in-
terpretation also allows reviewers to easily extract and visualize certain properties
in the EEG, as shown in (van Puen, 2008; van Puen et al., 2004; Friedman and
Hirsch, 2010). With faster review times, beer visualization of the underlying neu-
ronal activity, and still the same diagnostic certainty and reliability as compared to
visual inspection by itself, the addition of automated analysis (as shown in Fig. 1.3)
brings many possibilities to life.
Computer-assisted EEG interpretation
Computerized analysis, beer known as quantitative EEG (QEEG), has been around
for some time (Martin et al., 1972; Nakamura et al., 1992; Jordan, 1995; Thakor and
Tong, 2004; Anderson and Wisneski, 2008). A vast number of automated detection
algorithms have been proposed since the introduction of digital EEG, and although
most studies only focus on describing one feature or property of the EEG, the wide
range of its use have shown that QEEG features can be of great benefit during clini-
cal diagnosis and monitoring. Clinical applications for QEEG include ICUmonitor-
ing (Friedman and Hirsch, 2010; Cloostermans et al., 2011; Foreman and Claassen,
2012), clinical psychiatry (Coburn et al., 2006; Hammond, 2010), and the diagnosis

8 | Chapter 1
Fig. 1.3: Visual review of EEG is time-consuming, requires extensive training and suers from high
inter-rater variability. Computerized interpretation is consistent and fast, but is limited to specifictasks and lacks the accuracy of human interpretation. We aim to combine computerized interpreta-tion with visual reviews to improve reviewer eiciency and lower inter-rater variability.
of neurodegenerative diseases (Petit et al., 2004; Babiloni et al., 2011; Morei et al.,
2012). Although a number of commercial applications exist, computer-assisted in-
terpretation and structured reports are still not widely accepted by all (Thatcher,
2010). Extensive reviews on quantitative EEG and automated spike detection have
been performed in the past, some more recent than others (Nuwer, 1997; Wilson
and Emerson, 2002; Halford, 2009; Anderson and Doolile, 2010). Although not a
full review is given here, the two sections that follow provide an overview of rele-
vant work leading up to the objectives and subsequent investigations described in
this thesis.
Background activity
Themain research focus in computer-assisted reviews for routine outpatient EEG
recordings up to now has mostly been on the detection of inter-ictal epileptiform
discharges (Nuwer, 1997; Wilson and Emerson, 2002; Halford, 2009). Although com-
mercial applications are available to help clinicians visualize some of the common
properties in EEG1, their focus also mainly lies in seizure and spike detection, in-
tensive care monitoring and source localization. Regarding the clinical use of auto-
1For example applications see hp://www.persyst.com/ and hp://www.besa.de/.

Introduction | 9
mated systems that can analyze and generate EEG reports compatible with those of
reviewers on common background properties such as the alpha rhythm frequency
and reactivity, anterior-posterior gradients, symmetry and slowing, clinical imple-
mentations could not be found.
The current best practice for reviewing EEGs involves visual analysis of the record-
ing in its raw form followed by a wrien report based on the findings in free-text.
The laer part can lead to a high degree of variability and inconsistency between
reviewers (Haut et al., 2002; Benbadis et al., 2009; Gerber et al., 2008; Azuma et al.,
2003), and given that the findings are not noted down using a set category of out-
comes or that no commonly accepted guidelines exist for describing some proper-
ties, reports become diicult to query and compare to the findings of other clini-
cians. In recent work by Beniczky et al. (2013), the authors describe a set of guide-
lines and definitions (including the reporting of common background properties)
that is being constructed as part of a pan-European project with the goal of provid-
ing more consistency and structure for the reports in clinical EEG reviews (Beniczky
et al., 2013; Aurlien et al., 2004, 2007). Standard procedure for writing EEG reports
state that objective observations of the EEG properties should be separate from the
conclusions made by the reviewer based on these observations.2 As such, quanti-
tative analysis is well suited for the objective description of the background prop-
erties, and in combination with the guidelines provided by (Beniczky et al., 2013),
if widely accepted, a more structured and consistent report can be generated. This
should lead to more consistency in reviews and make patient databases easier to
query for patient information. Given that other factors such as medication and pa-
tient history are not known or taken into account by automated systems, the final
conclusions in EEG reports should always be drawn by the reviewer.
Apart from improving consistency in reporting, there is also a need to find faster
and more intuitive ways to visualize and interpret EEGs and thereby lessen the bur-
den of visual analysis (Nuwer, 1997; Aurlien et al., 2004; van Puen, 2008; Halford,
2009; Anderson and Doolile, 2010). A number of quantitative EEG features have
been proposed to describe specific properties in the EEG. They include statistical
measures such as variance, kurtosis and skewness (Scherg et al., 2012; Stevenson
et al., 2013), non-linear energy operators (Mukhopadhyay and Ray, 1998), small-
world networks and functional connectivity (Stam et al., 2007; Bullmore and Sporns,
2009), synchrony (Lachaux et al., 1999; van Puen, 2003), entropy (Stam, 2005; Kan-
2SeeGuideline 7 provided by the American Clinical Neurophysiology Society, J Clin Neurophysiol.
2006 Apr;23(2):118-21.

10 | Chapter 1
nathal et al., 2005), power ratios (Kurtz et al., 2009; Cloostermans et al., 2011), bi-
spectral index (Sigl and Chamoun, 1994), and le-right symmetry (van Puen et al.,
2004). Despite the variety of complex features available, relatively simple measures
can be used to describemany of the common background properties of an EEG (van
Puen, 2008). Example features are the presence or absence of certain rhythmic
components, power ratios between delta-, theta-, alpha- and beta-bands, and the
power distribution over the scalp. The importance of each background property
will vary based on the reason for recording, but in general, a description of the
background paern is of significant importance to any review.
Inter-ictal epileptiform spike detection
As shown in two detailed reviews by Wilson and Emerson (2002) and Halford
(2009), more than 50 inter-ictal epileptiform spike detection methods have been re-
ported since the 1970’s. Additional methods aer these reviews include (Nonclercq
et al., 2009, 2012; Ji et al., 2011a; Scherg et al., 2012). Promising results have been
achieved if we look at the performance criteria chosen, and indeed, a substantial
amount of research has been done in automated spike detection. Regardless of all
the accomplishments however, very few commercially available systems exist that
implement automated inter-ictal spike detection, and although some show more
success than others, it can be argued that none of these have reached mainstream
acceptance. This shows that although the problem of automated spike detection is
almost as old as digital EEG itself (Gotman and Gloor, 1976), it has still not been
solved, and given that longer recordings show improved chances of finding inter-
ictal events if any exist (Friedman and Hirsch, 2009; Faulkner et al., 2012), auto-
mated detection may be of even more importance today than it was before.
One of the main concerns in automated spike detection, as discussed by Halford
(2009), is the fact that each publication uses its own EEG dataset, thereby making it
diicult and inaccurate to compare the results between various detection methods.
Unless the same dataset is used, one cannot fairly determine the sensitivity or false
detection rate for at least the following two reasons. First, recordings may not
be of the same length or contain the same number of IEDs. Given that it will be
easier to detect many events in a short recording than a small number events in a
long recording, the method’s thresholds and parameters will be chosen in such a
way as to optimize the its false detection rate. Secondly, apart from IEDs, systems
such as these oen mistakenly detect eye blinks and other artifacts as epileptiform
Introduction | 11
discharges. If the number of artifacts vary greatly or their morphology matches
inter-ictal activity more in one dataset than the other, the results will be skewed. To
make valid comparisons, Halford (2009) explains how an evaluation dataset can help
to create more reliable benchmark tests, and in (Halford et al., 2011) and (Halford
et al., 2012) a proposed benchmark dataset is introduced for inter-ictal epileptiform
spike detection in scalp EEGs. An important finding in (Halford et al., 2011) was
the relatively large inter-rater variance (also reported by others, e.g. (Azuma et al.,
2003; Benbadis et al., 2009)), which points to an even greater need to use a single,
commonly accepted dataset for benchmarking purposes.
Based on our literature review together with the reviews from Halford (2009)
andWilson and Emerson (2002), we have concluded that automated spike detection
remains a sought aer goal for clinicians given its potential to reduce the time taken
by visual inspection alone and also to improve inter-rater reliability. Althoughmany
algorithms exist with some havingmore success than others, improvements are still
needed to make them widely accepted in clinical reality.
Our review also pointed out two issues that remain under-emphasized in this
field. These are related to performance criteria and user acceptance. First, the cur-
rent performance measures provide great statistical benchmarks to measure the
accuracy and reliability between systems, but oen neglects the most important
question of all, which is: “How much time and eort will it take the reviewer to
use this feature?”. For example, a system with a lower false detection rate might
lead to less work for the reviewer, but this oen translates to a system with lower
sensitivities given the typical trade-o between sensitivity and false detection rates
for current systems (see chapter 6). In addition, a false detection rate even as low as
0.5 false positives per minute can still require a user to scan through more than one
thousand events in long-term recordings given the design of current methods that
do not assign certainty or priority to each event. Unfortunately, even the global
benchmark dataset described in (Halford et al., 2011) and (Halford et al., 2012) does
not take these important factors into account when benchmarking systems. The
second under-emphasized issue relates to the complexity and ease of use of cur-
rently available systems. Spike detection systems appear complex and diicult to
use by the end user. This creates the problem where a reviewer prefers to perform
a visual review rather than use an automated method which he does not under-
stand or trust. Although there are more reasons why automated spike detection
has not become generally accepted, we conclude that these are two of the main
issues that need to be addressed before automated spike detection will become

12 | Chapter 1
widely accepted, and consequently, our main focus will be placed on them.
Objectives and outline of this thesis
The main objectives of this thesis are to find reliable methods and eicient re-
viewing techniques that will help with the review and interpretation of routine out-
patient EEGs. Our focus is not centered around fundamental neuroscience, but in-
stead on the translational aspect of bringing quantitative EEG analysis closer to
neurologists and clinical neurophysiologists in clinical practice. EEGs are widely
used and have an important role in neurological examinations. Even though visual
analysis has remained best-practice for the beer part of the last century, it requires
extensive training and has limits due to its time-consuming nature and complex-
ity. An expected outcome of this thesis is to introduce new best practices that will
simplify the interpretation of scalp EEG, and thereby improve the consistency and
reliability of clinical reviews.
Although many more properties and features are available than those we focus
on here, this study investigates the the most common properties described in rou-
tine scalp EEGs. Specific aims of this thesis are: (i) finding quantitativemeasures of
the background paern for automated analysis and a simplified representation of
the underlying brain activity, and (ii) detecting inter-ictal epileptiform discharges
and presenting them to the reviewer in a time-eicient manner. Both of these tasks
have high clinical relevance. In addition to extending existing methods, new quan-
titative analysis techniques are developed and tested on clinically relevant data.
Together with this, novel concepts are presented such as system certainty values
and adaptive reviewing algorithms.
An outline of the structure and scope of this thesis is given in Fig. 1.4. Given that
our goals are separated into two categories, background activity and transients,
this thesis follows the same logical structure. First we present all our work in EEG
background analysis (Chapters 2-4), and then proceed to the automated detection
of inter-ictal epileptiform discharges (Chapters 5 and 6). Lastly, Chapter 7 provides
a summary of this thesis and an outlook into the use (and usefulness) of automated
EEG interpretation in clinical practice. A general overview and future perspective
is also presented.

Introduction | 13
Fig. 1.4: Outline and scope of this thesis.
PART I: Automated EEG background analysis
For our goal to automate the interpretation of background activity, the five most
commonly reported properties that we found in the diagnostic reports are cho-
sen. These properties are: i) the posterior dominant rhythm and ii) its reactivity,
iii) anterior-posterior gradients, iv) asymmetries, and v) the presence or absence of
diuse slow-wave activity. The first important property is the posterior dominant
rhythm (PDR) and its peak frequency. Using an adapted version of the method
described by Chiang et al. (2008), a robust and accurate algorithm is developed for
the detection of the alpha rhythm in routine EEGs. Chapter 2 describes how this
method is implemented and tested. Aer obtaining accurate estimates of the PDR,
other properties such as its reactivity can also be found. Chapter 3 presents the
quantitative analysis features we propose tomeasure the fivemain properties of the
EEG background rhythm. Although the accuracy is very important in automated
analysis, a strong focus is also placed on keeping the algorithms simple and open,
so that reviewers can spot the weaknesses of the automated methods instead of
blindly trusting them. For this, simple guidelines and quantitative features are also
included in Chapter 3 to describe how the system evaluates each of the five back-
ground properties in the three most commonly used montages. Aer the methods
were developed for automated background interpretation, we set out to evaluate
14 | Chapter 1
the designed system in clinical practice. Chapter 4 describes how 45 routine EEGs
are sent to nine experienced electroencephalographers in a multi-center study to
evaluate both the accuracy and clinical benefit of using automated interpretation
together with visual analysis. Comparisons between reviewers and the system are
made using a gold standard and inter-rater agreements.
PART II: Inter-ictal epileptiform spike detection
Chapter 5 introduces a new approach to inter-ictal spike detection that makes
use of a large database of IED template waveforms to find epileptiform activity in
the common reference, bi-polar and source montages. This chapter also brings to
life the concept of detection certainty for inter-ictal spike detection, and we show
that by having a certainty value for each detected event, more likely detections can
be separated from events with low likelihoods. In Chapter 6, the use of detection
certainty is fully embraced, and it is shown that with this, an adaptive review pro-
cess can be used to achieve high sensitivities and fast review times simultaneously.

Part I
EEG background paern

Chapter 2
Automated EEG Analysis:
Characterizing the Posterior
Dominant Rhythm
Shaun S. Lodder
Michel J. A. M. van Puen
J Neurosci Meth 2011; 200:86-93

Abstract
Automated interpretation of clinical EEG recordings can improve inter-rater agree-
ment in visual reviews and reduce the time required for interpretation. As a first
step in the design of a fully automated system, a method is presented to charac-
terize the main properties of the posterior dominant rhythm (PDR), in particular
its frequency, symmetry and reactivity. The presented method searches for domi-
nant peaks in the EEG spectra during eyes-closed states with a three-component
curve-fiing technique. From the fied curve, the frequency and amplitude are es-
timated. The symmetry and reactivity is found using the spectral power at the PDR
frequencies. In addition, a certainty value is introduced as a measure of confidence
for each estimate. The method was evaluated on a test set of 1215 clinical EEG
recordings and compared to the PDR frequencies obtained from the visual anal-
ysis, as reported in the diagnostic reports. The calculated PDR frequencies were
within 1.2 Hz of the visual estimates in 92.5% of the cases. Even higher accuracies
were reached when estimates with low certainty values were discarded.
Significance: The presented method quantifies an essential feature of the EEG back-
ground paern with a matched accuracy to visual inspection, making it a feasible
building block to a fully automated interpretation system.

Estimation of the Posterior Dominant Rhythm | 19
2.1 Introduction
The electroencephalogram (EEG) is an important technique for the non-invasive
recording of brain-related activity. It has a high temporal resolution and can capture
both physiological rhythmic activity and other transient processes such as epilep-
tiform discharges. The first human EEG rhythm recorded through the intact scalp
was the alpha rhythm (Berger, 1929), and since then, this and other rhythms have
been studied extensively. The alpha rhythm plays an important part in many diag-
nostic fields ranging from depression (Segrave et al., 2010; Spronk et al., 2011) and
schizophrenia (Knyazeva et al., 2008; Jin et al., 2006) to Alzheimer’s disease (Ishii
et al., 2010; Lee et al., 2010) and visual perception (Babiloni et al., 2006; Sewards and
Sewards, 1999). It is most visible over the posterior regions during a relaxed state of
wakefulness or when the eyes are closed, and its frequency will typically follow a
downward gradient from the posterior to anterior region when measured over the
scalp (Segalowitz et al., 2010). When measured over the posterior region, the alpha
rhythm is also referred to as the posterior dominant rhythm (PDR).
Many aempts have been made to locate and explain the origin of the alpha
rhythm, but much is still unknown about its generation and what influence it has
on the larger scope of brain function. Instead of having a single generator, the
current view is that it is generated by nonlinear interactions of pyramidal cells and
modulated by thalamic input and other complex cortico-cortical processes (Steriade
et al., 1990; Silva, 1991; Stam et al., 1999; Naruse et al., 2010; Hughes and Crunelli,
2005; Nunez and Ramesh, 2005). The peak frequency for young children typically
resides around 3-4 Hz and gradually increases with age until reaching a maturation
point at around 8-13 Hz when adolescence or young adulthood is reached (van der
Stelt, 2008; Marcuse et al., 2008; Segalowitz et al., 2010; Chiang et al., 2011). In
adults, a small decrease in frequency with ageing can be observed at a consider-
ably slower rate. The alpha rhythm also shows other important characteristics. It
is suppressed when the eyes are opened and becomes again aenuated when the
eyes are closed. In some individuals only one dominant peak is visible, whereas for
others two distinct peaks can be observed. The reason for spliing is not yet clear,
but (Robinson et al., 2001) suggested that nonuniformities in corticothalamic time
delays could result in the observed spliing of alpha peaks in some subjects and
showed that the mechanism of alpha spliing may be via mode coupling induced
by spatial nonuniformities (Robinson et al., 2003).
The alpha rhythm in general has mostly been studied in subject groups of 15

20 | Chapter 2
to 100 individuals and only a small number of studies have used datasets contain-
ing one thousand individuals or more (Segalowitz et al., 2010; van der Stelt, 2008;
Chiang et al., 2011). In some cases, obtaining characteristics would require the re-
searcher to either read each individual patient report, or to visually inspect every
EEG. Aurlien et al. (1999, 2004) suggested the use of database structures which are
compatible with queries that extract patient information from reports. This ap-
proach seems aractive and should be considered when new EEG databases are
developed. However, it is not implemented in most existing systems and a descrip-
tion of the PDR for these would require an alternative approach.
In this paper we focus on the characterization of the PDR and we present a
method to identify it in EEGs using an automated technique. Dominant frequencies
are located in the spectra with a curve-fiing approach and the PDR components
are calculated from them accordingly. Using the PDR frequencies, a measure for
symmetry and reactivity is also obtained. To provide a confidence score to each
characterized rhythm, a certainty value is found and as shown in the results, it
makes a powerful contribution to the automated interpretation method.
2.2 Data and Methods
2.2.1 EEG Recordings
EEG recordings were obtained from the digital EEG database of the department
of Clinical Neurophysiology of the Medisch Spectrum Twente (MST) hospital in
the Netherlands. All EEGs were recorded as part of the diagnostic process and for
most of them a standard 20 minute protocol was used. The protocol included hy-
perventilation, photic stimulation and eyes-closed states. Standard EEG caps were
used with nineteen Ag-AgCl electrodes placed according to the international 10-20
system. Electrode impedances were kept below 5 kΩ to reduce polarization eects,
with sample rates of 250 Hz using a common reference (Brainlab, OSG BVBA).
At the time of this study, the MST database contained EEG records obtained over
a period of five years. Only recordings containing annotated events were used and
EEGs were only selected if they were categorized as normal brain activity. This was
determined by the diagnostic reports from board certified neurologists. The final
set of evaluation data consisted of 1215 individuals with ages ranging from a few
months to 96 years and contained 611 males and 604 females.

Estimation of the Posterior Dominant Rhythm | 21
2.2.2 Estimation of the PDR Frequency
Eyes-closed segments were extracted from the EEGs to estimate the frequency
of the PDR. The segments were limited to two minutes in length and those that oc-
curred during hyperventilation or photic stimulation were ignored. The remaining
segments were split into epochs of five seconds each, and to avoid high-amplitude
movement artifacts from interfering, epochs were discarded if they contained val-
ues larger than five times the standard deviation of the whole segment. A spectrum
was calculated for the remaining set of epochs and the dominant frequency compo-
nents were located. The component parameters of each epochwere pooled together
and clustered, and based on the size and properties of the clusters, estimates for the
PDR frequencies were obtained and a confidence value was computed for each esti-
mate. A description for each step of the method is provided below. The description
is divided into three parts: dominant peak location, peak value correction, and PDR
estimation.
2.2.2.1 Dominant Peak Location
To find the dominant peak components in each epoch, a normalized spectral
density Pnorm was calculated with theWelch method using a sliding window of two
seconds and an overlap of 75%. A common reference montage was used and only
the epochs from channels O1 and O2 (occipital region) were used. Each window
was zero padded to a length of 8 seconds giving Pnorm a frequency resolution of
0.125 Hz. The spectrum was log transformed and bounded to the frequency range
[fmin, fmax] = [3, 18] Hz:
Plog(f) = log (Pnorm(f)) , f ∈ [fmin, fmax] . (2.1)
As discussed in Section 2.1, the PDR is known to have either one or two spectral
peaks. Based on this, the log spectrum was assumed to consist of two peak com-
ponents Ppk1 and Ppk2 and some background processes Pbg. Using the log spectra,
the Levenberg-Marquardt algorithm (Levenberg, 1944) was used to approximate a
22 | Chapter 2
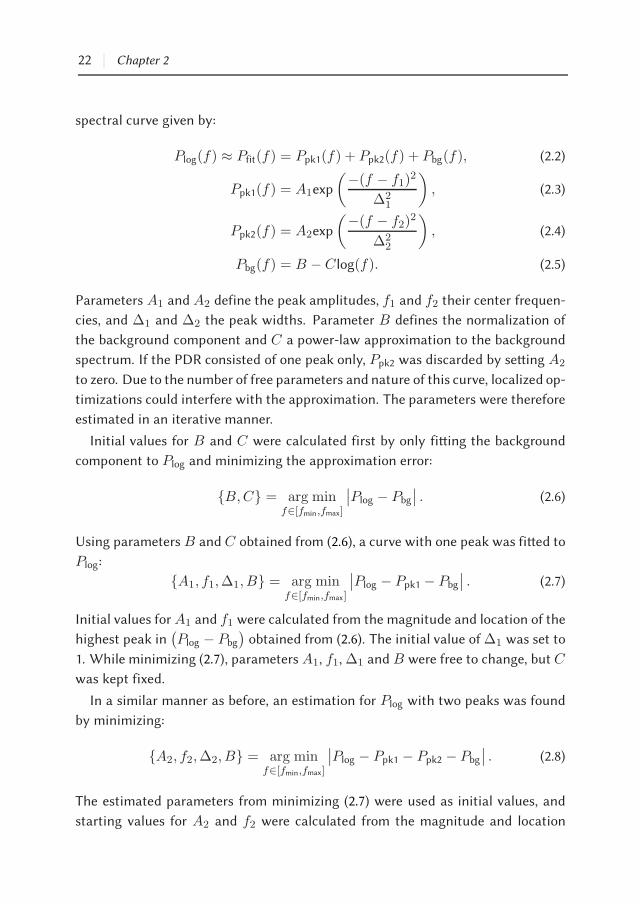
spectral curve given by:
Plog(f) ≈ Pfit(f) = Ppk1(f) + Ppk2(f) + Pbg(f), (2.2)
Ppk1(f) = A1exp
(
−(f − f1)2
∆21
)
, (2.3)
Ppk2(f) = A2exp
(
−(f − f2)2
∆22
)
, (2.4)
Pbg(f) = B − C log(f). (2.5)
Parameters A1 and A2 define the peak amplitudes, f1 and f2 their center frequen-
cies, and ∆1 and ∆2 the peak widths. Parameter B defines the normalization of
the background component and C a power-law approximation to the background
spectrum. If the PDR consisted of one peak only, Ppk2 was discarded by seing A2
to zero. Due to the number of free parameters and nature of this curve, localized op-
timizations could interfere with the approximation. The parameters were therefore
estimated in an iterative manner.
Initial values for B and C were calculated first by only fiing the background
component to Plog and minimizing the approximation error:
B,C = arg minf∈[fmin,fmax]
∣
∣Plog − Pbg
∣
∣ . (2.6)
Using parameters B and C obtained from (2.6), a curve with one peak was fied to
Plog:
A1, f1,∆1, B = arg minf∈[fmin,fmax]
∣
∣Plog − Ppk1 − Pbg
∣
∣ . (2.7)
Initial values forA1 and f1 were calculated from the magnitude and location of the
highest peak in(
Plog − Pbg
)
obtained from (2.6). The initial value of∆1 was set to
1. While minimizing (2.7), parameters A1, f1,∆1 and B were free to change, but C
was kept fixed.
In a similar manner as before, an estimation for Plog with two peaks was found
by minimizing:
A2, f2,∆2, B = arg minf∈[fmin,fmax]
∣
∣Plog − Ppk1 − Ppk2 − Pbg
∣
∣ . (2.8)
The estimated parameters from minimizing (2.7) were used as initial values, and
starting values for A2 and f2 were calculated from the magnitude and location

Estimation of the Posterior Dominant Rhythm | 23
of the highest peak in(
Plog − Ppk1 − Pbg
)
. The starting value of ∆2 was set to
1, parameters A2, f2, ∆2 and B were allowed to change, and A1, f1, ∆1 and C
remained fixed.
Values for all the parameters were obtained aer approximating the spectrum
in (2.8). However, an additional approximation was made where no parameters
were kept fixed:
A1, A2, f1, f2,∆1,∆2, B,C = arg minf∈[fmin,fmax]
∣
∣Plog − Ppk1 − Ppk2 − Pbg
∣
∣ . (2.9)
If the approximation error with the new parameter set was smaller than with the
previous parameters, the new set was used instead.
To ensure an accurate approximation of Plog with relevant parameters, a num-
ber of evaluations were performed during the iterative process. Firstly, a ratio was
calculated between the spectral power in Ppk1 and Plog aer one peak was fied. If
Ppk1 contributed to less than 50% of the power inPlog, the spectrumwas assumed to
be without a dominant frequency component and the epoch was rejected. Also, if
f1 was not in the range [fmin, fmax], or∆1 exceeded a threshold TH∆, i.e. the peak
power was not localized, the epoch was rejected. Secondly, when Plog was approx-
imated with two peaks and∆2 > TH∆ or f2 was not in the range [fmin, fmax], the
second peak was discarded by seing A2 = 0. The threshold TH∆ was arbitrarily
chosen as 2.5.
2.2.2.2 Peak Value Correction
Aer approximating a curve and obtaining parameters for each of the peaks in
the epochs, an intermediate step was performed to improve the location and am-
plitude of the detected frequency components. It was found that the iterative ap-
proach would robustly locate the dominant frequency components, but their exact
amplitudes and frequencies were oen inaccurate (see Fig. 2.1(a)). A reasonably
simple but eective solution was to search for the peak in Plog around the area of
the estimated frequencies. By starting at the estimated frequencies f1 and f2, the
peak estimates were shied towards the positive gradient on Plog until a local max-
imum was found. If two peaks were present and both were updated to the same
point, one peak was discarded.
Aer updating the peak parameters, the approximated spectrum was converted
from the log domain back to the original domain and the local minima were found
24 | Chapter 2
0 2 4 6 8 10 12 14 16 18f (H z )
Pn
orm
&ex
p(P
fit)
P no rm
exp(P fit )
f1 a nd f2
(a)
0 2 4 6 8 10 12 14 16 18f (H z )
Pn
orm
(f
)
f 6∈ R pe ak s
f ∈ R pe ak s
(b)
0 5 10 15 20
c= 0.26
f (Hz)
Pnorm
(f)
(c)
0 5 10 15 20
c= 0.72
f (Hz)
Pnorm
(f)
(d)
0 5 10 15 20
c= 0.92
f (Hz)
Pnorm
(f)
(e)
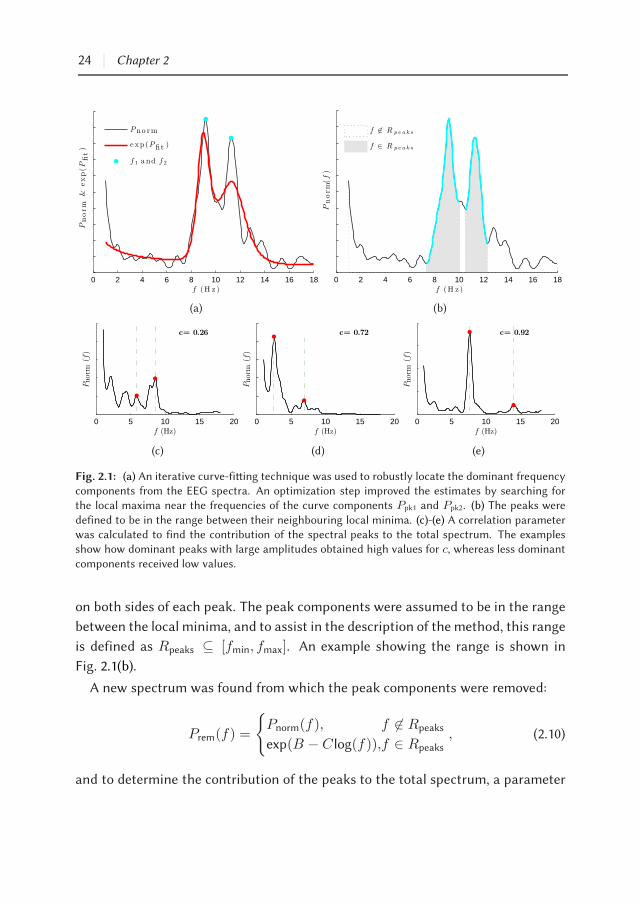
Fig. 2.1: (a) An iterative curve-fiing technique was used to robustly locate the dominant frequencycomponents from the EEG spectra. An optimization step improved the estimates by searching forthe local maxima near the frequencies of the curve components Ppk1 and Ppk2. (b) The peaks were
defined to be in the range between their neighbouring local minima. (c)-(e) A correlation parameterwas calculated to find the contribution of the spectral peaks to the total spectrum. The examplesshow how dominant peaks with large amplitudes obtained high values for c, whereas less dominant
components received low values.
on both sides of each peak. The peak components were assumed to be in the range
between the local minima, and to assist in the description of the method, this range
is defined as Rpeaks ⊆ [fmin, fmax]. An example showing the range is shown in
Fig. 2.1(b).
A new spectrum was found from which the peak components were removed:
Prem(f) =
Pnorm(f), f 6∈ Rpeaks
exp(B − C log(f)),f ∈ Rpeaks, (2.10)
and to determine the contribution of the peaks to the total spectrum, a parameter

Estimation of the Posterior Dominant Rhythm | 25
was calculated based on the correlation between Prem and Pnorm:
c = 1− corr(Pnorm, Prem), (2.11)
where corr(Pnorm, Prem) finds the correlation coeicient between Pnorm and Prem. If
Pnorm was noisy or more peak components were present with relatively high peaks,
the correlation parameter was low. However, when the peaks contributed to most
of the power in Plog, a high value for c was obtained. Fig. 2.1(c)-(e) shows examples
for dierent spectra.
2.2.2.3 PDR Estimation
Aer locating the dominant components in each epoch, the peaks were pooled
together and sorted according to frequency. Clusters were formed by grouping
peaks together if the frequency dierence between them was less than 0.2 Hz, and
clusters consisting of one peak or smaller in size than 75% of the largest cluster
were discarded. The remaining set of clusters was defined as Kjj∈1,..N, where
Kj = Ai, fi, cii∈1,..,Mjdenoted the amplitudes, frequencies, and the correla-
tion values of the Mj peaks in the cluster.
The PDRwas assumed to be the largest two clusters in the set and estimates were
calculated from them accordingly. If only one cluster was available, the EEG was
assumed to contain only one PDR. A weighted average was calculated to obtain the
PDR frequency fPDR and amplitude APDR from a given cluster according to:
APDR(j) =
M∑
i
Aiωi, (2.12)
fPDR(j) =
M∑
i
fiωi, (2.13)
ωi = ci/
M∑
k
ck. (2.14)
As shown in (2.14), the correlation values were used as weights. They were also
combined with the size of the cluster to calculate a certainty measure for the PDR

26 | Chapter 2
estimate:
certainty(j) = erf(ωM)M∑
i
ciM
, (2.15)
By design, the certainty is a normalized value between zero and one. Low correla-
tion values reflect less dominant components which in turn lead to lower certainty
values. Smaller clusters are more likely to produce erroneous estimates and the cer-
tainty value is therefore also dependent on the cluster size. The parameter ω serves
as a weight factor to balance the influence between the correlation values and the
cluster size component. Through a trial-and-error approach, a value of ω = 0.005
was found to be suitable.
Aer calculating the PDR frequencies and amplitudes for a given EEG, two addi-
tional steps were performed: Firstly, if two rhythms were detected by the method
and only one was in the alpha frequency range (8-12 Hz), the outlying rhythm was
discarded based on the assumption that it was not part of the PDR. Secondly, if two
rhythms were found and both resided outside of the alpha range, the rhythm with
the largest amplitude was identified as the PDR and the other was discarded.
2.2.3 Symmetry and Reactivity
The symmetry and reactivity was calculated by evaluating the spectral power
around the calculated PDR frequencies. For reactivity, two-minute segments of
EEG were extracted for both the eyes-closed and eyes-open state over channels O1
and O2. A spectrum was calculated for each using Welch’s method with a window
length of 10 seconds and no overlap. The mean power was calculated in a 0.2 Hz fre-
quency band around the PDR frequencies, and using this the reactivity was defined
as:
reactivity =PEC
PEO + PEC, (2.16)
where PEC is the mean power for the eyes-closed state and PEO the mean power for
the eyes-open state. The reactivity measure in (2.16) is a normalized value between
zero and one. Large suppression of the PDR with eyes opening will result in high
reactivity values, whereas smaller changes will indicate lower reactivity.
A measure for symmetry was found by comparing the spectral power between
the le and right occipital regions. Aswith the reactivity, themean power in a 0.2 Hz
band around the PDR frequencies is calculated. However, this time the mean power

Estimation of the Posterior Dominant Rhythm | 27
in channels O1 andO2 are not combined, but calculated separately. Using themean
power from the le- and right occipital regions, the symmetry was calculated as:
symmetry =Pright − Ple
Pright + Ple, (2.17)
where Ple and Pright is the mean power calculated for channels O1 and O2 respec-
tively. The symmetry measure is normalized between -1 and 1. Negative values
point to larger PDR amplitudes over the le occipital region and positive values to
larger amplitudes over the right.
2.2.4 Computed Frequencies vs. Visual Estimates
To evaluate the accuracy of the characterization method, visual estimates of the
PDR frequencies were taken from diagnostic reports of the EEGs. One PDR fre-
quency was given in 1089 (89.63%) of the reports and two in 114 (9.38%). A PDR
estimate was not given in 12 (0.99%) of the EEGs, and in many cases, a second
lower peak was also ignored. For some EEGs, the PDR was also not reported at
a specific frequency, but instead given as a frequency range due to some observer
uncertainty or non-stationarity in the data. Frequency ranges were reported for
640 (55.2%) of the EEGs, and for these the mean width of the visual estimate was
chosen as the frequency in the center of the range. The mean width of the reported
ranges was 1.28 Hz (SD 0.91 Hz).
To measure the accuracy between the calculated PDR frequencies and the visual
estimates, frequency dierences between the two for each EEG were calculated
according to:
fdip = fobsp −
fcpu
p, (2.18)
where fcpu is the calculated PDR frequency, fobs is the visual estimate, and p defines
the index of the corresponding EEG. If more than one peak was observed with vi-
sual estimation, the dierence between fcpu and the nearest fobs was found. If two
PDR frequencies were characterized by the method, a frequency dierence for both
estimates was found using the nearest visual estimate. The method’s accuracy was
defined as the percentage of estimates where fdi had a smaller dierence than a
given tolerance. Three tolerance values were evaluated: 0.6 Hz, 1.2 Hz and 1.8 Hz.

28 | Chapter 2
2.3 Results
Using the described method, PDR estimates were found for 1160 of the 1215
(95.5%) EEGs. In the remaining 4.5%, there were either insuicient artifact-free
epochs to estimate from, or only wide-band spectral components were present and
no dominant peaks. During estimation, 5.5% of the epochs in all EEGs were rejected
for having high-amplitude artifacts, and a further 23.9% were discarded aer no
dominant peaks were found. Two PDR frequencies were identified in only 20 (1.6%)
of the EEGs. Fig. 2.2 shows the number of EEGs grouped by age together with the
number in which the PDR was identified. Most of the rejected EEGs (78.2%) were
from the age range between 0 and 5 years.
Figures 2.3(a) and 2.3(b) show the distribution of the observed and calculated fre-
quencies over age respectively. Although more points are present in Fig. 2.3(a) than
in Fig. 2.3(b) (see histogram in Fig. 2.2), many are ploed on top of each other due
to a lower frequency resolution (0.5 Hz). A smoothed histogram (blue) was added
to indicate the density of the points. The common trend of the PDR frequency over
age was calculated by fiing a curve to each set of peaks with a minimum mean
squares error fit. A 7-th degree polynomial provided a suicient fit, and the ap-
proximated trends are shown in red in Fig. 2.3(a) and Fig. 2.3(b) respectively. The
correlation coeicient between the two polynomials from 0 to 96 years was 0.994,
showing an almost identical trend of the frequencies over age. Fewer outliers are
seen in Fig. 2.3(b) compared to Fig. 2.3(a).
A histogram of the frequency dierences between visual estimates and charac-
terized PDR frequencies is shown in Fig. 2.4(a). Three tolerance values were eval-
uated: 0.6 Hz, 1.2 Hz and 1.8 Hz, and accuracies of 75.9%, 92.5% and 96.0% were
obtained for them respectively. The mean frequency dierence between visual es-
timates and calculated frequencies was 0.52 Hz. A scaer plot of
fobs, fcpu
for
all estimate pairs is shown in Fig. 2.4(b) and a smoothed histogram (blue) is added
to indicate the density of the points. The relationship between observed and com-
puterized estimates was calculated as fobs=1.00fcpu (minimum mean square error
approximation, fixed oset through zero) with a residual error (root mean square)
of 0.96. The correlation between observed and computerized estimates was 0.79.
Fig. 2.4(c) shows the frequency dierences of each
fobs, fcpu
pair ploed against
the certainty of the characterized rhythm. The plot shows clearly that estimates
with high certainty values were mostly accurate, whereas inaccurate estimates re-
ceived certainties below 0.02. To highlight this, estimates with certainties below 0.02

Estimation of the Posterior Dominant Rhythm | 29
0
25
50
75
100
125
150
age (years)
0−5
5−10
10−1
5
15−2
0
20−2
5
25−3
0
30−3
5
35−4
0
40−4
5
45−5
0
50−5
5
55−6
0
60−6
5
65−7
0
70−7
5
75−8
0
80−8
5
85−9
0
90−9
5
95−1
00
EEGs availableEEGs characterized
Fig. 2.2: Age distribution of EEGs in the evaluation set. The total number of EEGs is represented inblack and the number for which estimates were found in blue. Most of the rejected EEGs were from
subjects below 3 years lacking eyes-closed epochs without movement artifacts.
0 10 20 30 40 50 60 70 80 900
2
4
6
8
10
12
14
16
18
age (years)
f (H
z)
(a)
0 10 20 30 40 50 60 70 80 900
2
4
6
8
10
12
14
16
18
age (years)
f (H
z)
(b)
Fig. 2.3: (a) Visual estimates (fobs) and (b) calculated frequencies (fcpu) of the PDR in all EEGs over
age. The density of the points is shown in blue and a line that approximates the trend over age isploed in red. The correlation coeicient between the two lines was 0.994, showing that the calculatedfrequencies and visual estimates had an almost identical trend over age.
were ploed as red crosses instead of black dots.
Aer discarding the estimates with low certainty values from the evaluation set,
the accuracy of the remaining set increased significantly. Table 2.1 shows the per-
centage of estimates which were within a tolerable range of the visual estimates.
The characterization accuracy was evaluated using the tolerance values of 0.6 Hz,
1.2 Hz and 1.8 Hz. The first column of Table 2.1 shows the exclusion criteria of the

30 | Chapter 2
Table 2.1: Accuracy of the presented method using three tolerance ranges and discarding estimatesbelow 3 dierent certainty thresholds. Accuracy was defined as the percentage of estimates wherefdi = fobs − fcpu was smaller than the tolerance indicated.
|fdi| < 0.6 Hz |fdi| < 1.2 Hz |fdi| < 1.8 Hz Discarded
certainty > 0.0 75.9% 92.5% 96.0% 0%
certainty > 0.02 80.4% 96.0% 98.4% 13.1%
certainty > 0.25 83.9% 98.1% 99.4% 41.0%
Table 2.2: Summary of the characterized PDR properties grouped by age. Values as mean and
standard deviation in each group.
Age Frequency (Hz) Amplitude (µV) Symmetry Reactivity
0-5 yrs 7.14 ± 2.35 11.46 ± 6.36 0.02 ± 0.33 0.77 ± 0.17
5-10 yrs 8.54 ± 1.17 11.45 ± 4.41 -0.08 ± 0.28 0.85 ± 0.14
10-20 yrs 9.98 ± 1.13 8.73 ± 4.34 -0.03 ± 0.25 0.87 ± 0.12
20-40 yrs 10.21 ± 1.02 5.42 ± 2.99 -0.07 ± 0.23 0.85 ± 0.13
40-60 yrs 9.95 ± 1.20 5.13 ± 3.21 -0.04 ± 0.25 0.85 ± 0.15
60-80 yrs 9.37 ± 1.10 4.88 ± 2.70 -0.03 ± 0.23 0.82 ± 0.17
>80 yrs 8.68 ± 1.10 5.03 ± 2.92 -0.07 ± 0.26 0.77 ± 0.20
evaluation set and the last column the number of estimates which were excluded.
In the first row, none of the characterized rhythms were discarded and accuracies
of 75.9%, 92.5% and 96.0% were obtained. The second row shows how by discarding
estimates with very low certainty values, a substantial increase in accuracy (80.4%,
96.0% and 98.4%) can be obtained while still keeping the exclusion rate low (13.1%).
The last row shows that even higher accuracies can be reached (83.9%, 98.1% and
99.4%), but at the price of higher exclusion rates (41.0%).
The key results from evaluating the frequency, amplitude, symmetry and reac-
tivity of the estimated posterior dominant rhythms is summarized in Table 2.2. The
EEGs were grouped in suitable age ranges and mean and standard deviation val-
ues were found for each property accordingly. As noted before in Fig. 2.3(a) and
Fig. 2.3(b), the PDR frequency is lower in younger subjects and increases over age
until adulthood is reached. The PDR slows down from the age of 20 years onwards,
but at a much slower rate. Higher peak amplitudes are also observed for younger
individuals.
The symmetry values show no significant change during ageing and the PDR
appears to be fairly symmetrical between the two hemispheres. Reactivity of the

Estimation of the Posterior Dominant Rhythm | 31
−10 −8 −6 −4 −2 0 2 4 6 8 100
50
100
150
200
frequency difference: fobs-fcpu (Hz)
num
ber
ofpea
ks
75.9% within 0.6 Hz of fobs
92.5% within 1.2 Hz of fobs
96.0% within 1.8 Hz of fobs
(a)
2 4 6 8 10 12 14 16 182
4
6
8
10
12
14
16
18
fobv = 1.00fcpu (RMS error: 0.96)
fobv (Hz)
f cpu
(Hz)
1180 estimates (α1 & α2)
r=0.79
(b)
−10 −5 0 5 10
0
0.1
0.2
0.3
0.4
0.5
0.6
0.7
0.8
0.9
1
fobs - fcpu (Hz)
cert
ain
ty
(c)
Fig. 2.4: (a) A histogram showing the frequency dierence between visual estimates and calculatedfrequencies. To view the method’s accuracy, three tolerance values were chosen and the number of
estimates were counted where frequency dierences were smaller than the tolerance values. Bound-aries of the tolerances are shown as doed lines and the accuracies are given in the figure legend.(b) A scaer plot showing fobs vs. fcpu for all estimate pairs. The relationship between fobs and fcpuis shown in red (line oset through zero). (c) The frequency dierence between calculated and visualestimates against the certainty of the calculated rhythm. PDR estimates with certainties below 0.02are shown as red crosses. Most outliers had very low certainty values.
PDR follows a similar trend over age as the change in frequency. The reactivity
increases with age until adulthood is reached, aer which it shows a slow decrease
from the age of 20 years onwards. Note that for older age groups the variance also
increases, indicating that the decrease in reactivity might be accounted for by only
some individuals and not the entire group.

32 | Chapter 2
2.4 Discussion
antitative analysis of EEG finds increasing applications in clinical medicine
(Cloostermans et al., 2011; Arciniegas, 2011; Korotchikova et al., 2011; van Puen
et al., 2004; van Puen, 2008). Here we introduce amethod to automatically charac-
terize the frequency, amplitude, symmetry and reactivity of the PDR together with
an accompanying certainty value. With the described method, we were able to es-
timate the PDR frequency within 1.2 Hz of the visual estimates in more than 92.5%
of the cases.
In our approach, we use a curve-fiing technique to locate the dominant peaks in
the spectrum. By describing the various spectral components with a curve, we were
able to find more reliable peak estimates than simply defining the highest peaks in
the spectra. This is mainly due to the relatively large variance present in spectral
estimates from short time-series, as discussed in e.g. (Broersen, 2006; Thakor and
Tong, 2004).
The frequency range of interest was chosen from 3-18 Hz to account for the lower
PDR frequencies of younger subjects. Most of the rejected EEGs were from subjects
aged between 0 and 5 years (Fig. 2.2), and with further investigation, it was found
that in this group the most subjects below 3 years had none or only a few eyes-
closed epochs without artifacts. Aer discarding the contaminated epochs, too
few remained to estimate a reliable PDR. Also, no dominant frequency components
were found in 23.9% of the epochs over all EEGs. However, given the condition
that the first dominant peak had to contain 50% of the total power in the spectrum
(Section 2.2.2.1), many may have been overseen due to lower amplitudes.
The symmetry and reactivity measures were obtained by evaluating the spectral
power at the calculated PDR frequencies. Symmetry and reactivity are highly rele-
vant features in clinical EEG interpretation as theymay point to focal ischaemia (van
Puen and Tavy, 2004) or neurodegenerative disorders (Babiloni et al., 2010). Also,
similar to other diagnostics, the certainty value we added assists the clinician in
the relative confidence of particular findings. The certainty value was calculated
by evaluating dierent aspects of the method during the characterization process,
and as shown in Fig. 2.4(c), erroneous frequency estimates were mostly character-
ized with low certainty scores. As further shown in Table 2.1, the accuracy of the
system was improved by ∼5% when PDR estimates with low certainties were dis-
carded, leaving PDR frequencies of 98.1% of the remaining estimates within 1.2 Hz
of the visual estimates. Althoughmost of the erroneous estimates had low certainty
Estimation of the Posterior Dominant Rhythm | 33
values, many accurate estimates were also assigned low certainties. This occurred
when EEGs had a small number of artifact-free epochs available. Fewer epochs lead
to fewer spectra from which the PDR was estimated, which resulted in less reliable
estimates and consequently lower certainty values.
It should be noted that the PDR amplitudes do not reflect the true peak ampli-
tude of the posterior dominant rhythm. The estimate is based on the spectra of
the EEG which was found using Welch’s method with a discrete Fourier transform.
As a result of using discrete methods, spectral leakage distorts the measurement
in such a way that energy from a given frequency component spreads over adja-
cent frequency bins. The spectral amplitude is therefore lower than the true peak
amplitude.
Although not the primary objective of this study, we found that the peak alpha
frequency typically started at 4.5 Hz and increased with age until maturing around
the age of 16 years (Fig. 2.3). A slow decline in frequency was observed from 20
years onwards. This confirms earlier reports on the age dependency of the alpha
rhythm as discussed in (van der Stelt, 2008; Marcuse et al., 2008; Segalowitz et al.,
2010; Aurlien et al., 2004). The mean PDR frequency over age was also reported
by (Aurlien et al., 2004). The similarity of the age-dependency of the PDR is striking,
as the dierences between their findings (Fig. 2(A) in (Aurlien et al., 2004)) and ours
(Fig. 2.3) at all ages are within∼0.25 Hz. In the same study, Aurlien et al. (2004) also
reported on inter-observer reliability, showing mean frequency dierences of up to
∼0.9 Hz between visual estimates. This is similar to a mean frequency dierence
of 0.5 Hz between the visual estimates and calculated PDR frequencies in our study.
The PDR is focussed on the alpha rhythm over the posterior region, and in (Chi-
ang et al., 2008, 2011) a similar technique to characterize the alpha rhythm was
explored. In (Chiang et al., 2008) the authors tested their method on 100 subjects
(49 females, 51 males) and classified each EEG in one of three categories: (i) no al-
pha rhythm detected (4 EEGs), (ii) a single alpha rhythm found (48 EEGs) and two
alpha rhythm components found (48 EEGs). A comparison to visual estimates was
however not made. A follow-up study investigated the age- and sex-related dier-
ences of alpha rhythms over a large (1498 subjects) healthy group (Chiang et al.,
2011). Similar to our findings, they found that alpha peak frequencies increase with
age until adolescence and then slowly declines thereaer. Another finding that cor-
relates with the results shown in Table 2.2 is that the alpha rhythm power declines
with age.
The presence of multiple alpha peaks is strongly supported in the literature (Ste-

34 | Chapter 2
riade et al., 1990; Lopes da Silva et al., 1997; Naruse et al., 2010; Klimesch, 1997;
Robinson et al., 2003) and possible reasons for this are discussed in Section 2.1.
In (Chiang et al., 2008, 2011), two components were found in approximately half
of the subjects, although it was not investigated if any of the detected peaks be-
longed to other rhythms than the alpha rhythm. Our results show that two PDR
components were found in 1.6% of the EEGs. Given however that our method will
discard the second rhythm if it falls outside of the range 8-12 Hz, the results do
not reflect an accurate number of EEGs with two PDR components. The reason for
discarding these peaks was to increase the specificity of our method by minimizing
the detection of rhythms that did not belong to the PDR.
Other approaches to quantify the alpha rhythm together with background EEG
paerns include model-based filters (Kemp and Blom, 1981), wavelets and multi-
tapers (van Vugt et al., 2007), fuzzy reasoning (Huupponen et al., 2002; Herrmann
et al., 2001), non-parametric methods (Brodsky et al., 1999), and multi-dimensional
decompositions (Orekhova et al., 2011). Most of these studies only focussed on find-
ing the onset and duration of the rhythm and not on locating the peak frequencies.
Our approach provides a more complete characterization of the PDR. With minor
modifications, the method can also be extended to locate dominant rhythms over
other electrode positions, for example the Mu rhythm over the motor cortex.
None of the studies using automated methods performed a formal comparison
between computed and visual estimates. Accuracies in Table 2.1 of up to 99% shows
that the described method is matched to visual estimation, making it a feasible
contribution to automated EEG interpretation.
In summary, a robust and automaticmethod is presented to characterize the pos-
terior dominant rhythm in human EEGs. Apart from removing the subjectivity of
visual estimation, it also brings forward an important building block for automated
EEG interpretation.

Chapter 3
antification of the adult
EEG background paern
Shaun S. Lodder
Michel J. A. M. van Puen
Clin Neurophysiol 2013; 124:228-237

Abstract
Visual interpretation of EEG is time-consuming and not always consistent between
reviewers. Our objective was to improve this by introducing guidelines and algo-
rithms to quantify various properties, focussing on the background paern in adult
EEGs. Five common properties were evaluated: i) alpha rhythm frequency; ii) re-
activity; iii) anterio-posterior gradients; iv) asymmetries and v) diuse slow-wave
activity. A formal description was found for each together with a guideline and pro-
posed quantitative algorithm. All five features were automatically extracted from
routine EEG recordings. Modified time-frequency plots were calculated to summa-
rize spectral and spatial characteristics. Visual analysis scores were obtained from
diagnostic reports. Automated feature extraction was applied to 384 routine EEGs.
Inter-rater agreement was calculated between visual and quantitative analysis us-
ing Fleiss’ kappa: κ = i) 0.60; ii) 0.35; iii) 0.19; iv) 0.12; v) 0.76. The method is
further illustrated with three representative examples of automated reports. Au-
tomated feature extraction of several background EEG properties seems feasible.
Inter-rater agreement diered between various features, ranging from slight to sub-
stantial. This may be related to the nature of various guidelines and inconsistencies
in visual interpretation.
Significance: Formal descriptions, standardized terminology, and quantitative anal-
ysis may help to improve inter-rater reliability in reporting of the EEG background
paern and contribute to more eicient and consistent interpretations.

antification of the adult EEG background paern | 37
3.1 Introduction
For almost a century the electroencephalogram (EEG) has been an important
and invaluable technique in clinical neurology. Applications include the dierential
diagnosis of developmental disorders, sleep analysis, and the diagnostic process in
epilepsy. Despite tremendous advances in computing power and the availability of
digital recordings, the gold standard for the interpretation is still visual analysis.
Perhaps the very large variability in EEG paerns, both in physiological and in
pathological conditions, limit eorts to automate the diagnostic process. At the
same time, the human brain is an expert in visual analysis, including the rejection
of artefacts and detection of transients. The processes involved are indeed not trivial
to replace by computer analysis (Halford, 2009).
In general, EEG analysis in clinical neurology consists of two parts: analysis of the
background paern and detection of transients (Schomer and Lopes da Silva, 2010;
van Puen, 2009). The background paern can be defined as the mean statistical
characteristics of the EEG, and includes features such as the posterior dominant
rhythm, reactivity, frequency distribution over the scalp, and the presence or ab-
sence of asymmetries. Transients refer to relatively rare events, and include both
physiological and pathological waveforms, such as lambda waves, wicket waves or
spike-wave discharges.
An accurate interpretation of both the background paern and the transients is of
high importance for correct diagnostics. Unfortunately, various studies have shown
that a large inter- and intra-observer variability still exists between reviewers. De-
pending on the reported feature or decision outcome, the inter-rater agreement
(Kappa coeicients) range from slight (0.09) to substantial (0.94) (Haut et al., 2002;
Benbadis et al., 2009; Gerber et al., 2008; Azuma et al., 2003). One of the main rea-
sons for this is a lack of consistency in describing the properties accurately. Azuma
et al. (2003) showed that by conforming to a set of general guidelines, inter-rater
variability could be reduced significantly (Azuma et al., 2003). For many of the EEG
properties mentioned however, formal guidelines do not exist or fall short of being
used. In addition to this, EEG reports lack consistent terminology to describe the
severity of an abnormality.
Apart from improving inter-rater reliability in reports, possibilities exist with
computational methods to increase reviewer eiciency and to find characteristics
that are hard or even impossible to detect by visual analysis alone. Substantial
progress has beenmade with quantitative methods in the fields of seizure and spike
38 | Chapter 3
detection (van Puen, 2003; van Puen et al., 2005; Kurtz et al., 2009; Halford, 2009;
Wilson and Emerson, 2002), but lile exists for describing the EEG background pat-
tern quantitatively. Given that background properties provide essential information
to the clinician, the use of quantitative tools may be advantageous in assisting with
the analysis.
In this paper, we address two issues related to the reviewing of EEGs in a clinical
environment. First, we propose guidelines for describing background properties to
improve consistency and reduce inter-rater variability. Secondly, by building meth-
ods around these guidelines, we introduce quantitative algorithms to measure five
of the most commonly reported background properties. The guidelines are kept
simple (but feasible) to maximize consensus between reviewers, and the quantita-
tive values are designed intuitively to allow for interpretation in a useful manner.
We evaluate our work by comparing reports generated with the quantitative tech-
niques against EEG reports from visual interpretation, and also show two examples
where quantitative analysis is used to identify abnormal background paerns.
3.2 Methods
3.2.1 Data
The dataset for this study was obtained from the department of Clinical Neu-
rophysiology of the Medisch Spectrum Twente (MST). The recordings were made
over a period of five years, and for each EEG a standard 20-30 minute recording pro-
tocol was used. Electrode impedances were kept below 5 kΩ to reduce polarization
eects, and standard EEG caps were used with nineteen Ag-AgCl electrodes placed
according to the international 10-20 system. The recordings were made at a sam-
ple rate of 250 Hz using a common reference (Brainlab, OSG BVBA). Technicians
annotated eyes open, eyes closed, hyperventillation and photic stimulation events
during all recordings.
From theMST database, we selected recordings that were originally made as part
of epilepsy investigations. A total of 384 records were used for evaluation, and the
patient group consisted of 214 males and 170 females with ages ranging from 18 to
90 years.
For each recording, a diagnostic report wrien prior to the construction of the
proposed guidelines was available. These reports were wrien by one of two board
certified neurologists, and theywere used to compare interpretations between visual-
and quantitative analysis. In order to compare the interpretations, the free text

antification of the adult EEG background paern | 39
Table 3.1: Summary of EEGs described by visual analysis. Descriptions obtained from diagnosticreports.
Alpha rhythm peak frequency
Normal for age Deviating from norm
303 (90%) 33 (10%)
Reactivity
Substantial Moderate Low or absent
301 (90%) 26 (8%) 9 (3%)
Anterio-posterior gradient
Normal range Moderate dierentiation Abnormal or deviant
286 (74%) 73 (19%) 25 (7%)
Asymmetries
None At least one
295 (77%) 89 (23%)
Diuse slow-wave activity
Normal EEG Paerns Diuse slow waves
347 (90%) 37 (10%)
reports were carefully read and all background properties were categorized by the
authors based on a designated set of outcomes for each property. Recordings were
excluded if their reports had missing information about any of the properties con-
sidered in this study. Table 3.1 shows the outcomes and summarizes the dataset as
described by the reports.
3.2.2 Preprocessing
An independent component analysis filter was used to reduce the influence of
eye blink artifacts on the described features. Aer calculating the independent
components, each was compared to a electrooculogram (EOG) channel recorded
together with the EEG. If one of the components showed a substantial correlation
with the EOG channel (>0.3), it was removed by seing all its values to zero. The
remaining components were projected back to their channel space by applying the
inverse transform. No other artifact detection or reduction was performed.

40 | Chapter 3
3.2.3 EEG features
We focus on five common background properties: i) the alpha rhythm1 and its
peak frequency; ii) reactivity; iii) anterio-posterior gradients; iv) asymmetries; and
v) the presence or absence of diuse slow-wave activity. Each of these properties
is discussed in the subsections to follow. Other reported background properties
include beta activity, lambda waves, changes during hyperventilation, and driving
responses during photic stimulation. These properties were however not investi-
gated.
Each subsection below starts with an outline of a property, followed by a pro-
posed guideline to evaluate or describe it, and then followed by a quantitative anal-
ysis approach to evaluate the property in a computational manner. Depending on
the quantitative feature calculated, either a common reference, Laplacian, or bi-
polar montage was used. Annotations were extracted in an automated manner to
determine eyes open and eyes closed states, and segments during hyperventila-
tion and photic stimulation were ignored. Detailed descriptions of the quantitative
algorithms are presented in 3.4.
3.2.3.1 Alpha rhythm frequency
The alpha rhythm was the first rhythmic activity measured in the brain and has
been shown to have diagnostic value in diseases ranging from depression (Segrave
et al., 2010; Spronk et al., 2011) and schizophrenia (Knyazeva et al., 2008; Jin et al.,
2006) to Alzheimer’s disease (Ishii et al., 2010; Lee et al., 2010) and visual percep-
tion (Babiloni et al., 2006; Sewards and Sewards, 1999). The alpha rhythm is most
visible over the posterior regions during a relaxed state of wakefulness when the
eyes are closed, and its frequency follows a downward gradient from the posterior
region anteriorly when measured over the scalp (Segalowitz et al., 2010). Its peak
frequency increases with age until maturation is reached, which typically occurs
during adolescence or young adulthood (van der Stelt, 2008; Marcuse et al., 2008;
Segalowitz et al., 2010). Thereaer it remains constant, or in some cases, decreases
slowly with ageing (Lodder and van Puen, 2011). Decreasing alpha rhythm fre-
quencies with ageing have been suggested to relate to mental deterioration (Gaál
et al., 2010).
1A more general name is the posterior dominant rhythm, as in pathological situations the peakfrequency may be outside the alpha frequency range. Here, we will further denote it as the alpha
rhythm.

antification of the adult EEG background paern | 41
In various handbooks, it is stated that a posterior dominant rhythm of less than 8
Hz during wakefulness in an adult is abnormal (Levin and Lüders, 2000). In healthy
individuals, even in the seventh and eighth decade, the mean is maintained at or
above 9 Hz (Obrist, 1976). In a previous study, we found this also to be true in a
dataset of 1215 normal EEGs (Lodder and van Puen, 2011). For children however,
alpha peak frequencies can be normal below 8 Hz.
Guideline 1: The alpha rhythm frequency is defined as the peak frequency in
a spectrogram taken over the posterior region during the eyes-closed state. For a
guideline to take age dependency of the peak frequency into account, we propose
to use the mean trend over age for normal EEGs, as noted by van der Stelt (2008),
Segalowitz et al. (2010), Aurlien et al. (2004), and Lodder and van Puen (2011). Ta-
ble 3.2 provides a reference derived from the mean trend approximated by Lodder
and van Puen (2011), and we consider the alpha rhythm to deviate from the norm
(i.e. too slow or fast) if the peak frequency diers by more than 1.8 Hz from the
reference value for a given age.
Automated analysis: To find the alpha rhythm frequency with an algorithmic
approach, a method previously described in (Lodder and van Puen, 2011) is used
(summarized in 3.4.2). Using a common reference montage, the technique identifies
dominant frequency components between 3-18 Hz in the occipital region. This is
done by fiing a curve to the log spectrum of localized segments of the EEG when
the eyes are closed:
Plog(f) ≈ Pfit(f) = Ppk1(f) + Ppk2(f) + Pbg(f) (3.1)
Peak parameters from the localized segments are clustered together based on fre-
quency similarity, and an alpha rhythm estimate is obtained by finding the mean
frequency of the largest cluster. If there are no dominant peaks in the EEG spectra,
the method assumes that an alpha rhythm is not present. Aer estimating the al-
pha rhythm peak frequencies, they are categorized using Guideline 1 and Table 3.2
as reference.
3.2.3.2 Alpha rhythm reactivity
Reactivity is known as an aenuation of rhythmic activity, occurring mostly in
the alpha band, when the brain receives an external stimulus aer an idle state

42 | Chapter 3
Table 3.2: Reference to accepted normal alpha rhythm peak frequencies over age. From 0-15 years,the peak frequency is strongly related to age.
Age Frequency (Hz)
0-1 yrs 5.3 ± 1.8
2-3 yrs 6.8 ± 1.8
4-5 yrs 7.9 ± 1.8
6-7 yrs 8.7 ± 1.8
8-15 yrs 9.5 ± 1.8
16-50 yrs 9.9 ± 1.8
>51 yrs 9.1 ± 1.8
(Schomer and Lopes da Silva, 2010). The stimulus can range from eyes opening to
auditory input or pain. Reactivity becomes weaker during drowsiness as compared
to a fully awake state, and the level of suppression varies with age (Gaál et al.,
2010). Although having less diagnostic value than other background properties,
the reactivity is known to be lower in demented patients (van der Hiele et al., 2007;
Babiloni et al., 2010). Furthermore, it is believed that lower reactivity reflects a
reduction of neuronal interconnectivity and a weaker level of neurotransmission,
which may be seen in EEGs of the elderly (Gaál et al., 2010). In previous studies
by Logi et al. (2011), Douglass et al. (2002), and Ramachandrannair et al. (2005), the
prognostic value of reactivity in comatosed patients was also explored with positive
results.
Although reactivity is most commonly associated with the suppression of alpha
power, a formal definition to quantify it with a scale of normality was not found in
existing literature. Most studies compare the alpha power in an idle state to that
of a non-idle state, as done for example by van der Hiele et al. (2007), Könönen and
Partanen (1993), and Partanen et al. (1997).
Guideline 2: To categorize reactivity, we compare the dierence in alpha power
over the occipital region between an idle (relaxed, eyes closed) and non-idle (eyes
open) state. Suppression of more than 50% alpha power is considered substantial,
between 10-50% as moderate, and anything less as low or absent.
Automated analysis: Using the alpha frequency obtained by the technique de-
scribed in Section 3.2.3.1, reactivity is calculated by comparing the dierence in al-
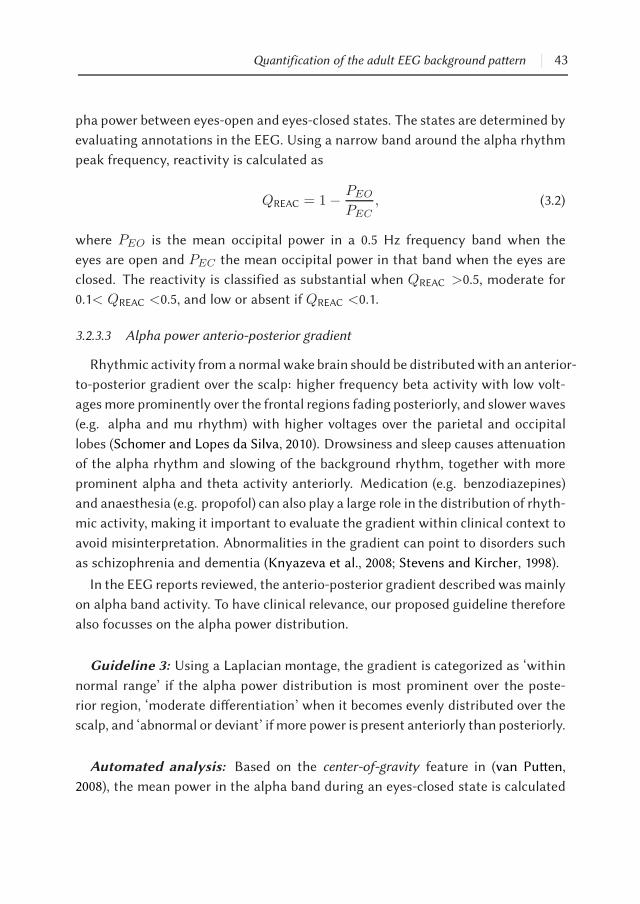
antification of the adult EEG background paern | 43
pha power between eyes-open and eyes-closed states. The states are determined by
evaluating annotations in the EEG. Using a narrow band around the alpha rhythm
peak frequency, reactivity is calculated as
QREAC = 1−PEO
PEC
, (3.2)
where PEO is the mean occipital power in a 0.5 Hz frequency band when the
eyes are open and PEC the mean occipital power in that band when the eyes are
closed. The reactivity is classified as substantial when QREAC >0.5, moderate for
0.1< QREAC <0.5, and low or absent if QREAC <0.1.
3.2.3.3 Alpha power anterio-posterior gradient
Rhythmic activity from a normal wake brain should be distributedwith an anterior-
to-posterior gradient over the scalp: higher frequency beta activity with low volt-
ages more prominently over the frontal regions fading posteriorly, and slower waves
(e.g. alpha and mu rhythm) with higher voltages over the parietal and occipital
lobes (Schomer and Lopes da Silva, 2010). Drowsiness and sleep causes aenuation
of the alpha rhythm and slowing of the background rhythm, together with more
prominent alpha and theta activity anteriorly. Medication (e.g. benzodiazepines)
and anaesthesia (e.g. propofol) can also play a large role in the distribution of rhyth-
mic activity, making it important to evaluate the gradient within clinical context to
avoid misinterpretation. Abnormalities in the gradient can point to disorders such
as schizophrenia and dementia (Knyazeva et al., 2008; Stevens and Kircher, 1998).
In the EEG reports reviewed, the anterio-posterior gradient described wasmainly
on alpha band activity. To have clinical relevance, our proposed guideline therefore
also focusses on the alpha power distribution.
Guideline 3: Using a Laplacian montage, the gradient is categorized as ‘within
normal range’ if the alpha power distribution is most prominent over the poste-
rior region, ‘moderate dierentiation’ when it becomes evenly distributed over the
scalp, and ‘abnormal or deviant’ if more power is present anteriorly than posteriorly.
Automated analysis: Based on the center-of-gravity feature in (van Puen,
2008), the mean power in the alpha band during an eyes-closed state is calculated

44 | Chapter 3
and a normalized anterio-posterior power ratio is found:
QAPG =Pant
Pant + Ppos. (3.3)
Here, Pant and Ppos represent the mean alpha power over the anterior and posterior
regions respectively (see 3.4.3). Using this ratio, the alpha power gradient is con-
sidered within normal range if QAPG is lower than 0.4, moderately dierentiated
between 0.4 and 0.6, and abnormal or deviant for values above 0.6.
3.2.3.4 Asymmetries
Asymmetry of the occipital alpha rhythm voltage is present in about 60% of
healthy adults (Maulsby et al., 1968). Only 17% of healthy adults show voltage dif-
ferences larger than 20%, and amere 1.5% showdierences larger than 50% (Maulsby
et al., 1968). As a rule therefore, interhemispheric dierences in amplitude larger
than 50% are considered abnormal (Levin and Lüders, 2000; Maulsby et al., 1968). A
significant (> 50%) voltage asymmetry of the mu rhythm or temporal alpha activity
are oen observed in healthy adults; a presence of these findings should therefore
be interpreted with caution, as this is common in asymptomatic persons (Ebersole
and Pedley, 2003). Frequency asymmetries of 1 Hz or larger also indicate pathology.
Guideline 4: Asymmetrical background paerns are found by comparing rhyth-
mic activity between the two hemispheres in corresponding channel pairs. Re-
ported asymmetries should refer to either a) a significant amplitude dierence be-
tween corresponding channels larger than 50%, or b) an abnormal frequency dif-
ference (or absence) of rhythmic components in excess of 0.5 Hz (which, for a fre-
quency resolution of 0.5 Hz, indicates a dierence of 1 Hz or more).
Automated analysis: Using a Laplacian montage, EEG channels are paired
based on symmetrical opposites over the le and right hemispheres:
CL,R = Fp1, Fp2, F7, F8, F3, F4, T3, T4,
C3, C4, T5, T6, P3, P4, O1, O2. (3.4)
Using the same principle as described by van Puen (2008), a spectral dierence is

antification of the adult EEG background paern | 45
calculated for each channel pair. If the EEG shows spectral asymmetry, it will be
reflected in the calculation:
QASYM(cL,R), cL,R ∈ CL,R. (3.5)
In (3.5), each cL,R represents one of the channel pairs, and QASYM(cL,R)
finds a normalized value to quantify the spectral dierence between two channels
(see 3.4.4). Using a threshold of 0.5, the EEG is considered to have an asymmetry
for any pair that exceeds that value.
3.2.3.5 Diuse slow-wave activity
Diuse slow-wave activity is hardly present in healthy waking adults (Ebersole
and Pedley, 2003). Normal variants exist, although in most cases its presence points
to an abnormality that can result from a number of causes. One common cause is
diuse cortical injury such as anoxia (Cloostermans et al., 2011). Slow-wave activity
can also be the result of pharmacological eects such as sedatives or anaesthetic
medications (San-juan et al., 2010; Blume, 2006).
Guideline 5: Diuse slow-wave activity results in increased power over the theta
and delta bands and decreased power in the alpha and beta bands. Using this as a
guideline, the EEG is considered to contain diuse slow-wave background activity
if less than one third of the power in a spectrogram resides above 8 Hz.
Automated analysis: Using the guideline above, the mean spectrum of the EEG
is calculated and the power ratio between Plow=2..8 Hz and Pwide=2..25 Hz is
obtained (3.4.5):
QSLOWING = Plow/Pwide. (3.6)
ForQSLOWING >0.6 (i.e. less than 40% of power above 8Hz), toomuch slow-wave ac-
tivity is present and the EEG is categorized as abnormal. EEGs withQSLOWING <0.6
are considered to have suiciently fast rhythmic activity.
3.2.4 Evaluation
To evaluate the value of the proposed guidelines and quantitative measures,
a comparison was made between the described properties from the EEG reports
and the interpretations made by automated analysis. As described above and also

46 | Chapter 3
shown in Table 3.1, each property was designated by either two or three categories,
depending on its relevance. To compare the proposed quantitativemeasures against
visual analysis, three measures were used: sensitivity, specificity, and Fleiss’ kappa
coeicient (Fleiss, 1971).
Although a common performance measure in quantitative analysis, sensitivity
and specificity is defined for two-class problems. It also assumes that the true la-
bels are accurate in describing the property at hand, and does not consider inter-
and intra-rater variability. Regardless, these measures can provide valuable infor-
mation relating to the development of quantitative analysis features. Sensitivity
and specificity are calculated for the three properties with a dichotomous outcome:
alpha rhythm frequency, reactivity, and the presence or absence of asymmetries.
Given that our goal is to assist the reviewer with analysis of the background
paern, measuring and maximizing the inter-rater agreement between visual and
quantitative analysis is of high importantance. Fleiss’ kappa coeicient measures
inter-rater agreement in properties withmultiple outcomes, and is therefore chosen
to achieve this.
3.3 Results
A dataset containing 384 adult EEGs was used to compare the proposed guide-
lines and automated analysis to visual interpretations. Results from individual
properties are provided in succeeding subsections. Table 3.3 summarizes the agree-
ment for each property, and Section 3.3.6 gives three examples of how automated
analysis can assist in visual interpretation.
3.3.1 Alpha rhythm frequency
Using Guideline 1, substantial agreement (κ =0.60) was obtained with visual
interpretation in determining if the alpha rhythm frequency was within normal
range. The quantitative measure could detect abnormal alpha frequencies with
high specificity (0.96), although a lower sensitivity (0.64) was reached. The alpha
rhythm could not be identified for 48 of the EEGs with quantitative analysis; either
because none was present, or because there was not a significant peak amplitude
in the power spectrum. Visual interpretation for these 48 EEGs also ranged from
no alpha rhythm observed to a weak but visible peak. The results for alpha rhythm
frequency and reactivity in Table 3.1 and Table 3.3 only reflect the EEGs in which
the rhythm was identified in both visual and quantitative analysis. The mean fre-

antification of the adult EEG background paern | 47
quency dierence between reported and calculated peak frequencies was 0.42 Hz
(SD±0.66 Hz). The peak frequency reported by visual analysis was oen described
using a narrow frequency range (mean width 0.57 Hz) instead of a single value.
In such cases, the frequency dierence with quantitative analysis was calculated
using the center frequency of that range.
3.3.2 Alpha rhythm reactivity
Using the calculated peak frequencies, reactivity was calculated for the 336 EEGs
with known alpha rhythms. Reactivity of the rhythm aer opening or closing the
eyes was assigned to one of three categories: substantial, moderate, and low or
absent. Using these categories, a fair agreement of κ =0.34 was reached.
3.3.3 Alpha band anterio-posterior gradient
The quantitative measure for an anterio-posterior gradient showed the lowest
agreement of all properties with visual interpretation (κ =0.19). It should however
be noted that it was the most diicult property to categorize from the EEG free text
reports due to inconsistent terminology and an unclear border between normal and
deviating dierentiation.
3.3.4 Asymmetries
Although it adds significant value to report in which region asymmetries exist,
our comparison focussed first on accurately identifying EEGs with abnormal asym-
metries. The agreement between visual interpretation and automated analysis was
low (κ =0.12). The sensitivity and specificity for this property were 0.16 and 0.97
respectivrely. No distinction was made between slight and severe asymmetries.
3.3.5 Diuse slow-wave activity
To categorize the presence or absence of diuse slow-wave activity in the back-
ground paern, our algorithm compared the power in the alpha and beta bands to
lower bands. As shown in the last row of Table 3.3, this approach obtained sub-
stantial agreement with visual interpretation (κ =0.76), high specificity (0.98), and
a moderate sensitivity (0.78).

48 | Chapter 3
Table 3.3: antitative analysis compared to visual interpretation. Comparisons are made basedon automated analysis and the outcome in EEG reports. For properties with a dichotomous out-come, sensitivities and specificities are given in the third and fourth columns. Inter-rater agreement,
calculated as kappa coeicients, are shown in the last column.
Background property antity Sensitivity Specificity Agreement
Alpha rhythm frequency QALPHA 0.64 0.96 κ =0.60
Alpha rhythm reactivity QREAC - - κ =0.34
Anterio-posterior gradient QAPG - - κ =0.19
Asymmetries QASYM 0.16 0.97 κ =0.12
Diuse slow-wave activity QSLOWING 0.78 0.98 κ =0.76
3.3.6 Automated analysis assisting visual interpretation in practice
Some examples are given to illustrate the added value of automated analysis dur-
ing an EEG review. Using quantitative analysis performed with the described algo-
rithms, automatically generated reports for three EEGs are presented in Fig. 3.1-3.3.
At the top of each figure is a summarized outcome of the quantitative analysis writ-
ten in free text, and below are images to display various EEG properties over time.
The images correspond to quantitative features described in Section 3.2.3, with the
exception of not reducing a feature to a single value by averaging over frequency or
time. These examples clearly illustrate the added benefit of a quantitative system:
outlining the background rhythm of the whole recording on a single page in a clear
and simple manner.
For the first example (Fig. 3.1), an EEG which was considered normal by both
visual analysis and quantitative analysis is shown. Fig. 3.1(b) shows the “assumed”
states (i.e. eyes open, eyes close, hyperventilation etc.) of the patient at each time
point. This is obtained by parsing the annotations made during recording. By using
Fig. 3.1(b) as context, the reviewer can easily compare changes in properties in the
figures below it when switching from states. The second image row, Fig. 3.1(c),
shows a spectrum of the EEG over time, averaged over all channels. Reactivity of
the alpha rhythm is clearly visible when comparing the spectrum in Fig. 3.1(c) to
the eyes-open and eyes-closed states in Fig. 3.1(b). Fig. 3.1(d) shows the average
symmetry over all le-right channel pairs. For this figure, an even symmetry was
reported and as seen in the plots, the symmetry appears to be relatively equal. The
last row, Fig. 3.1(e), shows the anterio-posterior distribution of rhythmic activity.
As expected for a normal EEG and discussed in Section 3.2.3.3, higher frequency
beta activity is seen most prominently over the frontal regions fading posteriorly,

antification of the adult EEG background paern | 49
Fig. 3.1: An automated EEG report with all background properties described as normal. (a) an-titative values (Section 3.2.3) are provided together with an automated free-text description. (b) EEG
states (i.e. eyes-open, eyes-closed, hyperventillation etc.) are shown to place quantitative featureplots in correct context. (c) Time-varying spectrum averaged across all channels. (d) Mean le-rightsymmetry, calculated by averaging Eq. (3.21) over all channels. (e) Time-varying anterio-posterior
distribution of rhythmic activity. Note the photic driving responses also visible in (c) and (e).
and slower waves (e.g. alpha and mu rhythm) more towards the posterior region.
For the second example (Fig. 3.2), the EEG background properties were all de-
scribed as normal, except for a right-dominant alpha asymmetry. This description
was based on visual inspection. antitative analysis also found all background
properties except for asymmetries to be normal. For this EEG, visual inspection
and quantitative analysis produced the same outcome. The plots in Fig. 3.2 also
show that all properties appear normal, except for a right-dominant asymmetry in

50 | Chapter 3
Fig. 3.2: An EEG with all background properties described as normal by visual analysis except for
asymmetries over temporal and parietal regions. QASYM shows two channel pairs above threshold,indicating asymmetries found by quantitative analysis. By looking at the le-right symmetry plot,the asymmetry is also clearly presented to the reviewer in a visual manner.
the alpha band and a le-dominant asymmetry in the lower bands.
The third example (Fig. 3.3) shows an EEG where multiple abnormalities occur.
Based on visual inspection, the report described it as containing diuse slow-wave
activity, very low or absent reactivity, and an abnormal anterio-posterior gradient.
Automated analysis described the EEG to have diuse slow-wave activity, moderate
reactivity, and an abnormal or deviant anterio-posterior gradient. Once again, the
plots in Fig. 3.3 can assist the reviewer by providing a time-varying summary of
the background properties investigated. As an example, compare the fourth row

antification of the adult EEG background paern | 51
Fig. 3.3: An EEG with several abnormalities reported by visual analysis: diuse slow-wave activity,
moderate to low reactivity and an abnormal anterio-posterior gradient. The quantitative featuresQSLOWING, QREAC, and QAPG show that automated analysis comes to a similar conclusion. As visualassistance and an outline of the full recording, plots show toomuch slow-wave activity and no reactiv-
ity in the power spectrum between eyes-open and eyes-closed states. Also, an abnormal distributionof rhythmic activity in the boom row is seen.
images of Fig. 3.2 and Fig. 3.3: As expected for normal dierentiation in Fig. 3.1-3.2,
rhythms in the alpha and theta bands appear posteriorly, whereas faster rhythms
are more visible anteriorly. Fig. 3.3 however shows that all rhythmic activity appear
stronger towards the anterior, corresponding to the EEG report that an abnormal
or deviant anterior-posterior gradient exists.

52 | Chapter 3
3.4 Discussion
Current methods of reviewing routine EEGs are based mostly on visual analy-
sis of the raw signals. Although this approach still holds the highest specificity
and sensitivity for finding abnormalities, it is time consuming and requires exten-
sive training. Apart from this, visual analysis is susceptible to reviewer bias (Haut
et al., 2002; Benbadis et al., 2009; Gerber et al., 2008; Azuma et al., 2003). Automated
quantification techniques reduce the time required for reviewing and improve con-
sistency in reporting. They can quantify various properties in EEG and even point
out abnormalities if found. However, because external factors (e.g. medication or
structural damage) may influence the EEG paerns, final interpretation of the find-
ings is always le to the reviewer.
For quantitative analysis of the background paern, it is not always easy to de-
fine explicit guidelines. Properties such as anterio-posterior gradients, reactivity
and asymmetries are well known, but categorizing them as normal, abnormal, or
the degree of abnormality, if applicable, is less trivial. Simpler features such as the
alpha rhythm frequency and diused slow-wave activity are beer defined, and as
shown in Table 3.3, it becomes easier to find agreement in descriptions. Azuma et al.
(2003) showed how inter-rater reliability was improved by having three reviewers
agree to use the same guidelines (Azuma et al., 2003). It is also shown that con-
sistent terminology can improve clarity and enhance sharing capabilities between
clinicians, as well as add value to the reporting and querying of data by storing
reviews in an organized database (Aurlien et al., 2004).
Our study focusses on quantifying particular key features of the background
paern as a contribution towards improved consistency and inter-rater reliability.
Based on the complexity of EEG signals, strict or “narrow” definitions were avoided
to prevent a lack of consensus. Instead, an aempt was made to look for simple
guidelines that reviewers can follow to improve consistency when discriminating
between normal and abnormal behaviour. Five properties were considered as they
were the most common in reports related to our study: i) alpha rhythm peak fre-
quency, ii) alpha reactivity, iii) anterio-posterior gradients, iv) asymmetries, and v)
the presence or absence of diuse slow-wave activity. For EEGs obtained under
other circumstances, e.g. intensive care or emergency units, other properties may
have more relevance (Cloostermans et al., 2011; Trevathan, 2006; Kurtz et al., 2009).
Previous quantitative analysis studies typically focussed on specialized features
to point out a disease or abnormality in the brain (John et al., 1994; Chabot and

antification of the adult EEG background paern | 53
Serfontein, 1996; Hughes and John, 1999; Bares et al., 2012; Prichep et al., 1994;
Calzada-Reyes et al., 2011; Begić et al., 2011; Bjork et al., 2011; Jiang et al., 2011;
Mishra et al., 2011). The dierence between these and our study, is that we aempt
to quantify the same background properties reported by routine visual analysis, and
in addition, compare the quantitative output to that of the human reviewer. To our
knowledge, this has not been done before. Our quantitative algorithms made use of
the proposed guidelines and required lile or no input from the reviewer to perform
its analysis. The outcome was compared to reports from visual interpretation, and
as shown in Table 3.3, the agreement between computer-generated features and
visual interpretation ranged from slight to substantial. Possible reasons for dier-
ences between visual and quantitative analysis can be: i) a too simplistic nature
of the proposed guidelines; ii) inconsistencies in visual interpretation; iii) artifacts
that interfere with automated analysis; or iv) the quantitative features may lack full
support of the guidelines. Also, the thresholds used to categorize the quantitative
features were not optimized, and are merely given to indicate how diagnostic clas-
sification can be implemented. With ongoing work, more examples of abnormal
background paerns will be collected and further optimization will take place.
This study is a first step, only. We are well aware that the background paern
contains more features than the five discussed in the current contribution, e.g. beta
activity, mu- and theta-rhythms, lambda waves or physiological transients such as
wicket waves. In addition, we quantify features from adult patients during wake-
fulness. Therefore, the present computer analysis is far from complete. However,
its main purpose is to assist in the visual analysis of the EEG, without an aempt
to be a replacement of the human EEG reader. The three examples in Section 3.3.6
show how the current system already has a practical use in clinical seings, and
with an ongoing study we will focus on improving it further.
Given that the evaluation criteria remains constant, automated analysis can re-
duce inter-rater reliability if used by the reviewer. As also discussed by Anderson
and Doolile (2010), a reviewer will be less likely to trust an algorithm if he does
not understand how its values are calculated. It is desirable to keep the logic of
the methods clear and transparent. The presented algorithms were designed with
a simple and intuitive approach in mind. Some of them were not capable of accu-
rately quantifying an intended property, and improvements are therefore needed
to further optimise the system. A common dataset is also needed to construct a
gold standard for evaluating new features. As this dataset develops, the guidelines
of defining the various properties should also improve.
54 | Chapter 3
In summary, current EEG analysis techniques can be improved by supplying re-
viewers with quantitativemeasures to assist in the review. In order to increase inter-
rater reliability, a consensus is needed to describe EEG properties and to character-
ize the severity of abnormalities. Five simple guidelines are proposed to describe the
EEG background paern. A quantitative analysis toolkit is developed to describe
these properties, and examples show the value added assistance that it can have
during a review.
Appendix: antitative features
3.4.1 Power spectrum
Let V (c, t) be a matrix representing a single EEG with c = 1..N channels over
time t. First, the entire EEG is split into smaller segments of 5 seconds each:
W (c, j, ts) : j ∈ [1..M ], ts ∈ [0..5], (3.7)
with j referring to each segment and ts to the time in each segment. Using the
Welch transformwith a 2 secondwindow, zero padded to 2048 sample points and an
overlap of 50%, the power spectrum of each segment for each channel is calculated.
Let this be represented by
P (c, j, f), c ∈ [1..N ], j ∈ [1..M ], f ∈ [fmin, fmax]. (3.8)
Each entry in P (c, j, f) contains a discrete Fourier coeicient for channel c, seg-
ment j, and at frequency f . The frequency resolution is 0.122 Hz.
3.4.2 Estimation of the alpha rhythm
A technique described in (Lodder and van Puen, 2011) was used to find esti-
mates of the alpha rhythm peak frequency in the EEGs. For a full description, refer
to the original text.
This technique is based on finding the dominant frequency components between
3-18 Hz in localized segments of the EEG. The dominent frequencies are clustered
together, and those most persistent during the eyes closed states are considered
to represent the alpha rhythm. Given that the alpha rhythm is most prominent
over the occipital region, channels O1 and O2 are used with a common reference
montage to estimate the peak frequencies. First, the log spectrum of each segment

antification of the adult EEG background paern | 55
is calculated:
Plog(f) = log [P (c, j, f)] , c ∈ O1, O2 , j ∈ JEC , (3.9)
where JEC represents the indices of all segments in the eyes closed state. Then, a
curve consisting of two peak components and the power-law background spectrum
is fied to Plog:
Plog(f) ≈ Pfit(f) = Ppk1(f) + Ppk2(f) + Pbg(f) (3.10)
Ppk1(f) = A1exp
(
−(f − f1)2
∆21
)
, (3.11)
Ppk2(f) = A2exp
(
−(f − f2)2
∆22
)
, (3.12)
Pbg(f) = B − C log(f). (3.13)
The peak parameters are used to form clusters based on frequency similarity, and by
taking the average of the largest cluster, the alpha rhythm frequency is estimated
accordingly.
3.4.3 Anterio-posterior gradient
Using a Laplacian montage for P (c, j, f), the mean power in the alpha band (8-
12 Hz) is calculated as
Palpha(c, j) = meanf=8..12 Hz
[P (c, j, f)] , (3.14)
Segments from the eyes closed state are used to quantify the anterior-posterior
gradient. A mean spectrum from these segments are found using
PEC(c) = meanj∈JEC
[
Palpha(c, j)]
, (3.15)
with JEC representing the indices of all segments in the eyes closed state. Using
the following channels for the anterior and posterior regions respectively:
Cant = Fp1, Fp2, F7, F8, F3, Fz, F4 , (3.16)
Cpos = T5, T6, P3, P4, P z,O1, O2 , (3.17)

56 | Chapter 3
the mean alpha power over each region is calculated as
Pant = meanc∈Cant
[PEC(c)] , and (3.18)
Ppos = meanc∈Cpos
[PEC(c)] . (3.19)
Following from this, a normalized ratio for the anterior-to-posterior power is found:
QAPG =Pant
Pant + Ppos. (3.20)
3.4.4 Asymmetries
Le-right symmetry is calculated by comparing spectral power between the two
hemispheres. To increase robustness, power ratios are first calculated in individual
segments and then averaged together. Using the channel pairs
CL,R = Fp1, Fp2, F7, F8, F3, F4, T3, T4,
C3, C4, T5, T6, P3, P4, O1, O2, (3.21)
a le-right ratio for each pair is calculated:
LR(cL,R, j, f) =P (cR, j, f) − P (cL, j, f)
P (cR, j, f) + P (cL, j, f), cL,R ∈ CL,R. (3.22)
By calculating the mean of all segments:
LRAVG(cL,R, f) =
∣
∣
∣
∣
meanj=1..M
[
LR(cL,R, j, f)]
∣
∣
∣
∣
, (3.23)
and averaging over f = 0.5..12 Hz, a single value is obtained to quantify the
symmetry for each channel pair:
QASYM(cL,R) = meanf=0.5..12 Hz
[
LRAVG(cL,R, f)]
. (3.24)
3.4.5 Diused slowing
Diuse slow-wave activity is detected by finding a ratio in spectral power from
a low 2..8 Hz band to a wider 2..25 Hz band. Using the common reference

antification of the adult EEG background paern | 57
montage to calculate P (c, j, f), the following channels are used to find the ratio:
CSLOWING = F7, F8, F3, F4, Fz, T3, T4, T5, T6,
C3, C4, Cz, P3, P4, P z,O1, O2. (3.25)
Using only segments from the eyes closed state, the mean spectrum over all chan-
nels are found:
PEC(f) = meanc∈CSLOWING
[
meanj∈JEC
[P (c, j, f)]
]
, (3.26)
with JEC referring to the indices of all segments in the eyes closed state. The total
power in the low and wide spectral bands are calculated:
Plow =
8 Hz∑
f=2 Hz
PEC(f), (3.27)
Pwide =25 Hz∑
f=2 Hz
PEC(f), (3.28)
and from these the slowing-ratio is found:
QSLOWING = Plow/Pwide. (3.29)


Chapter 4
Computer-assisted
interpretation of the EEG
background paern: A clinical
evaluation
Shaun S. Lodder
Jessica Askamp
Michel J. A. M. van Puen
PLOS ONE 2014
Abstract
Interpretation of the background paern in routine EEG recordings is an impor-
tant part of clinical reviews. We evaluated the feasibility of an automated system
to assist reviewers with evaluating the EEG background paern. antitative EEG
methods were used to describe the following five background properties: poste-
rior dominant rhythm frequency and reactivity, anterior-posterior gradients, pres-
ence of diuse slow-wave activity and asymmetry. Soware running the quan-
titative methods was sent to nine experienced electroencephalographers together
with 45 routine EEG recordings and automatically generated reports. Participants
were asked to first review the EEGs by visual analysis and then to correct mistakes
made by the system. Corrected reports were returned for comparison. Using a gold-
standard derived from the consensus of reviewer reports, inter-rater agreement was
calculated for all reviewers and for automated interpretation. Automated interpre-
tation together with most participants showed high (kappa > 0.6) agreement with
the gold standard. In some cases, automated analysis showed higher agreement
with the gold standard than participants. When asked, all participants considered
computer-assisted interpretation useful for routine reviews. Automated interpreta-
tion methods showed clinical feasibility and was well received by all reviewers.
Significance: Computer-assisted interpretation of the EEG background paern can
bring consistency to reports and improve eiciency and inter-rater agreement.

Clinical evaluation of computer-assisted interpretation | 61
4.1 Introduction
Scalp EEG is used in a wide range of clinical seings to obtain a non-invasive
measurement of cortical brain activity. Having a higher temporal resolution and
being more aordable, portable and widely available than fMRI and MEG, its uses
range from diagnostics and monitoring for outpatient recordings, to continuous
monitoring in the ICU. The recordings are typically analyzed by visual inspection
of the signals in their raw form, and apart from being a time consuming and error
prone task which may lead to missed events, this can also result in high inter- and
intra-rater variability depending on the level of experience and degree of concen-
tration of the reviewer (Anderson and Wisneski, 2008).
An important part of EEG reviews is the analysis of the background paern.
For routine outpatient recordings this plays an important part in epilepsy diagnos-
tics (Wilson and Emerson, 2002; Halford, 2009), clinical psychiatry (Coburn et al.,
2006) and the diagnosis of neurodegenerative diseases (Petit et al., 2004; Babiloni
et al., 2011; Morei et al., 2012). Also, continuous monitoring of the background
paern in the ICU can alert medical sta of sudden changes that require imme-
diate intervention (Friedman and Hirsch, 2010; Cloostermans et al., 2011; Foreman
and Claassen, 2012), thereby changing its role from passive to an active tool for
improving the outcomes of the critically ill.
antitative EEG analysis (QEEG) and structured reports have been proposed
to lessen the burden of visual reviews and to add more consistency during report-
ing (Aurlien et al., 2004; van Puen, 2008; Halford, 2009; Anderson and Doolile,
2010; Beniczky et al., 2013). Standard guidelines for writing EEG reports state that
objective observations of the EEG properties should be made first, followed by the
conclusions drawn from the reviewer based on these observations.1 As such, quan-
titative analysis is well suited during the first phase, i.e. by assisting in the objective
description of all background properties in a consistent manner. Given that other
factors such as medication and patient history are not known or taken into consid-
eration by quantitative analysis, conclusions drawn aer initial observations should
be le to the reviewer.
As shown in (Azuma et al., 2003), inter-rater agreement for describing EEG ob-
servations can be improved if reviewers agree to follow a clear set of guidelines
in reporting their findings. These guidelines should be obtained from the general
1SeeGuideline 7 provided by the American Clinical Neurophysiology Society, J Clin Neurophysiol.
2006 Apr;23(2):118-21.
62 | Chapter 4
consensus of experienced electroencephalographers themselves. In recent work re-
ported in (Beniczky et al., 2013), the authors show on how such a set of guidelines
and definitions are being constructed as part of a pan-European project with the
goal of providing more consistency and structure for the reporting in clinical EEG
reviews (Beniczky et al., 2013; Aurlien et al., 2004, 2007).
Many types of quantitative EEG features have been proposed to describe specific
properties in the EEG. These include statistical measures such as variance, kurtosis
and skewness (Scherg et al., 2012; Stevenson et al., 2013), non-linear energy opera-
tors (Mukhopadhyay and Ray, 1998), small-world networks and functional connec-
tivity (Stam et al., 2007; Bullmore and Sporns, 2009), synchrony (Lachaux et al., 1999;
van Puen, 2003), entropy (Stam, 2005; Kannathal et al., 2005), power ratios (Kurtz
et al., 2009; Cloostermans et al., 2011), bi-spectral index (Sigl and Chamoun, 1994),
and le-right symmetry (van Puen et al., 2004). Despite the variety of complex
features available, relatively simple measures can be used to describe many of the
background properties of an EEG. Example features are the presence or absence
of certain rhythmic components, power ratios between delta-, theta-, alpha- and
beta-bands, and the power distribution over the scalp. The importance of each
background property will vary based on the reason for recording, but in general, a
description of the background paern is of significant importance for any review.
In a previous study, we described an automated system based on quantitative
features that can be used to assist with the interpretation of the EEG background
paern (Lodder and van Puen, 2013). Based on the methods described in (van
Puen, 2008), this system uses quantitative analysis to estimate properties for the
posterior dominant rhythm, reactivity, anterior-posterior gradients, presence of dif-
fuse slow wave activity, and symmetry, and then determines if these properties are
abnormal or fall within the normal range. Together with constructing an automated
report based on the outcome of these features, the system also shows the quanti-
tative properties to the user in a simple and intuitive manner.
The results in (Lodder and van Puen, 2013) showed that quantitative features
can be used to find accurate measures of the common EEG background properties.
It was however also shown that regardless of good predictions, the system was
not reliable enough to match all outcomes from the diagnostic reports based on
visual analysis. It can therefore only serve to assist during a review and not replace
visual analysis. A reason for lower agreement with the diagnostic reports could
also have been related to a lack of consistent reporting from visual analysis that
lead to higher inter- and intra-rater variability, and a follow-up goal was therefore

Clinical evaluation of computer-assisted interpretation | 63
to measure inter-rater agreement in standard reports for these properties.
Although some background properties have more relevance than others depend-
ing on the clinical seing and reason for recording, all of these considered form
part of the common properties described in most routine EEG reports. The goal
of this study was to evaluate this system in routine outpatient EEG recordings by
sending it to a group of qualified and experienced electroencephalographers, and
to determine if there is any additional benefit in computer assisted interpretation
together with conventional EEG reviews. Apart from evaluating the accuracy of
the automated system, we also wanted to measure the inter-rater agreement be-
tween reviewers, and in addition to this obtain feedback from participants about
their experience and perceived importance of using quantitative features for future
reviews. Fast and accurate interpretation of the background paern by means of
computer assisted analysis can save time for reviewers, reduce the costs of analysis,
bring consistency and completeness to EEG reports, reduce inter-rater variability,
and allow for both experienced and less experienced electroencephalographers to
benefit from additional visualizations of the EEG by presenting it in a simpler and
more intuitive manner.
4.2 Methods
4.2.1 Subjects and data
The dataset used for this study consisted of 45 anonymized routine scalp EEGs,
each 20-30 min in length. Regarding ethical approval for using the EEG data in this
study, according to Dutch law, researchers do not need to consult a medical ethical
commiee if patient data has been obtained as part of routine patient care. Fur-
thermore, patient consent is not needed for additional use of these data for further
scientific research if the data has been anonymized. These statements have been
confirmed by our medical ethical commiee. All recordings were obtained from the
Medisch Spectrum Twente hospital in the Netherlands. Original diagnostic reports
were used to find example EEGs in such a way that both normal and abnormal oc-
currences were available for each background property. Apart from ensuring that
both normal and abnormal occurrences exist, the dataset was chosen randomly
with recording dates ranging over 7 years. Our selection was unbiased towards the
number of artifacts each recording contained, and subject ages ranged from 10 to
88 years (mean 53.2). Patients were awake during the recording and a standard 20-
30 min protocol was used, which included hyperventilation and photic stimulation.

64 | Chapter 4
Fig. 4.1: Outline of the study: For each of the 45 recordings, participants were asked to open theEEG in the conventional way (Fig. 4.2) and review five background properties by visual inspection.
Aer this, they were asked to open a new window showing a summary of the quantitative features(Fig. 4.3), and to correct the mistakes made in a report generated by automated interpretation.
None of the recordings were sleep-deprived EEGs. The EEGs were recorded at a
sample rate of either 250 or 256 Hz with the Brainlab EEG system, and Ag-AgCl
electrode caps were used with electrodes placed according to the 10-20 system.
Impedances were kept below 5 kΩ to reduce polarization eects.
4.2.2 Automated interpretation of the background paern
As a first step, quantitative features were calculated for each EEG in the dataset.
A brief outline on the calculation of each quantitative feature is provided in the Ap-
pendix, and a detailed description can be found in (Lodder and van Puen, 2013).
Five background properties were considered, and based on the threshold values
provided in the Appendix, an automated description of each property was obtained.
The five background properties were: i) the posterior dominant rhythm frequency
and ii) its reactivity, iii) anterior-posterior gradients, iv) asymmetries, and v) the
presence or absence of diuse slow-wave activity. In the case of asymmetry, the
system also determined the aected regions in which asymmetries appeared. Avail-
able options for this were the le and right frontal, central, temporal, parietal, and
occipital regions. The calculated findings were stored in diagnostic reports that
were later presented to the reviewers for verification. To make the outcomes com-
patible with visual reviews and easier to compare, set categories were defined in the
reports for the outcomes of each property. These categories are shown in Table 4.1.

Clinical evaluation of computer-assisted interpretation | 65
Fig. 4.2: Before evaluating the automated reports and correcting mistakes made by quantitativeanalysis, participants were asked to review the EEG conventionally by visual inspection of the record-ing in its raw form.
4.2.3 Visual inspection and confirmation
To compare automated reporting with visual analysis, the same dataset was sent
to ten certified and experienced electroencephalographers across multiple centers
within the Netherlands, together with a set of instructions and examples on how to
interpret the displayed quantitative features. Fig. 4.1 shows an outline of the pro-
tocol followed by each participant. For each of the 45 recordings, participants were
asked to first open the EEG as usual (i.e. ten second pages of raw time series data)
as shown in Fig. 4.2, scroll through the recording, and review the five background
properties by visual inspection. Aer this, they were asked to open a new window
in the soware application showing the same recording, but this time using quanti-
tative features instead of the raw time series data. In this new window was also the
automatically generated report of the EEG background properties. An example of
this display is shown in Fig. 4.3. The participants were then asked to verify the out-
come of the automatically generated reports with their interpretation from visual
inspection and make changes to it where automated analysis was wrong. To edit
the reports, a user interface with predefined checkboxes for the outcome of each

66 | Chapter 4
Fig. 4.3: Aer visually reviewing the EEG in its raw form, participants were shown a quantitativeEEG display which summarizes the entire recording into a single window. Using the report providedin this window (right), participants were asked to correct the automated interpretation where needed
and aerwards upload the corrected reports for comparison.
property was provided, as shown on the right of Fig 4.3. Possible outcomes for each
property are summarized in Table 4.1. Together with this, participants also had the
opportunity to compare their findings from visual analysis with the quantitative
features displayed on the le side of the quantitative analysis screen (Fig. 4.3). Af-
ter updating the reports and confirming that all findings were correct, the reports
were uploaded to our server and later analyzed for comparison.
4.2.4 User experience
Given that the system would also require general acceptance by reviewers to
become clinically relevant, an aempt was made to measure the user experience
and willingness of participants to include assisted interpretation into their routine
reviewing procedure. To obtain a quantitative measure for this, participants were
asked five questions aer evaluating all the EEGs. These questions, together with
the respondent averages, are shown in Table 4.2. The questions were focused on
obtaining information about the reviewers’ previous experience with quantitative

Clinical evaluation of computer-assisted interpretation | 67
EEG analysis, its ease of use, and their perceived importance of quantitative EEG
analysis in future reviews.
4.3 Results
To determine the feasibility of computer-assisted reviewing, the first important
step was to determine the accuracy and robustness of the quantitative analysis
methods. This was done by calculating the inter-rater agreement between the
computer-generated reports and a gold standard, whichwas obtained by taking the
most agreed upon outcome for each property in each of the recordings as given by
the ten participants. Using the gold standard for comparison, the inter-rater agree-
ment was calculated for both the automatically generated reports and for individual
participants that served as a benchmark. Inter-rater agreements were calculated
using Fleiss’ Kappa measure, and the results of these comparisons are shown in Ta-
ble 4.4. Although no universally excepted rule exists for interpreting Kappa values,
a popular guideline is provided by (Landis and Koch, 1977) and will be used here
accordingly (see Table 4.3 for reference). The first ten rows in Table 4.4 show the
inter-rater agreement between each participant and the gold standard for each of
the background properties. Compared with the gold standard, nearly all partici-
pants showed substantial (0.61 − 0.80) and almost perfect (> 0.81) agreement for
all properties apart from the presence and location of asymmetries. For the pres-
ence of asymmetries, four participants showed moderate agreement (0.41 − 0.60)
and the remaining six substantial agreement or higher. In reporting the location of
the asymmetries, two participants showed moderate agreement and the remain-
ing participants all substantial or almost perfect agreement. One participant did
not specify the asymmetry regions. The last row of Table 4.4 shows the inter-
rater agreement between the the gold standard and the automatically generated
reports as obtained by automated analysis. Here we see that for the PDR, reac-
tivity, anterior-posterior gradient and slowing, the system obtained almost perfect
agreement with the gold standard. For asymmetries and asymmetry regions, the
system obtained almost perfect and substantial agreement respectively. Also seen
is that the system showed higher agreement with the gold standard than some
reviewers.
Considering the questionnaire that participants were asked to complete at the
end of the study, two said that they have never used quantitative analysis before or
during a routine or long-term review, whereas the others have all used quantitative

68 | Chapter 4
Table 4.1: To make outcomes comparable with visual reviews, set categories were defined in thereports for the outcomes of each property.
Posterior dominant rhythm (PDR)
None Normal Deviating
PDR frequency
f (Hz)
Reactivity
Substantial Moderate Low or absent
AP-Gradient
Normal Moderate Deviating
Abnormal diuse slow waves
Yes present None
Asymmetries
None One or more
Aected asymmetry region
Le Right Both None
measures mostly on an occasional, regular or routine basis. antitative analysis
also appears to be used with same rate in long-term recordings as in routine EEGs.
Regarding the question asking participants if they found the automatically gen-
erated reports useful during their review, two said only rarely and the remaining
eight occasionally. Half of the participants also said that with the use of quantita-
tive features they expect to spend less time to perform a review, whereas the other
half said that they expected to spend the same amount of time as with a conven-
tional review. None of the participants expected to spend more time. Lastly, asking
the participants if they would find it useful to have quantitative analysis methods
assist them during their daily interpretation of both routine and long-term EEGs,
all of them responded with yes.
4.4 Discussion
This study investigated the clinical relevance of computer assisted interpretation
of the EEG background paern. Our specific goal was to test the quantitative anal-

Clinical evaluation of computer-assisted interpretation | 69
Table 4.2: Five questions were asked to each participant aer all EEGs were reviewed.
1. Before this study, how oen have you used any form of quantitative analysis methods to
help you with
(a) Routine EEG reviews?
Never (11%) Rarely (0%) Occasionally (44%) Oen (22%) Always (22%)
(b) Long-term EEG reviews?
Never (11%) Rarely (11%) Occasionally (33%) Oen (33%) Always (11%)
2. How oen did the quantitative analysis figures or generated reports alter your conclusions
based on visual interpretation of the EEG (eg. picked up a missed asymmetry or dierent
degree of reactivity)?
Never (0%) Rarely (22%) Occasionally (78%) Oen (0%) Always (0%)
3. Did you find the automatically generated reports useful during your review?
Not at all (0%) Rarely (0%) Occasionally (44%) Oen (33%) Most of the time (22%)
4. In your opinion, do you think that compared to the standard way of reviewing EEGs, the
added quantitative features will make you spend more time, less time, or the same amount of
time to perform a review?
More (0%) Same (56%) Less (44%)
5. Will you find it useful to have quantitative analysis methods assist you in every day inter-
pretation of:
(a) Routine EEGs
No (0%) Yes (100%)
(b) Long-term EEGs
No (0%) Yes (100%)
ysis methods described in (Lodder and van Puen, 2013) and to determine if they
bring added value to conventional reviewing procedures. To do this, an EEG dataset
consisting of 45 routine scalp EEGs was given to both the automated interpretation
system described in (Lodder and van Puen, 2013) and to ten experienced elec-
troencephalographers for review. Using a gold standard derived from the reviewer
reports, the inter-rater agreement was calculated for each participant and for the
automatically generated reports by themselves.
From Table 4.4 we see that there was high inter-rater agreement between all
reviewers for all of the background properties described, and only once was the

70 | Chapter 4
Table 4.3: Interpretation of Kappa values as suggested by (Landis and Koch, 1977)
κ Interpretation< 0 Poor agreement0.01− 0.20 Slight agreement0.21− 0.40 Fair agreement0.41− 0.60 Moderate agreement0.61− 0.80 Substantial agreement0.81− 1.00 Almost perfect agreement
Table 4.4: Inter-rater agreement between the gold standard and reviewers (Ri), and the gold stan-dard and automated analysis (CPU) respectively. The gold standard was based on the most agreedupon outcome for each property using reports from the participants, and the inter-rater agreement
was measured using Fleiss’ Kappa.
Reviewer PDR Reactivity AP-Gradient Slowing Asymmetries Asymmetry regions
R1 0.87 0.91 0.85 1.00 0.72 0.77R2 0.87 0.66 0.58 0.81 0.72 0.71R3 0.93 0.91 0.95 1.00 0.70 -R4 0.63 0.72 0.69 0.80 0.78 0.86R5 0.67 0.76 0.86 0.74 0.80 0.74R6 0.87 0.69 0.63 0.85 0.59 0.59R7 0.77 0.34 0.65 0.78 0.61 0.61R8 0.94 0.91 0.90 1.00 0.76 0.54R9 0.88 0.60 0.82 1.00 0.54 0.62CPU 0.93 0.91 0.95 1.00 0.70 0.77
inter-rater agreement less than moderate for any of the properties (reactivity for
reviewer R7). Although the quantitative algorithms followed a specific set of guide-
lines to determine the dierence between normal and abnormal properties as de-
scribed in (Lodder and van Puen, 2013), participants were not explicitly asked to
do the same. The reason for this is that in some cases, these guidelines may be too
simplistic in nature to make accurate interpretations. We therefore allowed the re-
viewers to make interpretations based on their own experience, and for future use
we intend to combine the guidelines used in (Lodder and van Puen, 2013) with the
proposed guidelines given by (Beniczky et al., 2013), and will encourage users to use
this instead to ensure conformity and standardization of EEG reports. Following
the same set of guidelines may also help to improve the inter-rater agreement, as
demonstrated in (Azuma et al., 2003).
An important observation in Table 4.4 is that the automatically generated reports
had higher agreement with the gold standard than many of the reviewer reports.

Clinical evaluation of computer-assisted interpretation | 71
This is an interesting finding, but should be interpreted carefully given that a bias
was added by asking participants to correct the generated reports instead of leing
them fill out the entire report by themselves. As a partial compensation to avoid
this bias, participants were not shown the pre-calculated reports until aer they
drew their own conclusions based on visual inspection of the entire recording, as
described in themethods and shown in the experiment outline in Fig.4.1. Due to the
inclusion of a possible bias however, we cannot conclude that automated analysis
is more in agreement with the gold standard than some reviewers, although it does
point to the fact that automated analysis is more consistent with interpretation
than some reviewers. To make a fair comparison between visual analysis and au-
tomated interpretation, a similar study will have to be done where participants are
asked to fill out reports without receiving input from quantitative analysis. Our aim
however is not to replace the reviewer but instead to assist him, and it was there-
fore chosen to perform the study in this way in order to also receive feedback from
participants based on their experience of using computer assisted interpretation.
This study made use of partially structured reports to describe the EEG back-
ground properties. Although provision was not made for all the background fea-
tures, an additional text box was available for reviewers to add additional com-
ments or to expand their descriptions on specific properties if they wished to do
so. Together with other improvements, more categorized properties can be added
to provide a fully structured report, as shown by for example (Aurlien et al., 1999,
2004). Structured reports make it easier for reviewers to follow general guidelines in
describing EEG properties, and helps them to perform their review of each property
in a consistent manner, without leaving anything out.
Although the five questions asked to the participants at the end of the studywere
only general in nature, our objectivewith thiswas tomeasure the overall acceptance
of computer assisted methods together a conventional EEG review. Automated in-
terpretation of the general properties associated with the EEG background paern
has been suggested before (Nakamura et al., 1992, 2002; Zhang et al., 2011), but up
to now is still not widely accepted for routine clinical use. Based on the received an-
swers from the questionnaire however, we do see that many participants make use
of quantitative EEG measures in some way or another. Other quantitative systems
are typically aimed at describing one or two specific properties in the EEG, for ex-
ample markers pointing to neurodegenerative diseases (Gudmundsson et al., 2007;
Snaedal et al., 2012; Petit et al., 2004) or psychiatric disorders (Coburn et al., 2006),
and trends showing burst-suppression rates or seizures in long-term ICU monitor-

72 | Chapter 4
ing (Cloostermans et al., 2011; Foreman and Claassen, 2012). Regarding the auto-
matically generated reports for describing the general background properties of the
EEG, most participants considered it to be useful during their review.
One of the important goals of this study was to try and improve the overall inter-
rater agreement in describing the EEGbackground paern. When participantswere
asked if the generated reports altered their initial conclusions based on visual analy-
sis alone, most of them indicated that it had done so occasionally. This shows that
although quantitative analysis may also make mistakes, it becomes useful as an
assistant during reviews and helps to improve reviewer consistency and intra-rater
reliability. Therefore, given that none of the reviewers will expect to take longer to
perform their reviews by adding computer-assisted analysis, this approach may
benefit the final outcome of an EEG review without reducing the reviewer ei-
ciency. Given that the recording and review of EEGs are also one of the highest
costs involved with neurological visits apart fromMRI and EMG (Burke et al., 2013;
Strzelczyk et al., 2012), any improvement in eiciency should lead to a significant
reduction in overall healthcare costs. All participants also indicated that they would
find it useful to have quantitative analysis methods assist them with every day in-
terpretation of routine and long-term EEGs, showing a very positive sign for the
general acceptance of computer assisted reviewing.
The system presented here is of course far from perfect and many improvements
can still be made to provide a beer and more eicient user experience. For some
features, in particular the detection of asymmetries, more detailed and also more
accurate interpretations from the automated system are needed to improve the
inter-rater agreement. Also, the interpretation of additional properties such as
mu and beta rhythms, lambda waves, and response to hyperventilation and photic
stimulation for example, are needed to to provide a complete description of the EEG
background paern. Although there was no selection bias in the chosen dataset re-
garding artifacts, it can be assumed that the system will become less accurate if too
many artifacts exist. However, given our sample size of 45 EEGs that also included
the normal amount of artifacts expected from a routine recording, the system ap-
pears to be fairly robust. In the case where artifacts would severely aect the per-
formance of the system, they will clearly be seen on the summarized review screen
(le side) as shown in Fig. 4.3. The reviewer should then be advised not to trust the
outcome of the automated review.
It is important to keep in mind that, as also stated in (Anderson and Doolit-
tle, 2010), quantitative features and automated systems should remain transpar-

Clinical evaluation of computer-assisted interpretation | 73
ent where possible and care should be taken not to over-complicate algorithms
and thereby lose the confidence of the reviewer. Regarding the visualization of the
quantitative features as shown in Fig. 4.3, some participants have also commented
on non-intuitive parts of the display, leading to them making less use of it. Further
work is therefore needed to improve the quantitative displays and to find more
intuitive methods to clearly show and summarize the EEG background properties.
In summary, a successful and accurate implementation of computer assisted in-
terpretation of the EEG background paern can assist reviewers in their daily rou-
tine of reviewing EEGs. Together with the structured reports obtained by this sys-
tem, this will bring more consistency to reviewing and further improve the inter-
rater agreement. Simple and intuitive ways of showing quantitative features can
also summarize and present the entire recording on a single display and thereby
bring added benefits to both experienced and inexperienced reviewers alike, and in
addition help to reduce the reviewing time significantly.
Acknowledgments
The authors would like to extend their gratitude to all participants that took part
in reviewing the EEGs; Dr. Geert Brekelmans, Prof. Oebele F. Brouwer, Prof. J. Gert
van Dijk, Dr. Jeannee Hofmeijer, Dr. Frans S. S. Leijten, Dr. Jan Meulstee, Dr. Jaco
Pasman, Dr. Robjan Schimsheimer, and Dr. Selma C. Tromp. We also thank them
for all their suggestions and insightful comments.
Appendix: antitative background features
Five background properties were evaluated and interpreted with quantitative
measures in this study. They were: i) the posterior dominant rhythm frequency
and ii) its reactivity, iii) anterior-posterior gradients, iv) asymmetries, and v) the
presence or absence of diuse slow-wave activity. A brief outline of the various
properties are provided below, and for more details, the reader is referred to (Lod-
der and van Puen, 2013).
For the posterior dominant rhythm, a peak frequency was calculated over the oc-
cipital region by dividing each EEG into segments of five seconds each and using a
curve-fiing approach to find the dominant peaks in the eyes-closed segments. Af-
terwards, the peak estimates of all segments were clustered together to determine
the dominant frequency components, and from this an estimate of the posterior

74 | Chapter 4
dominant peak frequency was obtained. A full description of this technique is de-
scribed in (Lodder and van Puen, 2011).
Aer obtaining the peak dominant frequency, the reactivity of the posterior dom-
inant rhythm was calculated by measuring the mean occipital power in a 0.5 Hz
frequency band around that frequency when the eyes are open PEO and and when
the eyes are closed PEC :
QREAC = 1−PEO
PEC. (4.1)
The reactivity was classified as substantial whenQREAC > 0.5, moderate for 0.1 <
QREAC < 0.5, and low or absent if QREAC < 0.1.
Anterior posterior gradients were measured by calculating the mean power over
the anterior Pant and posterior regions Ppos of the scalp, and finding a normalized
value that quantifies the contribution of Pant to the total power:
QAPG =Pant
Pant + Pant. (4.2)
The alpha power gradient was considered within normal range ifQAPG was lower
than 0.4, moderately dierentiated between 0.4 and 0.6, and abnormal or deviant
for values above 0.6.
In a similar manner, asymmetries were found by comparing power dierences
between matching le- and right electrode pairs:
Lastly, the presence of diuse slow-wave activity was calculated by comparing
the power in lower theta and delta bands (2-8 Hz) Plow to a wider spectral band
ranging from 2-25 Hz Pwide:
QSLOWING =Plow
Pwide
. (4.3)
Diuse slow-wave activity was considered to be present if QSLOWING > 0.6, i.e.,
less than 40% of the power was above 8 Hz.

Part II
Inter-ictal epileptiform
discharges


Chapter 5
Inter-Ictal Spike Detection
using Smart Templates
Shaun S. Lodder
Jessica Askamp
Michel J. A. M. van Puen
Clin Neurophysiol 2013; 124:2328-2335

Abstract
Visual analysis of EEG is time consuming and suers from inter-observer variabil-
ity. Assisted automated analysis helps by summarizing key aspects for the reviewer
and providing consistent feedback. Our objective is to design an accurate and ro-
bust system for the detection of inter-ictal epileptiform discharges (IEDs) in scalp
EEG. IED Templates are extracted from the raw data of an EEG training set. By
construction, the templates are given the ability to learn by searching for other
IEDs within the training set using a time-shied correlation. True and false detec-
tions are remembered and classifiers are trained for improving future predictions.
During detection, trained templates search for IEDs in the new EEG. Overlapping
detections from all templates are grouped and form one IED. Certainty values are
added based on the reliability of the templates involved. For evaluation, 2160 tem-
plates were used on an evaluation dataset of 15 continuous recordings containing
241 IEDs (0.79/min). Sensitivities up to 0.99 (7.24 fp/min) were reached. To reduce
false detections, higher certainty thresholds led to a mean sensitivity of 0.90 with
2.36 fp/min. By using many templates, this technique is less vulnerable to varia-
tions in spike morphology. A certainty value for each detection allows the system
to present findings in a more eicient manner and simplifies the review process.
Significance: Automated spike detection can assist in visual interpretation of the
EEG which may lead to faster review times.

Inter-ictal spike detection using smart templates | 79
5.1 Introduction
Epilepsy is estimated to aect around 50 million people worldwide. With a high
temporal resolution that can capture inter-ictal epileptiformdischarges (IEDs), EEGs
play an important role in the diagnosis of epilepsy. A major drawback however, is
that reviewing them is time-consuming. Also, the diagnostic yield is low, partially
due to the relative short duration of routine EEG recordings, and due to this, multi-
ple routine recordings are typically required before signs of inter-ictal epileptiform
activity are found (Doppelbauer et al., 1993). Given that reviewers have dierent
levels of training and experience, a reasonably high inter-observer reliability is also
known to exist (Azuma et al., 2003; Abend et al., 2011).
Longer recordings have shown to increase the chances of finding inter-ictal epilep-
tiform activity (Faulkner et al., 2012; Agbenu et al., 2012; Leach et al., 2006; Fried-
man and Hirsch, 2009). In some cases this can lead to fewer follow-up recordings
and an overall increase in diagnostic eiciency. Unfortunately, longer recordings
also result in more time required for visual analysis, a burden that is best avoided.
Computerized assistance with the detection of IEDs can lessen the burden of visual
analysis, and as an added benefit, ensure more consistency between reviews that
will lower inter-rater variability. A large number of detection algorithms have al-
ready been proposed over the last four decades, ranging from template matching
and parametric methods, to mimetic analysis, spectral analysis and artificial neural
networks (see (Wilson and Emerson, 2002) and (Halford, 2009)). A review by Hal-
ford (2009) shows that some techniques have achieved very promising results, but
due to a lack of a common dataset, comparisons between methods are still hard to
make.
One of the main obstacles in IED detection is not only to find the inter-ictal
events, but also to minimize the number of false detections per minute. If this
number is too large, a reviewer will still be required to inspect most of the data
and automated detection will be of no use. Most methods for this reason use a
multi-step process to first detect possible events, and then discard artifacts and
non-epileptiform events with additional rules from the set of potential candidates.
Although diicult to compare without a common dataset, a good benchmark for
the feasibility of spike detection methods in practice are their sensitivities and false
detection rates. Low sensitivities show that reviewers can miss important IEDs if
any are present, and as mentioned, high false detection rates make evaluating the
output of the algorithm more time consuming than a visual review itself. Although

80 | Chapter 5
selectivity measures also provide useful information about the algorithm, it does
not take into account the number of IEDs per minute in the dataset, which is critical
when comparing methods from dierent datasets. Recent methods report average
sensitivities of 0.90 (Nonclercq et al., 2012), 0.65 (De Lucia et al., 2008), 0.82 (Argoud
et al., 2006), 0.93 (Subasi, 2006), 0.78 (Halford et al., 2012), 0.69 (Ji et al., 2011a), and
0.92 (Van Hese et al., 2008), and average false detections per minute of 6 (De Lucia
et al., 2008), 13.4 (Argoud et al., 2006), 0.92 (Indiradevi et al., 2008), and 0.09 (Ji et al.,
2011a). In most studies that report high sensitivities, a high false detection rate
is present if given, otherwise data epochs are used instead of continuous EEG, or
the number of false detections are not reported (Nonclercq et al., 2012; Subasi, 2006;
Halford et al., 2012; Indiradevi et al., 2008; Van Hese et al., 2008). On the other hand,
studies with low false detection rates show lower sensitivities. This shows the trade
o for all methods between choosing high sensitivities with more false detections,
or lower sensitivities with fewer false detections.
Regardless of the many algorithms available, few implementations have made it
to clinical practice. With the aim of achieving a practical and reliable system for
IED detection, we introduce an automated detection method based on template
matching to find IEDs in EEG recordings. The method is unique in the sense that it
uses a large database of templates extracted from a training set of example EEGs.
Unlike other template matching algorithms that only rely on a single or a small
number of templates to search for inter-ictal events, our system can match more
variations in spike morphology and is less vulnerable to variability. In addition,
the algorithm is designed to incorporate experience into the templates from past
classifications during training, which can be extended even further so that they can
gain additional experience with repeated use. The presented method is intended to
assist instead of replace visual inspection, with the aim of significantly reducing
review time for clinicians and neurologists.
5.2 Methods
5.2.1 Subjects and data
An EEG dataset for this study was obtained from the department of Clinical Neu-
rophysiology at the Medisch Spectrum Twente (MST) in the Netherlands. Record-
ings were made with a standard 20-30 minute protocol using a Brainlab EEG system
and standard Ag-AgCl electrode caps placed according to the international 10-20
guidelines. Impedances were kept below 5 kΩ to reduce polarization eects. A

Inter-ictal spike detection using smart templates | 81
sample rate of either 250 Hz or 256 Hz was used for each recording. Aerwards it
was band-pass filtered between 0.5-30 Hz, and downsampled to 100 Hz to increase
eiciency of the algorithm. IEDs were marked and reviewed by experienced elec-
troencephalographers on the channels where they were clearly visible (MvP and
JA). Each IED consisted of one of the following paerns: (i) spike, (ii) sharp wave,
(iii) spike and slow wave, (iv) sharp wave and slow wave (v) slow wave with absent
or very small preceding spike, or (vi) polyspike and slow wave. IEDs were marked
in three montages: common reference, bi-polar and source.
The dataset consisted of 23 records with 723 IEDs in total and a combined record-
ing length of 481 min. The patient group consisted of 15 males and 8 females with
ages ranging from 4 to 52 (mean 23.2± 17.1) years. Thirteen subjects were diag-
nosed with generalized epilepsies (4 absence, 1 juvenile myoclonic, 8 idiopathic),
and the remaining ten with focal epilepsies (5 temporal lobe, 1 rolandic, 4 other).
The dataset was split into two parts, one for template collection and training, and
the other for an evaluation set. Eight EEGs were used for training and fieen for
testing. The training set contained 482 marked IEDs with a total recording length
of 175 min. The testing set contained 241 marked IEDs with a total recording length
of 306 min.
5.2.2 Preprocessing
Independent component analysis was used to reduce the influence of eye blink
artifacts. Aer calculating the independent components with the FastICA algo-
rithm1, each component was compared to the electrooculogram (EOG) channel
recorded with the EEG. If a component showed a substantial correlation with the
EOG channel (>0.5), it was removed by seing all its values to zero. The remain-
ing components were projected back to their channel space by applying the inverse
transform.
5.2.3 Method outline
The presented method uses a database of templates resembling typical wave-
forms of epileptiform activity, and finds matches between the templates and inter-
ictal events in the EEG. The main concepts that make this method dierent from
others are the following: (i) a substantially larger set of templates is used, (ii) the
templates are designed to have experience by remembering past classifications and
1Available at hp://research.ics.aalto.fi/ica/fastica/

82 | Chapter 5
using this to improve future predictions, and (iii) an agreement system is used to
combine detected events from multiple templates and thus lower false detections.
The sections that follow give a detailed outline of the various parts of the method,
which can be divided into template collection, learning, and detection. An illustra-
tive summary of the template collection and learning phase is shown in Fig. 1, and
one for the detection phase in Fig. 2.
5.2.4 Template collection
Starting with a blank database, templates are added using a training dataset.
For each EEG in the training set, a collection of epochs is extracted at the locations
where IEDs were marked by the reviewers. Each epoch represents a template and
is added to the database. Three montages are used during collection: common
reference, bi-polar, and source. Templates are extracted per channel, i.e. if an IED
is marked over two channels in the common reference montage and one channel in
the bi-polar montage, three templates will be created. Single spikes or sharp waves
were not included as templates, due to a high degree of false detections. An example
of extracted templates is shown in Fig. 3. Note that they also have dierences in
magnitude (amplitudes were not normalized, but used ‘as recorded’).
5.2.5 Learning
Aer extracting the templates, their ability to find and discriminate between
other IEDs from the same or other recordings and non-epileptiform activity is de-
termined. This is done by finding a time-shied correlation between each template
and all EEG channels for all EEGs in the training set with the same montage. Due
to the computational cost involved, this part of the algorithm was implemented
with parallel processing. Locations are foundwhere the templates have correlations
above 0.85, and the underlying EEG segment is extracted to calculate additional
properties to further determine the relationship between them and the template by
which they were detected. For this, let a template consisting of N samples (N dif-
fers per template) be defined as Stem(n) : n ∈ [1..N ], and each segment it finds as
Sseg(n) : n ∈ [1..N ], as illustrated in Fig. 4. In addition, let the preceding N sam-
ples of each segment (same length as segment) be defined as Sprec(n) : n ∈ [1..N ]
and the variance of the channel on which the segment is located as σ2ch. Then, the

Inter-ictal spike detection using smart templates | 83
following properties are calculated:
fCRR = corr(Stem, Sseg), (5.1)
fDCRR = corr(S′tem, S′
seg), (5.2)
fMAD =1
N
N∑
n
‖Stem(n)− Sseg(n)‖, (5.3)
fVRCHAN =σ2seg
σ2seg + σ2
ch
, (5.4)
fVRTEM =σ2seg
σ2seg + σ2
tem
, and (5.5)
fVRPREC =σ2seg
σ2seg + σ2
prec
, (5.6)
where
σ2seg = var(Sseg), (5.7)
σ2tem = var(Stem), and (5.8)
σ2prec = var(Sprec). (5.9)
In addition to having a high correlation with the template (fCRR ≥ 0.85), these
properties are used to determine the similarity between each detected segment and
its template. Property fDCRR measures the correlation between the derivatives of
Sseg and Stem, fMAD finds the mean amplitude dierence between Sseg and Stem,
and fVRCHAN, fVRTEM and fVRPREC calculates the variance ratio between σ2seg and the
sum of σ2seg with σ2
ch, σ2tem and σ2
prec respectively.
Using these properties, the location of each segment is converted to a “nomi-
nation” of an IED event if it satisfies both of the following conditions: (i) fMAD <
20µV, and (ii) fVRCHAN > 0.75 or fVRPREC > 0.67. Given that the correlation between
two segments is scale invariant, the first requirement ensures that their magnitude
is similar. The second requirement is based on the assumption that, for scalp EEG,
the amplitude changes within an IED segment will be significantly larger than its
preceding segment and the channel variance. Threshold values were chosen arbi-
trarily. Given that the true locations of IEDs are known in the training set, each

84 | Chapter 5
Fig. 1: Outline of the template extraction and learning steps. Aer the templates are trained, eachof them contributes to the detection by nominating possible IEDs.
nomination is either marked as correct or as a false detection, depending on if any
of its samples overlap in time with a marked IED. At this point, the false detection

Inter-ictal spike detection using smart templates | 85
Fig. 2: Outline of the detection method. Trained templates detect and nominate possible IEDs. Thesystem combines these nominations and identifies IEDs based the the mutual agreement of multiple
templates.
rate of a template can be calculated:
FDRtem =false detections
true detections+ false detections. (5.10)
Using only the criteria above to nominate events as IEDs lead tomany false detec-
tions. Therefore, a linear support vector machine (SVM) is trained using the nomi-
nations in the training set to give the template additional experience in discriminat-
ing between true IEDs and false predictions. Vectors consisting of fCRR, fDCRR, fVRTEM
are used as input. By having an SVM trained on past classifications, the template
can now find events with high correlation to itself and predict if it is in fact an

86 | Chapter 5
0 0.2 0.4 0.6−30
−20
−10
0
10
20
s
µV
0 0.2 0.4 0.6−100
−50
0
50
s
µV
0 0.2 0.4 0.6−40
−20
0
20
40
s
µV
0 0.2 0.4 0.6−80
−60
−40
−20
0
20
40
s
µV
0 0.2 0.4 0.6
−50
0
50
s
µV
0 0.2 0.4 0.60
20
40
60
80
s
µV
0 0.2 0.4 0.6
−50
0
50
s
µV
0 0.2 0.4 0.6−40
−20
0
20
40
60
s
µV
0 0.2 0.4 0.6−100
−50
0
s
µV
Fig. 3: Nine templates taken from the trained database consisting of 2160 templates. Templatelengths are allowed to dier and amplitudes are preserved.
SsegSprec
Stemtem
segprecch
Fig. 4: Template features: To find matching events, templates use correlation coeicients, amplitudedierences and variance ratios between a template and its detected segment. Variance ratios add
temporal context to a detected event by comparing it to its surrounding activity.
epileptiform event or not. Aer a template’s SVM is trained, its reliability (Rtem) is
calculated as the accuracy of re-classifying its own training vectors. The reliability
reflects a templates ability to separate IEDs from non-epileptiform events, and is
used as a weight factor during detection.

Inter-ictal spike detection using smart templates | 87
Aer all training steps are complete, templates that do not comply with the fol-
lowing conditions are discarded: (i) Templates with zero detections, (ii) templates
with only false detections, (iii) templates with a small number of correct detections
and no false detections. The last condition avoids templates that only find them-
selves in the training set and which have no use in finding other IEDs.
5.2.6 Detection
For detection, a similar approach is followed as during learning: For each tem-
plate in the database, a time-shied correlation is calculated on each EEG channel.
Locations with correlations above 0.85 are nominated as IEDs if they also satisfy
the conditions: (i) fMAD < 20µV and (ii) fVRCHAN > 0.75 or fVRPREC > 0.67, and
using each template’s own SVM, a prediction is made if the event is in fact an IED
or only a similar looking artifact. False predictions are discarded and the remaining
events are converted to nominations and added to a global pool. Nominations are
stored with the following information about themselves: (a) its onset and duration,
(b) the channel on which it was found, (c) fCRR, and (d) Rtem.
Next, nominations are grouped together if they reside on the same channel and
overlap with more than 75%. Groups with fewer than 3 nominations are considered
unreliable and are discarded. Each of the remaining groups is considered a detected
event, and the onset and duration is taken from the mean of the nominations in the
group. The event is also assigned a detection certainty, which is done by calculating
the mean product of each nomination’s correlation and template reliability:
certainty =1
M
M∑
m
Rtem(m)fCRR(m), (5.11)
with M the number of nominations in that group. Lastly, events from individual
channels are merged into one if they overlap in time, and once again the mean
onset, duration and certainty is used to describe the event.
5.3 Results
A total of 2632 templates were collected during training, of which 472 were dis-
carded for not passing the constraints described in Section 5.2.5. To gain some in-
sight on the behavior of the remaining 2160 templates, histograms of FDRtem and
Rtem are provided in Fig. 5.5(a) and Fig. 5.5(b) respectively. The mean false detec-
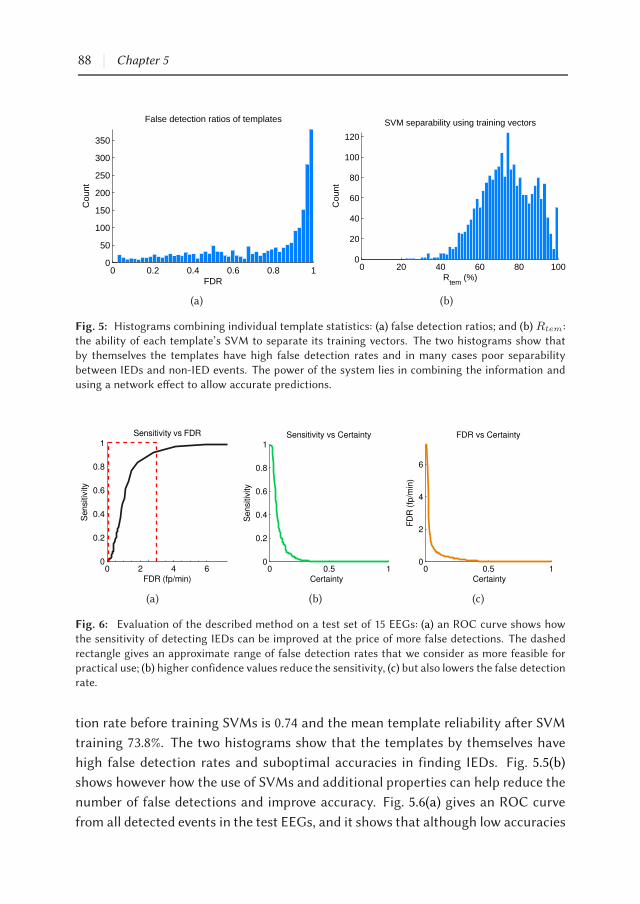
88 | Chapter 5
0 0.2 0.4 0.6 0.8 10
50
100
150
200
250
300
350
False detection ratios of templates
FDR
Cou
nt
(a)
0 20 40 60 80 1000
20
40
60
80
100
120
SVM separability using training vectors
Rtem
(%)
Cou
nt
(b)
Fig. 5: Histograms combining individual template statistics: (a) false detection ratios; and (b) Rtem:the ability of each template’s SVM to separate its training vectors. The two histograms show thatby themselves the templates have high false detection rates and in many cases poor separability
between IEDs and non-IED events. The power of the system lies in combining the information andusing a network eect to allow accurate predictions.
0 2 4 60
0.2
0.4
0.6
0.8
1
Se
nsi
tivity
Sensitivity vs FDR
FDR (fp/min)
(a)
0 0.5 10
0.2
0.4
0.6
0.8
1Sensitivity vs Certainty
Se
nsi
tivity
Certainty
(b)
0 0.5 10
2
4
6
FDR vs Certainty
Certainty
FD
R (
fp/m
in)
(c)
Fig. 6: Evaluation of the described method on a test set of 15 EEGs: (a) an ROC curve shows howthe sensitivity of detecting IEDs can be improved at the price of more false detections. The dashed
rectangle gives an approximate range of false detection rates that we consider as more feasible forpractical use; (b) higher confidence values reduce the sensitivity, (c) but also lowers the false detectionrate.
tion rate before training SVMs is 0.74 and the mean template reliability aer SVM
training 73.8%. The two histograms show that the templates by themselves have
high false detection rates and suboptimal accuracies in finding IEDs. Fig. 5.5(b)
shows however how the use of SVMs and additional properties can help reduce the
number of false detections and improve accuracy. Fig. 5.6(a) gives an ROC curve
from all detected events in the test EEGs, and it shows that although low accuracies

Inter-ictal spike detection using smart templates | 89
are achieved at template level, the combined information from individual templates
lead to reliable detections on a global level. As seen in Fig. 6, the certainty threshold
can be adjusted to either maximize the sensitivity or minimize the false detection
rate. Figures 5.6(b) and 5.6(c) respectively show the sensitivity and false detection
rate as a function of minimum certainty, and Table 1 gives corresponding values
to a number of points on the curves in Fig. 6. For all test EEGs combined, a maxi-
mum sensitivity of 0.99 is reached at a false detection rate of 7.24 false positives per
minute. Note that the IED rate in the evaluation set is only 0.79 IEDs per minute,
and so a false detection rate of 7.24 will be unacceptable for practical use. Although
far from ideal, we consider a more acceptable false detection rate for reviewing to
be below three per minute. The mean sensitivities obtained aer adjusting the cer-
tainty threshold of each EEG individually is shown in Table 2. The thresholds were
chosen in such away as to limit the false positives perminute to nomore than three.
Aer this, a mean sensitivity of 0.90 and mean false detection rate of 2.36 min−1 is
achieved. The selection of a threshold cannot be chosen a priori to limit the false
detection rate to a known maximum, but this shows that detections with higher
certainties are more reliable. In a typical usage scenario, a user may choose to view
events with the highest certainties first, and then gradually reduce the threshold if
he wishes to see more.
In addition to the detection algorithm, the described method was also imple-
mented into an EEG viewer. Fig. 7 shows how each of the detected events are pre-
sented, and using the options provided, the reviewer can decide to either confirm,
reject, or indicate doubt concerning each detected event. In such a way, the method
can be used to assist during a review by pointing out areas of interest in the EEG
and allowing the reviewer to give the final verdict.
5.4 Discussion
Automated detection of inter-ictal epileptiform discharges is a crucial step to-
wards improving the eiciency of epilepsy diagnostics and monitoring. Not only
does it reduce the review time significantly and make longer recordings feasible,
but it also allows for more objective analysis with less inter-observer variability. The
presented method uses a large collection of templates to detect inter-ictal epilep-
tiform discharges. It keeps track of past classifications during training in order
to provide the templates with additional statistical experience, and the size of the
database allows it to contain example spike-and-slow-wave paerns of many mor-

90 | Chapter 5
Table 1: Choosing to maximize the sensitivity or minimize the false detection rate can be doneby adjusting the minimum confidence threshold. This allows a reviewer to view the most probableIEDs first, and then to look at additional events if desired. Values below correspond to points on
Fig. 6(a)-(c).
Min confidence Mean sensitivity Mean Fp/min
0 0.99 7.24
0.02 0.97 4.12
0.04 0.67 1.29
0.06 0.44 0.87
0.08 0.27 0.62
0.1 0.2 0.54
0.12 0.15 0.41
0.14 0.08 0.37
0.16 0.07 0.31
0.18 0.06 0.29
0.2 0.04 0.26
0.22 0.03 0.22
0.24 0.02 0.19
0.26 0.02 0.16
Table 2: Mean sensitivities and false detection rates per EEG in the test set using a varying confi-dence threshold value per EEG and limiting false detections to a maximum of three per minute.
EEG Dur (min) IEDs SEN Fp/min
S1 16.3 13 1.00 1.59
S2 22.5 11 0.82 2.93
S3 20.0 5 1.00 1.40
S4 20.0 36 0.97 2.60
S5 22.3 19 0.79 1.93
S6 19.5 6 1.00 2.72
S7 20.3 79 0.97 1.82
S8 21.2 5 0.80 1.98
S9 20.0 2 1.00 2.95
S10 20.0 12 1.00 2.00
S11 21.5 7 0.38 2.88
S12 20.3 7 0.86 2.95
S13 20.7 19 0.95 2.08
S14 21.0 14 1.00 2.95
S15 20.0 6 1.00 2.60
mean 20.4 16.07 0.90 2.36

Inter-ictal spike detection using smart templates | 91
phologies so that IEDs can be detected across multiple patients and recordings, re-
gardless of whether their inter-ictal paerns look the same. In addition, using the
experience of each template, the system can determine its reliability during detec-
tion. This approach resembles the way in which humans search for IEDs: by find-
ing waveforms that have properties associated with IEDs, and mentally comparing
them to paerns observed in the past. In addition to high correlations between
templates and detected EDs, additional features were chosen to add information
and improve detection accuracy. Given that correlations are scale independent, the
mean amplitude dierence (fMAD) ensures that matching events are on the same
scale, and the variance ratios (fVRCHAN, fVRTEM, fVRPREC) ensure that IEDs are sig-
nificantly dierent from its surrounding activity. By adding these properties, the
method is capable of not only using wave morphology, but also temporal context.
To improve accuracy, the system removes uncertainties of single templates by
using a network eect to make decisions. In other words, even though individual
templates by themselves miss events andmakemany false detections, the collective
value of their votes result in accurate detections. Using this approach, the system
is less vulnerable to variability in spike morphology than other methods which rely
on single features or a small number of templates. Still, the system is highly depen-
dent on the templates contained within its database. Our results show that mosts
IEDs can be detected with the current set of templates and thresholds described.
However, the ideal set (and number) of templates to find all common inter-ictal pat-
terns is not known, and it could be that additional templates with more variations
in spike and wave morphology will allow the system to match events more accu-
rately, allowing higher thresholds for individual detections, and thereby lowering
the overall false detection rate.
A major advantage of this technique is that the system remains dynamic and
that more templates can be added if required. By further extending the method
and adding a feedback loop during reviews, the database can become adaptive. As
an example, missed events can be added as templates if a reviewer finds any IEDs
visually during a review. Another example is if template reliabilities change when
new EEGs are reviewed and false detections are marked by a reviewer. As cur-
rently implemented, templates search for matching IEDs in parallel to each other.
Although not strictly neccesary, this speeds up the detection process significantly
and makes the system scalable and fast enough for clinical use. Our implementa-
tion of the method runs on a standard desktop computer (Intel i7-2600 3.40 GHz
CPU, 4 GB RAM) and requires no additional hardware.

92 | Chapter 5
5V
1
Fig. 7: A detected IED highlighted on top of the EEG, as displayed to the reviewer in a bi-polarmontage.
Reviews by Wilson and Emerson (2002) and Halford (2009) summarize most of
the reported techniques over the last four decades. In addition to these, newer
methods have also been reported (Nonclercq et al., 2009, 2012; Scherg et al., 2012;
Ji et al., 2011a,b; Igasaki et al., 2011; Argoud et al., 2006; Nenadic and Burdick, 2005;
Wang et al., 2010; Zhou et al., 2012). Comparisons between dierent methods are
hard to make because there is no common dataset currently available. Without
a benchmark dataset, reported results rely heavily on the data used. For example,
some studies use standard 20minute recordings to evaluate theirmethods, whereas
others use longer recordings or smaller EEG segments simply categorized as either
containing IEDs or not. If the number of IEDs per minute are not within the same
range between datasets, measures such as the specificity, selectivity and the false
detection rate cannot be compared in a fairmanner. As suggested byHalford (2009),
a multi-center project is needed to create a dataset for reliable benchmarks. The
author later presents such a dataset, and although still under development, it may
suice for benchmark testing and future comparisons (Halford et al., 2011, 2012).
Regardless of using dierent datasets, our method compares well to others. De-
pending on the confidence threshold chosen, the system achieves sensitivities of
up to 0.99. With thresholds chosen as to limit the false detection rate, a mean sen-

Inter-ictal spike detection using smart templates | 93
sitivity of 0.90 and mean false detection rate of 2.36 is achieved. We feel that the
threshold should be set interactively by the reviewer during runtime, which can
start by viewing the most probable IEDs first with a high threshold value, and then
gradually view more detections (with greater false detection rate) if needed by low-
ering it.
Apart from achieving high accuracies in epileptiform event detection, automated
methods should also be responsible for presenting their findings to the reviewer in
a fast and eicient manner. Although some commercial applications already exist,
automated detection is mostly ignored by practicing neurologists. One reason for
this could be that the soware is still too complicated and time consuming to use.
Fig. 7 shows an example of how a detected event is presented to a clinician. To make
review time faster, events can be grouped by location or morphology and reviewing
can take place on a macro scale to save time. This is already shown in some studies
(and some products) who use clustering techniques to group similar looking events
together (Nonclercq et al., 2012; Scherg et al., 2012; Ji et al., 2011a).
Although our method shows promising results, it is still far from ideal and some
reported methods appear to perform beer. Many of them however, have already
been refined to the point where further improvement is limited. Our method, as
presented here, is only a first step in testing a novel approach where many im-
provements can still be made. In work to follow, we will try to use more of the
spatial context available to discard artifacts and lower the false detection rate. One
way that we can achieve this is by introducing event clustering. Events with sim-
ilar properties can be clustered, and each cluster’s validity as IEDs can be deter-
mined based on the spatial distribution and frequency of occurrence of the events
it contains. Apart from clustering, a number of ad hoc rules can also be applied
as a post-detection step to mimic the procedures followed by reviewers when de-
termining the validity of IEDs. Further work will also focus on testing the system
on long-term EEG recordings such as in-home ambulatory monitoring, where the
burden of visual inspection is even greater and more problematic for the reviewer.
In summary, automated detection of inter-ictal epileptiform activity will become
invaluable to current reviewing techniques that rely mostly on visual analysis. A re-
liable system for a wide range of EEGs with dierent spike morphologies is needed,
which should be tested with a gold-standard dataset for comparisons with other
techniques. With minor improvements and an intuitive interface, the presented
method is capable of providing more eiciency with reviewing and in turn improve
the diagnostic eiciency of epilepsy.


Chapter 6
A Self-Adapting System for
the Automated Detection of
Inter-Ictal Epileptiform
Discharges
Shaun S. Lodder
Michel J. A. M. van Puen
PLOS ONE 2013

Abstract
Scalp EEG remains the standard clinical procedure for the diagnosis of epilepsy.
Manual detection of inter-ictal epileptiform discharges (IEDs) is slow and cumber-
some, and few automated methods are used to assist in practice. This is mostly
due to low sensitivities, high false positive rates, or a lack of trust in the automated
method. In this study we aim to find a solution that will make computer assisted
detection more eicient than conventional methods, while preserving the detection
certainty of a manual search. Our solution consists of two phases. First, a detec-
tion phase finds all events similar to epileptiform activity by using a large database
of template waveforms. Individual template detections are combined to form “IED
nominations”, each with a corresponding certainty value based on the reliability
of their contributing templates. The second phase uses the ten nominations with
highest certainty and presents them to the reviewer one by one for confirmation.
Confirmations are used to update certainty values of the remaining nominations,
and another iteration is performed where ten nominations with the highest cer-
tainty are presented. This continues until the reviewer is satisfied with what has
been seen. Reviewer feedback is also used to update template accuracies globally
and improve future detections. Using the described method and fieen evaluation
EEGs (241 IEDs), one third of all inter-ictal events were shown aer one iteration,
half aer two iterations, and 74%, 90%, and 95% aer 5, 10 and 15 iterations respec-
tively. Reviewing fieen iterations for the 20-30min recordings took approximately
5 min.
Significance: The proposed method shows a practical approach for combining auto-
mated detection with visual searching for inter-ictal epileptiform activity. Further
evaluation is needed to verify its clinical feasibility and measure the added value it
presents.
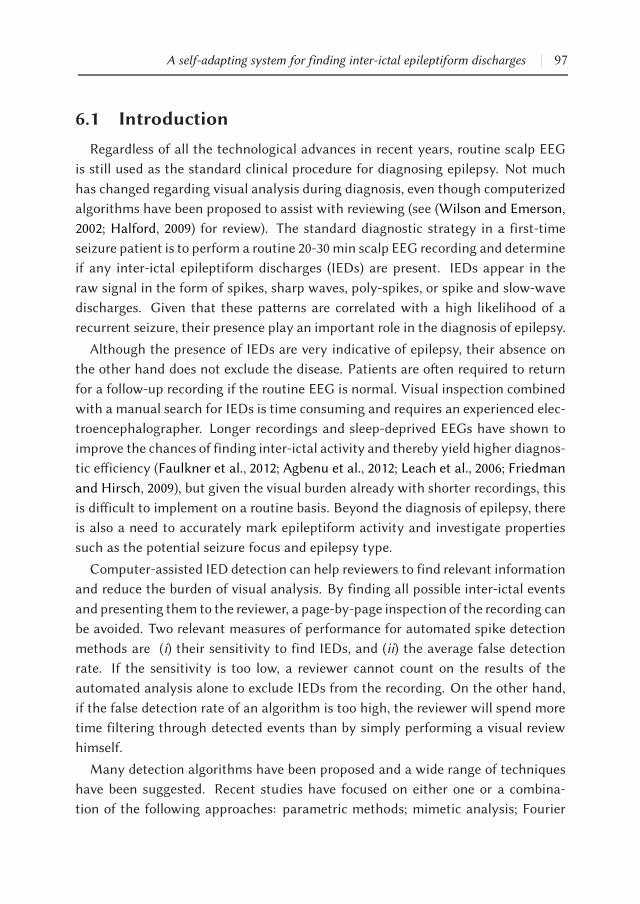
A self-adapting system for finding inter-ictal epileptiform discharges | 97
6.1 Introduction
Regardless of all the technological advances in recent years, routine scalp EEG
is still used as the standard clinical procedure for diagnosing epilepsy. Not much
has changed regarding visual analysis during diagnosis, even though computerized
algorithms have been proposed to assist with reviewing (see (Wilson and Emerson,
2002; Halford, 2009) for review). The standard diagnostic strategy in a first-time
seizure patient is to perform a routine 20-30 min scalp EEG recording and determine
if any inter-ictal epileptiform discharges (IEDs) are present. IEDs appear in the
raw signal in the form of spikes, sharp waves, poly-spikes, or spike and slow-wave
discharges. Given that these paerns are correlated with a high likelihood of a
recurrent seizure, their presence play an important role in the diagnosis of epilepsy.
Although the presence of IEDs are very indicative of epilepsy, their absence on
the other hand does not exclude the disease. Patients are oen required to return
for a follow-up recording if the routine EEG is normal. Visual inspection combined
with a manual search for IEDs is time consuming and requires an experienced elec-
troencephalographer. Longer recordings and sleep-deprived EEGs have shown to
improve the chances of finding inter-ictal activity and thereby yield higher diagnos-
tic eiciency (Faulkner et al., 2012; Agbenu et al., 2012; Leach et al., 2006; Friedman
and Hirsch, 2009), but given the visual burden already with shorter recordings, this
is diicult to implement on a routine basis. Beyond the diagnosis of epilepsy, there
is also a need to accurately mark epileptiform activity and investigate properties
such as the potential seizure focus and epilepsy type.
Computer-assisted IED detection can help reviewers to find relevant information
and reduce the burden of visual analysis. By finding all possible inter-ictal events
and presenting them to the reviewer, a page-by-page inspection of the recording can
be avoided. Two relevant measures of performance for automated spike detection
methods are (i) their sensitivity to find IEDs, and (ii) the average false detection
rate. If the sensitivity is too low, a reviewer cannot count on the results of the
automated analysis alone to exclude IEDs from the recording. On the other hand,
if the false detection rate of an algorithm is too high, the reviewer will spend more
time filtering through detected events than by simply performing a visual review
himself.
Many detection algorithms have been proposed and a wide range of techniques
have been suggested. Recent studies have focused on either one or a combina-
tion of the following approaches: parametric methods; mimetic analysis; Fourier

98 | Chapter 6
or wavelet analysis; artificial neural networks; template matching; context-based
rules; and event clustering (Scherg et al., 2012; Nonclercq et al., 2012, 2009; Halford
et al., 2012; Ji et al., 2011a; Wang et al., 2010; De Lucia et al., 2008; Indiradevi et al.,
2008; Zhou et al., 2012; Lodder et al., 2013; Argoud et al., 2006; Subasi, 2006; Inan and
Kuntalp, 2007; Van Hese et al., 2008; Kumar et al., 2012; Shen et al., 2013). Clearly,
a lot of thought has been given to eective ways of detecting inter-ictal activity.
However, almost all of these methods require thresholding to separate IEDs from
other events in some way or another, making them limited in achieving both high
sensitivities and low false detection rates at the same time. Low thresholds will
result in high sensitivities with many false detections, whereas high thresholds will
reduce the number of false detections but also lower the sensitivity.
Instead of simply searching for another spike detection technique, this study
focused on finding a practical approach to combining automated detection with
manual searching. This was achieved by bringing together the detection and review
phases with the help of detection certainty values for each event, and updating
detected event certainties with the help of user feedback. With our approach, we
were able to circumvent the limitation imposed by detection algorithms where a
threshold value has to be chosen to achieve either high sensitivities or low false
positive rates. By design, the described system learns from the feedback it receives
and updates the certainty values of the remaining nominations to prioritize more
likely events. In addition, the feedback is also used to update the system on a global
level, which aims to improve future detections and reviews.
The ultimate goal of this system is to improve reviewing accuracy and reduce
standard review times to below the average of manual detection.
6.2 Methods
This section is divided into two parts. The first part reviews the template-based
spike detection algorithm described in (Lodder et al., 2013) which we also use in this
study, and summarizes the main steps needed to obtain a collection of detections
which serve as “nominated” inter-ictal events. The second part explains how these
nominations are grouped together and presented to the reviewer for verification,
and how the proposed system can adapt during verification to learn from reviewer
feedback. The template-based detection method was chosen for two reasons. First,
by using a wide range of IED samples extracted from EEG training data and using
the principle of voting and reliability to prioritize detections, the system is able

A self-adapting system for finding inter-ictal epileptiform discharges | 99
to scale to any recording given that the IEDs it contains are similar in morphology
than the templates in the database. Secondly, by using this technique, we were able
to assign a certainty value to each detection which enabled us to sort the events in
decreasing order of likelihood.
6.2.1 Template-based IEDdetection andnominating inter-ictal events
Collection and training of a template database
To locate possible IEDs in an EEG recording, a database of templates is used to
find high correlations with events that represent inter-ictal epileptiform activity.
Each template represents a sample IED waveform, and together with this the num-
ber of detections it has made in the past are stored including the outcomes of these
detections, i.e. true or false positive. The database requires training only once with
a training dataset and can thereaer be used on any new EEG to find inter-ictal
epileptiform events. For building a database of IED template waveforms, a train-
ing set of eight EEGs were used with a total recording length of 175 min. For the
training set, an experienced electroencephalographer (MvP) was asked to mark all
inter-ictal events in each recording where a clear spike-wave discharge could be
seen. Spike-wave events were marked individually on all channels where they were
visible. The review took place in three montages: common reference, bi-polar, and
Laplace. The training dataset consisted out of 482 inter-ictal events, and from them
a total of 2973 spike-wave samples were marked across all channels and montages.
Using these marked events as our templates, a database was created where each
underlying epoch of data was extracted and stored. Templates ranged from 212 to
860 milliseconds in length. Some sample waveforms are shown in Fig. 1.
Aer extracting the templates, their ability to find and discriminate between
other IEDs from the same or other recordings and non-epileptiform activity was
determined. This was done by finding a time-shied correlation between each tem-
plate and all EEG channels for all EEGs in the training set with the same montage.
Locations were found where the templates had correlations above 0.85, and the un-
derlying EEG segment was extracted to calculate additional properties to further
determine the relationship between itself and the template by which it was de-
tected. These properties related to matching variance, amplitude dierences, and
the ratio between the detected epoch and EEG segments preceding it. For a de-
tailed description of the properties, see (Lodder et al., 2013). Using the correlations
between the detected epochs and the template, together with the additional prop-

100 | Chapter 6
Fig. 1: Sample template waveforms collected from a training dataset. To find inter-ictal epileptiformactivity in new unseen EEGs, each template searches for matching waveforms with high correlations
to themselves. Thereaer, individual template detections are combined to form “IED nominations”which are then presented to the reviewer in decreasing order of likelihood.
erties and a known outcome for each detection, a linear support vector machine
(SVM) was trained with these parameters as features to learn the dierence be-
tween true and false detections. The trained SVM for each template together with
its score of true and false positives was stored in the database for further use dur-
ing detection. During the training phase, templates were discarded if they had zero

A self-adapting system for finding inter-ictal epileptiform discharges | 101
detections, only false detections, or a small number of correct detections and no
false detections. Aer discarding unwanted templates, a total of 2256 remained.
IED detection in new EEG recordings
For the detection of inter-ictal activity in new recordings, a similar procedure
was used as during learning: for each template in the database, a time-shied cor-
relation is calculated on every EEG channel in three montages: common reference,
bi-polar and Laplace. Epochs with correlations above 0.85 are “nominated” as IED
events if they satisfy both the property constraints for that template and it’s SVM
classifies it as an IED. Each nomination is also assigned a reliability value, which is
calculated as TPs/(TPs + FPs), where TPs and FPs are the total number of
true and false predictions that the template has made over all time (note that these
scores are saved together with each template in the database).
6.2.2 Using IED nominations to find inter-ictal events
Our main goal in this study was to combine automated methods with visual re-
views to obtain a clinically feasiblemethod for computer-assisted detection of inter-
ictal epileptiform discharges. By not discarding any events or using any thresholds
during the detection phase, the system was not optimized for achieving a high
specificity. Instead, our focus was on providing the reviewer with as many inter-
ictal events as possible within a reasonable amount of time. By using an eicient
algorithm to present the reviewer with the most probable events first, it is not re-
quired of him to review all the detected events in order to draw informed conclu-
sions. Given that the review process is interactive and that no thresholds are used,
many of the nominated events will be false positives which are not necessarily pre-
sented to the reviewer andROC curves cannot be used fairly to evaluate the benefits
of such a system. Instead, we aim to measure its performance by the percentage of
IEDs in a recording that can be shownwithin a feasible amount of time or minimum
number of iterations.
To graphically illustrate how the adaptive reviewing method works, a flow dia-
gram of the described system is shown in Fig. 2. As a first step, all IED nominations
are found using the template-based IED detectionmethod described in the previous
section. As shown in the diagram, the detection phase can be performed indepen-
dently at any time before the EEG review takes place. Using Fourier optimizations
to calculate the correlations (circular convolution), this takes approximately 12-14

102 | Chapter 6
min for a 20-30 min recording. This can occur directly aer the recording, aer an
upload to the hospital database, or even in real-time during acquisition. Because
very few reviews will occur directly aer a routine recording in practice and that
this step can be completely automated, it can be considered as part of the acqui-
sition and preprocessing step, and not as part of the actual review time for the
electroencephalographer.
Grouping
When the computer-assisted review starts, all IED nominations from individual
templates are loaded and overlapping events are merged to form grouped nomina-
tions. This is illustrated in Fig. 3. Merging takes place in two steps. First, overlap-
ping template nominations are combined on the same channel if they overlap by
more than 75%. Grouped events with fewer than three nominations are discarded.
Next, overlapping groups over dierent channels are merged together where their
onsets start within one second from the first item in the group. Aer these two
steps, a number of grouped nominations have been obtained which point to seg-
ments in time where possible inter-ictal activity may exist.
Group presentation combined with reviewer feedback
If the entire list of group nominations were to be shown to a reviewer, more than
99% of the inter-ictal discharges in each recording will be found (see results (Lodder
et al., 2013)). However, this method has the disadvantage of also having a very
high false positive rate, and without a smart way of presenting the detections, the
reviewer is beer o searching for IEDs manually. Fortunately, and what also sets
this method apart from other techniques, is that each grouped nomination has an
assigned certainty value based on a combination of two factors: (i) the correlation
of each contributing template to the detected segment, and (ii) the reliability of
those templates in making accurate detections. The calculation of each nomination
group’s certainty value is shown in the Appendix. Using the certainty value to the
system’s advantage, a limited number of nominations with high likelihoods are
shown to the reviewer, and in an iterative manner, more can be requested until the
reviewer is satisfied with what has been seen. By presenting the nominated events
in iterations, the system is able to receive feedback during the review. This allows it
to update the reliability of the templates and thereby show more reliable detections
first.

A self-adapting system for finding inter-ictal epileptiform discharges | 103
Template DB
(trained)
Input EEG
co
mm
on
re
f
bi-p
ola
r
so
urc
e
For each template:
- detect segments with high correlation to itself (>0.85).
- detections not satisfying additional constraints discarded.
detections
tem
pla
tes
- Merge detections found on the same channel with more than 75% overlap.
Remember contributing templates.
- Discard where fewer than 3 contributing templates.
- Group across channels where merged detections overlap in time and promote
to IED nominations.
IED nominations
10 most likely IEDs
Calculate the group certainty for each nomination. Order groups by
certainty and select first 10 nominations.
For each of the 10 most likely nominations:
- Review one by one: confirm, reject, unsure
- Update template history (TPs | FPs) for all templates contributing to
reviewed nomination.
- Remove from list of unreviewed nominations.
Another iteration?
yes
no
Store all confirmed events.
Det
ectio
nIte
rativ
e R
evie
wM
ergi
ng a
nd G
roup
ing
Update database with new
template reliabilities.
Review complete
* This can be performed prior to the review or in real-time
during EEG aquisition.
Fig. 2: Outline of the IED detection, grouping, and presentation steps. Multiple detections of inter-ictal activity are made using a database of matching template waveforms. Individual template detec-
tions aremerged and grouped (see Fig. 3) to form IED nominations, and the nominations are presentedfor review in an iterative manner, ordered by nomination certainty.

104 | Chapter 6
co
mm
on
re
fb
i-p
ola
rso
urc
e
Overlapping template detections
on same channel merged together.
Events with fewer than 3 detections
discarded.
IED nominations represent a single event in
time, with marked channels showing where
possible inter-ictal discharges can be seen.
Fig. 3: Grouping and merging of template detections. Overlapping templates are merged togetherand grouped to form single IED nominations, which are presented to the reviewer as a single event intime. Channels containing template detections are highlighted to point out where inter-ictal activity
was found.
Implementation of the described procedure is as follows: Using the entire pool of
nominations obtained from the merging and grouping phase, group certainty val-
ues are calculated for each nomination. The ten nominations with highest group
certainties are then shown to the reviewer one at a time, and the reviewer is given
the chance to either confirm the nomination as an IED, reject it, or label it as un-
sure. Aer the ten nominations have been graded, their outcomes are returned to
the system and the reliabilities of the contributing templates are updated. Given
that template reliabilities aect the group certainties of each IED nomination (see
Appendix), the group certainties of the remaining nominations are updated. There-
aer, another iteration takes place where ten of the remaining group nominations
with highest certainties are shown. This process continues until the reviewer is

A self-adapting system for finding inter-ictal epileptiform discharges | 105
satisfied with the events seen or until all nominations have been shown. When
the review is complete, all confirmed nominations are stored and marked in the
recording as detected IEDs.
Global update for sustained learning
Apart from making the review of automated detection more eicient by showing
the most probable nominations first, this method also allows the system to im-
plement a globally adaptive technique for improving future detections. Aer an
EEG review is complete, the template database is updated to include the additional
number of true and false positives made by each template. As described above and
also shown in the Appendix, template reliabilities are measured by the number of
true and false positives made in the past. Given that more classifications are added
over time, a more accurate measure of each template’s reliability can be derived.
Therefore, over time with continuous use of this technique, reliable templates will
become more reliable and have more influence during detection, whereas less reli-
able templates will receive a lower weight and have less influence.
6.2.3 Subjects and data
A dataset from the department of Clinical Neurophysiology at theMedisch Spec-
trum Twente (MST) Hospital in the Netherlands was used to evaluate the proposed
method. All EEG data were obtained as part of routine patient care and anonymized
before use. Our evaluation dataset consisted of 15 EEGs with a total recording
length of 306 min and 241 marked IEDs. The inter-ictal events were marked prior
to our evaluation by an experienced electroencephalographer (MvP), and given the
time consuming nature of this, only the onset and duration of IEDs were marked
and not specific channel information. Table 1 provides additional information about
each recording in the evaluation set. Recordings were made using a standard 20-30
minute protocol with the Brainlab EEG system. Ag-AgCl electrode caps were used
with electrodes placed according to the 10-20 system, and impedances were kept
below 5 kΩ to reduce polarization eects. Recordings were made at a sample rate
of either 250 Hz or 256 Hz and band-pass filtered between 0.5-30 Hz. The data was
downsampled to 100 Hz to increase the performance of the system, and eye blink
artifacts were reduced using an independent component analysis filter.

106 | Chapter 6
Fig. 4: A screenshot showing how the review process works. For each iteration, the reviewer is
presented with 10 nominations, one at a time, and is given the opportunity to either confirm, reject,or ignore each event as inter-ictal epileptiform activity (see top right panel). Aer the ten nominationshave been graded, the user can choose to either stop with the review or to review another ten events.
Nomination certainties are updated between iterations.
6.3 Results
Using the described method, IED nominations were found for all of the 241 IEDs
in the evaluation dataset. Given however that no thresholds were used to discard
events with low certainties, the system would have a very high false positive rate
if all nominations had to be shown to a reviewer. As described in the Methods,
iterative reviewing is introduced to help minimize the number of presented false
positives. An example of the review process is shown in Fig. 4. A soware applica-
tion is used to show 10 seconds of EEG at a time with the nominated event centered
in the middle of the screen. The grouped nomination is highlighted to indicate its
onset and duration, and additional highlights are placed on the channels where
the templates have found possible IED waveforms. The reviewer is presented with
three options in the top-right corner of the screen. From these options the reviewer
can decide to either confirm, reject, of ignore the displayed nomination as an IED.
The simplicity of this approach allows the user to evaluate nominations in a fast

A self-adapting system for finding inter-ictal epileptiform discharges | 107
Fig. 5: Template contributions per recording: The first bar shows the number of templates that havecontributed to all the nominations presented during a review of fieen iterations. The second bar
shows the number of templates that contributed to confirmed IEDs only.
and eective manner. Although only measured during the development of this al-
gorithm, the average duration of visually reviewing one iteration consisting of ten
nominations was approximately 20 seconds.
Table 2 shows the number of IEDs detected per recording for each iteration dur-
ing the review. To provide consistency during the evaluation, nominations were
confirmed by comparing them to the marked IEDs obtained earlier from visual
inspection. The first and second columns provide the subject ids and number of
marked IEDs, and the remaining columns show the number of confirmed IEDs af-
ter each iteration of the review. Fieen iterations were used to evaluate the method
with ten nominations presented per iteration. We see that approximately one third
of all IEDs are shown within the first iteration of the review and already half of
them aer two iterations. Aer five iterations 74% of the events were found, and
with ten and fieen iterations the number of detected IEDs increased to 90% and
95% respectively.
Figure 5 provides some insight into the number of templates involved during
detection. A bar graph is shown consisting of two bars per subject. The first bar
shows the number of templates contributing to all nominations presented during
the review of fieen iterations. The second bar shows the number of templates
that contributed to confirmed IEDs. From this we see that a substantial number of
templates are involved during detection, and more importantly, that many of them

108 | Chapter 6
Table 1: Subject information of the EEGs used to test the detection and reviewing method.
Subject Epilepsy type Age (years) Duration (min)
S1 generalized idiopathic 45 16:19S2 absence 26 20:00S3 absence 10 21:30S4 generalized other 50 20:19S5 generalized other 7 20:40S6 temporal lobe 51 21:00S7 generalized other 44 20:00S8 generalized idiopathic 12 22:30S9 temporal lobe 17 20:00S10 generalized other 10 20:00S11 absence 42 22:19S12 generalized idiopathic 10 19:30S13 temporal lobe 7 20:19S14 generalized idiopathic 4 21:10S15 generalized other 44 20:00
contribute to confirmed IEDs. We also see that many templates are responsible for
negative contributions. It should be noted however that fieen iterations were used
per review, and that in most recordings, only a small number of inter-ictal events
were present. This means that if all IEDs were confirmed, the system would only
have false positives le to show. This figure also confirms that a suicient number
of template waveforms were available in the database to detect IEDs in the new, un-
seen EEGs of our evaluation dataset. Template reliabilities are not reflected in this
graph, meaning that detections with high certainty are not separated from those
with low certainty. Given the average reviewing time to perform one iteration, a
typical review of fieen iterations will approximately last five minutes for a 20-
30min EEG recording. This estimate is however only based on internal evaluation,
and a larger study withmultiple participants is required to obtain an accurate mea-
sure. The review time will be reduced even further if a reviewer is already satisfied
with the nominations seen aer fewer iterations.
6.4 Discussion
A large number of inter-ictal spike detection methods have been proposed in
recent years (see (Halford, 2009; Wilson and Emerson, 2002) for review). Many of
these have been designed with patient specific features, or have been tested on seg-
mented EEGdata with possibly reducedmovement and eyeblink artifacts. For these
A self-adapting system for finding inter-ictal epileptiform discharges | 109
reasons alone, they already appear not to scale well to new, unseen EEG recordings
as we would wish for practical consideration. Given the nature of spike detection
algorithms, it is also diicult to achieve both a high sensitivity and a low false de-
tection rate simultaneously. Some studies therefore place their focus on achieving
high sensitivities (Nonclercq et al., 2012; Argoud et al., 2006; Subasi, 2006; Halford
et al., 2012; Van Hese et al., 2008), whereas others aim to maintain low false posi-
tive rates (De Lucia et al., 2008; Ji et al., 2011a; Indiradevi et al., 2008). In a practical
scenario, this means that reviewers will be forced to look at a large number false
positive events, or to see fewer nominations and miss out on important detections.
When only these two options are available, it is clear to see why epileptologists pre-
fer the more conventional method of visual inspection with manual detection. Our
system has been optimized to achieve high sensitivitieswith events being presented
to the reviewer in a minimal amount of time. A weakness in the system therefore
lies in a higher number of false positives which range from 0.24-6.6 fp/min depend-
ing on the number of iterations chosen. Sensitivities for other reported methods
range from 0.5 to 0.92 and false detection rates from 0.1 to 6 fp/min (Halford, 2009;
Wilson and Emerson, 2002).
This study presents an alternative approach to inter-ictal spike detection and re-
view. It has three fundamental dierences to other automated methods, which to
our knowledge has not been used before: First, individual IED nominations are as-
signed a detection certainty, giving the system an opportunity to present them in
a descending order of likelihood. Secondly, the described system can learn from
the outcome of events that have been presented, and in such a way aempt to in-
crease its sensitivity during presentation of the remaining nominations aer every
iteration. Lastly, the system can adapt itself on a continuous and universal ba-
sis, thereby improving its own accuracy over time. By storing the number of true
and false positive detections of each template and updating their reliabilities ac-
cordingly, the template reliabilities will become more accurate which in turn will
improve the overall robustness of the system.
Given that IED nominations are presented in a descending order of likelihood,
the reviewer is not required to view all nominations before knowing if any inter-
ictal activity exists. Instead, it is le up to the reviewer to decide on the number
of nominations to view before a diagnosis is made. Because of this, the system is
less vulnerable to high false positive rates. This approach also avoids the need for
thresholding to limit the number of nominations presented to the reviewer, and
should make it scalable to long-term recordings. Further evaluation is required to
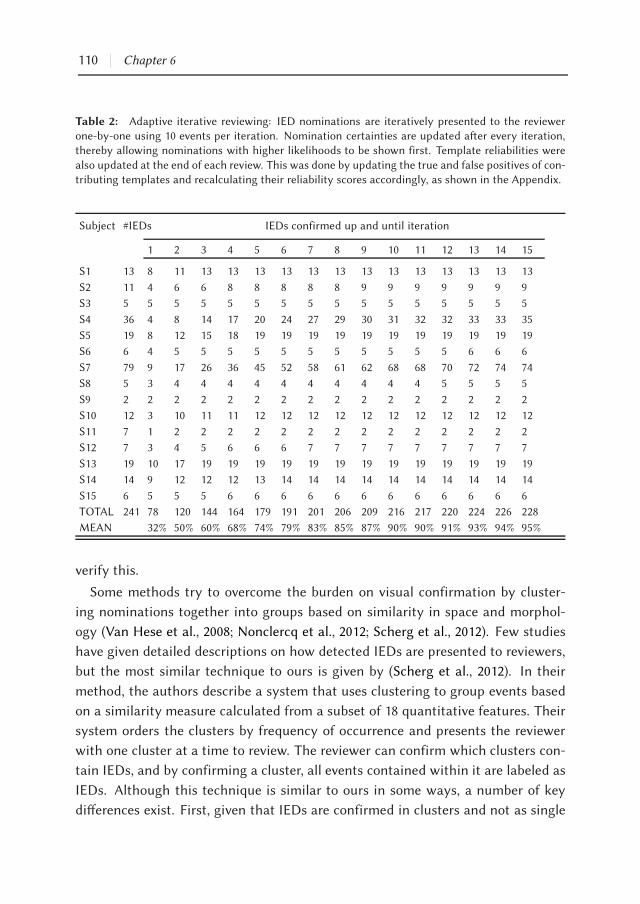
110 | Chapter 6
Table 2: Adaptive iterative reviewing: IED nominations are iteratively presented to the reviewerone-by-one using 10 events per iteration. Nomination certainties are updated aer every iteration,thereby allowing nominations with higher likelihoods to be shown first. Template reliabilities were
also updated at the end of each review. This was done by updating the true and false positives of con-tributing templates and recalculating their reliability scores accordingly, as shown in the Appendix.
Subject #IEDs IEDs confirmed up and until iteration
1 2 3 4 5 6 7 8 9 10 11 12 13 14 15
S1 13 8 11 13 13 13 13 13 13 13 13 13 13 13 13 13
S2 11 4 6 6 8 8 8 8 8 9 9 9 9 9 9 9
S3 5 5 5 5 5 5 5 5 5 5 5 5 5 5 5 5
S4 36 4 8 14 17 20 24 27 29 30 31 32 32 33 33 35
S5 19 8 12 15 18 19 19 19 19 19 19 19 19 19 19 19
S6 6 4 5 5 5 5 5 5 5 5 5 5 5 6 6 6
S7 79 9 17 26 36 45 52 58 61 62 68 68 70 72 74 74
S8 5 3 4 4 4 4 4 4 4 4 4 4 5 5 5 5
S9 2 2 2 2 2 2 2 2 2 2 2 2 2 2 2 2
S10 12 3 10 11 11 12 12 12 12 12 12 12 12 12 12 12
S11 7 1 2 2 2 2 2 2 2 2 2 2 2 2 2 2
S12 7 3 4 5 6 6 6 7 7 7 7 7 7 7 7 7
S13 19 10 17 19 19 19 19 19 19 19 19 19 19 19 19 19
S14 14 9 12 12 12 13 14 14 14 14 14 14 14 14 14 14
S15 6 5 5 5 6 6 6 6 6 6 6 6 6 6 6 6
TOTAL 241 78 120 144 164 179 191 201 206 209 216 217 220 224 226 228
MEAN 32% 50% 60% 68% 74% 79% 83% 85% 87% 90% 90% 91% 93% 94% 95%
verify this.
Some methods try to overcome the burden on visual confirmation by cluster-
ing nominations together into groups based on similarity in space and morphol-
ogy (Van Hese et al., 2008; Nonclercq et al., 2012; Scherg et al., 2012). Few studies
have given detailed descriptions on how detected IEDs are presented to reviewers,
but the most similar technique to ours is given by (Scherg et al., 2012). In their
method, the authors describe a system that uses clustering to group events based
on a similarity measure calculated from a subset of 18 quantitative features. Their
system orders the clusters by frequency of occurrence and presents the reviewer
with one cluster at a time to review. The reviewer can confirm which clusters con-
tain IEDs, and by confirming a cluster, all events contained within it are labeled as
IEDs. Although this technique is similar to ours in some ways, a number of key
dierences exist. First, given that IEDs are confirmed in clusters and not as single

A self-adapting system for finding inter-ictal epileptiform discharges | 111
events, the cluster-based review approach is vulnerable to confirming false detec-
tions clustered together with true IEDs. Although in our method the confirmation
of single events will potentially take longer than confirming clustered events, the
reviewer is assured that all marked IEDs will have been shown and are in fact true
inter-ictal events. The second key dierence is that, apart from ordering the clusters
by frequency of occurrence, the cluster-based system does not have any certainty
measure similar to the one we describe. All clusters therefore need reviewing in or-
der not to miss important events, and this can result in longer review times. Lastly,
our system is unique in incorporating reviewer feedback from current reviews to
improve the detections on future recordings.
As with any method, a number of improvements can still be made to further
increase the eiciency and accuracy of our technique. Specific areas of improve-
ment include a built-in mechanism to collect and train additional templates for
expanding the template database with more example waveforms. This will result
in a completely closed-loop system, where beer templates can be promoted over
time and unreliable templates discarded. Additionally, context-based rules such as
those described by (Scherg et al., 2012; Argoud et al., 2006; Ji et al., 2011a; Van Hese
et al., 2008; Nonclercq et al., 2012) can be added to group nominations according to
their similarity, which can be used to provide additional information during the re-
view. Given that only 15 EEGs were used to evaluate this method and that reviewer
bias may have been added by having the IEDsmarked by only one reviewer, further
evaluation is needed to determine the feasibility of this method in clinical practice.
Further work will involve multiple electroencephalographers and a comparison be-
tween visual searching and automated detection in long-term recordings.
In summary, by adding information to detected events in the form of certainty
values, nominated IEDs can be shown in a decreasing order of likelihood and thereby
make it possible for the reviewer to view fewer events. In practical terms, this has
the potential to improve eiciency and lower EEG review times, and thereby make
automated detection faster than conventional manual reviews while achieving a
similar diagnostic certainty.
Appendix: Calculation of the group certainties
Using the same method as described in (Lodder et al., 2013), a database of stored
template waveforms make individual detections of inter-ictal activity by finding
events in the EEG that have high correlations to themselves. Individual detections

112 | Chapter 6
are merged and grouped where they overlap, and from this the grouped IED nom-
inations are formed (see illustration Fig. 3).
Let each individual template detection be defined as
Dtem = CRRtem;TPtem;FPtem;Rtem , (6.1)
whereCRRtem is the correlation coeicient between the template and the detected
segment, TPtem and FPtem the total number of true and false detections made by
that template over all time (stored in the database), and Rtem a measure of the
template reliability:
Rtem =TPtem
TPtem + FPtem
. (6.2)
Given that each IED nomination can be seen as a combination of N overlapping
detections (nom = Dtem , tem ∈ [1...N ]), the certainty value of that nomination
is calculated as
CERTAINTYnom = max (CRRtem ×Rtem) , tem ∈ nom. (6.3)

Chapter 7
Summary
General discussion and
Outlook


Summary and general discussion | 115
An estimated forty to sixty thousand routine EEG recordings are made in the
Netherlands each year alone, and due to its portability and lower costs relative to
other non-invasive procedures for functional neuroimaging, this number is growing
steadily. With more recordings however, we are also presented with more data to
analyze, and because of the time-consuming nature, training, and costs involved in
performing these reviews, conventional methods of analyzing and reviewing EEGs
are becoming problematic.
This thesis has explored the use of computerized interpretation to assist review-
ers in analyzing EEGs faster and more consistently with the aid of quantitative and
automated methods. Although EEGs are used in many areas of diagnostics and
monitoring, this thesis has focused on routine clinical outpatient recordings and
on the standard reviews performed for the diagnosis of epilepsy. Two areas of auto-
mated analysis were considered: the analysis of background activity and inter-ictal
epileptiform spike detection. A summary of our contributions to each of these areas
is listed below, followed by a discussion and outlook into further developments of
automated EEG interpretation and the role it will play in the future of diagnostics
and neuromonitoring.
Summary
Part I - EEG background paern
For analyzing the various properties of the EEG background paern, this study
started with finding an accurate technique to automatically estimate the posterior
dominant rhythm (PDR). Although easily measured in most healthy patients, the
simple approach of calculating a mean spectrum over the eyes-closed EEG oen
failed due to artifacts or a weak presence of the PDR. More accurate and robust es-
timates were found by spliing the eye-closed EEG into smaller segments and then
estimating peak frequencies in each of these segments individually. Chapter 2 de-
scribes a method in which this approach was implemented with the use of a curve-
fiing algorithm and clustering to combine the segmented estimates. To evaluate
the technique, PDR frequency estimates were calculated from 1215 test EEGs. Diag-
nostic reports were available for all recordings, allowing us to extract and compare
reported visual estimates to those obtained from the algorithm. Agreements with
visual inspection ranged from 96% to 99.4% for a fault tolerance of 1.2 Hz.
Aer finding an accurate technique to robustly measure the PDR frequency in
an unsupervised manner, the next aim was to further describe other properties of

116 | Chapter 7
the EEG background paern. An additional four properties were chosen: the PDR
reactivity, anterior-posterior gradients, le-right symmetry, and the presence or
absence of abnormal diuse slow-wave activity. In order to compare quantitative
interpretation to visual reviews, 384 EEGs were gathered from a database at the
MST hospital in the Netherlands in which all these properties were reported. Dur-
ing this process, it was found that the descriptions were oen vague or inconsis-
tent due to its free-text nature, and that no formal guidelines existed for describing
some of the background properties. It was therefore decided that in addition to
developing quantitative measures for describing these properties, we would cre-
ate simple yet useful guidelines for reviewers to follow while noting down their
findings in the diagnostic reports. These guidelines also served as definitions on
which the quantitative algorithms could base their analysis, making the comput-
erized interpretation transparent to the reviewer. Chapter 3 provides the reported
guidelines, together with quantitative measures for each of the background prop-
erties considered. To test the reliability of these measures, the properties obtained
from automated analysis were compared to the properties reported through visual
inspection in the diagnostic reports. Some such as the PDR frequency, reactivity,
and presence of diuse slow waves were in moderate to high agreement with visual
reports. For symmetry and anterior-posterior gradients, the agreement was lower.
It was noted though that based on the vague free-text descriptions, these properties
were diicult to place in set categories for comparison.
Given that the automated interpretation methods showed promising results, it
was possible to further test them in clinical practice. For this, they were added
into a custom-built EEG viewer, and together with a new evaluation set of 45 EEG
recordings taken from the MST hospital database in the Netherlands, it was given
to nine EEG experts across the Netherlands for evaluation, as described in Chap-
ter 4. The EEGs varied enough to contain examples of both normal and abnormal
occurrences of each background property considered. Participants were asked to
first visually score each EEG, and then compare their findings with the interpreta-
tion provided by the system. Aerwards, the inter-rater agreement was measured
for both the automated system and each participant using a gold-standard derived
from the consensus of all reviewer reports. Automated interpretation together with
most participants showed high (kappa > 0.6) agreement with the gold standard,
and in some cases, automated analysis showed even higher agreement with the
gold standard than some participants. To determine the acceptance of such algo-
rithms during routine reviews, the participantswere also askedwhether they would

Summary and general discussion | 117
find it useful to have quantitative analysis methods assist them on a routine basis.
For this, all participants answered yes.
From the studies related to automated analysis of the background paern, we
conclude that computer-assisted interpretation can have a significant contribution
to routine EEG reviews. Although only tested on EEGs 20-30 min in length, the
algorithms may also be useful during the screening of longer EEGs, including am-
bulatory recordings and ICU monitoring. Further work may help to improve inter-
pretation accuracy and include more properties for review.
Part II - Inter-ictal epileptiform discharges
For routine outpatient visits, one of the main clinical reasons for EEG recordings
is the diagnosis of epilepsy. A large part of this thesis was on finding a method that
could automatically detect inter-ictal epileptiform discharges and present them to
the reviewer without him having to visually screen the entire EEG first. A large
number of spike detection algorithms already exist in literature without clinical
implementations, and our focus was therefore not only on finding a suitable tech-
nique, but also to create a method which could become a practical solution for
clinical use.
As a contribution to the automated detection of epileptiform activity, two studies
were performed. The first, presented in Chapter 5, describes a technique that finds
epileptiform discharges by comparing all signal waveforms present in the EEG to
a trained database of sample discharges. In this chapter, we describe how 2160
templates are extracted from a group of training EEGs, and trained in classifying
similar waveforms by allowing them to nominate epileptiform activity in an EEG
based on the similarity to themselves. Templates are given a measure of reliability,
and in combination with their own certainty of a detection, a voting system is used
to group and merge individual template nominations together. Although formal
comparisons could not bemade due to dierent datasets, it was shown in Chapter 5
that the proposed method can achieve similar sensitivities and false detection rates
as other techniques reported in literature. Due to not discarding many template
nominations, it has more false detections at high sensitivities however, therefore
still leaving it impractical in clinical use as compared to a standard visual review.
This chapter does however also show that the detection technique can generalize to
new, unseen recordings, and it can therefore have clinical relevance if the number
of false detections is reduced.

118 | Chapter 7
The second step in detecting inter-ictal epileptiform activity was to achieve a
practical and scalable solution for clinical use. The problem was approached from
a dierent perspective, and instead of looking for thresholds to discard false de-
tections, the described system assigns a detection certainty value to each detected
event, and orders themall in decreasing order of certainty. Next, the systempresents
ten events to the reviewer at a time in an iterative manner, and asks for either a
confirmation or rejection of each event that is shown. Using this as feedback, the
system then learns which events are of higher importance and adjusts the certainty
values of the remaining detections accordingly. By allowing the reviewer to choose
when he is satisfied with what has been shown and when to stop the iterative pro-
cess, the system provides a practical solution to routine reviews and can easily scale
up to long-term recordings. In Chapter 6, the systemwas tested on 45 routine EEGs
of approximately 20-30 min in length, and we show that aer a single iteration of
screening ten events, an average of already 32% of the inter-ictal discharges in the
recordings were found. Aer five iterations, this increased to 74% and aer fif-
teen iterations, which took an average reviewing time of five minutes, 95% of the
inter-ictal events present were detected and presented to the reviewer.
To truly test the benefit and advantages that this technique can provide in clinical
practice, another evaluation by expert electroencephalographers is needed. From
the results obtained up to this point however, the proposed method and review
strategy appears to have a positive outcome.
General discussion and Outlook
If automated interpretation will ever replace the human reviewer remains to
be seen. One thing that is for certain is that the presence of quantitative EEG
analysis will continue to grow during reviews. Many types of quantitative EEG
features have been proposed to describe specific properties in the EEG, including
statistical measures such as variance and kurtosis (Scherg et al., 2012; Stevenson
et al., 2013), non-linear energy operators (Mukhopadhyay and Ray, 1998), small-
world networks and functional connectivity (Stam et al., 2007; Bullmore and Sporns,
2009), synchrony (Lachaux et al., 1999; van Puen, 2003), entropy (Stam, 2005; Kan-
nathal et al., 2005), power ratios (Kurtz et al., 2009; Cloostermans et al., 2011), bi-
spectral index (Sigl and Chamoun, 1994), and le-right symmetry (van Puen et al.,
2004). Apart from epilepsy, clinical applications for quantitative EEG also include
ICU monitoring (Friedman and Hirsch, 2010; Cloostermans et al., 2011; Foreman

Summary and general discussion | 119
and Claassen, 2012), clinical psychiatry (Coburn et al., 2006; Hammond, 2010) and
the diagnosis of neurodegenerative diseases (Petit et al., 2004; Babiloni et al., 2011;
Morei et al., 2012). Many dierences exist between these fields, but quantitative
analysis in all of them share a very similar goal: to reveal additional information
about the patients neurological state and to make reviews more eicient and in-
tuitive for clinicians. As shown throughout this thesis, our suggested use of auto-
mated methods is not to replace the reviewer, but instead to give him the additional
tools needed to perform faster and more consistent reviews.
The algorithms presented here demonstrate how computational analysis brings
additional value to visual interpretation. InChapter 4we have shown how computer-
assisted interpretation can help to improve inter-rater agreement and serve as a tool
to present the background properties of an EEG to the reviewer in amore structured
and intuitive manner. It was also shown how easy it can be to integrate computer-
assisted reviewing with standard visual analysis, and at the same time receive gen-
eral acceptance from clinicians and their willingness to incorporate such a system
into routine reviews. Although the study in Chapter 4 used automatically gener-
ated reports and asked participants to only make changes where they disagreed,
other approaches can also be used to make assisted reviewing less intrusive for the
reviewer. A dierent approach for example, will be to let clinicians fill out the report
themselves and only ask the system to verify and point out properties for which it
has a dierent outcome. By doing this, an additional verification step is added to
reports which will surely help clinicians to improve their consistency and increase
the overall inter-rater reliability.
Unfortunately, automated background analysis still has a number of weaknesses
and the interpretations are limited to the number of features that the methods can
describe. Regarding the background properties presented in Chapter 3 and 4, addi-
tional features of interest may include the interpretation of beta and gamma activ-
ity, mu rhythms, and the EEG response to photic stimulation and hyperventilation.
Clear and intuitive ways of showing EEG properties using quantitative features are
also required to encourage reviewers to use the provided tools. It is also impor-
tant that computer-assisted systems are developed through continuous feedback
loops between developers and clinicians to ensure that clinical applications remain
relevant to the needs of clinicians.
Regarding inter-ictal epileptiform spike detection, we have taken a dierent route
thanmany by rejecting black-boxmethods and instead developed a techniquewhich
more closely resembles humans and visual analysis. By having a technique that

120 | Chapter 7
makes use of a template database to find matching inter-ictal discharges, actual
samples of epileptiform activity have been used to train a computer on how to find
inter-ictal discharges in the three most-commonly used montages, much in the
same way as with training a clinician. Also, as with humans, the system is adaptive
and can learn through its own mistakes, thereby improving upon itself over time.
The concepts and outline of our presented methods are very simple and transpar-
ent, although its implementation and the computational eiciency required to real-
ize them needed a certain degree of complexity. This has lead to many areas where
more improvements can be made. Two such areas for example, are in defining the
adaptive behavior of the system, i.e. deciding how it learns over time, and the other
is inmatching the additional steps followed by clinicianswhen evaluating EEGs, e.g.
taking into accountmedication and noting the frequency and spatial information of
observed abnormalities. Also, to further improve epileptiform spike detection algo-
rithms and compare them on a global basis, more collaboration is needed. Similar to
the benchmark database of electrocardiographic recordings (Willems et al., 1985),
a global benchmark for testing automated detection algorithms can be established
by storing annotated EEGs in a standardized evaluation database. Halford et al.
(2012) has presented such a database for EEG epileptiform spikes, and if it receives
global acceptance, all algorithms can be evaluated in the same manner in the future
to ensure fair and objective comparisons.
A major obstacle for quantitative EEG interpretation is the presence of artifacts.
Some, such as movement or muscle artifacts, can completely corrupt the signal,
whereas others may mimic pathological EEG, for example chewing or tooth brush-
ing that may resemble epileptiform discharges. A large number of artifact detec-
tion and correction algorithms are available, but for increased accuracy in auto-
mated analysis, more development is needed to further reduce noise and improve
the overall quality of these sensitive signals.
Standardized reporting
The EEG properties described in this thesis, in particular those in Chapter 3
and 4, were chosen based on provided information available from diagnostic re-
ports stored in a database at the MST hospital in the Netherlands. Aer reading
through more than 2500 reports and annotating all properties reported in free-text,
five background properties were found to be in most reports, and they were there-
fore chosen as a starting point for our study. Reading through this large amount of

Summary and general discussion | 121
reports already proved by itself to be a tedious and time consuming task, but more
importantly, it brought to light a major concern which others have also described.
Free-text reports lack consistency, are diicult to query, oen leave out important
information, contain localized terminology not always understood by other groups,
and sometimes have vague descriptions or ill-defined findings.
Fortunately, some EEG experts have taken on the task of standardizing EEG
reports (Aurlien et al., 1999, 2004, 2007; Beniczky et al., 2013). The Standardized
Computer-based Organized Reporting of EEG (SCORE), is a system designed to
bring consistency and completeness to how EEG findings are annotated and stored.
Based on the outcome of consensus workshops held in Europe from participants
across 15 countries, standard terms and definitions for EEG findings have been
agreed upon and organized categorically to be used for reporting (Beniczky et al.,
2013). By providing set options for describing each EEG characteristic, the SCORE
system tries to circumvent traditional free-text reports as much as possible, and
thereby ensures consistency and universality to all EEG findings. This also allows
institutions to more easily store, query and share their reports.
With minor modifications, the automated interpretation system presented in
Chapter 3 and 4 can be modified to adhere to these terms and guidelines. In addi-
tion to the background properties, detected inter-ictal spikes which are presented
to the reviewer as shown in Chapter 6, can also further be categorized and de-
scribed according to the standard terms and definitions. For future development
and the addition of more reported EEG properties by automated interpretation,
SCORE provides a good reference as to which characteristics are most relevant.
Towards computerized EEG interpretation in the future
As shown in this thesis, there is still great room for improvement in automated
EEG analysis and interpretation. Although the studies presented here have focused
mainly on routine 20-30 min recordings, the use of EEG extends much further for
both inpatient and outpatient seings. Improvements in hardware such as active
electrodes, shielded wires and smaller amplifiers allow the technology to be used
in environments which were not suitable before, and soware advances including
data synchronization and cloud computing create new possibilities for real-time
monitoring and diagnosis.

122 | Chapter 7
Routine recordings and ambulatory EEG
Given that EEG has become more portable and aordable over the past decade,
new opportunities have emerged in the way that we monitor and diagnose patients
(Askamp and van Puen, 2013; Waterhouse, 2003; Dash et al., 2012; Seneviratne
et al., 2013). For epilepsy diagnostics, the relatively short recording length of 20-30
min routine recordings only provide a small window of opportunity for clinicians
to capture inter-ictal events, leading to missed events and follow-up recordings. As
shown by Faulkner et al. (2012) and Friedman and Hirsch (2009), longer recording
windows can help to improve the chances of finding inter-ictal events if any ex-
ist. By using ambulatory monitoring and outpatient recordings, fewer hospital vis-
its are required which can reduce healthcare costs significantly (Foley et al., 2000;
Dash et al., 2012; Burke et al., 2013; Strzelczyk et al., 2012). For longer recording
windows, computerized interpretation will play an important part in reducing the
amount of data screened visually. Key properties and important events can be sum-
marized, and presented to the reviewer in a shortened version of the recording or
in a more intuitive manner, as demonstrated by in (Nakamura et al., 1992; Casson
and Rodriguez-Villegas, 2009; Scherg et al., 2012; van Puen, 2008; Lodder and van
Puen, 2013; Cloostermans et al., 2011; Kurtz et al., 2009; Moeller et al., 2011). Arti-
facts remain an important challenge in ambulatory EEG, where electrode-, muscle-
andmovement artifacts can either corrupt the signal or imitate epileptiform behav-
ior (Seneviratne et al., 2013).
Although ambulatory EEG can be great for many things, shorter recordings will
still play an important role in clinical diagnosis. As shown in Chapter 3, 4 and 5,
intuitive computerized methods can help to improve and simplify these reviews
and thereby lead to higher eiciency and cost savings. Additionally, the added
benefit of QEEG to calculate and display certain properties in an automated and
simple manner will also allow less qualified sta such as nurses to obtain a general
overview and interpretation of the patient’s current neurological state.
Neuromonitoring in the ICU
Apart from epilepsy and sleep studies, EEG also has important uses in the inten-
sive care unit (ICU). Patients suering from subarachnoid hemorrhage, postanoxic
coma aer cardiac arrest, traumatic brain injury or any other serious type of en-
cephalopathy will oen benefit from continuous neuromonitoring during their stay
in the ICU. Given that most of these patients are in a comatose state, an experi-

Summary and general discussion | 123
enced neurointensivist is needed to monitor them on a continuous basis for non-
convulsive seizures (NCS), status epilepticus (NCSE), ischemia, or other abrupt
changes with detrimental eects. For continuous monitoring in an ICU and neona-
tal critical care environment, EEG is one of the most practical procedures avail-
able (Jordan, 1999; Stewart et al., 2010; Abend et al., 2010; Chang and du Plessis,
2012; Riviello, 2013; Sanchez et al., 2013; Young, 2009).
Unfortunately, ICU monitoring comes paired with large quantities of data to
screen, which ideally requires real-time analysis to ensure intervention if something
occurs. For continuous, real-time EEGmonitoring, computerized interpretation has
a lot to oer. As an example, Cloostermans et al. (2011) describes a system that can
be used to quantify the important neurological properties for ICU patients. Using
a range of quantitative features and a decision tree based on human interpretation,
EEG segments are classified into dierent neurological states (artifact, seizure, gen-
eral periodic discharges, normal, slow wave activity, burst suppression, low-voltage,
iso), and changes in states over time are presented in trends to show improvement
or deterioration (Cloostermans et al., 2011).
Additionally, seizure detection algorithms, remote monitoring, and computer
generated alerts can all help to improve patient treatment and clinical interven-
tion (Abend et al., 2010; Kurtz et al., 2009; Hirsch, 2004). Remote ICU monitoring
will allow neurologists to track the progress of their patients from outside the ICU,
meaning changes in their neurological state can be monitored faster and on a more
regular basis.
A possible next step for continuing the work in this thesis is to expand the de-
scribed algorithms and add relevant features for continuous ICU monitoring. Al-
though not all the background properties inspected here have equal value in the
ICU seing, some of them (eg. symmetry and slowing), in combination additional
properties (eg. burst-suppresion index, alpha-delta ratios etc.) will have high impor-
tance. The system presented in Chapter 4 can be adapted to include more relevant
properties for continuous ICU monitoring, and using the same principles as imple-
mented here to present the underlying data in a simple and intuitive manner, aid
neurointensivists with beer tools for bedside and even remote monitoring.
Another important contribution to ICU monitoring may involve the automated
detection of seizures, in particular non-convulsive seizures which may not always
be detected by ICU sta. Although the template-based spike detection method
presented in Chapter 5 was designed for finding inter-ictal events, the system can
easily be optimized for detecting seizures by requiring seizure events to be multiple

124 | Chapter 7
successive detections of spike-wave events instead of single isolated spike-wave
discharges.
Non-clinical EEG and supportive technologies
Apart from diagnostic and monitoring purposes, EEG is also growing in popular-
ity in the consumer industry, wherewireless devices are being soldwith applications
aimed at gaiming and assistive technologies (Duvinage et al., 2013; Khushaba et al.,
2013; Webb et al., 2012; Li et al., 2013). Although many of these applications are not
directly aimed at medical diagnostics or monitoring, their demand and growth will
ultimately help to push EEG technology forward1.
An example of two technologies that can have a significant impact on the use
of EEG, is consumer smartphones and cloud-computing (Stopczynski and Larsen,
2011; Petersen and Stahlhut, 2011; Morabito et al., 2013). The majority of people
in developed countries already own a smartphone which they carry around with
them throughout the day. For ambulatory monitoring, this means that an intelli-
gent device capable of making complex calculations and sending and receiving data
is already available for continuous monitoring if connected with an EEG amplifier.
In special cases where the early detection of acute events can lead to an interven-
tion by some means such as alerting a caregiver or administering a medication,
the role of ambulatory monitoring will change from being passive to active. Also,
smartphone technology can help to compress data during ambulatory monitoring
and thereby increase the length of recordings (Morabito et al., 2013). A limitation
to smartphone technology however, is that it is also baery powered and to some
extent limited in computational resources, which means that complex calculations
can be slower than real-time and the additional power consumption can quickly
drain baery life. For this, cloud computing may bring many benefits (Ma et al.,
2012). Cloud computing allows devices to upload raw data for processing and down-
load the results when processing has been completed. A good example of this is how
a smartphone can upload raw data from its GPS device to a cloud server to perform
the complex calculations of obtaining a coordinate, and then download it back to
the phone again when the location has been found (Ma et al., 2012). Background
analysis techniques and inter-ictal spike detection can be implemented in a simi-
lar manner by leing the calculations run on the cloud. This will provide both the
patient and physician with direct feedback on the recorded brain activity, without
1A good example of this can be seen at hp://www.emotiv.com/.
Summary and general discussion | 125
having to wait for the patient to first return to the hospital. Suitable applications
for this may include monitoring a patient in real-time for ictal activity or other ab-
normalities, or to compress and store the data online to make longer recordings
possible.
Closing remarks
This thesis has only explored a small portion of quantitative EEG analysis and
automated interpretation relevant to clinical applications. Limited as they may be,
most of the procedures, guidelines and algorithms described here have had posi-
tive outcomes and are of high clinical relevance and practical value. In a digital age
where vast quantities of data is collected and data management becomes as im-
portant as the information it contains, automated EEG interpretation will become
increasingly important to take the visual burden away from the reviewer. Auto-
mated methods will become more widely used as they improve in accuracy, and
my view is that somewhere in the future, most reviewers, if not all, will make use of
quantitative analysis in some form or another together with visual analysis of the
raw time series data.


Chapter 8
Nederlandse samenvaing

128 | Chapter 8
In Nederland worden per jaar naar schaing veertig- tot zestigduizend routine
elektro-encefalografie (EEG)-registraties verricht. Door de hogemate vanmobiliteit
en de relatief lage kosten van het EEG in vergelijking met andere niet invasieve
methoden voor functionele neuroimaging neemt dit aantal EEG registraties gestaag
toe. Hiermee groeit echter ook de hoeveelheid te analyseren data. Conventionele
methoden voor EEG analyse zijn beperkt, met name vanwege het tijdrovende karak-
ter van visuele analyse, de training die ervoor nodig is en de kosten die ermee
gepaard gaan. In dit proefschri worden nieuwe methodes beschreven voor com-
puter-ondersteunde EEG-interpretatiemet als doel beoordelaars te assisteren in het
sneller en meer consistent analyseren van EEG’s door gebruik te maken van kwan-
titatieve en geautomatiseerde methoden. Hoewel EEG’s in verschillende gebieden
van diagnostiek en monitoring worden toegepast, richten we ons in dit proefschri
op de routine EEG-registraties in de poliklinische seing en de beoordeling van het
EEG voor epilepsie diagnostiek. Twee gebieden van automatische analyse werden
onderzocht: de analyse van het grondpatroon en de detectie van interictale epilep-
tiforme afwijkingen. Een samenvaing van de bijdrage aan elk van deze gebieden
is hieronder gegeven.
Deel I: EEG grondpatroon
Er zijn verschillende eigenschappen van het EEG grondpatroon die geanalyseerd
kunnen worden, en als eerste is deze studie gestart met het ontwikkelen van een
nauwkeurige techniek voor het bepalen van de frequentie van het posterieure do-
minante ritme (PDR). Hoewel deze frequentie in de meeste gevallen eenvoudig te
meten is, is dit soms lastig door de aanwezigheid van artefacten of door een beperkt
voorkomen van het PDR. Meer nauwkeurige en robuuste benaderingen werden
gevonden door het EEG gedeelte waarin de ogen gesloten waren op te splitsen in
kleinere segmenten en vervolgens de piekfrequenties in elk afzonderlijk segment
te bepalen. Hoofdstuk 2 beschrij een methode waarbij deze aanpak werd uitge-
voerd met behulp van een curve-fiing algoritme en clustering om de piekfrequen-
ties van de afzonderlijke segmenten te combineren. Om deze techniek te evalueren
werd in een test set van 1215 EEG’s de frequentie van het PDR berekend. Van
al deze EEG registraties waren diagnostische beschrijvingen aanwezig, zodat be-
rekende piekfrequentie vergeleken kon worden met de beschreven visuele beoor-
deling. Overeenkomsten varieerden van 96% tot 99,4% met een fouolerantie van
1,2 Hz.

Nederlandse samenvaing | 129
Na het vinden van een accurate techniek om de PDR frequentie robuust te meten
met een volledig geautomatiseerde methode, was het volgende doel om ook de an-
dere belangrijke eigenschappen van het EEG grondpatroon te beschrijven. Vier
extra eigenschappen werden gekozen: PDR reactiviteit, links-rechts symmetrie,
anterieure-posterieure gradiënten en de aan- of afwezigheid van abnormale dif-
fuus trage activiteit. Om deze kwantitatieve interpretatie te vergelijken met de
visuele beoordeling werden 384 EEG’s waarin al deze vier eigenschappen gerappor-
teerd waren verzameld uit de database van het Medisch Spectrum Twente (MST)
te Enschede. Tijdens dit proces bleek echter dat de beschrijvingen niet altijd een-
duidig te interpreteren of onvolledig waren en dat er bovendien geen formele richt-
lijnen bestaan om deze eigenschappen te beschrijven. Daarom werd besloten om
naast de ontwikkeling van een kwantitatieve methode om deze eigenschappen te
beschrijven, een aantal eenvoudige maar bruikbare richtlijnen op te stellen die ge-
bruikt kunnen worden door de beoordelaars bij het noteren van diagnostische be-
vindingen. Deze richtlijnen dienden tevens als definities voor de implementatie van
de kwantitatieve algoritmes, zodat de automatische interpretatie ook transparant
is voor de beoordelaar. Hoofdstuk drie beschrij de gerapporteerde richtlijnen,
alsmede de kwantitatieve methoden voor elke eigenschap. Deze methoden wer-
den gevalideerd door de eigenschappen die waren verkregen met behulp van de
automatische analyse te vergelijken met die van de visuele inspectie. De PDR fre-
quentie, reactiviteit en aanwezigheid van diuus trage activiteit hadden een matige
tot hoge overeenkomst met de visuele beschrijving. Voor symmetrie en anterieure-
posterieure gradiënten was de overeenkomst lager. Opgemerkt dient te worden
dat door de vrije tekst beschrijvingen de eigenschappen soms moeilijk in een vaste
categorie voor overeenkomst te plaatsen waren.
Omdat de geautomatiseerde interpretatie methoden veelbelovende resultaten
lieten zien, was het gewenst verder te testen in de klinische praktijk. Hiervoor
werden deze geïmplementeerd in een zelfontworpen EEG-viewer. Samen met een
nieuwe evaluatie set van 45 EEG-registraties, verkregen uit de database uit het MST
in Enschede, werd deze gepresenteerd aan negen EEG-experts in Nederland voor
evaluatie, zoals beschreven in Hoofdstuk 4. De EEG’s varieerden genoeg om voor-
beelden te bevaen van normale en afwijkende elementen van het grondpatroon.
Aan de deelnemers werd gevraagd om de EEG’s eerst visueel te beoordelen, en
daarna de bevindingen te vergelijken met de interpretatie gemaakt door het sys-
teem. Vervolgens werd de interbeoordelaarsbetrouwbaarheid bepaald, zowel van
het geautomatiseerde systeem als van elke deelnemer, met als gouden standaard

130 | Chapter 8
de consensus van alle beoordelaars. Zowel de automatische interpretatie als het
merendeel van deelnemers scoorden beide hoge overeenkomst (kappa > 0,6) met
deze gouden standaard. In sommige gevallen scoorde automatische analyse zelfs
een hogere overeenkomst dan enkele individuele deelnemers. Om de acceptatie van
dergelijke algoritmes voor routine beoordelingen te bepalen, werd de deelnemers
gevraagd of zij het nuig vonden kwantitatieve analyse methoden op routine basis
te gebruiken als assistentie. Hierop antwoordden alle deelnemers positief.
Uit deze studies met betrekking tot geautomatiseerde analyse van het grondpa-
troon kunnen we concluderen dat computer-geassisteerde interpretatie een signi-
ficante bijdrage kan hebben voor routine EEG-beoordelingen. Hoewel alleen EEG’s
met een duur van 20-30 minuten getest zijn, zouden de algoritmen ook bruikbaar
kunnen zijn in de interpretatie van langere EEG’s, zoals gemaakt in ambulante regi-
straties en voor IC-monitoring. Verder onderzoek kan helpen om de nauwkeurig-
heid van de interpretatie te verbeteren en om het systeem uit te breiden met aan-
vullende EEG eigenschappen voor beoordeling.
Deel II: Interictale epileptiforme afwijkingen
In de poliklinische seing is de diagnostisering van epilepsie een van de voor-
naamste redenen voor EEG-registratie. Een groot deel van dit proefschri richt
zich daarom op het vinden van een methode voor automatische detectie van inter-
ictale epileptiforme afwijkingen en deze te presenteren aan de beoordelaar, zonder
dat deze eerst het gehele EEG visueel hoe te screenen. In de literatuur is reeds
een groot aantal algoritmen voor piekdetectie beschreven, echter veelal zonder kli-
nische implementatie. Ons voornaamste doel was daarom niet alleen het vinden
van nieuwe algoritmes voor het detecteren van de epileptiforme ontladingen, maar
ook het creëren van een praktische oplossing die geschikt is voor klinisch gebruik.
Als bijdrage aan de automatische detectie van epileptische activiteit werden twee
studies uitgevoerd. De eerste, gepresenteerd in hoofdstuk 5, beschrij een techniek
die epileptiforme ontladingen vindt door het vergelijken van alle in het EEG aan-
wezige signaalgolfvormen aan een getrainde database van voorbeeld-ontladingen.
In dit hoofdstuk beschrijven we hoe 2160 templates van epileptiforme ontladingen
zijn verkregen uit een set test EEG’s. Ook beschrijvenwe hoe deze templates zijn ge-
traind om vergelijkbare golfvormen te classificeren in de andere EEGs op basis van
gelijkenis. Aan de templates is een maat voor betrouwbaarheid gegeven, en in com-
binatie met hun eigen detectie nauwkeurigheid is een stemsysteem gebruikt voor
Nederlandse samenvaing | 131
het groeperen van individuele gedetecteerde events. Hoewel door het bestaan van
verschillende datasets geen exacte vergelijkingen gemaakt konden worden, werd in
hoofdstuk 5 aangetoond dat de sensitiviteit en het aantal foutdetecties van de voor-
gestelde methode vergelijkbaar is met die van andere in de literatuur beschreven
technieken. Bij een hogere sensitiviteit hee deze methode meer foutdetecties door
het geringe elimineren van gedekteerde events, en blij deze in de klinische praktijk
onbruikbaar in vergelijking met de standaard visuele beoordeling. Dit hoofdstuk
laat echter ook zien dat de detectietechniek uitgebreid kan worden naar nieuwe,
nog onbeoordeelde EEG-registraties en het daardoor grote klinische relevantie kan
hebben wanneer het aantal foutdetecties wordt gereduceerd.
De tweede stap in de detectie van interictale epileptiforme activiteit was het vin-
den van een praktische en schaalbare oplossing voor klinisch gebruik. Dit probleem
werd benaderd vanuit een ander perspectief: in plaats van een drempelwaarde
te gebruiken om fout-positieven te elimineren, wijst het beschreven systeem een
waarde toe voor de waarschijnlijkheid dat een gedetecteerd event inderdaad een
epileptiforme afwijking is, en plaatst het deze in afnemende volgorde van waar-
schijnlijkheid. Vervolgens presenteert het systeem op iteratieve wijze steeds tien
events aan de beoordelaar en vraagt het om een bevestiging of afwijzing voor elk
getoonde event. Door dit als feedback te gebruiken leert het systeem welke events
het meest van belang zijn, en past het de waarde voor de waarschijnlijkheid van
de overgebleven detecties dienovereenkomstig aan. Door de beoordelaar te laten
kiezen wanneer hij tevreden is met wat getoond wordt en wanneer het iteratieve
proces stopt, biedt het systeem een praktische oplossing voor routine beoordelingen
en kan het opgeschaald worden naar langdurige registraties. In hoofdstuk 6 werd
het systeem getest op 45 routine EEG’s, elk met een duur van ongeveer 20 tot 30
minuten, en lieten we zien dat na een enkele herhaling van de eerste tien getoonde
events, een gemiddelde van 32% van de interictale ontladingen werd gevonden in de
registraties. Na vijf herhalingen steeg dit tot 74% en na vijien herhalingen werd
95% van de interictale events gedetecteerd en gepresenteerd aan de beoordelaar.
Dit proces kose gemiddeld vijf minuten beoordelingstijd voor de beoordelaar per
EEG.
Om de voordelen die deze techniek in de klinische praktijk kan bieden daadwer-
kelijk te testen is een uitgebreide evaluatie door expert elektro-encefalografisten
nodig. De tot nu toe verkregen resultaten met de voorgestelde methode en beoor-
delingsstrategie zijn echter zeer positief.


References


References | 135
Abend NS, Dlugos DJ, Hahn CD, Hirsch LJ, Herman ST. Use of EEG monitoring
and management of non-convulsive seizures in critically ill patients: a survey of
neurologists. Neurocritical care, 2010; 12:382–9.
Abend NS, Gutierrez-Colina A, Zhao H, Guo R, Marsh E, Clancy RR, et al. Inter-
observer reproducibility of electroencephalogram interpretation in critically ill
children. J Clin Neurophysiol, 2011; 28:15–9.
Agbenu J, Newton RW, Martland T, Ismayl O, Hargreaves S. Eect of reducing the
recording time of standard EEGs on the detection of EEG-abnormalities in the
management of the epilepsies of childhood. Seizure, 2012; 21:422–5.
Anderson NR, Doolile LM. Automated analysis of EEG: Opportunities and pitfalls.
J Clin Neurophysiol, 2010; 27:453–7.
Anderson NR,Wisneski KJ. Automated analysis and trending of the raw EEG signal.
Am J Electroneurodiagnostic Technol, 2008; 48:166–91.
Arciniegas DB. Clinical electrophysiologic assessments andmild traumatic brain in-
jury: State-of-the-science and implications for clinical practice. Int J Psychophys-
iol, 2011; .
Argoud FIM, De Azevedo FM, Neto JM, Grillo E. SADE3: an eective system for
automated detection of epileptiform events in long-term EEG based on context
information. Med Biol Eng Comput, 2006; 44:459–70.
Askamp J, van Puen MJaM. Mobile EEG in Epilepsy. Int J Psychophysiol, 2013; .
Aurlien H, Aarseth JH, Gjerde IO, Karlsen B, Skeidsvoll H, Gilhus NE. Focal epilepti-
form activity described by a large computerised EEG database. Clin Neurophys-
iol, 2007; 118:1369–76.
AurlienH, Gjerde IO, Aarseth JH, Eldø enG, Karlsen B, Skeidsvoll H, et al. EEG back-
ground activity described by a large computerized database. Clin Neurophysiol,
2004; 115:665–73.
Aurlien H, Gjerde IO, Gilhus NE, Hovstad OG, Karlsen B, Skeidsvoll H. A new way
of building a database of EEG findings. Clin Neurophysiol, 1999; 110:986–95.
Azuma H, Hori S, Nakanishi M, Fujimoto S, IchikawaN, Furukawa TA. An interven-
tion to improve the interrater reliability of clinical EEG interpretations. Psychiatr
Clin Neurosci, 2003; 57:485–9.

136
Babiloni C, Lizio R, Carducci F, Vecchio F, Redolfi A, Marino S, et al. Resting state
cortical electroencephalographic rhythms and white maer vascular lesions in
subjects with Alzheimer’s disease: an Italian multicenter study. J Alzheimers
Dis, 2011; 26:331–46.
Babiloni C, Lizio R, Vecchio F, Frisoni GB, Pievani M, Geroldi C, et al. Reactiv-
ity of cortical alpha rhythms to eye opening in mild cognitive impairment and
Alzheimer’s disease: An EEG study. J Alzheim Dis, 2010; 22:1047–64.
Babiloni C, Vecchio F, Bultrini A, Luca Romani G, Rossini PM. Pre- and poststimulus
alpha rhythms are related to conscious visual perception: A high-resolution EEG
study. Cerebr Cortex, 2006; 16:1690–700.
Bares M, Novak T, Brunovsky M, Kopecek M, Stopkova P, Krajca V, et al. The
change of QEEG prefrontal cordance as a response predictor to antidepressive
intervention in bipolar depression. A pilot study. J Psychiatr Res, 2012; 46:219–
25.
Begić D, Popović-Knapić V, Grubišin J, Kosanović-Rajačić B, Filipčić I, Telarović I,
et al.antitative electroencephalography in schizophrenia and depression. Psy-
chiatr Danub, 2011; 23:355–62.
Benbadis SR, LaFranceWC, Papandonatos GD, Korabathina K, Lin K, Kraemer HC.
Interrater reliability of EEG-video monitoring. Neurology, 2009; 73:843–6.
Beniczky S, Aurlien H, Brø gger JC, Fuglsang-Frederiksen A, Martins-da Silva A,
Trinka E, et al. Standardized computer-based organized reporting of EEG:
SCORE. Epilepsia, 2013; 54:1112–24.
Berger H. Uber das elektrenkephalogramm des menschen. Arch Psychiatr Ner-
venkr, 1929; 87:527–570.
Bjork M, Stovner LJ, Hagen K, Sand T. What initiates a migraine aack? Conclu-
sions from four longitudinal studies of quantitative EEG and steady-state visual-
evoked potentials in migraineurs. Acta Neurol Scand Suppl, 2011; 124:56–63.
Blume WT. Drug eects on EEG. Clin Neurophysiol, 2006; 23:306–11.
Brodsky BE, Darkhovsky BS, Kaplan aY, Shishkin SL. A nonparametric method for
the segmentation of the EEG. Comput Meth Programs Biomed, 1999; 60:93–106.

References | 137
Broersen P. Automatic autocorrelation and spectral analysis. Springer-Verlag New
York Inc, 1 edition, 2006.
Bullmore E, Sporns O. Complex brain networks: graph theoretical analysis of struc-
tural and functional systems. Nat Rev Neurosci, 2009; 10:186–98.
Burke JF, Skolarus LE, Callaghan BC, Kerber KA. Choosing Wisely: highest-cost
tests in outpatient neurology. Ann Neurol, 2013; 73:679–83.
Calzada-Reyes A, Alvarez-Amador A, Galán-García L, Valdés-Sosa M. Electroen-
cephalographic abnormalities in antisocial personality disorder. J Forensic Leg
Med, 2011; 19:29–34.
Casson AJ, Rodriguez-Villegas E. Toward online data reduction for portable elec-
troencephalography systems in epilepsy. IEEE transactions on bio-medical engi-
neering, 2009; 56:2816–25.
Castellanos NP, Makarov Va. Recovering EEG brain signals: artifact suppression
with wavelet enhanced independent component analysis. J Neurosci Meth, 2006;
158:300–12.
Chabot RJ, Serfontein G. antitative electroencephalographic profiles of children
with aention deficit disorder. Biol Psychiatr, 1996; 40:951–63.
Chang T, du Plessis A. Neurodiagnostic techniques in neonatal critical care. Curr
Neurol Neurosci Rep, 2012; 12:145–52.
Chiang A, Rennie C, Robinson P, Roberts J, Rigozzi M, Whitehouse R, et al. Auto-
mated characterization of multiple alpha peaks in multi-site electroencephalo-
grams. J Neurosci Methods, 2008; 168:396–411.
Chiang aKI, Rennie CJ, Robinson PA, van Albada SJ, Kerr CC. Age trends and sex
dierences of alpha rhythms including split alpha peaks. Clin Neurophysiol,
2011; 122:1505–17.
Cloostermans MC, de Vos CC, van Puen MJAM. A novel approach for computer
assisted EEG monitoring in the adult ICU. Clin Neurophysiol, 2011; 122:2100–9.
Coburn KL, Lauterbach EC, Boutros NN, Black KJ, Arciniegas DB, Coey CE. The
value of quantitative electroencephalography in clinical psychiatry: a report by

138
the Commiee on Research of the American Neuropsychiatric Association. J
Neuropsychiatry Clin Neurosci, 2006; 18:460–500.
Dash D, Hernandez-Ronquillo L, Moien-Afshari F, Tellez-Zenteno JF. Ambulatory
EEG: a cost-eective alternative to inpatient video-EEG in adult patients. Epilep-
tic disorders, 2012; 14:290–7.
Dauwels J, Vialae F, Cichocki A. Diagnosis of Alzheimer’s disease from EEG sig-
nals: where are we standing? Curr Alzheimer Res, 2010; 7:487–505.
De Lucia M, Fritschy J, Dayan P, Holder DS. A novel method for automated clas-
sification of epileptiform activity in the human electroencephalogram-based on
independent component analysis. Med Biol Eng Comput, 2008; 46:263–72.
Delorme A, Sejnowski T, Makeig S. Enhanced detection of artifacts in EEG data
using higher-order statistics and independent component analysis. NeuroImage,
2007; 34:1443–9.
Doppelbauer A, Zeitlhofer J, Zifko U, Baumgartner C, Mayr N, Deecke L. Occur-
rence of epileptiform activity in the routine EEG of epileptic patients. Acta Neurol
Scand, 1993; 87:345–52.
Douglass LM, Wu JY, Rosman NP, Stafstrom CE. Burst Suppression Electroen-
cephalogram Paern in the Newborn: Predicting the Outcome. J Child Neurol,
2002; 17:403–408.
Duvinage M, Castermans T, Petieau M, Hoellinger T, Cheron G, Dutoit T. Per-
formance of the Emotiv Epoc headset for P300-based applications. BioMedical
Engineering Online, 2013; 12:56.
Ebersole JS, Pedley TA. Current practice of clinical electroencephalography. LWW
medical book collection. Lippinco Williams & Wilkins, 2003.
FaulknerHJ, ArimaH,MohamedA. Latency to first interictal epileptiformdischarge
in epilepsy with outpatient ambulatory EEG. Clin Neurophysiol, 2012; 123:1732–
1735.
Fleiss J. Measuring nominal scale agreement among many raters. Psychol Bull,
1971; 76:378–382.

References | 139
Foley CM, Legido A, Miles DK, Chandler Da, Grover WD. Long-Term Computer-
Assisted Outpatient Electroencephalogram Monitoring in Children and Adoles-
cents. J Child Neurol, 2000; 15:49–55.
Foreman B, Claassen J. Annual Update in Intensive Care and Emergency Medicine
2012. Springer Berlin Heidelberg, Berlin, Heidelberg, 2012.
Friedman D, Hirsch LJ. Seizures in Critical Care. Humana Press, Totowa, NJ, 2010.
Friedman DE, Hirsch LJ. How long does it take to make an accurate diagnosis in
an epilepsy monitoring unit? Clin Neurophysiol, 2009; 26:213–7.
Gaál ZA, Boha R, Stam CJ, Molnár M. Age-dependent features of EEG-reactivity-
Spectral, complexity, and network characteristics. Neurosci Le, 2010; 479:79–84.
Gerber PA, Chapman KE, Chung SS, Drees C, Maganti RK, Ng YT, et al. Interob-
server agreement in the interpretation of EEG paerns in critically ill adults. J
Clin Neurophysiol, 2008; 25:241–9.
Gotman J, Gloor P. Automatic recognition and quantification of interictal epileptic
activity in the human scalp EEG. Electroencephalogr Clin Neurophysiol, 1976;
41:513–29.
Gudmundsson S, Runarsson TP, Sigurdsson S, Eiriksdoir G, Johnsen K. Reliability
of quantitative EEG features. Clin Neurophysiol, 2007; 118:2162–71.
Halford J, Shiau D, Kern R. Seizure detection soware used to complement the
visual screening process for long-term EEG monitoring. American Journal of
Electroneurodiagnostic Technology, 2010; 133–147.
Halford JJ. Computerized epileptiform transient detection in the scalp electroen-
cephalogram: Obstacles to progress and the example of computerized ECG in-
terpretation. Clin Neurophysiol, 2009; 120:1909–1915.
Halford JJ, Pressly WB, Benbadis SR, Tatum WO, Turner RP, Arain A, et al. Web-
based collection of expert opinion on routine scalp EEG: soware development
and interrater reliability. J Clin Neurophysiol, 2011; 28:178–84.
Halford JJ, Schalko RJ, Zhou J, Benbadis SR, TatumWO, Turner RP, et al. Standard-
ized Database Development for EEG Epileptiform Transient Detection: EEGnet

140
Scoring System andMachine Learning Analysis. J Neurosci Meth, 2012; 212:308–
316.
Hammond DC. The need for individualization in neurofeedback: heterogeneity in
QEEG paerns associated with diagnoses and symptoms. Appl Psychophysiol
Biofeedback, 2010; 35:31–6.
Haut SR, Berg AT, Shinnar S, Cohen HW, Bazil CW, SperlingMR, et al. Interrater re-
liability among epilepsy centers: Multicenter study of epilepsy surgery. Epilepsia,
2002; 43:1396–401.
Herrmann CS, Arnold T, Visbeck A, Hundemer HP, Hopf HC. Adaptive frequency
decomposition of EEG with subsequent expert system analysis. Comput Biol
Med, 2001; 31:407–27.
Hirsch LJ. Continuous EEG monitoring in the intensive care unit: an overview. J
Clin Neurophysiol, 2004; 21:332–40.
Hughes JR, John ER. Conventional and quantitative electroencephalography in
psychiatry. J Neuropsychiatry, 1999; 11:190–208.
Hughes SW, Crunelli V. Thalamic mechanisms of EEG alpha rhythms and their
pathological implications. Neuroscientist, 2005; 11:357–72.
Huupponen E, Himanen SL, Värri A, Hasan J, Saastamoinen A, Lehtokangas M,
et al. Fuzzy detection of EEG alpha without amplitude thresholding. Artif Intell
Med, 2002; 24:133–47.
Igasaki T, Higuchi T, Hayashida Y, Murayama N, Neshige R. Proposal for patient-
specific automatic on-line detection of spike-and-wave discharges utilizing an
artificial neural network. In 2011 4th International Conference on Biomedical
Engineering and Informatics (BMEI). IEEE, 2011; 813–817.
Ille N, Berg P, Scherg M. Artifact correction of the ongoing EEG using spatial fil-
ters based on artifact and brain signal topographies. J Clin Neurophysiol, 2002;
19:113–24.
Inan ZH, Kuntalp M. A study on fuzzy C-means clustering-based systems in auto-
matic spike detection. Comput Biol Med, 2007; 37:1160–6.
References | 141
Indiradevi KP, Elias E, Sathidevi PS, Dinesh Nayak S, Radhakrishnan K. A multi-
level wavelet approach for automatic detection of epileptic spikes in the elec-
troencephalogram. Comput Biol Med, 2008; 38:805–16.
Ishii R, Canuet L, Kurimoto R, IkezawaK, Aoki Y, AzechiM, et al. Frontal shi of pos-
terior alpha activity is correlated with cognitive impairment in early Alzheimer’s
disease: A magnetoencephalography-beamformer study. Psychogeriatrics, 2010;
10:138–43.
Jeong J. EEG dynamics in patients with Alzheimer’s disease. Clin Neurophysiol,
2004; 115:1490–505.
Ji Z, Sugi T, Goto S, Wang X, Ikeda A, Nagamine T, et al. An automatic spike detec-
tion system based on elimination of false positives using the large-area context
in the scalp EEG. IEEE Trans Biomed Eng, 2011a; 58:2478–88.
Ji Z,Wang X, Sugi T, Goto S, NakamuraM. Automatic spike detection based on real-
time multi-channel template. 2011 4th International Conference on Biomedical
Engineering and Informatics (BMEI), 2011b; 648–652.
Jiang L, Yin X, Yin C, Zhou S, DanW, Sun X. Dierent quantitative EEG alterations
induced by TBI among patients with dierent APOE genotypes. Neurosci Le,
2011; 505:160–4.
Jin Y, Potkin SG, Kemp AS, Huerta ST, Alva G, Thai TM, et al. Therapeutic eects
of individualized alpha frequency transcranial magnetic stimulation (alphaTMS)
on the negative symptoms of schizophrenia. Schizophr Bull, 2006; 32:556–61.
John ER, Prichep LS, Alper KR, Mas FG, Cancro R, Easton P, et al. antitative elec-
trophysiological characteristics and subtyping of schizophrenia. Biol Psychiatr,
1994; 36:801–26.
Jordan K. Continuous EEG monitoring in the neuroscience intensive care unit and
emergency department. J Clin Neurophysiol, 1999; .
Jordan KG. Neurophysiologic monitoring in the neuroscience intensive care unit.
Neurologic clinics, 1995; 13:579–626.
Kannathal N, Choo ML, Acharya UR, Sadasivan PK. Entropies for detection of
epilepsy in EEG. Comput Methods Programs Biomed, 2005; 80:187–94.
142
Kemp B, Blom H. Optimal detection of the alpha state in a model of the human
electroencephalogram. Electroencephalogr Clin Neurophysiol, 1981; 52:222–225.
Khushaba RN, Wise C, Kodagoda S, Louviere J, Kahn BE, Townsend C. Consumer
neuroscience: Assessing the brain response to marketing stimuli using electroen-
cephalogram (EEG) and eye tracking. Expert Syst Appl, 2013; 40:3803–3812.
Klass D. The continuing challenge of artifacts in the EEG. Am J EEG Technol, 1995;
.
KlimeschW. EEG-alpha rhythms andmemory processes. Int J Psychophysiol, 1997;
26:319–40.
Knyazeva MG, Jalili M, Meuli R, Hasler M, De Feo O, Do KQ. Alpha rhythm and
hypofrontality in schizophrenia. Acta Psychiatr Scand, 2008; 118:188–99.
Könönen M, Partanen JV. Blocking of EEG alpha activity during visual performance
in healthy adults. A quantitative study. Electroencephalogr Clin Neurophysiol,
1993; 87:164–6.
Korotchikova I, Stevenson NJ, Walsh BH, Murray DM, Boylan GB. antitative
EEG analysis in neonatal hypoxic ischaemic encephalopathy. Clin Neurophysiol,
2011; .
Kumar Y, Dewal ML, Anand RS. Epileptic seizures detection in EEG using DWT-
based ApEn and artificial neural network. Res J Appl Sci Eng Tech, 2012; 4:3588–
3591.
Kurtz P, Hanafy KA, Claassen J. Continuous EEG monitoring: Is it ready for prime
time? Curr Opin Crit Care, 2009; 15:99–109.
Lachaux JP, Rodriguez E, Martinerie J, Varela FJ. Measuring phase synchrony in
brain signals. Hum Brain Mapp, 1999; 8:194–208.
Landis JR, Koch GG. The measurement of observer agreement for categorical data.
Biometrics, 1977; 33:159–74.
Leach JP, Stephen LJ, Salveta C, Brodie MJ. Which electroencephalography (EEG)
for epilepsy? The relative usefulness of dierent EEG protocols in patients with
possible epilepsy. J Neurol Neurosurg Psychiatry, 2006; 77:1040–2.

References | 143
Lee SH, Park YM, Kim DW, Im CH. Global synchronization index as a biological
correlate of cognitive decline in Alzheimer’s disease. Neurosci Res, 2010; 66:333–
9.
Levenberg K. A Method for the Solution of Certain Non-Linear Problems in Least
Squares. Q Appl Math, 1944; 2:164–168.
Levin KH, Lüders H. Comprehensive clinical neurophysiology. W.B. Saunders, 2000.
Li M, Zhang Y, Zhang H, Hu HS. An EEG Based Control System for Intelligent
Wheelchair. Appl Mech Mater, 2013; 300-301:1540–1545.
Lodder SS, Askamp J, van PuenMJAM. Inter-ictal spike detection using a database
of smart templates. Clin Neurophysiol, 2013; .
Lodder SS, van Puen MJAM. Automated EEG analysis: Characterizing the poste-
rior dominant rhythm. J Neurosci Meth, 2011; 200:86–93.
Lodder SS, van PuenMJAM. antification of the adult EEG background paern.
Clin Neurophysiol, 2013; 124:228–37.
Logi F, Pasqualei P, Tomaiuolo F. Predict recovery of consciousness in post-acute
severe brain injury: The role of EEG reactivity. Brain Inj, 2011; 25:972–979.
Lopes da Silva FH, Pijn JP, Velis D, Nijssen PC. Alpha rhythms: noise, dynamics
and models. Int J Psychophysiol, 1997; 26:237–49.
Ma X, Cui Y, Stojmenovic I. Energy Eiciency on Location Based Applications in
Mobile Cloud Computing: A Survey. Procedia Computer Science, 2012; 10:577–
584.
Marcuse LV, Schneider M, Mortati KA, Donnelly KM, Arnedo V, Grant AC. an-
titative analysis of the EEG posterior-dominant rhythm in healthy adolescents.
Clin Neurophysiol, 2008; 119:1778–81.
Martin W, Johnson L, Viglione S, Naitoh P, Joseph R, Moses J. Paern recognition
of EEG-EOG as a technique for all-night sleep stage scoring. Electroencephalogr
Clin Neurophysiol, 1972; 32:417–427.
Maulsby RL, Kellaway P, GrahamM. The normative electroencephalographic data
reference library. Final report, contract NAS-9-1200 Washington DC National
aeronautics and space administration, 1968; .

144
Mishra M, Banday M, Derakhshani R, Croom J, Camarata PJ. A quantitative EEG
method for detecting post clamp changes during carotid endarterectomy. J Clin
Monit Comput, 2011; 25:295–308.
Moeller JJ, Tu B, Bazil CW. antitative and qualitative analysis of ambulatory
electroencephalography during mild traumatic brain injury. Arch Neurol, 2011;
68:1595–8.
Morabito FC, Labate D, Morabito G, Palamara I, Szu H. Monitoring and diagnosis
of Alzheimer’s disease using noninvasive compressive sensing EEG. volume 8750.
2013; 87500Y–87500Y–10.
Morei DV, Zanei O, Binei G, Frisoni GB. antitative EEG Markers in Mild
Cognitive Impairment: Degenerative versus Vascular Brain Impairment. Int J
Alzheimers Dis, 2012; 2012:917537.
Mukhopadhyay S, Ray GC. A new interpretation of nonlinear energy operator and
its eicacy in spike detection. IEEE Trans Biomed Eng, 1998; 45:180–7.
NakamuraM, ShibasakiH, Imajoh K, Nishida S, Neshige R, Ikeda A. Automatic EEG
interpretation: a new computer-assisted system for the automatic integrative
interpretation of awake background EEG. Electroencephalogr Clin Neurophysiol,
1992; 82:423–431.
NakamuraM, Sugi T, Ikeda A, ShibasakiH. Automatic EEG interpretation adaptable
to individual electroencephalographer using artificial neural network. Int J Adapt
Contr Signal Process, 2002; 16:25–37.
Naruse Y, Matani A, Miyawaki Y, Okada M. Influence of coherence between multi-
ple cortical columns on alpha rhythm: a computational modeling study. Human
brain mapping, 2010; 31:703–15.
Nenadic Z, Burdick JW. Spike detection using the continuous wavelet transform.
IEEE Trans Biomed Eng, 2005; 52:74–87.
Niedermeyer E, da Silva FL. Electroencephalography: Basic Principles, Clinical Ap-
plications, and Related Fields. Lippinco Williams & Wilkins, 5th edition, 2004.
Nonclercq A, Foulon M, Verheulpen D, De Cock C, Buzatu M, Mathys P, et al.
Spike detection algorithm automatically adapted to individual patients applied

References | 145
to spike-and-wave percentage quantification. Neurophysiol Clin Clin Neuro-
physiol, 2009; 39:123–31.
Nonclercq A, Foulon M, Verheulpen D, De Cock C, Buzatu M, Mathys P, et al.
Cluster-based spike detection algorithm adapts to interpatient and intrapatient
variation in spike morphology. J Neurosci Methods, 2012; 210:259–265.
Nunez PL, Ramesh S. Electric Fields of the Brain: The Neurophysics of EEG, 2nd
Edition. Oxford University Press, USA, 2005.
Nuwer M. Assessment of digital EEG, quantitative EEG, and EEG brain mapping:
Report of the American Academy of Neurology and the American Clinical Neu-
rophysiology Society. Neurology, 1997; 49:277–292.
Obrist WD. Problems of aging. In Remond A (ed). Handbook of electroencephalog-
raphy and Clinical Neurophysiology. Elsevier Amsterdam, 1976.
Orekhova EV, Elam M, Orekhov VY. Unraveling superimposed EEG rhythms with
multi-dimensional decomposition. J Neurosci Methods, 2011; 195:47–60.
Partanen J, SoininenH, Helkala E, KönönenM, Kilpeläinen R, Riekkinen P. Relation-
ship between EEG reactivity and neuropsychological tests in vascular dementia.
J Neural Transm, 1997; 104:905–912.
Petersen M, Stahlhut C. Smartphones get emotional: mind reading images and re-
constructing the neural sources. Aective Computing and Intelligent Interaction,
2011; 578–587.
Petit D, Gagnon JF, Fantini ML, Ferini-Strambi L, Montplaisir J. Sleep and quanti-
tative EEG in neurodegenerative disorders. J Psychosom Res, 2004; 56:487–96.
Prichep LS, John ER, Ferris SH, Reisberg B, Almas M, Alper K, et al. antitative
EEG correlates of cognitive deterioration in the elderly. Neurobiol Aging, 1994;
15:85–90.
Ramachandrannair R, Sharma R, Weiss SK, Cortez MA. Reactive EEG paerns in
pediatric coma. Pediatr Neurol, 2005; 33:345–9.
Riviello JJ. Digital trend analysis in the pediatric and neonatal intensive care units.
J Clin Neurophysiol, 2013; 30:143–55.

146
Robinson P, Loxley P, O’Connor S, Rennie C. Modal analysis of corticothalamic
dynamics, electroencephalographic spectra, and evoked potentials. Phys Rev E,
2001; 63:1–13.
Robinson P, Whitehouse R, Rennie C. Nonuniform corticothalamic continuum
model of electroencephalographic spectra with application to split-alpha peaks.
Physical Review E, 2003; 68:1–10.
San-juan D, Chiappa KH, Cole AJ. Propofol and the electroencephalogram. Clin
Neurophysiol, 2010; 121:998–1006.
Sanchez SM, Carpenter J, Chapman KE, Dlugos DJ, Gallentine WB, Giza CC, et al.
Pediatric ICU EEG monitoring: current resources and practice in the United
States and Canada. J Clin Neurophysiol, 2013; 30:156–60.
Scherg M, Ille N, Weckesser D, Ebert A, Ostendorf A, Boppel T, et al. Fast evalu-
ation of interictal spikes in long-term EEG by hyper-clustering. Epilepsia, 2012;
53:1196–204.
Schomer DL, Lopes da Silva FH. Niedermeyer’s Electroencephalography: Ba-
sic Principles, Clinical Applications, and Related Fields. Lippinco Williams &
Wilkins, 2010.
Segalowitz SJ, Santesso DL, Jetha MK. Electrophysiological changes during adoles-
cence: A review. Brain Cognit, 2010; 72:86–100.
Segrave RA, Thomson RH,Cooper NR, Cro RJ, SheppardDM, Fitzgerald PB. Upper
alpha activity during working memory processing reflects abnormal inhibition in
major depression. J Aect Disord, 2010; 127:191–8.
Seneviratne U, Mohamed A, Cook M, D’Souza W. The utility of ambulatory elec-
troencephalography in routine clinical practice: a critical review. Epilepsy re-
search, 2013; 105:1–12.
Sewards TV, Sewards MA. Alpha-band oscillations in visual cortex: Part of the
neural correlate of visual awareness? Int J Psychophysiol, 1999; 32:35–45.
Shen CP, Liu ST, Zhou WZ, Lin FS, Lam AYY, Sung HY, et al. A physiology-based
seizure detection system for multichannel EEG. PloS one, 2013; 8:e65862.

References | 147
Sigl JC, Chamoun NG. An introduction to bispectral analysis for the electroen-
cephalogram. J Clin Monit, 1994; 10:392–404.
Silva LD. Neural mechanisms underlying brain waves: from neural membranes to
networks. Electroencephalogr Clin Neurophysiol, 1991; 79:81–93.
Snaedal J, Johannesson GH, Gudmundsson TE, Blin NP, Emilsdoir AL, Einarsson B,
et al. Diagnostic accuracy of statistical paern recognition of electroencephalo-
gram registration in evaluation of cognitive impairment and dementia. Dement
Geriatr Cogn Disord, 2012; 34:51–60.
Spronk D, Arns M, Barne KJ, Cooper NJ, Gordon E. An investigation of EEG, ge-
netic and cognitive markers of treatment response to antidepressant medication
in patients with major depressive disorder: A pilot study. J Aect Disord, 2011;
128:41–8.
Stam CJ. Nonlinear dynamical analysis of EEG and MEG: review of an emerging
field. Clin Neurophysiol, 2005; 116:2266–301.
Stam CJ, Jones BF, Nolte G, Breakspear M, Scheltens P. Small-world networks and
functional connectivity in Alzheimer’s disease. Cereb Cortex, 2007; 17:92–9.
Stam CJ, Pijn JP, Suczynski P, Lopes da Silva FH. Dynamics of the human alpha
rhythm: evidence for non-linearity? Clin Neurophysiol, 1999; 110:1801–13.
Steriade M, Gloor P, Llinas R. Basic mechanisms of cerebral rhythmic activities.
Electroencephalogr, 1990; 76:481–508.
Stevens A, Kircher T. Cognitive decline unlike normal aging is associatedwith alter-
ations of EEG temporo-spatial characteristics. Eur Arch Psychiatr Clin Neurosci,
1998; 248:259–66.
Stevenson NJ, Korotchikova I, Temko A, Lightbody G, MarnaneWP, Boylan GB. An
automated system for grading EEG abnormality in term neonates with hypoxic-
ischaemic encephalopathy. Ann Biomed Eng, 2013; 41:775–85.
Stewart CP, Otsubo H, Ochi a, Sharma R, Hutchison JS, Hahn CD. Seizure identi-
fication in the ICU using quantitative EEG displays. Neurology, 2010; 75:1501–8.
Stopczynski A, Larsen J. A smartphone interface for a wireless EEG headset with
real-time 3D reconstruction. Aective Computing and Intelligent Interaction,
2011; 4:317–318.

148
Strzelczyk A, Nickolay T, Bauer S, Haag A, Knake S, Oertel WH, et al. Evaluation of
health-care utilization among adult patients with epilepsy in Germany. Epilepsy
Behav, 2012; 23:451–7.
Subasi A. Automatic detection of epileptic seizure using dynamic fuzzy neural net-
works. Expert Syst Appl, 2006; 31:320–328.
Tatum WO, Dworetzky Ba, Freeman WD, Schomer DL. Artifact: recording EEG in
special care units. J Clin Neurophysiol, 2011a; 28:264–77.
TatumWO, Dworetzky Ba, Schomer DL. Artifact and recording concepts in EEG. J
Clin Neurophysiol, 2011b; 28:252–63.
Thakor NV, Tong S. Advances in quantitative electroencephalogram analysis meth-
ods. Annu Rev Biomed Eng, 2004; 6:453–95.
Thatcher RW. Validity and Reliability of antitative Electroencephalography.
Journal of Neurotherapy, 2010; 14:122–152.
Trevathan E. Ellen R. Grass Lecture: Rapid EEG analysis for intensive care decisions
in status epilepticus. Am J Electroneurodiagnostic Technol, 2006; 46:4–17.
van de Velde M, Ghosh IR, Cluitmans PJ. Context related artefact detection in
prolonged EEG recordings. Comput Meth Programs Biomed, 1999; 60:183–96.
van der Hiele K, Vein AA, Reijntjes RHAM, Westendorp RGJ, Bollen ELEM, van
Buchem MA, et al. EEG correlates in the spectrum of cognitive decline. Clin
Neurophysiol, 2007; 118:1931–9.
van der Stelt O. Development of human EEG posterior alpha rhythms. Clin Neu-
rophysiol, 2008; 119:1701–2.
Van Hese P, Vanrumste B, Hallez H, Carroll GJ, Vonck K, Jones RD, et al. Detection
of focal epileptiform events in the EEG by spatio-temporal dipole clustering. Clin
Neurophysiol, 2008; 119:1756–70.
van Puen MJAM. Nearest neighbor phase synchronization as a measure to detect
seizure activity from scalp EEG recordings. J Clin Neurophysiol, 2003; 20:320–5.
van Puen MJAM. The colorful brain: Visualization of EEG background paerns. J
Clin Neurophysiol, 2008; 25:63–8.

References | 149
van Puen MJAM. Essentials of Neurophysiology: Basic Concepts and Clinical
Applications for Scientists and Engineers. 230. Springer, 2009; .
van Puen MJAM, Kind T, Visser F, Lagerburg V. Detecting temporal lobe seizures
from scalp EEG recordings: A comparison of various features. Clin Neurophysiol,
2005; 116:2480–9.
van Puen MJAM, Peters JM, Mulder SM, de Haas JAM, Bruijninckx CMA, Tavy
DLJ. A brain symmetry index (BSI) for online EEG monitoring in carotid en-
darterectomy. Clin Neurophysiol, 2004; 115:1189–94.
van Puen MJAM, Tavy DLJ. Continuous quantitative EEG monitoring in hemi-
spheric stroke patients using the brain symmetry index. Stroke, 2004; 35:2489–92.
van Vugt MK, Sederberg PB, Kahana MJ. Comparison of spectral analysis methods
for characterizing brain oscillations. J Neurosci Methods, 2007; 162:49–63.
Vigário R, Särelä J, Jousmäki V, Hämäläinen M, Oja E. Independent component
approach to the analysis of EEG and MEG recordings. IEEE transactions on bio-
medical engineering, 2000; 47:589–93.
Wang C, Zou J, Zhang J, Wang M, Wang R. Feature extraction and recognition
of epileptiform activity in EEG by combining PCA with ApEn. Cogn Neurodyn,
2010; 4:233–40.
Waterhouse E. New horizons in ambulatory electroencephalography. IEEE Eng
Med Biol Mag, 2003; 22:74–80.
Webb J, Xiao ZG, Aschenbrenner KP, Herrnstadt G, Menon C. Towards a portable
assistive arm exoskeleton for stroke patient rehabilitation controlled through a
brain computer interface. In 2012 4th IEEE RAS & EMBS International Confer-
ence on Biomedical Robotics and Biomechatronics (BioRob). IEEE, 2012; 1299–
1304.
Willems JL, Arnaud P, van Bemmel JH, Bourdillon PJ, Brohet C, Dalla Volta S, et al.
Assessment of the performance of electrocardiographic computer programs with
the use of a reference data base. Circulation, 1985; 71:523–534.
Wilson SB, Emerson R. Spike detection: A review and comparison of algorithms.
Clin Neurophysiol, 2002; 113:1873–81.

150
Young GB. Continuous EEG monitoring in the ICU: challenges and opportunities.
Can J Neurol Sci, 2009; 36 Suppl 2:S89–91.
Zhang X, Wang X, Sugi T, Ikeda A, Nagamine T, Shibasaki H, et al. Automatic
interpretation of hyperventilation-induced electroencephalogram constructed in
the way of qualified electroencephalographer’s visual inspection. Med Biol Eng
Comput, 2011; 49:171–80.
Zhou J, Schalko RJ, Dean BC, Halford JJ. Morphology-based wavelet features and
multiple mother wavelet strategy for spike classification in EEG signals. Confer-
ence proceedings : Annual International Conference of the IEEE Engineering in
Medicine and Biology Society, 2012; 2012:3959–62.

Acknowledgments
It has been an amazing four years in which I have learned a lot about a field that
I could only imagine to be familiar with a few years ago. The ride has been fun,
but as with all good things, it has to come to an end to make space for the next
adventure. Many people have played a key role for me to be where I am today, both
directly and indirectly. I would like to thank all of them: friends, family, colleagues,
relationships and acquaintances. Without your support and encouragement this
thesis would not have been possible.
I would also like to thank a number of people in particular. First, my parents
for their continuous support and encouragement over the course of this project.
Your weekly phone calls le me recharged and ready for the week ahead, and I am
grateful for the opportunity you gave me to study and for believing in me. To my
brothers Johnathan and Jason, thank you for your support. Seeing both of you so
passionate in what you do is a great inspiration to me. Never stop dreaming!
My next thank you goes to Michel van Puen for allowing me to make this PhD
a reality. Without his exchange of ideas and concepts this project would not have
reached its full potential. I still remember that first phone interview on an unex-
pected evening in South Africa. The signal quality was poor (or maybe surfing just
le my ears full of sand and water), but regardless of barely hearing anything, I
was determined to leave a good impression. Luckily with Michel this proved to be
easy given his natural style of making one feel comfortable and equal in a conver-
sation. Michel, thank you for taking a chance with me and allowing me to pursue
this project in a style and manner that fits my personality. I appreciate the freedom
you gave me and particularly value the working environment that you put together
where a simple engineer can learn and eventually contribute to a field as dierent
as clinical neurophysiology. Our meetings and discussions were greatly valued, and
I hope that more discussions still lie ahead.

152
Over the course of this project I have oen relied on colleagues and fellow PhD
students to help me with translations, proofreading, feedback on design protocols
and many administrative tasks which I was happy to delegate to whomever I could
find. Apart from this, I was also invited into the personal lives of many colleagues
which made me feel at home in a foreign country and made the working environ-
ment very pleasurable. To Bas-Jan, Cecile, Chin, Esther, Floor, Ghita, Hanneke,
Jessica, Marleen and Sid, thank you. I wish all of you the best for your future ca-
reers, and maybe one day our paths will cross again. To Jeannee, sharing an oice
with you has been a real pleasure. Aer that day when you brought a massive box
of coee to work I knew that we will get along just fine. To the rest of the ECTM
sta and researchers that I spent lunch, meetings, and coee breaks with, thanks
for all the laughs and good debates that we had. Special thanks also to Danielle,
Esmeralda, Jolanda and Tanja for helpingme with all the administrative tasks. Also,
thank you to Linda, Marleen and Esther for helping me with the Dutch translations
of this thesis.
At the start of this project I only had a small amount of experience with elec-
troencephalography, and although this still remains limited, I learned a lot during
the early months with the help of the technical sta at the Clinical Neurophysi-
ology department at Medisch Spectrum Twente in Enschede. By allowing me to
observe and make notes during patient measurements, I was able to quickly be-
come familiar with the field, and together with Thursday morning meetings in the
hospital led by Michel, my informal training into EEGs has given me an invaluable
tool that I can carry forward with me. Thank you in particular to Carin and Tom for
making my days in the hospital more fun. We all know how much I like hospitals..
I had the fortunate opportunity to also supervise three bachelors and Masters
students during the course of my PhD. To Astrid, Michiel and Sanne, thank you
for all the ideas and insights that we shared. It was a pleasure working with you.
To all the other students I had the opportunity to work with, especially those that
provided me with requests and suggestions to make my soware and algorithms
beer, thank you very much.
To all my friends and family abroad, Alex, Almero, Andrea, Ben, Bevan, Bjorn,
Ciske, Colleen, Fauve, Gerhard, Henry, Jar, Jaques, Juergen, Neil, Ockie, Petrus,
Rayno, Ross, Thomas, Tjoppie and van Wyk, you have played a large role in this
project. Your Skype calls and emails were the highlight of my day and made me
feel much closer to home. As anyone who lives abroad knows, there are days when
it all seems too much. Thank you for motivating me to keep going.

Dankwoord | 153
To everyone that I have met during my stay in the Netherlands, thank you for
making me feel at home. Having so many great friends to relax with has surely
made this project easier. Thanks in particular to Aard, Anne, Bart, Bram, Brian,
David, Erwin, Evelien, Feite, Frank, Frank, Freek, Gregory, Japie, Kazia, Linda, Mar-
cel, Merel, Natasja, Nick, Niels, Niels, Peter, Precivil, Ramazan, Roeland, Samuele,
Sanne, Stijn, Taco, Tjeerd and Yusuf and all the other people I’ve met. Although
I miss many names here, the other 200 of you are just as awesome! From burger
groups to surf trips and escalating Friday nights, I had a lot of fun!
Lastly I would like to thank all the people that participated in one way or another
to this research. Apart from Michel and fellow researchers, I was also fortunate
enough to have a group of very busy and very patient neurologists and clinical
neurophysiologists to help me with evaluation and testing: Dr. Geert Brekelmans,
Prof. Oebele F. Brouwer, Prof. J. Gert van Dijk, Dr. Jeannee Hofmeijer, Dr. Frans
S. S. Leijten, Dr. Jan Meulstee, Dr. Jaco Pasman, Dr. Robjan Schimsheimer, and Dr.
Selma C. Tromp. Thank you all. Your participation and feedback is greatly valued
and I hope that you had as much pleasure working with me as I did in working on
the methods and algorithms that may one day help you.
Lastly, I would like to thank my PhD defence commiee for reading my thesis
and for taking part in my PhD defence. Also thank you for the wonderful and very
insightful questions that you have asked.
May the next adventure be as fun as this one.
Shaun


About the author
Shaun Sandy Lodder was born on 20 October 1984 in Kimberley, South Africa. He
graduated high school in 2002, and aer spending a year abroad in the United
Kingdom, he returned to South Africa and studied engineering at the University of
Stellenbosch. His main areas of interest included applied mathematics, soware
design, computer vision and machine learning. In 2008 he obtained his bachelor’s
degree and continued to complete a master’s degree in engineering in 2010 un-
der supervision of prof. Johan A. du Preez. The topic of his master’s thesis was
brain-computer interfaces. Aer finishing his master’s degree, Shaun moved to the
Netherlands to continue his research as a doctoral student in automated EEG anal-
ysis under supervision of prof. Michel J.A.M van Puen. He obtained his PhD in
2014 and moved back to South Africa, where he founded a company to bring his re-
search to clinical practice. In his spare time, Shaun enjoys being outdoors as much
as possible and in particular loves surfing, kitesurfing, wine-tasting, diving, and a
variety of other adrenaline-filled activities.