FEATURES OF BIRDS. Flight feathers Body feathers Down feathers.

Computer-Aided Visual Analysis of FeathersJessica R. Baron1, Pepper W. Trail2, and Eric K. Patterson1
1Clemson University, North Charleston, SC, USAEmail: {jrbaron, ekp}@clemson.edu
2U.S. Fish & Wildlife Service, National Fish and Wildlife Forensic Laboratory, Ashland, OR, USAEmail: [email protected]
Abstract—Feathers are fascinating natural components ofbirds and other, extinct dinosaurs. They exhibit a variety ofcrucial biological properties that are studied in multiple fields.Here we present work in visual analysis of feathers that leveragesimage-processing methods to observe important physical dataabout the structure and shape of feathers. Such data may beused to inform ornithology or paleontology as well as used tosynthesize accurate computerized representations of feathers forhigh-fidelity visualization and interactive rendering.
I. INTRODUCTION
The feathers of birds and other dinosaurs are studied in or-nithology and paleontology. A variety of other fields also seekunderstanding of properties of feathers such as their strength,aerodynamics, coloration, and insulation in order to informmaterial design and other applications [1] [2]. Additionally,visualizations of feathers are needed for accurate scientificmaterials, and feathers are often modeled as a major visualaspect for characters in cinema and gaming. Here we presentnovel, ongoing work in visual analysis of feathers and de-scribe methods that we have developed for extracting physicalproperties from images of feathers. Although these techniquescould be employed using any photographs of feathers, theprimary source of images used for this work is The FeatherAtlas [3]. It consists of a well-cataloged library of images offlight feathers from various types of birds throughout NorthAmerica, images selected from the curated collection of theNational Fish and Wildlife Forensics Laboratory.
II. BIOLOGICAL BACKGROUND
Feathers are studied across disciplines such as ornithology,paleontology, physics, material science, and visual computing.This is particularly due to their unique, hierarchical structure.Figure 1 is an image of a feather taken with a scanningelectron microscope (SEM) with several key substructureshighlighted. A feather consists of a central shaft (blue inFigure 1) and two vanes composed entirely of barbs (yellow)branching from the rachis portion of the shaft (the bare portionis called the calamus). A single barb is composed of a centeredramus (dark center of the yellow portion) and many barbules(green and red). Pennaceous barbs as pictured are connectedtogether via their barbules. These barbules are either distal(green) or proximal (red). Distal barbules own hooklets thatconnect with rods on the adjacent proximal barbules. Six maintypes of feathers exist which vary in function, placement,
Fig. 1: SEM image of a feather with the shaft (blue), a barb (yellow),a distal barbule (green), and a proximal barbule (red) highlighted.
and anatomical composition [4]. We focus on flight feathers(primaries and secondaries on the wing and rectrices on thetail) due to their visibility, shape, and the available data, butthe techniques presented can be applied for the other types.
III. RELATED WORK
A. Visual Computing
Concerning feather geometry for computer graphics, severalworks focus on curved-based procedural feather generation butdo not use statistics of real-world feathers as a basis [11], [12],[13], [14], [15], [16], [17]. Some image processing has beenapplied to the feather-processing industry in denoising SEMcaptures of feathers [18] and extracting the general shapesof the shaft and vanes in feather images [19]. Another studylinks 2D image processing and 3D geometry generation of
Fig. 2: Image segmentation using the Watershed algorithm of multi-feather scans from the Feather Atlas.

Data Summary from Ornithological StudiesAttribute Feather Type(s) Bird(s) Value Unit ReferenceBarb Angle 3 Primaries 60 Species 5-50 degrees Feo, Field, & Prum [5]Barb Angle Covert, Rectrex Parrots 10-40 degrees Feo & Prum [6]Barb Length 3 Primaries 60 Species 10-60 mm Feo, Field, & Prum [5]Barb Length Covert, Rectrex Parrots 5-25 mm Feo & Prum [6]Vane Width Covert, Rectrex Parrots 5-15 mm Feo & Prum [6]Barb Diameter Contour Ducks, Cormorants 56 µm Rijke [7]Barb Spacing Contour Ducks, Cormorants 271 µm Rijke [7]Barbule Angle unknown Hummingbirds 0-70 degrees Greenewalt [8]Barbule Length unknown Hummingbirds 100 mm Greenewalt [8]Barbule Diameter unknown Hummingbirds 15 mm Greenewalt [8]Penn. Barb Density Contour Tits 1.47 per mm Broggi et al. [9]Penn. Barbule Density Contour Tits 2.17 per 0.1mm Broggi et al. [9]Rachis Cross Section 2 Primaries Common Buzzard 0.03-5.79 x 0.01-3.47 mm4 Osvath et al. [10]Rachis Cross Section 2 Primaries White Stork 0.14-26.1 x 0.08-22.3 mm4 Osvath et al. [10]Rachis Cross Section 2 Primaries House Sparrow 0.40-42.6 x 0.10-24.8 µm4 Osvath et al. [10]Rachis Cross Section 2 Primaries Pygmy Cormorant 5.00-55.0 x 4.00-55.8 µm4 Osvath et al. [10]
TABLE I: A summary sample of related data manually gathered in ornithological studies.
feathers using landmark- and curve-based techniques whichthe techniques proposed in this paper build upon [20].
B. Ornithological Studies
Although visual-computing applications have not used datafrom real-world feathers, ornithological studies provide someinsight into gathering statistics on the variation of feathershape. Most of the statistics found across these works issummarized in Table I including studying vane asymmetryfor flight concerning barb angles and lengths [6], [5], waterrepellency concerning barb diameters and spacing [7], insu-lation concerning barb and barbule densities [9], iridescencebased on barbule angles [8]. A recent study investigates thecross-sectional shape of the rachis of flight feathers sampledfrom birds with different patterns of flight. Measurements ofthe cross sections were manually taken as the second momentof area [10]; some of these results are in the last four rows ofTable I shown as ranges of minimum and maximum valueson single feathers. Other studies consider the nanoscopicarrangements within feathers using SEM and transmissionelectron microscopy (TEM) imagery for observing feathergrowth and iridescence [21] [22].
The measurements in these studies were all taken manually.In the next section we present methods for automating theanalysis of feather images with particular focus on barb densityand guiding curves.
IV. METHOD AND IMPLEMENTATION
The proposed implementation involves data collection andautomated visual analysis in order to extract informationthat describes the shapes of feathers. This study focuses onapplying such data to drive generation of procedural feathergeometry, but measurements and statistics of feather shapesmay also be of interest across disciplines to further theunderstanding of these unique, organic structures.
The overall goal is to extract several important physicalmeasurements from real feathers. We do this in a multi-stepprocess by segmenting images of multiple, related feathersphotographed together; approximating the number of barbs in
a vane of each individual feather; and fitting curves to thevarious substructures that help define the specific shapes ofeach feather.
Our analysis begins with reading and leveraging meta-datafrom the Feather Atlas [3]. This data is associated with eachsingle image containing multiple feathers of the same typetaken from a single avian specimen. An example of a scanis shown in Figure 2 (with located bounding boxes drawnover it). To represent a variety of birds, samples from theAtlas were chosen based on taxonomic order. The Watershedalgorithm is applied initially to segment the Feather Atlas scaninto single-feather images as depicted in Figure 2; boundingboxes were expanded to ensure that the calamus was includedwith each single-feather image. Further image analysis isthen applied to each split image on a per-feather basis. Theshaft may be important to some analysis and could be foundusing landmark-based curve regression, image masks, or cross-correlation starting near the calamus.
To estimate barb density, we apply the Fast-Fourier Trans-form (FFT) algorithm to span of a vane in the individualfeather images. A column of pixels along the center of a vaneis selected as input for the FFT by searching the image spaceof the bounding box. The pixel count of the highest energyfrequency divided by the vane’s length in pixels yields thespacing between barbs in pixels. This value is then scaled bythe actual vane length provided by the Feather Atlas data inorder to derive a final barb density per millimeter of the vane.This technique is performed over a variety of feather samplesand plotted in Figure 6. Figure 3 displays the column on thevane with red and blue alternating colors to show the barbsampling (left image) and a plot of the FFT values as barbcounts in the vane (right).
We also investigate estimating the curvature of individualbarbs, shown in Figure 4. This technique is a work in progresstowards extracting guide splines that describe the curvature ofbarbs. Tracing a barb curve begins on the rachis portion of theshaft. A window of pixels in this area (window size relativeto the resolution of a feather image) is selected to comparewith neighboring matrices moving outwards from the shaft to

the contour of the vane. The highest cross-correlation valuesamong nearby windows, progressing horizontally by one pixel,determines which pixel area is chosen next until the border ofthe feather is met. These pixel locations can then be regressedin order to derive control vertices for the guide splines.
The landmark-based approach according to [20] is currentlyemployed to process parametric curves for defining the generalshape of the shaft and vane outlines as depicted in Figure 5. Weare continuing use of the cross-correlation technique to find theshaft curvature without landmarks. Once this is known, barbangles (rotated orientations in respect to the shaft orientation)can be derived based on the shaft and barb as parameterizedcurves fitted from the trace.
V. DISCUSSION AND CONCLUSION
The main novel contribution of this study is the introductionof methods for visual analysis to derive values for barb densityand provide a means to extract the curved shape of barbs.Figure 6 plots estimated numbers of barbs per millimeter offeather vanes. 102 feathers were sampled from the FeatherAtlas from a variety of bird taxonomic orders and feathertypes.
The mean barb density of each type of flight feather isbetween 2.0 and 2.5 barbs per millimeter; this is similar tothe measurement of 1.47 barbs per millimeter on contourfeathers found in [9]. For comparison, we manually countedthe barbs in several feather images and found most to beestimated accurately by the technique described here; however,in some images where lighting conditions and resolution arenot sufficient for visual distinction, estimated counts werebelow the manually counted number. This is likely primarilydue to a low visual sampling frequency as well as combinedeffects from the barb angle decreasing toward the distal endof the feather, particularly relative to lighting angle. If lighting
Fig. 3: An input image with barb sampling drawn based on density(red and blue sections) within a vane (left) and a plot of correspondingFFT values used for counting the barbs and ultimately their densitywithin the vane (right).
Fig. 4: Tracing barbs on different feathers by cross-correlating pixelwindows.
and image resolution may be controlled, as well as using theshape of the shaft to guide the image sampling, accurate resultsshould be attainable. In lower-resolution images, manuallyassisted selection of feather image segments where barbs arevisually distinct could also be used to improve accuracy.
Another aspect of feather analysis introduced is a first steptowards extracting parametric curves to guide the path of barbswithin a vane is shown in Figure 4 as tracing barbs via cross-correlation of pixels. We believe this to be the first publishedwork to extract and parameterize these curves.
Figure 7 is a render of procedurally generated feathergeometry following the approach of [20]. It is achieved bycreating many curve instances to represent the substructures ofa feather with calculations on orientation and position basedon input such as guiding curves, barb and barbule densitiesand angles, and metadata from the Feather Atlas. The visualanalysis presented in this study will continue to improvephysically based geometric modeling of feathers based onreal-world data rather than user estimation. Such techniquesmay also be applied to finding patterns in feather structurein order to be applicable in multiple fields of study such aspaleontology. One such area of interest is investigating theappearance of fossilized feathers.
Applying the FFT technique to higher resolution and addi-tional SEM images may be used for identifying barb subcom-ponents and estimating the barbule density along the length ofa barb. The spacing currently approximated with FFT betweenbarbs along the shaft based on normal-scale photography
Fig. 5: Parametric curves for shaft and vane outlines derived usingcurve regression and drawn over the input image.
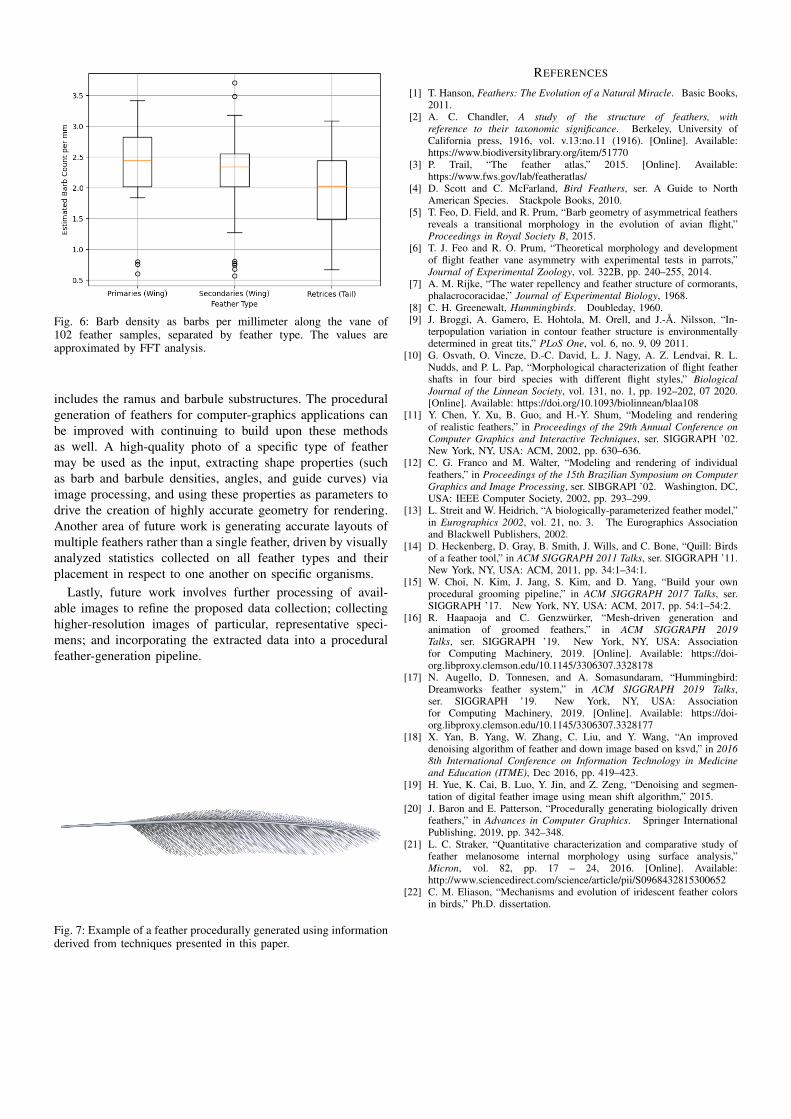
Fig. 6: Barb density as barbs per millimeter along the vane of102 feather samples, separated by feather type. The values areapproximated by FFT analysis.
includes the ramus and barbule substructures. The proceduralgeneration of feathers for computer-graphics applications canbe improved with continuing to build upon these methodsas well. A high-quality photo of a specific type of feathermay be used as the input, extracting shape properties (suchas barb and barbule densities, angles, and guide curves) viaimage processing, and using these properties as parameters todrive the creation of highly accurate geometry for rendering.Another area of future work is generating accurate layouts ofmultiple feathers rather than a single feather, driven by visuallyanalyzed statistics collected on all feather types and theirplacement in respect to one another on specific organisms.
Lastly, future work involves further processing of avail-able images to refine the proposed data collection; collectinghigher-resolution images of particular, representative speci-mens; and incorporating the extracted data into a proceduralfeather-generation pipeline.
Fig. 7: Example of a feather procedurally generated using informationderived from techniques presented in this paper.
REFERENCES
[1] T. Hanson, Feathers: The Evolution of a Natural Miracle. Basic Books,2011.
[2] A. C. Chandler, A study of the structure of feathers, withreference to their taxonomic significance. Berkeley, University ofCalifornia press, 1916, vol. v.13:no.11 (1916). [Online]. Available:https://www.biodiversitylibrary.org/item/51770
[3] P. Trail, “The feather atlas,” 2015. [Online]. Available:https://www.fws.gov/lab/featheratlas/
[4] D. Scott and C. McFarland, Bird Feathers, ser. A Guide to NorthAmerican Species. Stackpole Books, 2010.
[5] T. Feo, D. Field, and R. Prum, “Barb geometry of asymmetrical feathersreveals a transitional morphology in the evolution of avian flight,”Proceedings in Royal Society B, 2015.
[6] T. J. Feo and R. O. Prum, “Theoretical morphology and developmentof flight feather vane asymmetry with experimental tests in parrots,”Journal of Experimental Zoology, vol. 322B, pp. 240–255, 2014.
[7] A. M. Rijke, “The water repellency and feather structure of cormorants,phalacrocoracidae,” Journal of Experimental Biology, 1968.
[8] C. H. Greenewalt, Hummingbirds. Doubleday, 1960.[9] J. Broggi, A. Gamero, E. Hohtola, M. Orell, and J.-A. Nilsson, “In-
terpopulation variation in contour feather structure is environmentallydetermined in great tits,” PLoS One, vol. 6, no. 9, 09 2011.
[10] G. Osvath, O. Vincze, D.-C. David, L. J. Nagy, A. Z. Lendvai, R. L.Nudds, and P. L. Pap, “Morphological characterization of flight feathershafts in four bird species with different flight styles,” BiologicalJournal of the Linnean Society, vol. 131, no. 1, pp. 192–202, 07 2020.[Online]. Available: https://doi.org/10.1093/biolinnean/blaa108
[11] Y. Chen, Y. Xu, B. Guo, and H.-Y. Shum, “Modeling and renderingof realistic feathers,” in Proceedings of the 29th Annual Conference onComputer Graphics and Interactive Techniques, ser. SIGGRAPH ’02.New York, NY, USA: ACM, 2002, pp. 630–636.
[12] C. G. Franco and M. Walter, “Modeling and rendering of individualfeathers,” in Proceedings of the 15th Brazilian Symposium on ComputerGraphics and Image Processing, ser. SIBGRAPI ’02. Washington, DC,USA: IEEE Computer Society, 2002, pp. 293–299.
[13] L. Streit and W. Heidrich, “A biologically-parameterized feather model,”in Eurographics 2002, vol. 21, no. 3. The Eurographics Associationand Blackwell Publishers, 2002.
[14] D. Heckenberg, D. Gray, B. Smith, J. Wills, and C. Bone, “Quill: Birdsof a feather tool,” in ACM SIGGRAPH 2011 Talks, ser. SIGGRAPH ’11.New York, NY, USA: ACM, 2011, pp. 34:1–34:1.
[15] W. Choi, N. Kim, J. Jang, S. Kim, and D. Yang, “Build your ownprocedural grooming pipeline,” in ACM SIGGRAPH 2017 Talks, ser.SIGGRAPH ’17. New York, NY, USA: ACM, 2017, pp. 54:1–54:2.
[16] R. Haapaoja and C. Genzwurker, “Mesh-driven generation andanimation of groomed feathers,” in ACM SIGGRAPH 2019Talks, ser. SIGGRAPH ’19. New York, NY, USA: Associationfor Computing Machinery, 2019. [Online]. Available: https://doi-org.libproxy.clemson.edu/10.1145/3306307.3328178
[17] N. Augello, D. Tonnesen, and A. Somasundaram, “Hummingbird:Dreamworks feather system,” in ACM SIGGRAPH 2019 Talks,ser. SIGGRAPH ’19. New York, NY, USA: Associationfor Computing Machinery, 2019. [Online]. Available: https://doi-org.libproxy.clemson.edu/10.1145/3306307.3328177
[18] X. Yan, B. Yang, W. Zhang, C. Liu, and Y. Wang, “An improveddenoising algorithm of feather and down image based on ksvd,” in 20168th International Conference on Information Technology in Medicineand Education (ITME), Dec 2016, pp. 419–423.
[19] H. Yue, K. Cai, B. Luo, Y. Jin, and Z. Zeng, “Denoising and segmen-tation of digital feather image using mean shift algorithm,” 2015.
[20] J. Baron and E. Patterson, “Procedurally generating biologically drivenfeathers,” in Advances in Computer Graphics. Springer InternationalPublishing, 2019, pp. 342–348.
[21] L. C. Straker, “Quantitative characterization and comparative study offeather melanosome internal morphology using surface analysis,”Micron, vol. 82, pp. 17 – 24, 2016. [Online]. Available:http://www.sciencedirect.com/science/article/pii/S0968432815300652
[22] C. M. Eliason, “Mechanisms and evolution of iridescent feather colorsin birds,” Ph.D. dissertation.