Computed tomography of the spleen: how to interpret … REVIEW Computed tomography of the spleen:...
12
PICTORIAL REVIEW Computed tomography of the spleen: how to interpret the hypodense lesion Christoph A. Karlo & Paul Stolzmann & Richard K. Do & Hatem Alkadhi Received: 20 August 2012 / Revised: 30 October 2012 / Accepted: 31 October 2012 / Published online: 4 December 2012 # The Author(s) 2012. This article is published with open access at Springerlink.com Abstract Background As the largest single lymphatic organ in the human body, the spleen is responsible for central immuno- logical and haematological tasks. Therefore, the spleen can be subject to a wide range of pathologic disorders. Comput- ed tomography (CT) represents the most widely applied cross-sectional abdominal imaging technique and is consid- ered the imaging modality of choice for the evaluation of numerous abdominal pathological conditions. Hypodense splenic lesions are frequently encountered on abdominal CT images. Although most hypodense lesions of the spleen can be considered benign, some findings and clinical con- ditions warrant closer attention to the lesion. CT offers a number of morphological criteria that can be applied to differentiate hypodense lesions of the spleen, such as a the appearance of a lesion’ s borders, its attenuation, as well as the presence of calcifications or solid components. Methods This article reviews the most common splenic pathologies leading to hypodense appearances on CT images and illustrates the key CT imaging findings in the context of the clinical history of the patients. Conclusion The key imaging findings of hypodense splenic lesions are presented in order to aid interpretation during routine evaluation of abdominal CT images. Teaching Points • Haemangiomas, congenital in origin, represent the most common benign lesions of the spleen. • Lymphoma represents the most common malignant tumour of the, usually secondarily involved, spleen. • Most hypodense splenic lesions on CT represent benign lesions that require no further work-up. • For correct interpretation, hypodense splenic lesions need to be evaluated in the clinical context. Keywords Computed tomography . Spleen . Hypodense lesion . Abdominal pathology Introduction Focal hypodense lesions of the spleen are frequently en- countered on computed tomography (CT) images of the abdomen. Although the majority of hypodense splenic lesions do not require dedicated management or follow-up, some findings warrant closer attention [1]. Interpretation of a hypodense lesion in the spleen can be challenging, and often can only be performed correctly when certain imaging patterns are considered and the clinical history is taken into account. The purpose of this article is to review and discuss the characteristic CT imaging findings of hypodense lesions of the spleen and to illustrate selected cases in the context of the patient’ s history. The normal spleen Size and shape of the spleen exhibit a wide variability. While the shape is influenced by adjacent organs, determi- nation of the normal size of the spleen can be tricky. It has been suggested, that—on transverse CT images—a maxi- mum diameter of up to 10 cm and a perpendicular diameter of up to 6 cm can be considered normal. In adults, the craniocaudal diameter usually does not exceed 15 cm [2, 3]. C. A. Karlo : R. K. Do Department of Radiology, Memorial Sloan-Kettering Cancer Center, New York NY, USA P. Stolzmann : H. Alkadhi (*) Institute of Diagnostic and Interventional Radiology, University Hospital Zurich, Raemistrasse 100, 8091 Zurich, Switzerland e-mail: [email protected] Insights Imaging (2013) 4:65–76 DOI 10.1007/s13244-012-0202-z
-
Upload
truongthien -
Category
Documents
-
view
221 -
download
0
Transcript of Computed tomography of the spleen: how to interpret … REVIEW Computed tomography of the spleen:...
PICTORIAL REVIEW
Computed tomography of the spleen: how to interpretthe hypodense lesion
Christoph A. Karlo & Paul Stolzmann &
Richard K. Do & Hatem Alkadhi
Received: 20 August 2012 /Revised: 30 October 2012 /Accepted: 31 October 2012 /Published online: 4 December 2012# The Author(s) 2012. This article is published with open access at Springerlink.com
AbstractBackground As the largest single lymphatic organ in thehuman body, the spleen is responsible for central immuno-logical and haematological tasks. Therefore, the spleen canbe subject to a wide range of pathologic disorders. Comput-ed tomography (CT) represents the most widely appliedcross-sectional abdominal imaging technique and is consid-ered the imaging modality of choice for the evaluation ofnumerous abdominal pathological conditions. Hypodensesplenic lesions are frequently encountered on abdominalCT images. Although most hypodense lesions of the spleencan be considered benign, some findings and clinical con-ditions warrant closer attention to the lesion. CT offers anumber of morphological criteria that can be applied todifferentiate hypodense lesions of the spleen, such as a theappearance of a lesion’s borders, its attenuation, as well asthe presence of calcifications or solid components.Methods This article reviews the most common splenicpathologies leading to hypodense appearances on CTimages and illustrates the key CT imaging findings in thecontext of the clinical history of the patients.Conclusion The key imaging findings of hypodense spleniclesions are presented in order to aid interpretation duringroutine evaluation of abdominal CT images.Teaching Points• Haemangiomas, congenital in origin, represent the mostcommon benign lesions of the spleen.
• Lymphoma represents the most common malignant tumourof the, usually secondarily involved, spleen.
• Most hypodense splenic lesions on CT represent benignlesions that require no further work-up.
• For correct interpretation, hypodense splenic lesions needto be evaluated in the clinical context.
Keywords Computed tomography . Spleen . Hypodenselesion . Abdominal pathology
Introduction
Focal hypodense lesions of the spleen are frequently en-countered on computed tomography (CT) images of theabdomen. Although the majority of hypodense spleniclesions do not require dedicated management or follow-up,some findings warrant closer attention [1]. Interpretation ofa hypodense lesion in the spleen can be challenging, andoften can only be performed correctly when certain imagingpatterns are considered and the clinical history is taken intoaccount. The purpose of this article is to review and discussthe characteristic CT imaging findings of hypodense lesionsof the spleen and to illustrate selected cases in the context ofthe patient’s history.
The normal spleen
Size and shape of the spleen exhibit a wide variability.While the shape is influenced by adjacent organs, determi-nation of the normal size of the spleen can be tricky. It hasbeen suggested, that—on transverse CT images—a maxi-mum diameter of up to 10 cm and a perpendicular diameterof up to 6 cm can be considered normal. In adults, thecraniocaudal diameter usually does not exceed 15 cm [2, 3].
C. A. Karlo :R. K. DoDepartment of Radiology, Memorial Sloan-Kettering CancerCenter, New York NY, USA
P. Stolzmann :H. Alkadhi (*)Institute of Diagnostic and Interventional Radiology,University Hospital Zurich, Raemistrasse 100,8091 Zurich, Switzerlande-mail: [email protected]
Insights Imaging (2013) 4:65–76DOI 10.1007/s13244-012-0202-z
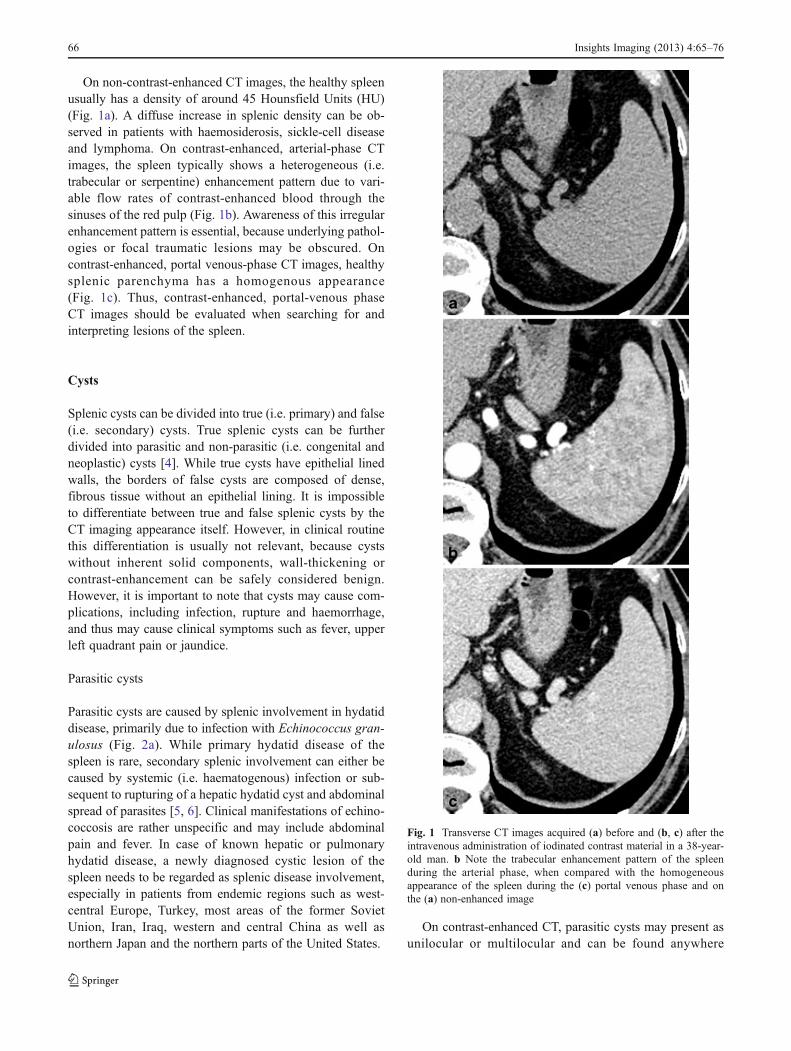
On non-contrast-enhanced CT images, the healthy spleenusually has a density of around 45 Hounsfield Units (HU)(Fig. 1a). A diffuse increase in splenic density can be ob-served in patients with haemosiderosis, sickle-cell diseaseand lymphoma. On contrast-enhanced, arterial-phase CTimages, the spleen typically shows a heterogeneous (i.e.trabecular or serpentine) enhancement pattern due to vari-able flow rates of contrast-enhanced blood through thesinuses of the red pulp (Fig. 1b). Awareness of this irregularenhancement pattern is essential, because underlying pathol-ogies or focal traumatic lesions may be obscured. Oncontrast-enhanced, portal venous-phase CT images, healthysplenic parenchyma has a homogenous appearance(Fig. 1c). Thus, contrast-enhanced, portal-venous phaseCT images should be evaluated when searching for andinterpreting lesions of the spleen.
Cysts
Splenic cysts can be divided into true (i.e. primary) and false(i.e. secondary) cysts. True splenic cysts can be furtherdivided into parasitic and non-parasitic (i.e. congenital andneoplastic) cysts [4]. While true cysts have epithelial linedwalls, the borders of false cysts are composed of dense,fibrous tissue without an epithelial lining. It is impossibleto differentiate between true and false splenic cysts by theCT imaging appearance itself. However, in clinical routinethis differentiation is usually not relevant, because cystswithout inherent solid components, wall-thickening orcontrast-enhancement can be safely considered benign.However, it is important to note that cysts may cause com-plications, including infection, rupture and haemorrhage,and thus may cause clinical symptoms such as fever, upperleft quadrant pain or jaundice.
Parasitic cysts
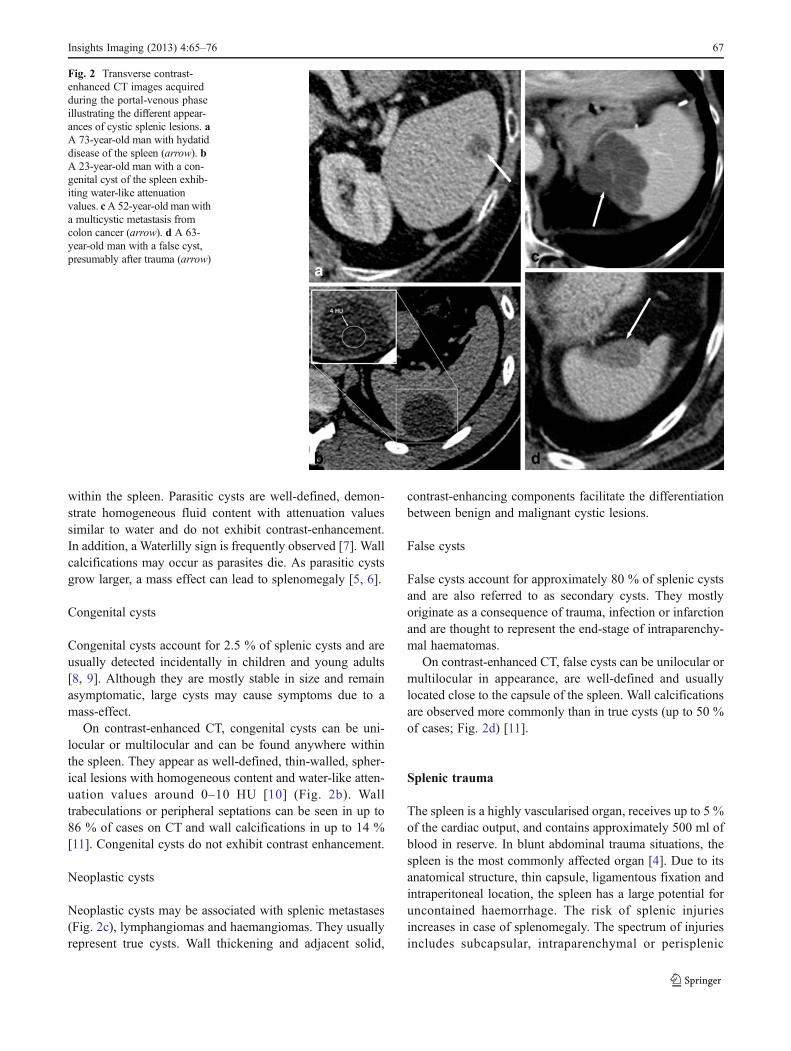
Parasitic cysts are caused by splenic involvement in hydatiddisease, primarily due to infection with Echinococcus gran-ulosus (Fig. 2a). While primary hydatid disease of thespleen is rare, secondary splenic involvement can either becaused by systemic (i.e. haematogenous) infection or sub-sequent to rupturing of a hepatic hydatid cyst and abdominalspread of parasites [5, 6]. Clinical manifestations of echino-coccosis are rather unspecific and may include abdominalpain and fever. In case of known hepatic or pulmonaryhydatid disease, a newly diagnosed cystic lesion of thespleen needs to be regarded as splenic disease involvement,especially in patients from endemic regions such as west-central Europe, Turkey, most areas of the former SovietUnion, Iran, Iraq, western and central China as well asnorthern Japan and the northern parts of the United States.
On contrast-enhanced CT, parasitic cysts may present asunilocular or multilocular and can be found anywhere
Fig. 1 Transverse CT images acquired (a) before and (b, c) after theintravenous administration of iodinated contrast material in a 38-year-old man. b Note the trabecular enhancement pattern of the spleenduring the arterial phase, when compared with the homogeneousappearance of the spleen during the (c) portal venous phase and onthe (a) non-enhanced image
66 Insights Imaging (2013) 4:65–76
within the spleen. Parasitic cysts are well-defined, demon-strate homogeneous fluid content with attenuation valuessimilar to water and do not exhibit contrast-enhancement.In addition, a Waterlilly sign is frequently observed [7]. Wallcalcifications may occur as parasites die. As parasitic cystsgrow larger, a mass effect can lead to splenomegaly [5, 6].
Congenital cysts
Congenital cysts account for 2.5 % of splenic cysts and areusually detected incidentally in children and young adults[8, 9]. Although they are mostly stable in size and remainasymptomatic, large cysts may cause symptoms due to amass-effect.
On contrast-enhanced CT, congenital cysts can be uni-locular or multilocular and can be found anywhere withinthe spleen. They appear as well-defined, thin-walled, spher-ical lesions with homogeneous content and water-like atten-uation values around 0–10 HU [10] (Fig. 2b). Walltrabeculations or peripheral septations can be seen in up to86 % of cases on CT and wall calcifications in up to 14 %[11]. Congenital cysts do not exhibit contrast enhancement.
Neoplastic cysts
Neoplastic cysts may be associated with splenic metastases(Fig. 2c), lymphangiomas and haemangiomas. They usuallyrepresent true cysts. Wall thickening and adjacent solid,
contrast-enhancing components facilitate the differentiationbetween benign and malignant cystic lesions.
False cysts
False cysts account for approximately 80 % of splenic cystsand are also referred to as secondary cysts. They mostlyoriginate as a consequence of trauma, infection or infarctionand are thought to represent the end-stage of intraparenchy-mal haematomas.
On contrast-enhanced CT, false cysts can be unilocular ormultilocular in appearance, are well-defined and usuallylocated close to the capsule of the spleen. Wall calcificationsare observed more commonly than in true cysts (up to 50 %of cases; Fig. 2d) [11].
Splenic trauma
The spleen is a highly vascularised organ, receives up to 5 %of the cardiac output, and contains approximately 500 ml ofblood in reserve. In blunt abdominal trauma situations, thespleen is the most commonly affected organ [4]. Due to itsanatomical structure, thin capsule, ligamentous fixation andintraperitoneal location, the spleen has a large potential foruncontained haemorrhage. The risk of splenic injuriesincreases in case of splenomegaly. The spectrum of injuriesincludes subcapsular, intraparenchymal or perisplenic
Fig. 2 Transverse contrast-enhanced CT images acquiredduring the portal-venous phaseillustrating the different appear-ances of cystic splenic lesions. aA 73-year-old man with hydatiddisease of the spleen (arrow). bA 23-year-old man with a con-genital cyst of the spleen exhib-iting water-like attenuationvalues. cA 52-year-old manwitha multicystic metastasis fromcolon cancer (arrow). d A 63-year-old man with a false cyst,presumably after trauma (arrow)
Insights Imaging (2013) 4:65–76 67
haematomas as well as lacerations, ruptures and infarctionsdue to vascular injuries, as well as contained vascular inju-ries such as pseudoaneurysm and arteriovenous fistula [12].In severe trauma, the spleen can rupture and multiple,devascularised splenic fragments can be seen in the leftupper quadrant of the abdomen. Usually, splenic rupturesare associated with extensive intraperitoneal haemorrhage.Traditionally, splenic injuries are classified according to thesplenic injury grading system of the American Associationfor the Surgery of Trauma [13]. In addition, multiple CTgrading systems had been proposed by various authors [14],as contrast-enhanced CT is an excellent imaging modalityfor the assessment of traumatic lesions of the spleen [15].However, care needs to be taken not to misinterpret congen-ital anomalies of the spleen such as lobulations or splenicclefts for splenic injuries.
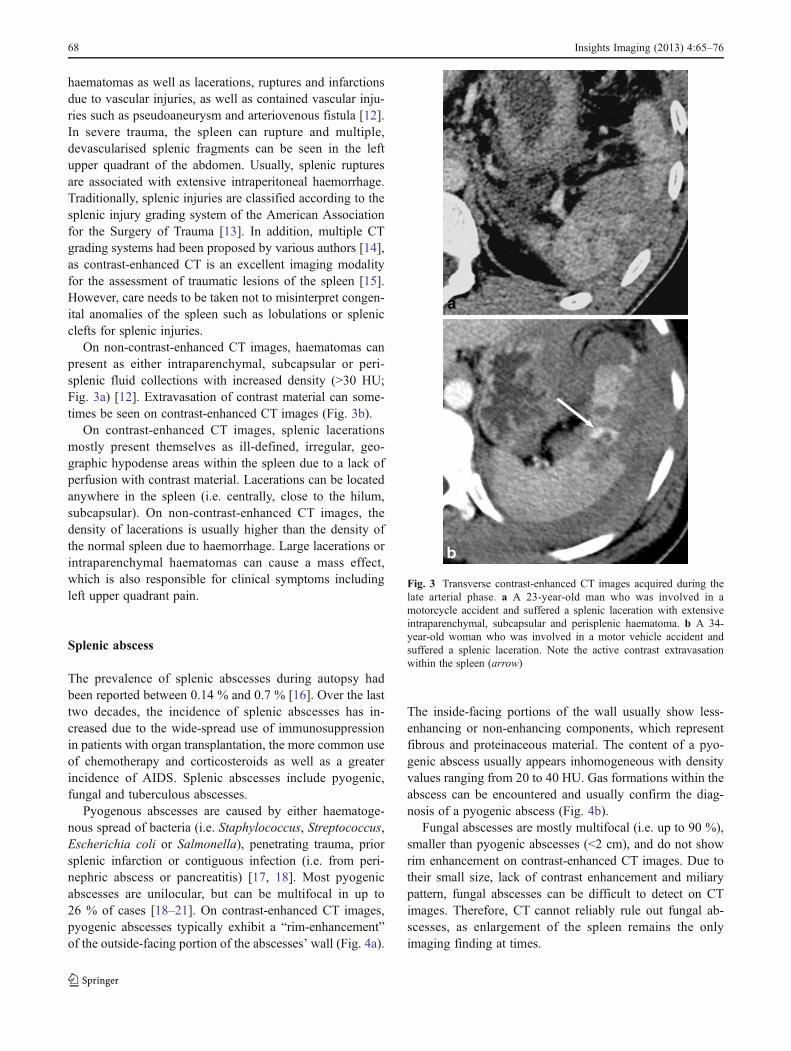
On non-contrast-enhanced CT images, haematomas canpresent as either intraparenchymal, subcapsular or peri-splenic fluid collections with increased density (>30 HU;Fig. 3a) [12]. Extravasation of contrast material can some-times be seen on contrast-enhanced CT images (Fig. 3b).
On contrast-enhanced CT images, splenic lacerationsmostly present themselves as ill-defined, irregular, geo-graphic hypodense areas within the spleen due to a lack ofperfusion with contrast material. Lacerations can be locatedanywhere in the spleen (i.e. centrally, close to the hilum,subcapsular). On non-contrast-enhanced CT images, thedensity of lacerations is usually higher than the density ofthe normal spleen due to haemorrhage. Large lacerations orintraparenchymal haematomas can cause a mass effect,which is also responsible for clinical symptoms includingleft upper quadrant pain.
Splenic abscess
The prevalence of splenic abscesses during autopsy hadbeen reported between 0.14 % and 0.7 % [16]. Over the lasttwo decades, the incidence of splenic abscesses has in-creased due to the wide-spread use of immunosuppressionin patients with organ transplantation, the more common useof chemotherapy and corticosteroids as well as a greaterincidence of AIDS. Splenic abscesses include pyogenic,fungal and tuberculous abscesses.
Pyogenous abscesses are caused by either haematoge-nous spread of bacteria (i.e. Staphylococcus, Streptococcus,Escherichia coli or Salmonella), penetrating trauma, priorsplenic infarction or contiguous infection (i.e. from peri-nephric abscess or pancreatitis) [17, 18]. Most pyogenicabscesses are unilocular, but can be multifocal in up to26 % of cases [18–21]. On contrast-enhanced CT images,pyogenic abscesses typically exhibit a “rim-enhancement”of the outside-facing portion of the abscesses’ wall (Fig. 4a).
The inside-facing portions of the wall usually show less-enhancing or non-enhancing components, which representfibrous and proteinaceous material. The content of a pyo-genic abscess usually appears inhomogeneous with densityvalues ranging from 20 to 40 HU. Gas formations within theabscess can be encountered and usually confirm the diag-nosis of a pyogenic abscess (Fig. 4b).
Fungal abscesses are mostly multifocal (i.e. up to 90 %),smaller than pyogenic abscesses (<2 cm), and do not showrim enhancement on contrast-enhanced CT images. Due totheir small size, lack of contrast enhancement and miliarypattern, fungal abscesses can be difficult to detect on CTimages. Therefore, CT cannot reliably rule out fungal ab-scesses, as enlargement of the spleen remains the onlyimaging finding at times.
Fig. 3 Transverse contrast-enhanced CT images acquired during thelate arterial phase. a A 23-year-old man who was involved in amotorcycle accident and suffered a splenic laceration with extensiveintraparenchymal, subcapsular and perisplenic haematoma. b A 34-year-old woman who was involved in a motor vehicle accident andsuffered a splenic laceration. Note the active contrast extravasationwithin the spleen (arrow)
68 Insights Imaging (2013) 4:65–76
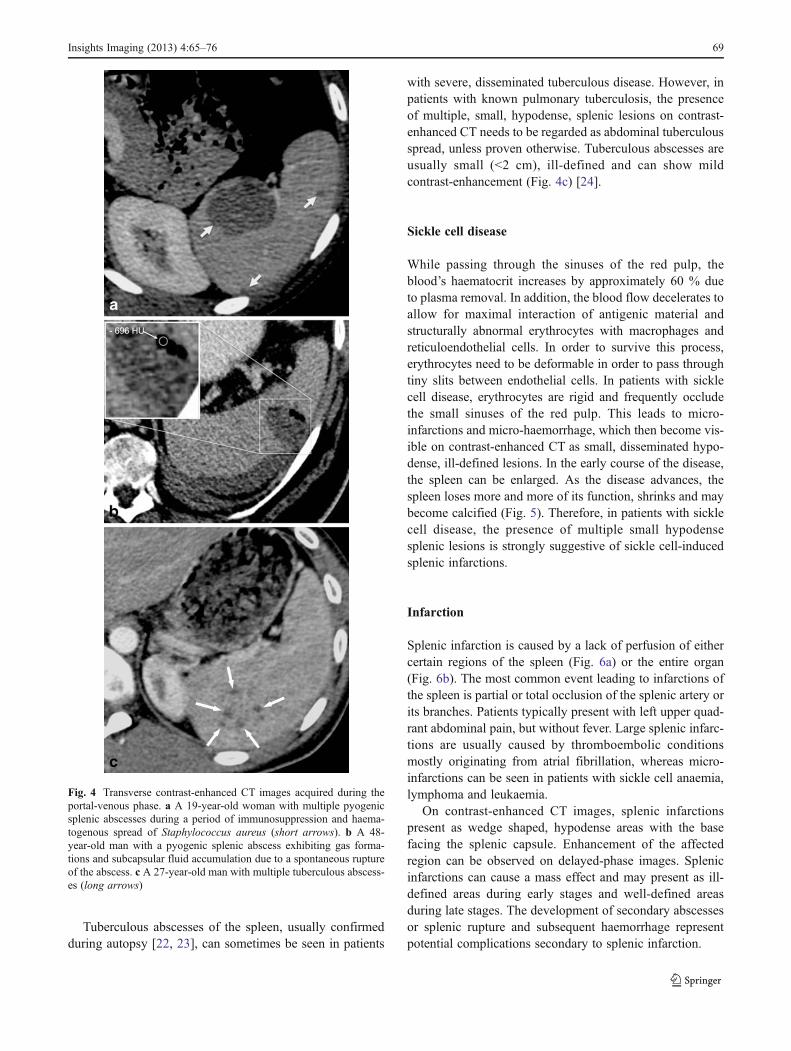
Tuberculous abscesses of the spleen, usually confirmedduring autopsy [22, 23], can sometimes be seen in patients
with severe, disseminated tuberculous disease. However, inpatients with known pulmonary tuberculosis, the presenceof multiple, small, hypodense, splenic lesions on contrast-enhanced CT needs to be regarded as abdominal tuberculousspread, unless proven otherwise. Tuberculous abscesses areusually small (<2 cm), ill-defined and can show mildcontrast-enhancement (Fig. 4c) [24].
Sickle cell disease
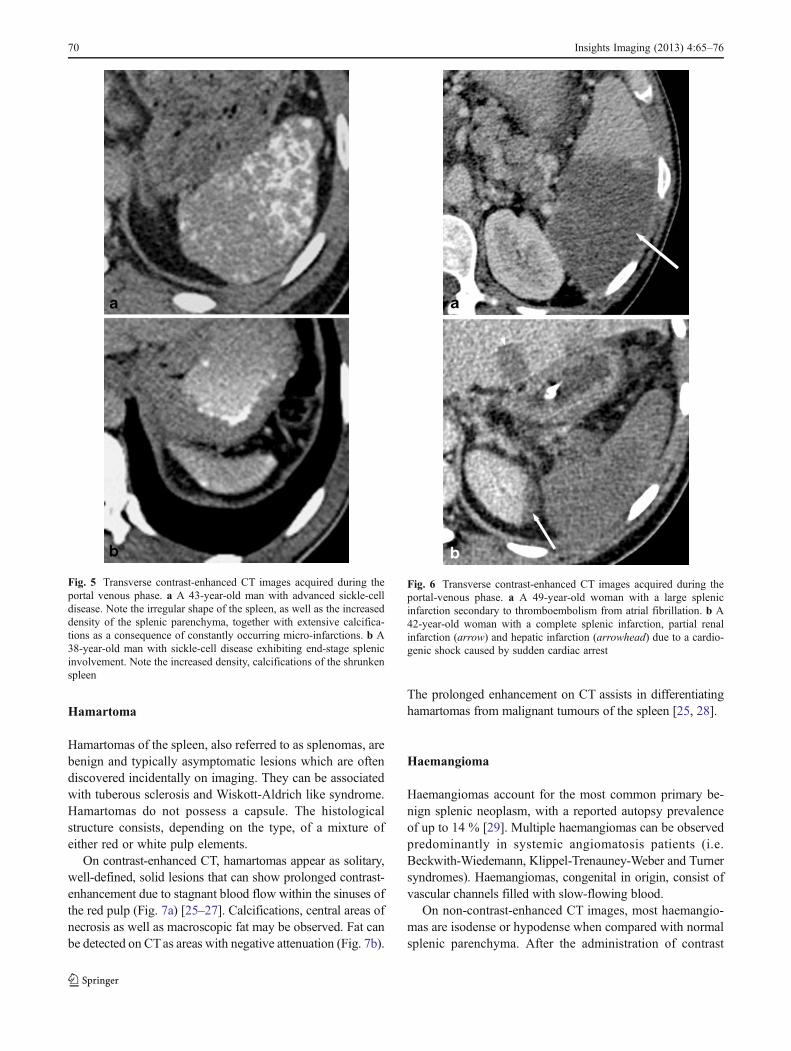
While passing through the sinuses of the red pulp, theblood’s haematocrit increases by approximately 60 % dueto plasma removal. In addition, the blood flow decelerates toallow for maximal interaction of antigenic material andstructurally abnormal erythrocytes with macrophages andreticuloendothelial cells. In order to survive this process,erythrocytes need to be deformable in order to pass throughtiny slits between endothelial cells. In patients with sicklecell disease, erythrocytes are rigid and frequently occludethe small sinuses of the red pulp. This leads to micro-infarctions and micro-haemorrhage, which then become vis-ible on contrast-enhanced CT as small, disseminated hypo-dense, ill-defined lesions. In the early course of the disease,the spleen can be enlarged. As the disease advances, thespleen loses more and more of its function, shrinks and maybecome calcified (Fig. 5). Therefore, in patients with sicklecell disease, the presence of multiple small hypodensesplenic lesions is strongly suggestive of sickle cell-inducedsplenic infarctions.
Infarction
Splenic infarction is caused by a lack of perfusion of eithercertain regions of the spleen (Fig. 6a) or the entire organ(Fig. 6b). The most common event leading to infarctions ofthe spleen is partial or total occlusion of the splenic artery orits branches. Patients typically present with left upper quad-rant abdominal pain, but without fever. Large splenic infarc-tions are usually caused by thromboembolic conditionsmostly originating from atrial fibrillation, whereas micro-infarctions can be seen in patients with sickle cell anaemia,lymphoma and leukaemia.
On contrast-enhanced CT images, splenic infarctionspresent as wedge shaped, hypodense areas with the basefacing the splenic capsule. Enhancement of the affectedregion can be observed on delayed-phase images. Splenicinfarctions can cause a mass effect and may present as ill-defined areas during early stages and well-defined areasduring late stages. The development of secondary abscessesor splenic rupture and subsequent haemorrhage representpotential complications secondary to splenic infarction.
Fig. 4 Transverse contrast-enhanced CT images acquired during theportal-venous phase. a A 19-year-old woman with multiple pyogenicsplenic abscesses during a period of immunosuppression and haema-togenous spread of Staphylococcus aureus (short arrows). b A 48-year-old man with a pyogenic splenic abscess exhibiting gas forma-tions and subcapsular fluid accumulation due to a spontaneous ruptureof the abscess. c A 27-year-old man with multiple tuberculous abscess-es (long arrows)
Insights Imaging (2013) 4:65–76 69
Hamartoma
Hamartomas of the spleen, also referred to as splenomas, arebenign and typically asymptomatic lesions which are oftendiscovered incidentally on imaging. They can be associatedwith tuberous sclerosis and Wiskott-Aldrich like syndrome.Hamartomas do not possess a capsule. The histologicalstructure consists, depending on the type, of a mixture ofeither red or white pulp elements.
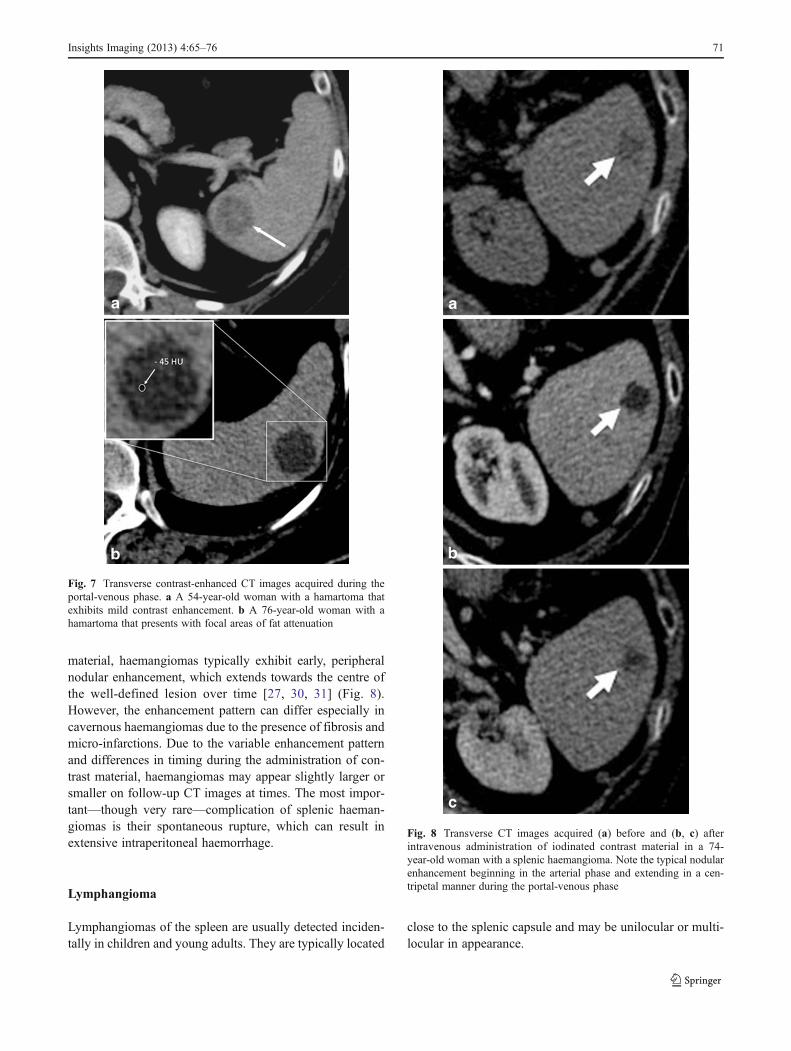
On contrast-enhanced CT, hamartomas appear as solitary,well-defined, solid lesions that can show prolonged contrast-enhancement due to stagnant blood flow within the sinuses ofthe red pulp (Fig. 7a) [25–27]. Calcifications, central areas ofnecrosis as well as macroscopic fat may be observed. Fat canbe detected on CTas areas with negative attenuation (Fig. 7b).
The prolonged enhancement on CT assists in differentiatinghamartomas from malignant tumours of the spleen [25, 28].
Haemangioma
Haemangiomas account for the most common primary be-nign splenic neoplasm, with a reported autopsy prevalenceof up to 14 % [29]. Multiple haemangiomas can be observedpredominantly in systemic angiomatosis patients (i.e.Beckwith-Wiedemann, Klippel-Trenauney-Weber and Turnersyndromes). Haemangiomas, congenital in origin, consist ofvascular channels filled with slow-flowing blood.
On non-contrast-enhanced CT images, most haemangio-mas are isodense or hypodense when compared with normalsplenic parenchyma. After the administration of contrast
Fig. 5 Transverse contrast-enhanced CT images acquired during theportal venous phase. a A 43-year-old man with advanced sickle-celldisease. Note the irregular shape of the spleen, as well as the increaseddensity of the splenic parenchyma, together with extensive calcifica-tions as a consequence of constantly occurring micro-infarctions. b A38-year-old man with sickle-cell disease exhibiting end-stage splenicinvolvement. Note the increased density, calcifications of the shrunkenspleen
Fig. 6 Transverse contrast-enhanced CT images acquired during theportal-venous phase. a A 49-year-old woman with a large splenicinfarction secondary to thromboembolism from atrial fibrillation. b A42-year-old woman with a complete splenic infarction, partial renalinfarction (arrow) and hepatic infarction (arrowhead) due to a cardio-genic shock caused by sudden cardiac arrest
70 Insights Imaging (2013) 4:65–76
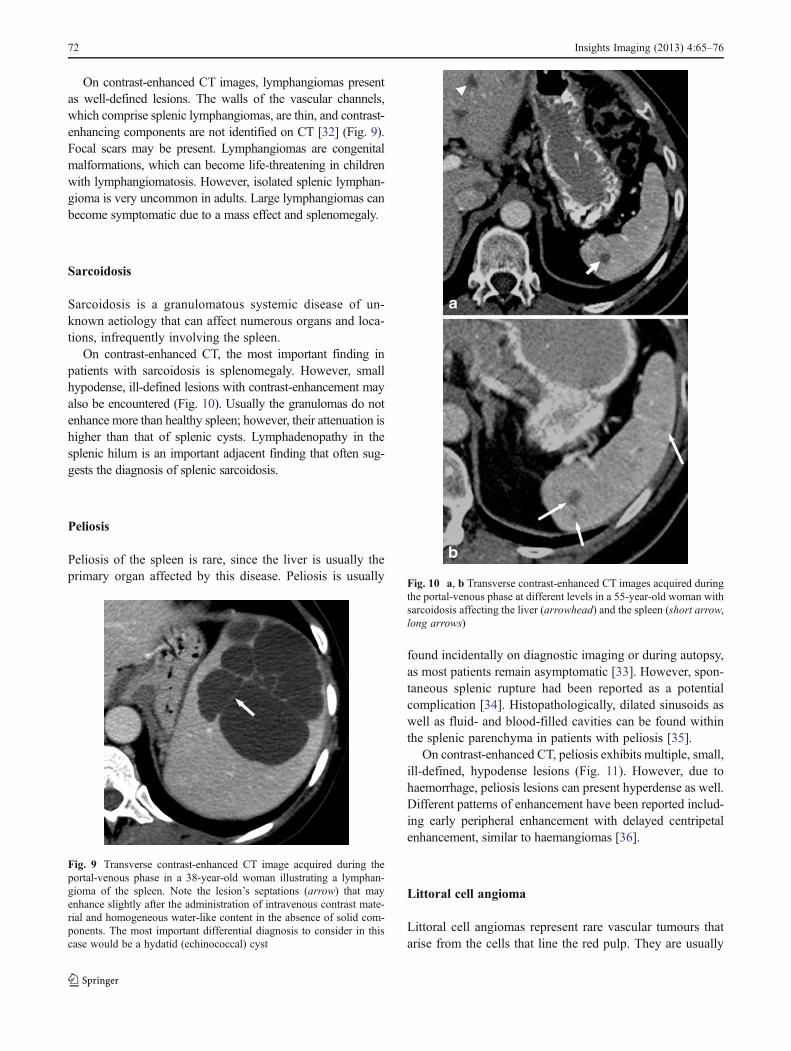
material, haemangiomas typically exhibit early, peripheralnodular enhancement, which extends towards the centre ofthe well-defined lesion over time [27, 30, 31] (Fig. 8).However, the enhancement pattern can differ especially incavernous haemangiomas due to the presence of fibrosis andmicro-infarctions. Due to the variable enhancement patternand differences in timing during the administration of con-trast material, haemangiomas may appear slightly larger orsmaller on follow-up CT images at times. The most impor-tant—though very rare—complication of splenic haeman-giomas is their spontaneous rupture, which can result inextensive intraperitoneal haemorrhage.
Lymphangioma
Lymphangiomas of the spleen are usually detected inciden-tally in children and young adults. They are typically located
close to the splenic capsule and may be unilocular or multi-locular in appearance.
Fig. 7 Transverse contrast-enhanced CT images acquired during theportal-venous phase. a A 54-year-old woman with a hamartoma thatexhibits mild contrast enhancement. b A 76-year-old woman with ahamartoma that presents with focal areas of fat attenuation
Fig. 8 Transverse CT images acquired (a) before and (b, c) afterintravenous administration of iodinated contrast material in a 74-year-old woman with a splenic haemangioma. Note the typical nodularenhancement beginning in the arterial phase and extending in a cen-tripetal manner during the portal-venous phase
Insights Imaging (2013) 4:65–76 71
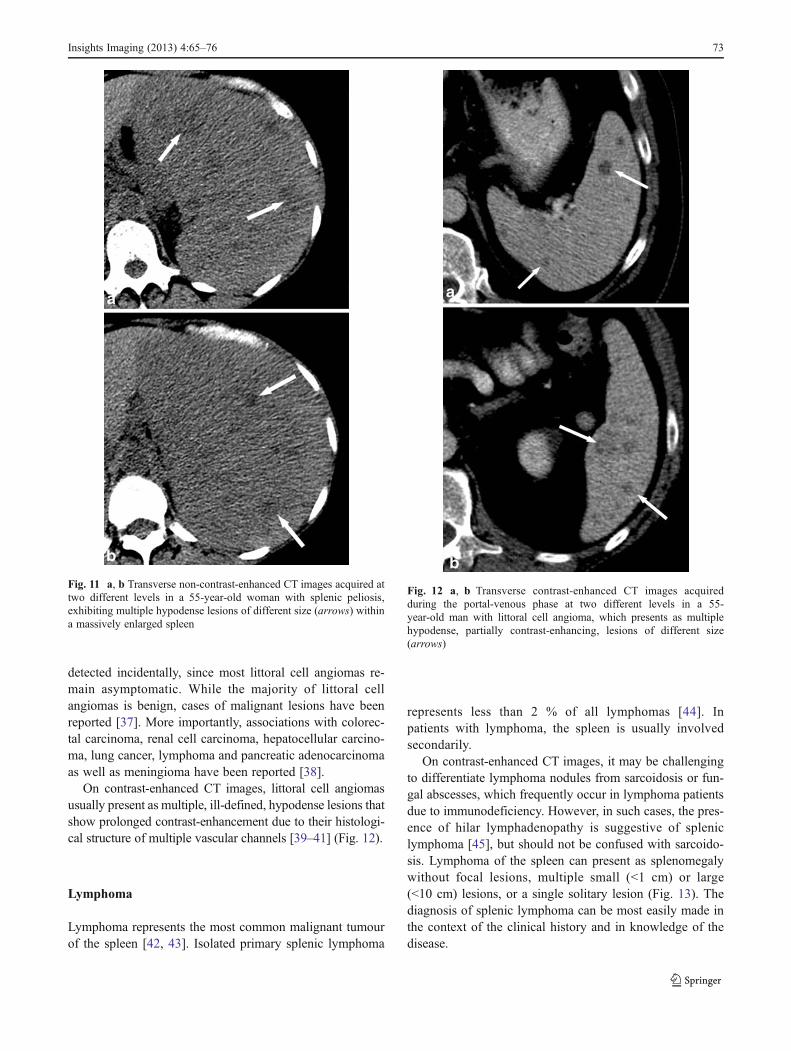
On contrast-enhanced CT images, lymphangiomas presentas well-defined lesions. The walls of the vascular channels,which comprise splenic lymphangiomas, are thin, and contrast-enhancing components are not identified on CT [32] (Fig. 9).Focal scars may be present. Lymphangiomas are congenitalmalformations, which can become life-threatening in childrenwith lymphangiomatosis. However, isolated splenic lymphan-gioma is very uncommon in adults. Large lymphangiomas canbecome symptomatic due to a mass effect and splenomegaly.
Sarcoidosis
Sarcoidosis is a granulomatous systemic disease of un-known aetiology that can affect numerous organs and loca-tions, infrequently involving the spleen.
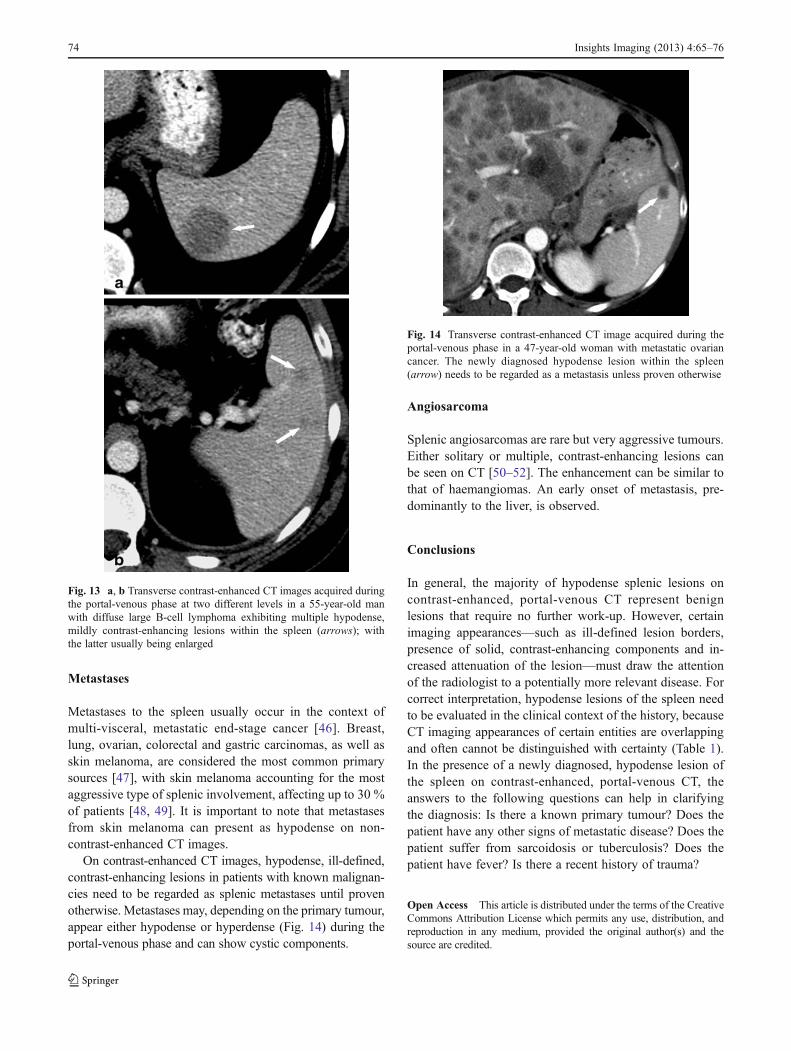
On contrast-enhanced CT, the most important finding inpatients with sarcoidosis is splenomegaly. However, smallhypodense, ill-defined lesions with contrast-enhancement mayalso be encountered (Fig. 10). Usually the granulomas do notenhance more than healthy spleen; however, their attenuation ishigher than that of splenic cysts. Lymphadenopathy in thesplenic hilum is an important adjacent finding that often sug-gests the diagnosis of splenic sarcoidosis.
Peliosis
Peliosis of the spleen is rare, since the liver is usually theprimary organ affected by this disease. Peliosis is usually
found incidentally on diagnostic imaging or during autopsy,as most patients remain asymptomatic [33]. However, spon-taneous splenic rupture had been reported as a potentialcomplication [34]. Histopathologically, dilated sinusoids aswell as fluid- and blood-filled cavities can be found withinthe splenic parenchyma in patients with peliosis [35].
On contrast-enhanced CT, peliosis exhibits multiple, small,ill-defined, hypodense lesions (Fig. 11). However, due tohaemorrhage, peliosis lesions can present hyperdense as well.Different patterns of enhancement have been reported includ-ing early peripheral enhancement with delayed centripetalenhancement, similar to haemangiomas [36].
Littoral cell angioma
Littoral cell angiomas represent rare vascular tumours thatarise from the cells that line the red pulp. They are usually
Fig. 9 Transverse contrast-enhanced CT image acquired during theportal-venous phase in a 38-year-old woman illustrating a lymphan-gioma of the spleen. Note the lesion’s septations (arrow) that mayenhance slightly after the administration of intravenous contrast mate-rial and homogeneous water-like content in the absence of solid com-ponents. The most important differential diagnosis to consider in thiscase would be a hydatid (echinococcal) cyst
Fig. 10 a, b Transverse contrast-enhanced CT images acquired duringthe portal-venous phase at different levels in a 55-year-old woman withsarcoidosis affecting the liver (arrowhead) and the spleen (short arrow,long arrows)
72 Insights Imaging (2013) 4:65–76
detected incidentally, since most littoral cell angiomas re-main asymptomatic. While the majority of littoral cellangiomas is benign, cases of malignant lesions have beenreported [37]. More importantly, associations with colorec-tal carcinoma, renal cell carcinoma, hepatocellular carcino-ma, lung cancer, lymphoma and pancreatic adenocarcinomaas well as meningioma have been reported [38].
On contrast-enhanced CT images, littoral cell angiomasusually present as multiple, ill-defined, hypodense lesions thatshow prolonged contrast-enhancement due to their histologi-cal structure of multiple vascular channels [39–41] (Fig. 12).
Lymphoma
Lymphoma represents the most common malignant tumourof the spleen [42, 43]. Isolated primary splenic lymphoma
represents less than 2 % of all lymphomas [44]. Inpatients with lymphoma, the spleen is usually involvedsecondarily.
On contrast-enhanced CT images, it may be challengingto differentiate lymphoma nodules from sarcoidosis or fun-gal abscesses, which frequently occur in lymphoma patientsdue to immunodeficiency. However, in such cases, the pres-ence of hilar lymphadenopathy is suggestive of spleniclymphoma [45], but should not be confused with sarcoido-sis. Lymphoma of the spleen can present as splenomegalywithout focal lesions, multiple small (<1 cm) or large(<10 cm) lesions, or a single solitary lesion (Fig. 13). Thediagnosis of splenic lymphoma can be most easily made inthe context of the clinical history and in knowledge of thedisease.
Fig. 11 a, b Transverse non-contrast-enhanced CT images acquired attwo different levels in a 55-year-old woman with splenic peliosis,exhibiting multiple hypodense lesions of different size (arrows) withina massively enlarged spleen
Fig. 12 a, b Transverse contrast-enhanced CT images acquiredduring the portal-venous phase at two different levels in a 55-year-old man with littoral cell angioma, which presents as multiplehypodense, partially contrast-enhancing, lesions of different size(arrows)
Insights Imaging (2013) 4:65–76 73
Metastases
Metastases to the spleen usually occur in the context ofmulti-visceral, metastatic end-stage cancer [46]. Breast,lung, ovarian, colorectal and gastric carcinomas, as well asskin melanoma, are considered the most common primarysources [47], with skin melanoma accounting for the mostaggressive type of splenic involvement, affecting up to 30 %of patients [48, 49]. It is important to note that metastasesfrom skin melanoma can present as hypodense on non-contrast-enhanced CT images.
On contrast-enhanced CT images, hypodense, ill-defined,contrast-enhancing lesions in patients with known malignan-cies need to be regarded as splenic metastases until provenotherwise. Metastases may, depending on the primary tumour,appear either hypodense or hyperdense (Fig. 14) during theportal-venous phase and can show cystic components.
Angiosarcoma
Splenic angiosarcomas are rare but very aggressive tumours.Either solitary or multiple, contrast-enhancing lesions canbe seen on CT [50–52]. The enhancement can be similar tothat of haemangiomas. An early onset of metastasis, pre-dominantly to the liver, is observed.
Conclusions
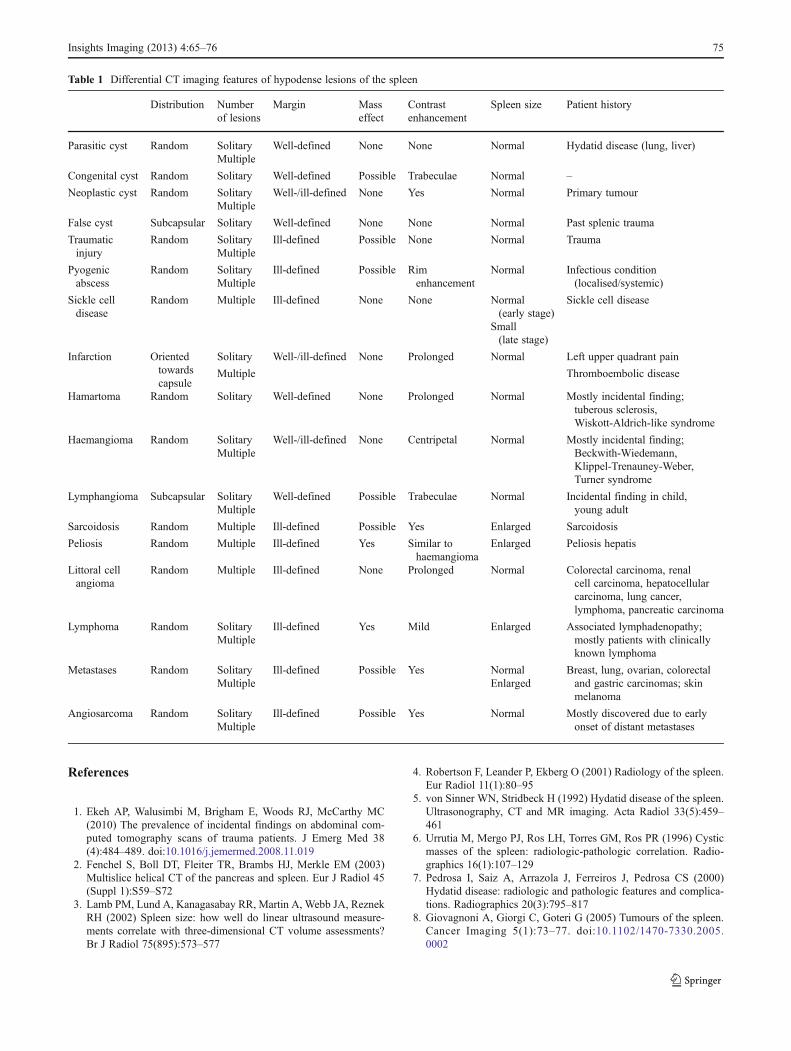
In general, the majority of hypodense splenic lesions oncontrast-enhanced, portal-venous CT represent benignlesions that require no further work-up. However, certainimaging appearances—such as ill-defined lesion borders,presence of solid, contrast-enhancing components and in-creased attenuation of the lesion—must draw the attentionof the radiologist to a potentially more relevant disease. Forcorrect interpretation, hypodense lesions of the spleen needto be evaluated in the clinical context of the history, becauseCT imaging appearances of certain entities are overlappingand often cannot be distinguished with certainty (Table 1).In the presence of a newly diagnosed, hypodense lesion ofthe spleen on contrast-enhanced, portal-venous CT, theanswers to the following questions can help in clarifyingthe diagnosis: Is there a known primary tumour? Does thepatient have any other signs of metastatic disease? Does thepatient suffer from sarcoidosis or tuberculosis? Does thepatient have fever? Is there a recent history of trauma?
Open Access This article is distributed under the terms of the CreativeCommons Attribution License which permits any use, distribution, andreproduction in any medium, provided the original author(s) and thesource are credited.
Fig. 13 a, b Transverse contrast-enhanced CT images acquired duringthe portal-venous phase at two different levels in a 55-year-old manwith diffuse large B-cell lymphoma exhibiting multiple hypodense,mildly contrast-enhancing lesions within the spleen (arrows); withthe latter usually being enlarged
Fig. 14 Transverse contrast-enhanced CT image acquired during theportal-venous phase in a 47-year-old woman with metastatic ovariancancer. The newly diagnosed hypodense lesion within the spleen(arrow) needs to be regarded as a metastasis unless proven otherwise
74 Insights Imaging (2013) 4:65–76
References
1. Ekeh AP, Walusimbi M, Brigham E, Woods RJ, McCarthy MC(2010) The prevalence of incidental findings on abdominal com-puted tomography scans of trauma patients. J Emerg Med 38(4):484–489. doi:10.1016/j.jemermed.2008.11.019
2. Fenchel S, Boll DT, Fleiter TR, Brambs HJ, Merkle EM (2003)Multislice helical CT of the pancreas and spleen. Eur J Radiol 45(Suppl 1):S59–S72
3. Lamb PM, Lund A, Kanagasabay RR, Martin A, Webb JA, ReznekRH (2002) Spleen size: how well do linear ultrasound measure-ments correlate with three-dimensional CT volume assessments?Br J Radiol 75(895):573–577
4. Robertson F, Leander P, Ekberg O (2001) Radiology of the spleen.Eur Radiol 11(1):80–95
5. von Sinner WN, Stridbeck H (1992) Hydatid disease of the spleen.Ultrasonography, CT and MR imaging. Acta Radiol 33(5):459–461
6. Urrutia M, Mergo PJ, Ros LH, Torres GM, Ros PR (1996) Cysticmasses of the spleen: radiologic-pathologic correlation. Radio-graphics 16(1):107–129
7. Pedrosa I, Saiz A, Arrazola J, Ferreiros J, Pedrosa CS (2000)Hydatid disease: radiologic and pathologic features and complica-tions. Radiographics 20(3):795–817
8. Giovagnoni A, Giorgi C, Goteri G (2005) Tumours of the spleen.Cancer Imaging 5(1):73–77. doi:10.1102/1470-7330.2005.0002
Table 1 Differential CT imaging features of hypodense lesions of the spleen
Distribution Numberof lesions
Margin Masseffect
Contrastenhancement
Spleen size Patient history
Parasitic cyst Random Solitary Well-defined None None Normal Hydatid disease (lung, liver)Multiple
Congenital cyst Random Solitary Well-defined Possible Trabeculae Normal –
Neoplastic cyst Random Solitary Well-/ill-defined None Yes Normal Primary tumourMultiple
False cyst Subcapsular Solitary Well-defined None None Normal Past splenic trauma
Traumaticinjury
Random Solitary Ill-defined Possible None Normal TraumaMultiple
Pyogenicabscess
Random Solitary Ill-defined Possible Rimenhancement
Normal Infectious condition(localised/systemic)Multiple
Sickle celldisease
Random Multiple Ill-defined None None Normal(early stage)
Sickle cell disease
Small(late stage)
Infarction Orientedtowardscapsule
Solitary Well-/ill-defined None Prolonged Normal Left upper quadrant pain
Multiple Thromboembolic disease
Hamartoma Random Solitary Well-defined None Prolonged Normal Mostly incidental finding;tuberous sclerosis,Wiskott-Aldrich-like syndrome
Haemangioma Random Solitary Well-/ill-defined None Centripetal Normal Mostly incidental finding;Beckwith-Wiedemann,Klippel-Trenauney-Weber,Turner syndrome
Multiple
Lymphangioma Subcapsular Solitary Well-defined Possible Trabeculae Normal Incidental finding in child,young adultMultiple
Sarcoidosis Random Multiple Ill-defined Possible Yes Enlarged Sarcoidosis
Peliosis Random Multiple Ill-defined Yes Similar tohaemangioma
Enlarged Peliosis hepatis
Littoral cellangioma
Random Multiple Ill-defined None Prolonged Normal Colorectal carcinoma, renalcell carcinoma, hepatocellularcarcinoma, lung cancer,lymphoma, pancreatic carcinoma
Lymphoma Random Solitary Ill-defined Yes Mild Enlarged Associated lymphadenopathy;mostly patients with clinicallyknown lymphoma
Multiple
Metastases Random Solitary Ill-defined Possible Yes Normal Breast, lung, ovarian, colorectaland gastric carcinomas; skinmelanoma
Multiple Enlarged
Angiosarcoma Random Solitary Ill-defined Possible Yes Normal Mostly discovered due to earlyonset of distant metastasesMultiple
Insights Imaging (2013) 4:65–76 75
9. Tsakayannis DE, Mitchell K, Kozakewich HP, Shamberger RC(1995) Splenic preservation in the management of splenic epider-moid cysts in children. J Pediatr Surg 30(10):1468–1470
10. Dachman AH, Ros PR, Murari PJ, Olmsted WW, Lichtenstein JE(1986) Nonparasitic splenic cysts: a report of 52 cases with radiologic-pathologic correlation. AJR Am J Roentgenol 147(3):537–542
11. Dawes LG, Malangoni MA (1986) Cystic masses of the spleen.Am Surg 52(6):333–336
12. Boscak A, Shanmuganathan K (2012) Splenic trauma: what isnew? Radiol Clin North Am 50(1):105–122. doi:10.1016/j.rcl.2011.08.008
13. Moore EE, Cogbill TH, Malangoni MA et al (1995) Organ injuryscaling. Surg Clin North Am 75(2):293–303
14. Marmery H, Shanmuganathan K, Alexander MT, Mirvis SE (2007)Optimization of selection for nonoperative management of bluntsplenic injury: comparison of MDCT grading systems. AJR Am JRoentgenol 189(6):1421–1427. doi:10.2214/AJR.07.2152
15. Becker CD, Mentha G, Terrier F (1998) Blunt abdominal trauma inadults: role of CT in the diagnosis and management of visceralinjuries. Part 1: liver and spleen. Eur Radiol 8(4):553–562
16. Al-Hajjar N, Graur F, Hassan AB, Molnar G (2002) Splenicabscesses. Rom J Gastroenterol 11(1):57–59
17. Chun CH, Raff MJ, Contreras L et al (1980) Splenic abscess.Medicine (Baltimore) 59(1):50–65
18. Nelken N, Ignatius J, Skinner M, Christensen N (1987) Changingclinical spectrum of splenic abscess. A multicenter study andreview of the literature. Am J Surg 154(1):27–34
19. Alonso Cohen MA, Galera MJ, Ruiz M et al (1990) Splenicabscess. World J Surg 14(4):513–516, discussion 516–517
20. de Bree E, Tsiftsis D, ChristodoulakisM, Harocopos G, SchoretsanitisG, Melissas J (1998) Splenic abscess: a diagnostic and therapeuticchallenge. Acta Chir Belg 98(5):199–202
21. Helton WS, Carrico CJ, Zaveruha PA, Schaller R (1986) Diagnosisand treatment of splenic fungal abscesses in the immune-suppressed patient. Arch Surg 121(5):580–586
22. Sharma SK, Smith-Rohrberg D, Tahir M, Mohan A, Seith A(2007) Radiological manifestations of splenic tuberculosis: a 23-patient case series from India. Indian J Med Res 125(5):669–678
23. Thoeni RF, Margulis AR (1979) Gastrointestinal tuberculosis.Semin Roentgenol 14(4):283–294
24. Vanhoenacker FM, De Backer AI, Op de Beeck B et al (2004)Imaging of gastrointestinal and abdominal tuberculosis. Eur Radiol14(Suppl 3):E103–E115. doi:10.1007/s00330-003-2047-9
25. Ohtomo K, Fukuda H, Mori K, Minami M, Itai Y, Inoue Y (1992)CT and MR appearances of splenic hamartoma. J Comput AssistTomogr 16(3):425–428
26. Thompson SE, Walsh EA, Cramer BC et al (1996) Radiologicalfeatures of a symptomatic splenic hamartoma. Pediatr Radiol 26(9):657–660
27. Ramani M, Reinhold C, Semelka RC et al (1997) Splenic heman-giomas and hamartomas: MR imaging characteristics of 28 lesions.Radiology 202(1):166–172
28. Rabushka LS, Kawashima A, Fishman EK (1994) Imaging of thespleen: CT with supplemental MR examination. Radiographics 14(2):307–332
29. Ros PR, Moser RP Jr, Dachman AH, Murari PJ, Olmsted WW(1987) Hemangioma of the spleen: radiologic-pathologic correla-tion in ten cases. Radiology 162(1 Pt 1):73–77
30. Disler DG, Chew FS (1991) Splenic hemangioma. AJR Am JRoentgenol 157(1):44
31. Vilanova JC, Capdevila A, Aldoma J, Delgado E (1994) Splenicepithelioid hemangioma: MR findings. AJR Am J Roentgenol 163(3):747–748
32. Bezzi M, Spinelli A, Pierleoni M, Andreoli G (2001) Cysticlymphangioma of the spleen: US-CT-MRI correlation. Eur Radiol11(7):1187–1190
33. Tada T, Wakabayashi T, Kishimoto H (1983) Peliosis of the spleen.Am J Clin Pathol 79(6):708–713
34. Lashbrook DJ, James RW, Phillips AJ, Holbrook AG, AgombarAC (2006) Splenic peliosis with spontaneous splenic rupture:report of two cases. BMC Surg 6:9. doi:10.1186/1471- 2482-6-9
35. Tsokos M, Erbersdobler A (2005) Pathology of peliosis. ForensicSci Int 149(1):25–33. doi:10.1016/j.forsciint.2004.05.010
36. Iannaccone R, Federle MP, Brancatelli G et al (2006) Peliosishepatis: spectrum of imaging findings. AJR Am J Roentgenol187(1):W43–W52. doi:10.2214/AJR.05.0167
37. Priego P, Rodriguez Velasco G, Griffith PS, Fresneda V (2008)Littoral cell angioma of the spleen. Clin Transl Oncol 10(1):61–63
38. Bhavsar T, Wang C, Huang Y, Karachristos A, Inniss S (2011)Littoral cell angiomas of the spleen associated with solid pseudo-papillary tumor of the pancreas. World J Gastrointest Pathophysiol2(3):53–56. doi:10.4291/wjgp.v2.i3.53
39. Levy AD, Abbott RM, Abbondanzo SL (2004) Littoral cell angi-oma of the spleen: CT features with clinicopathologic comparison.Radiology 230(2):485–490. doi:10.1148/radiol.2302030196
40. Shah S, Wasnik A, Pandya A, Bude RO (2011) Multimodalityimaging findings in image- guided biopsy proven splenic littoralcell angioma: series of three cases. Abdom Imaging 36(6):735–738. doi:10.1007/s00261-011-9697-x
41. Schneider G, Uder M, Altmeyer K, Bonkhoff H, Gruber M,Kramann B (2000) Littoral cell angioma of the spleen: CT andMR imaging appearance. Eur Radiol 10(9):1395–1400
42. Dachman AH, Buck JL, Krishnan J, Aguilera NS, Buetow PC(1998) Primary non- Hodgkin’s splenic lymphoma. Clin Radiol53(2):137–142
43. Metser U, Goor O, Lerman H, Naparstek E, Even-Sapir E (2004)PET-CT of extranodal lymphoma. AJR Am J Roentgenol 182(6):1579–1586
44. Ahmed S, Horton KM, Fishman EK (2011) Splenic incidentalo-mas. Radiol Clin North Am 49(2):323–347. doi:10.1016/j.rcl.2010.11.001
45. Leite NP, Kased N, Hanna RF et al (2007) Cross-sectional imagingof extranodal involvement in abdominopelvic lymphoproliferativemalignancies. Radiographics 27(6):1613–1634. doi:10.1148/rg.276065170
46. Comperat E, Bardier-Dupas A, Camparo P, Capron F, Charlotte F(2007) Splenic metastases: clinicopathologic presentation, differ-ential diagnosis, and pathogenesis. Arch Pathol Lab Med 131(6):965–969
47. Griffin N, Burke C, Grant LA (2011) Common primary tumours ofthe abdomen and pelvis and their patterns of tumour spread as seenon multi-detector computed tomography. Insights Imaging 2(3):205–214. doi:10.1007/s13244-011-0089-0
48. Berge T (1974) Splenic metastases. Frequencies and patterns. ActaPathol Microbiol Scand A 82(4):499–506
49. Lam KY, Tang V (2000) Metastatic tumors to the spleen: a 25-yearclinicopathologic study. Arch Pathol Lab Med 124(4):526–530
50. Ha HK, Kim HH, Kim BK, Han JK, Choi BI (1994) Primaryangiosarcoma of the spleen. CT and MR imaging. Acta Radiol35(5):455–458
51. Imaoka I, Sugimura K, Furukawa M, Kuroda S, Yasui K (1999)CT and MR findings of splenic angiosarcoma. Radiat Med 17(1):67–70
52. Vanhoenacker FM, Op de Beeck B, De Schepper AM, Salgado R,Snoeckx A, Parizel PM (2007) Vascular disease of the spleen.Semin Ultrasound CT MR 28(1):35–51
76 Insights Imaging (2013) 4:65–76