EPIDEMIC HEMORRHAGIC FEVER ( Hemorrhagic fever with renal syndrome )
J Med Assoc Thai Vol. 92 No. 1 2009 73
Correspondence to: Chiewvit P, Department of Radiology,Siriraj Hospital, 2 Prannok, Bangkoknoi, Bangkok 10700,Thailand. Phone: 0-2419-7086, Fax: 0-2412-7785, E-mail:[email protected]
Computed Tomographic Findings in Non-traumaticHemorrhagic Stroke
Pipat Chiewvit MD*, Nasuda Danchaivijitr MD*,Yongchai Nilanont MD**, Niphon Poungvarin MD**
* Department of Radiology, Faculty of Medicine Siriraj Hospital, Mahidol University, Bangkok, Thailand** Department of Internal Medicine, Faculty of Medicine Siriraj Hospital, Mahidol University, Bangkok, Thailand
Objective: To analyze CT findings in hemorrhagic stroke patients correlation with clinical outcome andassess the interobserver agreement of hemorrhagic stroke identification on CT imaging.Material and Method: CT imaging features of 131 cases and clinical data were verified and collected atSiriraj Hospital from Jan 2004 to Dec 2005 and retrospectively analyzed for type, location, mass effect, size ofhemorrhage, intraventricular extension, initial level of consciousness (GCS), hospital length of stay andpatient outcome. The percentages, predictive values, kappa were calculated.Results: From all types of hemorrhagic stroke, intracerebral hemorrhage remains a common and devastatingclinical problem. The most common site was the thalamus and basal ganglia. In the present study, the authorsfound that fifty-three cases (53/131 cases, 40.5%) with thalamic-ganglionic hemorrhage, nineteen cases(19/131 cases, 14.5%) in lobar hemorrhage, five cases (5/131 cases, 3.8%) in cerebellum, five cases (5/131cases, 3.8%) in brainstem and eight cases (8/131 cases, 6.1%) occurred in multiple locations. There weretwenty-five cases (25/131 cases, 19.1%) of subarachnoid hemorrhage, thirteen cases (13/131 cases, 9.9%) ofsubdural hemorrhage and three cases (3/131 cases, 2.3%) of intraventricular hemorrhage. Two variables onCT imaging, identified as significant as early mortality predictors, were hematoma volume more than 60 cm3,and presence of intraventricular hemorrhage extension (p < 0.05). The mass effect defined as midline and/orenlargement of contralateral ventricle was not significant (p = 0.067). The present study found concordancebetween CT brain interpretation by two neuroradiologists for the type of hemorrhagic stroke was very good,Kappa = 0.861 as well as for location was 0.866.Conclusion: CT imaging is an imaging instrument for early identification of hemorrhagic stroke patients andproviding imaging evidence of high mortality risk.
Keywords: Computed Tomographic finding, Computed Tomography, Stroke, Hemorrhagic stroke, Non-traumatic hemorrhagic stroke
Stroke is the third most common cause ofdeath in developed countries population after coronaryheart disease and cancer(1). The epidemiological dataof stroke in Thailand are scanty. The prevalence inBangkok, Thailand is 690 per 100,000 populations(2).A survey in the elderly population from four regions;
Central Region, Northern Region, North-EasternRegion and Southern Region found a prevalencerate of 1.12 percent(3). There are two major types ofstroke: one is called an “ischemic” stroke whichaccounts for 80 percent of all strokes; the other iscalled a “hemorrhagic” stroke which accounts forabout 20 percent of strokes(1,5-8). Hemorrhagic strokeincludes intracerebral hemorrhage (ICH), subarachnoidhemorrhage (SAH), intraventricular hemorrhage (IVH),subdural hemorrhage (SDH)(13). Recent advances in
J Med Assoc Thai 2009; 92 (1): 73-86Full text. e-Journal: http://www.mat.or.th/journal
74 J Med Assoc Thai Vol. 92 No. 1 2009
neuroimaging have made it easier to identify underlyingdisease mechanisms and to classify cerebrovasculardiseases appropriately(10). Computed Tomography(CT) of the head has a role in evaluation of patientswith stroke. Nowadays, CT is an imaging modality ofchoice of stroke fast track because of rapidly scanningtime as the result of development of fast scanningmachine such as multidetector CT scanner (MDCT).CT of the head can provide brain imaging diagnosis,used in patient management to differentiate betweenhemorrhage, ischemic stroke and other lesions thatpresent with stroke like symptoms. CT imaging is animaging modality which demonstrates normal architec-ture of related anatomical regional study and therefore,hemorrhagic stroke in either intra-axial location (intra-cerebral) or extra-axial location (epidural, subdural orsubarachnoid spaces) or both are well demonstrated.CT imaging has an additional value in assessmentof size or volume of intracerebral hemorrhage whichdirectly correlates to degree of midline shifting,clinical outcomes. Those images’ information cannotbe done by clinical examination alone(9-11). Diagnosisand management in the first few hours of acute strokepatients are critical. All stroke patients should beadmitted to the hospital for evaluation and treatment.This is best accomplished in an intensive care or strokeunit. Management must be individualized and basedon careful clinical and radiological assessment.
Material and MethodThe patients were identified from The Inter-
national Classification of Diseases, 10th Revision(ICD-10), codes with the diagnosis of nontraumaticintracranial hemorrhage (code I-60 subarachnoidhemorrhage, I-61 Intracerebral hemorrhage and I-62other non-traumatic intracranial hemorrhage).
Criteria for inclusions into the study were:(1) All patients that were available in
assessment of both CT imaging of the brain in PACSworkstation and medical record data for review.
(2) Patients who had undergone cranialsurgery, the preoperative CT imaging was used forreview.
(3) Patients who had more than one CT scan,only the first CT scan was used for analysis.
Plain axial study of CT scan of the brain wasperformed with multidetector CT scanner (Light speed16; General Electric Medical System, Milwaukee,Wisconsin, USA). Technique: 120 kV, 250 mA, and5-mm section thickness. Coverage was from the
skull base to the vertex by obtaining contiguous axialsections. The CT scan were searched from databasesat a PACS workstation in Siriraj Hospital and reviewedby two neuroradiologists. The CT scan of patientswho had non-traumatic intracranial hemorrhage (codeICD-10 = I 60, I 61, I62) and underwent CT scan thebrain at Siriraj Hospital from January 2004 to December2005. Retrospective review was performed at a PACSworkstation by two neuroradiologists in the inter-pretation of stroke CT scans and blinded to the clinicalhistory and lateralization of symptoms. CT scan wasdescribed for abnormalities as the precise extent ofintracranial hemorrhage, the size and location of thehemorrhage, structural abnormalities herniation, hydro-cephalus, intraventricular hemorrhage, subarachnoidhemorrhage and subdural hemorrhage. Discrepanciesin interpretation between two observers were resolvedby consensus. The intracerebral hematoma (ICH) weredivided into the following groups according to thelocation of the largest blood clot:
1. Lobar hematoma (frontal, parietal, temporal,occipital).
2. Thalamic-ganglionic hematoma (caudate,putaminal and thalamic).
3. Hematoma in the posterior fossa, brainstemand cerebellum.
All CT examination was reviewed for the followingfindings:
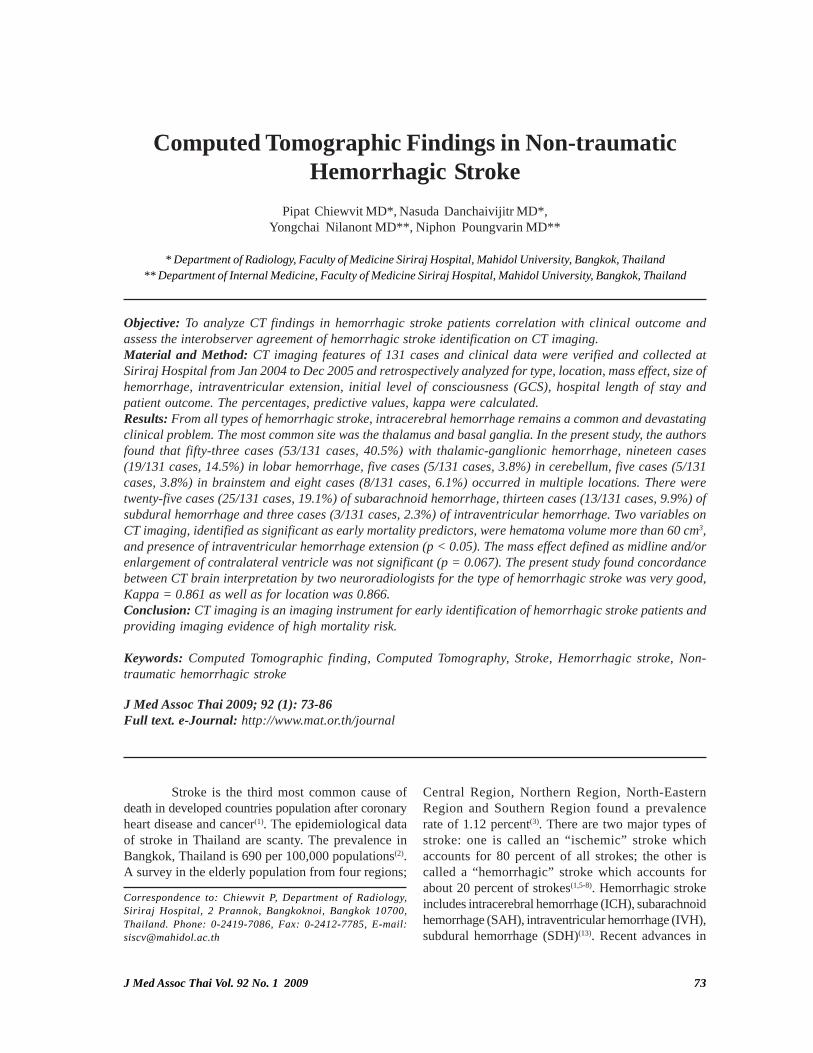
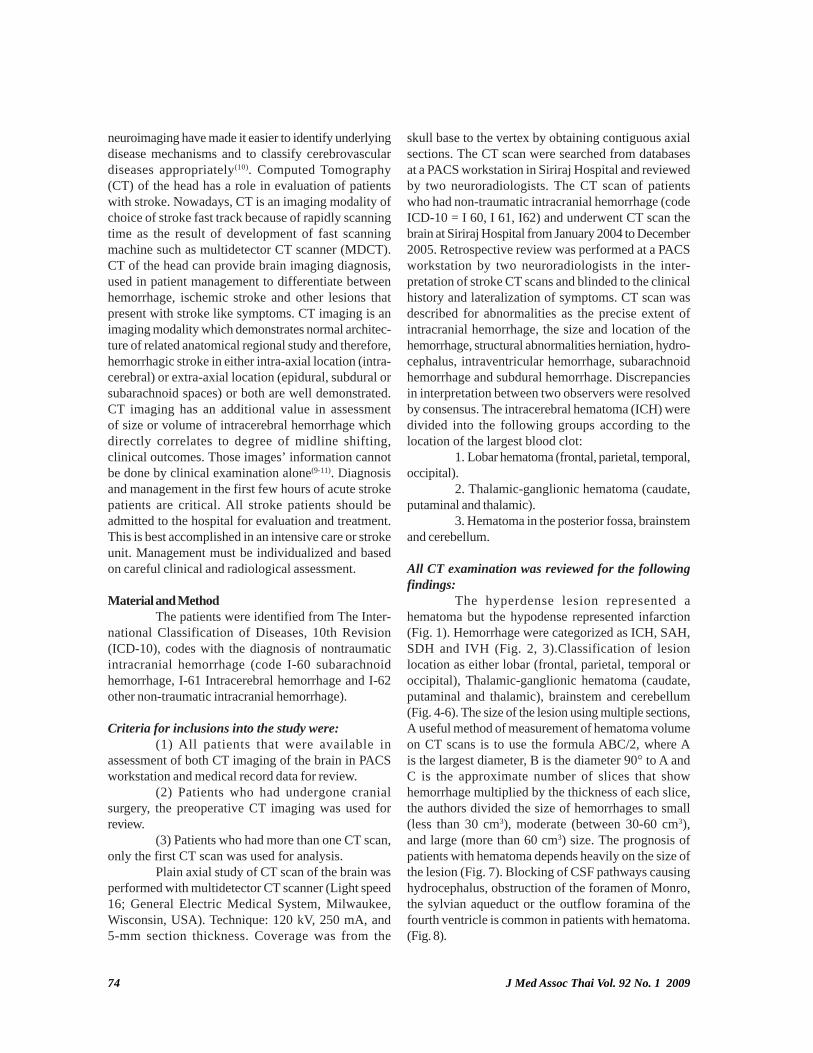
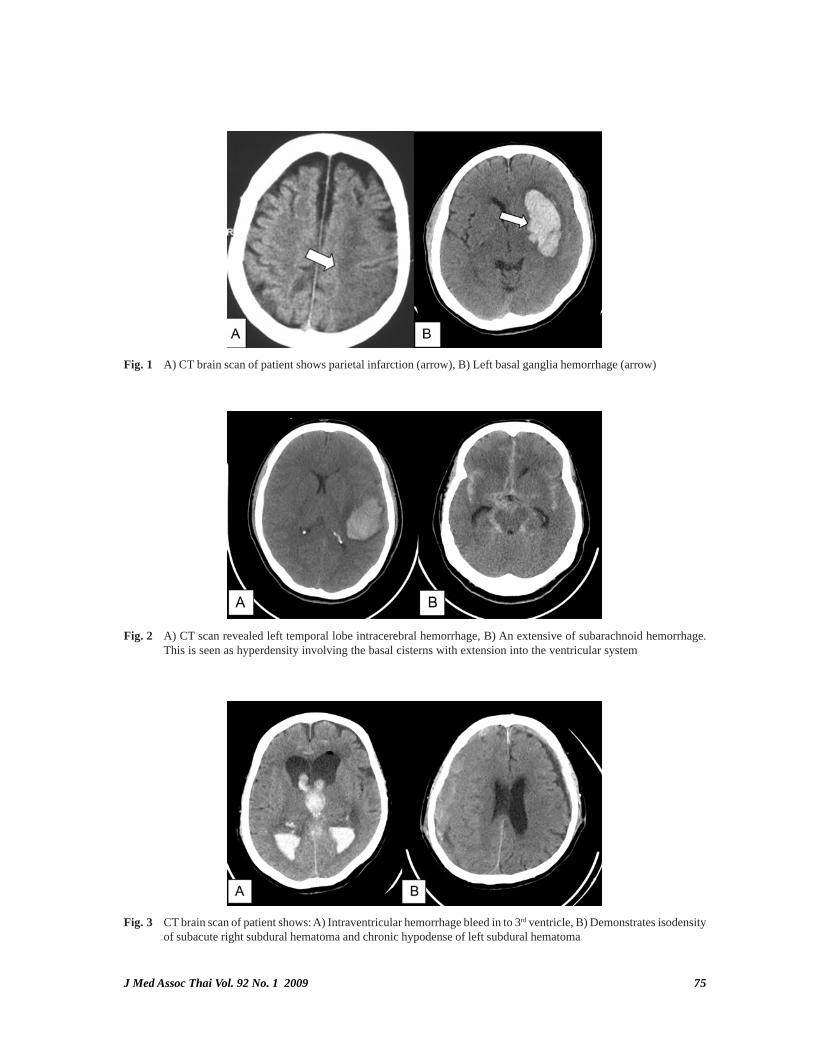
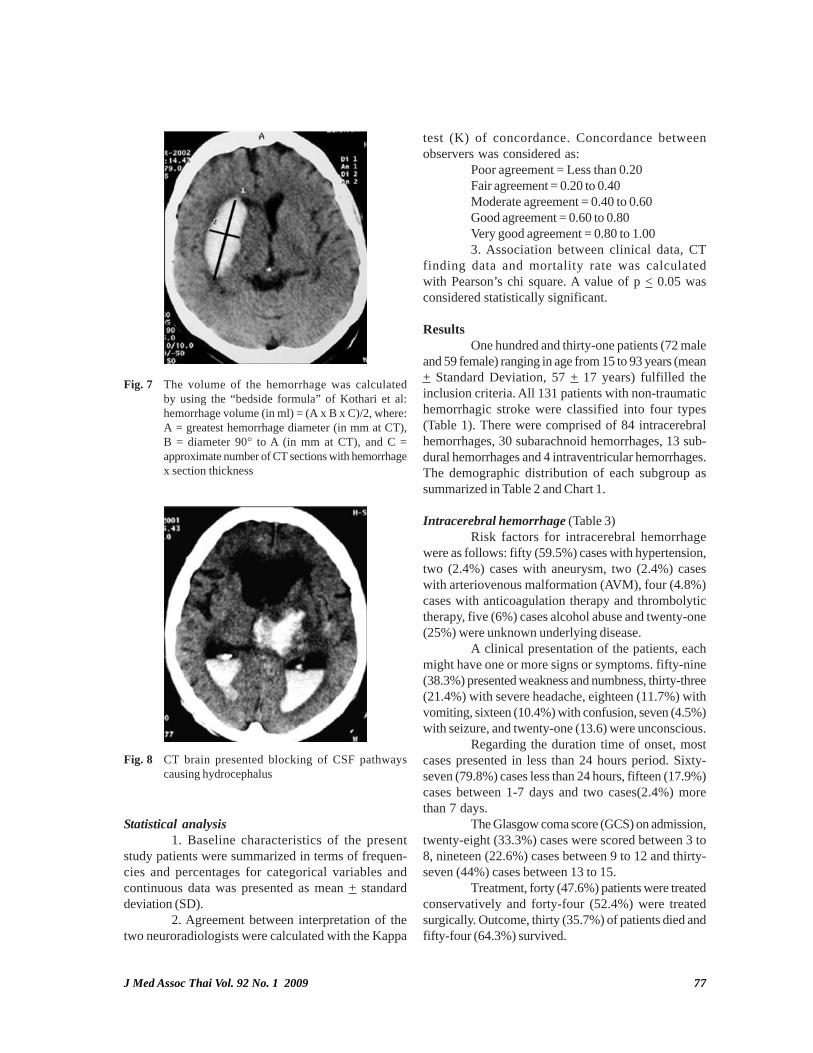
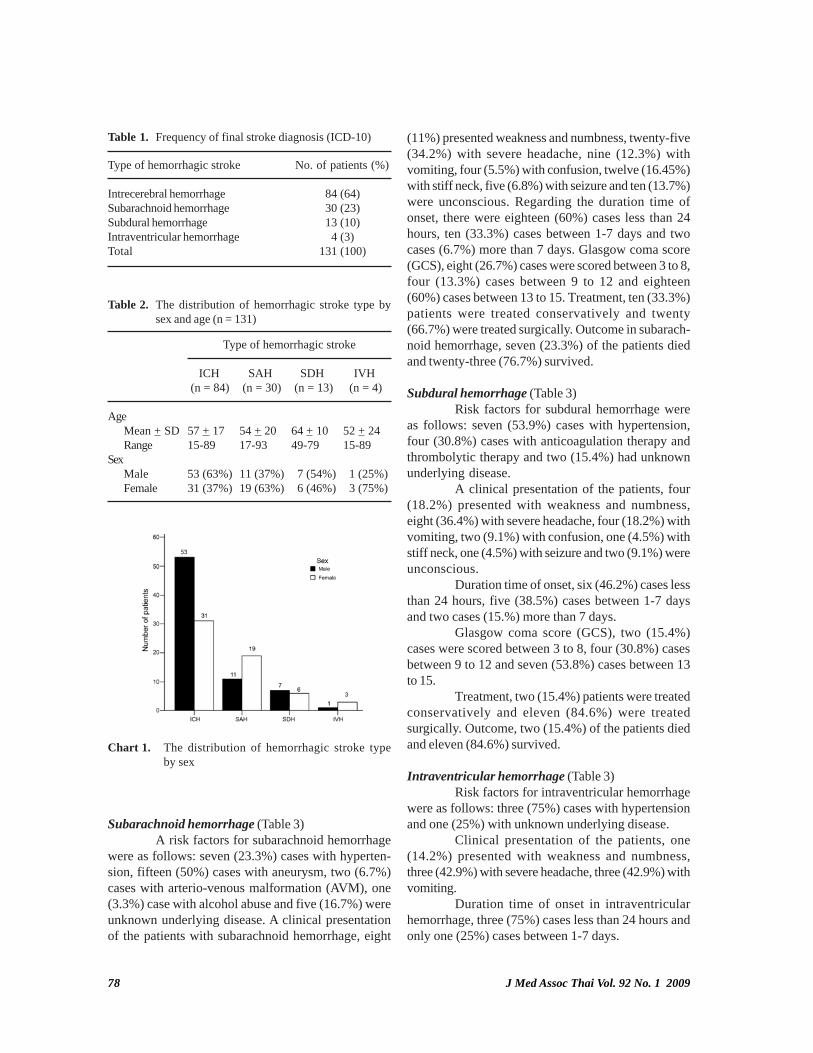
The hyperdense lesion represented ahematoma but the hypodense represented infarction(Fig. 1). Hemorrhage were categorized as ICH, SAH,SDH and IVH (Fig. 2, 3).Classification of lesionlocation as either lobar (frontal, parietal, temporal oroccipital), Thalamic-ganglionic hematoma (caudate,putaminal and thalamic), brainstem and cerebellum(Fig. 4-6). The size of the lesion using multiple sections,A useful method of measurement of hematoma volumeon CT scans is to use the formula ABC/2, where Ais the largest diameter, B is the diameter 90° to A andC is the approximate number of slices that showhemorrhage multiplied by the thickness of each slice,the authors divided the size of hemorrhages to small(less than 30 cm3), moderate (between 30-60 cm3),and large (more than 60 cm3) size. The prognosis ofpatients with hematoma depends heavily on the size ofthe lesion (Fig. 7). Blocking of CSF pathways causinghydrocephalus, obstruction of the foramen of Monro,the sylvian aqueduct or the outflow foramina of thefourth ventricle is common in patients with hematoma.(Fig. 8).
J Med Assoc Thai Vol. 92 No. 1 2009 75
Fig. 1 A) CT brain scan of patient shows parietal infarction (arrow), B) Left basal ganglia hemorrhage (arrow)
Fig. 2 A) CT scan revealed left temporal lobe intracerebral hemorrhage, B) An extensive of subarachnoid hemorrhage.This is seen as hyperdensity involving the basal cisterns with extension into the ventricular system
Fig. 3 CT brain scan of patient shows: A) Intraventricular hemorrhage bleed in to 3rd ventricle, B) Demonstrates isodensityof subacute right subdural hematoma and chronic hypodense of left subdural hematoma
76 J Med Assoc Thai Vol. 92 No. 1 2009
Fig. 5 Hypertensive hemorrhage in the basal ganglia. Hypertensive hemorrhage has a predilection for deep structuresincluding the thalamus and basal ganglia, particularly the putamen and external capsule. Thus, it often appearsas a high-density hemorrhage in the region of the basal ganglia: A) Lobar hemorrhage, B) Putamen hemorrhage,C) External capsule hemorrhage
Fig. 6 CT scan shown: A) Cerebellar hemorrhage, B) Brain stem hemorrhage
Fig. 4 CT image of Lobar hemorrhage: A) Frontal lobe intracerebral hemorrhage, B) Parietal lobe intracerebral hemorrhage,C) Temporo-occipital lobe intracerebral hemorrhage
J Med Assoc Thai Vol. 92 No. 1 2009 77
Fig. 7 The volume of the hemorrhage was calculatedby using the “bedside formula” of Kothari et al:hemorrhage volume (in ml) = (A x B x C)/2, where:A = greatest hemorrhage diameter (in mm at CT),B = diameter 90° to A (in mm at CT), and C =approximate number of CT sections with hemorrhagex section thickness
Fig. 8 CT brain presented blocking of CSF pathwayscausing hydrocephalus
Statistical analysis1. Baseline characteristics of the present
study patients were summarized in terms of frequen-cies and percentages for categorical variables andcontinuous data was presented as mean + standarddeviation (SD).
2. Agreement between interpretation of thetwo neuroradiologists were calculated with the Kappa
test (K) of concordance. Concordance betweenobservers was considered as:
Poor agreement = Less than 0.20Fair agreement = 0.20 to 0.40Moderate agreement = 0.40 to 0.60Good agreement = 0.60 to 0.80Very good agreement = 0.80 to 1.003. Association between clinical data, CT
finding data and mortality rate was calculatedwith Pearson’s chi square. A value of p < 0.05 wasconsidered statistically significant.
ResultsOne hundred and thirty-one patients (72 male
and 59 female) ranging in age from 15 to 93 years (mean+ Standard Deviation, 57 + 17 years) fulfilled theinclusion criteria. All 131 patients with non-traumatichemorrhagic stroke were classified into four types(Table 1). There were comprised of 84 intracerebralhemorrhages, 30 subarachnoid hemorrhages, 13 sub-dural hemorrhages and 4 intraventricular hemorrhages.The demographic distribution of each subgroup assummarized in Table 2 and Chart 1.
Intracerebral hemorrhage (Table 3)Risk factors for intracerebral hemorrhage
were as follows: fifty (59.5%) cases with hypertension,two (2.4%) cases with aneurysm, two (2.4%) caseswith arteriovenous malformation (AVM), four (4.8%)cases with anticoagulation therapy and thrombolytictherapy, five (6%) cases alcohol abuse and twenty-one(25%) were unknown underlying disease.
A clinical presentation of the patients, eachmight have one or more signs or symptoms. fifty-nine(38.3%) presented weakness and numbness, thirty-three(21.4%) with severe headache, eighteen (11.7%) withvomiting, sixteen (10.4%) with confusion, seven (4.5%)with seizure, and twenty-one (13.6) were unconscious.
Regarding the duration time of onset, mostcases presented in less than 24 hours period. Sixty-seven (79.8%) cases less than 24 hours, fifteen (17.9%)cases between 1-7 days and two cases(2.4%) morethan 7 days.
The Glasgow coma score (GCS) on admission,twenty-eight (33.3%) cases were scored between 3 to8, nineteen (22.6%) cases between 9 to 12 and thirty-seven (44%) cases between 13 to 15.
Treatment, forty (47.6%) patients were treatedconservatively and forty-four (52.4%) were treatedsurgically. Outcome, thirty (35.7%) of patients died andfifty-four (64.3%) survived.
78 J Med Assoc Thai Vol. 92 No. 1 2009
Type of hemorrhagic stroke No. of patients (%)
Intrecerebral hemorrhage 84 (64)Subarachnoid hemorrhage 30 (23)Subdural hemorrhage 13 (10)Intraventricular hemorrhage 4 (3)Total 131 (100)
Table 1. Frequency of final stroke diagnosis (ICD-10)
Type of hemorrhagic stroke
ICH SAH SDH IVH (n = 84) (n = 30) (n = 13) (n = 4)
AgeMean + SD 57 + 17 54 + 20 64 + 10 52 + 24Range 15-89 17-93 49-79 15-89
SexMale 53 (63%) 11 (37%) 7 (54%) 1 (25%)Female 31 (37%) 19 (63%) 6 (46%) 3 (75%)
Table 2. The distribution of hemorrhagic stroke type bysex and age (n = 131)
Subarachnoid hemorrhage (Table 3)A risk factors for subarachnoid hemorrhage
were as follows: seven (23.3%) cases with hyperten-sion, fifteen (50%) cases with aneurysm, two (6.7%)cases with arterio-venous malformation (AVM), one(3.3%) case with alcohol abuse and five (16.7%) wereunknown underlying disease. A clinical presentationof the patients with subarachnoid hemorrhage, eight
(11%) presented weakness and numbness, twenty-five(34.2%) with severe headache, nine (12.3%) withvomiting, four (5.5%) with confusion, twelve (16.45%)with stiff neck, five (6.8%) with seizure and ten (13.7%)were unconscious. Regarding the duration time ofonset, there were eighteen (60%) cases less than 24hours, ten (33.3%) cases between 1-7 days and twocases (6.7%) more than 7 days. Glasgow coma score(GCS), eight (26.7%) cases were scored between 3 to 8,four (13.3%) cases between 9 to 12 and eighteen(60%) cases between 13 to 15. Treatment, ten (33.3%)patients were treated conservatively and twenty(66.7%) were treated surgically. Outcome in subarach-noid hemorrhage, seven (23.3%) of the patients diedand twenty-three (76.7%) survived.
Subdural hemorrhage (Table 3)Risk factors for subdural hemorrhage were
as follows: seven (53.9%) cases with hypertension,four (30.8%) cases with anticoagulation therapy andthrombolytic therapy and two (15.4%) had unknownunderlying disease.
A clinical presentation of the patients, four(18.2%) presented with weakness and numbness,eight (36.4%) with severe headache, four (18.2%) withvomiting, two (9.1%) with confusion, one (4.5%) withstiff neck, one (4.5%) with seizure and two (9.1%) wereunconscious.
Duration time of onset, six (46.2%) cases lessthan 24 hours, five (38.5%) cases between 1-7 daysand two cases (15.%) more than 7 days.
Glasgow coma score (GCS), two (15.4%)cases were scored between 3 to 8, four (30.8%) casesbetween 9 to 12 and seven (53.8%) cases between 13to 15.
Treatment, two (15.4%) patients were treatedconservatively and eleven (84.6%) were treatedsurgically. Outcome, two (15.4%) of the patients diedand eleven (84.6%) survived.
Intraventricular hemorrhage (Table 3)Risk factors for intraventricular hemorrhage
were as follows: three (75%) cases with hypertensionand one (25%) with unknown underlying disease.
Clinical presentation of the patients, one(14.2%) presented with weakness and numbness,three (42.9%) with severe headache, three (42.9%) withvomiting.
Duration time of onset in intraventricularhemorrhage, three (75%) cases less than 24 hours andonly one (25%) cases between 1-7 days.
Chart 1. The distribution of hemorrhagic stroke typeby sex
J Med Assoc Thai Vol. 92 No. 1 2009 79
Clinical data Intracerebral Subarachnoid Subdural Intraventricular hemorrhage hemorrhage hemorrhage hemorrhage (n = 84) (n = 30) (n = 13) (n = 4)
Risk factorsHypertension 50 (59.5%) 7 (23.3%) 7 (53.9%) 3 (75%)Aneurysm 2 (2.4%) 15 (50%) - -Arterio-venous malformation 2 (2.4%) 2 (6.7%) - -Anticoagulation therapy or Thrombolytic therapy 4 (4.8%) - 4 (30.8%) -Alcohol 5 (6%) 1 (3.3%) - -Unknown 21 (25%) 5 (16.7%) 2 (15.4%) 1 (25%)
Clinical presentationsWeakness/numbness 59 (38.3%) 8 (11%) 4 (18.2%) 1 (14.2%)Severe headache 33 (21.4%) 25 (34.2%) 8 (36.4%) 3 (42.9%)Vomiting 18 (11.7%) 9 (12.3%) 4 (18.2%) 3 (42.9%)Confusion 16 (10.4%) 4 (5.5%) 2 (9.1%) -Stiff neck - 12 (16.4%) 1 (4.5%) -Seizure 7 (4.5%) 5 (6.8%) 1 (4.5%) -Unconscious 21 (13.6%) 10 (13.7 %) 2 (9.1%) -
Duration of onset< 1 day 67 (79.8%) 18 (60%) 6 (46.2%) 3 (75%)1-7 days 15 (17.9%) 10 (33.3%) 5 (38.5%) 1 (25%)> 7 days 2 (2.4%) 2 (6.7%) 2 (15.4%) -
Glasgow coma score3 - 8 28 (33.3%) 8 (26.7%) 2 (15.4%) 1 (25%)9 - 12 19 (22.6%) 4 (13.3%) 4 (30.8%) 1 (25%)13 - 15 37 (44%) 18 (60%) 7 (53.8%) 2 (50%)
TreatmentOperative 44 (52.4%) 20 (66.7%) 11 (84.6%) 2 (50%)Conservative 40 (47.6%) 10 (33.3%) 2 (15.4%) 2 (50%)
OutcomeSurvival 54 (64.3%) 23 (76.7%) 11 (84.6%) 4 (100%)Death 30 (35.7%) 7 (23.3%) 2 (15.4%) -
Table 3. The clinical data in patients with intracerebral hemorrhage, subarachnoid hemorrhage, subdural hemorrhage andintraventricular hemorrhage
Glasgow coma score (GCS), one (25%) caseswere scored between 3 to 8, one (25%) case between9 to 12 and two (50%) cases between 13 to 15.
Treatment, in intraventricular hemorrhage,two (50%) patients were treated conservatively andtwo (50%) were treated surgically and all survived.
Interobserver agreementThe CT findings, interpretation by two neuro-
radiologists, were calculated with Kappa test (K) ofconcordance. Concordance for the type of hemorrhagicstroke interpretation between observers was very good(K = 0.861). Result of interpretation by neuroradiologist1 showed intracerebral hemorrhage 36 cases, intra-cerebral hemorrhage with intraventricular extension 47cases, intraventricular hemorrhage 3 cases, subarach-
noid hemorrhage 15 cases, subarachnoid hemorrhagewith intraventricular hemorrhage 11 cases, intracere-bral hemorrhage with intraventricular hemorrhageand subarachnoid hemorrhage 6 cases and subduralhemorrhage 13 cases. The neuroradiologist 2 shownintracerebral hemorrhage 37 cases, intracerebralhemorrhage with intraventricular extension 43 cases,intraventricular hemorrhage 3 cases, subarachnoidhemorrhage 16 cases, subarachnoid hemorrhage withintraventricular hemorrhage 11 cases, intracerebralhemorrhage with intraventricular hemorrhage andsubarachnoid hemorrhage 8 cases and subduralhemorrhage 13 cases, as shown in Table 4.
Agreement for location of hematoma in intra-cerebral hemorrhage interpretation between observerswas very good (K = 0.866). Result of interpretation by
80 J Med Assoc Thai Vol. 92 No. 1 2009
neuroradiologist1 showed 20 lesions in lobar, 49lesions in thalamic-ganglionic, 5 lesions in cerebellum,5 lesions in brainstem and 11 lesions in multiplelocations. By neuroradiologist 2 showed 19 lesions inlobar, 41 lesions in thalamic-ganglionic, 5 lesions incerebellum, 5 lesions in brainstem and 20 lesions inmultiple locations, as shown in Table 5.
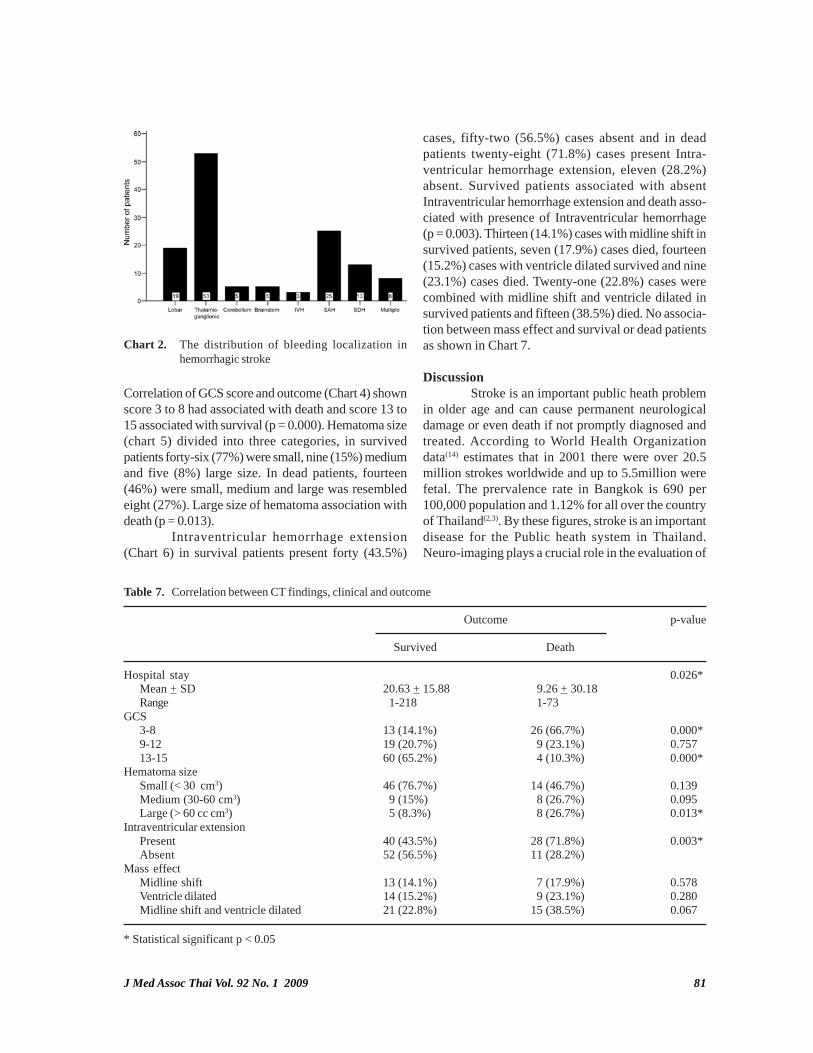
The most common site of intracerebralhemorrhage was the thalamus and basal ganglia. Offifty-three cases (40.5%) with thalamic-ganglionichemorrhage, nineteen cases (14.5%) in lobar hemorrhage,five cases (3.8%) in cerebellum, five cases (3.8%) inbrainstem and eight cases (6.1%) in multiple location.Three cases (2.3%) in intraventricular hemorrhage,twenty-five cases (19.1%) in subarachnoid hemorrhageand thirteen cases (9.9%) in subdural hemorrhage,as shown in Table 6, Chart 2-4. Side of hematoma,fifty-one (56.7%) were right side, thirty-six (40%) leftside. Intraventricular extension of the hematoma waspresented in 68 cases. The volume of hematomadivided into three categories(17, 53), sixty hematoma(66.7%) less than 30 cm3, seventeen hematoma (18.9%)between 30-60 cm3 and thirteen hematoma (14.4%) were61 cm3 or greater. There were twenty cases (15.3%)midline shift only, twenty-three cases (17.6%) ventricledilated and thirty-six cases (27.5%) were combined, asshown in Table 6.
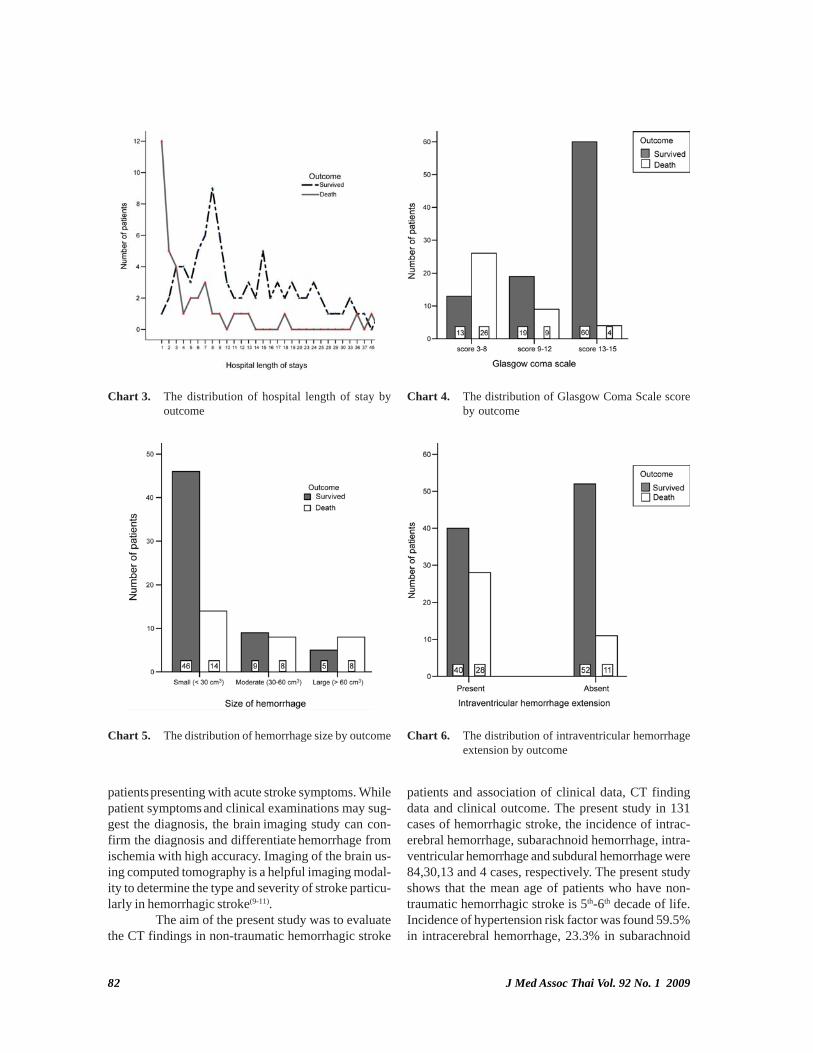
In the statistical analyses, in the presentstudy used clinical data on the patient includinghospital length of stay, initial level of consciousness(Glasgow Coma Scale score) and CT findings dataincluding hematoma size, intraventricular extensionand mass effect. Mean hospital length of stay (Chart 3)in survival patients were 20.63 + 15.88 range 1-218days and hospital length of stay in dead patients were9.26 + 30.18 range 1-73 days. Dead patients stayed inhospital shorter than survived patients (p = 0.026).
Neuroradiologist 2
Neuroradiologist 1 ICH ICH/ IVH IVH SAH SAH/ IVH ICH/IVH/SAH SDH Total
ICH 36 - - - - - - 36ICH/IVH 1 41 1 - - 4 - 47IVH - 1 2 - - - - 3SAH - - - 14 1 - - 15SAH/IVH - - - 2 8 1 - 11ICH/IVH/SAH - 1 - - 2 3 - 6SDH - - - - - - 13 13Total 37 43 3 16 11 8 13 131
Table 4. Agreement between interpretations of two neuroradiologists for hemorrhagic stroke type
Neuroradiologist 1 Neuroradiologist 2
Lobar 20 19Thalamic-ganglionic 49 41Cerebellum 5 5Brainstem 5 5Multiple locations 11 20Total 90 90
Table 5. Agreement between interpretations of two neuro-radiologist for location of hematoma
Location n %
LocationLobar 19 14.5Thalamic-ganglionic 53 40.5Cerebellum 5 3.8Brainstem 5 3.8Multiple location 8 6.1Pure intraventricular (IVH) 3 2.3Subarachnoid hemorrhage (SAH) 25 19.1Subdural hemorrhage (SDH) 13 9.9
Side of hematomaRight 51 56.7Left 36 40.0Mid 3 3.3
Intraventricular extensionPresent 68 51.9Absent 63 48.1
Size of hematomaSmall (< 30 cm3) 60 66.7Moderate (30-60 cm3) 17 18.9Large (> 60 cm3) 13 14.4
Mass effectNo mass effect 52 39.7Midline shift 20 15.3Ventricle dilated 23 17.6Midline shift and ventricle dilated 36 27.5
Table 6. CT findings after consensus
J Med Assoc Thai Vol. 92 No. 1 2009 81
Correlation of GCS score and outcome (Chart 4) shownscore 3 to 8 had associated with death and score 13 to15 associated with survival (p = 0.000). Hematoma size(chart 5) divided into three categories, in survivedpatients forty-six (77%) were small, nine (15%) mediumand five (8%) large size. In dead patients, fourteen(46%) were small, medium and large was resembledeight (27%). Large size of hematoma association withdeath (p = 0.013).
Intraventricular hemorrhage extension(Chart 6) in survival patients present forty (43.5%)
Chart 2. The distribution of bleeding localization inhemorrhagic stroke
Outcome p-value
Survived Death
Hospital stay 0.026*Mean + SD 20.63 + 15.88 9.26 + 30.18Range 1-218 1-73
GCS3-8 13 (14.1%) 26 (66.7%) 0.000*9-12 19 (20.7%) 9 (23.1%) 0.75713-15 60 (65.2%) 4 (10.3%) 0.000*
Hematoma sizeSmall (< 30 cm3) 46 (76.7%) 14 (46.7%) 0.139Medium (30-60 cm3) 9 (15%) 8 (26.7%) 0.095Large (> 60 cc cm3) 5 (8.3%) 8 (26.7%) 0.013*
Intraventricular extensionPresent 40 (43.5%) 28 (71.8%) 0.003*Absent 52 (56.5%) 11 (28.2%)
Mass effectMidline shift 13 (14.1%) 7 (17.9%) 0.578Ventricle dilated 14 (15.2%) 9 (23.1%) 0.280Midline shift and ventricle dilated 21 (22.8%) 15 (38.5%) 0.067
Table 7. Correlation between CT findings, clinical and outcome
* Statistical significant p < 0.05
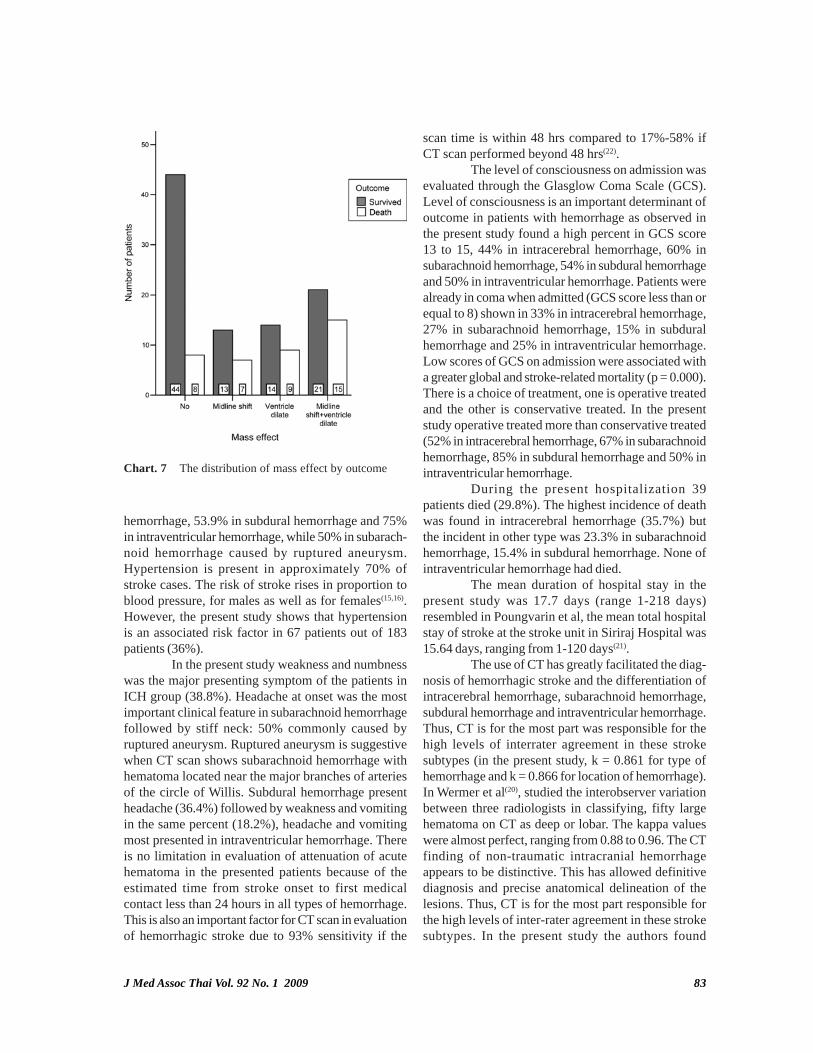
cases, fifty-two (56.5%) cases absent and in deadpatients twenty-eight (71.8%) cases present Intra-ventricular hemorrhage extension, eleven (28.2%)absent. Survived patients associated with absentIntraventricular hemorrhage extension and death asso-ciated with presence of Intraventricular hemorrhage(p = 0.003). Thirteen (14.1%) cases with midline shift insurvived patients, seven (17.9%) cases died, fourteen(15.2%) cases with ventricle dilated survived and nine(23.1%) cases died. Twenty-one (22.8%) cases werecombined with midline shift and ventricle dilated insurvived patients and fifteen (38.5%) died. No associa-tion between mass effect and survival or dead patientsas shown in Chart 7.
DiscussionStroke is an important public heath problem
in older age and can cause permanent neurologicaldamage or even death if not promptly diagnosed andtreated. According to World Health Organizationdata(14) estimates that in 2001 there were over 20.5million strokes worldwide and up to 5.5million werefetal. The prervalence rate in Bangkok is 690 per100,000 population and 1.12% for all over the countryof Thailand(2,3). By these figures, stroke is an importantdisease for the Public heath system in Thailand.Neuro-imaging plays a crucial role in the evaluation of
82 J Med Assoc Thai Vol. 92 No. 1 2009
Chart 3. The distribution of hospital length of stay byoutcome
Chart 4. The distribution of Glasgow Coma Scale scoreby outcome
Chart 6. The distribution of intraventricular hemorrhageextension by outcome
Chart 5. The distribution of hemorrhage size by outcome
patients presenting with acute stroke symptoms. Whilepatient symptoms and clinical examinations may sug-gest the diagnosis, the brain imaging study can con-firm the diagnosis and differentiate hemorrhage fromischemia with high accuracy. Imaging of the brain us-ing computed tomography is a helpful imaging modal-ity to determine the type and severity of stroke particu-larly in hemorrhagic stroke(9-11).
The aim of the present study was to evaluatethe CT findings in non-traumatic hemorrhagic stroke
patients and association of clinical data, CT findingdata and clinical outcome. The present study in 131cases of hemorrhagic stroke, the incidence of intrac-erebral hemorrhage, subarachnoid hemorrhage, intra-ventricular hemorrhage and subdural hemorrhage were84,30,13 and 4 cases, respectively. The present studyshows that the mean age of patients who have non-traumatic hemorrhagic stroke is 5th-6th decade of life.Incidence of hypertension risk factor was found 59.5%in intracerebral hemorrhage, 23.3% in subarachnoid
J Med Assoc Thai Vol. 92 No. 1 2009 83
hemorrhage, 53.9% in subdural hemorrhage and 75%in intraventricular hemorrhage, while 50% in subarach-noid hemorrhage caused by ruptured aneurysm.Hypertension is present in approximately 70% ofstroke cases. The risk of stroke rises in proportion toblood pressure, for males as well as for females(15,16).However, the present study shows that hypertensionis an associated risk factor in 67 patients out of 183patients (36%).
In the present study weakness and numbnesswas the major presenting symptom of the patients inICH group (38.8%). Headache at onset was the mostimportant clinical feature in subarachnoid hemorrhagefollowed by stiff neck: 50% commonly caused byruptured aneurysm. Ruptured aneurysm is suggestivewhen CT scan shows subarachnoid hemorrhage withhematoma located near the major branches of arteriesof the circle of Willis. Subdural hemorrhage presentheadache (36.4%) followed by weakness and vomitingin the same percent (18.2%), headache and vomitingmost presented in intraventricular hemorrhage. Thereis no limitation in evaluation of attenuation of acutehematoma in the presented patients because of theestimated time from stroke onset to first medicalcontact less than 24 hours in all types of hemorrhage.This is also an important factor for CT scan in evaluationof hemorrhagic stroke due to 93% sensitivity if the
scan time is within 48 hrs compared to 17%-58% ifCT scan performed beyond 48 hrs(22).
The level of consciousness on admission wasevaluated through the Glasglow Coma Scale (GCS).Level of consciousness is an important determinant ofoutcome in patients with hemorrhage as observed inthe present study found a high percent in GCS score13 to 15, 44% in intracerebral hemorrhage, 60% insubarachnoid hemorrhage, 54% in subdural hemorrhageand 50% in intraventricular hemorrhage. Patients werealready in coma when admitted (GCS score less than orequal to 8) shown in 33% in intracerebral hemorrhage,27% in subarachnoid hemorrhage, 15% in subduralhemorrhage and 25% in intraventricular hemorrhage.Low scores of GCS on admission were associated witha greater global and stroke-related mortality (p = 0.000).There is a choice of treatment, one is operative treatedand the other is conservative treated. In the presentstudy operative treated more than conservative treated(52% in intracerebral hemorrhage, 67% in subarachnoidhemorrhage, 85% in subdural hemorrhage and 50% inintraventricular hemorrhage.
During the present hospitalization 39patients died (29.8%). The highest incidence of deathwas found in intracerebral hemorrhage (35.7%) butthe incident in other type was 23.3% in subarachnoidhemorrhage, 15.4% in subdural hemorrhage. None ofintraventricular hemorrhage had died.
The mean duration of hospital stay in thepresent study was 17.7 days (range 1-218 days)resembled in Poungvarin et al, the mean total hospitalstay of stroke at the stroke unit in Siriraj Hospital was15.64 days, ranging from 1-120 days(21).
The use of CT has greatly facilitated the diag-nosis of hemorrhagic stroke and the differentiation ofintracerebral hemorrhage, subarachnoid hemorrhage,subdural hemorrhage and intraventricular hemorrhage.Thus, CT is for the most part was responsible for thehigh levels of interrater agreement in these strokesubtypes (in the present study, k = 0.861 for type ofhemorrhage and k = 0.866 for location of hemorrhage).In Wermer et al(20), studied the interobserver variationbetween three radiologists in classifying, fifty largehematoma on CT as deep or lobar. The kappa valueswere almost perfect, ranging from 0.88 to 0.96. The CTfinding of non-traumatic intracranial hemorrhageappears to be distinctive. This has allowed definitivediagnosis and precise anatomical delineation of thelesions. Thus, CT is for the most part responsible forthe high levels of inter-rater agreement in these strokesubtypes. In the present study the authors found
Chart. 7 The distribution of mass effect by outcome
84 J Med Assoc Thai Vol. 92 No. 1 2009
concordance between CT brain interpretation by twoneuroradiologist for the type of hemorrhagic strokewas very good, k = 0.861 and for location was k = 0.866.In Klaus et al(19) reported that Interobserver agreementis high (k = 0.96 for ICH and k = 0.82 for SAH) for majorstroke types as well as for categories of hemorrhagicstroke on the basis of review of medical records andresults of imaging data. The finding of hematomaformation at different sites is similar to Weisbergs’series. They found ganglionic-thalamic hemorrhagemost frequently involved (77% of cases) followedby lobar hematoma (15%). Cerebellar, brainstem andpure intraventricular hemorrhage are less common.Multiple intracerebral hemorrhaging occurred in 5 casesin the present series. In the present study found thebasal ganglia and thalamus are the most frequentsites of intracranial bleeding. 53 of 84 intracerebralhemorrhages (40%) affected this region. The mostfrequent cause of bleeding is vascular rupture, mostoften associated with hypertension. The relativeproportions of hematoma in lobar (14.5%), brainstem(3.8%), cerebellum (3.8%) and pure intraventricularhemorrhage (2.3%) are similar to those previouslyreported. The intracerebral hemorrhage (ICH) andsubarachnoid hemorrhage (SAH) often have pooroutcomes. Indeed, the most common hemorrhagicstrokes were ICH. ICH has the highest mortality andmorbidity rates of any stroke subtype. The comparisonof patients who died with those who survived revealedfive variables which were significant. In the statisticalanalyses, the authors used clinical data on the patients,including hospital length of stay, initial level ofconsciousness (GCS score) and CT findings data,including hematoma size, intraventricular extensionand mass effect. From the analyses, it was obviousthat the variables hospital length of stay, lower level ofconsciousness, large hematoma size and presence ofintraventricular hemorrhage extension were significantimportance, while the presence of mass effect (midlineshift and ventricle dilated (hydrocephalus) on CT scanhad no prognostic influence on outcome (survival ordeath).
ConclusionComputed tomography (CT) scan is the most
widely used imaging procedure to evaluate strokepatients. CT is by no means the only neuroradiologicexamination that has to be performed in patients withstroke, but it is safe, non-invasive creates a series ofcross-sectional images of the brain and can showevidence of bleeding into the brain almost immediately
after stroke symptoms appear. CT provides a sub-stantial amount of information, including the size andlocation of the hemorrhage and the presence of intra-ventricular, subarachnoid, or subdural blood.
The present study demonstrates that from alltype of hemorrhagic stroke, intracerebral hemorrhagethere remains a common and devastating clinicalproblem. A most risk factor were hypertension, but AVM,blood dyscrasia and unknown etiologies were the causeof non-hypertensive intracerebral hemorrhage, whileruptured aneurysm resulted in bleeding subarachnoidhemorrhage. CT findings by themselves can helppredict which patients are at high risk of short-termmortality and may require intensive treatment. Threevariables on CT imaging were identified as earlymortality predictors in patients where hematomavolume was more than 60 cm3 (p = 0.013), the presenceof intraventricular hemorrhage extension (p = 0.003)and mass effect were defined as the presence ofventricular shift across the midline and/or enlargementof contralateral ventricle. In the present study, therewas no mass effect association with clinical outcome(p = 0.067). Although the majority of hemorrhagicstrokes are visible on the computed tomographyscan, it necessitates finding a competent reader toappreciate the finding. The present study is notepidemiological in nature and results cannot be usedfor incidence calculations. Some limitations in thepresent study included retrospectives method anduncompleted medical records. This observationalsurvey from computed tomography diagnosed andlocalized hemorrhaging in hemorrhagic strokepatients. A prospective study with a larger sample sizeis suggested.
References1. Feigin VL, Lawes CM, Bennett DA, Anderson CS.
Stroke epidemiology: a review of population-basedstudies of incidence, prevalence, and case-fatalityin the late 20th century. Lancet Neurol 2003; 2:43-53.
2. Poungvarin N. Stroke in the developing world.Lancet 1998; 352 Suppl 3: SIII19-22.
3. Viriyavejakul A, Senanarong V, Prayoonwiwat N,Praditsuwan R, Chaisevikul R, Poungvarin N.Epidemiology of stroke in the elderly in Thailand.J Med Assoc Thai 1998; 81: 497-505.
4. Bamford J. Clinical examination in diagnosis andsubclassification of stroke. Lancet 1992; 339: 400-2.
5. Ricci S, Celani MG, La Rosa F, Vitali R, Duca E,Ferraguzzi R, et al. SEPIVAC: a community-based
J Med Assoc Thai Vol. 92 No. 1 2009 85
study of stroke incidence in Umbria, Italy. JNeurol Neurosurg Psychiatry 1991; 54: 695-8.
6. Kistler JP, Ropper AH, Martin JP. Cerebrovasculardiseases. In: Isselbacher KJ, Martin JP, BraunwaldE, Fauci AS, Wilson JD, Kasper DL, editors.Harrison’s principles of internal medicine. 13th ed.New York: McGraw-Hill; 1994: 2233-56.
7. Adams RD, Victor M, Ropper AH. Cerebrovascu-lar diseases. In: Adams RD, Victor M, RopperAH, editors. Principles of neurology. New York:McGraw-Hill; 1997: 777-873.
8. Bamford J, Sandercock P, Dennis M, Burn J,Warlow C. A prospective study of acute cerebro-vascular disease in the community: the OxfordshireCommunity Stroke Project - 1981-86. 2. Incidence,case fatality rates and overall outcome at one yearof cerebral infarction, primary intracerebral andsubarachnoid haemorrhage. J Neurol NeurosurgPsychiatry 1990; 53: 16-22.
9. Tomandl BF, Klotz E, Handschu R, Stemper B,Reinhardt F, Huk WJ, et al. Comprehensiveimaging of ischemic stroke with multisection CT.Radiographics 2003; 23: 565-92.
10. Wardlaw JM, Seymour J, Cairns J, Keir S, Lewis S,Sandercock P. Immediate computed tomographyscanning of acute stroke is cost-effective andimproves quality of life. Stroke 2004; 35: 2477-83.
11. Broderick JP, Adams HP Jr, Barsan W, FeinbergW, Feldmann E, Grotta J, et al. Guidelines forthe management of spontaneous intracerebralhemorrhage: A statement for healthcare pro-fessionals from a special writing group of theStroke Council, American Heart Association.Stroke 1999; 30: 905-15.
12. Caplan LR. Basic pathology, anatomy, andpathophysiology of stroke. In: Caplan LR, editor.Stroke: a clinical approach. Boston: ButterworthHeinemann. 1993: 23-66.
13. World Health Organization. The world healthreport 2002 - Reducing risks, promoting healthy
life [homepage on the Internet]. 2008 [cited 2008Oct 10]. Available from: http://www.who.int/whr/2002/en/
14. Collins R, MacMahon S. Blood pressure, anti-hypertensive drug treatment and the risks ofstroke and of coronary heart disease. Br Med Bull1994; 50: 272-98.
15. Keli S, Bloemberg B, Kromhout D. Predictive valueof repeated systolic blood pressure measurementsfor stroke risk. The Zutphen Study. Stroke 1992;23: 347-51.
16. Zeman RK, Silverman PM, Vieco PT, Costello P.CT angiography. AJR Am J Roentgenol 1995; 165:1079-88.
17. Kassell NF, Torner JC, Haley EC Jr, Jane JA, AdamsHP, Kongable GL. The International CooperativeStudy on the Timing of Aneurysm Surgery. Part 1:Overall management results. J Neurosurg 1990; 73:18-36.
18. Berger K, Kase CS, Buring JE. Interobserveragreement in the classification of stroke inthe physicians’ health study. Stroke 1996; 27:238-42.
19. Wermer MJ, Rinkel GJ, Van Rooij WJ, WitkampTD, Ziedses Des Plantes BG, Algra A. Inter-observer agreement in the assessment of lobarversus deep location of intracerebral haematomason CT. J Neuroradiol 2002; 29: 271-4.
20. Poungvarin N, Prayoonwiwat N, Senanarong V,Chaisevikul R, Danchaivijitr C, Nilanont Y. Sirirajacute stroke unit: the experience of 614 patients.Siriraj Hosp Gaz 2002; 54: 151-8.
21. Wardlaw JM, Keir SL, Seymour J, Lewis S,Sandercock PA, Dennis MS, et al. What is the bestimaging strategy for acute stroke? Health TechnolAssess 2004;8: iii, ix-iii, 1-180.
22. Kidwell CS, Chalela JA, Saver JL, Starkman S,Hill MD, Demchuk AM, et al. Comparison ofMRI and CT for detection of acute intracerebralhemorrhage. JAMA 2004; 292: 1823-30.
86 J Med Assoc Thai Vol. 92 No. 1 2009
ลักษณะการตรวจพบจากภาพเอกซเรย์คอมพิวเตอร์ในผู้ป่วยโรคหลอดเลือดสมองที่ทำให้เกิดเลือดออกในสมองท่ีไม่ได้มีสาเหตุจากอุบัติเหตุ
พิพัฒน์ เช่ียววิทย์, ณสุดา ด่านชัยวิจิตร, ยงชัย นิละนนท์, นิพนธ์ พวงวรินทร์
วัตถุประสงค์: เพื่อศึกษาลักษณะที่ตรวจพบจากภาพเอกซเรย์คอมพิวเตอร์, ความสัมพันธ์ของลักษณะที่พบกับผลลัพธ์ทางคลินิกและศึกษาความสอดคล้องในการแปลผลภาพเอกซเรย์คอมพิวเตอร์วัสดุและวิธีการ: โดยศึกษาในผู้ป่วยโรคหลอดเลือดสมองที่ทำให้เกิดเลือดออกในสมองและได้รับการตรวจด้วยเครื่องเอกซเรย์คอมพิวเตอร์ของโรงพยาบาลศิริราช ตั้งแต่เดือนมกราคม พ.ศ. 2547 ถึงเดือนธันวาคม พ.ศ. 2548จำนวน 131 รายผลการศกึษา: พบว่าโรคหลอดเลือดสมองที่เกิดเลือดออกในสมองส่วนใหญ่จะเป็นชนิด Intracerebral hemorrhage(ICH) ซ่ึงตำแหน่งท่ีพบมากท่ีสุดคือ thalamus และ basal ganglia พบ 53 ราย (40%) รองลงมาคือ lobar 19 ราย(14.5%), cerebellum 5 ราย (3.8%), brainstem 5 ราย (3.8%) และพบหลายตำแหน่ง 8 ราย (6.1%). ปัจจัย 2 ชนิดที่ได้จากภาพ CT คือ ก้อนเลือดขนาดใหญ่มากกว่า 60 ลูกบาศก์เซนติเมตร และการแตกของเลือดเข้าโพรงสมองมีความสัมพันธ์กับการเสียชีวิตของผู้ป่วยอย่างมีนัยสำคัญทางสถิติ (p < 0.05) ส่วนปัจจัย mass effect ไม่มีความสัมพันธ์กัน (p = 0.067) ความสอดคล้องในการแปลผลภาพเอกซเรย์คอมพิวเตอร์ นั้นมีค่าดีมาก K = 0.861สำหรับการแปลผล ชนิดของเลือดออกในสมอง และ K = 0.866 สำหรับการแปลผลตำแหน่งของก้อนเลือดสรุป: การตรวจด้วยเอกซเรย์คอมพิวเตอร์มีประโยชน์ในผู้ป่วยโรคหลอดเลือดสมองที่ทำให้เกิดเลือดออกในสมองและมีลักษณะสำคัญบางประการที่สามารถชี้นำให้เห็นว่าผู้ป่วยอาจมีภาวะอันตรายถึงแก่ชีวิตได้ซึ ่งช่วยในการพยากรณ์โรคได้