Computational Methods for Predicting Protein-Protein...
27
Computational Methods for Predicting Protein-Protein Interactions Using Various Protein Features Ziyun Ding 1 and Daisuke Kihara 1,2,3 1 Department of Biological Science, Purdue University, West Lafayette, Indiana 2 Department of Computer Science, Purdue University, West Lafayette, Indiana 3 Corresponding author: [email protected] Understanding protein-protein interactions (PPIs) in a cell is essential for learn- ing protein functions, pathways, and mechanism of diseases. PPIs are also im- portant targets for developing drugs. Experimental methods, both small-scale and large-scale, have identified PPIs in several model organisms. However, results cover only a part of PPIs of organisms; moreover, there are many organ- isms whose PPIs have not yet been investigated. To complement experimental methods, many computational methods have been developed that predict PPIs from various characteristics of proteins. Here we provide an overview of lit- erature reports to classify computational PPI prediction methods that consider different features of proteins, including protein sequence, genomes, protein structure, function, PPI network topology, and those which integrate multiple methods. C 2018 by John Wiley & Sons, Inc. Keywords: computational methods bioinformatics protein-protein interac- tions, PPI protein docking protein interaction network How to cite this article: Ding, Z., & Kihara, D. (2018). Computational methods for predicting protein-protein interactions using various protein features. Current Protocols in Protein Science, e62. doi: 10.1002/cpps.62 INTRODUCTION Identification of protein-protein interactions (PPIs) is important for understanding how proteins work together in a coordinated fashion in a cell to perform cellular functions. PPIs are essential for protein function, various cellular pathways, and development of diseases. PPIs are also important targets for drug design. Understanding how proteins interact can also lead to artificial design of protein interactions. Individual PPIs are determined by experiments, such as co-immunoprecipitation (A. Guo et al., 2005), fluorescence resonance energy transfer (Kenworthy, 2001), and surface plasmon resonance (Nikolovska-Coleska, 2015). Ultimately, biophysical meth- ods, such as nuclear magnetic resonance spectroscopy (NMR; Vinogradova & Qin, 2011; Zuiderweg, 2002), X-ray crystallography (Kobe et al., 2008), and electron microscopy (Dudkina, Kouˇ ril, Bultema, & Boekema, 2010), solve the tertiary structure of protein complexes, which can provide detailed atomic information about how the proteins in- teract. Moreover, from the mid 1990’s, PPIs were determined on a large-scale using the yeast-two-hybrid system (Fields & Sternglanz, 1994; Rajagopala et al., 2014; Rual et al., 2005; Walhout, Boulton, & Vidal, 2000), and affinity chromatography combined with mass spectrometry (Boeri Erba & Petosa, 2015; Dunham, Mullin, & Gingras, 2012; Current Protocols in Protein Science e62 Published in Wiley Online Library (wileyonlinelibrary.com). doi: 10.1002/cpps.62 C 2018 John Wiley & Sons, Inc. Ding and Kihara 1 of 27
Transcript of Computational Methods for Predicting Protein-Protein...
Computational Methods for PredictingProtein-Protein Interactions UsingVarious Protein FeaturesZiyun Ding1 and Daisuke Kihara1,2,3
1Department of Biological Science, Purdue University, West Lafayette, Indiana2Department of Computer Science, Purdue University, West Lafayette, Indiana3Corresponding author: [email protected]
Understanding protein-protein interactions (PPIs) in a cell is essential for learn-ing protein functions, pathways, and mechanism of diseases. PPIs are also im-portant targets for developing drugs. Experimental methods, both small-scaleand large-scale, have identified PPIs in several model organisms. However,results cover only a part of PPIs of organisms; moreover, there are many organ-isms whose PPIs have not yet been investigated. To complement experimentalmethods, many computational methods have been developed that predict PPIsfrom various characteristics of proteins. Here we provide an overview of lit-erature reports to classify computational PPI prediction methods that considerdifferent features of proteins, including protein sequence, genomes, proteinstructure, function, PPI network topology, and those which integrate multiplemethods. C© 2018 by John Wiley & Sons, Inc.
Keywords: computational methods � bioinformatics � protein-protein interac-tions, PPI � protein docking � protein interaction network
How to cite this article:Ding, Z., & Kihara, D. (2018). Computational methods forpredicting protein-protein interactions using various protein
features. Current Protocols in Protein Science, e62. doi:10.1002/cpps.62
INTRODUCTION
Identification of protein-protein interactions (PPIs) is important for understanding howproteins work together in a coordinated fashion in a cell to perform cellular functions.PPIs are essential for protein function, various cellular pathways, and development ofdiseases. PPIs are also important targets for drug design. Understanding how proteinsinteract can also lead to artificial design of protein interactions.
Individual PPIs are determined by experiments, such as co-immunoprecipitation(A. Guo et al., 2005), fluorescence resonance energy transfer (Kenworthy, 2001), andsurface plasmon resonance (Nikolovska-Coleska, 2015). Ultimately, biophysical meth-ods, such as nuclear magnetic resonance spectroscopy (NMR; Vinogradova & Qin, 2011;Zuiderweg, 2002), X-ray crystallography (Kobe et al., 2008), and electron microscopy(Dudkina, Kouril, Bultema, & Boekema, 2010), solve the tertiary structure of proteincomplexes, which can provide detailed atomic information about how the proteins in-teract. Moreover, from the mid 1990’s, PPIs were determined on a large-scale usingthe yeast-two-hybrid system (Fields & Sternglanz, 1994; Rajagopala et al., 2014; Rualet al., 2005; Walhout, Boulton, & Vidal, 2000), and affinity chromatography combinedwith mass spectrometry (Boeri Erba & Petosa, 2015; Dunham, Mullin, & Gingras, 2012;
Current Protocols in Protein Science e62Published in Wiley Online Library (wileyonlinelibrary.com).doi: 10.1002/cpps.62C© 2018 John Wiley & Sons, Inc.
Ding and Kihara
1 of 27
Guruharsha et al., 2011; Morris et al., 2014). However, experimental methods have severalshortcomings for detecting PPIs. First, these experimental methods are time consumingand labor intensive. Second, the applicability of experimental methods depends on howeffectively assay protocols are established in target organisms. Also, a method may notwork on some classes of proteins (Piehler, 2005; Rao, Srinivas, Sujini, & Kumar, 2014).Third, it is known that experimental methods often have difficulty with identifying weakinteractions, and leave out many transient interactions (Wetie et al., 2013). Fourth, it hasbeen mentioned that results of large-scale methods often have substantial disagreementwith each other, which may be partly due to false positives and false negatives (Gingras,Gstaiger, Raught, & Aebersold, 2007; Huang & Bader, 2009; Serebriiskii & Golemis,2001).
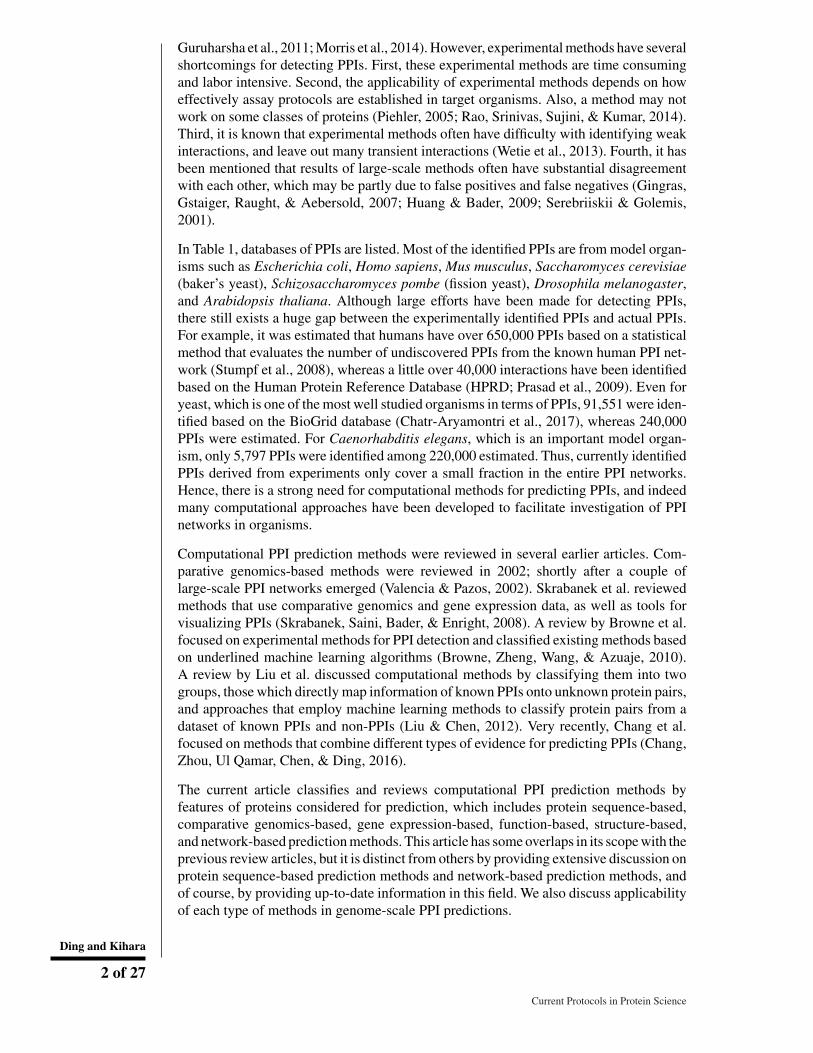
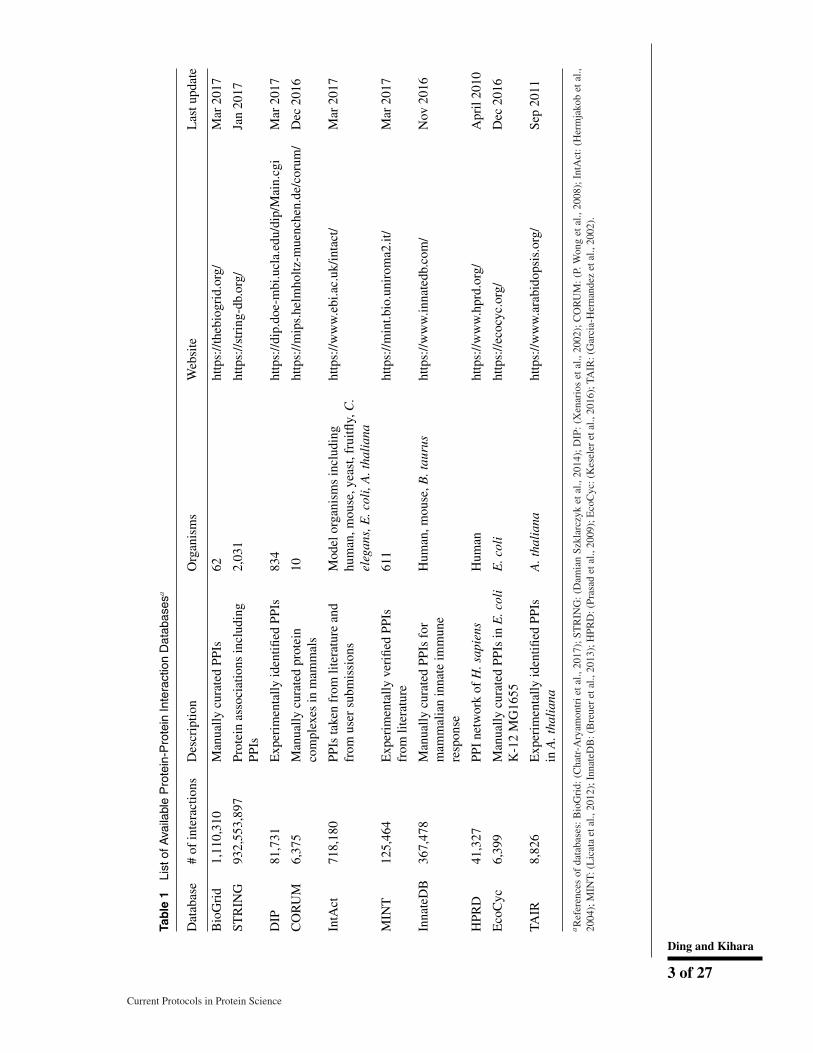
In Table 1, databases of PPIs are listed. Most of the identified PPIs are from model organ-isms such as Escherichia coli, Homo sapiens, Mus musculus, Saccharomyces cerevisiae(baker’s yeast), Schizosaccharomyces pombe (fission yeast), Drosophila melanogaster,and Arabidopsis thaliana. Although large efforts have been made for detecting PPIs,there still exists a huge gap between the experimentally identified PPIs and actual PPIs.For example, it was estimated that humans have over 650,000 PPIs based on a statisticalmethod that evaluates the number of undiscovered PPIs from the known human PPI net-work (Stumpf et al., 2008), whereas a little over 40,000 interactions have been identifiedbased on the Human Protein Reference Database (HPRD; Prasad et al., 2009). Even foryeast, which is one of the most well studied organisms in terms of PPIs, 91,551 were iden-tified based on the BioGrid database (Chatr-Aryamontri et al., 2017), whereas 240,000PPIs were estimated. For Caenorhabditis elegans, which is an important model organ-ism, only 5,797 PPIs were identified among 220,000 estimated. Thus, currently identifiedPPIs derived from experiments only cover a small fraction in the entire PPI networks.Hence, there is a strong need for computational methods for predicting PPIs, and indeedmany computational approaches have been developed to facilitate investigation of PPInetworks in organisms.
Computational PPI prediction methods were reviewed in several earlier articles. Com-parative genomics-based methods were reviewed in 2002; shortly after a couple oflarge-scale PPI networks emerged (Valencia & Pazos, 2002). Skrabanek et al. reviewedmethods that use comparative genomics and gene expression data, as well as tools forvisualizing PPIs (Skrabanek, Saini, Bader, & Enright, 2008). A review by Browne et al.focused on experimental methods for PPI detection and classified existing methods basedon underlined machine learning algorithms (Browne, Zheng, Wang, & Azuaje, 2010).A review by Liu et al. discussed computational methods by classifying them into twogroups, those which directly map information of known PPIs onto unknown protein pairs,and approaches that employ machine learning methods to classify protein pairs from adataset of known PPIs and non-PPIs (Liu & Chen, 2012). Very recently, Chang et al.focused on methods that combine different types of evidence for predicting PPIs (Chang,Zhou, Ul Qamar, Chen, & Ding, 2016).
The current article classifies and reviews computational PPI prediction methods byfeatures of proteins considered for prediction, which includes protein sequence-based,comparative genomics-based, gene expression-based, function-based, structure-based,and network-based prediction methods. This article has some overlaps in its scope with theprevious review articles, but it is distinct from others by providing extensive discussion onprotein sequence-based prediction methods and network-based prediction methods, andof course, by providing up-to-date information in this field. We also discuss applicabilityof each type of methods in genome-scale PPI predictions.
Ding and Kihara
2 of 27
Current Protocols in Protein Science
Tab
le1
List
ofA
vaila
ble
Pro
tein
-Pro
tein
Inte
ract
ion
Dat
abas
esa
Dat
abas
e#
ofin
tera
ctio
nsD
escr
iptio
nO
rgan
ism
sW
ebsi
teL
astu
pdat
e
Bio
Gri
d1,
110,
310
Man
ually
cura
ted
PPIs
62ht
tps:
//the
biog
rid.
org/
Mar
2017
STR
ING
932,
553,
897
Prot
ein
asso
ciat
ions
incl
udin
gPP
Is2,
031
http
s://s
trin
g-db
.org
/Ja
n20
17
DIP
81,7
31E
xper
imen
tally
iden
tified
PPIs
834
http
s://d
ip.d
oe-m
bi.u
cla.
edu/
dip/
Mai
n.cg
iM
ar20
17
CO
RU
M6,
375
Man
ually
cura
ted
prot
ein
com
plex
esin
mam
mal
s10
http
s://m
ips.
helm
holtz
-mue
nche
n.de
/cor
um/
Dec
2016
IntA
ct71
8,18
0PP
Ista
ken
from
liter
atur
ean
dfr
omus
ersu
bmis
sion
sM
odel
orga
nism
sin
clud
ing
hum
an,m
ouse
,yea
st,f
ruitfl
y,C
.el
egan
s,E
.col
i,A
.tha
lian
a
http
s://w
ww
.ebi
.ac.
uk/in
tact
/M
ar20
17
MIN
T12
5,46
4E
xper
imen
tally
veri
fied
PPIs
from
liter
atur
e61
1ht
tps:
//min
t.bio
.uni
rom
a2.it
/M
ar20
17
Inna
teD
B36
7,47
8M
anua
llycu
rate
dPP
Isfo
rm
amm
alia
nin
nate
imm
une
resp
onse
Hum
an,m
ouse
,B.t
auru
sht
tps:
//ww
w.in
nate
db.c
om/
Nov
2016
HPR
D41
,327
PPI
netw
ork
ofH
.sap
iens
Hum
anht
tps:
//ww
w.h
prd.
org/
Apr
il20
10
Eco
Cyc
6,39
9M
anua
llycu
rate
dPP
Isin
E.c
oli
K-1
2M
G16
55E
.col
iht
tps:
//eco
cyc.
org/
Dec
2016
TAIR
8,82
6E
xper
imen
tally
iden
tified
PPIs
inA
.tha
lian
aA
.tha
lian
aht
tps:
//ww
w.a
rabi
dops
is.o
rg/
Sep
2011
aR
efer
ence
sof
data
base
s:B
ioG
rid:
(Cha
tr-A
ryam
ontr
ieta
l.,20
17);
STR
ING
:(D
amia
nSz
klar
czyk
etal
.,20
14);
DIP
:(X
enar
ios
etal
.,20
02);
CO
RU
M:(
P.W
ong
etal
.,20
08);
IntA
ct:(
Her
mja
kob
etal
.,20
04);
MIN
T:(
Lic
ata
etal
.,20
12);
Inna
teD
B:(
Bre
uer
etal
.,20
13);
HPR
D:(
Pras
adet
al.,
2009
);E
coC
yc:(
Kes
eler
etal
.,20
16);
TAIR
:(G
arci
a-H
erna
ndez
etal
.,20
02).
Ding and Kihara
3 of 27
Current Protocols in Protein Science
PPI PREDICTION METHODS
We classified PPI prediction methods into six large categories based on features ofproteins considered as input information of the prediction. Below we discuss ideasbehind methods that fall into each category. Most of the categories are further classifiedinto sub-categories.
To develop a computational prediction method, one needs a dataset of known interactingprotein pairs (a positive set) and a dataset of non-interacting protein pairs (a negativeset), because the method needs to maximize its ability to distinguish between positiveand negative datasets. A positive dataset is constructed from known PPIs stored inexisting PPI databases (Table 1). On the other hand, constructing a negative datasetis not straightforward, because there are only few collections of protein pairs that areexperimentally directly verified not to interact. To facilitate construction of a negativedataset, there is a database named Negatome, which collects protein pairs that are unlikelyto interact by manual curation of literature and known protein complex structures (Blohmet al., 2014). Another commonly used strategy to construct a negative dataset is to pairproteins from different cellular locations and a random pairing of proteins that appearedin the positive dataset excluding interacting pairs.
SEQUENCE-BASED METHODS
Many methods have been developed that use the amino acid sequence information oftarget proteins. The obvious advantage of using sequence information is that it is availablefor all proteins in an organism as long as its genome sequence is available.
Motif/Domain-Based Approach
The most straightforward approach in this category is to predict that two proteins interactwith each other if they possess known sequence patterns of interacting proteins in theiramino acid sequences. For example, Becerra et al. predicted PPIs between human im-munodeficiency virus 1 (HIV-1) and human cells by detecting sequence motifs of proteininteracting regions that have disordered structures (Becerra, Bucheli, & Moreno, 2017).Sequence patterns of known functional regions including PPI sites, which are calledmotifs or domains depending on the sequence length, are stored in public databases,such as the Eukaryotic Linear Motif (ELM) resource (Dinkel et al., 2012), InterPro (Finnet al., 2017), PROSITE (Sigrist et al., 2010), PRINTS (Attwood et al., 2012), Pfam (Finnet al., 2016), and ProDom (Bru et al., 2005; Corpet, Gouzy, & Kahn, 1998).
Instead of detecting specific motifs that are known as protein interaction sites, Sprinzakand Margalit computed the log-odds score of observing two motifs from the InterProdatabase in known interacting yeast protein pairs (Sprinzak & Margalit, 2001). The log-odds value was computed as log2(Pi j/Pi Pj ), where Pi j is the observed frequency ofmotif pair (i,j) observed in interacting proteins, and Pi and Pj are the frequencies ofmotif i and j in the data, respectively. If a query protein pair contains at least one motifpair that has a log-odds value above a threshold, they are predicted as interacting. Later,essentially the same approach was taken to count motif pairs in interacting proteins in theDatabase of Interacting Proteins (DIP; Kim, Park, & Suh, 2002). Above methods consideronly a single motif pair from each protein pair. Chen and Liu extended the methods byconsidering contributions of all the possible pairs of 4293 Pfam domain combinations(Chen & Liu, 2005). Each protein pair was represented with a 4293-dimensional vectorwith 0 indicating absence of a domain in either of the proteins, 1 indicating one of theproteins contains the domain, and 2 indicating presence of the domain in both proteins.Then protein pairs are predicted to interact or not to interact by classifying its featurevector using a machine learning method, random forest, which makes a prediction byvoting from many decision trees.Ding and Kihara
4 of 27
Current Protocols in Protein Science
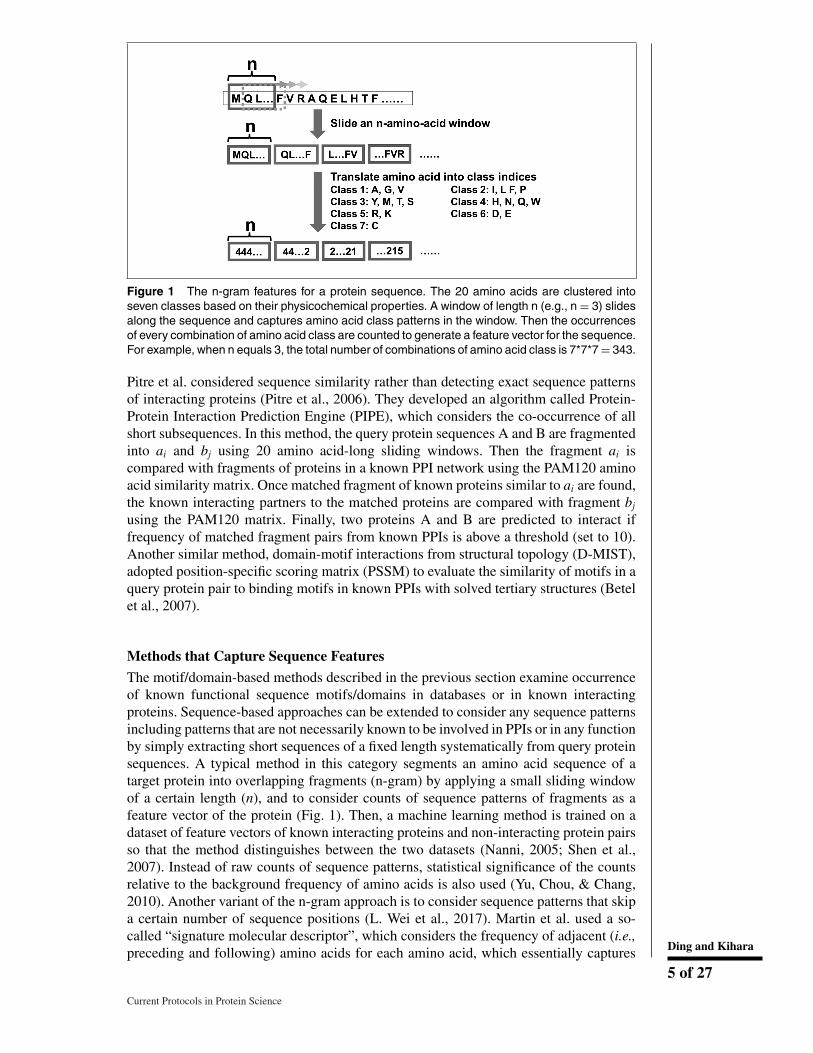
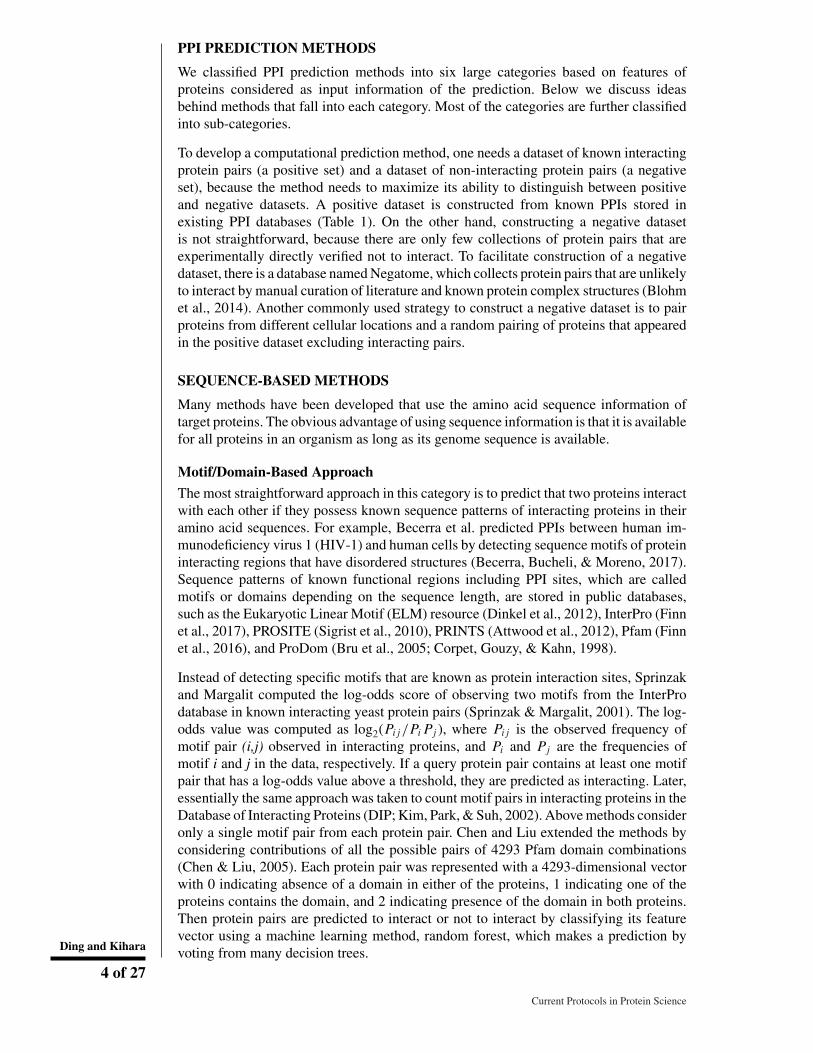
Figure 1 The n-gram features for a protein sequence. The 20 amino acids are clustered intoseven classes based on their physicochemical properties. A window of length n (e.g., n = 3) slidesalong the sequence and captures amino acid class patterns in the window. Then the occurrencesof every combination of amino acid class are counted to generate a feature vector for the sequence.For example, when n equals 3, the total number of combinations of amino acid class is 7*7*7 = 343.
Pitre et al. considered sequence similarity rather than detecting exact sequence patternsof interacting proteins (Pitre et al., 2006). They developed an algorithm called Protein-Protein Interaction Prediction Engine (PIPE), which considers the co-occurrence of allshort subsequences. In this method, the query protein sequences A and B are fragmentedinto ai and bj using 20 amino acid-long sliding windows. Then the fragment ai iscompared with fragments of proteins in a known PPI network using the PAM120 aminoacid similarity matrix. Once matched fragment of known proteins similar to ai are found,the known interacting partners to the matched proteins are compared with fragment bj
using the PAM120 matrix. Finally, two proteins A and B are predicted to interact iffrequency of matched fragment pairs from known PPIs is above a threshold (set to 10).Another similar method, domain-motif interactions from structural topology (D-MIST),adopted position-specific scoring matrix (PSSM) to evaluate the similarity of motifs in aquery protein pair to binding motifs in known PPIs with solved tertiary structures (Betelet al., 2007).
Methods that Capture Sequence Features
The motif/domain-based methods described in the previous section examine occurrenceof known functional sequence motifs/domains in databases or in known interactingproteins. Sequence-based approaches can be extended to consider any sequence patternsincluding patterns that are not necessarily known to be involved in PPIs or in any functionby simply extracting short sequences of a fixed length systematically from query proteinsequences. A typical method in this category segments an amino acid sequence of atarget protein into overlapping fragments (n-gram) by applying a small sliding windowof a certain length (n), and to consider counts of sequence patterns of fragments as afeature vector of the protein (Fig. 1). Then, a machine learning method is trained on adataset of feature vectors of known interacting proteins and non-interacting protein pairsso that the method distinguishes between the two datasets (Nanni, 2005; Shen et al.,2007). Instead of raw counts of sequence patterns, statistical significance of the countsrelative to the background frequency of amino acids is also used (Yu, Chou, & Chang,2010). Another variant of the n-gram approach is to consider sequence patterns that skipa certain number of sequence positions (L. Wei et al., 2017). Martin et al. used a so-called “signature molecular descriptor”, which considers the frequency of adjacent (i.e.,preceding and following) amino acids for each amino acid, which essentially captures Ding and Kihara
5 of 27
Current Protocols in Protein Science
sequence patterns of 3-grams (Martin, Roe, & Faulon, 2005). Ding et al. considered bothmultivariate mutual information of 3-gram and mutual information of 2-gram, i.e.,
I (a, b, c) = I (a, b) − I (a, b|c) ,
Equation 1
where I (a,b,c) is the multivariate mutual information of 3-gram, I(a,b) is the mutualinformation of 2-gram, a, b, c are amino acid classes, and I(a,b|c) denotes the conditionalmutual information of a and b given that c exists in the 3-gram (Ding, Tang, & Guo,2016). Wong et al. considered amino acid pairs (including non-adjacent pairs) in a proteinsequence and represented it as an n*n matrix (n: the length of the protein), where eachelement is the sum of hydrophobicity value of every combination of two amino acidsin the sequence (Wong, You, Li, Huang, & Liu, 2015). PSSM was used to represent aprotein sequence, which considers similarity of 19 other amino acids at each position ofa sequence (An et al., 2016). Using PSSM, 2-gram was represented as a 400-dimensionalvector (= 20*20), which was subject to the dimension reduction to 350 vectors.
The number of sequence combinations of n-grams is quite large, for example, thereare 20*20*20 = 8000 combinations for 3-grams for protein sequences that consist of20 different amino acids. A large number of combinations will generate unnecessarilylong feature vectors for proteins and will causes a data sparseness problem when somesequence patterns are not well sampled. Therefore, for computing n-grams, it is commonto reduce the number of letters in sequences by clustering amino acids into a smallernumber of groups. Shen et al. classified amino acids to seven classes considering theirpolarity and volume (Shen et al., 2007), and several later papers used the classification.
Besides using n-grams and its variants, there are several other ideas for capturing sequencepatterns that were used for PPI prediction. To capture general characteristics of a proteinsequence, a combination of three sequence features called the local descriptor was used(Fig. 2; You, Chan, & Hu, 2015; Yang, Xia, & Gui, 2010; Zhou, Gao, & Zheng, 2011;You, Lei, Zhu, Xia, & Wang, 2013). The features are the composition of amino acids,transition probabilities between two consecutive amino acids, and a feature called thedistribution. The distribution describes the lengths of sequences from the N-terminus thatcontain the first 25%, 50%, 75%, and 100% of each amino acid (class) over the sequence(Dubchak, Muchnik, Holbrook, & Kim, 1995).
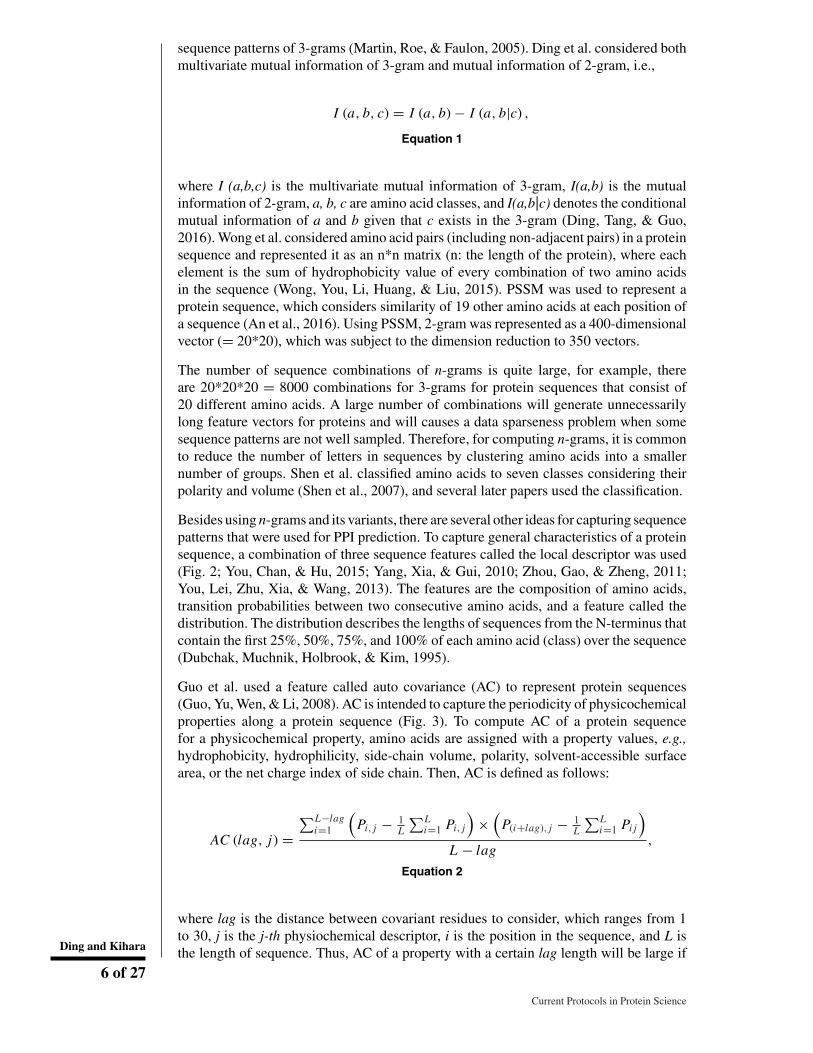
Guo et al. used a feature called auto covariance (AC) to represent protein sequences(Guo, Yu, Wen, & Li, 2008). AC is intended to capture the periodicity of physicochemicalproperties along a protein sequence (Fig. 3). To compute AC of a protein sequencefor a physicochemical property, amino acids are assigned with a property values, e.g.,hydrophobicity, hydrophilicity, side-chain volume, polarity, solvent-accessible surfacearea, or the net charge index of side chain. Then, AC is defined as follows:
AC (lag, j) =∑L−lag
i=1
(Pi, j − 1
L
∑Li=1 Pi, j
)×
(P(i+lag), j − 1
L
∑Li=1 Pi j
)
L − lag,
Equation 2
where lag is the distance between covariant residues to consider, which ranges from 1to 30, j is the j-th physiochemical descriptor, i is the position in the sequence, and L isthe length of sequence. Thus, AC of a property with a certain lag length will be large ifDing and Kihara
6 of 27
Current Protocols in Protein Science
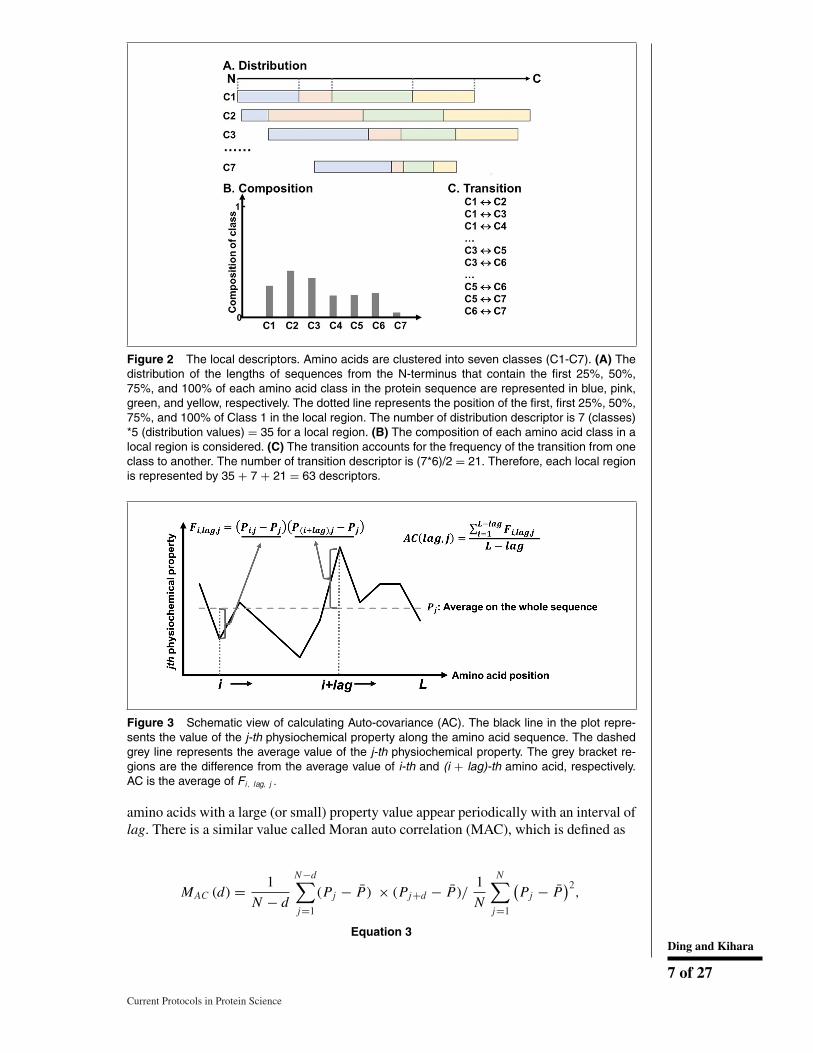
Figure 2 The local descriptors. Amino acids are clustered into seven classes (C1-C7). (A) Thedistribution of the lengths of sequences from the N-terminus that contain the first 25%, 50%,75%, and 100% of each amino acid class in the protein sequence are represented in blue, pink,green, and yellow, respectively. The dotted line represents the position of the first, first 25%, 50%,75%, and 100% of Class 1 in the local region. The number of distribution descriptor is 7 (classes)*5 (distribution values) = 35 for a local region. (B) The composition of each amino acid class in alocal region is considered. (C) The transition accounts for the frequency of the transition from oneclass to another. The number of transition descriptor is (7*6)/2 = 21. Therefore, each local regionis represented by 35 + 7 + 21 = 63 descriptors.
Figure 3 Schematic view of calculating Auto-covariance (AC). The black line in the plot repre-sents the value of the j-th physiochemical property along the amino acid sequence. The dashedgrey line represents the average value of the j-th physiochemical property. The grey bracket re-gions are the difference from the average value of i-th and (i + lag)-th amino acid, respectively.AC is the average of Fi, lag, j .
amino acids with a large (or small) property value appear periodically with an interval oflag. There is a similar value called Moran auto correlation (MAC), which is defined as
MAC (d) = 1
N − d
N−d∑j=1
(Pj − P) × (Pj+d − P)/1
N
N∑j=1
(Pj − P
)2,
Equation 3Ding and Kihara
7 of 27
Current Protocols in Protein Science
where d is the distance between covariant residues, which ranges from 1 to 30, Pj andPj+d are the physiochemical property of j-th and (j+d)-th amino acid, respectively, N
is the length of the protein sequence, P =∑N
j=1 Pj
N is the average value of the phys-iochemical property (You et al., 2013). Thus, MAC is AC divided by variance of thephysiochemical property, 1
N
∑Nj=1 (Pj − P)2.
The intention behind computing the local descriptor, AC, and MAC is to capture global,long range sequence features of proteins, in contrast to n-gram and its variants, whichcaptures local patterns of sequences. As these features are complementary to each other,often both types were combined (Ding et al., 2016). For example, in the method byYou et al., there were four components in the protein sequence feature representation(You et al., 2013). First, 3-grams, where amino acids were classified to seven classesand the frequency of 3-grams was considered as a feature of a protein; thus, a proteinpair is represented by a vector of 686 (= 2*7*7*7) features. Second, AC, with sixphysicochemical properties of amino acids being considered (hydrophobicity, side-chainvolume, polarity, polarizability, solvent-accessible surface area, and the net charge ofthe side chains). For each of the properties, AC was computed using 1 to 30 lag valuesfollowing Eq. 2; thus, the length of the vector for a protein pair was 360 (= 2*6*30).Third, MAC, where, similar to AC, a 360-dimension vector was constructed for a proteinpair. Fourth, local descriptors, where amino acids were classified to seven classes andthe local descriptor, the composition, the transition, and the distribution, were computedfor each of the seven amino acid classes for ten local regions in a protein. Thus, a pair ofproteins were represented by a vector of 1260 = 2* 10* (7 compositions + 21 transitions+ 35 distributions) values. Overall, considering all four features, a protein pair wasrepresented by a vector of 2666 (= 686 + 360 + 360 + 1260) features.
With these sequence features, predictions of PPIs were made using various machinelearning algorithms. Algorithms used include support vector machine (SVM; Bock &Gough, 2001; Y. Guo et al., 2008; X. Liu et al., 2012; Martin et al., 2005; Shen et al.,2007; Y. Z. Zhou et al., 2011), relevance vector machine (An et al., 2016), randomforest (X.-W. Chen & Liu, 2005; Ding et al., 2016; You et al., 2015), rotation forest(L. Wong et al., 2015), linear discriminant classifier and cloud points (Nanni, 2005),relaxed variable kernel density estimator (RVKDE; C.-Y. Yu et al., 2010), an ensembleclassifier (L. Wei et al., 2017), extreme learning machine (ELM; You et al., 2013), andk-nearest neighbors (KNNs; Yang et al., 2010).
These sequence-based methods reported surprisingly high accuracies. For example, Shenet al., reported 83.90% accuracy on the HPRD dataset (Prasad et al., 2009; Shen et al.,2007). Yang et al. reported 86.15% accuracy on a yeast dataset (Yang et al., 2010). Yuet al. achieved 93.7% accuracy on a highly unbalanced HPRD dataset where positive-to-negative ratio was 1:15 (C.-Y. Yu et al., 2010). Zhu et al. reported over a 75% accuracy onfive organisms including yeast, C. elegans, E. coli, human, and mouse (Y. Z. Zhou et al.,2011). Wong et al. achieved 93.92% on the S. cerevisiae dataset (L. Wong et al., 2015).You et al. achieved 93.46% to 97.01% accuracy on six different organisms includingyeast, Helicobacter pylori, C. elegans, E. coli, human, and mouse (You et al., 2015).Ding et al. achieved 95.01% on the yeast dataset and 87.59% on the H. pylori dataset(Ding et al., 2016). An et al. achieved 94.57% and 90.57% on the S. cerevisiae and theH. pylori dataset, respectively; also, a 97.15% accuracy on an imbalanced yeast dataset(An et al., 2016). Wei showed over 81% accuracy using different features on the Negatomeand the DIP dataset (Blohm et al., 2014; L. Wei et al., 2017; Xenarios et al., 2002).Although the reported accuracy values are high and encouraging, it needs to be notedthat the datasets on which the methods are tested are limited to several organisms.
Ding and Kihara
8 of 27
Current Protocols in Protein Science
Using homology
So far, we have reviewed methods that use partial sequence patterns and statistical fea-tures in protein sequences. In this section, we introduce methods that use the similarityof entire protein sequences. Many functionally important proteins in an organism areconserved across species, which is the rationale of sequence similarity search for anno-tating function of genes (Chitale, Hawkins, Park, & Kihara, 2009; T. Hawkins, Chitale,Luban, & Kihara, 2009; Troy Hawkins & Kihara, 2007). Several databases, such as KyotoEncyclopedia of Genes and Genomes (KEGG) Orthology (Tanabe & Kanehisa, 2012),OrthoDB (Waterhouse, Tegenfeldt, Li, Zdobnov, & Kriventseva, 2013), OrthoMCL-DB(F. Chen, Mackey, Stoeckert, & Roos, 2006), HomoloGene (NCBI, 2016), and INPARA-NOID (Sonnhammer & Ostlund, 2015), contain lists of precomputed homologous genesin different species. As interactions with other proteins is a part of a protein’s function,it is known that PPIs are often conserved across species. These conserved interactionsare noted as “interlogs” (Walhout et al., 2000). Matthew et al. mapped PPIs in the yeastinteraction map to predict PPIs in C. elegans, and identified 257 potential interlogs(Matthews et al., 2001). Further experimental validation performed on 72 predicted in-teractions gave 19 positive results, which were roughly 25% among tested. The POINTweb service provides human PPIs inferred from interlogs with mouse, fruitfly, yeast,and C. elegans (T.-W. Huang et al., 2004). Taking advantage of an increasing number ofexperimentally identified protein interactions, Lee et al. then expanded orthologous pairsto consider those from 18 eukaryotic species (Lee et al., 2008). The idea of interlogs wasalso applied to predict PPIs in the plant, A. thaliana, by considering homologs with yeast,fruitfly, human, and C. elegans (Geisler-Lee et al., 2007; De Bodt, Proost, Vandepoele,Rouze, & Van de Peer, 2009) and to a second plant, Oryza sativa (Asian rice), by consid-ering interlogs with the six species including the same four species with E. coli and A.thaliana (Gu, Zhu, Jiao, Meng, & Chen, 2011). Dutkowski et al. developed a statisticalmodel, which represents specification and duplication events of genes along an evolution-ary tree, on which known interacting protein pairs in seven eukaryotic organisms weremapped and used for predicting PPIs (Dutkowski & Tiuryn, 2009). Interactome3D is adatabase that provides the tertiary structure models of protein complexes built based onknown structure information of interlogs (Mosca, Pons, Ceol, Valencia, & Aloy, 2013).Wang et al. merged prediction results from an interlog-based method and a motif-basedmethod to cover a larger number of predicted PPIs in the pig proteome (Wang et al.,2012).
Codon usage
Interestingly, it was shown that the codon usage of genes can be used to predict PPIs.Using the difference of codon usage of protein pairs, Najafabadi et al. predicted PPIs inE. coli, yeast, and Plasmodium falciparum with reasonably good accuracy (Najafabadi& Salavati, 2008). For a pair of genes i and j the difference in usage of codon c among64 codons is simply defined as
di j (c) = ∣∣ fi (c) − f j (c)∣∣
Equation 4
where fi(c) is the usage of codon c of gene i. Then, dij of each codon is binned into50 intervals, and the likelihood ratio of the fraction in interacting and non-interactingproteins in a training dataset was computed. A PPI prediction for a protein pair isperformed with a naıve Bayes approach using the likelihood ratio. Zhou et al. usedSVM with the codon usage difference and applied to the yeast genome (Zhou, Zhou, He,Song, & Zhang, 2012). One may wonder why codon usage is related to PPIs. But it is Ding and Kihara
9 of 27
Current Protocols in Protein Science
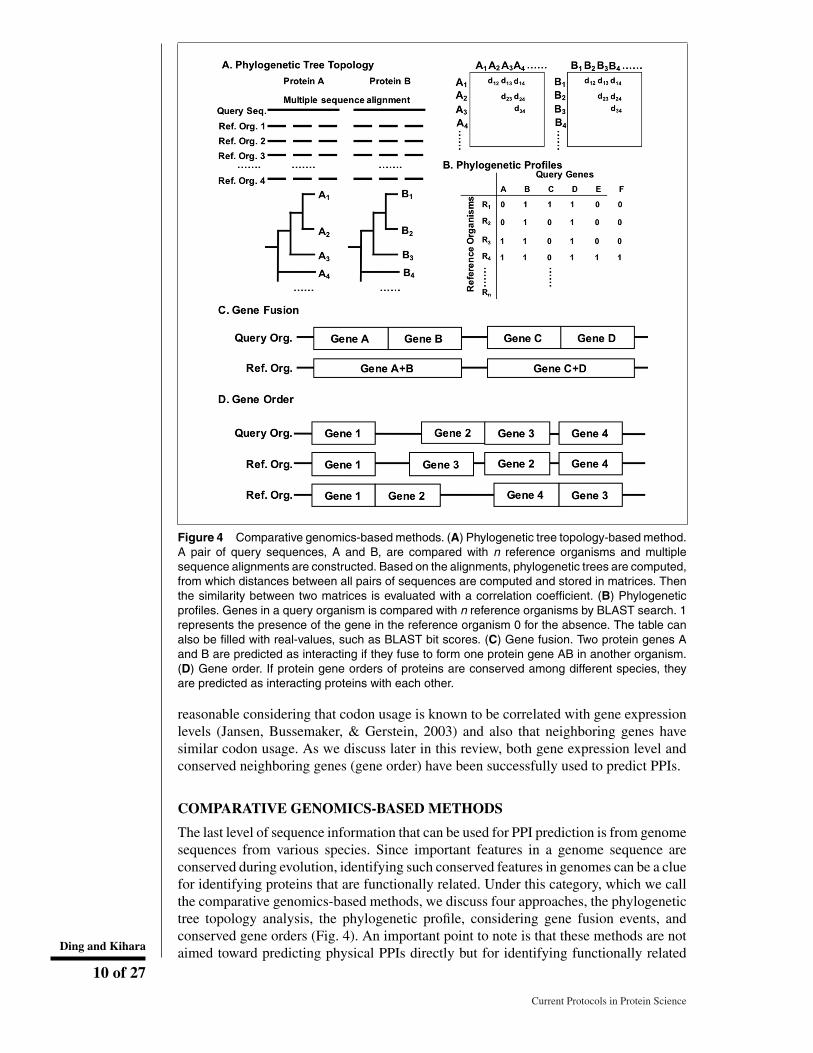
Figure 4 Comparative genomics-based methods. (A) Phylogenetic tree topology-based method.A pair of query sequences, A and B, are compared with n reference organisms and multiplesequence alignments are constructed. Based on the alignments, phylogenetic trees are computed,from which distances between all pairs of sequences are computed and stored in matrices. Thenthe similarity between two matrices is evaluated with a correlation coefficient. (B) Phylogeneticprofiles. Genes in a query organism is compared with n reference organisms by BLAST search. 1represents the presence of the gene in the reference organism 0 for the absence. The table canalso be filled with real-values, such as BLAST bit scores. (C) Gene fusion. Two protein genes Aand B are predicted as interacting if they fuse to form one protein gene AB in another organism.(D) Gene order. If protein gene orders of proteins are conserved among different species, theyare predicted as interacting proteins with each other.
reasonable considering that codon usage is known to be correlated with gene expressionlevels (Jansen, Bussemaker, & Gerstein, 2003) and also that neighboring genes havesimilar codon usage. As we discuss later in this review, both gene expression level andconserved neighboring genes (gene order) have been successfully used to predict PPIs.
COMPARATIVE GENOMICS-BASED METHODS
The last level of sequence information that can be used for PPI prediction is from genomesequences from various species. Since important features in a genome sequence areconserved during evolution, identifying such conserved features in genomes can be a cluefor identifying proteins that are functionally related. Under this category, which we callthe comparative genomics-based methods, we discuss four approaches, the phylogenetictree topology analysis, the phylogenetic profile, considering gene fusion events, andconserved gene orders (Fig. 4). An important point to note is that these methods are notaimed toward predicting physical PPIs directly but for identifying functionally relatedDing and Kihara
10 of 27
Current Protocols in Protein Science
proteins. Quite often, however, functionally related proteins do physically interact witheach other. A strong advantage of the comparative genomics-based approaches is that,due to the increasing number of determined genome sequences, many proteins can nowfind related (and maybe interacting) proteins through these approaches (Huynen, Snel,von Mering, & Bork, 2003).
Phylogenetic Tree Topology Analysis
It has been observed that the phylogenetic trees between interacting proteins are moresimilar than a general divergence between the corresponding species (Goh & Cohen,2002; Goh, Bogan, Joachimiak, Walther, & Cohen, 2000; Pazos & Valencia, 2001).The similarity between the phylogenetic trees of interacting proteins was explained asmaintenance of the complex functionality and suffering similar evolutionary pressure.
The sequence signal of coevolution is strong at the binding interface of proteins but canalso be detected other regions of proteins (Kann, Shoemaker, Panchenko, & Przytycka,2009).
The tree topology similarity can be measured as the correlation between the evolutionarydistance matrices used to build the trees. The algorithm to calculate similarity of distancematrices is called the mirror tree method (Pazos & Valencia, 2001). It contains thefollowing steps (Fig. 4A): 1) Construct a multiple sequence alignment for each proteinagainst a list of reference organisms; 2) Construct a phylogenetic tree for the proteins; 3)Then, for a pair of proteins in question, distances against orthologous proteins in differentspecies are computed (distance matrices) and the correlation coefficient between twodistance matrices is obtained. A protein pair is predicted to be interacting if the coefficientvalue is above a cut-off value, which is determined to distinguish known interacting andnon-interacting proteins.
The mirror tree method was modified for improvement in several different ways. Themethod was extended to handle interacting protein families, such as a ligand familyand a receptor family, to be able identify interacting specific protein pairs from the twofamilies (Ramani & Marcotte, 2003). Sato et al. removed a background tree similar-ity that arises by the overall evolutionary distance of organisms from distance matricesof individual proteins, which yielded improvement of PPI prediction accuracy (Sato,Yamanishi, Kanehisa, & Toh, 2005). They further considered partial correlation of dis-tance matrices that can more effectively remove background organism-level similarityfrom the tree similarity of a query protein pair, where the background organism-levelsimilarity was represented by a linear combination of distance matrices of many pro-teins in the organisms (Sato, Yamanishi, Horimoto, Kanehisa, & Toh, 2006). Besides thebackground similarity of organisms, another source of noise in the mirror tree methodis that a protein coevolves with multiple interacting proteins. Instead of evaluating treesimilarity of a query protein pair, Juan et al. considered a network of similarities betweenall pairs of proteins simultaneously (Juan, Pazos, & Valencia, 2008). In the mirror treemethod, selection of reference genomes is a key for successful prediction. Effective waysto select organisms for building trees were examined by Herman et al. (Herman et al.,2011). Instead of using correlation coefficient, SVM was also used to make predictionsfrom distance matrices (Craig & Liao, 2007).
Phylogenetic Profiles
Phylogenetically related and thus possibly interacting protein pairs can be identified in asimpler way using comparative genomics. In the approach called the phylogenetic profil-ing, co-presence and co-absence of orthologous proteins across organisms are examinedrather than comparing phylogenetic trees of protein pairs as discussed in the previoussection (Pellegrini, Marcotte, Thompson, Eisenberg, & Yeates, 1999). If two proteins are Ding and Kihara
11 of 27
Current Protocols in Protein Science
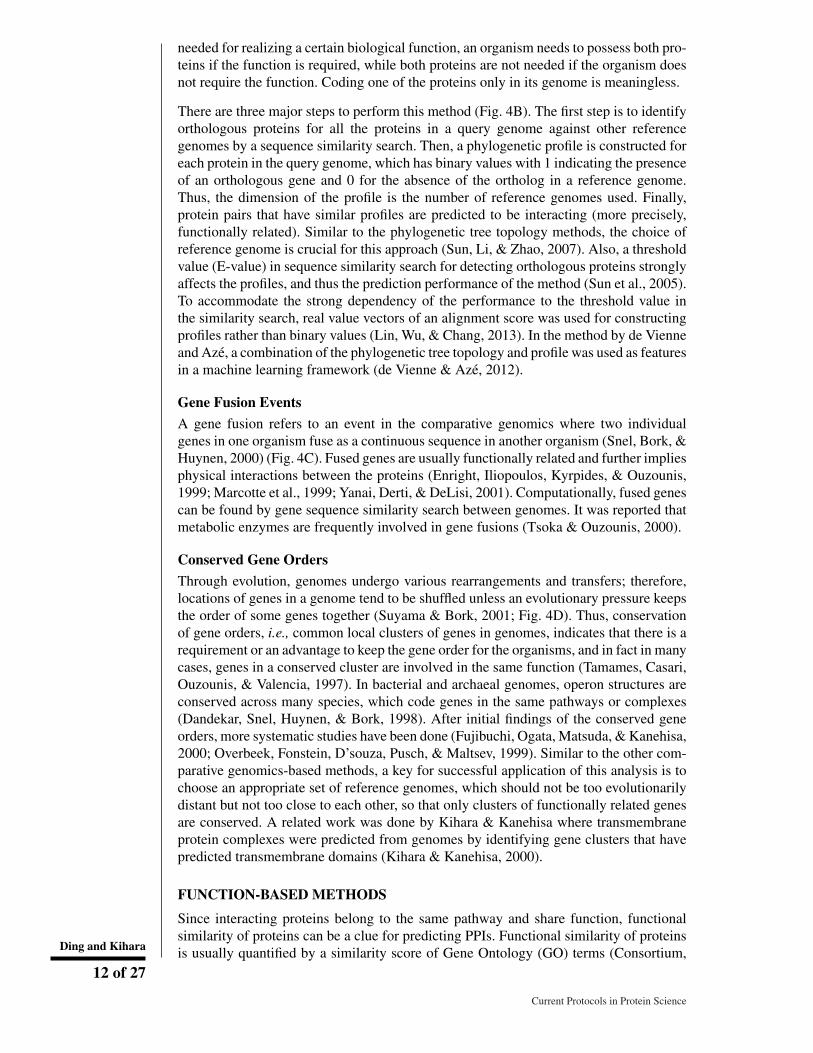
needed for realizing a certain biological function, an organism needs to possess both pro-teins if the function is required, while both proteins are not needed if the organism doesnot require the function. Coding one of the proteins only in its genome is meaningless.
There are three major steps to perform this method (Fig. 4B). The first step is to identifyorthologous proteins for all the proteins in a query genome against other referencegenomes by a sequence similarity search. Then, a phylogenetic profile is constructed foreach protein in the query genome, which has binary values with 1 indicating the presenceof an orthologous gene and 0 for the absence of the ortholog in a reference genome.Thus, the dimension of the profile is the number of reference genomes used. Finally,protein pairs that have similar profiles are predicted to be interacting (more precisely,functionally related). Similar to the phylogenetic tree topology methods, the choice ofreference genome is crucial for this approach (Sun, Li, & Zhao, 2007). Also, a thresholdvalue (E-value) in sequence similarity search for detecting orthologous proteins stronglyaffects the profiles, and thus the prediction performance of the method (Sun et al., 2005).To accommodate the strong dependency of the performance to the threshold value inthe similarity search, real value vectors of an alignment score was used for constructingprofiles rather than binary values (Lin, Wu, & Chang, 2013). In the method by de Vienneand Aze, a combination of the phylogenetic tree topology and profile was used as featuresin a machine learning framework (de Vienne & Aze, 2012).
Gene Fusion Events
A gene fusion refers to an event in the comparative genomics where two individualgenes in one organism fuse as a continuous sequence in another organism (Snel, Bork, &Huynen, 2000) (Fig. 4C). Fused genes are usually functionally related and further impliesphysical interactions between the proteins (Enright, Iliopoulos, Kyrpides, & Ouzounis,1999; Marcotte et al., 1999; Yanai, Derti, & DeLisi, 2001). Computationally, fused genescan be found by gene sequence similarity search between genomes. It was reported thatmetabolic enzymes are frequently involved in gene fusions (Tsoka & Ouzounis, 2000).
Conserved Gene Orders
Through evolution, genomes undergo various rearrangements and transfers; therefore,locations of genes in a genome tend to be shuffled unless an evolutionary pressure keepsthe order of some genes together (Suyama & Bork, 2001; Fig. 4D). Thus, conservationof gene orders, i.e., common local clusters of genes in genomes, indicates that there is arequirement or an advantage to keep the gene order for the organisms, and in fact in manycases, genes in a conserved cluster are involved in the same function (Tamames, Casari,Ouzounis, & Valencia, 1997). In bacterial and archaeal genomes, operon structures areconserved across many species, which code genes in the same pathways or complexes(Dandekar, Snel, Huynen, & Bork, 1998). After initial findings of the conserved geneorders, more systematic studies have been done (Fujibuchi, Ogata, Matsuda, & Kanehisa,2000; Overbeek, Fonstein, D’souza, Pusch, & Maltsev, 1999). Similar to the other com-parative genomics-based methods, a key for successful application of this analysis is tochoose an appropriate set of reference genomes, which should not be too evolutionarilydistant but not too close to each other, so that only clusters of functionally related genesare conserved. A related work was done by Kihara & Kanehisa where transmembraneprotein complexes were predicted from genomes by identifying gene clusters that havepredicted transmembrane domains (Kihara & Kanehisa, 2000).
FUNCTION-BASED METHODS
Since interacting proteins belong to the same pathway and share function, functionalsimilarity of proteins can be a clue for predicting PPIs. Functional similarity of proteinsis usually quantified by a similarity score of Gene Ontology (GO) terms (Consortium,Ding and Kihara
12 of 27
Current Protocols in Protein Science
2017) that annotate the proteins. Similarity of GO terms are defined by the closenessof the terms on the GO hierarchy tree and/or the frequency of the GO terms in geneannotations observed in an protein annotation database, e.g., UniProt (Lin, 1998; Resnik,1995; Schlicker, Domingues, Rahnenfuhrer, & Lengauer, 2006) (Wu, Pang, Lin, & Pei,2013). Interestingly, it was shown that considering common children terms of GO termsin addition to common parental GO terms, which are not used in the aforementionedfunctional similarity scores, improved PPI prediction accuracy (Zhang & Tang, 2016).Jain and Bader defined a GO similarity score by considering the distance to the leaf nodesin order to reduce the influence of imbalanced branch depths in the GO hierarchy (Jain& Bader, 2010).
GO term similarity (or relevance) can be also defined by counting frequency of co-occurrence of GO term pairs in biological contexts, in gene annotation, or PubMedabstracts (Chitale, Palakodety, & Kihara, 2011), or in known PPIs (Wei, Khan, Ding,Yerneni, & Kihara, 2017; Yerneni, Khan, Wei, & Kihara, 2015).
Since PPI prediction is a suitable and handy application of GO term similarity scores,all the GO term scores above have been tested and compared for their performance ofPPI predictions (Guo, Liu, Shriver, Hu, & Liebman, 2006; Jain & Bader, 2010; Wuet al., 2013; Yerneni et al., 2015). Maetsche et al. showed that when using GO termsfor PPI prediction in machine learning framework, induced GO term sets, e.g., commonparental terms of annotated GO terms, performed better rather than using the originalGO annotations of proteins (Maetschke, Simonsen, Davis, & Ragan, 2012).
GENE CO-EXPRESSION-BASED METHODS
Gene co-expression data such as microarray and RNA-sequencing data are valuableexperimental data that can be used to infer PPIs. Intuitively, interacting protein pairsare expected to have similar gene expression levels across different conditions. Indeedsignificant correlation between the gene co-expression level and PPIs was shown inbacteriophage T7 (Grigoriev, 2001), yeast (Ge, Liu, Church, & Vidal, 2001; Jansen,Greenbaum, & Gerstein, 2002), human, mouse, and E. coli (Bhardwaj & Lu, 2005).Fraser et al. showed that gene expression level of interacting proteins co-evolve usingfour closely related yeast species, where the expression level was estimated by thecodon usage (Fraser, Hirsh, Wall, & Eisen, 2004). Databases that provide large-scalegene co-expression information include GEO (Barrett et al., 2013), ATTED-II (Aoki,Okamura, Tadaka, Kinoshita, & Obayashi, 2016), and COXPRESdb (Okamura et al.,2014). ATTED-II and COXPRESdb are pre-calculated gene co-expression databases ofplant organisms and animal species, respectively.
Although gene expression is shown to have significant correlation to PPIs, a majorchallenge is that co-expression data is noisy due to various types of systematic andstochastic fluctuations. Soong et al. adopted principle component analysis (PCA) andindependent component analysis (ICA) to filter out noise in microarray data beforefeeding the data to SVM classifier (Soong, Wrzeszczynski, & Rost, 2008). As we seelater in the section for integrated methods, gene expression is used frequently as one ofthe input features for proteins.
PROTEIN TERTIARY STRUCTURE-BASED METHODS
The tertiary (3D) structure of proteins can be important information to predict PPIs,if available, or if the structures can be computationally reliably modelled. Thereare many computational methods developed that “docks” two protein structures toprovide the tertiary structures of a protein complex from individual protein struc-tures, which include LZerD (Esquivel-Rodriguez, Filos-Gonzalez, Li, & Kihara, 2014; Ding and Kihara
13 of 27
Current Protocols in Protein Science
Esquivel-Rodrıguez, Yang, & Kihara, 2012; Peterson, Roy, Christoffer, Terashi, & Ki-hara, 2017; Venkatraman, Yang, Sael, & Kihara, 2009), GRAMM-X (Tovchigrechko& Vakser, 2006), ZDOCK (Pierce et al., 2014), RosettaDock (Lyskov & Gray, 2008),HADDOCK (Geng, Narasimhan, Rodrigues, & Bonvin, 2017), SwarmDock (Torchala& Bates, 2014), HEX (Ritchie & Kemp, 2000), and ClusPro (Kozakov et al., 2017).These docking methods build structure models of a protein complex given individualprotein structures, which provide structural insights of the PPI. However, it should benoted that these docking methods do not predict whether a protein pair actually interactsor not.
How then does one use structure information for predicting PPIs? There are two ap-proaches explored. The first approach is to detect energetic characteristics of interactingprotein pairs observed in protein docking prediction. A protein docking program typicallygenerates over tens of thousands of different docking poses for a pair of input proteinstructures. Wass et al. reported the score distribution of docking poses of interactingprotein pairs can be distinguished from those of non-interacting proteins, because theformer distribution is skewed toward favorable scores (Wass, Fuentes, Pons, Pazos, &Valencia, 2011). This is an intriguing observation because a docking pose distributioninclude both near-native (i.e., almost correct) and incorrect poses, therefore, the reportimplies that even incorrect docking poses have relatively favorable scores (i.e., morefavorable geometric complementary) in cases of interacting proteins. In MEGADOCK,a protein docking method aimed for fast, large-scale protein docking screening, a proteinpair is predicted to be interacting if a pool of docking poses generated by the algo-rithm include clusters of similar poses that have significantly favorable docking scores incomparison with the rest of the poses (Ohue, Matsuzaki, Uchikoga, Ishida, & Akiyama,2014).
The second approach to use protein structure information for PPI prediction is, for twoquery protein structures, to find similarity in known protein complexes. PRISM, devel-oped by Keskin and his colleagues, is one of the first to take this approach (Aytuna,Gursoy, & Keskin, 2005; Tuncbag, Gursoy, Nussinov, & Keskin, 2011). PRISM takestwo protein structures as input, and examines if surface shapes of the proteins have sim-ilarity to docking interfaces from known protein complexes structures. To perform thiscomparison, PRISM has a database of docking interface regions of known protein com-plexes extracted from the PDB database (Rose et al., 2017). Identified potential interfaceregions in the two query proteins that are identified by comparison to known interfaceregions are examined for structural similarity to the template, sequence conservation, andthe binding energy. Although the prediction power of PRISM relies on the coverage oftemplate dataset, the method will be able identify interactions between proteins that areglobally dissimilar but have similar local interface regions to known protein complexes.PrePPI takes a similar approach to PRISM (Q. C. Zhang et al., 2012). One difference isthat PrePPI takes sequences of the query proteins and models their structures by homol-ogy modeling. Subsequently, the two structures are mapped to known protein complexstructures, which are then evaluated by structure and sequence similarity scores to theknown complex structures. Final prediction is made by a composite score that integratesfive other features, gene co-expression, essentiality of the proteins, functional similarity,and the phylogenetic profile. Similarly, Coev2Net models a complex structure of twoquery proteins by mapping their sequences to a known complex structure with a thread-ing method, and then evaluates the complex model by a logistic regression classifier thatconsiders structural and sequence features taken from its interface (Hosur et al., 2012). Ina recent method, InterPred, a similar approach is taken (Mirabello & Wallner, 2017): fora query protein sequence pair, structures are modelled, then known protein complexesare sought by structure comparison. Finally, the feasibility of the model is evaluatedusing a random forest classifier that considers interface structure and sequence featuresDing and Kihara
14 of 27
Current Protocols in Protein Science
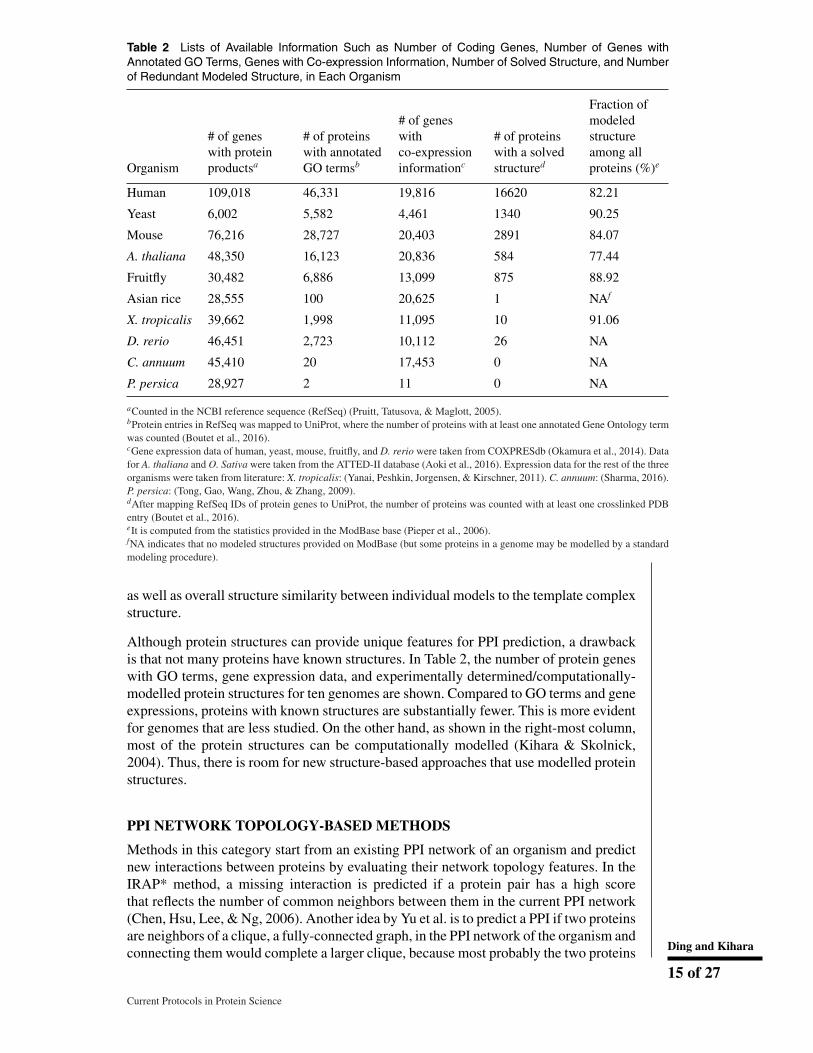
Table 2 Lists of Available Information Such as Number of Coding Genes, Number of Genes withAnnotated GO Terms, Genes with Co-expression Information, Number of Solved Structure, and Numberof Redundant Modeled Structure, in Each Organism
Organism
# of geneswith proteinproductsa
# of proteinswith annotatedGO termsb
# of geneswithco-expressioninformationc
# of proteinswith a solvedstructured
Fraction ofmodeledstructureamong allproteins (%)e
Human 109,018 46,331 19,816 16620 82.21
Yeast 6,002 5,582 4,461 1340 90.25
Mouse 76,216 28,727 20,403 2891 84.07
A. thaliana 48,350 16,123 20,836 584 77.44
Fruitfly 30,482 6,886 13,099 875 88.92
Asian rice 28,555 100 20,625 1 NAf
X. tropicalis 39,662 1,998 11,095 10 91.06
D. rerio 46,451 2,723 10,112 26 NA
C. annuum 45,410 20 17,453 0 NA
P. persica 28,927 2 11 0 NA
aCounted in the NCBI reference sequence (RefSeq) (Pruitt, Tatusova, & Maglott, 2005).bProtein entries in RefSeq was mapped to UniProt, where the number of proteins with at least one annotated Gene Ontology termwas counted (Boutet et al., 2016).cGene expression data of human, yeast, mouse, fruitfly, and D. rerio were taken from COXPRESdb (Okamura et al., 2014). Datafor A. thaliana and O. Sativa were taken from the ATTED-II database (Aoki et al., 2016). Expression data for the rest of the threeorganisms were taken from literature: X. tropicalis: (Yanai, Peshkin, Jorgensen, & Kirschner, 2011). C. annuum: (Sharma, 2016).P. persica: (Tong, Gao, Wang, Zhou, & Zhang, 2009).dAfter mapping RefSeq IDs of protein genes to UniProt, the number of proteins was counted with at least one crosslinked PDBentry (Boutet et al., 2016).eIt is computed from the statistics provided in the ModBase base (Pieper et al., 2006).fNA indicates that no modeled structures provided on ModBase (but some proteins in a genome may be modelled by a standardmodeling procedure).
as well as overall structure similarity between individual models to the template complexstructure.
Although protein structures can provide unique features for PPI prediction, a drawbackis that not many proteins have known structures. In Table 2, the number of protein geneswith GO terms, gene expression data, and experimentally determined/computationally-modelled protein structures for ten genomes are shown. Compared to GO terms and geneexpressions, proteins with known structures are substantially fewer. This is more evidentfor genomes that are less studied. On the other hand, as shown in the right-most column,most of the protein structures can be computationally modelled (Kihara & Skolnick,2004). Thus, there is room for new structure-based approaches that use modelled proteinstructures.
PPI NETWORK TOPOLOGY-BASED METHODS
Methods in this category start from an existing PPI network of an organism and predictnew interactions between proteins by evaluating their network topology features. In theIRAP* method, a missing interaction is predicted if a protein pair has a high scorethat reflects the number of common neighbors between them in the current PPI network(Chen, Hsu, Lee, & Ng, 2006). Another idea by Yu et al. is to predict a PPI if two proteinsare neighbors of a clique, a fully-connected graph, in the PPI network of the organism andconnecting them would complete a larger clique, because most probably the two proteins Ding and Kihara
15 of 27
Current Protocols in Protein Science
are subunits of a protein complex (Yu, Paccanaro, Trifonov, & Gerstein, 2006). In thework by L. Wong and his colleagues, a prediction of a PPI is made using a combinationof two scores, a score for capturing local network topology of proteins that is based onthe number of common neighbors and a global topology-based score that accounts forthe memberships of the proteins in protein groups where member proteins interact witheach other (Liu, Li, & Wong, 2008). Kuchaiev et al. applied Multi-Dimensional Scaling(MDS), a dimension reduction method in statistics, to a PPI network, where distances arebased on edge distances between proteins (Kuchaiev, Rasajski, Higham, & Przulj, 2009).New PPIs are predicted if proteins are closer than a threshold in the projected spaceby MDS. Lei and Ruan applied a random walk-based approach, where the probabilityof reaching each node from each of the other nodes in the network is computed byassuming a random walk (Lei & Ruan, 2012). The resulting probability matrix containsinformation of the topology of the PPI network. Based on the probability matrix, proteinpairs are connected if they are similar in their probability vectors to reach the othernodes.
INTEGRATION OF MULTIPLE FEATURES
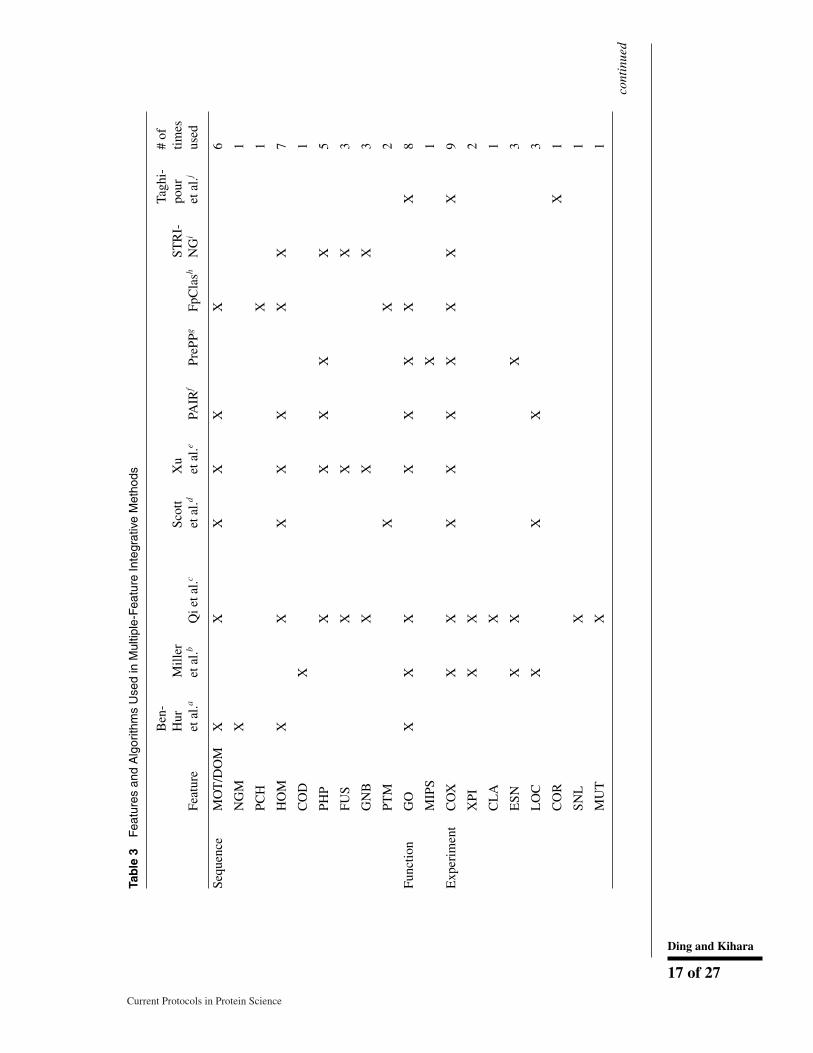
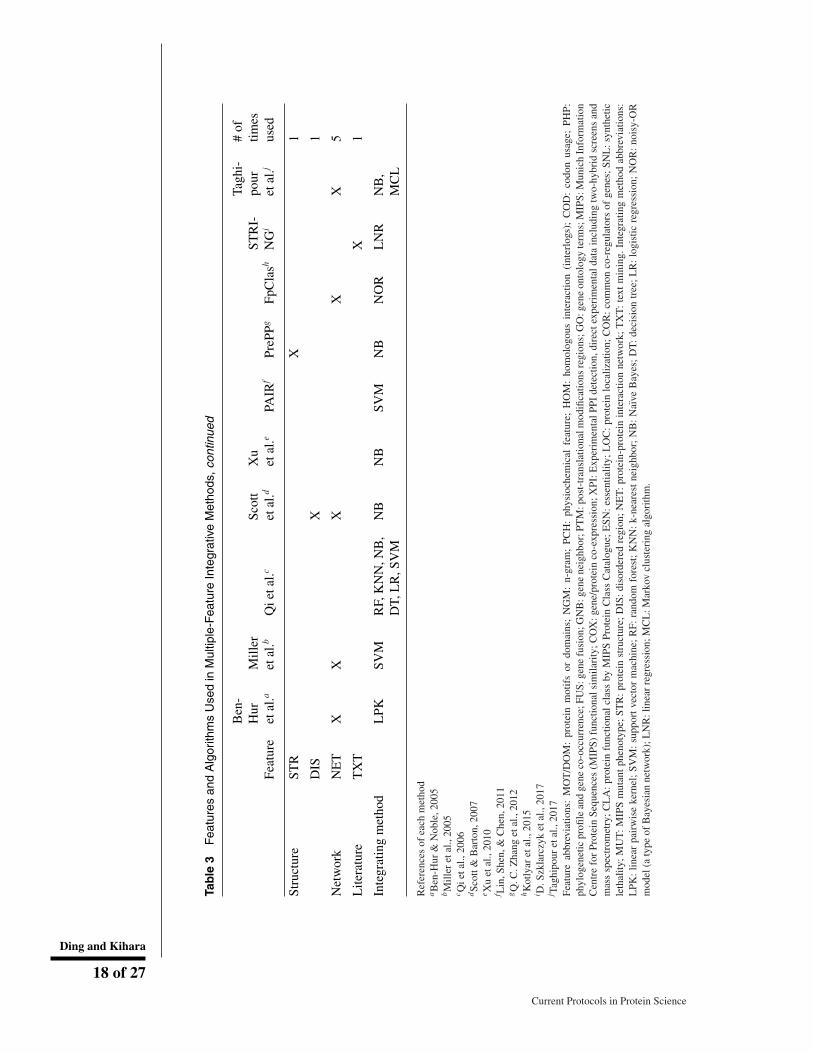
PPIs can be predicted from different perspectives as discussed above. Naturally, there aremethods that use multiple features to be able to combine strengths of different featuresand to increase the prediction confidence and coverage. Features can be combined usingmachine learning methods, such as random forest, Naıve Bayesian Network, artificialneural network, SVM, and logistic regression (Qi, Bar-Joseph, & Klein-Seetharaman,2006). In Table 3 methods that use multiple features are summarized.
From the table, we can see the most popular feature integrated was gene co-expressiondata (COX). The next most popular ones are GO functional similarity (GO), and ho-mology (HOM). Several features in the table are not explained yet in this review. Thephysicochemical features (PCH) concerns features such as charge and aromaticity ofamino acids in a protein sequence. The post-translational modification feature (PTM)indicates that PTM motifs are found in UniProt and HPRD. The disordered region (DIS)is a protein structure feature where non-structured regions in a protein can be predictedfrom its sequence. Thus, besides obvious sequence-based features, DIS, PCH, and PTMare features that are predicted from protein sequences. Direct experimental data of PPIs(EXP) used by Qi et al. were yeast-two-hybrid and mass spectrometry data (Qi et al.,2006), and those used by Miller et al. were data from yeast two-hybrid system (Milleret al., 2005). The protein functional class (CLA) in yeast are taken from the MunichInformation Center for Protein Sequences (MIPS) Protein Class Catalogue, which weredetermined by experiments (Mewes et al., 2004). Gene essentiality (ESN), syntheticlethality (SNL), and MIPS mutant phenotype (MUT) were determined by knockoutmutants (Qi et al., 2006). Text mining (TXT) counts co-mentions of two proteins inPubMed abstracts.
Regarding combinations of features, methods by Ben-Hur et al., Xu et al. combine mostlysequence-based features (Ben-Hur & Noble, 2005; Xu et al., 2010). On the other hand,PrePPI (Q. C. Zhang et al., 2012), FpClass (Kotlyar et al., 2015), and Taghipour et al.(Taghipour, Zarrineh, Ganjtabesh, & Nowzari-Dalini, 2017) are intended to combinedifferent types of features.
Turning our attention to algorithms used, naıve Bayes is the most frequently used amongthe multiple feature-based methods in Table 3. SVM was the next, used in the threemethods. Qi et al., tested five integrating algorithms with different feature combinations(Qi et al., 2006).
Ding and Kihara
16 of 27
Current Protocols in Protein Science
Tab
le3
Fea
ture
san
dA
lgor
ithm
sU
sed
inM
ultip
le-F
eatu
reIn
tegr
ativ
eM
etho
ds
Feat
ure
Ben
-H
uret
al.a
Mill
eret
al.b
Qie
tal.c
Scot
tet
al.d
Xu
etal
.ePA
IRf
PreP
PgFp
Cla
shST
RI-
NG
i
Tagh
i-po
uret
al.j
#of
times
used
Sequ
ence
MO
T/D
OM
XX
XX
XX
6
NG
MX
1
PCH
X1
HO
MX
XX
XX
XX
7
CO
DX
1
PHP
XX
XX
X5
FUS
XX
X3
GN
BX
XX
3
PTM
XX
2
Func
tion
GO
XX
XX
XX
XX
8
MIP
SX
1
Exp
erim
ent
CO
XX
XX
XX
XX
XX
9
XPI
XX
2
CL
AX
1
ESN
XX
X3
LO
CX
XX
3
CO
RX
1
SNL
X1
MU
TX
1
cont
inue
d
Ding and Kihara
17 of 27
Current Protocols in Protein Science
Tab
le3
Fea
ture
san
dA
lgor
ithm
sU
sed
inM
ultip
le-F
eatu
reIn
tegr
ativ
eM
etho
ds,c
ontin
ued
Feat
ure
Ben
-H
uret
al.a
Mill
eret
al.b
Qie
tal.c
Scot
tet
al.d
Xu
etal
.ePA
IRf
PreP
PgFp
Cla
shST
RI-
NG
i
Tagh
i-po
uret
al.j
#of
times
used
Stru
ctur
eST
RX
1
DIS
X1
Net
wor
kN
ET
XX
XX
X5
Lite
ratu
reT
XT
X1
Inte
grat
ing
met
hod
LPK
SVM
RF,
KN
N,N
B,
DT,
LR
,SV
MN
BN
BSV
MN
BN
OR
LN
RN
B,
MC
L
Ref
eren
ces
ofea
chm
etho
daB
en-H
ur&
Nob
le,2
005
bM
iller
etal
.,20
05c Q
ieta
l.,20
06dSc
ott&
Bar
ton,
2007
e Xu
etal
.,20
10f L
in,S
hen,
&C
hen,
2011
gQ
.C.Z
hang
etal
.,20
12hK
otly
aret
al.,
2015
i D.S
zkla
rczy
ket
al.,
2017
j Tagh
ipou
ret
al.,
2017
Feat
ure
abbr
evia
tions
:M
OT
/DO
M:
prot
ein
mot
ifs
ordo
mai
ns;
NG
M:
n-gr
am;
PCH
:ph
ysio
chem
ical
feat
ure;
HO
M:
hom
olog
ous
inte
ract
ion
(int
erlo
gs);
CO
D:
codo
nus
age;
PHP:
phyl
ogen
etic
profi
lean
dge
neco
-occ
urre
nce;
FUS:
gene
fusi
on;G
NB
:gen
ene
ighb
or;P
TM
:pos
t-tr
ansl
atio
nalm
odifi
catio
nsre
gion
s;G
O:g
ene
onto
logy
term
s;M
IPS:
Mun
ich
Info
rmat
ion
Cen
tre
for
Prot
ein
Sequ
ence
s(M
IPS)
func
tiona
lsim
ilari
ty;C
OX
:gen
e/pr
otei
nco
-exp
ress
ion;
XPI
:Exp
erim
enta
lPPI
dete
ctio
n,di
rect
expe
rim
enta
ldat
ain
clud
ing
two-
hybr
idsc
reen
san
dm
ass
spec
trom
etry
;C
LA
:pr
otei
nfu
nctio
nal
clas
sby
MIP
SPr
otei
nC
lass
Cat
alog
ue;
ESN
:es
sent
ialit
y;L
OC
:pr
otei
nlo
caliz
atio
n;C
OR
:co
mm
onco
-reg
ulat
ors
ofge
nes;
SNL
:sy
nthe
ticle
thal
ity;
MU
T:
MIP
Sm
utan
tph
enot
ype;
STR
:pr
otei
nst
ruct
ure;
DIS
:di
sord
ered
regi
on;
NE
T:
prot
ein-
prot
ein
inte
ract
ion
netw
ork;
TX
T:
text
min
ing.
Inte
grat
ing
met
hod
abbr
evia
tions
:L
PK:
linea
rpa
irw
ise
kern
el;
SVM
:su
ppor
tve
ctor
mac
hine
;R
F:ra
ndom
fore
st;
KN
N:
k-ne
ares
tne
ighb
or;
NB
:N
aıve
Bay
es;
DT
:de
cisi
ontr
ee;
LR
:lo
gist
icre
gres
sion
;N
OR
:no
isy-
OR
mod
el(a
type
ofB
ayes
ian
netw
ork)
;LN
R:l
inea
rre
gres
sion
;MC
L:M
arko
vcl
uste
ring
algo
rith
m.
Ding and Kihara
18 of 27
Current Protocols in Protein Science
CONCLUSIONS
The identification of PPIs is vital for a systems level understanding of molecular ac-tivity of living cells. To complement experimental approaches are many computationaltools, which use different types of protein features. There is currently a wide variety offeatures, explored in this review, and development of novel computational approacheswould need new types of experimental data. Also, large scale PPI networks are experi-mentally revealed only for a limited number of organisms, and thus many computationalmethods were developed and benchmarked on those organisms. Therefore, for furtheradvancement of PPI prediction, proteomics-scale PPIs of many more organisms wouldbe needed.
Current PPI networks construct both experimental and computational methods, and onlyrepresent a static snapshot of interactions of proteins in a cell, which are dynamicallychanging over time, containing both transient and permanent interactions. Therefore, thenext generation of PPI studies would aim to capture the time-dependent, dynamic aspectsof PPIs. Computationally, this direction would eventually meet and be integrated withother computational approaches, such as pathway simulations and molecular dynamicssimulation of molecules in a cell.
ACKNOWLEDGEMENTS
We acknowledge Natalie Tomoko Oda for proofreading the manuscript. This work waspartly supported by grants from the National Institutes of Health (R01GM097528) and theNational Science Foundation (DBI1262189, IIS1319551, IOS1127027, DMS1614777).ZD is supported by Purdue Research Foundation.
Literature citedAn, J. Y., Meng, F. R., You, Z. H., Chen, X., Yan, G. Y., & Hu, J. P. (2016). Improving protein–protein
interactions prediction accuracy using protein evolutionary information and relevance vector machinemodel. Protein Science, 25(10), 1825–1833. doi: 10.1002/pro.2991.
Aoki, Y., Okamura, Y., Tadaka, S., Kinoshita, K., & Obayashi, T. (2016). ATTED-II in 2016: A PlantCoexpression Database Towards Lineage-Specific Coexpression. Plant & Cell Physiology, 57(1), e5.doi: 10.1093/pcp/pcv165.
Attwood, T. K., Coletta, A., Muirhead, G., Pavlopoulou, A., Philippou, P. B., Popov, I., . . . Mitchell, A.L. (2012). The PRINTS database: A fine-grained protein sequence annotation and analysis resource–itsstatus in 2012. Database (Oxford), 2012, bas019. doi: 10.1093/database/bas019.
Aytuna, A. S., Gursoy, A., & Keskin, O. (2005). Prediction of protein–protein interactions by combiningstructure and sequence conservation in protein interfaces. Bioinformatics, 21(12), 2850–2855. doi:10.1093/bioinformatics/bti443.
Barrett, T., Wilhite, S. E., Ledoux, P., Evangelista, C., Kim, I. F., Tomashevsky, M., . . . Holko, M. (2013).NCBI GEO: Archive for functional genomics data sets—update. Nucleic Acids Research, 41(D1), D991–D995. doi: 10.1093/nar/gks1193.
Becerra, A., Bucheli, V. A., & Moreno, P. A. (2017). Prediction of virus-host protein-protein interactionsmediated by short linear motifs. Bmc Bioinformatics, 18(1), 163. doi: 10.1186/s12859-017-1570-7.
Ben-Hur, A., & Noble, W. S. (2005). Kernel methods for predicting protein–protein interactions. Bioinfor-matics, 21(suppl 1), i38–i46. doi: 10.1093/bioinformatics/bti1016.
Betel, D., Breitkreuz, K. E., Isserlin, R., Dewar-Darch, D., Tyers, M., & Hogue, C. W. (2007). Structure-templated predictions of novel protein interactions from sequence information. Plos ComputationalBiology, 3(9), e182. doi: 10.1371/journal.pcbi.0030182.
Bhardwaj, N., & Lu, H. (2005). Correlation between gene expression profiles and protein–protein interactionswithin and across genomes. Bioinformatics, 21(11), 2730–2738. doi: 10.1093/bioinformatics/bti398.
Blohm, P., Frishman, G., Smialowski, P., Goebels, F., Wachinger, B., Ruepp, A., & Frishman, D. (2014).Negatome 2.0: A database of non-interacting proteins derived by literature mining, manual anno-tation and protein structure analysis. Nucleic Acids Research, 42(Database issue), D396–400. doi:10.1093/nar/gkt1079.
Bock, J. R., & Gough, D. A. (2001). Predicting protein–protein interactions from primary structure. Bioin-formatics, 17(5), 455–460. doi: 10.1093/bioinformatics/17.5.455.
Ding and Kihara
19 of 27
Current Protocols in Protein Science
Boeri Erba, E., & Petosa, C. (2015). The emerging role of native mass spectrometry in characterizingthe structure and dynamics of macromolecular complexes. Protein Science, 24(8), 1176–1192. doi:10.1002/pro.2661.
Boutet, E., Lieberherr, D., Tognolli, M., Schneider, M., Bansal, P., Bridge, A. J., . . . Xenarios, I. (2016).UniProtKB/Swiss-Prot, the Manually Annotated Section of the UniProt KnowledgeBase: How to Usethe Entry View. Methods in Molecular Biology, 1374, 23–54. doi: 10.1007/978-1-4939-3167-5_2.
Breuer, K., Foroushani, A. K., Laird, M. R., Chen, C., Sribnaia, A., Lo, R., . . . Lynn, D. J. (2013). InnateDB:Systems biology of innate immunity and beyond–recent updates and continuing curation. Nucleic AcidsResearch, 41(Database issue), D1228–1233. doi: 10.1093/nar/gks1147.
Browne, F., Zheng, H., Wang, H., & Azuaje, F. (2010). From experimental approaches to computationaltechniques: A review on the prediction of protein-protein interactions. Advances in Artificial Intelligence,2010, 7. doi: 10.1155/2010/924529.
Bru, C., Courcelle, E., Carrere, S., Beausse, Y., Dalmar, S., & Kahn, D. (2005). The ProDom database ofprotein domain families: More emphasis on 3D. Nucleic Acids Research, 33(Database issue), D212–215.doi: 10.1093/nar/gki034.
Chang, J.-W., Zhou, Y.-Q., Ul Qamar, M. T., Chen, L.-L., & Ding, Y.-D. (2016). Prediction of Protein–Protein Interactions by Evidence Combining Methods. International Journal of Molecular Sciences,17(11), 1946. doi: 10.3390/ijms17111946.
Chatr-Aryamontri, A., Oughtred, R., Boucher, L., Rust, J., Chang, C., Kolas, N. K., . . . Tyers, M. (2017).The BioGRID interaction database: 2017 update. Nucleic Acids Research, 45(D1), D369–D379. doi:10.1093/nar/gkw1102.
Chen, F., Mackey, A. J., Stoeckert, C. J., & Roos, D. S. (2006). OrthoMCL-DB: Querying a comprehensivemulti-species collection of ortholog groups. Nucleic Acids Research, 34(suppl 1), D363–D368. doi:10.1093/nar/gkj123.
Chen, J., Hsu, W., Lee, M. L., & Ng, S.-K. (2006). Increasing confidence of protein interactomes usingnetwork topological metrics. Bioinformatics, 22(16), 1998–2004. doi: 10.1093/bioinformatics/btl335.
Chen, X.-W., & Liu, M. (2005). Prediction of protein–protein interactions using random decision forestframework. Bioinformatics, 21(24), 4394–4400. doi: 10.1093/bioinformatics/bti721.
Chitale, M., Hawkins, T., Park, C., & Kihara, D. (2009). ESG: Extended similarity group method forautomated protein function prediction. Bioinformatics, 25(14), 1739–1745. doi: 10.1093/bioinformatics/btp309.
Chitale, M., Palakodety, S., & Kihara, D. (2011). Quantification of protein group coherence and pathway as-signment using functional association. Bmc Bioinformatics, 12(1), 373. doi: 10.1186/1471-2105-12-373.
Consortium, G. O. (2017). Expansion of the Gene Ontology knowledgebase and resources. Nucleic AcidsResearch, 45(D1), D331–D338. doi: 10.1093/nar/gkw1108.
Corpet, F., Gouzy, J., & Kahn, D. (1998). The ProDom database of protein domain families. Nucleic AcidsResearch, 26(1), 323–326. doi: 10.1093/nar/26.1.323.
Craig, R. A., & Liao, L. (2007). Improving Protein–Protein Interaction Prediction Based on PhylogeneticInformation Using a Least-Squares Support Vector Machine. Annals of the New York Academy ofSciences, 1115(1), 154–167. doi: 10.1196/annals.1407.005.
Dandekar, T., Snel, B., Huynen, M., & Bork, P. (1998). Conservation of gene order: A finger-print of proteins that physically interact. Trends in biochemical sciences, 23(9), 324–328. doi:10.1016/S0968-0004(98)01274-2.
De Bodt, S., Proost, S., Vandepoele, K., Rouze, P., & Van de Peer, Y. (2009). Predicting protein-proteininteractions in Arabidopsis thaliana through integration of orthology, gene ontology and co-expression.Bmc Genomics [Electronic Resource], 10(1), 288. doi: 10.1186/1471-2164-10-288.
de Vienne, D. M., & Aze, J. (2012). Efficient prediction of co-complexed proteins based on coevolution.Plos One, 7(11), e48728. doi: 10.1371/journal.pone.0048728.
Ding, Y., Tang, J., & Guo, F. (2016). Predicting protein-protein interactions via multivariate mutual infor-mation of protein sequences. Bmc Bioinformatics, 17(1), 398. doi: 10.1186/s12859-016-1253-9.
Dinkel, H., Michael, S., Weatheritt, R. J., Davey, N. E., Van Roey, K., Altenberg, B., . . . Gibson, T. J.(2012). ELM–the database of eukaryotic linear motifs. Nucleic Acids Research, 40(Database issue),D242–251. doi: 10.1093/nar/gkr1064.
Dubchak, I., Muchnik, I., Holbrook, S. R., & Kim, S.-H. (1995). Prediction of protein folding class usingglobal description of amino acid sequence. Proceedings of the National Academy of Sciences, 92(19),8700–8704. doi: 10.1073/pnas.92.19.8700.
Dudkina, N. V., Kouril, R., Bultema, J. B., & Boekema, E. J. (2010). Imaging of organelles by electronmicroscopy reveals protein–protein interactions in mitochondria and chloroplasts. FEBS Letters, 584(12),2510–2515. doi: 10.1016/j.febslet.2010.03.027.
Ding and Kihara
20 of 27
Current Protocols in Protein Science
Dunham, W. H., Mullin, M., & Gingras, A. C. (2012). Affinity-purification coupled to mass spectrometry:Basic principles and strategies. Proteomics, 12(10), 1576–1590. doi: 10.1002/pmic.201100523.
Dutkowski, J., & Tiuryn, J. (2009). Phylogeny-guided interaction mapping in seven eukaryotes. Bmc Bioin-formatics, 10(1), 393. doi: 10.1186/1471-2105-10-393.
Enright, A. J., Iliopoulos, I., Kyrpides, N. C., & Ouzounis, C. A. (1999). Protein interaction maps forcomplete genomes based on gene fusion events. Nature, 402(6757), 86–90. doi: 10.1038/47056.
Esquivel-Rodriguez, J., Filos-Gonzalez, V., Li, B., & Kihara, D. (2014). Pairwise and multimeric protein-protein docking using the LZerD program suite. [Research Support, N.I.H., Extramural Research Support,Non-U.S. Gov’t Research Support, U.S. Gov’t, Non-P.H.S.]. Methods in Molecular Biology, 1137, 209–234. doi: 10.1007/978-1-4939-0366-5_15.
Esquivel-Rodrıguez, J., Yang, Y. D., & Kihara, D. (2012). Multi-LZerD: Multiple protein docking forasymmetric complexes. Proteins: Structure, Function, and Bioinformatics, 80(7), 1818–1833. doi:10.1002/prot.24079.
Fields, S., & Sternglanz, R. (1994). The two-hybrid system: An assay for protein-protein interactions. Trendsin Genetics, 10(8), 286–292. doi: 10.1016/0168-9525(90)90012-U.
Finn, R. D., Attwood, T. K., Babbitt, P. C., Bateman, A., Bork, P., Bridge, A. J., . . . Mitchell, A. L. (2017).InterPro in 2017-beyond protein family and domain annotations. Nucleic Acids Research, 45(D1), D190–D199. doi: 10.1093/nar/gkw1107.
Finn, R. D., Coggill, P., Eberhardt, R. Y., Eddy, S. R., Mistry, J., Mitchell, A. L., . . . Bateman, A. (2016).The Pfam protein families database: Towards a more sustainable future. Nucleic Acids Research, 44(D1),D279–285. doi: 10.1093/nar/gkv1344.
Fraser, H. B., Hirsh, A. E., Wall, D. P., & Eisen, M. B. (2004). Coevolution of gene expression amonginteracting proteins. Proceedings of the National Academy of Sciences of the United States of America,101(24), 9033–9038. doi: 10.1073/pnas.0402591101.
Fujibuchi, W., Ogata, H., Matsuda, H., & Kanehisa, M. (2000). Automatic detection of conserved geneclusters in multiple genomes by graph comparison and P-quasi grouping. Nucleic Acids Research,28(20), 4029–4036. doi: 10.1093/nar/28.20.4029.
Garcia-Hernandez, M., Berardini, T. Z., Chen, G., Crist, D., Doyle, A., Huala, E., . . . Zhang, P. (2002).TAIR: A resource for integrated Arabidopsis data. Functional & Integrative Genomics, 2(6), 239–253.doi: 10.1007/s10142-002-0077-z.
Ge, H., Liu, Z., Church, G. M., & Vidal, M. (2001). Correlation between transcriptome and interactomemapping data from Saccharomyces cerevisiae. Nature Genetics, 29(4), 482–486. doi: 10.1038/ng776.
Geisler-Lee, J., O’Toole, N., Ammar, R., Provart, N. J., Millar, A. H., & Geisler, M. (2007). A predictedinteractome for Arabidopsis. Plant Physiology, 145(2), 317–329. doi: 10.1104/pp.107.103465.
Geng, C., Narasimhan, S., Rodrigues, J. P., & Bonvin, A. M. (2017). Information-Driven, Ensemble FlexiblePeptide Docking Using HADDOCK. Modeling Peptide-Protein Interactions: Methods and Protocols,109–138. doi: 10.1007/978-1-4939-6798-8_8.
Gingras, A.-C., Gstaiger, M., Raught, B., & Aebersold, R. (2007). Analysis of protein complexes usingmass spectrometry. Nature Reviews Molecular Cell Biology, 8(8), 645–654. doi: 10.1038/nrm2208.
Goh, C.-S., Bogan, A. A., Joachimiak, M., Walther, D., & Cohen, F. E. (2000). Co-evolution of proteins withtheir interaction partners. Journal of Molecular Biology, 299(2), 283–293. doi: 10.1006/jmbi.2000.3732.
Goh, C.-S., & Cohen, F. E. (2002). Co-evolutionary analysis reveals insights into protein–protein interactions.Journal of Molecular Biology, 324(1), 177–192. doi: 10.1016/S0022-2836(02)01038-0.
Grigoriev, A. (2001). A relationship between gene expression and protein interactions on the proteomescale: Analysis of the bacteriophage T7 and the yeast Saccharomyces cerevisiae. Nucleic Acids Research,29(17), 3513–3519. doi: 10.1093/nar/29.17.3513.
Gu, H., Zhu, P., Jiao, Y., Meng, Y., & Chen, M. (2011). PRIN: A predicted rice interactome network. BmcBioinformatics, 12(1), 161. doi: 10.1186/1471-2105-12-161.
Guo, A., He, K., Liu, D., Bai, S., Gu, X., Wei, L., & Luo, J. (2005). DATF: A database of Arabidopsistranscription factors. Bioinformatics, 21(10), 2568. doi: 10.1093/bioinformatics/bti334.
Guo, X., Liu, R., Shriver, C. D., Hu, H., & Liebman, M. N. (2006). Assessing semantic similarity mea-sures for the characterization of human regulatory pathways. Bioinformatics, 22(8), 967–973. doi:10.1093/bioinformatics/btl042.
Guo, Y., Yu, L., Wen, Z., & Li, M. (2008). Using support vector machine combined with auto covariance topredict protein–protein interactions from protein sequences. Nucleic Acids Research, 36(9), 3025–3030.doi: 10.1093/nar/gkn159.
Guruharsha, K., Rual, J.-F., Zhai, B., Mintseris, J., Vaidya, P., Vaidya, N., . . . Cenaj, O. (2011). A proteincomplex network of Drosophila melanogaster. Cell, 147(3), 690–703. doi: 10.1016/j.cell.2011.08.047.
Ding and Kihara
21 of 27
Current Protocols in Protein Science
Hawkins, T., Chitale, M., Luban, S., & Kihara, D. (2009). PFP: Automated prediction of gene ontologyfunctional annotations with confidence scores using protein sequence data. Proteins: Structure, Function,and Bioinformatics, 74. doi: 10.1002/prot.22172.
Hawkins, T., & Kihara, D. (2007). Function prediction of uncharacterized proteins. Journal of Bioinformaticsand Computational Biology, 5(01), 1–30. doi: 10.1142/S0219720007002503.
Herman, D., Ochoa, D., Juan, D., Lopez, D., Valencia, A., & Pazos, F. (2011). Selection of organ-isms for the co-evolution-based study of protein interactions. Bmc Bioinformatics, 12(1), 363. doi:10.1186/1471-2105-12-363.
Hermjakob, H., Montecchi-Palazzi, L., Lewington, C., Mudali, S., Kerrien, S., Orchard, S., . . . Valencia,A. (2004). IntAct: An open source molecular interaction database. Nucleic Acids Research, 32(suppl 1),D452–D455. doi: 10.1093/nar/gkh052.
Hosur, R., Peng, J., Vinayagam, A., Stelzl, U., Xu, J., Perrimon, N., . . . Berger, B. (2012). A computationalframework for boosting confidence in high-throughput protein-protein interaction datasets. GenomeBiology, 13(8), R76. doi: 10.1186/gb-2012-13-8-r76.
Huang, H., & Bader, J. S. (2009). Precision and recall estimates for two-hybrid screens. Bioinformatics,25(3), 372–378. doi: 10.1093/bioinformatics/btn640.
Huang, T.-W., Tien, A.-C., Huang, W.-S., Lee, Y.-C. G., Peng, C.-L., Tseng, H.-H., . . . Huang, C.-Y. F.(2004). POINT: A database for the prediction of protein–protein interactions based on the orthologousinteractome. Bioinformatics, 20(17), 3273–3276. doi: 10.1093/bioinformatics/bth366.
Huynen, M. A., Snel, B., von Mering, C., & Bork, P. (2003). Function prediction and protein networks.Current Opinion in Cell Biology, 15(2), 191–198. doi: 10.1016/S0955-0674(03)00009-7.
Jain, S., & Bader, G. D. (2010). An improved method for scoring protein-protein interactions using semanticsimilarity within the gene ontology. Bmc Bioinformatics, 11(1), 562. doi: 10.1186/1471-2105-11-562.
Jansen, R., Bussemaker, H. J., & Gerstein, M. (2003). Revisiting the codon adaptation index from a whole-genome perspective: Analyzing the relationship between gene expression and codon occurrence in yeastusing a variety of models. Nucleic Acids Research, 31(8), 2242–2251. doi: 10.1093/nar/gkg306.
Jansen, R., Greenbaum, D., & Gerstein, M. (2002). Relating whole-genome expression data with protein-protein interactions. Genome Research, 12(1), 37–46. doi: 10.1101/gr.205602.
Juan, D., Pazos, F., & Valencia, A. (2008). High-confidence prediction of global interactomes based ongenome-wide coevolutionary networks. Proceedings of the National Academy of Sciences, 105(3), 934–939. doi: 10.1073/pnas.0709671105.
Kann, M. G., Shoemaker, B. A., Panchenko, A. R., & Przytycka, T. M. (2009). Correlated evolution ofinteracting proteins: Looking behind the mirrortree. Journal of Molecular Biology, 385(1), 91–98. doi:10.1016/j.jmb.2008.09.078.
Kenworthy, A. K. (2001). Imaging protein-protein interactions using fluorescence resonance energy transfermicroscopy. Methods (San Diego, Calif.), 24(3), 289–296. doi: 10.1006/meth.2001.1189.
Keseler, I. M., Mackie, A., Santos-Zavaleta, A., Billington, R., Bonavides-Martınez, C., Caspi, R., . . .Krummenacker, M. (2016). The EcoCyc database: Reflecting new knowledge about Escherichia coliK-12. Nucleic Acids Research, 45, D543–D550.
Kihara, D., & Kanehisa, M. (2000). Tandem clusters of membrane proteins in complete genome sequences.Genome research, 10(6), 731–743. doi: 10.1101/gr.10.6.731.
Kihara, D., & Skolnick, J. (2004). Microbial genomes have over 72% structure assignment by the threadingalgorithm PROSPECTOR_Q. Proteins: Structure, Function, and Bioinformatics, 55(2), 464–473. doi:10.1002/prot.20044.
Kim, W. K., Park, J., & Suh, J. K. (2002). Large scale statistical prediction of protein-protein interaction bypotentially interacting domain (PID) pair. Genome Informatics Series, 13, 42–50.
Kobe, B., Guncar, G., Buchholz, R., Huber, T., Maco, B., Cowieson, N., . . . Forwood, J. K. (2008).Crystallography and protein–protein interactions: Biological interfaces and crystal contacts: PortlandPress Limited.
Kotlyar, M., Pastrello, C., Pivetta, F., Lo Sardo, A., Cumbaa, C., Li, H., . . . Jurisica, I. (2015). In silicoprediction of physical protein interactions and characterization of interactome orphans. Nature Methods,12(1), 79–84. doi: 10.1038/nmeth.3178.
Kozakov, D., Hall, D. R., Xia, B., Porter, K. A., Padhorny, D., Yueh, C., . . . Vajda, S. (2017). The ClusProweb server for protein-protein docking. Nature Protocols, 12(2), 255–278. doi: 10.1038/nprot.2016.169.
Kuchaiev, O., Rasajski, M., Higham, D. J., & Przulj, N. (2009). Geometric de-noising of protein-proteininteraction networks. Plos Computational Biology, 5(8), e1000454. doi: 10.1371/journal.pcbi.1000454.
Lee, S.-A., Chan, C.-H., Tsai, C.-H., Lai, J.-M., Wang, F.-S., Kao, C.-Y., & Huang, C.-Y. F. (2008).Ortholog-based protein-protein interaction prediction and its application to inter-species interactions.Bmc Bioinformatics, 9(12), S11. doi: 10.1186/1471-2105-9-S12-S11.
Ding and Kihara
22 of 27
Current Protocols in Protein Science
Lei, C., & Ruan, J. (2012). A random walk based approach for improving protein-protein interaction networkand protein complex prediction. Paper presented at the Bioinformatics and Biomedicine (BIBM), 2012IEEE International Conference on.
Licata, L., Briganti, L., Peluso, D., Perfetto, L., Iannuccelli, M., Galeota, E., . . . Cesareni, G. (2012).MINT, the molecular interaction database: 2012 update. Nucleic Acids Research, 40(Database issue),D857–861. doi: 10.1093/nar/gkr930.
Lin, D. (1998). An information-theoretic definition of similarity. Paper presented at the ICML.
Lin, M., Shen, X., & Chen, X. (2011). PAIR: The predicted Arabidopsis interactome resource. Nucleic AcidsResearch, 39(suppl 1), D1134–D1140. doi: 10.1093/nar/gkq938.
Lin, T.-W., Wu, J.-W., & Chang, D. T.-H. (2013). Combining phylogenetic profiling-based and ma-chine learning-based techniques to predict functional related proteins. Plos One, 8(9), e75940. doi:10.1371/journal.pone.0075940.
Liu, G., Li, J., & Wong, L. (2008). Assessing and predicting protein interactions using both local and globalnetwork topological metrics. Genome Informatics, 21, 138–149.
Liu, X., Liu, B., Huang, Z., Shi, T., Chen, Y., & Zhang, J. (2012). SPPS: A sequence-based method forpredicting probability of protein-protein interaction partners. Plos One, 7(1), e30938. doi: 10.1371/journal.pone.0030938.
Liu, Z.-P., & Chen, L. (2012). Proteome-wide prediction of protein-protein interactions from high-throughputdata. Protein & Cell, 3(7), 508–520. doi: 10.1007/s13238-012-2945-1.
Lyskov, S., & Gray, J. J. (2008). The RosettaDock server for local protein-protein docking. [Re-search Support, N.I.H., Extramural]. Nucleic Acids Research, 36(Web Server issue), W233–238. doi:10.1093/nar/gkn216.
Maetschke, S. R., Simonsen, M., Davis, M. J., & Ragan, M. A. (2012). Gene Ontology-driven in-ference of protein–protein interactions using inducers. Bioinformatics, 28(1), 69–75. doi: 10.1093/bioinformatics/btr610.
Marcotte, E. M., Pellegrini, M., Ng, H.-L., Rice, D. W., Yeates, T. O., & Eisenberg, D. (1999). Detectingprotein function and protein-protein interactions from genome sequences. Science, 285(5428), 751–753.doi: 10.1126/science.285.5428.751.
Martin, S., Roe, D., & Faulon, J.-L. (2005). Predicting protein–protein interactions using signature products.Bioinformatics, 21(2), 218–226. doi: 10.1093/bioinformatics/bth483.
Matthews, L. R., Vaglio, P., Reboul, J., Ge, H., Davis, B. P., Garrels, J., . . . Vidal, M. (2001). Identification ofpotential interaction networks using sequence-based searches for conserved protein-protein interactionsor “interologs”. Genome Research, 11(12), 2120–2126. doi: 10.1101/gr.205301.
Mewes, H.-W., Amid, C., Arnold, R., Frishman, D., Guldener, U., Mannhaupt, G., . . . Stumpflen, V. (2004).MIPS: Analysis and annotation of proteins from whole genomes. Nucleic Acids Research, 32(suppl 1),D41–D44. doi: 10.1093/nar/gkh092.
Miller, J. P., Lo, R. S., Ben-Hur, A., Desmarais, C., Stagljar, I., Noble, W. S., & Fields, S. (2005). Large-scaleidentification of yeast integral membrane protein interactions. Proceedings of the National Academy ofSciences of the United States of America, 102(34), 12123–12128. doi: 10.1073/pnas.0505482102.
Mirabello, C., & Wallner, B. (2017). InterPred: A pipeline to identify and model protein-protein interactions.Proteins, 85, 1159–1170, doi: 10.1002/prot.25280.
Morris, J. H., Knudsen, G. M., Verschueren, E., Johnson, J. R., Cimermancic, P., Greninger, A. L., & Pico, A.R. (2014). Affinity purification–mass spectrometry and network analysis to understand protein-proteininteractions. Nature Protocols, 9(11), 2539–2554. doi: 10.1038/nprot.2014.164.
Mosca, R., Pons, T., Ceol, A., Valencia, A., & Aloy, P. (2013). Towards a detailed atlas of protein–proteininteractions. Current Opinion in Structural Biology, 23(6), 929–940. doi: 10.1016/j.sbi.2013.07.005.
Najafabadi, H. S., & Salavati, R. (2008). Sequence-based prediction of protein-protein interactions by meansof codon usage. Genome Biology, 9(5), R87. doi: 10.1186/gb-2008-9-5-r87.
Nanni, L. (2005). Fusion of classifiers for predicting protein–protein interactions. Neurocomputing, 68,289–296. doi: 10.1016/j.neucom.2005.03.004.
NCBI, R. C. (2016). Database resources of the National Center for Biotechnology Information. NucleicAcids Research, 44(D1), D7. doi: 10.1093/nar/gkv1290.
Nikolovska-Coleska, Z. (2015). Studying protein-protein interactions using surface plasmonresonance. Protein-Protein Interactions: Methods and Applications, 1278, 109–138. doi:10.1007/978-1-4939-2425-7_7.
Ohue, M., Matsuzaki, Y., Uchikoga, N., Ishida, T., & Akiyama, Y. (2014). MEGADOCK: An all-to-allprotein-protein interaction prediction system using tertiary structure data. Protein and Peptide Letters,21(8), 766–778. doi: 10.2174/09298665113209990050.
Ding and Kihara
23 of 27
Current Protocols in Protein Science
Okamura, Y., Aoki, Y., Obayashi, T., Tadaka, S., Ito, S., Narise, T., & Kinoshita, K. (2014). COXPRESdbin 2015: Coexpression database for animal species by DNA-microarray and RNAseq-based expressiondata with multiple quality assessment systems. Nucleic Acids Research, 43, D82–D86.
Overbeek, R., Fonstein, M., D’souza, M., Pusch, G. D., & Maltsev, N. (1999). The use of gene clustersto infer functional coupling. Proceedings of the National Academy of Sciences, 96(6), 2896–2901. doi:10.1073/pnas.96.6.2896.
Pazos, F., & Valencia, A. (2001). Similarity of phylogenetic trees as indicator of protein–protein interaction.Protein Engineering, 14(9), 609–614. doi: 10.1093/protein/14.9.609.
Pellegrini, M., Marcotte, E. M., Thompson, M. J., Eisenberg, D., & Yeates, T. O. (1999). Assigning proteinfunctions by comparative genome analysis: Protein phylogenetic profiles. Proceedings of the NationalAcademy of Sciences of the United States of America, 96(8), 4285–4288. doi: 10.1073/pnas.96.8.4285.
Peterson, L. X., Roy, A., Christoffer, C., Terashi, G., & Kihara, D. (2017). Modeling disordered proteininteractions from biophysical principles. PLOS Computational Biology, 13(4), e1005485. doi: 10.1371/journal.pcbi.1005485.
Piehler, J. (2005). New methodologies for measuring protein interactions in vivo and in vitro. CurrentOpinion in Structural Biology, 15(1), 4–14. doi: 10.1016/j.sbi.2005.01.008.
Pieper, U., Eswar, N., Davis, F. P., Braberg, H., Madhusudhan, M. S., Rossi, A., . . . Eramian, D. (2006).MODBASE: A database of annotated comparative protein structure models and associated resources.Nucleic Acids Research, 34(suppl 1), D291–D295. doi: 10.1093/nar/gkj059.
Pierce, B. G., Wiehe, K., Hwang, H., Kim, B. H., Vreven, T., & Weng, Z. (2014). ZDOCK server: Interactivedocking prediction of protein-protein complexes and symmetric multimers. Bioinformatics, 30(12),1771–1773. doi: 10.1093/bioinformatics/btu097.
Pitre, S., Dehne, F., Chan, A., Cheetham, J., Duong, A., Emili, A., . . . Krogan, N. (2006). PIPE: A protein-protein interaction prediction engine based on the re-occurring short polypeptide sequences betweenknown interacting protein pairs. Bmc Bioinformatics, 7(1), 365. doi: 10.1186/1471-2105-7-365.
Prasad, T. K., Goel, R., Kandasamy, K., Keerthikumar, S., Kumar, S., Mathivanan, S., . . . Venugopal, A.(2009). Human protein reference database—2009 update. Nucleic Acids Research, 37(suppl 1), D767–D772. doi: 10.1093/nar/gkn892.
Pruitt, K. D., Tatusova, T., & Maglott, D. R. (2005). NCBI Reference Sequence (RefSeq): A curated non-redundant sequence database of genomes, transcripts and proteins. Nucleic Acids Research, 33(suppl 1),D501–D504.
Qi, Y., Bar-Joseph, Z., & Klein-Seetharaman, J. (2006). Evaluation of different biological data and com-putational classification methods for use in protein interaction prediction. Proteins: Structure, Function,and Bioinformatics, 63(3), 490–500. doi: 10.1002/prot.20865.
Rajagopala, S. V., Sikorski, P., Kumar, A., Mosca, R., Vlasblom, J., Arnold, R., . . . Ceol, A. (2014). Thebinary protein-protein interaction landscape of Escherichia coli. Nature Biotechnology, 32(3), 285–290.doi: 10.1038/nbt.2831.
Ramani, A. K., & Marcotte, E. M. (2003). Exploiting the co-evolution of interacting pro-teins to discover interaction specificity. Journal of Molecular Biology, 327(1), 273–284. doi:10.1016/S0022-2836(03)00114-1.
Rao, V. S., Srinivas, K., Sujini, G., & Kumar, G. (2014). Protein-protein interaction detection: Methods andanalysis. International Journal of Proteomics, 2014, 147648, doi: 10.1155/2014/147648.
Resnik, P. (1995). Using information content to evaluate semantic similarity in a taxonomy. arXiv preprintcmp-lg/9511007.
Ritchie, D. W., & Kemp, G. J. (2000). Protein docking using spherical polar Fouriercorrelations. Proteins: Structure, Function, and Bioinformatics, 39(2), 178–194. doi:10.1002/(SICI)1097-0134(20000501)39:2%3c178::AID-PROT8%3e3.0.CO;2-6.
Rose, P. W., Prlic, A., Altunkaya, A., Bi, C., Bradley, A. R., Christie, C. H., . . . Burley, S. K. (2017). TheRCSB protein data bank: Integrative view of protein, gene and 3D structural information. Nucleic AcidsResearch, 45(D1), D271–D281. doi: 10.1093/nar/gkw1000.
Rual, J.-F., Venkatesan, K., Hao, T., Hirozane-Kishikawa, T., Dricot, A., Li, N., . . . Ayivi-Guedehoussou,N. (2005). Towards a proteome-scale map of the human protein–protein interaction network. Nature,437(7062), 1173–1178. doi: 10.1038/nature04209.
Sato, T., Yamanishi, Y., Horimoto, K., Kanehisa, M., & Toh, H. (2006). Partial correlation coefficientbetween distance matrices as a new indicator of protein–protein interactions. Bioinformatics, 22(20),2488–2492. doi: 10.1093/bioinformatics/btl419.
Sato, T., Yamanishi, Y., Kanehisa, M., & Toh, H. (2005). The inference of protein–protein interactions byco-evolutionary analysis is improved by excluding the information about the phylogenetic relationships.Bioinformatics, 21(17), 3482–3489. doi: 10.1093/bioinformatics/bti564.
Schlicker, A., Domingues, F., Rahnenfuhrer, J., & Lengauer, T. (2006). A new measure for functional similar-ity of gene products based on gene ontology. Bmc Bioinformatics, 7, 302. doi: 10.1186/1471-2105-7-302.
Ding and Kihara
24 of 27
Current Protocols in Protein Science
Scott, M. S., & Barton, G. J. (2007). Probabilistic prediction and ranking of human protein-protein interac-tions. Bmc Bioinformatics, 8(1), 239. doi: 10.1186/1471-2105-8-239.
Serebriiskii, I. G., & Golemis, E. A. (2001). Two-Hybrid System and False Positives: Approahesto Detection and Elimination. Two-Hybrid Systems: Methods and Protocols, 177, 123–134. doi:10.1385/1-59259-210-4:123.
Sharma, A. (2016). Computational gene expression profiling under salt stress reveals patterns of co-expression. Genomics Data, 7, 214–221. doi: 10.1016/j.gdata.2016.01.009.
Shen, J., Zhang, J., Luo, X., Zhu, W., Yu, K., Chen, K., . . . Jiang, H. (2007). Predicting protein–proteininteractions based only on sequences information. Proceedings of the National Academy of Sciences,104(11), 4337–4341. doi: 10.1073/pnas.0607879104.
Sigrist, C. J., Cerutti, L., de Castro, E., Langendijk-Genevaux, P. S., Bulliard, V., Bairoch, A., & Hulo, N.(2010). PROSITE, a protein domain database for functional characterization and annotation. NucleicAcids Research, 38(Database issue), D161–166. doi: 10.1093/nar/gkp885.
Skrabanek, L., Saini, H. K., Bader, G. D., & Enright, A. J. (2008). Computational prediction of protein–protein interactions. Molecular Biotechnology, 38(1), 1–17. doi: 10.1007/s12033-007-0069-2.
Snel, B., Bork, P., & Huynen, M. (2000). Genome evolution. Trends in Genetics, 16(1), 9–10. doi:10.1016/S0168-9525(99)01924-1.
Sonnhammer, E. L., & Ostlund, G. (2015). InParanoid 8: Orthology analysis between 273 proteomes, mostlyeukaryotic. Nucleic Acids Research, 43(Database issue), D234–239. doi: 10.1093/nar/gku1203.
Soong, T.-T., Wrzeszczynski, K. O., & Rost, B. (2008). Physical protein–protein interactions predicted frommicroarrays. Bioinformatics, 24(22), 2608–2614. doi: 10.1093/bioinformatics/btn498.
Sprinzak, E., & Margalit, H. (2001). Correlated sequence-signatures as markers of protein-protein interac-tion. Journal of Molecular Biology, 311(4), 681–692. doi: 10.1006/jmbi.2001.4920.
Stumpf, M. P., Thorne, T., de Silva, E., Stewart, R., An, H. J., Lappe, M., & Wiuf, C. (2008). Estimating thesize of the human interactome. Proceedings of the National Academy of Sciences, 105(19), 6959–6964.doi: 10.1073/pnas.0708078105.
Sun, J., Li, Y., & Zhao, Z. (2007). Phylogenetic profiles for the prediction of protein-protein interactions:How to select reference organisms? Biochemical and Biophysical Research Communications, 353(4),985–991. doi: 10.1016/j.bbrc.2006.12.146.
Sun, J., Xu, J., Liu, Z., Liu, Q., Zhao, A., Shi, T., & Li, Y. (2005). Refined phylogenetic profilesmethod for predicting protein–protein interactions. Bioinformatics, 21(16), 3409–3415. doi: 10.1093/bioinformatics/bti532.
Suyama, M., & Bork, P. (2001). Evolution of prokaryotic gene order: Genome rearrangements in closelyrelated species. Trends in Genetics, 17(1), 10–13. doi: 10.1016/S0168-9525(00)02159-4.
Szklarczyk, D., Franceschini, A., Wyder, S., Forslund, K., Heller, D., Huerta-Cepas, J., . . . Tsafou, K.P. (2014). STRING v10: Protein–protein interaction networks, integrated over the tree of life. NucleicAcids Research, gku1003.
Szklarczyk, D., Morris, J. H., Cook, H., Kuhn, M., Wyder, S., Simonovic, M., . . . von Mering, C. (2017).The STRING database in 2017: Quality-controlled protein-protein association networks, made broadlyaccessible. Nucleic Acids Research, 45(D1), D362–D368. doi: 10.1093/nar/gkw937.
Taghipour, S., Zarrineh, P., Ganjtabesh, M., & Nowzari-Dalini, A. (2017). Improving protein complex predic-tion by reconstructing a high-confidence protein-protein interaction network of Escherichia coli from dif-ferent physical interaction data sources. Bmc Bioinformatics, 18(1), 10. doi: 10.1186/s12859-016-1422-x.
Tamames, J., Casari, G., Ouzounis, C., & Valencia, A. (1997). Conserved clusters of function-ally related genes in two bacterial genomes. Journal of Molecular Evolution, 44(1), 66–73. doi:10.1007/PL00006122.
Tanabe, M., & Kanehisa, M. (2012). Using the KEGG database resource. Current Protocols in Bioinfor-matics, Chapter 1, Unit1 12. doi: 10.1002/0471250953.bi0112s38.
Tong, Z., Gao, Z., Wang, F., Zhou, J., & Zhang, Z. (2009). Selection of reliable reference genes forgene expression studies in peach using real-time PCR. BMC Molecular Biology, 10(1), 71. doi:10.1186/1471-2199-10-71.
Torchala, M., & Bates, P. A. (2014). Predicting the structure of protein–protein complexes using the Swar-mDock web server. Protein Structure Prediction, 1137, 181–197. doi: 10.1007/978-1-4939-0366-5_13.
Tovchigrechko, A., & Vakser, I. A. (2006). GRAMM-X public web server for protein-protein docking.Nucleic Acids Research, 34(Web Server issue), W310–314. doi: 10.1093/nar/gkl206.
Tsoka, S., & Ouzounis, C. A. (2000). Prediction of protein interactions: Metabolic enzymes are frequentlyinvolved in gene fusion. Nature Genetics, 26(2), 141–142. doi: 10.1038/79847.
Tuncbag, N., Gursoy, A., Nussinov, R., & Keskin, O. (2011). Predicting protein-protein interactions on aproteome scale by matching evolutionary and structural similarities at interfaces using PRISM. NatureProtocols, 6(9), 1341–1354. doi: 10.1038/nprot.2011.367. Ding and Kihara
25 of 27
Current Protocols in Protein Science
Valencia, A., & Pazos, F. (2002). Computational methods for the prediction of protein interactions. CurrentOpinion in Structural Biology, 12(3), 368–373. doi: 10.1016/S0959-440X(02)00333-0.
Venkatraman, V., Yang, Y. D., Sael, L., & Kihara, D. (2009). Protein-protein docking using region-based3D Zernike descriptors. Bmc Bioinformatics, 10(1), 407. doi: 10.1186/1471-2105-10-407.
Vinogradova, O., & Qin, J. (2011). NMR as a unique tool in assessment and complex determination of weakprotein–protein interactions NMR of Proteins and Small Biomolecules (pp. 35–45). Springer.
Walhout, A. J., Boulton, S. J., & Vidal, M. (2000). Yeast two-hybrid systems andprotein interaction mapping projects for yeast and worm. Yeast, 17(2), 88–94. doi:10.1002/1097-0061(20000630)17:2%3c88::AID-YEA20%3e3.0.CO;2-Y.
Walhout, A. J., Sordella, R., Lu, X., Hartley, J. L., Temple, G. F., Brasch, M. A., . . . Vidal, M. (2000). Proteininteraction mapping in C. elegans using proteins involved in vulval development. Science, 287(5450),116–122. doi: 10.1126/science.287.5450.116.
Wang, F., Liu, M., Song, B., Li, D., Pei, H., Guo, Y., . . . Zhang, D. (2012). Prediction and characterization ofprotein-protein interaction networks in swine. Proteome Science, 10(1), 2. doi: 10.1186/1477-5956-10-2.
Wass, M. N., Fuentes, G., Pons, C., Pazos, F., & Valencia, A. (2011). Towards the prediction of protein inter-action partners using physical docking. Molecular Systems Biology, 7(1), 469. doi: 10.1038/msb.2011.3.
Waterhouse, R. M., Tegenfeldt, F., Li, J., Zdobnov, E. M., & Kriventseva, E. V. (2013). OrthoDB: Ahierarchical catalog of animal, fungal and bacterial orthologs. Nucleic Acids Research, 41(D1), D358–D365. doi: 10.1093/nar/gks1116.
Wei, L., Xing, P., Zeng, J., Chen, J., Su, R., & Guo, F. (2017). Improved prediction of protein-proteininteractions using novel negative samples, features, and an ensemble classifier. Artificial Intelligence inMedicine, 83, 67–74. doi: 10.1016/j.artmed.2017.03.001.
Wei, Q., Khan, I. K., Ding, Z., Yerneni, S., & Kihara, D. (2017). NaviGO: Interactive tool for visualizationand functional similarity and coherence analysis with gene ontology. Bmc Bioinformatics, 18(1), 177.doi: 10.1186/s12859-017-1600-5.
Wetie, N., Armand, G., Sokolowska, I., Woods, A. G., Roy, U., Loo, J. A., & Darie, C. C. (2013). Investigationof stable and transient protein–protein interactions: Past, present, and future. Proteomics, 13(3-4), 538–557. doi: 10.1002/pmic.201200328.
Wong, L., You, Z.-H., Li, S., Huang, Y.-A., & Liu, G. (2015). Detection of protein-protein interactions fromamino acid sequences using a rotation forest model with a novel PR-LPQ descriptor. Paper presented atthe International Conference on Intelligent Computing.
Wong, P., Althammer, S., Hildebrand, A., Kirschner, A., Pagel, P., Geissler, B., . . . Schmidt, T. (2008). Anevolutionary and structural characterization of mammalian protein complex organization. Bmc Genomics[Electronic Resource], 9(1), 629. doi: 10.1186/1471-2164-9-629.
Wu, X., Pang, E., Lin, K., & Pei, Z.-M. (2013). Improving the measurement of semantic similarity betweengene ontology terms and gene products: Insights from an edge-and IC-based hybrid method. Plos One,8(5), e66745. doi: 10.1371/journal.pone.0066745.
Xenarios, I., Salwinski, L., Duan, X. J., Higney, P., Kim, S.-M., & Eisenberg, D. (2002). DIP, the Databaseof Interacting Proteins: A research tool for studying cellular networks of protein interactions. NucleicAcids Research, 30(1), 303–305. doi: 10.1093/nar/30.1.303.
Xu, F., Li, G., Zhao, C., Li, Y., Li, P., Cui, J., . . . Shi, T. (2010). Global protein interactome explo-ration through mining genome-scale data in Arabidopsis thaliana. Bmc Genomics [Electronic Resource],11(2), S2.
Yanai, I., Derti, A., & DeLisi, C. (2001). Genes linked by fusion events are generally of the same functionalcategory: A systematic analysis of 30 microbial genomes. Proceedings of the National Academy ofSciences, 98(14), 7940–7945. doi: 10.1073/pnas.141236298.
Yanai, I., Peshkin, L., Jorgensen, P., & Kirschner, M. W. (2011). Mapping gene expression in two Xenopusspecies: Evolutionary constraints and developmental flexibility. Developmental Cell, 20(4), 483–496.doi: 10.1016/j.devcel.2011.03.015.
Yang, L., Xia, J.-F., & Gui, J. (2010). Prediction of protein-protein interactions from protein sequence usinglocal descriptors. Protein and Peptide Letters, 17(9), 1085–1090. doi: 10.2174/092986610791760306.
Yerneni, S., Khan, I., Wei, Q., & Kihara, D. (2015). IAS: Interaction specific GO term associations forpredicting Protein-Protein Interaction Networks. IEEE/ACM Transactions on Computational Biologyand Bioinformatics, doi: 10.1109/TCBB.2015.2476809.
You, Z.-H., Chan, K. C., & Hu, P. (2015). Predicting protein-protein interactions from primary proteinsequences using a novel multi-scale local feature representation scheme and the random forest. PlosOne, 10(5), e0125811. doi: 10.1371/journal.pone.0125811.
You, Z.-H., Lei, Y.-K., Zhu, L., Xia, J., & Wang, B. (2013). Prediction of protein-protein interactions fromamino acid sequences with ensemble extreme learning machines and principal component analysis. BmcBioinformatics, 14(8), S10. doi: 10.1186/1471-2105-14-S8-S10.Ding and Kihara
26 of 27
Current Protocols in Protein Science
Yu, C.-Y., Chou, L.-C., & Chang, D. T.-H. (2010). Predicting protein-protein interactions in unbalanced datausing the primary structure of proteins. Bmc Bioinformatics, 11(1), 167. doi: 10.1186/1471-2105-11-167.
Yu, H., Paccanaro, A., Trifonov, V., & Gerstein, M. (2006). Predicting interactions in protein networks bycompleting defective cliques. Bioinformatics, 22(7), 823–829. doi: 10.1093/bioinformatics/btl014.
Zhang, Q. C., Petrey, D., Deng, L., Qiang, L., Shi, Y., Thu, C. A., . . . Hunter, T. (2012). Structure-basedprediction of protein-protein interactions on a genome-wide scale. Nature, 490(7421), 556–560. doi:10.1038/nature11503.
Zhang, S.-B., & Tang, Q.-R. (2016). Protein–protein interaction inference based on semantic similarity ofGene Ontology terms. Journal of Theoretical Biology, 401, 30–37. doi: 10.1016/j.jtbi.2016.04.020.
Zhou, Y., Zhou, Y.-S., He, F., Song, J., & Zhang, Z. (2012). Can simple codon pair usage predict protein–protein interaction? Molecular BioSystems, 8(5), 1396–1404. doi: 10.1039/c2mb05427b.
Zhou, Y. Z., Gao, Y., & Zheng, Y. Y. (2011). Prediction of protein-protein interactions using local descriptionof amino acid sequence Advances in Computer Science and Education Applications (pp. 254–262).Springer.
Zuiderweg, E. R. (2002). Mapping protein−protein interactions in solution by NMR spectroscopy. Bio-chemistry, 41(1), 1–7. doi: 10.1021/bi011870b.
Ding and Kihara
27 of 27
Current Protocols in Protein Science


!['Protein 3D Structure and Electron Microscopy Map ...dragon.bio.purdue.edu/paper/3DEMSurfer_CurrProtocol2017.pdf& Burley, 2016)] and Electron Microscopy Data Bank (EMDB; Lawson et](https://static.fdocuments.net/doc/165x107/5f642a94c561b240b33ca080/protein-3d-structure-and-electron-microscopy-map-burley-2016-and-electron.jpg)