Computational Medicine Volume 7417 || Microarray Meta-Analysis: From Data to Expression to...
19
Microarray Meta-Analysis: From Data to Expression to Biological Relationships 4 Julia Feichtinger, Gerhard G. Thallinger, Ramsay J. McFarlane, and Lee D. Larcombe Abstract Since the introduction of microarray technology, it has become the work- horse for mRNA expression profiling. Its application ranges from inves- tigating gene function, regulation, and co-expression, to clinical use in diagnosis and prognosis. Over the last decade, a large number of micro- array experiments have become available in public repositories often addressing similar or related hypotheses. The large compendia of gene expression data provide the opportunity to conduct meta-analyses by combining data from various independent but related studies. Such data integration has the potential to enhance the reliability and generalizability of the results of individual microarray studies. This chapter describes the meta-analysis process including objectives, data collection, annotation, analysis methods, and visualizations. For each step we present a selection of tools available and discuss associated problems and difficulties. 4.1 Introduction Microarray technology enables the investigation of tens of thousands of genes simultaneously in a single experiment. It is possible to capture the transcriptional state of a cell under different envi- ronmental, genetic, physiological, and pathologic conditions or at different stages of development, resulting in expression signatures that characterize such a state (Bullinger et al. 2004; Dhanasekaran et al. 2001; Furlong et al. 2001; Gasch et al. 2000; Ivanova et al. 2002; Lu et al. 2004; McDonald and Rosbash 2001; Ramalho-Santos et al. 2002; Ramaswamy et al. 2003; White et al. 1999). Expression signatures have high medical and clini- cal value, with the utility of microarrays in medical research being evidenced by the ability to classify subtypes of diseases and to predict targets for prog- nosis, diagnosis, and therapy (Alizadeh et al. 2000; Bullinger et al. 2004; Dhanasekaran et al. 2001; Golub et al. 1999; Perou et al. 1999; van’t Veer et al. 2002) as well as to measure drug responses (Dan et al. 2002; Shimizu et al. 2004; Staunton J. Feichtinger (*) North West Cancer Research Fund Institute, Bangor University, Bangor, Gwynedd LL572UW, UK Institute for Genomics and Bioinformatics, Graz University of Technology, Petersgasse 14, 8010 Graz, Austria e-mail: [email protected] Z. Trajanoski (ed.), Computational Medicine, DOI 10.1007/978-3-7091-0947-2_4, # Springer-Verlag Wien 2012 59
Transcript of Computational Medicine Volume 7417 || Microarray Meta-Analysis: From Data to Expression to...

Microarray Meta-Analysis: From Data toExpression to Biological Relationships 4Julia Feichtinger, Gerhard G. Thallinger, Ramsay J. McFarlane,and Lee D. Larcombe
Abstract
Since the introduction of microarray technology, it has become the work-
horse for mRNA expression profiling. Its application ranges from inves-
tigating gene function, regulation, and co-expression, to clinical use in
diagnosis and prognosis. Over the last decade, a large number of micro-
array experiments have become available in public repositories often
addressing similar or related hypotheses. The large compendia of gene
expression data provide the opportunity to conduct meta-analyses by
combining data from various independent but related studies. Such data
integration has the potential to enhance the reliability and generalizability
of the results of individual microarray studies.
This chapter describes the meta-analysis process including objectives,
data collection, annotation, analysis methods, and visualizations. For each
step we present a selection of tools available and discuss associated
problems and difficulties.
4.1 Introduction
Microarray technology enables the investigation of
tens of thousands of genes simultaneously in a
single experiment. It is possible to capture the
transcriptional state of a cell under different envi-
ronmental, genetic, physiological, and pathologic
conditions or at different stages of development,
resulting in expression signatures that characterize
such a state (Bullinger et al. 2004; Dhanasekaran
et al. 2001; Furlong et al. 2001; Gasch et al. 2000;
Ivanova et al. 2002; Lu et al. 2004; McDonald and
Rosbash 2001; Ramalho-Santos et al. 2002;
Ramaswamy et al. 2003; White et al. 1999).
Expression signatures have high medical and clini-
cal value, with the utility of microarrays in medical
research being evidenced by the ability to classify
subtypes of diseases and to predict targets for prog-
nosis, diagnosis, and therapy (Alizadeh et al. 2000;
Bullinger et al. 2004; Dhanasekaran et al. 2001;
Golub et al. 1999; Perou et al. 1999; van’t Veer
et al. 2002) as well as to measure drug responses
(Dan et al. 2002; Shimizu et al. 2004; Staunton
J. Feichtinger (*)
North West Cancer Research Fund Institute, Bangor
University, Bangor, Gwynedd LL572UW, UK
Institute for Genomics and Bioinformatics, Graz
University of Technology, Petersgasse 14,
8010 Graz, Austria
e-mail: [email protected]
Z. Trajanoski (ed.), Computational Medicine,DOI 10.1007/978-3-7091-0947-2_4, # Springer-Verlag Wien 2012
59
et al. 2001; Zembutsu et al. 2002). The clinical
potential of the technology as a diagnostic or prog-
nostic tool (Li et al. 2008) can be highlighted by the
FDA approval of the AmpliChip CYP450 from
Roche (de Leon et al. 2006) and the MammaPrint
from Agendia (Slodkowska and Ross 2009).
However, the identification of such sets of
differentially expressed genes distinguishing
one condition from another (e.g., healthy and
diseased) continually proves challenging. Varia-
tion from differences in experimental settings,
lack of validation, and, in particular, the small
sample size of many microarray studies compli-
cates the interpretation of the results, and calls
the reliability and reproducibility of individual
studies into question (Marshall 2004; Michiels
et al. 2005; Ntzani and Ioannidis 2003). An inte-
grative data analysis, a so-called meta-analysis,
can serve as a remedy by combining information
from independent but related studies in order to
enhance the statistical power, reliability, and
generalizability of results (Normand 1999;
Ramasamy et al. 2008). In addition to refining
and validating hypotheses between analogous
studies (Arasappan et al. 2011; Griffith et al.
2006; Grutzmann et al. 2005; LaCroix-Fralish
et al. 2011; Parmigiani et al. 2004; Rhodes
et al. 2002; Shen et al. 2004; Smith et al. 2008;
Vierlinger et al. 2011; Wang et al. 2004), meta-
analyses can be used to identify a meta-signature
across related studies (Anders et al. 2011; Daves
et al. 2011; Pihur et al. 2008; Rhodes et al. 2004);
to address novel questions (Chang et al. 2011;
Cheng et al. 2011; Wennmalm et al. 2005); and/
or to infer co-expression patterns and gene func-
tion (Lee et al. 2004; Stuart et al. 2003; Wren
2009; Zhou et al. 2005). Ultimately, meta-
analyses can provide the opportunity to maxi-
mize the use of available data to help to uncover
underlying biological mechanisms.
4.2 Microarray Technology andData Analysis
This section serves as a brief introduction into
microarray technology and data analysis to pro-
vide a basic understanding of this methodology.
4.2.1 Introduction to MicroarrayTechnology
Despite the completion of the human genome
sequencing project, questions remain addressing
expression, function, and regulation of genes,
which can be studied among others by mRNA
expression profiling. Techniques such as serial
analysis of gene expression (SAGE, Velculescu
et al. 1995), expressed sequence tags (ESTs,
Adams et al. 1991), and microarrays (Schena
et al. 1995) enable evaluation of the expression
of tens of thousands of genes in parallel. However,
since the introduction of microarray technology
by Schena et al. (1995), it has developed to
become the most widely used method for profiling
mRNA expression. In addition, microarrays can
characterize the genome by investigating single
nucleotide polymorphisms (SNPs, Kennedy et al.
2003; Teh et al. 2005), alternative RNA splicing
(Pan et al. 2004), or DNA copy number changes
(Pollack et al. 1999).
The underlying principle of microarray meth-
odology relies on hybridization between nucleic
acids (Southern et al. 1999). For expression stud-
ies, an RNA sample under investigation is reverse
transcribed into complementary DNA (cDNA),
labeled, and hybridized on an array. The array
represents a defined matrix of tens of thousands
of cDNA or oligonucleotide probes each
corresponding to a gene of interest and arrayed
onto a solid surface at distinct sites. After hybridi-
zation and washing, a scanner is used to detect
fluorescence intensities at each probe site (Burgess
2001; Gershon 2002; Schena et al. 1995). In con-
trast to such a single channel experiment, a two
channel experiment uses cDNA samples from two
diverse populations labeled with different fluoro-
phores. These are hybridized to the same array,
which results in relative amounts of transcripts
between the two populations, detectable as relative
fluorescence intensities (Shalon et al. 1996).
A number of microarray platforms have been
developed with the most popular being Affymetrix
(http://www.affymetrix.com/), NimbleGen (http://
www.nimblegen.com/), and Agilent (http://www.
home.agilent.com). In general, there are two meth-
ods of microarray fabrication: to manufacture
60 J. Feichtinger et al.
cDNA arrays, probes are spotted onto a surface
such as glass or silicon (Cheung et al. 1999),
whereas the production of oligonucleotide arrays
is based on direct synthesis of the probes onto the
array surface using photolithographic methods
(Lipshutz et al. 1999; Singh-Gasson et al. 1999)
or ink-jet printing (Blanchard et al. 1996). The
oligonucleotide arrays are widely used with Affy-
metrix having the highest market share. Affymetrix
arrays typically consist of 11–20 probe pairs per
gene, where each probe pair represents a perfectly
matching (PM) and a mismatching sequence (MM)
of 25 bp in length to distinguish between specific
and nonspecific hybridization events (Lipshutz
et al. 1999). Newer arrays, however, do not provide
MM sequences anymore, as studies showed that
MM sequences could not reliably be used to detect
nonspecific hybridization events (Irizarry et al.
2003; Wang et al. 2007).
4.2.2 Introduction to StandardMicroarray Data Analysis
After quantifying the raw images into fluores-
cence intensity values for each probe, the data
must undergo various preprocessing steps to
account for variation caused during the experi-
mental procedure (Nadon and Shoemaker 2002)
followed by a statistical analysis to compute dif-
ferentially expressed genes. The data analysis pro-
cess described here focuses on profiling mRNA
expression for single channel experiments using
Affymetrix arrays, but is generally applicable with
slight adaptations to other applications.
Preprocessing steps include (1) background
correction, (2) normalization, (3) summariza-
tion of probe intensities, and (4) filtering
(reviewed by Gentleman 2005; Suarez et al.
2009). Background correction is essential to
eliminate the noise originating from nonspecific
hybridization and the laser scanning process
(Gentleman 2005). Various methods have been
developed with the most popular being the
robust multi-array average (RMA, Irizarry
et al. 2003) and the MAS 5.0 background
(MicroArray Suite from Affymetrix, Hubbell
et al. 2002). Normalization is used to detect
and correct for systematic differences in the
overall distribution of probe intensity values,
and allows the comparison of data from differ-
ent chips (Owzar et al. 2008). Bolstad et al.
(2003) compare and review a number of nor-
malization methods including cyclic loess
(Dudoit et al. 2002), quantile (Bolstad et al.
2003), scaling (Affymetrix), and nonlinear
methods (Li and Hung Wong 2001; Schadt
et al. 2001). Another widely used normalization
method, Variance Stabilization and Normaliza-
tion (VSN), was introduced by Huber et al.
(2002). After normalization, summarization of
probe intensities is necessary to establish a sin-
gle expression value for each gene. Among the
more common methods are Li–Wong (Li and
Wong 2001), median polish (Tukey 1977),
and summarization methods from Affymetrix.
Finally, filtering may be applied to eliminate
genes, which for example exhibit relatively
low variability across the samples. Filtering
increases the statistical power, as it reduces the
number of hypotheses to be tested (Gentleman
2005; Owzar et al. 2008).
Following preprocessing, a statistical analysis
serves to identify significant genes that are dif-
ferentially expressed under certain conditions.
Various approaches have been developed (Cui
and Churchill 2003; Suarez et al. 2009) ranging
from simple fold-change (FC) criteria (DeRisi
et al. 1997) and ordinary t tests (Callow et al.
2000), to more sophisticated methods including
moderated t test (Limma, Smyth 2004), Bayesian
methods (Lo and Gottardo 2007), rank product
statistics (Breitling et al. 2004), Analysis of Var-
iance (ANOVA, Sahai and Ageel 2000), or per-
mutation methods such as Significance Analysis
of Microarrays (SAM, Tusher et al. 2001).
Microarray data analysis is often now per-
formed using R (R Core Team 2012) and the
Bioconductor libraries (http://www.bioconduc-
tor.org/). Numerous R packages have been devel-
oped to facilitate microarray data analysis such
as the popular “affy” R package (Gautier et al.
2004a). Alternatives are Matlab (http://www.
mathworks.co.uk/) or other platforms developed
such as Genesis (Sturn et al. 2002) and TM4
(Saeed et al. 2006), with commercial data
4 Microarray Meta-Analysis: From Data to Expression to Biological Relationships 61
analysis software such as GeneSpring GX from
Agilent Technologies (http://www.genespring.
com/) and GeneMaths XT (http://www.applied-
maths.com/) also available.
4.3 Meta-Analysis: “The Analysisof Analyses”
Large amounts of microarray data are now avail-
able in public repositories and provide research-
ers the opportunity to retrieve, integrate, and
reanalyze the data (Moreau et al. 2003). So-
called meta-analysis techniques aim to combine
the data available and integrate information from
multiple independent but related microarray
experiments to identify significant genes (Nor-
mand 1999; Ramasamy et al. 2008).
A meta-analysis consists of (1) objective defi-
nition, (2) data collection; (3) data preprocessing
and selection of differentially expressed genes, (4)
annotation, (5) analysis of differentially expressed
genes across studies, and (6) data interpretation
and presentation (Ramasamy et al. 2008). Points
(1)–(5) are discussed below including the asso-
ciated advantages, problems, and difficulties.
The last point is discussed in the final section by
presenting a couple of examples for visualization
of complex data.
4.3.1 Advantages of Meta-Analysisand Its Objectives
Combining studies can enhance reliability and
generalizability of the results (Ramasamy et al.
2008) and is generally used to obtain a more
precise estimate of gene expression. In particular,
the benefit of increasing the statistical power can
help to overcome probably the most profound
limitation of microarray studies: testing tens of
thousands of hypotheses, relying only on rela-
tively few samples (Campain and Yang 2010;
Normand 1999).
Combining microarray datasets is only sensible
if the individual microarray experiments address
similar or related questions. It may be used (1) to
reveal a more valid set of differentially expressed
genes in analogous studies (Arasappan et al. 2011;
Griffith et al. 2006; Grutzmann et al. 2005;
LaCroix-Fralish et al. 2011; Parmigiani et al.
2004; Rhodes et al. 2002; Shen et al. 2004;
Smith et al. 2008; Vierlinger et al. 2011; Wang
et al. 2004), (2) to identify an overlap of genes in
related studies—a meta-signature (Anders et al.
2011; Daves et al. 2011; Pihur et al. 2008; Rhodes
et al. 2004), (3) to test new hypotheses (Chang
et al. 2011; Cheng et al. 2011; Wennmalm et al.
2005), or (4) to gain insights into co-expression
patterns and gene function (Lee et al. 2004; Stuart
et al. 2003; Wren 2009; Zhou et al. 2005). Meta-
analyses can aid to determine subtypes of dis-
eases, targets for prognosis, treatment, diagnosis,
and monitoring as well as treatment effects or
signatures for biological mechanisms and condi-
tions, and thus can lead to a more accurate under-
standing of underlying biological mechanisms.
Meta-analyses can eliminate artifacts of indi-
vidual but analogous studies (e.g., a given cancer
type) or resolve conflicting results between anal-
ogous studies to refine and validate primary
hypotheses (Normand 1999; Rhodes et al.
2002). Biological, experimental, and technologi-
cal variations including differences in experi-
mental conditions, tissues, cell lines, species,
platforms, sample treatment, and processing can
lead to inconsistencies in gene expression, which
reflect the differences in the experimental setting
in addition to the objective studied (Cahan et al.
2007). Combining studies can eliminate these
variations and identify a more valid set of differ-
entially expressed genes; for example, LaCroix-
Fralish et al. (2011) analyzed the results of exist-
ing tonic/chronic pain microarray studies and
could identify a more accurate set of differen-
tially expressed genes. Similarly, Arasappan
et al. (2011) found a refined expression signature
for systemic lupus erythematosus, and Vierlinger
et al. (2011) reported the identification of a
potential biomarker for papillary thyroid carci-
noma (PTC) by merging of microarray datasets
comparing PTC nodules to benign nodules.
Another closely related objective is to identify
a common transcriptional profile—a meta-
signature. A meta-signature is an overlap of
genes, which is shared within a given group across
62 J. Feichtinger et al.
related studies (e.g., across cancer studies). In one
microarray experiment hundreds of genes can be
declared as significant, of which numerous might
be spurious or system-specific and thus are
expected to show no change across related studies.
In contrast, core features are expected to be over-
represented (Pihur et al. 2008; Rhodes et al. 2004).
Daves et al. (2011), for example, reported a com-
mon meta-signature for metastasis by means of
comparing primary to metastatic tumors in vari-
ous types of cancer, while Anders et al. (2011)
detected angiogenesis-related meta-signatures in
cancer.
Gene function can also be inferred through
meta-analysis. Since genes are conditionally
expressed, groups of co-expressed genes can aid
functional annotation by assuming associated func-
tions (Troyanskaya 2005). Conducting a global
meta-analysis can predict gene function based on
the recurrent expression pattern of co-regulated
genes across various conditions (Wren 2009).
Novel questions may be addressed by con-
ducting a meta-analysis. According to Wenn-
malm et al. (2005) the observed expression
pattern of senescence in cell cultures resembles
that of aging in mouse but not in humans. Chang
et al. (2011) identified housekeeping and tissue-
selective genes across 43 tissues by means of
meta-analysis, whereas Cheng et al. (2011)
reported potential reference genes for 13 tissue
types across 4 physiological states, which may be
used for normalization of quantitative real-time
polymerase chain reaction (qRT-PCR).
4.3.2 Data Collection and QualityControl
There are two types of data suitable for meta-
analyses: the raw data (probe intensities) and the
published results (gene lists, Cahan et al. 2007;
Ramasamy et al. 2008). Processed data is more
frequently available than raw data; Larsson and
Sandberg (2006) stated that only 48 % of pub-
lished microarray experiments in GEO and
ArrayExpress are available in the form of raw
data. Nevertheless, it is recommended to use raw
data, as results of microarray analyses depend on
the genes covered in the study, the preprocessing
steps, the annotation methods, and the data anal-
ysis techniques used. In addition, information
about all other genes not in the list (Suarez-
Farinas et al. 2005).
Public repositories (Table 4.1) such as ArrayEx-
press (Parkinson et al. 2009), Gene Expression
Omnibus (GEO, Barrett et al. 2011), Center for
Information Biology Gene Expression database
(CIBEX, Ikeo et al. 2003), and Stanford Microar-
ray Database (SMD, Hubble et al. 2009) collect
raw and processed microarray data from diverse
platforms and provide it to the public. Recently, a
number of more specialized databases (Table 4.1)
have become available. Databases such as M2DB
(Cheng et al. 2010) and M3D (Faith et al. 2008)
collected microarray data and uniformly prepro-
cessed it. Databases such as L2L (Newman and
Weiner 2005) provide published gene lists, which
can be compared to the user’s ownmicroarray data.
To facilitate querying of popular databases
(Table 4.1), interfaces have been implemented
such as Geometadb (Zhu et al. 2008), the “GEO-
query” R package (Davis and Meltzer 2007), the
“ArrayExpress” R package (Kauffmann et al.
2009), and MaRe (Ivliev et al. 2008).
Varying results observed between studies
raised concerns about the comparability of
microarray experiments and led to the question-
ing of reproducibility, repeatability, and valida-
tion of microarrays in the research community
(Marshall 2004; Michiels et al. 2005; Ntzani and
Ioannidis 2003). Intensive studies were carried
out to assess the reproducibility across platforms
and laboratories, in particular driven by the
MicroArray Quality Control (MAQC) project
(Shi et al. 2006). In general, agreement in cross-
platform and cross-laboratory experiments was
achieved if the preparation and the consumables
were appropriately handled (Irizarry et al. 2005;
Larkin et al. 2005; Shi et al. 2006; Shippy et al.
2006). In particular, Affymetrix platforms
provided the most consistent results across mul-
tiple laboratories (Irizarry et al. 2005). Recent
studies suggest that poor quality data is responsi-
ble for the differences between experiments,
4 Microarray Meta-Analysis: From Data to Expression to Biological Relationships 63
which may be due to lack of standards as well as
inadequate experimental procedures, statistical
analysis, validation, and/or reporting of the stud-
ies (Dupuy and Simon 2007; Jafari and Azuaje
2006; Shi et al. 2005). According to a study by
Larsson and Sandberg (2006), only 23 % of the
raw data in GEO and ArrayExpress meet the
quality requirements for RNA integrity and
hybridization sensitivity to be considered as reli-
able datasets (Larsson and Sandberg 2006).
Hence one should access the data quality, and
poor quality data should then be excluded to
assure comparability. The introduction of the
Minimum Information About aMicroarray Exper-
iment (MIAME) standard led to an improvement
by requiring comprehensive reporting of sample,
experimental, and array design to allow proper
interpretation of microarray experiments (Brazma
et al. 2001). A number of journals now require
the submission of microarray data to a public
repository preferable in a format that agrees
with MIAME (Ball et al. 2004). Ultimately,
good laboratory practice and well-controlled
experiments assure reproducibility, as the quality
of the meta-analysis can only be as good as the
quality of the underlying data (Shi et al. 2006).
4.3.3 Data Preprocessing andSelection Criteria
Numerous preprocessing and data analysis meth-
ods for microarrays have been proposed over the
years to include background correction, normali-
zation, measure summarization, and filtering
(cf. Sect. 4.3).
The impact of preprocessing on reproducibil-
ity of microarrays has been intensively studied
(Irizarry et al. 2005; Owzar et al. 2008; Patterson
et al. 2006; Shippy et al. 2006). Inconsistencies
were found when comparing differently prepro-
cessed datasets, even when different methods
were applied to the same dataset (Gagarin et al.
2005; Owzar et al. 2008). Irizarry et al. (2005)
claim that alternative preprocessing methods
such as RMA (Irizarry et al. 2003) can improve
cross-study and cross-platform agreement. In
contrast, other studies showed that preprocessing
methods had very little impact on the resulting
gene lists when following the manufacturer’s
recommendations (Patterson et al. 2006; Shi
et al. 2006; Shippy et al. 2006). Nevertheless, it
is advisable to uniformly preprocess the raw data
to account for any systematic differences.
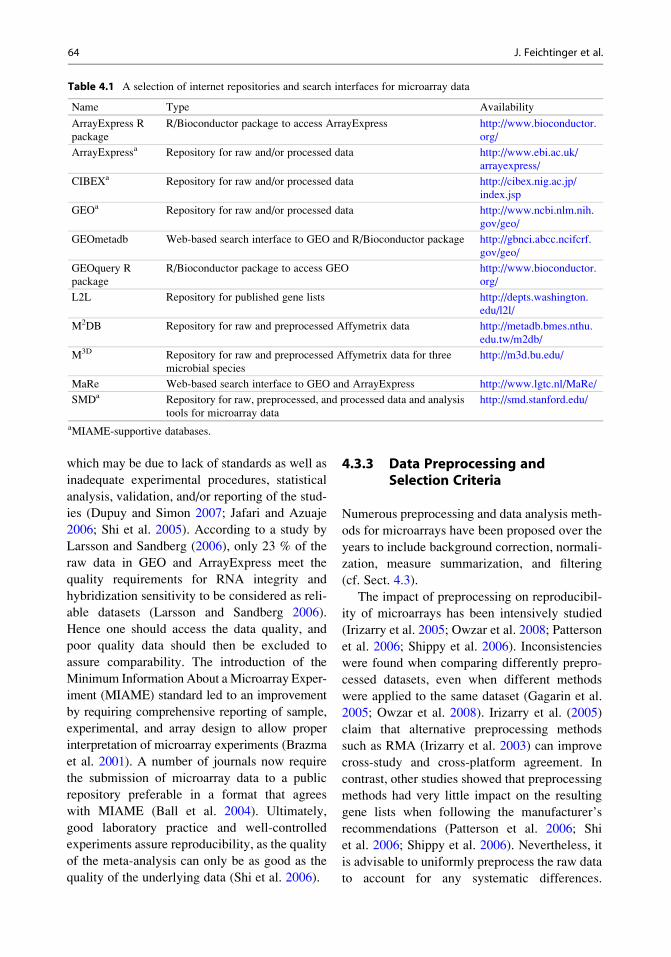
Table 4.1 A selection of internet repositories and search interfaces for microarray data
Name Type Availability
ArrayExpress R
package
R/Bioconductor package to access ArrayExpress http://www.bioconductor.
org/
ArrayExpressa Repository for raw and/or processed data http://www.ebi.ac.uk/
arrayexpress/
CIBEXa Repository for raw and/or processed data http://cibex.nig.ac.jp/
index.jsp
GEOa Repository for raw and/or processed data http://www.ncbi.nlm.nih.
gov/geo/
GEOmetadb Web-based search interface to GEO and R/Bioconductor package http://gbnci.abcc.ncifcrf.
gov/geo/
GEOquery R
package
R/Bioconductor package to access GEO http://www.bioconductor.
org/
L2L Repository for published gene lists http://depts.washington.
edu/l2l/
M2DB Repository for raw and preprocessed Affymetrix data http://metadb.bmes.nthu.
edu.tw/m2db/
M3D Repository for raw and preprocessed Affymetrix data for three
microbial species
http://m3d.bu.edu/
MaRe Web-based search interface to GEO and ArrayExpress http://www.lgtc.nl/MaRe/
SMDa Repository for raw, preprocessed, and processed data and analysis
tools for microarray data
http://smd.stanford.edu/
aMIAME-supportive databases.
64 J. Feichtinger et al.
Unfortunately, this may be difficult for meta-
analyses combining cross-platform data, as few
preprocessing methods can be applied to all plat-
forms (Ramasamy et al. 2008).
The selection criteria for differentially
expressed genes can also affect the reproducibil-
ity. The use of FC criteria proved to generate
more reproducible results than solely relying on
p value criteria. Also more sophisticated methods
such as SAM (Tusher et al. 2001) did not
improve the reproducibility (Shi et al. 2005,
2006). However, using a non-stringent p value
cutoff in addition to FC criteria generated the
highest overlap in differentially expressed gene
lists (Guo et al. 2006).
4.3.4 Annotation
In order to interpret the results of a microarray
study, probe-level identifiers (e.g., Affymetrix
IDs or I.M.A.G.E. cloneIDs) need to be linked
to the corresponding gene identifiers (e.g.,
Entrez Gene IDs or Ensembl IDs). To do so,
one can use the annotation files provided by
Affymetrix (http://www.affymetrix.com/sup-
port/technical/annotationfilesmain.affx), the
Bioconductor annotation packages (http://
www.bioconductor.org/packages/release/data/
annotation/), or web tools such as IDconverter
(Alibes et al. 2007), SOURCE (Diehn et al.
2003), RESOURCERER (Tsai et al. 2001),
DAVID (Dennis et al. 2003), or MADGene
(Baron et al. 2011) (Table 4.2). Several tools not
only allow mapping of identifiers but also provide
annotation with additional biological information
and/or comparison to other species. Alternatively,
alignment algorithms such as BLAST (Altschul
et al. 1990) may be used to map probes based on
sequence similarity (Shi et al. 2006) by means of
databases such as RefSeq (Pruitt et al. 2009) or
the TIGR Gene Index databases (now the DFCI
Gene Index, Lee et al. 2005).
Annotation poses a challenge for various rea-
sons. It has been suggested that the annotation
method used could have an effect on the resulting
gene list and therefore might be responsible for
inconsistencies between platforms (Irizarry et al.
2005). Thus, the annotation method should be
consistent across all microarray experiments if
possible (Ramasamy et al. 2008). First, diverse
platforms do not use a unique nomenclature or
common identifiers, which impairs gene annota-
tion and thus comparability of results (Cahan
et al. 2007). Second, as gene annotation is not
yet complete, genome databases are incomplete,
which in turn affects microarray annotation
(Brors 2005; Shi et al. 2006). Third, probe dis-
parities can cause inconsistencies, as probes used
to measure gene expression may differ depend-
ing on the platform. These disparities may be due
to different sensitivity and/or specificity, in par-
ticular if splice variants are involved (Cahan
et al. 2007; Shi et al. 2006). Fourth, the available
platforms differ not only in hybridization tech-
nique but also in coverage. A lot of arrays do not
cover the complete genome and thus the tran-
script coverage could cause differences in the
resulting gene list (Cahan et al. 2007). Finally,
not all probes map to one gene and vice versa, as
probes might not be specific enough due to cross-
hybridization from splice variants or closely
related genes (Ramasamy et al. 2008; Shi et al.
2006). This led to the proposal of alternative
mappings of probes to genes for Affymetrix
chips (Gautier et al. 2004b; Harbig et al. 2005).
4.3.5 Analysis Methods
Numerous meta-analysis approaches have been
developed over the last century that have more
recently been adapted for application to micro-
array experiments. These can generally be
divided into two categories: relative and absolute
methods, where the former analyzes each study
(microarray experiment) and combines the
results, and the latter combines the data first
and subsequently analyzes it with traditional
techniques (reviewed by Campain and Yang
2010; Hong and Breitling 2008; Larsson et al.
2006; Ramasamy et al. 2008).
A brief summary of developed strategies and a
selection of available tools are given in Table 4.3.
The strategies discussed here are based on a two-
class comparison (e.g., cancer vs. normal) for
single channel experiments with the focus mainly
on relative approaches.
4 Microarray Meta-Analysis: From Data to Expression to Biological Relationships 65

4.3.5.1 Vote Counting StrategiesVote counting strategies are based on the number
of studies reporting gene i to be differentially
expressed (Bushman 1994). Rhodes et al. (2004)
applied such a vote counting approach to micro-
array experiments and assessed the significance
by random permutation testing. Additionally,
they collected and analyzed cancer microarray
data that is publically accessible via the data-
mining platform Oncomine (Rhodes et al. 2007).
The Gene Expression Atlas is another data-
mining platform that is provided by the European
Bioinformatics Institute (EBI) and relies on
curated microarrays derived from the ArrayEx-
press repository. The expression profile of a
given gene i across numerous conditions,
Table 4.2 A selection of useful annotation tools for microarrays
Name Type Availability
Affymetrix
annotation files
Annotation files of the manufacturer http://www.affymetrix.com/
support/technical/
annotationfilesmain.affx
Bioconductor
annotation
packages
R packages for annotation http://www.bioconductor.org/
packages/release/data/
annotation/
DAVID ID conversion, functional annotation, and classification http://david.abcc.ncifcrf.gov/
IDconverter ID converter http://idconverter.bioinfo.cnio.
es/
MADGene ID converter http://cardioserve.nantes.inserm.
fr/madtools/
RESOURCERER Annotation for common platforms including
comparisons within and across species
http://compbio.dfci.harvard.edu/
cgi-bin/magic/r1.pl
Source Mapping of feature identifiers and annotation with
additional information from various databases
http://smd.stanford.edu/cgi-bin/
source/sourceSearch
Table 4.3 A selection of available meta-analysis tools
Name Strategy Implementation Availability
A-MADMAN Absolute method Web platform http://compgen.bio.unipd.it/bioinfo/
amadman/
Gene
Expression
Atlas
Vote counting Web platform http://www.ebi.ac.uk/gxa/
GeneMeta Effect size combination R package http://www.bioconductor.org/packages/
2.8/bioc/html/GeneMeta.html
GeneSapiens Absolute method Web platform http://www.genesapiens.org/
Genevestigator Absolute method Web platform https://www.genevestigator.com/
MAMA 9 in 1 package includes, e.g.,
RankProd and metaMA
R package http://cran.r-project.org/src/contrib/
Archive/MAMA/
metaArray Integrative correlation
strategy
R package http://www.bioconductor.org/packages/
2.10/bioc/html/metaArray.html
metaMA Effect size and p value
combination
R package http://cran.r-project.org/web/packages/
metaMA/
METRADISC Rank aggregation Compaq Visual
Fortan90 software
http://biomath.med.uth.gr
Oncomine Vote counting Web platform https://www.oncomine.org/
RankAggreg Rank aggregation R package http://cran.r-project.org/web/packages/
RankAggreg/
RankProd Rank aggregation R package http://www.bioconductor.org/packages/
release/bioc/html/RankProd.html
66 J. Feichtinger et al.
developmental stages, and tissues can be viewed
(http://www.ebi.ac.uk/gxa/).
Other related approaches have been devel-
oped. Griffith et al. (2006), for example, applied
a vote counting strategy to processed data and
calculated the significance by means of a Monte
Carlo simulation.
4.3.5.2 Rank Aggregation StrategiesRank combination strategies consider the individ-
ual rank orders of each gene i across k lists (indi-vidual results of microarray experiments) to
merge them to an aggregated rank order. One
possibility is to aggregate relative preferences of
paired items across k lists. Fagin et al. (2003)
described possible distance measures between
top x lists and Dwork et al. (2001) proposed
aggregating these relative preferences by means
of Markov algorithms. DeConde et al. (2006)
adopted this technique for microarray experiments
by first computing pair-wise comparisons of the
ranks of gene i and i’ relative to each other based
on an extension of Kendall’s tau for two noniden-
tical but overlapping top x lists t1 and t2 (Faginet al. 2003; Kendall 1938), described as:
KðpÞðt1; t2Þ ¼X
i;i02Pðt1;t2Þ�KðpÞii0 ðt1; t2Þ
where i 6¼ i0
Pðt1; t2Þ is the set of all paired items i and i’
and �KðpÞii0 ðt1; t2Þ represents the penalty value for
the paired items i and i’. The values range from
0 to 1 depending on whether the pair is concor-
dantly (0) or discordantly ranked (1) across the
two lists. If the ordering cannot be inferred, a
penalty parameter p is defined (0 < p < 1). Sec-
ond, DeConde et al. (2006) converted the pair-
wise comparisons into aggregate rankings by
means of three different algorithms: a Thur-
stone’s order-statistics model (Thurstone 1931)
and two Markov chain algorithms Dwork et al.
(2001). The twoMarkov chain algorithms use the
pair-wise comparisons to define a transition
matrix M. For a set of genes (states) G, M repre-
sents the relative preference for gene i over gene
i’ across k microarray experiments, and the
aggregation of the rankings is given by the sta-
tionary distribution p of the Markov chain. The
stationary distribution p is the principal left
eigenvector of the transition matrix M associated
with an eigenvalue of 1. p reflects a natural order
for G, where the highest value in p corresponds
to the gene with the highest rank order (DeConde
et al. 2006; Dwork et al. 2001) as shown below:
M ¼ g� g
G ¼ f1; 2; . . . ; gg
p ¼ p �M
Pihur et al. (2008) developed a closely related
approach, which is also based on distance mea-
sures between top x lists. The method is publi-
cally available as the “RankAggreg” R package
(Pihur et al. 2009). For measuring the distance
between two top x lists, one can choose between
Spearman’s foot rule (Spearman 1904) and Ken-
dall’s tau (Kendall 1938), and both distance mea-
sures can be additionally weighted. They provide
two rank aggregation algorithms: the Cross-
Entropy Monte Carlo and the Genetic algorithm
(Pihur et al. 2008, 2009).
A further rank aggregation strategy,
“RankProd”, was developed by Breitling et al.
(2004) and is also available as an R package
(Hong et al. 2006). The method is based on FC
criteria, where for two experimental conditions A
and B,M ¼ nA � nB represents the pair-wise FC
ratios for each gene i in a dataset j with n ¼ nA +nB samples. A rank product is computed based
on the ranks ri for gene i across all k datasets and
all s pair-wise comparisons, and significance is
determined by permutation testing (Breitling
et al. 2004; Hong et al. 2006):
An1
Bn1
;An1
Bn2
; . . . ;AnB
BnB
) nA � nB
RPi ¼Ykj¼1
Ysc¼1
rijc
!1=s
Another rank combination method, Meta-
Analysis of Ranked Discovery Datasets
(METRADISC), was proposed by Zintzaras and
4 Microarray Meta-Analysis: From Data to Expression to Biological Relationships 67

Ioannidis (2008), and allows the incorporation of
heterogeneity between studies. An average rank
r* and a heterogeneity metric q* are computed for
each gene i across k datasets as:
r�i ¼Pk
j¼1 rij
k
q�i ¼Xkj¼1
ðrij � r�i Þ2
The significance of r* and q* is calculated via
Monte Carlo permutation testing. The METRA-
DISC software is publically available for down-
load (http://biomath.med.uth.gr).
4.3.5.3 p Value Combination Strategiesp Value combination strategies pool p values
from independent studies to determine if a vari-
able (gene) i is significant (reviewed by Loughin
2004). A popular method is the sum of logs
strategy proposed by Fisher (1932), whereby
the p values of each study j are used to generate
a summary statistic Si:
Si ¼ �2Xkj¼1
logðpijÞ
To determine the p value for Si, Si can be
assumed to follow a w2 distributionwith 2 k degreesof freedom. This method was applied to microarray
data by Rhodes et al. (2002), whereby they com-
puted p values for gene i in a dataset j by random
permutation t tests, combined them by means of
Fisher’s method (Fisher 1932), and assessed Si by
permutation testing (Rhodes et al. 2002).
Alternatively, z scores may be used instead of
p values. This so-called inverse normal method
was introduced by Stouffer (1949) and allows
assigning a weight wi to each individual study j
(Hedges et al. 1992; Stouffer 1949; Whitlock
2005). This can be described as follows, where
pij is the one-tailed p value corresponding to the
t test of study j for gene i and F represents the
normal distribution function:
zijðpijÞ ¼ �F�1ðpijÞ
zi ¼Pk
j¼1 zijffiffiffik
p
zi ¼Pk
j¼1 wjzijffiffiffiffiffiffiffiffiffiffiffiffiffiffiffiffiffiPkj¼1 w
2j
q
The “metaMA” R package provides p value
combination strategies based on Fisher’s and
Stouffer’s methods (Marot et al. 2009).
4.3.5.4 Effect Size Combination StrategiesThe effect size is a standardized, scale-free mea-
sure of the magnitude of a difference between two
groups (Cohen 1988). For a meta-analysis, the
effect size estimates from each individual study j
can be combined to an overall estimate of the size
of the effect. Choi et al. (2003) proposed an effect
size-based meta-analysis method for microarrays,
whereby they calculate the effect size using
Cohen’s d (Cohen 1988) modified to Hedges’ g*
(Hedges and Olkin 1985) using a correction fac-
tor, which accounts for the sample size bias:
dij ¼�xAij
� �xBij
sij
gij ¼�xAij
� �xBij
s�j
g�ij ¼ gij � 1� 3
4n� 9
� �
Here �xA and �xB are the means of the two
groups for n samples with the standard deviation
s and the pooled standard deviation s*.The overall mean of differential expression m
for each gene i across all k datasets can be
extracted from the following model, where g�i is
the effect size and yj the study-specific mean of
study j. ej represents the within-study effect with
the corresponding variance s2i , whereas dj is thebetween-study effect with the corresponding vari-
ance t2:
g�ij ¼ yij þ eij; eij � Nð0; s2ijÞyij ¼ mi þ dij; dij � Nð0; t2i Þ
68 J. Feichtinger et al.
For the random-effects model, t2 can be esti-
mated using a method developed by DerSimo-
nian and Laird (1986). In contrast to the random-
effects model, the fixed-effects model assumes
that the between-study variances are 0 and may
be used when the studies show biological and
technical uniformity (Ramasamy et al. 2008).
“GeneMeta” (Lusa et al. 2006) is an available R
package for microarray meta-analysis based on
Choi et al. (2003) as described above.
Marot et al. (2009) suggested an adaptation of
such approaches, whereby they use moderated
effect sizes by relating to moderated t tests. The
effect size resembles the t test apart from the
factorffiffiffi~n
p, which accounts for the sample size:
tij ¼ dij �ffiffiffiffiffi~nij
p
~nij ¼nAij
� nBij
nAijþ nBij
t can be calculated using Limma (Smyth
2004) or other variance shrinkage approaches.
The “metaMA” R package (Marot et al. 2009)
provides various meta-analysis strategies includ-
ing the methods based on Choi et al. (2003) and
Marot et al. (2009).
4.3.5.5 Other StrategiesAn integrative correlation (IC) strategy to define
reproducible genes was proposed by Parmigiani
et al. (2004), which was, in combination with the
generation of a probability of expression matrix
Ej (Parmigiani et al. 2002), implemented into the
“metaArray” R package (Choi et al. 2007). First,
the expression values for g genes across n sam-
ples are transformed into Ej:
Ej ¼ g� n
eia
�1 under expressed
0 not differentially expressed
1 over expressed
8<:
Second, correlations for all pairs of genes i
and i’ in a study j are computed by means of the
Pearson correlation coefficient rii0j and summar-
ized as a mean of the correlations per study �rj.Third, the integrative correlation Iijj0 for gene i
for two datasets j and j0 is given by:
Iijj0 ¼Xgi0¼1
ðrii0j � �rjÞ � ðrii0j0 � �rj0 Þ
where 6¼ i0 and j 6¼ j0
For more than two studies, the average of all
integrative correlations for a certain gene i repre-sents a reproducibility score. All genes with a
score above a certain threshold are deemed to
be reproducible (Parmigiani et al. 2004).
Campain and Yang (2010) proposed a method
described as meta Differential Expression via
Distance Synthesis (mDEDS), which relies on
combining multiple statistical measures such as
FC, SAM, and t values from standard or moder-
ated statistics to identify true differently
expressed genes.
Various absolute approaches have been
reported including the web-based platforms Gene-
Sapiens (Kilpinen et al. 2008) and Genevestigator
(Hruz et al. 2008). Such platforms enable to com-
pare the expression values of samples that have
been pooled and uniformly preprocessed, and pro-
vide insight in gene expression across numerous
conditions and tissues. In addition, the web-
application A-MADMAN (Bisognin et al. 2009)
allows retrieving, annotating, and pooled prepro-
cessing of microarray datasets. It outputs expres-
sion values, which can be fed into a custom R
analysis.
Furthermore, approaches incorporating addi-
tional information were developed, such as the
literature-aided meta-analysis reported by Jelier
et al. (2008) and the pathway-based approach
proposed by Arasappan et al. (2011). The intro-
duction of additional quality weights can further
enhance the statistical power of meta-analyses
(Hu et al. 2006).
4.3.5.6 Strategy ComparisonOpinions about the performance of meta-analysis
strategies differ. Hong and Breitling (2008) con-
ducted a comparison of three meta-analysis stra-
tegies: rank aggregation by Breitling et al.
4 Microarray Meta-Analysis: From Data to Expression to Biological Relationships 69
(2004), Fisher’s method (Fisher 1932), and effect
size combination by Choi et al. (2003). Accord-
ing to Hong and Breitling (2008) the rank aggre-
gation strategy demonstrates greater sensitivity
and reproducibility, in particular concerning
small sample sizes and high between-study var-
iations. A comparison presented by Campain and
Yang (2010) evaluated eight different methods
including six methods described above and two
absolute strategies. Most methods performed rea-
sonably well for similar-platform meta-analyses,
but struggled with cross-platform analyses. Fish-
er’s method (Fisher 1932), the integrative correla-
tion strategy (Parmigiani et al. 2002; Parmigiani
et al. 2004), and mDEDS (Campain and Yang
2010) outperformed the other methods under
such conditions. In contrast, Ramasamy et al.
(2008) favored the effect size combination stra-
tegies, primarily due to the value of weighting
each study. The disadvantage of vote counting
strategies is that only significant genes of the
individual studies are considered for meta-
analysis. Combining p values can increase the
significance of the results, but does not provide
the magnitude of the effect or a direction of
significance if two-sided p values are used
(Ramasamy et al. 2008).
4.4 Visualization of Complex Data
Results of single microarray studies are usually
presented in the form of heatmaps or clustered
heatmaps (Eisen et al. 1998) to illustrate the simi-
larities of expression patterns across groups of
genes or samples. Heatmaps are grids, in which
color ranges are used to reflect the expression
value. Coherent color patterns derive from
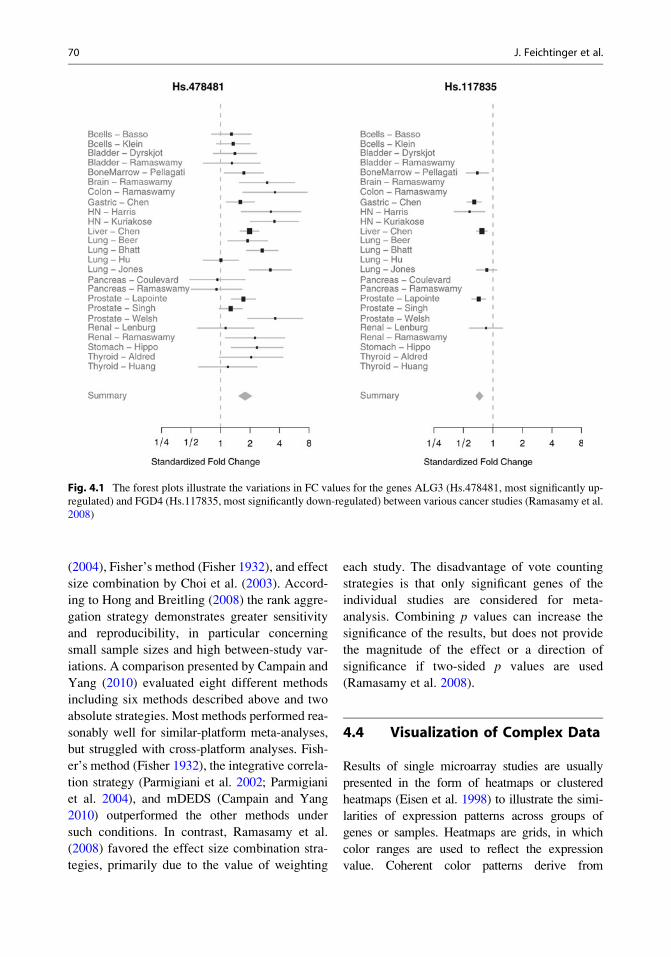
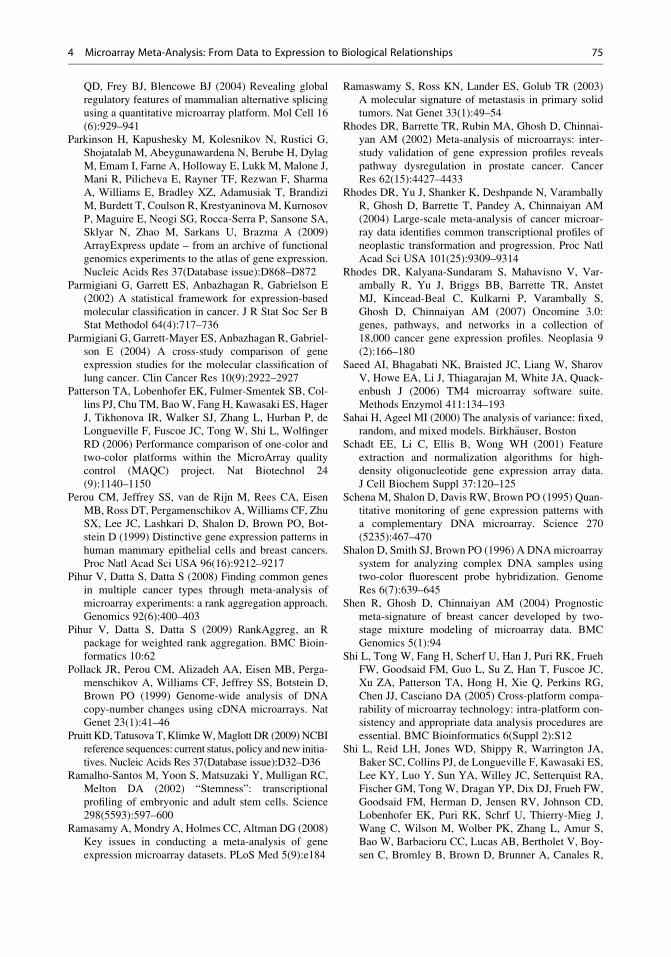
Fig. 4.1 The forest plots illustrate the variations in FC values for the genes ALG3 (Hs.478481, most significantly up-
regulated) and FGD4 (Hs.117835, most significantly down-regulated) between various cancer studies (Ramasamy et al.
2008)
70 J. Feichtinger et al.

hierarchical clustering and are indicated through
tree-like structures (Wilkinson and Friendly
2009). For short gene lists or small numbers of
combined studies, clustered heatmaps or Venn dia-
grams (Venn 1880) can be used to visualize meta-
analysis results quite successfully. With increasing
complexity of the data, however, other visualiza-
tion techniques must be used to simplify the inter-
pretation of large quantities of data and to highlight
the relationships within the data. The most popular
way to visualize meta-analysis results (Lalkhen and
McCluskey 2008) is a forest plot (Lewis and Clarke
2001), where each study is illustrated by a square;
the position on the x-axis representing the measure
estimate (e.g., FC ratio), the size proportional to the
weight of the study, and the horizontal line through
it reflecting the confidence interval of the estimate
(Fig. 4.1). Alternatively, new approaches to visu-
alization of complex data are developing, such as
the circular layout visualizations produced by
Krona (Ondov et al. 2011) or Circos plots (Krzy-
winski et al. 2009). Such tools are becoming
increasingly popular in comparative genomics and
metagenomics, and could, for example, be used to
illustrate the weighted relationships between gene
expression and different study datasets. The chal-
lenge for successful meta-analysis visualization
methods is to demonstrate the variations between
studies and facilitate biological interpretation of the
overall result.
References
Adams MD, Kelley JM, Gocayne JD, Dubnick M, Poly-
meropoulos MH, Xiao H, Merril CR, Wu A, Olde B,
Moreno RF et al (1991) Complementary DNA
sequencing: expressed sequence tags and human
genome project. Science 252(5013):1651–1656
Alibes A, Yankilevich P, Canada A, Diaz-Uriarte R
(2007) IDconverter and IDClight: conversion and
annotation of gene and protein IDs. BMC Bioinfor-
matics 8:9
Alizadeh AA, Eisen MB, Davis RE, Ma C, Lossos IS,
Rosenwald A, Boldrick JC, Sabet H, Tran T, Yu X,
Powell JI, Yang L, Marti GE, Moore T, Hudson J Jr,
Lu L, Lewis DB, Tibshirani R, Sherlock G, Chan WC,
Greiner TC, Weisenburger DD, Armitage JO, Warnke
R, Levy R, Wilson W, Grever MR, Byrd JC, Botstein
D, Brown PO, Staudt LM (2000) Distinct types of
diffuse large B-cell lymphoma identified by gene
expression profiling. Nature 403(6769):503–511
Altschul SF, Gish W, Miller W, Myers EW, Lipman DJ
(1990) Basic local alignment search tool. J Mol Biol
215(3):403–410
Anders M, Fehlker M, Wang Q, Wissmann C, Pilarsky C,
Kemmner W, Hocker M (2011) Microarray meta-
analysis defines global angiogenesis-related gene
expression signatures in human carcinomas. Mol Car-
cinog (Epub ahead of print)
Arasappan D, Tong W, Mummaneni P, Fang H, Amur S
(2011) Meta-analysis of microarray data using a
pathway-based approach identifies a 37-gene expression
signature for systemic lupus erythematosus in human
peripheral blood mononuclear cells. BMC Med 9:65
Ball CA, Brazma A, Causton H, Chervitz S, Edgar R,
Hingamp P, Matese JC, Parkinson H, Quackenbush J,
Ringwald M, Sansone SA, Sherlock G, Spellman P,
Stoeckert C, Tateno Y, Taylor R, White J, Winegarden
N (2004) Submission of microarray data to public
repositories. PLoS Biol 2(9):E317
Baron D, Bihouee A, Teusan R, Dubois E, Savagner F,
Steenman M, Houlgatte R, Ramstein G (2011) MAD-
Gene: retrieval and processing of gene identifier lists
for the analysis of heterogeneous microarray datasets.
Bioinformatics 27(5):725–726
Barrett T, Troup DB,Wilhite SE, Ledoux P, Evangelista C,
Kim IF, Tomashevsky M, Marshall KA, Phillippy KH,
Sherman PM, Muertter RN, Holko M, Ayanbule O,
Yefanov A, Soboleva A (2011) NCBI GEO: archive
for functional genomics data sets–10 years on. Nucleic
Acids Res 39(Database issue):D1005–D1010
Bisognin A, Coppe A, Ferrari F, Risso D, Romualdi C,
Bicciato S, Bortoluzzi S (2009) A-MADMAN:
annotation-based microarray data meta-analysis tool.
BMC Bioinformatics 10:201
Blanchard AP, Kaiser RJ, Hood LE (1996) High-density
oligonucleotide arrays. Biosens Bioelectron 11(6/7):
687–690
Bolstad BM, Irizarry RA, Astrand M, Speed TP (2003) A
comparison of normalization methods for high density
oligonucleotide array data based on variance and bias.
Bioinformatics 19(2):185–193
Brazma A, Hingamp P, Quackenbush J, Sherlock G,
Spellman P, Stoeckert C, Aach J, Ansorge W, Ball
CA, Causton HC, Gaasterland T, Glenisson P, Hol-
stege FC, Kim IF, Markowitz V, Matese JC, Parkinson
H, Robinson A, Sarkans U, Schulze-Kremer S, Stew-
art J, Taylor R, Vilo J, Vingron M (2001) Mini-
mum information about a microarray experiment
(MIAME)-toward standards for microarray data. Nat
Genet 29(4):365–371
Breitling R, Armengaud P, Amtmann A, Herzyk P (2004)
Rank products: a simple, yet powerful, new method to
detect differentially regulated genes in replicated
microarray experiments. FEBS Lett 573(1–3):83–92
Brors B (2005) Microarray annotation and biological
information on function. Methods Inf Med 44
(3):468–472
4 Microarray Meta-Analysis: From Data to Expression to Biological Relationships 71
Bullinger L, Dohner K, Bair E, Frohling S, Schlenk RF,
Tibshirani R, Dohner H, Pollack JR (2004) Use of
gene-expression profiling to identify prognostic sub-
classes in adult acute myeloid leukemia. N Engl J Med
350(16):1605–1616
Burgess JK (2001) Gene expression studies using micro-
arrays. Clin Exp Pharmacol Physiol 28(4):321–328
Bushman BJ (1994) Vote-counting procedures in meta-
analysis. In: Cooper H, Hedges LV (eds) The hand-
book of research synthesis, vol 236, 1st edn. Russell
Sage, New York, pp 193–213
Cahan P, Rovegno F, Mooney D, Newman JC, St Laurent
G 3rd, McCaffrey TA (2007) Meta-analysis of micro-
array results: challenges, opportunities, and recom-
mendations for standardization. Gene 401(1–2):12–18
Callow MJ, Dudoit S, Gong EL, Speed TP, Rubin EM
(2000) Microarray expression profiling identifies
genes with altered expression in HDL-deficient mice.
Genome Res 10(12):2022–2029
Campain A, Yang YH (2010) Comparison study of micro-
array meta-analysis methods. BMC Bioinformatics
11:408
Chang CW, Cheng WC, Chen CR, Shu WY, Tsai ML,
Huang CL, Hsu IC (2011) Identification of human
housekeeping genes and tissue-selective genes by
microarray meta-analysis. PLoS One 6(7):e22859
Cheng WC, Tsai ML, Chang CW, Huang CL, Chen CR,
Shu WY, Lee YS, Wang TH, Hong JH, Li CY, Hsu IC
(2010) Microarray meta-analysis database (M(2)DB):
a uniformly pre-processed, quality controlled, and
manually curated human clinical microarray database.
BMC Bioinformatics 11:421
Cheng WC, Chang CW, Chen CR, Tsai ML, Shu WY, Li
CY, Hsu IC (2011) Identification of reference genes
across physiological states for qRT-PCR through
microarray meta-analysis. PLoS One 6(2):e17347
Cheung VG, Morley M, Aguilar F, Massimi A, Kucher-
lapati R, Childs G (1999) Making and reading micro-
arrays. Nat Genet 21(Suppl 1):15–19
Choi JK, Yu U, Kim S, Yoo OJ (2003) Combining multi-
ple microarray studies and modeling interstudy varia-
tion. Bioinformatics 19(Suppl 1):i84–i90
Choi H, Shen R, Chinnaiyan AM, Ghosh D (2007) A
latent variable approach for meta-analysis of gene
expression data from multiple microarray experi-
ments. BMC Bioinformatics 8:364
Cohen J (1988) Statistical power analysis for the behav-
ioral sciences, 2nd edn. Lawrence Erlbaum Associ-
ates, Hillsdale
Cui X, Churchill GA (2003) Statistical tests for differen-
tial expression in cDNA microarray experiments.
Genome Biol 4(4):210
Dan S, Tsunoda T, Kitahara O, Yanagawa R, Zembutsu
H, Katagiri T, Yamazaki K, Nakamura Y, Yamori T
(2002) An integrated database of chemosensitivity to
55 anticancer drugs and gene expression profiles of
39 human cancer cell lines. Cancer Res 62
(4):1139–1147
Daves MH, Hilsenbeck SG, Lau CC, Man TK (2011)
Meta-analysis of multiple microarray datasets reveals
a common gene signature of metastasis in solid
tumors. BMC Med Genomics 4:56
Davis S, Meltzer PS (2007) GEOquery: a bridge between
the Gene Expression Omnibus (GEO) and BioCon-
ductor. Bioinformatics 23(14):1846–1847
de Leon J, Susce MT, Murray-Carmichael E (2006) The
AmpliChip CYP450 genotyping test: Integrating a
new clinical tool. Mol Diagn Ther 10(3):135–151
DeConde RP, Hawley S, Falcon S, Clegg N, Knudsen B,
Etzioni R (2006) Combining results of microarray
experiments: a rank aggregation approach. Stat Appl
Genet Mol Biol 5(1), Article 15
Dennis G Jr, Sherman BT, Hosack DA, Yang J, Gao W,
Lane HC, Lempicki RA (2003) DAVID: database for
annotation, visualization, and integrated discovery.
Genome Biol 4(5):P3
DeRisi JL, Iyer VR, Brown PO (1997) Exploring the
metabolic and genetic control of gene expression on
a genomic scale. Science 278(5338):680–686
DerSimonian R, Laird N (1986) Meta-analysis in clinical
trials. Control Clin Trials 7(3):177–188
R Core Team (2012) R: a language and environment for
statistical computing. R Foundation for Statistical
Computing, Vienna. http://www.R-project.org/
Dhanasekaran SM, Barrette TR, Ghosh D, Shah R, Var-
ambally S, Kurachi K, Pienta KJ, Rubin MA, Chinnai-
yan AM (2001) Delineation of prognostic biomarkers
in prostate cancer. Nature 412(6849):822–826
Diehn M, Sherlock G, Binkley G, Jin H, Matese JC,
Hernandez-Boussard T, Rees CA, Cherry JM, Bot-
stein D, Brown PO, Alizadeh AA (2003) SOURCE:
a unified genomic resource of functional annotations,
ontologies, and gene expression data. Nucleic Acids
Res 31(1):219–223
Dudoit S, Yang YH, Callow MJ, Speed TP (2002) Statis-
tical methods for identifying differentially expressed
genes in replicated cDNA microarray experiments.
Statistica Sinica 12(1):111–139
Dupuy A, Simon RM (2007) Critical review of published
microarray studies for cancer outcome and guidelines
on statistical analysis and reporting. J Natl Cancer Inst
99(2):147–157
Dwork C, Kumar R, Naor M, Sivakumar D (2001) Rank
aggregation methods for the Web. In: Shen VY, Saito
N, Lyu MR, Zurko ME (eds) The tenth international
world wide web conference, Hong Kong, 1–5 May
2001, pp 613–622
Eisen MB, Spellman PT, Brown PO, Botstein D (1998)
Cluster analysis and display of genome-wide expression
patterns. Proc Natl Acad Sci USA 95(25):14863–14868
Fagin R, Kumar R, Sivakumar D (2003) Comparing top k
lists. SIAM J Discr Math 17(1):134
Faith JJ, Driscoll ME, Fusaro VA, Cosgrove EJ, Hayete
B, Juhn FS, Schneider SJ, Gardner TS (2008) Many
microbe microarrays database: uniformly normalized
affymetrix compendia with structured experimental
72 J. Feichtinger et al.
metadata. Nucleic Acids Res 36(Database issue):
D866–D870
Fisher RA (1932) Statistical methods for research work-
ers, 4th edn. Oliver & Boyd, Edinburgh
Furlong EE, Andersen EC, Null B, White KP, Scott MP
(2001) Patterns of gene expression during Drosophila
mesoderm development. Science 293(5535):1629–1633
Gagarin D, Yang Z, Butler J, Wimmer M, Du B, Cahan P,
McCaffrey TA (2005) Genomic profiling of acquired
resistance to apoptosis in cells derived from human
atherosclerotic lesions: potential role of STATs,
cyclinD1, BAD, and Bcl-XL. J Mol Cell Cardiol 39
(3):453–465
Gasch AP, Spellman PT, Kao CM, Carmel-Harel O, Eisen
MB, Storz G, Botstein D, Brown PO (2000) Genomic
expression programs in the response of yeast cells
to environmental changes. Mol Biol Cell 11(12):
4241–4257
Gautier L, Cope L, Bolstad BM, Irizarry RA (2004a)
Affy–analysis of Affymetrix GeneChip data at the
probe level. Bioinformatics 20(3):307–315
Gautier L, Moller M, Friis-Hansen L, Knudsen S (2004b)
Alternative mapping of probes to genes for Affymetrix
chips. BMC Bioinformatics 5:111
Gentleman R (2005) Bioinformatics and computational
biology solutions using R and bioconductor. Springer,
New York
Gershon D (2002) Microarray technology: an array of
opportunities. Nature 416(6883):885–891
Golub TR, Slonim DK, Tamayo P, Huard C, Gaasenbeek
M, Mesirov JP, Coller H, Loh ML, Downing JR,
Caligiuri MA, Bloomfield CD, Lander ES (1999)
Molecular classification of cancer: class discovery
and class prediction by gene expression monitoring.
Science 286(5439):531–537
Griffith OL, Melck A, Jones SJ, Wiseman SM (2006)
Meta-analysis and meta-review of thyroid cancer
gene expression profiling studies identifies important
diagnostic biomarkers. J Clin Oncol 24
(31):5043–5051
Grutzmann R, Boriss H, Ammerpohl O, Luttges J, Kalth-
off H, Schackert HK, Kloppel G, Saeger HD, Pilarsky
C (2005) Meta-analysis of microarray data on pancre-
atic cancer defines a set of commonly dysregulated
genes. Oncogene 24(32):5079–5088
Guo L, Lobenhofer EK, Wang C, Shippy R, Harris SC,
Zhang L, Mei N, Chen T, Herman D, Goodsaid FM,
Hurban P, Phillips KL, Xu J, Deng X, Sun YA, Tong
W, Dragan YP, Shi L (2006) Rat toxicogenomic study
reveals analytical consistency across microarray plat-
forms. Nat Biotechnol 24(9):1162–1169
Harbig J, Sprinkle R, Enkemann SA (2005) A sequence-
based identification of the genes detected by probesets
on the Affymetrix U133 plus 2.0 array. Nucleic Acids
Res 33(3):e31
Hedges LV, Olkin I (1985) Statistical methods for meta-
analysis. Academic, New York
Hedges LV, Cooper H, Bushman BJ (1992) Testing the
null hypothesis in meta-analysis: a comparison of
combined probability and confidence interval proce-
dures. Psychol Bull 111(1):188–194
Hong F, Breitling R (2008) A comparison of meta-analysis
methods for detecting differentially expressed genes in
microarray experiments. Bioinformatics 24(3):374–382
Hong F, Breitling R, McEntee CW, Wittner BS, Nemhau-
ser JL, Chory J (2006) RankProd: a bioconductor
package for detecting differentially expressed genes
in meta-analysis. Bioinformatics 22(22):2825–2827
Hruz T, Laule O, Szabo G, Wessendorp F, Bleuler S,
Oertle L, Widmayer P, Gruissem W, Zimmermann P
(2008) Genevestigator v3: a reference expression
database for the meta-analysis of transcriptomes.
Adv Bioinformatics 2008:420747
Hu P, Greenwood CMT, Beyene J (2006) Statistical meth-
ods for meta-analysis of microarray data: a compara-
tive study. Inform Syst Front 8(1):9–20
Hubbell E, Liu WM, Mei R (2002) Robust estimators for
expression analysis. Bioinformatics 18(12):1585–1592
Hubble J, Demeter J, Jin H, Mao M, Nitzberg M, Reddy
TB, Wymore F, Zachariah ZK, Sherlock G, Ball CA
(2009) Implementation of GenePattern within the
Stanford microarray database. Nucleic Acids Res 37
(Database issue):D898–D901
Huber W, von Heydebreck A, Sultmann H, Poustka A,
Vingron M (2002) Variance stabilization applied to
microarray data calibration and to the quantification of
differential expression. Bioinformatics 18(Suppl 1):
S96–S104
Ikeo K, Ishi-i J, Tamura T, Gojobori T, Tateno Y (2003)
CIBEX: center for information biology gene expres-
sion database. C R Biol 326(10–11):1079–1082
Irizarry RA, Hobbs B, Collin F, Beazer-Barclay YD,
Antonellis KJ, Scherf U, Speed TP (2003) Explora-
tion, normalization, and summaries of high density
oligonucleotide array probe level data. Biostatistics 4
(2):249–264
Irizarry RA, Warren D, Spencer F, Kim IF, Biswal S,
Frank BC, Gabrielson E, Garcia JG, Geoghegan J,
Germino G, Griffin C, Hilmer SC, Hoffman E,
Jedlicka AE, Kawasaki E, Martinez-Murillo F, Mors-
berger L, Lee H, Petersen D, Quackenbush J, Scott A,
Wilson M, Yang Y, Ye SQ, Yu W (2005) Multiple-
laboratory comparison of microarray platforms. Nat
Methods 2(5):345–350
Ivanova NB, Dimos JT, Schaniel C, Hackney JA, Moore
KA, Lemischka IR (2002) A stem cell molecular sig-
nature. Science 298(5593):601–604
Ivliev AE, t Hoen PA, Villerius MP, den Dunnen JT,
Brandt BW (2008) Microarray retriever: a web-based
tool for searching and large scale retrieval of public
microarray data. Nucleic Acids Res 36(Web Server
issue):W327–W331
Jafari P, Azuaje F (2006) An assessment of recently
published gene expression data analyses: reporting
experimental design and statistical factors. BMC
Med Inform Decis Mak 6:27
Jelier R, t Hoen PA, Sterrenburg E, den Dunnen JT, van
Ommen GJ, Kors JA, Mons B (2008) Literature-aided
4 Microarray Meta-Analysis: From Data to Expression to Biological Relationships 73

meta-analysis of microarray data: a compendium
study on muscle development and disease. BMC Bio-
informatics 9:291
Kauffmann A, Rayner TF, Parkinson H, Kapushesky M,
Lukk M, Brazma A, Huber W (2009) Importing
ArrayExpress datasets into R/bioconductor. Bioinfor-
matics 25(16):2092–2094
Kendall MG (1938) A new measure of rank correlation.
Biometrika 30(1–2):81–93
Kennedy GC, Matsuzaki H, Dong S, Liu WM, Huang J,
Liu G, Su X, Cao M, Chen W, Zhang J, Liu W, Yang
G, Di X, Ryder T, He Z, Surti U, Phillips MS, Boyce-
Jacino MT, Fodor SP, Jones KW (2003) Large-scale
genotyping of complex DNA. Nat Biotechnol 21
(10):1233–1237
Kilpinen S, Autio R, Ojala K, Iljin K, Bucher E, Sara H,
Pisto T, Saarela M, Skotheim RI, Bjorkman M,
Mpindi JP, Haapa-Paananen S, Vainio P, Edgren H,
Wolf M, Astola J, Nees M, Hautaniemi S, Kallioniemi
O (2008) Systematic bioinformatic analysis of expres-
sion levels of 17,330 human genes across 9,783 sam-
ples from 175 types of healthy and pathological
tissues. Genome Biol 9(9):R139
Krzywinski M, Schein J, Birol I, Connors J, Gascoyne R,
Horsman D, Jones SJ, Marra MA (2009) Circos: an
information aesthetic for comparative genomics.
Genome Res 19(9):1639–1645
LaCroix-Fralish ML, Austin JS, Zheng FY, Levitin DJ,
Mogil JS (2011) Patterns of pain: meta-analysis of
microarray studies of pain. Pain 152(8):1888–1898
Lalkhen AG, McCluskey A (2008) Statistics V: Introduc-
tion to clinical trials and systematic reviews.
Continuing Education in Anaesthesia Critical Care
Pain 8(4):143–146
Larkin JE, Frank BC, Gavras H, Sultana R, Quacken-
bush J (2005) Independence and reproducibility
across microarray platforms. Nat Methods 2
(5):337–344
Larsson O, Sandberg R (2006) Lack of correct data format
and comparability limits future integrative microarray
research. Nat Biotechnol 24(11):1322–1323
Larsson O, Wennmalm K, Sandberg R (2006) Compara-
tive microarray analysis. OMICS 10(3):381–397
Lee HK, Hsu AK, Sajdak J, Qin J, Pavlidis P (2004)
Coexpression analysis of human genes across many
microarray data sets. Genome Res 14(6):1085–1094
Lee Y, Tsai J, Sunkara S, Karamycheva S, Pertea G,
Sultana R, Antonescu V, Chan A, Cheung F, Quacken-
bush J (2005) The TIGR gene indices: clustering and
assembling EST and known genes and integration
with eukaryotic genomes. Nucleic Acids Res 33(Data-
base issue):D71–D74
Lewis S, Clarke M (2001) Forest plots: trying to see the
wood and the trees. BMJ 322(7300):1479–1480
Li C, Hung Wong W (2001) Model-based analysis of
oligonucleotide arrays: model validation, design issues
and standard error application. Genome Biol 2(8),
RESEARCH0032
Li C, Wong WH (2001) Model-based analysis of oligonu-
cleotide arrays: expression index computation and
outlier detection. Proc Natl Acad Sci USA 98
(1):31–36
Li X, Quigg RJ, Zhou J, Gu W, Nagesh Rao P, Reed EF
(2008) Clinical utility of microarrays: current status,
existing challenges and future outlook. Curr Genomics
9(7):466–474
Lipshutz RJ, Fodor SP, Gingeras TR, Lockhart DJ (1999)
High density synthetic oligonucleotide arrays. Nat
Genet 21(Suppl 1):20–24
Lo K, Gottardo R (2007) Flexible empirical Bayes models
for differential gene expression. Bioinformatics 23
(3):328–335
Loughin T (2004) A systematic comparison of methods
for combining p-values from independent tests. Com-
put Stat Data Anal 47(3):467–485
Lu T, Pan Y, Kao SY, Li C, Kohane I, Chan J, Yankner
BA (2004) Gene regulation and DNA damage in the
ageing human brain. Nature 429(6994):883–891
Lusa L, Gentleman RC, Ruschhaupt M (2006) GeneMeta:
metaanalysis for high throughput experiments. http://
www.bioconductor.org/packages/2.8/bioc/html/Gene-
Meta.html
Marot G, Foulley JL, Mayer CD, Jaffrezic F (2009) Mod-
erated effect size and P-value combinations for micro-
array meta-analyses. Bioinformatics 25(20):2692–2699
Marshall E (2004) Getting the noise out of gene arrays.
Science 306(5696):630–631
McDonald MJ, Rosbash M (2001) Microarray analysis
and organization of circadian gene expression in Dro-
sophila. Cell 107(5):567–578
Michiels S, Koscielny S, Hill C (2005) Prediction of
cancer outcome with microarrays: a multiple random
validation strategy. Lancet 365(9458):488–492
Moreau Y, Aerts S, De Moor B, De Strooper B, Dab-
rowski M (2003) Comparison and meta-analysis of
microarray data: from the bench to the computer
desk. Trends Genet 19(10):570–577
Nadon R, Shoemaker J (2002) Statistical issues with
microarrays: processing and analysis. Trends Genet
18(5):265–271
Newman JC, Weiner AM (2005) L2L: a simple tool for
discovering the hidden significance in microarray
expression data. Genome Biol 6(9):R81
Normand SL (1999) Meta-analysis: formulating, evaluat-
ing, combining, and reporting. Stat Med 18(3):321–359
Ntzani EE, Ioannidis JP (2003) Predictive ability of DNA
microarrays for cancer outcomes and correlates: an
empirical assessment. Lancet 362(9394):1439–1444
Ondov BD, Bergman NH, Phillippy AM (2011) Interac-
tive metagenomic visualization in a Web browser.
BMC Bioinformatics 12:385
Owzar K, Barry WT, Jung SH, Sohn I, George SL (2008)
Statistical challenges in preprocessing in microarray
experiments in cancer. Clin Cancer Res 14
(19):5959–5966
Pan Q, Shai O, Misquitta C, Zhang W, Saltzman AL,
Mohammad N, Babak T, Siu H, Hughes TR, Morris
74 J. Feichtinger et al.
QD, Frey BJ, Blencowe BJ (2004) Revealing global
regulatory features of mammalian alternative splicing
using a quantitative microarray platform. Mol Cell 16
(6):929–941
Parkinson H, Kapushesky M, Kolesnikov N, Rustici G,
Shojatalab M, Abeygunawardena N, Berube H, Dylag
M, Emam I, Farne A, Holloway E, Lukk M, Malone J,
Mani R, Pilicheva E, Rayner TF, Rezwan F, Sharma
A, Williams E, Bradley XZ, Adamusiak T, Brandizi
M, Burdett T, Coulson R, Krestyaninova M, Kurnosov
P, Maguire E, Neogi SG, Rocca-Serra P, Sansone SA,
Sklyar N, Zhao M, Sarkans U, Brazma A (2009)
ArrayExpress update – from an archive of functional
genomics experiments to the atlas of gene expression.
Nucleic Acids Res 37(Database issue):D868–D872
Parmigiani G, Garrett ES, Anbazhagan R, Gabrielson E
(2002) A statistical framework for expression-based
molecular classification in cancer. J R Stat Soc Ser B
Stat Methodol 64(4):717–736
Parmigiani G, Garrett-Mayer ES, Anbazhagan R, Gabriel-
son E (2004) A cross-study comparison of gene
expression studies for the molecular classification of
lung cancer. Clin Cancer Res 10(9):2922–2927
Patterson TA, Lobenhofer EK, Fulmer-Smentek SB, Col-
lins PJ, Chu TM, BaoW, Fang H, Kawasaki ES, Hager
J, Tikhonova IR, Walker SJ, Zhang L, Hurban P, de
Longueville F, Fuscoe JC, Tong W, Shi L, Wolfinger
RD (2006) Performance comparison of one-color and
two-color platforms within the MicroArray quality
control (MAQC) project. Nat Biotechnol 24
(9):1140–1150
Perou CM, Jeffrey SS, van de Rijn M, Rees CA, Eisen
MB, Ross DT, Pergamenschikov A, Williams CF, Zhu
SX, Lee JC, Lashkari D, Shalon D, Brown PO, Bot-
stein D (1999) Distinctive gene expression patterns in
human mammary epithelial cells and breast cancers.
Proc Natl Acad Sci USA 96(16):9212–9217
Pihur V, Datta S, Datta S (2008) Finding common genes
in multiple cancer types through meta-analysis of
microarray experiments: a rank aggregation approach.
Genomics 92(6):400–403
Pihur V, Datta S, Datta S (2009) RankAggreg, an R
package for weighted rank aggregation. BMC Bioin-
formatics 10:62
Pollack JR, Perou CM, Alizadeh AA, Eisen MB, Perga-
menschikov A, Williams CF, Jeffrey SS, Botstein D,
Brown PO (1999) Genome-wide analysis of DNA
copy-number changes using cDNA microarrays. Nat
Genet 23(1):41–46
Pruitt KD, Tatusova T, KlimkeW,Maglott DR (2009) NCBI
reference sequences: current status, policy and new initia-
tives. Nucleic Acids Res 37(Database issue):D32–D36
Ramalho-Santos M, Yoon S, Matsuzaki Y, Mulligan RC,
Melton DA (2002) “Stemness”: transcriptional
profiling of embryonic and adult stem cells. Science
298(5593):597–600
Ramasamy A, Mondry A, Holmes CC, Altman DG (2008)
Key issues in conducting a meta-analysis of gene
expression microarray datasets. PLoS Med 5(9):e184
Ramaswamy S, Ross KN, Lander ES, Golub TR (2003)
A molecular signature of metastasis in primary solid
tumors. Nat Genet 33(1):49–54
Rhodes DR, Barrette TR, Rubin MA, Ghosh D, Chinnai-
yan AM (2002) Meta-analysis of microarrays: inter-
study validation of gene expression profiles reveals
pathway dysregulation in prostate cancer. Cancer
Res 62(15):4427–4433
Rhodes DR, Yu J, Shanker K, Deshpande N, Varambally
R, Ghosh D, Barrette T, Pandey A, Chinnaiyan AM
(2004) Large-scale meta-analysis of cancer microar-
ray data identifies common transcriptional profiles of
neoplastic transformation and progression. Proc Natl
Acad Sci USA 101(25):9309–9314
Rhodes DR, Kalyana-Sundaram S, Mahavisno V, Var-
ambally R, Yu J, Briggs BB, Barrette TR, Anstet
MJ, Kincead-Beal C, Kulkarni P, Varambally S,
Ghosh D, Chinnaiyan AM (2007) Oncomine 3.0:
genes, pathways, and networks in a collection of
18,000 cancer gene expression profiles. Neoplasia 9
(2):166–180
Saeed AI, Bhagabati NK, Braisted JC, Liang W, Sharov
V, Howe EA, Li J, Thiagarajan M, White JA, Quack-
enbush J (2006) TM4 microarray software suite.
Methods Enzymol 411:134–193
Sahai H, Ageel MI (2000) The analysis of variance: fixed,
random, and mixed models. Birkh€auser, BostonSchadt EE, Li C, Ellis B, Wong WH (2001) Feature
extraction and normalization algorithms for high-
density oligonucleotide gene expression array data.
J Cell Biochem Suppl 37:120–125
Schena M, Shalon D, Davis RW, Brown PO (1995) Quan-
titative monitoring of gene expression patterns with
a complementary DNA microarray. Science 270
(5235):467–470
Shalon D, Smith SJ, Brown PO (1996) A DNAmicroarray
system for analyzing complex DNA samples using
two-color fluorescent probe hybridization. Genome
Res 6(7):639–645
Shen R, Ghosh D, Chinnaiyan AM (2004) Prognostic
meta-signature of breast cancer developed by two-
stage mixture modeling of microarray data. BMC
Genomics 5(1):94
Shi L, Tong W, Fang H, Scherf U, Han J, Puri RK, Frueh
FW, Goodsaid FM, Guo L, Su Z, Han T, Fuscoe JC,
Xu ZA, Patterson TA, Hong H, Xie Q, Perkins RG,
Chen JJ, Casciano DA (2005) Cross-platform compa-
rability of microarray technology: intra-platform con-
sistency and appropriate data analysis procedures are
essential. BMC Bioinformatics 6(Suppl 2):S12
Shi L, Reid LH, Jones WD, Shippy R, Warrington JA,
Baker SC, Collins PJ, de Longueville F, Kawasaki ES,
Lee KY, Luo Y, Sun YA, Willey JC, Setterquist RA,
Fischer GM, Tong W, Dragan YP, Dix DJ, Frueh FW,
Goodsaid FM, Herman D, Jensen RV, Johnson CD,
Lobenhofer EK, Puri RK, Schrf U, Thierry-Mieg J,
Wang C, Wilson M, Wolber PK, Zhang L, Amur S,
Bao W, Barbacioru CC, Lucas AB, Bertholet V, Boy-
sen C, Bromley B, Brown D, Brunner A, Canales R,
4 Microarray Meta-Analysis: From Data to Expression to Biological Relationships 75

Cao XM, Cebula TA, Chen JJ, Cheng J, Chu TM,
Chudin E, Corson J, Corton JC, Croner LJ, Davies C,
Davison TS, Delenstarr G, Deng X, Dorris D, Eklund
AC, Fan XH, Fang H, Fulmer-Smentek S, Fuscoe JC,
Gallagher K, Ge W, Guo L, Guo X, Hager J, Haje PK,
Han J, Han T, Harbottle HC, Harris SC, Hatchwell E,
Hauser CA, Hester S, Hong H, Hurban P, Jackson SA,
Ji H, Knight CR, KuoWP, LeClerc JE, Levy S, Li QZ,
Liu C, Liu Y, Lombardi MJ, Ma Y, Magnuson SR,
Maqsodi B, McDaniel T, Mei N, Myklebost O, Ning
B, Novoradovskaya N, Orr MS, Osborn TW, Papallo
A, Patterson TA, Perkins RG, Peters EH, Peterson R,
Philips KL, Pine PS, Pusztai L, Qian F, Ren H, Rosen
M, Rosenzweig BA, Samaha RR, Schena M, Schroth
GP, Shchegrova S, Smith DD, Staedtler F, Su Z, Sun
H, Szallasi Z, Tezak Z, Thierry-Mieg D, Thompson
KL, Tikhonova I, Turpaz Y, Vallanat B, Van C,
Walker SJ, Wang SJ, Wang Y, Wolfinger R, Wong
A, Wu J, Xiao C, Xie Q, Xu J, Yang W, Zhang L,
Zhong S, Zong Y, Slikker W Jr (2006) The MicroAr-
ray quality control (MAQC) project shows inter- and
intraplatform reproducibility of gene expression mea-
surements. Nat Biotechnol 24(9):1151–1161
Shimizu D, Ishikawa T, Ichikawa Y, Togo S, Hayasizaki
Y, Okazaki Y, Shimada H (2004) Current progress in
the prediction of chemosensitivity for breast cancer.
Breast Cancer 11(1):42–48
Shippy R, Fulmer-Smentek S, Jensen RV, Jones WD,
Wolber PK, Johnson CD, Pine PS, Boysen C, Guo
X, Chudin E, Sun YA, Willey JC, Thierry-Mieg J,
Thierry-Mieg D, Setterquist RA, Wilson M, Lucas
AB, Novoradovskaya N, Papallo A, Turpaz Y, Baker
SC, Warrington JA, Shi L, Herman D (2006) Using
RNA sample titrations to assess microarray platform
performance and normalization techniques. Nat Bio-
technol 24(9):1123–1131
Singh-Gasson S, Green RD, Yue Y, Nelson C, Blattner F,
Sussman MR, Cerrina F (1999) Maskless fabrication of
light-directed oligonucleotide microarrays using a digi-
tal micromirror array. Nat Biotechnol 17(10):974–978
Slodkowska EA, Ross JS (2009) MammaPrint 70-gene
signature: another milestone in personalized medical
care for breast cancer patients. Expert Rev Mol Diagn
9(5):417–422
Smith DD, Saetrom P, Snove O Jr, Lundberg C, Rivas
GE, Glackin C, Larson GP (2008) Meta-analysis of
breast cancer microarray studies in conjunction with
conserved cis-elements suggest patterns for coordinate
regulation. BMC Bioinformatics 9:63
Smyth GK (2004) Linear models and empirical bayes
methods for assessing differential expression in
microarray experiments. Stat Appl Genet Mol Biol 3,
Article3
Southern E, Mir K, Shchepinov M (1999) Molecular inter-
actions on microarrays. Nat Genet 21(Suppl 1):5–9
Spearman C (1904) The proof and measurement of asso-
ciation between two things. Am J Psychol 15:72–101
Staunton JE, Slonim DK, Coller HA, Tamayo P, Angelo
MJ, Park J, Scherf U, Lee JK, Reinhold WO,Weinstein
JN, Mesirov JP, Lander ES, Golub TR (2001) Chemo-
sensitivity prediction by transcriptional profiling. Proc
Natl Acad Sci USA 98(19):10787–10792
Stouffer SA (1949) The American soldier, vol 2. Prince-
ton University Press, Princeton
Stuart JM, Segal E, Koller D, Kim SK (2003) A gene-
coexpression network for global discovery of con-
served genetic modules. Science 302(5643):249–255
Sturn A, Quackenbush J, Trajanoski Z (2002) Genesis:
cluster analysis of microarray data. Bioinformatics 18
(1):207–208
Suarez E, Burguete A, McLachlan GJ (2009) Microarray
data analysis for differential expression: a tutorial. P R
Health Sci J 28(2):89–104
Suarez-Farinas M, Noggle S, Heke M, Hemmati-
Brivanlou A, Magnasco MO (2005) Comparing inde-
pendent microarray studies: the case of human embry-
onic stem cells. BMC Genomics 6:99
Teh MT, Blaydon D, Chaplin T, Foot NJ, Skoulakis S,
Raghavan M, Harwood CA, Proby CM, Philpott
MP, Young BD, Kelsell DP (2005) Genomewide
single nucleotide polymorphism microarray
mapping in basal cell carcinomas unveils uniparen-
tal disomy as a key somatic event. Cancer Res 65
(19):8597–8603
Thurstone LL (1931) Rank order as a psycho-physical
method. J Exp Psychol 14(3):187–201
Troyanskaya OG (2005) Putting microarrays in a context:
integrated analysis of diverse biological data. Brief
Bioinform 6(1):34–43
Tsai J, Sultana R, Lee Y, Pertea G, Karamycheva S,
Antonescu V, Cho J, Parvizi B, Cheung F, Quacken-
bush J (2001) RESOURCERER: a database for anno-
tating and linking microarray resources within and
across species. Genome Biol 2(11): SOFTWARE0002
Tukey JW (1977) Exploratory data analysis, vol 2. Addi-
son Wesley, Boston
Tusher VG, Tibshirani R, Chu G (2001) Significance
analysis of microarrays applied to the ionizing radia-
tion response. Proc Natl Acad Sci USA 98
(9):5116–5121
van’t Veer LJ, Dai H, van de Vijver MJ, He YD, Hart AA,
Mao M, Peterse HL, van der Kooy K, Marton MJ,
Witteveen AT, Schreiber GJ, Kerkhoven RM, Roberts
C, Linsley PS, Bernards R, Friend SH (2002) Gene
expression profiling predicts clinical outcome of
breast cancer. Nature 415(6871):530–536
Velculescu VE, Zhang L, Vogelstein B, Kinzler KW
(1995) Serial analysis of gene expression. Science
270(5235):484–487
Venn J (1880) On the diagrammatic and mechanical rep-
resentation of propositions and reasonings. Philos
Mag J Sci 9(59):1–18
Vierlinger K, Mansfeld MH, Koperek O, Nohammer C,
Kaserer K, Leisch F (2011) Identification of SER-
PINA1 as single marker for papillary thyroid carcinoma
through microarray meta analysis and quantification of
its discriminatory power in independent validation.
BMC Med Genomics 4:30
76 J. Feichtinger et al.

Wang J, Coombes KR, Highsmith WE, Keating MJ,
Abruzzo LV (2004) Differences in gene expression
between B-cell chronic lymphocytic leukemia and
normal B cells: a meta-analysis of three microarray
studies. Bioinformatics 20(17):3166–3178
Wang Y, Miao ZH, Pommier Y, Kawasaki ES, Player A
(2007) Characterization of mismatch and high-signal
intensity probes associated with Affymetrix gene-
chips. Bioinformatics 23(16):2088–2095
Wennmalm K, Wahlestedt C, Larsson O (2005) The
expression signature of in vitro senescence resembles
mouse but not human aging. Genome Biol 6(13):R109
White KP, Rifkin SA, Hurban P, Hogness DS (1999)
Microarray analysis of Drosophila development dur-
ing metamorphosis. Science 286(5447):2179–2184
Whitlock MC (2005) Combining probability from inde-
pendent tests: the weighted Z-method is superior to
Fisher’s approach. J Evol Biol 18(5):1368–1373
Wilkinson L, Friendly M (2009) The history of the cluster
heat map. Am Stats 63(2):179–184
Wren JD (2009) A global meta-analysis of microarray
expression data to predict unknown gene functions
and estimate the literature-data divide. Bioinformatics
25(13):1694–1701
Zembutsu H, Ohnishi Y, Tsunoda T, Furukawa Y, Kata-
giri T, Ueyama Y, Tamaoki N, Nomura T, Kitahara O,
Yanagawa R, Hirata K, Nakamura Y (2002) Genome-
wide cDNA microarray screening to correlate gene
expression profiles with sensitivity of 85 human can-
cer xenografts to anticancer drugs. Cancer Res 62
(2):518–527
Zhou XJ, Kao MC, Huang H, Wong A, Nunez-Iglesias J,
Primig M, Aparicio OM, Finch CE, Morgan TE,
Wong WH (2005) Functional annotation and network
reconstruction through cross-platform integration of
microarray data. Nat Biotechnol 23(2):238–243
Zhu Y, Davis S, Stephens R, Meltzer PS, Chen Y (2008)
GEOmetadb: powerful alternative search engine for
the Gene Expression Omnibus. Bioinformatics 24
(23):2798–2800
Zintzaras E, Ioannidis JP (2008) Meta-analysis for ranked
discovery datasets: theoretical framework and empiri-
cal demonstration for microarrays. Comput Biol Chem
32(1):38–46
4 Microarray Meta-Analysis: From Data to Expression to Biological Relationships 77