Computational learning of stem cell fates Martina Koeva 09/10/07.
42
Computational learning of stem cell fates Martina Koeva 09/10/07
-
date post
22-Dec-2015 -
Category
Documents
-
view
217 -
download
0
Transcript of Computational learning of stem cell fates Martina Koeva 09/10/07.

Computational learning of stem cell fates
Martina Koeva09/10/07

The fascinating world of stem cells
• Adult and embryonic stem cells• Pluripotency and multipotency• Differentiation and proliferation
stem cell
progenitor cell
differentiated cell
http://en.wikipedia.org/wiki/Image:Stem_cells_diagram.png http://en.wikipedia.org/wiki/Image:Stem_cell_division_and_differentiation.svg

Therapeutic potential of stem cells
• Parkinson’s disease
• Cancer– leukemia
http://www.kumc.edu/stemcell/mature.html

Current challenges in stem cells
• Chromatin, chromatin state and differentiation
• MiRNAs and differentiation• More and better marker genes

Proposed aims
• Aim 1: Assess coherence of gene modules in stem cell differentiation– Chromosomal gene neighborhoods– Predicted targets of a miRNA
• Aim 2: Identify and classify cell state in stem cell differentiation using gene expression data
• Aim 3: Identify differential gene expression patterns in hierarchical stem cell lineages

Open and closed chromatin
Adapted from http://www.abcam.com/index.html?pageconfig=resource&rid=10189&pid=5

Stem cells show domains of co-expression on the chromosome
chromosomal position
Real genome Randomized genome
co-e
xp
ress
ion
sco
re
chromosomal position
Li 2006
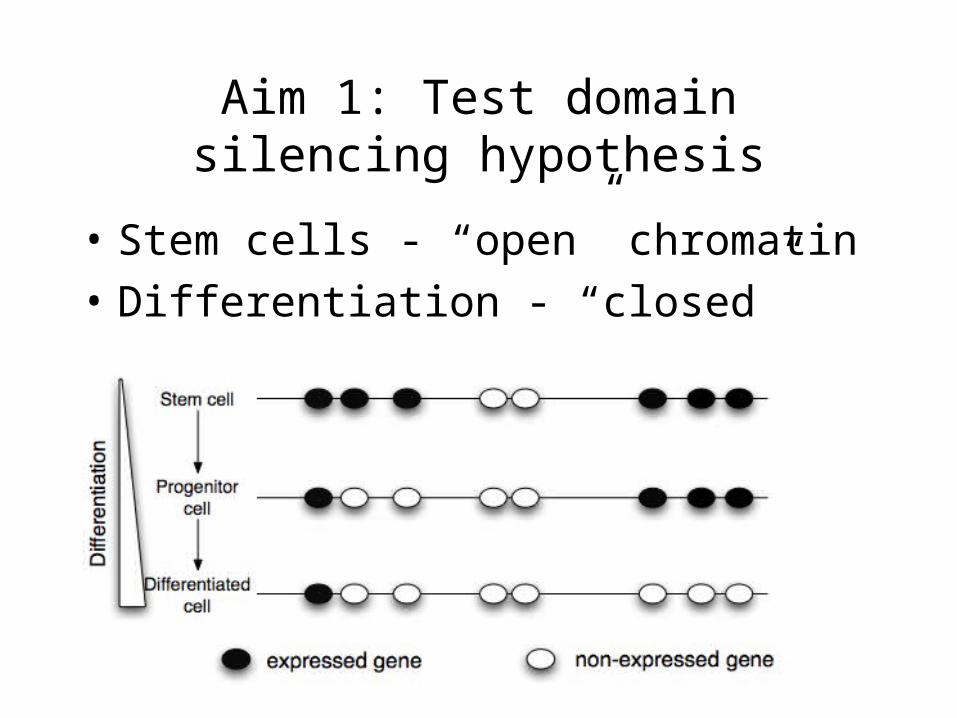
Aim 1: Test domain silencing hypothesis
• Stem cells - “open” chromatin• Differentiation - “closed”
chromatin
Chromatin silencing hypothesis
QuickTime™ and aTIFF (LZW) decompressor
are needed to see this picture.

Hematopoietic system in mouse
http://www.molmed.lu.se/HSC_regulation.htm

High-throughput gene expression data in the hematopoietic system
• Weissman lab• cDNA microarray data in
mouse• Pairwise comparisons
between LT-HSC, ST-HSC and MPP cell populations

What genes are expressed?
QuickTime™ and aTIFF (LZW) decompressor
are needed to see this picture.
• Relative expression between conditions• Probability of expression of gene in each
condition
Adapted from http://www.microarrayworld.com/

Empirical probabilistic expression detection
• Probabilistic empirical Bayesian method for expression estimation of a gene
• Positive and negative control distributions
• Average posterior probability for each gene
• Evaluated against an ANOVA FDR-based approach

Global windowing approach
• Probability of co-expression within window
• Global effects– Windowing approach - two gene window– Likelihood score
€
P gi =1gi+1 =1,di,i+1 = δ( ) =P(gi =1,gi+1 =1,di,i+1 = δ)
P(gi =1,gi+1 =1) P(di,i+1 = δ)
Co-expressed genes within window
Co-expression of neighboring genes
Genes within distance

Global windowing approach
QuickTime™ and aTIFF (LZW) decompressor
are needed to see this picture.

Global assessment of likelihood of co-expression of neighboring genes at different distance cutoffs
-0.8
-0.6
-0.4
-0.2
0
0.2
0.4
0.6
0 10 20 30 40 50 60 70 80 90 100
Maximum distance allowed between neighboring genes (kb)
Likelihood score (log2)
LT-HSC vs ST-HSC
ST-HSC vs MPP
LT-HSC vs MPP

QuickTime™ and aTIFF (LZW) decompressor
are needed to see this picture.
Local windowing approach
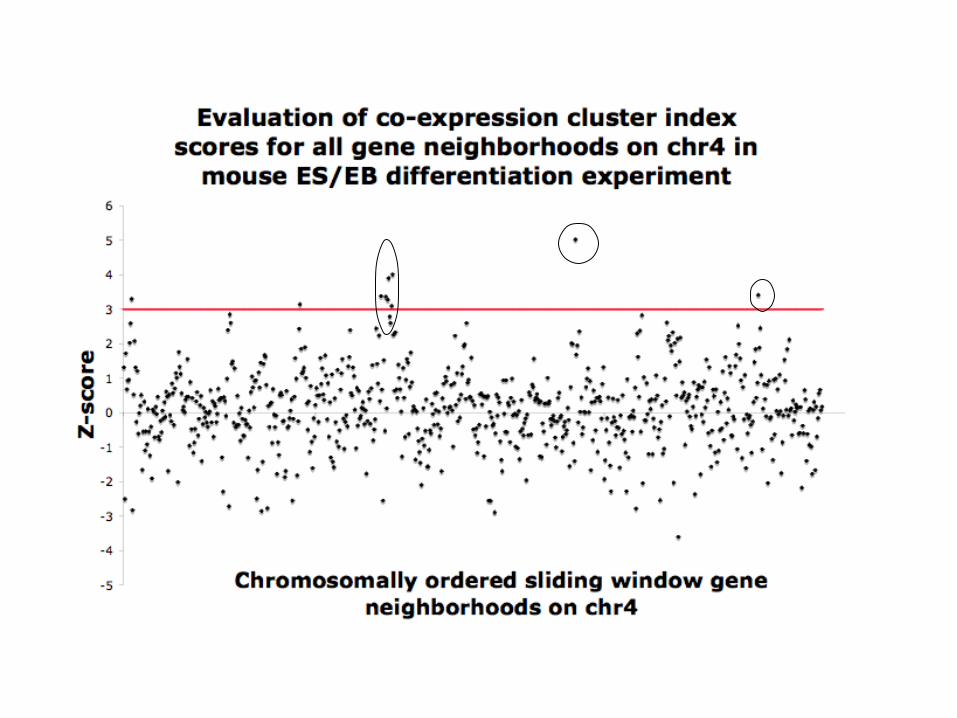

Gene neighborhood with significant co-expression scores
Gene neighborhoods with significant scores
Ror1 - receptor tyrosine kinaseJak1 - Jak tyrosin protein kinase Lepr - Leptin receptor precursor Pde4b, Pgm2
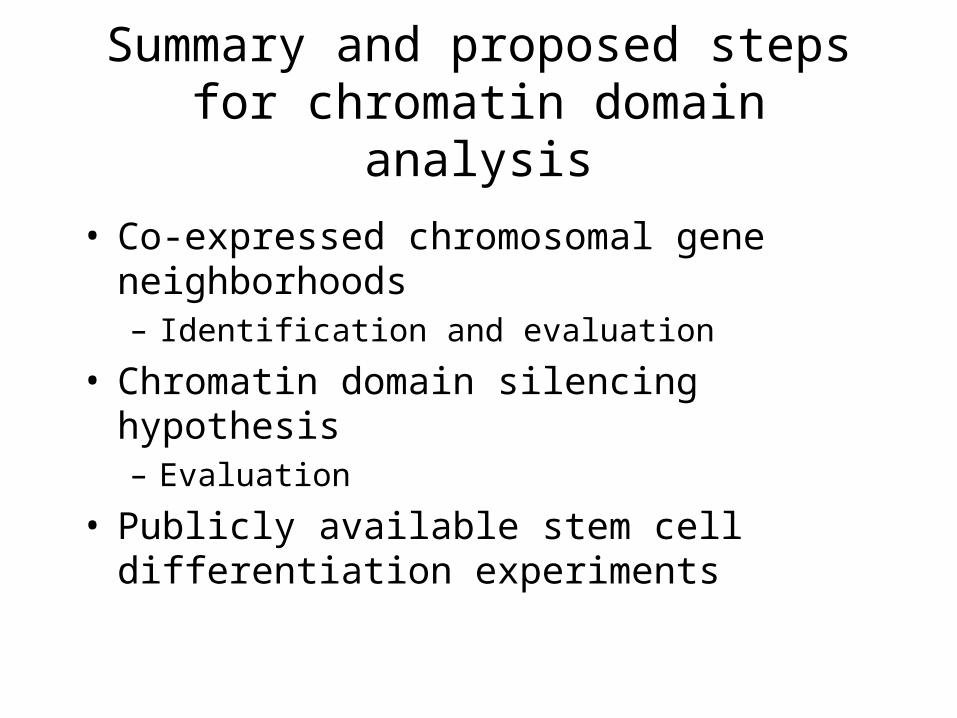
Summary and proposed steps for chromatin domain analysis
• Co-expressed chromosomal gene neighborhoods– Identification and evaluation
• Chromatin domain silencing hypothesis– Evaluation
• Publicly available stem cell differentiation experiments

Role of microRNAs in gene regulation
http://www3.cancer.gov/intra/LHC/lhcpage.htm
MicroRNAs in the hematopoietic system
• Weissman lab• Differentially expressed miRNAs in
human– Hematopoietic system– What do they do?
• Prediction of miRNA targets• Can we tie miRNA expression and
miRNA target expression?
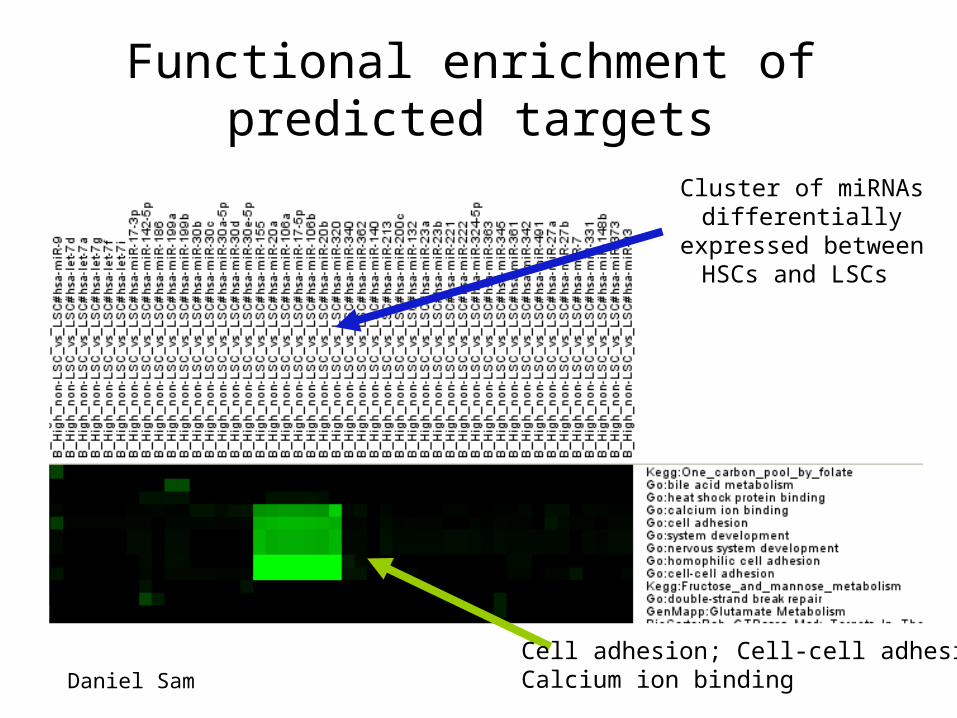
Functional enrichment of predicted targets
Cell adhesion; Cell-cell adhesion;Calcium ion binding
Cluster of miRNAs differentially
expressed between HSCs and LSCs
Daniel Sam

Role of miRNAs in differentiation through target expression
analysis
• Predicted targets with similar expression profiles– Common regulation
• Conservation of target expression through evolution

MicroRNAs can show inverse correlation to their predicted targets
during differentiation
Felli 2005

Summary and proposed steps for miRNA role in differentiation
analysis
• Modules of miRNA targets with shared expression profiles– Identification and evaluation
• Role of specific miRNAs in differentiation– Evaluation

Stem cell state classification
http://www.urmc.rochester.edu/GEBS/faculty/Craig_Jordan.htm
Cell surface marker genes
(used in FACS analysis)

Gene-based and pathway-based features
QuickTime™ and aTIFF (LZW) decompressor
are needed to see this picture.

Tissue comparisons using different feature types
0
0.1
0.2
0.3
0.4
0.5
0.6
0.7
0.8
0.9
1
Sensitivity
Specificity
Sensitivity 0.266 0.216 0.392 0.145
Specificity 0.989 0.925 0.996 0.99
Pathway-based (Groden)
Pathway-based (Zapala)
Gene-based (Groden)
Gene-based (Zapala)
Aim 2: Classify cell state in differentiation experiments
QuickTime™ and aTIFF (LZW) decompressor
are needed to see this picture.

Classifier compendium
QuickTime™ and aTIFF (LZW) decompressor
are needed to see this picture.

Summary and proposed steps for classification aim
• Complementarity of feature types– Feature selection
• Compendium of classifiers from stem cell differentiation experiments
• Evaluation– Hematopoietic system
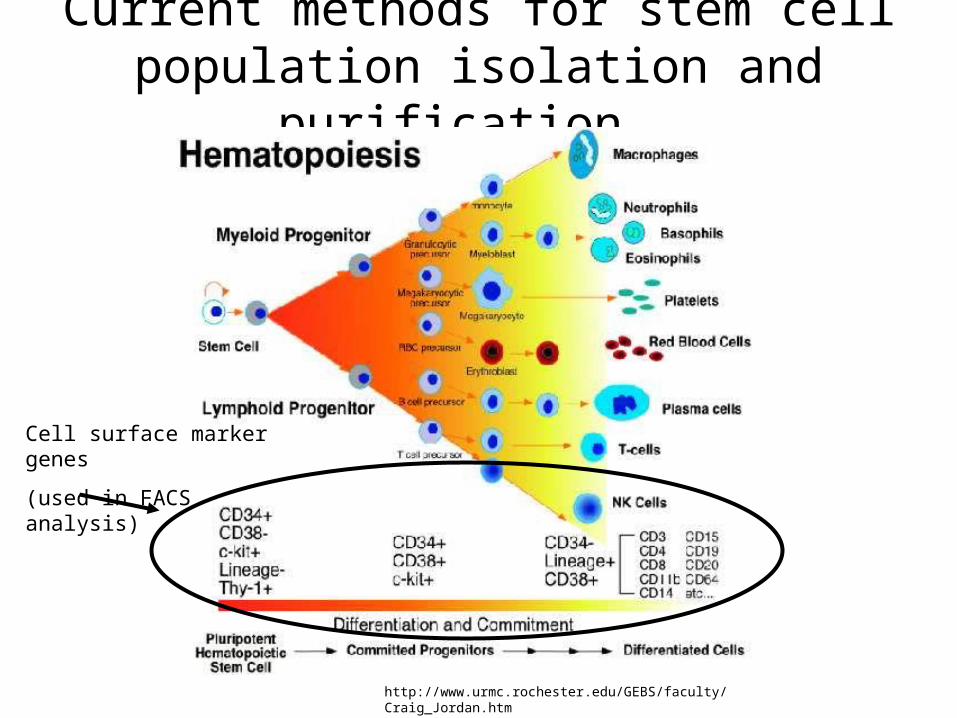
Current methods for stem cell population isolation and purification
http://www.urmc.rochester.edu/GEBS/faculty/Craig_Jordan.htm
Cell surface marker genes
(used in FACS analysis)
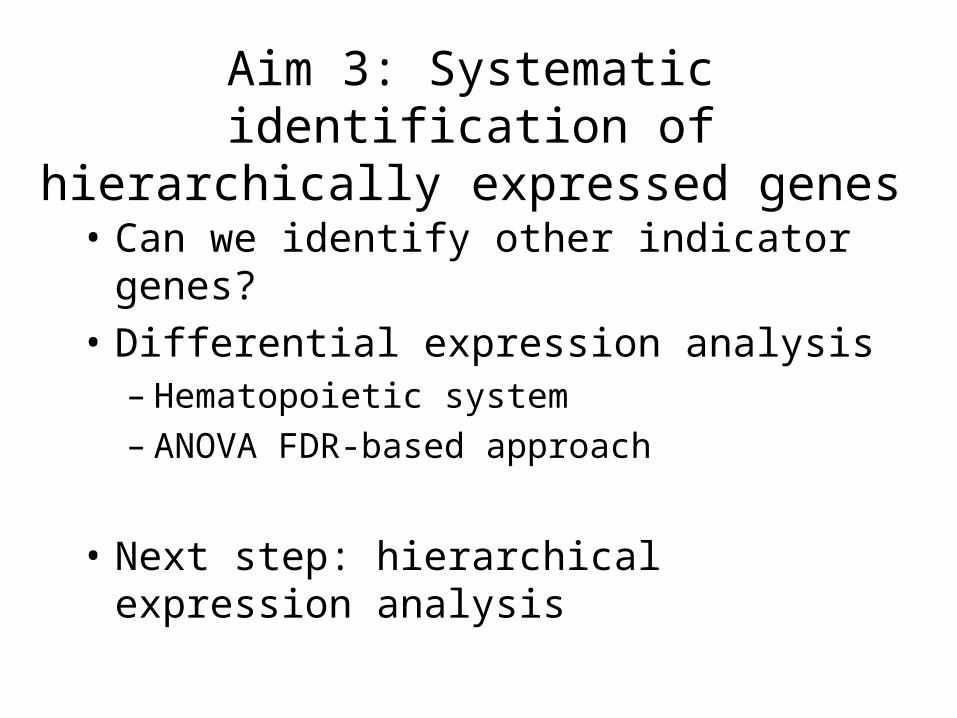
Aim 3: Systematic identification of hierarchically expressed genes
• Can we identify other indicator genes?
• Differential expression analysis– Hematopoietic system– ANOVA FDR-based approach
• Next step: hierarchical expression analysis
Scoring method for identifying indicator genes
QuickTime™ and aTIFF (LZW) decompressor
are needed to see this picture.

Can hierarchically expressed genes be missed by direct differential expression analysis?
-8
-6
-4
-2
0
2
4
6
0 1 2 3 4 5 6 7 8 9 10
Score for significance of hierarchical expresion in LT-ST-MPP comparison
Differential expression t-statistic
for LT-MPP comparison
Hierarchically expressed genes missed by direct diff. expression

Summary and proposed steps for hierarchical expression detection
analysis
• Method for identification of hierarchically expressed genes
• Apply to gene expression experiments with hierarchical stem cell lineages

Acknowledgements
• Josh Stuart• Committee members
– Kevin Karplus– Raquel Prado– Camilla Forsberg
• Collaborators– Weissman lab– Daniel Sam
• Others– Alex Williams– Charlie Vaske– Craig Lowe– David Bernick– Matt Weirauch

MicroRNA targets with inverse correlation: functional
enrichment

Chromosome 17
Alk - anaplastic lymphoma kinase: tyrosine kinase (orphan receptor; plays an importantrole in normal developmentXdh - xanthine dehydrogenase; regulation of epithilial cell differentiation

Chromosome 17
Marcksl1 - MARCKS-like 1 -- high level of co-expression with neighboring genesHdac1 - histone deacetylase 1
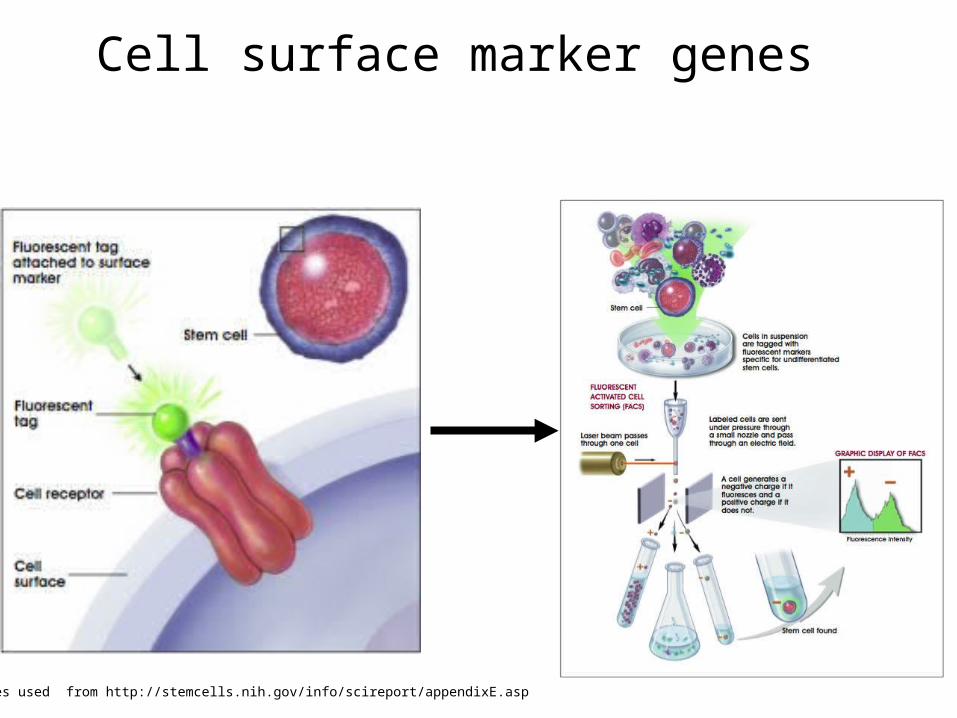
Cell surface marker genes
Images used from http://stemcells.nih.gov/info/scireport/appendixE.asp