Computational Fluid Dynamics Modeling of Proton...
22
Computational Fluid Dynamics Modeling of Proton Exchange Membrane Fuel Cells using Fluent ® Ugur Pasaogullari, Chao-Yang Wang † Electrochemical Engine Center The Pennsylvania State University University Park, PA, 16802 A comprehensive multi-physics model has been developed to simulate proton exchange membrane fuel cells using commercially available CFD software Fluent ® . The developed model accounts simultaneously for electrochemical kinetics and multi- component species transport. The proposed model is a full cell model, which includes all the parts of the PEM fuel cell, flow channels, gas diffusion electrodes, catalyst layers and the membrane. Coupled transport and electrochemical kinetics equations are solved in a single domain; therefore no interfacial boundary condition is required at the internal boundaries between cell components. The model incorporates the various modes of water transport; therefore it is able to provide comprehensive water management study, which is essential for PEM fuel cells in order to achieve high performance. The model is capable of simulating the fuel cell under a variety of reformate fuel for real life applications. The model is tested against available experimental data and previously published models. Since the model has been developed using the commercial software Fluent ® , it can be easily applied for different flow field designs. Finally, the model is applied to several different operating conditions with different cell geometries and corresponding results are reported, including the effect of different flow fields on cell performance. Keywords: PEM, Fuel Cell, Mathematical Modeling, Water Management, Interdigitated Flow Field, Nafion ® † Corresponding Author [email protected] 2002 Fluent Student Contest Winner Presented in 2002 Fluent User Group Meeting, Manchester, NH
-
Upload
phungkhanh -
Category
Documents
-
view
213 -
download
0
Transcript of Computational Fluid Dynamics Modeling of Proton...

CCoommppuuttaattiioonnaall FFlluuiidd DDyynnaammiiccss MMooddeelliinngg ooff PPrroottoonn EExxcchhaannggee MMeemmbbrraannee FFuueell CCeellllss uussiinngg FFlluueenntt®®
Ugur Pasaogullari, Chao-Yang Wang† Electrochemical Engine Center
The Pennsylvania State University University Park, PA, 16802
A comprehensive multi-physics model has been developed to simulate proton
exchange membrane fuel cells using commercially available CFD software Fluent®. The
developed model accounts simultaneously for electrochemical kinetics and multi-
component species transport. The proposed model is a full cell model, which includes all
the parts of the PEM fuel cell, flow channels, gas diffusion electrodes, catalyst layers and
the membrane. Coupled transport and electrochemical kinetics equations are solved in a
single domain; therefore no interfacial boundary condition is required at the internal
boundaries between cell components. The model incorporates the various modes of
water transport; therefore it is able to provide comprehensive water management study,
which is essential for PEM fuel cells in order to achieve high performance. The model is
capable of simulating the fuel cell under a variety of reformate fuel for real life
applications. The model is tested against available experimental data and previously
published models. Since the model has been developed using the commercial software
Fluent®, it can be easily applied for different flow field designs. Finally, the model is
applied to several different operating conditions with different cell geometries and
corresponding results are reported, including the effect of different flow fields on cell
performance. Keywords: PEM, Fuel Cell, Mathematical Modeling, Water Management,
Interdigitated Flow Field, Nafion®
† Corresponding Author [email protected]
2002 Fluent Student Contest Winner Presented in 2002 Fluent User Group
Meeting, Manchester, NH

2
Nomenclature A Superficial Electrode Area, m2
C Molar Concentration,mol/m3
D Species Diffusivity, m2/s
I Current Density, A/m2
S Source Terms in Transport and Phase Potential Equations
U Inlet Velocity, m/s
j Transfer Current Density, A/m3
u� velocity vector, m/s
p pressure, Pa
Greek Letters
η Overpotential, V
ρ density, kg/m3
ε porosity
σ Ionic Conductivity, S/m
Φ Phase Potential, V
ζ Stoichiometric Coefficient
ϑ Volumetric Flow Rate, m3/s
λ Water Content of The Membrane
µ Viscosity, kg m/s

3
Introduction
In recent years, the interest in development of fuel cell systems has accelerated.
Higher energy density and less polluting energy conversion promise of these devices
make them feasible for use in stationary, portable and automotive applications. In
particular, for automotive and portable applications, the Proton Exchange Membrane Fuel
Cells are considered as the most successful candidates for replacing current power
generating devices. Their high energy efficiency potential, possibly up to 50-70 %, which
is unlimited to Carnot cycle efficiency, very low greenhouse emissions, quieter and
reliable operation because of none or limited number of moving parts and scalability
allow them to replace Internal Combustion Engines for vehicle applications and batteries
for portable devices.
Like any electrochemical device, A Proton Exchange Membrane (PEM) Fuel Cell
system consists of an anode, a cathode and an electrolyte. A polymer membrane is used
as the electrolyte in PEM Fuel Cell systems. Each one of the anode and cathode
electrodes consist of gas channel, gas diffuser and catalyst layer, in which the electro-
chemical reactions take place. A Proton Exchange Membrane fuel cell is illustrated in
Figure 1.
The performance of the fuel cell system is characterized by current-voltage curve
(i.e. polarization curve). The difference between the open circuit potential of the
electrochemical reaction and cell voltage occurs from the losses associated with the
operation. The corresponding voltage drop is generally classified in three parts:
i. activation over-potential caused by the electrochemical reactions,
ii. ohmic drop across the polymer electrolyte

4
iii. mass transfer limitations of reactants
These associated losses dominate over different current density ranges. For low
current densities; the activation over-potential is dominant. For high current densities,
which are of particular interest for vehicle applications because of higher power density;
the mass transfer limitations dominates the losses. For moderate current densities, the
ohmic drop across the polymer membrane dominates. Moreover, for high current
densities, water starts to exist in liquid form leading to a two-phase transport of reactants
to reaction site, which is an additional transport phenomenon of PEM Fuel Cell
operation.
For optimal design and operation of PEM fuel cell system, a careful and detailed
understanding of transport and electrochemical kinetics is necessary. Several studies
accounting for this purpose has been published over the decades. The PEM fuel cell
research up to mid 1990’s is exclusively reviewed by Prater [1] and Gottesfeld [2] in
different studies. Moreover, in recent years, different numerical models of PEM Fuel
Cells are also published by different groups. Early models by Bernardi and Verbrugge [3]
and Springer et al. [4] are essentially one-dimensional models. Fuller and Newman [5],
Nguyen and White [6], Gurau et al. [7] and Yi and Nguyen [8] presented pseudo-two
dimensional models, which account for variations in compositions along the flow path.
Recently, Um et al. [9] has published a multi-dimensional CFD model of PEM Fuel Cells
based on the approach developed for battery systems by Gu et al. [10]
The objective of this study is to extend the applicability of the model by Um et al.
by considering the additional physics involved in the water transport. Water management
is highly critical in PEM Fuel Cell applications. In order to achieve high performance, the

5
ohmic losses should be minimized, therefore, the membrane should be hydrated, on the
other hand at the high current densities the water produced in the cathode catalyst layer
starts to condense at the cathode side, therefore hindering the oxygen transport and
lowering the performance. A detailed analysis of water transport, involving different
modes of transport is added to the previous model of Um et al. The proposed model is
solved using commercially available CFD software Fluent®, using User Defined
Functions to customize the solver to meet the purpose. The other goal of this study is to
investigate the effects of different flow field designs on the PEM Fuel Cell performance.
In the following sections, development of a Fluent® based multi-dimensional,
multi-physics PEM Fuel Cell model is described. The validation of model against
available experimental data is also provided.

6
Model Development
It is previously noted that the proposed model is based on the model of Um et al.
and suited particularly for commercially available CFD software Fluent®. The model
developed by Um et al. based on the battery systems modeling by Gu et al. and it is
formulated for single domain. Therefore, unlike the model presented by Gurau et al., the
proposed model does not require any internal boundary conditions between the
components of PEM Fuel Cell system.
A PEM Fuel Cell system consists of gas channels, gas diffusers, catalyst layers
and a polymer membrane, as shown in Figure 1. The different physical properties and
transport parameters are incorporated into a single set of governing equations using a
single domain formulation. The model aims to study the electrochemical kinetics, current
distribution, reactant flow fields and multi-component transport of oxidizer and fuel
streams in a multi-dimensional domain. The assumptions made in developing the model
are as follows:
• Ideal gas mixtures
• Incompressible and Laminar flow because low flow velocities and low fuel
utilization
• Isotropic and homogeneous porous electrodes, catalyst layers and membrane
• Isothermal operation
• Negligible ohmic resistance at porous electrodes and current collectors
Under isothermal conditions, fuel cell operation is governed by the mass,
momentum, species and charge conservation equations. The conservation equations of
mass, momentum, species and charge that are suited for Fluent®, is as follows:

7
( ) ( ) 0=⋅∇+∂
∂ ut
�ερρε (1)
( ) ( ) ( ) uSupuutu +∇⋅∇+∇−=⋅∇+
∂∂ ���
�
εµεερρε (2)
( ) ( ) ( ) kkeffkk
k SCDCutC
+∇⋅∇=⋅∇+∂
∂ �εε (3)
( ) 0=+Φ∇⋅∇ ΦSeeffgσ (4)
, where ekCu Φ,,� denotes intrinsic velocity vector, molar concentration of kth species
and electrolyte phase potential, respectively.
The corresponding source terms treating the electrochemical reactions and porous
media are presented in Table 3.
It is of benefit to further explain the corresponding diffusivities of the governing
equations. The diffusivities for species concentration equations and ionic conductivity for
membrane phase potential equation are modified using Bruggman correlation to account
for porous electrodes, which can be expressed as:
kmeffk DD 5.1ε= (5)
emeffe σεσ 5.1= (6)
In a fuel cell system, the inlet flow rates are generally expressed as stoichiometric
ratios of inlet streams based on a reference current density. The stoichiometric ratios inlet
streams are given by the following equations.
2
2anode anodeH
ref
FCI A
ζ ϑ= (7)
2
4cathode cathodeO
ref
FCI A
ζ ϑ= (8)

8
The local current density is calculated as:
( ), eff eeI y z
xσ ∂Φ=
∂ (9)
And the average current density is:
1 ( , )avgA
I I y z dydzA
= ∫∫ (10)
More details of developed model is presented in the previous study published by
Um et al. [9]
In a fuel cell system, water management has a significant impact on performance.
Besides, water vapor has more complex transport mechanism than any other species
present in PEM fuel cell operation. In the following section, treatment of water transport
in proposed model is explained.
Water Transport
In PEM Fuel Cells, due to properties of Polymer Electrolyte Membrane, the water
molecules are transported via electro-osmotic drag in addition to the molecular diffusion.
Water molecules are transported through the polymer electrolyte membrane by the H+
protons, and this transport phenomenon is called electro-osmotic drag. In addition to the
molecular diffusion and electro-osmotic drag, water vapor is also produced in the cathode
catalyst layer due to Oxygen Reduction Reaction. The transport of water has been
illustrated in Figure 2.
Water transport through the polymer electrolyte membrane has been investigated
by several researchers in different aspects. Most interesting studies in this area includes
the determination of water diffusion coefficient [11] and water drag coefficient [12] by

9
Zawodzinski et al. and investigating the diffusion of water in Nafion® membranes by
Motupally et al.[13]
The electro-osmotic drag coefficient is defined as the number of water molecules
transported by each hydrogen proton H+. The electro-osmotic drag coefficient can be
expressed with the following equation:
225.2 λ=dn [4] (11)
The diffusion coefficient of water in Polymer Membrane is also highly dependent
on the water content of the membrane. The relation is given as:
⋅⋅+⋅⋅⋅
<<⋅−⋅⋅⋅=
−−
−
otherwisee)e1611(1017.430fore)1e(101.3
T23468
T234628.07
/-
/-mWD
λ
λ
λλλ
[13] (12)
Boundary Conditions The previously noted set of equations, which governs the fuel cell operation forms
(m+5) unknowns, where m is the physical dimension of the problem domain. There are
natural boundary conditions of zero-flux prescribed everywhere other than the inlet and
outlets of the flow channels. The boundary conditions prescribed at the inlets of the gas
channels are:
2 2 2 2
2 2 2 2
0 0
, 0 , 0
, 0, , 0,
,
,
,
anode cathodein a in c
anode in cathode inH H O O
anode in a cathode in cH O H O H O H O
U U U U
C C C C
C C C C
= =
= =
= = (11)
Numerical Procedure The governing equations, (1) through (4) are solved using the commercially
available CFD software Fluent®. The software is customized using User Defined

10
Functions to be able solve the electrochemical kinetics, since the software is not capable
of modeling electrochemical systems. A mesh of 130x100x62 was found to provide
required spatial resolution for five-channel geometry. The solution is considered to be
converged when the difference between successive iterations is less than 10-7 for all
variables. The computation time for the geometry described above is around 7 hours on a
1.7 GHz PC.
11
Results & Discussion
The experimental data of Ticianelli et al. [14] is used to validate the results
obtained from numerical simulations. In Figure 3, the computed polarization curve is
compared the experimental results of Ticianelli et al. and it is seen that the calculated
results are in good agreement with the experimental data.
Unlike the published experimental results, the proposed model is capable of
providing more detailed data regarding the operation of fuel cell system, including the
flow field, species concentration and current density distribution.
To illustrate the capability of the proposed model and to investigate the effect of
flow field design on fuel cell performance, three different test cells are simulated. The
dimensions of these test cells are given in Table 3. The different flow fields used in these
three test cells are illustrated in Figure 4.
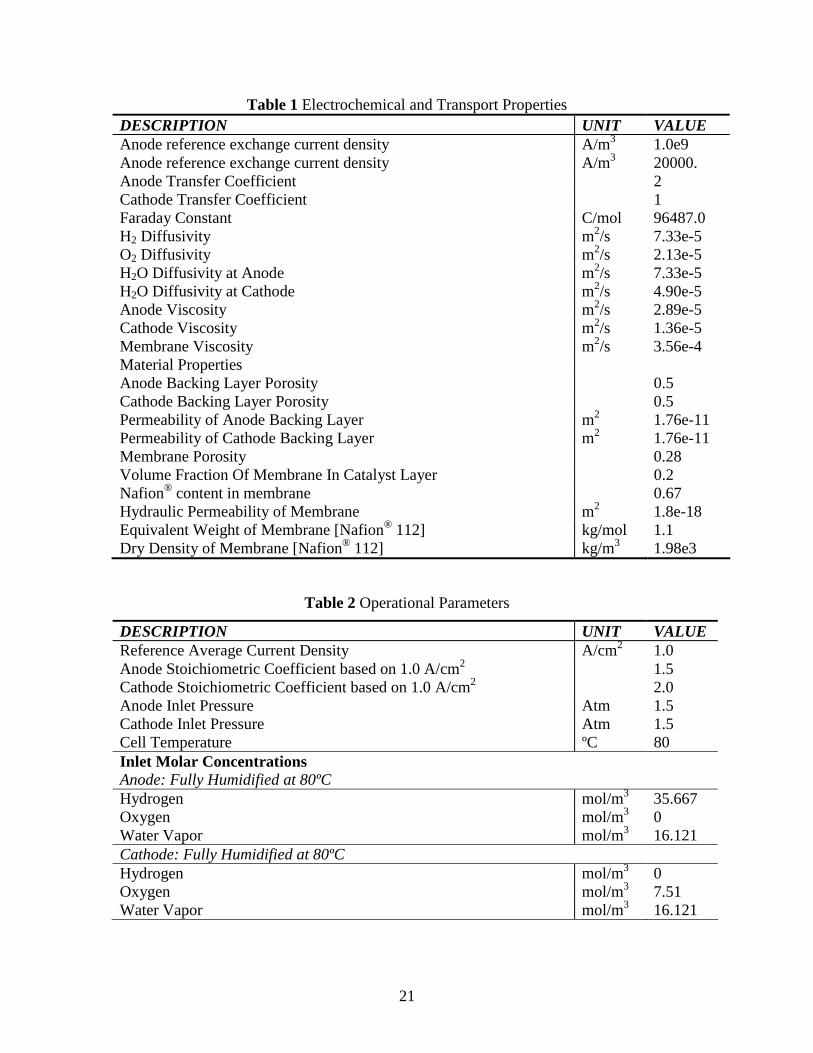
The Electrochemical and Transport Parameters used in these simulations are
summarized in Table 1, and the operational parameters are presented in Table 2.
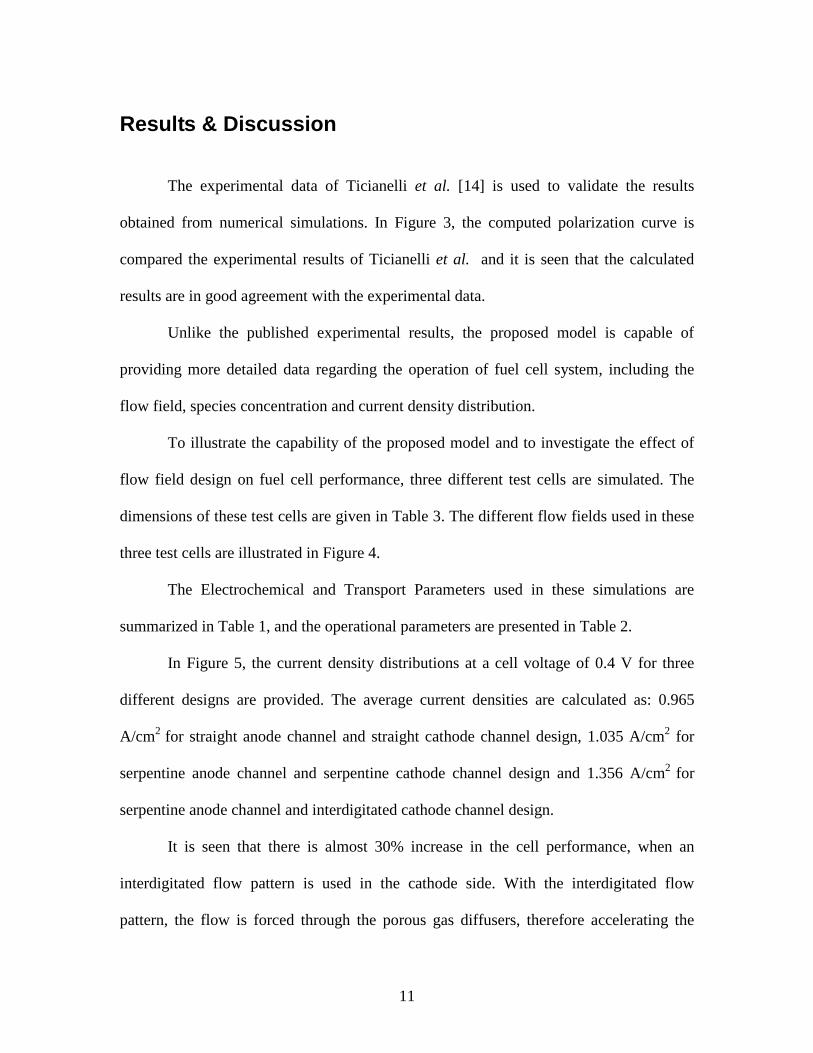
In Figure 5, the current density distributions at a cell voltage of 0.4 V for three
different designs are provided. The average current densities are calculated as: 0.965
A/cm2 for straight anode channel and straight cathode channel design, 1.035 A/cm2 for
serpentine anode channel and serpentine cathode channel design and 1.356 A/cm2 for
serpentine anode channel and interdigitated cathode channel design.
It is seen that there is almost 30% increase in the cell performance, when an
interdigitated flow pattern is used in the cathode side. With the interdigitated flow
pattern, the flow is forced through the porous gas diffusers, therefore accelerating the

12
transport of reactants to the reaction site, resulting in increase of performance. This
forced convection also carries away more water produces in the catalyst layer ,which is
produces as a result of the oxygen reduction reaction.
When the results are further investigated, it is seen that the current density
distribution is more uniform in third design than the other two. In the serpentine or
straight designs, a significant difference noticed in the regions underneath of the current
collector and the gas channel.
Figure 6 displays the species molar concentrations for three different designs. It is
seen that for all designs at this cell voltage, the water vapor molar concentrations exceeds
the saturated value, which means that condensation takes place. Therefore, this model can
be just illustrative at these cell voltages, a more-realistic multi-phase model is necessary
to fully simulate these current densities. Moreover, it is noted that at the inlet of gas
channels, there is net water vapor transport from anode to cathode due to electro-osmotic
drag. Then, the electro-osmotic drag is balanced by molecular diffusion from cathode to
anode, since water vapor concentration is higher in cathode due to Oxygen Reduction
Reaction.
Figure 7 shows calculated current density distribution along the channel to
channel direction. This figure illustrates the difference in the current density between the
regions underneath the current collector and the flow channel. In the regions underneath
the current collector, the convective transport is limited compared to the region
underneath the flow channel, therefore the electrochemical reaction is hindered, resulting
in lower current density. However, this effect is not seen in interdigitated flow field

13
design, since the flow is forced into the porous media, therefore increasing the convective
transport under the current collectors.
It is seen that fuel cell performance is highly improved by using interdigitated
flow pattern in the mass transfer limited zone of polarization curve. Interdigitated flow
fields are also effective in removing the excess water by providing additional convective
transport in the gas diffuser.

14
Conclusions
A three dimensional model has been developed and applied to three different
designs in order to investigate the effects of flow field on to PEM Fuel Cell Performance.
The effect is illustrated through the two-dimensional contours of current density for
different designs and three dimensional plots of species concentrations. The developed
model, which incorporated the electrochemical kinetics and multi-dimensional species
transport can be used to understand the complex electrochemistry occurring during the
fuel cell operation and simulating the actual operating conditions as a tool for design of
PEM Fuel Cells.

15
References [1] K. B. Prater, J. Power Sources, 51, 129 (1994)
[2] S. Gottesfeld, in Advances in Electrochemical Science and Engineering, C.
Tobias, Editor, Vol. 5, p.195, John Wiley and Sons, New York (1997)
[3] D. M. Bernardi and M. W. Verbrugge, J. Electrochem. Soc., 139, 2477 (1992)
[4] T. E. Springer, M. S. Wilson and S. Gottesfeld, J. Electrochem. Soc., 140, 3513
(1993)
[5] T. F. Fuller and J. Newman, J. Electrochem. Soc., 140, 1218 (1993)
[6] T. V. Nguyen and R. E. White, J. Electrochem. Soc., 140, 2178 (1993)
[7] V. Gurau, H. Liu and S. Kakac, AIChE J., 44, 2410 (1998)
[8] J. S. Yi and T. V. Nguyen, J. Electrochem. Soc., 146, 38 (1999)
[9] S. Um, C.-Y. Wang and K. S. Chen, J. Electrochem. Soc., 147, 12 (2000)
[10] W. B. Gu, C.-Y. Wang, and B. Y. Liaw, J. Electrochem. Soc., 144, 2053 (1997)
[11] T. A. Zawodzinski, Jr, M. Neeman, L. O. Sillerud and S. Gottesfeld, J. Phys.
Chem., 95, p.6040, (1991)
[12] T. A. Zawodzinski, J. Davey, J. Valerio and S. Gottesfeld, Electrochimica Acta,
40, 3 (1995)
[13] S. Motupally, A. J. Becker and J. W. Weidner, J. Electrochem. Soc., 147, 9
(2000)
[14] E. A. Ticianelli, C. R. Derouin and S. Srinivasan, J. Electroanal. Chem., 251,
275 (1998)

16
Figure 1 PEM Fuel Cell Schematics
Figure 2 Water Transport in PEM Fuel Cell

17
0
0.1
0.2
0.3
0.4
0.5
0.6
0.7
0.8
0.9
1
1.1
1.2
0 0.1 0.2 0.3 0.4 0.5 0.6 0.7 0.8 0.9 1
NumericalExp
Figure 3 Comparison of Calculated and Measured Polarization Curves
The experimental data is adapted from Ticianelli et al. [14]
Figure 4 Illustrations of different flow field designs
Straight Design Serpentine Design Interdigitated Design
18
Figure 5 Current Density Distribution for three different designs [A/m2] Fully Humidified Anode and Cathode Inlets, Vcell=0.4 V and Tcell=353 K
Straight-Straight Design Serpentine-Serpentine Design Serpentine-Interdigitated Design

19
Calculated H2 Molar Concentrations for different designs [mol/m3] Straight- Straight Design Serpentine- Serpentine Design Serpentine- Interdigitated Design
Straight- Straight Design Serpentine- Serpentine Design Serpentine- Interdigitated Design
Calculated O2 Molar Concentrations for different designs [mol/m3]
Straight- Straight Design Serpentine- Serpentine Design Serpentine- Interdigitated Design
Calculated H2O Molar Concentrations for different designs [mol/m3] Figure 6 Calculated Species Molar Con centrations for different designs Fully Humidified Anode and Cathode Inlets, Vcell=0.4 V and Tcell=353 K

20
4000
6000
8000
10000
12000
14000
16000
0 0.001 0.002 0.003 0.004 0.005 0.006 0.007 0.008 0.009 0.01Direction Along the Cell Height [m]
Cur
rent
Den
sity
[A/m
2]Straight-Straight DesignSerpentine-Serpentine DesignSerpentine-Interdigitated Design
Figure 7 Calculated Current Density Distribution Along the Channel-Channel Direction
y=L/2, Vcell=0.4 V, Tcell=353 K GC: Gas Channel
GCGC GC GCGC
21
Table 1 Electrochemical and Transport Properties DESCRIPTION UNIT VALUE Anode reference exchange current density A/m3 1.0e9 Anode reference exchange current density A/m3 20000. Anode Transfer Coefficient 2 Cathode Transfer Coefficient 1 Faraday Constant C/mol 96487.0 H2 Diffusivity m2/s 7.33e-5 O2 Diffusivity m2/s 2.13e-5 H2O Diffusivity at Anode m2/s 7.33e-5 H2O Diffusivity at Cathode m2/s 4.90e-5 Anode Viscosity m2/s 2.89e-5 Cathode Viscosity m2/s 1.36e-5 Membrane Viscosity m2/s 3.56e-4 Material Properties Anode Backing Layer Porosity 0.5 Cathode Backing Layer Porosity 0.5 Permeability of Anode Backing Layer m2 1.76e-11 Permeability of Cathode Backing Layer m2 1.76e-11 Membrane Porosity 0.28 Volume Fraction Of Membrane In Catalyst Layer 0.2 Nafion® content in membrane 0.67 Hydraulic Permeability of Membrane m2 1.8e-18 Equivalent Weight of Membrane [Nafion® 112] kg/mol 1.1 Dry Density of Membrane [Nafion® 112] kg/m3 1.98e3
Table 2 Operational Parameters
DESCRIPTION UNIT VALUE Reference Average Current Density A/cm2 1.0 Anode Stoichiometric Coefficient based on 1.0 A/cm2 1.5 Cathode Stoichiometric Coefficient based on 1.0 A/cm2 2.0 Anode Inlet Pressure Atm 1.5 Cathode Inlet Pressure Atm 1.5 Cell Temperature ºC 80 Inlet Molar Concentrations Anode: Fully Humidified at 80ºC Hydrogen mol/m3 35.667 Oxygen mol/m3 0 Water Vapor mol/m3 16.121 Cathode: Fully Humidified at 80ºC Hydrogen mol/m3 0 Oxygen mol/m3 7.51 Water Vapor mol/m3 16.121

22
Table 3 Test Cell Dimensions
DESCRIPTION UNIT VALUE Cell Length mm 76.3 Cell Height mm 10.0 Current Collector Height mm 1.0 Gas Channel Height mm 1.0 Anode Gas Channel Width mm 2.54 Cathode Gas Channel Width mm 2.54 Anode Backing Layer Thickness mm 0.3 Cathode Backing Layer Thickness mm 0.3 Anode Catalyst Layer Thickness µm 10 Cathode Catalyst Layer Thickness µm 10 Membrane Width [Nafion® 112] µm 51 Total Cell Thickness mm 5.751
Table 4 Source Terms
SU (MOMENTUM) SK (SPECIES) SΦ Φ Φ Φ (PHASE POTENTIAL)
GAS CHANNELS 0 N/A
BACKING LAYERS u
K2εµ−
CATALYST LAYERS u
K2εµ−
: anode
2a
m mc
jF
ρε ε
−
: cathode4
c
m mc
jF
ρε ε
1 : cathode2
: anode
cd
m mc
da
m mc
j nFn jF
ρε ε
ρε ε
− + −
j
MEMBRANE uK
2εµ−
O2
H2O
H2