Computational Fluid Dynamics Modeling of Proton …/67531/metadc710225/m2/1/high... ·...
35
o .$ Computational Fluid Dynamics Modeling of Proton Exchange Membrane Fuel Cells Sukkee Urn and C.Y. Wangl GATE Center for Advanced Energy Storage Department of Mechanical Engineering The Pennsylvania State University University Park, PA 16802 K.S. Chen’ Engineering Sciences Center 4! Sandia National Laboratories @&/~ . Albuquerque, NM 87185-0834 % ~ &/?J 08;28! A manuscript to be submitted to / > Joumd of Electrochemical SocieQ { as a technical paper ‘ Electrochemical Society Active Member — ~ ,,. .4-. ,. .,, .,, ..... ,-, .. ,.. e,.e...,,.,. .... ,..-.,,, . ... J ,...,-. m. ———. .,
Transcript of Computational Fluid Dynamics Modeling of Proton …/67531/metadc710225/m2/1/high... ·...

o .$
Computational Fluid Dynamics Modelingof Proton Exchange Membrane Fuel Cells
Sukkee Urn and C.Y. WanglGATE Center for Advanced Energy Storage
Department of Mechanical EngineeringThe Pennsylvania State University
University Park, PA 16802
K.S. Chen’Engineering Sciences Center 4!Sandia National Laboratories
@&/~.
Albuquerque, NM 87185-0834% ~ &/?J
08;28!A manuscript to be submitted to /
>
Joumd of Electrochemical SocieQ {
as a technical paper
‘ Electrochemical Society Active Member
—~ ,,. .4-. ,. .,, .,, . .. . . ,-, . . ,.. e,.e...,,.,. ....... ,..-.,,,. ...J ,...,-. m. ———..,

DISCLAIMER
This report was prepared as an account of work sponsoredby an agency of the United States Government. Neither theUnited States Government nor any agency thereof, nor anyof their employees, make any warranty, express or implied,or assumes any legal liability or responsibility for theaccuracy, completeness, or usefulness of any information,apparatus, product, or process disclosed, or represents thatits use would not infringe privately owned rights. Referenceherein to any specific commercial product, process, orservice by trade name, trademark, manufacturer, orotherwise does not necessarily constitute or imply itsendorsement, recommendation, or favoring by the UnitedStates Government or any agency thereof. The views andopinions of authors expressed herein do not necessarilystate or reflect those of the United States Government orany agency thereof.
-- ‘T- ~-. k --w~ .-.,.. ..... ............. .. .......... ,~.... -A ,>7: >< ., ,,. .,- , > .+A,,,.,. ,,Y... .
DISCLAIMER
Portions of this document may be illegiblein electronic image products. Images areproduced from the best available originaldocument.
I
-——. . . —.—- .+ .. .,- V..LL-.>, , . . -X-7—-—---

, ‘,
2
A
exchange
Abstract
transient, multi-dimensional model has been deveIoped to simulate proton
membrane (PEM) fuel cells. The model accounts simultaneously for
electrochemical kinetics, current distribution, hydrodynamics and multi-component
transport. A single set of conservation equations valid for flow channels, gas-diffusion
electrodes, catalyst layers and the membrane region are developed and numerically
solved using a finite-volume-based computational fluid dynamics (CFD) technique. The
numerical model is validated against published experimental data with good agreement.
Subsequently, the model is ap~lied to explore hydrogen dilution effects in the anode feed.4
The predicted polarization cubes under hydrogen dilution conditions are found to be in.-
qualitative agreement with recent experiments reported in the literature. The detailed
two-dimensional electrochemical and flowhnsport simulations fiu-ther reveal that in the
presence of hydrogen dilution in the fuel stream, hydrogen is depleted at th reaction\
surface resulting in substantial kinetic polarization and hence a lower current density “that
is limited by hydrogen transport from the fuel stream to the reaction site.
(
i
-- ... .,, !,. , ., .,,,.,, ,...--. . . . . . . ! -. . .. .,. *.,<, . ,. ,, .,, . . . ~ , , -...+. -..
—. .-
h , . . .

Introduction .
Proton exchange membrane (PEM) fuel cell engines can potentially replace the
internal combustion engine for transportation because they are clean, quiet, energy-
efficient,
involves
modular and capable of quick
electrochemical reactions,.
component transport and heat transfer, a
start-up. Since a PEM fuel cell simultaneously
current distribution, hydrodynamics, multi-
comprehensive mathematical model is needed in
order to gain a iimdamental understanding of the interacting electrochemical and
transport phenomena and to provide a computer-aided tool for desiem and optimization of\
future fuel cell engines. 4,
Performance of a fuel cell. is measured by its current-volta~e relation (i.e.- the
polarization curve). At a particular current the voltage drop is mainly caused by: (1)
overpotentials of electrochemical reactions (mainly on the cathode)j (2) the ohmic drop
across the ionomeric membrane; and (3) the mass transport limitations of reac~ts tid
products. At high current densities of special interest to vehicuku applications, excessive
water is produced within the air cathode in the form of liquid thus leading to a gas-liquid
two-phase flow in the porous electrode. The ensuing two-phase transport of gaseous
reactants to the reaction surface, i.e. the cathode/membrane interface, becomes a limiting
mechanism for cell performance, particularly at high current densities (e.g. >1 A/cmz).
On the anode side, when reformate is used for the feed gas, the incoming hydrogen
stream is diluted with nitrogen and carbon dioxide. The effects of hydrogen dilution on
anode performance, particularly under high fuel utilization conditions, are significant.”z
Excellent reviews of the hydrogen PEM fuel cell research up to mid-1990s were
presented by Prater3 and Gottesfeld! Modeling and computer simulation of hydrogen fuel
.........

#
4
cells have been attempted by a number of groups with the common goal of better
understanding and hence optimizing fuel cell systems.
Bemardi and Verbrugge5”G,Springer et al.7”8,Fuller and
Notable work includes those of
Newmang, Nguyen and White’”,
Garau et al.’1, Yi and Nguyen’z”*3.Except for Garau et al.” and Yi and Nguyen’3,
previous models are essentially one-dimensional or pseudo two-dimensional, assuming
that fuel and oxidizer streams are well mixed and their compositions do not vary along
the flow channels. While such models are useful for small single cells, their applicability
to large-scale fuel cells, particulady under high i%el utilization conditions, is limited.t
Nevertheless, the one-dimensi~nal models of Bemardi and Verbrugge5”Gand Springer et
al 718provided a fundamental fr&ework to build multi-dimensional m~dels that followed..
The pseudo two-dimensional models developed by Fuller and Newmang, Nkwyen and
White’” and later Yi and Nguyenlz further demonstrated the importhnt roles played by
water and heat management in maintaining high performance of PEM fuel cells.\ ‘
Most recently, Gurau et al.” presented a two-dimensional model of transport
phenomena in PEM fuel cells. This work illustrated the utility of a multi-dimensional
model in the understanding of the internal conditions of a fiel cell such as the oxygen and
water distributions. Jn a separate development, Yi and N.guyen’3 formulated a two-
dimensional modeI to explore hydrodynamics and multi-component transport in the air
cathode of PEM fuel cells with an interdigitated flow field. Recent efforts have also been
made to model two-phase flow and transport in the air cathode, a critical issue that has
repeatedly been emphasized in the literature for fuel cells operated under high current
densities.’Js’5
I
I
I
I
I!
b
m..

5
The objective of the present study is two-fold. One is to develop a transient,
multi-dimensional model for electrochemical kinetics, current distribution, fuel and
oxidant flow, and multi-component transport in a realistic fuel cell based on a finite-
volume-based computational fluid dynamics (CFD) approach. The CFD method was first
adapted to electrochemical systems by Gu et al.lGand has since been applied successfully
to a variety of battery systems including lead-acid, nickel-cadmium, nickel-metal
hydride, lithium-ion, and the primary Li/SOClz cell.l&zzThe present work is intended to
extend the efficient single-domain CFD formulation previously developed for batteries to\
PEM fuel cells. The second gqal, and also of practical importance, is to explore hydrogen,
.dilution effects on PEM fuel cells running on reformate gas. Such effects were most
recently investigated experimentally but have not been modeled.
The following section describes a transient, multi-dimensional mathematical
model for electrochemical and transport processes occurring inside a PEM>el cell.
Model validation against the experimental data of Ticianelli et al.z3 is presented in
Section 3 along with a detailed, two-dimensional study of hydrogen dilution effects. The
last section summarizes the major conclusions from this study and identifies further
research based on the present CFD modeling framework.
anode
Numerical Model
Figure 1 schematically shows a PEM fiel cell divided into seven sub-regions: the
gas channel, gas-diffusion anode, anode catalyst layer, ionomeric membrane,
cathode catalyst layer, gas-diffusion cathode, and cathode flow channel. Distinct from
previous models, the present model considers the anode feed consisting of hydrogen,
water vapor and nitrogen in order to simulate reformate gas, whereas humidified air is fed
— —-.

6
into the cathode channel. Hydrogen oxidation and oxygen reduction reactions are
considered to occur only within the active catalyst layers where Pt/C catalysts are
intermixed uniformly with recast ionomer. Other aspects of hydrogen fuel cell modeling
can be found in the works of Bemardi and VerbruggeGand Springer et al.s
The fiel and oxidant flow rates can be described by a stoichiometric flow ratio,
~, defined as the amount of reactant in”the chamber gas feed divided by the amount
required by the electrochemical reaction. That is, )
(1)
, (a -. .
where 0° is the inlet volumetric flow rate to a gas channel, p and T the pressure and
temperature, R and F the universal gas constant and Faraday’s conitant, 1 the current
density, and A the electrode stirface area. The subscripts (+) and (-) denote the athodek
and anode sides, respectively. For convenience, the stoichiometric flow ratios defined in
Eqs.(1) and (2) are chosen to be based on the reference current density of 1 A/cmz in the
present work so that the ratios can also be considered as dimensionless flow rates of the
fiel and oxidant.
Model Assumptions
The present model assumes:
. incompressible and Iaminm flow;
● ideal gas mixtures;
. isotropic and homogeneous electrodes, catalyst layers and membrane;
. constant cell temperature; and

7
● negligible potential drop in the electronically-conductive solid matrix of
porous electrodes and catalyst layers as well as the current collectors.
Governing Equations
In contrast to the approach of Garau et al.**which employs separate differential
equations for different sub-regions, we take the single-domain approach used in our
previous battery models in which a single set of governing equations valid for all sub-
regions are used. As a result, no interracial conditions are required to be specified at
internal boundaries between ‘various regions. In general, fuel cell operation under
4isothermal conditions is described by mass, momentum, species and charge conservation
.
principles. Thus, under the above-mentioned assumptions, the model equa~ons can be
written, in the vector form, as*9
“@)+v.(Epfi)=o.
at
J(&P~)+v.(&pfiti)=-&:+v .(&p”flvz)+s”at
y3)
(4)
) (5)J(~xk)+v. (&fixk)=v. (D;flvxk +~kat
V.(apq)+so =0 (6)
In the above ~, p, Xk, and @. denote the intrinsic fluid velocity vector, pressure, mole
fraction of chemical species k and the phase potential of the electrolyte membrane,
respectively. The diffusion coefficient of
membrane phase in Eqs.(5) and (6) are
species k and ionic conductivity of the
effective values modified via Bruggman
correlation to account for the effects of porosity and tortuosity in porous electrodes,
catalyst layers and the membrane. That is,
(7)
b. .

where E, is the volume fraction of solid membrane and other symbols in Eqs. (3) through\
(6) canbe found in the Nomenclature section.
Notice that three source terms, S., Sk, and S@ appear in momentum, species and
charge conservation equations to represent various volumetric sources or sinks arising
from each sub-region of a fuel cell. Detailed expressions of these source terms are given
in Table I. Specifically, the momentum source term is used to described Darcy’s drag for
flow through porous electrodes, active catalyst layers and the membrane~l 1.16 In
addition, electro-osmotic drag’arising from the catalyst layers and the membrane is also
included.. .
Generation or consumption of chemical species k only occurs in the active
catalyst layers where electrochemical reactions take place. So does the creation. of electric
\current (see Table I). Both Sk and So terms are therefore related to the transfer’ current
between the solid matrix and the membrane phase inside each of the catalyst layers.
These transfer currents at anode and cathode can be expressed as follows4:
j. = ai~uf.
j. =—ai~f ,
\ A H2,rcf(9)
(lo)
The above kinetics expressions are derived from the general Butler-Volmer equation
based on the facts that the anode exhibits fast electrokinetics and hence a low surface
overpotential to justify a linear kinetic rate equation, and that the cathode has relatively(
I
)
I
i
. . . ..--, —---.> ...-.,. . .,-.-.

9
slow kinetics to be adequately described by Tafel equation. In Eqs.(9) and (10) the
surface overpotential, q(x,y), is defined as
q(.x,y)= @$-Q, -V,,c (11)
where Q, and @e stand for the potentials of the electronically-conductive solid matrix
and electrolyte, respectively, at the electrode/electrolyte interface. VOCis the open-circuit
potential of an electrode. It is equal to zero on the anode but is a function of temperature
on the cathodez~;namely1
v,x.+= 0.0025 *T+ O.2~9 (12),
,. .
where T is in Kevin and VOCin Volts. Under the assumption of a perfectly conductive
solid matrix for electrodes and catalyst layers, Q. is equal to zero on ~heanode side at the
anodic current collector and to the cell voltage on the cathode side at the cathodic current\
collector. Thus, the surface overpotential given by Eq.(11) is only dependent upon the
membrane phase potential which is to be solved from Eq.(6).
The species diffusivity, Q, varies in different sub-regions of the PEM fuel cell
depending on the specific physical phase of component k. In flow channels and porous
electrodes, species k exists in the’gaseous phase and thus the diffusion coefficient takes
the value in gas, whereas species k is dissolved in the membrane phase within the catalyst
layers and the membrane, and thus takes the value corresponding to dissolved species,
which is usually a few orders of magnitude lower than that in gas (see Table II). In
addition, the diffusion coefficient is a function of temperature and pressurex, i.e.
(13)
.

10
The proton conductivity in the membrane phase has been correlated by Springer
et al.7 as
[ [++)1o,(T) = 100”exp 1268 .(0.0051391 -0.00326) in S/cm (14)
where the water content in the membrane, 2, depends on the water activity, a, according
to the following fit of the experimental data
{
~ 0.043+ 17.18a –39.85az + 36.0a3 for O<a<l
= 14+1.4(a -1) for l<a<3
The water activity is in turn calculated by
xa
ff~o. p=
Pw!
.
(15)
(16)
where the saturation pressure of water vapor can be computed from Springer et al.’
k)glop’”’= –2.1794+0.02953 .(2=-273.15) -9.1837 ”10-5.(T–273.J5)’(17)
+ 1.4454 .10-7 “(T-273.15)3
The above calculated saturation pressure is in bars.\
For the present multi-component system, the general species transpofi equation
given in Eq.(5) is applied to solve for mole fractions of hydrogen, oxygen, and water
vapor. The mole fraction of nitrogen is then obtained by the following constraint:
x ~2=1–x~z–xH,0 on the anode side
x~2=l–xo~‘xH20 on the cathode side
Once the electrolyte phase potential are determined
(18a)
(l~b)
in the membrane, the local
current density along the axial direction can be calculated as follows:
a~I(y)= –O:fx
x=I.F.(19)
,I
t
)
I
,
.—-. v. - . .. . . . . . . . . . . . ...>>.. . .. . . . ..J,..- -,. .
11
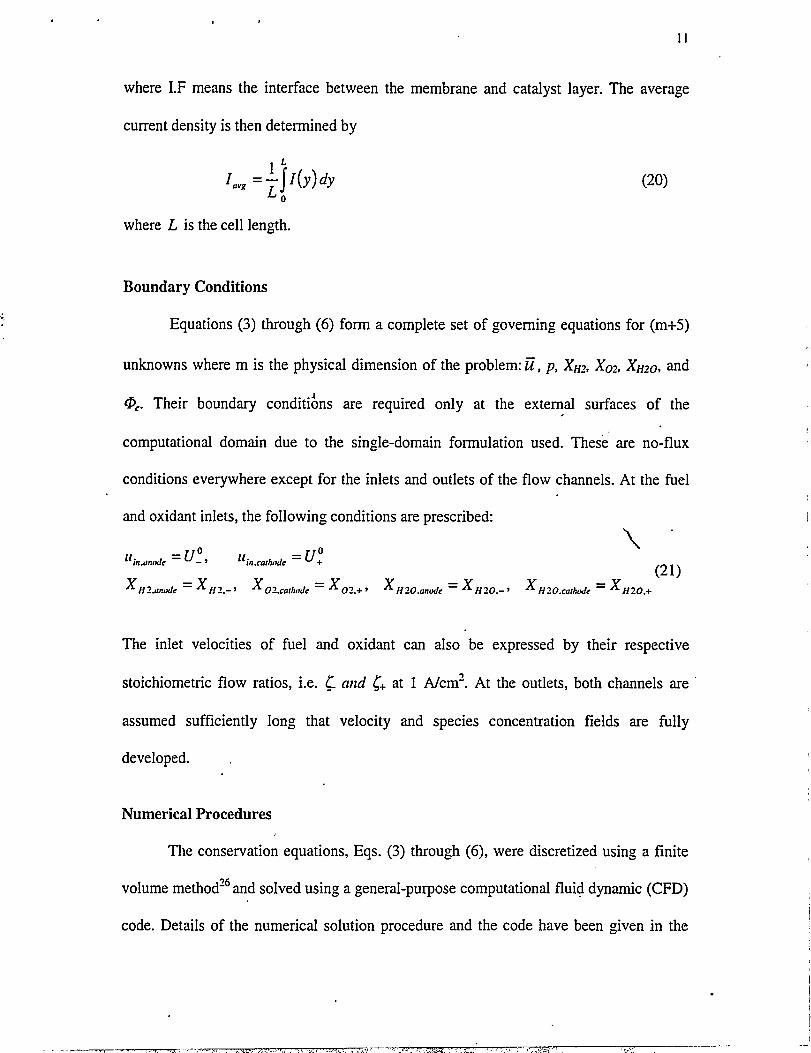
where I.F means the interface between the membrane and catalyst layer. The average
current density is then determined by
L
J()I lIydy=—UrgLO
(20)
where L is the cell length.
Boundary Conditions
Equations (3) through (6) form a complete set of governing equations for (m+5)
unknowns where m is the physical dimension of the problem: ~, p, XHZ,Xoz, XHZO,and
@c. Their boundary conditions are required only at the external surfaces of the.
computational domain due to the single-domain formulation used. These are no-flux
conditions everywhere except for the inlets and outlets of the flow channels. At the fuel
and oxidant inlets, the following conditions are prescribed:
\u.
m.lnwdc =U:, .uin ~*th,,& = u:(21)
x jf~.~~~= x Xo,.co,h”de= X*2,+, xH20.andc= xH20._, xH20.ca,M== XH,O.+ff~.-,
The inlet velocities of fuel and oxidant can also be expressed by their respective
stoichiometric flow ratios, i.e. ~. and <+at 1 A/cmz. At the outlets, both channels are
assumed sufficiently long that velocity and species concentration fields are fully
developed.
Numerical Procedures
The conservation equations, Eqs. (3) through (6), were discretized using a finite
volume methodzGand solved using a general-purpose computational fluid dynamic (CFD)
code. Details of the numerical solution procedure and the code have been given in the
.
.— ~. m,,, . . . . . . . . ., .,.,, ,,, ,--,. ,,. ,,, ,,. —. ,., ,,. ,, ,... s,A, ,.,, .,, ,. ,.,. ..T3F’ .
... . ..

previous work.*G’18A point worth mentioning here is that although some species are
practically non-existing in certain regions of a fuel cell, the species transport equation can
still be applied throughout the entire computational domain by using the large source
term technique originally proposed by Voller.z7 For example, there is virtually no
hydrogen in the cathode catalyst layer, gas-diffusion cathode and cathode gas channel.
Therefore, in these sub-regions, a sufficiently large source term is assigned to the
hydrogen transport equation, which effectively ‘freezes’ the hydrogen mole fraction at
zero. t
Stringent numerical tqsts were performed to ensure that the solutions were
independent of the grid size. It was found that a 35 by 90 mesh provides sufficient spatial
resolution. The coupled set of equations were solved simultaneously, and the solution
was considered to be convergent when the relative error in
consecutive iterations was less than 10-5.A typical simulation
eacli field between two
involving appr)~imately
2~,ooo un~owns required about 20 minutes of CpU time on a 600MHz PC.
Results and Discussion
Experimental Validation
To validate the numerical model presented in the preceding section, comparisons
were made to the experimental data of Ticianelli et al.n for a single cell operated at two
different temperatures. The parameters used in the following simulations were taken
from Bemardi and VerbruggeGand are summarized in Table II.
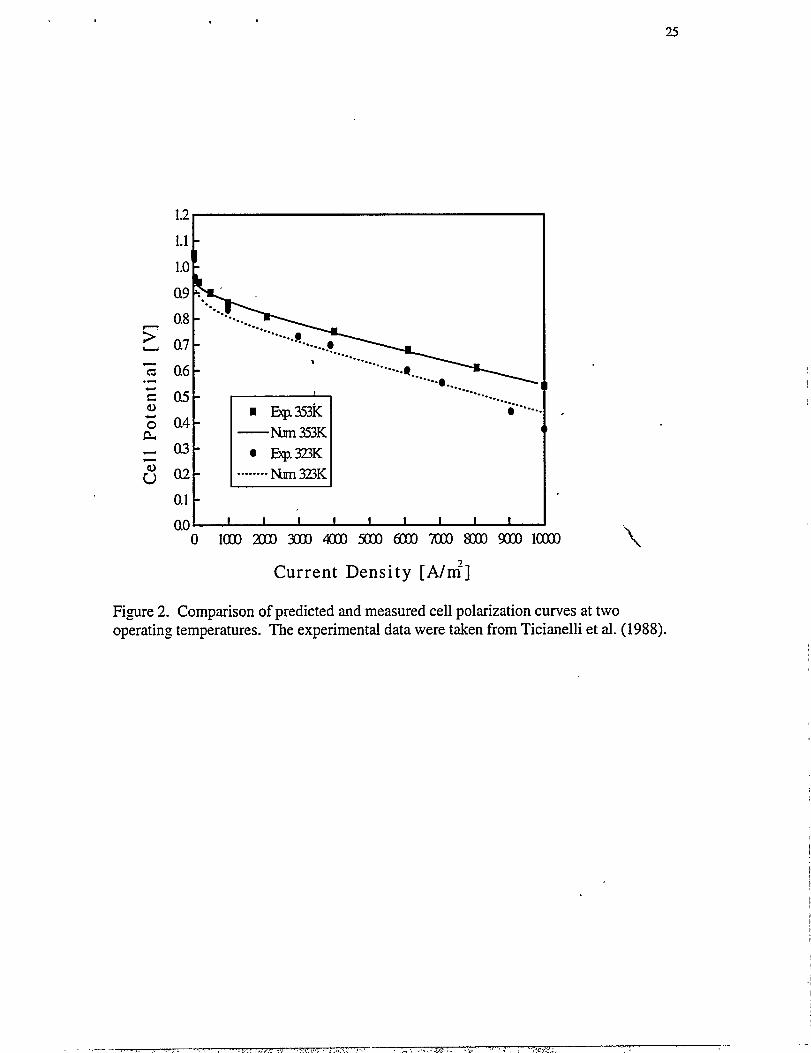
Figure 2 comp~es the computed polarization curves with the measured ones. The
calculated curves show good agreement with the experimental data for both temperatures.
—— , r., . . . . . . .. ,>. . . ,., , ., ....*.. . ~ {...’,- .,, ... ~ .,

.
13
The product of the specific interracial area and the exchange current density for the
anodic reaction used in these simulations is so large that the predicted surface
overpotential prevailing in the anode catalyst layer is practically negligible, which is in
accordance with the experimental measurement.
While no data of velocity and concentration fields were provided in the
experiments of Ticianelli et al.z3 , these detailed results can also be generated from the
present model to shed light on the internal operation of the fuel cell. Figure 3 shows the
predicted flow field inside the ~ntire cell, and the water vapor and oxygen mole fraction
fields within the porous cathodg and its adjacent flow channel for the experimental fuel.
cell at 353K. It can be seen that the velocity exhibits parabolic profiles in both anode and
cathode gas channels and reduces essentially to zero in the regions of porous structure.
The water vapor mole fraction incre~es along the cathode gas charinel while the mole
fraction of oxygen decreases, due to the electrochemical reaction within the}athode
catalyst layer where oxygen is reduced by protons migrating through the membrane from
the anode side to produce water.
Figure 4 displays the local current density distributions at various average current
densities along the axial direction of fuel cells. The current density distributions are quite
uniform at all cell average current densities due probably to the small cell employed in
these experiments.
In the present model it is assumed that water only exists in the vapor state.
However, it should be noted that if the electrochemical reaction rate is sufficiently high,
the amount of water produced would be condensed into the liquid phase. In this
situation, two-phase flow and transpofi must be considered. Figure 5 displays water vapor
.— . .. ..-. .. ..-.=. ..

.
14
mole fraction profiles along the interface between the catalyst layer and gas diffuser on
the cathode side where there is the highest content of water vapor. It is evident that when
the cell current density is higher than about 6000 A/mz, the water vapor mole fraction
along the catalyst layer/gas diffuser interface already exceeds the saturated level,
i.e. xg~~ = 0.0935LIIat the pressure of 5 atm and the cell temperature of 353 K. Hence, it
appears that the two-phase flow regime already starts at intermediate current densities.
Hydrogen Dilution Effects ,
When reformate gas is Used as the anode feed, the hydrogen mole fraction at the.
anode inlet is significantly lower than that in the pure hydrogen condition (i.e., hydrogen
plus water vapor only). As a consequence, hydrogen dilution has a strong effect on the
cell performance. A series of simulations for different hydrogen inlet fractions at the
\anode have been carried out to illustrate this effect. In all these simulatmns, the I
stoichiometric flow ratios of fuel and oxidant are 2.8 and 3.0 at 1 A/cmz respectively. It
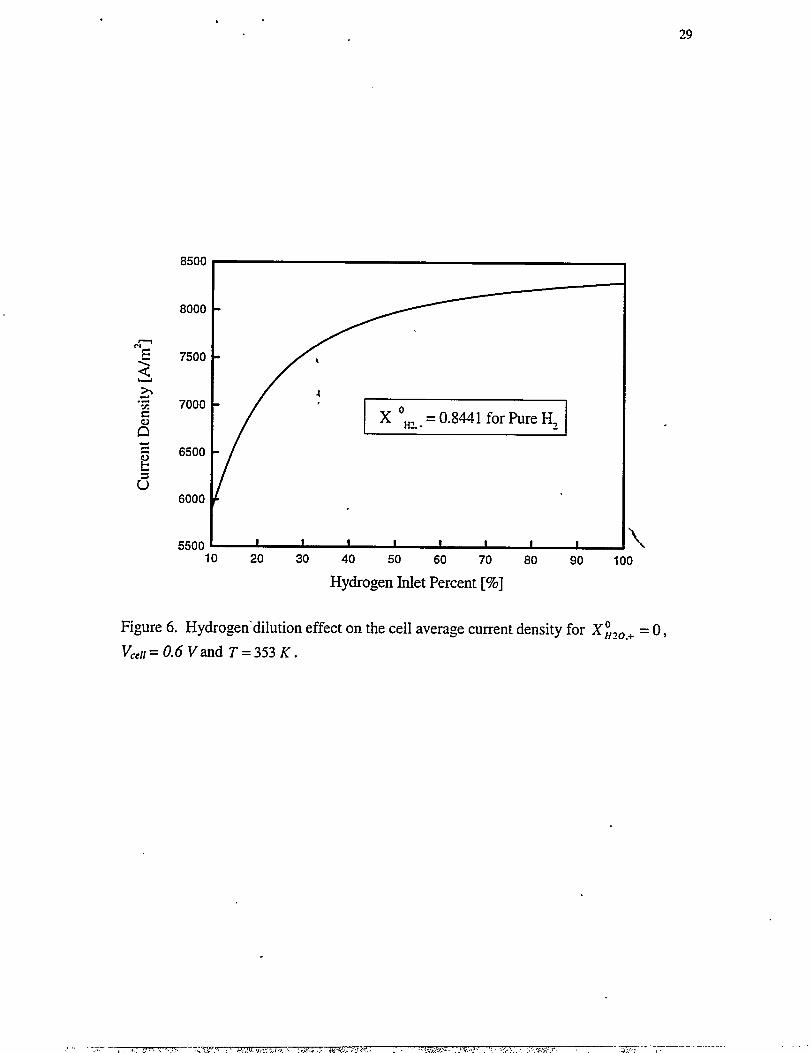
can be seen from Figures 6 and 7 that the cell current density at the cell voltage of 0.6 V
decreases significantly as the inlet hydrogen content is lowered, particularly in the range
below 50 percent. The cell polarization curves under pure and hydrogen dilution
conditions are displayed in Figure 7, showing “qualitatively good agreement with the most
recent experiments of Rockward et al.l
Figure 3 shows predicted profiles of the membrane phase potential across the
anode catalyst layer, the membrane and the cathode catalyst layer at various axial
locations. IrI the case of pure hydrogen, nearly zero overpotential is predicted within the
anode catalyst layer, indicating that the hydrogen oxidation kinetics on the anode is much
I1
—— . . . . ..r. . . . . . . . . ,.. \- .—

.15
faster than the cathode reaction. Furthermore, the membrane phase potential profile
remains similar at different axial locations. However, in the presence of large hydrogen
dilution, the overpotential for the hydrogen oxidation within the anode catalyst layer
significmtly increases m the hydrogen mole fraction at the reaction surface is drastically
reduced. This can easily be explained by Eq. (9) where the transfer current is
proportional to the square root of the hydrogen mole fraction. Downstream along the gas
channel, the anode gas is progressively
e~ectrochemical reaction, and thus the1
depleted in hydrogen as it
overpotential required to
is consumed by the
sustain a particular
current density becomes larger< Tliere are also appreciable differences in the membrane,
phase potential profile at various locations along the channel. A limiting cuyent density
may occur when hydrogen is completely depleted at the reaction surface thus leading to
an infinitely large anode polarization loss.
Figure 9 shows the two-dimensional contours of hydrogen mole fractib. in the
anode gas channel and porous electrode for 10% hydrogen dilution and no dilution cases,
respectively. It is seen that under the hydrogen dilution condition, the hydrogen mole
fraction decreases along the flow channel as well as across the porous anode. These
trends are more apparent from Figure 10 which displays the hydrogen mole fraction
profiles at several important boundaries. The ‘down-the-channel’. effect becomes
particularly significant in high fuel utilization conditions that are needed for the highest
possible fuel efficiency. This effect can, however, be alleviated by using large fuel flow
rates and thus at the expense of fuel utilization. For example, the ‘down-the-channel’
effect is not significant in the case displayed in Fig. 10. The substantial drop of Hz mole
fraction across the anode is caused by diffi.tsionof hydrogen from the anode stream to the
\\
— —.. . .—. .-

16
reaction surface, a limiting step for the cell current density in this case. On the contrary,
the hydrogen supply from the fuel stream to the reaction surface appears adequate in the
case of no dilution, as can be seen in Fig. 9b.
The above simulations provide a good illustration of the capabilities of the present
model. Although the results for hydrogen dilution effects are shown to be realistic, more
detailed analyses and parametric studies are desirable to fully investigate hydrogen
dilution and high fiel utilization effects. This will be presented in the near future.
t
Conclusion4
A single-domain fo~ulation was developed to comprehensively describe
electrochemical kinetics, current distribution, hydrodynamics, and multi-component
transport in hydrogen PEM fuel cells. A finite-volume-based computational fluid
dynamics technique was successfully adapted to simulate multi-dimensional behaviors of\
the fuel cell. The CFD model was shown to be able to predict not only the experimental
polarization curves of Ticianelli et al.z3
distributions inside the cell. In addition,
but also the detailed reactant and product
the CFD model was used to understand the
hydrogen dilution effect when the reformer gas k used as the mode feed. It W= found ‘
that hydrogen dilution leads to a much lower cell current density that is limited by the
diffhsive transport of hydrogen to the reaction site.
The results presented
PEM fuel cells. However,
here have focused only on the steady-state
the present CFD model can also simulate
operation of
the transient
response of a fuel cell to dynamically varying operating conditions; these transient results
will be reported in a separate publication. Efforts are also underway to simulate three-
dimensional behaviors of PEM fuel cells.
,
,
)
(
I
1
I.. . . . . . . . . . —-. . .:,. .<.. .,
17
Acknowledgments
This work was partially supported by Sandia National Laboratones. Sandia is a
multiprograrn laboratory operated by Sandia Corporation, a Lockheed lMartin Company,
for the United States Department of Energy under Contract DE-AC04-94AL85000. The
work is also supported by NSF under Grant No. DUE-9979579.
Nomenclature
A = superilcialelectrodearea
c = molarconcentration,mol/m3
D= massdiffusivityof species, ~z /s4
1= currentdensity, Almz ‘
j= transfercurrent, A/m3
p = pressure,Pa
R =g=constmt,3314 J j~ol. K
S = Sourceterm in transpofiequations
t = time
T = temperature, K
ii= velocityvector, m/s
U = inletvelocity, m/s
V = cell potential,V
X = mole fractionof species
Greek letters
A= membranewater content, mol HzOlmol SO;
@ =phasepotential,V
q = overpotential,V
p = viscosity, kglm. s
v = kinematicviscosity, m2/s
O = volumetricflow rate, m3/s
p = density, kg lm3
.
\
I
I
I
I
I
I
... .-., . .. . . . .. . ,.. . ..—.,.. . ... ..., ---

18
a = ionicconductivity
J = stoichiometri,cflow ratio, Eq.(1)
Superscripts
o = gas channelinlet value
eff = effectivevalue
sat = saturationvalue
Subscripts
a= anode
c = cathode.
e = electrolyte ‘
k = species ‘
m = membrane
oc = opencircuit
ref = referencevalue
s = solidphaseof electrode
u = momentumequation
@=potentialequation
-t = cathode
- = anode
\
References
1. T. Rockward, T. ‘Zawodzinski, J. Bauman, F. Uribe, J. Va.lerio,T. Springer and S.
Gottesfeld, Abstract No.566 in Meeting Abstracts of 195* Electrochemical Society
Meeting, Seattle, May 1999.
2. J.K. Hong, L.A. Zook, M. Inbody, J. Tafoya and N.E. Vanderborgh, Abstract No.570
in Meeting Abstracts of 195* Electrochemical Society Meeting, Seattle, May 1999.
3. K.B. Prater, J Power Sources, 51,,129 (1994).
4. S. Gottesfeld, in Advances in Electrochemical Science and Engineering, C. Tobias et
I
,
.. —,, ,.,. ..... . . . . ... ... + ., --- .. .—. ......... , , . ., ,-----.. - -,,/ I

.
19
al. eds., 5, 195, John Wiley and Sons, New York (1997).
5. D. M. Bemardi, and M. W. Verbrugge, AIC/zEJ., 37, 1151 (1991).
6. D. M. Bemardi, and M. W. Verbrugge, J. .Elecfrochem. Sot., 139,2477 (1992).
7. T. E. Springer, T. A. Zawodinski, and S. Gottesfeld, J. Electroc}zem. Sot., 136,
2334 (1991).
8. T.E. Springer, M.S. Wilson and S. Gottesfeld, J. Electrochem. Sot., 140,3513 (1993).
9. T.F. Fuller and J. Newman, J. Electrochem Sot, 140,1218 (1993).
10. T.V. Nguyen and R.E. Whi{e, J. Electrochern. Sot., 140,2178 (1993).
11. V. Gurau, H. Liu, and S. Kr#ac, AIC72EJ.,”44,2410 (1998).
12. J. S. Yi and T. V. Nguyen, J. Electrochem. Sot., 145, 1149 (1998).” . . ~
13. J. S. Yi and T. V. Nguyen, J. Electrochem. Sot., 146,38 (1999).
14. T.V. Nguyen, presented at 195’hMtg. of Electrochemical Society, May 4-7, Seattle
(1999). \
15. C.Y. Wang, Z.H. Wang and Y. Pan, in Proc. of IMECE99, ASME, New York (1999).
16. W.B. Gu, C.Y. Wang and B.Y. Liaw, J. Electrochem Sot, 144,2053 (1997).
17. W.B. Gu, C.Y. Wang and B.Y. Liaw, J. Power Sources, 75/1, 154 (1998).
18. W.B. Gu, C.Y. Wang and B.Y. Liaw, J. Electrochem Sot, 145,3418 (1998).
19. C. Y. Wang, W. B. Gu, and B.Y. Liaw, J. Electrochem. Sot., 145,3407 (1998).
20. C.Y. Wang, W.B. Gu, R. Cullion and B. Thomas, in Proc. of IMECE99, ASME, New
York (1999).
21. W.B. Gu, C.Y. Wang, S. Li, M.M. Geng and B.Y. Llaw, Electrochem. Acts, 44,
4525 (1999).
22. W.B. Gu, C.Y. Wang, J. Weidner, R. Jungst and G. Nagasubramanian, J. E1ectro-(
1
1
.- -—.-, , —.. , . .. .... . . ... ,.,,-. ..... .. , —.,--..,.,, ..,1,,.,. -, .,, , , .,>. . ;->!’—..,..,,,, I

.
them. Sot., accepted for publication (1999).
23. E. A. Ticianelli, C. R. Derouin, and S. Srinivasan, J. Electroanal. Chem., 251,275
(1988).
24. A. Parthasarathy, S. Srinivasan, and A. J. Appleby, J. Electrochem Sot, 139,2530
(1992).
25. R. B. Bird, W.E. Stewart and E.N. Lightfoot, Transport Phenomena, John Wiley &
Sons, Inc., New York (1960).
26. S. V. Patankar, Numerical Heat Transfer and Fluid Flow, Hemisphere, New York1
(1980). 4
27. V.R. Voller, Numer. Heat Transfer, Part B, 17, 155 (1990). .,
\
I
4
4
)
I
— —.. – ., ..,... . . .. . ... .,.:-. ,.-, <., !.4

Table I. Source terms for momentum, species and charge conservation equations invarious region.
Gas Channels
Gas-
Diffusion
Electrodes
Catalyst
Layers
Membrane
0
4
Sk
o
0
j.–— for Hz~Fctofu
~ for 0~4Fc,0,C
j. for HZO– 2Fc,0,U ‘
so
NIA
o
o
\
o
1
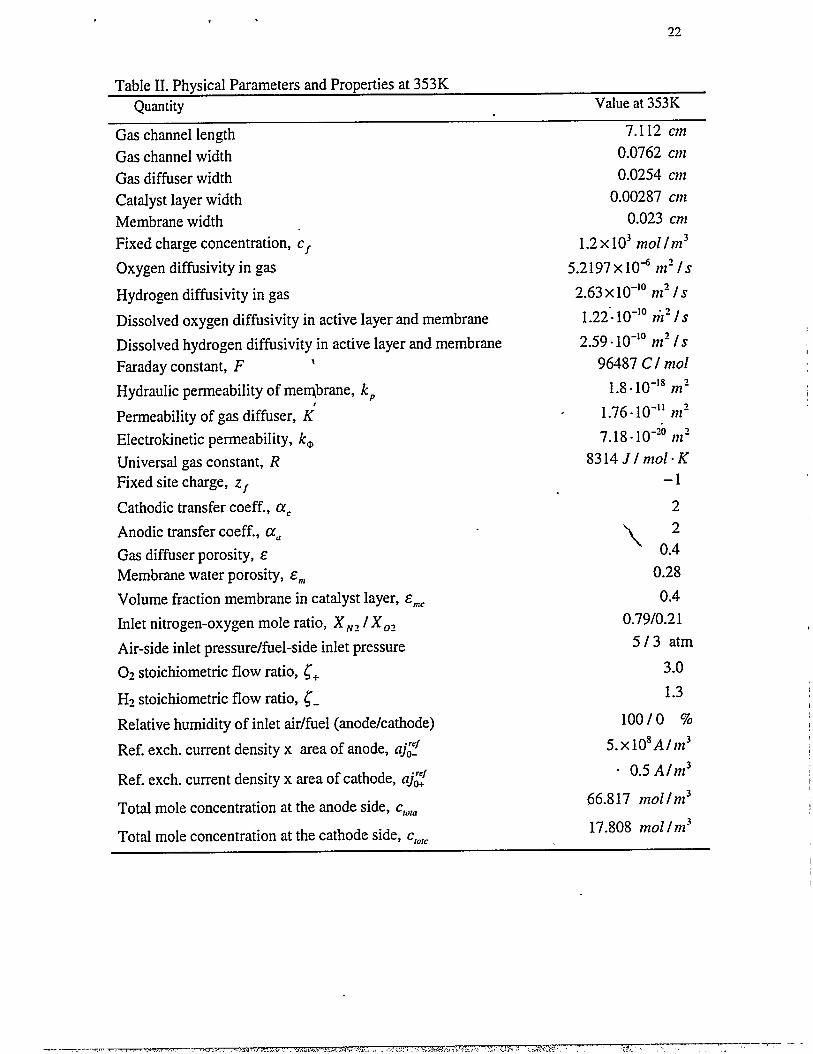
Table II. Physical Parameters and Properties at 353KQuantity Value at 353K
.
Gas channel length
Gas channel width
Gas diffiser width
Catalyst layer width
Membrane width
Fixed charge concentration, c,
Oxygen diffisivity in gas
Hydrogen diffusivity in gas
Dissolved oxygen diffusivity in active layer and membrane
Dissolved hydrogen diffusivity in active layer and membrane
Faraday constant, F 1
Hydraulic permeability of membrane, kP
Permeability of gas diffuser, K’
Electrokinetic permeability, k.
Universal gas constant, RFixed site charge, Zf
Cathodic transfer coeff., czC
Anodic transfer coeff., CXa
Gas diffuser porosity, sMembrane water porosity, &~
Volume fraction membrane in catalyst layer, &~C
Inlet nitrogen-oxygen mole ratio, X~z / Xoz
Air-side inlet pressure/fuel-side inlet pressure
Oz stoichiometric flow ratio, ~+
Hz stoichiometric flOWratio, g.
Relative humidity of inlet air/fuel (anode/cathode)
Ref. exch. current density x area of anode, aj~f
Ref. exch. current density x area of cathode, aj~’
Total mole concentration at the anode side, C,ti,d
Total mole concentration at the cathode side, C,o,c
7.112 cm
0.0762 Cm
0.0254 cm
0.00287 Cl?l
0.023 cm
1.2x10³ mol/nz3
5.2197x 10A mz /s
2.63 x 10-]0nzz /s
1.22”.10-’0ti2 /s
2.59 .10-]0 mz /s
96487 Cl mol
1.8“10-18mz. 1.76-10-’1 mz
7.18.10-z0 nzz
8314 JI ]?1o[”K.
–1
~
\2
0.4
0.28
0.4
0.79/0.21
5/3 atm
3.0
1.3
100/0 %
5.x10sAlm3
“ 0.5 A/m3
66.817 mollnz3
17.808 mol /m3
II
t
i
I
--- -—. --.,.. -.-7-. . . . . . . ,/, .- . . . . . . .. . . . . . ..?./ ,~r., ,T : ,.%?SZZ7R..,J{-. ,.., 1:,, ,~ ..% >=, . ~ +1,’ ~ ,.——— ~— — —,,, I

.
List of Figures
23
Figure 1. Schematic diagram of a proton-exchange-membrane (PEM) fuel cell.
Figure 2. Comparison of predicted and measured cell polarization curves at twooperating temperatures. The experimental data were taken from Ticianelli et al. (1988).
Figure 3. (a) Computed velocity profiles in anode and cathode flow channels, (b) watervapor mole fraction and (c) oxygen mole fraction in the cathode gas diffuser and flow
channel for 1.,$ = 8297 Almz, XjzO.+ = O, and T =353 K. The left boundary in (b) and
(c) is the interface between catalyst layer and gas-diffusion cathode.
Figure 4. Local current density distributions in the axial distance (y-direction) for
X:2*.+ =Oand T=353K.
Figure 5. Water mole fraction’profiles along the interface between the cathode catalyst
layer and gas diffuser for X~z~.+= O and T =353 K. .
Figure 6. Hydrogen dilution effect on the cell average current density for X~zO,+= O,
V,.,ll= 0.6 Vand T = 353 K .
Figure 7. Effect of the inlet hydrogen mole fraction on cell polarization curves for
X;20.+ =Oand T=353K. \
Figure 8. Phase potential distributions in the transverse direction (x-direction) for
,c\l= 0.6V , X;zo,v =0, T=353K, and<. = 2.8 at 1 A/cmz for Pure Hz.
Figure 9. Hydrogen mole fraction distributions in the anode flow channel and gas
diffusion electrode for X~zo,+= O, VCC,,=0.6V, T=353 K, and <. =2.8 at 1 A/cm?
(a) 10% hydrogen ( X~,._ = 0.08441 ) and (b) pure hydrogen ( X~,._ = 0.8441 ).
Figure 10. Hydrogen mole fraction profiles at: (a) the flow channel wall, (b) the interfacebetween the anode flow channel and gas diffusion electrode, and (c) the interface
between the gas diffision anode and catalyst layer for X~lO.+= O, VC~,,= 0.6V, and
T=353K.
>!
,
I)
II
I
....T.- ,. >,,>,.,s. ,-. ,- ...,, . . . . . . . ,.-,..,,,,, ..+. “:- ,”,. .-. Q.,..wt..: .-.
.+..-- —,-

Anode
GAS
CHA.V.VEL
Iiiiiil..#-.
CatkdtGAS
CHA.WEL
\
Figure 1. Schematic diagram of a proton-exchange-membrane (PEM) fiel cell.
I
1
,
I
I
I
,-rr -- ., .z-—.. ,,, . .. ,., ...,, . . ,.,,. . -.*.., ,2--- ,, . . . . ... 7-.*:.. ..- .<. ? . :..—
... < ..-s.-. -kc.. !,,
2.s
->’
c.-
12
1.1
1.0
09
08
07
06
05
04
0.3
02
P
~ Eql 3S3K
—IWm 353K
● Exp3ZK““”””-””Mm 323K
.
al
0.0oIcm2mm4m5cmmm mmlam
Current Density [A/m2]
Fi~re 2. Comparison of predicted and measured cell polarization curves at twooperating temperatures. The experimental data were taken from Ticianelli et al. (1988).
./, .!).. ‘ . . . . . !-. ,- -, ,... ..;.. x.. ..,, .> .,. ...,L-..J,

.26
8
(b)
!=/ 0.111101
I.
0.09rs+;0.08- 0.07v
0.060.050.040.030.020.010
(c)
I0.210.20.19..0.18*,0.170.160.150.140.130.120.110.1
\
Figure 3. (a) Computed velocity profiles in anode and cathode flow channels, (b) watervapor mole fraction and (c) oxygen mole fraction (c) in the cathode gas diffuser and flow
channel for Im~= 8297 Almz, X~zO,+= O, and T =353 K. The left boundary in (b) and
(c) is the interface between catalyst layer and gas-diffhsion cathode.f1
,
I
___ . ...— ——“., .,.”.., , ,.,. .%. . . .. . $,,. ’,..

.27
. . . . .1Uuuu
9000
8000
7000
6000
5000
4000
3000
. ..-..__
r —.--” —-.-.. _____ _
—— —.
~ 1,,%=9563A/mZ.. . . . . . . . . . . . .. . . . . . . . . . . . . . . . . . . . .. . . . . . . . . . .
\. . . . . . . . . . . . . . . . . . . . . . . . . . . . . . . . . . . . . . . .
Y“------ ------- ------- -------- ------- ------- ------- .. .
FI=,X=3810A/mz
I I I I I I
o 1 2 3 4 5 b
Axial Distance [cm]
Figure 4. Local current density distributions in the axial distance (y-direction) for
X;,o.+=Oand T=353K.
.?-,.-.~.. .-.,-. $’-’.. .,, ,.-,.~v-+ .- . ...’. ~?t.f- --- ~ .<”
—.
.. . . ,. .F, V 7>?., .!” ..2 .,. ‘.>.):+. ,.. .,!

. . .
28
0.11 __——---”--—- —— —.-—-..-..
#“-/---”./-
,...”
[
x satJf~o
. . . . . . . . . . . . . . . . . . . . . . . . . . . . . . . . . . . . . . . . . . . . . . . . . . . . . . . . . . . . . . . . . . . . . . . . . . . . . . . . . . . . . .
0.09c“o t
--------------- -------- ------- --.-_-----
.- ~z--- .~-.--~--
4 FL===
,.
0.06
o 1 2 3 4 5 6 7
hid Distance [cm] \. .
Figure 5. Water mole fraction profiles along the interface between the cathode catalyst
layer and gas diffuser for X~zo$+= O and T =353 K.
,, . -- >. ., .,\.,w. ,,,, . . .. . ! .>. ., ‘.. . ..>.. k ., . . .>., .,..,, ,, fl’:.,. ,+. ::<.73F- ,,:, ., -.—. . . . ..—,.
29
8500
8000
7500
7000
6500
6000
550010 20 30 40 50 60 70 80 go 100
Hydrogen Inlet Percent [%]
Figure 6. Hydrogen’dilution effect on the cell average current density for X~zo.+= O,
VCell= 0.6 Vand T = 353 K .
.,y,— . ,, .,>,,.,.%,.. .: !.~~. -, .Iu ..-. . ,, ,> :}.. .,. .,, ?,,7 , . . . ...>><.’.. . -.. !,s ! ..,. ,. ,, . ..- .&* .?”, . .> :.... ,_.. . .—. ___

. . .30
1.2 I
1.1
1.0 1
0.9
0.8
0.7
0.6
0.5
0.4
0.3
0.2
0.1
0.0
— 10%z/90%Nz
----- 20%~-/80%Nl
‘----””:50%</50% N,
––— Pure ~ -
~-= 2.8 at 1A/cm2for Pure H,
I I I I I I I I I
o 2000 4000 6000 8000 10000 12000 14000 16000 18000 20000
\
Current Density [A/mz]
Figure 7. Effect of the inlet hydrogen mole fraction on cell polarization curves for
x~zo.+=Oand T=353K.
9---..., ,.:, ,[.4 ! . . ...!.?... ,.. ! i \ .-. ~, . >,...l~,.-- . ., ., ,., . , ,’..->-<..--. ..+.

0.00
-0.05
-0.10
-0.15
-0.20
-0.25
-0.30
. .
.... .. .. ., ..
,: ..-- -;
!:..
:
:.. 10%H2MO%N2
..:....
m
.:.: Anode.... Catalyst.
.H.5LI ::.
0.105 0.110 0.115 0.120 0.125
Transverse Distance [cm]
Figure 8. Phase potential distributions in the transverse direction (x-direction) for
~t,l= 0.6V , X~zo.+v = O, T = 353 K, and <_ = 2.8 at 1 A/cmz for Pure Hz.
.

.
Ii0.08‘o.07
;2 0.06.<..~-05
‘0.040.030.020.01
1 1
0.80.750.70.650.60.5.50.50.450.4
\
(a) (b)
Figure 9. Hydrogen mole fraction distributions in the anode flow channel and gasdiffusion electrode for X~zO,+= O, VCC,,=0.6V, T =353 K, and <. = 2.8 at 1 A/cm?
(a) 10% hydrogen ( X~z.. --0.08441 ) and (b) pure hydrogen ( X~z._ = 0.8441 ).
.
.-“:<, ., .?,. .. -/..,.7 !. ’’.’-., .-.~,.~,. ., . .,,--,-,. ‘-.*->. .,.’.”” -’ 6,...’----- “’. ---*., --’”.””-: J , ..+*-
~,>:~.,

.
0.09
0.08
0.07
~ 0.06x- 0.05c
o.-GE 0.04L~ 0.03
50.02
0.01
0.00
w *
\8\\
\ (a) x=O.Ocm\ \ \
-* -. ‘. *.-4
/---
------ -----(b) x=O.07cm ---- ------ ------ ------
‘... G (clx=olcm..O... .. .. . . .... . . . . . . . / \.. . .. .. .. . . . .. .. . . . .. .. . . . .. .. . .. . .. .. . . . . .. . . . . .. . . . . . . . . . .t I I 1 I
o 1 2 3 4 5 6 7
P&l Distance [cm]
Figure 10. Hydrogen mole fraction profiles at: (a) the flow channel wall, (b) the interfacebetween the anode flow channel and gas diffusion electrode, and (c) the interface
between the gas diffusion anode and catalyst layer for X~zo,+= O, VCC,,= 0.6V, and
T=353K.