Computational description of nanocrystalline deformation...
13
Computational description of nanocrystalline deformation based on crystal plasticity Hsueh-Hung Fu, David J. Benson, Marc Andr e Meyers * Department of Mechanical and Aerospace Engineering, University of California, San Diego, Mail Code 0411, La Jolla, CA 92093, USA Received 22 January 2004; received in revised form 20 May 2004; accepted 21 May 2004 Available online 20 July 2004 Abstract The effect of grain size on the mechanical response of polycrystalline metals was investigated computationally and applied to the nanocrystalline domain. A phenomenological constitutive description is adopted to build the computational crystal model. Two approaches are implemented. In the first, the material is envisaged as a composite; the grain interior is modeled as a monocrystalline core surrounded by a mantle (grain boundary) with a lower yield stress and higher work hardening rate response. Both a quasi- isotropic and crystal plasticity approaches are used to simulate the grain interiors. The grain boundary is modeled either by an isotropic Voce equation (Model I) or by crystal plasticity (Model II). Elastic and plastic anisotropy are incorporated into this simulation. An implicit Eulerian finite element formulation with von Mises plasticity or rate dependent crystal plasticity is used to study the nonuniform deformation and localized plastic flow. The computational predictions are compared with the experimentally determined mechanical response of copper with grain sizes of 1 lm and 26 nm. Shear localization is observed during work hardening in view of the inhomogeneous mechanical response. In the second approach, the use of a continuous change in mechanical response, expressed by the magnitude of the maximum shear stress orientation gradient, is introduced. It is shown that the magnitude of the gradient is directly dependent on grain size. This gradient term is inserted into a constitutive equation that predicts the local stress– strain evolution. Ó 2004 Acta Materialia Inc. Published by Elsevier Ltd. All rights reserved. Keywords: Nanocrystalline materials; Grain size 1. Introduction The mechanical behavior of nanocrystalline metals has been the object of recent intense study [1,2]. Ex- perimental, analytical, and computational investigations are revealing the detailed mechanisms of plastic defor- mation. A universal observation is that the Hall–Petch slope shows a significant decrease as the grain size is decreased beyond 1 lm level (e.g. [2]). 1.1. Plasticity of crystals The early study of single crystal deformation can be traced back to the experiments by Taylor and Elam [3]. A simplified polycrystal model was proposed by Taylor [4], who assumed that each grain in the crystalline ag- gregate was subjected to the same average strain as the whole matrix. This model has been widely adopted in the study of large deformation of polycrystals (e.g., Bishop and Hill [5], Bishop [6], Dillamore and Kaoth [7], and others). Hill and Rice [8] used an elastic–plastic rate-independent model to describe the behavior of crystal deformation. Asaro and Rice [9] found, in single slip deformation, that localized shear slip occurs as the plastic hardening modulus for this slip system ap- proaches a small critical positive value. Thus, they proposed a constitutive model incorporating a deviation from the Schmid law. Another approach to the finite strain of polycrystals is the development of self consistent models. The early work was done by Kr€ oner [10] and Budianski and Wu [11]. This was followed by Berveiller and Zaoui [12] and * Corresponding author. Tel.: +1-858-534-4719; fax: +1-858-534- 5698. E-mail address: [email protected] (M. Andr e Meyers). 1359-6454/$30.00 Ó 2004 Acta Materialia Inc. Published by Elsevier Ltd. All rights reserved. doi:10.1016/j.actamat.2004.05.036 Acta Materialia 52 (2004) 4413–4425 www.actamat-journals.com
Transcript of Computational description of nanocrystalline deformation...
Acta Materialia 52 (2004) 4413–4425
www.actamat-journals.com
Computational description of nanocrystalline deformation basedon crystal plasticity
Hsueh-Hung Fu, David J. Benson, Marc Andr�e Meyers *
Department of Mechanical and Aerospace Engineering, University of California, San Diego, Mail Code 0411, La Jolla, CA 92093, USA
Received 22 January 2004; received in revised form 20 May 2004; accepted 21 May 2004
Available online 20 July 2004
Abstract
The effect of grain size on the mechanical response of polycrystalline metals was investigated computationally and applied to the
nanocrystalline domain. A phenomenological constitutive description is adopted to build the computational crystal model. Two
approaches are implemented. In the first, the material is envisaged as a composite; the grain interior is modeled as a monocrystalline
core surrounded by a mantle (grain boundary) with a lower yield stress and higher work hardening rate response. Both a quasi-
isotropic and crystal plasticity approaches are used to simulate the grain interiors. The grain boundary is modeled either by an
isotropic Voce equation (Model I) or by crystal plasticity (Model II). Elastic and plastic anisotropy are incorporated into this
simulation. An implicit Eulerian finite element formulation with von Mises plasticity or rate dependent crystal plasticity is used to
study the nonuniform deformation and localized plastic flow. The computational predictions are compared with the experimentally
determined mechanical response of copper with grain sizes of 1 lm and 26 nm. Shear localization is observed during work hardening
in view of the inhomogeneous mechanical response. In the second approach, the use of a continuous change in mechanical response,
expressed by the magnitude of the maximum shear stress orientation gradient, is introduced. It is shown that the magnitude of the
gradient is directly dependent on grain size. This gradient term is inserted into a constitutive equation that predicts the local stress–
strain evolution.
� 2004 Acta Materialia Inc. Published by Elsevier Ltd. All rights reserved.
Keywords: Nanocrystalline materials; Grain size
1. Introduction
The mechanical behavior of nanocrystalline metalshas been the object of recent intense study [1,2]. Ex-
perimental, analytical, and computational investigations
are revealing the detailed mechanisms of plastic defor-
mation. A universal observation is that the Hall–Petch
slope shows a significant decrease as the grain size is
decreased beyond 1 lm level (e.g. [2]).
1.1. Plasticity of crystals
The early study of single crystal deformation can be
traced back to the experiments by Taylor and Elam [3].
* Corresponding author. Tel.: +1-858-534-4719; fax: +1-858-534-
5698.
E-mail address: [email protected] (M. Andr�e Meyers).
1359-6454/$30.00 � 2004 Acta Materialia Inc. Published by Elsevier Ltd. A
doi:10.1016/j.actamat.2004.05.036
A simplified polycrystal model was proposed by Taylor
[4], who assumed that each grain in the crystalline ag-
gregate was subjected to the same average strain as thewhole matrix. This model has been widely adopted in
the study of large deformation of polycrystals (e.g.,
Bishop and Hill [5], Bishop [6], Dillamore and Kaoth [7],
and others). Hill and Rice [8] used an elastic–plastic
rate-independent model to describe the behavior of
crystal deformation. Asaro and Rice [9] found, in single
slip deformation, that localized shear slip occurs as the
plastic hardening modulus for this slip system ap-proaches a small critical positive value. Thus, they
proposed a constitutive model incorporating a deviation
from the Schmid law.
Another approach to the finite strain of polycrystals
is the development of self consistent models. The early
work was done by Kr€oner [10] and Budianski and Wu
[11]. This was followed by Berveiller and Zaoui [12] and
ll rights reserved.
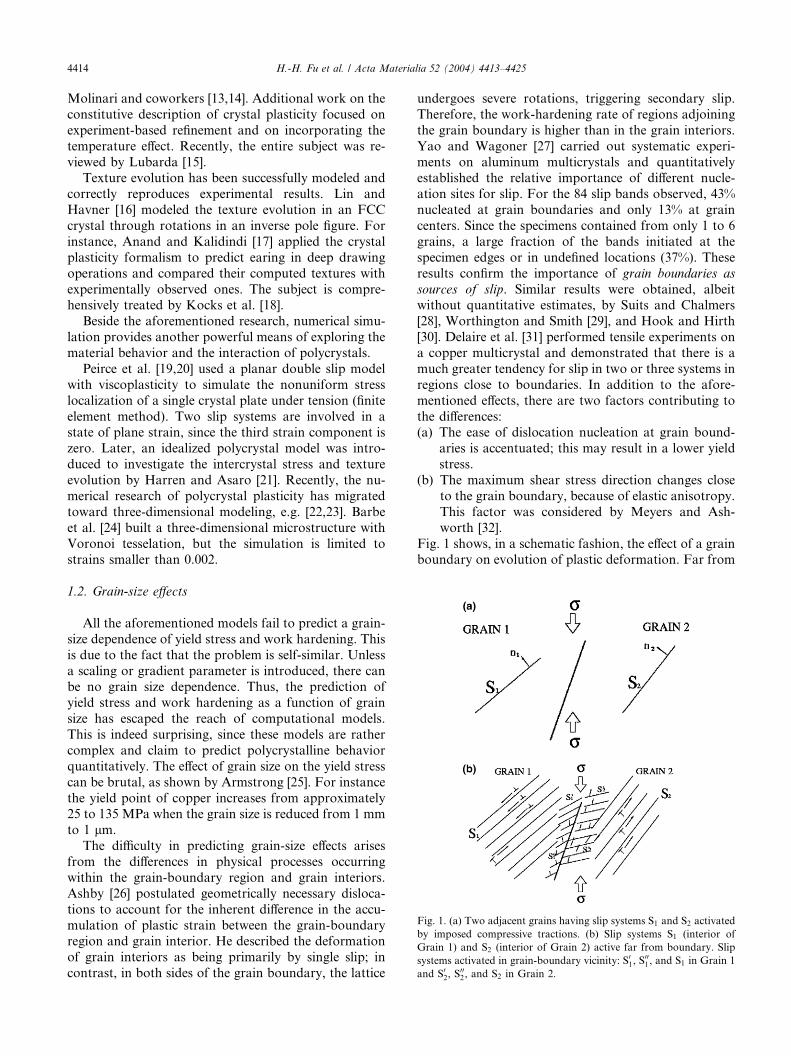
Fig. 1. (a) Two adjacent grains having slip systems S1 and S2 activated
by imposed compressive tractions. (b) Slip systems S1 (interior of
Grain 1) and S2 (interior of Grain 2) active far from boundary. Slip
systems activated in grain-boundary vicinity: S01, S001, and S1 in Grain 1
and S02, S002, and S2 in Grain 2.
4414 H.-H. Fu et al. / Acta Materialia 52 (2004) 4413–4425
Molinari and coworkers [13,14]. Additional work on the
constitutive description of crystal plasticity focused on
experiment-based refinement and on incorporating the
temperature effect. Recently, the entire subject was re-
viewed by Lubarda [15].Texture evolution has been successfully modeled and
correctly reproduces experimental results. Lin and
Havner [16] modeled the texture evolution in an FCC
crystal through rotations in an inverse pole figure. For
instance, Anand and Kalidindi [17] applied the crystal
plasticity formalism to predict earing in deep drawing
operations and compared their computed textures with
experimentally observed ones. The subject is compre-hensively treated by Kocks et al. [18].
Beside the aforementioned research, numerical simu-
lation provides another powerful means of exploring the
material behavior and the interaction of polycrystals.
Peirce et al. [19,20] used a planar double slip model
with viscoplasticity to simulate the nonuniform stress
localization of a single crystal plate under tension (finite
element method). Two slip systems are involved in astate of plane strain, since the third strain component is
zero. Later, an idealized polycrystal model was intro-
duced to investigate the intercrystal stress and texture
evolution by Harren and Asaro [21]. Recently, the nu-
merical research of polycrystal plasticity has migrated
toward three-dimensional modeling, e.g. [22,23]. Barbe
et al. [24] built a three-dimensional microstructure with
Voronoi tesselation, but the simulation is limited tostrains smaller than 0.002.
1.2. Grain-size effects
All the aforementioned models fail to predict a grain-
size dependence of yield stress and work hardening. This
is due to the fact that the problem is self-similar. Unless
a scaling or gradient parameter is introduced, there canbe no grain size dependence. Thus, the prediction of
yield stress and work hardening as a function of grain
size has escaped the reach of computational models.
This is indeed surprising, since these models are rather
complex and claim to predict polycrystalline behavior
quantitatively. The effect of grain size on the yield stress
can be brutal, as shown by Armstrong [25]. For instance
the yield point of copper increases from approximately25 to 135 MPa when the grain size is reduced from 1 mm
to 1 lm.
The difficulty in predicting grain-size effects arises
from the differences in physical processes occurring
within the grain-boundary region and grain interiors.
Ashby [26] postulated geometrically necessary disloca-
tions to account for the inherent difference in the accu-
mulation of plastic strain between the grain-boundaryregion and grain interior. He described the deformation
of grain interiors as being primarily by single slip; in
contrast, in both sides of the grain boundary, the lattice
undergoes severe rotations, triggering secondary slip.
Therefore, the work-hardening rate of regions adjoining
the grain boundary is higher than in the grain interiors.
Yao and Wagoner [27] carried out systematic experi-
ments on aluminum multicrystals and quantitativelyestablished the relative importance of different nucle-
ation sites for slip. For the 84 slip bands observed, 43%
nucleated at grain boundaries and only 13% at grain
centers. Since the specimens contained from only 1 to 6
grains, a large fraction of the bands initiated at the
specimen edges or in undefined locations (37%). These
results confirm the importance of grain boundaries as
sources of slip. Similar results were obtained, albeitwithout quantitative estimates, by Suits and Chalmers
[28], Worthington and Smith [29], and Hook and Hirth
[30]. Delaire et al. [31] performed tensile experiments on
a copper multicrystal and demonstrated that there is a
much greater tendency for slip in two or three systems in
regions close to boundaries. In addition to the afore-
mentioned effects, there are two factors contributing to
the differences:(a) The ease of dislocation nucleation at grain bound-
aries is accentuated; this may result in a lower yield
stress.
(b) The maximum shear stress direction changes close
to the grain boundary, because of elastic anisotropy.
This factor was considered by Meyers and Ash-
worth [32].
Fig. 1 shows, in a schematic fashion, the effect of a grainboundary on evolution of plastic deformation. Far from
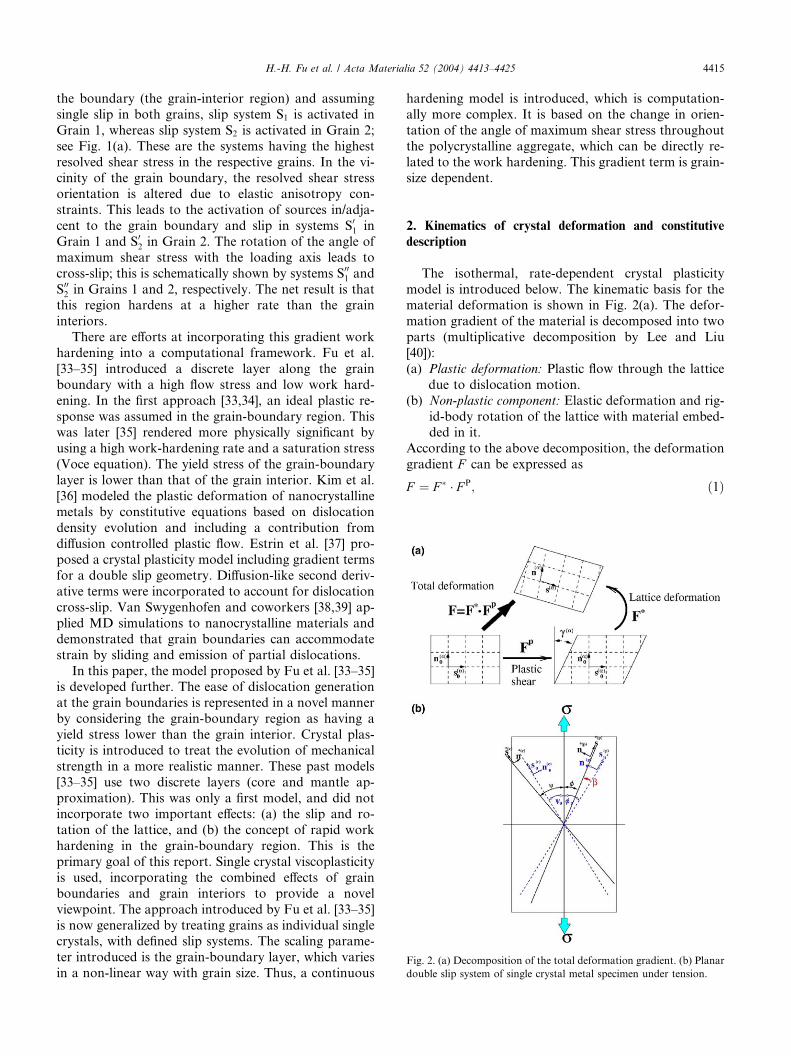
Fig. 2. (a) Decomposition of the total deformation gradient. (b) Planar
double slip system of single crystal metal specimen under tension.
H.-H. Fu et al. / Acta Materialia 52 (2004) 4413–4425 4415
the boundary (the grain-interior region) and assuming
single slip in both grains, slip system S1 is activated in
Grain 1, whereas slip system S2 is activated in Grain 2;
see Fig. 1(a). These are the systems having the highest
resolved shear stress in the respective grains. In the vi-cinity of the grain boundary, the resolved shear stress
orientation is altered due to elastic anisotropy con-
straints. This leads to the activation of sources in/adja-
cent to the grain boundary and slip in systems S01 in
Grain 1 and S02 in Grain 2. The rotation of the angle of
maximum shear stress with the loading axis leads to
cross-slip; this is schematically shown by systems S001 and
S002 in Grains 1 and 2, respectively. The net result is that
this region hardens at a higher rate than the grain
interiors.
There are efforts at incorporating this gradient work
hardening into a computational framework. Fu et al.
[33–35] introduced a discrete layer along the grain
boundary with a high flow stress and low work hard-
ening. In the first approach [33,34], an ideal plastic re-
sponse was assumed in the grain-boundary region. Thiswas later [35] rendered more physically significant by
using a high work-hardening rate and a saturation stress
(Voce equation). The yield stress of the grain-boundary
layer is lower than that of the grain interior. Kim et al.
[36] modeled the plastic deformation of nanocrystalline
metals by constitutive equations based on dislocation
density evolution and including a contribution from
diffusion controlled plastic flow. Estrin et al. [37] pro-posed a crystal plasticity model including gradient terms
for a double slip geometry. Diffusion-like second deriv-
ative terms were incorporated to account for dislocation
cross-slip. Van Swygenhofen and coworkers [38,39] ap-
plied MD simulations to nanocrystalline materials and
demonstrated that grain boundaries can accommodate
strain by sliding and emission of partial dislocations.
In this paper, the model proposed by Fu et al. [33–35]is developed further. The ease of dislocation generation
at the grain boundaries is represented in a novel manner
by considering the grain-boundary region as having a
yield stress lower than the grain interior. Crystal plas-
ticity is introduced to treat the evolution of mechanical
strength in a more realistic manner. These past models
[33–35] use two discrete layers (core and mantle ap-
proximation). This was only a first model, and did notincorporate two important effects: (a) the slip and ro-
tation of the lattice, and (b) the concept of rapid work
hardening in the grain-boundary region. This is the
primary goal of this report. Single crystal viscoplasticity
is used, incorporating the combined effects of grain
boundaries and grain interiors to provide a novel
viewpoint. The approach introduced by Fu et al. [33–35]
is now generalized by treating grains as individual singlecrystals, with defined slip systems. The scaling parame-
ter introduced is the grain-boundary layer, which varies
in a non-linear way with grain size. Thus, a continuous
hardening model is introduced, which is computation-
ally more complex. It is based on the change in orien-
tation of the angle of maximum shear stress throughout
the polycrystalline aggregate, which can be directly re-
lated to the work hardening. This gradient term is grain-size dependent.
2. Kinematics of crystal deformation and constitutive
description
The isothermal, rate-dependent crystal plasticity
model is introduced below. The kinematic basis for thematerial deformation is shown in Fig. 2(a). The defor-
mation gradient of the material is decomposed into two
parts (multiplicative decomposition by Lee and Liu
[40]):
(a) Plastic deformation: Plastic flow through the lattice
due to dislocation motion.
(b) Non-plastic component: Elastic deformation and rig-
id-body rotation of the lattice with material embed-ded in it.
According to the above decomposition, the deformation
gradient F can be expressed as
F ¼ F � � F P; ð1Þ
4416 H.-H. Fu et al. / Acta Materialia 52 (2004) 4413–4425
where F P is the deformation gradient from crystallo-
graphic slip and F � ¼ V eR� accounts for the non-plastic
part (including elastic stretching and the rigid body ro-
tation of the lattice). The initial lattice vectors of an
active slip system a, the slip plane normal n and the slipdirections, are stretched and rotated with the lattice as
(Fig. 2(b))
sðaÞ ¼ F � � sðaÞ0 ; ð2Þ
nðaÞ ¼ nðaÞ0 � F ��1: ð3Þ
In the-rate dependent formulation, the slip evolution
is not described by the loading condition as assumed in
rate-independent models [41]. Instead, the visco-plastic
slip system is described by a power relationship between
stress and strain rate. A successful expression is the
power relationship used by Hutchinson [42] for a slipsystem a; it has the form
sðaÞ ¼ gðaÞ_cðaÞ
_a
!m
sgnsðaÞ
gðaÞ
� �; ð4Þ
where _a is the reference slip rate, m is the rate sensitivity
parameter, (the limit of m ! 0 is the rate independent
case). The current slip resistance on the system a is gðaÞ
and the resistance of this slip system is initially the critical
resolved shear stress. The following evolution equation
for the current strain hardening state gðaÞ can be used:
gðaÞ ¼Xna¼1
hab _cðbÞ: ð5Þ
Eq. (5) represents the orientation effect on slip system afor plastic slip to occur. The hardening matrix habadopted by Hutchison [42] and Peirce et al. [19,20] is
hab ¼ ½qþ ð1� qÞdab�hðcÞ; ð6Þwhere the q is the ratio of latent hardening to self-hardening rates. Its value is estimated to be between 1
and 1.4 from the experimental data [44], and
hðcÞ ¼ h0 sec hh0c
ss � s0
� �; ð7Þ
where h0 is the initial hardening modulus and ss is thesaturated shear strength. Eq. (7) is based on the single
slip law, which comes from the approximation of ex-
perimental data
sðcÞ ¼ s0 þ ðss � s0Þ tanhh0c
ss � s0
� �; ð8Þ
where the sðcÞ is the current value of the flow stress in
single slip. Extending the application of Eq. (8) to the
multi-slip case, c is defined as the cumulative shear strain
on all slip systems, which is defined as
c ¼Xna¼1
jcðaÞj: ð9Þ
3. Results and discussion
Three models were used to treat the problem. They
represent increasing departures from the earlier Fu et al.
[33–35] approach, incorporating a more realistic re-sponse. The initial assumption for the grain-boundary
response [33,34] was ideally plastic with zero work
hardening; a second approach [35] used a Voce equation
with high work hardening rate. In these early papers, the
elastic deformation was assumed to be quasi-isotropic;
three types of grains with different (but isotropic) elastic
constants, were considered.
Three models are considered here. Model I uses aquasi-isotropic (or ‘‘pseudocubic’’) approach similar to
Fu et al. [35]. Within the grains, crystal plasticity (see
Section 2) is introduced. Model II incorporates full
elastic anisotropy, with the cubic elastic stiffness (C11,
C12, and C44). The grain interior is modeled by crystal
plasticity, which is more realistic than the isotropic
response assumed earlier by Fu et al. [35]. In Model
III the mechanical response is assumed to vary con-tinuously. This is done through the change in orien-
tation of the angle of maximum shear stress; the
magnitude of the gradient can be incorporated into the
work hardening, because it expresses a frequency of
cross-slip.
3.1. Model I: Crystal plasticity for grain interiors; Voce
equation for grain boundaries
In this model, the grain interiors are assumed to have
three orientations. They were modeled with three crystal
orientations given by Diehl [45], with an extension (at
higher strains) by Suzuki et al. [46]. The grain-boundary
regions are governed by a Voce equation with J2 flow
theory, as described in Fu et al. [35]. The two slip di-
rections of the three groups FCC crystals are assumed tobe / ¼ w ¼ 30� (Fig. 2(b)), and the FCC cell has to be
rotated according to the specified crystal orientations as
shown in Fig. 2(b). The crystal properties for this model
and the orientation of the crystals are specified with the
simplified two-dimensional assumption. The three ori-
entations considered correspond to the orientations C23,
C26, and C30 from Diehl [45]. The rotation angles for C23
and C26 are assumed to be 45� because their locations oncrystal stereographic projection positions are close to
[1 1 1] and [1 1 0], respectively. For C30, it is assumed to
be 90� because it is close to the location of [1 0 0]. The
elastic response is assumed to be ‘‘pseudocubic’’ and
three sets of Young’s moduli are used: E23 (for C23), E26
(for C26), and E30 (for C30). Their values are given in
Table 1. They were calculated from the compliance
matrix for copper, expressing Eijk according to thestandard relationship [47].
The direction cosines are l1, l2, and l3; s11, s12, and s44are the elastic compliances.
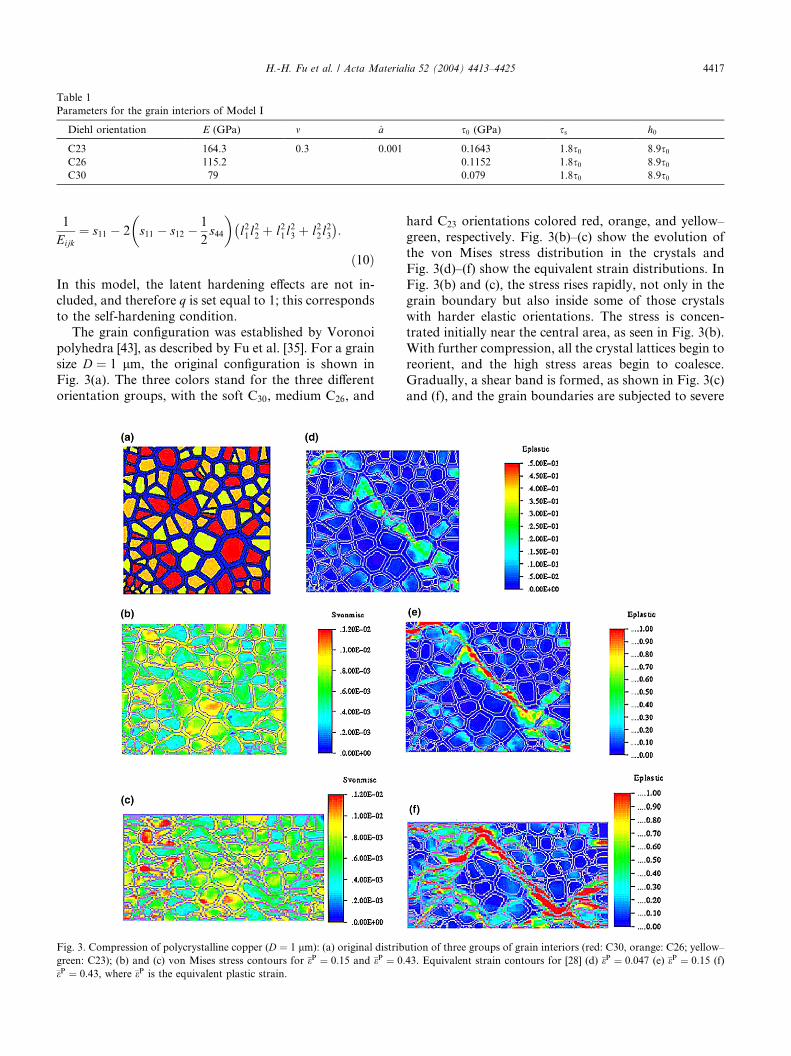
Table 1
Parameters for the grain interiors of Model I
Diehl orientation E (GPa) m _a s0 (GPa) ss h0
C23 164.3 0.3 0.001 0.1643 1:8s0 8:9s0C26 115.2 0.1152 1:8s0 8:9s0C30 79 0.079 1:8s0 8:9s0
H.-H. Fu et al. / Acta Materialia 52 (2004) 4413–4425 4417
1
Eijk¼ s11 � 2 s11
�� s12 �
1
2s44
�l21l
22
�þ l21l
23 þ l22l
23
�:
ð10Þ
In this model, the latent hardening effects are not in-
cluded, and therefore q is set equal to 1; this corresponds
to the self-hardening condition.
The grain configuration was established by Voronoi
polyhedra [43], as described by Fu et al. [35]. For a grainsize D ¼ 1 lm, the original configuration is shown in
Fig. 3(a). The three colors stand for the three different
orientation groups, with the soft C30, medium C26, and
Fig. 3. Compression of polycrystalline copper (D ¼ 1 lm): (a) original distrib
green: C23); (b) and (c) von Mises stress contours for �eP ¼ 0:15 and �eP ¼ 0:�eP ¼ 0:43, where �eP is the equivalent plastic strain.
hard C23 orientations colored red, orange, and yellow–
green, respectively. Fig. 3(b)–(c) show the evolution of
the von Mises stress distribution in the crystals and
Fig. 3(d)–(f) show the equivalent strain distributions. In
Fig. 3(b) and (c), the stress rises rapidly, not only in the
grain boundary but also inside some of those crystals
with harder elastic orientations. The stress is concen-trated initially near the central area, as seen in Fig. 3(b).
With further compression, all the crystal lattices begin to
reorient, and the high stress areas begin to coalesce.
Gradually, a shear band is formed, as shown in Fig. 3(c)
and (f), and the grain boundaries are subjected to severe
ution of three groups of grain interiors (red: C30, orange: C26; yellow–
43. Equivalent strain contours for [28] (d) �eP ¼ 0:047 (e) �eP ¼ 0:15 (f)
4418 H.-H. Fu et al. / Acta Materialia 52 (2004) 4413–4425
shear distortions, resulting in the destruction of the
grain boundary structure. This plastic shear flow pene-
trates through the grain interiors as shown in Fig. 3(c)
and (f). In comparison with earlier results of Fu et al.
[35], the strain is more localized in Model I; the locali-zation effect is much stronger and the difference between
the grains that are located inside and outside of the
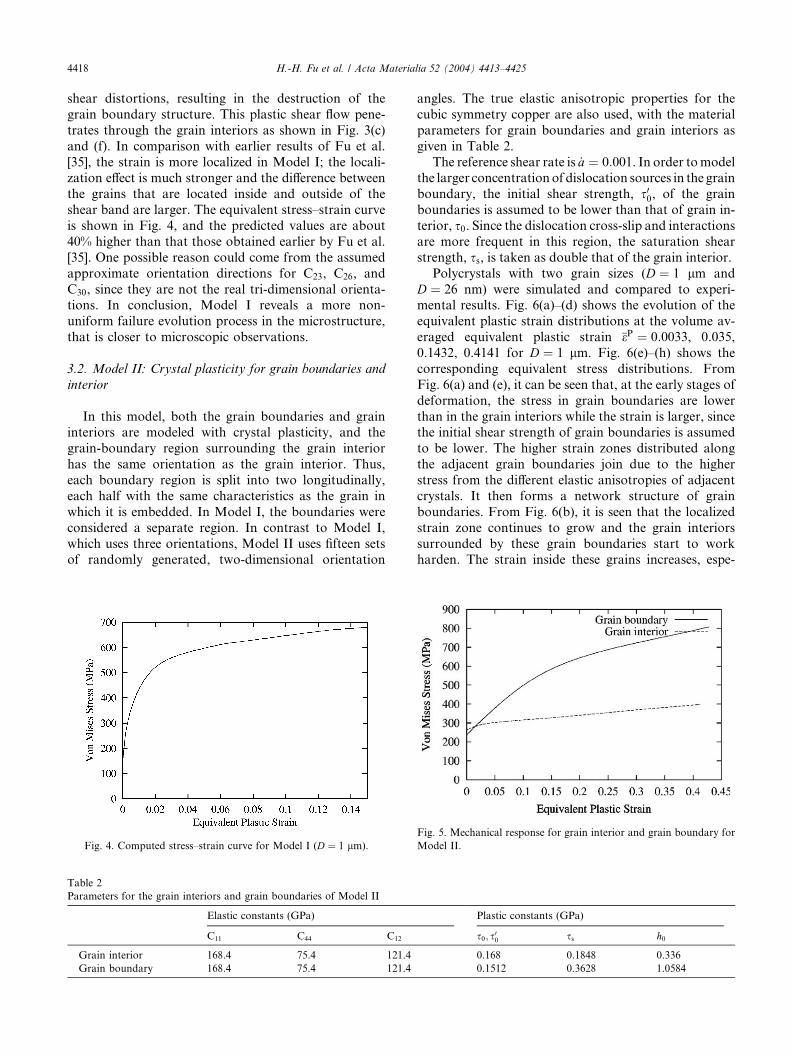
shear band are larger. The equivalent stress–strain curve
is shown in Fig. 4, and the predicted values are about
40% higher than that those obtained earlier by Fu et al.
[35]. One possible reason could come from the assumed
approximate orientation directions for C23, C26, and
C30, since they are not the real tri-dimensional orienta-tions. In conclusion, Model I reveals a more non-
uniform failure evolution process in the microstructure,
that is closer to microscopic observations.
3.2. Model II: Crystal plasticity for grain boundaries and
interior
In this model, both the grain boundaries and graininteriors are modeled with crystal plasticity, and the
grain-boundary region surrounding the grain interior
has the same orientation as the grain interior. Thus,
each boundary region is split into two longitudinally,
each half with the same characteristics as the grain in
which it is embedded. In Model I, the boundaries were
considered a separate region. In contrast to Model I,
which uses three orientations, Model II uses fifteen setsof randomly generated, two-dimensional orientation
Table 2
Parameters for the grain interiors and grain boundaries of Model II
Elastic constants (GPa)
C11 C44 C12
Grain interior 168.4 75.4 121.4
Grain boundary 168.4 75.4 121.4
Fig. 4. Computed stress–strain curve for Model I (D ¼ 1 lm).
angles. The true elastic anisotropic properties for the
cubic symmetry copper are also used, with the material
parameters for grain boundaries and grain interiors as
given in Table 2.
The reference shear rate is _a ¼ 0:001. In order tomodelthe larger concentrationof dislocation sources in the grain
boundary, the initial shear strength, s00, of the grain
boundaries is assumed to be lower than that of grain in-
terior, s0. Since the dislocation cross-slip and interactions
are more frequent in this region, the saturation shear
strength, ss, is taken as double that of the grain interior.
Polycrystals with two grain sizes (D ¼ 1 lm and
D ¼ 26 nm) were simulated and compared to experi-mental results. Fig. 6(a)–(d) shows the evolution of the
equivalent plastic strain distributions at the volume av-
eraged equivalent plastic strain �eP ¼ 0:0033, 0.035,
0.1432, 0.4141 for D ¼ 1 lm. Fig. 6(e)–(h) shows the
corresponding equivalent stress distributions. From
Fig. 6(a) and (e), it can be seen that, at the early stages of
deformation, the stress in grain boundaries are lower
than in the grain interiors while the strain is larger, sincethe initial shear strength of grain boundaries is assumed
to be lower. The higher strain zones distributed along
the adjacent grain boundaries join due to the higher
stress from the different elastic anisotropies of adjacent
crystals. It then forms a network structure of grain
boundaries. From Fig. 6(b), it is seen that the localized
strain zone continues to grow and the grain interiors
surrounded by these grain boundaries start to workharden. The strain inside these grains increases, espe-
Plastic constants (GPa)
s0; s00 ss h0
0.168 0.1848 0.336
0.1512 0.3628 1.0584
Fig. 5. Mechanical response for grain interior and grain boundary for
Model II.
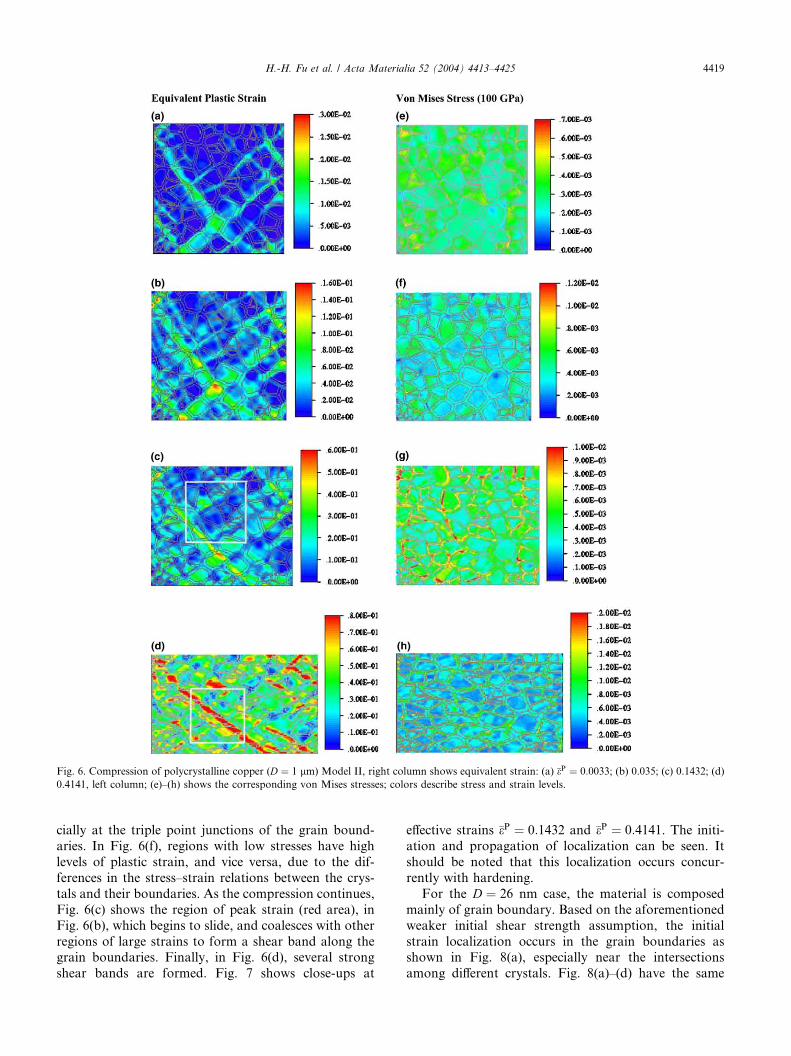
Fig. 6. Compression of polycrystalline copper (D ¼ 1 lm) Model II, right column shows equivalent strain: (a) �eP ¼ 0:0033; (b) 0.035; (c) 0.1432; (d)
0.4141, left column; (e)–(h) shows the corresponding von Mises stresses; colors describe stress and strain levels.
H.-H. Fu et al. / Acta Materialia 52 (2004) 4413–4425 4419
cially at the triple point junctions of the grain bound-
aries. In Fig. 6(f), regions with low stresses have high
levels of plastic strain, and vice versa, due to the dif-
ferences in the stress–strain relations between the crys-
tals and their boundaries. As the compression continues,
Fig. 6(c) shows the region of peak strain (red area), in
Fig. 6(b), which begins to slide, and coalesces with other
regions of large strains to form a shear band along thegrain boundaries. Finally, in Fig. 6(d), several strong
shear bands are formed. Fig. 7 shows close-ups at
effective strains �eP ¼ 0:1432 and �eP ¼ 0:4141. The initi-
ation and propagation of localization can be seen. It
should be noted that this localization occurs concur-
rently with hardening.
For the D ¼ 26 nm case, the material is composed
mainly of grain boundary. Based on the aforementioned
weaker initial shear strength assumption, the initial
strain localization occurs in the grain boundaries asshown in Fig. 8(a), especially near the intersections
among different crystals. Fig. 8(a)–(d) have the same
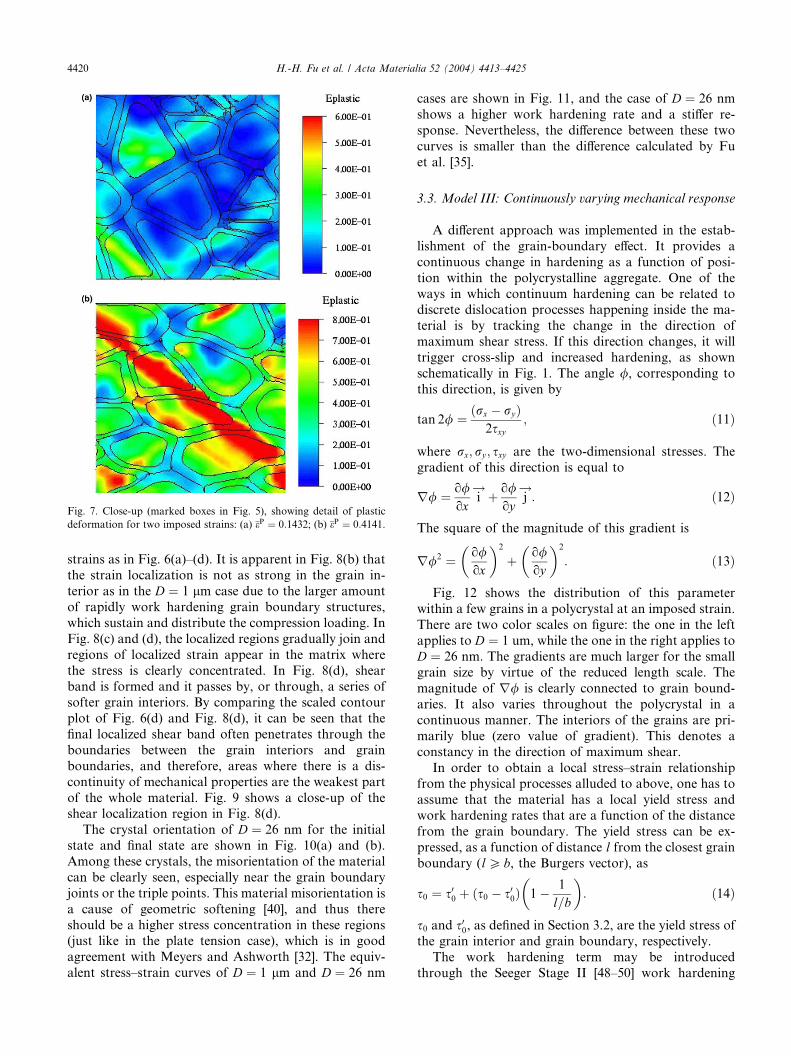
Fig. 7. Close-up (marked boxes in Fig. 5), showing detail of plastic
deformation for two imposed strains: (a) �eP ¼ 0:1432; (b) �eP ¼ 0:4141.
4420 H.-H. Fu et al. / Acta Materialia 52 (2004) 4413–4425
strains as in Fig. 6(a)–(d). It is apparent in Fig. 8(b) that
the strain localization is not as strong in the grain in-
terior as in the D ¼ 1 lm case due to the larger amount
of rapidly work hardening grain boundary structures,
which sustain and distribute the compression loading. In
Fig. 8(c) and (d), the localized regions gradually join and
regions of localized strain appear in the matrix where
the stress is clearly concentrated. In Fig. 8(d), shearband is formed and it passes by, or through, a series of
softer grain interiors. By comparing the scaled contour
plot of Fig. 6(d) and Fig. 8(d), it can be seen that the
final localized shear band often penetrates through the
boundaries between the grain interiors and grain
boundaries, and therefore, areas where there is a dis-
continuity of mechanical properties are the weakest part
of the whole material. Fig. 9 shows a close-up of theshear localization region in Fig. 8(d).
The crystal orientation of D ¼ 26 nm for the initial
state and final state are shown in Fig. 10(a) and (b).
Among these crystals, the misorientation of the material
can be clearly seen, especially near the grain boundary
joints or the triple points. This material misorientation is
a cause of geometric softening [40], and thus there
should be a higher stress concentration in these regions(just like in the plate tension case), which is in good
agreement with Meyers and Ashworth [32]. The equiv-
alent stress–strain curves of D ¼ 1 lm and D ¼ 26 nm
cases are shown in Fig. 11, and the case of D ¼ 26 nm
shows a higher work hardening rate and a stiffer re-
sponse. Nevertheless, the difference between these two
curves is smaller than the difference calculated by Fu
et al. [35].
3.3. Model III: Continuously varying mechanical response
A different approach was implemented in the estab-
lishment of the grain-boundary effect. It provides a
continuous change in hardening as a function of posi-
tion within the polycrystalline aggregate. One of the
ways in which continuum hardening can be related todiscrete dislocation processes happening inside the ma-
terial is by tracking the change in the direction of
maximum shear stress. If this direction changes, it will
trigger cross-slip and increased hardening, as shown
schematically in Fig. 1. The angle /, corresponding to
this direction, is given by
tan 2/ ¼ ðrx � ryÞ2sxy
; ð11Þ
where rx; ry ; sxy are the two-dimensional stresses. The
gradient of this direction is equal to
r/ ¼ o/ox
i!þ o/
oyj!: ð12Þ
The square of the magnitude of this gradient is
r/2 ¼ o/ox
� �2
þ o/oy
� �2
: ð13Þ
Fig. 12 shows the distribution of this parameter
within a few grains in a polycrystal at an imposed strain.
There are two color scales on figure: the one in the left
applies to D ¼ 1 um, while the one in the right applies toD ¼ 26 nm. The gradients are much larger for the small
grain size by virtue of the reduced length scale. The
magnitude of r/ is clearly connected to grain bound-
aries. It also varies throughout the polycrystal in a
continuous manner. The interiors of the grains are pri-
marily blue (zero value of gradient). This denotes a
constancy in the direction of maximum shear.
In order to obtain a local stress–strain relationshipfrom the physical processes alluded to above, one has to
assume that the material has a local yield stress and
work hardening rates that are a function of the distance
from the grain boundary. The yield stress can be ex-
pressed, as a function of distance l from the closest grain
boundary (lP b, the Burgers vector), as
s0 ¼ s00 þ ðs0 � s00Þ 1
�� 1
l=b
�: ð14Þ
s0 and s00, as defined in Section 3.2, are the yield stress of
the grain interior and grain boundary, respectively.
The work hardening term may be introduced
through the Seeger Stage II [48–50] work hardening
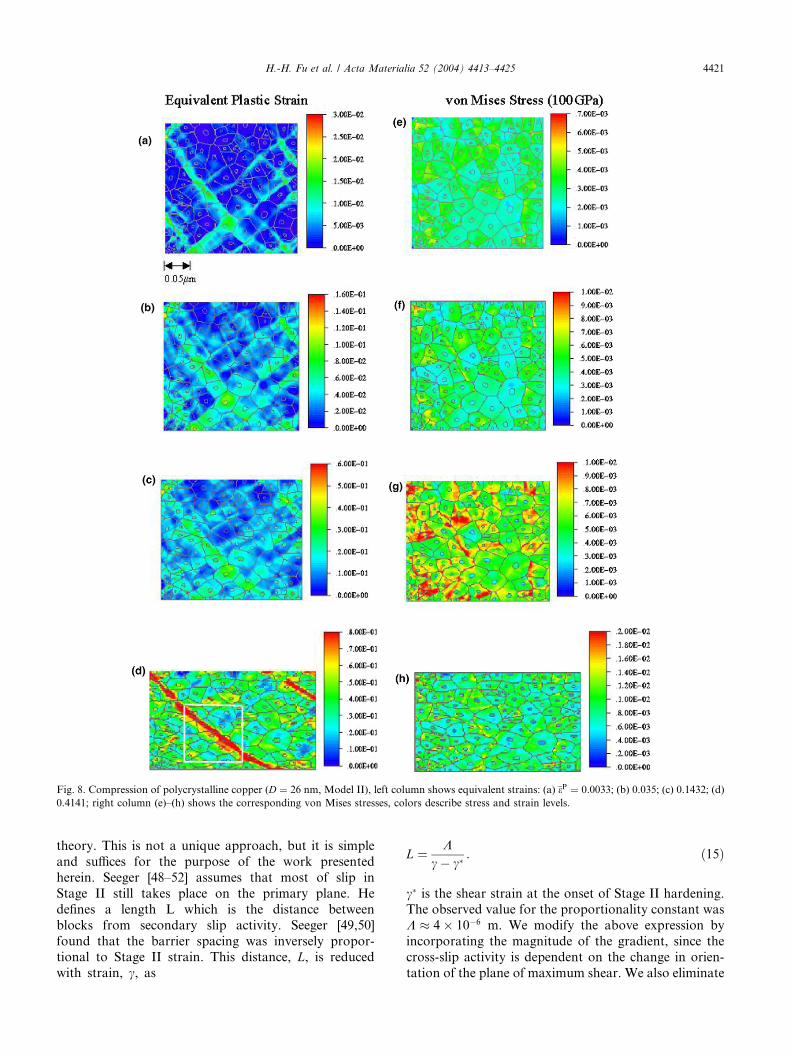
Fig. 8. Compression of polycrystalline copper (D ¼ 26 nm, Model II), left column shows equivalent strains: (a) �eP ¼ 0:0033; (b) 0.035; (c) 0.1432; (d)
0.4141; right column (e)–(h) shows the corresponding von Mises stresses, colors describe stress and strain levels.
H.-H. Fu et al. / Acta Materialia 52 (2004) 4413–4425 4421
theory. This is not a unique approach, but it is simple
and suffices for the purpose of the work presented
herein. Seeger [48–52] assumes that most of slip in
Stage II still takes place on the primary plane. He
defines a length L which is the distance between
blocks from secondary slip activity. Seeger [49,50]
found that the barrier spacing was inversely propor-tional to Stage II strain. This distance, L, is reduced
with strain, c, as
L ¼ Kc� c�
: ð15Þ
c� is the shear strain at the onset of Stage II hardening.The observed value for the proportionality constant was
K � 4� 10�6 m. We modify the above expression by
incorporating the magnitude of the gradient, since the
cross-slip activity is dependent on the change in orien-
tation of the plane of maximum shear. We also eliminate
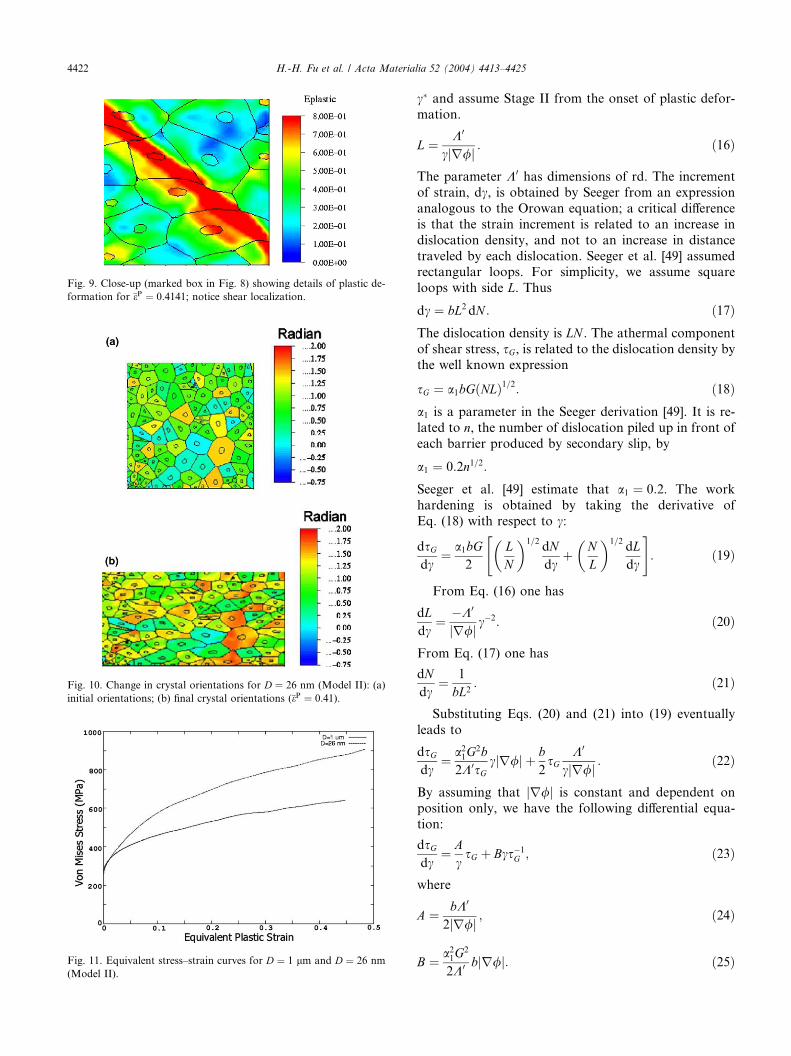
Fig. 9. Close-up (marked box in Fig. 8) showing details of plastic de-
formation for �eP ¼ 0:4141; notice shear localization.
Fig. 10. Change in crystal orientations for D ¼ 26 nm (Model II): (a)
initial orientations; (b) final crystal orientations (�eP ¼ 0:41).
Fig. 11. Equivalent stress–strain curves for D ¼ 1 lm and D ¼ 26 nm
(Model II).
4422 H.-H. Fu et al. / Acta Materialia 52 (2004) 4413–4425
c� and assume Stage II from the onset of plastic defor-
mation.
L ¼ K0
cjr/j : ð16Þ
The parameter K0 has dimensions of rd. The increment
of strain, dc, is obtained by Seeger from an expression
analogous to the Orowan equation; a critical difference
is that the strain increment is related to an increase in
dislocation density, and not to an increase in distance
traveled by each dislocation. Seeger et al. [49] assumedrectangular loops. For simplicity, we assume square
loops with side L. Thus
dc ¼ bL2 dN : ð17ÞThe dislocation density is LN . The athermal component
of shear stress, sG, is related to the dislocation density bythe well known expression
sG ¼ a1bG NLð Þ1=2: ð18Þa1 is a parameter in the Seeger derivation [49]. It is re-
lated to n, the number of dislocation piled up in front of
each barrier produced by secondary slip, by
a1 ¼ 0:2n1=2:
Seeger et al. [49] estimate that a1 ¼ 0:2. The work
hardening is obtained by taking the derivative of
Eq. (18) with respect to c:
dsGdc
¼ a1bG2
LN
� �1=2dNdc
"þ N
L
� �1=2dLdc
#: ð19Þ
From Eq. (16) one has
dLdc
¼ �K0
jr/j c�2: ð20Þ
From Eq. (17) one has
dNdc
¼ 1
bL2: ð21Þ
Substituting Eqs. (20) and (21) into (19) eventually
leads to
dsGdc
¼ a21G2b
2K0sGcjr/j þ b
2sG
K0
cjr/j : ð22Þ
By assuming that jr/j is constant and dependent on
position only, we have the following differential equa-
tion:
dsGdc
¼ AcsG þ Bcs�1
G ; ð23Þ
where
A ¼ bK0
2jr/j ; ð24Þ
B ¼ a21G2
2K0 bjr/j: ð25Þ
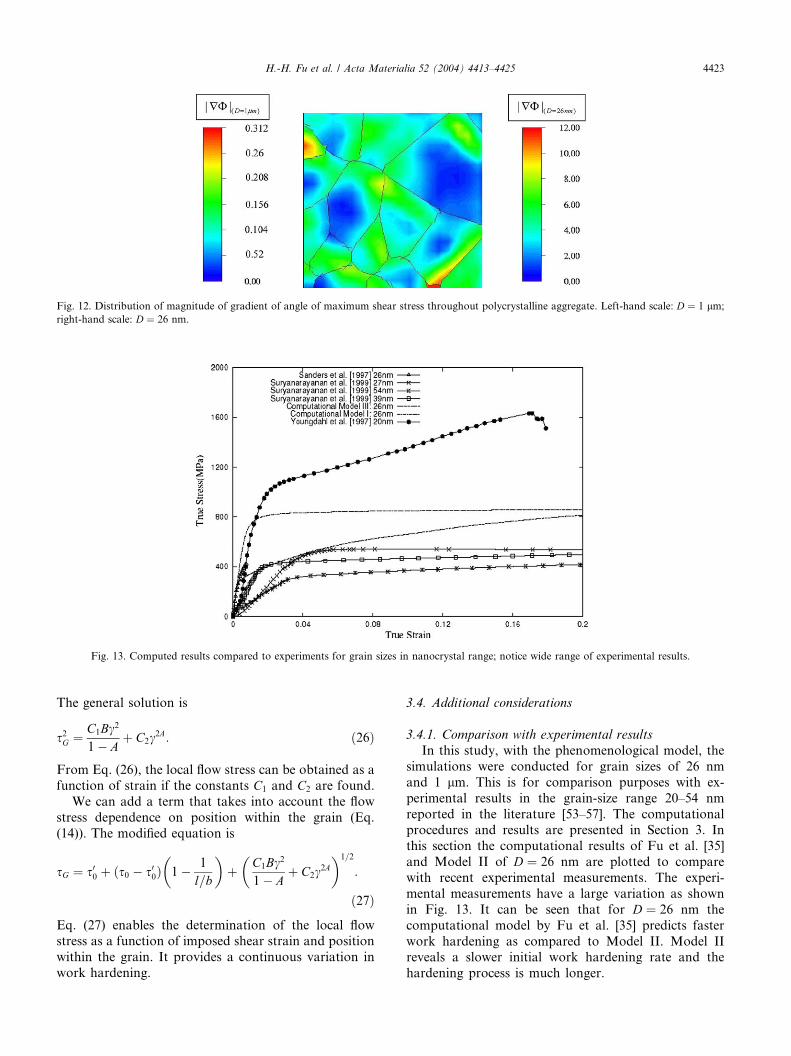
Fig. 12. Distribution of magnitude of gradient of angle of maximum shear stress throughout polycrystalline aggregate. Left-hand scale: D ¼ 1 lm;
right-hand scale: D ¼ 26 nm.
Fig. 13. Computed results compared to experiments for grain sizes in nanocrystal range; notice wide range of experimental results.
H.-H. Fu et al. / Acta Materialia 52 (2004) 4413–4425 4423
The general solution is
s2G ¼ C1Bc2
1� Aþ C2c
2A: ð26Þ
From Eq. (26), the local flow stress can be obtained as a
function of strain if the constants C1 and C2 are found.
We can add a term that takes into account the flow
stress dependence on position within the grain (Eq.
(14)). The modified equation is
sG ¼ s00 þ ðs0 � s00Þ 1
�� 1
l=b
�þ C1Bc2
1� A
�þ C2c
2A
�1=2
:
ð27Þ
Eq. (27) enables the determination of the local flowstress as a function of imposed shear strain and position
within the grain. It provides a continuous variation in
work hardening.
3.4. Additional considerations
3.4.1. Comparison with experimental results
In this study, with the phenomenological model, the
simulations were conducted for grain sizes of 26 nm
and 1 lm. This is for comparison purposes with ex-
perimental results in the grain-size range 20–54 nm
reported in the literature [53–57]. The computationalprocedures and results are presented in Section 3. In
this section the computational results of Fu et al. [35]
and Model II of D ¼ 26 nm are plotted to compare
with recent experimental measurements. The experi-
mental measurements have a large variation as shown
in Fig. 13. It can be seen that for D ¼ 26 nm the
computational model by Fu et al. [35] predicts faster
work hardening as compared to Model II. Model IIreveals a slower initial work hardening rate and the
hardening process is much longer.
4424 H.-H. Fu et al. / Acta Materialia 52 (2004) 4413–4425
At small strains Model II agrees with the Sanders
et al. curve [57], but its initial yield point is too low, and
in the middle stage it runs close to the results of Sur-
yanarayanan [54,55] (D ¼ 27 nm) and continues to work
harden. For the current work, both Model I and ModelII can successfully simulate the strengthening phenom-
ena of nanocrystalline copper, and they provide a useful
way to study the evolution of microstructure for poly-
crystalline copper. The great spread in the experimental
results is a clear demonstration that the accuracy of
calculations cannot, at the present moment, be checked
against results.
3.4.2. Shear localization
Both Models I and II exhibit shear localization. Figs.
8 and 9 show the evolution of the process: a well-de-
fined shear band is formed at �eP ¼ 0:4. This shear lo-
calization is indeed a dominant deformation mechanism
in nanocrystalline materials. Ma [59] observed locali-
zation in and nanocrystalline copper, and Wei et al. [60]
and Jia et al. [61] observed the same phenomenon inultrafine grained iron. The reason for this is the virtual
absence of work hardening in these materials, after a
few per cent of plastic deformation. The grain bound-
aries are the primary sources and sinks of dislocations,
and their mean free path is so small that little interac-
tion (cross slip, reactions, etc.) exists. The observations
by TEM [59–61] reveal enlarged grains within the shear
localization regions. These grains are elongated in theshear direction and are thought to provide paths for
dislocations.
These complex changes cannot, at present, be incor-
porated into the model presented herein. Nevertheless,
the agreement between computations and experimental
observations is considered more than fortuitous. Lo-
calization takes place concurrently with hardening in the
computations. This could well represent the initiation ofthe process. The material within this region is subjected
to drastic reorientation that would then lead to the
creation of favored paths for dislocation motion. The
elongated grains would provide the larger mean free
paths for these dislocations.
3.4.3. Grain-boundary sliding
The negative Hall–Petch slope obtained experimen-tally by Chokshi et al. [58] has been at the center of
considerable debate. The picture that is emerging is that,
for grain sizes on the order of 20 nm and lower, sliding
becomes an important deformation mechanism and
lowers the yield stress. Fu et al. [35] included grain-
boundary sliding and diffusional accommodation
through a sinusoidal Raj–Ashby [62] boundary and
showed that, for d 6 10 nm, this effect was important.Recently, Conrad and Narayan [63,64] carried out ex-
periments showing the inverse Hall–Petch relationship.
Conrad [65] developed a model that predicts the inverse
relationship. In the current calculations the smallest
grain size was 26 nm. Thus, there is no need to incor-
porate this effect (cf. Fig. 10).
4. Conclusions
Three computational models are proposed to predict
the effect of grain size and microstructural evolution,
while retaining the single crystal response within the
grain interiors:
1. Model I uses crystal plasticity in the grain interior
and a Voce equation in the grain boundaries. Elasticanisotropy is accounted for by considering three ori-
entations with different Young moduli, calculated
from the anisotropic elastic compliances. Its mechan-
ical response is somewhat too stiff, and the isotropic
plasticity in the grain boundaries result in unrealistic
deformation.
2. Model II is a more realistic model because it uses
crystal plasticity for both the grain interiors and grainboundaries. Elastic anisotropy is fully accounted for
by the use of the elastic stiffness matrix for copper.
Although in this study, the calculated mechanical re-
sponse does not exhibit a grain size dependence as
strong as that observed in experiments, it does pro-
vide a good simulation of the evolution of shear lo-
calization in the microstructures. This localization
occurs with global hardening. The calculations alsoshow more detail in the crystal slip phenomenon.
3. Model III uses a novel approach. A continuous
change in work hardening is introduced. This harden-
ing is related to the dislocation density evolution,
which is dictated by cross-slip frequency. One param-
eter that governs this evolution is the change in orien-
tation of the plane of maximum shear stress; the
magnitude of the gradient of the maximum shearstress angle is used here. Computations using this pa-
rameter demonstrate that the grain-boundary regions
are indeed subjected to accelerated hardening.
The computational models successfully predict the
grain size effects and provide valuable information
about the deformation evolution. It is shown that the
variation among experimental results in the nanocrys-
talline range by different investigators is considerableand therefore the fine-tuning of models cannot be car-
ried out at the current stage. The evolution of this
polycrystalline/nanocrystalline model has proceeded by
first assuming a perfectly plastic grain-boundary region
[34] to one hardening at higher rate than the grain in-
terior [35]; in the effort presented here, crystal plasticity
with texture evolution has been introduced first in a core
and mantle scheme, than in a physically based contin-uous variation of mechanical response, see Fig. 11.
Recent observations show the formation of a grain-
boundary work hardened layer [66].
H.-H. Fu et al. / Acta Materialia 52 (2004) 4413–4425 4425
Acknowledgements
This researchwas supported by theUSArmyResearch
Office Multidisciplinary University Research Initiative
(Contract No. DAAH 04-96-1-0376), NSF Grants DMI-9612017 and CMS-0210173 (NIRT). Prof. V. Lubarda
provided many valuable insights. Discussions with Prof.
R.J. Asaro and Dr. B.K. Kad are gratefully acknowl-
edged. Miss B.Y. Cao’s help in the last stages of manu-
script preparation are appreciated.
References
[1] Gleiter H. Acta Mater 2000;48:1.
[2] Kumar KS, Van Swygenhofen H, Suresh S. Acta Mater
2003;51:5743.
[3] Taylor GI, Elam CF. Proc R Soc London 1925;28:102.
[4] Taylor GI. Proc R Soc London 1938:307.
[5] Bishop JFW, Hill JFW. Philos Mag 1951;42:414.
[6] Bishop JFW. J Mech Phys Solids 1954;3:130.
[7] Dillamore IL, Kaoth H. Met Sci 1974;8:21.
[8] Hill R, Rice JR. J Mech Phys Solids 1972;20:401.
[9] Asaro RJ, Rice JR. J Mech Phys Solids 1977;25:309.
[10] Kr€oner E, Teodosiu C. In: Proc of the Symposium on Foundation
of Plasticity Nordhoff International Pub. Leyden, p. 93.
[11] Budiansky B, Wu TY. In: Proc of the 4th US Nat Cong APPL
Mech, 1962, p. 1175.
[12] Berveiller M, Zaoui AJ. Mech Phys Solids 1979;26:325.
[13] Molinari A, Canova GR, Ahzi S. Acta Metall 1987;35:2983.
[14] Canova G, Fresseangeas C, Molinari A, Kocks UF. Acta Metall
1988;36:1961.
[15] Lubarda V. Elastoplasticity theory. Boca-Raton (FL): CRC Press;
2002.
[16] Lin G, Havner KS. Int J Plast 1994;10:471.
[17] Anand L, Kalidindi SR. Mech Mater 1994;17:223.
[18] Kocks UF, Tom�e CN, Wenck H-R. Texture and anisotropy:
preferred orientations in polycrystals and their effects on materials
properties. Cambridge: Cambridge Uniuersity Press; 1998.
[19] Peirce D, Asaro RJ, Needleman A. Acta Metall 1982;30:1087.
[20] Peirce D, Asaro RJ, Needleman A. Acta Metall 1983;31:1951.
[21] Harren SV, Asaro RJ. J Mech Phys Solids 1988;37:191.
[22] Marin EB, Dawson PR. Comput Methods Appl Mech Eng
1996;165:23.
[23] Mika DP, Dawson PR. Acta Mater 1999;47:1355.
[24] Barbe F, Decker L, Jeulin D, Cailletaud G. Int J Plast
2000;17:513.
[25] Armstrong RW. In: Bunshah RF, editor, Advances in materials
research, vol. 5. New York: Interscience; 1971. p. 101.
[26] Ashby MF. Philos Mag 1970;21:399.
[27] Yao Z, Wagoner RH. Acta Metall Mater 1993;41:451.
[28] Suits JC, Chalmers B. Acta Metall 1961;9:854.
[29] Worthington PJ, Smith E. Acta Metall 1966;15:1277.
[30] Hook RE, Hirth JP. Acta Metall 1967;15:535.
[31] Delaire F, Rafanel JL, Rey C. Acta Mater 2000;48:1075.
[32] Meyers MA, Ashworth E. Philos Mag 1982;46:737.
[33] Meyers MA, Benson DJ, Fu H-H. In: Chung Y-W, Dunand DC,
Liaw PK, Olson, GB, editors, Advanced materials for the 21st
Century. Warrendale (PA): TMS-AIME; 1999. p. 499–512.
[34] Benson DJ, Fu H-H, Meyers MA. Mater Sci Eng A 2001;319:
854.
[35] Fu H-H, Benson DJ, Meyers MA. Acta Mater 2001;49:2567.
[36] Kim HS, Estrin Y, Bush MB. Mater Sci Eng A 2001;316:195.
[37] Estrin Y, Sluys B, Brechet Y, Molinari A. J Phys IV
1998;8(P8):135.
[38] Van Swygenhofen H, Caro A. Phys Rev B 1998;58:11246.
[39] Van Swygenhofen H, Spaczer M, Caro A. Acta Mater
1999;47:3117.
[40] Lee EH, Liu DT. J Appl Mech 1967;38:19.
[41] Anand L. In: Meyers MA, Armstrong RW, Kirchner HOK,
editors. Mechanics and materials fundamentals and linkages. New
York: Wiley–Interscience; 1999. p. 231.
[42] Hutchinson JW. Proc R Soc London A 1970;319:247.
[43] Voronoi GZ. Reine Angew Math 1908;1345:199.
[44] Kocks UF, Mecking H. Prog Mater Sci 2003;48:171.
[45] Diehl J. Z Metallkd 1956;47:331.
[46] Suzuki H, Ikeda T, Tanaka T. J Phys Soc Jpn 1956;1:382.
[47] Nye JF. Physical properties of crystals. Clarenden Press: Oxford
University; 1957. p. 145.
[48] Seeger A, Mader S, Kronmuller H. In: Thomas G, Washburn J,
editors. Electron microscopy and strength of crystals. New York:
Wiley–Interscience; 1963. p. 665.
[49] Seeger A, Diehl J, Madrer S, Rebstock H. Philos Mag 1957;8:323.
[50] Mader S, Seeger A, Leitz C. J Appl Phys 1963;34:3368.
[51] Mader S, Seeger A, Thieringen HM. J Appl Phys 1963;34:3376.
[52] Seeger A. In: Dislocations and mechanical properties of crystals.
New York: Wiley; 1957. p. 243.
[53] Weertman JR. Mater Sci Eng A 1993;166:161.
[54] Suryanarayana C, Fores FH. Met Trans A 1992;23:1071.
[55] Suryanarayana C, Koch CC. Hyperfine Interact 2000;130:5–44.
[56] Youngdahl CJ, Sanders PG, Eastman JA, Weertman JR. Scr
Mater 1997;37:811.
[57] Sanders PG, Eastman JA, Weertman JR. Acta Mater
1997;45:4023.
[58] Chokshi AH, Rosen A, Karch J, Gleiter H. Scr Metall
1989;23:1679.
[59] Ma E. Scr Mater 2002;49:663.
[60] Wei Q, Jia D, Ramesh KT, Ma E. Appl Phys Lett 2002;81:1240.
[61] Jia D, Ramesh KT, Ma E. Acta Mater 2003;51:3495.
[62] Raj R, Ashby MF. Met Trans 1971;2:1113.
[63] Conrad H, Narayan J. Scr Mater 2000;42:1025.
[64] Conrad H, Narayan J. Acta Mater 2002;50:5067.
[65] Conrad H. Met Mat Trans 2004.
[66] Gray III GT, Chen SR, Vecchio KS. Met Mat Trans 1999;30A:
1235.


![Nucleation of deformation twins in nanocrystalline fcc alloys XT Twin Alloy... · ary) energy may change independently for many alloys [32]. Therefore, independent var- iations of](https://static.fdocuments.net/doc/165x107/5f17345b00e319418b421a50/nucleation-of-deformation-twins-in-nanocrystalline-fcc-alloys-xt-twin-alloy.jpg)