Computation of dark frames in digital imagersweb.pdx.edu/~d4eb/ccd/SPIE_2007.pdf · Computation of...
8
Computation of dark frames in digital imagers Ralf Widenhorn, a,b Armin Rest, c Morley M. Blouke, d Richard L. Berry, b and Erik Bodegom a,b a Portland State, Portland, OR 97207, b Digital Clarity Consultants, Lyons, OR 97328, c Cerro Tololo Inter-American Observatory, d Ball Aerospace & Technologies Corp., Boulder CO 80306 ABSTRACT Dark current is caused by electrons that are thermally exited into the conduction band. These electrons are collected by the well of the CCD and add a false signal to the chip. We will present an algorithm that automatically corrects for dark current. It uses a calibration protocol to characterize the image sensor for different temperatures. For a given exposure time, the dark current of every pixel is characteristic of a specific temperature. The dark current of every pixel can therefore be used as an indicator of the temperature. Hot pixels have the highest signal-to-noise ratio and are the best temperature sensors. We use the dark current of a several hundred hot pixels to sense the chip temperature and predict the dark current of all pixels on the chip. Dark current computation is not a new concept, but our approach is unique. Some advantages of our method include applicability for poorly temperature-controlled camera systems and the possibility of ex post facto dark current correction. Keywords: digital images, image correction, dark current INTRODUCTION Dark current is a major noise source in digital imagers. To decrease the generation of dark current, many camera systems are cooled. In some cases like consumer cameras a cooling system is not feasible and dark current can become a problem even for short exposure times. The standard method for dark current correction is taking a so-called dark frame, an exposure with closed shutter, before or after the light exposure. This dark frame is subsequently subtracted from the actual image. To decrease the effect of statistical variations in the dark frame, often a master frame composed of multiple frames is obtained. The increased signal to noise of such a frame comes with the cost of time that the camera system cannot be used for the data collection. The description of the dark current in a CCD is similar to the analysis of the dark current in a diode and requires taking into account several sources of dark current. 1,2,3,4,5 We showed that a model of two exponential functions describes the dark current for the back-illuminated chip accurately. 6 So called hot pixels are pixels with and unusual high dark count which is caused by impurities in the silicon. 7,8,9,10 The knowledge of how each individual pixel's dark current changes with temperature can be used to calculate artificial dark frames. However, for many cameras the exact chip temperature is not precisely known. Some camera systems do not contain any temperature regulation and the chip temperature can vary significantly depending on the ambient temperature or operation time. Systems, where low dark current levels are of greater importance, contain usually some kind of cooling system. In thermoelectrically cooled systems, the control circuit that operates the Peltier-element cycles the temperature above and below a mean temperature. Usually, the temperature sensor measures not the actual chip temperature but the temperature of the cold finger underneath the chip. The chip temperature can change due to heat generated when the chip is clocked rapidly. All those elements can lead to uncertainty in the actual chip temperature at the time of exposure. We will investigate a novel dark correction method that requires no knowledge of the chip temperature. For a given exposure time, the dark current of every pixel is characteristic of a specific temperature. The dark current of every pixel can therefore be used as an indicator of the temperature. As we will show later, hot pixels have the highest signal-to- noise ratio and are the best temperature sensors. The basic idea is to use the dark current of several tens or hundreds of hot pixels—pixels with an unusually large dark current—to sense the chip temperature and predict the dark current of all pixels on the chip. Dark current computation is not a new concept, but our approach is unique. Some of the advantages of our method are the applicability even for camera systems with poor temperature control and the possibility of ex post facto dark current correction. We used the data from a backside-illuminated CCD housed in SpectraVideo camera (Model: SV512V1) manufactured by Pixelvision, Inc. to analyze the feasibility and the performance of such a dark current correcting algorithm. The chip was a three phase, n-buried channel, three-level polysilicon back-thinned device (12.3x12.3 mm, 512 x 512 pixels, manufactured by SITe Inc.). The Pixelvision camera that houses the SITe chip is very well behaved and after the temperature was stabilized for a sufficient time, very stable. First, the dark current produced by the chip was determined
Transcript of Computation of dark frames in digital imagersweb.pdx.edu/~d4eb/ccd/SPIE_2007.pdf · Computation of...

Computation of dark frames in digital imagers Ralf Widenhorn,a,b Armin Rest,c Morley M. Blouke,d Richard L. Berry,b and Erik Bodegoma,b
aPortland State, Portland, OR 97207, bDigital Clarity Consultants, Lyons, OR 97328, cCerro Tololo Inter-American Observatory, dBall Aerospace & Technologies Corp., Boulder CO 80306
ABSTRACT
Dark current is caused by electrons that are thermally exited into the conduction band. These electrons are collected by the well of the CCD and add a false signal to the chip. We will present an algorithm that automatically corrects for dark current. It uses a calibration protocol to characterize the image sensor for different temperatures. For a given exposure time, the dark current of every pixel is characteristic of a specific temperature. The dark current of every pixel can therefore be used as an indicator of the temperature. Hot pixels have the highest signal-to-noise ratio and are the best temperature sensors. We use the dark current of a several hundred hot pixels to sense the chip temperature and predict the dark current of all pixels on the chip. Dark current computation is not a new concept, but our approach is unique. Some advantages of our method include applicability for poorly temperature-controlled camera systems and the possibility of ex post facto dark current correction. Keywords: digital images, image correction, dark current
INTRODUCTION Dark current is a major noise source in digital imagers. To decrease the generation of dark current, many camera systems are cooled. In some cases like consumer cameras a cooling system is not feasible and dark current can become a problem even for short exposure times. The standard method for dark current correction is taking a so-called dark frame, an exposure with closed shutter, before or after the light exposure. This dark frame is subsequently subtracted from the actual image. To decrease the effect of statistical variations in the dark frame, often a master frame composed of multiple frames is obtained. The increased signal to noise of such a frame comes with the cost of time that the camera system cannot be used for the data collection. The description of the dark current in a CCD is similar to the analysis of the dark current in a diode and requires taking into account several sources of dark current.1,2,3,4,5 We showed that a model of two exponential functions describes the dark current for the back-illuminated chip accurately.6 So called hot pixels are pixels with and unusual high dark count which is caused by impurities in the silicon.7,8,9,10 The knowledge of how each individual pixel's dark current changes with temperature can be used to calculate artificial dark frames. However, for many cameras the exact chip temperature is not precisely known. Some camera systems do not contain any temperature regulation and the chip temperature can vary significantly depending on the ambient temperature or operation time. Systems, where low dark current levels are of greater importance, contain usually some kind of cooling system. In thermoelectrically cooled systems, the control circuit that operates the Peltier-element cycles the temperature above and below a mean temperature. Usually, the temperature sensor measures not the actual chip temperature but the temperature of the cold finger underneath the chip. The chip temperature can change due to heat generated when the chip is clocked rapidly. All those elements can lead to uncertainty in the actual chip temperature at the time of exposure. We will investigate a novel dark correction method that requires no knowledge of the chip temperature. For a given exposure time, the dark current of every pixel is characteristic of a specific temperature. The dark current of every pixel can therefore be used as an indicator of the temperature. As we will show later, hot pixels have the highest signal-to-noise ratio and are the best temperature sensors. The basic idea is to use the dark current of several tens or hundreds of hot pixels—pixels with an unusually large dark current—to sense the chip temperature and predict the dark current of all pixels on the chip. Dark current computation is not a new concept, but our approach is unique. Some of the advantages of our method are the applicability even for camera systems with poor temperature control and the possibility of ex post facto dark current correction. We used the data from a backside-illuminated CCD housed in SpectraVideo camera (Model: SV512V1) manufactured by Pixelvision, Inc. to analyze the feasibility and the performance of such a dark current correcting algorithm. The chip was a three phase, n-buried channel, three-level polysilicon back-thinned device (12.3x12.3 mm, 512 x 512 pixels, manufactured by SITe Inc.). The Pixelvision camera that houses the SITe chip is very well behaved and after the temperature was stabilized for a sufficient time, very stable. First, the dark current produced by the chip was determined

with fifty 50-second pictures taken at temperatures between 232 K and 281 K. The temperature range of almost 50 K is large and applications which require measurement over such a range should be very rare. However, the large range of dark currents will give some answers on the limitation of an accurate dark current correction. After collecting these data, the dark current correction protocol can pick out the hot pixels and calculate, based on their count rate, the dark current for the whole chip. Of course, any dark current correction is limited by the inherent noise of each dark frame.
ALGORITHM TO CORRECT DARK CURRENT Every chip is unique in its behavior and needs to be calibrated individually. Ideally, the calibration protocol obtains a large number of images spanning or exceeding the temperature range expected during the actual operation of the camera. After taking a set of dark frames, these basic steps are executed: The first step is to locate hot pixels to serve as temperature indicators. These are selected from an image with sufficiently large dark signal is used to find the n hottest pixels on the chip. A hot pixel in this context means, a pixel with a dark signal large compared to its neighboring pixels. The neighboring pixels are of significance because in an actual image, containing light information, the adjacent pixels are used to predict the light signal. Removing the light signal works accurately only if there is high degree of correlation between the light signal of the hot pixel and its adjacent pixels. In most images the correlation between adjacent pixels is very high. Later, we will discuss in more detail how the light information influences the temperature reading of a hot pixel. The hottest pixels are found by ranking the values of:
1 1
1 1( , ) ( , ) ( , )
i jhotpix x y weight i j pixel x i y j
=− =−
= ⋅ + +∑ ∑ , (1)
where (x, y) are the coordinates of the pixel and pixel(x, y) is its dark count. The best estimate of the dark current is obtained when a bias frame is first subtracted from the dark frame. However, if the bias is almost uniform across the chip its value averages out in the computation. Generally, we will refer in the calculations of the dark count to the number of counts above the bias level. In Eq. 1 only the immediate neighbors of the hot pixel are considered. It is possible to include a wider area and increase the range of the summation. The weight(i, j) depends on the relative location of an adjacent pixel. We chose the following weighting factors: for the center pixel (the hot pixel): (0,0) 1weight = for pixels on the corner of the hot pixel: ( 1, 1) (1, 1) ( 1,1) (1,1) 0.05weight weight weight weight− − = − = − = = − for pixels directly adjacent to the hot pixel: ( 1,0) (1,0) (0, 1) (0,1) 0.2weight weight weight weight− = = − = = − The directly adjacent pixels have a larger weight than the corner pixel because the correlation of the light signal should be the highest for those pixels (–0.05 and –0.2 was chosen for the sake of simplicity). Notice that with these weighting factors the value for hotpix(x, y) is equal or close to zero if all nine pixels are equally “hot.”
Fig. 1. Counts versus temperature indicator for 6 different pixels. Fig. 2. Temperature indicators for a dark frame taken
at 271 K.

The next step is to calculate the average of hotpix(x, y) for the n hottest pixels for frames at different temperatures and used as an indicator for the chip’s temperature, TInd. Now, the value of hotpix(x, y) is fitted as a quadratic least squares function of the temperature indicator, TInd:
cTbTayxhotpix IndInd +⋅+⋅= 2),( (2) To exclude hot pixels with poor fits, we order the hot pixels according to goodness of the fit and disregard pixels with a poor correlation. One would expect c to be zero for all pixels. However, we did not fix c to zero in the hope to reach a slightly better agreement between fit and actual data, especially if all values are far away from the origin. We next store the coordinates of all hot pixels (we choose from the 200 hottest pixels, the 150 pixels with the best correlation for the quadratic fit) as well as the three fitting parameters in a file which contains all the information to evaluate the temperature of the chip. Note that we do not use the actual temperature (nor do we need to know the actual temperature). Our temperature calibration is a function of the dark current in selected temperature-indicator hot pixels. The next step in the protocol next is to determine the counts of all pixels with respect to TInd. To accomplish this, the counts of each pixel for frames taken at different temperatures, is fitted with a quadratic least square fit versus the temperature indicator. Since this fit is later used to calculate the dark count, independently from the neighboring pixels, the actual count of the pixels (not the counts with respect to the neighboring pixels) is used to determine the fitting parameters. The three fitting parameters are saved as images with the same dimensions as the chip (in our case a 512 by 512 array). Figure 1 shows the data and fits for six different pixels.
Fig. 3. Counts difference between dark frame and computed dark frame (left panels) and between dark frame and master dark frame
(right panels) for three different temperatures.
To evaluate the performance of the dark current correction algorithm we use a dark frame that was not used to find the calibration parameters, and compare it with the computed dark frame. The computation is done as follows: First the coordinates for the hot pixels are read and the value for hotpix(x, y) is calculated for the dark frame. Each hot pixel's count should be characteristic of the same temperature. Of course, factors like shot and readout noise will cause this value to be less than perfect. The value for the temperature indicator, TInd, is found by using the fitting parameters from the hot pixel file and solving the corresponding quadratic equation. This derived value of TInd can then be used with parameter values from the parameter images to compute the expected dark current value for the temperature TInd. Figure 2 shows the temperature indicated by each of the 150 hot pixels for a frame, which according to the temperature reading on the camera, was taken at 271 K. As expected the temperature indicated is similar for all pixels. Random noise causes a spread from pixel to pixel. Instead of using the mean value of the individual pixels as the temperature indicator, the more robust median value is chosen as TInd. Choosing the median over the mean might not be of great importance for this dark frame. As we will show later, for a frame that contains also light information the difference between mean and median can be significant. The median value of the individual temperature indicators can then be used, in conjunction with the three calibration files, to calculate the dark counts for each pixel on the chip. The performance of the image correction the algorithm compares well with master dark frames computed from 50 dark frames at each temperature. One should note that it takes one hour of camera time to obtain such a master frame. The histograms in the panels on the left side of Fig. 3 show the difference between a real dark frame and the computed dark frames. The histograms on the right side show the differences between the dark frame and the master dark frame. In the ideal case the histogram is a narrow distribution with the peak value at zero counts difference. One can see that the widths of the distributions of the master frames and the calculated frames are almost identical. The median values for the counts difference for the master frame are given by: 0 counts at 232 K, -0.18 counts at 252 K, -0.14 counts at 271 K. All peak values are very close to zero, an indication that the temperatures of the dark frames were really the same temperature as the master frames. The median values for the computed frames are given by: 0.99 counts at 232 K, -1.79 counts at 252 K, and 6.86 counts at 271 K. At the higher temperature the peak of the distribution is slightly moved from the zero point. The origin of this small difference is either due to random noise which leads to an incorrect determination of the temperature, or, as a second possibility, a systematic error due to small differences between the fits and the actual data. Overall, the algorithm performs similarly as the actual master frames. The deviations between computed and real dark image will decrease further if the calibration temperature range is smaller.
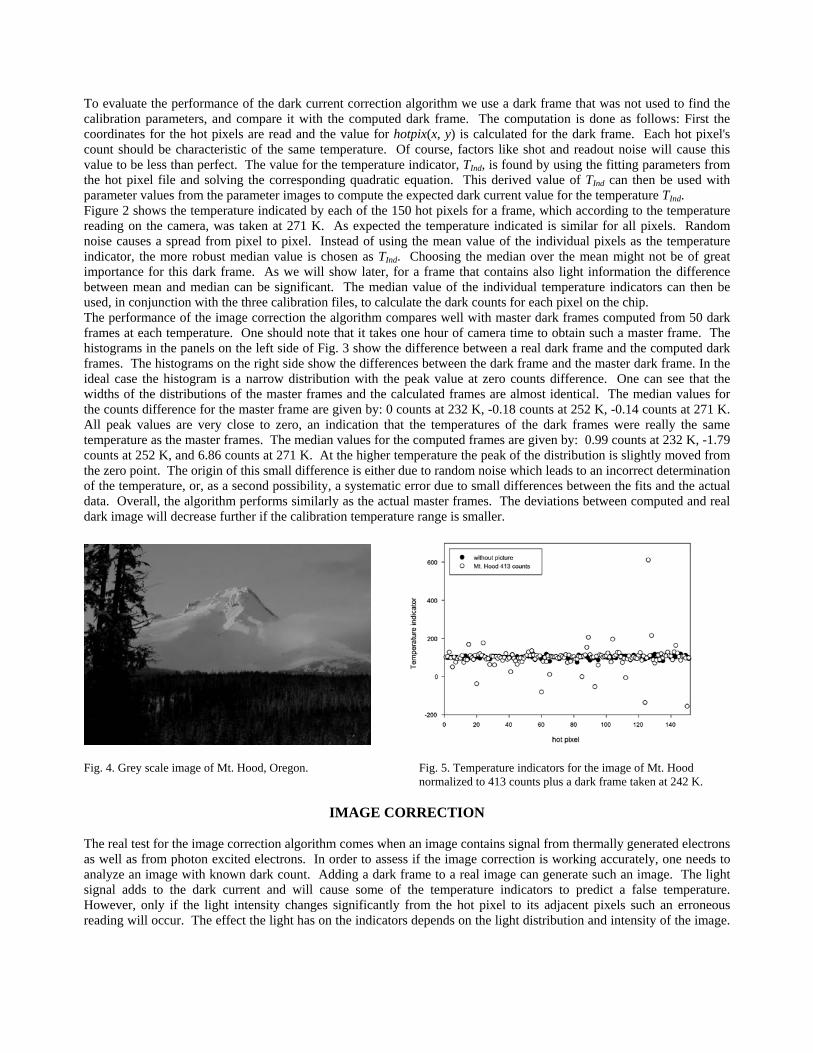
Fig. 4. Grey scale image of Mt. Hood, Oregon. Fig. 5. Temperature indicators for the image of Mt. Hood normalized to 413 counts plus a dark frame taken at 242 K.
IMAGE CORRECTION The real test for the image correction algorithm comes when an image contains signal from thermally generated electrons as well as from photon excited electrons. In order to assess if the image correction is working accurately, one needs to analyze an image with known dark count. Adding a dark frame to a real image can generate such an image. The light signal adds to the dark current and will cause some of the temperature indicators to predict a false temperature. However, only if the light intensity changes significantly from the hot pixel to its adjacent pixels such an erroneous reading will occur. The effect the light has on the indicators depends on the light distribution and intensity of the image.

We will show the effect on the temperature indicators for three different images at different signal levels. Two of the images are astronomical images and the other is a picture typical for natural scenery. The latter image depicts Mt. Hood (see Fig. 4) and was taken with a short exposure time with a Canon Powershot S45. The image was initially a color image and was later converted to a gray scale image. The average counts of the picture was normalized to 413 counts, 1654 counts, 6617 counts, and 26468 counts to simulate different light levels. The effect the superimposed image has on the individual temperature indicators can be seen in Fig. 5. The solid circles depict the indicators for one dark frame taken at 242 K. The median value of all temperature indicators, for the dark frame only, was given by 103.01. The figure also shows the individual indicators for the dark frame plus the Mt. Hood image normalized to 413 counts. As expected, some indicator pixels have a count which does not correspond to the temperature of the image. One pixel's value is about 6 times the value without the superimposed image. The temperature indicated by this pixel would be off by about 20 K. Several pixels even show physically impossible negative temperatures. However, the median value of all indicators has only changed slightly: from 103.01 without image to 102.68 with image. Hence, even with the superimposed image the right temperature was found by the dark current correction algorithm. In Fig. 6 the temperature indicators for a dark frame with a TInd =1661.45 (corresponding to a chip temperature of 271 K) is added to the image of Mt. Hood scaled to four different light levels. The left panel of the figure shows all indicators while the right panel is an enlargement of the left panel. It is apparent that the spread of the individual indicators increases with increasing count level of the image. The effect the light exposure has on some indicators is amplified with increasing signal of the image. However, while the average value of all indicators would be thrown off by such pixels, the median value stayed fairly stable. The individual values for TInd are given by: 1657.93 at 413 counts, 1658.57 at 1654 counts, 1658.78 at 6617 counts, and 1666.45 at 26468 counts.
Fig. 6. Temperature indicators for the image of Mt. Hood with different intensity levels plus a dark frame taken at 271 K. Figure (b) is
an enlargement of figure (a). Next, we take a look at two images in a field where long exposure times are common practice, astronomy. The images were taken from the CDROM that accompanies AIP4WIN11 software. We are only interested how the patterns of typical astronomical images influence the temperature-indicator pixels. For this purpose dark frames are added to the original images (the originals contain very little dark current). The light level present in astronomical imaging is generally very low and long exposure times are required to get an acceptable signal-to-noise ratio. On the other hand, the contrast between the dark sky background and a very bright object is often very large. For example, the image of the Dumbbell Nebula (also known as Messier 27 or simply M27) contains pixels with counts from 1 to 32751 and an average value of 188 counts. Hence, the majority of the pixels have a fairly small number of counts. The problem with dark current is most severe if one is not interested in the bright object, but in an object which is only slightly higher than the sky background. Hence, even for a high contrast image like the one of M27, dark current can be a nuisance. Figure 7 shows the original mage of M27 (upper left panel), the image plus a 50 second dark frame at 271 K (upper right panel). The dark current adds white sprinkles to the images, which to the untrained eye do not look much different than a star. The number of additional “stars” that appear on the image depend on the ratio of the sky background to the dark current level. With increasing temperature more hot pixels will stand out from the background. The second example of an astronomical image is the image of the Whirlpool Galaxy, M51. The lower left panel of Fig. 7 shows the original picture. The counts vary from 1 to 32624 counts and the average number of counts is 762.65. The image on the right of the original has a 50 second dark frame at 271 K added.

Fig. 7. Images of M27 on the left side, images of M51 on the right side. Upper panel: original images, middle panel: original image
plus a 50 second dark frame at 271 K, bottom panel: M27 and M51 after the dark current correction.
The bottom panels of Fig. 7 show the images after dark correction. Most of the false “stars” have disappeared. How visible such effects are in an image depends strongly on the contrast setting of the imaging software. The minimum and maximum setting for the original image of M27 plus the 271 K dark frame was: Minimum: 700 counts, Maximum: 1100 counts. For the original and the corrected image the minimum was 200 counts and the maximum 450 counts. The contrast setting for M51 were as follows: original plus 271 K dark frame: Minimum: 1200 counts, Maximum: 2500 counts. For the other images: Minimum: 800 counts, Maximum: 2000 counts.
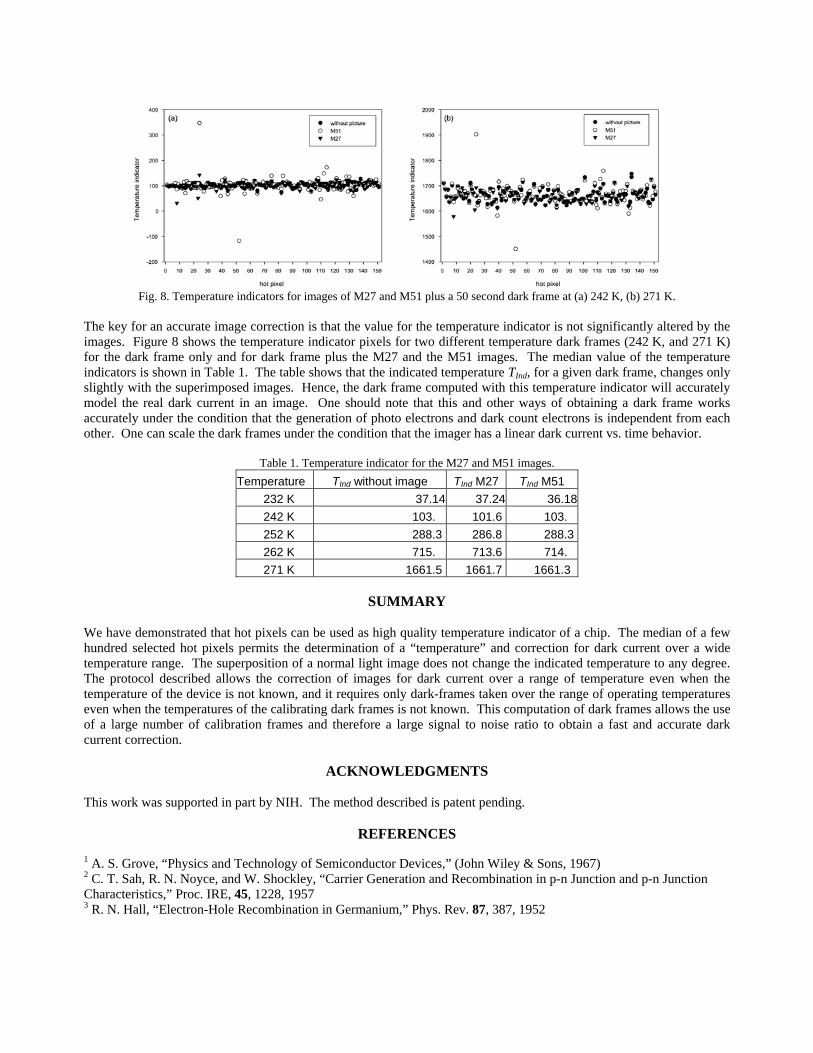
Fig. 8. Temperature indicators for images of M27 and M51 plus a 50 second dark frame at (a) 242 K, (b) 271 K.
The key for an accurate image correction is that the value for the temperature indicator is not significantly altered by the images. Figure 8 shows the temperature indicator pixels for two different temperature dark frames (242 K, and 271 K) for the dark frame only and for dark frame plus the M27 and the M51 images. The median value of the temperature indicators is shown in Table 1. The table shows that the indicated temperature TInd, for a given dark frame, changes only slightly with the superimposed images. Hence, the dark frame computed with this temperature indicator will accurately model the real dark current in an image. One should note that this and other ways of obtaining a dark frame works accurately under the condition that the generation of photo electrons and dark count electrons is independent from each other. One can scale the dark frames under the condition that the imager has a linear dark current vs. time behavior.
Table 1. Temperature indicator for the M27 and M51 images. Temperature TInd without image TInd M27 TInd M51 232 K 37.14 37.24 36.18 242 K 103. 101.6 103. 252 K 288.3 286.8 288.3 262 K 715. 713.6 714. 271 K 1661.5 1661.7 1661.3
SUMMARY
We have demonstrated that hot pixels can be used as high quality temperature indicator of a chip. The median of a few hundred selected hot pixels permits the determination of a “temperature” and correction for dark current over a wide temperature range. The superposition of a normal light image does not change the indicated temperature to any degree. The protocol described allows the correction of images for dark current over a range of temperature even when the temperature of the device is not known, and it requires only dark-frames taken over the range of operating temperatures even when the temperatures of the calibrating dark frames is not known. This computation of dark frames allows the use of a large number of calibration frames and therefore a large signal to noise ratio to obtain a fast and accurate dark current correction.
ACKNOWLEDGMENTS This work was supported in part by NIH. The method described is patent pending.
REFERENCES 1 A. S. Grove, “Physics and Technology of Semiconductor Devices,” (John Wiley & Sons, 1967) 2 C. T. Sah, R. N. Noyce, and W. Shockley, “Carrier Generation and Recombination in p-n Junction and p-n Junction Characteristics,” Proc. IRE, 45, 1228, 1957 3 R. N. Hall, “Electron-Hole Recombination in Germanium,” Phys. Rev. 87, 387, 1952
4 W. Shockley and W. T. Read, “Statistics of the Recombination of Holes and Electrons,” Phys. Rev. 87, 835, 1952 5 S.M. Sze, “Physics of Semiconductor Devices,” second edition (John Wiley & Sons, 1981) 6 R. Widenhorn, M. M. Blouke, A. Weber, A. Rest, and E. Bodegom, Temperature dependence of dark current in a CCD, Proc. SPIE Int. Soc. Opt. Eng. 4669, 193 (2002) 7 R. D. McGraph, J. Doty, G. Lupino, G. Ricker, and J. Vallerga, IEEE Trans. Electron Devices, vol. ED-34, 2555, 1987 8 W. C. McColgin, J. P. Lavine, J. Kyan, D. N. Nichols, and C. V. Stancampiano, International Electron Device Meeting 1992, p. 113, 13-16 Dec., 1992 9 W. C. McColgin, J. P. Lavine, and C. V. Stancampiano, Mat. Res. Soc. Symp. Proc. 378, 713, 1995 10 W. C. McColgin, J. P. Lavine, C. V. Stancampiano, and J. B. Russell, Mat. Res. Soc. Symp. Proc. 510, 475, 1998 11 R. Berry, J. Burnell, “The Handbook of Astronomical Image Processing,” second edition (Willmann-Bell, Inc., 2005)