
ComProbe Protocol Analysis System User Manual User Manual.pdf · INTRODUCTION The Frontline...
27
ComProbe Protocol Analysis System™ User Manual Copyright © 2000-2012 Frontline Test Equipment, Inc. All rights reserved. You may not reproduce, transmit, or store on magnetic media any part of this publication in any way without prior written authorization of Frontline Test Equipment, Inc. CPAS, Frontline, ComProbe Protocol Analysis System, and ComProbe are registered trademarks of Frontline Test Equipment, Inc. FTS4BT is a trademark of Frontline Test Equipment, Inc. The Bluetooth SIG, Inc. owns the Bluetooth word mark and logos, and any use of such marks by Frontline is under license. All other trademarks and registered trademarks are property of their respective owners.
Transcript of ComProbe Protocol Analysis System User Manual User Manual.pdf · INTRODUCTION The Frontline...

ComProbe Protocol Analysis System™ User Manual
Copyright © 2000-2012 Frontline Test Equipment, Inc. All rights reserved. You may not reproduce, transmit, or store on magnetic media any part of this publication in any way without prior written authorization of Frontline Test Equipment, Inc. CPAS, Frontline, ComProbe Protocol Analysis System, and ComProbe are registered trademarks of Frontline Test Equipment, Inc. FTS4BT is a trademark of Frontline Test Equipment, Inc. The Bluetooth SIG, Inc. owns the Bluetooth word mark and logos, and any use of such marks by Frontline is under license. All other trademarks and registered trademarks are property of their respective owners.

P a g e | i
CONTENTS Minimum System Requirements .................................................................................................................. 1
Purpose ......................................................................................................................................................... 2
Introduction .................................................................................................................................................. 2
Opening/Selecting Data Capture Method .................................................................................................... 3
Analyzing Data .............................................................................................................................................. 5
Control Window ........................................................................................................................................ 5
Frame Display ............................................................................................................................................ 5
Data Extraction ......................................................................................................................................... 9
Message Sequence Chart ........................................................................................................................ 12
How do I access the chart? ................................................................................................................. 12
What do I see? .................................................................................................................................... 12
Search .................................................................................................................................................. 14
PER Stats ................................................................................................................................................. 16
Bluetooth Timeline .................................................................................................................................. 18
Timeline ............................................................................................................................................... 19
Legend ................................................................................................................................................. 19
Indicators ............................................................................................................................................ 19
Throughput Graph .............................................................................................................................. 20
Low Energy Timeline ............................................................................................................................... 20
Coexistence View .................................................................................................................................... 21
Timeline ............................................................................................................................................... 21
Legend ................................................................................................................................................. 22
Throughput Graph .............................................................................................................................. 23
Display Synchronization .......................................................................................................................... 23
Duplicate Displays ................................................................................................................................... 23
Bookmarks .............................................................................................................................................. 23
Technical Support ....................................................................................................................................... 25

P a g e | 1
MINIMUM SYSTEM REQUIREMENTS
• PC with Windows XP 32 bit, (Service Pack 2 or higher), Windows 7 (32 or 64 bit).
• Pentium 2 GHz processor
• RAM Requirements: 2 GB minimum, 4 GB recommended
• 100 MB free Hard Disk Space
• USB 2.0 High Speed enabled port

P a g e | 2
PURPOSE
This document is designed to get you started capturing and analyzing data with the ComProbe Protocol Analysis System (CPAS). We’ll do this by going through one of the data capture methods available in CPAS.
What this document does not do is cover all methods of data capture or data analysis for CPAS. We wanted to provide a solid foundation for early success in capturing data and using some of the tools to view and analyze what you capture.
INTRODUCTION
The Frontline ComProbe Protocol Analysis System (CPAS for short) is a protocol analysis system that may be used with a variety of different ComProbes (hardware interfaces for capturing different technologies) available from Frontline. CPAS automatically detects the ComProbe hardware plugged into your PC and configures itself according to the requirements of your sniffing hardware.
This document assumes that you have already loaded the device drivers and installed the software for CPAS. If our assumption is correct, you can move to the next section and we will get started. If, however, you haven't installed drivers and software, you need to stop here and follow the Quick Start Guide for the ComProbe hardware you’re planning to use.

P a g e | 3
OPENING/SELECTING DATA CAPTURE METHOD
At this point, your ComProbe(s) should be plugged in and the drivers configured. The drivers should load automatically when your ComProbe hardware is plugged in.
Run the “Frontline ComProbe Protocol Analysis System” shortcut from the “Frontline ComProbe Protocol Analysis System [version #] folder, or go to Start -> Programs -> Frontline ComProbe Protocol Analysis System [version #] and click on Frontline ComProbe Protocol Analysis System shortcut.
The Select Data Capture Method dialog appears (Figure 4).
Figure 1
The selections offered to you will vary according to the hardware you have plugged in. Only those data capture methods that may be performed with the attached hardware will appear.
For the purposes of this discussion, we’ll assume that the BPA 500 Bluetooth Dual Mode ComProbe is plugged in, as shown in the figure above.
1. Expand the tree for Classic/low energy Air Sniffing (Figure 5).
Notice the options available for each method. If you click on an option, a short description appears on the right of the dialog.

P a g e | 4
Figure 2
As we mentioned earlier in the Introduction, in this guide we are going to select one of the options (the most commonly used), explain how to analyze the results. If you need to know how to configure your hardware, or configure data capture settings, please refer to the Quick Start Guide for your ComProbe hardware.
2.
3.
Select "Combined Connection (Classic/low energy)".
Select "Run".

P a g e | 5
ANALYZING DATA
Control Window
First of all, we have the Control window, which appears as the small rectangular window at the top of your screen (Figure 23).
Figure 3
BPA 500 is organized around this window. The Control window allows you to control data capture and access the other windows used to view data.
While there are a number of dialogs you can use to analyze the data, let's look quickly at some of the options you have.
Frame Display
Click the Frame Display icon on the Control window toolbar to open Frame Display (Figure 24).
Figure 4
P a g e | 6
Protocol Tabs The Frame Display adds a tab to the top of the Summary Pane for every protocol found in the in the data. You can click on these tabs to filter on the protocol. Protocols are also arranged by technology groups. When the same protocol appears in multiple technologies, the data will be displayed in separate groups. For example, if there are Classic, low energy, and/or 802.11 data, they will be displayed within a Classic, low energy, and 802.11 group. Clicking on a protocol tab within a group shows all packets for that protocol and technology. The groups are arranged from top to bottom as General, Classic, low energy, and 802.11. They are also color-coded: General/Gray, Classic/Light Blue, low energy/Light Green, and Wi-Fi/Orange..
If a protocol appears in multiple technologies, then a tab for that protocol will appear in the specific technology group and in the General group.
Select the Unfiltered tab to display all protocols. The Unfiltered tab is automatically selected when multiple protocols are being filtered-in using other filtering methods.
There are several special tabs that appear in the Summary Pane when certain conditions are met. These include:
• Bookmarks appear when a bookmark is first seen. • Errors appear when an error is first seen. Errors include decode errors (failure of Verify
methods), DRF error bits, and PDA complaints about decoders. The Errors tab is displayed in red.
• Info appears when a frame containing an Information field is first seen. • A shown technology has the icon to the left of the first row. A hidden technology has the icon to
the right of the first row of the general tab group.
The new tabs disappear when the capture buffer is cleared during live capture or when decoders are reloaded, even if one of the new tabs is currently selected. They subsequently reappear as the corresponding events are detected.
Panes Frame display allows you to see an amazing amount of information from your protocol. The Frame Display is divided into panes, where each pane shows a different view of the data.
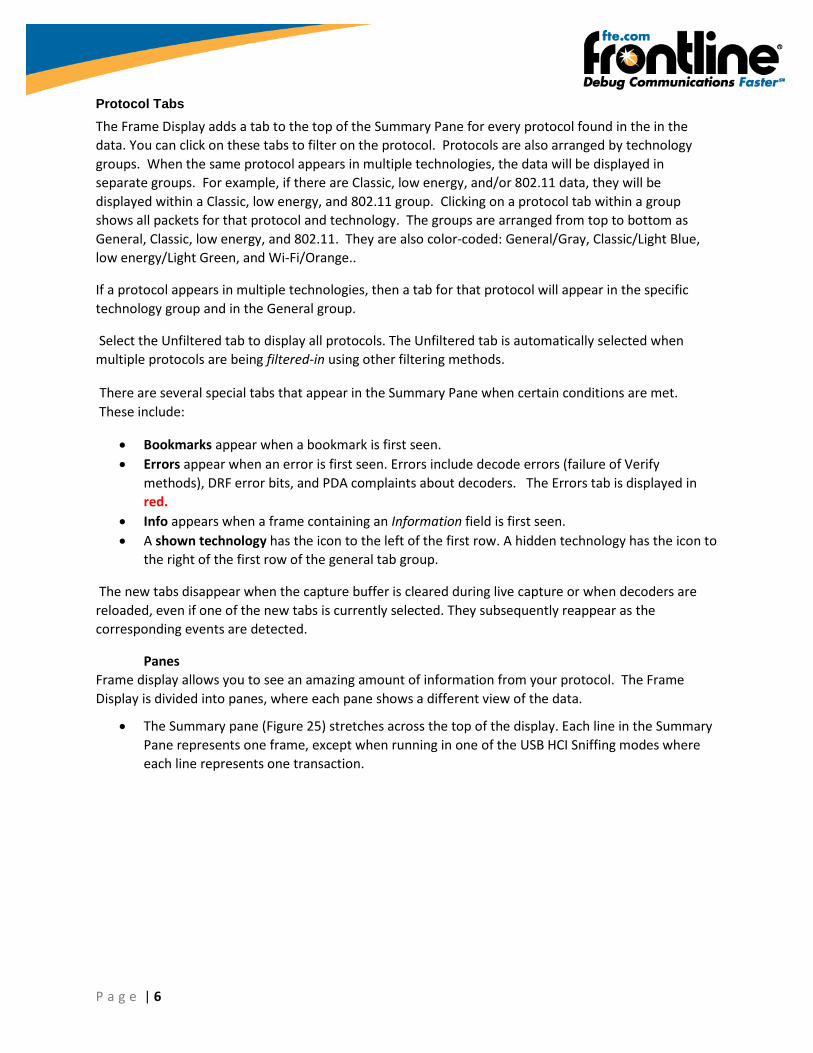
• The Summary pane (Figure 25) stretches across the top of the display. Each line in the Summary Pane represents one frame, except when running in one of the USB HCI Sniffing modes where each line represents one transaction.

P a g e | 7
Figure 5
• The Decode pane (Figure 26) contains a detailed decode of the frame/transaction selected in the Summary pane, and is located on the left side of the Frame Display window.
Figure 6
• The three smaller panes on the bottom right of the Frame Display show the data in hex, binary and ASCII (Figure 27). The user can choose to have these panes show the data in other radixes or character sets. Select any field in the Decode pane and the corresponding bit(s) or byte(s) will be selected in the data panes.

P a g e | 8
Figure 7
Frame Errors Frame numbers in red indicate an error in the frame. Select the frame, and look at the top of the Decode pane to determine the type of error.
Scrolling versus Static View
Click the Lock/Resume icon to have the Summary pane scroll to always show the latest frames captured. Click the Lock/Resume icon again to stop the Summary pane from scrolling.
Protocol Tabs The frame display has a series of Protocol Tabs that allow you to filter on a specific protocol quickly and easily. For more advanced filtering option please consult the online Help.

P a g e | 9
Data Extraction
You use Data/Audio Extraction to pull out data from various decoded Bluetooth® protocols. Once the data are extracted, you can save them into different file types, such as text files, graphic files, email files, .mp3 files, and more.
1. You access this dialog by selecting Extract Data/Audio from the View menu or by clicking on the
icon from the toolbar .
2. Choose a checkbox or checkboxes on the left side of the dialog to identify those profile(s) from which you want to extract data (Figure 28).
Figure 8
It's important to note that if there is no data for the profile(s) you select, no extracted file is created.
3. If you want the file(s) to open automatically after they are extracted, select the Open File(s) After Extraction checkbox. Note: This does not work for SCO/eSCO.
4. Click on a radio button to write the streams as Two Mono Files or as One Stereo File. This is for SCO/eSCO only.
5. Select the checkbox if you want to convert A-Law and µ-law to Linear PCM. CVSD are always converted to Linear PCM. It's probably a good idea to convert to Linear PCM since more media players accept this format.
6. Select the Add Silence packets to insert the silence packets (dummy packets) for the reserved empty slots into the extracted file. If this option is not selected, the audio packets are extracted without inserting the silence packets for the reserved empty slots. This option is active for SCO/eSCO only.
7. Select Extract.

P a g e | 10
A Save As dialog appears (Figure 29). Figure 9
The application will assign a file name and file type for each profile you select in Step 1 above. The file type varies depending on the original profile. A separate file for each profile will be created, but only for those profiles with available data.
8. Select a location for the file(s).
9. Click Save.
The Data Extraction Status and Audio Extraction Status dialogs appear (Figure 30). When the process is complete the dialogs display what files have been created and where they are located.
Figure 10

P a g e | 11
If you selected Open Files(s) After Extraction, the files open automatically.
10. If you did not select this option, you can open a file by simply double-clicking on the name.
11. When you are finished, select Close to close the dialogs.

P a g e | 12
Message Sequence Chart
The Message Sequence Chart (MSC) displays a concise overview of a Bluetooth connection, highlighting the essential elements of the connection. At a glance, you can see the flow of the data, including role switches, connection requests, and errors. You can look at all the packets in the capture, or filter by protocol/profile. The MSC is color coded for a clear and easy to use view of your data (Figure 31).
Figure 11
How do I access the chart?
You access the Message Sequence Chart by selecting the icon or MSC Chart from the View menu from the Control Window or Frame Display.
What do I see?
Along the top of the dialog are a series of tabs, which will vary depending on the protocols.

P a g e | 13
Clicking on a tab displays the messaging between the master and slave for that protocol (Figure 32). For example, if you select RFCOMM, you will see the messaging between the RECOMM{M} Master, and the RFCOMM{S} Slave.
Figure 12
Note: The Non-Message Summary tab displays all the non-message items in the data and the Ctrl Summary tab displays the signaling packets for all layers in one window in the order in which they are received. The information in the colored boxes displays general information about the messaging. When you position the mouse over the message description, you will see an expanded tool tip (Figure 33).
Figure 13
How do I navigate in the dialog? You can use the navigation arrows at the bottom and the right side of the dialog to move vertically and horizontally. You can also click and hold within the dialog, which brings up a directional arrow that you can use to move left/right and up/down.

P a g e | 14
Search
The Message Sequence Chart has a Search function that makes it easy to find a specific type message within the layers.
You access this dialog by selecting the Search icon or F3, the Search dialog appears (Figure 34).
Figure 14
From this dialog you can search for specific protocol messages or search for the first error frame. To use the dialog:
1. Select one of the protocol tabs at the top of the dialog.
2. Open the Search dialog using one of the three methods.
Note: If you select All Layers in Step 1, the Protocol Layers drop-down list is active. If you select any of the other single protocols, the Protocol Layers drop-down is grayed out.
3. Select a specific Protocol Message from the drop-down list (Figure 35).
Figure 15
4. Once you select the Protocol Message, click OK.
P a g e | 15
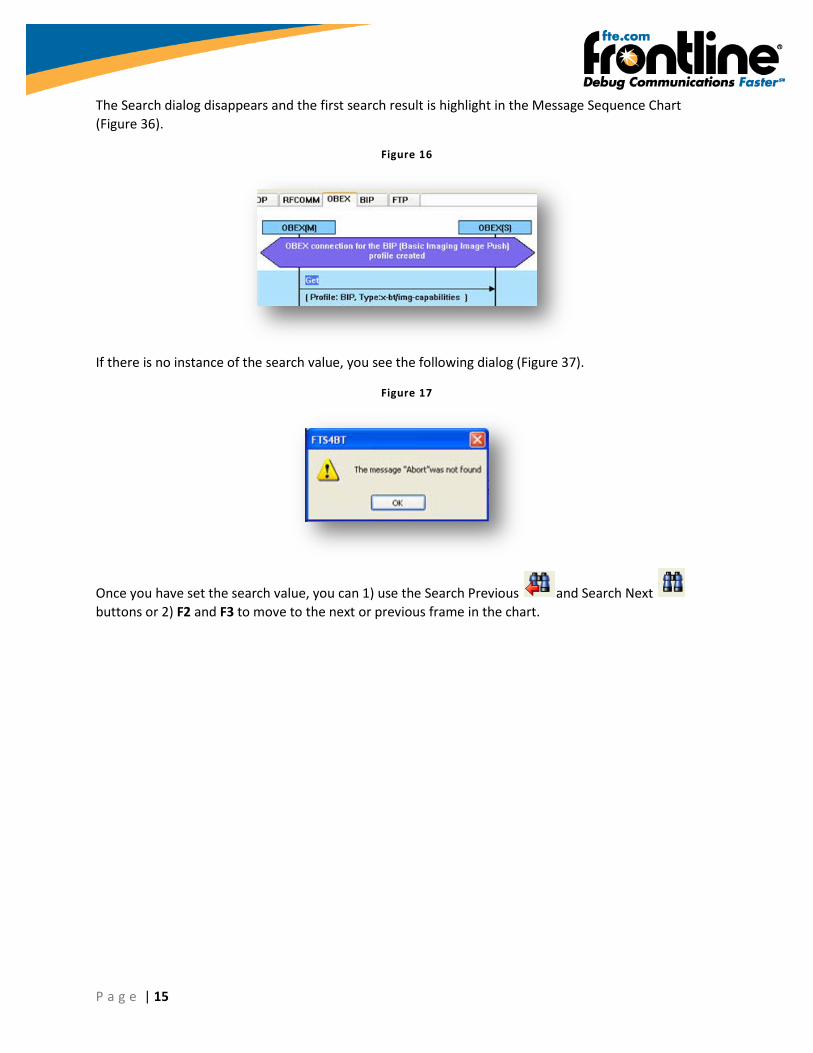
The Search dialog disappears and the first search result is highlight in the Message Sequence Chart (Figure 36).
Figure 16
If there is no instance of the search value, you see the following dialog (Figure 37).
Figure 17
Once you have set the search value, you can 1) use the Search Previous and Search Next buttons or 2) F2 and F3 to move to the next or previous frame in the chart.

P a g e | 16
PER Stats
The Packet Error Rate Stats (PER Stats) Plug-in provides a dynamic graphical representation of the Packet Error Rate for each channel (Figure 38).
Figure 18
Packet Error Rate Stats assist in detecting bad communication connections. When a high percentage of re-transmits, and/or header/payload errors occur, careful analysis of the statistics indicate whether the two devices under test are experiencing trouble communicating, or the packet sniffer is having difficulty listening.
Generally, if the statistics display either a large number of re-transmits with few errors or an equal number of errors and re-transmits, then the two devices are not communicating clearly. However, if the statistics display a large number of errors and a small number of re-transmits, then the packet sniffer is not receiving the transmissions clearly.
• Each channel contains a bar that displays the number of packets with no errors in green, packets with Header Errors in red, packets with Payload or CRC errors in dark red, and Retransmitted packets in yellow.

P a g e | 17
• When you select a channel, detailed information for that channel is displayed in the expanded channel chart on the upper right. • The number of packets with no errors is displayed in light green in the bar chart.
• The number of packets that have header errors is displayed in red in the bar chart.
• The number of payload errors is displayed in dark red in the bar chart.
• The number of re-transmits is displayed in yellow in the bar chart.
• When you select the in the upper-right corner, the bar chart is replaced by a pie chart
(Figure40). To return to the bar chart, click on the channel again.
Figure 19
• In the Scroll bar captured data begins to appear on the left and fills the width of the bar, left to
right.
• The vertical bars in the Scroll Bar each indicate a fixed duration. When data first appears in the Scroll Bar as it is being captured, each bar equals one second. When the data fills the bar, reaching the right side limit, the last bar moves back to the center of the Scroll Bar. The bars stay the same size, but doubles in duration (for example, the first time the Scroll Bar fills, the bars return to the middle, but now each bar represent two seconds of time instead of one). Each time the bars cycle to the middle, the time they represent doubles.
• The Viewport is used to select single or multiple vertical bars . Clicking on a vertical bar left justifies the Viewport to that bar. You can drag the sides of the VIewport or the slider buttons
to select multiple bars, representing a greater time range.
• You can click and drag the Viewport within the Scroll Bar.

P a g e | 18
Bluetooth Timeline
The Bluetooth Timeline displays packet information in a main timeline that can display data over different periods of time and also in graph and chart form. Instead of just raw numbers and characters, the Timeline displays when packets occur, their speed, type, their payload, errors, retransmits, and more (Figure 41).
Figure 20
You access the Bluetooth Timeline by selecting the icon from the Control Window or Frame Display toolbars or Bluetooth Timeline from the View menus.

P a g e | 19
Timeline
The timeline displays multiple rows of time, from left to right, top to bottom, just like a book. Information for the Master and Slave are shown on separate lines. Each packet type is a different color. The packet and corresponding color are shown on the legend (Figure 42).
Figure 21
Legend
This legend identifies the color coding found in the timeline (Figure 43).
Figure 22
Indicators
There are three throughput indicators (Figure 44).
Figure 23

P a g e | 20
• Average throughput is the total payload over the entire session divided by the total time. • 1-Second Payload Throughput is the total payload over the most recent one second of duration. • Average Throughput for a selected packet range displays the data for a single packet when you
select that packet from the Timeline.
Throughput Graph
Payload Throughput over Time shows throughput over a period of time in a graph (Figure 45).
Figure 24
Low Energy Timeline
There is also a low energy Timeline . It is very similar to the Bluetooth Timeline.

P a g e | 21
Coexistence View
The Coexistence View displays Bluetooth® and the 802.11 channels frequencies in one view or separately (Figure 46).
You access the Coexistence View by selecting the icon from the Control Window or Frame Display toolbars or Coexistence View from the View menus.
Timeline
In the Timeline you can see what packets were being transmitted, when they were transmitted, and how they relate to each other (Figure 47).
P a g e | 22
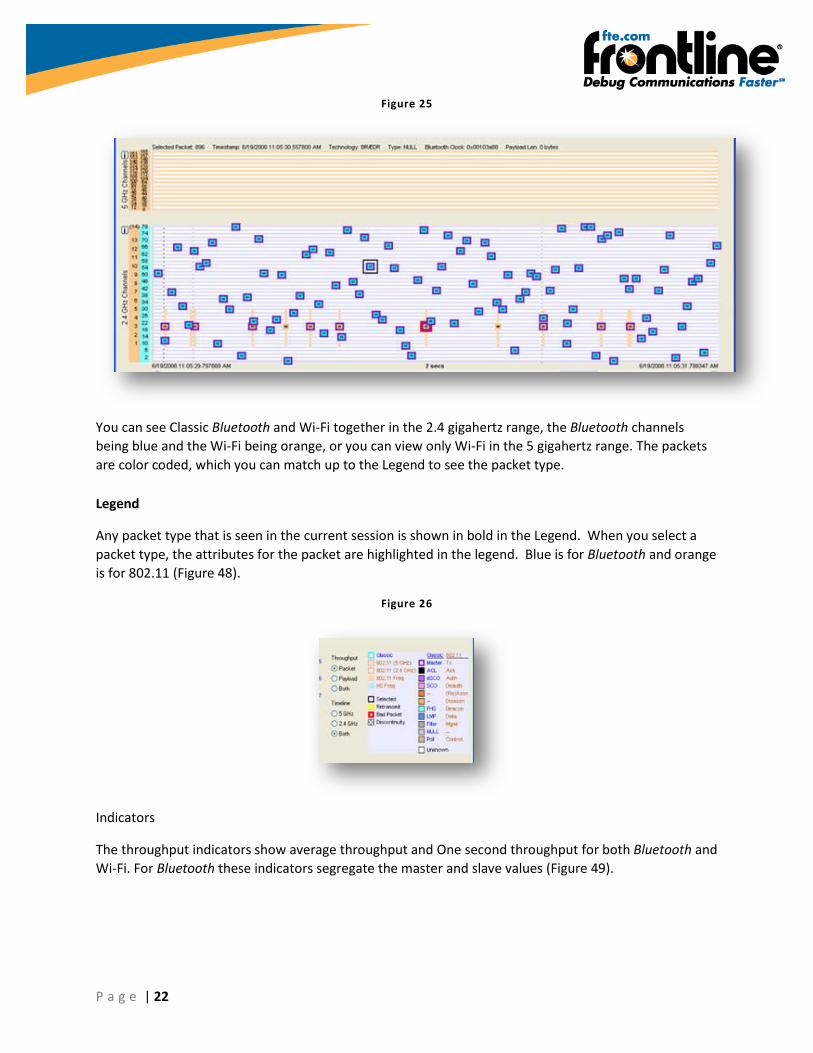
Figure 25
You can see Classic Bluetooth and Wi-Fi together in the 2.4 gigahertz range, the Bluetooth channels being blue and the Wi-Fi being orange, or you can view only Wi-Fi in the 5 gigahertz range. The packets are color coded, which you can match up to the Legend to see the packet type.
Legend
Any packet type that is seen in the current session is shown in bold in the Legend. When you select a packet type, the attributes for the packet are highlighted in the legend. Blue is for Bluetooth and orange is for 802.11 (Figure 48).
Figure 26
Indicators
The throughput indicators show average throughput and One second throughput for both Bluetooth and Wi-Fi. For Bluetooth these indicators segregate the master and slave values (Figure 49).

P a g e | 23
Figure 27
Throughput Graph
The throughput graph displays throughput over time (Figure 50).
Figure 28
You can see a line that displays the packet throughput for Bluetooth and Wi-Fi.You can also see a line that displays the payload throughput for both Bluetooth and Wi-Fi.
Display Synchronization
The system synchronizes the display in the Frame Display with the Event Display. Select a frame in the Frame Display and the other windows automatically update to highlight the bytes in the selected frame. Select a byte in the Message Sequencing Chart and the Frame Display and Event Display updates to show the frame containing the byte.
Duplicate Displays
The Duplicate icon creates a second window of the same type, identical to the first. The advantage of additional Displays is that you can look at two different groups of data at the same time. For example, you can look at the start of an interaction in one Frame Display and the end of that same interaction in the other and compare the two.
Bookmarks
Bookmarks let you mark frames of interest so they can be easily found later. Bookmarked frames appear with a magenta triangle icon next to them except in the Event Display where they appear as a dashed line around the start of frame marker. You can navigate between bookmarks using the Find

P a g e | 24
feature or by pressing F2 to go to the next bookmark. To make a new bookmark, right-click on the frame and choose Add Bookmark from the menu.Searching
You can search for strings or patterns in your data or in the frame decode, for errors, control signal
changes, bookmarks, special events, and time. Click the Find icon to open the Find window. Click the Help button for more information on the different types of searches.

P a g e | 25
TECHNICAL SUPPORT
Technical support is available in several ways. The online help system provides answers to many user related questions. Frontline’s website has documentation on common problems, as well as software upgrades and utilities to use with our products.
Web: http://www.fte.com, click Support
Email: [email protected]
If you need to talk to a technical support representative, support is available between 9am and 5pm, U.S. Eastern time, Monday through Friday. Technical support is not available on U.S. national holidays.
Phone: +1 (434) 984-4500
Fax: +1 (434) 984-4505


![RS-232 ComProbe II Quick Start Guide ComProbe II QSG.pdf · RS ‐ 232 ComProbe II QSG’ or ‘Start Æ Programs Æ NetDecoder [version#] Æ Documentation Æ RS ‐ 232 ComProbe](https://static.fdocuments.net/doc/165x107/5eab3069fcf4450e44123330/rs-232-comprobe-ii-quick-start-comprobe-ii-qsgpdf-rs-a-232-comprobe-ii-qsga.jpg)


