
Comprehensive school counseling programs: A review for policy ...

Portland
Sacramento
Las Vegas
Phoenix
DenverKansas City
DetroitChicago
Memphis
Tulsa
DallasFort Worth
San Antonio Houston
Atlanta
Nashville
Louisville
Indianapolis
Morgantown
Cincinnati
Philadelphia
Minneapolis
PittsburghColumbus
Seattle
San Francisco
Austin
Milwaukee
Dayton
Hartford
Savannah
Columbia
Charlotte
Orlando
MiamiSarasota
Tampa
Boston
New York CityNorthern New JerseyCoastal New Jersey
Washington D.C.Baltimore
Richmond
Naples
Providence
Los Angeles
San Diego Greenville
IRR de México
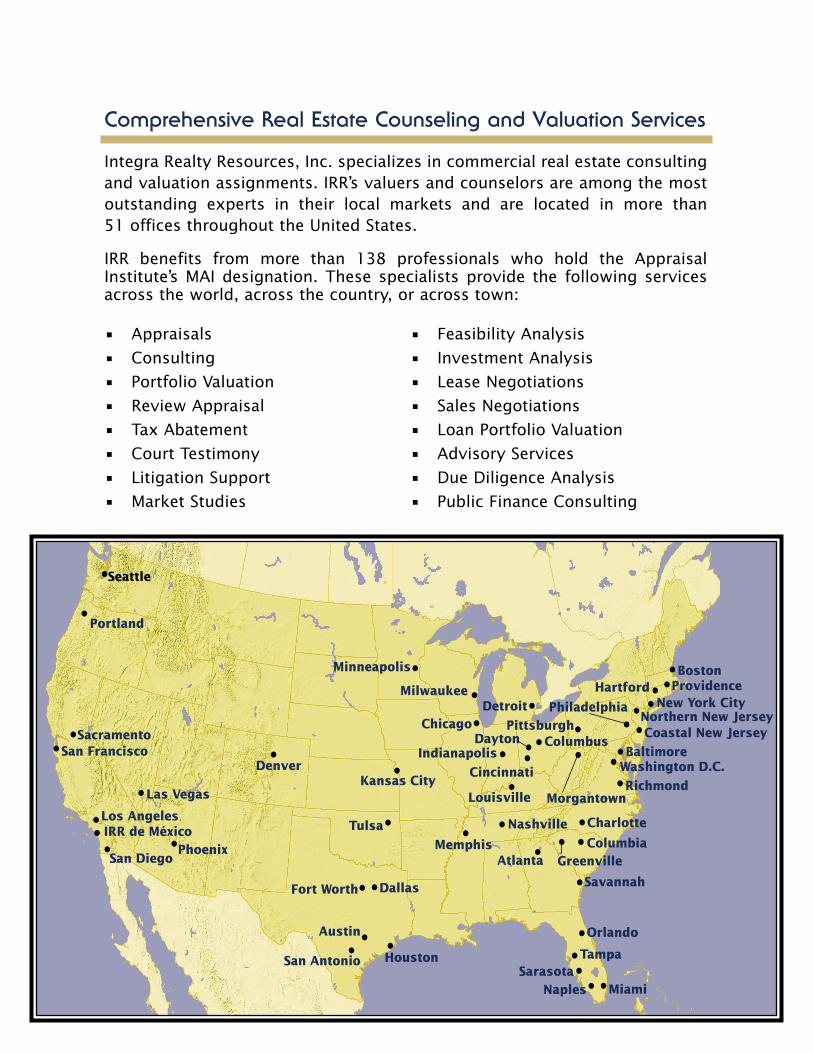
Comprehensive Real Estate Counseling and Valuation Services
Integra Realty Resources, Inc. specializes in commercial real estate consultingand valuation assignments. IRR’s valuers and counselors are among the mostoutstanding experts in their local markets and are located in more than 51 offices throughout the United States.
IRR benefits from more than 138 professionals who hold the AppraisalInstitute’s MAI designation. These specialists provide the following servicesacross the world, across the country, or across town:
• Appraisals
• Consulting
• Portfolio Valuation
• Review Appraisal
• Tax Abatement
• Court Testimony
• Litigation Support
• Market Studies
• Feasibility Analysis
• Investment Analysis
• Lease Negotiations
• Sales Negotiations
• Loan Portfolio Valuation
• Advisory Services
• Due Diligence Analysis
• Public Finance Consulting

VIEWPOINT 2005 INTEGRA REALTY RESOURCES, INC.
Dear Colleagues and Friends,
I am pleased to publish Viewpoint 2005, which is in its 15th consecu-tive year of print. Again this year we focus on the four food groups:office, retail, multifamily and industrial. Additional special reportswere prepared by Shelli Lowe and Anthony S. Graziano on gaming andJoe Pasquarella on lodging. This year we present our real estate trendsforecast in a similar format reflecting our views on the national realestate market and identifying where each major metropolitan area cur-rently is in the cycle.
We are pleased to announce that Jeffrey Rogers has been promotedfrom Chief Operating Officer to President of Integra Realty Resources.Jeffrey is responsible for the leadership of our 51 U.S. offices and twoin Mexico. We are proud of the fact that we continue our mantra “localexpertise nationally” providing services to financial institutions, cor-porations and the legal profession. Integra continues to focus on qual-ity control. In 2005 we will be launching integrated new softwarethroughout Integra that will allow the exchange of income andexpense data as well as lease and comparable sale informationthroughout our entire company.
Integra Realty Resources was further honored by the fact that I wasinvited to present to the Federal Reserve Board of Governors, includ-ing Alan Greenspan, Integra’s views on the residential real estate mar-ket for 2005. The presentation included forecasting potential bubblemarkets and the impact of those markets on the residential real estateindustry.
Finally, on behalf of Integra, I would like to wish each of you a healthyand prosperous 2005.
Very truly yours;
Kevin K. Nunnink, MAIEditor-in-ChiefChairman of the BoardIntegra Realty Resources, Inc.
CHAIRMAN’SLETTER
TABLE OF CONTENTS
National Real Estate Market..............2
Property Sector Cycles
New Investment Criteria ..5
Property Sector Cycles
Office, CBD & Suburban...9Gaming..........................14Lodging .........................15Retail .............................18Apartment .....................21Industrial .......................24
Demographic andEconomic Trends ..............27
Appendix .........................32
Local IRR Offices..back cover

NATIONAL REAL ESTATE
MARKETThe economic recovery is in full swing, but what itmeans for the real estate sector is the question. Lastyear IRR forecasted a “Yellow Flag Recovery.” IRRbelieves the economy is now hitting on all cylindersand IRR believes the GDP growth rate will range from3.5% – 4% in 2005. Reflecting on the last three months,approximately 300,000 jobs per month have been cre-ated in the U.S. decreasing the unemployment rate to5.4%.
When the economy is experiencing a “rising tide,” nor-mally one would expect the real estate sector to risewith all other boats. However, when dissecting the cap-ital markets IRR cautions both investors and lenders ofthe historical relationship of the 10-year treasury andthe Federal Funds rate. Reflecting on the recent FederalReserve actions, it is worthwhile to note the “Fed”reduced the Federal Funds rate 13 consecutive timesfrom 6.5% in May of 2000 to 1% in June of 2003.Considering inflation, this accommodative fiscal policycreated at times a zero cost of funds to borrowers dur-ing that period. Since June 2004, the Federal Reservehas increased rates from 1% to 2.25%. Presumably,these increases are in part to keep inflation in check asthe recovery heats up. While there are numerous exter-nalities affecting the 10-year treasury, a comparison ofthe direct relationship would suggest that the 10-yeartreasury will likely rise commensurate with the FederalFunds rate. Furthermore, it is widely speculated that
the equilibrium for the Federal Funds rate is approxi-mately 4%. In the early 1990’s the “delta” between thesetwo indices approximated 250 basis points. In the mid-dle to late 1990’s this spread narrowed to 50 to 100basis points. In the first portion of the 21st Century, thespread again widened to 250 to 300 basis points. Thus,Integra has forecasted that if the Federal Funds ratereturns to 4%, the 10-year treasury will range from4.75% to 5.25%, similar to the spreads observed duringthe mid to late 1990’s.
With most borrowing being pegged off the 10-year trea-sury and a median loan to value ratio of 75%, theimpact of the interest rates trends could be consider-able. Thus, Integra cautions investors and lenders tochart their debt course accordingly; either by hedgingtheir position or by locking in on a fixed rate mortgage.IRR counsels those investors that have “ridden theadjustable rate tide,” now is the time to “lock your rateor pay the price” in the years to come.
Other risks to consider when examining today’s econ-omy include:
• Energy: The U.S, which is an approximate $11.8Trillion dollar economy, imports approximately 4.5billion barrels of oil per year, thus every $10 per bar-rel (i.e. aggregate cost of $45 billion) increase in oilwould suggest a drop in the annual GDP growth rateof .4%. Threats of terrorism in the Middle East exposethe U.S. economy to this risk.
• Deficit: The current U.S. deficit is projected to be$422 billion in 2004, up from $375 billion in 2003.Financing the war in Iraq in the future will likely cause
0
1
2
3
4
5
6
7
8
9
10
Mar
-90
Mar
-91
Mar
-92
Mar
-93
Mar
-94
Mar
-95
Mar
-96
Mar
-97
Mar
-98
Mar
-99
Mar
-00
Mar
-01
Mar
-02
Mar
-03
Mar
-04
Mar
-05
Mar
-06
Effective Federal Funds Rate10 Year Treasury Yield
0
1
2
3
4
5
6
7
8
9
10
%%
Historical Projected
2 INTEGRA REALTY RESOURCES, INC. VIEWPOINT 2005
INTEREST RATETABLE 2
3.5
4
4.5
5
5.5
6
6.5
1995 1996 1997 1998 1999 2000 2001 2002 2003 2004
-400
-200
0
200
400
600
Rate Thousands of jobs
Nonfarm payroll employmentUnemployment Rate
SOURCE: Federal Reserve Bank
NEW JOBS CREATED BY THE ECONOMYTABLE 1
HISTORICAL SOURCE: Federal Reserve BankPROJECTED SOURCE: Integra Realty Resources, Inc.

the deficit to increase in the short term which couldbegin to substantially affect the price of debt instru-ments.
• Medical costs and funding retirement: Rising medicalcosts and the current underfunding of Social Securityare concerns and need to be dealt with before theseissues affect the economy on a go forward basis.
• Terrorism: Another catastrophic event in the U.S.could again cause another “economic flu” that is notpredictable in depth or impact.
ALTERNATIVE INVESTMENTS
CMBS MARKETU.S. volume was up 19.7% closing at $93.1 billion. Lastyear’s volume of $77.8 billion was also a record. Bankof America originated $11.6 billion and dethroned
-7
-6
-5
-4
-3
-2
-1
0
1
2
1970 1974 1978 1982 1986 1990 1994 1998 2002
-700
-600
-500
-400
-300
-200
-100
0
100
200
Percent Billions of $
Current Account
CA/GDP
NATIONAL REAL ESTATE MARKET
VIEWPOINT 2005 INTEGRA REALTY RESOURCES, INC. 3
J.P. Morgan Chase for first place in the league tables. J.P.Morgan lost first place by a meager $550 million.Morgan Stanley and Credit Suisse First Boston are virtu-ally in a dead heat for third and fourth place, both orig-inating approximately $10.5 billion.
REITSReal Estate Investment Trusts continue to dominate theinvesting sectors. The ALL REIT index returned 28.67%with the EQUITY REITS returning 29.88%. MORTGAGEREITs returned a respectable 16.01% while dealing withthe interest rate swing in 2004. IRR believes this REITsector will have difficulty continuing its recent returnsand investors should cautiously trade mortgage REITstocks.
Furthermore, IRR believes it will be difficult for theEquity REITs to continue the returns they have har-vested in the past five years; three-year average of22.32%, five-year 21.55%. IRR suggests the upside willbe selecting individual REIT stocks rather than theindexes. Attributes to look for in your favorite REITstock should be low debt levels, diversification of geo-graphic ownership that will insulate the REIT from cata-strophic events (hurricanes, terrorism, etc). IRR likesthe lodging and apartment sectors. The lodging sectorshould continue to benefit from the rebounding econ-omy and many of its gains are merely recovery from thepost-September 11th hangover. On the other hand, theapartment sector will benefit from the reboundingeconomy as well as the swing upward in interest rates.IRR believes the most challenged REIT sectors will beManufactured Homes, Health Care and MortgageFinancing.
INVESTMENT ALTERNATIVESYEAR S&P 500 BONDS* NCREIF** NAREIT
1994 1.3% 3.51% 6.4% 0.8%1995 37.5% 19.24% 7.7% 18.3%1996 23.0% 2.90% 10.3% 35.8%1997 33.2% 9.76% 10.9% 18.9%1998 28.58% 9.46% 16.14% -18.82%
1999 21.04% -2.15% 11.11% -6.48%
2000 -10.14% 11.84% 11.66% 17.74%
2001 -13.04% 8.5% 10.10% 12.83%
2002 -23.4% 9.15% 5.5% 3.6%
2003 26.4% 4.67% 7.84% 35.42%2004 9.0% 4.2% 12.42% 29.88%
SOURCE: *Lehman’s Government/Corporate Bond Index**NCREIF: Twelve-month return based on 3rd quarter 2004 reporting.
48.9
58.5
77.7
40.5
28.8
17.8
0
10
20
30
40
50
60
70
80
20001995 1996 1997 1998 1999
90
100
2001
74.4
2002
66.4
2003
77.8
2004
93.1
CMBS ISSUANCE ($ in Billions)
TABLE 5
SOURCE: Federal Reserve Bank
CURRENT ACCOUNT DEFICITTABLE 3
TABLE 4
SOURCE: CMSA & MBAA

NATIONAL REAL ESTATE MARKET
4 INTEGRA REALTY RESOURCES, INC. VIEWPOINT 2005
EXPECTATIONS FOR 2005Integra expects the office, industrial and apartmentsectors to continue their rebounding parallel with therecovery of the economy. Thus, expectations of signifi-cant gross revenue increases are expected. However,net yield to the investor will be a function of theamount of leverage in the transaction or pool of trans-actions. Gains in the top line revenue may be lost to thebottom line for properties with lots of leverage.
Owners of apartments seem to feel the worst is over.Generally, concessions are disappearing and increasinginterest rates in the single-family residential sector arecreating additional demand for rental units. Apartmentconversions to condos have also contributed to lesssupply. IRR acknowledges the office market is still softbut 2005 should provide the turning point for therecovery with corporations first absorbing under-utilized space followed by expansion in late 2005 and2006. However, due to the number of new buildingsunder construction in the major metropolitan areas IRRexpects a continued hangover for owners attempting tore-lease space that has been vacated. Tenants will stillperceive it as a tenant’s market and landlords will havedifficulty in pushing rents until late 2005 or early 2006.
This paradigm coupled with interest rate hikes will bechallenging in the office and industrial sectors.
In conclusion, IRR believes acceptable risk adjustedreturns will be commanded by the four main foodgroups in the real estate sector. However, apartmentsand retail will lead the recovery followed by industrialand then office. Those owners that are highly leveragedwill face some challenges of maintaining their bottomline, but generally the demand components willincrease as the economy gains momentum. IRRbelieves the cities with a 24-hour culture will continueto thrive as the empty nesters continue to leave the“burbs” for the vibrancy of the City. The hospitality andgaming sectors are both in for a banner 2005; however,the hospitality sector will primarily just recover some ofthe ground that it has lost during the past few years.The gaming sector on the other hand continues to caterto the “boomers” and the high risk adjusted returnscontinue to attract capital.
All in all the real estate “boat” should rise with the ris-ing tide of the economy, but Integra does not expect a“good times roll” mentality.

VIEWPOINT 2005 INTEGRA REALTY RESOURCES, INC. 5
PROPERTYSECTOR CYCLESNew Investment Criteria
Integra Realty Resources (IRR) takes a three-channelapproach in providing investors with appropriateinformation to make investment decisions. Our triad
of services — the Viewpoint publication, our website atwww.irr.com and market insights from our local IRRrepresentatives — help investors interpret the realestate environment, both nationally and locally.
Viewpoint provides a broad introduction to the currentnational real estate environment while selectively direct-ing a spotlight at several hot spots on the horizon.
Investors drill down more at www.irr.com where theycan access a collection of comprehensive, moredetailed and regularly updated data. In addition,updates for property type and submarket are availableat www.irr.com/IRR-Pulse.
Investors dig even deeper when they turn to local IRRrepresentatives for help in defining local and submar-ket risks and opportunities in all MSA’s. Examples ofspecialized information available from our representa-tives for some MSA’s and their submarkets are pre-sented in Quick Market Glance in the individualproperty sector segments in this section of Viewpoint.
Our broad look focuses on promising MSA’s that are inexpansion phases. However, even in those top markets,an isolated submarket could be in a recessionaryphase. We think this is important so we’ll say it again.To get more targeted information about specific sub-markets, consult a local IRR representative. To make themost informed real estate investment decision,investors ideally would use all resources made avail-able by IRR.
In the following pages, we discuss these designatedproperty sectors: CBD and suburban office, gaming,lodging, retail, apartment and industrial. We feature mar-ket cycle and cap rate trends charts in only four of thoseproperty sectors: office, retail, apartment and industrial.
MARKET CYCLE PHASESThe four market cycle phases include:
• Recovery: decreasing vacancy rates; low new con-struction; moderate absorption; and low to moderateemployment growth
• Expansion: decreasing vacancy rates; moderate tohigh new construction; high absorption; and moder-ate to high employment growth
• Hypersupply: increasing vacancy rates; moderate tohigh new construction; low to negative absorption;and moderate to low employment growth
• Recession: increasing vacancy rates; moderate tolow new construction; low absorption; and low tonegative employment growth
We determine the position of each market by analyzingvacancy rate trends, new construction starts, fore-
PROJECTED CAP RATE CHANGEProperty Type Decline (%) Increase (%) Stable (%)
CBD Office 17.0 8.5 74.5Suburban Office 22.4 10.2 67.3Regional Mall 20.0 8.9 71.1Community Mall 18.4 10.2 71.4Neighborhood Strip 18.4 14.3 67.3Manufacturing 4.3 14.9 80.9Bulk 12.5 4.2 83.3Office/Warehouse 22.4 6.1 71.4R&D 4.2 6.3 89.6Urban Multi Family 14.9 17.0 68.1Suburban Multi Family 16.3 18.4 65.3CBD Lodging 31.9 4.3 63.8Suburban Lodging 31.3 4.2 64.6Airport Lodging 30.4 4.3 65.2AVERAGE 18.9 9.4 71.7
TABLE 7
2004 CAP RATE RANKS2004 2004 Low 2004 High 2004 Avg.Rank Property Type (%) (%) (%)
1 Suburban Multi Family 5.0 9.5 7.492 Urban Multi Family 5.9 10.5 7.623 Regional Mall 6.0 10.0 7.984 Community Mall 7.0 10.0 8.295 Neighborhood Strip 6.5 10.8 8.376 CBD Office 6.8 10.5 8.717 Office/Warehouse 7.5 10.5 8.748 Suburban Office 6.6 11.0 8.799 Bulk 7.3 11.0 8.8210 R&D 7.0 10.5 9.1511 Manufacturing 7.5 11.0 9.3412 CBD Lodging 9.0 12.0 10.2313 Airport Lodging 9.0 12.0 10.4814 Suburban Lodging 8.5 12.0 10.48
TABLE 6

INVESTMENT CRITERIA
6 INTEGRA REALTY RESOURCES, INC. VIEWPOINT 2005
CBD Office 9.00% 9.00% 8.50% 8.00% 8.75% 7.50% 9.25% 9.00% 9.50% 9.00% 10.50% 8.00% 10.00% 9.00% 9.50% 9.25% 9.00% 10.00% 8.50% 8.50% 8.50% 9.00% 10.00%Suburban Office 8.50% 9.50% 8.50% 9.00% 9.00% 9.50% 9.50% 9.50% 9.50% 9.25% 9.50% 8.50% 9.00% 9.25% 9.80% 9.25% 8.50% 9.00% 8.00% 8.25% 8.00% 9.00% 9.00%Regional Mall 8.00% 8.00% 8.00% 8.00% 7.50% 7.50% 8.00% 8.50% 8.50% 7.75% 10.00% 7.50% 8.75% 8.00% 8.50% 8.00% 8.00% 9.00% 9.00% 7.75% 8.00% 8.00% -Community Mall 8.50% 8.50% 8.50% 8.50% 8.00% 8.00% 7.75% 8.75% 8.75% 8.75% 9.50% 8.00% 9.00% 8.75% 8.75% 9.00% 8.50% 9.50% 8.50% 8.00% 8.00% 9.00% 8.50%Neighborhood Strip 8.75% 9.50% 8.00% 8.50% 8.50% 8.50% 8.25% 8.25% 8.75% 9.00% 9.50% 8.50% 9.00% 9.00% 8.80% 9.25% 8.50% 9.50% 8.50% 8.00% 8.00% 8.00% 9.50%Manufacturing 9.50% 10.00% 9.00% 9.00% 9.25% 9.00% 9.00% 10.25%11.00% 9.00% 11.00% 9.00% 9.75% 9.00% 10.50% 11.00% 10.00% 10.50% 8.50% 9.25% 9.00% 9.80% 9.00%Bulk 9.00% 10.50% 8.00% 9.00% 9.00% 8.00% 8.75% 9.75% 9.50% 8.50% 10.50% 9.00% 9.75% 8.50% 9.50% 11.00% 8.00% 9.00% 8.50% 8.25% 8.00% 9.50% 8.50%Office/Warehouse 9.00% 10.50% 8.00% 9.00% 9.00% 8.00% 8.50% 9.50% 9.50% 8.50% 10.50% 8.80% 9.25% 8.50% 9.00% 10.50% 9.00% 9.50% 8.50% 8.50% 8.50% 9.00% 8.50%R&D 9.00% 10.00% 8.50% 9.00% - 9.00% 9.00% 10.25%10.00% 9.00% 10.50% 9.00% 8.75% 9.00% 9.50% 10.00% 9.00% 9.50% 8.50% 8.75% 8.50% 9.80% 9.00%Urban Multi Family 8.50% 8.50% 7.00% 8.00% 6.50% 7.00% 8.50% 8.50% 8.50% 7.00% 10.50% 6.00% 9.00% 7.25% 8.25% 8.50% 8.00% 9.50% 8.00% 8.25% 7.00% 8.50% 6.75%Suburban Multi Family 8.50% 8.50% 7.00% 7.00% 6.50% 7.00% 8.00% 8.00% 8.00% 7.25% 9.50% 6.50% 8.25% 7.50% 8.30% 9.25% 7.50% 8.50% 7.50% 6.75% 6.50% 8.00% 6.75%CBD Lodging 10.50% 11.00% 10.00% 10.00% 9.50% 10.50% 11.50% 10.50% 9.50% 10.00% 12.00% 9.50% 11.50% 10.00% 11.00% 9.50% 10.50% 11.00% 9.00% 9.25%10.00% 10.00% -Suburban Lodging 10.50% 11.00% 10.50% 10.00% 9.50% 11.50% 11.00% 10.50%10.50% 10.00% 11.50% 10.00% 11.50% 10.00% 11.00% 11.00% 11.00% 12.00% 9.00% 9.00%10.00% 12.00% -Airport Lodging 11.00% 11.00% 10.50% 10.00% 9.50% 10.50% 11.00% 10.50%10.50% 10.50% 12.00% 10.00% 10.50% 10.50% 10.50% 11.00% 10.75% 12.00% 9.00% 9.00%11.00% 10.00% -
CBD Office 11.00% 11.00% 10.50% 10.50%10.25% 10.00% 11.25% 11.25%10.50% 10.75% 12.50% 10.00% 10.50% 10.75% 12.00% 10.75% 10.50% 10.50% 11.00% 9.50%10.50% 10.50% 11.00%Suburban Office 10.50% 11.00% 10.50% 11.00%10.50% 11.00% 11.50% 11.00%10.50% 10.75% 11.50% 10.50% 10.25% 10.75% 13.00% 10.75% 10.00% 10.50% 11.00% 9.25%10.00% 10.50% 10.00%Regional Mall 9.00% 10.00% 10.00% 10.00% 9.00% 10.00% 10.00% 10.75% 9.00% 10.25% 12.00% 9.50% 10.50% 10.25% 10.00% 9.50% 9.50% 10.00% 11.00% 8.75%10.00% 10.00% -Community Mall 9.50% 11.00% 10.50% 10.00% 9.50% 10.50% 9.75% 11.00%10.00% 10.25% 11.50% 10.00% 10.50% 10.25% 10.50% 10.50% 9.50% 10.50% 11.00% 9.00%10.00% 9.80% 10.00%Neighborhood Strip 9.75% 11.00% 10.00% 10.00%10.00% 10.50% 10.25% 10.50%10.00% 10.50% 11.00% 10.25% 10.50% 10.50% 11.00% 10.75% 10.00% 11.50% 11.00% 9.00%10.00% 10.50% 11.00%Manufacturing 10.50% 11.50% 11.00% 10.50%10.75% 11.00% 11.00% 11.50%11.50% 11.00% 13.00% 11.00% 11.50% 11.00% 14.00% 12.50% 12.00% 12.50% 11.00% 10.00%11.00% 10.20% 11.00%Bulk 10.00% 11.50% 10.00% 10.50%10.50% 11.00% 10.75% 10.50%11.00% 10.25% 12.50% 10.50% 11.00% 10.50% 13.00% 12.00% 9.50% 11.00% 11.00% 9.00%10.00% 10.80% 10.50%Office/Warehouse 10.00% 11.00% 10.00% 10.50%10.50% 11.00% 10.50% 10.50%11.00% 10.25% 12.50% 10.00% 11.00% 10.50% 12.00% 12.00% 10.50% 11.00% 11.00% 9.25%10.50% 10.50% 10.50%R&D 10.00% 11.00% 10.50% 10.50% - 12.00% 11.00% 11.50%11.00% 11.00% 12.50% 10.50% 10.50% 11.00% 13.00% 11.50% 10.50% 11.50% 11.00% 9.50%10.50% 10.80% 11.00%Urban Multi Family 10.00% 10.00% 9.00% 10.00% 8.50% 9.00% 10.50% 10.50%10.00% 9.25% 12.50% 9.50% 9.50% 9.50% 10.50% 9.50% 9.50% 10.00% 11.00% 9.25% 9.50% 9.50% 10.00%Suburban Multi Family 10.00% 10.00% 9.00% 10.00% 8.50% 9.00% 10.00% 10.50%10.00% 9.50% 11.50% 9.50% 9.25% 9.75% 10.00% 10.75% 9.00% 9.00% 11.00% 9.00% 9.00% 8.80% 10.00%CBD Lodging 12.00% 12.00% 12.00% 12.50%11.75% 12.00% 13.50% 12.25%12.00% 12.00% 14.00% 11.75% 12.50% 12.00% 14.00% 11.00% 12.50% 12.50% 11.00% 9.50%12.00% 13.00% -Suburban Lodging 12.00% 12.00% 12.50% 12.50%11.75% 13.00% 13.00% 12.25%13.50% 12.00% 13.50% 11.75% 12.00% 12.00% 14.00% 13.00% 12.50% 13.50% 11.00% 9.25%12.00% 13.50% -Airport Lodging 12.50% 12.00% 12.50% 12.50%11.75% 10.50% 13.00% 12.25%13.50% 12.00% 14.00% 11.75% 11.50% 12.00% 13.50% 12.50% 12.50% 13.50% 11.00% 9.25%13.00% 13.00% -
CBD Office 9.50% 9.50% 9.50% 8.50% 9.25% 8.00% 9.50% 9.50%10.00% 9.50% 11.00% 8.50% 10.25% 9.50% 10.00% 9.75% 9.50% 10.50% 9.00% 9.00% 9.00% 9.50% 10.25%Suburban Office 9.50% 10.00% 9.50% 9.50% 9.50% 10.00% 9.75% 10.00%10.00% 9.75% 10.00% 9.00% 9.50% 9.75% 10.30% 9.75% 9.00% 9.50% 8.50% 8.75% 8.50% 9.50% 9.25%Regional Mall 8.75% 8.50% 9.00% 8.50% 8.00% 7.50% 8.25% 9.00% 9.00% 8.25% 12.00% 8.00% 9.25% 8.50% 9.00% 8.50% 8.50% 9.50% 9.50% 8.00% 8.50% 8.60% -Community Mall 9.00% 9.50% 9.50% 9.00% 8.50% 8.00% 8.00% 9.25% 9.25% 9.50% 10.00% 8.75% 9.50% 9.50% 9.00% 9.50% 9.00% 10.00% 9.00% 8.50% 8.50% 10.50% 8.75%Neighborhood Strip 9.25% 10.50% 9.00% 9.00% 9.00% 8.50% 8.50% 8.50% 9.25% 9.50% 10.00% 8.75% 9.50% 9.50% 9.30% 9.75% 9.00% 10.00% 9.00% 8.50% 8.50% 9.20% 9.75%Manufacturing 10.00% 10.50% 10.00% 9.50% 9.75% 9.50% 9.25% 10.75%11.50% 9.50% 11.50% 9.50% 10.00% 9.50% 11.00% 11.50% 11.00% 11.00% 9.00% 10.00% 9.50% 10.00% 9.50%Bulk 9.50% 11.00% 9.00% 9.50% 9.50% 8.50% 9.00% 10.00%10.00% 9.00% 11.00% 9.50% 10.00% 9.00% 10.00% 11.00% 8.50% 9.50% 9.00% 8.75% 8.50% 10.00% 9.00%Office/Warehouse 9.50% 11.00% 9.00% 9.50% 9.50% 8.50% 8.75% 9.75%10.00% 9.00% 11.00% 9.25% 9.75% 9.00% 9.50% 11.00% 9.50% 10.00% 9.00% 8.75% 9.00% 10.00% 9.00%R&D 9.50% 10.50% 9.50% 9.50% - 9.50% 9.25% 10.75%10.50% 9.50% 11.00% 9.50% 9.25% 9.50% 10.00% 11.00% 9.50% 10.00% 9.00% 9.00% 9.00% 10.20% 9.50%Urban Multi Family 9.50% 9.00% 8.00% 8.50% 7.25% 7.50% 8.75% 8.75% 9.00% 7.50% 11.00% 6.50% 9.25% 7.75% 8.80% 8.50% 8.50% 10.00% 8.50% 8.75% 7.50% 8.70% 7.00%Suburban Multi Family 9.50% 9.00% 8.00% 7.50% 7.25% 7.50% 8.25% 8.25% 9.00% 7.75% 10.00% 7.00% 9.00% 8.00% 8.80% 9.75% 8.00% 9.00% 8.00% 7.75% 7.00% 8.20% 7.00%CBD Lodging 11.00% 11.50% 11.00% 10.50% 9.75% 10.75% 11.75% 11.00%10.00% 11.00% 13.00% 10.00% 12.00% 11.00% 11.20% 10.00% 11.00% 11.50% 9.50% 9.50%10.50% 13.00% -Suburban Lodging 11.00% 11.50% 11.50% 10.50% 9.75% 11.75% 11.25% 11.00%11.00% 11.00% 12.50% 10.50% 12.00% 11.00% 11.50% 12.00% 11.50% 12.50% 9.50% 9.25%10.50% 12.50% -Airport Lodging 12.00% 11.50% 11.50% 10.50% 9.75% 10.75% 11.25% 11.00%11.00% 11.50% 13.00% 10.50% 11.00% 11.50% 11.00% 11.50% 11.25% 12.50% 9.50% 9.25%11.50% 10.50% -
CBD Office 2.00% 0.00% 2.00% 0.00% 0.00% 2.50% 0.00% 0.00% 3.00% 0.00% 2.00% 0.00% -2.00% 0.00% 0.00% 0.00% 1.00% 3.00% 2.00% 2.75% 1.00% 0.50% 1.00%Suburban Office 2.00% 0.00% 2.00% 0.00% 0.00% 0.00% 1.00% 0.00% 3.00% 0.00% 3.00% 0.00% 0.00% 2.00% 0.00% 0.00% 5.00% 2.00% 3.00% 2.75% 2.00% 0.50% 2.00%Regional Mall 2.00% 5.00% 3.00% 2.50% 2.50% 2.00% 2.00% 3.00% 3.00% 3.00% 2.00% 3.00% 0.00% 0.00% 3.00% 2.00% 2.50% 3.00% 3.00% 3.25% 3.00% 2.00% -Community Mall 2.00% 5.00% 3.00% 3.00% 2.50% 2.00% 2.00% 2.00% 3.00% 2.00% 2.00% 3.00% 0.00% 3.00% 0.00% 2.00% 2.50% 3.00% 3.00% 3.25% 2.50% 2.00% 2.00%Neighborhood Strip 2.00% 3.00% 3.00% 3.00% 2.50% 2.00% 2.00% 1.00% 3.00% 3.00% 3.00% 3.00% 0.00% 3.00% 0.00% 2.00% 2.50% 3.00% 3.00% 3.00% 2.50% 2.50% 2.00%Manufacturing 1.50% 0.00% 3.00% 0.00% 0.00% 2.00% 1.00% 0.00% 3.00% 2.50% 1.00% 3.00% -2.50% 2.50% 0.00% 0.00% 0.00% 0.00% 2.50% 2.75% 0.00% 1.00% 2.50%Bulk 1.50% 0.00% 3.00% 0.00% 0.00% 2.00% 0.00% 1.00% 3.00% 3.00% 1.00% 3.00% -2.00% 3.00% 0.00% 2.00% 1.50% 3.00% 2.50% 3.00% 2.00% 1.00% 2.50%Office/Warehouse 1.50% 0.00% 3.00% 1.50% 0.00% 2.00% 1.00% 1.00% 3.00% 3.00% 2.00% 3.00% 0.00% 3.00% 2.00% 2.00% 1.25% 2.00% 2.50% 3.00% 2.00% 1.00% 2.50%R&D 1.50% 0.00% 3.00% 0.00% - 2.00% 1.00% 1.00% 3.00% 0.00% 2.00% 3.00% 0.00% 0.00% 2.00% 2.00% 1.25% 2.00% 2.50% 2.75% 2.00% 1.00% 2.50%Urban Multi Family 2.00% 3.00% 2.50% 1.50% 0.00% 1.00% 2.00% 2.00% 3.00% 0.00% 2.00% 3.00% 0.00% 0.00% 3.00% 2.00% 5.00% 3.00% 5.00% 2.75% 3.00% 1.50% 2.00%Suburban Multi Family 2.00% 3.00% 2.50% 1.50% 0.00% 1.00% 2.00% 2.00% 3.00% 0.00% 2.00% 3.00% 1.50% 0.00% 4.00% 2.00% 5.00% 3.00% 5.00% 3.00% 3.00% 1.00% 0.00%CBD Lodging 3.50% 0.00% 3.00% 3.00% 0.00% 2.00% 2.00% 1.00% 3.00% 0.00% 2.00% 2.00% -1.50% 0.00% 5.00% 2.00% 2.50% 0.00% 1.00% 3.00% 1.00% 2.50% -Suburban Lodging 3.50% 0.00% 3.00% 3.00% 0.00% 2.00% 2.00% 1.00% 3.00% 0.00% 2.00% 2.00% 0.00% 0.00% 5.00% 0.00% 2.50% 0.00% 1.00% 3.25% 3.00% 2.00% -Airport Lodging 3.00% 0.00% 3.00% 3.00% 0.00% 2.00% 2.00% 1.00% 3.00% 0.00% 2.00% 2.00% 0.00% 0.00% 5.00% 0.00% 2.50% 0.00% 1.00% 3.00% 2.00% 2.50% -
CBD Office 2.50% 3.00% 3.00% 3.00% 2.75% 3.00% 2.00% 3.00% 3.00% 3.00% 2.00% 3.00% 2.50% 3.00% 3.00% 2.00% 2.75% 3.00% 3.00% 3.00% 3.00% 2.50% 2.00%Suburban Office 2.50% 3.00% 3.00% 3.00% 2.75% 2.00% 2.00% 3.00% 3.00% 3.00% 2.00% 3.00% 2.50% 3.00% 3.00% 2.00% 2.75% 3.00% 3.00% 2.75% 3.00% 3.00% 2.00%Regional Mall 2.50% 3.00% 3.00% 3.00% 2.50% 2.00% 2.00% 3.00% 3.00% 3.00% 2.00% 3.00% 2.50% 3.00% 3.00% 2.00% 3.00% 3.00% 3.00% 3.00% 3.00% 3.00% -Community Mall 2.50% 3.00% 3.00% 3.00% 2.50% 2.00% 2.00% 3.00% 3.00% 3.00% 2.00% 3.00% 2.50% 3.00% 3.00% 2.00% 3.00% 3.00% 3.00% 3.00% 3.00% 3.00% 2.00%Neighborhood Strip 2.50% 3.00% 3.00% 3.00% 2.50% 2.00% 2.00% 3.00% 3.00% 3.00% 2.00% 3.00% 2.50% 3.00% 3.00% 2.00% 3.00% 3.00% 3.00% 3.00% 3.00% 3.00% 2.00%Manufacturing 2.50% 3.00% 3.00% 3.00% 2.50% 2.00% 2.00% 3.00% 3.00% 3.00% 2.00% 3.00% 2.50% 3.00% 3.00% 2.00% 3.00% 3.00% 3.00% 2.75% 3.00% 3.00% 2.50%Bulk 2.50% 3.00% 3.00% 3.00% 2.50% 2.00% 2.00% 3.00% 3.00% 3.00% 2.00% 3.00% 2.50% 3.00% 3.00% 2.00% 3.00% 3.00% 3.00% 3.00% 3.00% 3.00% 2.50%Office/Warehouse 2.50% 3.00% 3.00% 3.00% 2.50% 2.00% 2.00% 3.00% 3.00% 3.00% 2.00% 3.00% 2.50% 3.00% 3.00% 2.00% 3.00% 3.00% 3.00% 3.00% 3.00% 3.00% 2.50%R&D 2.50% 3.00% 3.00% 3.00% - 2.00% 2.00% 3.00% 3.00% 3.00% 2.00% 3.00% 2.50% 3.00% 3.00% 2.00% 3.00% 3.00% 3.00% 3.00% 3.00% 3.00% 2.50%Urban Multi Family 2.50% 3.00% 3.00% 3.00% 2.75% 2.00% 2.00% 3.00% 3.00% 3.00% 2.00% 3.00% 2.50% 3.00% 3.00% 2.00% 2.75% 3.50% 3.00% 3.25% 3.00% 3.00% 2.50%Suburban Multi Family 2.50% 3.00% 3.00% 3.00% 2.75% 2.00% 2.00% 3.00% 3.00% 3.00% 2.00% 3.00% 2.50% 3.00% 3.00% 2.00% 2.75% 3.00% 3.00% 3.00% 3.00% 3.00% 2.50%CBD Lodging 2.50% 3.00% 3.00% 3.00% 2.75% 3.00% 2.00% 3.00% 3.00% 3.00% 2.00% 2.00% 2.50% 3.00% 3.00% 2.00% 3.00% 0.00% 2.00% 3.00% 3.00% 3.00% -Suburban Lodging 2.50% 3.00% 3.00% 3.00% 2.75% 3.00% 2.00% 3.00% 3.00% 3.00% 2.00% 2.00% 2.50% 3.00% 3.00% 2.00% 3.00% 0.00% 2.00% 3.00% 3.00% 1.00% -Airport Lodging 2.50% 3.00% 3.00% 3.00% 2.75% 3.00% 2.00% 3.00% 3.00% 3.00% 2.00% 2.00% 2.50% 3.00% 3.00% 2.00% 3.00% 0.00% 2.00% 3.00% 3.00% 3.00% -
CBD Office $23.00 $20.00 $25.00 $20.00 $15.00 $35.00 $15.00 $20.00 $20.00 $20.00 $15.00 $25.00 $20.00 $20.00 $25.00 $20.00 $20.00 $30.00 $40.00 $25.00 $35.00 $30.00 $25.00Suburban Office $17.50 $17.00 $20.00 $10.00 $15.00 $25.00 $15.00 $15.00 $20.00 $20.00 $22.00 $25.00 $12.50 $20.00 $20.00 $15.00 $15.00 $25.00 $40.00 $20.00 $25.00 $25.00 $25.00Regional Mall - $20.00 - $2.00 - $10.00 $15.00 $15.00 - $25.00 $22.00 $2.00 $7.00 $25.00 $10.00 $25.00 $10.00 - $30.00 $25.00 $5.00 $50.00 -Community Mall $10.00 $10.00 - $2.00 - $10.00 $10.00 $10.00 - $15.00 $17.00 $4.00 $5.00 $17.00 $5.00 $12.00 $10.00 - $30.00 $5.00 $5.00 $20.00 $20.00Neighborhood Strip $10.00 $9.00 - $2.00 - $10.00 $5.00 $5.00 - $16.00 $15.00 $4.00 $7.00 $16.00 $5.00 $8.00 $5.00 - $30.00 $2.00 $5.00 $15.00 $20.00Manufacturing - $4.00 - - - $5.00 - - - $1.00 $8.00 $1.00 - $3.00 - - - - $30.00 - $2.50 - $1.00Bulk $1.00 $2.00 $1.00 - - $5.00 - - - $3.00 $8.00 $1.00 - $3.00 - - $0.50 - $30.00 - $1.50 $20.00 $1.00Office/Warehouse $2.00 $2.00 $2.00 - - $5.00 - - - $2.50 $8.00 $1.00 $3.00 $3.00 - $5.00 $1.00 - $30.00 - $2.50 - $1.00R&D - $5.00 $9.00 $5.00 - $5.00 - - - $5.00 $13.00 $5.00 $7.00 $5.00 - $4.00 $1.00 $5.00 $30.00 - $2.00 $25.00 $2.00
Atla
nta,
GA
Aust
in, T
X
Balti
mor
e, M
D
Bost
on, M
A
Char
lotte
, NC
Chic
ago,
IL
Cinc
inna
ti, O
H
Colu
mbi
a, S
C
Colu
mbu
s, O
H
Dalla
s, T
X
Dayt
on, O
H
Denv
er, C
O
Detro
it, M
I
Fort
Wor
th, T
X
Hartf
ord,
CT
Hous
ton,
TX
Indi
anap
olis
, IN
Kans
as C
ity, K
S/M
O
Las
Vega
s, N
V
Long
Isla
nd, N
Y
Los
Ange
les,
CA
Loui
svill
e, K
Y
Mem
phis
, TN
GOIN
G-IN
CAP
E RA
TE (%
)GO
ING-
IN D
ISCO
UNT
RATE
(%)
REVE
RSIO
NCA
PRA
TE (%
)M
ARKE
T RE
NT IN
FLAT
OR (%
)EX
PENS
EGR
OWTH
RATE
(%)
TENA
NT F
INIS
HAL
LOW
ANCE
($)
Property Types
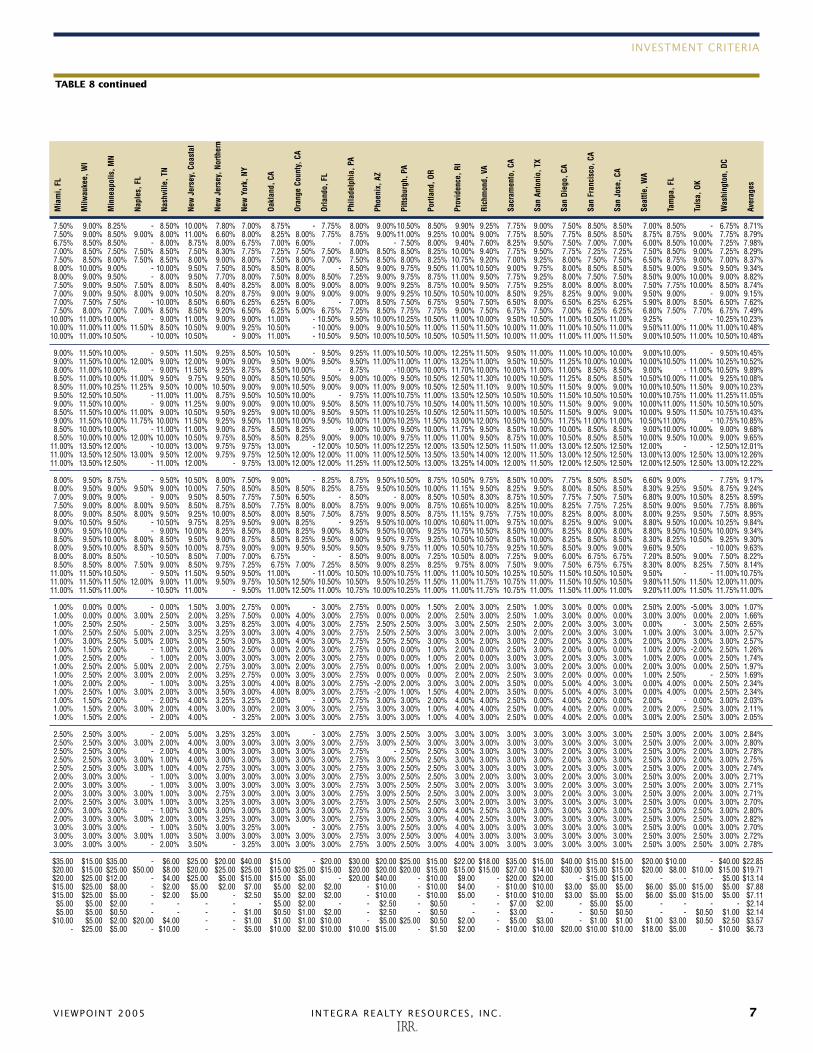
CAPITALIZATION RATES, DISCOUNT RATES, REVERSION RATES, MARKET RENT CHANGE RATES, EXPENSE GROWTH RATES AND TENANT FINISH ALLOWANCES
TABLE 8
7.50% 9.00% 8.25% - 8.50% 10.00% 7.80% 7.00% 8.75% - 7.75% 8.00% 9.00%10.50% 8.50% 9.90% 9.25% 7.75% 9.00% 7.50% 8.50% 8.50% 7.00% 8.50% - 6.75% 8.71%7.50% 9.00% 8.50% 9.00% 8.00% 11.00% 6.60% 8.00% 8.25% 8.00% 7.75% 8.75% 9.00%11.00% 9.25% 10.00% 9.00% 7.75% 8.50% 7.75% 8.50% 8.50% 8.75% 8.75% 9.00% 7.75% 8.79%6.75% 8.50% 8.50% - 8.00% 8.75% 8.00% 6.75% 7.00% 6.00% - 7.00% - 7.50% 8.00% 9.40% 7.60% 8.25% 9.50% 7.50% 7.00% 7.00% 6.00% 8.50% 10.00% 7.25% 7.98%7.00% 8.50% 7.50% 7.50% 8.50% 7.50% 8.30% 7.75% 7.25% 7.50% 7.50% 8.00% 8.50% 8.50% 8.25% 10.00% 9.40% 7.75% 9.50% 7.75% 7.25% 7.25% 7.50% 8.50% 9.00% 7.25% 8.29%7.50% 8.50% 8.00% 7.50% 8.50% 8.00% 9.00% 8.00% 7.50% 8.00% 7.00% 7.50% 8.50% 8.00% 8.25% 10.75% 9.20% 7.00% 9.25% 8.00% 7.50% 7.50% 6.50% 8.75% 9.00% 7.00% 8.37%8.00% 10.00% 9.00% - 10.00% 9.50% 7.50% 8.50% 8.50% 8.00% - 8.50% 9.00% 9.75% 9.50% 11.00% 10.50% 9.00% 9.75% 8.00% 8.50% 8.50% 8.50% 9.00% 9.50% 9.50% 9.34%8.00% 9.00% 9.50% - 8.00% 9.50% 7.70% 8.00% 7.50% 8.00% 8.50% 7.25% 9.00% 9.75% 8.75% 11.00% 9.50% 7.75% 9.25% 8.00% 7.50% 7.50% 8.50% 9.00% 10.00% 9.00% 8.82%7.50% 9.00% 9.50% 7.50% 8.00% 8.50% 8.40% 8.25% 8.00% 8.00% 9.00% 8.00% 9.00% 9.25% 8.75% 10.00% 9.50% 7.75% 9.25% 8.00% 8.00% 8.00% 7.50% 7.75% 10.00% 8.50% 8.74%7.00% 9.00% 9.50% 8.00% 9.00% 10.50% 8.20% 8.75% 9.00% 9.00% 9.00% 9.00% 9.00% 9.25% 10.50% 10.50% 10.00% 8.50% 9.25% 8.25% 9.00% 9.00% 9.50% 9.00% - 9.00% 9.15%7.00% 7.50% 7.50% - 10.00% 8.50% 6.60% 6.25% 6.25% 6.00% - 7.00% 8.50% 7.50% 6.75% 9.50% 7.50% 6.50% 8.00% 6.50% 6.25% 6.25% 5.90% 8.00% 8.50% 6.50% 7.62%7.50% 8.00% 7.00% 7.00% 8.50% 8.50% 9.20% 6.50% 6.25% 5.00% 6.75% 7.25% 8.50% 7.75% 7.75% 9.00% 7.50% 6.75% 7.50% 7.00% 6.25% 6.25% 6.80% 7.50% 7.70% 6.75% 7.49%
10.00% 11.00% 10.00% - 9.00% 11.00% 9.00% 9.00% 11.00% - 10.50% 9.50% 10.00%10.25% 10.50% 11.00% 10.00% 9.50% 10.50% 11.00% 10.50% 11.00% 9.25% - - 10.25%10.23%10.00% 11.00% 11.00% 11.50% 8.50% 10.50% 9.00% 9.25% 10.50% - 10.00% 9.00% 9.00%10.50% 11.00% 11.50% 11.50% 10.00% 11.00% 11.00% 10.50% 11.00% 9.50%11.00% 11.00% 11.00%10.48%10.00% 11.00% 10.50% - 10.00% 10.50% - 9.00% 11.00% - 10.50% 9.50% 10.00%10.50% 10.50% 10.50% 11.50% 10.00% 11.00% 11.00% 11.00% 11.50% 9.00%10.50% 11.00% 10.50%10.48%
9.00% 11.50% 10.00% - 9.50% 11.50% 9.25% 8.50% 10.50% - 9.50% 9.25% 11.00%10.50% 10.00% 12.25% 11.50% 9.50% 11.00% 11.00% 10.00% 10.00% 9.00%10.00% - 9.50%10.45%9.00% 11.50% 10.00% 12.00% 9.00% 12.00% 9.00% 9.00% 9.50% 9.00% 9.50% 9.50% 11.00%11.00% 11.00% 13.25% 11.00% 9.50% 10.50% 11.25% 10.00% 10.00% 10.00%10.50% 11.00% 10.25%10.52%8.00% 11.00% 10.00% - 9.00% 11.50% 9.25% 8.75% 8.50% 10.00% - 8.75% -10.00% 10.00% 11.70% 10.00% 10.00% 11.00% 11.00% 8.50% 8.50% 9.00% - 11.00% 10.50% 9.89%8.50% 11.00% 10.00% 11.00% 9.50% 9.75% 9.50% 9.00% 8.50% 10.50% 9.50% 9.00% 10.00% 9.50% 10.50% 12.50% 11.30% 10.00% 10.50% 11.25% 8.50% 8.50% 10.50%10.00% 11.00% 9.25%10.08%8.50% 11.00% 10.25% 11.25% 9.50% 10.00% 10.50% 9.00% 9.00% 10.50% 9.00% 9.00% 11.00% 9.00% 10.50% 12.50% 11.10% 9.00% 10.50% 11.50% 9.00% 9.00% 10.00%10.50% 11.50% 9.00%10.23%9.50% 12.50% 10.50% - 11.00% 11.00% 8.75% 9.50% 10.50% 10.00% - 9.75% 11.00%10.75% 11.00% 13.50% 12.50% 10.50% 10.50% 11.50% 10.50% 10.50% 10.00%10.75% 11.00% 11.25%11.05%9.00% 11.50% 10.00% - 9.00% 11.25% 9.00% 9.00% 9.00% 10.00% 9.50% 8.50% 11.00%10.75% 10.50% 14.00% 11.50% 10.00% 10.50% 11.50% 9.00% 9.00% 10.00%11.00% 11.50% 10.50%10.50%8.50% 11.50% 10.00% 11.00% 9.00% 10.50% 9.50% 9.25% 9.00% 10.00% 9.50% 9.50% 11.00%10.25% 10.50% 12.50% 11.50% 10.00% 10.50% 11.50% 9.00% 9.00% 10.00% 9.50% 11.50% 10.75%10.43%9.00% 11.50% 10.00% 11.75% 10.00% 11.50% 9.25% 9.50% 11.00% 10.00% 9.50% 10.00% 11.00%10.25% 11.50% 13.00% 12.00% 10.50% 10.50% 11.75% 11.00% 11.00% 10.50%11.00% - 10.75%10.85%8.50% 10.00% 10.00% - 11.00% 11.00% 9.00% 8.75% 8.50% 8.25% - 9.00% 10.00% 9.50% 10.00% 11.75% 9.50% 8.50% 10.00% 10.00% 8.50% 8.50% 9.00%10.00% 10.00% 9.00% 9.68%8.50% 10.00% 10.00% 12.00% 10.00% 10.50% 9.75% 8.50% 8.50% 8.25% 9.00% 9.00% 10.00% 9.75% 11.00% 11.00% 9.50% 8.75% 10.00% 10.50% 8.50% 8.50% 10.00% 9.50% 10.00% 9.00% 9.65%
11.00% 13.50% 12.00% - 10.00% 13.00% 9.75% 9.75% 13.00% - 12.00% 10.50% 11.00%12.25% 12.00% 13.50% 12.50% 11.50% 11.00% 13.00% 12.50% 12.50% 12.00% - - 12.50%12.01%11.00% 13.50% 12.50% 13.00% 9.50% 12.00% 9.75% 9.75% 12.50% 12.00% 12.00% 11.00% 11.00%12.50% 13.50% 13.50% 14.00% 12.00% 11.50% 13.00% 12.50% 12.50% 13.00%13.00% 12.50% 13.00%12.26%11.00% 13.50% 12.50% - 11.00% 12.00% - 9.75% 13.00% 12.00% 12.00% 11.25% 11.00%12.50% 13.00% 13.25% 14.00% 12.00% 11.50% 12.00% 12.50% 12.50% 12.00%12.50% 12.50% 13.00%12.22%
8.00% 9.50% 8.75% - 9.50% 10.50% 8.00% 7.50% 9.00% - 8.25% 8.75% 9.50%10.50% 8.75% 10.50% 9.75% 8.50% 10.00% 7.75% 8.50% 8.50% 6.60% 9.00% - 7.75% 9.17%8.00% 9.50% 9.00% 9.50% 9.00% 10.00% 7.50% 8.50% 8.50% 8.50% 8.25% 8.75% 9.50%10.50% 10.00% 11.15% 9.50% 8.25% 9.50% 8.00% 8.50% 8.50% 8.30% 9.25% 9.50% 8.75% 9.24%7.00% 9.00% 9.00% - 9.00% 9.50% 8.50% 7.75% 7.50% 6.50% - 8.50% - 8.00% 8.50% 10.50% 8.30% 8.75% 10.50% 7.75% 7.50% 7.50% 6.80% 9.00% 10.50% 8.25% 8.59%7.50% 9.00% 8.00% 8.00% 9.50% 8.50% 8.75% 8.50% 7.75% 8.00% 8.00% 8.75% 9.00% 9.00% 8.75% 10.65% 10.00% 8.25% 10.00% 8.25% 7.75% 7.25% 8.50% 9.00% 9.50% 7.75% 8.86%8.00% 9.00% 8.50% 8.00% 9.50% 9.25% 10.00% 8.50% 8.00% 8.50% 7.50% 8.75% 9.00% 8.50% 8.75% 11.15% 9.75% 7.75% 10.00% 8.25% 8.00% 8.00% 8.00% 9.25% 9.50% 7.50% 8.95%9.00% 10.50% 9.50% - 10.50% 9.75% 8.25% 9.50% 9.00% 8.25% - 9.25% 9.50%10.00% 10.00% 10.60% 11.00% 9.75% 10.00% 8.25% 9.00% 9.00% 8.80% 9.50% 10.00% 10.25% 9.84%9.00% 9.50% 10.00% - 9.00% 10.00% 8.25% 8.50% 8.00% 8.25% 9.00% 8.50% 9.50%10.00% 9.25% 10.75% 10.50% 8.50% 10.00% 8.25% 8.00% 8.00% 8.80% 9.50% 10.50% 10.00% 9.34%8.50% 9.50% 10.00% 8.00% 8.50% 9.50% 9.00% 8.75% 8.50% 8.25% 9.50% 9.00% 9.50% 9.75% 9.25% 10.50% 10.50% 8.50% 10.00% 8.25% 8.50% 8.50% 8.30% 8.25% 10.50% 9.25% 9.30%8.00% 9.50% 10.00% 8.50% 9.50% 10.00% 8.75% 9.00% 9.00% 9.50% 9.50% 9.50% 9.50% 9.75% 11.00% 10.50% 10.75% 9.25% 10.50% 8.50% 9.00% 9.00% 9.60% 9.50% - 10.00% 9.63%8.00% 8.00% 8.50% - 10.50% 8.50% 7.00% 7.00% 6.75% - - 8.50% 9.00% 8.00% 7.25% 10.50% 8.00% 7.25% 9.00% 6.00% 6.75% 6.75% 7.20% 8.50% 9.00% 7.50% 8.22%8.50% 8.50% 8.00% 7.50% 9.00% 8.50% 9.75% 7.25% 6.75% 7.00% 7.25% 8.50% 9.00% 8.25% 8.25% 9.75% 8.00% 7.50% 9.00% 7.50% 6.75% 6.75% 8.30% 8.00% 8.25% 7.50% 8.14%
11.00% 11.50% 10.50% - 9.50% 11.50% 9.50% 9.50% 11.00% - 11.00% 10.50% 10.00%10.75% 11.00% 11.00% 10.50% 10.25% 10.50% 11.50% 10.50% 10.50% 9.50% - - 11.00%10.75%11.00% 11.50% 11.50% 12.00% 9.00% 11.00% 9.50% 9.75% 10.50% 12.50% 10.50% 10.50% 9.50%10.25% 11.50% 11.00% 11.75% 10.75% 11.00% 11.50% 10.50% 10.50% 9.80%11.50% 11.50% 12.00%11.00%11.00% 11.50% 11.00% - 10.50% 11.00% - 9.50% 11.00% 12.50% 11.00% 10.75% 10.00%10.25% 11.00% 11.00% 11.75% 10.75% 11.00% 11.50% 11.00% 11.00% 9.20%11.00% 11.50% 11.75%11.00%
1.00% 0.00% 0.00% - 0.00% 1.50% 3.00% 2.75% 0.00% - 3.00% 2.75% 0.00% 0.00% 1.50% 2.00% 3.00% 2.50% 1.00% 3.00% 0.00% 0.00% 2.50% 2.00% -5.00% 3.00% 1.07%1.00% 0.00% 0.00% 3.00% 2.50% 2.00% 3.25% 7.50% 0.00% 4.00% 3.00% 2.75% 0.00% 0.00% 2.00% 2.50% 3.00% 2.50% 1.00% 3.00% 0.00% 0.00% 3.00% 3.00% 0.00% 2.00% 1.66%1.00% 2.50% 2.50% - 2.50% 3.00% 3.25% 8.25% 3.00% 4.00% 3.00% 2.75% 2.50% 2.50% 3.00% 3.00% 2.50% 2.50% 2.00% 2.00% 3.00% 3.00% 0.00% - 3.00% 2.50% 2.65%1.00% 2.50% 2.50% 5.00% 2.00% 3.25% 3.25% 3.00% 3.00% 4.00% 3.00% 2.75% 2.50% 2.50% 3.00% 3.00% 2.00% 3.00% 2.00% 2.00% 3.00% 3.00% 1.00% 3.00% 3.00% 3.00% 2.57%1.00% 3.00% 2.50% 5.00% 2.00% 3.00% 2.50% 3.00% 3.00% 4.00% 3.00% 2.75% 2.50% 2.50% 3.00% 3.00% 2.00% 3.00% 2.00% 2.00% 3.00% 3.00% 2.00% 3.00% 3.00% 3.00% 2.57%1.00% 1.50% 2.00% - 1.00% 2.00% 3.00% 2.50% 0.00% 2.00% 3.00% 2.75% 0.00% 0.00% 1.00% 2.00% 0.00% 2.50% 3.00% 2.00% 0.00% 0.00% 1.00% 2.00% -2.00% 2.50% 1.26%1.00% 2.50% 2.00% - 1.00% 2.00% 3.00% 3.00% 3.00% 2.00% 3.00% 2.75% 0.00% 0.00% 1.00% 2.00% 0.00% 3.00% 3.00% 2.00% 3.00% 3.00% 1.00% 2.00% 0.00% 2.50% 1.74%1.00% 2.50% 2.00% 5.00% 2.00% 2.00% 2.75% 3.00% 3.00% 2.00% 3.00% 2.75% 0.00% 0.00% 1.00% 2.00% 2.00% 3.00% 3.00% 2.00% 3.00% 0.00% 2.00% 3.00% 0.00% 2.50% 1.97%1.00% 2.50% 2.00% 3.00% 2.00% 2.00% 3.25% 2.75% 0.00% 3.00% 3.00% 2.75% 0.00% 0.00% 0.00% 2.00% 2.00% 2.50% 3.00% 2.00% 0.00% 0.00% 1.00% 2.50% - 2.50% 1.69%1.00% 2.00% 2.00% - 1.00% 3.00% 3.25% 3.00% 4.00% 8.00% 3.00% 2.75% -2.00% 2.00% 3.00% 3.00% 2.00% 3.50% 0.00% 5.00% 4.00% 3.00% 0.00% 4.00% 0.00% 2.50% 2.34%1.00% 2.50% 1.00% 3.00% 2.00% 3.00% 3.50% 3.00% 4.00% 8.00% 3.00% 2.75% -2.00% 1.00% 1.50% 4.00% 2.00% 3.50% 0.00% 5.00% 4.00% 3.00% 0.00% 4.00% 0.00% 2.50% 2.34%1.00% 1.50% 2.00% - 2.00% 4.00% 3.25% 3.25% 2.00% - 3.00% 2.75% 3.00% 3.00% 2.00% 4.00% 4.00% 2.50% 0.00% 4.00% 2.00% 0.00% 2.00% - 0.00% 3.00% 2.03%1.00% 1.50% 2.00% 3.00% 2.00% 4.00% 3.00% 3.00% 2.00% 3.00% 3.00% 2.75% 3.00% 3.00% 1.00% 4.00% 4.00% 2.50% 0.00% 4.00% 2.00% 0.00% 2.00% 2.00% 2.50% 3.00% 2.11%1.00% 1.50% 2.00% - 2.00% 4.00% - 3.25% 2.00% 3.00% 3.00% 2.75% 3.00% 3.00% 1.00% 4.00% 3.00% 2.50% 0.00% 4.00% 2.00% 0.00% 3.00% 2.00% 2.50% 3.00% 2.05%
2.50% 2.50% 3.00% - 2.00% 5.00% 3.25% 3.25% 3.00% - 3.00% 2.75% 3.00% 2.50% 3.00% 3.00% 3.00% 3.00% 3.00% 3.00% 3.00% 3.00% 2.50% 3.00% 2.00% 3.00% 2.84%2.50% 2.50% 3.00% 3.00% 2.00% 4.00% 3.00% 3.00% 3.00% 3.00% 3.00% 2.75% 3.00% 2.50% 3.00% 3.00% 3.00% 3.00% 3.00% 3.00% 3.00% 3.00% 2.50% 3.00% 2.00% 3.00% 2.80%2.50% 2.50% 3.00% - 2.00% 4.00% 3.00% 3.00% 3.00% 3.00% 3.00% 2.75% - 2.50% 2.50% 3.00% 3.00% 3.00% 3.00% 2.00% 3.00% 3.00% 2.50% 3.00% 2.00% 3.00% 2.78%2.50% 2.50% 3.00% 3.00% 1.00% 4.00% 3.00% 3.00% 3.00% 3.00% 3.00% 2.75% 3.00% 2.50% 2.50% 3.00% 3.00% 3.00% 3.00% 2.00% 3.00% 3.00% 2.50% 3.00% 2.00% 3.00% 2.75%2.50% 2.50% 3.00% 3.00% 1.00% 4.00% 2.75% 3.00% 3.00% 3.00% 3.00% 2.75% 3.00% 2.50% 2.50% 3.00% 3.00% 3.00% 3.00% 2.00% 3.00% 3.00% 2.50% 3.00% 2.00% 3.00% 2.74%2.00% 3.00% 3.00% - 1.00% 3.00% 3.00% 3.00% 3.00% 3.00% 3.00% 2.75% 3.00% 2.50% 2.50% 3.00% 2.00% 3.00% 3.00% 2.00% 3.00% 3.00% 2.50% 3.00% 2.00% 3.00% 2.71%2.00% 3.00% 3.00% - 1.00% 3.00% 3.00% 3.00% 3.00% 3.00% 3.00% 2.75% 3.00% 2.50% 2.50% 3.00% 2.00% 3.00% 3.00% 2.00% 3.00% 3.00% 2.50% 3.00% 2.00% 3.00% 2.71%2.00% 3.00% 3.00% 3.00% 1.00% 3.00% 2.75% 3.00% 3.00% 3.00% 3.00% 2.75% 3.00% 2.50% 2.50% 3.00% 2.00% 3.00% 3.00% 2.00% 3.00% 3.00% 2.50% 3.00% 2.00% 3.00% 2.71%2.00% 2.50% 3.00% 3.00% 1.00% 3.00% 3.25% 3.00% 3.00% 3.00% 3.00% 2.75% 3.00% 2.50% 2.50% 3.00% 2.00% 3.00% 3.00% 3.00% 3.00% 3.00% 2.50% 3.00% 0.00% 3.00% 2.70%2.00% 3.00% 3.00% - 1.00% 3.00% 3.00% 3.00% 3.00% 3.00% 3.00% 2.75% 3.00% 2.50% 3.00% 4.00% 2.50% 3.00% 3.00% 3.00% 3.00% 3.00% 2.50% 3.00% 2.50% 3.00% 2.80%2.00% 3.00% 3.00% 3.00% 2.00% 3.00% 3.25% 3.00% 3.00% 3.00% 3.00% 2.75% 3.00% 2.50% 3.00% 4.00% 2.50% 3.00% 3.00% 3.00% 3.00% 3.00% 2.50% 3.00% 2.50% 3.00% 2.82%3.00% 3.00% 3.00% - 1.00% 3.50% 3.00% 3.25% 3.00% - 3.00% 2.75% 3.00% 2.50% 3.00% 4.00% 3.00% 3.00% 3.00% 3.00% 3.00% 3.00% 2.50% 3.00% 0.00% 3.00% 2.70%3.00% 3.00% 3.00% 3.00% 1.00% 3.50% 3.00% 3.00% 3.00% 3.00% 3.00% 2.75% 3.00% 2.50% 3.00% 4.00% 3.00% 3.00% 3.00% 3.00% 3.00% 3.00% 2.50% 3.00% 2.50% 3.00% 2.72%3.00% 3.00% 3.00% - 2.00% 3.50% - 3.25% 3.00% 3.00% 3.00% 2.75% 3.00% 2.50% 3.00% 4.00% 3.00% 3.00% 3.00% 3.00% 3.00% 3.00% 2.50% 3.00% 2.50% 3.00% 2.78%
$35.00 $15.00 $35.00 - $6.00 $25.00 $20.00 $40.00 $15.00 - $20.00 $30.00 $20.00 $25.00 $15.00 $22.00 $18.00 $35.00 $15.00 $40.00 $15.00 $15.00 $20.00 $10.00 - $40.00 $22.85$20.00 $15.00 $25.00 $50.00 $8.00 $20.00 $25.00 $25.00 $15.00 $25.00 $15.00 $20.00 $20.00 $20.00 $15.00 $15.00 $15.00 $27.00 $14.00 $30.00 $15.00 $15.00 $20.00 $8.00 $10.00 $15.00 $19.71$20.00 $25.00 $12.00 - $4.00 $25.00 $5.00 $15.00 $15.00 $5.00 - $20.00 $40.00 - $10.00 $9.00 - $20.00 $20.00 - $15.00 $15.00 - - - $5.00 $13.14$15.00 $25.00 $8.00 - $2.00 $5.00 $2.00 $7.00 $5.00 $2.00 $2.00 - $10.00 - $10.00 $4.00 - $10.00 $10.00 $3.00 $5.00 $5.00 $6.00 $5.00 $15.00 $5.00 $7.88$15.00 $25.00 $5.00 - $2.00 $5.00 - $2.50 $5.00 $2.00 $2.00 - $10.00 - $10.00 $5.00 - $10.00 $10.00 $3.00 $5.00 $5.00 $6.00 $5.00 $15.00 $5.00 $7.11$5.00 $5.00 $2.00 - - - - - $5.00 $2.00 - - $2.50 - $0.50 - - $7.00 $2.00 - $5.00 $5.00 - - - - $2.14$5.00 $5.00 $0.50 - - - - $1.00 $0.50 $1.00 $2.00 - $2.50 - $0.50 - - $3.00 - - $0.50 $0.50 - - $0.50 $1.00 $2.14
$10.00 $5.00 $2.00 $20.00 $4.00 - - $1.00 $1.00 $1.00 $10.00 - $5.00 $25.00 $0.50 $2.00 - $5.00 $3.00 - $1.00 $1.00 $1.00 $3.00 $0.50 $2.50 $3.57- $25.00 $5.00 - $10.00 - - $5.00 $10.00 $2.00 $10.00 $10.00 $15.00 - $1.50 $2.00 - $10.00 $10.00 $20.00 $10.00 $10.00 $18.00 $5.00 - $10.00 $6.73
Mia
mi,
FL
Milw
auke
e, W
I
Min
neap
olis
, MN
Napl
es, F
L
Nash
ville
, TN
New
Jer
sey,
Coa
stal
New
Jer
sey,
Nor
ther
n
New
Yor
k, N
Y
Oakl
and,
CA
Oran
ge C
ount
y, C
A
Orla
ndo,
FL
Phila
delp
hia,
PA
Phoe
nix,
AZ
Pitts
burg
h, P
A
Portl
and,
OR
Prov
iden
ce, R
I
Rich
mon
d, V
A
Sacr
amen
to, C
A
San
Anto
nio,
TX
San
Dieg
o, C
A
San
Fran
cisc
o, C
A
San
Jose
, CA
Seat
tle, W
A
Tam
pa, F
L
Tuls
a, O
K
Was
hing
ton,
DC
Aver
ages
TABLE 8 continued
INVESTMENT CRITERIA
VIEWPOINT 2005 INTEGRA REALTY RESOURCES, INC. 7

INVESTMENT CRITERIA
8 INTEGRA REALTY RESOURCES, INC. VIEWPOINT 2005
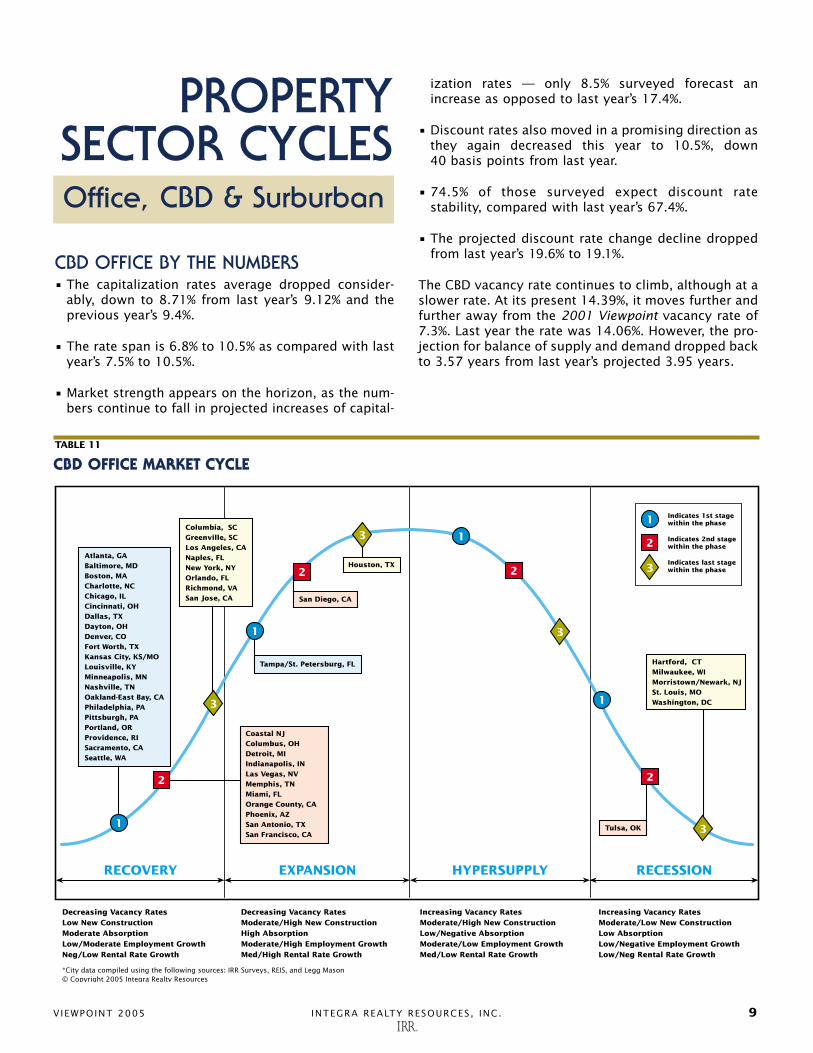
casted absorption figures and employment growthforecasts and by applying standard criteria to each sur-veyed city. The majority of reviewed markets for allproperty types were in various stages of the recession-ary or recovery phases of the market cycle. The viabil-ity of a MSA depends upon where it is in the cycle. If aMSA has entered the last stage of the recessionaryphase, it is expected that it will begin its recovery bythe end of the year.
OFFICE MARKET CYCLE 2004In the office sector cycle, many markets in the reces-sionary phase in last year’s report have moved into thefirst phase of recovery, including Boston, Chicago,Dallas, Minneapolis and Pittsburgh. Hartford,Milwaukee and St. Louis are those still stuck in the thirdphase of the recessionary stage. Houston, Tampa,
St. Petersburg and San Diego are all in some stage ofexpansion in the office property sector.
RETAIL MARKET CYCLE 2004Kansas City and Orange County have moved into thefirst phase of expansion for the retail property sector.Last year, Kansas City was in the third phase of reces-sion in this sector. The majority of the markets are invarious stages of the expansion or recovery phaseswith many more in the hypersupply phase. Last year,Austin was the lone MSA in the hypersupply phase.
APARTMENT MARKET CYCLE 2004
In the apartment sector cycle, Washington, D.C., Hartford,Miami, Austin, Boston, St. Louis and Tulsa are in the hyper-supply phase. Last year no markets were in this phase.
INDUSTRIAL MARKET CYCLE 2004The majority of markets in the industrial property sec-tor are in various stages of recovery/expansion. Onlytwo markets are in hypersupply including Ft. Worth andAtlantic City, which was in this phase last year.Indianapolis, St. Louis and Tampa moved out of therecessionary phase.
CAPITALIZATION AND DISCOUNT RATESAlthough no crystal ball, capitalization and discountrates are important signposts on the real estate invest-ment landscape. When capitalization rates increase,caution is warranted. However, a drop in initial capital-ization rates usually indicates strength in future dura-bility, net income growth, capital costs and overall risks.Other factors in the macro-economic environment canskew this standard barometer, so it is wise to take ahard look at the declining rates to determine if they arebased on strong fundamentals or other market condi-tions. Caution is warranted here and IRR representativescan help you analyze any current market anomalies.
Discount rates are the annualized rates or expectedrates of return for property investments and they alsoprovide clues about the weakness or strength of a mar-ket. Basically, overall risk decreases when discountrates fall and risk increases as rates move up.
OVERALL YIELD RATESLast year’s projected capitalization rates were on aver-age 74.3% stable with 17.8% declining and 7.9%increasing. This year it hasn’t changed much with71.7% stable, 18.9% declining and 9.4% increasing.
The discount rates’ year-to-year change was greater. Lastyear IRR projected discount rates at 75.4% stable, 18.6%declining and 6% increasing. This year, the projectionsare 73.2% stable with 17.8% declining and 9% increasing.
PROJECTED DISCOUNT RATE CHANGEProperty Type Decline (%) Increase (%) Stable (%)
CBD Office 19.1 6.4 74.5Suburban Office 24.5 6.1 69.4Regional Mall 17.8 11.1 71.1Community Mall 16.3 10.2 73.5Neighborhood Strip 16.3 12.2 71.4Manufacturing 8.5 14.9 76.6Bulk 10.4 4.2 85.4Office/Warehouse 26.5 6.1 67.3R&D 16.7 6.3 77.1Urban Multi Family 10.6 17.0 72.3Suburban Multi Family 14.3 16.3 69.4CBD Lodging 21.3 6.4 72.3Suburban Lodging 22.9 4.2 72.9Airport Lodging 23.9 4.3 71.7AVERAGE 17.8 9.0 73.2
2004 DISCOUNT RATE RANKS2004 2004 Low 2004 High 2004 Avg.Rank Property Type (%) (%) (%)
1 Urban Multi Family 8.3 12.5 9.72 Suburban Multi Family 8.3 12.0 9.73 Regional Mall 8.0 12.0 9.94 Community Mall 8.5 12.5 10.15 Neighborhood Strip 8.5 12.5 10.26 CBD Office 8.5 12.5 10.57 Office/Warehouse 8.5 12.5 10.48 Bulk 8.5 14.0 10.59 Suburban Office 9.0 13.3 10.5
10 R&D 9.0 13.0 10.911 Manufacturing 8.8 14.0 11.012 CBD Lodging 9.5 14.0 12.013 Airport Lodging 9.3 14.0 12.214 Suburban Lodging 9.3 14.0 12.3
TABLE 9
TABLE 10
CBD OFFICE BY THE NUMBERS• The capitalization rates average dropped consider-
ably, down to 8.71% from last year’s 9.12% and theprevious year’s 9.4%.
• The rate span is 6.8% to 10.5% as compared with lastyear’s 7.5% to 10.5%.
• Market strength appears on the horizon, as the num-bers continue to fall in projected increases of capital-
ization rates — only 8.5% surveyed forecast anincrease as opposed to last year’s 17.4%.
• Discount rates also moved in a promising direction asthey again decreased this year to 10.5%, down 40 basis points from last year.
• 74.5% of those surveyed expect discount rate stability, compared with last year’s 67.4%.
• The projected discount rate change decline droppedfrom last year’s 19.6% to 19.1%.
The CBD vacancy rate continues to climb, although at aslower rate. At its present 14.39%, it moves further andfurther away from the 2001 Viewpoint vacancy rate of7.3%. Last year the rate was 14.06%. However, the pro-jection for balance of supply and demand dropped backto 3.57 years from last year’s projected 3.95 years.
VIEWPOINT 2005 INTEGRA REALTY RESOURCES, INC. 9
PROPERTYSECTOR CYCLESOffice, CBD & Surburban
RECOVERY EXPANSION HYPERSUPPLY RECESSION
Decreasing Vacancy RatesLow New ConstructionModerate AbsorptionLow/Moderate Employment GrowthNeg/Low Rental Rate Growth
Tulsa, OK
Indicates 1st stagewithin the phase
Indicates 2nd stagewithin the phase
Indicates last stagewithin the phase
1
2
3
Hartford, CTMilwaukee, WIMorristown/Newark, NJSt. Louis, MOWashington, DC
Decreasing Vacancy RatesModerate/High New ConstructionHigh AbsorptionModerate/High Employment GrowthMed/High Rental Rate Growth
Increasing Vacancy RatesModerate/High New ConstructionLow/Negative AbsorptionModerate/Low Employment GrowthMed/Low Rental Rate Growth
Increasing Vacancy RatesModerate/Low New ConstructionLow AbsorptionLow/Negative Employment GrowthLow/Neg Rental Rate Growth
*City data compiled using the following sources: IRR Surveys, REIS, and Legg Mason© Copyright 2005 Integra Realty Resources
Coastal NJColumbus, OHDetroit, MIIndianapolis, INLas Vegas, NVMemphis, TNMiami, FLOrange County, CAPhoenix, AZSan Antonio, TXSan Francisco, CA
Atlanta, GABaltimore, MDBoston, MACharlotte, NCChicago, ILCincinnati, OHDallas, TXDayton, OHDenver, COFort Worth, TXKansas City, KS/MOLouisville, KYMinneapolis, MNNashville, TNOakland-East Bay, CAPhiladelphia, PAPittsburgh, PAPortland, ORProvidence, RISacramento, CASeattle, WA
3
2
1
1
2
3 1
2
3
1
2
3
Tampa/St. Petersburg, FL
Houston, TX
San Diego, CA
Columbia, SCGreenville, SCLos Angeles, CANaples, FLNew York, NYOrlando, FLRichmond, VASan Jose, CA
TABLE 11
CBD OFFICE MARKET CYCLE

PROPERTY SECTORS – OFFICE, CBD & SURBURBAN
10 INTEGRA REALTY RESOURCES, INC. VIEWPOINT 2005
4
5
6
7
8
9
10
11
1994 1995 1996 1997 1998 1999 2000 2002
Office CBD10 Year Treasury (January Avg.)
Year
Per
cent
age
2001
3
2
120042003
10 Year Treasury (Annual Avg.)
TABLE 12
CAP RATE TRENDS—CBD OFFICE
Inventory grew. This year it was 1.37 billion squarefeet, as compared with last year’s 1.35 billion squarefeet. Development in the pipeline for 2004 – 2007 is 46million square feet. Last year about 54.6 million squarefeet in office space was under development for theperiod of 2003 – 2006.
QUICK MARKET GLANCE• CBD office continues to hold 6th place in the cap rate
ranks, but has moved up one slot in the discount rate ranks, from 7th to 6th.
• The continuing upward trend of vacancy rates, eventhough it appears to be slowing a bit, discouragesany thoughts of a quick turnaround in this sector, buta market recovery is on the horizon. Perhapsinvestors think it has bottomed out and are buyingon higher than normal vacancy rates.
• Although moving away from the projection to reachequilibrium in almost four years, it at last seems tobe moving in the right direction.
• The corporate hiring moratorium seems to be a stub-born mainstay of today’s economy and it will have toshake loose before this sector begins to fire on allcylinders.
• This sluggishness holds on in many MSA’s throughoutthe nation, with a few tentative bright spots, offeringa glimpse at a more promising future trend.
– In the Los Angeles market, recent construction anddevelopment have accelerated, but the anticipatedamount of available space expected within the nexttwo years is still considered minimal so the marketwill tighten up somewhat. However, the reductionof government employment will put a drag onabsorption of space in the market.
– In Miami, vacancy continues to decline and thetrend of slightly increased lease rates is expectedto continue for the next two years.
– The downtown Seattle market is steadily improv-ing, although gradually. In the third quarter, thedowntown Bellevue market improved significantlywhen three large tenants relocated to the area.
• Growth in low-wage and service sector jobs justwon’t pull this sector out of the doldrums. UntilCorporate America sees enough growth on the hori-zon to ignore escalating health care costs and beginsto generate jobs, recovery in this sector isn’t going tosurprise anyone with any speed records. In this sec-tor, the follow-up to the age-old maxim of “nothingever happens until someone sells something” is“nothing will really happen until someone hiressomeone.”
© 2005 Integra Realty Resources

VIEWPOINT 2005 INTEGRA REALTY RESOURCES, INC. 11
TABLE 13
OFFICE MARKET CONDITIONS AND FORECASTS: Central Business DistrictTOTAL FORECAST TOTAL FORECAST
AVG. ANNUAL UNDER AVG. ANNUAL VALUE TOTAL VALUE EST.VACANCY NET ABSORP. CONST. NET ABSORP. CHANGE CHANGE YEARS
INVENTORY1 RATE1 VACANCY1 2001-20041 2004-20071 2005-20071 2001-2004 2005-2007 TOMARKET AREA (SQ. FT.) (%) (SQ. FT.) (SQ. FT.) (SQ. FT.) (SQ. FT.) (%) (%) BALANCE
Atlanta, GA 15,500,000 19.50 3,022,500 -370,250 441,000 500,000 -9.50 4.10 3Austin, TX 8,456,130 23.40 1,978,734 6,391 1,391,970 217,333 -1.00 -5.00 3Baltimore, MD 19,069,000 13.00 2,478,970 44,500 725,000 225,000 9.00 7.00 3Boston, MA 60,000,000 15.00 9,000,000 -472,500 1,500,000 533,333 -10.00 5.00 3Charlotte, NC 14,295,000 9.00 1,286,550 337,250 3,927,000 340,000 -8.00 15.00 2Chicago, IL 115,400,000 15.93 18,378,000 -539,500 4,150,000 1,512,333 0.00 3.50 5Cincinnati, OH 13,000,000 13.00 1,690,000 -70,000 580,000 166,667 3.50 3.00 1.5Cleveland, OH 20,543,000 21.80 4,478,374 -402,250 0 319,333 - - -Columbia, SC 5,526,000 18.50 1,022,310 2,500 370,000 100,000 -8.00 0.00 4Columbus, OH 9,350,000 14.00 1,309,000 -14,750 160,000 225,000 -5.00 5.00 3Dallas, TX 33,299,499 27.70 9,223,961 -121,944 0 - -30.00 3.00 4Dayton, OH 7,124,295 14.30 1,018,774 44,755 20,000 1,667 7.00 6.00 1Denver, CO 23,300,000 17.00 3,961,000 -582,500 0 283,333 0.00 6.00 5Detroit, MI 13,000,000 23.00 2,990,000 -383,500 100,000 28,333 -1.00 0.00 7Fort Worth, TX 10,218,202 7.60 776,583 255,906 1,300,000 101,077 -10.00 6.00 1Hartford, CT 7,547,882 24.00 1,811,492 -40,858 93,000 -50,000 -5.00 0.00 5Houston, TX 43,300,000 22.00 9,526,000 -986,165 690,000 900,000 15.00 0.00 4Indianapolis, IN 10,328,000 16.00 1,652,480 51,250 0 0 1.00 1.00 2.5Kansas City, KS/MO 13,550,000 22.00 2,981,000 -140,000 500,000 166,667 -15.00 15.00 5Las Vegas, NV 2,960,151 5.20 153,928 83,000 392,000 50,000 9.00 6.00 1Los Angeles, CA 35,169,581 19.50 6,858,068 -401,512 697,000 557,535 10.00 4.00 5Louisville, KY 10,300,000 24.70 2,544,100 -20,486 380,000 166,667 -2.00 3.00 2Memphis, TN 2,792,870 22.90 639,567 -44,453 50,000 10,000 0.00 2.00 3Miami, FL 6,700,000 14.00 938,000 -28,889 0 74,500 - - 2.5Milwaukee, WI 11,931,000 14.70 1,753,857 -45,750 220,000 23,333 -7.00 0.00 4Minneapolis, MN 24,786,000 19.80 4,907,628 -505,750 941,000 665,667 3.00 1.00 5Nashville, TN 5,800,000 15.00 870,000 56,250 80,000 16,667 0.00 0.00 6New Jersey, Coastal 4,500,000 9.00 405,000 0 310,000 100,000 -10.00 5.00 -New Jersey, Northern 42,000,000 15.70 6,594,000 400,000 0 1,800,000 8.00 6.00 5New Orleans, LA 14,024,000 17.50 2,454,200 -44,000 0 -10,333 - - -New York, NY 365,000,000 10.50 38,325,000 -1,388,000 7,400,000 12,933,333 27.00 12.00 4Oakland, CA 12,139,000 13.03 1,582,000 179,000 177,000 145,667 0.00 10.00 4Orlando, FL 6,270,000 11.00 689,700 10,179 1,340,000 185,333 13.55 9.05 1Philadelphia, PA 54,464,441 11.50 6,263,411 -449,075 1,800,000 -262,018 7.00 0.00 5Phoenix, AZ 5,500,000 15.00 825,000 147,500 0 46,667 3.00 3.00 2Pittsburgh, PA 26,700,000 18.00 4,806,000 -295,000 460,000 133,333 -12.00 0.00 5Portland, OR 17,096,519 12.80 2,188,354 -158,987 40,980 200,000 2.50 7.50 2.5Providence, RI 6,200,000 9.70 601,400 - 300,000 116,667 6.00 6.00 3Richmond, VA 8,250,000 14.00 1,155,000 53,750 1,050,000 50,000 6.00 4.00 2Sacramento, CA 11,000,000 14.00 1,540,000 -6,500 360,000 150,000 9.00 2.00 2Salt Lake City, UT 7,612,000 16.10 1,225,532 -101,000 56,000 129,667 - - -San Antonio, TX 5,324,000 22.10 1,176,604 -146,000 0 134,667 12.50 10.00 4San Diego, CA 9,503,000 11.00 1,045,330 -79,000 1,299,000 288,667 30.00 10.00 1San Francisco, CA 49,673,000 16.72 8,305,000 -1,409,000 70,000 511,333 -5.00 10.00 5San Jose, CA 8,640,000 17.12 1,479,000 -194,500 149,000 243,667 -10.00 15.00 5Seattle, WA 43,184,820 14.11 6,091,229 25,716 2,174,500 780,000 30.00 20.00 4St. Louis, MO 11,982,000 19.80 2,372,436 -210,000 0 -42,000 - - -Tampa, FL 7,120,000 18.00 1,281,600 -94,268 1,750,000 258,333 5.50 6.00 2Tulsa, OK 7,900,000 24.50 1,935,500 -148,649 0 33,333 0.00 2.50 10Washington, DC 105,000,000 7.50 7,875,000 1,497,500 8,856,000 2,337,333 11.00 5.50 -
Total: Simple Avg Total: Total: Total: Total: Average: Average: Average:1,372,329,390 16.22 197,467,173 -6,335,729 46,300,450 27,398,094 1.78 5.20 3.57
Weighted Avg:14.39
1 Italicized Inventory (i.e. blue), Vacancy, Absorption and Under Construction figures were provided by REIS, Inc. 212-921-1122.

12 INTEGRA REALTY RESOURCES, INC. VIEWPOINT 2005
OFFICE MARKET CONDITIONS AND FORECASTS: Surburban Market AreaTOTAL FORECAST TOTAL FORECAST
AVG. ANNUAL UNDER AVG. ANNUAL VALUE TOTAL VALUE EST.VACANCY NET ABSORP. CONST. NET ABSORP. CHANGE CHANGE YEARS
INVENTORY1 RATE1 VACANCY1 2001-20041 2004-20071 2005-20071 2001-2004 2005-2007 TOMARKET AREA (SQ. FT.) (%) (SQ. FT.) (SQ. FT.) (SQ. FT.) (SQ. FT.) (%) (%) BALANCE
Atlanta, GA 120,000,000 19.60 23,520,000 475,000 3,922,000 1,833,333 -15.50 4.10 4Austin, TX 28,751,936 20.40 5,864,842 -479,534 352,672 733,333 -25.00 0.00 4Baltimore, MD 55,244,000 12.10 6,684,524 1,017,802 2,300,000 800,000 9.00 7.00 4Boston, MA 92,500,000 17.73 16,400,000 -1,837,500 2,100,000 666,667 -15.00 5.00 3Charlotte, NC 25,124,000 19.39 4,872,362 719,250 5,126,346 333,333 -13.00 5.00 4Chicago, IL 102,000,000 19.82 20,215,000 -2,730,500 1,707,000 1,869,000 5.00 6.00 5Cincinnati, OH 18,605,000 19.15 3,562,150 -216,250 2,050,000 483,333 1.50 4.00 2Cleveland, OH 16,557,000 18.30 3,029,931 81,500 672,500 349,000 - - -Columbia, SC 4,875,000 24.00 1,170,000 111,250 275,000 91,667 -10.00 0.00 5Columbus, OH 22,300,000 15.25 3,400,000 -156,750 975,000 556,667 -3.00 5.00 3Dallas, TX 169,311,978 20.85 35,302,669 -1,628,540 3,611,667 177,791 -20.00 0.00 3Dayton, OH 14,060,696 12.85 1,806,485 163,621 145,000 30,000 7.00 6.00 1Denver, CO 63,000,000 24.06 15,160,500 -482,750 4,300,000 1,000,000 0.00 6.00 4Detroit, MI 55,350,000 17.87 9,890,250 -962,401 1,750,000 -300,000 - 5.00 5Fort Worth, TX 39,620,070 14.06 5,572,398 220,321 1,101,293 644,667 -20.00 3.00 2Hartford, CT 16,280,796 16.45 2,678,432 -193,910 0 66,667 -10.00 0.00 5Houston, TX 170,177,000 14.92 25,391,730 669,124 940,000 2,500,000 10.00 5.00 1Indianapolis, IN 18,982,000 19.27 3,658,480 240,250 612,000 444,000 3.00 2.00 2.5Kansas City, KS/MO 27,350,000 18.91 5,173,000 -352,908 1,000,000 366,667 -15.00 10.00 4Las Vegas, NV 29,326,788 9.45 2,772,703 1,885,530 8,200,000 1,683,333 15.00 10.00 1Long Island, NY 46,200,000 10.80 4,989,600 460,000 935,000 475,000 14.00 9.00 3Los Angeles, CA 138,038,662 14.17 19,557,584 -1,047,888 2,178,947 2,078,798 11.00 6.00 2Louisville, KY 13,000,000 19.06 2,477,200 84,528 2,350,000 333,333 -4.00 3.00 2Memphis, TN 14,584,343 16.94 2,470,545 17,458 483,866 466,667 0.00 4.00 2Miami, FL 33,300,000 15.33 5,105,000 12,477 1,657,000 613,000 - - 2.5Milwaukee, WI 15,284,000 18.68 2,855,654 -108,750 100,000 33,333 -7.00 0.00 4Minneapolis, MN 43,661,000 18.30 7,988,140 -318,750 312,000 450,667 4.00 1.00 5Naples, FL 5,605,797 9.53 534,064 141,178 579,000 250,000 10.00 12.00 2Nashville, TN 19,400,000 15.08 2,926,250 242,547 930,000 216,667 7.50 5.00 1New Jersey, Coastal 17,721,765 12.24 2,168,275 -422,500 950,000 283,333 -8.00 3.00 2New Jersey, Northern 201,000,000 14.20 28,542,000 1,925,000 1,200,000 2,533,333 7.00 2.00 4New Orleans, LA 7,505,000 8.50 637,925 -14,750 620,000 168,000 - - -Oakland, CA 48,066,000 14.79 7,111,000 -481,000 673,000 839,333 0.00 10.00 4Orange County, CA 126,622,198 10.41 13,177,453 813,399 2,795,000 1,898,333 15.00 10.00 1Orlando, FL 24,153,000 16.54 3,994,327 711,196 2,859,000 832,667 10.60 7.10 1Philadelphia, PA 90,679,493 17.62 15,978,643 -328,411 3,329,445 638,693 5.00 6.00 2Phoenix, AZ 50,380,000 19.98 10,064,000 1,327,500 6,000,000 1,200,000 3.00 3.00 4Pittsburgh, PA 47,900,000 17.72 8,487,880 3,300 500,000 333,333 -4.00 4.00 3Portland, OR 24,281,137 16.03 3,892,948 343,880 1,987,973 750,000 -5.00 5.00 3.5Providence, RI 5,750,000 9.50 546,250 - 550,000 95,000 12.00 10.00 3Richmond, VA 17,550,000 11.24 1,973,250 118,750 1,240,000 270,000 10.00 6.00 2Sacramento, CA 37,075,000 14.11 5,231,250 356,250 4,050,000 1,150,000 11.00 2.00 2Salt Lake City, UT 17,788,000 19.30 3,433,084 -79,500 993,000 551,000 - - -San Antonio, TX 20,437,000 17.70 3,617,349 -201,706 841,000 614,000 12.50 10.00 4San Diego, CA 38,481,000 13.46 5,177,990 318,250 2,328,000 1,174,000 30.00 10.00 1San Francisco, CA 74,676,000 20.14 15,040,000 -354,750 554,000 1,340,667 -12.50 10.00 5San Jose, CA 56,634,000 15.97 9,044,000 -775,250 146,000 1,187,000 -10.00 15.00 5Seattle, WA 50,200,829 14.92 7,491,300 -209,692 677,083 733,333 -8.00 25.00 3St. Louis, MO 33,026,000 18.30 6,043,758 92,750 1,109,000 859,333 - - -Tampa, FL 33,555,000 16.02 5,375,293 999,326 2,350,000 250,000 7.00 6.00 2Tulsa, OK 12,000,000 17.23 2,067,500 -55,513 0 100,000 0.00 2.50 5Washington, DC 202,850,000 13.58 27,538,650 2,602,500 13,723,000 4,040,000 5.50 4.00 2
Total: Simple Avg Total: Total: Total: Total: Average: Average: Average:2,656,821,488 16.19 431,663,618 2,714,436 100,141,792 41,088,283 0.45 5.82 3.01
Weighted Avg:16.25
TABLE 14
1 Italicized Inventory (i.e. blue), Vacancy, Absorption and Under Construction figures were provided by REIS, Inc. 212-921-1122.

PROPERTY SECTORS – OFFICE, CBD & SURBURBAN CRITERIA
VIEWPOINT 2005 INTEGRA REALTY RESOURCES, INC. 13
SUBURBAN OFFICE BY THE NUMBERS• Capitalization rates continue to fall, decreasing from
last year’s 9.2% to this year’s 8.79%.
• Projected declines rose to 22.4% from last year’s18.8%.
• The discount rate average continues to decrease witha drop to 10.5% from last year’s 10.9%.
The vacancy rates took a decidedly welcome downwardturn, but it was still far from the 8.6% of four years ago.This year’s 16.25% is a decrease from both last year’s16.76% and the previous year’s 16.66%. Inventory lev-els were just a bit higher from last year’s 2.6 billion atalmost 2.66 billion square feet.
Suburban office space in the development pipelinemoved upwards to 100 million square feet from lastyear’s 93.8 million square feet under construction.However, it’s well under the radar of the 246 millionsquare feet reported in Viewpoint 2001.
This constriction of future supply alleviates some of thepressure in this sector, supporting the drop in the timespan to reach equilibrium. Last year’s estimated yearsto balance were 3.48 years and this year, the projectedyears to balance are 3.01 years.
QUICK MARKET GLANCE• Suburban again held down 8th place in the cap rate
ranks chart.
• Equilibrium moves closer, but tenants are still favoredwith a beneficial negotiating environment.
• Healthy discipline in controlling supply will aid thissector. Once demand returns, supply will be in bal-ance.
• The Tulsa suburban office submarket is showing asign of recovery as absorption was positive in 2004.The average vacancy rate also decreased in the sub-urban market.
• Tampa Bay is also experiencing a strengthening sub-urban office market with increasing rental rates andlower vacancies. The previous glut of sublease spacehas dissipated except for negative absorption of callcenter space. The Westshore office district, thelargest in Florida, is particularly strong and demandfor owner-occupied buildings has soared, with someprices over $200 per square feet.
4
5
6
7
8
9
10
11
1994 1995 1996 1997 1998 1999 2000 2002
10 Year Treasury (January Avg.)
Year
Per
cent
age
2001
3
2
1
Office Sub
20042003
10 Year Treasury (Annual Avg.)
TABLE 15
CAP RATE TRENDS—SURBURBAN OFFICE
© 2005 Integra Realty Resources

14 INTEGRA REALTY RESOURCES, INC. VIEWPOINT 2005
Last November, voters made the gaming equipmentmakers the real winners in several significant elec-tions.
• Voters passed the expansion of gaming in threestates. Florida, Oklahoma and Wisconsin all passedgaming initiatives.
• Voters in Florida approved the legalization of slotmachines at both Jai Alai games and racetracks.
• However, the voters in both Miami-Dade and BrowardCounties still need to pass a referendum early in2005 to secure the vote. If all goes as planned, theslot machines should be showing up in Florida some-time in early 2006.
• Oklahoma voters passed a proposal to allow race-tracks to have slot machines.
• Wisconsin voted to allow tribal casinos to developgaming properties on acquired land.
• California voters shot down two separate initiativesthat would have expanded Indian gaming. The indi-vidual tribes are trying to negotiate with the new gov-ernor on their individual pacts. They want to increaseslot machine numbers currently allowed. California isone of the strongest, if not the most explosive gam-ing market.
• Therefore, 46 states have some form of legalizedgaming and 35 states allow electronic gamingdevices. The American Gaming Association (AGA)reports legal gaming reported $73 billion spent byestimates of gross gaming revenue. The largest com-ponent is commercial casinos.
As of October 10, 2004, Nevada statewide reported a$10,189,484,000 win for all nonrestricted gaming loca-tions for 2004 thru August 31, 2004. This is up 6.59%.Total gaming win for the strip was up 8.08%. Nevadacasinos reported their best ever August winnings at$905.1 million. This is up 11.2% over the same monthlast year. September was $924.8 million, a 10% gainfrom last year.
Las Vegas has the 10 largest hotels in the United States.The average occupancy level overall is 88%. By 2006, thetotal room count will be approximately 140,000 rooms.
The new Wynn Resort is planned to open in April of2005. Sheldon Adelson is also building a new resortbetween the Venetian and the new Wynn property.
MGM Mirage announced a multi-billion dollar “UrbanMetropolis” on the strip between Bellagio and theMonte Carlo.
This will be a 66-acre project featuring an 18 millionsquare foot phase one. The resort will include a 4,000-room hotel and casino, three 400-room boutique hotelsand a 1,550-condominium development. There is also a550,000 square foot retail and entertainment spaceplanned. The first phase will cost approximately $4 bil-lion and create 7,000 construction jobs, and then12,000 permanent jobs. MGM Mirage states it shouldbe completed by 2010.
Interest has again peaked to see the latest and greatesthotels. The new financial sheets show that gamingincome as a percentage of total income is continuouslyhaving less of the total pie, as the other portions ofbusiness (dining, rooms, entertainment and retail) con-tinue to increase their contribution to the bottom line.
Atlantic City, New Jersey still maintains the “Avis” positionin the United States gaming industry and continues to tryharder. After a 10-year effort on the part of the redevel-opment agencies, state legislature and gaming industry, in2003 Atlantic City enjoyed opening the first new casinohotel in 13 years. The Borgata Hotel raised the bar andbrought new life to the gaming industry. As we reportedlast year, gaming revenues for the city in 2003 increasedby a modest 2.4%. A significant component of the winshifted from the existing casinos to the Borgata.
The year 2004 saw the first full year of operation forthe Borgata Hotel and the grand opening of the WalkOutlet Center at the foot of the Expressway. Resortsopened the 479-room Rendezvous Tower andShowboat opened a new 544-room tower. Morerecently, in November of this year, the $280-millionHavana Hotel Tower and The Quarter at the TropicanaCasino opened. The Quarter is a Cuban-themed non-gaming venue which features street entertainment,retail shops, restaurants and the IMAX Theatre. TheHavana Tower added an additional 500 rooms to theTropicana Complex which now is the second hotel inAtlantic City to boast over 2,000 hotel rooms. As weforecasted last year, Atlantic City will wrap up 2004with well over 15,000 hotel rooms and over 1,200,000square feet of casino gaming space.
Boosted by the success of the Borgata, anticipationthroughout the city was encouraged dramatically bythe same store sales January to October of 2003 vs.January to October of 2004 which showed a 7.4%growth in gaming revenue from approximately $3.8 bil-lion to $4.1 billion based on Casino Control Com-
PROPERTYSECTOR CYCLES
Gaming

PROPERTY SECTORS – GAMING
VIEWPOINT 2005 INTEGRA REALTY RESOURCES, INC. 15
PROPERTYSECTOR CYCLES
Lodging
As we review national, regional and local lodgingtrends, we will primarily focus on conditionsaffecting the lodging’s specific market area and
competitive set. First, a review of national trends overthe past 10 years for a general perspective of the cycli-cal nature of the lodging industry, and a brief review ofthe anemic conditions surrounding the more recentpast and the current resurgence underway with therecovering economy.
NATIONAL TRENDS A review and comparison of the past 10 to 12 years ofthe industry is a useful tool for understanding thedirection the lodging industry is likely to take in thenear and intermediate term. A 10 year historical per-spective of pertinent lodging statistics compiled bySmith Travel Research for the U.S. lodging industry ispresented below.
mission reports. The Borgata continues to drive successand reports a win as of October 2004 at $528 million,second only to Bally’s win of $549 million for the sameperiod. Bally’s win, which is slightly over 3% higher thanBorgata, however, must be weighted against the realitythat Bally/Claridge Complex provides over 55% moregaming space. We are further impressed by the Borgataperformance in table win which totals over 35% of rev-enue when compared to the industry average inAtlantic City at about 25% of gaming revenue.
Enthusiasm in Atlantic City is running high. The Borgatahas announced plans for a $347 million expansion whichincludes 500 rooms, restaurants and non-gaming facilities.
The best evidence of the Atlantic City confidence is theincreasing investment from operators within the market.One of the commitments is the $9.4 billion Harrah'sacquisition of Caesars Entertainment. Once completed,Harrah's will be operating four world-class casino hotelproperties including Bally's, Caesars, Showboat and, ofcourse, the Harrah's Marina property. Even the new guyon the block, Colony Capital, who operates Resorts willbe closing shortly on their acquisition of the Atlantic CityHilton, a purchase which will include several large tractsof land at the west end of the city.
Atlantic City is even excited about a recently filed bank-ruptcy by the Trump Organization. As stated by DonaldTrump, the three Trump Casinos are in dire need ofmajor renovations and expansion to maintain a com-petitive position in this growing marketplace. Thebankruptcy offers Trump an opportunity to recapitalizeand upgrade the three properties.
Although Atlantic City will never challenge Las Vegas insize, merely for geographic reasons, it is clear that theindustry in Atlantic City will be in a strong second placewith a 2004 gross win close to $4.7 billion. All currentindications are that 2005 could be the year that the citybreaks the $5-billion threshold.
Redevelopment efforts throughout the city are continu-ing and all eyes now are focusing on the re-opening ofthe Million Dollar Pier (formerly Shops at Ocean I). Thisnew non-gaming venue will position the city as a truenational convention hub with gaming and non-gamingopportunities, including over one-million square feet ofnew upscale shopping.
The more we study the industry, the more we recognizethat the gaming industry provides a draw necessary tosupport the upscale hotel, resort, entertainment andshopping venues necessary to attract the Baby Boomersand Generation Xers. Clearly the ability to support andfund world-class boxing and top-line entertainmentwhile providing luxury hotel rooms at moderate pricingare the features that attract American and internationaltravelers to Las Vegas and Atlantic City. Continued
growth in the economy and the building of underlyingfamily wealth should bode well for the gaming industry.
As stated several years ago in the early planning stagesof the Borgata site, the various state initiatives andexpansion of the Indian gaming markets have helpedthe industry by legitimizing recreational gaming andexposing a larger segment of the population to thisform of recreation.
TABLE 16
U.S. LODGING INDUSTRY – KEY STATISTICSSupply Demand Fixed
% % % % ADR % RevPAR % GOP ExpensesChg Chg Occupancy Chg $ Chg $ Chg (RTS)* (RTS)
1992 0.8 2.1 62.6 1.3 59.17 1.5 37.06 2.8 29.5 25.61993 0.4 1.9 63.6 1.6 60.79 2.7 38.64 4.2 30.5 22.81994 1.2 3.1 64.7 1.7 63.19 3.9 40.91 5.9 36.2 24.01995 1.5 2.1 65.1 0.6 66.22 4.8 43.10 5.4 37.0 20.11996 2.4 2.32 64.9 -0.3 70.53 6.5 45.81 6.3 38.2 17.61997 3.6 2.8 64.4 -0.8 74.71 5.9 48.13 5.1 40.3 15.81998 4.2 3.1 63.8 -0.9 78.17 4.6 49.86 3.6 40.2 13.51999 4.1 3.0 63.2 -1.1 81.29 4.0 51.33 2.9 39.2 13.92000 3.1 3.7 63.5 0.6 85.24 4.9 54.15 5.5 40.9 13.52001 2.4 -3.4 60.0 -5.7 84.92 -1.3 50.96 -6.9 37.0 17.72002 1.8 0.8 59.1 -1.0 83.35 -1.5 49.24 -2.5 N/A N/A2003 1.3 1.6 59.2 0.2 83.28 -0.1 49.34 0.2 N/A N/A* Gross operating profit ratio to sales
SOURCE: © 2004 Smith Travel Research

PROPERTY SECTORS – LODGING
16 INTEGRA REALTY RESOURCES, INC. VIEWPOINT 2005
Before 2000, the lodging industry fared well with gen-erally stable occupancy rates and increasing ADR andRevPAR. In particular, IRR – Hospitality identifies severalkey forces that affected the expansion cycle of lodgingassets immediately before 2000 including:
• Improved hotel performance since 1993
• Financing availability at low interest rates
• Demand from real estate investment trusts (REITs)
• Growing economic trends
• Expansion of major franchise affiliations
However, the market sharply declined during the 2000-01 national recession, especially after September 11th.These forces culminated in a deep and protracted eco-nomic downturn following the wars in Afghanistan andIraq; reduced consumer confidence/spending; and cap-ital market instability. A reversal of the past trends sur-faced in late-2002 into early-2003. The following chartshows this observed turnaround. More pronouncedimprovement has been observed through most of2004. The following demonstrates the rate(s) of growthor decline having taken place before and after thedownturn. Note the slope of ADR and OCC lines aremarkedly improved beginning in the latter part of2002, with a slight flattening during 2003, and anothersurge reflecting consistent improving conditionsobserved through May 2004. (As will be noted below,these trends have continued to take place throughSeptember 2004.)
The growth recorded above is a result of an expandingeconomy and improving capital markets, causing amuch-anticipated recovery in the U.S. lodging industry.Actual RevPAR improvement in the first six months of
2004 was 9.5%, as reported by all companies that trackthese statistics, including Smith Travel. ADR increasedin the range of 3.2% during the same period, a growthrate similar to that reported during the post 1990-91recession. In relative terms, this increase is more posi-tive since the rate of inflation is noticeably less post-2003 when compared to the early-1990s. If this trendcontinues through the remainder of 2004 (data avail-able through September 2004 available through SmithTravel projections appears to support these estimates),the rate of recovery in RevPAR will be the highest inalmost 25 years. As a result of this recent and projectedgrowth, hotel operators are expecting a 17.9% increasein operating profits, also the highest rate in about 25 years.
In addition to the above, other major observations inthe broader market are as follows:
• Room occupancy in the Top 25 Markets sector was71.7%, for an increase of almost 6%± over a year ago.Room demand rose nearly 7%.
• The increase in demand during June was common toall regions, all price groups and all location segments.The largest increases were in urban, higher-pricedproperties in the South Atlantic, West South Central,and Pacific regions.
In a “Special Analysis” conducted by STR LodgingReview in August 2004, it was reported “the perfor-mance of the industry in the first six months of the yearshowed improvement in all measures that was greaterthan the pace set in 1993 over 1992 when the industrywas recovering from the last recession.” The compari-son provides support in forecasting market perfor-mance for the subject as historical perspective providesa fundamental basis for near-term future expectations.The following tables infer that the current turnaroundof the lodging industry is more prominent today thanpost-1992.
The improved performance in the first six months of2004 was significantly better than ten years ago, afterthe recession of 1990-1992. However, the industry stillhas room for recovery as there were 81 million morevacant room-nights in hotels during the first six monthsof 2004 when compared to 1993 due to greater exist-ing inventory. Assuming the rooms supply does notsuddenly increase and demand continues to grow atsimilar levels as experienced in the recent past,prospects are excellent during 2005 and 2006. Barringa catastrophic event, the majority of U.S. hotels areexpected to benefit from improving economy and mar-ket conditions.
These industry improvements have resulted in strongerinvestor appetite for hotel property particularly amongfull-service hotels, which also bears striking similarities
1998 1999 2000 2001 20042002 2003
-8
-6
-4
-2
0
2
4
6
8
Occ % ChangeADR % Change
TABLE 17
TOTAL UNITED STATES OCCUPANCY/ADR PERCENT CHANGE12 MONTH MOVING AVERAGE TO MAY 2004
SOURCE: © 2004 Smith Travel
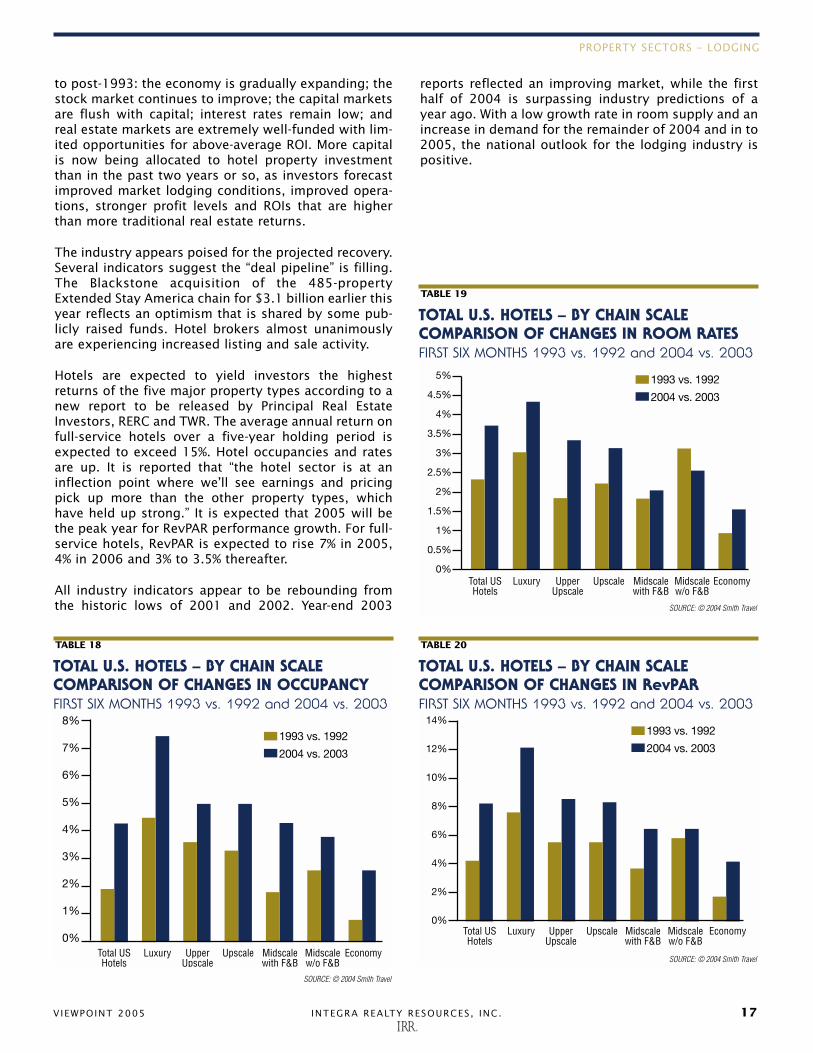
PROPERTY SECTORS – LODGING
VIEWPOINT 2005 INTEGRA REALTY RESOURCES, INC. 17
to post-1993: the economy is gradually expanding; thestock market continues to improve; the capital marketsare flush with capital; interest rates remain low; andreal estate markets are extremely well-funded with lim-ited opportunities for above-average ROI. More capitalis now being allocated to hotel property investmentthan in the past two years or so, as investors forecastimproved market lodging conditions, improved opera-tions, stronger profit levels and ROIs that are higherthan more traditional real estate returns.
The industry appears poised for the projected recovery.Several indicators suggest the “deal pipeline” is filling.The Blackstone acquisition of the 485-propertyExtended Stay America chain for $3.1 billion earlier thisyear reflects an optimism that is shared by some pub-licly raised funds. Hotel brokers almost unanimouslyare experiencing increased listing and sale activity.
Hotels are expected to yield investors the highestreturns of the five major property types according to anew report to be released by Principal Real EstateInvestors, RERC and TWR. The average annual return onfull-service hotels over a five-year holding period isexpected to exceed 15%. Hotel occupancies and ratesare up. It is reported that “the hotel sector is at aninflection point where we’ll see earnings and pricingpick up more than the other property types, whichhave held up strong.” It is expected that 2005 will bethe peak year for RevPAR performance growth. For full-service hotels, RevPAR is expected to rise 7% in 2005,4% in 2006 and 3% to 3.5% thereafter.
All industry indicators appear to be rebounding fromthe historic lows of 2001 and 2002. Year-end 2003
reports reflected an improving market, while the firsthalf of 2004 is surpassing industry predictions of ayear ago. With a low growth rate in room supply and anincrease in demand for the remainder of 2004 and in to2005, the national outlook for the lodging industry ispositive.
8%
7%
6%
5%
4%
3%
2%
1%
0%Total USHotels
Luxury UpperUpscale
Upscale Midscalewith F&B
Midscalew/o F&B
Economy
1993 vs. 1992
2004 vs. 2003
TABLE 18
TOTAL U.S. HOTELS – BY CHAIN SCALE COMPARISON OF CHANGES IN OCCUPANCYFIRST SIX MONTHS 1993 vs. 1992 and 2004 vs. 2003
SOURCE: © 2004 Smith Travel
5%
4.5%
4%
3.5%
2%
1.5%
1%
0%Total USHotels
Luxury UpperUpscale
Upscale Midscalewith F&B
Midscalew/o F&B
Economy
1993 vs. 1992
2004 vs. 2003
3%
2.5%
0.5%
TABLE 19
TOTAL U.S. HOTELS – BY CHAIN SCALE COMPARISON OF CHANGES IN ROOM RATESFIRST SIX MONTHS 1993 vs. 1992 and 2004 vs. 2003
SOURCE: © 2004 Smith Travel
14%
12%
10%
8%
6%
4%
2%
0%Total USHotels
Luxury UpperUpscale
Upscale Midscalewith F&B
Midscalew/o F&B
Economy
1993 vs. 1992
2004 vs. 2003
TABLE 20
TOTAL U.S. HOTELS – BY CHAIN SCALE COMPARISON OF CHANGES IN RevPARFIRST SIX MONTHS 1993 vs. 1992 and 2004 vs. 2003
SOURCE: © 2004 Smith Travel

18 INTEGRA REALTY RESOURCES, INC. VIEWPOINT 2005
RETAIL BY THE NUMBERS• Regional mall capitalization rates decreased to 7.98%
from last year’s 8.46% and the previous year’s 8.7%.
• Regional mall discount rates also fell — to 9.9% fromlast year’s 10.3% and the previous year’s 10.8% average.
• Also decreasing was the community mall capitaliza-tion rate averages to 8.29% from last year’s 8.77% andthe previous year’s 9.3% average.
• The community mall discount rate average fell fromlast year’s 10.6% to this year’s 10.1% average.
• The downward trend continues with the neighbor-hood strip capitalization rate average dropping to8.37% from last year’s 8.9%.
• The discount rate average for neighborhood stripmall category moved down also, decreasing to 10.2%from last year’s average of 10.8%.
Retail inventory is 2.43 billion square feet and thevacancy rate was 7.27%, a drop from last year’s 7.65%.Mall vacancy rates continue to increase — this year’srate is 6.37%, last year’s was 6.22% and the previousyear’s was 6.1%.
It is expected to take less than a year to reach a balancein this property sector, steady advancement from theprevious two years’ estimates of 1.35 and 1.32 years toequilibrium. The amount in the development pipeline is
PROPERTYSECTOR CYCLES
Retail
RECOVERY EXPANSION HYPERSUPPLY RECESSION
Decreasing Vacancy RatesLow New ConstructionModerate AbsorptionLow/Moderate Employment GrowthNeg/Low Rental Rate Growth
Indicates 1st stagewithin the phase
Indicates 2nd stagewithin the phase
Indicates last stagewithin the phase
1
2
3
Decreasing Vacancy RatesModerate/High New ConstructionHigh AbsorptionModerate/High Employment GrowthMed/High Rental Rate Growth
Increasing Vacancy RatesModerate/High New ConstructionLow/Negative AbsorptionModerate/Low Employment GrowthMed/Low Rental Rate Growth
Increasing Vacancy RatesModerate/Low New ConstructionLow AbsorptionLow/Negative Employment GrowthLow/Neg Rental Rate Growth
*City data compiled using the following sources: IRR Surveys, REIS, and Legg Mason© Copyright 2005 Integra Realty Resources
Atlanta, GAChicago, ILDenver, COMiami, FLProvidence, RIRichmond, VATulsa, OK
Kansas City, KS/MOOrange County, CASan Jose, CASan Francisco, CA
Baltimore, MDColumbus, OHHartford, CTIndianapolis, INLas Vegas, NVLos Angeles, CANew York, NYSeattle, WA
1
2
3
1
2
3 1
2
3
1
2
3
Cincinnati, OHDallas, TXDayton, OHDetroit, MIFort Worth, TXMemphis, TNNaples, FL
Houston, TXSt. Louis, MO
Washington, DC
Austin, TXNashville, TNOakland/East Bay, CAOrlando, FLPortland, ORSan Antonio, TXTampa, FL
Boston, MACoastal NJLouisville, KYMinneapolis, MNMilwaukee, WIMorristown/Newark, NJPhiladelphia, PAPhoenix, AZPittsburgh, PASacramento, CASan Diego, CA
TABLE 21
RETAIL MARKET CYCLE

VIEWPOINT 2005 INTEGRA REALTY RESOURCES, INC. 19
RETAIL MARKET CONDITIONS AND FORECASTS: Central Business Districts and Suburban Market AreasTOTAL FORECAST TOTAL FORECAST GAFO
AVG. ANNUAL UNDER AVG. ANNUAL VALUE TOTAL VALUE EST. SALES GLAVACANCY MALL NET ABSORP. CONST. NET ABSORP. CHANGE CHANGE YEARS PER PER
INVENTORY1 RATE1 VACANCY1 VACANCY 2001-20041 2004-20071 2005-20071 2001-2004 2005-2007 TO HOUSEHOLD2CAPITA3
MARKET AREA (SQ. FT.) (%) (SQ. FT.) RATE (%) (SQ. FT.) (SQ. FT.) (SQ. FT.) (%) (%) BALANCE ($) 2004
Atlanta, GA 69,300,000 7.63 5,287,590 - 948,750 3,425,000 3,000,000 0.00 10.00 3 19.60 26.69Austin, TX 18,128,951 5.25 951,770 6.07 258,274 6,273,718 500,000 0.00 3.00 3 20.14 19.41Baltimore, MD 55,902,000 5.25 2,932,656 6.00 175,250 2,278,000 316,000 6.00 10.00 0 15.83 21.01Boston, MA 152,500,000 4.21 6,426,000 5.00 615,000 8,000,000 2,000,000 15.00 10.00 0 18.48 14.48Charlotte, NC 26,285,000 6.00 1,577,125 4.40 393,250 8,200,000 1,366,667 5.50 5.00 0 15.25 24.93Chicago, IL 109,800,000 7.39 8,109,820 7.75 3,900,000 7,000,000 1,833,333 7.00 5.00 1 17.00 17.98Cincinnati, OH 43,200,000 10.94 4,724,500 9.50 660,750 5,250,000 1,833,333 5.00 5.00 1 16.24 21.19Cleveland, OH 22,668,000 7.20 1,632,096 - 384,250 1,205,000 263,333 - - 2 17.51 20.53Columbia, SC 9,810,000 9.50 931,950 5.50 -47,500 1,000,000 275,000 9.00 8.00 2 17.38 23.30Columbus, OH 45,740,000 11.91 5,447,900 11.00 405,000 4,240,000 1,066,667 15.00 -5.00 3 19.61 24.14Dallas, TX 129,182,803 10.24 13,225,395 8.70 85,053 5,571,760 507,667 15.00 8.00 1 19.88 21.70Dayton, OH 15,195,000 11.65 1,770,801 10.00 4,250 225,000 50,000 9.00 6.00 2 19.42 23.46Denver, CO 81,141,000 9.49 7,703,195 1.00 748,000 8,000,000 2,666,667 8.00 6.00 2 17.81 27.96Detroit, MI 53,410,000 6.41 3,421,650 5.00 112,750 126,000 195,000 7.00 5.00 3 15.07 14.29Fort Worth, TX 75,572,040 9.74 7,360,012 6.60 242,357 1,648,900 275,000 15.00 8.00 1 17.21 22.88Hartford, CT 36,028,000 10.64 3,834,419 5.00 40,550 1,200,000 400,000 10.00 10.00 3 15.56 19.37Houston, TX 139,520,000 14.40 20,085,600 5.00 1,273,000 3,055,000 971,667 15.00 10.00 1 18.62 19.69Indianapolis, IN 16,363,308 11.35 1,857,593 7.20 11,250 2,310,508 248,161 10.00 4.00 2 15.57 21.52Kansas City, KS/MO 45,800,000 7.76 3,554,000 14.00 660,750 1,400,000 400,000 5.00 10.00 4 19.98 25.66Las Vegas, NV 38,755,768 3.76 1,455,867 3.00 604,750 8,700,000 1,750,000 13.00 10.00 0 17.49 22.18Long Island, NY 25,600,000 3.30 844,800 4.00 1,400,000 6,700,000 2,066,667 16.50 11.00 0 - -Los Angeles, CA 58,845,000 3.32 1,954,140 3.50 690,000 4,876,959 642,333 9.00 6.00 0 15.77 12.42Louisville, KY 16,420,000 11.23 1,844,508 10.00 212,250 3,500,000 400,000 9.10 6.00 1 14.62 16.95Memphis, TN 27,859,717 10.14 2,826,171 - 374,366 5,100,000 1,183,333 7.30 4.00 2 16.69 22.23Miami, FL 26,650,000 5.97 1,591,000 4.50 295,000 1,493,000 348,000 8.20 6.60 0 17.20 17.34Milwaukee, WI 12,704,000 7.96 1,010,891 - 70,000 1,082,000 218,333 9.00 6.00 2 16.35 12.67Minneapolis, MN 50,850,000 6.15 3,127,250 4.50 658,250 2,300,000 500,000 33.00 9.00 0 18.79 15.78Naples, FL 9,042,453 3.90 352,397 - 173,438 521,935 275,000 27.00 24.00 0 16.35 25.29Nashville, TN 32,000,000 8.19 2,621,121 4.00 183,500 1,150,000 283,333 9.00 5.00 1 16.30 20.54New Jersey, Coastal 40,230,000 4.40 1,768,200 10.00 2,750,000 4,250,000 833,333 27.00 12.00 0 20.81 18.76New Jersey, Northern 46,900,000 5.61 2,629,000 6.00 1,180,000 6,600,000 2,000,000 11.00 7.00 0 15.50 11.78New Orleans, LA 11,180,000 10.50 1,173,900 - 77,500 659,000 141,333 - - 2.5 14.66 15.67Oakland, CA 30,149,000 4.15 1,251,000 6.00 122,500 848,000 209,000 30.00 8.00 0 16.15 15.63Orange County, CA 39,183,000 2.82 1,104,746 2.00 415,250 1,641,000 331,333 13.00 6.00 0 21.43 22.08Orlando, FL 54,500,000 7.24 3,944,165 10.00 435,500 1,340,000 361,667 12.25 8.00 1 19.37 26.73Philadelphia, PA 57,638,000 8.87 5,114,945 5.00 376,500 2,549,000 699,000 8.50 6.00 1 14.63 19.07Phoenix, AZ 114,240,000 6.52 7,446,800 4.00 1,000,000 8,200,000 1,783,333 15.00 6.00 0 15.45 26.63Pittsburgh, PA 57,350,000 7.28 4,176,700 5.00 -24,500 2,950,000 1,475,000 7.50 4.00 0 13.65 21.17Portland, OR 38,603,896 4.38 1,691,324 5.40 231,198 3,452,195 316,667 8.50 10.00 0 15.28 15.78Providence, RI 20,000,000 9.60 1,920,000 10.00 231,000 575,000 141,667 9.00 9.00 2 13.27 13.36Richmond, VA 32,340,000 7.64 2,470,005 - 105,750 1,520,000 316,667 13.00 8.00 1 17.45 24.79Sacramento, CA 32,410,000 4.66 1,511,250 10.00 512,750 6,100,000 1,300,000 12.00 6.00 0 13.82 18.76Salt Lake City, UT 11,291,000 5.50 621,005 - 125,750 590,000 147,333 - - 0 19.29 17.51San Antonio, TX 37,752,079 13.40 5,058,779 13.00 -16,738 2,610,000 465,000 15.00 10.00 1 15.70 20.16San Diego, CA 82,690,000 2.49 2,055,100 1.60 588,250 1,736,000 360,667 14.30 8.70 0 17.99 20.42San Francisco, CA 20,483,000 7.78 1,594,000 6.00 24,500 778,000 209,333 30.00 8.00 0 21.01 13.20San Jose, CA 23,152,000 2.73 633,000 6.00 141,500 611,000 146,000 25.00 8.00 0 29.38 19.03Seattle, WA 41,600,228 3.56 1,479,665 5.46 142,186 5,190,020 1,050,000 14.00 15.00 0 21.88 14.40St. Louis, MO 24,256,000 7.80 1,891,968 - 214,500 2,183,000 472,667 - - 16.75 22.12Tampa, FL 48,200,000 6.29 3,030,100 - 372,030 4,733,523 386,667 12.00 9.00 0 14.32 21.31Tulsa, OK 15,600,000 10.42 1,625,100 5.00 -128,000 1,400,000 283,333 6.00 4.00 0 15.08 21.27Washington, DC 111,633,300 3.93 4,384,766 5.80 1,251,850 6,755,000 665,333 10.50 7.00 0 17.23 21.11
Total: Simple Avg Total: Average: Total: Total: Total: Average: Average: Average: National Avg2,435,654,543 7.28 177,037,734 6.37 25,661,814 173,103,518 39,930,828 12.32 7.61 0.95 16.26
Weighted Avg:7.27
TABLE 22
1 Italicized inventory, vacancy, absorption and under construction figures were provided by REIS, Inc. 212-921-1122.2 GAFO Sales per Household provided by Claritas Data Services. 1-800-234-5973.3 GLA per Capita provided by the National Research Bureau. 1-800-456-4555
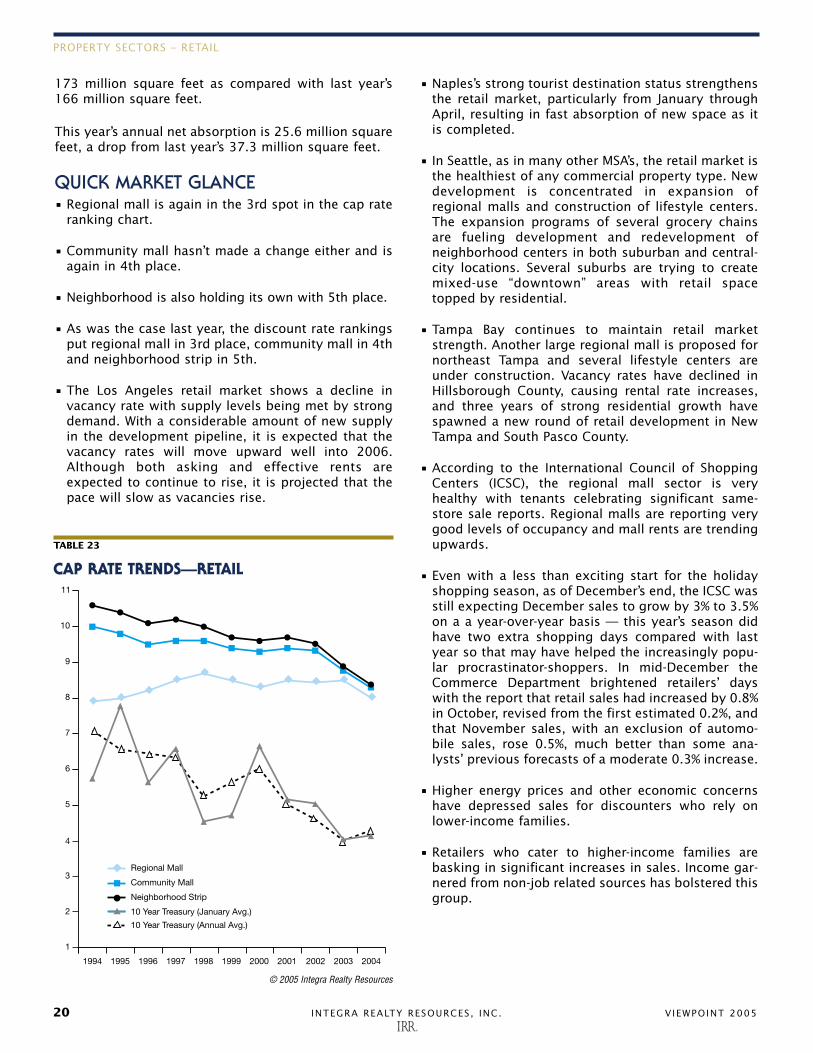
PROPERTY SECTORS – RETAIL
20 INTEGRA REALTY RESOURCES, INC. VIEWPOINT 2005
173 million square feet as compared with last year’s166 million square feet.
This year’s annual net absorption is 25.6 million squarefeet, a drop from last year’s 37.3 million square feet.
QUICK MARKET GLANCE• Regional mall is again in the 3rd spot in the cap rate
ranking chart.
• Community mall hasn’t made a change either and isagain in 4th place.
• Neighborhood is also holding its own with 5th place.
• As was the case last year, the discount rate rankingsput regional mall in 3rd place, community mall in 4thand neighborhood strip in 5th.
• The Los Angeles retail market shows a decline invacancy rate with supply levels being met by strongdemand. With a considerable amount of new supplyin the development pipeline, it is expected that thevacancy rates will move upward well into 2006.Although both asking and effective rents areexpected to continue to rise, it is projected that thepace will slow as vacancies rise.
• Naples’s strong tourist destination status strengthensthe retail market, particularly from January throughApril, resulting in fast absorption of new space as itis completed.
• In Seattle, as in many other MSA’s, the retail market isthe healthiest of any commercial property type. Newdevelopment is concentrated in expansion ofregional malls and construction of lifestyle centers.The expansion programs of several grocery chainsare fueling development and redevelopment ofneighborhood centers in both suburban and central-city locations. Several suburbs are trying to createmixed-use “downtown” areas with retail spacetopped by residential.
• Tampa Bay continues to maintain retail marketstrength. Another large regional mall is proposed fornortheast Tampa and several lifestyle centers areunder construction. Vacancy rates have declined inHillsborough County, causing rental rate increases,and three years of strong residential growth havespawned a new round of retail development in NewTampa and South Pasco County.
• According to the International Council of ShoppingCenters (ICSC), the regional mall sector is veryhealthy with tenants celebrating significant same-store sale reports. Regional malls are reporting verygood levels of occupancy and mall rents are trendingupwards.
• Even with a less than exciting start for the holidayshopping season, as of December’s end, the ICSC wasstill expecting December sales to grow by 3% to 3.5%on a a year-over-year basis — this year’s season didhave two extra shopping days compared with lastyear so that may have helped the increasingly popu-lar procrastinator-shoppers. In mid-December theCommerce Department brightened retailers’ dayswith the report that retail sales had increased by 0.8%in October, revised from the first estimated 0.2%, andthat November sales, with an exclusion of automo-bile sales, rose 0.5%, much better than some ana-lysts’ previous forecasts of a moderate 0.3% increase.
• Higher energy prices and other economic concernshave depressed sales for discounters who rely onlower-income families.
• Retailers who cater to higher-income families arebasking in significant increases in sales. Income gar-nered from non-job related sources has bolstered thisgroup.
1994 1995 1996 1997 1998 2000 2001 2002
Regional Mall
Community Mall
Neighborhood Strip
10 Year Treasury (January Avg.)
1999
4
5
6
7
8
9
10
11
3
2
1
10 Year Treasury (Annual Avg.)
2003 2004
TABLE 23
CAP RATE TRENDS—RETAIL
© 2005 Integra Realty Resources
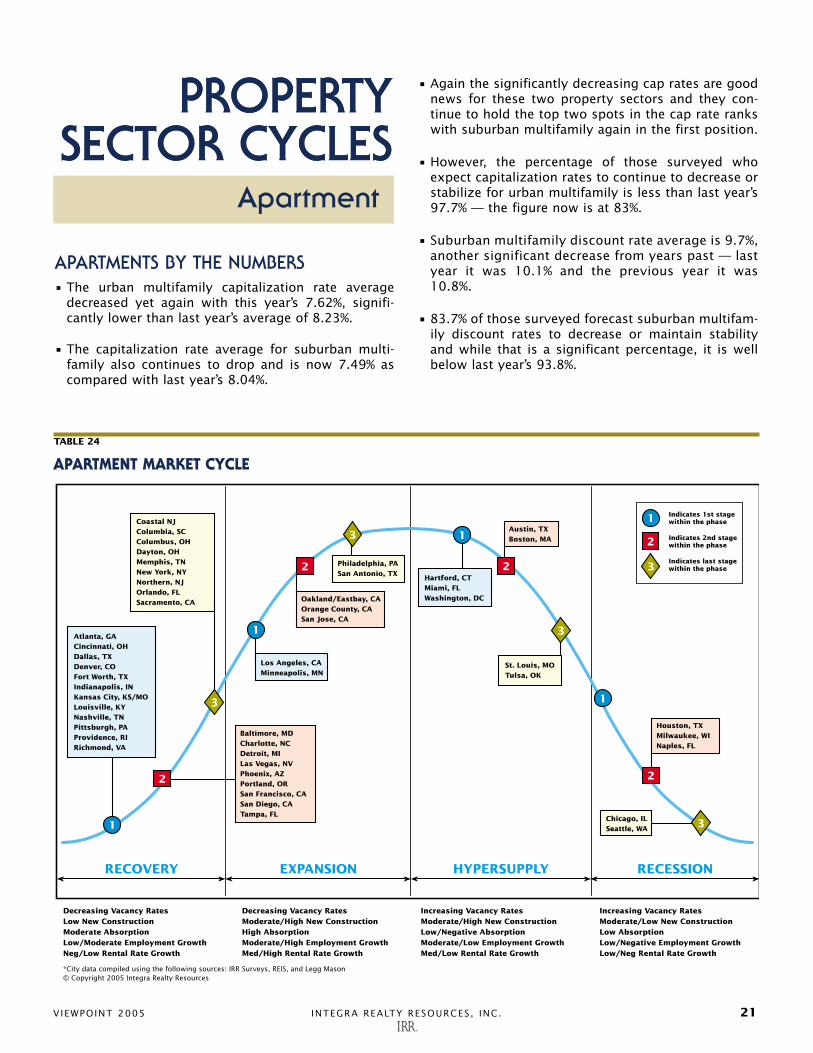
APARTMENTS BY THE NUMBERS• The urban multifamily capitalization rate average
decreased yet again with this year’s 7.62%, signifi-cantly lower than last year’s average of 8.23%.
• The capitalization rate average for suburban multi-family also continues to drop and is now 7.49% ascompared with last year’s 8.04%.
• Again the significantly decreasing cap rates are goodnews for these two property sectors and they con-tinue to hold the top two spots in the cap rate rankswith suburban multifamily again in the first position.
• However, the percentage of those surveyed whoexpect capitalization rates to continue to decrease orstabilize for urban multifamily is less than last year’s97.7% — the figure now is at 83%.
• Suburban multifamily discount rate average is 9.7%,another significant decrease from years past — lastyear it was 10.1% and the previous year it was10.8%.
• 83.7% of those surveyed forecast suburban multifam-ily discount rates to decrease or maintain stabilityand while that is a significant percentage, it is wellbelow last year’s 93.8%.
VIEWPOINT 2005 INTEGRA REALTY RESOURCES, INC. 21
PROPERTYSECTOR CYCLES
PROPERTYSECTOR CYCLES
Apartment
TABLE 24
APARTMENT MARKET CYCLE
RECOVERY EXPANSION HYPERSUPPLY RECESSION
Decreasing Vacancy RatesLow New ConstructionModerate AbsorptionLow/Moderate Employment GrowthNeg/Low Rental Rate Growth
Chicago, ILSeattle, WA
Indicates 1st stagewithin the phase
Indicates 2nd stagewithin the phase
Indicates last stagewithin the phase
1
2
3
Decreasing Vacancy RatesModerate/High New ConstructionHigh AbsorptionModerate/High Employment GrowthMed/High Rental Rate Growth
Increasing Vacancy RatesModerate/High New ConstructionLow/Negative AbsorptionModerate/Low Employment GrowthMed/Low Rental Rate Growth
Increasing Vacancy RatesModerate/Low New ConstructionLow AbsorptionLow/Negative Employment GrowthLow/Neg Rental Rate Growth
*City data compiled using the following sources: IRR Surveys, REIS, and Legg Mason© Copyright 2005 Integra Realty Resources
Baltimore, MDCharlotte, NCDetroit, MILas Vegas, NVPhoenix, AZPortland, ORSan Francisco, CASan Diego, CATampa, FL
3
2
1
1
2
3 1
3
1
2
3
Los Angeles, CAMinneapolis, MN
Coastal NJColumbia, SCColumbus, OHDayton, OHMemphis, TNNew York, NYNorthern, NJOrlando, FLSacramento, CA Oakland/Eastbay, CA
Orange County, CASan Jose, CA
Philadelphia, PASan Antonio, TX
Austin, TXBoston, MA
2Hartford, CTMiami, FLWashington, DC
Houston, TXMilwaukee, WINaples, FL
St. Louis, MOTulsa, OK
Atlanta, GACincinnati, OHDallas, TXDenver, COFort Worth, TXIndianapolis, INKansas City, KS/MOLouisville, KYNashville, TNPittsburgh, PAProvidence, RIRichmond, VA

22 INTEGRA REALTY RESOURCES, INC. VIEWPOINT 2005
TABLE 25
APARTMENT MARKET CONDITIONS AND FORECASTS: Central Business Districts and Suburban Market Areas
TOTAL FORECAST TOTAL FORECASTAVG. ANNUAL UNDER AVG. ANNUAL VALUE TOTAL VALUE EST.
VACANCY NET ABSORP. CONST. NET ABSORP. CHANGE CHANGE YEARSINVENTORY1 RATE1 VACANCY1 2001-20041 2004-20071 2005-20071 2001-2004 2005-2007 TO
MARKET AREA (UNITS) (%) (UNITS) (UNITS) (UNITS) (UNITS) (%) (%) BALANCE
Atlanta, GA 340,000 9.82 33,400 1,583 19,400 4,167 5.00 5.00 2.5Austin, TX 134,712 10.31 13,892 2,097 5,503 1,890 2.00 8.00 1Baltimore, MD 187,340 4.60 8,618 10 5,200 1,600 12.00 6.00 0Boston, MA 203,000 4.94 10,030 -197 8,000 2,000 5.00 0.00 0Charlotte, NC 74,900 10.47 7,839 1,430 10,284 2,800 -20.00 7.00 2Chicago, IL 2,000,000 7.05 141,050 -2,366 5,700 1,300 4.00 3.00 1Cincinnati, OH 106,025 9.10 9,650 -113 1,500 433 4.00 4.00 1Cleveland, OH 110,691 7.20 7,970 -459 1,406 532 - - 3Columbia, SC 25,825 11.50 2,970 156 1,750 500 10.00 8.00 2Columbus, OH 116,900 8.81 10,301 227 4,808 1,547 9.00 6.00 3Dallas, TX 369,463 10.40 38,407 -1,748 17,033 3,800 -12.00 4.00 3Dayton, OH 32,877 7.29 2,397 28 1,221 352 8.00 4.00 1Denver, CO 276,138 8.19 22,607 2,511 16,500 5,333 -13.00 3.00 2Detroit, MI 170,000 6.03 10,243 -792 1,500 333 7.00 5.50 3Fort Worth, TX 144,540 10.56 15,266 -67 5,360 1,787 -12.00 3.00 3Hartford, CT 75,000 4.81 3,607 -372 2,985 500 30.00 15.00 5Houston, TX 515,890 10.74 55,413 -3,280 14,300 5,367 15.00 10.00 1Indianapolis, IN 105,299 10.22 10,765 -222 6,100 1,200 1.50 2.00 2Kansas City, KS/MO 124,000 8.55 10,603 746 3,700 1,433 -10.00 8.00 4Las Vegas, NV 156,953 5.18 8,128 2,401 16,480 4,667 14.00 12.00 0Long Island, NY 22,880 3.20 732 16 1,870 767 15.00 7.00 1Los Angeles, CA 745,045 3.35 24,952 1,041 19,434 3,286 32.00 4.00 0Louisville, KY 43,800 3.55 1,557 1,065 8,400 1,667 0.00 6.00 1Memphis, TN 63,474 9.21 5,846 297 5,200 1,000 3.00 2.00 2Miami, FL 157,805 7.20 11,362 -760 5,460 - 9.70 5.60 5Milwaukee, WI 95,643 6.50 6,213 -530 2,538 827 14.00 -6.00 2Minneapolis, MN 152,100 6.32 9,614 -499 7,200 1,033 11.00 2.00 1Naples, FL 12,551 5.19 652 505 668 212 10.00 6.00 0Nashville, TN 58,510 6.38 3,735 249 7,700 3,917 9.00 6.00 1New Jersey, Coastal 26,100 4.23 1,103 -5 575 117 18.00 6.00 0New Jersey, Northern 957,400 4.58 43,838 1,941 11,800 2,767 12.00 8.50 1New Orleans, LA 64,201 6.30 4,045 31 1,845 218 - - 0New York, NY 1,970,000 3.60 70,920 3,359 4,086 3,384 9.00 10.00 0Oakland, CA 145,950 5.58 8,150 -753 4,801 1,814 33.00 5.00 0Orange County, CA 197,182 4.07 8,018 1,741 9,290 2,640 30.00 10.00 0Orlando, FL 137,520 7.39 10,165 2,902 6,260 1,913 14.10 8.00 2Philadelphia, PA 194,819 3.91 7,619 -264 5,878 1,120 13.00 5.00 2Phoenix, AZ 253,764 9.20 23,346 1,903 11,093 3,231 - - 5Pittsburgh, PA 83,534 7.26 6,066 -189 3,741 579 10.50 3.50 1Portland, OR 96,396 6.39 6,155 -294 3,714 800 17.00 8.00 0Providence, RI 24,000 4.00 960 - 1,400 360 30.00 16.00 2Richmond, VA 117,203 8.77 10,277 95 4,351 1,267 10.50 6.00 2Sacramento, CA 93,823 6.14 5,763 -476 6,800 1,867 12.00 6.00 0Salt Lake City, UT 75,761 7.10 5,379 279 3,548 1,013 - - 4San Antonio, TX 125,490 7.00 8,784 948 4,625 1,988 14.50 10.00 0San Diego, CA 180,975 4.15 7,514 445 9,838 2,850 43.00 20.00 0San Francisco, CA 135,675 5.20 7,050 -674 4,925 1,341 28.00 5.00 0San Jose, CA 106,050 5.00 5,300 677 5,277 1,540 18.00 5.00 0Seattle, WA 387,330 8.00 30,993 371 3,950 2,233 25.39 13.00 3St. Louis, MO 118,063 8.60 10,153 -997 3,555 1,015 - - 5Tampa, FL 160,224 8.45 13,539 1,284 10,600 2,633 12.00 8.00 1Tulsa, OK 65,000 10.50 6,825 -732 1,400 300 -5.00 0.00 2Washington, DC 368,000 5.07 18,642 1,485 29,400 7,733 13.00 7.00 2
Total: Simple Avg: Total: Total: Total: Total: Average: Average: Average:12,705,821 6.93 808,422 16,037 359,952 98,971 10.86 6.38 1.59
Weighted Avg:6.36
Note 1: Italicized Inventory, Vacancy, Absorption and Under Construction figures were provided by REIS, Inc. 212-921-1122.© Copyright 2005 Integra Realty Resource

• However, favorable conditions for the multifamilysector don’t exist in every market. Market conditionsremain soft throughout the Seattle region with thevacancy rate stuck above 7% for the past three years.Average rents continue a slow decline. New con-struction remains at low levels and absorption isweak because persistently low mortgage rates con-tinue to draw renters into the ownership market. Netmigration to the region is beginning to increase, buthas yet to make an impact on the rental market.Despite weak market fundamentals, investors arepouring money into the market, driving up prices.The investors are positioning themselves to takeadvantage of substantial rental growth when themarket does turn around, though even the most opti-mistic observers believe that won’t happen for a yearor more.
PROPERTY SECTORS – APARTMENT
VIEWPOINT 2005 INTEGRA REALTY RESOURCES, INC. 23
Vacancy rates continue to rise. This year the vacancyrate is 6.36%, considerably higher than last year’s5.96% and the previous year’s 5.62%. The forecastedequilibrium is now 1.59 years, an increase from lastyear’s 1.4 years.
The number of apartment units planned for construc-tion is higher than last year’s figure. This year it isreported that 359,952 units are in the developmentpipeline and last year it was 344,975 units.
QUICK MARKET GLANCE• Both suburban and urban multifamily were again
ranked as the top two in the 2004 cap rate ranks aswell as the 2004 discount rate ranks.
• The number of apartment units in the pipeline hasbegun to move back up, although only slightly, but itmay not be a problem if the fundamentals finallycome into alignment — the long-term demographicstrend still bodes well for this property sector — wordon the street is that this market has bottomed out,concessions are disappearing and vacancy rates areeroding.
• Markets with forbidding home values are favoritesfor investors in this sector and Los Angeles is theposter child for out of reach home costs. With its con-sistent shortage of affordable housing and constric-tion on space for development, multifamily hasremained strong throughout the recent past.Vacancies are among the lowest of any nationwide.Even with historically low interest rates, buying ahome in Los Angeles was tough. Now that interestrates are beginning to move up, it’s almost impossi-ble for many hopeful homeowners. In June 2004, themedian price of a single-family home was nearly$475,000, forcing many potential homebuyers intothe apartment rental market. Asking and effectiverents have made a slow and steady upward climb in2004 and that trend is expected to continue in 2005.Cap rates may increase slightly as interest rates rise.
4
5
6
7
8
9
10
3
2
1
1994 1995 1996 1997 1998 1999 2000 2002 2003 20042001
Urban Multifamily
Suburban Multifamily
10 Year Treasury (January Avg.)
10 Year Treasury (Annual Avg.)
TABLE 26
CAP RATE TRENDS—APARTMENT
© 2005 Integra Realty Resources

24 INTEGRA REALTY RESOURCES, INC. VIEWPOINT 2005
INDUSTRIAL BY THE NUMBERS• The manufacturing capitalization rate average
declined again and now stands at 9.34% as comparedwith 9.65%.
• The office/warehouse cap rate average also is fallingwith a decrease from last year’s 9.17% to this year’saverage of 8.74%.
• Even R & D cap rates continue the downward trendwith this year’s average of 9.15%, well below lastyear’s 9.47%.
• A significant drop of the cap rate average was expe-rienced in the bulk property class from last year’s9.26% to this year’s 8.82%.
• Discount rates for all industrial property classes alsodecreased from last year’s averages
– manufacturing to 11% from 11.4%
– office/warehouse to 10.4% from 10.9%
– R & D to 10.9% from 11.2%
– bulk to 10.5% from 10.9%
PROPERTYSECTOR CYCLES
Industrial
RECOVERY EXPANSION HYPERSUPPLY RECESSION
Decreasing Vacancy RatesLow New ConstructionModerate AbsorptionLow/Moderate Employment GrowthNeg/Low Rental Rate Growth
Indicates 1st stagewithin the phase
Indicates 2nd stagewithin the phase
Indicates last stagewithin the phase
1
2
3
Decreasing Vacancy RatesModerate/High New ConstructionHigh AbsorptionModerate/High Employment GrowthMed/High Rental Rate Growth
Increasing Vacancy RatesModerate/High New ConstructionLow/Negative AbsorptionModerate/Low Employment GrowthMed/Low Rental Rate Growth
Increasing Vacancy RatesModerate/Low New ConstructionLow AbsorptionLow/Negative Employment GrowthLow/Neg Rental Rate Growth
*City data compiled using the following sources: IRR Surveys, REIS, and Legg Mason© Copyright 2005 Integra Realty Resources
Austin, TXHartford, CTPittsburgh, PARichmond, VA
Atlanta, GABaltimore, MDBoston, MAChicago, ILCincinnati, OHColumbus, OHDallas, TXDayton, OHDenver, COHouston, TXIndianapolis, INKansas City, KS/MOMemphis, TNNashville, TNNew York, NYPhoenix, AZProvidence, RISacramento, CASan Antonio, TXSeattle, WATulsa, OKWashington, DC
1Columbia, SCCharlotte, NCLas Vegas, NVLos Angeles, CAMiami, FLMilwaukee, WIMinneapolis, MN
Detroit, MILouisville, KYOakland, CAOrange County, CAOrlando, FLPhiladelphia, PAPortland, ORSan Francisco, CASan Diego, CASan Jose, CASt. Louis, MOTampa, FL
2
3
1
2
3 1
3
1
3
Coastal NJ
Morristown/Newark, NJNaples, FL
Fort Worth, TX
2
2
TABLE 27
INDUSTRIAL MARKET CYCLE

VIEWPOINT 2005 INTEGRA REALTY RESOURCES, INC. 25
TABLE 28
INDUSTRIAL MARKET CONDITIONS AND FORECASTS: Central Business Districts and Suburban Market Areas
TOTAL FORECAST TOTAL FORECASTAVG. ANNUAL UNDER AVG. ANNUAL VALUE TOTAL VALUE EST.
VACANCY NET ABSORP. CONST. NET ABSORP. CHANGE CHANGE YEARSINVENTORY1 RATE1 VACANCY1 2001-20041 2004-20071 2005-20071 2001-2004 2005-2007 TO
MARKET AREA (SQ. FT.) (%) (SQ. FT.) (SQ. FT.) (SQ. FT.) (SQ. FT.) (%) (%) BALANCE
Atlanta, GA 516,100,000 13.16 67,928,500 1,724,500 15,400,000 3,533,333 0.00 0.00 5Austin, TX 33,596,700 21.02 7,061,505 16,946 841,000 533,333 -20.00 0.00 3Baltimore, MD 101,949,000 11.50 11,724,135 1,046,750 6,400,000 2,265,000 14.00 6.00 2Boston, MA 106,300,000 18.30 19,455,000 -1,020,500 2,300,000 516,667 0.00 5.00 1Charlotte, NC 34,895,000 16.97 5,922,004 90,000 3,515,000 533,333 -9.00 -5.00 4Chicago, IL 979,000,000 9.49 92,930,500 7,049,750 7,000,000 1,066,667 5.00 5.00 1Cincinnati, OH 249,000,000 11.13 27,712,500 -1,114,750 3,500,000 1,666,667 1.00 4.00 1.5Cleveland, OH 316,641,000 10.10 31,980,741 -1,852,000 8,067,000 1,954,000 - -Columbia, SC 31,075,000 10.00 3,107,500 100,000 800,000 225,000 4.00 4.00 3Columbus, OH 168,011,624 12.12 20,355,102 -323,750 3,682,000 1,600,000 31.50 10.00 5Dallas, TX 329,830,010 11.60 38,260,281 -779,602 4,695,875 482,869 9.00 8.00 1Dayton, OH 65,659,440 9.62 6,316,846 116,090 80,000 2,000,000 6.00 4.00 4Denver, CO 176,700,000 8.98 15,859,450 646,250 6,000,000 1,666,667 0.00 6.00 2Detroit, MI 287,055,000 13.13 37,687,425 -3,866,750 4,970,000 1,413,333 1.00 2.50 5Fort Worth, TX 175,392,993 11.56 20,278,232 500,219 1,206,180 245,630 9.00 8.00 1Hartford, CT 67,552,490 12.19 8,232,692 -132,757 740,000 400,000 -5.00 10.00 2Houston, TX 405,800,000 9.49 38,528,000 1,242,750 7,920,000 3,610,000 11.00 10.00 5Indianapolis, IN 204,500,000 8.56 17,510,000 504,500 17,500,000 4,500,000 8.00 5.00 2Kansas City, KS/MO 222,500,000 11.12 24,745,000 -1,759,250 2,750,000 233,333 -15.00 5.00 5Las Vegas, NV 77,946,470 9.20 7,170,324 2,513,784 9,200,000 2,266,667 10.50 7.00 1Long Island, NY 47,000,000 6.00 2,820,000 1,800,000 5,000,000 1,366,667 12.00 8.00 2Los Angeles, CA 942,933,788 3.71 34,957,973 5,630,723 18,021,000 5,629,000 6.00 4.00Louisville, KY 42,325,000 23.26 9,843,713 636,000 5,700,000 2,666,667 -19.00 2.00 2Memphis, TN 121,643,179 21.89 26,627,014 317,328 10,295,090 2,833,333 4.50 3.00 3Miami, FL 191,929,430 6.50 12,480,688 632,520 6,641,552 2,158,667 37.78 8.00Milwaukee, WI 223,340,955 7.57 16,916,097 - - - 3.00 0.00 1Minneapolis, MN 110,930,000 11.63 12,897,960 428,000 2,940,000 1,266,667 4.00 5.00 3Naples, FL 10,702,570 5.85 625,762 291,252 194,000 193,333 44.80 30.00Nashville, TN 76,300,000 14.13 10,782,000 502,000 10,400,000 2,416,667 5.00 4.00 2New Jersey, Coastal 33,050,000 7.66 2,531,500 187,500 1,450,000 383,333 25.00 5.00New Jersey, Northern 685,000,000 7.44 50,935,000 4,350,000 26,500,000 7,000,000 16.00 10.00 2New Orleans, LA 57,257,000 13.80 7,901,466 -101,750 942,000 412,333 - -Oakland, CA 247,464,000 9.81 24,266,000 -619,500 3,471,000 1,699,000 15.00 10.00 1Orange County, CA 291,761,469 6.33 18,477,494 878,579 4,847,000 2,078,000 20.00 10.00 1Orlando, FL 80,500,000 13.30 10,706,500 400,250 1,833,000 1,450,000 10.25 8.25 4Philadelphia, PA 253,507,371 12.89 32,679,661 -672,410 1,057,538 -259,765 6.00 4.00 2Phoenix, AZ 223,230,000 10.41 23,228,600 936,250 17,450,000 5,233,333 3.00 6.00Pittsburgh, PA 81,170,677 20.00 16,234,135 -1,233,440 1,300,000 -216,667 2.00 1.00 4Portland, OR 126,206,921 9.59 12,102,490 465,648 5,576,716 3,166,667 1.50 4.00 2Providence, RI 25,000,000 10.00 2,500,000 - 1,450,000 433,333 2.00 6.00 3Richmond, VA 37,935,000 17.85 6,770,775 400,675 508,000 225,000 -21.00 0.00 5Sacramento, CA 154,950,000 11.13 17,253,300 768,500 5,900,000 1,600,000 7.00 6.00 1San Antonio, TX 55,579,000 13.70 7,614,323 138,812 2,182,000 669,000 4.50 3.00 2San Diego, CA 178,034,913 8.28 14,734,124 855,957 9,267,000 2,627,000 2.70 3.50 1San Francisco, CA 83,516,000 9.07 7,574,000 -1,724,250 1,137,000 855,333 15.00 10.00 1San Jose, CA 218,803,000 16.82 36,794,000 -3,069,750 295,000 1,430,667 -25.00 15.00 7Seattle, WA 206,943,595 7.72 15,984,351 -9,549 1,989,007 2,750,000 19.00 12.00 2St. Louis, MO 190,862,000 8.20 15,650,684 -432,000 4,920,000 1,507,000 - -Tampa, FL 42,710,000 10.56 4,511,860 209,693 8,600,000 2,200,000 9.00 6.00 2Tulsa, OK 57,200,000 9.00 5,148,000 -328,472 900,000 - 10.00 4.00 3Washington, DC 113,900,000 8.98 10,222,930 1,185,500 6,650,000 0 6.50 6.50 2
Total: Simple Avg Total: Total: Total: Total: Average: Average: Average:9,761,190,595 11.42 974,538,139 17,526,244 273,983,958 84,487,067 5.99 6.02 2.59
Weighted Avg:9.98
1 Italicized Inventory (i.e. blue), Vacancy, Absorption and Under Construction figures were provided by REIS, Inc. 212-921-1122.

PROPERTY SECTORS – INDUSTRIAL
26 INTEGRA REALTY RESOURCES, INC. VIEWPOINT 2005
Vacancy rates in the industrial property sector show apromising downward trend with this year’s 9.98% aver-age as compared with last year’s slightly higher 10.02%average. A positive trend also appears in the estimatedyears to balance. It is expected that it will take 2.59 years to reach equilibrium in this sector. Last yearthe average was 2.76 years. While lower, it still ishigher than the two years ago estimate of 2.05 years.
The development pipeline is moving upward, also. Lastyear it was expected that 240 million square feet wouldmove through the pipeline. This year, that figure standsat 274 million square feet.
This year the average net absorption was 17.5 millionsquare feet compared with last year’s 73.8 millionsquare feet.
QUICK MARKET GLANCE• Office/warehouse remains in 7th place on the cap
rate ranks chart.
• Manufacturing also retains its 11th place as do bulkin 9th position and R & D in 10th place.
• The industrial categories also kept many of the samerankings in the average discount rate chart withmanufacturing staying put at 11th place.
• R & D was again in 10th and office/warehouse is in7th place.
• Bulk continues to move up in the rankings and nowis at 8th place.
• Good news is acknowledged in the Seattle industrialproperty sector as the South End and Pierce Countysubmarkets come roaring back with rising absorp-tion, falling vacancy rates and the resumption ofspeculative construction. The close-in Seattle marketremains stable, while the technology-dependentEastside and Boeing-dependent Snohomish Countymarkets remain soft, although vacancy rates arebeginning to drift downward in both areas.Development of “big box” distribution centers isshifting south to Pierce County and Thurston County.
• In the coastal New Jersey area, sales prices and buyerdemand for industrial are at all-time highs. Pricespaid versus lease rates and market fundamentalsappear high and clearly the market is anticipatingcontinued growth. Economic uncertainty has kept thelid on speculative development and makes near-termprojections difficult. Market fundamentals such asemployment growth are difficult to project with quar-terly employment and industrial capacity shiftingback and forth over eight consecutive quarters.
Inflation is good for producers and might signal con-tinued positive trends for industrial. Expect a short-term leveling off in prices and stable user demand.
• The past year has been somewhat of a roller coasterride as the corporate world tries to re-establish itsfooting in the jobless recovery here and in the strug-gling world economies. Recent increases in the vol-ume of international trade through the MiamiCustoms District, as well as a reported 7.4% increaseof imports, appear to signal a positive change whichwill reflect as increased demand for warehouse spacein the Miami MSA. Boosted by this rising demand, theindustrial market is making a comeback, posting pos-itive net absorption and decreased vacancy rates.Rental rates are expected to continue a steadyincrease over the next year. Leasing is expected toincrease over sales as the economy continues torecover and sale prices are expected to slow and flat-ten in the near term.
• In Naples, Florida, the lack of vacant industrial landhas driven up property values.
1994 1995 1996 1997 1998 1999 2000 2001 20042002
10 Year Treasury (Annual Avg.)
Manufacturing
Bulk
Office/Warehouse
R&D
10 Year Treasury (January Avg.)
2003
4
5
6
7
8
9
10
11
3
2
1
3.5
4.5
5.5
6.5
7.5
8.5
9.5
10.5
2.5
1.5
0
0.5
TABLE 29
CAP RATE TRENDS—INDUSTRIAL
© 2005 Integra Realty Resources

VIEWPOINT 2005 INTEGRA REALTY RESOURCES, INC. 27
TABLE 31
Choosing a lucrative real estate investment is eas-ier when an investor includes demand compo-nents of the macro real estate environment as
integral elements in the decision process. Althoughinvestors must factor in other essentials such as inter-est rate and capital flow trends, identifying geographicareas that are expanding or declining economically isan important part of the game.
Demand components of real estate investment funda-mentals such as trends in population and employmentgrowth are key indices to judging whether an area is onthe edge of an economic boom or bust. Other criticalanalyzed indices are growth in household and house-hold income.
NPA Data Services of Washington, D.C. provided thedemographic and economic data for all the charts inthis section. With this data gathered over the pastyears, we have developed a good snapshot of the bestMetropolitan Statistical Areas with the most desirablerisk-reward real estate investments.
However, the outlook of any MSA is more complex thanindicated by information gathered merely at the macrolevel. We know that in each market there are areas ofopportunity as well as hazards. That’s why it’s crucial tohave an adviser who is on the ground and specializes in
a specific MSA. Our local IRR representatives thoroughlyknow their local markets and provide useful informa-tion and advice about submarket risks and opportuni-ties in each of these MSA’s.
Since employment sectors don’t perform in lock-step asthe economy evolves, we also provide informationabout refined categories by employment type.
This section covers information found in the charts onthe following pages or on-line at www.irr.com.
When appearing in both tables, MSA’s have a greaterpotential for strong economic futures based on popula-tion growth. Last year, four MSA’s made the cut for bothtables. This year only three did so again with San Diegodropping off this list.
• Phoenix — This MSA has reliably held on to its rank-ings in these two charts for awhile. Phoenix retainedits year-ago number 3 status in percentage change,and its number 6 position in absolute change. In theyear before that, it ranked number 3 in percentagechange and number 7 in absolute change. Solid jobgrowth and its continuing appeal to retirees and othersun-lovers make this MSA a favorite for investors.
• Atlanta — Another solid performer, Atlanta is number 7 in percentage change and number 3 inabsolute change. Last year it was number 8 in per-centage change and number 2 in absolute change.
• Denver — Denver is more than holding its own in thetop 10 of both charts. Compared with last year’s rank-ing of number 10 in percentage change and number 9in absolute change, this year’s report has it at number 8in both charts. The LoDo residential district in down-town Denver remains a beacon of “what can be” for sim-ilar-sized MSA’s with excitement-deprived downtowns.
DEMOGRAPHIC & ECONOMIC
TRENDS
TOP 10 ANNUAL GROWTH AREAS BY PERCENTAGE CHANGE
Annual Growth Rate Absolute Annual Growth
'04-'09 2003 '99-'04 '04-'09 '99-'04Rank Rank Rank MSA Rank Rank
1 1 1 Orlando, FL 15 142 2 4 Austin, TX 18 173 3 5 Phoenix, AZ 7 104 4 7 Las Vegas, NV 22 155 7 20 Ft. Worth, TX 14 246 11 12 Sacramento, CA 19 197 8 11 Atlanta, GA 3 48 10 15 Denver, CO 10 129 5 13 Tampa, FL 20 16
10 6 6 San Diego, CA 4 6SOURCE: NPA Data Services, Inc., compiled by IRR
TOP 10 ANNUAL GROWTH AREAS BY ABSOLUTE CHANGE
Annual Growth Rate Absolute Annual Growth
'04-'09 2003 '99-'04 '04-'09 '99-'04Rank Rank Rank MSA Rank Rank
1 1 1 Washington, DC 30 102 3 2 Houston, TX 20 33 2 4 Atlanta, GA 9 114 11 5 Los Angeles, CA 46 325 4 3 Dallas, TX 21 26 6 10 Phoenix, AZ 3 57 10 8 Orange County, CA 14 178 9 12 Denver, CO 10 159 8 7 Chicago, IL 45 41
10 13 9 Boston, MA 36 33SOURCE: NPA Data Services, Inc., compiled by IRR
TABLE 30

DEMOGRAPHIC & ECONOMIC TRENDS
28 INTEGRA REALTY RESOURCES, INC. VIEWPOINT 2005
In addition to these two charts, these MSA’s ranked inthe top 10 in the following population/employmentgrowth charts:
• Phoenix — 2.61% projected growth for populationgrowth; 2.85% household growth; 2.74% total house-hold income growth; 3.76% total employment growth;3.66% manufacturing employment growth; 4.03%wholesale/retail employment growth; 4.31% whole-sale employment growth; 3.92% retail employmentgrowth; 4.18% FIRE employment growth; 3.88% ser-vices employment growth and 2.2% contract con-struction employment growth.
• Atlanta — 2.41% projected growth for populationgrowth; 2.61% household growth; 3.63% totalemployment growth; 3.83% wholesale/retail employ-ment growth; 3.57% wholesale employment growth;3.97% retail employment growth; 4.06% servicesemployment growth and 2.16% contract constructionemployment growth.
• Denver — This year Denver was again only in the top10 on FIRE employment with 3.98% projected growth,an increase from last year’s 3.18% projected growth inFIRE employment.
Population, Household Growth and AverageHousehold Income Growth
The third time is the charm — as in the charm of sunand sand, as Naples and Orlando grab the top twospots in population and household growth for the thirdyear in a row. Overall, the top 10 average dropped to2.53% from last year’s 2.54% projected populationgrowth percentage. Naples is well above the top 10average with 3.32%, but has dropped from its last year’sreported 3.39% and Orlando shows 2.75%, a slight dropfrom last year’s 2.76%.
Although still number one, Naples household growthprojections also dropped to 3.57% from last year’s3.79% while Orlando dropped to 2.98% from last year’s3.15%
The average in this section also fell, from last year’s top10 average of 2.93% to this year’s 2.77% average.
Oakland, California, toppled Providence, Rhode Island,from its three-year top reign for average householdincome growth. In last year’s report, Oakland was num-ber 4 with 2.39% projected income growth and is thisyear’s leader of the pack with a 3.67% projected aver-age. Fort Worth has also made significant strides on thischart with its second place showing with a 3.61% aver-age, up from last year’s 2.35% average in the number 7spot. Miami moved down to number 10 from last year’snumber 2 spot.
Overall this category is trending upward. The top 10average in household income growth for this year is3.16%, well above last year’s 2.36% and the previousyear’s 2.77%. The average for the total MSA’s analyzedalso rose to 2.51% from last year’s 2.08% and the previ-ous year’s 2.4%.
Employment Growth
Not much is shaking in this chart, with the top 5 retain-ing their positions in this chart for the third year.
Orlando continues to climb with this year’s 4.26% pro-jected average higher than both last year’s 4.14% andthe previous year’s 4.07%. Percentage for forecastedemployment growth for all top 10 markets is alsohigher — up to 3.7% from last year’s 3.56% and the pre-vious year’s 3.52%. In fact, employment is trending upin all analyzed MSA’s, a jump to 2.41% from last year’s2.2%.
FIRE Employment Growth
A welcomed upward trend for employment in finance,insurance and real estate has appeared on the horizonoffering a glimmer of hope for the office property sec-tor in many MSA’s.
After a multi-year slide, averages in this category havebriskly rebounded. Last year the top 10 MSA’s’ averageprojected growth dropped to 3.39% from the previousyear’s 3.55% — this year the average for the top 10 is4.15%. The trend continues in the overall average withan increase from last year’s 1.96% to this year’s 2.72%.
Orlando, Naples and Sacramento are again the top 3 inthis category. Orlando surpassed last year’s average of3.84% to this year’s 4.58% projected growth average asdid Naples and Atlanta, with 4.34% and 4.27% averagesrespectively. Last year’s average for Naples was 3.62%and for Sacramento it was 3.5%.
Service Employment
Last year, a climbing trend began in this sector with anincrease from 3.84% to 3.96%. This year’s 3.98% for pro-jected growth in the top 10 MSA’s continues thatincrease.

4.0%0.0% 1.0%Annual Growth Rate (%)
Ab
solu
te A
nnua
l Gro
wth
(000
’s)
2.0% 2.5% 3.5% 5.0%3.0%0.5% 1.5% 4.5%
LEGEND2004-20091999-2004
-1.0%-10
0
-0.5%
120
110
100
90
80
70
60
50
40
30
20
10
Atlanta, GA
Atlantic City, NJ
Austin, TX
Boston, MA
Charlotte, NC
Pittsburgh, PA
Cleveland, OH
Dallas, TX
Houston, TX
Honolulu, HI
Denver, CO
Detroit, MI
Fort Worth, TX
New Orleans, LA
Hartford, CT
Oakland, CAMiami, FL
Kansas City, KS/MO
Las Vegas, NVLos Angeles, CA
Louisville,KY
Memphis, TN
Minneapolis/St. Paul MN
Naples, FL
San Antonio, TX
Nashville, TN
Orange County, CA
Orlando, FL
Phoenix, AZ
Portland, OR
Providence, RI
Sacramento, CA
Salt Lake City, UT
San Diego, CA
San Jose, CA
St. Louis, MO
Tampa, FL
Tulsa,OK
Washington, DC
Dayton, OH
Columbus, OHSarasota, FL
Seattle, WA
Chicago, IL
San Francisco, CA
Philadelphia, PA
Baltimore, MD
Columbia, SCDes Moines, IA
Richmond, VAIndianapolis, IN
Omaha, NENew York, NYMilwaukee, WI
Newark, NJ
Cincinnati, OH
Oakland, CA
Boston, MA
Charlotte, NC
Portland, OR
San Jose, CAFort Worth, TX
Chicago, IL
Cincinnati, OH
Kansas City, KS/MO
Columbus, OH
Cleveland, OHMilwaukee, WI
Pittsburgh, PA
Columbia, SC
San Antonio, TXSan Francisco, CA
Dallas, TX
Dayton, OH
Hartford,CT
Denver, CO
Des Moines, IA
Detroit, MI
Newark, NJ
Honolulu, HI
Tulsa, OKRichmond, VA
Houston, TX
Indianapolis, IN
Las Vegas, NV
Los Angeles, CA
Louisville, KY
Memphis, TN
Miami, FL
Minneapolis/St. Paul, MN
Naples, FL
Nashville, TN
New York, NY
St. Louis, MO
Orange County, CA
Orlando, FL
Philadelphia, PA
Phoenix, AZ
Providence, RI
Salt Lake City, UT
San Diego, CA
Seattle, WA
Tampa, FL
Washington, DC
Atlantic City, NJ
Atlanta, GA
Baltimore, MD
Austin, TX
Sacramento, CA
Omaha, NENew Orleans, LA
Sarasota, FL
SOURCE: NPA Data Services, Inc; compiled by IRR
TABLE 32
TOTAL EMPLOYMENT GROWTH By Absolute Annual Growth and Annual Growth Rate Percentage
DEMOGRAPHIC & ECONOMIC TRENDS
VIEWPOINT 2005 INTEGRA REALTY RESOURCES, INC. 29

30 INTEGRA REALTY RESOURCES, INC. VIEWPOINT 2005
HOUSEHOLDS
Annual Growth Rate Absolute Annual Growth
Current '04-'09 '04-'09 '99-'04 '99-'04 '04-'09 '04-'09 '99-'04 '99-'04[000’s] Rank [%] Rank [%] Rank [000’s] Rank [000’s]
POPULATION
Annual Growth Rate Absolute Annual Growth
Current '04-'09 '04-'09 '99-'04 '99-'04 '04-'09 '04-'09 '99-'04 '99-'04MSAs [000’s] Rank [%] Rank [%] Rank [000’s] Rank [000’s]
2004
Atlanta, GA 4,544.17 6 2.41 5 2.67 1 109.48 1 106.87 1,655.04 6 2.61 6 2.50 1 43.16 1 36.76Atlantic City, NJ 369.32 33 0.81 35 0.95 50 2.99 51 3.35 143.03 33 1.04 33 0.96 51 1.49 50 1.31Austin, TX 1,408.38 3 2.62 3 3.36 17 36.91 13 40.50 527.40 5 2.83 3 3.10 20 14.95 14 14.15Baltimore, MD 2,626.25 36 0.79 39 0.68 28 20.71 31 17.19 998.98 36 0.98 38 0.65 25 9.80 31 6.27Boston, MA 6,213.49 44 0.46 41 0.64 24 28.75 16 38.31 2,366.41 43 0.68 41 0.60 17 16.03 15 13.80Charlotte, NC 1,624.01 17 1.77 10 2.07 23 28.75 22 30.49 622.53 16 2.00 11 2.04 22 12.47 20 11.55Chicago, IL 8,521.94 45 0.42 37 0.75 19 35.95 7 61.88 3,049.34 45 0.62 39 0.64 14 18.94 7 18.93Cincinnati, OH 1,694.01 37 0.72 40 0.68 33 12.28 36 11.18 661.80 37 0.91 36 0.67 35 6.01 36 4.32Cleveland, OH 2,259.90 53 -0.06 54 0.06 53 -1.36 54 1.43 894.92 54 0.13 54 0.08 53 1.19 53 0.70Columbia, SC 567.15 21 1.47 24 1.35 41 8.31 43 7.18 214.84 21 1.70 21 1.43 43 3.66 42 2.87Columbus, OH 1,619.50 27 1.16 26 1.24 29 18.77 28 18.97 639.69 28 1.38 25 1.21 28 8.81 25 7.32Dallas, TX 3,855.45 14 2.04 8 2.36 4 78.49 4 81.47 1,402.43 14 2.28 8 2.25 4 31.99 3 28.42Dayton, OH 953.92 51 0.10 55 0.02 51 0.95 55 0.15 380.70 51 0.31 55 0.06 54 1.18 55 0.22Denver, CO 2,259.51 13 2.16 13 1.82 10 48.86 18 37.61 877.07 13 2.34 17 1.59 10 20.48 17 12.89Des Moines, IA 477.91 38 0.68 27 1.21 49 3.26 48 5.46 187.81 38 0.91 26 1.18 50 1.70 48 2.09Detroit, MI 4,509.98 49 0.25 48 0.32 34 11.18 34 14.17 1,720.89 49 0.48 48 0.34 30 8.19 33 5.80Ft. Worth, TX 1,864.00 12 2.20 9 2.30 15 40.95 15 38.47 683.70 12 2.43 9 2.23 16 16.63 16 13.73Hartford, CT 1,167.71 52 0.02 45 0.46 52 0.28 49 5.28 453.33 52 0.24 45 0.49 55 1.08 47 2.18Honolulu, HI 894.41 40 0.59 47 0.35 46 5.24 52 3.10 291.91 40 0.81 47 0.36 48 2.36 52 1.02Houston, TX 4,534.54 15 2.01 11 2.05 3 91.12 3 84.26 1,583.05 15 2.24 12 1.91 3 35.42 5 27.57Indianapolis, IN 1,681.78 32 0.87 28 1.17 31 14.68 29 18.56 657.30 32 1.07 27 1.14 34 7.04 27 7.06Kansas City, KS/MO 1,850.78 34 0.80 32 1.01 30 14.85 30 17.77 724.25 34 1.02 31 1.03 32 7.38 26 7.11Las Vegas, NV 1,759.22 5 2.60 2 3.41 11 45.79 8 51.23 666.06 3 2.85 2 3.45 13 18.99 6 19.62Los Angeles, CA 9,776.51 42 0.57 38 0.72 8 56.03 6 67.84 3,210.14 41 0.79 42 0.57 8 25.51 9 17.75Louisville, KY 1,051.80 41 0.58 42 0.62 44 6.07 45 6.34 421.39 42 0.76 40 0.62 44 3.22 44 2.53Memphis, TN 1,180.30 31 0.92 33 0.97 36 10.81 39 10.88 440.19 31 1.14 32 0.97 37 5.01 38 4.07Miami, FL 2,334.60 30 0.97 31 1.02 25 22.73 25 22.73 803.50 30 1.20 35 0.88 26 9.64 28 6.74Milwaukee, WI 1,533.40 43 0.47 44 0.50 43 7.14 42 7.43 598.97 44 0.67 44 0.50 42 3.99 41 2.95Minneapolis, MN 3,147.98 22 1.43 21 1.47 13 45.14 10 43.14 1,200.33 22 1.62 22 1.38 12 19.48 12 15.52Naples, FL 288.85 1 3.32 1 3.57 39 9.58 41 8.75 118.84 1 3.57 1 3.68 41 4.24 39 3.69Nashville, TN 1,311.60 20 1.67 19 1.59 26 21.87 27 19.37 509.23 20 1.86 18 1.55 27 9.47 24 7.32New Orleans, LA 1,350.37 47 0.33 53 0.18 47 4.43 53 2.40 509.88 47 0.53 51 0.20 46 2.69 51 1.03New York, NY 9,392.37 55 -0.14 50 0.32 56 -13.17 23 29.25 3,500.40 55 0.07 52 0.17 47 2.37 32 5.89Newark, NJ 2,050.07 56 -0.15 51 0.28 55 -3.09 47 5.72 733.86 56 0.07 50 0.22 56 0.48 49 1.59Oakland, CA 2,523.54 28 1.16 25 1.35 22 29.21 21 31.89 908.97 27 1.39 28 1.11 21 12.61 22 9.56Omaha, NE 745.95 35 0.80 34 0.96 45 5.99 44 6.82 285.80 35 1.02 34 0.91 45 2.92 45 2.49Orange County, CA 3,013.15 23 1.36 22 1.40 16 40.84 14 39.44 988.48 23 1.59 24 1.23 18 15.67 21 11.48Orlando, FL 1,819.38 2 2.75 6 2.63 9 50.00 11 42.28 693.43 2 2.98 4 2.66 9 20.68 10 16.30Philadelphia, PA 5,165.41 50 0.18 49 0.32 40 9.30 32 16.17 1,937.99 50 0.39 49 0.33 31 7.52 30 6.37Phoenix, AZ 3,606.53 4 2.61 4 2.69 2 93.96 2 85.64 1,324.40 4 2.85 5 2.59 2 37.75 2 30.42Pittsburgh, PA 2,360.04 54 -0.06 56 -0.05 54 -1.40 56 -1.18 966.75 53 0.15 56 -0.01 52 1.43 56 -0.10Portland, OR 2,060.80 18 1.76 15 1.73 18 36.27 19 32.86 795.68 19 1.96 14 1.66 19 15.58 18 12.18Providence, RI 984.79 46 0.36 43 0.61 48 3.51 46 5.85 382.20 46 0.58 37 0.67 49 2.20 46 2.46Richmond, VA 1,041.51 29 1.04 30 1.10 35 10.84 38 10.90 404.34 29 1.21 30 1.07 39 4.89 37 4.10Sacramento, CA 1,793.47 7 2.35 7 2.39 14 42.18 17 38.30 671.02 7 2.60 7 2.46 15 17.45 13 14.70Salt Lake City, UT 1,426.47 10 2.21 18 1.60 20 31.49 26 21.15 460.20 11 2.44 20 1.49 24 11.21 29 6.38San Antonio, TX 1,696.10 19 1.73 20 1.57 21 29.35 24 24.71 597.34 18 1.97 16 1.61 23 11.77 23 8.90San Diego, CA 3,026.94 11 2.21 16 1.70 5 66.85 9 47.47 1,068.99 10 2.45 15 1.64 7 26.17 11 16.16San Francisco, CA 1,748.85 39 0.62 52 0.27 37 10.81 50 4.67 687.24 39 0.83 53 0.08 36 5.73 54 0.52San Jose, CA 1,748.19 26 1.21 36 0.92 27 21.16 33 15.34 579.22 25 1.44 43 0.50 29 8.33 43 2.84Sarasota, FL 637.09 8 2.24 12 1.90 32 14.28 37 11.04 285.62 8 2.48 10 2.05 33 7.08 34 5.31Seattle, WA 2,559.35 16 1.78 23 1.35 12 45.64 20 32.39 1,016.47 17 2.00 23 1.23 11 20.30 19 11.74St. Louis, MO 2,651.66 48 0.30 46 0.44 42 7.89 35 11.38 1,029.60 48 0.49 46 0.44 38 5.01 35 4.47Tampa, FL 2,578.31 9 2.23 14 1.77 7 57.55 12 41.84 1,089.30 9 2.47 13 1.80 6 26.91 8 17.98Tulsa, OK 843.49 25 1.24 29 1.12 38 10.45 40 8.98 330.85 24 1.46 29 1.08 40 4.82 40 3.40Washington, DC 5,243.60 24 1.27 17 1.63 6 66.68 5 79.20 1,960.22 26 1.44 19 1.54 5 28.21 4 28.07Average 1.22 1.28 26.92 27.25 1.43 1.23 11.95 9.47
DEMOGRAPHIC AND ECONOMIC TRENDS Mid Year 2004
TABLE 33
2004

VIEWPOINT 2005 INTEGRA REALTY RESOURCES, INC. 31
95,981.32 35 2.38 39 3.39 23 2282.82 26 2783.77 1,181.80 1 4.26 6 2.57 15 50.30 11 26.95 Atlanta, GA87,769.85 33 2.39 13 4.20 33 2101.44 17 3045.66 168.66 2 4.06 1 5.00 54 6.85 35 6.75 Atlantic City, NJ89,705.24 9 2.68 44 3.28 19 2401.56 39 2530.70 925.42 3 3.76 4 2.71 23 34.83 16 22.12 Austin, TX86,220.03 7 2.97 51 2.32 15 2557.01 50 1790.27 2,113.09 4 3.76 7 2.44 7 79.36 5 45.98 Baltimore, MD
108,206.14 15 2.61 9 4.58 7 2828.77 9 4032.75 1,038.12 5 3.67 3 3.39 17 38.15 9 30.10 Boston, MA87,303.80 47 2.28 26 3.81 44 1994.74 25 2791.80 2,927.71 6 3.63 11 2.09 1 106.34 2 55.29 Charlotte, NC
105,388.10 32 2.40 32 3.66 16 2524.93 15 3259.71 391.62 7 3.51 2 3.54 43 13.75 32 11.77 Chicago, IL86,729.68 36 2.38 19 4.02 38 2065.47 23 2901.58 959.93 8 3.46 12 1.96 24 33.25 20 17.15 Cincinnati, OH85,315.72 53 2.13 28 3.76 52 1815.51 31 2702.62 1,043.39 9 3.45 5 2.68 21 35.96 15 24.67 Cleveland, OH80,951.96 46 2.29 17 4.10 50 1856.05 29 2753.72 1,579.72 10 3.43 8 2.36 14 54.19 8 33.39 Columbia, SC83,638.25 34 2.39 31 3.71 43 1996.14 35 2616.43 1,589.52 11 3.42 17 1.74 13 54.30 13 25.42 Columbus, OH
103,965.51 49 2.19 12 4.29 24 2275.88 11 3669.89 2,011.50 12 3.37 9 2.35 8 67.84 6 42.36 Dallas, TX77,669.01 42 2.31 35 3.64 53 1796.46 43 2394.33 1,868.30 13 3.35 10 2.34 10 62.60 7 39.17 Dayton, OH
100,040.46 17 2.60 25 3.82 13 2602.89 16 3205.86 1,052.58 14 3.33 15 1.88 22 35.05 19 18.09 Denver, CO89,321.96 52 2.14 15 4.11 48 1915.25 18 3043.19 2,619.41 15 3.24 13 1.95 5 84.74 4 46.45 Des Moines, IA92,600.78 48 2.26 42 3.31 34 2095.74 34 2628.74 1,828.02 16 3.18 24 1.26 11 58.13 17 21.63 Detroit, MI74,250.85 2 3.61 54 0.68 10 2678.43 55 491.51 2,788.78 17 3.12 14 1.95 4 87.07 3 49.50 Ft. Worth, TX
107,296.18 5 3.19 6 5.37 5 3427.59 4 4539.50 1,002.05 18 2.95 18 1.74 30 29.57 24 16.01 Hartford, CT97,704.06 24 2.55 47 3.12 17 2494.02 33 2638.41 1,049.36 19 2.94 23 1.32 27 30.88 26 12.97 Honolulu, HI
108,671.07 37 2.37 7 5.00 14 2580.85 7 4344.69 931.25 20 2.91 19 1.49 32 27.14 27 12.90 Houston, TX84,808.86 50 2.15 36 3.63 51 1819.57 36 2605.25 1,293.46 21 2.87 20 1.41 18 37.15 21 17.08 Indianapolis, IN85,640.67 28 2.44 41 3.32 35 2088.92 42 2440.70 1,301.24 22 2.85 21 1.39 19 37.03 22 16.90 Kansas City, KS/MO76,209.16 21 2.56 50 2.44 46 1949.60 51 1656.00 389.23 23 2.64 29 0.99 49 10.29 41 3.66 Las Vegas, NV
102,724.06 40 2.35 5 5.40 18 2409.25 6 4368.37 2,205.92 24 2.56 25 1.22 12 56.43 14 25.39 Los Angeles, CA81,243.17 44 2.30 27 3.78 49 1868.77 37 2580.86 3,633.91 25 2.41 16 1.77 3 87.47 1 58.97 Louisville, KY84,694.36 16 2.61 45 3.27 27 2207.44 45 2379.36 1,111.24 26 2.38 27 1.15 33 26.48 31 12.04 Memphis, TN89,080.71 10 2.68 4 6.01 21 2385.52 8 4119.29 1,409.23 27 2.34 26 1.21 26 32.95 23 16.14 Miami, FL90,934.08 29 2.43 22 3.89 28 2206.86 21 2959.69 536.02 28 2.34 30 0.97 45 12.55 37 4.98 Milwaukee, WI
101,574.27 43 2.31 37 3.50 22 2342.98 19 3022.60 1,320.26 29 2.22 28 1.12 31 29.28 25 14.03 Minneapolis, MN95,336.44 55 1.75 55 0.68 56 1666.92 54 630.76 691.49 30 2.14 31 0.90 40 14.82 36 5.97 Naples, FL87,320.30 22 2.56 30 3.74 26 2238.49 30 2752.93 728.15 31 2.11 49 0.17 39 15.33 51 1.22 Nashville, TN78,249.08 14 2.62 11 4.57 39 2047.76 22 2909.10 241.47 32 2.05 22 1.38 56 4.94 43 3.11 New Orleans, LA
129,093.29 56 1.31 3 7.79 55 1685.72 3 7236.02 1,457.55 33 2.05 32 0.88 29 29.88 30 12.28 New York, NY113,578.98 6 3.16 48 2.90 3 3586.18 24 2872.58 1,221.61 34 2.01 35 0.73 34 24.56 33 8.60 Newark, NJ96,127.97 1 3.67 56 0.51 4 3529.29 56 476.44 1,095.46 35 2.00 37 0.66 36 21.88 34 6.97 Oakland, CA89,453.96 38 2.37 33 3.65 32 2115.74 27 2764.31 532.14 36 1.94 34 0.74 48 10.32 39 3.78 Omaha, NE
114,342.71 4 3.35 20 3.93 2 3824.90 10 3755.46 1,582.75 37 1.93 33 0.82 28 30.61 29 12.41 Orange County, CA76,897.69 12 2.65 23 3.86 40 2034.11 40 2486.32 1,076.40 38 1.93 48 0.21 37 20.75 46 2.21 Orlando, FL92,565.77 19 2.59 49 2.79 20 2398.05 48 2265.34 355.65 39 1.76 39 0.58 55 6.27 47 2.01 Philadelphia, PA79,618.65 8 2.74 38 3.46 31 2184.22 46 2346.52 1,004.62 40 1.73 52 0.09 38 17.42 53 0.92 Phoenix, AZ81,237.83 31 2.41 21 3.91 45 1961.40 32 2658.38 682.61 41 1.72 50 0.14 46 11.74 52 0.93 Pittsburgh, PA84,561.18 18 2.60 46 3.19 29 2201.16 47 2325.37 4,002.43 42 1.66 36 0.69 9 66.57 12 26.63 Portland, OR74,951.71 3 3.52 52 2.30 12 2638.35 52 1547.23 5,541.42 43 1.61 40 0.54 2 89.41 10 29.02 Providence, RI87,332.79 41 2.33 16 4.10 41 2033.61 20 2974.17 5,099.48 44 1.59 43 0.37 6 80.96 18 18.74 Richmond, VA84,817.29 20 2.58 43 3.29 30 2191.80 44 2393.37 567.31 45 1.56 38 0.64 51 8.85 42 3.54 Sacramento, CA85,691.27 39 2.36 40 3.35 42 2018.56 41 2459.05 533.26 46 1.49 41 0.50 52 7.97 44 2.60 Salt Lake City, UT89,570.98 26 2.51 10 4.58 25 2247.13 14 3340.12 785.37 47 1.47 45 0.32 47 11.56 45 2.47 San Antonio, TX81,495.32 23 2.56 18 4.08 36 2088.25 28 2762.42 2,521.85 48 1.46 54 -0.06 20 36.81 54 -1.52 San Diego, CA98,823.82 11 2.68 14 4.18 11 2650.79 13 3418.35 1,621.47 49 1.44 51 0.11 35 23.33 50 1.72 San Francisco, CA
169,768.91 54 1.89 2 8.34 6 3206.04 2 9990.24 2,904.81 50 1.42 42 0.44 16 41.16 28 12.48 San Jose, CA184,596.59 51 2.15 1 8.58 1 3973.91 1 11082.97 758.39 51 1.34 47 0.25 50 10.18 49 1.88 Sarasota, FL78,346.76 13 2.65 53 1.33 37 2073.98 53 979.84 565.60 52 1.26 55 -0.36 53 7.13 55 -2.09 Seattle, WA
110,137.25 25 2.52 29 3.75 8 2771.78 12 3475.04 1,186.72 53 1.15 44 0.37 44 13.65 38 4.36 St. Louis, MO72,496.64 27 2.48 34 3.64 54 1795.79 49 2231.06 1,361.10 54 1.09 56 -0.42 41 14.77 56 -5.85 Tampa, FL79,968.22 30 2.43 24 3.85 47 1944.61 38 2579.82 1,360.26 55 1.05 46 0.28 42 14.27 40 3.70 Tulsa, OK
118,202.91 45 2.30 8 4.66 9 2716.20 5 4466.45 5,039.65 56 0.66 53 0.04 25 33.02 48 1.95 Washington, DC2.51 3.83 2346.34 3097.80 2.41 1.23 35.50 15.86 Average
Total Employment
Annual Growth Rate Absolute Annual Growth
Current '04-'09 '04-'09 '99-'04 '99-'04 '09-'04 '04-'09 '99-'04 '99-'04[000’s] Rank [%] Rank [%] Rank [000’s] Rank [000’s] MSA’s
Average Household Income
Annual Growth Rate Absolute Annual Growth
Current '04-'09'04-'09 '99-'04 '99-'04 '04-'09 '04-'09 '99-'04 '99-'04[$] Rank [%] Rank [%] Rank [$] Rank [$]
2004
DEMOGRAPHIC AND ECONOMIC TRENDS Mid Year 2004
TABLE 33 continued
2004
SOURCE: NPA Data Services, Inc., compiled by IRR

APPENDIX
32 INTEGRA REALTY RESOURCES, INC. VIEWPOINT 2005
TABLE 35
HOUSEHOLD GROWTHTop 10 Markets
Annual Growth Rate Absolute Annual Growth
'04-'09 '04-'09 '99-'04 '99-'04 '04-'09 '04-'09Rank (%) Rank (%) MSA Rank (000’s)
1 3.57 1 3.68 Naples, FL 41 4.242 2.98 4 2.66 Orlando, FL 9 20.683 2.85 2 3.45 Las Vegas, NV 13 18.994 2.85 5 2.59 Phoenix, AZ 2 37.755 2.83 3 3.10 Austin, TX 20 14.956 2.61 6 2.50 Atlanta, GA 1 43.167 2.60 7 2.46 Sacramento, CA 15 17.458 2.48 10 2.05 Sarasota, FL 33 7.089 2.47 13 1.80 Tampa, FL 6 26.91
10 2.45 15 1.64 San Diego, CA 7 26.172.77 2.59 IRR Top 10 Average1.43 1.23 IRR MSA Average
SOURCE: NPA Data Services, Inc., compiled by IRR
POPULATION GROWTH Top 10 Markets
Annual Growth Rate Absolute Annual Growth
'04-'09 '04-'09 '99-'04 '99-'04 '04-'09 '04-'09Rank (%) Rank (%) MSA Rank (000’s)
1 3.32 1 3.57 Naples, FL 39 9.582 2.75 6 2.63 Orlando, FL 9 50.003 2.62 3 3.36 Austin, TX 17 36.914 2.61 4 2.69 Phoenix, AZ 2 93.965 2.60 2 3.41 Las Vegas, NV 11 45.796 2.41 5 2.67 Atlanta, GA 1 109.487 2.35 7 2.39 Sacramento, CA 14 42.188 2.24 12 1.90 Sarasota, FL 32 14.289 2.23 14 1.77 Tampa, FL 7 57.55
10 2.21 18 1.60 Salt Lake City, UT 20 31.492.53 2.60 IRR Top 10 Average1.22 1.28 IRR MSA Average
SOURCE: NPA Data Services, Inc., compiled by IRR
TABLE 34 TABLE 36
AVERAGE HOUSEHOLD INCOME GROWTHTop 10 Markets
Annual Growth Rate Absolute Annual Growth
'04-'09 '04-'09 '99-'04 '99-'04 '04-'09 '04-'09Rank (%) Rank (%) MSA Rank ($’s)
1 3.67 56 0.51 Oakland, CA 4 3529.292 3.61 54 0.68 Ft. Worth, TX 10 2678.433 3.52 52 2.30 Providence, RI 12 2638.354 3.35 20 3.93 Orange County, CA 2 3824.905 3.19 6 5.37 Hartford, CT 5 3427.596 3.16 48 2.90 Newark, NJ 3 3586.187 2.97 51 2.32 Baltimore, MD 15 2557.018 2.74 38 3.46 Phoenix, AZ 31 2184.229 2.68 44 3.28 Austin, TX 19 2401.56
10 2.68 4 6.01 Miami, FL 21 2385.523.16 3.08 IRR Top 10 Average2.51 3.83 IRR MSA Average
SOURCE: NPA Data Services, Inc., compiled by IRR
TABLE 37
TOTAL EMPLOYMENT GROWTHTop 10 Markets
Annual Growth Rate Absolute Annual Growth
'04-'09 '04-'09 '99-'04 '99-'04 '04-'09 '04-'09Rank (%) Rank (%) MSA Rank (000’s)
1 4.26 6 2.57 Orlando, FL 15 50.302 4.06 1 5.00 Naples, FL 54 6.853 3.76 4 2.71 Austin, TX 23 34.834 3.76 7 2.44 Phoenix, AZ 7 79.365 3.67 3 3.39 Las Vegas, NV 17 38.156 3.63 11 2.09 Atlanta, GA 1 106.347 3.51 2 3.54 Sarasota, FL 43 13.758 3.46 12 1.96 Salt Lake City, UT 24 33.259 3.45 5 2.68 Sacramento, CA 21 35.96
10 3.43 8 2.36 Tampa, FL 14 54.193.70 2.87 IRR Top 10 Average2.41 1.23 IRR MSA Average
SOURCE: NPA Data Services, Inc., compiled by IRR
APPENDIXFor additional industry trend charts, check on-line atwww.irr.com.

Every effort has been made in this publication to provide accurate information regardingthe subject matters covered. Provided in this publication are the analyses and opinionsderived from the available data of the members of Integra Realty Resources, Inc. and otherreputable services. While the available data is presumed to be accurate, this publication isdistributed with the understanding that it does not render legal, accounting, appraisal,counseling, investment or other professional advice. Should such services or other expertassistance be needed, it is recommended that the servicesof a competent person, having access to the detailsof the situation, be employed.
Copyright © February 2005, Integra Realty Resources, Inc.Viewpoint 2005 Editor: Kevin K. Nunnink, MAI3 Park Avenue, 39th FloorNew York, NY 10016(212) 255-7858, ext. 2021

CORPORATE OFFICEJeffrey Rogers – President and COO3 Park Avenue, 39th FloorNew York, NY 10016-5902212-255-7858 FAX: 646-424-1869E-mail: [email protected]
ATLANTA, GAJ. Carl Schultz, Jr., MAI, SRA, CRE1795 Peachtree Street NE, Suite 200AAtlanta, GA 30309-2338404-897-1866 FAX: 404-897-1053E-mail: [email protected]
AUSTIN, TXRandy A. Williams, MAI3700 W. Parmer Lane, Suite 101Austin, TX 78727512-459-3440 ext. 15 FAX: 512-459-4423E-mail: [email protected]
BALTIMORE, MDG. Edward Kerr, MAIPadonia Centre30 E. Padonia Road, Suite 302Baltimore, MD 21093-2345410-561-9320 FAX: 410-561-9322E-mail: [email protected]
BOSTON, MA David L. Cary, MAI, SRA, CRE313 Congress Street, Suite 100 Boston, MA 02210617-451-9110 FAX: 617-451-0039E-mail: [email protected]
CHARLOTTE, NCFitzhugh L. Stout, MAI, CRE1919 South Boulevard, Suite 102Charlotte, NC 28203704-376-0295 ext. 101 FAX: 704-342-3704E-mail: [email protected]
CHICAGO, ILJeffrey G. Pelegrin, MAI 300 S. Wacker Drive, Suite 3525Chicago, IL 60606-6610312-922-8500 ext. 1010 FAX: 312-922-8501E-mail: [email protected]
CHICAGO, ILGary K. DeClark, MAI, CRE566 West Lake Street, Suite 320Chicago, Illinois 60661312-346-3200 FAX: 312-228-4908E-mail: [email protected]
CINCINNATI, OHGary S. Wright, MAI, SRA7807 Laurel AvenueCincinnati, OH 45243-2608513-561-2305 FAX: 513-561-2881E-mail: [email protected]
COLUMBIA, SCMichael B. Dodds, MAI, CCIM500 Lawand Dr., 2nd FloorColumbia, SC 29210803-772-8282 ext. 110 FAX: 803-772-0087E-mail: [email protected]
COLUMBUS, OHEric E. Belfrage, MAI, CRE, ISHC1900 Crown Park CourtColumbus, OH 43235614-451-3211 ext. 109 FAX: 614-451-9599E-mail: [email protected]
DALLAS, TXMark R. Lamb, MAI, CPAPark Central VII12750 Merit Drive, Suite 801Dallas, TX 75251972-960-1222 FAX: 972-960-2922E-mail: [email protected]
DAYTON, OHMark L. Middleton, MAI, SRA105 Riverside DriveDayton, OH 45405937-228-4402 FAX: 937-228-4418E-mail: [email protected]
DENVER, COBrad A. Weiman, MAI 2000 S. Colorado Blvd., Suite 10800 Tower 1Denver, CO 80222303-300-3320 ext. 109 FAX: 303-300-3789E-mail: [email protected]
DETROIT, MIAnthony Sanna, MAI400 West Maple, Suite 100Birmingham, MI 48009-3351248-540-0040 ext. 107 FAX: 248-540-8239E-mail: [email protected]
FORT WORTH, TXDonald J. Sherwood, MAI930 West First Street, Suite 303Fort Worth, TX 76102817-332-5522 ext. 204 FAX: 817-336-1621E-mail: [email protected]
GREENVILLE, SCMichael B. Dodds, MAI, CCIM101 Lavinia Avenue, 2nd FloorGreenville, SC 29601864-282-0001 FAX: 864-232-2360E-mail: [email protected]
HARTFORD, CTMark F. Bates, MAI, CRE64 Pratt StreetHartford, CT 06103860-246-3888 FAX: 860-246-3931E-mail: [email protected]
HOUSTON, TXDavid R. Dominy, MAI5718 Westheimer, Suite 1100Houston, TX 77057713-243-3300 FAX: 713-243-3301E-mail: [email protected]
INDIANAPOLIS, INMichael C. Lady, MAI, SRA, CCIM4981 N. Franklin RoadIndianapolis, IN 46226317-546-4720 FAX: 317-546-1407E-mail: [email protected]
KANSAS CITY, KS/MOKevin K. Nunnink, MAI1901 West 47th Place, Suite 300Westwood, KS 66205-1834913-236-4700 FAX: 913-236-4307E-mail: [email protected]
LAS VEGAS, NVShelli L. Lowe, MAI 10181 Park Run, Suite 210Las Vegas, NV 89145702-869-0442 FAX: 702-869-0955E-mail: [email protected]
LOS ANGELES, CAJohn G. Ellis, MAI20720 Ventura Blvd., Suite 240Woodland Hills, CA 91364-6264818-593-7200 ext. 16 FAX: 818-593-7201E-mail: [email protected]
LOUISVILLE, KYGeorge M. Chapman, MAI, SRA, CRE3703 Taylorsville Road, Suite 205Louisville, KY 40220502-452-1543 FAX: 502-451-3657E-mail: [email protected]
MEMPHIS, TNJ. Walter Allen, MAI4934 William Arnold RoadMemphis, TN 38117901-866-4934 FAX: 901-767-4918E-mail: [email protected]
MIAMI, FLMichael Y. Cannon, MAI, SRA, CRE9400 S. Dadeland Boulevard, PH-1Miami, FL 33156-2817305-670-0001 ext. 212 FAX: 305-670-2276E-mail: [email protected]
MILWAUKEE, WISean Reilly, MAIPlaza East Office Center330 E. Kilbourn Ave., Suite 1145Milwaukee, WI 53202414-727-2966 FAX: 414-727-2970E-mail: [email protected]
MINNEAPOLIS, MNMichael F. Amundson, MAI, CCIM222 South Ninth Street, Suite 3220Minneapolis, MN 55402612-339-7700 FAX: 612-339-7937E-mail: [email protected]
MORGANTOWN, WVThomas A. Motta, MAI714 Venture Drive, PMB 179Morgantown, WV 26508-7306304-864-8660 FAX: 603-415-2566E-mail: [email protected]
NAPLES, FLThomas Tippett, MAI4795 Enterprise AvenueNaples, FL 34104-7042239-643-6888 FAX: 239-643-6871E-mail: [email protected]
NASHVILLE, TNR. Paul Perutelli, MAI, SRA5123 Virginia Way, Suite B-23Brentwood, TN 37027615-377-9715 FAX: 615-377-9975E-mail: [email protected]
NEW JERSEY, ATLANTIC COAST Anthony S. Graziano, MAI, CRE1415 Hooper Avenue, Suite 202Toms River, NJ 08753-2887732-244-7000 FAX: 732-505-9498E-mail: [email protected]
NEW JERSEY, NORTHERN Barry J. Krauser, MAI, CREP. O. Box 2135/161 Madison Ave., Suite 8Morristown, NJ 07962-2135973-538-3188 ext. 103 FAX: 973-285-5045E-mail: [email protected]
NEW YORK, NYRaymond T. Cirz, MAI, CRE3 Park Avenue, 39th FloorNew York, NY 10016-5902212-255-7858 ext. 2020FAX: 646-424-1869E-mail: [email protected]
ORANGE COUNTY, CALarry D. Webb, MAI29811 Santa Margarita Parkway, Suite 300Rancho Santa Margarita, CA 92688-3612949-709-7200 ext. 225 FAX: 949-709-7201E-mail: [email protected]
ORLANDO, FLCharles J. Lentz, MAI28 West Central Boulevard, Suite 300Orlando, FL 32801-2431407-843-3377 FAX: 407-841-3823E-mail: [email protected]
PHILADELPHIA, PAJoseph D. Pasquarella, MAI, CRE200 S. Broad Street - Suite 510Philadelphia, PA 19102215-587-6000 ext. 123 FAX: 215-587-6007E-mail: [email protected]
PHOENIX, AZWalter Winius, Jr., MAI, CRE 3010 North 2nd Street, Suite 101Phoenix, AZ 85012602-266-5599 FAX: 602-266-1515E-mail: [email protected]
PITTSBURGH, PAPaul D. Griffith, MAI3104 Unionville Road, Suite 120Cranberry Township, PA 16066724-742-3324 FAX: 724-742-3390E-mail: [email protected]
PORTLAND, ORBrian A. Glanville, MAI, CRE812 SW Washington St., Suite 850Portland, OR 97205-3231503-222-7066 FAX: 503-274-8630E-mail: [email protected]
PROVIDENCE, RI Gerard H. McDonough, MAI365 Eddy StreetProvidence, RI 02903401-273-7710 FAX: 401-273-7410E-mail: [email protected]
RICHMOND, VA Robert E. Coles, MAI, CRE4447 Cox RoadGlen Allen, VA 23060-3326804-346-2600 ext. 210 FAX: 804-747-9140E-mail: [email protected]
SACRAMENTO, CAScott Beebe, MAI1015 25th Street, Suite 210Sacramento, CA 95816916-554-6492 ext. 13 FAX: 916-554-6493E-mail: [email protected]
SAN ANTONIO, TX Martyn C. Glen, MAI, CRE, FRICS115 East Travis St., Suite 616San Antonio, TX 78205210-225-7700 ext. 17 FAX: 210-225-6800E-mail: [email protected]
SAN DIEGO, CA Lance W. Doré, MAI2250 Third AvenueSan Diego, CA 92101619-744-4040 ext. 2001 FAX: 619-744-4041E-mail: [email protected]
SAN FRANCISCO, CA Jan Kleczewski, MAI155 Sansome St., Suite 650San Francisco, CA 94104415-248-5000 ext. 105 FAX: 415-248-0080E-mail: [email protected]
SARASOTA, FL Julian Stokes, MAI, CRE, CCIM3307Clark Road, Suite 101Sarasota, FL 34231941-923-8588 FAX: 941-923-8893E-mail: [email protected]
SAVANNAH, GA J. Carl Schultz, Jr., MAI, SRA, CRE145 Bull StreetSavannah, GA 31401912-234-4647 FAX: 912-233-1773E-mail: [email protected]
SEATTLE, WAAllen N. Safer, MAI1424 Fourth Avenue, Suite 310Seattle, WA 98101206-903-6700 ext. 206 FAX: 206-623-5731Email: [email protected]
TAMPA, FL Bradford L. Johnson, MAI4915 West Cypress Street, Suite 200Tampa, FL 33607813-287-1000 ext. 121 FAX: 813-281-0681E-mail: [email protected]
TULSA, OKRobert E. Gray, MAI 6940 South Utica Avenue, Suite 100Tulsa, OK 74136918-492-4844 FAX: 918-493-7155E-mail: [email protected]
WASHINGTON, DC Patrick C. Kerr, MAI, SRAThe Flagship Building11785 Beltsville Drive, Suite 150Beltsville, MD 20705-4025301-586-9320 FAX: 301-586-9322E-mail: [email protected]
INTEGRA REALTY RESOURCES, INC. LOCAL OFFICES
INTERNATIONAL OFFICE
IRR DE MÉXICOU.S. Liaison OfficeOscar J. Franck Y Terrazas, Managing Director2549-B Eastbluff Dr., # 466-BNewport Beach, CA 92660Tel: 949-644-2833 Fax: 949-644-2932E-mail: [email protected]