COMPREHENSIVE OPERATIONAL ANALYSIS & MANAGEMENT PLAN … 2018-2022 Comprehensive Operational...
88
COMPREHENSIVE OPERATIONAL ANALYSIS & MANAGEMENT PLAN FY 2018-2022 June 2017 Prepared by: Lima-Allen County Regional Planning Commission 130 W. North Street Lima, Ohio 45801 419-228-1836 In Consultation with: Allen County Regional Transit Authority 200 E. High Street Lima, Ohio 45801 419-222-2782 The preparation of this report was financed in part by the Federal Highway Administration, the Ohio Department of Transportation, the Ohio Department of Public Safety, and local units of government. The contents of this report do not reflect the official view and/or policies of the Federal Highway Administration, the Ohio Department of Public Safety, the Ohio Department of Transportation, or local units of government. This report does not constitute a standard specification or regulation.
Transcript of COMPREHENSIVE OPERATIONAL ANALYSIS & MANAGEMENT PLAN … 2018-2022 Comprehensive Operational...

COMPREHENSIVE OPERATIONAL ANALYSIS & MANAGEMENT PLAN
FY 2018-2022
June 2017
Prepared by: Lima-Allen County Regional Planning Commission
130 W. North Street Lima, Ohio 45801
419-228-1836
In Consultation with: Allen County Regional Transit Authority
200 E. High Street Lima, Ohio 45801
419-222-2782
The preparation of this report was financed in part by the Federal Highway Administration, the Ohio Department of Transportation, the Ohio Department of Public Safety, and local units of government. The contents of this report do not reflect the official view and/or policies of the Federal Highway Administration, the Ohio Department of Public Safety, the Ohio Department of Transportation, or local units of government. This report does not constitute a standard specification or regulation.

i
EXECUTIVE SUMMARY
1. Information has been presented throughout this report that reflects the nature and scope of past, present and future public transportation in Allen County, Ohio. The report was prepared for, and with information provided by, the Allen County Regional Transit Authority (ACRTA) in an attempt to document the adequacy of public transportation services currently provided and to present the rationale needed to justify the use of federal/state/local monies in the provision of such services.
2. In CY 2016 the ACRTA reflected a seven (7) member Board of Trustees with an executive
director, a financial director, an operations director, a maintenance manager, two (2) street supervisors, five (5) mechanics, three (3) dispatch operators, thirty-one (31) transit operators (18 full-time, 13 part-time), one (1) administrative assistant, and two (2) Greyhound counter clerks, for a total of forty-eight employees.
3. The weekday route structure covered 1,604.5 miles per day, 142 trips by providing 123.5
hours of service each weekday. The average system speed during CY 2016 was 12.99 miles per hour. The ACRTA provided 257 weekdays of service in 2016. Saturday service covers 367 miles per day, sixty (60) trips and fifty-one (51) hours of service. The average speed for Saturdays in CY 2016 was 11.1. Saturday service accounted for an additional 51 days of service bringing total service to 308 days in 2016. Total fixed route ridership in 2016 was 349,809 and an additional 36,459 passengers using demand response services.
4. The ACRTA owns fourteen (14) fixed route buses, fifteen (15) paratransit vehicles, one (1)
maintenance truck and one (1) administration vehicle. All vehicles of the Fixed Route System are now lift-equipped with hydraulic kneeling capability and/or with low floors to facilitate travel for the mobility impaired. In addition, all paratransit vans in the Uplift fleet are lift-equipped with transit style entry doors for direct entry.
5. The fixed route system profile found customers/clients racially mixed; 44.36 percent African-American, 43.97 percent White, 2.84 percent Hispanic and 8.51 percent “Other”. Further analysis showed that 53.06 percent of ACRTA’s clients were female. In terms of their trip purposes, respondent’s reasons for using the ACRTA were as follows: work related, 25.06 percent; shopping, 25.53 percent; school, 9.69 percent; medical, 17.12 percent; recreational/social/family 15.37 percent; and, nutritional or other, 7.09 percent. Examining usage, 65.11 percent of the passengers rode the ACRTA every day or almost every day, and another 25.54 percent rode twice a week.
6. Of those surveyed on the fixed route system, 59.53 percent felt current services were
excellent and 26.04 percent stated that the services were good. Only 5.02 percent felt that services offered by the ACRTA were unsatisfactory.
7. The FY 2018-2022 Comprehensive Operational Analysis and Management Plan
emphasizes the positive relationship between Section 504 of the Rehabilitation Act of 1973 and the Americans with Disabilities Act of 1990 (ADA), and ACRTA’s compliance. Addressing Environmental Justice (EJ) requirements, the ACRTA, working with the MPO, reviewed the existing fixed routes, current ridership, and the residence as well as employment characteristics of low income and minority populations in the Lima Urbanized Area. The MPO supported the ACRTA expenditures as necessary to maintain public transportation service as an alternative mode of travel, providing accessibility, choice, and travel opportunity to the community’s transportationally disadvantaged.
8. Federal and state grant allocations, as well as operational costs, outlined in Section 4. Table
4-3 documents expenses and revenue for CY 2016, showing a shortfall of $120,091.

ii
Section 5 reveals an ongoing deficit of roughly $1.16 million over the 2017-2021 period unless additional revenue is found or operating costs are reduced significantly.
9. From a capital improvement perspective, rolling stock, improved dispatching capabilities and
automated vehicle locators are of major importance to maintaining ACRTA’s mission of providing transport to the needy maximizing efficiencies and supporting the coordination of paratransit service between and amongst local non-profit agencies.
10. Average passengers per mile on the fixed route system was up .11 from 2015 while cost per
mile was down by $1.10 per mile. Cost per hour for Demand response dropped by $12.95.

iii
TABLE OF CONTENTS
SECTION PAGE EXECTUIVE SUMMARY ...................................................................................................... i TABLE OF CONTENTS ........................................................................................................ iii LIST OF TABLES, MAPS & ILLUSTRATIONS ...................................................................... v 1 INTRODUCTION ....................................................................................................... 1 - 1
1.1 Rationale ....................................................................................................... 1 - 2 1.2 Objective ........................................................................................................ 1 - 2 1.3 Public Participation ........................................................................................ 1 - 3 1.4 Overview ........................................................................................................ 1 - 3
2 DEMOGRAPHIC OVERVIEW & DEMAND FOR ESTIMATION ................................. 2 - 1 2.1 Population ...................................................................................................... 2 - 1 2.2 Area Employment .......................................................................................... 2 - 1 2.3 Demand for Transit ........................................................................................ 2 - 3 2.4 Travel Generators .......................................................................................... 2 - 3 2.5 Demographic Profile of Service Area ............................................................. 2 - 5 2.6 Summary ....................................................................................................... 2 - 19
3 OVERVIEW OF ACRTA SYSTEM ............................................................................. 3 - 1 3.1 Management Structure & Operating Personnel .............................................. 3 - 1 3.2 Bus Facilities .................................................................................................. 3 - 1 3.2.1 Transit Properties ............................................................................... 3 - 2 3.2.2 Transit Vehicles .................................................................................. 3 - 3 3.2.3 Bus Shelters ....................................................................................... 3 - 4 3.3 Service Area .................................................................................................. 3 - 4 3.4 Fare Structure ................................................................................................ 3 - 5 3.5 Transfer Policy ............................................................................................... 3 - 5 3.6 Fixed Routes & Schedules ............................................................................. 3 - 6 3.7 Utilization of Fixed Route Services ................................................................. 3 - 7 3.8 Paratransit Service Program .......................................................................... 3 - 8 3.8.1 Paratransit Hours & Days of Service .................................................. 3 - 9 3.8.2 Paratransit Eligibility ........................................................................... 3 - 9 3.8.3 Paratransit Ridership Scheduling ....................................................... 3 - 9 3.9 Demand Response Services .......................................................................... 3 - 9 3.9.1 Complementary Paratransit Services ................................................. 3 - 10 3.9.2 Coordinated Demand Response Services .......................................... 3 - 10
4 TRANSIT SERVICE DEVELOPMENT ....................................................................... 4 - 1 4.1 Operational Efficiency & Effectiveness ........................................................... 4 - 1 4.1.1 Operational Planning .......................................................................... 4 - 2 4.1.2 Service Improvements ........................................................................ 4 - 2 4.1.3 Coordination of Services .................................................................... 4 - 3 4.2 Funding, Revenues & Expenses .................................................................... 4 - 4 4.3 Summary ....................................................................................................... 4 - 7

iv
TABLE OF CONTENTS (Continued)
SECTION PAGE 5 TRANSIT DEVELOPMENT PROGRAM GOALS ....................................................... 5 - 1 5.1 Management Plan .......................................................................................... 5 - 1 5.2 Status of Transit Development Goals & Objectives ........................................ 5 - 2 5.3 Financial Management ................................................................................... 5 - 7 5.4 Capital Improvement Program Plan ............................................................... 5 - 8 APPENDICES
FIXED ROUTE SURVEY RESULTS ......................................................................... A - 1
2016 UPLIFT SURVEY ANALYSIS ........................................................................... B - 1
MAJOR EMPLOYMENT SITE MAPS ........................................................................ C - 1
LEVEL OF SERVICE ANALYSIS .............................................................................. D - 1

v
LIST OF TABLES, MAPS & ILLUSTRATIONS
TABLES PAGE Table 2-1 Allen County Population by Political Subdivision 1980-2010 ....................... 2 - 1 Table 2-2 Lima Area Employers by Site Location for Map 2-3 ..................................... 2 - 6 Table 2-3 Travel Generators by Site Location Number ............................................... 2 - 6 Table 2-4 Demographic Summary of Census Tracts within Study Area ...................... 2 - 7 Table 3-1 ACRTA Service Fleet December 31, 2016 .................................................. 3 - 4 Table 3-2 2016 ACRTA Fare Structure ....................................................................... 3 - 6 Table 3-3 ACRTA Weekday Operating Route Profile 2016 ......................................... 3 - 6 Table 3-4 ACRTA Weekday Route Service Miles Per Hour 2016 ................................ 3 - 7 Table 3-5 ACRTA Saturday Route Service Miles Per Hour 2016 ................................ 3 - 7 Table 3-6 ACRTA Fixed Route Service Statistics January-December 2016 ................ 3 - 8 Table 3-7 CY 2016 ADA Service Criteria .................................................................... 3 - 12 Table 3-8 2016 Demand Response Service Delivery to Stakeholders......................... 3 - 13 Table 4-1 Comparison of Service Effectiveness - Performance Measures .................. 4 - 2 Table 4-2 Comparison of Service Effectiveness - Recovery Ratios ............................. 4 - 3 Table 4-3 ACRTA Actual Revenue Expenses - Ended December 31, 2016 ................ 4 - 4 Table 4-4 Five Year Revenue Comparison ................................................................. 4 - 6 Table 4-5 Revenue by Percentage .............................................................................. 4 - 6 Table 5-1 ACRTA Financial Plan ................................................................................ 5 - 8 Table 5-2 Proposed ACRTA Capital Improvement Schedule (2017-2021) .................. 5 - 9 MAPS Map 2-1 Allen County Base Map ............................................................................... 2 - 2 Map 2-2 ACRTA 2016 Fixed Route System .............................................................. 2 - 4 Map 2-3 Major Employers within the Fixed Route Service Area ................................ 2 - 8 Map 2-4 Social Service Agencies within the Fixed Route Service Area ..................... 2 - 9 Map 2-5 Shopping Facilities within the Fixed Route Service Area ............................. 2 - 10 Map 2-6 Medical & Residential Care Facilities within the Fixed Route Service Area ........................................................... 2 - 11 Map 2-7 RTA Fixed Route by Census Tract .............................................................. 2 - 12 Map 2-8 Percentage of Population 65 Years and Older by Census Tract .................. 2 - 13 Map 2-9 Percentage of Population below Poverty Level by Census Tract ................. 2 - 14 Map 2-10 Percentage of Population with Mobility Limitation by Census Tract ............. 2 - 15 Map 2-11 Percentage of Population with No Vehicle by Census Tract ........................ 2 - 16 Map 2-12 Percentage of Minority Population by Census Tract .................................... 2 - 17 Map 2-13 Work Sites by Number of Employees within Fixed Route Service Area ....... 2 - 18 Map 2-14 Degree of Demand for Transportation by Census Tract .............................. 2 - 20 Map 3-1 ACRTA Service Route Areas by Type ......................................................... 3 - 11 ILLUSTRATIONS Illustration 3-1 Management Structure & Operating Personnel ........................................... 3 - 2 Illustration 3-2 2016 Fixed Route Ridership by Month ........................................................ 3 - 8 Illustration 3-3 Paratransit/Demand Response Ridership 1991-2016 .................................. 3 - 10 Illustration 4-1 2016 Revenue ............................................................................................. 4 - 5 Illustration 4-2 2016 Expenses ........................................................................................... 4 - 5 Illustration 4-3 Revenue Comparison by Year .................................................................... 4 - 6

1 - 1
SECTION 1 INTRODUCTION
Evident by the late 1800's, urban America had been shaped by its dependency upon the ability to move goods and people as efficiently and cheaply as possible. A historical retrospective reveals that the horse-drawn omnibus was the ever-important mode of public transport between 1830 and 1860; and, whereas cable cars performed admirably between 1860 and 1890, the most universal mode of public transportation from 1890 to the 1940's, in all but the largest of cities, was the electric streetcar. Not only did these early transportation systems lace the urban structure of cities together, they affected the arrangement and function of elements within the structure of cities. The introduction of the twentieth century's most profound technological development, the automobile, drastically changed the predominant urban structure along with the means of transporting goods and people. The effect that motorized transport had upon the system of transportation in the urban environment and its internal structure was immense. Travel was no longer confined to the fixed route system of the electric streetcars and the railroad. People and goods were free to move as they wished. Their schedules were no longer determined by the rigidity of the public transit system. The transit system's linear and inflexible routes, geared to the traditional downtown, became increasingly irrelevant, for with this new freedom of movement came the decentralization of activities, both residential and employment, and the elimination of the transport monopoly enjoyed by fixed route transit. An irreversible decline in ridership seems to have befallen public mass transit since the end of World War II in all but the largest urban centers. For as income increased, so did automobile ownership and non-work related trips that furthered the decentralization of employment sites and residential preference to the suburbs. The reason public mass transit was losing its share of the market seemed due to the fact that it was not patterned to compete effectively with the automobile in terms of out-of-pocket commuting costs, travel time, comfort and safety; for mass transit was still structured to service the typical downtown-oriented travel commutes. As a result, mass transit has increasingly drawn its market share from captive riders or those who have no other choice. Although the automobile is now the predominant and preferred mode of transportation within the region, recent research has indicated generational support for public transportation services. Several recent trends affecting the Baby Boomer generation (those born between 1946 and 1964) and now the largest generation ever, the Millennials (those born between 1982 and 2003), may broaden the customer base of public transit. Consider the fact that our workforce is graying — not just because the population as a whole is growing older, but because older adults are staying in the labor force longer. This trend intensified during the recession and reflects a variety of factors including: (1) the need for older Americans to reenter the workforce, or (2) to delay retirement and keep working because of economic conditions, declining investment returns, or reductions in government benefits; and, (3) the overall health of older residents permit many to stay employed longer. From a transportation perspective, the continued employment of seniors coupled with the aging process suggests a definite need for employment-based public transportation services.
Looking forward, there is a tendency for the Millennials, especially the young professionals, to delay the purchase of a car and more likely to “opt-in” to car ownership – as part of a multi-modal strategy. The Millennials want options for getting around. Millennials are less likely to feel they have to have a car to get to the places they need to and more likely to use multiple transportation options on a daily basis. Millennials are more health conscious, economically-

1 - 2
minded and aware of their carbon footprint than those in the Baby Boomer generation and prefer walking, biking and public transit over automobiles because they are more frugal and mindful of the environmental impacts of the auto.
Recent literature has also emphasized that even among captive riders (the poor, the aged, and the disabled) public transit is too inflexible in routing and often dangerous to those who suffer physical disabilities. Studies cite that low income workers find multiple transfers, which can be costly in terms of time are all too often necessary to get from some neighborhoods to suburban sites, while the elderly and disabled find it difficult to utilize public transit due to associated walks to and from bus stops, long waits, the need to step in and out of vehicles, the lack of adequate seating space, and the rapid acceleration/deceleration of vehicles. Taken collectively, data suggests a sizeable segment of our population is forced to, or prefers to, rely upon public transit to satisfy employment, medical, school and/or personal travel needs. And for this reason, urban centers must continue to provide, fund and improve public
transportation. This study has been prepared, in part, to examine public transportation within
Allen County and develop a Comprehensive Operational Analysis & Management Plan (COA) for the Allen County Regional Transit Authority (ACRTA) so as to better enable the ACRTA to accommodate the travel needs of area residents.
1.1 Rationale In accordance with the Urban Mass Transportation Act of 1964, as amended, the Federal Transit Administration (FTA) has become the principal source of federal financial assistance for aiding urban areas in the planning, development, and improvement of comprehensive mass transportation systems. Such financial assistance is provided through a variety of programs within the FTA's statutory authority.
Under the auspices of the Section 5307 Planning Program, the FTA provides financial assistance to state and local governments to aid in the preparation of plans and cost-effective Transportation Improvement Programs (TIPs), which guide the use of Federal capital assistance resources. Although a discretionary program, the distribution of such funds to states and each of 465 urbanized areas is done using a population weighted allocation so that the planning grants are tracked and released in the same way as capital grants.
Recipients of such funding in an Ohio urbanized area, although not required, have been strongly encouraged by the Ohio Department of Transportation (ODOT) to prepare a Comprehensive Operational Analysis & Management Plan in order to support requests for federal funds made in their capital improvement program. This requirement was considered by the Lima-Allen County Regional Planning Commission (LACRPC) during the formulation of this COA. Since the report addresses both FTA and Federal Highway Administration (FHWA) planning requirements, applicants for this type of capital assistance programming may use the document for the purpose of complying with other FTA/FHWA requirements, providing that their proposed projects comply with the information outlined herein.
1.2 Objective
The objective of this report, which examines public mass transportation as provided by the ACRTA, is three-fold: (1) to document the present nature and scope of public transit services; (2) to assess the adequacy of existing transit services and propose alternatives; and, (3) to provide a detailed rationale for the FY 2018-2022 capital improvement program. This report is intended to provide the insights and justification

1 - 3
necessary to develop a financially sound public transportation service and to serve as a guide for policy and technical committees.
1.3 Public Participation
The LACRPC, as the Metropolitan Planning Organization (MPO), has an adopted Public Involvement Plan and participatory process that was submitted and accepted by the Ohio Department of Transportation (ODOT) and the Federal Highway Administration (FHWA). The LACRPC provides planning services to the Transit Authority under a Memorandum of Understanding as prescribed by ODOT, the MPO and the Transit Authority. The adopted Public Involvement Plan receives regular attention in order to serve as the public participation process for the ACRTA program of projects, meeting the requirements of Section 5307 (b) as prescribed in FTA C 9030.1E DATE 1/16/2014. As such, the public participation was designed to include but not limited to: (1) press release sent to the media making the document available for citizen review and comment; (2) a one-page summary made available on the MPO and Transit Authority website with document availability upon request; (3) a hard copy of complete document available at the offices of the LACRPC, Transit Authority, City of Lima Mayoral Office as well as that of Board of County Commissioners of Allen County, Ohio and the Lima Public Library; complete document is also available at http://LACRPC.com for download; (4) complete document provided to members of various LACRPC committees; (5) ACRTA and LACRPC staff attended meetings to discuss the COA with neighborhood associations and service organizations; and, (6) one-on-one communication soliciting comments from transit riders while conducting ridership surveys.
1.4 Overview
This study is composed of several distinct sections. The Introduction is followed by a Demographic Overview that provides information of the area's population and income, travel generators, and demand for transit. Section 3 provides an overview of the ACRTA fixed route system, the paratransit system, the ACRTA fare structure and the ACRTA budget. Section 4 provides an overview of service developments and improvements. The emphasis in Section 4 falls into four areas: (1) operations planning; (2) service improvements; and, (3) coordination of services; (4) funding. Section 5 presents a review of transit development program goals established by the ACRTA for the FY 2018-2022 period, as well as policies and practices associated with realizing such goals. Following a Report Summary, an Appendix provides ridership surveys for both fixed route and demand response services.

2 - 1
SECTION 2 DEMOGRAPHIC OVERVIEW & DEMAND FOR ESTIMATION
The City of Lima, located in Allen County, Ohio, is part of the only urbanized area in west central Ohio. Allen County's size is 410 square miles with 13.7 square miles within the municipal limits of Lima. Allen County is both urban and rural in nature, with its urban population centralized around the City of Lima (refer to Map 2-1). The community’s demographics have changed over time and such change has necessarily affected the delivery of the ACRTA’s services. The remainder of this section examines key demographic indices to provide baseline information on the overall demand for public transportation by specific segments of the population. 2.1 Population
Population figures released in the most recent census report suggest that Allen County had a population of 106,331 residents in 2010 with the City of Lima having a total population of 38,771 individuals. Reviewing 2000 and 2010 census figures, Allen County realized a 2.0 percent decrease in population while the City of Lima experienced a 6.8 percent loss. The County's more urbanized area, including the City of Lima, combined with the four surrounding Townships of American, Bath, Perry and Shawnee, comprise 72.4 percent of the County's 2010 population. Table 2-1 reveals Allen County population figures from 1980 through 2010 by political subdivision.
TABLE 2-1 ALLEN COUNTY POPULATION BY POLITICAL SUBDIVISION
1980-2010
Subdivision 1980 1990 % Change 1980-1990
2000 % Change 1990-2000
2010 % Change 2000-2010
Allen County 112,241 109,755 -2.2 108,473 -1.2 106,331 -2.0
Amanda Township American Township Auglaize Township Bath Township Jackson Township Marion Township Monroe Township Perry Township Richland Township Shawnee Township Spencer Township Sugar Creek Township
1,769 12,825 2,548 9,997 2,702 2,734 1,621 3,586 1,628
12,344 925
1,242
1,773 12,407 2,778
10,105 2,737 2,775 1,622 3,577 1,821
12,133 832
1,311
0.2 -3.3 9.0 1.1 1.3 1.5 0.1
-0.3 11.9 -1.7
-10.1 5.6
1,913 14,019 2,850 9,819 2,936 2,872 1,720 3,620 2,015
12,220 871
1,330
7.9 13.0 2.6
-2.8 7.3 3.5 6.0 1.2
10.7 0.7 4.7 1.4
2,071 12,476
2,366 9,725 2,611 2,777 1,702 3,531 1,955
12,433 844
1,283
8.3 -11.0 -17.0 -1.0
-11.0 -3.3 -1.0 -2.5 -3.0 1.7 -3.1 -3.5
Village of Beaverdam Village of Cairo Village of Elida Village of Ft. Shawnee Village of Harrod Village of Lafayette City of Lima Village of Spencerville Village of Bluffton* City of Delphos*
492 596
1,349 4,541
506 488
47,827 2,184 3,237 3,984
467 473
1,486 4,128
537 449
45,549 2,288 3,206 3,901
-5.1 -20.6 10.2 -9.1 6.1
-8.7 -4.8 4.8
-1.0 -2.1
356 499
1,917 3,855
491 304
41,578 2,235 3,719 3,972
-23.8 5.5
29.0 -6.6 -8.6 -3.2 -8.7 -2.3 16.0 1.8
382 524
1,905 3,726
417 445
38,771 2,223 3,952 3,938
7.3 5.0 -0.6 -3.3
-15.1 46.4 -6.8 -0.5 6.3 -0.9
* Pertains to Allen County portions only.
1990 Urbanized Population – 64,389 2000 Urbanized Population – 75,059 2010 Urbanized Population – 78,801
2.2 Area Employment
Lima and Allen County are not very different from other small, urbanized, Midwestern cities. Beginning in the 1960s and 1970s, decentralization and suburbanization of employment, commercial and residential activities, had marked effects on public transit within the Lima Urbanized Area, as has the shift in its economic base due to deindustrialization.

£¤30
66
§̈¦75
CF&E RR
CF&E RR
R.J. Corman RR
CSX Tra
nsport
ation, I
nc.
R.J. Corman RR
Indian
a & Oh
io RR
MARION TOWNSHIP
SPENCER TOWNSHIP
AMANDA TOWNSHIP
AMERICAN TOWNSHIP
SUGAR CREEK TOWNSHIP
MONROE TOWNSHIP
RICHLAND TOWNSHIP
JACKSON TOWNSHIP
BATH TOWNSHIP
AUGLAIZE TOWNSHIPPERRY TOWNSHIP
SHAWNEE TOWNSHIP
Cridersville
CSX Tra
nsport
ation, I
nc.66 198
81
81
309 115
309
196
117117
65
696
65
501
103
§̈¦75
£¤30
Lima
Bluffton
Delphos
Elida
Spencerville
BeaverdamCairo
Harrod
Lafayette
CSX
Norfolk Southern RR
MAP 2-1ALLEN COUNTY BASE MAP
·
2 - 2
Date: May 2017Dwg by: DD
0 5 102.5Miles

2 - 3
In the past, the County enjoyed a strong manufacturing sector within its economic base, but the economic recession of the early 1980s forced the closing of two of the area's largest employers, Clark Equipment and Sheller Globe, eliminating over 2,000 jobs. Subsequent downturns in the economy coupled with the elimination of government defense programs compelled other major local employers to cut back and/or close operations such as General Dynamics, Airfoil Textron, Westinghouse and Sundstrand. Allen County's economic base continues to undergo transition out of the Great Recession and is experiencing renewed growth in various sectors with the number of business establishments expanding. Over the past two decades, the most significant change has been a shift from the manufacturing sector to the service sector, with local employment in the manufacturing sector decreasing by 20.0 percent and service sector employment increasing by 55.0 percent. Today the service sector accounts for 32.6 percent of all employment in Allen County. And while manufacturing has declined, recent data suggests a resurgence in the manufacturing sector. Based upon historical precedents, available land, existing infrastructure, educational investment, as well as the area's strong work ethic, such growth is expected to continue.
2.3 Demand for Transit
Demand for transit service is, at least conceptually, directly related to population growth, and hence based upon residential, commercial, and industrial development. Following such a premise, as an area's population and employment base increases, the demand for, and ultimately ridership of, public transit would theoretically grow as well. Historically, public transit in Allen County has only serviced the urbanized area around the City of Lima; but, various factors have resulted in a geographically expanded service area with increasing ridership. Map 2-2 illustrates the current fixed route system of the ACRTA.
The related processes of decentralization, global mergers, and corporate downsizing have resulted in the loss of several large transit demand generators. Employment growth moving out of the central business district (CBD) and into the suburbs increased the travel distance to work/services for the general public. In addition, this migration resulted in increased pressure to enlarge the public transit service area. Despite the loss of the aforementioned generators and the associated population decline, ACRTA has refined its service to generate almost 350,000 fixed route trips in 2016. However, the current fiscal capacity of ACRTA simply does not allow for a major extension of the service area without a significant increase of fiscal support from local political subdivisions and/or taxes and levies. In sum, the consumer market for the ACRTA has changed its location and its customers, and the continuation of system services is dependent upon the ability to secure adequate and stable funding.
The remainder of this section will identify transit demand generators and deal with specific characteristics of the service area, the consumers of public transit, and the adequacy of present public mass transportation within Allen County.
2.4 Travel Generators
The key to maximizing the productivity and efficiency of any public transportation system is the identification of the origins and destinations of a majority of the trips made each day. By identifying the destinations of these trips, it is possible to distinguish travel generators and construct a route schedule that will take into consideration the needs of the ridership, while taking advantage of centralized locations and an economy of scale in delivering such services.

MAP 2-2ACRTA 2016 FIXED ROUTE SYSTEM
Route1. W. Market2. Eastgate3. Lima Mall / Edgewood4. North Main5. South Main6. West North7. North East / PG Shuttle8. South Metcalf / JFS9.South Shawnee / Apollo
0 2 4 6 8 10Miles·
2 - 4

2 - 5
Within Allen County, the City of Lima's CBD must be considered the dominant activity center. Due to the large number of firms and their employees located within the 30 block area (bordered by W. Wayne Street to the north, Elm Street to the south, McDonel Street to the west, and Central Avenue to the east), the CBD must also be considered as the major travel generator. Although the CBD is the dominant generator, it is not alone. There are several other areas located within the Lima Urbanized Area that are also significant traffic generators. These areas are often based on the location of a single large travel generator, or a cluster of smaller activity centers located within close proximity to each other. Examples of major travel generators include the Lima Mall, located in American Township, or St. Rita's Medical Center, located at 730 West Market Street in Lima. In addition to the large single travel generators, there are a few areas in the urbanized area where several smaller clustered activities are located in close proximity to each other. When combined, these also could be considered as travel generators; examples would include the activity areas centered around roadways servicing business and industry in the areas of Bible/Sugar, Allentown/Cable, Elida/Cable, as well as Ft. Amanda/Buckeye.
Table 2-2 identified those employers within the fixed route service area by site location number. Map 2-3 reveals the location of such employers by site number. Detailed maps depicting major employment sites along each of the nine (9) routes can be found in Appendix C. Map 2-4 reveals the location of private and public social service agencies that tend to be major generators within the City of Lima. Map 2-5 reveals the location of the various shopping facilities servicing the Allen County population and Map 2-6 depicts the location of the healthcare facilities within the region. Table 2-3 provides the identity of the respective facilities by site identification number and map number. Collectively, the maps reveal the extent to which the area employers, the social service agencies, shopping centers, and healthcare facilities are geographically clustered. In an attempt to study the degree to which the Lima area's major travel generators are being serviced by the ACRTA, an overlay of the present route system is imposed on the various maps along with the location of previously identified travel generators. Currently, a vast majority of the generators have access to service. Analysis of the various maps reveal that while the majority of the area's social service agencies, healthcare facilities, and shopping centers are being serviced, there are several generators that are presently excluded, including such major employers as Superior Forge, Joint Systems Manufacturing Center, and Scot Lad Foods.
2.5 Demographic Profile of Service Area
It has been widely accepted that certain segments of the population are more likely to need and make use of public transit services than the general population as a whole. In general, persons more likely to utilize public transit services, as provided by the ACRTA, are those with one of the following characteristics: over 65 years of age, earn below the local average income, suffer from a transportation disability, are of minority status, or are less likely to have access to a private automobile. An assessment of the area's transit services and system potential demand depends on various income and household characteristics. Table 2-4 presents key socio-demographic characteristics as documented at the tract level census data. Map 2-7 documents the parameters of the individual census tracts within the Lima Urbanized Area. In an attempt to use sociodemographic variables as barometers of an area's demand for service, Maps 2-8 through 2-12 depict the present transit service area's character. Map 2-13 examines local employers by size of their work force and their location within the service area.

2 - 6
TABLE 2-2 LIMA AREA EMPLOYERS BY SITE LOCATION FOR MAP 2-3
Site Employer Site Employer
1 2 3 4 5 6 7 8 9 10 11 12 13 14 15 16 17 18 19 20 21 22 23 24
25
St. Rita's Medical Center Lima Memorial Hospital Ford Proctor & Gamble Lima Refinery Allen County Correctional Institution General Dynamics Dana UNOH Nickles Bakery Walmart-Eastgate Interim Health Care Spartan Stores Walmart -Allentown Meijer National Payroll Service Bob Evans Foods Lima Community Health Center High School of Multi Intelligences Rhodes State College Apollo Lima Memorial Professional Corporation Crothall Laundry Metokote Shawnee Manor
26 27 28 29 30 31 32 33 34 35 36 37 38 39 40 41 42 43 44 45 46 47 48 49 50
ODOT East of Chicago Pizza PCS Nitrogen Mid-American Cleaning Orthopaedic Institute of Ohio Menards Coleman Professional Service Lima Convalescent Home WOCAP Institute for Orthopaedic Surgery OSU INEOS Texas Roadhouse Sam’s Club Pepsi Lowe’s Accubuilt YMCA SCCI Hospitals of Lima Shawnee High School Kohl’s City of Lima UPS Allen County Educational Service Superior Forge
TABLE 2-3 TRAVEL GENERATORS BY SITE LOCATION NUMBER
Map 2-4 Map 2-5 Map 2-6
Site Social Service Providers Site Shopping Facilities Site Medical/Residential
Care Facilities
1 2 3 4 5 6 7 8 9 10 11 12 13 14 15 16 17 18
Area Agency on Aging Senior Citizens Service Goodwill Industries Association for Retarded Citizens Lutheran Social Services West Ohio Community Action Partnership Allen County Council on Aging Marimor Industries United Way of Greater Lima U. S. Social Security Administration Allen County Dept. of Job & Family Services Allen County Elderly Legal Services Bureau for the Visually Impaired Salvation Army Community Center Easter Seals Society Allen County Board of DD Children’s Development Center Mental Health & Recovery Services
1 2 3 4 5 6 7 8 9 10 11
Eastgate Shopping Center Lima Mall Meijer Northland Plaza Sam’s Club Clock Tower Plaza Westgate Center Lima Plaza Eastgate Walmart Lima Center Eastown Plaza
1 2 3 4 5 6 7 8 9 10 11 12 13 14 15 16 17 18 19
St. Rita’s Medical Center Lima Memorial Hospital Lima Community Health Center Shawnee Manor Nursing Home Orthopedic Institute of Ohio Lima Convalescent Home Plus Management Services SCCI Hospitals of Lima Lima Manor Springview Manor Nursing Home Orchards of Lima Living & Rehab Lost Creek Care Center St. Rita’s Lima St. Rita’s Professional Service Gastro Intestinal Associates Lima Senior Living Champaign Residential Services OB/GYN Specialists of Lima Burton’s Ridge
The geographic distribution of the populations most likely to use transit services can be spatially depicted by census tract. The highest concentration of the elderly, portrayed on Map 2-8, are located in tracts 101, 103, 106, 108, 109, 113, 114, 116, 118, 119, 120, 121, 130, 133, and 140 with significant concentrations in 101, 108, 116, 119, and 120. Map 2-9 suggests that census tracts 110, 123, 124, 127, 129, 134, 136, 137, 138, and 141 have the highest proportion of persons below the poverty level, with significant amounts found in 127, 129, 134, 137, and 141. Map 2-10 suggests that tracts 102, 116, 119, 122, 124, 127, 132, 133, 134, 136, 137, 138, and 141 have a significant proportion of persons suffering from mobility disabilities. Tracts 109, 119, 122, 124, 126, 127, 129, 132, 133, 134, 136, 137, 138, and 141 identified in Map 2-11, had the highest proportion

2 - 7
of households with no vehicle available, with significant numbers in 127, 129, 134, 137, and 141. Map 2-12 suggests that tracts 110, 112, 122, 124, 126, 127, 129, 130, 132, 133, 134, 136, and 137 have the highest percentage of minorities. In addition, with respect to the major employers discussed in Section 2.4, Map 2-13 identifies tracts 112, 112, 122, 124, 126, 127, 129, 130, 132, 133, 134, 136, 137, 138, and 141 as having the highest number of employees.
TABLE 2-4 DEMOGRAPHIC SUMMARY OF CENSUS TRACTS WITHIN STUDY AREA
Census Tract
Total Population
Percent Over 65
Percent Minority
Percent with Mobility
Limitation
Percent Below
Poverty Level
Percent with No Vehicle Available
101 102 103 106 108 109 110
4,433 4,105 1,533 5,052 7,673 4,796 5,796
20.6 15.4 16.4 15.8 20.2 16.8 14.9
5.0 1.1 0.3 5.1 4.4
16.1 19.0
5.6 8.0 3.5 6.9 5.7 6.3 7.3
6.9 1.7 3.0 5.5 1.1 6.0
19.1
4.6 2.4 1.5 3.3 4.0 8.9 3.0
112 113 114 115 116
2,635 7,419 2,988 2,748 2,768
8.6
19.7 16.6 12.5 20.1
27.6 6.5 0.3 3.5 3.4
7.1 5.4 6.3 7.2 8.0
0.0 3.7 3.9 5.6 5.4
4.7 2.9 1.4 4.4 4.7
118 119 120 121
2,606 3,025 2,243 3,467
19.1 22.3 22.6 17.4
12.8 7.3 5.4
11.6
5.8
11.1 5.0 6.2
3.9 2.1 1.0 2.1
0.5 7.9 0.4 2.1
122 123 124 126
3,559 3,855 2,630 1,969
9.8
10.0 7.9
13.7
33.1 16.0 24.3 19.0
9.6 5.6 9.5 4.4
16.7 18.4 22.7 16.6
13.1 4.4
20.7 8.4
127 129 130 131
1,898 1,483 4,392 2,347
5.6 7.9
18.1 13.2
40.9 37.0 17.9 16.1
11.4 5.5 6.8 3.0
39.8 33.1 13.2 5.4
22.8 24.2 7.6 3.6
132 133 134 136
1,914 1,308 2,457 1,290
10.0 18.4 13.1 7.1
39.5 46.9 37.6 51.2
8.2
16.5 17.6 13.1
8.7 6.1
47.8 20.7
11.8 21.9 34.3 11.2
137 138 139 140 141
1,165 2,827 3,347 3,413 2,055
9.2
11.9 13.6 19.9 6.0
61.5 65.0 1.9 5.0
50.8
14.8 12.0 6.6 4.5
11.7
30.2 19.4 0.1 4.9
26.0
25.7 22.1 5.3 4.3
30.1
Mobility, vehicle, and poverty level figures reflect 2015 ACS data. Numeration varied between the 2000 and 2010 census tracts with 125, 117 and 135 respectively.
There are also correlations, which can be seen throughout the maps, between the census tracts discussed above. Several demographic characteristics discussed are prevalent throughout tracts 124, 127, 133, 134, 136, 137, 138, and 141. These tracts indicate the highest propensity to use and/or need public transportation, provided that the system services these areas.

3
4
2
86
5
1
7
9
46
192036
49
1139
40
38
24
48
13
10
23
3530
26
42
18
34
1722
47
32
2743
29
50
161244
33
283725
21
14
1531
41
45
MAP 2-3MAJOR EMPLOYERS WITHIN
THE FIXED ROUTE SERVICE AREA
Route1. W. Market2. Eastgate3. Lima Mall / Edgewood4. North Main5. South Main6. West North7. North East / PG Shuttle8. South Metcalf / JFS9.South Shawnee / ApolloEmployer Location
0 1 2 3 4 5Miles·
1 47
27
43
16
1244
INSERT 1
INSERT 1
DATA SOURCE: 2016 ES202DATE: MAY 2017
DWG BY: DM
2 - 8

!(
!(
!( !(!(
!(!(
!(
!(
!(
!(
!(!(
!(
!(
!(
!(
!(
8
2
3
94
5 7
6
1
18
15
17
14
1613
11
12
10
0 1 2 3 4 5Miles
MAP 2-4SOCIAL SERVICE AGENCIES WITHIN
THE FIXED ROUTE SERVICE AREA
·Date: May 2017
Dwg by: DM
2 - 9

!(
!(!(
!(!(
!(
!(
!(
!(
!(
!(
!(
9
4
5
1
82
76
3
12
10
·Date: May 2017
Dwg by: DM
0 1 2 3 4 5Miles
MAP 2-5SHOPPING FACILITIES WITHIN
THE FIXED ROUTE SERVICE AREA
2 - 10

!(
!(
!(!(
!(
!(
!(
!(
!(
!(
!(
!(
!(
!(
!(
!(!(
!(
!(
3
9
4
5
7
81
6
2
19
16
1814
17
15
1211
1310
0 1 2 3 4 5Miles
MAP 2-6MEDICAL & RESIDENTIAL CARE FACILITIES WITHIN
THE FIXED ROUTE SERVICE AREA
·Date: May 2017
Dwg by: DM
2 - 11

_̂
102
106
115
114
116
103
113
139
140
108
121119
101
112
110
118
109
120 138
141130
126134
123122
136137
124
131132 127133129
MAP 2-7RTA FIXED ROUTE BY CENSUS TRACT
·
Route1. W. Market2. Eastgate3. Lima Mall / Edgewood4. North Main5. South Main6. West North7. North East / PG Shuttle8. South Metcalf / JFS9.South Shawnee / ApolloCensus Tracts
_̂ Transit Center0 2 4 6 8 10MilesData Source: 2010 Census & ACRTA
Date: May 2017Dwg by: DD
2 - 12

102
106
115
114
116
103
113
139
140
108
121119
101
112
110
118
109
120 138
141130
126134
123122
136137
132 127
124
131 133129
MAP 2-8PERCENTAGE OF POPULATION
65 YEARS AND OLDER BY CENSUS TRACT
·0 2.5 5 7.5 10
Miles
Percent 65 Years and Older7.5% or Less7.6% to 10.0%10.1% to 15.0%15.1% to 20.0%Greater than 20.0%
Data Source: 2015 ACS 5-Year Estimates
Date: May, 2017Dwg by: DD
2 - 13

102
106
115
114
116
103
113
139
140
108
121119
101
112
110
118
109
120 138
141130
126134
123122
136137
132 127
124
131 133129
MAP 2-9PERCENTAGE OF POPULATION
BELOW POVERTY LEVEL BY CENSUS TRACT
Percent Below Poverty5.0% or Less5.1% to 10.0%10.1% to 15.0%15.1% to 20.0%Greater than 20.0% 0 2.5 5 7.5 10
Miles
Data Source: 2015 ACS 5-Year Estimates
Date: May, 2017Dwg by: DD ·
2 - 14

102
106
115
114
116
103
113
139
140
108
121119
101
112
110
118
109
120 138
141130
126134
123122
136137
132 127
124
131 133129
MAP 2-10PERCENTAGE OF POPULATION
WITH MOBILITY LIMITATION BY CENSUS TRACT
Percent with Mobility Limitation5.0% or Less5.1% to 7.5%7.6% to 10.0%10.1% to 15.0%Greater than 15.0%
0 2.5 5 7.5 10Miles
·Data Source: 2015 ACS 5-Year Estimates
Date: May, 2017Dwg by: DD
2 - 15

102
106
115
114
116
103
113
139
140
108
121119
101
112
110
118
109
120 138
141130
126134
123122
136137
132 127
124
131 133129
MAP 2-11PERCENTAGE OF POPULATION
WITH NO VEHICLE BY CENSUS TRACT
0 2.5 5 7.5 10Miles
Percent with No Vehicle2.5% or Less2.6% to 5.0%5.1% to 10.0%10.1% to 15.0%Greater than 15.0%
·Data Source: 2015 ACS 5-Year Estimates
Date: May, 2017Dwg by: DD
2 - 16

102
106
115
114
116
103
113
139
140
108
121119
101
112
110
118
109
120 138
141130
126134
123122
136137
132 127
124
131 133129
MAP 2-12PERCENTAGE OF MINORITY POPULATION
BY CENSUS TRACT
0 2.5 5 7.5 10Miles
Percent of Minorities5.0% or Less5.1% to 10.0%10.1% to 25.0%25.1% to 50.0%Greater than 50.0%
·Data Source: 2015 ACS 5-Year Estimates
Date: May, 2017Dwg by: DD
2 - 17

MAP 2-13WORK SITES BY NUMBER OF EMPLOYEES
WITHIN FIXED ROUTE SERVICE AREA
100 Top Employers50 or Fewer50 to 150151 to 300
301 to 600
Greater than 600
Route1. W. Market2. Eastgate3. Lima Mall / Edgewood4. North Main5. South Main6. West North7. North East / PG Shuttle8. South Metcalf / JFS9.South Shawnee / Apollo
· Data Source: ES 202, 2016Date: May 2017
Dwg by: DM
0 1 2 3 4 5Miles
2 - 18

2 - 19
Map 2-14, a compilation of data from the previous maps, suggests the degree of demand for public transit based on a graduated scale. While tracts 134, 137, and 141 are presumed to have the highest level of need for public transit, tracts 124, 127, 133, 136, and 138 also suggest a strong demand for such services. Examination reveals that all of these tracts are located within the RTA's present service. Map 2-14 clearly demonstrates that the ACRTA fixed route serves those census tracts demonstrating the highest probability of need for public transportation. The Transit Authority’s current fixed route service area, between 6:45 a.m. and 5:15 p.m., incorporates the needs for users of public transportation to get to work in a timely and predictable fashion and the needs of major employers for a steady, dependable workforce. In addition to serving the major employers in the CBD, the ACRTA also serves major retail and service developments located in or near the Lima and American Malls, as well as Eastgate and Clock Tower shopping centers.
The ACRTA service area refers to the geographic area in which the Transit Authority has agreed, under contract or by policy, to provide public transportation services. The ACRTA’s service area differs by type of service. With respect to fixed route transit operations, coverage is considered to include that area within a one-quarter (1/4) mile radius of each fixed route. The current ACRTA fixed route system service area encompasses 38.7 square miles.
With respect to complementary paratransit, the ACRTA provides curb-to-curb service to individuals residing within three miles of the current fixed route system. ACRTA's Uplift is a complementary paratransit program that serves the mobility challenged within Allen County. Any qualifying individual that is prohibited from using the ACRTA regular fixed route bus service, and who is within Zone 1 or Zone 2, approximately three miles off the fixed route, is eligible for the specialized transportation service. The Uplift service area encompasses 68.5 square miles.
Although ACRTA service is concentrated in the City of Lima, it provides limited service to adjacent political subdivisions of American, Bath, Perry, Marion, and Shawnee Townships. The remainder of this chapter will provide a basic history of the ACRTA fixed route system as well as a discussion of operations, ridership, and route changes that has had an impact on that system’s ridership in 2016.
2.6 Summary
In summation, both Lima and Allen County continued the trend begun in 1980 of a consistent pattern in the loss of population. This has also been the overall trend for the outlying area, as ten out of twelve Townships showed population loss. Though Lima’s overall population has declined, the percentage of the remaining population that traditionally demonstrates the need for public transportation services (referring to the poor, elderly, frail, and disabled) has in fact increased.

102
106
115
114
116
103
113
139
140
108
121119
101
112
110
118
109
120 138
141130
126134
123122
136137
124
131132 127133129
MAP 2-14DEGREE OF DEMAND FOR TRANSPORTATION
BY CENSUS TRACT
DemandLowMediumHighFixed Routes 0 2 4 6 8 10
Miles· Data Source: 2015 ACS 5-Year Estimates
Date: May, 2017Dwg by: DD
2 - 20

3 - 1
SECTION 3 OVERVIEW OF ACRTA SYSTEM
A public transportation system is developed and ultimately charged with the responsibility of providing transportation services to the general public. A public transportation system reflects its employees and those vehicles, facilities and equipment necessary to support the movement of passengers and goods. Public transportation typically employs the use of buses, trolleys, vans and other modes including ferries, light rail and trains. In smaller communities it is more common for public transportation services to utilize fixed route bus services and augment such service with paratransit services using specially equipped vehicles to accommodate the mobility limited. Public transportation services are regulated by federal and state standards. Their main sources of financing are fare revenues, governmental subsidies, income or property taxes, and advertisements. Today, public transit systems, like all public entities, are being subjected to ever-increasing scrutiny due to public concerns over increased taxation as well as budget shortfalls at all levels of government. Public transit authorities exist primarily to support the overall mission of providing public transportation in the most efficient and effective means possible. Efficiency indicates the extent to which the Agency produces a given output with the least possible use of resources. Effectiveness has been defined as the comparison of service provided to intended output or objectives. That is, measures of effectiveness are concerned with the extent to which the service is provided – in terms of quantity, location, and character – and corresponds to the goals and objectives established for the transit system by the Transit Authority and the needs of local residents. The remainder of this Section will provide an overview of transit system services within Allen County in an attempt to provide the means to assess the transit system’s efficiency and effectiveness and determine any warranted amendments to system services and/or Agency goals and objectives addressed in Section 5. 3.1 Management Structure & Operating Personnel
In CY 2016 the ACRTA reflected a seven (7) member Board of Trustees with an executive director, a financial director, an operations manager, a maintenance manager, two street supervisors, five (5) mechanics, three (3) dispatch operators, thirty-one (31) transit operators (18 full-time, 13 part-time), one (1) administrative assistant, and two (2) Greyhound Bus counter clerks. In all, there were forty-six (46) employees under the supervision of the executive director, see Illustration 3-1.
3.2 Bus Facilities According to 49 USCS § 5309 [Title 49. Transportation; Subtitle III. General and Intermodal Programs; Chapter 53. Public Transportation], Buses and Bus Facilities include buses for fleet and service expansion, bus maintenance and administrative facilities, transfer facilities, bus malls, transportation centers, intermodal terminals, park-and-ride stations, acquisition of replacement vehicles, bus preventive maintenance, passenger amenities such as passenger shelters and bus stop signs, accessory and miscellaneous equipment such as mobile radio units, supervisory vehicles, fare boxes, computers and shop and garage equipment. Following federal procurement policies, the ACRTA has developed a diverse set of resources to manage and support its fixed route and complimentary paratransit services both to expand its services as well as to support local coordination efforts with area non-profit and social service agencies engaged in demand response paratransit services.

3 - 2
ILLUSTRATION 3-1 MANAGEMENT STRUCTURE & OPERATING PERSONNEL
3.2.1 Transit Properties
Prior to 1998 the ACRTA operated from a combined garage, maintenance, management, and passenger transfer facility located at 240 N. Central Avenue on the northwestern edge of the Lima CBD. The site was problematic because it lacked several significant site elements including adequate parking facilities and appropriate access and egress points. In addition to these shortcomings, the facility, which provided shelter and transfer activities, proved precarious due to the on-site vehicular and pedestrian circulation patterns. In the May 1992 study conducted by ATE Management & Service Company, Inc., the passenger transfer center located in the transit facility yard, was cited as problematic for passenger safety. Therefore, funding for a new transfer facility was sought. The ACRTA eventually secured a site at the corner of High and Union Streets in the Lima CBD and constructed a multimodal transfer facility in 1998. Passengers of both Greyhound and Lakefront are currently serviced at the facility. The facility, approximately 2,880 square feet, houses agency dispatchers, provides a small break area and comfort station for drivers, incorporates Greyhound Services & Sales, and provides nearly 1,000 square feet for passengers/luggage.
The Transit Authority retains the original site at 240 N. Central Avenue as its maintenance facility. The maintenance garage is approximately 17,250 square feet and provides shelter and storage for maintenance personnel and vehicles as well as necessary replacement parts and maintenance equipment. The site also serves to shelter local non-profit vehicles and a bulk fuel distribution center; both
Board of Trustees
Director/CEO
Operations Supervisor
Marketing/Safety Maintenance
Manager
Mechanics
Bus Fueler
Volunteers
UPLIFT Supervisor
Coordinator
Bus Operators
Street Supervisors
Shift Leaders/Trainer
Bus Operators
Dispatch
Financial Director Administrative
Assistant

3 - 3
maintenance and fueling functions are coordinated with area social service and non-profit paratransit providers. The site which housed the Agency’s original administrative offices (built circa 1860) was reconfigured in 2009 to support increased vehicle parking/storage. Construction of a new administrative office building located immediately adjacent to the Transfer Facility began in CY 2002 and was completed in 2003. The 8,200 square feet facility supports transit management and operations allowing ACRTA managers to monitor and accommodate passengers and operational personnel, thereby increasing efficiency. The Transit Authority also rents space to area non-profits who support the coordination of transportation services for dependent populations. The current maintenance facility serves multiple functions at a very busy intersection. The facility supports the parking, storage, maintenance, fueling, etc., for not only the Transit Authority vehicles but also those of area social service agencies. Due to the limited size of the facility, as well as the mix and sizes of the various vehicles, and the number of different agency drivers at the site congestion and safety concerns have risen. In part stemming from the sites age, current configuration and on-going service arrangements in 2016, the ACRTA initiated a search for a larger site to serve as a maintenance facility and bus garage.
3.2.2 Transit Vehicles The ACRTA owns fourteen (14) fixed route buses, fifteen (15) paratransit
vehicles, one (1) maintenance truck, and one (1) admin vehicle. With respect to mass transit vehicles, the fleet reflects: two (2) 1998 Gillig buses, three (3) 2009 Gillig buses, two (2) 2013 Gillig buses, two (2) 2013 Eldorado buses, two (2) 2014 Gilliig buses, a 2016 Gillig bus and a BlueBird purchased in 2007. There are two (2) conversion vans for paratransit services, purchased in 2007 and 2009. In 2012 five (5) Tesco LTV’s were purchased. There are two Chevrolet LTVs a 2011 and a 2015. In 2016 six (6) Ford 450 vehicles were purchased. All paratransit vehicles contain wheelchair lifts and appropriate tie downs.
The seating capacity of the fourteen (14) buses currently within the fleet range from twenty-five (25) to thirty-two (32) seats per vehicle. The Tesco vehicles have a capacity of 20 - 22 passengers. The Ford 450s can seat 21 passengers each. The mean age of the buses within the fleet is 6.7 years. The bus fleet's mean number of vehicle miles based on December 31, 2016, mileage figures are 192,049 miles. The mean mileage of the paratransit vans is 57,352, with a mean age of 2.8 years. Table 3-1 reveals pertinent information pertaining to the service fleet. The entire transit fleet is accessible by wheelchair. Currently a replacement schedule has been developed to support the necessary rolling stock with three (3) Gillig 35’ buses to be delivered in the spring of 2017 to replace the last of the 1998s. Four (4) MV1s are also scheduled to be delivered in 2017. In 2016 ACRTA donated a Dodge van to Church Ministries and a Ford van to Soldiers of Honor, both of the vehicles were past their useful life. All of the Gillig buses have the capability to "kneel", which in effect lowers the height of the bus at the entrance, enabling easier boarding and disembarking for passengers. This accessibility feature is considered essential given the physical

3 - 4
limitations of many ACRTA passengers. Service vehicles are not used to transport passengers. The ease of entry into the paratransit vehicles has also been of interest to the ACRTA. As a result, the agency has required transit-style entry doors on all converted vans in order to provide direct entry. Although this does negatively impact the available seating capacity of the vans by effectively eliminating a front passenger seat, the safety and comfort of passenger access and/or egress is seen to more than offset any need for additional capacity.
TABLE 3-1 ACRTA SERVICE FLEET
DECEMBER 31, 2016
Make/Model Quantity Total
Seating Wheelchair
Accessible Seating Mileage
1991 Chance Trolley 1 Special Events 184,872
1998 Gillig Bus 2 31 2 444,310 435,347
2004 Gillig bus 35’ 1 34 2 227,670
2007 Blue Bird 1 26 2 214,243
2007 Ford E450 1 14 2 151,745
2009 Tesco LTV -25’ 1 20 4 133,073
2009 35' Gillig Bus 2 37 4 278,724 258,698
2009 30' Gillig Bus 1 25 2 303,594
2011 Chevrolet 25’ LTV 1 14 3 59,858
2011 Ford F250 1 Service Vehicle 9,760
2012 Tesco LTV 5 20 22
4 2
85,694 100,366 88,858 61,133 64,607
2013 Ford Explore 1 Service Vehicle 19,082
2013 Gillig 2 32 2 151,997 139,590
2013 Eldorado Bus 35’ 2 33 3 33,781 31,004
2014 35’ Gillig Bus 1 37 4 77,836
2014 30’ Gillib Bus 1 27 2 78,880
2015 Chevrolet 25’ LTV 1 22 3 48,737
2016 30’ Gillig Bus 1 25 2 13,025
2016 Ford 450 6 21 3
10,555 12,243 9,850 6,741
12,944 13,882
Note: Mileage as of December 31, 2016
3.2.3 Bus Shelters
Interior and exterior passenger shelters are located onsite at the Transfer facility. Lighting and waste receptacles as well as restrooms are available. Off-site passenger amenities including shelters, bus stop signage, bicycle racks/storage facilities, racks, and signage are extremely limited. A few offsite bus stop signs were installed in 2016 with more scheduled in 2017. Offsite bus shelters are owned by a private vendor as authorized by the City of Lima.
3.3 Service Area
The service area for the ACRTA refers to the geographic area in which the ACRTA has agreed, under contract, federal statute or by policy, to provide public transportation services. The ACRTA’s service area differs by type of service provided. With respect to
3 - 5
fixed route transit operations, coverage is considered to include that area within a one-quarter (1/4) mile radius of each fixed route. The current ACRTA fixed route system service area encompasses 25.2 square miles.
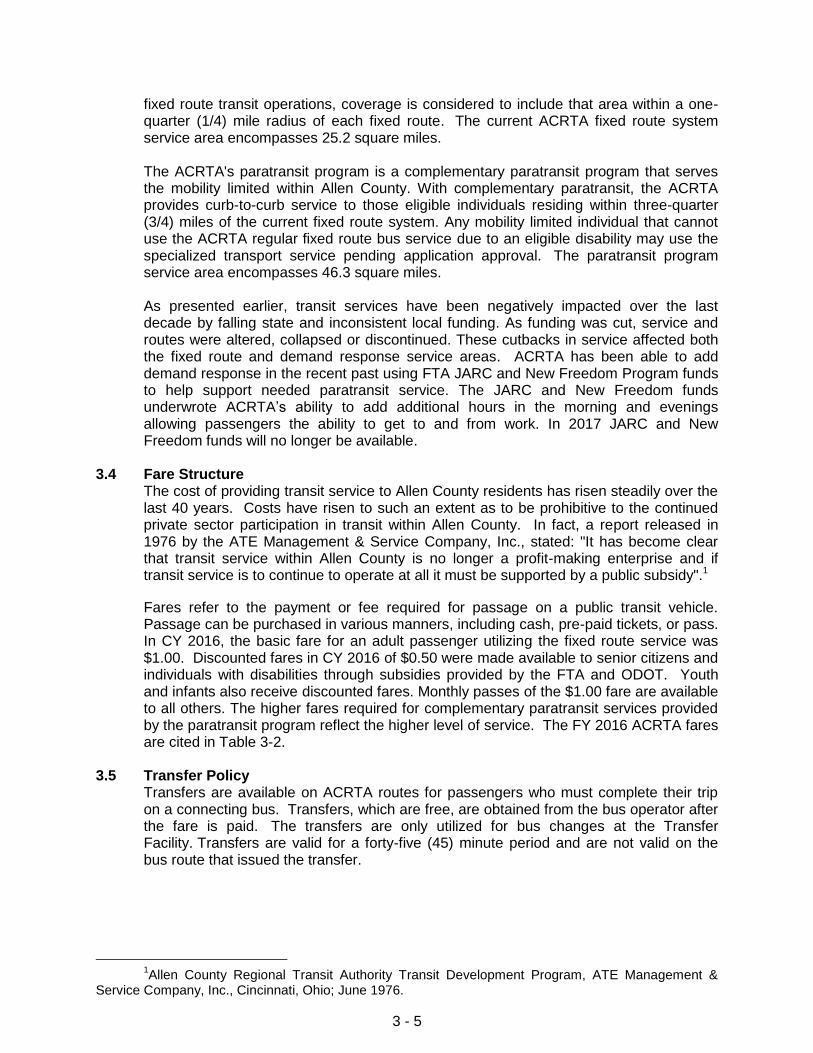
The ACRTA's paratransit program is a complementary paratransit program that serves the mobility limited within Allen County. With complementary paratransit, the ACRTA provides curb-to-curb service to those eligible individuals residing within three-quarter (3/4) miles of the current fixed route system. Any mobility limited individual that cannot use the ACRTA regular fixed route bus service due to an eligible disability may use the specialized transport service pending application approval. The paratransit program service area encompasses 46.3 square miles.
As presented earlier, transit services have been negatively impacted over the last decade by falling state and inconsistent local funding. As funding was cut, service and routes were altered, collapsed or discontinued. These cutbacks in service affected both the fixed route and demand response service areas. ACRTA has been able to add demand response in the recent past using FTA JARC and New Freedom Program funds to help support needed paratransit service. The JARC and New Freedom funds underwrote ACRTA’s ability to add additional hours in the morning and evenings allowing passengers the ability to get to and from work. In 2017 JARC and New Freedom funds will no longer be available.
3.4 Fare Structure
The cost of providing transit service to Allen County residents has risen steadily over the last 40 years. Costs have risen to such an extent as to be prohibitive to the continued private sector participation in transit within Allen County. In fact, a report released in 1976 by the ATE Management & Service Company, Inc., stated: "It has become clear that transit service within Allen County is no longer a profit-making enterprise and if transit service is to continue to operate at all it must be supported by a public subsidy".1
Fares refer to the payment or fee required for passage on a public transit vehicle. Passage can be purchased in various manners, including cash, pre-paid tickets, or pass. In CY 2016, the basic fare for an adult passenger utilizing the fixed route service was $1.00. Discounted fares in CY 2016 of $0.50 were made available to senior citizens and individuals with disabilities through subsidies provided by the FTA and ODOT. Youth and infants also receive discounted fares. Monthly passes of the $1.00 fare are available to all others. The higher fares required for complementary paratransit services provided by the paratransit program reflect the higher level of service. The FY 2016 ACRTA fares are cited in Table 3-2.
3.5 Transfer Policy Transfers are available on ACRTA routes for passengers who must complete their trip on a connecting bus. Transfers, which are free, are obtained from the bus operator after the fare is paid. The transfers are only utilized for bus changes at the Transfer Facility. Transfers are valid for a forty-five (45) minute period and are not valid on the bus route that issued the transfer.
1Allen County Regional Transit Authority Transit Development Program, ATE Management &
Service Company, Inc., Cincinnati, Ohio; June 1976.

3 - 6
TABLE 3-2 2016 ACRTA FARE STRUCTURE
Cash Fares
Adults $1.00
Senior Citizens (65+ with ACRTA ID Card) $0.50
Disabled (with ACRTA ID Card) $0.50
Medicare Cardholder (with ACRTA ID Card) $0.50
Youth (2 to 18) $0.75
Infants (Under age 6) Free
Paratransit $2.00
Monthly Pass
Adults $34.00
Senior Citizens (65+ with ACRTA ID Card) $17.00
Disabled (with ACRTA ID Card) $17.00
Medicare Cardholder (with ACRTA ID Card) $17.00
Youth (6 to 18) $20.00
Ten Ride Tickets
Adult $9.00
Youth (6 to 18)Ten Ride Tickets $6.00
UPLIFT zone 1 $20.00
UPLIFT zone 2 $60.00
3.6 Fixed Routes & Schedules
Fixed route services are those provided on a repetitive, fixed schedule basis along specific routes with vehicles stopping to pick up and deliver passengers; each fixed route trip serves the same origins and destinations. The ACRTA runs weekdays between the hours of 5:50 a.m. and 9:50 p.m. and on Saturday from 7:50 a.m. to 4:50 p.m. No services are provided on Sundays or six (6) major holidays. In CY 2016, the ACRTA provided 308 days of public transportation services. The ACRTA presently serves nine (9) fixed routes utilizing fourteen (14) vehicles Monday through Friday. Fifteen (15) lift-equipped vans are utilized to meet the travel needs of the mobility-limited citizens in the ACRTA’s demand response service on a daily basis. All fixed routes emanate from the centralized transfer facility located at 218 E. High Street in Lima’s Central Business District (CBD). The routes operate on a hub or pulse concept, which brings seven (7) of the routes into the transfer facility at ten (10) minutes before the hour and two (2) of the routes into the facility at twenty (20) minutes after the hour.
TABLE 3-3 ACRTA WEEKDAY OPERATING ROUTE PROFILE
2016
Route Name First Time Out Last Time Out Frequency Total Trips
1. W. Market 6:20 a.m. 9:20 p.m. 60 min 15
2. East Kibby 5:50 a.m. 8:50 p.m. 60 min 15
3. Lima Mall 6:50 a.m. 8:50 p.m. 60 min 14
4. N. Main 5:50 a.m. 9:50 p.m. 60 min 17
5. S. Main 5:50 a.m. 9:50 p.m. 30 min 33
6. W. North 6:50 a.m. 8:50 p.m. 60 min 14
7. Marimor-NE 5:50 a.m. 5:50 p.m. 60 min 10
8. JFS Shuttle 5:50 a.m. 4:50 p.m. 60 min 12
9. S. Shawnee/Apollo 6:20 a.m. 9:20 p.m. 60 min 12
The radial route network in Lima, emanating from the transfer facility, provides good route coverage to the majority of the City's residents, as well as some areas outside the City limits. Considering the spacing of the different routes, most residents are within a

3 - 7
0.25 mile to 0.375 mile radius of a transit route. Such coverage meets general industry guidelines for medium density areas whose population is classified as low income with low automobile ownership ratios. Although there are a few geographically isolated areas that fall between a 0.5 to 1.0 mile radius from a transit route, those districts are located in areas of low population density. The current route network services most major traffic corridors, residential districts, commercial areas, institutional facilities, and other generators.
3.7 Utilization of Fixed Route Services
The ACRTA provides needed transit services to residents in Allen County. Residents from a wide cross-section of the community use its services in their commute to work, school, medical appointments, shopping, social and recreational activities. The current weekday route structure in 2016 covered 1,604.5 miles over 142 trips by providing 123.5 hours of service each weekday. The average system speed for weekdays in CY 2016 was 12.99 miles per hour. The ACRTA provided 257 days of weekday service in 2016. Table 3-4 provides a profile of weekday operations in CY 2016. In 2016, Saturday service covered 367.3 miles; providing 60 trips, and 51 hours of service on Saturdays. The average system speed for Saturdays in CY 2016 was 11.12 miles per hour. The ACRTA provided 51 days of Saturday service in 2016. Table 3-5 provides a profile of Saturday operations in CY 2016.
TABLE 3-4 ACRTA WEEKDAY ROUTE SERVICE
MILES PER HOUR 2016
Route Name Trips Per Day Miles/Day Hours Miles Per Hour
1. W. Market 15 99.0 16 6.19
2. East Kibby 15 184.5 16 11.53
3. Lima Mall 14 197.4 15 13.16
4. N. Main 17 122.4 8 15.30
5. S. Main 33 204.6 16.5 12.40
6. W. North 14 197.4 15 13.16
7. Marimor-NE 10 176.0 12 14.66
8. JFS Shuttle 12 182.4 12 15.20
9. S. Shawnee/Apollo 12 241.2 13 18.55
Total 142 1,604.5 123.5 12.99
TABLE 3-5 ACRTA SATURDAY ROUTE SERVICE
MILES PER HOUR 2016
Route Name Trips Per Day Miles/Day Hours Miles Per Hour
1. W. Market 8 52.8 8 6.60
2. East Kibby 8 98.4 8 12.30
3. Lima Mall 9 126.9 9 14.10
4. N. Main 9 64.8 9 7.20
5. S. Main 18 111.6 9 12.40
6. W. North 8 112.8 8 14.10
Total 60 367.3 51 11.12
The ACRTA tracks all trips, revenue miles and revenue hours for each route during the year. In 2016 ACRTA experienced a single missed trip because of a train and 1

3 - 8
because of a medical emergency. Table 3-6 shows ridership by route for 2016. Illustration 3-2 shows ridership variations by month. In CY 2016, the ACTRA serviced an average of 0.83 passengers per mile serving a total ridership of 340,040 on the fixed route service with an additional 9,769 special service passengers. The ACRTA also provided 5,345 paratransit and 31,114 demand response trips. Thus, total trips provided by ACRTA in CY 2016 were 386,268, of which approximately 93.0 percent were fixed route trips.
TABLE 3-6 ACRTA FIXED ROUTE SERVICE STATISTICS
JANUARY-DECEMBER 2016
Route Name Ridership Per Mile Per Hour Per Trip
1. W. Market 39,897 1.40 8.89 9.43
2. East Kibby 52,625 0.99 11.73 12.43
3. Lima Mall 45,323 0.78 10.58 11.25
4. N. Main 47,240 1.34 18.90 9.85
5. S. Main 75,314 1.27 16.13 8.06
6. W. North 49,657 0.87 11.73 12.48
7. Marimor-NE 10,754 0.24 3.51 4.21
8. JFS Shuttle 17,029 0.36 5.56 5.65
9. S. Shawnee/Apollo 2,201 0.08 0.66 1.42
Total 340,040 0.83 9.97 9.00
Special Services/Trolley/Events 7,539 12.22 72.14 NA
Community 2,230 0.32 7.61 NA
Total 349,809 13.00 90.00 NA
3.8 Paratransit Service Program
The requirements of 49 CFR Part 37 address requirements for complementary paratransit service provided by public entities operating a fixed route system and provision of nondiscriminatory accessible transportation service. Sections 3.8 through 3.9, inclusive, reflect those specific requirements as provided by the ACRTA’s paratransit program. The paratransit program serves the mobility limited within the service area which encompasses 46.3 square miles within Allen County.
-
5,000
10,000
15,000
20,000
25,000
30,000
35,000
40,000
ILLUSTRATION 3-2 2016 FIXED ROUTE RIDERSHIP BY MONTH

3 - 9
3.8.1 Paratransit Hours & Days of Service Paratransit’s service is made available to qualified individuals on the same days and during the same hours as the ACRTA's regular fixed route services. During weekdays, the service operates between the hours of 5:50 a.m. and 9:50 p.m. Saturday service runs from 7:50 a.m. to 5:15 p.m. No service is provided on Sundays or six (6) of the major Holidays. Trip requests for ADA paratransit are available through voicemail messaging during ACRTA non-working hours.
3.8.2 Paratransit Eligibility
In order to utilize the paratransit program service, formal certification is required. Eligibility is based on an evaluation of mobility impairments in three (3) areas: (1) movement; (2) vision; and, (3) cognition. Initial eligibility for service is determined by the ACRTA staff. A doctor’s or medical professional’s signature on the individual’s Program application must verify disabilities. Once certified, the individual receives a Program ID verifying his/her eligibility for service. Since service eligibility is based upon the duration and degree of impairment, a temporary condition would warrant service only for as long as the service is needed, whereas a permanent condition would sanction program eligibility without temporal conditions. The criteria the ACRTA utilizes for eligibility is compatible with the mandates and requirements established in the ADA legislation.
3.8.3 Paratransit Ridership Scheduling The ACRTA provides paratransit services on a next day basis, whereby requests for services will be accommodated when received by certified individuals anytime during the preceding day. Trip reservations can be made up to fourteen (14) days in advance. On days when the ACRTA administrative offices are closed, voicemail messaging is utilized in order to process the requests for next day services. Demand Response Service consists of regularly scheduled trips for people who go to and from the same place at the same time on the same days of the week. ACRTA service to subscription riders currently makes up over 82.6% percent of all rides. If the system were to reach maximum capacity, the ACRTA would need to limit subscription based services to 50.0 percent of paratransit operations per CFR 37.139. Therefore, if capacity is reached, the ACRTA will reserve the right to limit demand response trips. In CY 2016 Demand Response trips served the Allen County Board of Developmental Disability, Area Agency on Aging 3, Jobs and Family Services, Allen County Schools, and many others. ACRTA became a Medicaid provider in July of 2016 and in the last six months of the year 6,562 of the demand response trips were Medicaid eligible.
The ACRTA currently utilizes eight (8) wheelchair lift equipped, fourteen (14) to twenty-two (22) seat LTV vans for paratransit. The ACRTA also uses eight (8) Ford 450 vehicles with seating capacity for twenty-one. The ACRTA also has mutual aid agreements with local paratransit operators who will loan the ACRTA paratransit vehicles should the need ever arise.
3.9 Demand Response Services
In 2013, the Transit Authority saw the number of paratransit trips explode by nearly 90 percent as a result of increased coordination and the availability of JARC and New Freedom funding. In 2014 The ACRTA decided to add demand response services so that many of the trips that were being done under paratransit could be done as a demand response trip and more people could be transported at one time. In 2016 The

3 - 10
ACRTA again made changes to some of the fixed routes to help some of the demand response riders use the fixed route system. The result has been extremely effective.
0
10,000
20,000
30,000
40,000
50,000
60,000
70,000
80,000
90,000
ILLUSTRATION 3-3PARATRANSIT/DEMAND RESPONSE RIDERSHIP 1991-2016
3.9.1 Complementary Paratransit Services
Only 17.3 percent or 5,345 trips of all paratransit trips facilitated by the ACRTA in 2016 were classified as complimentary paratransit pursuant to FTA rules regarding ADA paratransit services. With regards to the ACRTA service area, Map 3-1 depicts the fixed route services and the mandated complimentary paratransit services often referred to as paratransit within the three-quarter (3/4) mile service area as measured from the fixed route. The residential locations of paratransit patrons are depicted in red. Rules of ridership eligibility are
stringently adhered to. To be eligible to use the ACRTA paratransit service, the patron must fill out an application; a portion of which must be completed by a physician. The application is then reviewed by the ACRTA for eligibility based on specific criteria to determine the clients’ level of eligibility, from full eligibility to partial, and/or temporary, by trip location.
Paratransit hours and days of operation mirror the fixed route system. At the end of 2016 the paratransit service was running from 5:50 a.m. to 9:50 p.m. Monday through Friday and from 7:50 a.m. through 5:15 p.m. on Saturday. No trip restrictions are placed on client request nor does a prioritization process based upon the purpose of the service exist. The ACRTA does not restrict nor imply restrictions upon the number of times a client may use its services. The
paratransit services performed admirably with zero (0) missed trips recorded in 2016.
Table 3-7 is provided as a summary of that criteria identified by the ADA and supported by FTA as mandatory service criteria and will summarize ACRTA’s compliance with each of the service issues. Table 3-7 reveals that the ACRTA meets all of the ADA Service Criteria that was expected in CY 2016.
3.9.2 Coordinated Demand Response Services
In an attempt to meet the ever increasing demands of an aging population and rising disability rates, the Transit Authority has worked with other community

MAP 3-1ACRTA SERVICE ROUTE AREAS BY TYPE
Route1. W. Market2. Eastgate3. Lima Mall / Edgewood4. North Main5. South Main6. West North7. North East / PG Shuttle8. South Metcalf / JFS9.South Shawnee / Apollo
Complimentary Paratransit
0 1 2 3 4 5Miles
·Date: May 2017
Dwg by: DD
3 - 11

3 - 12
stakeholders to provide and coordinate services beyond traditional fixed route public transit service and complimentary paratransit. Table 3-8 shows the number of clients for each of the demand response areas as well as the number of no shows and cancelations for each. A no show is recorded when the Transit vehicle arrives to pick up a client for a trip that was set up and the client doesn’t take the trip. No shows not only cost the ACRTA money but also cut back on the number of trips that can be offered to other clients. A cancelation is shown when the client makes arrangements for the trip and then before the van leaves to pick the client up the client calls and cancels the trip.
TABLE 3-7 CY 2016
ADA SERVICE CRITERIA*
Service Issues Status
Service Area:
Origins and destinations within the defined area.
Criteria met.
ACRTA provides its complementary paratransit service to those eligible applicants for locations within three-quarter (3/4) mile of the current fixed route system. In addition, ACRTA provided increased services at a zonal rate for those customers outside of the three-quarter (3/4) mile area.
Response Time:
Requests accepted during normal business hours for service on “next day” basis, requests accepted on all days prior to days of service.
Criteria met.
Eligible program applicants can request paratransit service by telephoning the ACRTA during regular business hours on Monday through Friday. Messages can be left on ACRTA’s voicemail to schedule trips when their office is closed. Trip reservations will be accepted up to fourteen (14) days in advance. All trips not delivered within one (1) hour of the time requested will be logged as a missed trip.
Fares:
No more than twice the base fixed route fare for eligible individuals within three-quarter (3/4) miles of the fixed route, compliance with companion fare requirement and compliance with personal care attendant fare requirement.
Criteria met.
Eligible program applicants receive paratransit services within three-quarter (3/4) miles of the fixed route for twice the fixed route fare, $2.00. Paratransit services requested beyond the three-quarter (3/4) mile area are subject to an additional rate.
Days and Hours Service:
Paratransit provided during all days and hours when fixed route service is in operation.
Criteria met.
Paratransit services are provided during the same days and hours of regular fixed route services.
Trip Purposes:
No restrictions on types of trip purposes and no prioritization by trip purpose in scheduling.
Criteria met.
The ACRTA subjects no trip restrictions or priorities on paratransit program clients.
Capacity Constraints:
No restrictions on the number of trips an individual will be provided, no waiting lists for access to the service, no substantial numbers of significantly untimely pickups for initial or return trips, no substantial numbers of trips with excessive trip lengths, and when capacity is unavailable, subscription trips are less than 50.0 percent.
Criteria met.
The ACRTA places no restrictions on the number of trips a client can use paratransit. The ACRTA has no waiting list for paratransit services. As the ACRTA has not reached capacity constraints, subscription services are at 82.7 percent without any negative consequences to the level of service.
*Per CFR 37.139 (b) (10) and CFR 37.131 (d) (4)

3 - 13
TABLE 3-8 2016 DEMAND RESPONSE SERVICE DELIVERY TO STAKEHOLDERS
Demand Response Completed No Shows Cancelled % of No Shows
Medicaid 6,562 640 483 9.6%
Allen County VA 66 1 2 1.5%
General Public 765 38 169 5.0%
ADA Uplift 5,345 293 1,878 5.5%
AAA3 1,542 179 560 11.6%
County Board of DD 9,683 640 850 6.6%
JFS 4,637 359 1,894 7.7%
Lima City School 2,876 414 386 7.1%
Elida School 1,595 162 176 10.2%
Bath School 117 3 16 2.6%
Bluffton School 325 5 79 1.5%
Total 36,459 2,734 6,493 7.5%

4 - 1
SECTION 4 TRANSIT SERVICE DEVELOPMENT
Federal legislation provides the legal framework that guides the transportation planning process. As it affects transportation, the legislative process is both an incremental and historical process in that each bill defines specific federal policies and establishes regulatory language to address specific issues at a particular point in time. Each subsequent bill then builds upon prior legislation in effect, producing a cumulative impact of incremental actions. Collectively legislative initiatives passed by Congress have incrementally impacted the manner and extent to which transportation programs, including transit, must address accessibility, safety and the environment. Consider that the Americans with Disabilities Act (1990) built on Section 504 of the Rehabilitation Act of 1973 which built on the Architectural Barriers Act of 1968. The Clean Air Act of 1990 required states to integrate both air quality and transportation planning in order to effectively reduce automobile emitted pollutants. ISTEA (1991) required states to fully integrate the larger transportation system with pedestrian walkways and bicycle transportation facilities. In 1994 and later in 1997, USDOT finalized Executive Order 12898 and Environmental Justice (EJ) regulations which prevented the denial of, or reduction in, benefits, and the avoidance of disproportionately high negative impacts on minority and low income populations. TEA-21 (1998), required transit, bicycle facilities and pedestrian walkways be considered, in conjunction with all new construction/reconstruction projects. SAFETEA-LU (2005) elevated the importance of safety by creating a new core safety program and amended the environmental review process. In 2015 President Obama signed into law the Fixing America’s Surface Transportation Act (FAST Act). The FAST Act established a new National Surface Transportation and Innovative Finance Bureau within the Department to serve as a one-stop shop for state and local governments to receive federal funding, financing or technical assistance. The act includes a number of items that strengthen workforce training and improve regional planning. Reviewed collectively, these Acts have addressed and integrated the needs of all Americans with that of the environment providing not only dedicated funding streams but governmental mandates to do so. In cooperation with its various funding sources, the ACRTA has committed to servicing the Lima community with those public transportation services necessary to satisfy local customers and to comply with state and federal regulatory controls. The ACRTA recognizes that the nature and scope of such service varies across the community’s diverse population. Acknowledging such, the ACRTA is interested in, and obligated to, developing the necessary partnerships with local political subdivisions, neighborhood associations, fellow service providers and community service groups, as well as its current customers to better understand and address those diverse needs. The remainder of Section 4 reviews and discusses the major issues confronting the ACRTA at the present time. These issues involve events that have recently transpired, or are now underway, and raise issues that will face transit planners in the near future. 4.1 Operational Efficiency & Effectiveness
The ACRTA maintains that operational efficiency reflects the extent to which the Transit Authority produces the expected output of services with the least possible use of resources. Effectiveness is concerned with the extent to which the service is provided – in terms of quantity, location, and character – and corresponds to the goals and objectives established for the transit system by local government and the needs of its citizens.

4 - 2
The ACRTA recognizes that operational efficiency can be addressed on a number of fronts including: (1) operations planning; (2) service improvements; and, (3) the coordination of services. Operations planning is responsible for efficiently tailoring the supply of transit service between that which is requested or anticipated and the actual demand and available resources. Service improvements are developed to improve performance and satisfy not only local demands for service, but also the manner in which such demands are met. The coordination of services refers to the various arrangements between or amongst those organizations providing transportation services or functions in order to improve the efficiency and effectiveness of such services.
4.1.1 Operational Planning
Operational planning can be divided between maximizing both service effectiveness and service efficiency. Planning analysis requires assessments at the system, route and sub-route levels. The process needs to be sensitive and respond to service indicators and specific productivity standards developed as part of an evaluation network. Such a network defines data collection requirements and guides the analysis of service including such factors as hours of operation, service areas, route locations, travel times and measures of route/trip performance. System level analysis determines how well the system is performing as a whole. A common diagnostic tool used to assess transit systems is a trend line analysis. A trend line analysis consists of a year-to-year examination of indicators for a single system, analyzing how a transit system has been performing over time. The statistical measures are cumulative and show average annual changes in performance. Statistics such as passengers-per-hour (PPH) and passengers-per-mile (PPM) measure service effectiveness. ACRTA has had a goal of 1 passenger per mile on the fixed routes system which has been met only 8 out of the last 16 years.
TABLE 4-1 COMPARISON OF SERVICE EFFECTIVENESS – PERFORMANCE MEASURES
Year
Fixed Demand
PPM Cost per
Mile PPH
Cost per Hour
PPM Cost per
Mile PPH
Cost per Hour
2001 0.96 3.30 12.22 42.26 0.14 2.79 1.59 31.53
2002 1.06 3.79 13.00 46.64 0.14 2.59 1.58 28.61
2003 0.91 5.90 11.38 67.26 0.17 15.24 1.58 25.50
2004 0.91 6.69 11.71 78.43 0.17 12.08 1.68 20.32
2005 0.96 5.27 11.85 62.56 0.21 19.58 2.96 58.11
2006 1.08 5.94 13.36 73.28 0.21 5.19 2.99 73.25
2007 1.14 5.43 14.13 67.27 0.24 6.52 3.20 87.09
2008 1.18 7.08 15.19 91.04 0.22 7.55 2.97 78.74
2009 1.08 5.99 14.40 99.16 0.25 6.19 3.11 75.35
2010 1.03 5.83 13.76 78.25 0.26 6.29 3.09 74.23
2011 1.01 6.42 13.52 85.82 0.32 7.09 3.91 86.63
2012 0.97 5.43 11.88 66.41 0.56 6.99 6.99 108.40
2013 1.01 5.41 12.30 65.95 0.32 5.11 5.11 64.54
2014 0.94 9.45 11.00 110.47 0.21 3.09 2.57 48.02
2015 0.74 7.01 10.85 102.27 0.16 3.27 1.93 38.05
2016 0.83 5.91 11.57 80.45 0.13 1.80 1.89 25.10
4.1.2 Service Improvements Service improvements are strategic responses to routes or service areas identified during the network analysis as inefficient or unproductive with respect

4 - 3
to either system goals or public demands for service. Service improvements are developed to improve performance and satisfy not only local demands for service but also the manner in which such demands can be met given the limited resources available to the ACRTA. Service improvements alter the delivery of service. Such improvements range from balancing services with the level of demand, to schedule adjustments, to reviewing route alignments. Increasing access in certain service sectors of the system are also service improvements as are attempts at improving ridesharing and demand response services.
In 2016, the ACRTA addressed passenger demands in the proximity of existing fixed route service by using route deviation and by adding/changing routes to meet the needs of the public. Under the new policy ACRTA fixed route vehicles may deviate from the route alignment to serve destinations within a prescribed distance of the route.
TABLE 4-2 COMPARISON OF SERVICE EFFECTIVENESS – RECOVERY RATIOS
Year Fixed Demand
Recovery Ratio Operating Expense Recovery Ratio Operating Expense
2001 13.00% $845,603 7.00% $27,088
2002 16.70% $704,897 14.10% $54,674
2003 14.00% $1,026,613 17.90% $199,314
2004 9.50% $1,189,426 2.50% $177,133
2005 14.72% $744,936 11.48% $253,698
2006 11.70% $1,107,142 6.50% $393,757
2007 13.29% $782,338 12.37% $383,651
2008 11.00% $998,713 14.10% $445,136
2009 13.97% $999,365 16.96% $308,492
2010 17.80% $1,082,979 22.74% $319,806
2011 16.46% 1,251,359 55.28% $457,492
2012 10.70% $1,561,575 58.96% $1,255,437
2013 10.00% $1,216,185 49.90% $1,113,968
2014 15.25% $2,294,125 49.68% $724,126
2015 14.11% $2,970,269 47.54% $776,562
2016 12.67% $2,433,039 62.64% $776,562
No Depreciation accounted for.
4.1.3 Coordination of Services Coordination of services between and amongst local transit and paratransit providers is a difficult process and requires open and honest communications. The coordination of services is one area in which the ACRTA has sought to make in-roads with its local partners, not only to improve its own internal performance measures, but also to improve social services, overall mobility within the community and to reduce costs for all concerned. The ACRTA believes that the coordination of services can achieve certain economies of scale, not available to smaller service providers, which can result in significantly higher levels of service for both customers and service providers. The ACRTA believes that coordination would further: (1) increased efficiency; (2) improved vehicle life and reliability; and, (3) reduced operating costs per unit of service.
In CY 2016, ACRTA staff continued to engage the area's human service agencies and paratransit operators providing transportation to the public. The ACRTA reviewed the home/workplace locations of Allen County Board of Developmental Disabilities (ACBDD) clients to better facilitate their travel needs and maximize route productivity.

4 - 4
4.2 Funding, Revenues & Expenses The ACRTA has used a wide variety of sources to fund transit services within Allen County. The ACRTA has utilized federal and state, as well as local monies, especially City monies, in its efforts to finance those capital acquisitions and support the operation of transit services. Transit operations are heavily dependent upon federal and state subsidies, changes at the federal and/or state levels have had significant impacts on local service. As federal/state grants require local fiscal contributions, the City of Lima contributed $95,000 in CY 2016; no other political subdivision contributed funding for operating or capital needs.
In 2016, along with the aforementioned public, federal and state monies, total operational funds also include those funds generated by fares for service, vending machine sales, lottery ticket sales, the sale of advertising (bus signage, route schedules, interior bus signage), demand response to the Allen County Board of Developmental Disabilities, Jobs and Family Services and the provision of special services to area non-profits (maintenance service, fuel sales contracts to area paratransit operators and the leasing of storage space for paratransit vehicles), Greyhound operations, as well as miscellaneous donations and contributions. Local monies are used to match state and federal funds as required in the grant allocation process. Federal and state monies, available through the FTA/ODOT and MPO/CMAQ, will continue to be utilized in the acquisition of capital items such as transit vehicles. State monies have been successfully employed to subsidize the transportation services provided to the elderly and disabled. However, local monies are necessary and required to match federal and state funds in the grant allocation process. In CY 2016 the City’s fiscal contribution covered 2.71 percent of the total ACRTA operating expenses. The total cost of operating public transit services within Allen County derived from passenger fare revenues, demand response, special services, and revenues generated through coordinated activities was 38.08 percent in 2016. The remaining 61.92 percent of operating costs were covered by federal and state funds. Funding public mass transit within Allen County continues to be a significant issue. What’s more, securing local match monies places increasingly more financial pressure on the ACRTA to meet public transportation demands. Table 4-3 reveals the actual operating revenues and expenses of the ACRTA for CY 2016. Capital expenses are not accounted for in this tables or the following charts. Table 4-4 reveals the Transit Authority’s revenue stream over the past five (5) years.
TABLE 4-3 ACRTA ACTUAL REVENUE EXPENSES – ENDED DECEMBER 31, 2016
Operating Expenses Revenues
Salaries/Wages Fringe Benefits Services Materials and Supplies Utilities Casualty/Liability Costs Other Expenses OPERATING EXPENSES Depreciation TOTAL OPERATION EXPENSES
1,197,247 385,674 473,535 548,397 47,132 95,614
169,939 2,917,539
577,678 3,495,217
Planning Funds Interest on Working Capital Fare Revenue Demand Response & Special Services Federal ADA Assistance Federal Operating Assistance Federal Capitalized Maintenance Federal Funding State Operating Assistance Local Operating Assistance State E&D Assistance Advertising Contributed Labor Other Local Revenues Service Maintenance Service TOTAL REVENUES
29,466 9
203,512 444,898 113,736 963,093 420,901 461,444 94,197 95,000 38,790 10,885 24,053
401,592 73,550
3,375,126

4 - 5
ILLUSTRATION 4-12016 REVENUE
Planning Funds Interest on Working Capital
Fare Revenue Demand Response & Special Services
Federal ADA Assistance Federal Operating Assistance
Federal Capitalized Maintenance Federal Capital
State Operating Assistance Local Operating Assistance
State E&D Assistance Advertising
Contributed Labor Other Local Revenues Service
Maintenance Service
ILLUSTRATION 4-22016 EXPENSES
Salaries/Wages Fringe Benefits Services Material and Supplies
Utilities Casualty/Liability Costs Other Expenses Depreciation
Transit system costs are divided into three (3) categories: capital, planning and operating. Operating expenses, those expenses that are consumed in a single year, include items such as labor, materials and supplies. Capital costs are typically nonrecurring or infrequent costs of long-term assets, such as land, buildings, and vehicles and often reflect related expenses such as depreciation. Capital costs tend to be fixed costs, those costs that remain relatively constant irrespective of the level of operational services. Operating costs are more associated with variable costs or those expenditures which are affected by the respective level of transportation services provided, including the frequency of service, the hours of service or the service area and would necessarily include insurance, fuel and vehicle maintenance. Illustration 4-3 shows operating revenue for the past five (5) years and where those funds come from. Federal funds are the main source of income for ACRTA and have been in the past. While federal funds are still the main source for 2016, it is easy to see that local funding has become more important than ever.
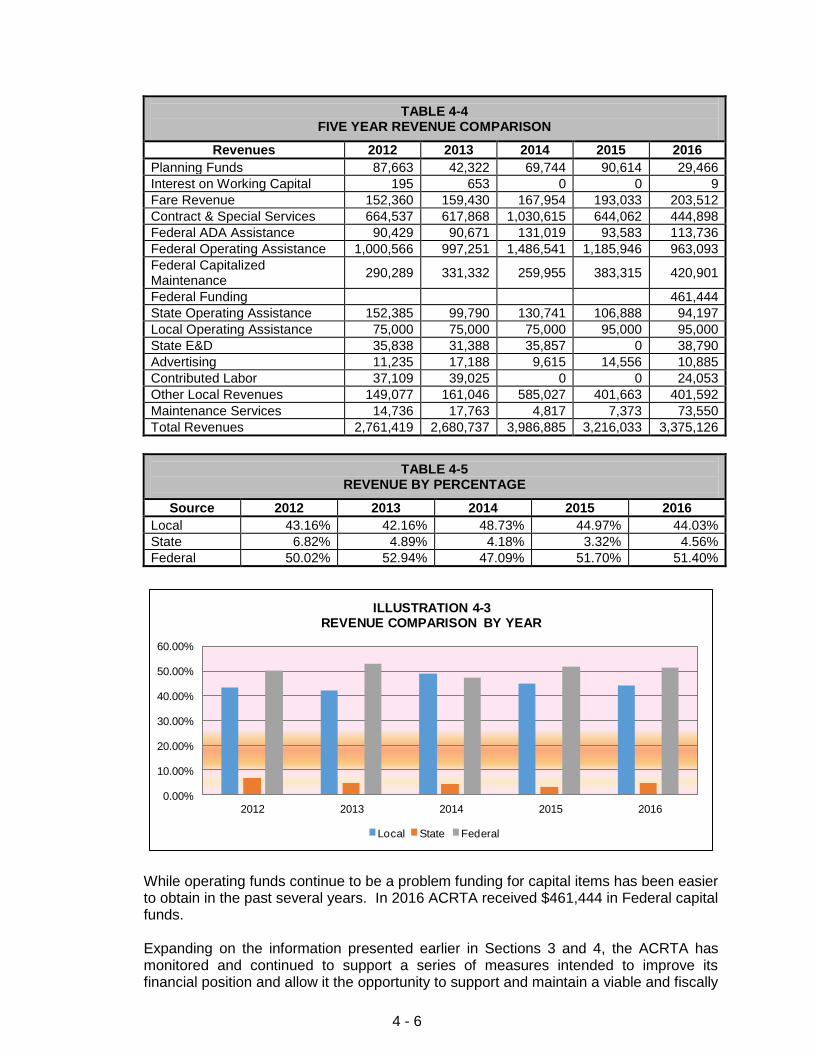
4 - 6
TABLE 4-4 FIVE YEAR REVENUE COMPARISON
Revenues 2012 2013 2014 2015 2016
Planning Funds 87,663 42,322 69,744 90,614 29,466
Interest on Working Capital 195 653 0 0 9
Fare Revenue 152,360 159,430 167,954 193,033 203,512
Contract & Special Services 664,537 617,868 1,030,615 644,062 444,898
Federal ADA Assistance 90,429 90,671 131,019 93,583 113,736
Federal Operating Assistance 1,000,566 997,251 1,486,541 1,185,946 963,093
Federal Capitalized Maintenance
290,289 331,332 259,955 383,315 420,901
Federal Funding 461,444
State Operating Assistance 152,385 99,790 130,741 106,888 94,197
Local Operating Assistance 75,000 75,000 75,000 95,000 95,000
State E&D 35,838 31,388 35,857 0 38,790
Advertising 11,235 17,188 9,615 14,556 10,885
Contributed Labor 37,109 39,025 0 0 24,053
Other Local Revenues 149,077 161,046 585,027 401,663 401,592
Maintenance Services 14,736 17,763 4,817 7,373 73,550
Total Revenues 2,761,419 2,680,737 3,986,885 3,216,033 3,375,126
TABLE 4-5 REVENUE BY PERCENTAGE
Source 2012 2013 2014 2015 2016
Local 43.16% 42.16% 48.73% 44.97% 44.03%
State 6.82% 4.89% 4.18% 3.32% 4.56%
Federal 50.02% 52.94% 47.09% 51.70% 51.40%
0.00%
10.00%
20.00%
30.00%
40.00%
50.00%
60.00%
2012 2013 2014 2015 2016
ILLUSTRATION 4-3REVENUE COMPARISON BY YEAR
Local State Federal
While operating funds continue to be a problem funding for capital items has been easier to obtain in the past several years. In 2016 ACRTA received $461,444 in Federal capital funds. Expanding on the information presented earlier in Sections 3 and 4, the ACRTA has monitored and continued to support a series of measures intended to improve its financial position and allow it the opportunity to support and maintain a viable and fiscally

4 - 7
responsible public transportation service in the community. In 2016 certain routes were redirected to offer exposure to more densely populated neighborhoods along with allowing service to newly identified generators on request. Fixed route service subsidies received from the ACDJFS, ACBDD as well as a subsidy from the Ohio State University/Rhodes State College route are examples of local generators willingness to support their clients with public transportation services.
4.3 Summary
Special services have furthered the needs of a number of non-profit agencies while at the same time providing the ACRTA with positive public exposure and the opportunity to raise sorely needed revenues. Advertising has remained steady as has contributed labor and donations.
Capital Funds have been easier to obtain in the past several years.
Operating funding remains an issue: As the demand for transit continues the cost of operations continues to rise. Federal and State funding have remained fairly static. ACRTA is always looking for ways to increase local funds.
In 2016 federal funds covered 51.70 percent of ACRTA operating revenue, 44.97 percent was covered by local funds.
In 2016 ACRTA was able to reduce the cost per mile of fixed route by $1.10 and the cost of demand response by $1.47.
In 2016 there was a decrease of cost per hour of over $20.00 for fixed route and $13.00 for demand response while at the same time increasing passengers per hour in both fixed route and demand response.

5 - 1
SECTION 5 TRANSIT DEVELOPMENT PROGRAM GOALS
The mission of the ACRTA is to provide safe, reliable, and efficient transportation services to ensure that everyone may have access to work, health care and quality of life opportunities. This section of the report establishes the goals and respective programming of the ACRTA for the FY 2017 through FY 2021 time period. In order to realize the goals put forth herein, this section presents an overview of the proposed ACRTA transit development program composed of management and capital improvement plans that are intended to be utilized in the ACRTA's quest to support the delivery of quality public transportation services. The management and financial subsection establish specific goals and objectives that reflect the ACRTA’s interest in improving mode choice and further developing access for the community and it’s transportationally disabled over the next five (5) year period. 5.1 Management Plan
While achieving operational efficiencies and increased effectiveness results from organizational decisions that force improvements in service, and successful fiscal management reflects the balancing of competing capital, planning and operating activities, successful management must rely on established goals that guide decisive actions. Management plans are developed to achieve specific goals and to provide a measured level of direction and accountability. Transit management plans usually identify several broad goals espoused by a public transit agency and then continue to propose general objectives that need to be met for such goals to be realized.
Goals are general, long-range oriented statements that are based on accepted values and shared desires and used as guides to direct the continuity of decisions. Whereas, objectives are specific statements designed to fulfill realization of the goals. Taken collectively, they form an agency's policy. However, policy alone will not bring goals to fruition. Tasks and specific actions need to be developed and concluded to realize the objectives of each respective goal. The report does not identify specific tasks. The goals of the report have been constructed in such a manner so as to address: the system’s need for adequate funding; safe and efficient service; ensuring service for residents, especially those who are transportationally disadvantaged; and, guaranteeing compliance with FTA, FHWA and ODOT regulations. More specifically, the goals adopted by the ACRTA are to:
Deliver quality transportation services to customers safely and in a cost effective manner.
Increase citizen, community leaders, and local official’s awareness of the range and nature of ACRTA’s public transportation services, and their role in the community’s development, environmental quality and economic growth.
Improve mobility by providing transportation opportunities, services, and amenities to the greatest number of potential users.
Ensure the long term financial stability necessary to maintain high quality public transportation.
Develop an employee team that is well trained, takes initiative, sustains high expectations, and values diversity in an atmosphere of dignity and respect for all.
Increase fixed route utilization by paratransit customers, students, and the general public.

5 - 2
5.2 Status of Transit Development Goals & Objectives In order to cultivate and realize the aforementioned goals, the proposed management plan of the ACRTA addresses the following specific objectives that need to be dealt with if the identified goals are to be accomplished. The objectives should be considered milestones toward reaching the set goals. This section provides a summary of actions taken on behalf of realizing each goal with reference to the status of specific objectives. GOAL #1: Deliver transportation services to ACRTA’s customers that are safe,
high quality, dependable and cost effective.
Status/Objectives: Strive for continuous improvement in safety by developing a safety culture through
training, safety awareness, safety messages and displays, and employee recognition of performance.
Collaborate with the Allen County Emergency Management Agency in preparation for community disaster response.
Achieve a standard of no more than four (4) collision accidents per 100,000 miles. Maximize customer satisfaction on fixed routes by monitoring timeliness of service. Operate fixed route service no less than 90 percent on time performance and
paratransit service no less than 95 percent on time. Ensure compliance with the Americans with Disabilities Act and implement
measures to improve the calling of due points and requested stops. Maintain at least 10,000 miles between road calls. Perform preventative maintenance inspections on all buses and vans within 300
miles of the inspection mileage interval, 98 percent of the time. Assure the cleanliness and cosmetic appearance of buses by performing, at a
minimum, a thorough interior/exterior cleaning daily. Purchase new driver uniforms and enforce professional dress code. Perform monthly safety inspections of buildings and equipment. Install camera systems on all rolling stock transporting clients. Introduce a Transit Asset Management Policy. Implement a Safety and Security Policy which includes Public Safety. Lima City Police Officers will ride the fixed route to get to know the passengers.
Partner with First Responders for emergency plans and training.
Start a study for operation of a Bike Share program.
Implementation of Electronic Farebox system. The ACRTA has continued to work toward meeting the service delivery goal in 2016.
Consider the following narrative. Over the past 12 months, ACRTA has continued to: conduct monthly safety meetings for personnel; performed annual employee evaluations to address safety concerns and performance; safety posters and safety messages are displayed in all ACRTA facilities, transit mailings and pay checks; established and promoted safety awards and an annual safety banquet. Cameras were installed on all vehicles carrying transit passengers and are monitored. The MPO serves on the Emergency Management Agency’s Local Emergency Planning Committee as Transportation Chair and communicates with the Transit Authority as to changes in protocol and training exercises. The ACRTA monitors on-time performance of both fixed route and demand response services monthly both had over 90% on time performance rating. The practice of calling all due points and requested stops has been integrated into the ACRTA driver training program and operations manual and added additional annunciator equipment to Fixed Routes Buses that is operated on a GPS software. Drivers understand that passengers need and expect this courtesy. Dispatchers announce during the day a two minute warning when the buses will be leaving the

5 - 3
terminal to assist with the on time performance and on time exits of the terminal. A review of preventative maintenance found scheduled performance to be completed 100 percent of the time. Vehicle cleanliness is extremely important to driver comfort and ACRTA’s image. Vehicles are washed every day, inside and out. ACRTA purchases employee uniforms and rigorously enforces dress code policies. Management personnel conduct thorough safety inspections of all facilities monthly and immediately after a reportable incidents.
GOAL #2: Increase citizens, community leaders, and local official’s awareness
of the range and nature of ACRTA’s public transportation services, and their role in the community’s development, environmental quality, and economic growth.
Status/Objectives:
Establish contact with neighborhood associations and other appropriate organizations to share information and solicit input about the ACRTA services with presentations and brochures.
Establish a Transit Advisory Committee to obtain public input on issues concerning compliance with ADA and the quality of ACRTA services.
Develop an outreach program to address current/potential transit customers, stakeholder agencies, community groups and service clubs including: (a) conducting phone surveys (b) awareness interviews with Transit riders, connecting the community with radio interviews, TV interviews and advertising; and (c) developing testimonials to personalize the value of transit service and use in print, website and media.
Expand partnerships with community organizations and resources, such as Lima City Schools, Lima Public Library, and Lima Parks Department, to jointly improve access to educational and recreational opportunities through the use of transit. Advertise with school events, provide maps and brochures in lobbies.
Provide year-round youth passes or reduced fare programs to improve access to educational and recreational opportunities through the use of transit.
Determine feasibility of bus wraps to promote ACRTA services, local businesses and community institutions. Now providing in-house advertising.
Attend quarterly update meetings with the Lima City Council and Allen County Commissioners, presenting informational briefings on ACRTA plans and programs.
Continue to give presentations of Transit Awareness at local organizations Participate in community events for RTA awareness
The goal of expanding public awareness through outreach efforts was somewhat limited in 2016. The Transit Authority is an active member of the MPO’s Citizens Advisory Committee and communicates directly to neighborhood associations serving on the same committee. The Executive Director attended local neighborhood and service organization meetings to communicate directly with the public. The MPO regularly meets with neighborhood associations and distributes transit brochures and provides updates on available transit services. The ACRTA has established an internal committee (TRAC) to address ADA concerns and services. Management does review every customer complaint and takes decisive action when required to eliminate customer concerns. Management lacked funding to develop and implement an effective marketing and outreach program in 2016; although a marketing and communications plan was drafted in 2010, it shares the same fiscal constraints. The Transit Authority recognizes this as a necessary undertaking and will examine funding options to initiate a low budget marketing campaign. The aforementioned tasks need to be completed in order to resolve the perception that public money used in subsidizing public transit services are utilized wisely. ACRTA has developed a relationship with the Lima City Schools, parks,

5 - 4
and recreation centers to expand student access. There was a summer parks program that ACRTA provided transportation for in 2013-2015 as well as a demo at local schools on how to ride the buses and change routes for school access. The Transit Authority does offer student and youth passes at reduced fares. The ACRTA has utilized “perffs”, which are advertising wraps on windows, along with bus tail advertising and inside bus advertising. The increased advertising increases local revenue without negatively obscuring a passenger’s vision. The wrap allows passengers to see out but denies vision into the transit vehicle, thereby increasing the security and comfort of the transit ridership. The “perffs” also serve to cool the vehicles in the summer months as the radiant energy is reflected from entering the transit vehicle. The Transit Authority met with the Allen County Commissioners extensively in 2009, 2010 and 2014 to establish cause; the county terminated any funding to the ACRTA shortly thereafter. Such funding has not been re-established even though the Transit Authority has continued communications with the Allen County Commissioners. The ACRTA did meet with Lima City officials and have recently received increased funding in the amount of $95,000 annually. GOAL #3: Improve mobility by providing transportation opportunities, services
and amenities to the greatest number of potential users.
Status/Objectives: Review current route structure to ensure the ACRTA routes are servicing the
greatest area of riders and their destinations. Expand the travel training program to encourage use of fixed route transit by
persons without access to personal transportation, especially the elderly, disabled, students, and low income populations.
Support efforts to improve the efficiency of community transportation services offered by public and private non-profit agencies through coordination of activities such as planning procurement, dispatching, brokerage, and service delivery.
Work with American Billboard (owner of bus shelters) and local governments to review all bus stop shelters for correct ADA requirements on current routes.
Changing from “flag stop” service to “bus stop” service is currently in process for a two year plan; bus stops are currently being placed throughout each route.
Implement scheduling software for paratransit program service. Implement voice box equipment on fixed route buses for ADA annunciators. New webpage design with updated maps and added software to assist in trip
planning.
The Transit Authority continued its efforts to maximize services to area residents in 2016 with route changes and added routes #7, 8, & 9. Given fiscal constraints with lack of funding and decreased grants, ACRTA was successful in implementing and maintaining monthly monitoring reports detailing productivity and ridership with special emphasis on routes modified with no additional employees. With the support of the MPO, the ACRTA documented EJ requirements across existing and proposed route alignments in 2016; no negative bias or findings were identified. The Transit Authority began addressing the topic of travel training; they have a trainer that will ride with someone to show them how to ride the bus. The ACRTA has taken the buses to several organizations and to the schools to let people become more familiar with the system if they have never ridden public transit in the past. The ACRTA will work to identify other community organizations that provide such services and identify opportunities for coordination and collaboration. The Transit Authority has and will continue to support local coordination efforts both with staffing and financially. The ACRTA has been working closely with Jobs and Family services to transport their clients to and from work sites and became Medicaid certified in 2016 in order to continue to transport ACDD clients. The ACRTA has a rental contract

5 - 5
to house the Area Agency on Aging and support the Mobility Manager, the Dial-A-Ride service and other coordination projects efforts with space, and access and training to the scheduling and dispatching software. The Transit Authority has identified and mapped all of the shelter locations and documented conditions as to transit passenger amenities and would like to include a bike share program in conjunction of the current bus shelters or additional shelters in the future. The ACRTA has reviewed the on-time performance factors of each of its routes and worked to identify increases in the level of service accompanying the elimination of flag stops. The Transit Authority commits to expediting the delivery and capabilities of the computer software to further increase efficiency in its paratransit program service but also to integrate passengers across a wider fleet of vehicles operating under the coordination umbrella. GOAL #4: Ensure the long term financial stability necessary to maintain high
quality public transportation.
Status/Objectives: Develop with an ACRTA legislative committee strategies to support increased
transit funding at the federal, state and local levels. Produce a presentation to be used with local officials that demonstrates the value
of investment in public transit. Review fare structure. Prepare, review, and maintain annual budget, with the goal of expenses not
exceeding revenues with significant variances reviewed by the Board of Trustees. Coordinate planning efforts with LACRPC to ensure federal project programming
and implementation. Develop strategies to better control and/or reduce transportation cost per mile with
more efficient vehicles, utilize smaller buses for Saturday services. Prepare for and complete FTA Triennial Review with no significant deficiencies in
the twenty three (23) program review areas. Develop five (5) year Capital Plan outlining vehicle replacement, vehicle
refurbishment, estimated costs, and sources of funding.
Survey the community for possible Levy structure.
Continue to research Federal and State Grants with 100% capital purchases. Continue Fuel Sales Contracts with local non-profits and consider future Fueling
Station with propane or CNG. The Transit Authority must work with state and local officials to develop increased fiscal support for transit and paratransit services if local services are expected to sustain a minimal level of service. The Transit Authority will need to work with OPTA (Ohio Public Transit Authority) and national organizations to solicit further federal and state funding under the next Transportation Bill in Congress and establish a better understanding of the impact of transit on local elected officials. The ACRTA will need to work toward documenting the service in terms of its economic and social impact on the local community. No formal presentation outlining the impact of transit has been initiated locally; support of OPTA and the MPO will be necessary. The ACRTA has not raised its fixed route fares since 2002. However, ACRTA established zone and mileage fares for paratransit services which effectively raised the expanded paratransit service fees. The ACRTA continues to monitor the increasing fare box recovery ratio of fixed route services and is cognizant that a review of fares should be undertaken every 5 years. The ACRTA has instituted a number of new accounting software reports that provide the Transit Authority with financial and performance based documentation. Financial reporting reflects daily, monthly, and year to date expenditures as well as profit/loss data on a line item basis. Management reports document performance on a monthly, year to

5 - 6
date, and previous year basis. The Transit Authority works with the MPO on a regular basis. From a capital planning perspective, the MPO develops the region’s TIP and assists the ACRTA in developing the Agency’s Capital Improvement Plan. Management will need to identify additional performance measures to ensure the system is realizing continuing improvements and balance any independent cost savings that challenge the LOS and sustainability of the larger organization. The Federal Transit Authority will initiate the Triennial Review in 2016. Management will need to work with the MPO to ensure available documentation. Table 5-2 identifies the capital needs of the Transit System.
GOAL #5: Develop an employee team that is well trained, takes initiative, sustains high expectations, and values diversity in an atmosphere of dignity and respect for all.
Status/Objectives: Maintain current job descriptions for all ACRTA employment positions which
accurately describe job duties, responsibilities/requirements. Continue regularly scheduled meetings to develop ACRTA staff. Establish ACRTA employee recognition programs to increase overall performance. Continue monthly safety meetings with emphasis on safety, security, maintenance
issues, operation procedures, wellness, etc. Produce and provide reporting documents related to the ACRTA on services
provided, financial status, operations and maintenance. Annual employee evaluations will be conducted for line staff to recognize
employee’s achievements and accomplishments, provide feedback on the quality of their work and their overall performance as indicated by supervisor input, customer comments and the extent to which they met the Agency's expectations.
Department promotion and training programs available. Additional training and promotion opportunities are being provided in house for shift
leaders and street supervisors. Bus build inspections are now done in-house so drivers, mechanics and
supervisors can experience and give feedback of each bus build. CDL driver training is now completed in-house in order to widen the hiring
availability of the community.
Objectives of Goal 5 have been or are in the process of being realized. The ACRTA has an effective employee policy and procedures manual that identifies employee job descriptions, and employee responsibilities. Management should review the policy manual on an annual basis to assess amended federal policy, local wellness programs and health insurance issues, training requirements, etc., to address warranted modifications and ensure personal information is current. Staff meets monthly to address safety and routing issues of concern. Management maintains an open door policy but should convene regularly scheduled meetings of its administrative staff to ensure a broad based and mutual understanding of issues affecting the overall system (e.g. maintenance, security, performance, fiscal issues, etc.). Employee recognition programs have been limited to safety. Management should review potential benefits of behavioral/motivational possibilities and make recommendations for the Board’s consideration. Management has continued mandatory quarterly safety meetings.
GOAL #6: Increase fixed route utilization by paratransit customers and students.
Status/Objectives: Provide incentives to leave car at home (Dump the Pump campaign). Provide reduced and free fares for new customers and coordinating organizations.

5 - 7
Launch annual ad campaign to reach targeted populations; especially people too young to drive, older drivers, people who cannot afford a car, people tired of paying high gas prices, people who are unaware of the public transportation system, and people who are uneasy about the public transportation system.
Define the benefits of public transit services to students, families, and school personnel.
Identify methods that will encourage paratransit customers to use fixed route system.
Goal 6 has been integrated into the management plan; most of its respective objectives have been addressed by the Transit Authority. No travel demand management program has been developed by the MPO. Peer mentoring has been established in the driver training program. Mentoring has not gravitated beyond the driver position and no formal training budget exists. No travel trainer position has been established by the ACRTA, although a current UpLift Coordinator will act as a travel trainer if the need arises. A recent position, a “Transit Ambassador”, has been established using federal funding in an attempt to establish a liaison with local generators and targeted audiences of the transportationally disadvantaged. Try Transit Week activities have included free fares, Senior Free Fare month, which takes place in May, includes presentations performed by ACRTA staff at various senior citizens facilities, and flyers are presented on the buses along with TV interviews as a partner with AAA3. Establishing public transit’s benefits to students, families and schools has been explored at community expo events and college open house events; however, this activity should be pursued to garner increased ridership and greater political support. Management has reviewed the potential implications of moving paratransit ridership to fixed route services, but on-time performance concerns and limited secured seating remains to be addressed.
5.3 Financial Management
In keeping with the ACRTA's goal of providing transit service in an efficient, economical and effective manner, the ACRTA will continue to:
Refine its in-house capacity to conduct all financial functions in order to pursue a more active and productive role in developing the system's fiscal security and to monitor year-to-date expenses;
Actively pursue communication with ODOT, the City of Lima and Allen County officials to discuss and evaluate the financial condition of the ACRTA; and,
Continue to develop a fiscal policy aimed at minimizing operating expenses and maximizing all available local funding.
In order to improve its public transit services, the ACRTA intends to assess and resolve financial development barriers by:
Establishing stable funding based on an adequate ridership fare structure and services/benefits as provided to the community’s various political subdivisions;
Evaluating and analyzing each ACRTA route to propose improvements that will increase ridership; and,
Selling its transit services and reaffirming the general public's faith and interest in public mass transit.
Passing a levy dedicated to transit services in Allen County. The aforementioned tasks need to be completed in a timely manner in order to resolve the perception that public monies used in subsidizing public transit services are utilized wisely.

5 - 8
In order to present the ACRTA's financial operating management plan, a projection of costs and revenues is presented in Table 5-1.
TABLE 5-1 ACRTA FINANCIAL PLAN
Income 2017 2018 2019 2020 2021
Passenger Fares 215,532 221,998 228,658 235,518 242,583
Federal Income 1,015,358 1,035,665 1,056,378 1,077,506 1,099,056
State Income 189,074 190,965 192,874 194,803 196,751
Local Income 95,000 95,000 95,000 95,000 95,000
Special Service 254,647 259,740 264,935 270,234 275,638
Other 545,360 554,308 563,417 572,687 582,124
Total 2,314,971 2,357,676 2,401,262 2,445,747 2,491,152
Expenses
Wages 1,475,701 1,496,587 1,531,036 1,556,717 1,577,770
Benefits 117,744 120,099 122,501 124,951 127,450
Supplies 569,108 580,496 592,075 603,905 615,971
Services 429,427 438,016 444,816 457,845 468,105
Utilities 49,920 50,919 51,937 52,976 53,736
Insurance 108,872 111,043 116,581 122,395 128,499
Other 90,971 95,720 120,854 79,480 80,256
Depreciation 593,776 605,652 617,765 630,120 642,722
Total 3,435,519 3,498,531 3,597,564 3,628,389 3,694,510
Difference (1,120,548) (1,140,855) (1,196,302) (1,182,642) (1,203,358)
5.4 Capital Improvement Program Planning
In order to comply with federal mandates within the ADA and the Rehabilitation Act, and support ACRTA's responsibility to service local citizens, including the mobility limited of Allen County, a capital improvement program (CIP) has been prepared and included herein. This CIP necessarily reflects needed rolling stock as well as specific actions and associated capital outlays to sustain the Transit Authority’s infrastructure (including buildings, yards, etc.), maintenance capabilities and vehicle fleet. The ACRTA has worked with the MPO to prioritize needed rolling stock and infrastructure improvements required to support local transit operations in replacement of vehicles that have passed their useful life and mileage. In 2016, ACRTA was able to obtain 1 Gilig Bus and 6 Ford 450s with 100% federal funding. The MPO has cooperated to fiscally support specific items and program necessary items in the region’s Transportation Improvement Program (TIP) using the rationale and justification outlined herein. The lack of local fiscal commitment has increasingly become more problematic for continued ACRTA operations. The ACRTA and MPO prepared this section of the report cognizant of the fact that: (1) some needed capital items are expected in late FY 2017; and, (2) ODOT/FTA policies demand a fiscally constrained Transportation Improvement Program. Given, the limited local funding currently available, the capital improvement schedule shown here (Table 5-2) cannot be included in any other documents for presentation until local funding can be obtained. While, the MPO intends to fund specific capital items with MPO/CMAQ and/or MPO/STP funds in each year 2018 through 2021, the requisite local match is still unidentified for the out years. In 2019 and 2020, the ACRTA will receive an additional 2 buses with MPO funding.
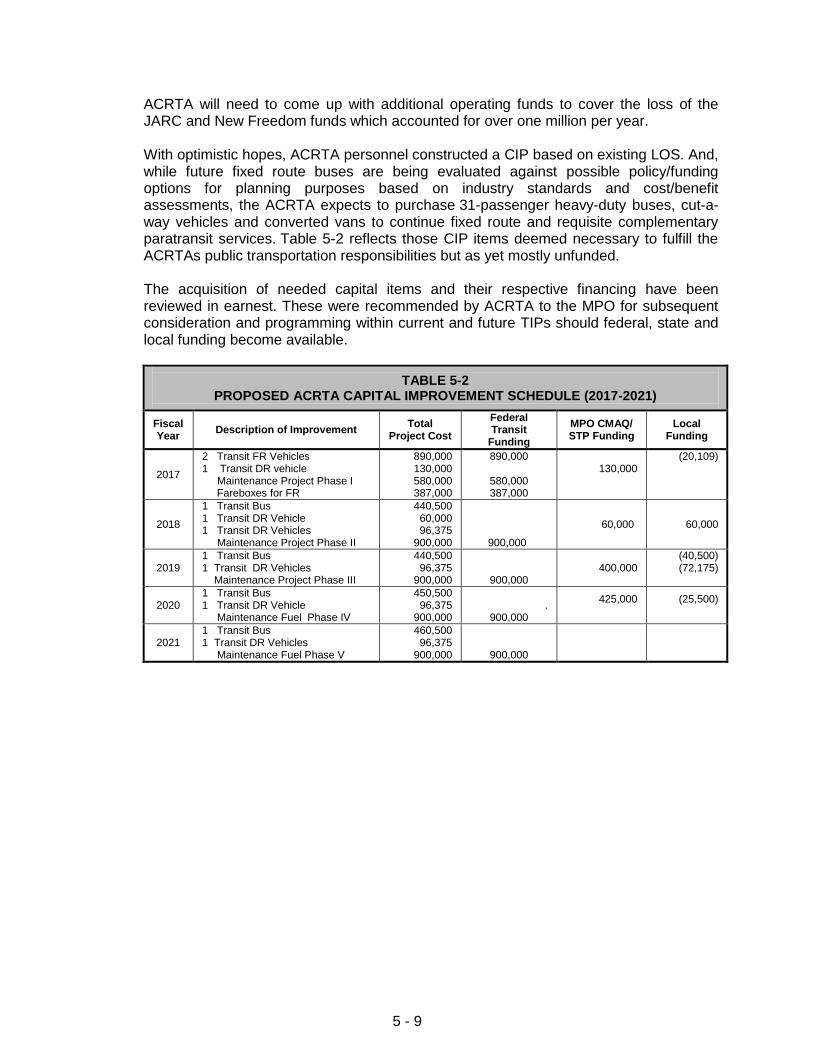
5 - 9
ACRTA will need to come up with additional operating funds to cover the loss of the JARC and New Freedom funds which accounted for over one million per year. With optimistic hopes, ACRTA personnel constructed a CIP based on existing LOS. And, while future fixed route buses are being evaluated against possible policy/funding options for planning purposes based on industry standards and cost/benefit assessments, the ACRTA expects to purchase 31-passenger heavy-duty buses, cut-a-way vehicles and converted vans to continue fixed route and requisite complementary paratransit services. Table 5-2 reflects those CIP items deemed necessary to fulfill the ACRTAs public transportation responsibilities but as yet mostly unfunded.
The acquisition of needed capital items and their respective financing have been reviewed in earnest. These were recommended by ACRTA to the MPO for subsequent consideration and programming within current and future TIPs should federal, state and local funding become available.
TABLE 5-2 PROPOSED ACRTA CAPITAL IMPROVEMENT SCHEDULE (2017-2021)
Fiscal Year
Description of Improvement Total
Project Cost
Federal Transit
Funding
MPO CMAQ/ STP Funding
Local Funding
2017
2 Transit FR Vehicles 1 Transit DR vehicle Maintenance Project Phase I Fareboxes for FR
890,000 130,000 580,000 387,000
890,000
580,000 387,000
130,000
(20,109)
2018
1 Transit Bus 1 Transit DR Vehicle 1 Transit DR Vehicles Maintenance Project Phase II
440,500 60,000 96,375
900,000
900,000
60,000 60,000
2019 1 Transit Bus 1 Transit DR Vehicles Maintenance Project Phase III
440,500 96,375
900,000
900,000 400,000
(40,500) (72,175)
2020 1 Transit Bus 1 Transit DR Vehicle Maintenance Fuel Phase IV
450,500 96,375
900,000
.
900,000
425,000
(25,500)
2021 1 Transit Bus 1 Transit DR Vehicles Maintenance Fuel Phase V
460,500 96,375
900,000
900,000

APPENDICES

A - 1
APPENDIX A FIXED ROUTE SURVEY RESULTS
In order to provide the most efficient and effective public transit system, a survey of the ACRTA fixed route ridership was conducted to provide critical information on travel patterns, demographics, travel options and mode choice for transit-using residents. From October 3, 2016 through October 14, 2016, ACRTA’s fixed route passengers were provided with a questionnaire by LACRPC staff while riding fixed route buses. Passengers, selected randomly, were asked to follow the simple instructions and return the survey when completed. The questionnaire, with a total of 21 questions, was distributed to riders on all eight of the ACRTA’s fixed routes. The survey tool can be found as an attachment at the end of this document; survey results follow. In all, 279 surveys were returned, forming the basis of the ridership profile. Many respondents did not answer every question on the survey, so results are based on the number of actual responses per question. As the ridership survey was conducted in an uncontrolled environment, results should be scrutinized thoughtfully and projections considered with care. A.1 Demographic Overview
The Ridership Survey revealed the demographic make-up of the ACRTA riders during the selected survey period; the results of that survey are depicted below. Table A-1 presents a breakdown of the respondents’ race/ethnicity, while Table A-2 depicts gender. Survey data indicated that passengers were generally evenly split along racial and gender lines. Of the respondents, just under half (44.02%) self-reported their race as “African American”; while, 42.47 percent were “White”, 2.70 percent were “Hispanic”, 5.68 percent were American Indian and 4.63 percent were “Other”. Under other the respondents classified themselves as Mixed (3), Biracial (5), American (4) and Haitian (1). In terms of gender, 53.06 percent of the riders were female.
TABLE A-1 RACE/ETHNICITY OF RESPONDENTS
African American Hispanic White Asian American Indian Other Total
Number 114
7 110
1 15 12
259
Percentage 44.02%
2.70% 42.47%
0.39% 5.76% 4.63%
100.00%
TABLE A-2 GENDER OF RESPONDENTS
Female Male Total
Number 130 115 245
Percentage 53.06% 46.94%
100.00%
Table A-3 depicts age cohorts of respondents; while, the age of the riders varied, those aged 25 to 34 comprised the largest ridership group, accounting for 1 in 5 of the fixed-route population, those over 60 years-of-age accounted for 13.57 percent overall. In addition, those surveyed between 8 and 19 were 8.91 percent and 25-34 accounted 21.71 percent.

A - 2
When examining the employment status of survey respondents, 4 in 10 (40.30%) were employed. Approximately 11 percent of passengers were attending school, or unemployed; while 21.67 percent were on disability.
TABLE A-3 AGE OF RESPONDENTS
8-19 20-24 25-34 35-44 45-54 55-59 Over 60 Total
Number 23 24 56 41 54 25 35
258
Percentage 8.91% 9.30%
21.71% 15.89% 20.98%
9.69% 13.57%
100.00%
TABLE A-4 EMPLOYMENT STATUS OF RESPONDENTS
Employed Retired In School Unemployed On Disability Seeking Employment Total
Number 106 23 31 30 57 16
263
Percentage 40.30%
8.75% 11.79% 11.41% 21.67%
6.08% 100.00%
When analyzing the age of the passengers by gender, it is interesting to note how the gender of riders varied from age cohort to age cohort. Illustration A-1 reveals, there were more female passengers in every age group except the 20-24 and 45-54 cohorts.
0.00%
2.00%
4.00%
6.00%
8.00%
10.00%
12.00%
14.00%
8 - 19 20 - 24 25 - 34 35 - 44 45 - 54 55 - 59 Over 60
ILLUSTRATION A-1 PERCENT OF SURVEYED RIDERS BY AGE & GENDER
Male Female

A - 3
Illustration A-2 depicts the ACRTA ridership by race/ethnicity and by age. As stated earlier, the African-American and White populations comprised the majority of the survey respondents. The under 24 and 45-59 age groups have a higher ridership of African Americans while all other age groups have a higher white ridership. The Hispanic ridership has remained static over the last year.
Table A-5 reveals that the educational attainment levels of survey respondents were mixed and reflects the socio-economic character of the transit patron.
TABLE A-5 EDUCATIONAL ATTAINMENT OF RESPONDENTS 25 YEARS OF AGE & OLDER
Less than 12
th Grade
High School Diploma/GED Some College 2 Year College Degree 4 Year College Degree Total
Number 54 94 62 51 12
243
Percentage 22.22% 38.68% 25.51%
8.64% 4.94%
100.00%
When comparing those riders 25 years-of-age and older in terms of education, transit riders educational attainment levels were about the same as residents in general of both Allen County and the City of Lima. Table A-5 reflects a majority (79.37%) of the riders had received a high school diploma/GED, or greater, as compared to 88.40 percent of County residents and 82.60 percent of Lima residents; while, 22.22 percent of riders had not completed high school (11.60% County, 17.40% Lima). Approximately 13.58 percent of the ridership had obtained either a two- or four-year college degree (19.50% County, 13.70% Lima) and 25.51 percent reported completing some college course work (22.40% County, 25.80% Lima). Illustration A-3 reveals ridership by educational attainment.
0.00%
2.00%
4.00%
6.00%
8.00%
10.00%
12.00%
Under 19 20-24 25-34 35-44 45-54 55-59 over 60
ILLUSTRATION A-2 PERCENT OF SURVEY RESPONDENTS BY AGE & RACE
African American White Hispanic Asian American Indian Other

A - 4
A.2 Utilization of ACRTA
Respondents cited various reasons for using transit; Table A-6 shows the percentage of respondents by reason for utilizing the ACRTA. Over half (64.55%) of respondents cited the major reason for riding transit was “Do Not Own a Car” or that it was less expensive than taking a taxi (16.05%); “Convenient” was cited 2.01 percent of the time as the main reason for riding transit. In lieu of the fact that 71.02 percent of the ridership surveyed reported that they do not have a driver’s license, and 8.91 percent of the ridership was under age 19, the previously cited statistic was not unexpected.
TABLE A-6 REASON UTILIZING THE ACRTA
Do Not Own a Car Less Expensive Than a Taxi Less Expensive Than Personal Vehicle Convenient Other Total
Number 193 48 19
6 33
299
Percentage 64.55% 16.05%
6.35% 2.01%
11.04% 100.00%
Illustration A-4 illustrates the percentage of transit passengers by age cohort who hold a valid driver’s license compared to those who do not. Those aged 45 to 54 years were the largest cohort of transit riders holding a driver’s license. The majority of the respondents over 25 years-of-age did not have a driver’s license. Table A-7 demonstrates the frequency of rides per week. Of those surveyed, 29.86 percent responded that they ride the ACRTA buses every day, 32.25 percent ride almost every day, and 25.54 percent ride one to two times a week. With respect to number of years respondents had used ACRTA transit service, of the 277 passengers who answered, 75.09 percent of the passengers reported use of more than one year. Of those riders, 21.30 percent had been passengers for over ten years and 13.72 percent had employed ACRTA services for five to ten years. Just under half of
0.00%
2.00%
4.00%
6.00%
8.00%
10.00%
12.00%
14.00%
25-34 35-44 45-54 55-59 Over 60
ILLUSTRATION A-3 EDUCATIONAL ATTAINMENT OF SURVEY
RESPONDENTS OVER AGE 25
less than 12th high school diploma/GED some college/vocational 2 year college 4 year college

A - 5
the respondents have been riding the bus from one to five years (40.07%). Table A-8 is a breakdown of the number of years passengers have utilized the ACRTA service.
TABLE A-7 FREQUENCY OF ACRTA USAGE
Every Day Almost Every Day 1 or 2 Times/Week 1 or 2 Times/Month Very Seldom Total
Number 83 98 71 14 12
278
Percentage 29.86% 32.25% 25.54%
5.04% 4.32%
100.00%
TABLE A-8 YEARS USING ACRTA SERVICE
Less than 1 Year Between 1 to 3 Years Between 3 to 5 Years Between 5 to 10 Years Over 10 Years Total
Number 69 78 33 38 59
277
Percentage 24.91% 28.16% 11.91% 13.72% 21.30%
100.00%
A.3 Purpose of Trip
Table A-9 examines respondents’ trip purpose and compares that to national survey results in the American Public Transportations Association “A Profile of Public Transportation Passenger Demographics and Travel Characteristics Reported in On-Board Surveys” May 2007. Nationally 59.2.0 percent of riders used transit for work purposes, while locally only 25.06 percent of the survey respondents used transit to get to and from work. Analysis further revealed that 17.23 percent of respondents stated that their main use for the ACRTA was for medical purposes while nationally the number is only 3.00%. Locally, educational trips (9.69%) reflected less than the proportion of educational trips taken nationally (10.6%). The Recreational 6.62%), social/family
0.00%
2.00%
4.00%
6.00%
8.00%
10.00%
12.00%
14.00%
16-19 20-24 25-34 35-44 45-54 55-59 Over 60
ILLUSTATION A-4 DRIVERS LICENSE ATTAINMENT BY AGE
Yes No

A - 6
(8.75%) and other (5.67%) trips account for a little less than one quarter of the overall trips. It should be noted that this question was sometimes difficult for the commuters to answer, because most riders utilize the ACRTA for all their transportation needs, and, therefore did not view any one reason as primary. Those who mentioned other reported using transit to go to the library or pay bills, or go to court, while the main answer was "Biolife".
TABLE A-9 MAIN PURPOSE OF TRIP
Purpose National Local
Work School Shopping Nutritional Medical Recreational Social/family Other Total
Percentage 59.20% 10.60%
8.50% N/A
3.00% 6.80% 6.20% 5.70%
100.00%
Number 106 41
108 6
73 28 37 24
423
Percentage 25.06%
9.69% 25.53%
1.42% 17.23%
6.62% 8.75% 5.67%
100.00%
When comparing the main purpose of the trip and the frequency of use, Illustration A-5 reveals that the largest concentration of people who rode “every day” or “almost every day” used the bus for work, medical, school and shopping. All of the categories show those using the bus do so at least 1-2 times per week or more.
Illustration A-6 depicts the relationship between trip purpose and the number of years using the ACRTA. When comparing the number of years using the ACRTA service with the trip purpose, those using the service for three years or less work is their main purpose. Those using the service over ten years have the highest number using the system for medical and shopping. The majority of those using the system for school have used the service three years or less. Those who stated that they use the system for other were asked to specify. The main answer under the specification was "everything" with BioLife, paying bills and going to the library as other answers.
0.00%
2.00%
4.00%
6.00%
8.00%
10.00%
12.00%
Work School Shopping Nutritional Medical Recreational Social/Family Other
ILLUSTRATION A-5 TRIP PURPOSE BY FREQUENCY OF USE
Every Day Almost Every Day 1-2 times per Week 1-2 times per Month Very Seldom

A - 7
When looking at the population of riders who have ridden the bus for 1-3 year the age group 25 -34 years of age constitutes 6.87 percent. The age group from 45- 54 have the highest percentage of riders who have rode for one year or less. Those patrons in the 45-54 age group also have the largest percentage (6.01%), of riders who have been using the system for over 10 years and 1-3 years.
The survey indicates only slight gender differences when examining trip purposes. The major uses of the system are for work and shopping. Females use the system for work at 14.19 percent and males at 11.09 percent. Female, (13.75%) patrons also have a higher percentage of using the bus for shopping than do males (11.75%). Female and male riders use the ACRTA for school purposes equally with 4.66 percent for each. Males were more likely to use the service for recreational (3.77%) than females at (3.33%). For medical purpose females use the system at 9.09 percent while males use it 6.87 percent. Under other males (4.07%) use the service more than females (3.62%).
0.00%
1.00%
2.00%
3.00%
4.00%
5.00%
6.00%
7.00%
8.00%
9.00%
10.00%
work school shopping nutritional medical recreational social/family other
ILLUSTRATION A-6 YEARS USING ACRTA & TRIP PURPOSE
Less than 1 year 1-3 years 3-5 years 5-10 years Over 10 years
0.00%
1.00%
2.00%
3.00%
4.00%
5.00%
6.00%
7.00%
8.00%
0-19 20-24 25-34 35-44 45-54 55-59 over 60
ILLUSTRATION A-7 NUMBER OF YEARS USING ACRTA SERVICES BY AGE
Less than one year 1 - 3 years 3 - 5 years 5 - 10 years pver 10 years

A - 8
Males use the service more for social and family (5.10%) with females riding for social/family (3.33%) percent.
From Illustration A-9 it is evident that the higher the educational attainment level the lower dependency upon transit services. For males and females with a high school degree work is the predominant trip purpose at 3.95 and 6.67 percent respectively. Also females and males with less than a high school education are using the buses to get to work at 1.123 and 2.96 percent respectively. When looking at medical, females with a high school education accounted for 2.96 percent of the respondents and males of the same education level accounted for 3.46 percent. All categories are using the system for shopping with females with a high school education at the highest usage at 5.68 percent.
A.4 The Nature of Ridership
To further distinguish ridership, survey results were disaggregated by the ridership’s rationale for utilizing mass transit. This exercise allows the ridership to be separated into three broad categories: (1) the “economically captive riders” who have no car available
0.00%
2.00%
4.00%
6.00%
8.00%
10.00%
12.00%
14.00%
16.00%
Work School Shopping Nutritional Medical Recreational Social/family Other
ILLUSTRATION A-8 TRIP PURPOSE BY GENDER
Male Female
0.00%
2.00%
4.00%
6.00%
8.00%
10.00%
12.00%
14.00%
16.00%
18.00%
20.00%
Male Female Male Female Male Female Male Female Male Female
<12 High School Some College 2 Year 4 Year
ILLUSTRATION A-9 PURPOSE BY DEGREE & GENDER
Work School Medical Shopping Social/Family Other

A - 9
to them due to economic reasons and, therefore, must rely upon mass transit; (2) the “non-economic captive riders” who have to use transit for reasons other than economics, such as the very young, and those without driver’s licenses, the elderly, and the disabled; and, (3) “choice riders” who have a vehicle available to them, but choose to ride transit for various reasons. A cursory review suggests that most of ACRTA’s ridership can be classified as either economically captive or non-economically captive. When examining income 87.30 percent of the respondents have an income of less than $30,000 per year. These figures should be viewed with scrutiny, however, for it is difficult to obtain an accurate count of truly economically captive persons. However, data suggests 71.26 percent of respondents do not have a valid driver’s license, and 64.55 percent of the ACRTA ridership does not own a vehicle (as shown in Table A-6), these captive riders depend on the ACRTA services for most, if not all trip purposes. Therefore, the ACRTA is vital to the transportationally and economically disadvantaged residents of the City of Lima and the outlying urbanized area.
A.5 Level of Service
Turning to respondents’ perceptions of ACRTA service, riders were asked to rate certain aspects of the service on a scale of 1 to 5, with 5 being “excellent” and 1 “needs improvement”. Passengers were asked to rate the overall condition of the buses and facilities. Ridership was overwhelmingly positive with approximately 90.57 percent of all riders responded that the exterior and interior of the buses were kept clean; while, 89.55 percent responded that the temperature on the buses is considered to be comfortable. Almost all (92.86%) patrons responded that the transfer center was in good physical condition as well as, that they felt safe from crime on the buses and at the transfer facility (92.56%). Drivers are the face of the ACRTA to the transit riding public; therefore, riders' perceptions regarding drivers’ performance and competency was also tracked. Patrons rated the drivers’ attitude and care as excellent 57.75 percent of the time and 22.07 percent as good. Over 81 percent of patrons were comfortable with the competency of the drivers; with 58.14 percent of drivers rated as excellent and 23.25 percent as good. The smoothness of the ride and stops rated quite high, considering the survey was primarily conducted on a fixed route system, while riding a large bus with many stops. Nearly three-fourths of survey respondents rated the smoothness of the trip as excellent (38.60%) or good (26.51%); only 2.79 gave the ride a poor rating. Because time and affordability are important measures for both the customer as well as for ACRTA, riders were asked to rate time from two perspectives, that of “time it takes to reach your destination” and “reliability of getting where you need to go on time”. While 45.75 percent of respondents rated “time it takes to reach your destination” as excellent and 28.30 percent rated the service as good, 3.30 percent rated this measure of service as poor. In terms of reliability, that of “getting where you need to go on time”, over three-quarters of those surveyed rated ACRTA fixed route service as excellent (51.14%) or good (25.11%). Finally, respondents were asked to rate “overall convenience” and “ACRTA transit service” in general. Customer satisfaction surveys, though subjective and based on perceptions, are useful tools in understanding how to improve customer service and increase ridership. With respect to overall convenience, more than 8 in 10 of those surveyed agreed that the ACRTA’s overall convenience was excellent (64.44%) or good (22.59%); while only 2.93 percent responded that the overall convenience of the service was poor. Table A-10 summarizes respondent surveys.

A - 10
TABLE A-10 ACRTA SERVICE RATING
5 4 3 2 1
The cleanliness of bus exterior 46.63% 25.48% 19.71% 2.40% 5.77%
The cleanliness of bus interior, including seats and windows
45.37% 25.46% 18.52% 4.63% 6.02%
The temperature on the bus 38.18% 25.91% 25.45% 6.82% 3.64%
The physical condition of transfer facility 50.95% 24.76% 17.14% 2.38% 4.76%
Safe and competent drivers 58.14% 23.26% 11.63% 2.33% 4.65%
Rate the attitude and care that drivers give you
57.75% 22.07% 11.74% 2.35% 6.10%
The smoothness of the ride and stops 38.60% 26.51% 25.12% 6.98% 2.79%
Freedom from nuisance behaviors of other passengers
45.75% 28.30% 16.98% 5.66% 3.30%
The time it takes to reach your destination 51.14% 25.11% 15.07% 5.02% 3.65%
Reliability of getting where you need to go on time
69.63% 17.29% 7.94% 1.87% 3.27%
Affordability of bus trip 44.95% 22.48% 20.64% 6.88% 5.05%
Safety from crime on buses and at station 59.53% 23.26% 9.77% 3.26% 4.19%
Overall convenience 64.44% 22.59% 7.11% 2.93% 2.93%
Rate ACRTA transit service 58.96% 26.42% 9.43% 0.94% 4.25%
5 is “excellent” and 1 “needs improvement”
A.6 System’s Physical Limitations with Passengers
Patrons were asked to identify specific personal physical problems encountered while using the ACRTA. Of survey respondents the majority (50.17%) reported no limitation, 10.45 percent reported having difficulty walking more than two blocks to get to the bus, and 14.63 percent indicated difficulty waiting longer than ten minutes for the bus. While 7.32 percent reported problems getting on or off the bus, 5.57 percent indicated difficulty understanding route information, 4.58 percent reported a problem maintaining their balance while the bus was in motion. Note that several clients reported multiple conditions. The ACRTA operates on a flag stop basis, whereby passengers can "flag" a bus down anywhere along the route as opposed to only boarding and alighting at specific locations along the route. Table A-12 reveals that 59.81 percent of passengers walked a block or less to an ACRTA fixed route; while, only 20.82 percent of passengers walked more than three blocks to flag a bus.
TABLE A-11 PHYSICAL LIMITATIONS OF PASSENGERS
Getting on/off the bus Walking more than 2-3 blocks Keeping your balance while riding Understanding and following route information Holding/grasping coins Waiting or standing for more than 10 minutes Other None of the above Total
Number 21 30 13 16
6 42 15
144 287
Percentage 7.32%
10.45% 4.58% 5.57% 2.09%
14.63% 5.23%
50.17% 100.00%

A - 11
TABLE A-12 DISTANCE PASSENGERS WALK TO BUS STOP
½ block 1 block 2 blocks 3 or more blocks Total
Number 108 53 52 56
269
Percentage 40.15% 19.70% 19.33% 20.82%
100.00%
Over half (53.44%) of the respondents do not have access to another form of transportation. Examine Table A-13 and Illustration A-10 collectively reveals transportation options used by respondents. Those using other means of transportation traveled with family or friends (45.31%) or traveled by taxi (23.44%), they also rode a bike or walked (7.03%). Several stated that they could get a ride from Allen County Council on Aging, as well as Easter Seals both at (1.56%) or from a medical service (2.34%).
TABLE A-13 OTHER TRANSPORATION OF RESPONDENTS
Yes No Total
Number 132 115 247
Percentage 43.44% 46.56%
100.00%
Table A-14 reveals the amount spent each week by respondents on transportation. Most of the respondents (56.43%) spend less than $10.00 per week on transportation; while, 29.05 percent spend between $10.00 and $19.00 per week. Only 14.52 percent spend more than $20.00 per week.
TABLE A-14 AMOUNT PER WEEK SPENT ON TRANSPORTATION
Less than $10.00 per week $10.00-$19.00 per week $20.00-$29.00 per week $30.00-$39.00 per week Over $40.00 per week Total
Number 136 70 18
6 11
241
Percentage 56.43% 29.05%
7.47% 2.49% 4.56%
100.00%
56.37%
20.13%
2.68%
6.04%
14.76%
Friends Family
Cab
church
ACOA
Bike/Walk
ILLUSTRATION A-10 OTHER FORMS OF TRANSPORTATION USED BY SURVEY
RESPONDENTS

A - 12
Patrons were given a multiple choice question as to what improvement of services they would like, with other as one of the choices. Sunday service came in at 40.17 percent while both request later bus routes (18.01%) and more frequent buses (19.67%) came in close to one fifth of the answers. Under other longer service on Saturdays was requested by 33.33 percent and holiday service at 19.05 percent of the patron, with more routes and wifi service for passenger both coming in at 23.81%.
TABLE A-15 IMPROVEMENT IN ACRTA SERVICE
Earlier buses on routes Later buses on routes More frequent buses Sunday Service Other Total
Number 50 65 71
145 30
361
Percentage 13.85% 18.01% 19.67% 40.17%
8.31% 100.00%
TABLE A-16 OTHER SERVICE REQUESTED
Longer Service on Saturday More Routes Holiday Service WIFI Service for Passengers Total
Number 7 5 4 5
21
Percentage 33.33% 23.81% 19.05% 23.81%
100.00%
Table A-17 depicts the likelihood that patrons will continue to use ACRTA services. Of those responding, over three quarters (84.56%) responded that in the future they would likely continue transit use. When asked to give a reason for continued use, affordable (26.08%) and convenience (22.36%) were reported as reasons for continued use of ACRTA. Currently more than half (51.55 %) do not have any other form of transportation.
TABLE A-17 CONTINUE USE OF ACRTA SERVICES
Likely Unlikely Total
Number 190 27
217
Percentage 84.56% 12.44%
100.00%
A.7 Fixed Routes Operations
Based on last year’s surveys the Transit Authority responded to requests for additional services. Two new fixed routes were started in 2016 to serve the outlying areas of Allen County. In order to continue to meet the FTA triennial review process ACRTA maintains records of operational profiles. This also allows ACRTA to continue to meet their goal of improved mobility by providing transportation opportunities, services and amenities to the greatest number of potential users. Table A-18 covers all survey results from 1992 up thru 2016. Over time the percentage of African American and White survey respondents has remained fairly consistent. The

A - 13
gender of the survey respondents has also remained mainly female. Work, Medical and Shopping have been the main trip purposes. It is evident that people who take transit do so almost every day and continue to do so over a long period of time, most of the survey respondents give a satisfactory or better rating to the over transit system.
37.34%
34.67%
6.66%
21.33%
Affordable
Convenient
Friendly Drivers
No Car or license
ILLUSTRATION A-11 REASONS FOR CONTINUED USE
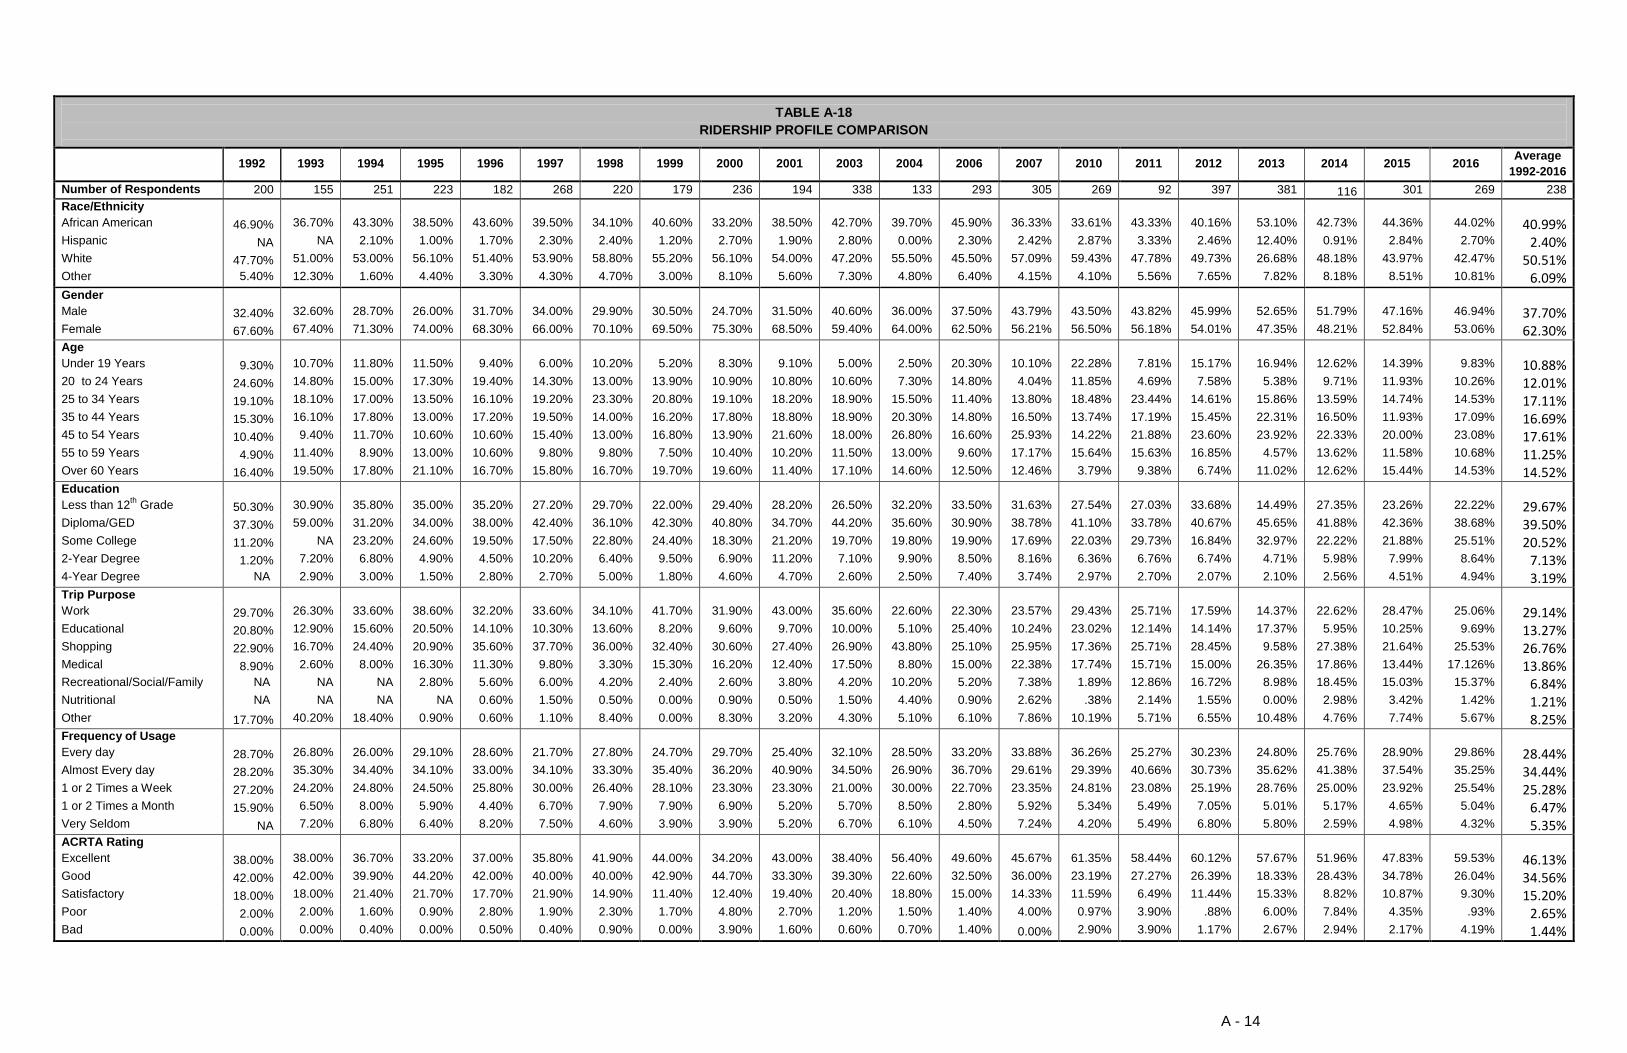
A - 14
TABLE A-18
RIDERSHIP PROFILE COMPARISON
1992 1993 1994 1995 1996 1997 1998 1999 2000 2001 2003 2004 2006 2007 2010 2011 2012 2013 2014 2015 2016 Average
1992-2016
Number of Respondents 200 155 251 223 182 268 220 179 236 194 338 133 293 305 269 92 397 381 116 301 269 238
Race/Ethnicity
African American 46.90% 36.70% 43.30% 38.50% 43.60% 39.50% 34.10% 40.60% 33.20% 38.50% 42.70% 39.70% 45.90% 36.33% 33.61% 43.33% 40.16% 53.10% 42.73% 44.36% 44.02% 40.99% Hispanic NA NA 2.10% 1.00% 1.70% 2.30% 2.40% 1.20% 2.70% 1.90% 2.80% 0.00% 2.30% 2.42% 2.87% 3.33% 2.46% 12.40% 0.91% 2.84% 2.70% 2.40% White 47.70% 51.00% 53.00% 56.10% 51.40% 53.90% 58.80% 55.20% 56.10% 54.00% 47.20% 55.50% 45.50% 57.09% 59.43% 47.78% 49.73% 26.68% 48.18% 43.97% 42.47% 50.51% Other 5.40% 12.30% 1.60% 4.40% 3.30% 4.30% 4.70% 3.00% 8.10% 5.60% 7.30% 4.80% 6.40% 4.15% 4.10% 5.56% 7.65% 7.82% 8.18% 8.51% 10.81% 6.09% Gender
Male 32.40% 32.60% 28.70% 26.00% 31.70% 34.00% 29.90% 30.50% 24.70% 31.50% 40.60% 36.00% 37.50% 43.79% 43.50% 43.82% 45.99% 52.65% 51.79% 47.16% 46.94% 37.70% Female 67.60% 67.40% 71.30% 74.00% 68.30% 66.00% 70.10% 69.50% 75.30% 68.50% 59.40% 64.00% 62.50% 56.21% 56.50% 56.18% 54.01% 47.35% 48.21% 52.84% 53.06% 62.30% Age
Under 19 Years 9.30% 10.70% 11.80% 11.50% 9.40% 6.00% 10.20% 5.20% 8.30% 9.10% 5.00% 2.50% 20.30% 10.10% 22.28% 7.81% 15.17% 16.94% 12.62% 14.39% 9.83% 10.88% 20 to 24 Years 24.60% 14.80% 15.00% 17.30% 19.40% 14.30% 13.00% 13.90% 10.90% 10.80% 10.60% 7.30% 14.80% 4.04% 11.85% 4.69% 7.58% 5.38% 9.71% 11.93% 10.26% 12.01% 25 to 34 Years 19.10% 18.10% 17.00% 13.50% 16.10% 19.20% 23.30% 20.80% 19.10% 18.20% 18.90% 15.50% 11.40% 13.80% 18.48% 23.44% 14.61% 15.86% 13.59% 14.74% 14.53% 17.11% 35 to 44 Years 15.30% 16.10% 17.80% 13.00% 17.20% 19.50% 14.00% 16.20% 17.80% 18.80% 18.90% 20.30% 14.80% 16.50% 13.74% 17.19% 15.45% 22.31% 16.50% 11.93% 17.09% 16.69% 45 to 54 Years 10.40% 9.40% 11.70% 10.60% 10.60% 15.40% 13.00% 16.80% 13.90% 21.60% 18.00% 26.80% 16.60% 25.93% 14.22% 21.88% 23.60% 23.92% 22.33% 20.00% 23.08% 17.61% 55 to 59 Years 4.90% 11.40% 8.90% 13.00% 10.60% 9.80% 9.80% 7.50% 10.40% 10.20% 11.50% 13.00% 9.60% 17.17% 15.64% 15.63% 16.85% 4.57% 13.62% 11.58% 10.68% 11.25% Over 60 Years 16.40% 19.50% 17.80% 21.10% 16.70% 15.80% 16.70% 19.70% 19.60% 11.40% 17.10% 14.60% 12.50% 12.46% 3.79% 9.38% 6.74% 11.02% 12.62% 15.44% 14.53% 14.52% Education Less than 12
th Grade 50.30% 30.90% 35.80% 35.00% 35.20% 27.20% 29.70% 22.00% 29.40% 28.20% 26.50% 32.20% 33.50% 31.63% 27.54% 27.03% 33.68% 14.49% 27.35% 23.26% 22.22% 29.67%
Diploma/GED 37.30% 59.00% 31.20% 34.00% 38.00% 42.40% 36.10% 42.30% 40.80% 34.70% 44.20% 35.60% 30.90% 38.78% 41.10% 33.78% 40.67% 45.65% 41.88% 42.36% 38.68% 39.50% Some College 11.20% NA 23.20% 24.60% 19.50% 17.50% 22.80% 24.40% 18.30% 21.20% 19.70% 19.80% 19.90% 17.69% 22.03% 29.73% 16.84% 32.97% 22.22% 21.88% 25.51% 20.52% 2-Year Degree 1.20% 7.20% 6.80% 4.90% 4.50% 10.20% 6.40% 9.50% 6.90% 11.20% 7.10% 9.90% 8.50% 8.16% 6.36% 6.76% 6.74% 4.71% 5.98% 7.99% 8.64% 7.13% 4-Year Degree NA 2.90% 3.00% 1.50% 2.80% 2.70% 5.00% 1.80% 4.60% 4.70% 2.60% 2.50% 7.40% 3.74% 2.97% 2.70% 2.07% 2.10% 2.56% 4.51% 4.94% 3.19% Trip Purpose Work 29.70% 26.30% 33.60% 38.60% 32.20% 33.60% 34.10% 41.70% 31.90% 43.00% 35.60% 22.60% 22.30% 23.57% 29.43% 25.71% 17.59% 14.37% 22.62% 28.47% 25.06% 29.14% Educational 20.80% 12.90% 15.60% 20.50% 14.10% 10.30% 13.60% 8.20% 9.60% 9.70% 10.00% 5.10% 25.40% 10.24% 23.02% 12.14% 14.14% 17.37% 5.95% 10.25% 9.69% 13.27% Shopping 22.90% 16.70% 24.40% 20.90% 35.60% 37.70% 36.00% 32.40% 30.60% 27.40% 26.90% 43.80% 25.10% 25.95% 17.36% 25.71% 28.45% 9.58% 27.38% 21.64% 25.53% 26.76% Medical 8.90% 2.60% 8.00% 16.30% 11.30% 9.80% 3.30% 15.30% 16.20% 12.40% 17.50% 8.80% 15.00% 22.38% 17.74% 15.71% 15.00% 26.35% 17.86% 13.44% 17.126% 13.86% Recreational/Social/Family NA NA NA 2.80% 5.60% 6.00% 4.20% 2.40% 2.60% 3.80% 4.20% 10.20% 5.20% 7.38% 1.89% 12.86% 16.72% 8.98% 18.45% 15.03% 15.37% 6.84% Nutritional NA NA NA NA 0.60% 1.50% 0.50% 0.00% 0.90% 0.50% 1.50% 4.40% 0.90% 2.62% .38% 2.14% 1.55% 0.00% 2.98% 3.42% 1.42% 1.21% Other 17.70% 40.20% 18.40% 0.90% 0.60% 1.10% 8.40% 0.00% 8.30% 3.20% 4.30% 5.10% 6.10% 7.86% 10.19% 5.71% 6.55% 10.48% 4.76% 7.74% 5.67% 8.25% Frequency of Usage Every day 28.70% 26.80% 26.00% 29.10% 28.60% 21.70% 27.80% 24.70% 29.70% 25.40% 32.10% 28.50% 33.20% 33.88% 36.26% 25.27% 30.23% 24.80% 25.76% 28.90% 29.86% 28.44% Almost Every day 28.20% 35.30% 34.40% 34.10% 33.00% 34.10% 33.30% 35.40% 36.20% 40.90% 34.50% 26.90% 36.70% 29.61% 29.39% 40.66% 30.73% 35.62% 41.38% 37.54% 35.25% 34.44% 1 or 2 Times a Week 27.20% 24.20% 24.80% 24.50% 25.80% 30.00% 26.40% 28.10% 23.30% 23.30% 21.00% 30.00% 22.70% 23.35% 24.81% 23.08% 25.19% 28.76% 25.00% 23.92% 25.54% 25.28% 1 or 2 Times a Month 15.90% 6.50% 8.00% 5.90% 4.40% 6.70% 7.90% 7.90% 6.90% 5.20% 5.70% 8.50% 2.80% 5.92% 5.34% 5.49% 7.05% 5.01% 5.17% 4.65% 5.04% 6.47% Very Seldom NA 7.20% 6.80% 6.40% 8.20% 7.50% 4.60% 3.90% 3.90% 5.20% 6.70% 6.10% 4.50% 7.24% 4.20% 5.49% 6.80% 5.80% 2.59% 4.98% 4.32% 5.35% ACRTA Rating Excellent 38.00% 38.00% 36.70% 33.20% 37.00% 35.80% 41.90% 44.00% 34.20% 43.00% 38.40% 56.40% 49.60% 45.67% 61.35% 58.44% 60.12% 57.67% 51.96% 47.83% 59.53% 46.13% Good 42.00% 42.00% 39.90% 44.20% 42.00% 40.00% 40.00% 42.90% 44.70% 33.30% 39.30% 22.60% 32.50% 36.00% 23.19% 27.27% 26.39% 18.33% 28.43% 34.78% 26.04% 34.56% Satisfactory 18.00% 18.00% 21.40% 21.70% 17.70% 21.90% 14.90% 11.40% 12.40% 19.40% 20.40% 18.80% 15.00% 14.33% 11.59% 6.49% 11.44% 15.33% 8.82% 10.87% 9.30% 15.20% Poor 2.00% 2.00% 1.60% 0.90% 2.80% 1.90% 2.30% 1.70% 4.80% 2.70% 1.20% 1.50% 1.40% 4.00% 0.97% 3.90% .88% 6.00% 7.84% 4.35% .93% 2.65% Bad 0.00% 0.00% 0.40% 0.00% 0.50% 0.40% 0.90% 0.00% 3.90% 1.60% 0.60% 0.70% 1.40% 0.00% 2.90% 3.90% 1.17% 2.67% 2.94% 2.17% 4.19% 1.44%

A - 15
TABLE A-18
RIDERSHIP PROFILE COMPARISON
(Continued)
1992 1993 1994 1995 1996 1997 1998 1999 2000 2001 2003 2004 2006 2007 2010 2011 2012 2013 2014 2015 2016 Average
1992-2016
Length of Patronage
Less than 1 Year 11.40% 11.40% 17.30% 17.60% 15.40% 22.80% 14.70% 17.50% 18.60% 17.30% 16.00% 13.90% 29.50% 20.00% 25.00% 18.48% 23.93% 8.36% 23.68% 23.59% 24.91% 18.64% Between 1 and 3 Yrs 18.10% 18.10% 18.50% 18.00% 19.20% 18.70% 27.20% 20.30% 14.30% 21.50% 21.70% 15.50% 21.80% 18.33% 24.23% 20.65% 26.95% 41.19% 21.05% 23.26% 28.16% 21.75% Between 3 and 5 Yrs 20.10% 20.10% 15.30% 12.20% 19.20% 10.50% 15.70% 14.10% 13.90% 14.10% 14.80% 13.20% 11.10% 16.00% 10.38% 9.78% 12.59% 20.90% 11.40% 17.28% 11.91% 14.50% Between 5 and 10 Yrs 17.50% 17.50% 15.60% 21.60% 15.40% 17.20% 12.40% 16.90% 17.70% 16.20% 14.50% 18.60% 11.40% 14.00% 15.00% 21.74% 11.84% 9.55% 18.42% 10.63% 13.17% 15.56% Over 10 Years 32.90% 32.90% 33.30% 30.60% 30.80% 30.70% 30.00% 31.10% 35.50% 30.90% 33.10% 38.80% 26.20% 31.67% 25.38% 29.35% 24.69% 20.00% 25.44% 25.25% 21.30% 29.52% Reason Using RTA Only Transportation/Don't Drive 67.20% 67.20% 69.40% 63.80% 68.00% 67.40% 64.00% 61.00% 58.80% 38.80% 65.20% 56.90% 61.60% 56.60% 66.67% 59.63% 53.26% 29.51% 56.55% 59.65% 72.01% 60.15% Cheaper Than Taxi 10.70% 10.70% 14.70% 16.80% 7.70% 10.10% 12.10% 13.00% 19.30% 24.50% 10.20% 15.40% 7.10% 14.29% 8.05% 16.51% 19.35% 25.82% 17.24% 12.68% 17.91% 14.48% Cheaper Than Driving 3.40% 3.40% 1.20% 0.00% 2.20% 1.90% 2.80% 2.30% 2.60% 3.20% 4.20% 7.70% 3.20% 5.12% 2.30% 4.59% 8.48% 11.89% 10.34% 5.19% 7.09% 4.43% Convenient 5.40% 5.40% 7.80% 13.10% 14.40% 11.20% 14.00% 12.40% 14.50% 20.20% 12.70% 12.30% 20.60% 14.29% 7.66% 11.01% 8.70% 26.64% 6.21% 2.02% 2.24% 11.56% Between Vehicles 4.70% 4.70% 6.90% 6.30% 7.70% 9.40% 7.00% 11.30% 4.80% 13.30% 7.50% 7.70% 7.50% NA NA NA NA NA N/A NA NA 4.70% Other 8.60% 8.60% NA NA NA NA NA NA NA NA NA NA NA 9.70% 15.33% 8.26% 10.22% 6.15% 9.66% 16.14% .75% 4.45% Drivers License Have License 28.10% 28.10% 32.00% 29.70% 33.30% 33.70% 37.00% 35.40% 29.30% 27.90% 31.50% 29.30% 30.40% 24.91% 29.88% 34.44% 25.47% 40.94% 25.45% 28.63% 28.98% 30.69% Does Not Have License 71.90% 71.90% 68.00% 70.30% 66.70% 66.30% 63.00% 64.60% 70.70% 72.10% 68.50% 70.70% 69.60% 75.10% 70.12% 65.56% 74.53% 59.06% 74.55% 71.37% 71.02% 69.31% Difficulties Using RTA Getting On/Off Bus 12.30% 12.30% 21.00% 11.00% 10.70% 14.70% 12.90% 8.80% 14.20% 18.60% 7.10% 5.00% 5.50% 8.95% 6.90% 11.40% 8.46% 2.61% 7.50% 5.95% 5.95% 10.09% Walking 2-3 Blocks 25.80% 25.80% 26.70% 16.80% 16.70% 12.30% 13.40% 21.10% 16.00% 20.50% 11.20% 9.10% 8.70% 12.82% 10.34% 10.53% 12.15% 22.75% 8.33% 8.33% 10.56% 15.23% Standing 10 Minutes 25.80% 25.80% 31.00% NA NA NA NA NA NA 25.60% 19.10% 3.30% 12.00% 12.67% 14.94% 12.28% 14.97% NA 15.83% 17.26% 14.08% 11.65% Keep Balance on Bus 3.90% 3.90% 4.30% 3.70% 2.70% 4.00% 3.60% 5.40% 2.30% 7.70% 6.00% 3.30% 3.90% 4.07% 4.98% 3.51% 5.42% 10.43% 3.33% 2.68% 4.58% 4.46% Read/Understand Info 7.10% 7.10% 6.20% 7.40% 4.30% 7.50% 5.20% 8.20% 8.20% 4.50% 5.70% 16.50% 5.80% 6.88% 3.07% 6.14% 5.86% 8.06% 0.83% 5.06% 5.63% 6.44% Grasp/Hold Objects 2.60% 2.60% 1.40% 1.60% 2.20% 2.80% 2.10% 1.40% 3.20% 2.60% 2.70% 3.30% 1.00% 2.44% 1.92% 1.75% .65% 21.09% 0.00% .60% 2.11% 2.86% Other NA NA 9.40% 1.60% 3.20% 1.20% NA 0.00% 3.50% 1.20% 0.00% NA 0.60% 4.61% 3.07% 8.77% 3.47% 3.55% 3.33% 5.36% 4.93% 2.75% No Difficulties NA NA NA 57.90% 60.20% 69.00% 66.50% 68.00% 63.50% 51.30% 48.10% 56.20% 62.50% 47.56% 54.79% 45.61% 49.02% 3.55% 60.83% 54.76% 50.70% 46.19%

B - 1
APPENDIX B 2016 UPLIFT SURVEY ANALYSIS
Each year ACRTA tries to do an analysis of the level of service provided by the Demand Response Program to evaluate the quality of service. ACRTA transports some of the UPLIFT clients on a contract basis for several social service agencies. These clients find it very difficult if not impossible to answer the survey questions, making it very difficult to obtain very many surveys. For the past several years there have not been enough to surveys to get a good overall view of the UPLIFT system. In 2016 between LACRPC and ACRTA staff there were 41 passengers that were able to fill out a survey. Currently there are two types of service being ran under the uplift system, the ADA service which follows all of the ADA rules and regulations and a Demand Response service. To be eligible to use the ACRTA ADA service, the patron must fill out an application. A portion of the application must be completed by a physician. The application is then reviewed for eligibility. There are different levels of eligibility, from full eligibility to partial, or temporary to trip by trip designation Under the ADA service the client must have documentation from a Dr. and be approved by ACRTA for the service. The Demand Response uses the same vehicles and drivers, but the client does not have to be ADA eligible. ADA passengers either pay for their trip privately or are covered by Medicare. Demand Response passengers are normally covered by another agency such as a school system, Jobs and Family Services, County Board of DD Veteran’s Administration or the Area Agency on Aging. Those questioned were asked how their trip was being paid for. Over half (63.33%) stated that another agency was covering the cost of their trip with the remaining 36.67 percent paying for the trip themselves. The following are the results of the surveys.
B.1 Demographic Overview
With respect to gender of ridership, 47.37 percent were male while 52.63 percent were female. The race of respondents was largely white (76.32%), African-American (21.05%) and Other (2.63%). In terms of age of the Uplift Program passengers (17.14%) of the ridership were 60 or over. .
TABLE B-1 UPLIFT SURVEY POPULATION
Gender Race
Male Female White Black Other
Uplift Riders 47.37% 52.63% 76.32% 21.06% 2.63%
B.2 Comparison of LACRTA Uplift Ridership to Fixed Route Ridership
The LACRTA annually conducts surveys of the passengers of its fixed route service as well as those who use the demand response service. The demographics and trip purposes of both services are presented in Table B-2 for comparison purposes. It is readily apparent that the clientele of the demand response program is not that much different from those using the fixed route system. In terms of gender, ridership on both services is split very closely with males being the major riders on the fixed route and females being the major riders in demand response. The age of riders on both fixed route and demand response are both primarily under the age of 60. Fixed route ridership is made up of 44.02% African-Americans while only 21.06% of the Demand Response ridership is African-American. Illustration B-1 show that when asked how many times a week they used the system the majority of the respondents (86.49%) stated that they use the system 7-10 times per week. When asked if they could use the RTA fixed route system only 8.70 percent

B - 2
answered that they could. The remainder cannot because they either need an assistant, have no sidewalks to get to the route or live to far from a fixed bus route.
TABLE B-2 COMPARISON OF DEMAND RESPONSE AND FIXED ROUTE RIDERSHIP
Category % Fixed Route Respondents
% Uplift Ridership
AGE COHORT Under 60 Over 60
86.43% 13.57%
82.86% 17.14%
GENDER Female Male
46.94% 53.06%
52.63% 47.37%
RACE African American Hispanic White Other
44.02%
2.70% 42.47% 10.81%
21.06%
0.00% 76.32%
2.63%
0.00% 10.00% 20.00% 30.00% 40.00% 50.00% 60.00% 70.00% 80.00% 90.00% 100.00%
7-10 times per week
1-2 times per month
3-4 times per month
4 times a year
ILLUSTRATION B-1WEEKLY USAGE
Many of the respondent have been riding the UPLIFT service for more than 3 years. Illustration B-2 shows the number of years that respondents have been using the service.
0.00%
5.00%
10.00%
15.00%
20.00%
25.00%
30.00%
35.00%
40.00%
45.00%
less than one year between 1-3 years between 3-5 years between 5-10 years over 10 years
ILLUSTRATION B-2YEARS OF USE

B - 3
Almost three quarters of the respondents are on disability. Illustration B-3 shows the breakdown of why the respondents use the system. Based on the usage it is easy to see why over 80% (83.87%) of the respondents have a household income below $15,000 per year.
0% 10% 20% 30% 40% 50% 60% 70% 80%
employed full-time
in school
on disability
retired
unemployed
seeking employment
ILLUSTRATION B-3WHY RESPONDENTS USE THE SYSTEM
When putting the surveys together RTA tries to come up with questions that will give them an overall understanding of how their riders perceive the system. The following questions were asked on the survey with the instructions that 5 is excellent, 4 good, 3 satisfactory, 2 poor, and 1 bad. Overall the respondents are happy with the cleanliness, safety and convenience of the UPLIFT service.
TABLE B-3 OVERALL VIEW OF RTA
5 4 3 2 1
Cleanliness of van exterior 81.08% 13.51% 5.41% 0.00% 0.00%
Cleanliness of van exterior 85.29% 2.55% 2.88% 0.00% 2.94%
Temperature on the van 67.57% 21.62% 5.41% 2.70% 2.70%
Physical condition of transfer facility 71.88% 25.00% 3.13% 0.00% 0.00%
Safe and competent drivers 88.89% 8.33% 2.78% 0.00% 0.00%
The smoothness of the ride and stops 68.57% 20.00% 11.43% 0.00% 0.00%
The time it takes to reach your destination 66.67% 24.24% 3.03% 3.03% 3.03%
Reliability of getting where you need to go on time
66.67% 24.24% 3.03% 3.03% 3.03%
Affordability of my trip 72.73% 21.21% 3.03% 0.00% 3.03%
Freedom from nuisance behaviors of other riders
75.00% 15.63% 9.38% 0.00% 0.00%
safety from crime in vans and at station 78.13% 21.88% 0.00% 0.00% 0.00%
overall convenience 75.76% 21.21% 3.03% 0.00% 0.00%
Rate RTA transit services 75.00% 21.88% 3.13% 0.00% 0.00%
The attitude of the drivers toward you 89.47% 10.53% 0.00% 0.00% 0.00%
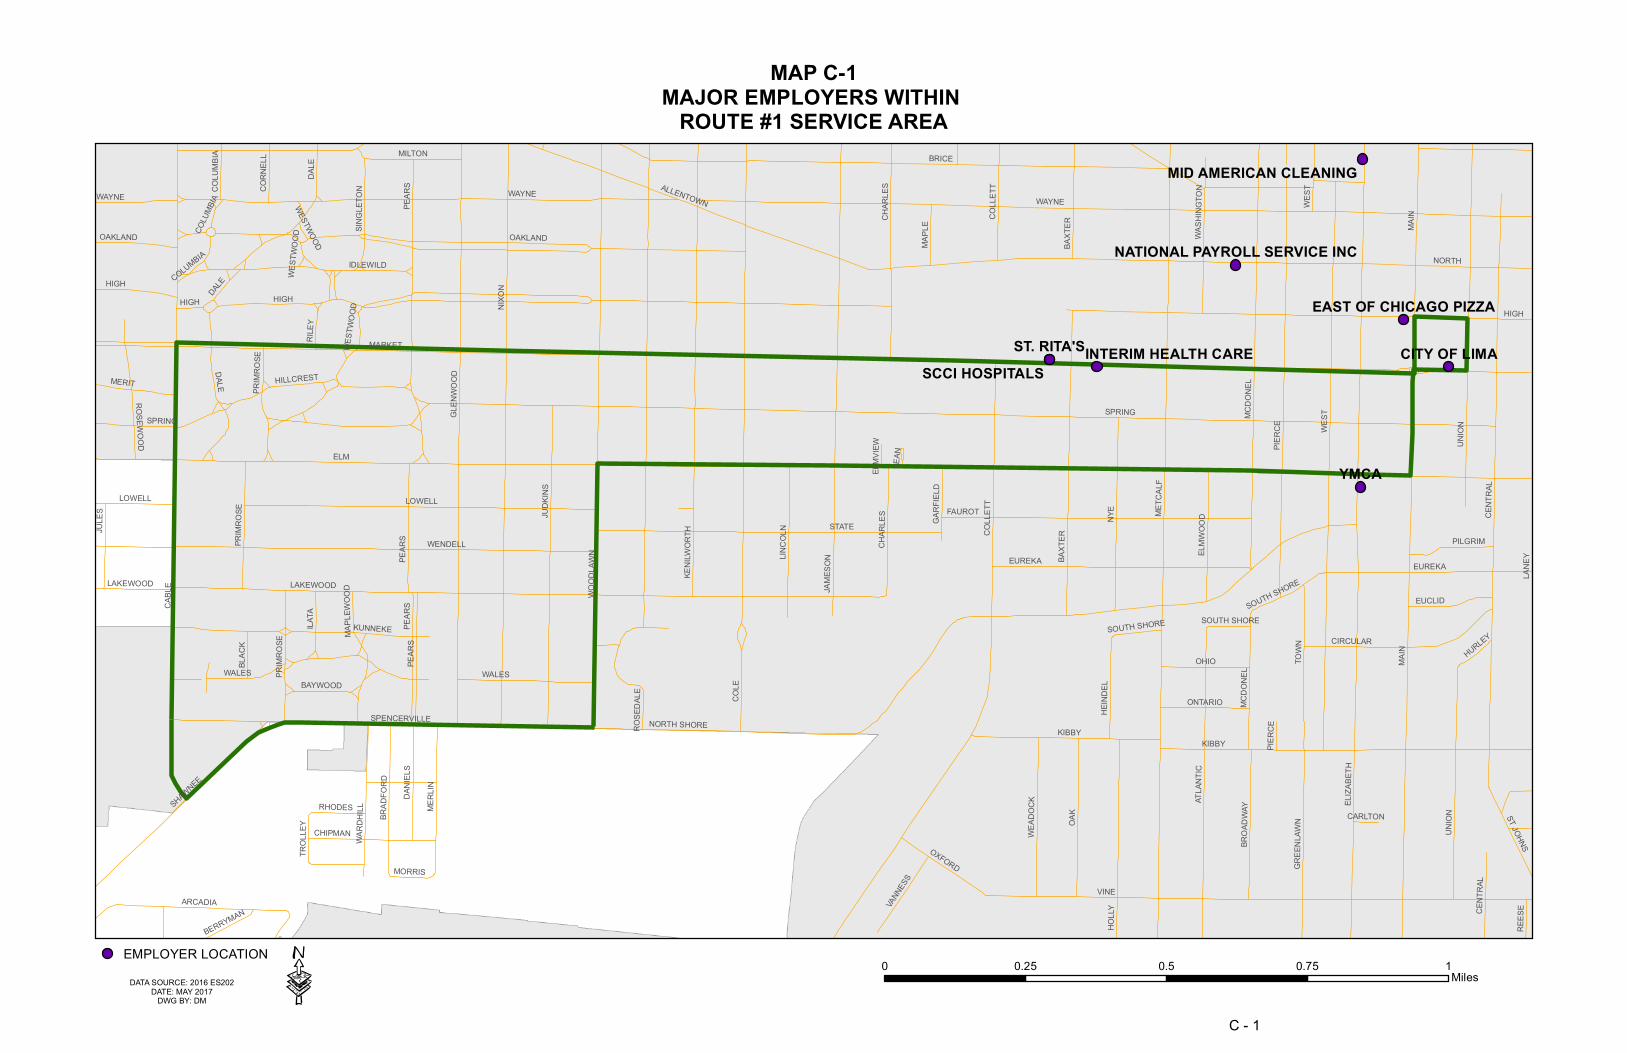
YMCA
ST. RITA'S CITY OF LIMASCCI HOSPITALS
INTERIM HEALTH CARE
EAST OF CHICAGO PIZZA
MID AMERICAN CLEANING
NATIONAL PAYROLL SERVICE INC
ELM
MARKET
SPRING
VINE
WAYNE
MAIN
NORTH
WEST
NIXO
N
BRICECA
BLE
METC
ALF
ELIZA
BETH
CENT
RAL
COLL
ETT
PIERC
E
STATE
NORTH SHORE
WENDELL
GLEN
WOOD
JAME
SON
WOOD
LAWN
NYE
LOWELL
PEAR
S
MCDO
NEL
FAUROT
BAXT
EROA
K
JUDK
INS
UNIO
N
ATLA
NTIC
KIBBY
HOLL
Y
HIGH
TOWN
KUNNEKE
EUREKA
SHAWNEE
OAKLAND
ARCADIA
IDLEWILD
SPENCERVILLE
MERL
IN
WALES
ALLENTOWN
CIRCULAR
DALE
LINCO
LN
OHIO
WEAD
OCK
COLE
WARD
HILL
GREE
NLAW
N
CHIPMAN
JULE
S
CHAR
LES
DANI
ELS
BRAD
FORD
MILTON
BROA
DWAY
MERIT HILLCREST
ILATA
ELMW
OOD
PRIM
ROSE
HEIN
DEL
ROSEWOOD
EUCLID
OXFORD
WASH
INGT
ON
PILGRIM
SINGL
ETON
MAPL
EWOO
D
ONTARIO
VANN
ESS
MAPL
E
ST JOHNS
ROSE
DALE
BAYWOOD
GARF
IELD
BLAC
K
KENI
LWOR
TH
LAKEWOOD
RHODES
RILE
Y
CORN
ELL
REES
E
TROL
LEY
MORRIS
COLU
MBIA
HURLEY
BERRYMAN
WEST
WOOD
SOUTH SHORE
CARLTON
JEAN
ELMV
IEW
LANE
Y
SPRING
WAYNE
SOUTH SHORE
OAKLAND
PEAR
S
PRIM
ROSE
PIERC
E
COLU
MBIA
SOUTH SHORE
UNIO
N
MAIN
DALE
PEAR
S
CHAR
LES
HIGH
EUREKA
DALE
WESTWOOD
LOWELL
WEST
WOOD
COLL
ETTWAYNE
KIBBY
HIGH
WEST
WALES
COLUMBIA
PEAR
S
MCDO
NEL
BAXT
ER
HIGH
PRIM
ROSE
CENT
RAL
LAKEWOOD
MAP C-1MAJOR EMPLOYERS WITHIN
ROUTE #1 SERVICE AREA
EMPLOYER LOCATION0 0.25 0.5 0.75 1
Miles·C - 1
DATA SOURCE: 2016 ES202DATE: MAY 2017
DWG BY: DM
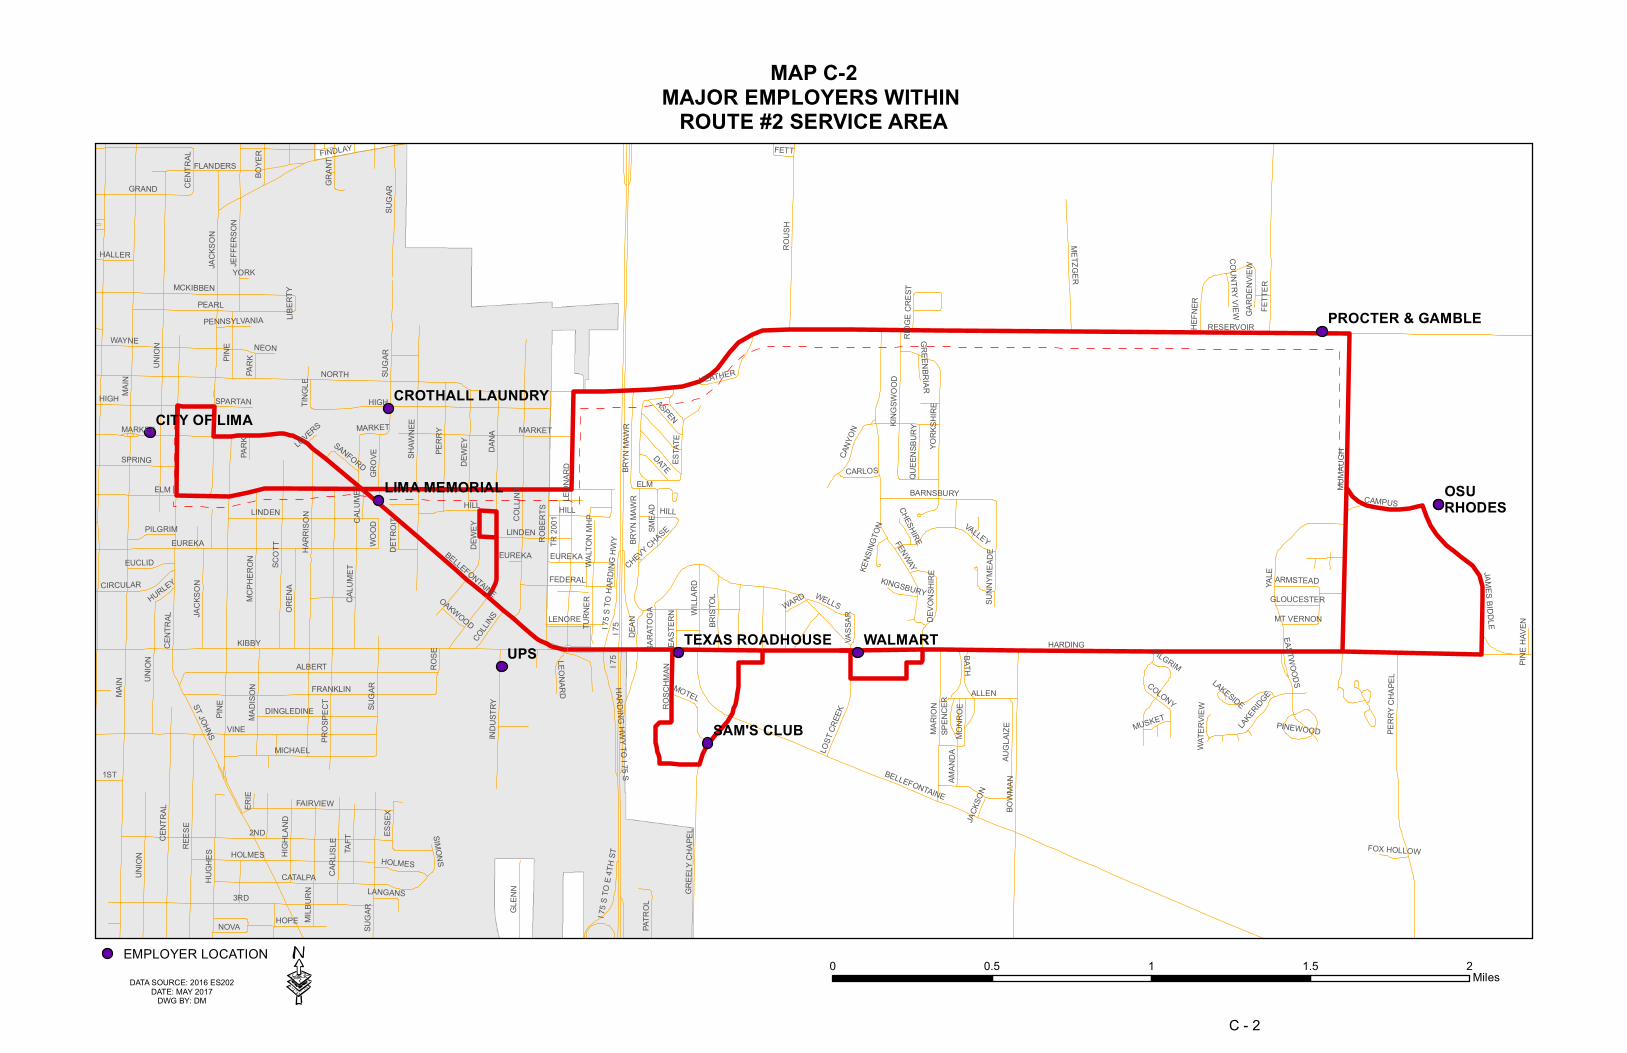
OSU
UPS
RHODES
WALMART
SAM'S CLUB
CITY OF LIMA
LIMA MEMORIAL
TEXAS ROADHOUSE
PROCTER & GAMBLE
CROTHALL LAUNDRY
I 75
ELM
MAIN
RESERVOIR
HARDINGKIBBY
PINE
2ND
3RD
VINE
NORTH
UNIO
N
HIGH
DANA
BELLEFONTAINE
FENWAY
EUREKA
MUMA
UGH
ALBERT
COLL
INS
BOWM
AN
REES
E
HARR
ISON
YALE
SCOT
T
LEON
ARD
SHAW
NEE
ROBE
RTS
ROUS
H
CATALPA
PROS
PECT
FRANKLIN
PEARL
CENT
RAL
FETT
ER
FINDLAY
WAYNE
LINDEN
HOPE
MCKIBBEN
MARI
ON
MARKETPE
RRY
SUGA
R
PERR
Y CHA
PEL
LOST
CREE
K
MICHAEL
HUGH
ES TAFT
DEWE
Y
FAIRVIEW
FLANDERS
OREN
A
JEFF
ERSO
N
YORK
SHIR
E
INDU
STRY
VALLEY
MILB
URN GR
EELY
CHA
PEL
MCPH
ERON
CALU
MET
METZGER
GRAND
ALLEN
KINGS
WOOD
ESTA
TE
MADI
SON
GLEN
N
CARL
ISLE
JACK
SON
SPRING
COLONY
HEFN
ER
AUGL
AIZE
FEDERAL
ROSC
HMAN
ST JOHNS
CANY
ON
DINGLEDINE
TURN
ER
GROV
E
JAMES BIDDLE
WILL
ARD
BATH
ESSE
X
BARNSBURY
MOTELBR
ISTOL
LAKERIDGE
HIGH
LAND
ROSE
TR 20
01
CIRCULAR
SMEA
D
BRYN
MAW
R
HEATHER
DATE
SUNN
YMEA
DE
1ST
WELLS
ASPEN
LENORE
HILL
PATR
OL
CAMPUS
GRAN
T
EUCLID
NOVA
HOLMES
BOYE
R
DEVO
NSHI
RE
PILGRIM
HARDING HWY TO I 75 S
MONR
OE
CARLOS
LAKESIDE
HALLER
FETT
PARK
I 75 S
TO E
4TH
ST
AMAN
DA
WOOD
DEANI 7
5 S TO
HAR
DING
HWY
SPARTAN
CHEVY CHASE
EAST
ERN WARD
QUEE
NSBU
RY
VASS
AR
ARMSTEAD
TINGL
E
SPEN
CER
SANFORD
SARA
TOGA
ERIE
DETR
OIT
NEON
GLOUCESTERWA
LTON
MHP
GARD
ENVIE
W
MT VERNON
HURLEYOAKWOOD
CHESHIRE
KINGSBURY
LANGANS
PINEWOOD
RIDG
E CRE
ST
PENNSYLVANIA
PINE H
AVEN
FOX HOLLOW
COUNTRY VIEW
KENS
INGTO
N
EASTWOODS
WATE
RVIEW
GREENBRIAR
MUSKET
LIBER
TYYORK
LOVERS
SIMONS
PINE
HOLMES
ELM
MAIN
I 75
JACK
SON
SUGA
R
BELLEFONTAINE
SUGA
R
JACK
SON
CENT
RAL
MARKET
CALU
MET
COLLINS
EUREKA
HILL
SUGA
R
EUREKA
PILGRIM
HIGH
LINDEN
UNIO
N
DEWE
Y
HILL
LEONARD
CENT
RAL
MARKET
UNIO
N
BRYN
MAW
R
PARK
MAP C-2MAJOR EMPLOYERS WITHIN
ROUTE #2 SERVICE AREA
EMPLOYER LOCATION
C - 2
DATA SOURCE: 2016 ES202DATE: MAY 2017
DWG BY: DM · 0 0.5 1 1.5 2Miles

UNOH
KOHLS
LOWESMEIJER
MENARDS
EAST OF CHICAGO PIZZA
MID AMERICAN CLEANING
ELIDA
COLE
CABLE
ROBB
WEST
DILLER
SUGA
R
MAIN
BATY
NORTH
EAST
OWN
ALLENTOWN
METC
ALF
GRAND
LANE
EAST
KOOP
BRICE
NEELY
MARKET
STEV
ICK
UNIO
N
HIGH
BIBLE
NIXO
N
LATHAM
ELIZA
BETH
FINDLAYMURPHY
BROWER
EWING
SPRING
O'CONNOR
MCKIBBENRICHIE
FREYER
ASHTON
RICE
AMERICAN
EDGEWOOD
HALLER
JEFF
ERSO
N
DELPHOS
CORN
ELL
KIMBE
RLY
HAZEL
MCCU
LLOU
GH
JACK
SON
CHAPMAN
WOOD
LAWN
MERIT
CHAR
LES
RUNYAN
MARIAN
ROSE
DALE
PEAR
S
EDNA
NORTHERN
KING
BURCH
PIERC
E
KENI
LWOR
TH
ST CLAIR
LEWIS
COAKLEY
TREMONT
LESTER
MACKENZIE
COLU
MBIA
MCKIN
LEY
VIRGI
NIA
CRES
TWOO
D
DEBB
IE
PINE
FLANDERS
BOYE
R
ARLINGTON
COLL
INS
TR 20
07
WILLIAMS
SHAW
NEE
MELR
OSE
DALE
CAMP
KARE
N
ERTEL
HOMEW
ARD
COLL
ETT
IDLEWILD
DANA
SUMM
IT
PLAZA
MOUND
CARO
LYN
LOGAN
JUNE
AU
PERR
Y
CHEROKEE
MCDO
NEL
LARK
FORD
FERN
WOOD
WATT
AUGU
STA
CAROLINA
WAYNE
SHERMAN
PLAINFIELD
LIVE O
AK
CENT
RAL
ARTH
UR
BAHAMA
LONG
HART
ZLER
GRAN
T
NORT
HWOL
D
FEEMAN
BROO
KHAV
EN
TR 20
05
SERI
FF
BENH
AM
REIN
ELL
DEWE
Y
WARREN
LELAND
ANN WAY
GLEN
WOOD
CORTLANDT
RUSSELL
SKY HAWK
MALIBU
ADAM
S
EAGLE
NORTHBROOK
BLUF
F OAK
VICTO
RIA
MOLL
Y
KILDARE
CITABRIA
LORE
TTA
CENT
ER
JUDI
TH
ASHWOOD
MULLEN
PATTON
TR 20
04
MILTON
BATO
N RO
UGE
BUR OAK
CONC
EPT
DEER
KENT
HILLCREST
BAXT
ER
BIKINI
EDSEL
PROS
PERI
TY
PENN
Y LEE
FRAN
KS
OAKLAND
WHITE
HALL
LARR
Y
HELE
N
WINDSOR
TAYLOR
BUCK
SKIN
WASH
INGT
ON
CHAN
DLER
STEV
EN
INDE
PEND
ENCE
GOLDEN
BISCAYNE
JARED
WOOD
WARD
MUSSER
LUCIL
LE
JULIAN
PATRICIA
SINGL
ETON
ALIX
MAND
OLIN
OLYMPIA
GANN
ON
BAY
STANTON
JARVIS
AMARYLLIS
BROOKWOOD
BELV
IDER
E
GRAH
AM
CHRISTOPHER
KNOLLWOOD
MAPL
E
EDWARDS
BELLWOOD
ROBIN
HOO
DSADDLEBROOK UNIVERSITY
PARK
COLL
EGE
DAYTONA
SANDPIPER
JAME
SON
RACERS
PANGLE
LAKE
CIR
CLE
MICHIGAN
BERM
UDA
DELAWARE
PENNSYLVANIAFA
IRFIE
LD
DOE
ASPE
N
NORT
HLEA
ROBIN
MARI
LEE E
STAT
ES M
HP
JACOBS
RILE
Y
CLOV
ER
SHERWOOD
STEEPLE CHASE
BURD
EN
CHESTER
PRIMROSE
NEON
SHERRY LEE
BUCKINGHAM
CHESTERTON
STONEYWOOD
PIERRE
SHAR
ON R
OSE
BURL
INGT
ON BEAU
MONT
HARTFORD
SANFORD
FAWN
COLLINGWOOD
LANS
ING
WOOD
FORD
UNKN
OWN
MHP
BURC
H
SUMM
IT
GLEN
WOOD
BOYE
R
LORETTA
HIGH
SHERWOOD
DALE BA
XTER
MCDO
NEL
CHARLES
MURPHY
RICE
OAKL
AND
LONG
MARKET
CRESTWOOD
CHAPMAN
OAKLAND WAYNE
CENT
RAL
ELIZA
BETH
FAIR
FIELD
KENT
ROSE
DALE
COLU
MBIA
BURC
H
CENT
RALDALE
WAYNE
FORD
MURPHY
BURC
H
LANEFORD
WAYNE
KILDARE
WEST
LELAND
UNIO
N
UNIVERSITY
ROSE
DALE
LEWIS
GRAN
T
HIGH
PINE
SUGA
R
OAKLAND
HIGHHIGH
BURC
H
PATTON
O'CONNOR
HAZEL
KENI
LWOR
TH
LELAND
HIGH
ADAM
S
MAP C-3MAJOR EMPLOYERS WITHIN
ROUTE #3 SERVICE AREA
EMPLOYER LOCATION
C - 3
DATA SOURCE: 2016 ES202DATE: MAY 2017
DWG BY: DM · 0 0.5 1 1.5 2Miles
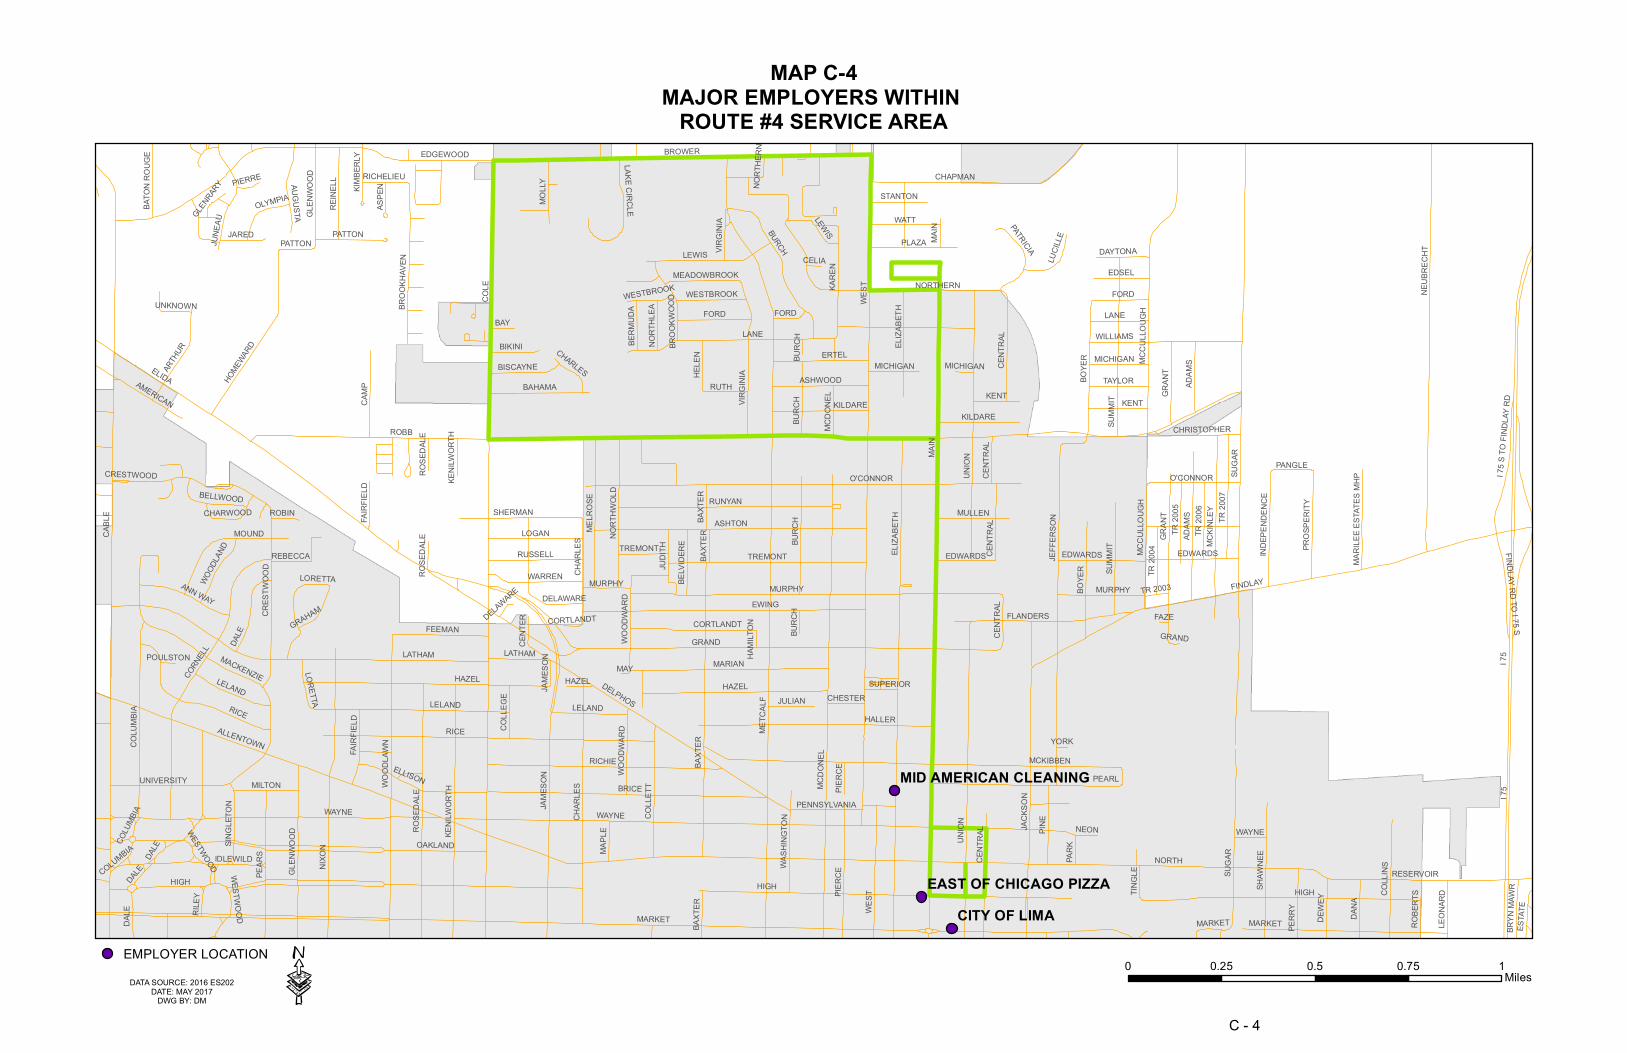
CITY OF LIMAEAST OF CHICAGO PIZZA
MID AMERICAN CLEANING
I 75
ROBB
COLE
MAIN
NORTHWE
ST
CABL
E
MARKET
ELIDA
WAYNE
SUGA
R
METC
ALF
GRAND
LANE
FINDLAY
BRICE
HIGH
UNIO
N
LATHAM
MCDO
NEL
ELIZA
BETH
NIXO
N
MURPHY
BROWER
EWING
O'CONNOR
MCKIBBENRICHIE
ALLENTOWN
NEUB
RECH
T
ASHTON
RICE
EDGEWOOD
HALLER
JEFF
ERSO
N
DELPHOS
CORN
ELL
JACK
SON
PEARL
JAME
SON
HAZEL
CHAR
LES
RUNYAN
MARIAN
WOOD
LAWN
NORTHERN
ROSE
DALE
MCCU
LLOU
GH
BURCH
PEAR
S
CHAPMAN
LEWIS
TREMONT
KENI
LWOR
TH
MACKENZIE
COLU
MBIA
PIERC
E
MCKIN
LEY
VIRGI
NIA
CRES
TWOO
D
RESERVOIR
PINE
FLANDERS
BOYE
R
TR 20
07
OAKLAND
WILLIAMS
MELR
OSE
DALE
CAMP
KARE
N
ERTEL
HOMEW
ARD
COLL
ETT
IDLEWILD
SUMM
IT
COLL
INS
PLAZA
MOUND
SHAW
NEE
LOGAN
JUNE
AU
UNIVERSITY
FORD
WATT
SHERMAN
CENT
RAL
ARTH
UR
BAHAMA GRAN
T
NORT
HWOL
DFEEMAN
BROO
KHAV
EN
TR 20
05
REIN
ELL
WARREN
DANA
LELAND
ANN WAY
CORTLANDT
RUSSELL
PERR
Y
TR 20
06AD
AMS
AMERICAN
MOLL
Y
KILDARE
AUGUSTA
LORETTA
CENT
ER
JUDI
TH
ASHWOOD
MULLEN
PATTON
TR 20
04
GLEN
WOOD
MILTON
KENT
BIKINI
EDSEL
PROS
PERI
TY
ELLISON
DEWE
Y
RUTH
HELE
N
TAYLOR
WASH
INGT
ON
INDE
PEND
ENCE
BISCAYNE
JARED
WOOD
WARD
LUCIL
LE
JULIAN
PATRICIA
SINGL
ETON
I 75 S
TO FI
NDLA
Y RD
ESTA
TE
OLYMPIAWOO
DLAN
D
BAY
STANTON
ROBE
RTS
BROO
KWOO
D
LEON
ARD
BELV
IDER
E
GRAHAM
CHRISTOPHER
KIMBE
RLY
BAXT
ER
MAPL
E
EDWARDS
BELLWOOD
REBECCA
PARK
COLL
EGE
DAYTONA
WESTBROOK
PANGLE
LAKE CIRCLE
MICHIGAN
BATO
N RO
UGE
FINDLAY RD TO I 75 S
BERM
UDA
DELAWARE
BRYN
MAW
R
PENNSYLVANIA
FAIR
FIELD
ASPE
N
TINGL
E
NORT
HLEA
MEADOWBROOK
ROBIN
RICHELIEU
MARI
LEE E
STAT
ES M
HP
RILE
Y
CHESTER
NEON
UNKNOWN
CHARWOOD
PIERRE
TR 2003
GLENRAR
Y
CELIA
WESTWOOD
YORK
MAY
HAMI
LTON
FAZE
SUPERIOR
POULSTON
BURC
H
DALE
ROSE
DALE
CHARLES
EDWARDS
BOYE
R
LANE
SUMM
IT
MICHIGAN
LATHAM
DALE
PIERC
E
CHAR
LES
MCDO
NEL
I 75
WAYNE
LORETTA
WESTBROOK
LELANDBA
XTER
HAZEL
MARKET
WEST
BAXT
ER
BURC
HBU
RCH
ELIZA
BETH
CENT
RAL
CENT
RAL
ROSE
DALE
FORD
FAIR
FIELD
CENT
RAL
JAME
SON
SUGA
R
MARKET
GRAN
T
BAXT
ER
COLU
MBIA
MURPHY
WESTWOOD
WOOD
WARD
FORD
CENT
RAL
GLEN
WOOD
KENI
LWOR
TH
ADAM
S
KILDARE
LEWIS
GRAND
MICHIGAN
O'CONNOR
DELAWARE
NORT
HERN
TREMONT
LELAND
WAYNE
HIGH
VIRGI
NIA
MAIN
BURC
H
COLUMBIA
EDWARDS
UNIO
N
HAZEL
MCCU
LLOU
GH
CRESTWOOD
KENT
MURPHY
RICE
DALE
CORTLANDT
HIGH
PATTON
MAP C-4MAJOR EMPLOYERS WITHIN
ROUTE #4 SERVICE AREA
EMPLOYER LOCATION
C - 4
0 0.25 0.5 0.75 1MilesDATA SOURCE: 2016 ES202
DATE: MAY 2017DWG BY: DM ·

YMCA
WOCAP
CITY OF LIMA
SUPERIOR FORGE LIMA COMMUNITY HEALTH CENTER
COLEMAN PROFESSIONAL SERVICES
ELM
4TH
I 75
VINEMAIN
KIBBY
SPRING
PINE
2ND
3RD
MARKET
METC
ALF
C
REES
E
5TH
DANA
CENT
RAL
8TH
WEST
6TH
COLL
ETT
NIXO
N
EUREKA
9TH
ELIZA
BETH HARDING
7TH
ALBERT
ST JOHNS
STATE
NORTH SHORE
HARR
ISON
DIXIE
SCOT
T
NYE
CATALPA
ZEITS
PROS
PECT
FRANKLIN
LEON
ARD
COLL
INS
ROBE
RTS
HUGH
ES
GREE
LY C
HAPE
L
SUGA
R
FAUROT
PIERC
E
OAK
JUDK
INS
BAXT
ER
10TH
LINDEN
FT AMANDA
UNIO
N
ATLA
NTIC
NORV
AL
LAKEWOOD
HOPE
LENN
OX
WOOD
LAWN
SHAW
NEE
HOLL
Y
MCCL
AIN
LOST
CREE
K
JAME
SON
MICHAEL
TAFT
GARL
AND
FAIRVIEW
PERR
Y
TOWN
1ST
DEWE
Y
MCDO
NEL
OREN
A
INDU
STRY
MILB
URN
MCPH
ERON
CALU
MET
GLEN
N
BELLEFONTAINE
CLYD
E
MADI
SON
CARL
ISLE
GREE
NLAW
N
CIRCULAR
JACK
SON
ESTA
TE
FEDERAL
ROSC
HMAN
LINCO
LN
WALES
PAUL
DINGLEDINE
OHIO
TURN
ER
GROV
E
WILL
ARD
ESSE
X
CEDA
R
MOTEL
CANYON
WEAD
OCK
LOWELL
BRIST
OL
COLE
HIGH
LAND
ROSE
KINGS
TON
TR 20
01
PATR
OLSM
EAD
CHAR
LEDO
N
CHAR
LES
DATE
BROA
DWAY
WELLS
ELMW
OOD
LENORE
HILL
HEIN
DEL
BRYN
MAW
R
EUCLID
OXFORD
NOVA
HOLMES
ASPEN
CHEMICAL
PILGRIM
ONTARIOHARDING HWY TO I 75 S
VANN
ESS
CHESTNUT
ROSE
DALE
RADC
LIFFE
I 75 S
TO E
4TH
STI 7
5 N TO
E 4T
H ST
LIBER
TY C
OMMO
NS
MT H
OLYO
KE
ST AN
DREW
S
MONR
OE
LAKE
BELM
ONT
WOOD
PARK
SPENCERVILLE DEANI 7
5 S TO
HAR
DING
HWY
HARDING HWY TO I 75 N
CHEV
Y CHA
SEEA
STER
N
GARF
IELD
VASS
AR
KENI
LWOR
TH
BRAD
FIELD
SANFORD
SARA
TOGA
MAKIN
E 4TH
ST TO
I 75 S
E 4TH
ST TO
I 75 N
ERIE
DETR
OIT
PRIVATE DRIVE
WALT
ON M
HP
HURLEYOAKWOOD
LANGANS
CHER
RY
SOUTH SHORE
LOVERS
JEAN
ELMV
IEW
SIMONS
DEWE
Y
9TH
EUREKA
DEWE
Y
EUREKA
MARKET
I 75
MAIN
SOUTH SHORE
ELM
SOUTH SHORE
HILL
BRYN
MAW
R
PIERC
EMCDO
NEL
KIBBY
6TH
COLLINS
LINDEN
SUGA
R
CHES
TNUT
MARKET
7TH
JACK
SON
LEONARD
UNIO
N
8TH
MAIN
10TH
CENT
RAL
HILL
7TH
UNIO
NUN
ION
9TH9TH
ATLA
NTIC
7TH
SUGA
RCA
LUME
T
5TH
BELLEFONTAINE
HOLMES
MAP C-5MAJOR EMPLOYERS WITHIN
ROUTE #5 SERVICE AREA
EMPLOYER LOCATION
C - 5
DATA SOURCE: 2016 ES202DATE: MAY 2017
DWG BY: DM · 0 0.25 0.5 0.75 1Miles

UNOH
WALMART
CITY OF LIMA
LIMA CONVALESCENT HOME
NATIONAL PAYROLL SERVICE INC
ELM
COLE
ELIDA
ROBBCABL
E
MAIN
WEST
SPRING
NORTH
METC
ALF
EAST
OWN
GRAND
ALLENTOWN
MARKET
LANE
KOOP
UNIO
N
BRICE
NIXO
N
MCDO
NEL
ELIZA
BETH
LATHAM
MURPHY
BROWER
EWING
O'CONNOR
MCKIBBENRICHIE
ASHTON
RICE
AMERICAN
WOOD
LAWN
ROSE
DALE
HALLER
JEFF
ERSO
N
DELPHOSCO
RNEL
L
NEELY
PEARL
HAZEL
PEAR
S
PIERC
E
JACK
SON
MERIT
CHAR
LES
RUNYAN
MARIAN
KENI
LWOR
TH
NORTHERN
KING
BURCH
CHAPMAN
LEWIS
TREMONT
MACKENZIE
COLU
MBIA
PINE
VIRGI
NIA
CRES
TWOO
D
FLANDERS
BOYE
R
ARLINGTON
BAXT
ER
FERN
WOOD
MELR
OSE
DALE
HIGHCA
MP
KARE
N
ERTEL
FINDLAY
HOMEW
ARD
COLL
ETT
IDLEWILD
SUMM
IT
PLAZA
MOUND
EDGEWOOD
LOGAN
FORD
NYE
WATT
JUNE
AU
CAROLINA
WAYNE
SHERMAN
CENT
RAL
ARTH
UR
BAHAMA
HART
ZLER
NORT
HWOL
D
FEEMAN
BROO
KHAV
EN
BENH
AM
REIN
ELL
WARREN
LELAND
FREYER
ANN WAY
CORTLANDT
RUSSELL
MALIBU
EAGLE
VICTO
RIA
MOLL
Y
KILDARE
LORETTA
CITABRIA
CENT
ER
JUDI
TH
ASHWOOD
CESS
NA
MULLEN
AUGUSTA
PATTON
MILTON
CONC
EPT
DEER
CHAN
CELL
OR
KENT
HILLCREST
BIKINI
GLEN
WOOD
ELLISON
SCOT
T
RUTH
OAKLAND
WHITE
HALL
HELE
N
WINDSOR
ROSEWOOD
BUCKSKIN
CHEROKEE
WASH
INGT
ON
CHAN
DLER
EDSEL
GOLDEN
JUDK
INS
BISCAYNE
CLOS
E
HILL
SDAL
E
JARED
WOOD
WARD
MUSSER
LUCI
LLE
TAYLOR
JULIAN
PATRICIA
SINGL
ETON
NORTHWESTERN
WOODL
AND
BAY
STANTON
JARVIS
BROO
KWOO
DBE
LVID
ERE
GRAHAM
MAPL
E
EDWARDS
BELLWOODROBIN
HOO
D
SADDLEBROOK UNIVERSITY
PARK
COLL
EGE
KIMBE
RLY
JAME
SON
WILLIAMS
WESTBROOK
RACERS
LAKE CIRCLE
BLAC
KBUR
N
MICHIGAN
VERA
BERM
UDA
SPARTAN
DELAWARE
BATO
N RO
UGE
PENNSYLVANIA
FAIR
FIELD
DAYTONA
DOE
ASPE
N
TINGL
E
NORT
HLEA
MEADOWBROOK
ROBIN
RICHELIEU
PRIMROSE
SERI
FF
RILE
Y
SHERWOOD
STEEPLE CHASE
CHESTER
GLOR
IA
NEON
BUCKINGHAM
UNKNOWN
CHESTERTON
CHARWOOD
PIERRE
BURL
INGT
ONBE
AUMO
NT
CELIA
WEST
WOOD
TARA
FAWN
VETE
RAN'S
LIBER
TY
WOOD
FORD
YORK
MAY
HAMI
LTON
UNKNOWN MHP
JEAN
ELMV
IEW
PINE
FORD
COLUMBIA
BURC
H
UNIO
N
WAYNE
HAZEL
COLL
ETT
EDGEWOOD
HIGH
BURC
H
ROSE
DALE
MAIN
MCDO
NEL
OAKLAND
WAYNE
BURC
H
MARKET
SPRING
MICHIGAN
CRESTWOOD
VIRGI
NIA
CHAPMAN
WEST
HAZEL
HIGH
LELAND LELAND
MURPHY
CENT
RAL
SHERWOOD
CENT
RAL
KENI
LWOR
TH
CORTLANDT
DALE
PIERC
E
UNIVERSITY
UNKN
OWN
MHP
CENT
RAL
OAKLAND
PRIM
ROSE
DALE
KENT
GLEN
WOOD
BAXT
ER
ELIZA
BETH
CHAR
LES
LEWIS
BAXT
ER
LORETTA
CHARLES
LANE
RICE
HIGH
MAIN
BOYE
R
DELAWARE MURPHY
HIGH
EDWARDS
FORD
BURC
H
BAXT
ER
PATTON
LATHAM
MAP C-6MAJOR EMPLOYERS WITHIN
ROUTE #6 SERVICE AREA
EMPLOYER LOCATION
C - 6
DATA SOURCE: 2016 ES202DATE: MAY 2017
DWG BY: DM · 0 0.5 1 1.5 2Miles

UPS
FORDDANAODOT
METOKOTE
LIMA MEMORIAL
SPARTAN STORES
NICKLES BAKERY
PROCTER & GAMBLE
CROTHALL LAUNDRY SERVICES
ALLEN COUNTY EDUCATIONAL SERVICE
I 75
ADA
COOL
HARDING
ELM
THAY
ER
BIBLE
RESERVOIR
DIXIE
KIBBY
FETT
ER
SUGA
R
VINE
FINDLAY
PINE
ELIZA
BETH
ROBB
MAIN
NORTH
WEST
UNIO
N
SANDUSKY
HIGH
DANA
STEW
ART
EUREKA
FENW
AY
ROUS
H
MOWERY
NEUB
RECH
T
MUMA
UGH
ALBERT
COLL
INS
SLAB
TOWN
PIERC
E
WAYNE
HARR
ISON
YALE
SCOT
T
LEON
ARD
SHAW
NEE
ROBE
RTS
FRANKLIN
LANE
JEFF
ERSO
N
PEARLMCKIBBEN
PROS
PECT
MCCU
LLOU
GH
CHAPMAN
HADS
ELL
GRAND
MARKET
LINDEN
PERR
Y
SPRING
MURPHY
LOST CREEK
FETT
DEWE
Y
O'CONNOR
TOWN
MCKIN
LEY
FLANDERS
BOYE
R
OREN
A
YORK
SHIR
E
VALLEY
NORTHERN
WILLIAMS
MCPH
ERON
CALU
MET
METZGER
MARI
ON
KARE
N
HALLER
ALLEN
SUMM
IT
KINGS
WOOD
PLAZA
ESTA
TE
BOWM
AN
MADI
SON
WATT
MIRROR LAKE
CIRCULAR
JACK
SON
INDU
STRY
COLONY
HEFNER
BELLEFONTAINE
CENT
RAL
FEDERAL
GRAN
T
CANY
ON
TR 20
05
TURN
ERJAMES BIDDLEWI
LLAR
D
BATH
BARNSBURY
ROSC
HMAN
MOTEL
BRIST
OL
LAKERIDGE
FORDAD
AMS
GREE
NLAW
N
KILDARERO
SE
SMEA
DBR
YN M
AWR
MULLEN
PLAZA MHPTR
2004
HEAT
HER
DATE
SUNN
YMEA
DE
KENT
EDSEL
ASPEN
HILL
PERR
Y CHA
PEL
ERTEL
LARR
Y
CAMPUS
EUCLID
EWING
PILGRIM
I 75 S
TO FI
NDLA
Y RD
CHESTNUT
RADC
LIFFE
MONR
OE
PINE L
AKE
STANTON
CHRISTOPHER
EDWARDS
MT H
OLYO
KEST
ANDR
EWS
PARK
FINDLAY RD TO I 75 N
I 75 N
TO FI
NDLA
Y RD
WOOD
I 75 N
TO H
ARDI
NG H
WY
PANGLE
BUTTERNUT
UNKNOWN MHP
I 75 S
TO H
ARDI
NG H
WY
MARI
LEE E
STAT
ES M
HP
JACOBS
SANFORD
SARA
TOGA
DETR
OIT
NEON
GLOUCESTERMT VERNON
HURLEYOAKWOOD
KINGSBURY
PINEWOOD
RIDG
E CRE
ST
WINS
TON
PENNSYLVANIA
PINE H
AVEN
CHER
RY
KENS
INGTO
N
CAMBRIDGE
EASTWOODS
GREENBRIAR
SUGA
R
BELLEFONTAINE
DEWE
Y
SUGA
R
PIERC
E
CENT
RAL
CENT
RAL
KENT
UNKNOWN MHP
MIRROR LAKE
MARKET
ELMHILL
PENNSYLVANIA
UNIO
N
LANE
PINE
PILGR
IM
WEST
MAIN
I 75
LINDEN
GRAN
T
LEONARDUNIO
N
PINE
BOYE
R
EUREKA
SUMM
IT
MARKET
MAP C-7MAJOR EMPLOYERS WITHIN
ROUTE #7 SERVICE AREA
EMPLOYER LOCATION
C - 7
DATA SOURCE: 2016 ES202DATE: MAY 2017
DWG BY: DM · 0 0.5 1 1.5 2Miles
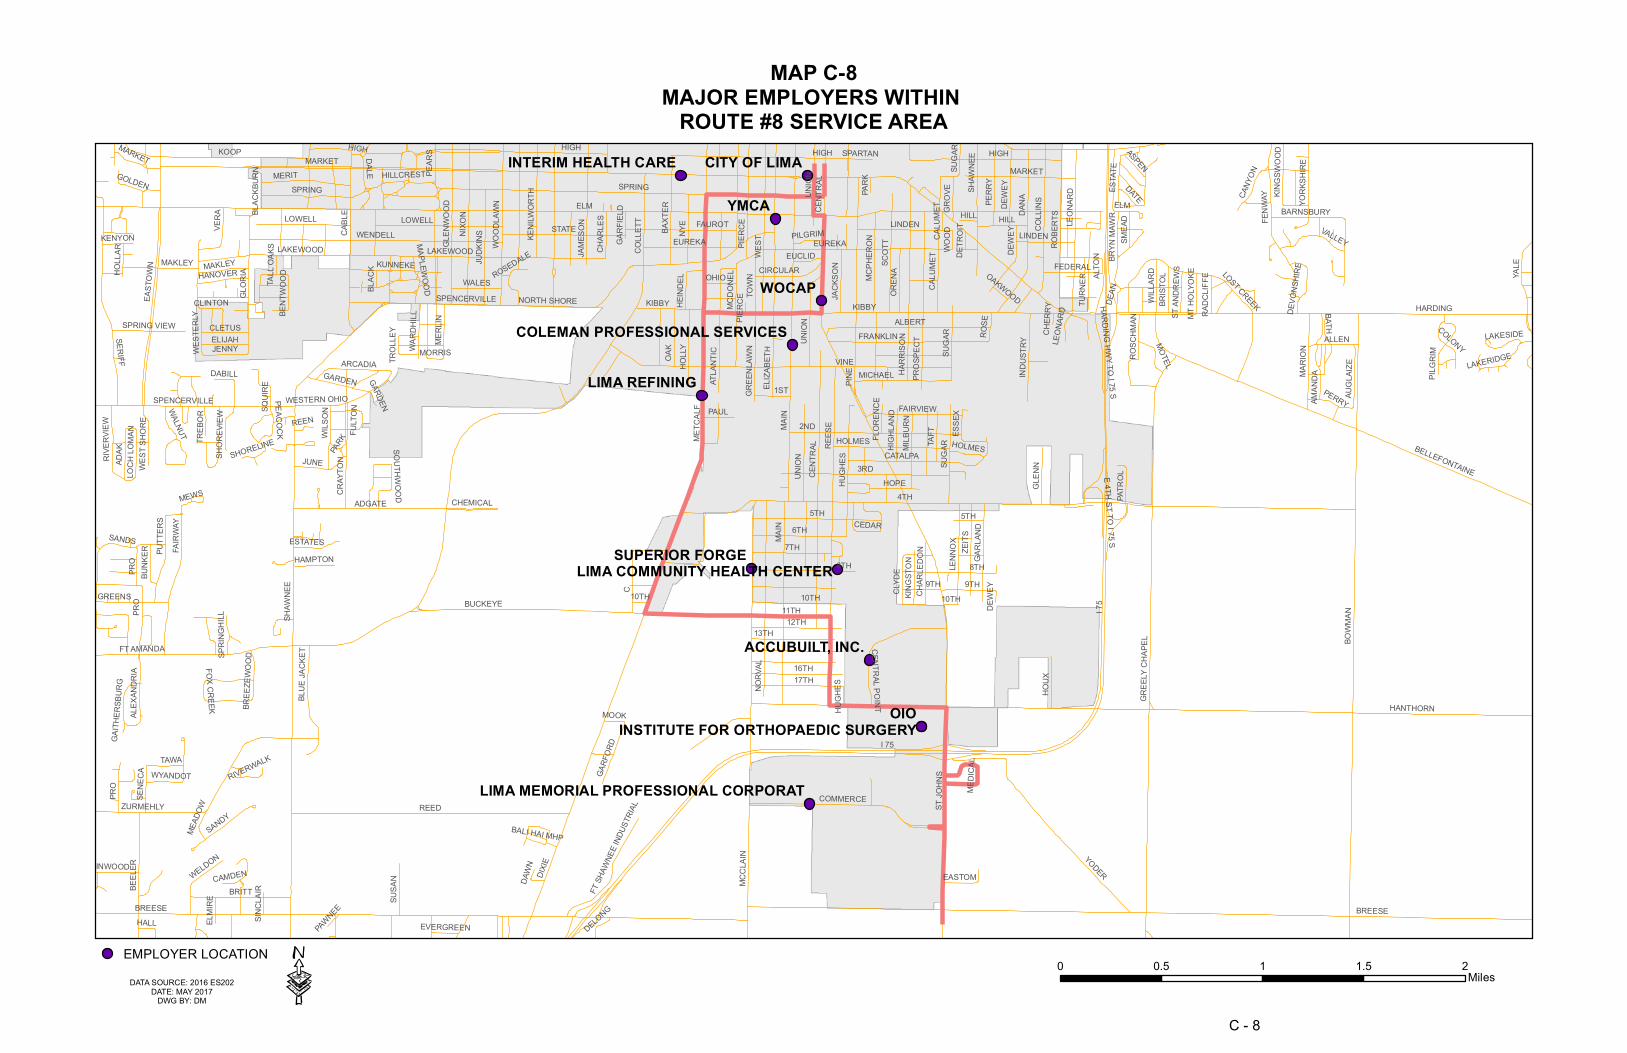
OIO
YMCA
WOCAP
CITY OF LIMA
LIMA REFINING
SUPERIOR FORGE
ACCUBUILT, INC.
INTERIM HEALTH CARE
LIMA COMMUNITY HEALTH CENTER
COLEMAN PROFESSIONAL SERVICES
INSTITUTE FOR ORTHOPAEDIC SURGERY
LIMA MEMORIAL PROFESSIONAL CORPORAT
I 75
ELM
4TH
BREESE
DIXIE
MARKET
HANTHORN
BOWM
AN
VINE
MAIN
SHAW
NEE
KIBBY
SPRING
ST JO
HNS
REED
REES
E
FT AMANDA
MCCL
AIN
PINE
C
2ND
3RD
METC
ALF
HARDING
BUCKEYE
GREE
LY C
HAPE
L
5TH
YODER
KOOP HIGH
DANA
CENT
RAL
WEST
SERIFF
8TH
WENDELL
BELLEFONTAINENI
XON
CABL
E
6TH
NORV
ALEL
IZABE
TH
COLL
ETT
EUREKA
9TH
ZURMEHLY
7TH
ALBERT
STATEGL
ORIA
NORTH SHORE
FENW
AY
ADGATE
17TH16TH
HARR
ISON
12TH
10TH
SCOT
T
COLL
INS
BRITT
13TH
LEON
ARD
NYE
11TH
ROBE
RTS
COMMERCE
FAIR
WAY
CATALPA
ZEITS
PROS
PECT
FRANKLIN
BEEL
ERPR
O
LOWELL
PIERC
E
HUGH
ES
YALE
MERIT
SUGA
R
FAUROTBAXT
ER
GLEN
WOOD
OAK
JUDK
INS
WOOD
LAWN
SPENCERVILLE
LAKEWOOD
LINDEN
UNIO
N
ATLA
NTIC
HOPE
JAME
SON
EAST
OWN
LENN
OX
MARI
ON
PERR
Y
HOLL
Y
LOST CREEKMICHAEL
WEST
ERLY
MCDO
NEL
TAFT
DEWE
Y
SANDY
GARL
AND
FAIRVIEW
JUNE
PUTT
ERS
TOWN
1ST
SANDS
ADAK
KUNNEKE
PEAR
S
OREN
A
VERA
HOUX
KENI
LWOR
TH
INDU
STRY
VALLEY
MILB
URN
MCPH
ERON
CALU
MET
GREENS
ARCADIA
GLEN
N
WILS
ON
BLUE
JACK
ET
ALLEN
SUSA
N
CLYD
E
GARDEN
ESTA
TE
YORK
SHIR
E
MERL
IN
WALES
WELDON
GREE
NLAW
N
ELIJAHCR
AYTO
NJENNY
CENTRAL POINT
CIRCULAR
JACK
SON
TAWA
COLONY
DALE
WESTERN OHIO
GARF
ORD
AUGL
AIZE
FEDERAL
ROSC
HMAN
MAKLEY
CANY
ON
PAUL
OHIO
TURN
ER
GROV
E
WILL
ARD
BATH
ESSE
X
RIVE
RVIEW
BARNSBURY
CLETUS
CEDAR
SENE
CA
MOTEL
SPRING VIEW
SQUI
RE
BRIST
OL
LAKERIDGE
WARD
HILL
HANOVER
ESTATES
ALEX
ANDR
IA
KINGS
TON
HIGH
LAND
ROSE
INWOOD
PATR
OLSM
EAD
TALL
OAK
S
CHAR
LEDO
N
BRYN
MAW
R
CHEMICAL
CHAR
LES
KINGS
WOOD
DATE
FT SH
AWNE
E IND
USTR
IAL
BUNK
ER
HILLCREST
SHORELINE
ASPEN
EASTOM
FULT
ON
WEST
SHOR
E
HILL
HEIN
DEL
HAMPTON
EUCLID
WALNUT
HOLMES
HOLL
AR
HALL
GOLDEN
PEACOCK
MEDI
CAL
DEVO
NSHI
RE
LOCH
LOMA
N
PILGRIMSH
OREV
IEWKENYON MAPLEWOOD
WYANDOT
TREB
OR
HARDING HWY TO I 75 S
ELMI
RE
ROSEDALE
SOUTHWOOD
BREE
ZEWO
OD
RADC
LIFFE
REEN
MOOK
GAITH
ERSB
URG
SPRI
NGHI
LL
BENT
WOOD
LAKESIDE
MT H
OLYO
KEST
ANDR
EWS
MEAD
OW
AMAN
DA
DELONG
WOOD
PARK
BLAC
KBUR
N
DEAN
DABILL
SPARTAN
GARF
IELD
FLOR
ENCE
BLAC
K
DAWN
SINCL
AIR
CLINTON
E 4TH ST TO I 75 S
ALTO
N
EVERGREEN
RIVERWALK
MEWS
CAMDEN
DETR
OIT
TROL
LEY
MORRIS
OAKWOOD
BALI HAI MHP
FOX CREEK
PAWNEE
CHER
RY
PIERC
E
PERRY
BREESE
I 75
HIGH
UNIO
N
LEON
ARD
10TH
HIGH
UNIO
N
SHAW
NEE
DEWE
Y
PRO
MAIN
PILGR
IM
LAKEWOOD
HIGH
MARKET
GARDEN
KIBBY
CENT
RAL
PARK HOLMES
DEWE
Y
HUGH
ES
CALU
MET
MAKLEY
PRO
EUREKA
10TH
MARKET
8TH
SPRING
SUGA
R
ELMLOWELL
5TH
SPENCERVILLE
SUGA
R
LINDEN
9TH
HILL
MAP C-8MAJOR EMPLOYERS WITHIN
ROUTE #8 SERVICE AREA
EMPLOYER LOCATION
C - 8
0 0.5 1 1.5 2MilesDATA SOURCE: 2016 ES202
DATE: MAY 2017DWG BY: DM ·

OIO
YMCA
INEOS
APOLLO
ST. RITA'S
SHAWNEE HIGH
LIMA REFINING
SHAWNEE MANOR
SUPERIOR FORGE
SCCI HOSPITALS
ACCUBUILT, INC.
GENERAL DYNAMICSPCS NITROGEN OHIO LIMA COMMUNITY HEALTH CENTER
INSTITUTE FOR ORTHOPAEDIC SURGERYI 75
ELM
4TH
DIXIE
BREESE
MARKET
BOWM
AN
VINE
MAIN
SHAW
NEE
KIBBY
HANTHORN
FT AMANDA
SPRING
ST JO
HNS
REED
REES
E
MCCL
AIN
PINE
C
2ND
3RD
METC
ALF
BUCKEYE
GREE
LY C
HAPE
L
5TH
KOOP
YODER
HIGH
ZURMEHLY
WEST
DANA
CENT
RAL
YOAK
AM
SERI
FF
WENDELL NIXO
N
HARDING
CABL
E
6TH
NORV
ALEL
IZABE
TH
COLL
ETT
EUREKA
9TH
7TH
ALBERT
STATE
SPENCERVILLEBELLEFONTAINE
GLOR
IA
FENW
AY
NORTH SHORE
ADGATE
17TH16TH
14TH
HARR
ISON
12TH
10TH
COLL
INS
SCOT
T
BRITT
15TH
13TH
LEON
ARD
NYE
INWOOD
11TH
ROBE
RTS
COMMERCE
FAIR
WAY
CATALPA
ZEITS
PROS
PECT
FRANKLIN
PIERC
E
PRO
LOWELLBE
ELER
HUGH
ES
MERIT
SUGA
R
GLEN
WOOD
FAUROT
BAXT
ER
WOOD
LAWN
OAK
JUDK
INS
LAKEWOOD
LINDEN
UNIO
N
JAME
SON
ATLA
NTIC
RESERVOIR
HOPE
EAST
OWN
LENN
OX
MARI
ON
PERR
Y
STEVICK
HOLL
Y
LOST CREEK
HAWT
HORN
E
MCDO
NEL
MICHAEL
WEST
ERLY
DALE
TAFT
DEWE
Y
SANDY
GARL
AND
FAIRVIEW
JUNE
PEAR
S
PUTT
ERS
TOWN
ODEM
A
SANDS
ADAK
KUNNEKE
KENI
LWOR
TH
OREN
A
VERA
HOUX
INDU
STRY
VALLEY
MILB
URN
MCPH
ERON
CALU
MET
GREENS
ARCADIA
GLEN
N
WILS
ON
BLUE
JACK
ET
ALLEN
HIGH
RID
GE
YORK
SHIR
E
SUSA
N
GARDEN
ESTA
TE
MERL
IN
WALES
WELDONGR
EENL
AWN
ELIJAH
CRAY
TON
JENNY
CENTRAL POINT
CIRCULAR
JACK
SON
TAWA
WESTERN OHIO
GARF
ORD
AUGL
AIZE
FEDERAL
ROSC
HMAN
MAKLEY
CANY
ON
PAUL
OHIO
TURN
ER
GROV
E
WILL
ARD
BATH
ESSE
X
RIVE
RVIEW
BARNSBURY
CLETUS
FERN
WOOD
CEDAR
SENE
CA
MOTEL
WEAD
OCKSPRING VIEW
SQUI
RE
BRIST
OL
WARD
HILL
HANOVER
ESTATES
ALEX
ANDR
IA
KINGS
WOOD
HIGH
LAND
ROSE
PATR
OLSM
EAD
TALL
OAK
S
BRYN
MAW
R
CHEMICAL
CHAR
LES
DATE
FT SH
AWNE
E IND
USTR
IAL
BUNK
ER
HIAW
ATHA
BROA
DWAY
HILLCREST
SHORELINE
BALYEAT
ASPEN
JAMES
EASTOM
FULT
ON
WEST
SHOR
E
STRUTHMORE
HILL
STOL
L
HEIN
DEL
ROSEWOOD
HAMPTON
EUCLID
WALNUT
OXFORD
HOLMES
CLEMENT
HOLL
AR
GOLDEN
PEACOCK
MEDICAL
DEVO
NSHI
RE
LOCH
LOMA
NPILGRIM
SHOR
EVIEW
HALL
KENYON MAPLEWOOD
WYANDOT
TREB
OR
HARDING HWY TO I 75 S
ELMI
RE
ROSEDALE
SOUTHWOOD
AMBL
EWOO
D
COLONIAL
BREE
ZEWO
OD
RADC
LIFFE
LIBER
TY C
OMMO
NS
REEN
MOOK
GAITH
ERSB
URG
SPRI
NGHI
LL
BENT
WOOD
MT H
OLYO
KEST
ANDR
EWS
TUPE
LO
LAKE
GRIM
MWOO
D
WOOD
PARK
BRIAR
GROV
E
BLAC
KBUR
N
DEAN
DABILL
EMMA
PECA
N
SPARTAN
DELONG
GARF
IELD
FLOR
ENCE
BLAC
K
DAWN
SINCL
AIR
CLINTON
E 4TH ST TO I 75 S
ALTO
N
EVERGREEN
RIVERWALK
SUGA
R CR
EEK
MEWS
CAMDEN
DETR
OIT
TROL
LEY
MORRIS
HURLEY OAKWOOD
BALI HAI MHP
FOX CREEK
PAWNEE
HUMANE
CHER
RY
9TH
MARKET
LOWELL
MAKLEY
10TH
BREESE
7TH
HIGH
LEON
ARD
CALU
MET
BELLEFONTAINE
LINDEN
9TH
PARK
DEWE
Y
JACK
SON
SHAW
NEE
LAKEWOOD
7TH
HUGH
ES
HIGH
UNIO
N
HIGH
SUGA
R
HOLMES
HILL
10TH
I 75
SPENCERVILLE
SPRING
MARKET
MAIN
PRO
ELM
MARKET
PRO
5TH
GARDEN
CENT
RAL
EUREKA
UNIO
N
9TH
DEWE
Y
KIBBY
FT SHAWNEE INDUSTRIAL
MAP C-9MAJOR EMPLOYERS WITHIN
ROUTE #9 SERVICE AREA
EMPLOYER LOCATION
C - 9
0 0.5 1 1.5 2MilesDATA SOURCE: 2016 ES202
DATE: MAY 2017DWG BY: DM ·
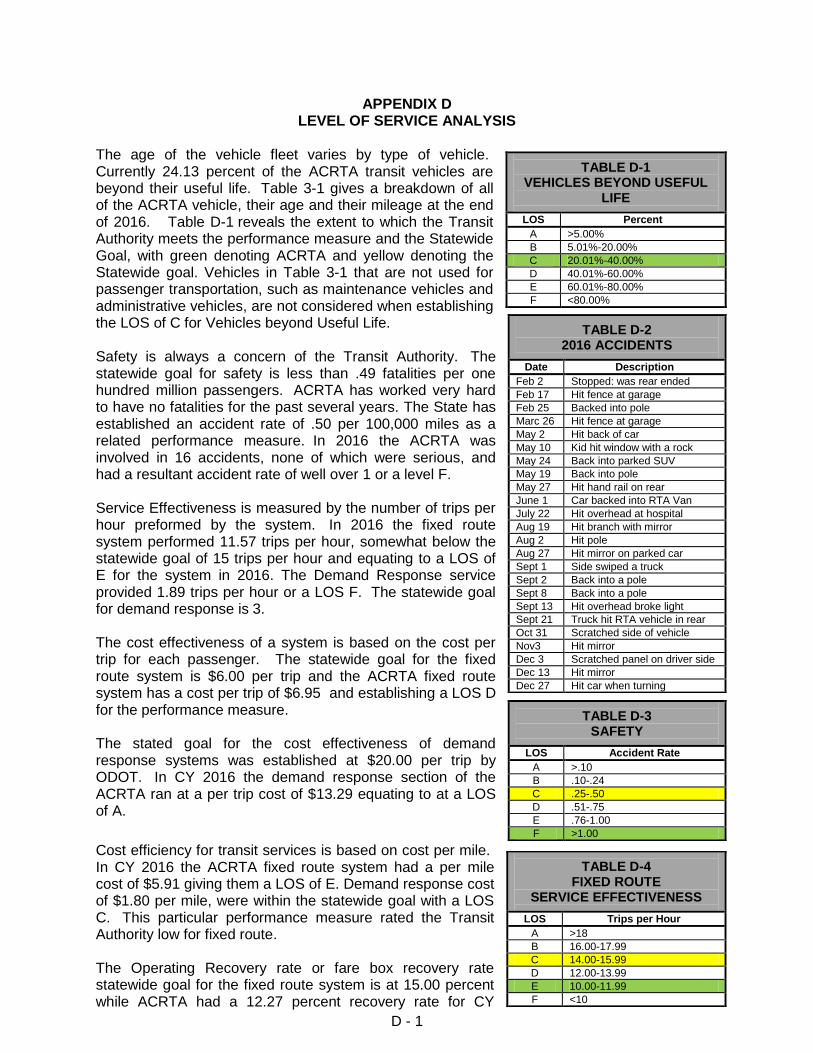
D - 1
APPENDIX D LEVEL OF SERVICE ANALYSIS
The age of the vehicle fleet varies by type of vehicle. Currently 24.13 percent of the ACRTA transit vehicles are beyond their useful life. Table 3-1 gives a breakdown of all of the ACRTA vehicle, their age and their mileage at the end of 2016. Table D-1 reveals the extent to which the Transit Authority meets the performance measure and the Statewide Goal, with green denoting ACRTA and yellow denoting the Statewide goal. Vehicles in Table 3-1 that are not used for passenger transportation, such as maintenance vehicles and administrative vehicles, are not considered when establishing the LOS of C for Vehicles beyond Useful Life. Safety is always a concern of the Transit Authority. The statewide goal for safety is less than .49 fatalities per one hundred million passengers. ACRTA has worked very hard to have no fatalities for the past several years. The State has established an accident rate of .50 per 100,000 miles as a related performance measure. In 2016 the ACRTA was involved in 16 accidents, none of which were serious, and had a resultant accident rate of well over 1 or a level F. Service Effectiveness is measured by the number of trips per hour preformed by the system. In 2016 the fixed route system performed 11.57 trips per hour, somewhat below the statewide goal of 15 trips per hour and equating to a LOS of E for the system in 2016. The Demand Response service provided 1.89 trips per hour or a LOS F. The statewide goal for demand response is 3. The cost effectiveness of a system is based on the cost per trip for each passenger. The statewide goal for the fixed route system is $6.00 per trip and the ACRTA fixed route system has a cost per trip of $6.95 and establishing a LOS D for the performance measure. The stated goal for the cost effectiveness of demand response systems was established at $20.00 per trip by ODOT. In CY 2016 the demand response section of the ACRTA ran at a per trip cost of $13.29 equating to at a LOS of A.
Cost efficiency for transit services is based on cost per mile. In CY 2016 the ACRTA fixed route system had a per mile cost of $5.91 giving them a LOS of E. Demand response cost of $1.80 per mile, were within the statewide goal with a LOS C. This particular performance measure rated the Transit Authority low for fixed route. The Operating Recovery rate or fare box recovery rate statewide goal for the fixed route system is at 15.00 percent while ACRTA had a 12.27 percent recovery rate for CY
TABLE D-1 VEHICLES BEYOND USEFUL
LIFE
LOS Percent
A >5.00%
B 5.01%-20.00%
C 20.01%-40.00%
D 40.01%-60.00%
E 60.01%-80.00%
F <80.00%
TABLE D-2 2016 ACCIDENTS
Date Description
Feb 2 Stopped: was rear ended
Feb 17 Hit fence at garage
Feb 25 Backed into pole
Marc 26 Hit fence at garage
May 2 Hit back of car
May 10 Kid hit window with a rock
May 24 Back into parked SUV
May 19 Back into pole
May 27 Hit hand rail on rear
June 1 Car backed into RTA Van
July 22 Hit overhead at hospital
Aug 19 Hit branch with mirror
Aug 2 Hit pole
Aug 27 Hit mirror on parked car
Sept 1 Side swiped a truck
Sept 2 Back into a pole
Sept 8 Back into a pole
Sept 13 Hit overhead broke light
Sept 21 Truck hit RTA vehicle in rear
Oct 31 Scratched side of vehicle
Nov3 Hit mirror
Dec 3 Scratched panel on driver side
Dec 13 Hit mirror
Dec 27 Hit car when turning
TABLE D-3 SAFETY
LOS Accident Rate
A >.10
B .10-.24
C .25-.50
D .51-.75
E .76-1.00
F >1.00
TABLE D-4 FIXED ROUTE
SERVICE EFFECTIVENESS
LOS Trips per Hour
A >18
B 16.00-17.99
C 14.00-15.99
D 12.00-13.99
E 10.00-11.99
F <10

D - 2
2016. The ACRTA fixed route system fare schedule (Table 3-2) shows that many of the riders have the option of purchasing a monthly pass for a considerable discount over the $1.00 per trip cost. There are also discounts for seniors, and disabled. Since over half (64.55%) of the passengers do not own a car and 71.02 percent of the passengers do not have a drivers license it is reasonable to conclude that the majority of the ACRTA riders are captive riders.
The demand response section of the ACRTA system has a very good recovery rate at 62.64 percent because many of the demand response rides are in coordination with other social service agencies and those agencies are covering part of the cost.
Service area coverage of the Fixed Route service is basically limited to the City of Lima with just a small area outside the City Limits. The Transit Authority provides Uplift services to all eligible consumers within a 3/4 mile area surrounding the fixed route system. The demand response system serves the entire county and in certain cases outside the county. This performance measure finds the ACRTA operating at a LOS B.
TABLE D-5 DEMAND RESPONSE
SERVICE EFFECTIVENESS
LOS Trips per Hour
A >4.00
B 3.50-3.99
C 3.00-3.49
D 2.50-2.99
E 2.00-2.49
F <1.99
TABLE D-6 FIXED ROUTE
COST EFFECTIVENESS
LOS Cost per Trip
A <$5.49
B $5.49-$5.99
C $6.00-$6.49
D $6.50-$6.99
E $7.00-$7.49
F >$7.49
TABLE D-7 DEMAND RESPONSE
COST EFFECTIVENESS
LOS Cost per Trip
A <$19.00
B $19.00-$19.49
C $19.50-$20.00
D $20.01-$20.49
E $20.50-$21.00
F >$21.00
TABLE D-8 FIXED ROUTE
COST EFFICIENCY
LOS Cost per Mile
A <$3.00
B $2.01-$3.00
C $3.01-$4.00
D $4.01-$5.00
E $5.01-$6.00
F >$6.00
TABLE D-9 DEMAND RESPONSE
COST EFFICIENCY
LOS Cost per Mile
A <1.00
B 1.00-1.49
C 1.50-2.00
D 2.01-2.49
E 2.50-3.00
F >3.00
TABLE D-10 FIXED ROUTE
OPERATING RECOVERY
LOS Percent
A >16.00%
B 15.01%-16.00%
C 14.01%-15.00%
D 13.01%-14.00%
E 12.01%-13.00%
F <12.00%
TABLE D-11 DEMAND RESPONSE
OPERATING RECOVERY
LOS Percent
A >21.00%
B 20.01%-21.00%
C 19.01%-20.00%
D 18.01%-19.00%
E 17.01%-18.00%
F <17.00%
TABLE D-12 SERVICE AREA COVERAGE
LOS Service Area
A Seamless regional mobility
B County wide plus out -of-county destinations
C County wide service
D Citywide plus limited outside the City
E City limits only
F Less than City limits