Comprehensive Needs Assessment School: Forestville ES ...
25
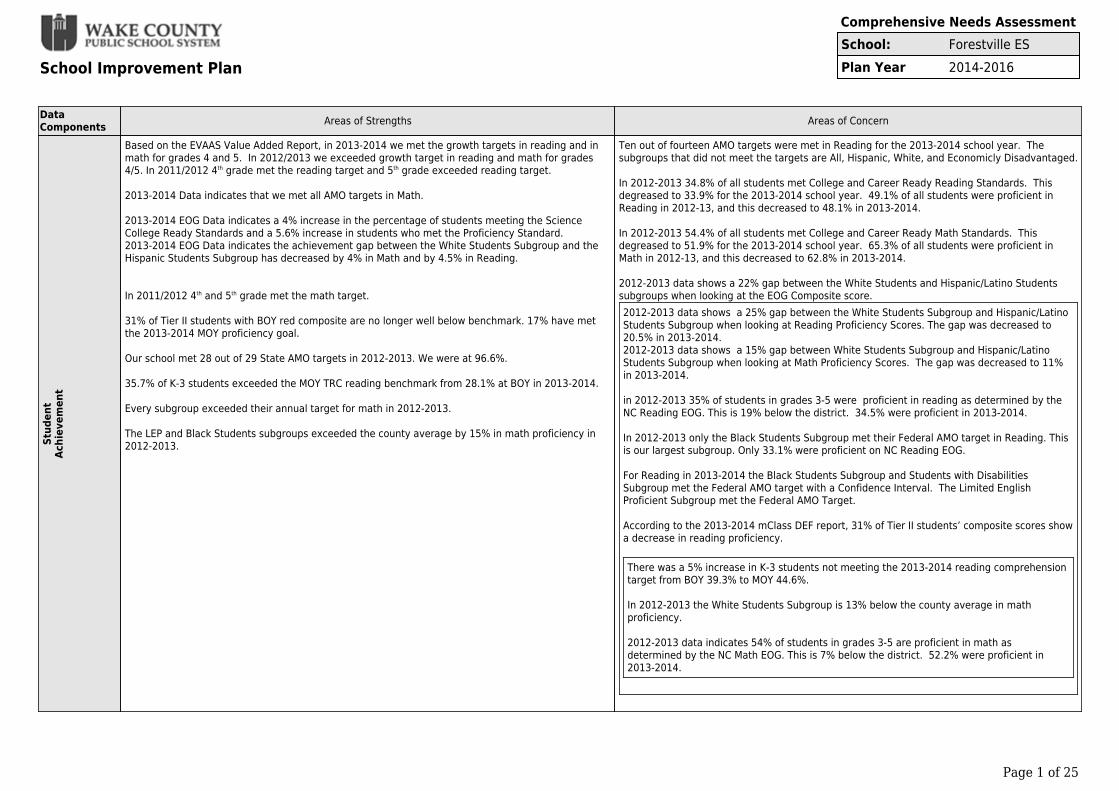
School Improvement Plan Comprehensive Needs Assessment School: Forestville ES Plan Year 2014-2016 Page 1 of 25 Data Components Areas of Strengths Areas of Concern Student Achievement Based on the EVAAS Value Added Report, in 2013-2014 we met the growth targets in reading and in math for grades 4 and 5. In 2012/2013 we exceeded growth target in reading and math for grades 4/5. In 2011/2012 4 th grade met the reading target and 5 th grade exceeded reading target. 2013-2014 Data indicates that we met all AMO targets in Math. 2013-2014 EOG Data indicates a 4% increase in the percentage of students meeting the Science College Ready Standards and a 5.6% increase in students who met the Proficiency Standard. 2013-2014 EOG Data indicates the achievement gap between the White Students Subgroup and the Hispanic Students Subgroup has decreased by 4% in Math and by 4.5% in Reading. In 2011/2012 4 th and 5 th grade met the math target. 31% of Tier II students with BOY red composite are no longer well below benchmark. 17% have met the 2013-2014 MOY proficiency goal. Our school met 28 out of 29 State AMO targets in 2012-2013. We were at 96.6%. 35.7% of K-3 students exceeded the MOY TRC reading benchmark from 28.1% at BOY in 2013-2014. Every subgroup exceeded their annual target for math in 2012-2013. The LEP and Black Students subgroups exceeded the county average by 15% in math proficiency in 2012-2013. Ten out of fourteen AMO targets were met in Reading for the 2013-2014 school year. The subgroups that did not meet the targets are All, Hispanic, White, and Economicly Disadvantaged. In 2012-2013 34.8% of all students met College and Career Ready Reading Standards. This degreased to 33.9% for the 2013-2014 school year. 49.1% of all students were proficient in Reading in 2012-13, and this decreased to 48.1% in 2013-2014. In 2012-2013 54.4% of all students met College and Career Ready Math Standards. This degreased to 51.9% for the 2013-2014 school year. 65.3% of all students were proficient in Math in 2012-13, and this decreased to 62.8% in 2013-2014. 2012-2013 data shows a 22% gap between the White Students and Hispanic/Latino Students subgroups when looking at the EOG Composite score. 2012-2013 data shows a 25% gap between the White Students Subgroup and Hispanic/Latino Students Subgroup when looking at Reading Proficiency Scores. The gap was decreased to 20.5% in 2013-2014. 2012-2013 data shows a 15% gap between White Students Subgroup and Hispanic/Latino Students Subgroup when looking at Math Proficiency Scores. The gap was decreased to 11% in 2013-2014. in 2012-2013 35% of students in grades 3-5 were proficient in reading as determined by the NC Reading EOG. This is 19% below the district. 34.5% were proficient in 2013-2014. In 2012-2013 only the Black Students Subgroup met their Federal AMO target in Reading. This is our largest subgroup. Only 33.1% were proficient on NC Reading EOG. For Reading in 2013-2014 the Black Students Subgroup and Students with Disabilities Subgroup met the Federal AMO target with a Confidence Interval. The Limited English Proficient Subgroup met the Federal AMO Target. According to the 2013-2014 mClass DEF report, 31% of Tier II students’ composite scores show a decrease in reading proficiency. There was a 5% increase in K-3 students not meeting the 2013-2014 reading comprehension target from BOY 39.3% to MOY 44.6%. In 2012-2013 the White Students Subgroup is 13% below the county average in math proficiency. 2012-2013 data indicates 54% of students in grades 3-5 are proficient in math as determined by the NC Math EOG. This is 7% below the district. 52.2% were proficient in 2013-2014.
Transcript of Comprehensive Needs Assessment School: Forestville ES ...
School Improvement Plan
Comprehensive Needs AssessmentSchool: Forestville ESPlan Year 2014-2016
Page 1 of 25
DataComponents Areas of Strengths Areas of Concern
Stud
ent
Achi
evem
ent
Based on the EVAAS Value Added Report, in 2013-2014 we met the growth targets in reading and inmath for grades 4 and 5. In 2012/2013 we exceeded growth target in reading and math for grades4/5. In 2011/2012 4th grade met the reading target and 5th grade exceeded reading target.
2013-2014 Data indicates that we met all AMO targets in Math.
2013-2014 EOG Data indicates a 4% increase in the percentage of students meeting the ScienceCollege Ready Standards and a 5.6% increase in students who met the Proficiency Standard.2013-2014 EOG Data indicates the achievement gap between the White Students Subgroup and theHispanic Students Subgroup has decreased by 4% in Math and by 4.5% in Reading.
In 2011/2012 4th and 5th grade met the math target.
31% of Tier II students with BOY red composite are no longer well below benchmark. 17% have metthe 2013-2014 MOY proficiency goal.
Our school met 28 out of 29 State AMO targets in 2012-2013. We were at 96.6%.
35.7% of K-3 students exceeded the MOY TRC reading benchmark from 28.1% at BOY in 2013-2014. Every subgroup exceeded their annual target for math in 2012-2013.
The LEP and Black Students subgroups exceeded the county average by 15% in math proficiency in2012-2013.
Ten out of fourteen AMO targets were met in Reading for the 2013-2014 school year. Thesubgroups that did not meet the targets are All, Hispanic, White, and Economicly Disadvantaged.
In 2012-2013 34.8% of all students met College and Career Ready Reading Standards. Thisdegreased to 33.9% for the 2013-2014 school year. 49.1% of all students were proficient inReading in 2012-13, and this decreased to 48.1% in 2013-2014.
In 2012-2013 54.4% of all students met College and Career Ready Math Standards. Thisdegreased to 51.9% for the 2013-2014 school year. 65.3% of all students were proficient inMath in 2012-13, and this decreased to 62.8% in 2013-2014.
2012-2013 data shows a 22% gap between the White Students and Hispanic/Latino Studentssubgroups when looking at the EOG Composite score.2012-2013 data shows a 25% gap between the White Students Subgroup and Hispanic/LatinoStudents Subgroup when looking at Reading Proficiency Scores. The gap was decreased to20.5% in 2013-2014.2012-2013 data shows a 15% gap between White Students Subgroup and Hispanic/LatinoStudents Subgroup when looking at Math Proficiency Scores. The gap was decreased to 11%in 2013-2014.
in 2012-2013 35% of students in grades 3-5 were proficient in reading as determined by theNC Reading EOG. This is 19% below the district. 34.5% were proficient in 2013-2014.
In 2012-2013 only the Black Students Subgroup met their Federal AMO target in Reading. Thisis our largest subgroup. Only 33.1% were proficient on NC Reading EOG.
For Reading in 2013-2014 the Black Students Subgroup and Students with DisabilitiesSubgroup met the Federal AMO target with a Confidence Interval. The Limited EnglishProficient Subgroup met the Federal AMO Target.
According to the 2013-2014 mClass DEF report, 31% of Tier II students’ composite scores showa decrease in reading proficiency.
There was a 5% increase in K-3 students not meeting the 2013-2014 reading comprehensiontarget from BOY 39.3% to MOY 44.6%.
In 2012-2013 the White Students Subgroup is 13% below the county average in mathproficiency.
2012-2013 data indicates 54% of students in grades 3-5 are proficient in math asdetermined by the NC Math EOG. This is 7% below the district. 52.2% were proficient in2013-2014.
School Improvement Plan
Comprehensive Needs AssessmentSchool: Forestville ESPlan Year 2014-2016
Page 2 of 25
DataComponents Areas of Strengths Areas of Concern
Inst
ruct
iona
lPr
actic
es/S
trat
egie
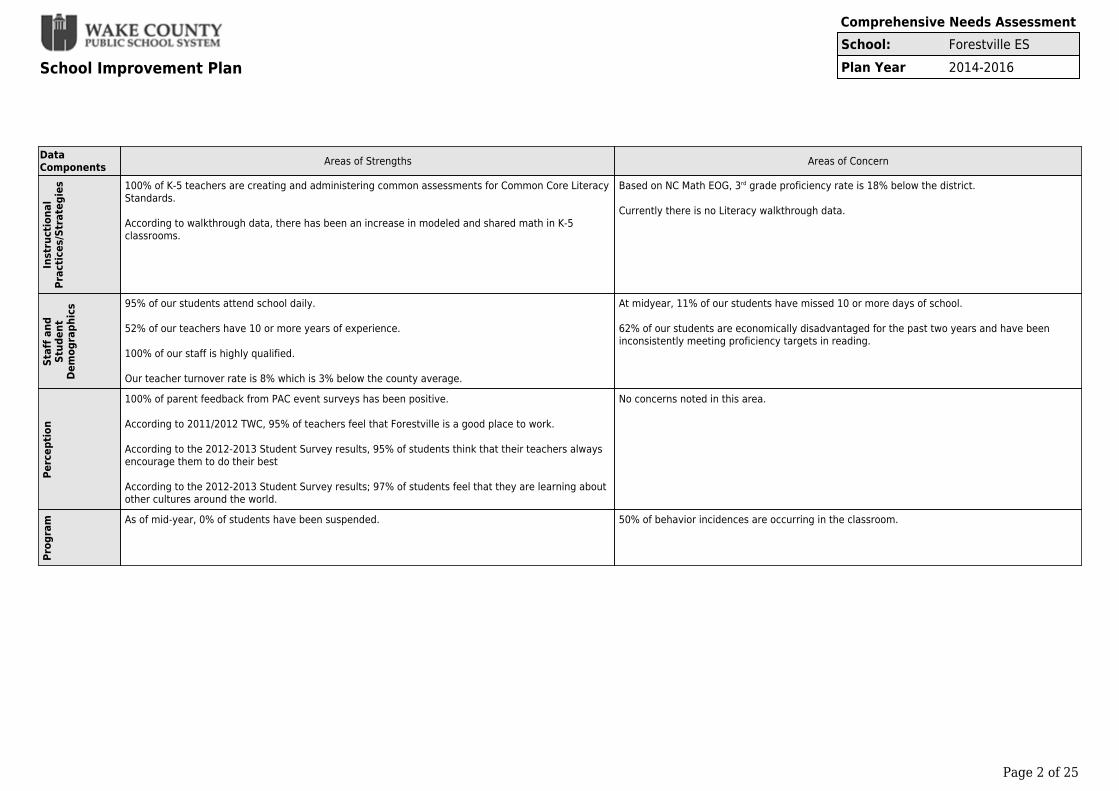
s 100% of K-5 teachers are creating and administering common assessments for Common Core LiteracyStandards.
According to walkthrough data, there has been an increase in modeled and shared math in K-5classrooms.
Based on NC Math EOG, 3rd grade proficiency rate is 18% below the district.
Currently there is no Literacy walkthrough data.
Staf
f and
Stud
ent
Dem
ogra
phic
s 95% of our students attend school daily.
52% of our teachers have 10 or more years of experience.
100% of our staff is highly qualified.
Our teacher turnover rate is 8% which is 3% below the county average.
At midyear, 11% of our students have missed 10 or more days of school.
62% of our students are economically disadvantaged for the past two years and have beeninconsistently meeting proficiency targets in reading.
Perc
eptio
n
100% of parent feedback from PAC event surveys has been positive.
According to 2011/2012 TWC, 95% of teachers feel that Forestville is a good place to work.
According to the 2012-2013 Student Survey results, 95% of students think that their teachers alwaysencourage them to do their best
According to the 2012-2013 Student Survey results; 97% of students feel that they are learning aboutother cultures around the world.
No concerns noted in this area.
Prog
ram As of mid-year, 0% of students have been suspended. 50% of behavior incidences are occurring in the classroom.
School Improvement Plan
Comprehensive Needs AssessmentSchool: Forestville ESPlan Year 2014-2016
Page 3 of 25
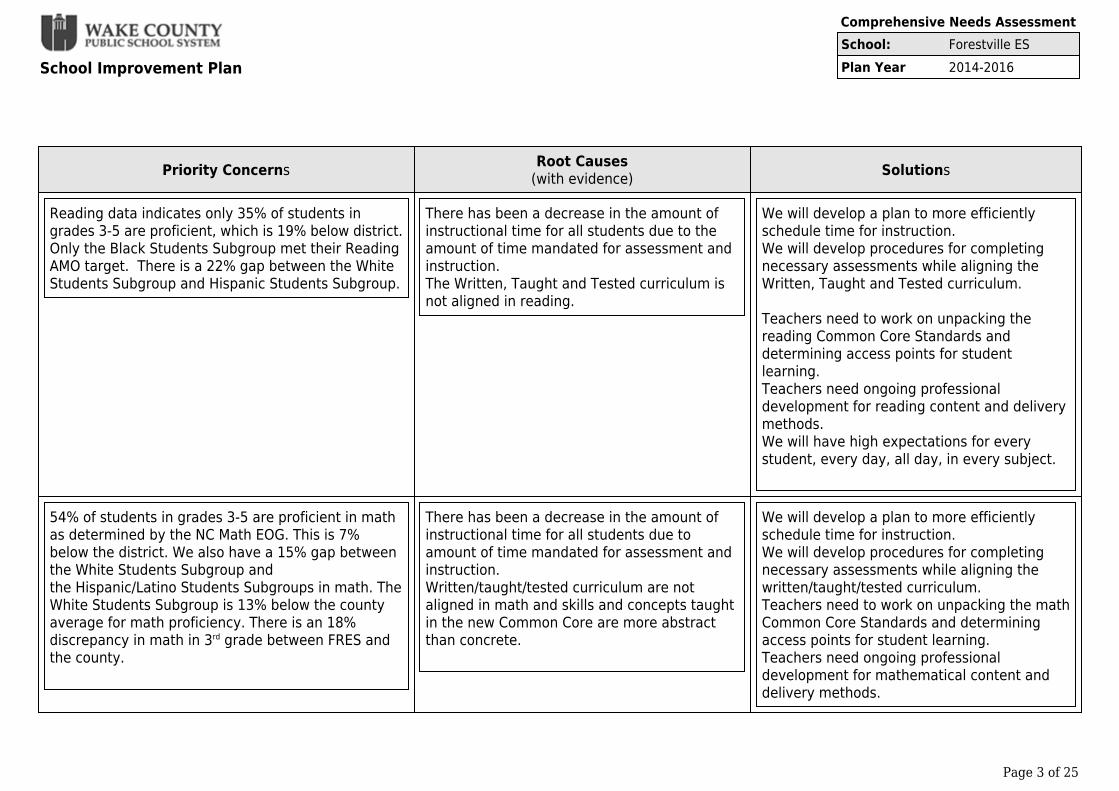
Priority Concerns Root Causes(with evidence) Solutions
Reading data indicates only 35% of students ingrades 3-5 are proficient, which is 19% below district.Only the Black Students Subgroup met their ReadingAMO target. There is a 22% gap between the WhiteStudents Subgroup and Hispanic Students Subgroup.
There has been a decrease in the amount ofinstructional time for all students due to theamount of time mandated for assessment andinstruction.The Written, Taught and Tested curriculum isnot aligned in reading.
We will develop a plan to more efficientlyschedule time for instruction. We will develop procedures for completingnecessary assessments while aligning theWritten, Taught and Tested curriculum.
Teachers need to work on unpacking thereading Common Core Standards anddetermining access points for studentlearning.Teachers need ongoing professionaldevelopment for reading content and deliverymethods.We will have high expectations for everystudent, every day, all day, in every subject.
54% of students in grades 3-5 are proficient in mathas determined by the NC Math EOG. This is 7%below the district. We also have a 15% gap betweenthe White Students Subgroup andthe Hispanic/Latino Students Subgroups in math. TheWhite Students Subgroup is 13% below the countyaverage for math proficiency. There is an 18%discrepancy in math in 3rd grade between FRES andthe county.
There has been a decrease in the amount ofinstructional time for all students due toamount of time mandated for assessment andinstruction.Written/taught/tested curriculum are notaligned in math and skills and concepts taughtin the new Common Core are more abstractthan concrete.
We will develop a plan to more efficientlyschedule time for instruction.We will develop procedures for completingnecessary assessments while aligning thewritten/taught/tested curriculum.Teachers need to work on unpacking the mathCommon Core Standards and determiningaccess points for student learning.Teachers need ongoing professionaldevelopment for mathematical content anddelivery methods.

School Improvement Plan
Comprehensive Needs AssessmentSchool: Forestville ESPlan Year 2014-2016
Page 4 of 25
Data SummaryDescribe your conclusionsA comprehensive look at our data indicates that our strengths include in 2012/2013 we exceeded growth target in reading and math for grades 4/5, andthat we met 28 out of 29 State AMO targets. Our teacher turnover rate is 8% which is 3% below the county average and 95% of students think that theirteachers always encourage them to do their best.
In addition, this data indicate that our priority concerns are in reading and in math. Reading data indicates only 35% of students in grades 3-5 areproficient, which is 19% below district. Only one subgroup met their annual target and there is a 22% gap between White and Hispanic subgroups. Inmath, 54% of students in grades 3-5 are proficient as determined by the NC Math EOG. This is 7% below the district. We also have a 15% gap betweenWhite students and Hispanic/Latino subgroups in math. White subgroup is 13% below the county average for math proficiency. There is an 18%discrepancy in math in 3rd grade between FRES and the county.
To address these concerns, we plan to develop a plan to more efficiently schedule time for instruction. We will develop procedures for completingnecessary assessments while aligning the written/taught/tested curriculum. We will also provide time and support for teachers to work on unpacking themath and reading Common Core Standards and determining access points for student learning. Job embedded staff development will address readingand math content and delivery methods. Every teacher will have high expectations for every student in every subject.
School Improvement Plan
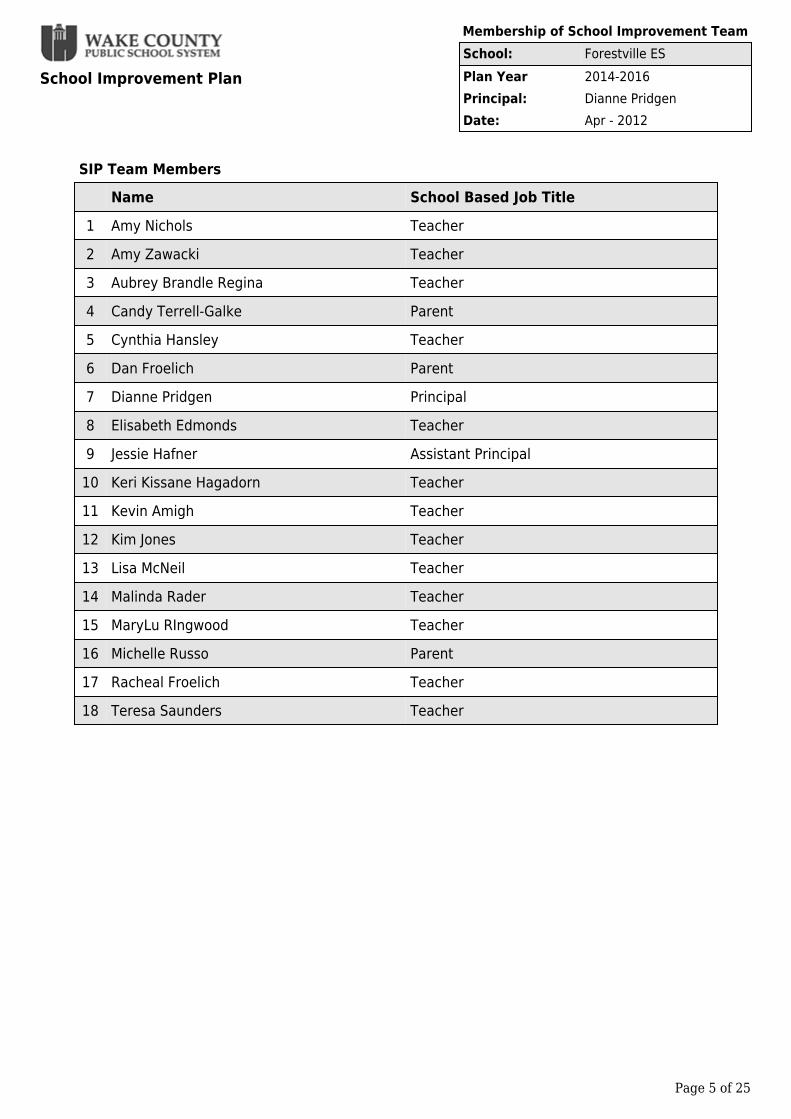
Membership of School Improvement TeamSchool: Forestville ESPlan Year 2014-2016Principal: Dianne PridgenDate: Apr - 2012
Page 5 of 25
SIP Team MembersName School Based Job Title
1 Amy Nichols Teacher2 Amy Zawacki Teacher3 Aubrey Brandle Regina Teacher4 Candy Terrell-Galke Parent5 Cynthia Hansley Teacher6 Dan Froelich Parent7 Dianne Pridgen Principal8 Elisabeth Edmonds Teacher9 Jessie Hafner Assistant Principal10 Keri Kissane Hagadorn Teacher11 Kevin Amigh Teacher12 Kim Jones Teacher13 Lisa McNeil Teacher14 Malinda Rader Teacher15 MaryLu RIngwood Teacher16 Michelle Russo Parent17 Racheal Froelich Teacher18 Teresa Saunders Teacher
School Improvement Plan
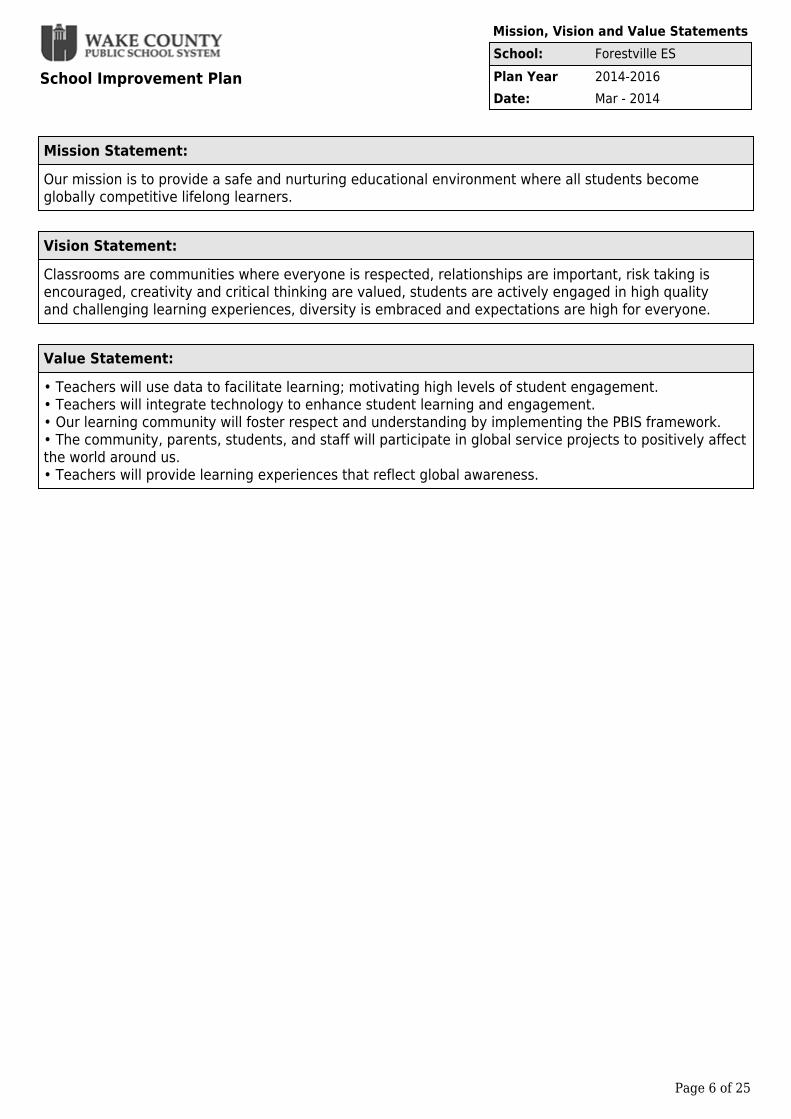
Mission, Vision and Value StatementsSchool: Forestville ESPlan Year 2014-2016Date: Mar - 2014
Page 6 of 25
Mission Statement:Our mission is to provide a safe and nurturing educational environment where all students becomeglobally competitive lifelong learners.
Vision Statement:Classrooms are communities where everyone is respected, relationships are important, risk taking isencouraged, creativity and critical thinking are valued, students are actively engaged in high qualityand challenging learning experiences, diversity is embraced and expectations are high for everyone.
Value Statement:• Teachers will use data to facilitate learning; motivating high levels of student engagement.• Teachers will integrate technology to enhance student learning and engagement.• Our learning community will foster respect and understanding by implementing the PBIS framework.• The community, parents, students, and staff will participate in global service projects to positively affectthe world around us.• Teachers will provide learning experiences that reflect global awareness.
School Improvement Plan
Summary of Goals, Key Processes and Action StepsSchool: Forestville ESPlan Year 2014-2016LEA: Wake County (920)
Page 7 of 25
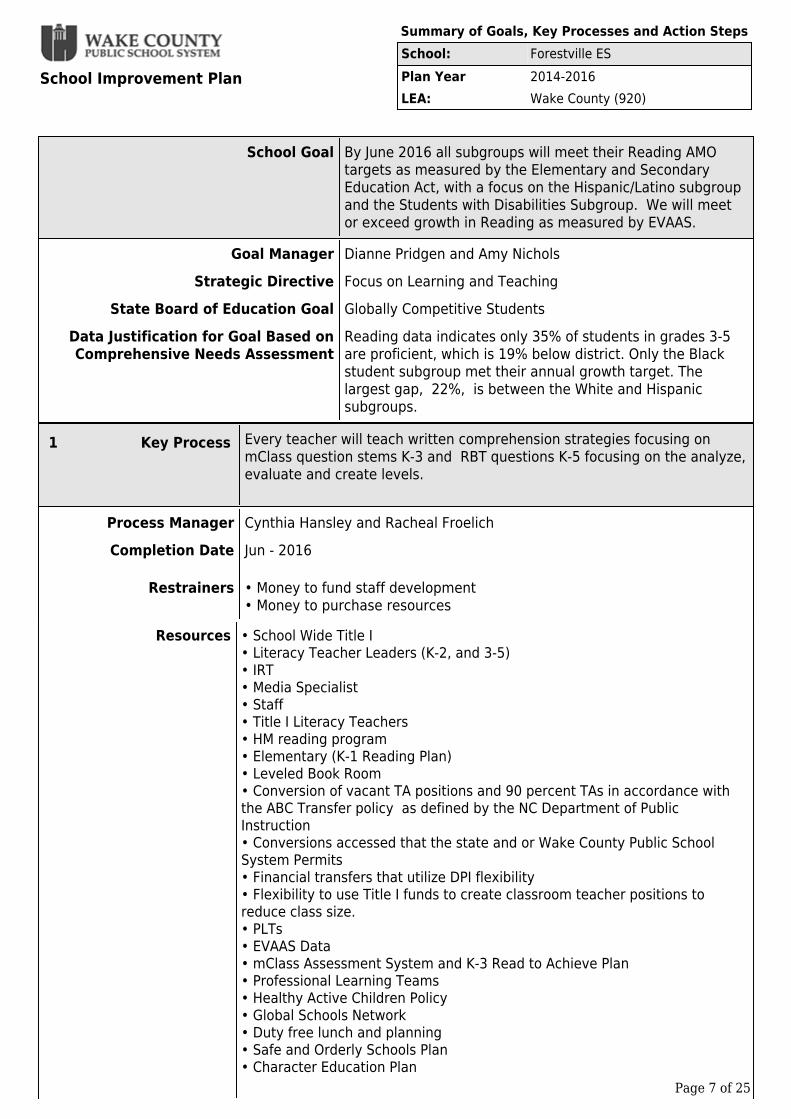
School Goal By June 2016 all subgroups will meet their Reading AMOtargets as measured by the Elementary and SecondaryEducation Act, with a focus on the Hispanic/Latino subgroupand the Students with Disabilities Subgroup. We will meetor exceed growth in Reading as measured by EVAAS.
Goal Manager Dianne Pridgen and Amy NicholsStrategic Directive Focus on Learning and Teaching
State Board of Education Goal Globally Competitive StudentsData Justification for Goal Based onComprehensive Needs Assessment
Reading data indicates only 35% of students in grades 3-5are proficient, which is 19% below district. Only the Blackstudent subgroup met their annual growth target. The largest gap, 22%, is between the White and Hispanicsubgroups.
1 Key Process Every teacher will teach written comprehension strategies focusing onmClass question stems K-3 and RBT questions K-5 focusing on the analyze,evaluate and create levels.
Process Manager Cynthia Hansley and Racheal FroelichCompletion Date Jun - 2016
Restrainers • Money to fund staff development• Money to purchase resources
Resources • School Wide Title I• Literacy Teacher Leaders (K-2, and 3-5)• IRT• Media Specialist• Staff• Title I Literacy Teachers• HM reading program• Elementary (K-1 Reading Plan)• Leveled Book Room• Conversion of vacant TA positions and 90 percent TAs in accordance withthe ABC Transfer policy as defined by the NC Department of PublicInstruction• Conversions accessed that the state and or Wake County Public SchoolSystem Permits• Financial transfers that utilize DPI flexibility• Flexibility to use Title I funds to create classroom teacher positions toreduce class size.• PLTs• EVAAS Data• mClass Assessment System and K-3 Read to Achieve Plan• Professional Learning Teams• Healthy Active Children Policy • Global Schools Network• Duty free lunch and planning• Safe and Orderly Schools Plan• Character Education Plan
School Improvement Plan
Summary of Goals, Key Processes and Action StepsSchool: Forestville ESPlan Year 2014-2016LEA: Wake County (920)
Page 8 of 25
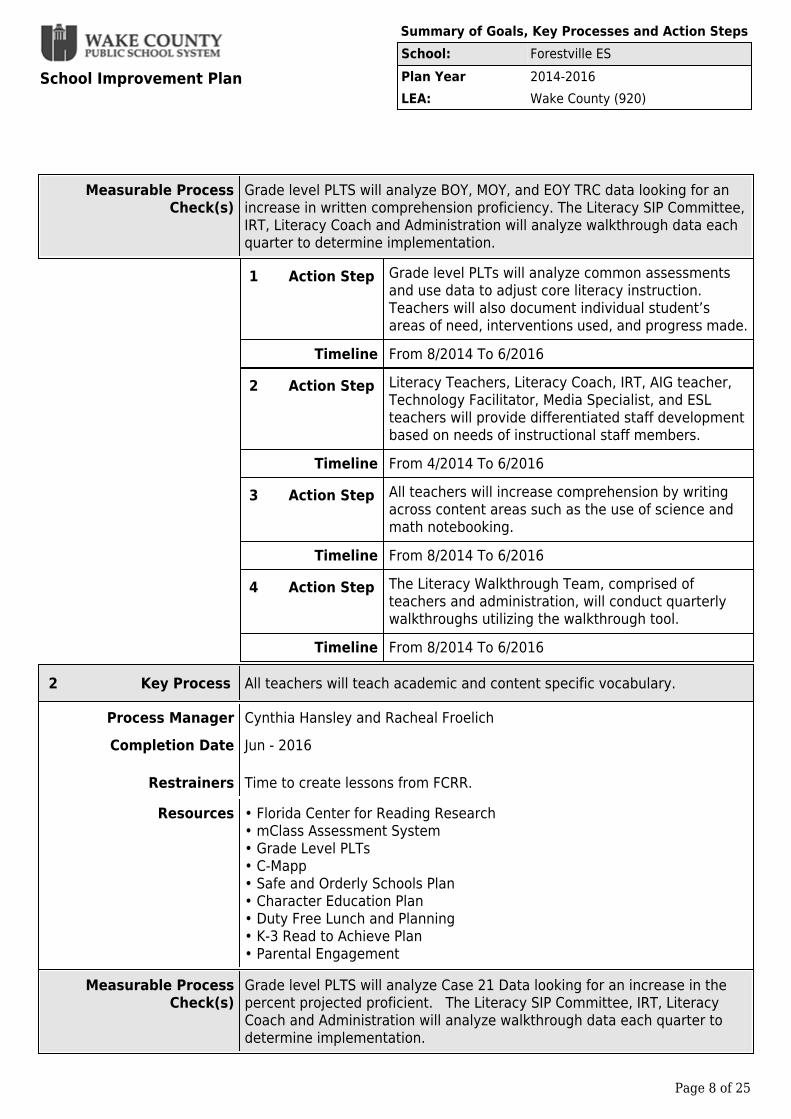
Measurable ProcessCheck(s)
Grade level PLTS will analyze BOY, MOY, and EOY TRC data looking for anincrease in written comprehension proficiency. The Literacy SIP Committee,IRT, Literacy Coach and Administration will analyze walkthrough data eachquarter to determine implementation.
1 Action Step Grade level PLTs will analyze common assessmentsand use data to adjust core literacy instruction. Teachers will also document individual student’sareas of need, interventions used, and progress made.
Timeline From 8/2014 To 6/2016
2 Action Step Literacy Teachers, Literacy Coach, IRT, AIG teacher,Technology Facilitator, Media Specialist, and ESLteachers will provide differentiated staff developmentbased on needs of instructional staff members.
Timeline From 4/2014 To 6/2016
3 Action Step All teachers will increase comprehension by writingacross content areas such as the use of science andmath notebooking.
Timeline From 8/2014 To 6/2016
4 Action Step The Literacy Walkthrough Team, comprised ofteachers and administration, will conduct quarterlywalkthroughs utilizing the walkthrough tool.
Timeline From 8/2014 To 6/2016
2 Key Process All teachers will teach academic and content specific vocabulary.
Process Manager Cynthia Hansley and Racheal FroelichCompletion Date Jun - 2016
Restrainers Time to create lessons from FCRR.
Resources • Florida Center for Reading Research• mClass Assessment System• Grade Level PLTs• C-Mapp• Safe and Orderly Schools Plan• Character Education Plan• Duty Free Lunch and Planning• K-3 Read to Achieve Plan• Parental Engagement
Measurable ProcessCheck(s)
Grade level PLTS will analyze Case 21 Data looking for an increase in thepercent projected proficient. The Literacy SIP Committee, IRT, LiteracyCoach and Administration will analyze walkthrough data each quarter todetermine implementation.

School Improvement Plan
Summary of Goals, Key Processes and Action StepsSchool: Forestville ESPlan Year 2014-2016LEA: Wake County (920)
Page 9 of 25
1 Action Step Teachers will work in PLT and collaborative planninggroups to determine the essential academic andcontent area vocabulary in the mClass and RevisedBloom’s Question Stems
Timeline From 8/2014 To 6/2016
2 Action Step All content area teachers will work in PLT andcollaborative planning groups to determine theessential academic and content area vocabulary foreach unit or book used for instruction.
Timeline From 8/2014 To 6/2016
3 Action Step Teachers will utilize high yield SIOP-based strategiesincluding Marzano and the Frayer Model for robustvocabulary instruction.
Timeline From 8/2014 To 6/2016
4 Action Step All students will participate in daily independentreading, followed up with a written accountabilitymeasure.
Timeline From 8/2014 To 6/2016
3 Key Process Teachers will unpack the Reading Common Core Standards and determineaccess points for student learning.
Process Manager Cynthia Hansley and Racheal FroelichCompletion Date Jun - 2015
Restrainers • Time for unpacking• Texts on appropriate levels for each standard
School Improvement Plan
Summary of Goals, Key Processes and Action StepsSchool: Forestville ESPlan Year 2014-2016LEA: Wake County (920)
Page 10 of 25
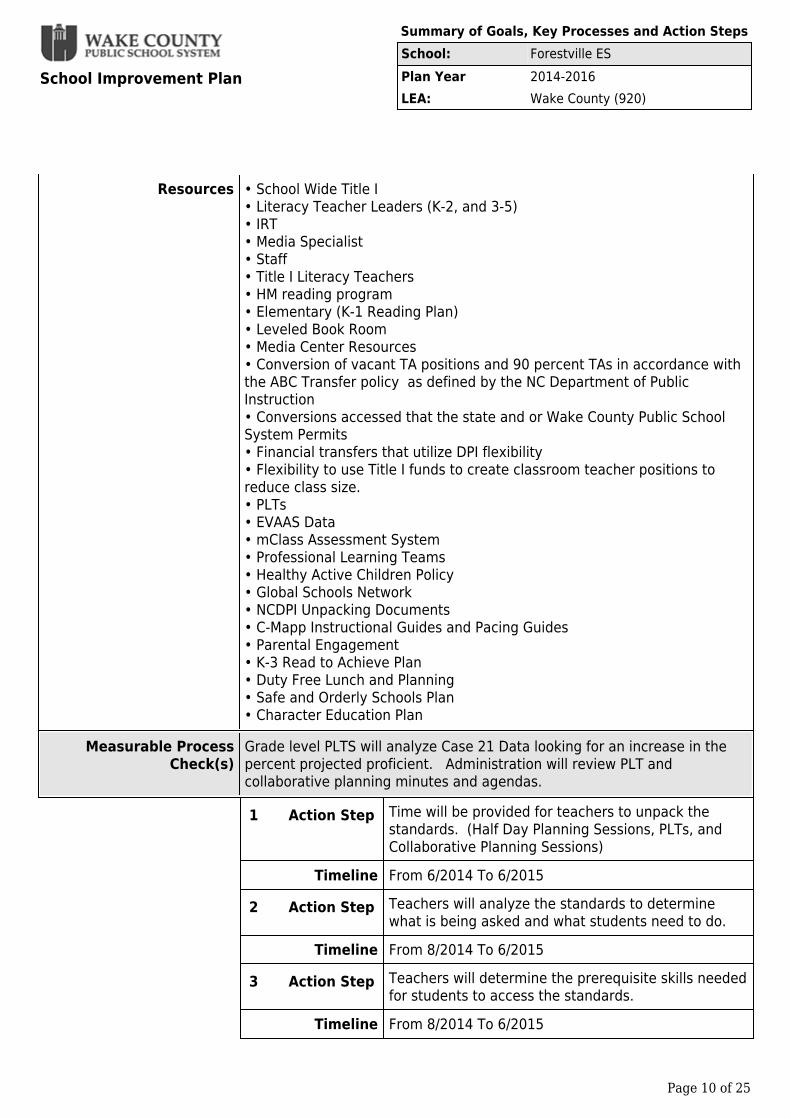
Resources • School Wide Title I• Literacy Teacher Leaders (K-2, and 3-5)• IRT• Media Specialist• Staff• Title I Literacy Teachers• HM reading program• Elementary (K-1 Reading Plan)• Leveled Book Room• Media Center Resources• Conversion of vacant TA positions and 90 percent TAs in accordance withthe ABC Transfer policy as defined by the NC Department of PublicInstruction• Conversions accessed that the state and or Wake County Public SchoolSystem Permits• Financial transfers that utilize DPI flexibility• Flexibility to use Title I funds to create classroom teacher positions toreduce class size.• PLTs• EVAAS Data• mClass Assessment System• Professional Learning Teams• Healthy Active Children Policy • Global Schools Network• NCDPI Unpacking Documents• C-Mapp Instructional Guides and Pacing Guides• Parental Engagement• K-3 Read to Achieve Plan• Duty Free Lunch and Planning• Safe and Orderly Schools Plan• Character Education Plan
Measurable ProcessCheck(s)
Grade level PLTS will analyze Case 21 Data looking for an increase in thepercent projected proficient. Administration will review PLT andcollaborative planning minutes and agendas.
1 Action Step Time will be provided for teachers to unpack thestandards. (Half Day Planning Sessions, PLTs, andCollaborative Planning Sessions)
Timeline From 6/2014 To 6/2015
2 Action Step Teachers will analyze the standards to determinewhat is being asked and what students need to do.
Timeline From 8/2014 To 6/2015
3 Action Step Teachers will determine the prerequisite skills neededfor students to access the standards.
Timeline From 8/2014 To 6/2015

School Improvement Plan
Summary of Goals, Key Processes and Action StepsSchool: Forestville ESPlan Year 2014-2016LEA: Wake County (920)
Page 11 of 25
4 Action Step Teachers will develop common assignments aligned to common core standards toassess student mastery.
Timeline From 8/2014 To 6/2015
5 Action Step Teachers will collaboratively plan lessons used tomodel and teach both the prerequisite skills and thestandards.
Timeline From 8/2014 To 6/2015
6 Action Step Teachers will develop and utilize rubrics for scoringcommon assignments.
Timeline From 8/2014 To 6/2015

School Improvement Plan
Summary of Goals, Key Processes and Action StepsSchool: Forestville ESPlan Year 2014-2016LEA: Wake County (920)
Page 12 of 25
School Goal By June 2016 all subgroups will exceed their math AMOtargets as measured by The Elementary and SecondaryEducation Act; with a focus on the Hispanic StudentSubgroup and the White Student Subgroup. We will meet orexceed math growth targets as measured by EVAAS.
Goal Manager Dianne Pridgen and Beth EdmondsStrategic Directive Focus on Learning and Teaching
State Board of Education Goal Globally Competitive StudentsData Justification for Goal Based onComprehensive Needs Assessment
In math, 54% of students in grades 3-5 are proficient asdetermined by the NC Math EOG. This is 7% below thedistrict. We also have a 15% gap between White studentsand the Hispanic/Latino subgroups in math. White subgroupis 13% below the county average for math proficiency.There is an 18% discrepancy in math in 3rd grade betweenFRES and the county.
1 Key Process All teachers will increase rigor in math by implementing the mathematicalpractice standards; with a focus on Standard 1: I can make sense ofproblems and persevere in solving them and Standard 3: I can explain andjustify my thinking.
Process Manager Kim Jones and Amy ZawackiCompletion Date Jun - 2016
Restrainers • Staff turnover• Funding for staff development
Resources • Math Intervention Teachers• IRT• National Math Standards• Math data• Math Teacher Leaders (K-2 and 3-5)• Math Expressions Program• Conversions of vacant TA positions and 90 percent TAs in accordancewith the ABC Transfer policy as defined by the NC Department of PublicInstruction• Conversions accessed that the state and or Wake County Public SchoolSystem permits• Financial transfers that utilize DPI flexibility• Flexibility in using Title I funds to create classroom teacher positions toreduce class size.• EVAAS data• Professional Learning Teams• Healthy Active Children Policy• Global Schools Network
Measurable ProcessCheck(s)
Grade level PLTS will analyze Case 21 Data looking for an increase in the percent projectedproficient. The Math SIP Committee, IRT, Math Intervention Teachers and Administration willanalyze walkthrough data each quarter to determine implementation.
School Improvement Plan
Summary of Goals, Key Processes and Action StepsSchool: Forestville ESPlan Year 2014-2016LEA: Wake County (920)
Page 13 of 25
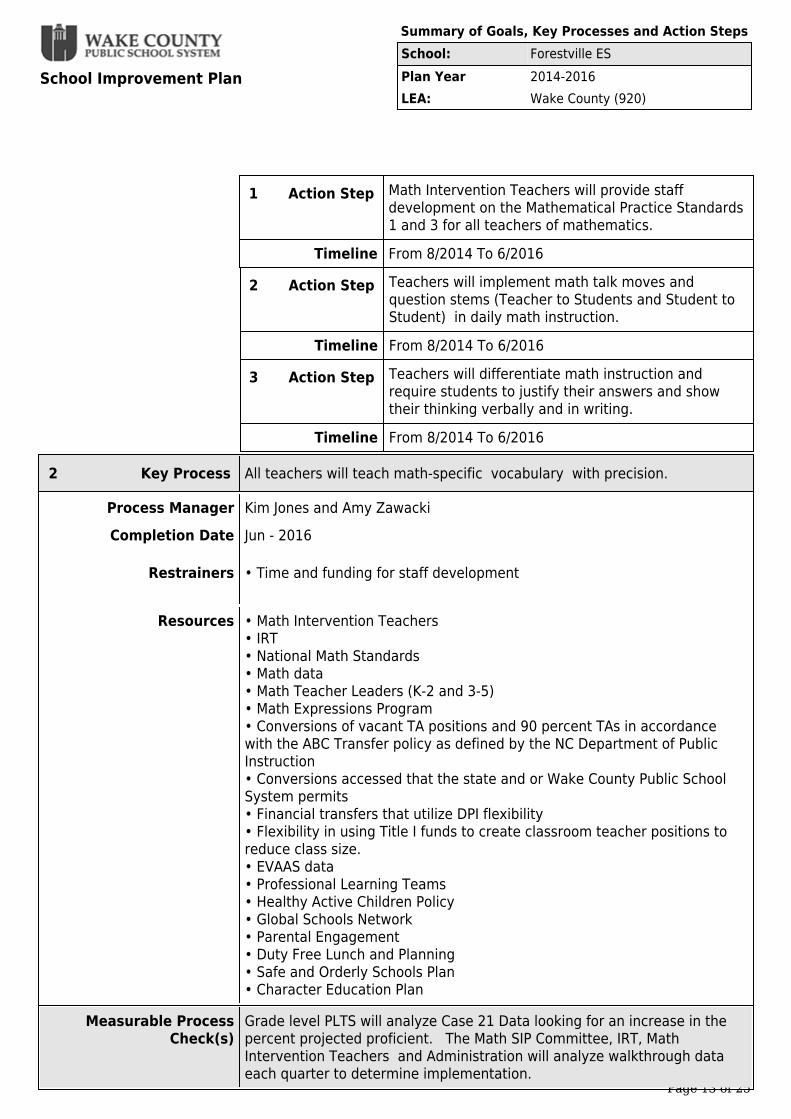
1 Action Step Math Intervention Teachers will provide staffdevelopment on the Mathematical Practice Standards1 and 3 for all teachers of mathematics.
Timeline From 8/2014 To 6/2016
2 Action Step Teachers will implement math talk moves andquestion stems (Teacher to Students and Student toStudent) in daily math instruction.
Timeline From 8/2014 To 6/2016
3 Action Step Teachers will differentiate math instruction andrequire students to justify their answers and showtheir thinking verbally and in writing.
Timeline From 8/2014 To 6/2016
2 Key Process All teachers will teach math-specific vocabulary with precision.
Process Manager Kim Jones and Amy ZawackiCompletion Date Jun - 2016
Restrainers • Time and funding for staff development
Resources • Math Intervention Teachers• IRT• National Math Standards• Math data• Math Teacher Leaders (K-2 and 3-5)• Math Expressions Program• Conversions of vacant TA positions and 90 percent TAs in accordancewith the ABC Transfer policy as defined by the NC Department of PublicInstruction• Conversions accessed that the state and or Wake County Public SchoolSystem permits• Financial transfers that utilize DPI flexibility• Flexibility in using Title I funds to create classroom teacher positions toreduce class size.• EVAAS data• Professional Learning Teams• Healthy Active Children Policy• Global Schools Network• Parental Engagement• Duty Free Lunch and Planning• Safe and Orderly Schools Plan• Character Education Plan
Measurable ProcessCheck(s)
Grade level PLTS will analyze Case 21 Data looking for an increase in thepercent projected proficient. The Math SIP Committee, IRT, MathIntervention Teachers and Administration will analyze walkthrough dataeach quarter to determine implementation.
School Improvement Plan
Summary of Goals, Key Processes and Action StepsSchool: Forestville ESPlan Year 2014-2016LEA: Wake County (920)
Page 14 of 25
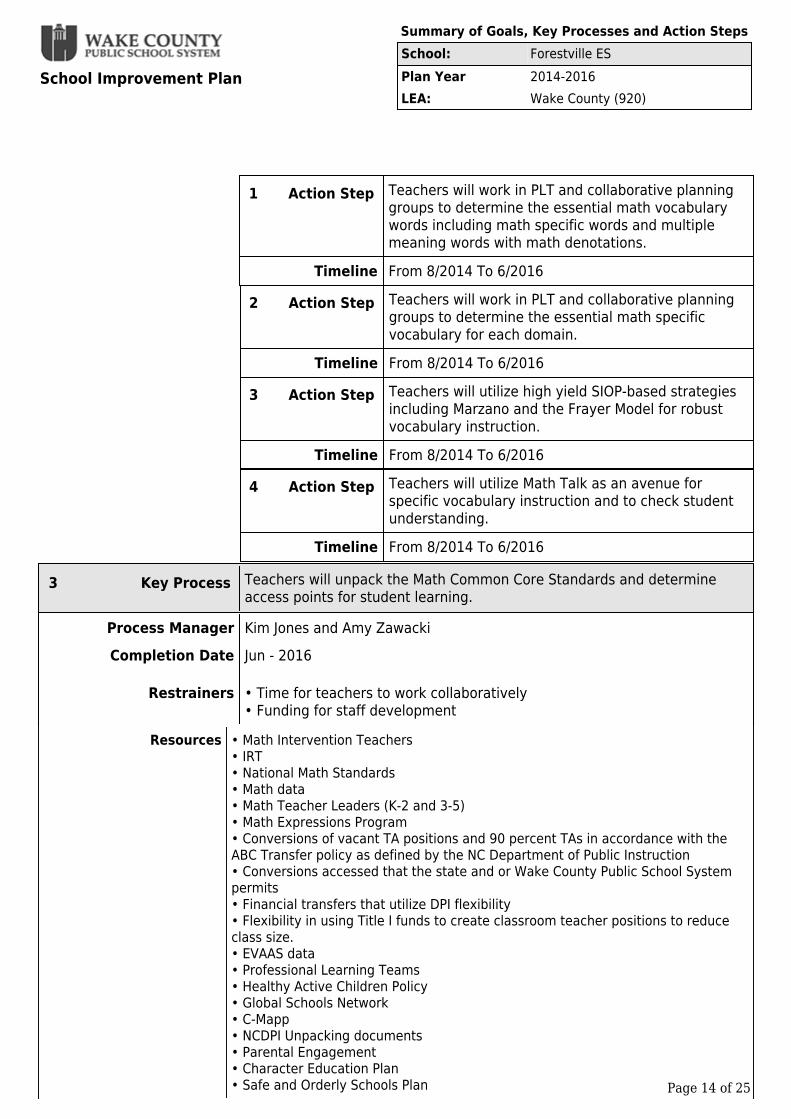
1 Action Step Teachers will work in PLT and collaborative planninggroups to determine the essential math vocabularywords including math specific words and multiplemeaning words with math denotations.
Timeline From 8/2014 To 6/2016
2 Action Step Teachers will work in PLT and collaborative planninggroups to determine the essential math specific vocabulary for each domain.
Timeline From 8/2014 To 6/2016
3 Action Step Teachers will utilize high yield SIOP-based strategiesincluding Marzano and the Frayer Model for robustvocabulary instruction.
Timeline From 8/2014 To 6/2016
4 Action Step Teachers will utilize Math Talk as an avenue forspecific vocabulary instruction and to check studentunderstanding.
Timeline From 8/2014 To 6/2016
3 Key Process Teachers will unpack the Math Common Core Standards and determineaccess points for student learning.
Process Manager Kim Jones and Amy ZawackiCompletion Date Jun - 2016
Restrainers • Time for teachers to work collaboratively• Funding for staff development
Resources • Math Intervention Teachers• IRT• National Math Standards• Math data• Math Teacher Leaders (K-2 and 3-5)• Math Expressions Program• Conversions of vacant TA positions and 90 percent TAs in accordance with theABC Transfer policy as defined by the NC Department of Public Instruction• Conversions accessed that the state and or Wake County Public School Systempermits• Financial transfers that utilize DPI flexibility• Flexibility in using Title I funds to create classroom teacher positions to reduceclass size.• EVAAS data• Professional Learning Teams• Healthy Active Children Policy• Global Schools Network• C-Mapp• NCDPI Unpacking documents• Parental Engagement• Character Education Plan• Safe and Orderly Schools Plan
School Improvement Plan
Summary of Goals, Key Processes and Action StepsSchool: Forestville ESPlan Year 2014-2016LEA: Wake County (920)
Page 15 of 25
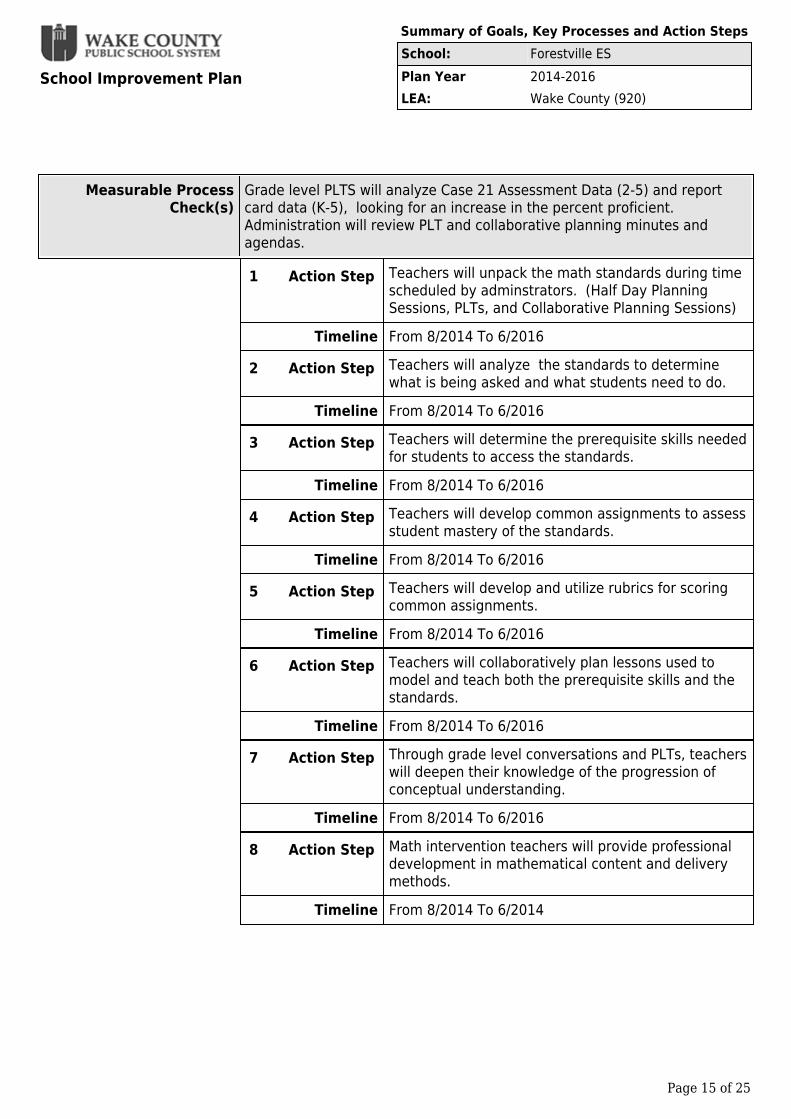
Measurable ProcessCheck(s)
Grade level PLTS will analyze Case 21 Assessment Data (2-5) and reportcard data (K-5), looking for an increase in the percent proficient. Administration will review PLT and collaborative planning minutes andagendas.
1 Action Step Teachers will unpack the math standards during timescheduled by adminstrators. (Half Day PlanningSessions, PLTs, and Collaborative Planning Sessions)
Timeline From 8/2014 To 6/2016
2 Action Step Teachers will analyze the standards to determinewhat is being asked and what students need to do.
Timeline From 8/2014 To 6/2016
3 Action Step Teachers will determine the prerequisite skills neededfor students to access the standards.
Timeline From 8/2014 To 6/2016
4 Action Step Teachers will develop common assignments to assessstudent mastery of the standards.
Timeline From 8/2014 To 6/2016
5 Action Step Teachers will develop and utilize rubrics for scoringcommon assignments.
Timeline From 8/2014 To 6/2016
6 Action Step Teachers will collaboratively plan lessons used tomodel and teach both the prerequisite skills and thestandards.
Timeline From 8/2014 To 6/2016
7 Action Step Through grade level conversations and PLTs, teacherswill deepen their knowledge of the progression ofconceptual understanding.
Timeline From 8/2014 To 6/2016
8 Action Step Math intervention teachers will provide professionaldevelopment in mathematical content and deliverymethods.
Timeline From 8/2014 To 6/2014

School Improvement Plan
Waiver RequestSchool: Forestville ESPlan Year 2014-2016
Page 16 of 25
Date Apr - 2014Waiver RequestedThere are no waivers needed or requested.How will this waiver impact school improvement?There are no waivers needed or requested.Please indicate the type of waiver: LocalPlease indicate the policy to be waived none
School Improvement Plan
Summary Sheet of Professional Development ActivitiesSchool: Forestville ESPlan Year 2014-2016School Year: 2014-2015
Page 17 of 25
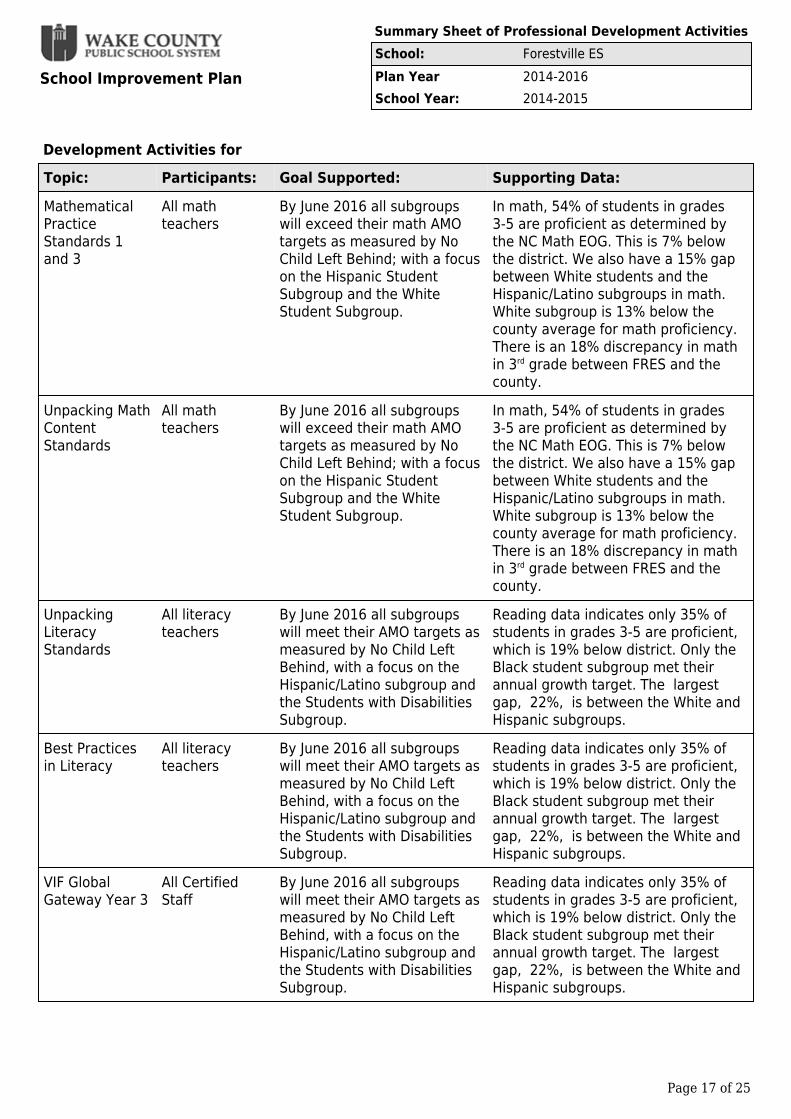
Development Activities for Topic: Participants: Goal Supported: Supporting Data:MathematicalPracticeStandards 1and 3
All mathteachers
By June 2016 all subgroupswill exceed their math AMOtargets as measured by NoChild Left Behind; with a focuson the Hispanic StudentSubgroup and the WhiteStudent Subgroup.
In math, 54% of students in grades3-5 are proficient as determined bythe NC Math EOG. This is 7% belowthe district. We also have a 15% gapbetween White students and theHispanic/Latino subgroups in math.White subgroup is 13% below thecounty average for math proficiency.There is an 18% discrepancy in mathin 3rd grade between FRES and thecounty.
Unpacking MathContentStandards
All mathteachers
By June 2016 all subgroupswill exceed their math AMOtargets as measured by NoChild Left Behind; with a focuson the Hispanic StudentSubgroup and the WhiteStudent Subgroup.
In math, 54% of students in grades3-5 are proficient as determined bythe NC Math EOG. This is 7% belowthe district. We also have a 15% gapbetween White students and theHispanic/Latino subgroups in math.White subgroup is 13% below thecounty average for math proficiency.There is an 18% discrepancy in mathin 3rd grade between FRES and thecounty.
UnpackingLiteracyStandards
All literacyteachers
By June 2016 all subgroupswill meet their AMO targets asmeasured by No Child LeftBehind, with a focus on theHispanic/Latino subgroup andthe Students with DisabilitiesSubgroup.
Reading data indicates only 35% ofstudents in grades 3-5 are proficient,which is 19% below district. Only theBlack student subgroup met theirannual growth target. The largestgap, 22%, is between the White andHispanic subgroups.
Best Practicesin Literacy
All literacyteachers
By June 2016 all subgroupswill meet their AMO targets asmeasured by No Child LeftBehind, with a focus on theHispanic/Latino subgroup andthe Students with DisabilitiesSubgroup.
Reading data indicates only 35% ofstudents in grades 3-5 are proficient,which is 19% below district. Only theBlack student subgroup met theirannual growth target. The largestgap, 22%, is between the White andHispanic subgroups.
VIF GlobalGateway Year 3
All CertifiedStaff
By June 2016 all subgroupswill meet their AMO targets asmeasured by No Child LeftBehind, with a focus on theHispanic/Latino subgroup andthe Students with DisabilitiesSubgroup.
Reading data indicates only 35% ofstudents in grades 3-5 are proficient,which is 19% below district. Only theBlack student subgroup met theirannual growth target. The largestgap, 22%, is between the White andHispanic subgroups.

School Improvement Plan
Summary Sheet of Professional Development ActivitiesSchool: Forestville ESPlan Year 2014-2016School Year: 2014-2015
Page 18 of 25
Development Activities for Topic: Participants: Goal Supported: Supporting Data:DiscoveryEducation
All certifiedstaff
By June 2016 all subgroupswill meet their AMO targets asmeasured by No Child LeftBehind, with a focus on theHispanic/Latino subgroup andthe Students with DisabilitiesSubgroup.
Reading data indicates only 35% ofstudents in grades 3-5 are proficient,which is 19% below district. Only theBlack student subgroup met theirannual growth target. The largestgap, 22%, is between the White andHispanic subgroups.
School Improvement Plan
Summary Sheet of Professional Development ActivitiesSchool: Forestville ESPlan Year 2014-2016School Year: 2015-2016
Page 19 of 25
Development Activities for Topic: Participants: Goal Supported: Supporting Data:
School Improvement Plan
Intervention Planning MatrixSchool: Forestville ESPlan Year 2014-2016School Year: 2014-2015
Page 20 of 25
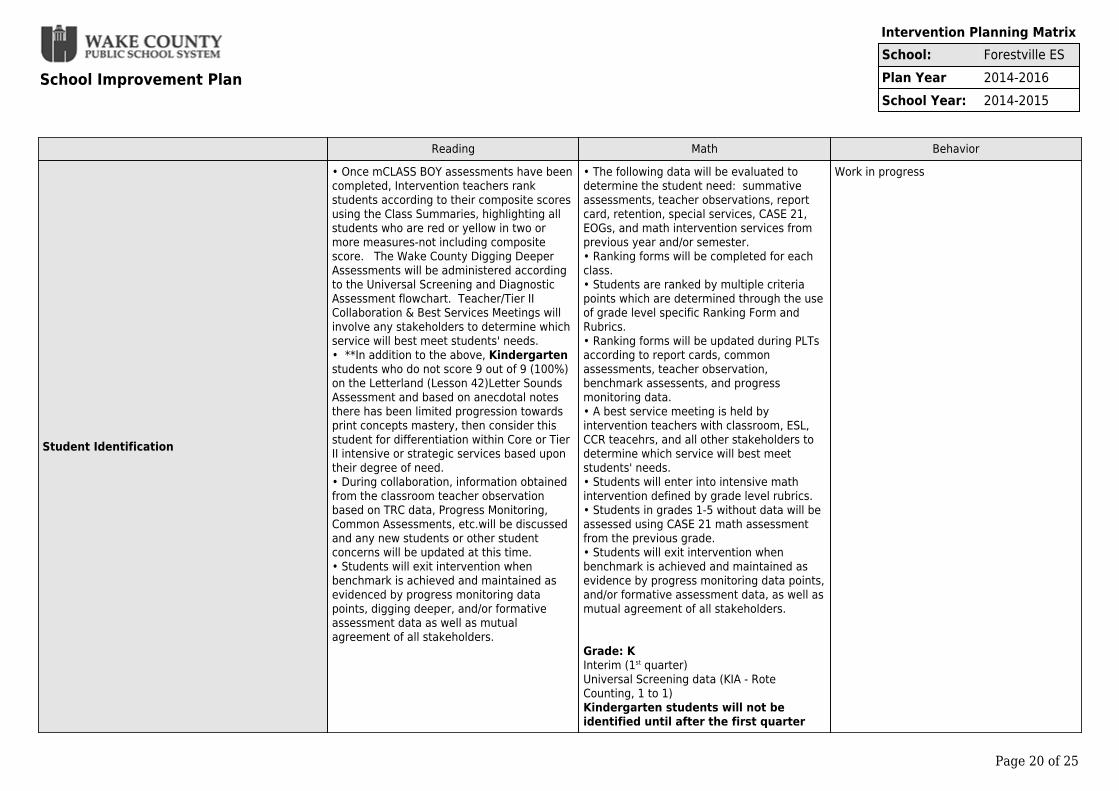
Reading Math Behavior
Student Identification
• Once mCLASS BOY assessments have beencompleted, Intervention teachers rankstudents according to their composite scoresusing the Class Summaries, highlighting allstudents who are red or yellow in two ormore measures-not including compositescore. The Wake County Digging DeeperAssessments will be administered accordingto the Universal Screening and DiagnosticAssessment flowchart. Teacher/Tier IICollaboration & Best Services Meetings willinvolve any stakeholders to determine whichservice will best meet students' needs. • **In addition to the above, Kindergartenstudents who do not score 9 out of 9 (100%)on the Letterland (Lesson 42)Letter SoundsAssessment and based on anecdotal notesthere has been limited progression towardsprint concepts mastery, then consider thisstudent for differentiation within Core or TierII intensive or strategic services based upontheir degree of need. • During collaboration, information obtainedfrom the classroom teacher observationbased on TRC data, Progress Monitoring,Common Assessments, etc.will be discussedand any new students or other studentconcerns will be updated at this time. • Students will exit intervention whenbenchmark is achieved and maintained asevidenced by progress monitoring datapoints, digging deeper, and/or formativeassessment data as well as mutualagreement of all stakeholders.
• The following data will be evaluated todetermine the student need: summativeassessments, teacher observations, reportcard, retention, special services, CASE 21,EOGs, and math intervention services fromprevious year and/or semester.• Ranking forms will be completed for eachclass.• Students are ranked by multiple criteriapoints which are determined through the useof grade level specific Ranking Form andRubrics.• Ranking forms will be updated during PLTsaccording to report cards, commonassessments, teacher observation,benchmark assessents, and progressmonitoring data.• A best service meeting is held byintervention teachers with classroom, ESL,CCR teacehrs, and all other stakeholders todetermine which service will best meetstudents' needs.• Students will enter into intensive mathintervention defined by grade level rubrics.• Students in grades 1-5 without data will beassessed using CASE 21 math assessmentfrom the previous grade.• Students will exit intervention whenbenchmark is achieved and maintained asevidence by progress monitoring data points,and/or formative assessment data, as well asmutual agreement of all stakeholders.
Grade: KInterim (1st quarter)Universal Screening data (KIA - RoteCounting, 1 to 1)Kindergarten students will not beidentified until after the first quarter
Work in progress

School Improvement Plan
Intervention Planning MatrixSchool: Forestville ESPlan Year 2014-2016School Year: 2014-2015
Page 21 of 25
Reading Math Behavior
Intervention Structure
• Intensive service: direct instruction inpull-out or station teaching groups 20-30minutes a day 3-5 days per week.• Strategic service: pull-out or stationteaching groups 10-20 minutes a day 2-4days per week.• Classroom strategy groups: 5-15 minutes1-3 days per week as needed/requested. • Literacy collaborative planning with gradesK-5 will be held each week.
• There will be a dedicated K/1 LiteracyCoach/Math Specialist. The teacher willprovide pull-out/push-in interventions forstudents below grade level in kindergartenand first grade as determined by the multiplecriteria rubric.• The remaining math intervention staff willbe dedicated to providing interventions forgrades 2-5 where there will be push-inintervention. Services for the identifiedintensive students will be for the needieststudents at each grade level as determinedby the Multiple Criteria Rubric. All otherstudents in the classroom will be supportedby the intervention team as part of thepush-in model.• Grade K and 1: Days and times may varybased on student need as demonstrated byUniversal Screening and Benchmark Data. Session length will vary from 20-35 minutesand will meet up to 3-5 days per week. Thenumber of pull-out groups/station teaching ateach grade level will be based on need.• Grades 2-5: Push-in/co-teaching at least 4days per week for 45-60 minutes.• Collaborative planning with grades K-5 onthe non-served day each week.
Work in progress

School Improvement Plan
Intervention Planning MatrixSchool: Forestville ESPlan Year 2014-2016School Year: 2014-2015
Page 22 of 25
Reading Math Behavior
Instruction
• Based on need, students will be identifiedas intensive or strategic and will be served insmall groups of 4-6 students. • K & 1st:Letterland intervention lessonformat• 2-5: Intervention formats will provide directand explicit instruction based on studentneed and guided by assessment data,collaboration and anecdotal notes. This mayinclude topics focused on fluency, word work,vocabulary and/or comprehension thataddress grade level expectations onstudents' levels.
• We hold monthly collaboration meetingswith classroom teachers and weekly PLTs todiscuss student needs. The focus ofintervention lessons will be discussed duringthese meetingsd to ensure skills aregeneralized across settings and addressgrade level expectations on students' levels.• Based on need, students will be identifiedas intensive or strategic and will be served insmall groups.• All intervention formats will be direct andexplicit instruction based on student needand guided by assessment data,collaboration, and anecdotal notes.The pull-out intervention format is as follows:K-1:Warm up (5-10 minutes): mental math,review, subitizingConcept Building with embeddedVocabulary Development (10-20minutes): Modeled lesson and guidedpracticeExtended Response/Application (5-15minutes): Independent or partner work
The Push-in/Co-teaching intervention formatis as follows:2-5: Tier II Intervention teachers will supportCommon Core classroom instruction throughguided math, strategy groups, mini-lessons,collaborative planning, and the use ofC-MAPP.Warm up (10 minutes): mental math andreview
Concept Building with embeddedVocabulary Development (20-30minutes): Modeled lesson and guidedpracticeExtended Response/Application (15-20minutes): Independent or partner work
Work in progress

School Improvement Plan
Intervention Planning MatrixSchool: Forestville ESPlan Year 2014-2016School Year: 2014-2015
Page 23 of 25
Reading Math Behavior
Assessment
• Tier II Literacy Assessments will beadministered during the mClass beginning,middle, and end of the year benchmarkwindows. Assessments will be analyzed toguide instruction and determine impact ofintervention on students. The followingassessments will be administered: K-5: • mClass/TRC or Running Record• Letterland assessments• Universal Screening Measures• Wake County Digging Deeper Assessments• Formative Assessments• BOG3• EOG• CASE 21• mCLASS progress monitoring • Students in the red will be progressmonitored every 10 school days andstudents in the yellow will be progressmonitored every 20 school days. • Duration, frequency, and intensity will beadjusted based on progress monitoring datapoints and following the RtI framework.
Tier II Math Assessments will be administeredduring the beginning, middle, and end of theyear benchmark windows.These assessments will be analyzed toidentify students’ weaknesses and strengthsin different math objectives, to guideinstruction, and to determine impact onstudents.• Number Knowledge Test (optional)• Common formative assessments • Report Card• Case 21• EOGs• I-Ready• K-1 Summative Assessments
Work in progress.
School Improvement Plan
Intervention Planning MatrixSchool: Forestville ESPlan Year 2014-2016School Year: 2014-2015
Page 24 of 25
Reading Math Behavior
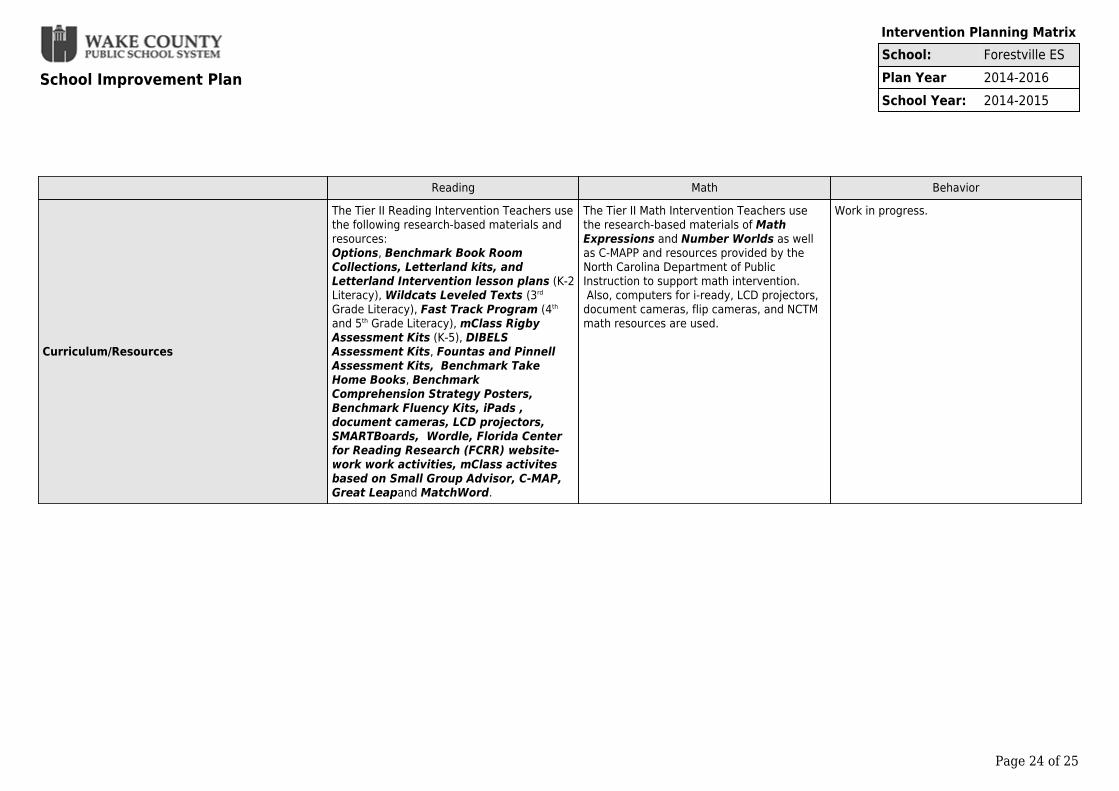
Curriculum/Resources
The Tier II Reading Intervention Teachers usethe following research-based materials andresources:Options, Benchmark Book RoomCollections, Letterland kits, andLetterland Intervention lesson plans (K-2Literacy), Wildcats Leveled Texts (3rd
Grade Literacy), Fast Track Program (4th
and 5th Grade Literacy), mClass RigbyAssessment Kits (K-5), DIBELSAssessment Kits, Fountas and PinnellAssessment Kits, Benchmark TakeHome Books, BenchmarkComprehension Strategy Posters,Benchmark Fluency Kits, iPads ,document cameras, LCD projectors,SMARTBoards, Wordle, Florida Centerfor Reading Research (FCRR) website-work work activities, mClass activitesbased on Small Group Advisor, C-MAP,Great Leapand MatchWord.
The Tier II Math Intervention Teachers usethe research-based materials of MathExpressions and Number Worlds as wellas C-MAPP and resources provided by theNorth Carolina Department of PublicInstruction to support math intervention. Also, computers for i-ready, LCD projectors,document cameras, flip cameras, and NCTMmath resources are used.
Work in progress.
School Improvement Plan
Intervention Planning MatrixSchool: Forestville ESPlan Year 2014-2016School Year: 2015-2016
Page 25 of 25
Reading Math BehaviorStudent IdentificationInterventionStructureInstructionAssessmentCurriculum/Resources