
Susceptibility of murine induced pluripotent stem cell-derived ...

Resource
Comprehensive Mapping o
f Pluripotent Stem CellMetabolism Using Dynamic Genome-Scale NetworkModelingGraphical Abstract
Highlights
d Systems approach infersmetabolic network state using time-
course metabolomics
d Characterized themetabolic state of naive and primedmurine
embryonic stem cells
d Trackedmetabolic reprogramming by the pluripotency factor
Lin28 in iPS cells
d Simulated and validated the influence of metabolic pathways
on histone methylation
Chandrasekaran et al., 2017, Cell Reports 21, 2965–2977December 5, 2017 ª 2017 The Authors.https://doi.org/10.1016/j.celrep.2017.07.048
Authors
Sriram Chandrasekaran, Jin Zhang,
Zhen Sun, ..., Hu Li, George Q. Daley,
James J. Collins
[email protected](G.Q.D.),[email protected] (J.J.C.)
In Brief
Chandrasekaran et al. use computational
modeling, metabolomics, and metabolic
inhibitors to discover metabolic
differences between various pluripotent
stem cell states and infer their impact on
stem cell fate decisions.

Cell Reports
Resource
Comprehensive Mapping of PluripotentStem Cell Metabolism Using DynamicGenome-Scale Network ModelingSriram Chandrasekaran,1,2,3,10 Jin Zhang,4,5,6,10 Zhen Sun,6 Li Zhang,6 Christian A. Ross,7 Yu-Chung Huang,4,5
John M. Asara,8,9 Hu Li,7 George Q. Daley,4,5,* and James J. Collins2,3,11,*1Department of Biomedical Engineering, University of Michigan, Ann Arbor, MI 48105, USA2Institute for Medical Engineering & Science, Department of Biological Engineering, and Synthetic Biology Center, Massachusetts
Institute of Technology, Broad Institute of MIT and Harvard, Cambridge, MA 02142, USA3Wyss Institute for Biologically Inspired Engineering, Harvard University, Boston, MA 02115, USA4Stem Cell Transplantation Program, Division of Pediatric Hematology Oncology, Boston Children’s Hospital, Boston, MA 02115, USA5Department of Biological Chemistry and Molecular Pharmacology, Harvard Medical School, Boston, MA 02115, USA6Center for Stem Cell and Regenerative Medicine, Department of Basic Medical Sciences and Institute of Hematology,The First Affiliated Hospital, Zhejiang University School of Medicine, Hangzhou 310058, China7Center for Individualized Medicine, Department of Molecular Pharmacology & Experimental Therapeutics, Mayo Clinic, Rochester,
MN 55905, USA8Division of Signal Transduction, Beth Israel Deaconess Medical Center, Boston, MA 02215, USA9Department of Medicine, Harvard Medical School, Boston, MA 02115, USA10These authors contributed equally11Lead Contact
*Correspondence: [email protected] (G.Q.D.), [email protected] (J.J.C.)https://doi.org/10.1016/j.celrep.2017.07.048
SUMMARY
Metabolism is an emerging stem cell hallmark tiedto cell fate, pluripotency, and self-renewal, yet sys-tems-level understanding of stem cell metabolismhas been limited by the lack of genome-scalenetwork models. Here, we develop a systemsapproach to integrate time-course metabolomicsdata with a computational model of metabolism toanalyze the metabolic state of naive and primedmurine pluripotent stem cells. Using this approach,we find that one-carbon metabolism involving phos-phoglycerate dehydrogenase, folate synthesis, andnucleotide synthesis is a key pathway that differs be-tween the two states, resulting in differential sensi-tivity to anti-folates. The model also predicts thatthe pluripotency factor Lin28 regulates this one-car-bon metabolic pathway, which we validate usingmetabolomics data from Lin28-deficient cells. More-over, we identify and validate metabolic reactionsrelated to S-adenosyl-methionine production thatcan differentially impact histone methylation in naiveand primed cells. Our network-based approachprovides a framework for characterizing metabolicchanges influencing pluripotency and cell fate.
INTRODUCTION
Pluripotent stem cells are able to self-renew and have the capac-
ity to regenerate all tissues in the human body. Recently, there
Cell RepThis is an open access article under the CC BY-N
has been a resurgence of interest in stem cell metabolism due
to its role in affecting signaling pathways and epigenetic pro-
cesses, apart from synthesizing precursors and generating en-
ergy for stem cell renewal. Understanding the metabolism of
pluripotent stem cells holds promise for understanding early
development as well as for regenerative medicine.
Two distinct states of pluripotent stem cells that differ in their
developmental potential have been recently described. Naive
murine embryonic stem cells (ESCs) that closely mirror the inner
cell mass of the pre-implantation embryo are maintained in
culture with ERK/MEK inhibitor and GSK3 inhibitor (2i) (Nichols
and Smith, 2009), whereas primed ESCs derived from the post-
implantation embryo are maintained in the presence of fibroblast
growth factor 2 (FGF2) andActivin (Brons et al., 2007; Tesar et al.,
2007). These states also show distinct patterns of metabolism.
Naive cells predominantly employ mitochondrial oxidative meta-
bolism (Huang et al., 2014; Takashima et al., 2014; Zhou et al.,
2012) and utilize more glucose and less glutamine to make a-ke-
toglutarate,which in turn influences histone andDNAmethylation
(Carey et al., 2015). Human naive-like cells derived with different
protocols (Gafni et al., 2013; Takashima et al., 2014; Theunissen
et al., 2014; Ware et al., 2014) consistently exhibit high oxidative
metabolism, as well as low S-adenosyl-methionine (SAM) levels
due to high consumption that presumably leads to histone hypo-
methylation (Sperber et al., 2015), a characteristic of the naive
state (Marks et al., 2012). It has been shown that mouse ESCs
in LIF/serum media (a metastable state between naive and
primed) utilize threonine to feed the SAM pool for H3K4 methyl-
ation (Shyh-Chang et al., 2013), and human ESCs require methi-
onine tomaintain pluripotency (Shiraki et al., 2014). However, the
role and activity of enzymes involved in one-carbon metabolism,
which impacts nucleotide biosynthesis, redox homeostasis, and
methylation reactions, in two clearly defined naive and primed
orts 21, 2965–2977, December 5, 2017 ª 2017 The Authors. 2965C-ND license (http://creativecommons.org/licenses/by-nc-nd/4.0/).

Figure 1. Overview of Our Approach to Integrate Time-Course Metabolomics (Intracellular or Extracellular) with Genome-Scale Metabolic
Models to Reconstruct the Metabolic Network of Different Cell Fates
(A) A simple metabolic network consisting of two parallel pathways to produce the growth-associated metabolite C is shown, along with its corresponding
stoichiometric matrix representation. Deleting reactions 2 or 4 should impact the biomass production equally in this model.
(B) Time-coursemetabolomics data from two different conditions are then overlaid onto themetabolic networkmodel and dynamicmetabolites are identified. The
accumulation or depletion of metabolites resulting from increased or decreased flux through the reactions involving those metabolites are represented in silico
(legend continued on next page)
2966 Cell Reports 21, 2965–2977, December 5, 2017

pluripotency states ofmouse ESCs has not been explored from a
systems perspective.
The enormous size and complexity of the mammalian meta-
bolic networks has so far limited systems-level understanding
of stem cell metabolism. Expression analysis of metabolic genes
ormetabolomics can provide a snapshot of themetabolic status,
but is limited because gene or metabolite changes often do not
reflect the flux of the metabolic reactions. Isotope tracing anal-
ysis can determine flux but only focuses on specific metabolic
pathways and does not give a systems perspective of the entire
network. Pathway enrichment analysis is another commonly
used approach to characterize metabolic changes at the
systems level (Subramanian et al., 2005; Xia et al., 2015). How-
ever, given the highly inter-connected nature of the metabolic
network, the underlying assumption behind pathway enrichment
analysis that each pathway is independent of each other does
not hold for metabolism (Shlomi et al., 2008). Adjacent pathways
on the network can influence each other’s activity, and altered
flux activity can arise due to perturbations upstream of a given
pathway. Furthermore, individual enzymes in a pathway do not
change coherently as a whole and can have different levels of
activity. A systems-level model is thus needed to understand
metabolic differences between different cell states at both the
individual reaction level and the network level.
Here, we use genome-scale computational modeling to
comprehensively characterize themetabolism of different plurip-
otent stem cell states. Genome-scale metabolic network models
are manually curated and represent the mechanistic relation-
ships among thousands of genes, proteins, and metabolites
within a biological system (Bordbar et al., 2014). Recently,
genome-scalemetabolic models have been integrated with tran-
scriptomics data to identify a subset of metabolic genes that are
active in a system. Such transcriptomics-constrained models
have been applied successfully to predict metabolic behaviors
of human tissues and cancer cells at steady state (Frezza
et al., 2011; Uhlen et al., 2015).
Because stem cell metabolic rewiring is dynamic (i.e., not at
steady state) and has been known to be regulated at the post-
transcriptional level (Zhang et al., 2016), we developed a
genome-scale modeling approach to directly infer metabolic
states based on time-course metabolomics data. Similar to
pathway enrichment analysis where increased levels of metabo-
lites in a pathway suggests increased pathway activity in a
condition, we assume that the accumulation or depletion of a
metabolite over time is evidence for increased or decreased
overall flux activity of the set of reactions involving the metabo-
lite. By integrating data from several metabolites into a unified
genome-scale model, we can identify reactions whose differen-
tial activity will most likely explain the observed pattern ofmetab-
olomic changes.
We first validate this approach by identifying metabolic vulner-
abilities of the NCI-60 cancer cell lines. This approach is then
using flux-activity coefficients. A global metabolomics-consistent metabolic net
gration reveals a higher flux through reaction 2 in condition 1 and a higher flux th
(C) Differentially sensitive and differentially active metabolic reactions are determ
(D) Overview of the steps in processing metabolomics data, integration with the
(E) A genome-scalemodel of metabolism is used to integrate data across hundred
applied to characterize murine naive and primed ESC metabolic
states, and track the metabolic effect of Lin28, a pluripotency
factor (Viswanathan andDaley, 2010) associated with the primed
state (Zhang et al., 2016). We confirm a transition of mitochon-
drial metabolism and uncovered an elevation of one-carbon
metabolism pathways from naive to primed state. Using Lin28
knockout pluripotent stem cells as a surrogate of the naive state,
we demonstrate a pivotal role of Lin28 in conferring the unique
one-carbon and nucleotide metabolism associated with primed
pluripotency.
RESULTS
Construction of a Dynamic Genome-Scale MetabolicModelOur proposed approach integrates time-course metabolomics
data with a genome-scale metabolic network model and makes
use of the flux balance analysis (FBA) framework to infer the
metabolic state of a condition (Orth et al., 2010). The FBA
approach identifies the optimal flux through each reaction
in the metabolic network that maximizes a specific objective
such as the growth rate, while satisfying stoichiometric and
mass-balance constraints.
The integration of metabolite levels with genome-scale meta-
bolic models has been a significant challenge due to the lack of
thermodynamic and kinetic parameters (Cotten and Reed, 2013;
Yizhak et al., 2015). In addition, integrating metabolomics mea-
surements from mammalian systems poses additional chal-
lenges due to noise in the data, the undefined nature of serum
components in the media, and compartment-specific meta-
bolism. In microbial dynamic flux-balance models, time-course
metabolomics measurements are used to explicitly determine
metabolite accumulation/depletion rates (Kleessen et al., 2015;
Schmidt et al., 2013). In contrast, given the complexity associ-
ated with eukaryotic metabolic measurements due to cellular
heterogeneity and compartmentalization, our approach uses
time-course metabolomics measurements as cues for likelihood
of altered flux activity around a metabolite. Our approach tries to
identify a metabolic state that best fits the metabolomics data
while allowing for deviations from observed pattern of accumu-
lation or depletion of metabolites. Network integration is then
used to combine these cues into a global, consistent metabolic
state (Experimental Procedures; Figure 1).
Usingour approach,wecan infer the impactof theobserveddif-
ferential metabolite levels on the corresponding reaction, the
encompassing metabolic pathway, and the entire network of
thousands of metabolic reactions. Furthermore, the input data
can be either intracellular or extracellular. In the metabolic model,
metabolites in each compartment (i.e., extracellular, cytosol,
mitochondria, nucleus, or other organelles) are distinct from
each other. Transport reactions are used to connect metabolites
in different compartments. Because the network is unified, the
work state is determined for each condition. In this case, metabolomics inte-
rough reaction 4 in condition 2.
ined by performing genome-scale reaction deletion analysis and FVA.
metabolic model, and prediction of metabolic vulnerabilities.
s ofmetabolites to identify differentially sensitive reactions between conditions.
Cell Reports 21, 2965–2977, December 5, 2017 2967

impact of changes inmetabolites in any compartment canbe pre-
dicted on the network. For example, changes in extracellular
metabolite levels will impact the uptake or secretion flux of these
metabolites, which in turn will impact reactions downstream of
these transport reactions. Hence, data from extracellular mea-
surements can be directly utilized to constrain the model using
the same mathematical framework used for intracellular metabo-
lites. This approach goes beyond traditional pathway enrichment
analysis by creating a genome-scalemodel of themetabolic state
of a system.The in silicomodel canbesubsequentlyused tosimu-
late deletion of metabolic genes or inhibition of enzymes, in addi-
tion to identifying differentially active reactions and pathways.
As a validation of ourmethod in complex mammalian systems,
we applied it to predict the metabolic vulnerabilities of the
NCI-60 cancer cell lines. The metabolic properties of these cell
lines have been characterized using metabolomics collected at
two different time points (Jain et al., 2012). Using our approach,
we integrated these time-course metabolomics data with
a genome-scale model of human metabolism (Duarte et al.,
2007) consisting of 1,487 genes and 3,744 metabolic reactions
to map the metabolic state of each of the NCI-60 cell lines.
We simulated deletion of all metabolic genes in the model and
predicted the effect of deletion on the growth of the cell. Some
genes affected the growth of all the cell lines, whereas others
were more selective for specific cell and tissue type (Figure 2A).
We first identified commonmetabolic vulnerabilities across all 60
cell lines. This was done by identifying genes that when deleted
impact growth by at least 5%of thewild-type (Figure 2A; Supple-
mental Experimental Procedures). Comparing the predicted
metabolic vulnerabilities with data from small interfering RNA
(siRNA) and CRISPR Cas9 gene knockdown screens (Cheung
et al., 2011; Marcotte et al., 2012; Aguirre et al., 2016) revealed
that cell lines were significantly more sensitive to siRNAs target-
ing these genes compared to other metabolic genes, suggesting
that the genes identified by our approach were more likely to be
essential to the growth of these cell lines (p value = 83 10�3, 23
10�15, and 33 10�3, respectively, for siRNA [Cheung et al., 2011;
Marcotte et al., 2012] and CRISPR data [Aguirre et al., 2016],
one-sided Kolmogorov-Smirnov test [KS] test). As a negative
control, prediction using the metabolic model without metabolo-
mics constraint resulted in no significant enrichment.
We next used the integratedmodel to determinemetabolic dif-
ferences between the cell lines. We identified metabolic genes
that were differentially vulnerable in a cell line relative to the re-
maining cell lines (Figure 2A). These genes were also more likely
to be predicted as selectively vulnerable in these cell lines based
onboth siRNAandCRISPR-Cas9 screens (p value=3310�3, 13
10�6, and 13 10�3, respectively, for siRNA [Cheung et al., 2011;
Marcotte et al., 2012] andCRISPRdata [Aguirre et al., 2016], one-
sided KS-test) (Figures 2B–2D). These results are notable given
the variable nature of high-throughput siRNA screens andmetab-
olomicsdata acrossdifferent studies. These findings suggest that
our approach can accurately capture metabolic differences be-
tween cell states using time-course metabolomics data.
Modeling Murine Naive and Primed ESC MetabolismTo characterize the metabolic state of mouse ESCs in naive and
primed states, we measured levels for over 200 metabolites at
2968 Cell Reports 21, 2965–2977, December 5, 2017
three time points (Figure 3A). The metabolomics data revealed
changes in several metabolites, but these were not specifically
related to any one pathway. Pathway enrichment analysis of
metabolomics data mirrored this complexity and only two path-
ways—purine metabolism and urea cycle—were predicted to
be differentially active at false discovery rate (FDR) < 0.05 (Tables
S1A and S1B). Enrichment analysis of gene expression data of
these two states also did not reveal any significant differential ac-
tivity for a metabolic pathway over the background (FDR < 0.1).
Changes inmetabolic pathwaysweremaskedby strong changes
in other pathways such as signaling pathways (Table S1E).
Given the limited insight from enrichment analysis, we applied
our dynamic genome-scale modeling approach to tease out the
underlying metabolic differences between the two cell fates.
The metabolomics data were then used to create a dynamic
genome-scale metabolic model of the naive and primed state
(Figure 3A). We performed deletion analysis of all the metabolic
reactions to discover differences between the two metabolic
networks (Figure 3B). In addition to reaction deletion analysis,
which identified the dominant metabolic differences between
the two states, we used flux variability analysis (FVA) to deter-
mine the range of feasible fluxes for each reaction based on
thermodynamic, stoichiometric, and metabolomics constraints
(Mahadevan and Schilling, 2003). FVA can capture flux differ-
ences in essential reactions, which cannot be inferred through
deletion analysis as they are lethal to both states. The combina-
tion of reaction deletion analysis and FVA was used to prioritize
reactions that showed differential sensitivity and flux activity.
The majority of the 3,744 reactions (96%) did not show selec-
tivity between the two states, i.e., their knockout affected both
states to the same extent. Among the reactions that were selec-
tive, the primed state network was more sensitive to knockout
of reactions in folate/SAM/one-carbon metabolism, cysteine-
methionine synthesis, and purine synthesis, whereas the naive
state was more sensitive to reactions in oxidative phosphoryla-
tion, tricarboxylic acid (TCA) cycle, and pyrimidine synthesis
(Figures 3B and 3C). We also observed that reactions in mito-
chondria were more sensitive in the naive state. For example, re-
actions involving folate in the cytoplasm were more active in the
primed state, whereas folate reactions in mitochondria were
more active in the naive state (Tables S2A and S3A).
Validating Predicted Metabolic Differences betweenNaive and Primed Mouse ESCsConsistent with the in silico predictions, we found using13C-glucose and 13C-glutamine tracing that, in the naive
state, glucose had increased incorporation into the mitochon-
drial TCA cycle metabolites such as citrate, a-ketoglutarate/
glutamate, fumarate, and malate, and decreased incorporation
into one-carbonmetabolismmetabolites such as serine, 3-phos-
phoserine, andmethionine; glutamine had decreased incorpora-
tion into nucleotides (Figures 3D and 3E; Figures S1A and S1B).
Overall, metabolites associated with differentially sensitive reac-
tions were also more likely to be differentially labeled between
the two states (p value = 0.005, hypergeometric test; Figure S1F),
confirming the strong concordance between two datasets.
To further assess the importance of folate and one-carbon
metabolism predicted by the model, we tested our predictions

Figure 2. Validation of Our Approach to Infer Metabolic States from Time-Course Metabolomics Data by Applying It to Predict the Metabolic
Behavior of NCI-60 Cancer Cell Lines
(A) Table of cell-line-specific metabolic vulnerabilities predicted by our approach. The predicted growth (measured by ATP flux) of 48 differentially sensitive gene
knockouts in the NCI-60 cell lines is shown relative to wild-type. Highlighted genes affect ATP flux across all cell lines.
(B) The set of cell-line-specific metabolic gene vulnerabilities predicted by our approach were consistent with siRNA screens. The GARP (gene activity rank
profile) scores of genes that were sensitive (vulnerable) in a cell line were found to be lower than those that were not predicted to be sensitive in a given cell line.
The lower the GARP score for a given cell line, the more essential is the gene in that particular cell line (data fromMarcotte et al., 2012). The distribution of GARP
scores for the sensitive and non-sensitive associations are shown. The distributions were compared using the KS test (p value = 10�6).
(C) Predictions were also consistent with siRNA knockout screen (p value [KS test] = 0.0034; Cheung et al., 2011). Distribution of ATARIS (analytic technique for
assessment of RNAi by similarity) z-scores are shown for sensitive and non-sensitive gene knockouts across all cell lines.
(D) Predictions were also consistent with a CRISPR/Cas9-mediated knockout screen (p value [KS test] = 0.0012; Aguirre et al., 2016). Distribution of ATARIS
z-scores are shown for sensitive and non-sensitive gene knockouts across all cell lines.
(E) Sensitivity analysis of the dynamic modeling approach. Increasing the weight parameter (kappa) results in increasing weight for the metabolomics data over
growth. Correlation with the default settings (kappa = 1, i.e., equal weights for growth and metabolomics) and after changing kappa is shown for the predicted
difference in growth between naive and primed states after deletion of all the 3,744 metabolic reactions in the model.
(F) The approach is robust to noise in the metabolomics data. 10%, 25%, and 33% of the metabolites in the metabolomics data were randomly removed, and the
impact on the predictions between naive and primed state was analyzed. Correlation from predictions using this randomly sampled data with the predictions
using the entire dataset is shown. Predictionsmade by using just the direction of change (accumulation or depletion) without themagnitude also gave qualitatively
similar predictions as using the entire data (shown as yellow bar).
by using the anti-folate compound methotrexate. Methotrexate
is a well-established inhibitor of nucleotide synthesis and folate
synthesis that has been used in many previous studies (Singh
et al., 2006). It inhibits dihydrofolate reductase (DHFR), which
participates in tetrahydrofolate synthesis and thus impacts de
novo synthesis of purines and thymidine. As predicted by the
Cell Reports 21, 2965–2977, December 5, 2017 2969

Figure 3. Mapping the Metabolic Differences between Naive and Primed Stem Cells Using the Computational Model of Metabolism
(A) Overview of our approach to measure time-course metabolomics data and identify differentially active reactions.
(B) To identify differentially active metabolic reactions, we performed reaction knockout analysis on the naive and primed metabolic networks. The histogram
shows the distribution of growth rates after in silico deletion of all the metabolic reactions. The horizontal x axis shows the relative selectivity of each knockout for
naive state versus the primed state. The stronger the magnitude of selectivity, the greater the difference between the growth rate of the reaction knockout
between two states. The majority (96%) of knockouts do not have a differential effect on naive or primed metabolism. The y axis shows the total number of
reactions in each bin. Metabolic reactions that showed the greatest differences in growth between the two states are highlighted. The full list of reactions and their
abbreviations are provided in Table S2A. The suffix ‘‘m’’ at the end of each reaction name indicates a reaction occurring inmitochondria; isoforms are represented
with numerical suffixes (orange: more sensitive to deletion in naive; purple: more sensitive to deletion in primed).
(C) Schematic diagram of themetabolic pathways that are predicted to differ between the two states (naive, orange labels; primed, pink labels) as identified by the
model. The thickness of the reaction name label border is proportional to the extent of the differential activity of the reactions between the two states. Reactions
predicted to impact SAM flux in primed state (MAT, AHC, and METS) are also highlighted (Table S4).
(D) 13C tracing of glucose revealed that metabolites in the one-carbon and nucleotide metabolism were differentially labeled between the two conditions sug-
gesting re-routing of metabolic flux. The heatmap shows the total isotopomers labeled at different time points for each metabolite after z-transformation
(Supplemental Experimental Procedures).
(legend continued on next page)
2970 Cell Reports 21, 2965–2977, December 5, 2017

model, primed cells were more sensitive to inhibition by metho-
trexate (Figure 3F). In contrast, naive cells weremore sensitive to
mitochondrial folate metabolism inhibition by the drug MTH-
1459 that blocks MTHFD2 activity, also confirming the in silico
predictions (Figure 3F).
Decreasedone-carbonmetabolism in the naive statemight not
be caused by reduced glycolysis because 13C incorporation to
lactatewasnot lower in thenaive state (FigureS2D). Furthermore,
even though 13C incorporation from glucose to the ribose moiety
of nucleotide and nucleoside was lower in naive cells (Figure 3D;
Figure S2C), it was not caused by the pentose phosphate
pathway, as metabolites in this pathway were not differentially
measured in either state (Figure S2D). On the other hand, 13C
incorporation from serine to nucleobase moieties was lower in
naive cells (Figure S2E), indicating one-carbon metabolism
through N10-formyl-tetrahydrofolate (f-THF) accounted for
reduced nucleotide biosynthesis. 13C incorporation from gluta-
mine to nucleobase moieties through aspartate was also lower
in naive cells (Figure 3E), which could be attributed to lower gluta-
mine incorporation into the TCA cycle (Figure S2B). In summary,
these data suggest that the one-carbon metabolism pathway
branching from glycolysis is more active in the primed state.
In addition, mRNA transcripts of genes associated with the
reactions predicted by the model to be differentially sensitive
were also significantly more likely to be differentially expressed
(pvalue=0.003, t test; FigureS1G).Althoughpathwayenrichment
of transcriptomics data did not identify differential activity of these
pathways, analysis of specific transcripts prioritized by themodel
revealed lower expression of folate pathway genes Mthfd1,
Mthfd2, Mthfd2l, Mthfs, Mthfr, and Dhfr, and nucleotide biosyn-
thesis pathway genes Adsl, Atic, andGart, in the naive state cells
(Figure S1E). Further assessment of in vivo embryonic day 4.5
(E4.5) pre-implantation epiblast (naive) versus E5.5 post-implan-
tation epiblast (primed) also showed lower expression of Phgdh,
Psat, Shmt1/2 (serine metabolism), Mthfd1l, Mthfs, Mtfhfd2,
Dhfr (folate pathway), Mat2a, Mat1a, Cbs (methionine/cysteine
metabolism), andAdsl,Gart,Tyms,Atic,Paics (nucleotidebiosyn-
thesis) (Figure S1H). A dormant state of diapause characteristic of
the embryonic epiblast showed the lowest expression of most
genes listed above (Figure S1H) (Boroviak et al., 2015). Taken
together, these data suggest that mouse naive state pluripotency
is associated with lower one-carbon metabolism and glutamine
metabolism required for nucleotide biosynthesis.
Tracking Metabolic Network Rewiring by Lin28We next examined the metabolic state of naive induced pluripo-
tent stem cells (iPSCs) cultured in LIF/2i condition depleted of
Lin28. Lin28 knockout cells show elevated naive state features
compared with wild-type cells; they have defects in priming
and do not grow well in the primed condition (FGF2/Activin).
Indeed, our prior analysis has indicated that Lin28-deficient cells
(E) 13C tracing of glutamine revealed that metabolites in nucleotide metabolism w
the two states (p < 0.05) are displayed in (D) and (E) heatmaps. n = 3 for each tim
(F) Viability of cells after treatment with the anti-folate methotrexate and the mitoc
FGF2/Activin for 3 days at the time of measurement. Error bars represent SEM. n
different between naive and primed cells for both inhibitors (p value = 0.01 and 5
rank test).
represent a surrogate for the naive-state metabotype (Zhang
et al., 2016).
With the same approach using time-course metabolomics
data and reaction deletion analysis, we discovered similar meta-
bolic differences in one-carbon, oxidative phosphorylation and
nucleotide metabolism between Lin28 knockout and wild-type
cells (Tables S2B and S3B). Lin28 knockout cells were more
sensitive to deletion of reactions in the mitochondria, and less
sensitive to deletion of one-carbon metabolism reactions, remi-
niscent of the naive state compared with the primed state (Fig-
ures 4A–4C). The comparison between Lin28 knockout cells
and wild-type cells (both in 2i) differed from the comparison be-
tween naive cells and primed cells in the activity of the pentose
phosphate pathway (Figure 4D). This analysis also revealed the
importance of the nucleotide salvage pathway in Lin28 knockout
cells, with reactions in purine salvage and purine cycle pathways
such as Hgprt, predicted to have higher flux in Lin28 knockout
cells (Figures 4A and 4B). This could explain a previous report
that these cells are deficient in de novo nucleotide biosynthesis
and addition of nucleotides in the media rescues this phenotype
(Zhang et al., 2016). Time-course analysis of 13C-glucose incor-
poration also showed lower flux to nucleotides in Lin28 knockout
cells (Figure 4C; Figure S1C). In addition, 13C-glutamine tracing
revealed knockout cells had lower flux to nucleotide, similar to
the 2i naive state (Figure 4C; Figure S1D).
We next quantified the overall similarity of the 3,744 reaction
sensitivities between naive, primed, lin28 knockout, and wild-
type cells using unsupervised clustering and multi-dimensional
scaling (MDS) analysis (Figures 4D and 4E). Hierarchical clus-
tering analysis revealed that most reactions that show differential
sensitivity between cell states share the same direction of
change in both naive versus primed cells and DLin28 versus
wild-type cells, suggesting broad similarities between the two
scenarios (Figure 4D). A small subset of reactions showed the
opposite direction of change in DLin28 versus wild-type
compared to naive versus primed cells, suggesting that these
two scenarios are similar, but not identical (Figure 4D). MDS
analysis, which visualizes the entire set of variation in a data in
three dimensions, confirmed that knockout of Lin28 moves the
cellular metabolic network of iPS cells closer to the naive ESC
state (Figure 4E).
Simulating Impact of Metabolic Pathways on HistoneMethylationThe one-carbon metabolism pathway is required for histone
methylation in ESCs through modulating the SAM/S-adenosyl-
L-homocysteine (SAH) ratio (Shyh-Chang et al., 2013) (Figure 3C).
To assess the impact of the naive and primed metabolic
network states on histone methylation, we simulated the effect
of metabolic reaction deletions on SAM flux and subsequently
histone methylation under the assumption that SAM is a limiting
ere differentially labeled. Metabolites showing significant differences between
e point.
hondrial MTHFD2 inhibitor for 2 days. For primed cells, ESCs were treated with
= 3. *p < 0.05. Error bar represents SEM. The viability curves were significantly
3 10�4 for MTHFD2 inhibitor and methotrexate, respectively; Wilcoxon signed
Cell Reports 21, 2965–2977, December 5, 2017 2971
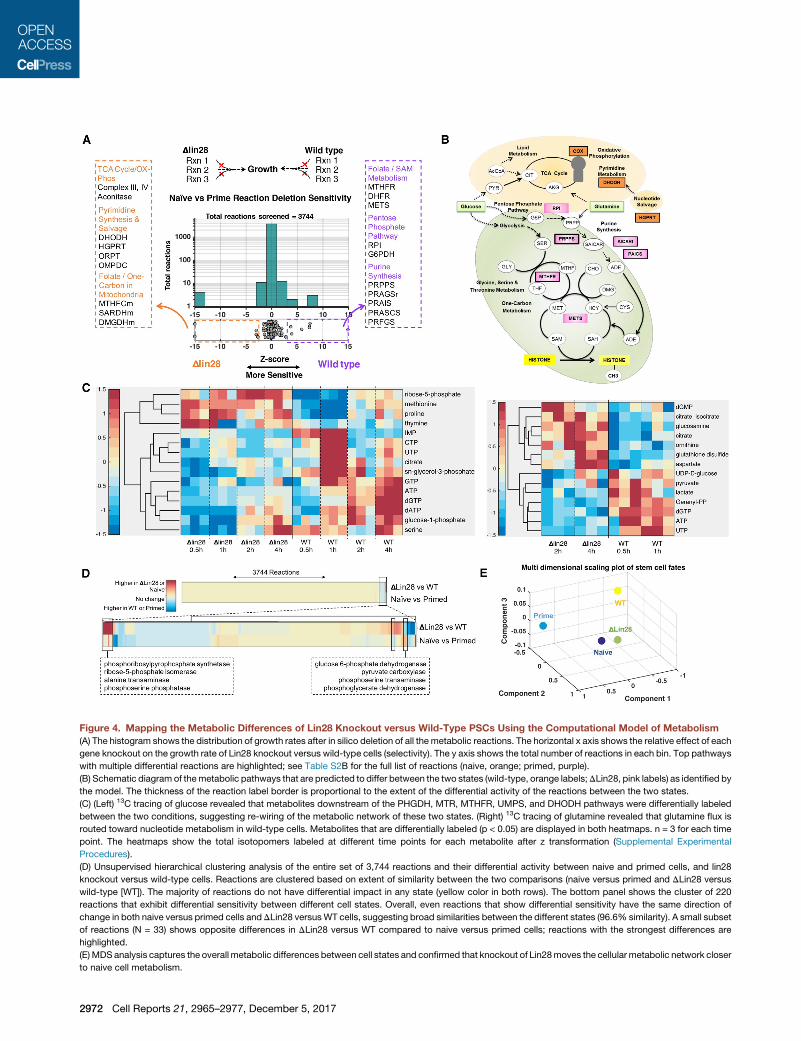
Figure 4. Mapping the Metabolic Differences of Lin28 Knockout versus Wild-Type PSCs Using the Computational Model of Metabolism
(A) The histogram shows the distribution of growth rates after in silico deletion of all the metabolic reactions. The horizontal x axis shows the relative effect of each
gene knockout on the growth rate of Lin28 knockout versus wild-type cells (selectivity). The y axis shows the total number of reactions in each bin. Top pathways
with multiple differential reactions are highlighted; see Table S2B for the full list of reactions (naive, orange; primed, purple).
(B) Schematic diagram of themetabolic pathways that are predicted to differ between the two states (wild-type, orange labels;DLin28, pink labels) as identified by
the model. The thickness of the reaction label border is proportional to the extent of the differential activity of the reactions between the two states.
(C) (Left) 13C tracing of glucose revealed that metabolites downstream of the PHGDH, MTR, MTHFR, UMPS, and DHODH pathways were differentially labeled
between the two conditions, suggesting re-wiring of the metabolic network of these two states. (Right) 13C tracing of glutamine revealed that glutamine flux is
routed toward nucleotide metabolism in wild-type cells. Metabolites that are differentially labeled (p < 0.05) are displayed in both heatmaps. n = 3 for each time
point. The heatmaps show the total isotopomers labeled at different time points for each metabolite after z transformation (Supplemental Experimental
Procedures).
(D) Unsupervised hierarchical clustering analysis of the entire set of 3,744 reactions and their differential activity between naive and primed cells, and lin28
knockout versus wild-type cells. Reactions are clustered based on extent of similarity between the two comparisons (naive versus primed and DLin28 versus
wild-type [WT]). The majority of reactions do not have differential impact in any state (yellow color in both rows). The bottom panel shows the cluster of 220
reactions that exhibit differential sensitivity between different cell states. Overall, even reactions that show differential sensitivity have the same direction of
change in both naive versus primed cells andDLin28 versusWT cells, suggesting broad similarities between the different states (96.6% similarity). A small subset
of reactions (N = 33) shows opposite differences in DLin28 versus WT compared to naive versus primed cells; reactions with the strongest differences are
highlighted.
(E) MDSanalysis captures the overall metabolic differences between cell states and confirmed that knockout of Lin28moves the cellularmetabolic network closer
to naive cell metabolism.
2972 Cell Reports 21, 2965–2977, December 5, 2017

Figure 5. Prediction and Validation of Intracellular SAM Levels and Global Histone Methylation
(A) Using the metabolic model, we predicted metabolic changes that can impact SAM flux and subsequently histone methylation. The histogram shows the
distribution of SAM flux toward histonemethylation after deletion of all themetabolic reactions. The horizontal x axis shows the relative effect of each knockout on
SAM flux in the naive state versus the primed state (selectivity). The y axis shows the total number of reactions in each bin. Metabolic reactions that showed the
(legend continued on next page)
Cell Reports 21, 2965–2977, December 5, 2017 2973
metabolite for methylation. Deletion of reactions in one-carbon
metabolism and nucleotide metabolism preferentially affected
SAM production in the primed state over the naive state (Fig-
ure 5A; Table S4). We experimentally validated this prediction
by treating cells with 3-deazaadenosine (3-DZA), a SAH hydro-
lase inhibitor that decreases the SAM/SAH ratio, and found
that it more profoundly affected H3K4, H3K9, and H3K27 trime-
thylation in the primed state relative to the naive state (Figure 5B).
Furthermore, treatment with 3-DZA affected wild-type H3K9 tri-
methylation more than Lin28 knockout, consistent with the role
of Lin28 in the primed state (Figure 5C). FBA also revealed higher
flux through SAM synthesis reactions in the primed state, sug-
gesting that the primed state relies more on one-carbon meta-
bolism for production of SAM (Table S4). Consistent with the
in silico prediction, the primed metabolic state has higher 13C
incorporation from serine toward SAM than the naive state
based on tracing 13C-labeled serine (Figure 5E). Furthermore,
histone methyltransferases and demethylases are not differen-
tially expressed in these two states; hence altered SAM meta-
bolism can explain the observed differential histone methylation
(Figure 5D).
DISCUSSION
Metabolism influences gene-regulatory networks that govern
cell fate choices (Ryall et al., 2015; Zhang et al., 2012), in both
pluripotent stem cells (Carey et al., 2015) and various types of
adult progenitor/stem cells (Peng et al., 2016; Yang et al.,
2016). Given the development potential of naive ESCs compared
to primed ESCs, it is critical to understand the metabolic
differences between these pluripotent cell fates. Analysis using
our dynamic metabolic modeling framework revealed three
insights on pluripotent stem cell metabolism. First, previous
studies showed higher mitochondria function in mouse ESCs,
in comparison to EpiSC or human ESCs (Zhou et al., 2012).
Furthermore, human naive-like cells have higher nicotinamide
N-methyltransferase (NNMT) activity that consume SAM
(Sperber et al., 2015). Here, we comprehensively characterized
the metabolic network of two bona fide pluripotent states in
mouse ESCs and discovered that, during priming, the entire
one-carbon metabolic pathway is activated, including upstream
serine production from glucose and downstream SAM and
nucleotide production through folate cycle and methionine
cycle. This makes mouse primed ESCsmore vulnerable to folate
metabolism inhibition and SAM/SAH repression. Interestingly,
this effect is compartment specific, with folate inhibition in mito-
chondria more sensitive in naive cells, whereas cytoplasmic inhi-
bition is more sensitive in primed cells. Our systems approach
greatest differences in SAM flux between the two states are highlighted. No reac
threshold of �2.
(B) Western blotting of H3K4me3, H3K9me3, and H3K27me3 of naive and primed
the bands.
(C)Western blotting of H3K9me3 of wildtype (WT) and Lin28 knockout (DKO) PS ce
ratio averaged from two experiments. The untreated WT ratio was used as refere
1 and 0.33 ± 0.1 and for Lin28 knockout is 0.53 ± 0.06 and 0.29 ± 0.11, respecti
(D) The mRNA expression levels of histone methyltransferases and demethylase
(E) Naive and primed cells were labeled with 50% [U13C]-serine for 24 hr, and th
2974 Cell Reports 21, 2965–2977, December 5, 2017
has thus uncovered a transition of one-carbon metabolism be-
tween two clearly defined naive and primed states.
Second, a previous report found that deleting Lin28 changes
mouse ESCs to a naive-like state. At the network level, broad
similarities between 2i naive and Lin28 knockout cells
were observed. However, unique differences in the pentose
phosphate pathway identified by our analysis suggest that these
states are not identical (Figure 4D). Third, we found that
increased flux through one-carbon pathway leads to higher
flux toward SAM and histone methylation in primed state, and
inhibiting these pathways reduces methylation disproportion-
ately in primed state. A previous report connected NNMT activity
to SAM consumption (Sperber et al., 2015). Our approach re-
vealed that serine flux and the one-carbon metabolic pathway
contribute to SAM production and histone methylation. Consis-
tent with a low SAM pool, naive mouse cells have hypomethy-
lated DNA and histone, and are tolerant to loss of epigenetic
regulators such as DNMT1 and polycomb protein EED, in
contrast to primed cells (Weinberger et al., 2016). Because
recent studies also implied that similar metabolic changes in
one-carbon and oxidative metabolism may occur in converted
human naive-like and primed pluripotent stem cells (PSCs)
(Sperber et al., 2015; Takashima et al., 2014), whether the con-
verted naive-like cells become more tolerant to DNMT1 deple-
tion and/or to SAM/SAH repression, merits careful investigation
to substantiate the identity of those cells.
Pervasive histone methylation is a key feature of primed cells
and our findings directly tie into the biology of primed pluripo-
tency. Our model also suggests that hypomethylation in naive
cells is likely due to the lack of one-carbon donor, SAM. Differen-
tiation potential (governed by epigenetic regulations) and prolif-
eration are the two most important cellular phenotypes that
distinguish naive and primed pluripotent states. The mechanism
of regulation of histone methylation so far is unknown because
histone methyltransferases and demethylases are not differen-
tially expressed in these two states (Figure 5D). Our study pro-
vides evidence that altered one-carbon and SAM metabolism
account for the differential histone methylation in these two
states, which in turn determines expression of various pluripo-
tent and developmental genes.
Our work suggests an interplay between mitochondrial res-
piratory metabolism and one-carbon metabolism during ESC
pluripotent state transitions, pointing to an unappreciated role
of elevated mitochondrial function in naive state pluripotency.
Similar coupling between one-carbon and respiratory meta-
bolism has been recently reported in cancer cell lines (Bao
et al., 2016). Furthermore, many of the enzymes predicted to
be differentially active between naive and primed ESCs, such
tion was predicted to impact SAM production in the naive state over a z-score
cells treated with 20 mM 3-DZA for 2 days. Lower panels show densitometry of
lls treatedwith 20 mM3-DZA for 2 days. Bar graph shows the H3K9me3 to actin
nce. The H3K9me3 to actin ratio before and after treatment with DZA for WT is
vely. Image from one representative blot is shown.
s are similar in both the naive and primed states (n = 4).
e fraction of each SAM isotopomer is shown.
as PHGDH, MTHFR, and other one-carbon metabolism pathway
constituents, have also been associated with tumor initiation,
progression and metastases (Locasale, 2013; Piskounova
et al., 2015). Comparison of metabolic genes that are sensitive
in NCI-60 cancer cell lines (Figure 2) with corresponding sensi-
tivity in naive and primed cells (Figure 3) revealed that the meta-
bolic state of many NCI-60 cell lines is surprisingly similar to
naive cell metabolism but not to primed cell metabolism. This
intriguing preliminary observation needs to be explored further
in a future study. Our findings may provide a better understand-
ing of metabolic rewiring during tumorigenesis as well.
Our systems biology approach overcomes a significant chal-
lenge in genome-scale modeling by inferring the metabolic state
of mammalian cells directly from time-course metabolomics
data. The power of our approach is that it can infer the activity
of thousands of reactions based on the measurement of a few
hundred metabolites. Interpreting metabolomics data is quite
challenging due to the highly interconnected nature of metabolic
networks. Themetabolites in our time-course data were involved
in 834 metabolic reactions in the model, even after excluding
ubiquitous metabolites such as ATP and NADH. Hence, it is diffi-
cult to manually infer the differentially active reactions from the
metabolomics data. By overlaying these data onto the model,
we identified a small, prioritized set of reactions that are differen-
tially active between these two states.
Using our approach, we identified compartment-specific dif-
ferences in folate metabolism, which we validated using cyto-
solic and mitochondrial folate inhibitors (Figure 3F). This is
significant given that information on cellular compartments is
lost duringmetabolomicsmeasurement. Furthermore, themodel
correctly identified differences in oxidative phosphorylation
pathway despite there being no direct measurement of this path-
way’s activity. These results highlight the power of our systems
approach to infer metabolic changes based on network topology
that goes beyond traditional analysis of metabolomics data.
Our computational approach still has some limitations
despite these numerous advances highlighted earlier. First,
the algorithm requires the levels of numerous metabolites
(�100) to infer the activity of reactions in the metabolic model.
The accuracy of the approach dropped significantly with data
from fewer than 65 metabolites (i.e., 33% of the data removed;
Figure 2F). Future studies should reveal which metabolites pro-
vide the most predictive power for these models. Second, exist-
ing genome-scale metabolic models lack detailed mapping of
atom transfer from substrates to products, thus preventing
the incorporation of isotopomer labeling distribution from13C tracing data. 13C flux tracing studies currently use signifi-
cantly smaller metabolic models with atomic mapping to predict
fluxes. Our systems-scale approach can complement such
traditional 13C analysis approaches by making coarse-grained
predictions for a larger set of reactions. Third, our approach is
restricted to predicting the impact of complete enzyme inhibi-
tion or gene knockouts on the metabolic network. As enzyme
kinetic parameters become available, it should be possible to
simulate the systems-level impact of nuanced changes in
enzyme levels.
Looking forward, a systems-level understanding of stem cell
metabolism could allow us to rationally manipulate specific
metabolic modules to facilitate differentiation and aid cell-fate
engineering. Our approach could be readily extended to under-
stand metabolic mechanisms underlying other cell-fate changes
and could open new avenues for computational identification
of metabolic vulnerabilities of cancer cells and other complex
metabolic disorders.
EXPERIMENTAL PROCEDURES
Genome-Scale Metabolic Network Modeling
We used the Duarte et al. (2007) model of human metabolism for all the meta-
bolic modeling in this study as it has been widely applied in literature for under-
standing cellular metabolism of various normal and disease states. We also
used the human Recon 2.0 model and the genome-scale model of mouse
metabolism as further validation. The mouse model was derived based on ho-
mology with the Duarte et al. human model. Using these models leads to the
identification of similar set of genes and pathways that were differentially
active between naive and primed states (Table S2C).
We used FBA to determine the optimal metabolic state that satisfies the
growth objective and the metabolomics constraints. Mathematically, in FBA,
we solve the optimization problem to identify a metabolic state (v, a vector
of reaction fluxes) that maximizes a specific cellular objective, such as the
biomass production or ATP synthesis rate, while satisfying thermodynamic
and mass balance constraints. FBA is formulated as follows:
S:v=b;
where S is the stoichiometric matrix with Sij representing the stoichiometric co-
efficient of metabolite i in reaction j, v is the flux vector, and b represents the
rate of change of metabolites (dM/dt). In traditional FBA, the value of R.H.S
vector b is assumed to be zero to represent steady state. We set this value pro-
portional to the measured rate of change from time-course metabolomics
data. For each dynamic metabolite, we include a flux activity coefficient,
whose value and sign determines whether there is increased or decreased
flux activity involving the metabolite.
S: v!=epsilon�����!
;
where epsilon is a vector of flux activity coefficient values (s0 for dynamic
metabolites).
The value of the flux activity coefficients is directly determined based on the
rate of change of metabolite levels over time. Because subcellular compart-
ment-specific information is lost during metabolomics measurement, we
assumed that the measured metabolites represent the sum total of those in
the cytoplasm, nucleus, and the mitochondrial compartments in the model.
In addition, some metabolite changes might represent noise in the data, and
these constraints would be predicted to be infeasible by themodel. To account
for these issues, we implemented an approach, defined below, that identifies a
metabolic state that best fits the entire set of metabolomics constraints
simultaneously:
S: v!+alpha���!�beta
���!=epsilon�����!
Minimize�alpha���!
+beta���!�
:
Alpha and beta are positive vectors that represent deviation from the
measured experimental data (Supplemental Experimental Procedures). The
entire sequence of steps in the dynamic modeling approach is described in
the pseudo-code provided in the supplement (Supplemental Experimental
Procedures).
The approach is robust to relative weights for metabolomics data and
growth objective (as defined by the kappa parameter), and also to noise in me-
tabolomics data (Figure 1E). Using a simple model that takes as input only the
Cell Reports 21, 2965–2977, December 5, 2017 2975
direction of change of metabolites (i.e., accumulating or depleting) without the
magnitude also led to qualitatively similar set of predictions for naive and
primed states (Figure 1F).
In addition to FBA, we used FVA to determine the range of feasible fluxes for
each reaction. Reactions that had either higher minimal flux or both higher
minimal and maximal flux compared to the second condition (naive or primed
state) were considered to have higher activity in that condition.
Software and Data Availability
The MATLAB implementation of the algorithm and associated datasets are
publicly available at the Synapse bioinformatics software repository (https://
www.synapse.org/; synapse ID: syn7253624). Examples and instructions for
running the analysis are also provided. The entire metabolomics data for naive,
primed, and Dlin28 cells are also provided as a supplemental dataset (Tables
S5 and S6). The optimization problem was solved using the Gurobi mathe-
matical programming solver.
SUPPLEMENTAL INFORMATION
Supplemental Information includes Supplemental Experimental Procedures,
two figures, and six tables and can be found with this article online at
https://doi.org/10.1016/j.celrep.2017.07.048.
AUTHOR CONTRIBUTIONS
J.Z. and S.C. conceived, designed, and performed research and wrote the
manuscript with input from G.Q.D. and J.J.C. S.C. performed all the computa-
tional analysis, and J.Z. conducted all the experimental assays with help from
Z.S., L.Z., and Y.-C.H. G.Q.D. and J.J.C. contributed to study design and su-
pervised the study. J.M.A. performedmetabolomics, and C.A.R. and H.L. per-
formed transcriptomics analysis.
ACKNOWLEDGMENTS
We thank Matthew G. Vander Heiden and Caroline Lewis for suggestions in in-
terpreting the metabolomics data and critical reading of the manuscript. We
thank Aswin Kannan for advice on implementing the optimization algorithm.
We thank Raze Therapeutics for providing MTHFD2 inhibitor MTH-1459 and
Nello Mainolfi for discussion. This work was supported by the Wyss Institute
and NIH grants (R01GM107536 and R24DK092760) to G.Q.D. and J.J.C.
Received: February 8, 2017
Revised: May 13, 2017
Accepted: July 18, 2017
Published: December 5, 2017
REFERENCES
Aguirre, A.J., Meyers, R.M., Weir, B.A., Vazquez, F., Zhang, C.-Z., Ben-David,
U., Cook, A., Ha, G., Harrington,W.F., Doshi, M.B., et al. (2016). Genomic copy
number dictates a gene-independent cell response toCRISPR/Cas9 targeting.
Cancer Discov. 6, 914–929.
Bao, X.R., Ong, S.-E., Goldberger, O., Peng, J., Sharma, R., Thompson, D.A.,
Vafai, S.B., Cox, A.G., Marutani, E., Ichinose, F., et al. (2016). Mitochondrial
dysfunction remodels one-carbon metabolism in human cells. eLife 5, e10575.
Bordbar, A., Monk, J.M., King, Z.A., and Palsson, B.O. (2014). Constraint-
based models predict metabolic and associated cellular functions. Nat. Rev.
Genet. 15, 107–120.
Boroviak, T., Loos, R., Lombard, P., Okahara, J., Behr, R., Sasaki, E., Nichols,
J., Smith, A., and Bertone, P. (2015). Lineage-specific profiling delineates the
emergence and progression of naive pluripotency in mammalian embryogen-
esis. Dev. Cell 35, 366–382.
Brons, I.G.M., Smithers, L.E., Trotter, M.W.B., Rugg-Gunn, P., Sun, B., Chuva
de Sousa Lopes, S.M., Howlett, S.K., Clarkson, A., Ahrlund-Richter, L., Peder-
sen, R.A., and Vallier, L. (2007). Derivation of pluripotent epiblast stem cells
from mammalian embryos. Nature 448, 191–195.
2976 Cell Reports 21, 2965–2977, December 5, 2017
Carey, B.W., Finley, L.W.S., Cross, J.R., Allis, C.D., and Thompson, C.B.
(2015). Intracellular a-ketoglutarate maintains the pluripotency of embryonic
stem cells. Nature 518, 413–416.
Cheung, H.W., Cowley, G.S., Weir, B.A., Boehm, J.S., Rusin, S., Scott, J.A.,
East, A., Ali, L.D., Lizotte, P.H., Wong, T.C., et al. (2011). Systematic investiga-
tion of genetic vulnerabilities across cancer cell lines reveals lineage-specific
dependencies in ovarian cancer. Proc. Natl. Acad. Sci. USA 108, 12372–
12377.
Cotten, C., and Reed, J.L. (2013). Mechanistic analysis of multi-omics data-
sets to generate kinetic parameters for constraint-based metabolic models.
BMC Bioinformatics 14, 32.
Duarte, N.C., Becker, S.A., Jamshidi, N., Thiele, I., Mo, M.L., Vo, T.D., Srivas,
R., and Palsson, B.Ø. (2007). Global reconstruction of the human metabolic
network based on genomic and bibliomic data. Proc. Natl. Acad. Sci. USA
104, 1777–1782.
Frezza, C., Zheng, L., Folger, O., Rajagopalan, K.N., MacKenzie, E.D., Jerby,
L., Micaroni, M., Chaneton, B., Adam, J., Hedley, A., et al. (2011). Haem oxy-
genase is synthetically lethal with the tumour suppressor fumarate hydratase.
Nature 477, 225–228.
Gafni, O., Weinberger, L., Mansour, A.A., Manor, Y.S., Chomsky, E., Ben-Yo-
sef, D., Kalma, Y., Viukov, S., Maza, I., Zviran, A., et al. (2013). Derivation of
novel human ground state naive pluripotent stem cells. Nature 504, 282–286.
Huang, K., Maruyama, T., and Fan, G. (2014). The naive state of human plurip-
otent stem cells: a synthesis of stem cell and preimplantation embryo tran-
scriptome analyses. Cell Stem Cell 15, 410–415.
Jain, M., Nilsson, R., Sharma, S., Madhusudhan, N., Kitami, T., Souza, A.L.,
Kafri, R., Kirschner, M.W., Clish, C.B., and Mootha, V.K. (2012). Metabolite
profiling identifies a key role for glycine in rapid cancer cell proliferation. Sci-
ence 336, 1040–1044.
Kleessen, S., Irgang, S., Klie, S., Giavalisco, P., and Nikoloski, Z. (2015). Inte-
gration of transcriptomics and metabolomics data specifies the metabolic
response of Chlamydomonas to rapamycin treatment. Plant J. 81, 822–835.
Locasale, J.W. (2013). Serine, glycine and one-carbon units: cancer meta-
bolism in full circle. Nat. Rev. Cancer 13, 572–583.
Mahadevan, R., and Schilling, C.H. (2003). The effects of alternate optimal
solutions in constraint-based genome-scale metabolic models. Metab. Eng.
5, 264–276.
Marcotte, R., Brown, K.R., Suarez, F., Sayad, A., Karamboulas, K., Krzyza-
nowski, P.M., Sircoulomb, F., Medrano, M., Fedyshyn, Y., Koh, J.L.Y., et al.
(2012). Essential gene profiles in breast, pancreatic, and ovarian cancer cells.
Cancer Discov. 2, 172–189.
Marks, H., Kalkan, T., Menafra, R., Denissov, S., Jones, K., Hofemeister, H.,
Nichols, J., Kranz, A., Stewart, A.F., Smith, A., and Stunnenberg, H.G.
(2012). The transcriptional and epigenomic foundations of ground state plurip-
otency. Cell 149, 590–604.
Nichols, J., and Smith, A. (2009). Naive and primed pluripotent states. Cell
Stem Cell 4, 487–492.
Orth, J.D., Thiele, I., and Palsson, B.Ø. (2010). What is flux balance analysis?
Nat. Biotechnol. 28, 245–248.
Peng, M., Yin, N., Chhangawala, S., Xu, K., Leslie, C.S., and Li, M.O. (2016).
Aerobic glycolysis promotes T helper 1 cell differentiation through an epige-
netic mechanism. Science 354, 481–484.
Piskounova, E., Agathocleous, M., Murphy, M.M., Hu, Z., Huddlestun, S.E.,
Zhao, Z., Leitch, A.M., Johnson, T.M., DeBerardinis, R.J., and Morrison, S.J.
(2015). Oxidative stress inhibits distant metastasis by human melanoma cells.
Nature 527, 186–191.
Ryall, J.G., Cliff, T., Dalton, S., and Sartorelli, V. (2015). Metabolic reprogram-
ming of stem cell epigenetics. Cell Stem Cell 17, 651–662.
Schmidt, B.J., Ebrahim, A., Metz, T.O., Adkins, J.N., Palsson, B.Ø., and Hy-
duke, D.R. (2013). GIM3E: condition-specific models of cellular metabolism
developed from metabolomics and expression data. Bioinformatics 29,
2900–2908.

Shiraki, N., Shiraki, Y., Tsuyama, T., Obata, F., Miura, M., Nagae, G., Abura-
tani, H., Kume, K., Endo, F., and Kume, S. (2014). Methionine metabolism reg-
ulates maintenance and differentiation of human pluripotent stem cells. Cell
Metab. 19, 780–794.
Shlomi, T., Cabili, M.N., Herrgard, M.J., Palsson, B.Ø., and Ruppin, E. (2008).
Network-based prediction of human tissue-specific metabolism. Nat. Bio-
technol. 26, 1003–1010.
Shyh-Chang, N., Locasale, J.W., Lyssiotis, C.A., Zheng, Y., Teo, R.Y., Ratana-
sirintrawoot, S., Zhang, J., Onder, T., Unternaehrer, J.J., Zhu, H., et al. (2013).
Influence of threonine metabolism on S-adenosylmethionine and histone
methylation. Science 339, 222–226.
Singh, R., Fouladi-Nashta, A.A., Li, D., Halliday, N., Barrett, D.A., and Sinclair,
K.D. (2006). Methotrexate induced differentiation in colon cancer cells is pri-
marily due to purine deprivation. J. Cell. Biochem. 99, 146–155.
Sperber, H., Mathieu, J., Wang, Y., Ferreccio, A., Hesson, J., Xu, Z., Fischer,
K.A., Devi, A., Detraux, D., Gu, H., et al. (2015). The metabolome regulates
the epigenetic landscape during naive-to-primed human embryonic stem
cell transition. Nat. Cell Biol. 17, 1523–1535.
Subramanian, A., Tamayo, P., Mootha, V.K., Mukherjee, S., Ebert, B.L., Gil-
lette, M.A., Paulovich, A., Pomeroy, S.L., Golub, T.R., Lander, E.S., and
Mesirov, J.P. (2005). Gene set enrichment analysis: a knowledge-based
approach for interpreting genome-wide expression profiles. Proc. Natl.
Acad. Sci. USA 102, 15545–15550.
Takashima, Y., Guo, G., Loos, R., Nichols, J., Ficz, G., Krueger, F., Oxley, D.,
Santos, F., Clarke, J., Mansfield, W., et al. (2014). Resetting transcription
factor control circuitry toward ground-state pluripotency in human. Cell 158,
1254–1269.
Tesar, P.J., Chenoweth, J.G., Brook, F.A., Davies, T.J., Evans, E.P., Mack,
D.L., Gardner, R.L., and McKay, R.D.G. (2007). New cell lines from mouse
epiblast share defining features with human embryonic stem cells. Nature
448, 196–199.
Theunissen, T.W., Powell, B.E., Wang, H., Mitalipova, M., Faddah, D.A.,
Reddy, J., Fan, Z.P., Maetzel, D., Ganz, K., Shi, L., et al. (2014). Systematic
identification of culture conditions for induction and maintenance of naive
human pluripotency. Cell Stem Cell 15, 471–487.
Uhlen, M., Fagerberg, L., Hallstrom, B.M., Lindskog, C., Oksvold, P., Mardino-
glu, A., Sivertsson, A., Kampf, C., Sjostedt, E., Asplund, A., et al. (2015). Pro-
teomics. Tissue-based map of the human proteome. Science 347, 1260419.
Viswanathan, S.R., and Daley, G.Q. (2010). Lin28: a microRNA regulator with a
macro role. Cell 140, 445–449.
Ware, C.B., Nelson, A.M., Mecham, B., Hesson, J., Zhou, W., Jonlin, E.C.,
Jimenez-Caliani, A.J., Deng, X., Cavanaugh, C., Cook, S., et al. (2014). Deriva-
tion of naive human embryonic stem cells. Proc. Natl. Acad. Sci. USA 111,
4484–4489.
Weinberger, L., Ayyash, M., Novershtern, N., and Hanna, J.H. (2016). Dynamic
stem cell states: naive to primed pluripotency in rodents and humans. Nat.
Rev. Mol. Cell Biol. 17, 155–169.
Xia, J., Sinelnikov, I.V., Han, B., and Wishart, D.S. (2015). MetaboAnalyst
3.0—making metabolomics more meaningful. Nucleic Acids Res. 43 (W1),
W251–W257.
Yang, Q., Liang, X., Sun, X., Zhang, L., Fu, X., Rogers, C.J., Berim, A., Zhang,
S., Wang, S., Wang, B., et al. (2016). AMPK/a-ketoglutarate axis dynamically
mediates DNA demethylation in the Prdm16 promoter and brown adipogene-
sis. Cell Metab. 24, 542–554.
Yizhak, K., Chaneton, B., Gottlieb, E., and Ruppin, E. (2015). Modeling cancer
metabolism on a genome scale. Mol. Syst. Biol. 11, 817.
Zhang, J., Nuebel, E., Daley, G.Q., Koehler, C.M., and Teitell, M.A. (2012).
Metabolic regulation in pluripotent stem cells during reprogramming and
self-renewal. Cell Stem Cell 11, 589–595.
Zhang, J., Ratanasirintrawoot, S., Chandrasekaran, S., Wu, Z., Ficarro, S.B.,
Yu, C., Ross, C.A., Cacchiarelli, D., Xia, Q., Seligson, M., et al. (2016). LIN28
regulates stem cell metabolism and conversion to primed pluripotency. Cell
Stem Cell 19, 66–80.
Zhou, W., Choi, M., Margineantu, D., Margaretha, L., Hesson, J., Cavanaugh,
C., Blau, C.A., Horwitz, M.S., Hockenbery, D., Ware, C., and Ruohola-Baker,
H. (2012). HIF1a induced switch from bivalent to exclusively glycolytic meta-
bolism during ESC-to-EpiSC/hESC transition. EMBO J. 31, 2103–2116.
Cell Reports 21, 2965–2977, December 5, 2017 2977