Comprehensive Health Impact Assessment
65
Comprehensive Health Impact Assessment: Clark County Bicycle and Pedestrian Master Plan Clark County Public Health December, 2010
Transcript of Comprehensive Health Impact Assessment

Comprehensive
Health Impact Assessment:
Clark County Bicycle and
Pedestrian Master Plan
Clark County Public Health
December, 2010

ACKNOWLEDGMENTS
This HIA was conducted by Clark County Public Health
with support from Active Living Research, a project of
the Robert Wood Johnson Foundation. Clark County
Public Health is grateful for a data donation from ESRI,
Inc. Research and analysis on bicycle and pedestrian
injuries and fatalities was contributed by Kendra Bunker,
MPH candidate at Oregon Health Sciences University.
PROJECT TEAM
Clark County Public Health
Alan Melnick, MD, MPH, CPH
Jonnie Hyde, PhD
Brendon Haggerty, MURP
Clark County Community Planning
Laurie Lebowsky, MURP
FOR FURTHER INFORMATION
Contact Clark County Public Health
Assessment and Evaluation:
(360) 397-8000 Ext. 7281
Related documents can be found at http://www.clark.wa.gov/public-health/reports/facts.html

2
CONTENTS
EXECUTIVE SUMMARY
SECTION I: LAYING A FOUNDATION
Introduction……………………………………………………………………………………………..
Purpose
Process
Meeting Practice Standards……………………………………………………………………...
Screening
Scoping
Assessment
Reporting
Dissemination
Pathways………………………………………………………………………………………………….
Research on Social Determinants of Health
Research on Health, Physical Activity, and the Built Environment
Economic Benefits of Promoting Physical Activity
Economic Costs of Obesity
SECTION II: ASSESSMENT
Baseline Conditions…………………………………………………………………………………..
Determinants
Built Environment
Outcomes
Impact of Proposed Actions……………………………………………………………………..
Projects
Policies
Programs
Process
SECTION III: RECOMMENDATIONS
Recommendations……………………………………………………………………………………
Overarching
Projects
Policies
Programs
APPENDICES
A. Maps
B. Methods
C. Summary of Evidence
i
1
1
2
7
15
15
31
45
45
59

Executive Summary
Purpose
This Comprehensive Health Impact Assessment (HIA) was undertaken by Clark County Public
Health to identify the nature of health impacts associated with the Clark County Bicycle and Pedes-
trian Master Plan and to recommend implementation strategies. The plan identifies priority pro-
jects, policies, and programs to facilitate cycling and walking, and was adopted in November 2010.
This HIA builds on an earlier Rapid HIA (May 2010) that made recommendations on ways to priori-
tize projects, policies, and programs to maximize health benefits for all county residents. This
assessment examines the likely impacts of the master plan based on prioritized proposals.
Where we live, work, learn, and play shapes our health. The built environment interacts with so-
cial conditions to produce both positive and negative effects on health, and we can influence these
effects by proactively planning for health. The Clark County Pedestrian and Bicycle Master Plan
contains proposals that can provide additional opportunities for active lifestyles. Implementing
the plan in a way that increases the number of residents engaging in these forms of physical activ-
ity will promote health and reduce disparities.
Research demonstrates many relationships between the built environment and health. For in-
stance, lack of access to healthy food and physical inactivity are the primary factors contributing to
increasing rates of obesity among children and adults, which in turn lead to a higher prevalence of
many chronic diseases. Characteristics of the built environment that are associated with physical
activity include the presence of sidewalks and bikeways, parks, street network density, residential
density, land use mix, and urban design. Bicycle and pedestrian infrastructure improvements are
associated with more adults and children meeting physical activity recommendations through
both leisure and transportation-related physical activity. In addition, residents of traditional, walk-
able neighborhoods get more physical activity than residents of typical suburban developments.
The graphic below is an example illustration of the pathway by which the built environment influ-
ences chronic disease.
The Built Environment and Health
Pathway from the built environment to chronic disease
i EXECUTIVE SUMMARY
Lack of opportunity
for physical activity
Lack of access to
healthy food
Overweight &
Obesity
Related Chronic Diseases:
Heart disease
Diabetes
Cancer
Hypertension
Dyslipidemia
Stroke
Liver & Gallbladder disease
Respiratory problems
Degenerative arthritis
Built
Environment
Barriers
Lack of opportunity
for physical activity
Lack of access to
healthy food
Overweight &
Obesity
Related Chronic Diseases:
Heart disease
Diabetes
Cancer
Hypertension
Dyslipidemia
Stroke
Liver & Gallbladder disease
Respiratory problems
Degenerative arthritis
Built
Environment
Barriers
HIA: Clark County Bicycle & Pedestrian Master Plan Clark County Public Health 2010

2
In 2008, a national study estimated the annual medical cost of obesity at $147 billion. Obesity
accounts for 9.1% of annual medical spending in the United States, rivaling the amount spent due
to tobacco-related health problems. The same study found that the average annual medical
spending for obese people (BMI >30) was 42% more than for healthy weight people. On average,
a person who was obese had $1,429 additional medical costs per year. Using this estimate and
current obesity rates, the annual cost in Clark County is $110.9 million.
In this HIA, Clark County Public Health examined existing conditions relating to social determinants
of health, the built environment, and health outcomes. In combination with other local reports on
community health, such as the Community Assessment, Planning, and Evaluation report, this as-
sessment helps to identify areas of potential and areas of need within the county. We looked for
neighborhoods where overlapping conditions result in locations where bicycle and pedestrian im-
provements would result in the most opportunity for physical activity. As discussed in the Rapid
HIA, many block groups south of the I-5/ I-205 junction, west of 182nd Avenue, and north of Van-
couver city limits have either high infrastructure needs or high potential for active travel.
The table below summarizes key findings of the baseline assessment, and mapped examples of
built environment characteristics can be found on the following page. The walkability index map
reflects a composite of four measures: land use mix, density, urban design, and street connectivity.
The adjacent map represents the area within walking distance of grocery stores and supermarkets.
Measures of food access aid our understanding of risk for obesity by addressing the influence of
the built environment on nutrition and diet.
The Costs of Obesity
Baseline Assessment
Key Findings
Social Determinants • Lower socioeconomic status (SES) residents fare worse by most
measures of health.
• The lowest income block groups are located mostly within the
Vancouver Urban Growth Area (UGA).
Built Environment • The most walkable and bikeable areas of the county are in the
Vancouver UGA.
• About 15% of county residents live within ½ mile walking distance of a
grocery store or supermarket.
• About 42% of county residents live within ½ mile of a fast food
restaurant or convenience store.
• About 44% of county residents live within ½ mile walking distance of a
park.
Health Outcomes • The difference between the zip code with the highest life expectancy
and that with the lowest life expectancy is about 6 years.
• In 2008, 64% of Clark County adults and 23% of tenth graders were
overweight or obese.
• The percent of adults who are overweight or obese ranges from 51% to
74% by zip code.
ii EXECUTIVE SUMMARY
HIA: Clark County Bicycle & Pedestrian Master Plan Clark County Public Health 2010

3
Public Health finds that the projects, policies, and programs in the Bicycle and Pedestrian Master
Plan will positively impact health by increasing opportunities for physical activity. Impacts of pro-
jects are listed in the table below.
Walkability Index
(quintiles)
Lowest
Highest
Highways ¯0 5 102.5Miles
0 5 102.5Miles
1/2 mile walking distance
1 mile walking distance
Highways
Major Roads ¯
Impact Assessment
Potential Magnitude
Facility Type
Impact on
Physical
Activity
Strength of
Evidence
Residential
Population
Served
School
Population
Served
Parks
Population
Served
Neighborhood
Services Popula-
tion Served
Bikeways Positive Moderate 31,073 22,876 11,338 12,376
Restriping Positive Moderate 17,242 15,078 8,413 4,966
Trails Positive Strong 62,540 31,652 21,241 13,348
Sidewalks Positive Moderate 4,655 3,973 1,909 2,401
All Projects Positive Moderate 94,969 53,805 33,428 28,797
Walkability Index
by Block Group, 2009
Walking distance to grocery
stores and supermarkets, 2009
iii EXECUTIVE SUMMARY
HIA: Clark County Bicycle & Pedestrian Master Plan Clark County Public Health 2010

4
Priority Sidewalks
Priority Trails
Priority Bikeways
Major Roads
Service Areas
Incorporated Areas ¯0 5 102.5Miles
Block Group
Median Income
Percent of
Proposed Sidewalk
Miles
Percent of
Proposed Bikeway
Miles
Lowest 1/3 51% 45%
Middle 1/3 17% 25%
Highest 1/3 32% 30%
The populations listed in the table on the pre-
ceding page are served by the proposed pro-
jects mapped at left.
Lower income groups have higher risk for
obesity and chronic disease. As shown in the
table below, proposed bikeway and sidewalk
projects are found disproportionately in
lower income neighborhoods. This is consis-
tent with project selection criteria, which in-
cluded neighborhood socioeconomic status.
Given the higher risk in these neighborhoods,
this plan will likely improve health for those
most in need.
Recommendations
Based on the assessment portion of this HIA, Public Health developed the following
recommendations for implementing and updating the bicycle and pedestrian master plan.
Overarching Recommendations
1. Update the plan in five years.
2. Use data to prioritize projects and track
progress.
3. Plan and provide for the needs of a
continuum of users and trip types.
Policy Recommendations
6. Ensure full implementation of policies.
7. Target zero pedestrian and bicycle
crashes.
8. Use crash data in prioritization criteria.
9. Prioritize improvements in low
socioeconomic status neighborhoods.
iv EXECUTIVE SUMMARY
Project Recommendations
4. Use innovative designs and a variety of
facility types.
5. Create a comprehensive inventory of
sidewalks.
Program Recommendations
10. Develop criteria for selecting
programs.
11. Use proven approaches in schools
programs.
HIA: Clark County Bicycle & Pedestrian Master Plan Clark County Public Health 2010

Purpose
This HIA was undertaken by Clark County Public Health (CCPH) to
identify the nature of health impacts associated with the Clark
County Bicycle and Pedestrian Master Plan (adopted November,
2010) and to recommend management strategies. CCPH exam-
ined not only whether there will be positive impacts on health,
but also how elements of the plan could be prioritized in order
to maximize health benefits.
There are three types of proposals contained in the plan: pro-
jects, programs, and policies. Projects include physical infra-
structure for cycling and walking such as sidewalks and bike
lanes. Programs are efforts to increase cycling and walking
through encouragement, marketing, and promotion. Policies are
broad decisions aimed at improving underlying conditions for
walking and cycling. The likely health impacts of these three pro-
posal types are analyzed in this HIA, with an additional discussion
of the planning process used to develop each.
HIA Process
This HIA was funded by the Robert Wood Johnson Foundation
through a grant with four specific aims (see left). The Rapid HIA
was issued in May, 2010 with the intent of identifying likely
health impacts and providing input on the draft plan. Whereas
the Rapid HIA was somewhat speculative in nature and ad-
dressed some proposals that were in early stages of develop-
ment, this document is a more in-depth analysis that focuses on
the plan as adopted (for a discussion of the planning process, see
page 48).
The process of conducting this HIA involved many partners. The
core team included staff from CCPH and Clark County Commu-
nity Planning (Community Planning). Valuable contributions
were welcomed from staff from Clark County departments of
Public Health, Community Planning, and Public Works, as well as
the Sheriff’s office and the region’s Metropolitan Planning Or-
ganization. A local not-for-profit health equity organization,
SECTION 1: LAYING A FOUNDATION
Introduction
Health Impact
Assessment (HIA) is a
combination of
procedures, methods,
and tools used to
evaluate the potential
health effects of a policy,
program, or project. - World Health Organization
Specific Aims:
1. Conduct Rapid HIA
2. Conduct Comprehensive
HIA
3. Evaluate effects of HIA
recommendations
4. Explore decision-making
process
SECTION 1: LAYING A FOUNDATION 1

2
Community Choices, provided technical review to ensure that
the research was relevant to and reflective of community needs.
A county-sponsored Bicycle and Pedestrian Technical Advisory
Committee developed the plan and provided extensive input on
the HIA. Additionally, other organizations informally reviewed
both the plan and HIA, enhancing the document through their
feedback. These included the Friends of Clark County Active
Transportation Committee and a regional network of HIA practi-
tioners.
Findings from the HIA were formally presented to the county’s
Public Health Advisory Council, Planning Commission, and Board
of Health/Board of County Commissioners (two entities with the
same membership). The Public Health Advisory Council re-
viewed the plan and suggested further research questions. The
Planning Commission reviewed the plan, made recommenda-
tions for changes where needed, and eventually endorsed it for
adoption by the Board of County Commissioners. The board of
County Commissioners adopted the plan, which will be incorpo-
rated into the 2014 County Comprehensive Growth Manage-
ment Plan Update.
It is the intention of Clark County Public Health to advance the
practice of HIA while producing a useful tool for policy evalua-
tion. In the interest of this goal, CCPH consulted Practice Stan-
dards for Health Impact Assessment (North American HIA Prac-
tice Standards Working Group, 2009), which provide guidance on
best practices and offer a metric for comparison to other HIAs.
In accordance with these standards and in the interest of trans-
parency, a description of the HIA process is detailed below.
Screening
At the onset of the planning process for the Bicycle and Pedes-
trian Master Plan, CCPH was invited by Community Planning to
conduct an HIA on the plan. In the interest of building capacity
for HIAs and to maximize the health benefits of the plan, CCPH
accepted this invitation. In this sense, the screening decision
was somewhat opportunistic. Pursuant to the grant awarded by
Active Living Research, this HIA is meant to identify “highest
value implementation strategies” for increasing physical activity
in the county. The HIA considers both whether to adopt the
plan, as well as how and where to prioritize projects.
Meeting practice standards
SECTION 1: LAYING A FOUNDATION
HIA: Clark County Bicycle & Pedestrian Master Plan Clark County Public Health 2010
2

3
Scoping
Decision & Alternatives
The primary decision assessed by this HIA is whether to adopt
the Bicycle and Pedestrian Master Plan. The decision makers
include the county Planning Commission and the Board of
County Commissioners. As the adoption decision is a yes/no de-
cision, the only considered alternative is a no-build option. A
subset of decisions made by committee during the development
of the plan determined the prioritization scheme used to select
near-term projects. This prioritization scheme is analyzed in ad-
dition the decision of whether to adopt the plan.
Potential impacts
Physical activity is the focus of the HIA. Lack of physical activity
is a cause of obesity, which in turn leads to various chronic ill-
nesses resulting in premature death. The influence of the built
environment on this trend is the primary impact considered in
the HIA. Other impacts are considered to a more limited extent,
including potential impacts on access to food and injuries & fa-
talities.
Boundaries of Analysis
Whereas the baseline assessment covers the entire county, the
assessment of impacts is limited to the unincorporated areas of
Clark County for the 20-year period ending in 2030. The plan is
divided into near-term and long-term proposals, with implemen-
tation of near-term proposals expected within roughly 6 years.
Long-term proposals have no definite implementation strategies
and were not prioritized in the plan, therefore they were not
analyzed in the HIA. This effectively limits the time horizon of
the HIA to 6 years. The entire population of the county is consid-
ered in the analysis, with special attention given to low socioeco-
nomic status (SES) populations and youth due to documented
health disparities.
Research & Data Gaps
Existing data is used in the analysis, including county assessor’s
parcel data, roadway networks, and census data. A donation of
updated census estimates from ESRI, Inc. enables us to use 2009
figures for many variables. Health data come from the Healthy
Youth Survey (HYS), Behavioral Risk Factor Surveillance System
(BRFSS), and Kaiser Permanente (KP) electronic health records as
mapped by Portland State University. HYS data include variables
SECTION 1: LAYING A FOUNDATION
HIA: Clark County Bicycle & Pedestrian Master Plan Clark County Public Health 2010

4
on youth physical activity and nutrition. KP provided data on
member obesity rates. Additional description of data sets can be
found in Appendix B.
As recommended by the Practice Standards, it is important to
acknowledge data gaps in order to increase transparency and aid
interpretation of our findings.
Notable gaps in available data include:
• Qualitative data on existing bicycle and pedestrian infrastruc-
ture
• Comprehensive inventory of pedestrian facilities
• Local health data (morbidity/mortality) linked to built envi-
ronment data
• Data on most types of morbidity by neighborhood
• Data on physical activity by neighborhood
• Data on racial/ethnic disparities (due to small numbers)
Roles
The Bicycle and Pedestrian Advisory Committee determined key
elements of the plan, including the vision, goals, and project se-
lection criteria. The Planning Commission decided whether to
recommend the plan for adoption, with the final adoption deci-
sion belonging to the Board of County Commissioners. CCPH led
the HIA, with support from Community Planning. Additionally,
technical support was provided by the county Assessor & GIS of-
fice. The community non-profit Community Choices acted as a
reviewer with the specific task of ensuring that research is rele-
vant to community needs and policy goals.
Standards
The HIA is based on relationships identified in peer-reviewed lit-
erature. The direction of the change in health outcomes is based
on a research literature review, and magnitude of change was
determined based on GIS analysis. We use the Center for Dis-
ease Control and Prevention definition of and recommendations
on physical activity.
We recognize that research on the connections between physical
activity and the built environment is still being developed and
there is statistical uncertainty surrounding the causal nature of
the relationship. Most of the studies available, including those
relied upon for this HIA, are cross sectional in design (Brownson,
2009; TRB & IOM, 2005). To reflect the varying levels of cer-
tainty, associations that are supported by theory and by multiple
SECTION 1: LAYING A FOUNDATION
HIA: Clark County Bicycle & Pedestrian Master Plan Clark County Public Health 2010

5
studies with similar outcomes are classified as having the strong-
est evidence. Evidence coming from a smaller body of published
research is categorized as “moderate”. For many proposals,
there is emerging evidence or examples of successful implemen-
tation. These cases are labeled “some evidence”.
Where evidence is lacking, assessment is based instead on case
studies, best practices, and theory. We categorize such findings
as “limited”. Table 1 provides a summary of this system of cate-
gorizing evidence, which is used to evaluate polices and pro-
grams in Section II.
Table 1. Strength of evidence
Due to lack of data and limitations of pedestrian and bicycle de-
mand forecasting, magnitudes of impact are very rough esti-
mates. For projects, they are based on the population served
within a certain distance of facilities. These distances are based
on the Dill study of cyclist behavior using GPS devices (2009).
Further discussion of methods can be found in Appendix B.
Additionally, disparities based on socioeconomic status, race/
ethnicity, and age are reported when apparent.
Review & Dissemination
As noted above, Community Choices provided review of the
products and process, and will also help in dissemination. In ad-
dition, the regional network of HIA practitioners was consulted
during the process and will provide feedback. This network in-
cludes public health experts from public agencies, non-profit or-
ganizations, health care organizations, and academia. The HIA
will be posted on the county’s website and distributed through
committees and public outreach events. Also, through the par-
ticipation of community groups such as the Community Choices
Health Equity Coalition and the Friends of Clark County Active
Category Description
+ Limited evidence: Few case studies, theoreti-
cally supported.
++ Some evidence: Limited research, some case
studies.
+++ Moderate evidence: Rigorous, peer reviewed
research.
++++ Strong evidence: Multiple rigorous, peer re-
viewed research studies with similar findings.
Facility Service Areas
Sidewalks: 500 ft.
Bike lanes: 1/4 mile
Off-street paths: ~ 1/2 mile
SECTION 1: LAYING A FOUNDATION
HIA: Clark County Bicycle & Pedestrian Master Plan Clark County Public Health 2010

6
Transportation Committee, the HIA will be shared among many
community groups.
Assessment
The assessment portion of this HIA includes baseline conditions,
identification of health impacts, and recommended strategies for
implementing and updating the plan. Baseline conditions are
reported for the county population as a whole as well as for vul-
nerable sub-populations. Limitations, gaps in data, and uncer-
tainties are made explicit (see Appendix B). Assessment of pro-
ject impacts is based on GIS analysis combined with relationships
established in research literature. Recommendations are based
on the findings from assessment and on the best available evi-
dence from research literature.
Reporting
This report and executive summary constitute the primary re-
porting activity related to this HIA. The report includes a sum-
mary of findings and discussion of evidence for the identified
health impacts.
Monitoring
A unique feature of this HIA is the grant funding provided to en-
gage in monitoring and evaluation. Following the release of this
report, CCPH will study the impact of health information on the
final plan and on the decision making process. Monitoring of
health outcomes and changes in the determinants of health will
take place through routine assessments conducted by CCPH,
most notably through the Community Assessment Planning, and
Evaluation (CAPE) report.
SECTION 1: LAYING A FOUNDATION
HIA: Clark County Bicycle & Pedestrian Master Plan Clark County Public Health 2010

7
The central goal of this HIA is to make explicit the relationship
between health and the built environment. A better under-
standing of this relationship informs decision-making processes
by raising issues that would otherwise not receive attention and
by articulating the trade-offs involved. It also provides a factual
basis to justify some of the proposals in the plan. Accordingly,
research on the pathways from social context and the built envi-
ronment to health is summarized below. In response to requests
from planners and community members, research relating to the
economic costs of obesity and economic benefits of physical ac-
tivity is also included.
Research on Social Determinants of Health
The term “social determinants of health” refers to what some
call “the causes of the causes”. This approach recognizes the
fact that health starts not in a doctor’s office, but where we live,
work, learn, and play. Therefore, the conditions in which we live
have a powerful influence on our overall health. Disparities in
these conditions lead to avoidable differences in health out-
comes based on such factors as socioeconomic status, educa-
tion, race, ethnicity, gender, and geographic location (Marmot,
2005; Adler, 2008).
Among the strongest predictors of overall health is socio-
economic status (SES). Research shows that across the entire
range of income, better health is associated with higher income
(Adler and Newman, 2002). Additionally, our surroundings have
an impact on our health, and neighborhood measures of depri-
vation, such as neighborhood median income, are associated
with worse health outcomes (Pickett and Pearl, 2001), which has
led public health experts to point out that “our zip code may be
more important to our health than our genetic
code” (Commission to Build a Healthier America, 2009).
Research on Health, Physical Activity, and the Built Envi-
ronment
Obesity: Trends and Causes
Nationwide, overweight and obesity are among the top three
preventable causes of death, and a 2004 study estimated that
obesity and inactivity will soon overtake tobacco as the leading
cause of death (Mohad, et al, 2004; Dinaei et al, 2009). Obesity
“Our zip code may be
more important to our
health than our genetic
code” - Commission to Build a
Healthier America
Pathways
SECTION 1: LAYING A FOUNDATION
HIA: Clark County Bicycle & Pedestrian Master Plan Clark County Public Health 2010

8
is like tobacco in that it is a key contributor to many chronic dis-
eases; however, it is a more challenging health threat because
obesity itself is caused by multiple and complex factors, with
poor nutrition and physical inactivity widely acknowledged as
primary (TRB & IOM, 2005). Physical activity and diet are in turn
influenced by numerous factors at many levels. CCPH recognizes
these multi-level influences on individuals as articulated by the
socio-ecological model of health. The socio-ecological model
emphasizes that barriers and opportunities for physical activity
and healthful diets may affect people on many levels.
Pathway
While there are many social determinants of health, such as so-
cioeconomic status and race/ethnicity, the built environment
can also influence health. Food access and physical activity are
the primary factors contributing to increasing rates of obesity
among children and adults, which in turn leads to a higher preva-
lence of many chronic diseases. Among all age groups, over-
weight and obesity lead to chronic diseases such as heart dis-
ease, diabetes, and cancer.
This theoretical causal pathway is illustrated below in figure 1.
Barriers & Opportunities for Physical Activity
Built environments that provide opportunities for physical activ-
ity lower the risk for obesity. Measures of the built environment
that are correlated with physical activity include presence of bi-
cycle and pedestrian infrastructure, parks, street network den-
sity, residential density, land use mix, and urban design (Sallis, et
al, 2009; Saelens and Handy, 2008; Saelens, Sallis, and Frank,
2003). Bicycle and pedestrian facilities are associated with more
Figure 1. Pathway from the built environment to chronic disease
Public Policy
Community
Organizational
Interpersonal
Individual
Public PolicyPublic Policy
Community
OrganizationalOrganizational
Interpersonal
Individual
Socio-ecological Model of Health
Adapted from: Kendrick, S; Inman, K; Hoskins
S. Clark County Public Health, 2010
SECTION 1: LAYING A FOUNDATION
HIA: Clark County Bicycle & Pedestrian Master Plan Clark County Public Health 2010
Lack of opportunity
for physical activity
Lack of access to
healthy food
Overweight &
Obesity
Related Chronic Diseases:
Heart disease
Diabetes
Cancer
Hypertension
Dyslipidemia
Stroke
Liver & Gallbladder disease
Respiratory problems
Degenerative arthritis
Built
Environment
Barriers
Lack of opportunity
for physical activity
Lack of access to
healthy food
Overweight &
Obesity
Related Chronic Diseases:
Heart disease
Diabetes
Cancer
Hypertension
Dyslipidemia
Stroke
Liver & Gallbladder disease
Respiratory problems
Degenerative arthritis
Built
Environment
Barriers

9
adults and children meeting physical activity recommendations
through both leisure and transportation-related physical activity
(Owen et al, 2004; Dill, 2009; Pucher, Dill, and Handy, 2010).
Residents of traditional (pre-WWII), walkable neighborhoods get
more physical activity (Sallis et al, 2009). A recent study of
neighborhoods in Seattle and Baltimore found that even among
high–income neighborhoods, there are differences in physical
activity. In high-income, low-walkable neighborhoods, residents
had about a 50% increased risk for obesity compared to high-
income, walkable neighborhoods (Sallis et al, 2009). These stud-
ies demonstrate a clear and convincing association between the
built environment and physical activity, but certain aspects of
the built environment warrant additional explanation.
The literature identifies two types of cycling and walking. The
first is leisure, also known as recreational or non-derived de-
mand travel. This type of walking and cycling is done simply for
the sake of the activity, and has the strongest associations with
the proximity, quantity, and quality of recreational facilities
(Brownson et al, 2009). The second type of cycling and walking
is for travel, also known as utilitarian travel or active transporta-
tion. This type of activity is a means to some ends, such as com-
muting to work, and is likely influenced by route directness,
proximity of destinations, and cycling and walking facilities
(Brownson et al, 2009; Dill, 2009; Sallis et al, 2009).
The influence of the design of buildings and streetscapes is
somewhat difficult to measure, although several studies link cer-
tain characteristics of design to walkability and physical activity.
Ewing et al (2006) outline a conceptual framework that associ-
ates physical, quantitative design features with walking behavior,
as well as more qualitative characteristics. The measurable
physical features include sidewalk width, street width, traffic vol-
umes, tree canopy, building height, number of people present,
and weather. The more qualitative, subjective measures include
Imageability The quality that makes a place recognizable and distinct
Enclosure The degree to which streets and spaces are defined by buildings, trees, and other ele-
ments
Human Scale The size, texture, and articulation of physical elements that match the size and propor-
tions of humans and match the speed at which humans walk
Transparency The degree to which people can see or perceive what lies beyond the edge of a space,
especially the degree to which they can see other human activity
Complexity The visual richness of a place, defined by variety in the physical environment
Table 2. Urban Design Measures of Walkability
Built environment determi-
nants of physical activity:
• Connectivity
• Density
• Urban Design
• Land Use Mix
• Sidewalks
• Bikeways
• Access
SECTION 1: LAYING A FOUNDATION
HIA: Clark County Bicycle & Pedestrian Master Plan Clark County Public Health 2010

10
concepts described in table 2. Whereas these measures are as-
sociated with physical activity, they require intensive data collec-
tion to be useful for assessment.
Access to parks is associated with physical activity. In one study
of adults, this has been measured in terms of perception; adults
who perceive that they have access to parks are almost twice as
likely to meet physical activity recommendations (Brownson,
2001). Among children, the actual number and size of parks cor-
relates with increased physical activity. For example, one study
found that for each 1 percent increase in park area within a com-
munity, there was a 1.4 percent increase in physical activity
(Roemmich et al, 2006). The strongest link between this type of
research and the Clark County Bicycle and Pedestrian Master
Plan relates to the use of parks for active transportation, specifi-
cally trails. Living near a trail is associated with a 50% increase in
the likelihood of meeting physical activity recommendations
(Huston et al, 2003; Pierce et al, 2006).
Auto-dependent development reinforces sedentary lifestyles. In
a study of counties across the United States, researchers found
that residents of the most sprawling counties walk less, weigh
more, and have a greater prevalence of hypertension than their
counterparts in denser counties (Ewing, et al. 2003). Each addi-
tional hour per day spent in a car increases the odds of obesity
by 6%, while each additional kilometer walked results in about a
5% reduction in the odds (Frank, Andreson, & Schmidt, 2004).
Safety
Real and perceived danger to pedestrians and bicyclists from
traffic crashes can deter individuals from choosing non-
motorized methods of transport. Over the past decade, re-
search has more closely examined features of our built environ-
ments that may increase risk of pedestrian and bicyclist injury.
Some approaches have looked at area characteristics on the cen-
sus tract level, finding that traffic volume, arterial streets with-
out transit, land area, land use, and population characteristics
(socioeconomic and demographic factors) were all significant
predictors of pedestrian injury (Wier et al., 2009). Additionally,
studies have found that crash risk is higher around schools, and
risk in this area is further increased among non-white popula-
tions (Abdel-Aty, Chundi, and Lee, 2007; Clifton and Kreamer-
Fult, 2007; Campos-Outcalt et al., 2002). Other studies have
SECTION 1: LAYING A FOUNDATION
HIA: Clark County Bicycle & Pedestrian Master Plan Clark County Public Health 2010
Automobile trips that can
be safely replaced by
walking or bicycling offer
the first target for
increased physical activity
in communities.
- Dr. Jeffrey Koplan and
Dr.William Dietz, Centers for
Disease Control and Prevention

11
looked at even smaller geographical areas; an examination of
traffic corridors in King County, Washington found that increased
usage of transit stops is associated with more pedestrian-motor
vehicle collisions (Hess, Vernez Moudon, and Matlick, 2004),
while an analysis of pedestrian crash points in New Zealand
found significant associations between both traffic volume and
curb parking in relation to pedestrian-motor vehicle collisions
(Roberts et al., 1995). While these are not measures of risk be-
cause of differences in the level of pedestrian and motor vehicle
exposure, they are indicative of environmental attributes that
may promote or dissuade individuals from walking.
Strength of Research
Research on the relationship between the built environment and
physical activity, while still relatively new, is moving toward con-
sensus. In a joint report in 2005, the Transportation Research
Board and Institute of Medicine pointed out that while the
causal relationship between physical activity and health is well
established, research on the built environment and physical ac-
tivity, which deals with more variables, does not show causal
relationships with certainty. However, since 2005, the literature
has grown rapidly and there are many studies supporting the as-
sociation of built environment characteristics with physical activ-
ity. Such evidence remains largely cross-sectional and further
investigation is needed to resolve uncertainty about both the
degree of causation and the about which environmental charac-
teristics are the most important factors in this relationship. Nev-
ertheless, the associations between the built environment and
physical activity are strong enough to compel action and guide
public policy (Brownson et al, 2009). The research summarized
in this document reflects the growing consensus and current
findings on the relationship between the built environment and
physical activity.
A consistent feature of the research on the built environment
and physical activity is the prominent influence of characteristics
outside of the obvious infrastructure associated with cycling and
walking. While sidewalks and bicycle facilities are undeniably
crucial investments, many of the strongest associations between
the built environment and physical activity are broader structural
issues best addressed through policies that are beyond the scope
of the Clark County Bicycle and Pedestrian Master Plan. As rec-
ommended in the Rapid HIA, research encourages consideration
of these additional factors, such as street network density and
Associations between
the built environment
and physical activity are
strong enough to
compel action and guide
public policy.
SECTION 1: LAYING A FOUNDATION
HIA: Clark County Bicycle & Pedestrian Master Plan Clark County Public Health 2010

12
land use patterns, when planning for the future of walking and
cycling in the county.
Economic Benefits of Promoting Physical Activity
Most of the benefits of physical activity lie in the prevention of
chronic disease. Put another way, the economic benefit of
physical activity is avoidance of costs related to treating chronic
disease. Some cost benefit studies of bicycle facilities are
plagued with problems, often relating to the measurement of
benefits. Measuring the value of health improvements resulting
from bicycle and pedestrian facilities is therefore somewhat un-
reliable (Krizek, 2007). However, several studies have been suc-
cessful in demonstrating the value of bicycle and pedestrian fa-
cilities. In one study using interviews of trail users and actual
trail construction costs in Lincoln, Nebraska, researchers esti-
mated that for every one dollar invested in trails, about three
dollars is saved in direct medical costs (Wang et al, 2004).
Economic Costs of Obesity
Although the costs of obesity are multiple and difficult to meas-
ure thoroughly, there are several rigorous estimates that quan-
tify the costs of obesity. Note that these estimates refer only to
measurable direct medical costs. In 2008, the direct cost of obe-
sity nationwide was estimated at $147 billion (Finkelstein, 2009).
Obesity accounts for 9.1% of annual medical spending in the US,
rivaling the amount spent due to tobacco. The same national
study found that the average difference in medical spending be-
tween healthy weight and obese people was $1429 annually.
This difference amounts to 42% more spending than healthy
weight people (Finkelstein, 2009). Using this estimate, the an-
nual cost in Clark County is $110.9 million. Finkelstein estimates
the annual per-capita cost to each US taxpayer at about $180,
paid through Medicare and Medicaid benefits directly attribut-
able to obesity. As Finkelstein put it, “Medicare and Medicaid
spending would be spending 8.5 and 11.8 percent lower, respec-
tively, in the absence of obesity.” The Clark County share of this
burden is $37.7 million annually.
The costs discussed above refer only to direct medical costs, and
only a part of these costs is attributable to physical inactivity.
However, given the influential role of physical inactivity as cause
of obesity, even a small increase in physical activity could result
in millions of dollars in savings, especially when savings are mul-
Estimated excess annual
medical spending in Clark
County due to obesity:
$110.9 million
Estimated annual
Medicare and Medicaid
tax burden in Clark
County due to obesity:
$37.7 million
SECTION 1: LAYING A FOUNDATION
HIA: Clark County Bicycle & Pedestrian Master Plan Clark County Public Health 2010
For every $1 invested in
trails, about $3 is saved
in direct medical costs.

13
tiplied over a lifetime. With only 44% of Clark County tenth
graders meeting physical activity recommendations (Clark
County Public Health, 2010), the cost of physical inactivity will
likely continue to rise.
In addition to these costs, there are profound impacts that are
less measurable in monetary costs. Multiple studies demonstrate
a decrease in both the length and quality of life associated with
obesity (Olshansky et al, 2005). One study found that obesity
results in a shortened lifespan of 5 to 20 years (Fontaine et al.,
2003). Another found that obesity resulted in 4 fewer quality
adjusted life years for men and 7 fewer for women (Muennig,
2006). These findings point to the cost of obesity that is perhaps
the most difficult to quantify: “today’s youth may be the first
generation in American history to live shorter, less healthy lives
than their parents” (Levi, et al, 2010). Clearly the cost of obesity
is massive, and the full benefits of prevention are realized over
lifetimes and generations.
SECTION 1: LAYING A FOUNDATION
HIA: Clark County Bicycle & Pedestrian Master Plan Clark County Public Health 2010

14
References for Section 1 Abdel-Aty M., Chundi S.S., & Lee C. (2007). Geo-spatial and log-linear
analysis of pedestrian and bicyclist crashes involving school-aged
children. Journal of Safety Research, 38(5), 571-9
Adler N. & Newman K. (2002) Socioeconomic disparities in health: Pathways
and policies. Health Affairs, 2(21), 60-76
Adler N.E. & Rehkopf D.H. (2008) U.S. Disparities in health: Descriptions,
causes, and mechanisms. Annual Review of Public Health, (29), 235-52
Brownson R., Baker E., Housemann L, et al. (2001). Environmental and
policy determinants of physical activity in the United States. American
Journal of Public Health, 91(12), 1995-2003
Brownson R.C., Hoehner C.M., Day K., Forsyth A., & Sallis J.F. (2009) Meas-
uring the built environment for physical activity. American Journal of
Preventive Medicine, 36 (4 Suppl), S99-123
Campos-Outcalt, D, Bay, C, Dellapenna A, Cota MK (2002). Pedestrian
fatalities by race/ethnicity in Arizona, 1990-1996. American Journal
of Preventive Medicine. 23(2), 129-135
Clark County Public Health (2010). Community Assessment, Planning and
Evaluation Report. Vancouver, WA: Clark County Public Health
Clifton K.J., & Kreamer-Fult K. (2007). An examination of the environmental
attributes associated with pedestrian-vehicular crashes near public
schools. Accident Analysis & Prevention. 39(4):708-15
Commission to Build a Healthier America. (2009). Breaking Through on the
Social Determinants of Health and Health Disparities. Retrieved from
http://www.rwjf.org/pr/product.jsp?id=53235
Dill, J. (2009). Bicycling for transportation and health: the role of infrastruc-
ture. Journal of Public Health Policy, 30, S95-S110
Dinaei G., Ding E.L., Mozaffarian D., Taylor B., et al. (2009) The preventable
causes of death in the United States: Comparative risk assessment of
dietary, lifestyle, and metabolic risk factors. PLoS Med 6(4): e1000058.
doi:10.1371/journal.pmed.1000058
ESRI, Inc. (2009) Demographic Update 2009/2014. [Data files]
Ewing R., Handy S., Brownson R.C., Clemete O., & Winston E.(2006). Identi-
fying and Measuring Urban Design Qualities Related to Walkability.
Journal of Physical Activity and Health, 3 (Suppl 1), S223-S240
Ewing R., Schmid T., Killingsworth R., Zlot A., & Raudenbush S. (2003) Rela-
tionship Between Urban Sprawl and Physical Activity, Obesity, and
Morbidity. American Journal of Health Promotion, 18 (1), 47-57
Frank L.D., Andreson M.A., & Schmidt L.S. (2004) Obesity relationships with
community design, physical activity, and time spent in cars. (American
Journal of Preventive Medicine. (27), 87-96
Finkelstein E.A., Trogdon J.G., Cohen J.W., & Dietz W. (2009) Annual Medi-
cal Spending Attributable to Obesity: Payer-and Service-Specific Esti-
mates. Health Affairs, (28), w822-w831
Fontaine K.R., Redden D.T., Wang C., et al. (2003) Years of life lost due to
obesity. Journal of the American Medical Association, 289(2), 187-193
Hess P.M., Vernez Moudon A.V., & Matlick J.M. (2004) Pedestrian safety
and transit corridors. Journal of Public Transportation, 7(2), 73-93
Huston S., Evenson K., Bors P., et al. (2003) Neighborhood environment,
access to places for activity, and leisure-time activity in a diverse North
Carolina population. American Journal of Health Promotion, 18(3), 58-
69
Institute of Portland Metropolitan Studies. (2010). Percent of Kaiser Perma-
nente adult members obese by census tract in Clark County, 2007.
[Map made at request of Public Health]. Portland, OR: Portland State
University
Kendrick S., Inman K., & Hoskins S. (2010) Socio-ecological Model. [Graphic illustra-
tion]. Vancouver, WA: Clark County Public Health
Krizek K. (2007) Estimating the economic benefits of bicycling and bicycle facilities: An
interpretive review and proposed methods. In V. Inglada (Ed.), Essays on Trans-
portation Economics London: Springer Publishing
Marmot, M. (2005) Social determinants of health inequalities. The Lancet; (365),
1099-1104
Mokdad A.H., Marks J.S., Stroup D.F., & Gerberding J.L. (2004) Actual causes of death
in the United States. Journal of the American Medical Association, 291 (10) 1238-
1245
Muennig P., Lubetkin E., Jia H., & Franks P. (2006) Gender and the burden of disease
attributable to obesity. American Journal of Public Health, 96(9), 1662-1668
North American HIA Practice Standards Working Group (2009). Practice Standards for
Health Impact Assessment, Version 1. Retrieved from http:\\www.sfphes.org
Olshansky S.J, et al. (2005) A potential decline in life expectancy in the United States
in the 21st century. The New England Journal of Medicine, (352), 1138-1145
Owen N., Humpel N., Leslie E., Bauman A., Sallis J. (2004) Understanding environ-
mental influences on walking. American Journal of Preventive Medicine, 27(1) 67-
76
Pickett K., & Pearl M. (2001). Multilevel analyses of neighbourhood socioeconomic
context and health outcomes: A critical review. Journal of Epidemiology and
Community Health, (55), 111-122
Pierce J., Denison A., Arif A., et al. (2006) Living near a trail is associated with In-
creased odds of walking among patients using community clinics. Journal of
Community Health, 31(4), 289-302
Pucher J., Dill J., & Handy S. (2010) Infrastructure, Programs, and policies to increase
bicycling: An international review. Preventive Medicine, (50) S106-S125
Roberts I, Norton R, Jackson R, Dunn R, Hassall I. (1995) Effect of environmental
factors on risk of injury of child pedestrians by motor vehicles: a case-control
study. British Medical Journal, 310(91), 91-94
Roemmich J., Epstein L., Rja S., et al. (2006) Association of access to parks and recrea-
tional facilities with the physical activity of young children. Preventive Medicine,
43(6), 437-441
Saelens B., & Handy S. (2008) Built environment correlates of walking: A review.
Medicine & Science in Sports & Exercise, 40(7S), S550-S556
Saelens, B. E., Sallis, J. F., & Frank, L. D. (2003). Environmental correlates of walking
and cycling: Findings from the transportation, urban design, and planning litera-
tures. Annals of Behavioral Medicine, (25) 80–91
Sallis, J. F. et al. (2009). Neighborhood built environment and income: Examining
multiple health outcomes. Social Science and Medicine, doi: 10.1016/
j.socscmed.2009.01.017
Transportation Research Board and Institute of Medicine of the National Academies.
(2005) Does the Built Environment Influence Physical Activity? Examining the
Evidence. Special Report 282. Transportation Research Board, Washington, D.C.
Levi J., Vinter, S., St. Laurent R., Segal L.M. (2010) F as in fat: How obesity threatens
America’s Future. Washington, D.C.: Trust for America’s Health
Wang G., Macera C., Scudder-Soucie B., et al. (2004) Cost Effectiveness of a Bicycle/
Pedestrian Trail Development in Health Promotion. Preventive Medicine, 38(2),
237-242
Wier M, Weintraub J, Humphreys EH, Seto E, & Bhatia R (2009). An area-level model
of vehicle-pedestrian injury collisions with implications for land use and trans-
portation planning. Accident Analysis and Prevention, 41(1):137-45
HIA: Clark County Bicycle & Pedestrian Master Plan Clark County Public Health 2010
SECTION 1: LAYING A FOUNDATION

Knowing more about where we are helps us make better deci-
sions about where we want to go. This assessment of baseline
conditions in Clark County presents the current status of social
and built environment determinants of health measured at the
neighborhood level. In combination with other reports on com-
munity health in Clark County, such as the Community Assess-
ment, Planning, and Evaluation report (Clark County Public
Health, 2010) and the Community Report Card (Community
Choices, 2010), this assessment helps to identify areas with high
potential for active transportation and areas of high infrastruc-
ture needs within the county. Findings are grouped into three
categories: Determinants, Built Environment, and Outcomes.
Determinants
Income
Median income is an indicator of income distribution and equal-
ity. Median income for all Clark county residents in 2009 was
$56,074, similar to the statewide median of $56,548 (US Census
Bureau, 2010). Map 1 shows the distribution of income by block
group, revealing a pattern of higher incomes in outlying areas
and lower incomes in older, more developed areas. Dramatic
differences are seen between the lowest median income block
group ($10, 854) and the highest ($134,558). Living in lower in-
SECTION 2: ASSESSMENT
Baseline conditions
SECTION 2: ASSESSMENT
Chart 1. Number of Residents by Block Group Median Income
For a discussion of how
determinants influence
health, see Section 1.
15
0
10000
20000
30000
40000
50000
60000
70000
< 10k
10,001-15k
15,001-20k
20,001-25k
25,001-30k
30,001-35k
35,001-40k
40,001-45k
45,001-50k
50,001-55k
55,001-60k
60,001-65k
65,001-70k
70,001-75k
75,001-80k
80,001-85k
85,001-90k
90,001-95k
95,001-100k
100,001-105k
105,001-110k
110,001-115k
115,001-120k
120,001-125k
125,001-130k
130,001-135k
Block Group Median Income
Number of residents
Population: 124,359 (29%) Population: 310,940 (71%)
Median income: $56,438

16
come neighborhoods is a risk factor for health, whereas higher
income neighborhoods can be protective. Of the county’s 233
block groups, 159 (68%) have a median income above the county
median; these block groups are home to 71 percent of the
county population (see chart 1). Although these block groups
are home to over 70 percent of the population, in 1999 they
were home to just 43% of the population living in poverty.
Equality of income distribution refers to the difference between
the highest income earners and lowest income earners in a com-
munity. Whereas perfect income equality (everyone earning the
same) may not be realistic or ideal, the concept is useful in as-
sessing the influence of SES on health. Studies indicate a strong
correlation between greater income equality and improved
health outcomes (Adler and Newman, 2002; Adler and Rehkopf,
2008). To help communities assess the impacts of income ine-
quality, the US Census bureau calculates an index of income ine-
quality known as the gini index, where 1 represents perfect ine-
quality and 0 represents perfect equality (US Census Bureau,
2010). In 2009 the gini index of income inequality for Clark
County was .42, similar to the statewide index of .44.
0 5 102.5Miles ¯
Median Income in 2009
$10,854.00 - $49,364.00
$49,364.01 - $60,741.00
$60,741.01 - $68,977.00
$68,977.01 - $77,712.00
$77,712.01 - $134,558.00
Highways 0 5 102.5Miles
Percent Below Poverty
0% - 3%
3.1% - 5.7%
5.8% - 9.3%
9.4% - 13.9%
14% - 63.6% ¯
Map 1. Median Income in 2009 Map 2. Poverty in 1999
SECTION 2: ASSESSMENT
HIA: Clark County Bicycle & Pedestrian Master Plan Clark County Public Health 2010
16

17
Education
Educational attainment is another measure of equality; higher
educational attainment is associated with better health out-
comes, giving an advantage to those with access to greater life-
time earnings resulting from quality higher education. In Clark
County, about 24% of adults over age 25 have attained a bache-
lor’s degree or higher (US Census Bureau, 2010). As one would
expect, 2009 data on educational attainment (see map 3)
roughly follows the same pattern as median income, unevenly
distributed throughout the county. However, a nearly continu-
ous set of block groups with lower educational attainment is
found along SR 500 and in the Orchards area.
Poverty
As an indicator of need, poverty is a stronger measure than in-
come or education. Given that many block groups have a rela-
tively high median income, the level of material need among
residents can be difficult to detect through measures such as
median income. The poverty rate in 2009 was 11.8%, similar to
0 5 102.5Miles ¯
Percent with B.A. or higher
2.6% - 14.8%
14.9% - 20.4%
20.5% - 25.9%
26% - 33.5%
33.6% - 63.6%
Highways
Map 3. Educational Attainment
13.2% - 29%
29.1% - 42.4%
42.5% - 50.9%
51% - 61.3%
61.4% - 87.3%
No Data
0 5 102.5Miles ¯
Percent receiving freeor reduced meals
Map 4. Free & Reduced Price Meals
SECTION 2: ASSESSMENT
HIA: Clark County Bicycle & Pedestrian Master Plan Clark County Public Health 2010

18
the statewide rate of 12.3% (US Census Bureau, 2010). Unfortu-
nately, recent estimates are not available at a small geographic
scale, but a data from Census 2000 is displayed by block group in
map 2. The map shows that poverty is largely concentrated in
and around Vancouver, and reaches over 50% of block group
populations in extreme cases.
Free and Reduced Price Meals
Another measure of material need is the percent of students
who participate in free or reduced meal programs at school. This
measure is shown in map 4 by elementary school attendance
area, reflecting a somewhat different distribution of need from
that shown in the maps of income and poverty, with higher need
shown along SR 503. This is partially due to different geographic
units (school attendance areas rather than cen-
sus block groups), but may also be indicative of
specific conditions for the population of families
with children.
Race & Ethnicity
Clark County has relatively small populations of
racial and ethnic minorities. As discussed in Sec-
tion 1, racial and ethnic minorities often face
higher health risks than their white neighbors.
The 2009 American Community Survey esti-
mates that about 88% of Clark County residents
are white, and 83% are non-Hispanic or Latino
white. The percent white population by block
group in 2009 is shown in map 5, indicating that
minority populations are largely concentrated in
the more densely populated areas in and
around Vancouver.
Language
Recent estimates from the American Commu-
nity Survey indicate that there are two large
non-English-speaking populations in Clark
County: Spanish and Indo-European. These populations are
roughly the same size, each between 8,000 and 9,000 people
(CCPH, 2009). Recent data on this variable are not available for
geographies smaller than the county as a whole, but based on
ethnicity we can approximate the location of Spanish speakers.
The Indo-European language speakers are likely Eastern Euro-
0 5 102.5Miles ¯
Percent Non-hispanic White
59.2% - 82.3%
82.4% - 86.6%
86.7% - 90.4%
90.5% - 92.7%
92.8% - 97%
Map 5. Race & Ethnicity
SECTION 2: ASSESSMENT
HIA: Clark County Bicycle & Pedestrian Master Plan Clark County Public Health 2010

19
pean, and therefore are not distinguishable through racial or
ethnic data because they are classified as white by the US Cen-
sus.
Age
Age is a particular concern related to cycling and walking, as
those at both ends of the life cycle often require special consid-
eration to accommodate their physical and informational needs
as they navigate the transportation system. Map 6 shows older
adults as a percent of population by block group, accompanied
by map 7 displaying the percent of youth in each block group.
The distribution pattern appears to be similar to that of median
income, with some exceptions. There are youthful pockets in
Battle Ground, Orchards, and Highway 99 area, whereas the
older population is more concentrated west of I-5 and along the
Columbia River.
Housing affordability
Housing affordability effects both equality and chronic stress,
both of which influence chronic illness (CSDH, 2008). A standard
measure of housing affordability is percent of household income
spent on housing, with 30% considered the threshold of afforda-
0 5 102.5Miles ¯
Percent Aged 65+
1.7% - 6.5%
6.6% - 9%
9.1% - 11.2%
11.3% - 14.8%
14.9% - 53.9%
Map 6. Older Adults
0 5 102.5Miles ¯
Percent Under Age 20
7% - 23.2%
23.3% - 27.1%
27.2% - 29.6%
29.7% - 32.7%
32.8% - 42.2%
Map 7. Youth
SECTION 2: ASSESSMENT
HIA: Clark County Bicycle & Pedestrian Master Plan Clark County Public Health 2010

20
bility (CNT, 2010). In this study we are using an alternative defi-
nition of affordability that takes transportation costs into ac-
count, for the reasons that follow. As much of the county is
heavily dependent on automobiles, transportation options are
limited and costs are highly related to oil prices. The two maps
below show the impact that transportation costs can have on
affordability. In map 8, yellow areas are considered affordable
using the threshold of 30% of income spent on housing costs.
Map 9 shows how affordability changes when the definition is
expanded to include housing plus transportation costs using a
45% threshold. When transportation costs are included, much of
the county is unaffordable, with most of the affordable housing
located in or just outside Vancouver city limits. Clark County as a
whole is considered affordable using the 30% threshold, with the
average household spending just 28.8% of household income on
housing. However, when transportation costs are included, the
county surpasses the 45% threshold, as households can expect
to spend 51.6% of their incomes on housing and transportation
(CNT, 2010). The large number of employees with lengthy com-
mutes to Oregon (about 60,000) may partially explain this pat-
tern.
Built Environment
Access to parks
Parks provide important opportunities for physical activity. Park
access in Clark County is nearly ubiquitous in close-in areas of
Vancouver and Camas, with increasing gaps moving northward.
Map 8. Housing Affordability
Map 9. Housing + Transportation
Affordability
SECTION 2: ASSESSMENT
HIA: Clark County Bicycle & Pedestrian Master Plan Clark County Public Health 2010

21
About 45% of the county population is within ½
mile walking distance of a park access point, and
about 70% is within one mile. Vancouver-Clark
Parks and Recreation defines neighborhood parks
as those that serve roughly a ½ mile walking dis-
tance and provides these only within Vancouver
and its UGA. This explains why within incorpo-
rated areas, nearly 60 percent of residents live
within walking distance of a park, but only 31 per-
cent of unincorporated residents live within walk-
ing distance of a park. Of all residents living
within ½ mile walking distance of a park, 99 per-
cent live within a city or the Vancouver UGA.
Access to food
With physical activity, nutritious food can help
prevent obesity. Access to nutritious food varies
widely in Clark County, as shown in maps 11 and
12. Sometimes the nearest food outlet may not
be a healthy one – inexpensive, calorie-dense food
is often closer or more convenient than fresh pro-
SECTION 2: ASSESSMENT
HIA: Clark County Bicycle & Pedestrian Master Plan Clark County Public Health 2010
1/2 mile buffer
1 mile buffer
Parks0 5 102.5
Miles ¯
0 5 102.5Miles
1/2 mile walking distance
1 mile walking distance
Highways
Major Roads ¯
Map 11. Walking Distance to Fast
Food
Map 12. Walking Distance to Grocery
stores and Supermarkets
Map 10. Walking Distance to Parks
0 5 102.5Miles
1/2 mile walking distance
1 mile walking distance
Highways
Major Roads ¯

22
duce. This is especially true in lower income areas, as reflected
in the correlation between the density of fast food restaurants
and median incomes among census block groups (Pearson corre-
lation -0.405; p<0.000). Table 3 illustrates the relative ease of
access for different types of food stores.
Having healthy food stores nearby is not only important for
healthy eating, it also serves as a destination for active transpor-
tation.
Access to schools
Among the most prominent built environment concerns is the
accessibility of schools (TRB & IOM, 2005). Distance to school is
cited by parents as the leading barrier to allowing
their children to walk to school, an issue exacer-
bated by the tendency of new schools to locate
on the suburban fringe where land is less expen-
sive. In Clark County, there are examples of both
highly walkable, urban school attendance areas
as well as schools separated from other land uses
by distance or lack of appropriate facilities such
as sidewalks, low-traffic streets, and safe cross-
ings.
Maps 13 and 14 show the average distance from
each residential parcel within a school atten-
dance area to that school. Schools with lower
average distances have higher potential for walk-
ing or cycling, such as many of the elementary
schools located in and around Vancouver with
average distances under 1 mile (in Washington
State, there is no bus service for children living
within 1 mile of school). As students transition to
middle school, the distance from home typically
becomes greater, making walking and cycling less
Average Distance
0.00 - 0.70
0.71 - 0.93
0.94 - 1.22
1.23 - 1.97
1.98 - 5.14 0 5 102.5Miles ¯
Map 13. Distance (miles) to
Elementary Schools
SECTION 2: ASSESSMENT
HIA: Clark County Bicycle & Pedestrian Master Plan Clark County Public Health 2010
1/2 mile 2/3 mile 1 mile
Produce Only 0.5% 1% 4%
Grocery 7% 11% 21%
Supermarket 9% 16% 34%
Grocery or Supermarket 15% 23% 42%
Convenience Store 32% 45% 65%
Fast Food 35% 47% 66%
Table 3. Population within walking distance of food stores

23
likely. This is reflected in the larger middle
school attendance areas and higher average dis-
tances. While distance is not the only determi-
nant of whether children walk to school, it is of-
ten cited as among the most important (CDC,
2005; Kerr et al 2006). A high average distance
to school, while a significant challenge, does not
preclude walking or cycling for students who live
nearby. However, higher average distances are
partially explained by development patterns that
result in few students living near enough to
school to feasibly walk, or in few route options
that offer safe facilities.
Access to transit
Studies find that transit use is associated with a
decreased likelihood of obesity, and that 29% of
those who use transit achieve daily physical ac-
tivity recommendations solely by walking to and
from transit (Besser and Dannenburg, 2005).
Proximity to public transit has repeatedly been
associated with higher transit use and to higher
levels of physical activity (McCormak, Giles-Corti,
and Bulsara, 2008). In Clark County, about 27%
of the county population lives within ¼ mile of a
transit stop, and about 52% are within ½ mile.
Map 15 shows the areas that are within ¼ and ½
mile of a transit stop. Central Vancouver enjoys
ubiquitous service, whereas eastern and north-
ern areas have sparse service or none at all.
Proximity to transit stops helps illustrate its avail-
ability, but does not complete the picture. The
quality and frequency of service greatly impacts
transit’s ability to serve as a primary mode of
transportation. While some areas of the county,
such as the Fourth Plain corridor, are well-served
by frequent and direct lines, large areas have in-
frequent or minimal transit service.
Bikeability
The presence of bicycle facilities contributes to
increased bicycling (Pucher et al, 2009). One way
of measuring the presence of facilities is bicycle
network density, which compares census block 0 5 102.5
Miles
1/4 mile buffer
1/2 mile buffer
Major Roads
Highways ¯
Map 15. Walking
Access to Transit
SECTION 2: ASSESSMENT
HIA: Clark County Bicycle & Pedestrian Master Plan Clark County Public Health 2010
Average distance
1.50 or less
1.51 - 2.00
2.01 - 2.50
2.51 - 3.00
3.01 or greater
No Data
0 5 102.5Miles ¯
Map 14. Distance (miles)
to Middle Schools

24
groups within the county by calculating bikeway miles per square
mile. By this measure, much of unincorporated Clark County
compares well to other areas of the county, particularly within
the Vancouver UGA. This pattern is displayed in map 16, which
shows bikeway network density by census block group. How-
ever, research also shows that infrastructure is only one of many
factors that influences cycling (Krizek, 2006; Pucher et al, 2009).
Many other factors that influence bicycling also influence walk-
ing, such as street network connectivity and the proximity of
destinations. For this reason, it is important to consider the map
of bikeability in the context of measures of walkability shown in
the map 17.
Walkability
Several studies associate measures of walkability with physical
activity (Sallis et al, 2009; Frank et al, 2007; Clifton et al, 2006).
There are many methods of measuring the influence of the built
environment on walking, but the walkability index developed by
Sallis and Frank is used in this HIA because it offers the following
advantages: first, it is consistently linked with obesity and physi-
cal activity in research; second, it can be calculated using archival
Bikeway Miles/Sq Mile
(quintiles)
0.00
0.01 - 0.62
0.63 - 1.60
1.61 - 2.45
2.46 - 7.41
Highways ¯0 5 102.5Miles
Map 16. Bicycle Network
Density by Block Group
Walkability Index
(quintiles)
Lowest
Highest
Highways ¯0 5 102.5Miles
Map 17. Walkability
Index by Block Group
SECTION 2: ASSESSMENT
HIA: Clark County Bicycle & Pedestrian Master Plan Clark County Public Health 2010
“Facility” is a catch-all
term that can refer to any
type of infrastructure,
such as bike lanes, bike
boulevards, or sidewalks.

25
GIS data rather than by means of intensive pri-
mary data collection efforts. The walkability
index is a combined measure of net residential
density, road network connectivity, retail floor-
area ratio, and land use mix.
In map 17, darker areas have higher walkability
index scores, indicating better conditions for
walking. As might be expected, many of the
most walkable locales are in and near down-
town Vancouver, while much of the rural area
is less walkable. The walkability map also
shows the urban growth areas and incorpo-
rated areas, giving a clearer picture of the area
impacted by the Bicycle and Pedestrian Master
Plan. It is important to note that this index
does not take into account the presence or
quality of bicycle and pedestrian facilities
(these data are still being developed). As such,
the index can be considered more of a walk-
ability potential index, rather than a measure
of current activity or service levels. Also, it is a
relative measure, meaning that a high walkabil-
ity score in one block group does not necessar-
ily reflect a very walkable environment, only
that it is more walkable than other block groups
in the county.
Crime
Research and theory suggest that personal
safety from crime is a key component in peo-
ple’s willingness to engage in physical activity in
their neighborhoods. At least one study found
that low-income residents in walkable
neighborhoods tend not to get as much physi-
cal activity as their wealthier counterparts
(Sallis et al, 2009). This finding suggests that
there may be necessary preconditions for a
truly walkable neighborhood, such as diminish-
ing the real or perceived threat from crime.
Crime rates (maps 18 and 19) for Clark County
show that lower income areas such as central
Vancouver have higher crime rates.
Assaults per 100,000 Population
0 - 243
244 - 479
480 - 828
829 - 1456
1457 or more
0 5 102.5Miles ¯
Map 18. Assaults by
Block Group, 2009
Drug Offenses
per 100,000 population
0 - 38
39 - 103
104 - 220
221 - 457
458 - 43670 5 102.5
Miles ¯
Map 19. Drug offenses
by Block Group, 2009
SECTION 2: ASSESSMENT
HIA: Clark County Bicycle & Pedestrian Master Plan Clark County Public Health 2010

26
Outcomes
Disparities
In Clark County, there are populations with worse health out-
comes than others, a situation known as a health disparity. In
many cases these differences are preventable by focusing re-
sources based on social conditions. For example, those with
lower socioeconomic status fare worse on the majority of meas-
ures of health (Clark County Public Health, 2010). Figure 2 shows
differences in various measures of health specific to Clark County
based on socioeconomic status. Health indicators in green are
related to medical care, those in blue measure emotional health
and substance abuse, and those in red are indicators of risk for
chronic disease. Each section of the diagram contains indicators
for which the corresponding group is relatively worse off than
other groups. For example, measures of adult obesity are higher
among low SES adults, and daily physical education attendance is
lower among high SES students. When compared to maps of SES
(see page 16), it is clear that there is some degree of geographic
clustering of people with similar SES, and that this is reflected in
the geographic distribution of health outcomes.
SECTION 2: ASSESSMENT
HIA: Clark County Bicycle & Pedestrian Master Plan Clark County Public Health 2010
Low SES
Adults with healthcare coverage
Adults with a personal doctor
Adults with a past year dental visit
Adults who could not afford to see a doctor
Prenatal care
Adult poor emotional health
Adult binge drinking
Youth depression
Youth alcohol use
Youth marijuana use
Youth meth use
Adult obesity
Youth obesity
Youth overweight/obesity
Adult fruit/vegetable consumption
Youth fruit/vegetable consumption
Youth sweetened beverage consumption
Adult leisure time physical activity
Youth meeting physical activity recommendation
High SES
Daily physical education attendance
No difference
Adult overweight/obesity
Figure 2. Health disparities in Clark County

27
Life expectancy
One of the most basic indicators of overall health, Life Expec-
tancy at Birth (LEB), tells us how long a person born in a given
year can expect to live. This measure is particularly helpful in
illustrating disparities based on social and environmental influ-
ences on health or SES. In Clark County, the total variability in
LEB between zip codes is roughly six years. As shown in map 20,
LEB is higher in eastern zip codes, with lower expectancies found
in northern and south-central zip codes. Based on assessment of
existing socioeconomic conditions (page 16), it is clear that this
pattern is partially coincident with measures of SES.
HIA: Clark County Bicycle & Pedestrian Master Plan Clark County Public Health 2010 HIA: Clark County Bicycle & Pedestrian Master Plan Clark County Public Health 2010
SECTION 2: AS-
Zip codes
Life Expectancy in 2007
75.5 - 77.4
77.5 - 77.9
78.0 - 79.2
79.3 - 80.1
80.2 - 82.10 5 102.5
Miles ¯
Map 20. Life Expectancy by Zip Code

28
Obesity
In Clark County, 26% of adults are obese (BMI>30), and an addi-
tional 38% are overweight (BMI >25-30). These percentages are
similar to Washington State overall and have increased over the
past decades. As shown in map 21, the distribution of over-
weight and obesity is not equal throughout the county. While
there is a substantial amount of missing data, it appears that
there is higher concentration of overweight and obese residents
in south-central zip codes. This is corroborated by a separate
HIA: Clark County Bicycle & Pedestrian Master Plan Clark County Public Health 2010
64% of Clark County
adults are obese or
overweight.
0 5 102.5Miles ¯
Percent adults overweight or obese
50% - 52%
53% - 55%
56% - 60%
61% - 68%
69% - 74%
No data
Map 21. Overweight and Obesity by Zip Code
SECTION 2: ASSESSMENT

29
data set that uses electronic medical records from a sin-
gle provider to map obesity rates by census tract. This second
data set indicates that obesity rates are highest in the south-
central area around the junction of I-205 and SR 500. Rates vary
from 21% in downtown Vancouver to 39% east of Washougal
(Institute of Portland Metropolitan Studies, 2010). Note that
these rates are for the insured population covered by a single
provider and represent obesity rates only among a sub-
population of insured adults.
A survey of Clark County tenth graders indicates that about 13
percent are overweight and 11 percent are obese (Clark County
Public Health, 2010). For both youth and adults, obesity rates
decrease with higher SES as measured by education level. Com-
pared to White residents, overweight and obesity rates are
higher among Hispanics and Black residents.
Injuries & fatalities
Perhaps the most obvious health outcome related to any bicycle
and pedestrian plan is the incidence of traffic injuries and fatali-
ties for cyclists and pedestrians. Recent data from the Washing-
ton State Department of Transportation show that of the 61 pe-
destrian fatalities in Washington in 2009, only 1 occurred in Clark
County. Bicyclist fatalities totaled 9 in Washington, 1 of which
occurred in Clark County. Table 5 reflects a diminishing number
of fatalities for pedestrians in recent years, but similar numbers
of cyclist fatalities year-to-year. The numbers are too small to
indicate a trend for cyclist and pedestrian injuries, but some vari-
ability may be related to inconsistent reporting.
Studies have found that despite some predictions, significant in-
creases in pedestrian and bicyclist traffic are associated with re-
duced incidence of pedestrian-motor vehicle and bicyclist-motor
vehicle collisions (Jacobsen, 2003). This effect has been ob-
HIA: Clark County Bicycle & Pedestrian Master Plan Clark County Public Health 2010
Year Pedestrian
fatalities
Pedestrian Serious
Injuries
Bicyclist
Fatalities
Bicyclist Serious
Injuries
2006 5 14 1 5
2007 5 7 2 7
2008 2 20 2 20
2009 1 18 1 9
Table 5. Bicycle and Pedestrian Fatality Rates
SECTION 2: ASSESSMENT
24% of Clark County
tenth grade students are
overweight or obese.

30
served locally in Portland. Thus, there is two-fold benefit to
building communities that promote pedestrian and bicyclist ac-
tivity – expected decreases in chronic health conditions due to
improved activity levels as well as decreases in the incidence of
pedestrian and bicyclist injury due to “safety in numbers”.
Maps 19 and 20 show locations of bicycle and pedestrian crashes
from 1997-2010. The highest number of crashes at any single
place in Clark County is the intersection of NE 78th
Street and
Highway 99, with ten pedestrian crashes and three bicycle
crashes.
HIA: Clark County Bicycle & Pedestrian Master Plan Clark County Public Health 2010
¯0 5 102.5Miles
Bicycle Crashes
1
2 - 3
Major Roads
Cities ¯0 5 102.5Miles
Pedestrian Crashes
1
2 - 3
4 - 5
6 - 10
Major Roads
Cities
Map 19. Bicycle injury and fatality crashes,
1997-2010
Map 20. Pedestrian injury and fatality crashes,
1997-2010
SECTION 2: ASSESSMENT

31
Proposed projects, policies, and programs and their likely im-
pacts are described below. Findings on impacts are summarized
at the beginning of each set of proposals. For discussion pur-
poses, projects are aggregated by type and in total to give a
sense of overall impact. Also included is a discussion of the im-
pact of the planning process. Relevant research and sources are
listed in Appendix C.
An important consideration in the assessment of the policies and
programs proposed in the plan (as opposed to projects) is that
they essentially remain proposals unless funded, codified or oth-
erwise implemented. Due to the broad range of implementation
options for each policy and strategy, the population served is not
estimated for these proposals. Instead, we comment on
whether there is an impact, whether the effect is positive or
negative, and whether the effect directly increases physical ac-
tivity or merely supports it. To translate the findings of this as-
sessment into action, recommendations on implementation are
included in section 3.
Projects
Impact
CCPH finds that, if implemented, all proposed projects will have
a positive impact on health by providing increased opportunities
for physical activity. The proposed projects will produce no ad-
verse impacts on vulnerable populations, and could help low SES
and older residents.
Strength of Evidence
This finding is supported by multiple peer-reviewed research
studies that show a consistent association between bicycle and
pedestrian infrastructure and physical activity (Pucher et al,
2009; Krizek, 2006; Dill and Carr, 2003; Dill, 2009; Dill and Gliebe
2008).
Magnitude
This analysis assumes that projects will be fully implemented as
proposed. The magnitude of the proposed projects was ana-
lyzed based on their proximity to populations that could benefit
from increased opportunities for physical activity in their
neighborhoods. Implied in this approach is that being nearer to
a facility increases the likelihood of using it, which is generally
HIA: Clark County Bicycle & Pedestrian Master Plan Clark County Public Health 2010
Impact of Proposed Actions
Public Health finds that, if
implemented, all
proposed projects will
have a positive impact on
health by providing
increased opportunities
for physical activity.
SECTION 2: ASSESSMENT

32
supported by research (Pucher et al, 2009, Krizek, 2006). While
this does not represent the true magnitude of health impacts in
a highly quantified form, it is an attempt to identify the potential
magnitude through quantifying the population that will have ac-
cess to increased opportunities for physical activity.
Findings from a study of cyclist behavior indicate that facility
types vary in their appeal to cyclists (Dill, 2009). Using these
findings, we calculated the service areas for each bicycle and pe-
destrian project based on their attractive “pull”. This approach
involves a degree of arbitrary cut-off distances. We assume that
¼ mile is the “pull”, or service area, for bike lanes, which is sup-
ported both by other planning approaches (City of Portland,
2010), and by research showing that residents living within 400
meters of a bike lane are more likely to cycle (Krizek, 2006).
Based on Dill’s study, we calculated that the relative attractive-
ness of an off-street trail to a bike path increases the service
area to nearly ½ mile. Whereas Dill’s study affirms the attrac-
tiveness of several types of bicycling facilities, such as bicycle
boulevards and low-speed streets, only trails and bike lanes are
prioritized in the Clark County Bicycle and Pedestrian Master
Plan.
After reviewing existing research, we were unable to determine
a specific distance as a service area for sidewalks based solely on
empirical observations. Presence of sidewalks is typically meas-
ured by their continuity (percent of streets covered) or by pedes-
trian behavior (Brownson et al, 2009; Saelens et al, 2003). With-
out a basis for determining sidewalk service areas, we assume
that residents within 500 feet (two blocks) will be served by new
sidewalks. At assumed walking speeds of four feet per second
(FHWA, 2009), a 500 foot route deviation would take about two
minutes. This equates to a 16% deviation on a .6 (1km) mile
walk trip commonly used as a standard in transportation re-
search and planning (Lee and Moudon, 2006) or a 14% deviation
on a .7 mile walk trip reported as the mean distance for all walk
trips on the 2009 National Household Transportation Survey.
This deviation is at the lower range of those found for cycling
facilities. Although pedestrian and bicycle behavior is not di-
rectly comparable, CCPH uses the distance of 500 feet because it
falls within an observed range of deviation and is easily under-
standable when communicated as a 2-block radius.
These service areas are shown in green in map 21. We use prox-
imity-based measures for three reasons: a) data availability,
HIA: Clark County Bicycle & Pedestrian Master Plan Clark County Public Health 2010
SECTION 2: ASSESSMENT
“Service areas” refer to
the area that can be
reasonably served by a
destination or facility,
such as a park or trail, if
users access it by walking
or cycling.
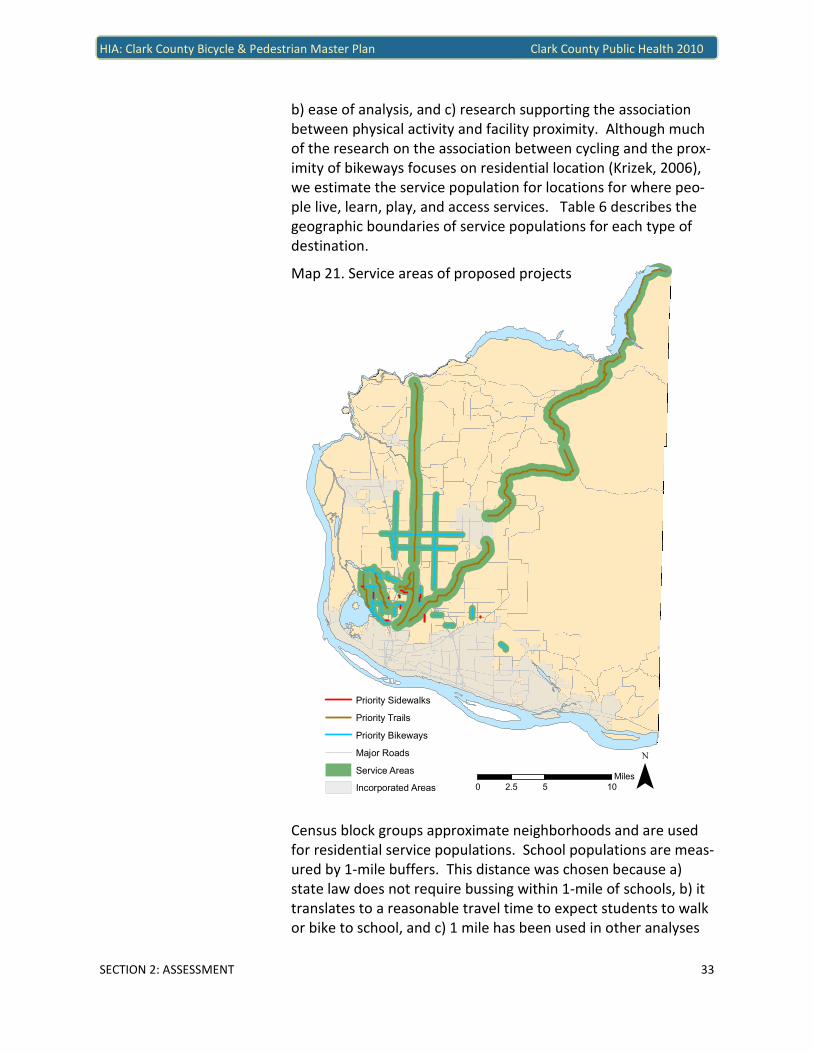
33
b) ease of analysis, and c) research supporting the association
between physical activity and facility proximity. Although much
of the research on the association between cycling and the prox-
imity of bikeways focuses on residential location (Krizek, 2006),
we estimate the service population for locations for where peo-
ple live, learn, play, and access services. Table 6 describes the
geographic boundaries of service populations for each type of
destination.
Census block groups approximate neighborhoods and are used
for residential service populations. School populations are meas-
ured by 1-mile buffers. This distance was chosen because a)
state law does not require bussing within 1-mile of schools, b) it
translates to a reasonable travel time to expect students to walk
or bike to school, and c) 1 mile has been used in other analyses
HIA: Clark County Bicycle & Pedestrian Master Plan Clark County Public Health 2010
Priority Sidewalks
Priority Trails
Priority Bikeways
Major Roads
Service Areas
Incorporated Areas ¯0 5 102.5Miles
Map 21. Service areas of proposed projects
SECTION 2: ASSESSMENT

34
(Dill and Haggerty, 2009). The entire population is included,
rather than just the school aged population for three reasons: a)
priority projects may not be completed while the current school
age population is still in school, b) parents and families are indi-
rectly served if their students can walk to school, and c) improve-
ments targeted at school children can be enjoyed by anyone.
Park service areas are defined as ½ mile buffer, a distance recog-
nized by Vancouver Clark Parks & Recreation as the walkable ser-
vice area of neighborhood parks, expecting that people will walk
about ten minutes to access smaller parks. Finally, the service
population for neighborhood services is defined as a 1-mile
buffer, which roughly corresponds to a 20-minute walking dis-
tance referenced in the plan as a desirable neighborhood scale
(Bicycle and Pedestrian Master Plan, page 4).
The estimated current population that would be served by pro-
posed improvements is displayed in table 7 by facility type. In
unincorporated Clark County, there are about 211,800 residents.
Using the service areas described above, CCPH estimates that
about 95,000 or 45% of the unincorporated population will be
directly served by the improvements prioritized in this plan.
Projects within the Urban Growth Areas (UGA) can be compared
to research studies of other urbanized areas. When all projects
are completed, the bikeway network density in unincorporated
Clark County within UGAs will increase from 1.11 to 1.76 bike-
way miles per square mile, or 59 percent. Excluding off-street
paths, the bikeway density will increase from 0.93 to 1.31 bike-
way miles per square mile, or 40 percent. A study of US metro-
politan areas found that an increase of 1 bike lane mile per
square mile is associated with a 1 percent increase in the share
of commuters traveling by bicycle (Dill & Carr, 2003). If the same
relationship is present in Clark County, we can expect an in-
crease from 0.25 to 0.62 percent of commuters traveling by bicy-
cle. This translates to an additional 240 workers commuting by
HIA: Clark County Bicycle & Pedestrian Master Plan Clark County Public Health 2010
Population Geographic definition
Residential Census block groups
School 1 mile buffer around k-12 schools
Parks ½ mile buffer around park access points
Neighborhood Services 1 mile buffer around grocery stores & supermarkets
Table 6. Service area definitions
When all projects are
completed, at least
95,000 residents will have
increased access to
opportunities for physical
activity in their
neighborhoods.
The population served is
defined as the population
that will have increased
opportunities for physical
activity as a result of
priority projects. We have
reason to believe that this
group will benefit from
increased physical activity
as a result of greater ac-
cess to physical activity.
SECTION 2: ASSESSMENT

35
bicycle, some of whom may have changed from sedentary to ac-
tive transportation. This calculation assumes that the bicy-
cle commute mode share in block groups in the Urban Growth
Area is the same in 2009 as it was in 2000. However, of 70 block
groups within the Urban Growth Area, only 13 had a bicycle
commute mode share greater than zero in the 2000 census. Ad-
ditionally, the study that serves as a basis for this calculation is
cross-sectional and doesn’t measure “before and after” effects
of adding bicycle lanes, although some longitudinal studies have
shown increases following the installation of bike lanes.
Disparate impacts
Disparate impacts were assessed based on four measures of ad-
vantage: SES, Race/Ethnicity, Youth, and Older adults. For each
measure, geographic areas were designated as high, medium, or
low based compared to other areas of the county. These catego-
ries are identified in table 8. It should be noted that, with the
exception of SES, these populations were not specific focus areas
in the plan. Tables present variation in average bikeway density
Description Values
# Block
Groups
Income
Highest 1/3 of block groups $76,245 - $117,968 37 Middle 1/3 of block groups $64,629 - $76,244 37
Lowest 1/3 of block groups $27,711 - $64,628 38
Race/Ethnicity High percent non-Hispanic White 92.7% - 97.0 % 38 Medium percent non-Hispanic White 88.9% - 92.6% 37
Low percent non-Hispanic White 62.3% - 88.8% 37
Age:
Youth (1-18) High percent youth 30.7% - 42.2% 37 Medium percent youth 26.9% - 30.6% 37
Low percent youth 18.7% - 26.8% 38
Age:
Older Adults (65+) High percent older adults 12.3% - 32.3% 37 Medium percent older adults 8.9% - 12.2% 37
Low percent older adults 2.8% - 8.8% 38
Table 8. Analysis categories for determining disparate impacts
SECTION 2: ASSESSMENT
HIA: Clark County Bicycle & Pedestrian Master Plan Clark County Public Health 2010
Potential Magnitude
Facility
Type
Impact on
Physical
Activity
Strength
of
Evidence
Residential
Population
Served
School
Population
Served
Parks Popu-
lation
Served
Neighbor-
hood Services
Population
Served
Bikeways Positive Moderate 31,073 22,876 11,338 12,376
Restriping Positive Moderate 17,242 15,078 8,413 4,966
Trails Positive Strong 62,540 31,652 21,241 13,348
Sidewalks Positive Moderate 4,655 3,973 1,909 2,401
All Projects Positive Moderate 94,969 53,805 33,428 28,797
Table 7. Potential magnitude of impact by project
“Commute mode share” is
the proportion of
commute trips made by
each mode of travel.
For example, in 2009, 78%
of Clark County commuters
drove alone to work (US
Census Bureau, 2010).

36
and sidewalk mileage for each disadvantaged population. How-
ever, given the small number of proposed sidewalk miles (7.15),
tables relating to sidewalk projects should not be interpreted as
conclusive regarding avoidable negative differential impacts.
Recommendations on how programs and policies can be imple-
mented to avoid negative differential impacts are included in
section 3.
Disparate Impacts in Neighborhoods
Socioeconomic Status (SES)
There is a mix of disparate impacts among block groups based on
median income. Of all new project miles, 45 percent are
planned for the 33 percent of block groups with the lowest me-
dian incomes. The priority projects could therefore be said to
address the existing higher health risks faced by residents of
lower income block groups. However, if projects were to fully
respond to disparate health risks based on SES, one would ex-
pect to see a greater proportion of project miles in middle in-
come block groups than in higher income block groups. As evi-
dent in table 9, this is not the case.
There is no significant difference in average bikeway network
density (bikeway miles/square mile) based on block group in-
come categories. One-way ANOVA tests showed that, both for
income quintiles and tertiles, there is no significant difference
between groups. Similarly, comparing the 10 percent of block
groups with the lowest incomes to the other 90 percent shows
45% of new project
mileage will be in lower
income block groups.
Income group Proposed bikeway miles Percent of total
Lowest 1/3 48.3 45%
Middle 1/3 27.0 25%
Highest 1/3 31.7 30%
Table 9. Proposed bikeway miles by SES
SECTION 2: ASSESSMENT
HIA: Clark County Bicycle & Pedestrian Master Plan Clark County Public Health 2010
Block group
income
Proposed sidewalk
miles
Percent of all pro-
posed sidewalk miles
Low 3.62 51%
Middle 1.25 17%
High 2.28 32%
Total 7.15 100%
Table 10. Proposed sidewalks by block group SES
ANOVA (analysis of
variance) is a common
statistical test used to
determine whether there
are significant differences
between groups.

37
slight differences. No significant correlation was found between
income and existing bikeway network density, proposed bikeway
miles, or future bikeway network density.
The bikeway network is currently evenly distributed among block
groups by SES and will remain so following the completion of pri-
ority projects. We are unable to determine changes in sidewalk
network density or continuity due to lack of data on existing fa-
cilities, but we can determine that, similar to all priority bicycle
projects, there is a slight weighting toward lower SES block
groups, and a somewhat lower percentage of new mileage pro-
posed for middle income block groups than for higher income
block groups.
Race
Obesity rates are higher for Blacks and Hispanics in Washington
State (Levi, 2010). Minority status is widely cited as a risk factor
for chronic disease, adding to the importance of preventing obe-
sity among minority populations (Williams, 2008). In this re-
spect, the plan could be seen as successful in that it preserves
and expands opportunities for physical activity in racial and eth-
nic minority areas. However, the plan does not reinforce the
positive existing conditions, in which areas with higher percent
minority populations have higher bikeway network density.
There are significant differences in average bikeway network
density based on percent of minority population within block
Block group
income
2009 Average
bikeway density
Average additional
proposed
2015 Average
bikeway density
Lowest 1/3 1.36 0.68 2.04
Middle 1/3 1.19 0.34 1.53
Highest 1/3 1.15 0.62 1.76
Lowest 10% 1.44 0.52 1.96
Highest 90% 1.11 0.63 1.74
Table 11. Average bikeway network density by block group SES
Block group
percent minority
2009 Average
bikeway density
Average addi-
tional proposed
2015 Average
bikeway density
Low 0.34 0.48 0.82
Med 1.31 0.84 2.16
High 1.77 0.53 2.30
Table 12. Average bikeway network density by block group percent minority
SECTION 2: ASSESSMENT
HIA: Clark County Bicycle & Pedestrian Master Plan Clark County Public Health 2010

38
groups. A one-way ANOVA with post-hoc testing confirms that
on average, block groups with higher proportions of racial and
ethnic minorities also have higher bikeway network density. The
same holds true after proposed bikeway miles are completed.
However, there is no statistically significant difference in the av-
erage additional bikeway miles proposed. Correlations show the
same relationship – whereas there are significant moderate cor-
relations for existing (.45) and future (.34) bikeway miles
(p<.001), there is no significant relationship for miles proposed.
We can conclude that areas with higher percentages of racial
and ethnic minorities have somewhat greater access to opportu-
nities for physical activity through bicycling, which will continue
to be the case when all proposed improvements are completed.
Whether this higher level of access is commensurate with the
higher health risks faced by minorities is difficult to determine
due to factors that could inhibit access to these facilities, such as
lack of equipment, physical barriers (such as topography), and
real or perceived safety threats.
Sidewalks appear to be evenly distributed among block groups
based on race and ethnicity, as illustrated in table 13.
Youth
There is no significant difference in average bikeway network
density among block groups based on percent youth population.
A one-way ANOVA confirms that this is true for existing, pro-
posed, and future average bikeway network densities. A notable
feature of the age distribution in unincorporated Clark County is
that there are few contiguous areas of concentrated youth popu-
lation. Indeed, the distribution of block groups shows that the
percent of the population under age 20 is relatively similar
among all block groups – the mean among block groups is 29
percent with a standard deviation of only 5 percent. In this case,
the “high, medium, and low” designations may be less meaning-
Block group percent
minority
Proposed
sidewalk miles
Percent of all proposed
sidewalk miles
Low 2.32 32%
Medium 2.17 30%
High 2.66 37%
Total 7.15 100%
Table 13. Proposed sidewalks by block group percent minority
SECTION 2: ASSESSMENT
HIA: Clark County Bicycle & Pedestrian Master Plan Clark County Public Health 2010

39
ful, but still useful in determining whether there are disparate
impacts. Given the relatively uniform population of youth, dispa-
rate impacts are not likely based on residential location. Impacts
based on school locations are examined separately on the fol-
lowing page.
As shown in table 14, the distribution of proposed sidewalks is
heavily tilted toward block groups with the middle range of
youth as a percent of population, followed by block groups with
a high percent of youth. This reflects the fact that two of the
lengthiest projects are in block groups with a medium youth per-
centile. Additionally, many projects straddle or border block
groups of different age demographics, providing easy access to
several block groups at once. Because of this effect and due to
the relatively small project mileage in question, calculations on
sidewalk project distribution should not be interpreted as con-
clusive regarding disparate impacts.
Older adults
There is no significant difference among block groups in existing
or future bikeway network density based on percent older
adults. However, a one-way ANOVA shows that on average,
there is a significantly higher proposed bikeway network density
increase among the highest percent older population block
groups compared to the lowest (p<.05). This analysis suggests
that the plan targets areas with older populations, which is con-
sistent with the need to provide physical activity options for
healthy aging.
SECTION 2: ASSESSMENT
HIA: Clark County Bicycle & Pedestrian Master Plan Clark County Public Health 2010
Block group
percent youth
2009 Average
bikeway density
Average addi-
tional proposed
2015 Average
bikeway density
Low 1.12 0.81 1.93
Med 1.29 0.71 2.00
High 1.03 0.31 1.35
Table 14. Average bikeway network density by block group percent youth
Block group percent
youth
Proposed sidewalk
miles
Percent of all proposed
sidewalk miles
Low .81 11%
Medium 4.49 63%
High 1.85 26%
Total 7.15 100%
Table 15. Proposed sidewalks by block group percent youth
29.1% of Clark County
residents are under age 20
(US Census Bureau, 2010).

40
As with youth, sidewalks appear to be skewed toward block
groups in the middle range of older adults as a percent of popu-
lation. In contrast to findings on youth, it appears that there are
concentrations of older adults. Map 6 (page 19) shows several
contiguous areas with higher percent older adult populations,
especially west of I-5. The mean among block groups is 11 per-
cent, with a standard deviation of 5 percent.
Disparate impacts by School SES
School SES is measured by the percent of students participating
in free and reduced-price meal (FRPM) programs. Of the 51 K-12
schools in unincorporated Clark County, 11 are private and no
data are available on SES. Of the 40 remaining schools, partici-
pation in free and reduced lunch programs ranges from 16.9% to
68.5% of students, with a mean of 39.8%. Similar to income data
at the neighborhood level, three categories of school SES were
created based on tertiles (see table 18).
SECTION 2: ASSESSMENT
HIA: Clark County Bicycle & Pedestrian Master Plan Clark County Public Health 2010
Block group
percent older
adults
2009 Average
bikeway density
Average
additional
proposed
2015 Average
bikeway density
Low 1.30 0.35 1.65
Med 0.99 0.56 1.55
High 1.15 0.94 2.09
Table 16. Average bikeway network density by block group percent older adults
Block group per-
cent older adults
Proposed
sidewalk miles
Percent of all proposed
sidewalk miles
Low 1.97 28%
Medium 3.59 50%
High 1.59 22%
Total 7.15 100%
Table 17. Proposed sidewalks by block group percent older adults
SES Category Description Values
#
Schools
Highest 1/3 of FRPM Participation 47.5% - 68.5% 14
Middle 1/3 of FRPM Participation 31.1% - 47.4% 13
Lowest 1/3 of FRPM Participation 16.9% - 31.0% 13
Table 18. School SES analysis categories
10.6% of Clark County
residents are age 65 or
older (US Census Bureau,
2010).

41
About half (51 miles) of all proposed bikeway miles is are within
a 1-mile network buffer of a K-12 school. As shown in table 19,
low SES schools seem to be favored by existing conditions,
whereas high SES schools appear to be favored by the proposed
projects. Middle SES schools appear not to be as well served.
However, neither an ANOVA nor tests for correlations demon-
strate any statistically significant relationship between average
bikeway network density and school SES. Similarly, there is no
significant correlation between the percent of students partici-
pating in free or reduced meal programs and bikeway network
density.
Like bikeways, about half of all proposed sidewalk miles (3.5
miles) are within a 1-mile network buffer of a K-12 school. Table
20 shows that nearly half of those sidewalks planned near
schools are within 1 mile of a low SES school. While this appears
as a uneven distribution of new projects, this impression is di-
minished by the fact that only 3.5 miles of sidewalks in total are
proposed near schools, and that given the lack of data on exist-
ing sidewalks, it is impossible to tell which schools are already
well served.
SECTION 2: ASSESSMENT
HIA: Clark County Bicycle & Pedestrian Master Plan Clark County Public Health 2010
School SES 2009 Average
bikeway density
Average addi-
tional proposed
2015 Average
bikeway density
Low SES 2.07 0.61 2.20
Middle SES 1.30 .78 1.57
High SES 1.22 1.37 2.60
Table 19. Average bikeway network density by school SES
School SES Proposed sidewalk
miles
Percent of proposed sidewalk miles
near schools
Private Schools 0.21 5.9%
Low SES 1.75 49.6%
Middle SES 0.55 15.6%
High SES 1.02 28.9%
Total 3.53 100%
Table 20. Proposed sidewalks by school SES

42
Policies
Impact
CCPH finds that, if implemented, all proposed policies will sup-
port or increase opportunities for physical activity.
Strength of Evidence
Depending on the policy, there is a range of evidentiary support
for determining the impact of policies. Some policies, such as
“implement a variety of facility types to meet the needs of di-
verse users”, are strongly supported by research suggesting a
link between physical activity and changes in the built environ-
ment. Others are based more on specific needs, community in-
put, or best practices.
An important consideration in the assessment of the policies
proposed in the plan is that they essentially remain proposals
unless codified or otherwise implemented. This leaves a broad
range of uncertainty about their impact, especially considering
the potential for some policies to interact with and build on each
other (such as providing new facilities and encouraging active
transportation). As described in the plan, these policies will be
incorporated into the 2014 Comprehensive Plan update. There-
fore, for purposes of this assessment we assume that the policies
will be implemented. However, if policies are not implemented,
any positive effects may be lost, and existing disparities may
worsen.
There are 67 policies listed in the plan as objectives or actions
falling under six goals. Due the variability in possible implemen-
tation strategies, we are unable to reliably assess the magnitude
of health impacts resulting from policy proposals, but the direc-
tion of change and strength of evidence are listed in the table on
the following page. When applicable, disparate impacts are also
listed. Policies that have an indirect impact or are related to
planning & funding are categorized as “supportive”, while poli-
cies that are likely to directly lead to increased physical activity
are listed as “positive”. The strength of evidence is categorized
according to the system laid out in Section 1 (summarized in ta-
ble 21). In some cases, the strength of evidence is “Limited” be-
cause it is a highly specific policy and there is no specific, rele-
vant research.
CCPH finds that, if
implemented, all
proposed policies will
support or increase
opportunities for physical
activity in Clark County.
Plan Goals:
1. Developing a bicycle
and pedestrian
network
2. Jurisdictional
coordination
3. Traffic management/
demand management
4. Education,
encouragement, and
safety programs
5. Funding
6. Active transportation
planning and bicycle
and pedestrian
supportive land uses
SECTION 2: ASSESSMENT
HIA: Clark County Bicycle & Pedestrian Master Plan Clark County Public Health 2010
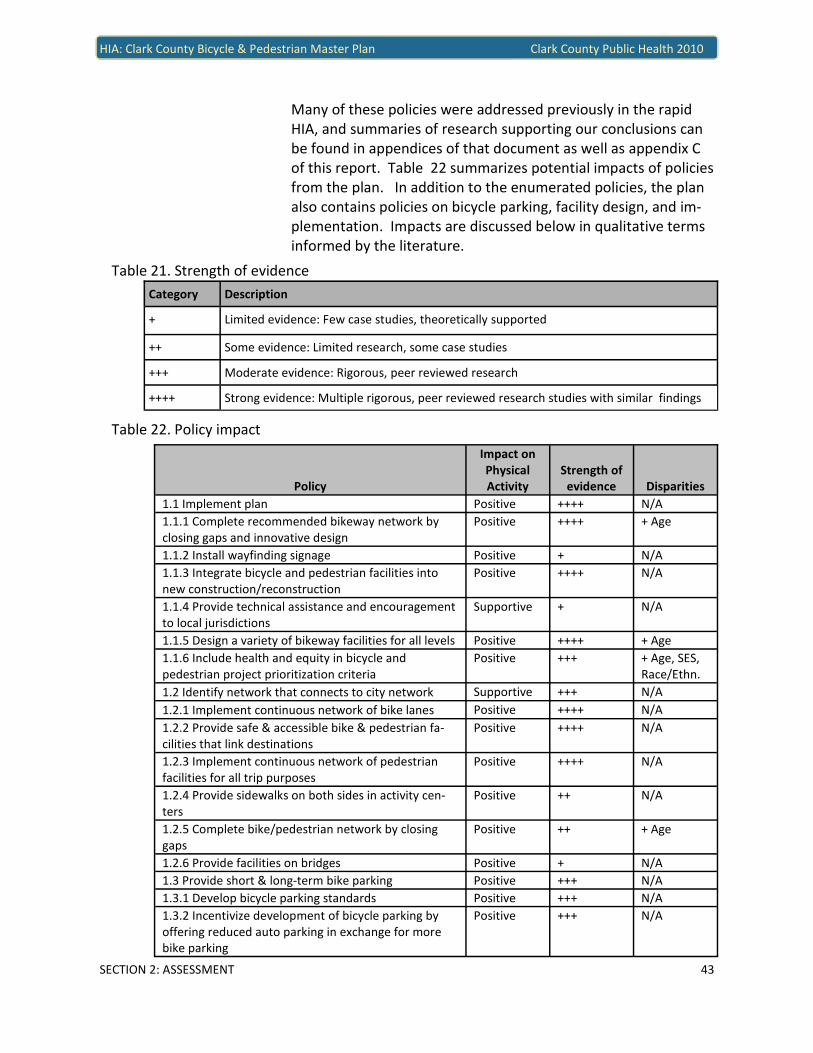
43
Many of these policies were addressed previously in the rapid
HIA, and summaries of research supporting our conclusions can
be found in appendices of that document as well as appendix C
of this report. Table 22 summarizes potential impacts of policies
from the plan. In addition to the enumerated policies, the plan
also contains policies on bicycle parking, facility design, and im-
plementation. Impacts are discussed below in qualitative terms
informed by the literature.
SECTION 2: ASSESSMENT
HIA: Clark County Bicycle & Pedestrian Master Plan Clark County Public Health 2010
Category Description
+ Limited evidence: Few case studies, theoretically supported
++ Some evidence: Limited research, some case studies
+++ Moderate evidence: Rigorous, peer reviewed research
++++ Strong evidence: Multiple rigorous, peer reviewed research studies with similar findings
Table 21. Strength of evidence
Table 22. Policy impact
Policy
Impact on
Physical
Activity
Strength of
evidence Disparities
1.1 Implement plan Positive ++++ N/A
1.1.1 Complete recommended bikeway network by
closing gaps and innovative design
Positive ++++ + Age
1.1.2 Install wayfinding signage Positive + N/A
1.1.3 Integrate bicycle and pedestrian facilities into
new construction/reconstruction
Positive ++++ N/A
1.1.4 Provide technical assistance and encouragement
to local jurisdictions
Supportive + N/A
1.1.5 Design a variety of bikeway facilities for all levels Positive ++++ + Age
1.1.6 Include health and equity in bicycle and
pedestrian project prioritization criteria
Positive +++ + Age, SES,
Race/Ethn.
1.2 Identify network that connects to city network Supportive +++ N/A
1.2.1 Implement continuous network of bike lanes Positive ++++ N/A
1.2.2 Provide safe & accessible bike & pedestrian fa-
cilities that link destinations
Positive ++++ N/A
1.2.3 Implement continuous network of pedestrian
facilities for all trip purposes
Positive ++++ N/A
1.2.4 Provide sidewalks on both sides in activity cen-
ters
Positive ++ N/A
1.2.5 Complete bike/pedestrian network by closing
gaps
Positive ++ + Age
1.2.6 Provide facilities on bridges Positive + N/A
1.3 Provide short & long-term bike parking Positive +++ N/A
1.3.1 Develop bicycle parking standards Positive +++ N/A
1.3.2 Incentivize development of bicycle parking by
offering reduced auto parking in exchange for more
bike parking
Positive +++ N/A

44
SECTION 2: ASSESSMENT
HIA: Clark County Bicycle & Pedestrian Master Plan Clark County Public Health 2010
Policy
Impact on
Physical
Activity
Strength of
evidence Disparities
1.4 Increase # of bike-transit trips and pedestrian
access to transit
Positive ++++ + SES
1.4.1 Provide on-street bicycle and pedestrian
connection to transit centers and bus stops
Positive + + SES, Age
1.5 Develop trails within parks Positive ++ + Age
1.5.1 Provide on-street bicycle and pedestrian
connections to trails
Positive +++ N/A
1.5.2 Change Title 40 to include park code that guides
development standards for parks
Supportive + N/A
2.1 Facilitate coordination among jurisdictions Supportive + N/A
2.1.1 Develop tools & guidance for local jurisdictions Supportive + N/A
2.1.2 Establish & maintain regular communications Supportive + N/A
2.1.3 Work with jurisdictions to ID bike & pedestrian
routes throughout the county, connect to city facilities
Supportive + N/A
3.1 Encourage use of alternative types of transporta-
tion through TDM
Positive ++ N/A
3.1.1 Publicize availability of maps and connections to
transit
Positive + N/A
3.2 Ensure facilities are designed to most recent
guidelines & best practices
Positive ++ N/A
3.2.1 Ensure compliance with ADA Positive ++ N/A
3.2.2 Support excellence among staff by ensuring
exposure to new designs
Positive ++ N/A
3.2.3 Develop and implement a county-wide training
program for engineers & planners
Supportive + N/A
4.1 Promote bike & pedestrian safety through
education, encouragement & enforcement
Positive +++ N/A
4.1.1 Continue existing programs Positive +++ N/A
4.1.2 Collaborate with schools to use federal & state
SRTS funds
Positive +++ + Age
4.1.3 Include temporary street closures as a program
proposal
Positive ++ + Age
4.2 Promote cycling and walking for transportation Positive +++ N/A
4.2.1 Encourage employers to provide incentives Positive ++ N/A
4.2.2 Encourage jurisdictions to provide incentives to
businesses and residents completing development
that includes facilities
Supportive ++ N/A
4.3 Promote bike & ped safety through enforcement Positive ++ + Age
4.3.1 Stricter law enforcement Positive ++ + Age
4.3.2 Recognize increasing numbers of cyclists and
pedestrians as a safety strategy
Positive ++++ N/A
4.4 Maintain and improve quality, operation, and
integrity of facilities
Positive ++ N/A
4.4.1 Develop maintenance program Supportive + N/A
4.4.2 Install continuous counting devices to track
ridership goals
Supportive + N/A
Table 22 continued

45
Impact of Parking Standards
In addition to the above policies, the plan dedicates chapter 5 to
recommended bicycle parking standards and policies. The park-
ing proposals, if implemented, are likely to increase opportuni-
ties for physical activity and are supported by a moderate base
of evidence in addition to the experience of planning experts
(Pucher and Buehler, 2008; Pucher et al, 2009).
SECTION 2: ASSESSMENT
HIA: Clark County Bicycle & Pedestrian Master Plan Clark County Public Health 2010
Policy
Impact on
Physical
Activity
Strength of
evidence Disparities
4.4.3 Establish policies & protocols to ensure repair and
construction minimize disruption
Supportive + N/A
4.4.4 Use crash data to monitor bike & ped safety, target
10% reduction over 20 years
Supportive ++++ N/A
5.1 Fund construction of bike/pedestrian improvements
& maximize funding
Positive ++++ N/A
5.1.1 Seek funding through current sources, leverage
these sources though local partnerships
Supportive + N/A
5.1.2 Include cost of short term projects in CIP Positive ++++ N/A
5.1.3 Aggressively pursue grants Supportive + N/A
5.1.4 Maintain current information regarding regional,
state and federal funding programs
Supportive + N/A
5.1.5 Partner with other agencies to pursue funding Supportive + N/A
5.1.6 Coordinate development of Transportation Benefit
District
Positive + N/A
5.2 Pursue voluntary and private funding Positive + N/A
5.2.1 BPAC will pursue a voluntary fund Positive + N/A
5.2.2 BPAC will work to develop private partnerships Positive + N/A
6.1 Increase development practices supportive of
walking and cycling
Positive ++++ N/A
6.1.1 Ensure consistent review of road projects and
development proposals
Positive +++ N/A
6.1.2 Include low-speed roadway designs as bicycle and
pedestrian projects
Positive +++ N/A
6.1.3 Prioritize projects and adopt policies that increase
measures of walkability
Positive ++++ N/A
6.1.4 Change title 40 to limit construction of cul-de-sacs Positive ++++ N/A
6.1.4 Change title 40 to promote ped & bike friendly
design through human-scale development
Positive ++++ N/A
6.1.5 Change title 40 to encourage a density & provisions
for facilities
Positive ++++ N/A
6.2 Improve bicycle and pedestrian access to nutritious
food
Supportive ++ N/A
6.2.1 Prioritize bicycle and pedestrian improvements
that provide routes to grocery stores and farmers mar-
kets
Supportive ++ N/A
6.2.2 Encourage grocery stores and farmers' markets to
locate along existing bike pedestrian corridors
Supportive + N/A
Table 22 continued

46
Impact of Facility Design
Facility design will impact physical activity, as it is well docu-
mented that facility types with a greater degree of separation
are safer and attract more users (Pucher et al, 2009). Chapter 6
of the plan is dedicated to a matrix of best design practices,
many of which are supported by increasing evidence and experi-
ence. Design practices that incorporate separation from traffic
and low-traffic speeds are likely to increase physical activity, and
the approach of implementing a variety of facility types is sup-
ported by research (Pucher et al, 2009; Dill and Gliebe, 2008).
Although the best practices matrix identifies numerous facility
types and treatments, such as bike boulevards and cycle tracks,
the plan recommends only two designs, lanes and trails, as pri-
oritized bikeway projects. It is unlikely that such a limited variety
of designs will attract any new cyclists.
The plan does not link the best practices matrix to any proposed
facilities or policies. Instead, the best practices matrix is pre-
sented in the plan as a basis for future committee work. A de-
sign program is referenced in Chapter 6 of the plan, but it is un-
clear how the program relates to codified standards or adopted
guidelines, as it is not referenced in the discussion of implemen-
tation in Chapter 7. In the future, development of such guide-
lines could increase opportunities for physical activity, but the
current plan falls short of guaranteeing any changes to design
standards.
A strength of the design program is the set of key principles
(reproduced below) that are included as in Chapter 6.
• All roads in Clark County are legal for the use of bicyclists,
except limited access interstates which specifically prohibit
bicyclists.
• Bicyclists have a range of skill levels, from Type B/C to Type
A.
• Facilities will be designed for the use of Type “A” cyclists and
for Type “B” cyclists to the greatest extent possible.
• Design guidelines are flexible and can be applied with profes-
sional judgment by designers.
• Clark County will have a complete network of on-street bicy-
cling facilities to connect seamlessly to the existing and pro-
posed off-street pathways.
SECTION 2: ASSESSMENT
HIA: Clark County Bicycle & Pedestrian Master Plan Clark County Public Health 2010
“One would assume that
people would be more
likely to walk if walking
trips became more
pleasant, safer, or in any
sense easier, or if
alternatives to walking
became more costly or
more difficult.” - TRB & IOM

47
Consistent with research findings on the success of low-speed,
separated bicycle facilities, these principles recognize a range of
cycling ability and corresponding needs. However, a notable
omission in these principles is any direct reference to the needs
of pedestrians. With the exception of the matrix of best prac-
tices, most of the chapter heavily emphasizes bicycle infrastruc-
ture. The result is that while it is unclear how bicycle facility de-
sign guidelines will be updated and codified, it is even more un-
clear how the county will proceed with pedestrian design guide-
lines.
Impact of Implementation Strategies
The implementation strategies discussed in Chapter 8 of the
plan, including funding strategies, are likely to increase opportu-
nities for physical activity. The implementation plan contains
language advocating a sustainable funding source for bicycle and
pedestrian transportation and leveraging this funding to win fed-
eral and state grants. Such funding strategies would require a
commitment from the county to fund and prioritize active trans-
portation infrastructure.
Notably, the plan articulates the need to avoid any funding strat-
egy that would create a barrier to cycling and walking, such as a
bicycle registration fee. This is an important statement, as any
funding strategy that makes walking and cycling less attractive
than other modes of transportation would be a disincentive for
physical activity.
Two of the six implementation strategies are not directly related
to funding: these include a broader integration of bicycle and
pedestrian planning with other planning efforts, and a commit-
ment to collect better data on bicycle and pedestrian activity.
These two strategies will likely support increased opportunities
for physical activity and related tasks have been included in the
2011-2012 work plan for Community Planning.
Programs
Impact
CCPH finds that, if implemented, the proposed programs will
support increased opportunities for physical activity, and that
there are no negative differential impacts of these programs.
Some positive differential impacts could benefit older and
younger age groups.
SECTION 2: ASSESSMENT
HIA: Clark County Bicycle & Pedestrian Master Plan Clark County Public Health 2010
CCPH finds that, if
implemented, proposed
programs will support
increased opportunities
for physical activity

48
Strength of Evidence
The proposed programs are supported by a range of evidence
relating to their influence on physical activity. Strong evidence
supports school programs, and limited evidence supports all
other programs.
Programs were evaluated in a similar manner to policies, recog-
nizing that their impact depends on the degree of implementa-
tion. These programs are described as near-term proposals in
the plan and the newly re-formed Bicycle and Pedestrian Advi-
sory Committee is charged with implementing them using grant
funding.
There are five programs recommended in the plan, narrowed
from a field of 17 originally suggested by the plan consultant.
Two of these programs (see numbers 1 and 5 in table 23) are
aimed at streamlining the development of new facilities and are
therefore categorized as “supportive” of physical activity.
Process
Impacts
CCPH finds that the planning process omitted potential data in-
puts, thereby limiting the ability of the plan to maximize health
benefits.
Throughout the planning process there were two areas of oppor-
tunity to maximize health benefits. First, advisory committee
members were provided information on health and the built en-
vironment and encouraged by planners to find ways of maximiz-
ing health benefits through projects, policies, and programs.
Second, it offered a way to improve health through empowering
citizens and building social cohesion. The discussion that follows
SECTION 2: ASSESSMENT
HIA: Clark County Bicycle & Pedestrian Master Plan Clark County Public Health 2010
Program Impact on Phys.
Activity
Strength of
Evidence
Disparate
Impacts
1. Revise the bicycle and pedestrian advisory
committee
Supportive + N/A
2. Create a school education & encouragement
program
Positive ++++ + Age
3. Establish a “Clarklovia” Positive + + Age
4. Establish an east county scenic tour Positive + N/A
5. Improve communications within departments Supportive + N/A
Table 23. Program impact
CCPH finds that the
planning process omitted
important data inputs,
thereby limiting the
ability of the plan to
maximize health benefits.

49
is a description of the process and the extent to which it lever-
aged these two opportunities.
The planning process spanned a time period of more than 18
months. Public involvement, described in Chapter 1 of the plan,
included four open houses, an online survey, a Planning Commis-
sion work session, three Board of County Commissioners work
sessions, and one hearing each for the Planning Commission and
Board of County Commissioners. During these outreach events,
Community Planning staff discussed projects, policies, and pro-
grams with the public, focusing especially on funding strategies.
There are numerous ways to generate potential projects, poli-
cies, and programs. For this plan, the bicycle and pedestrian ad-
visory committee drafted policies and revised them through dis-
cussions. A list of potential programs was presented by consult-
ants, and committee members and staff selected those that
seemed most feasible and effective. Projects, on the other hand,
are often subject to a more quantitative analysis, as was the case
in this plan. Project prioritization criteria were established by
the committee, although the project list was generated from a
variety of sources. Figure 3 depicts a conceptual diagram of how
prioritized projects are selected. The inputs listed in this model
come from other planning processes and from FHWA guidelines
SECTION 2: ASSESSMENT
Citizen
Requests
Crash data
High use
w/poor
conditions
Inventory/
ID gaps
Public input
Project List
(Needs) CriteriaPrioritized
Project List
Inputs
Existing
documents
Citizen
Requests
Crash data
High use
w/poor
conditions
Inventory/
ID gaps
Public input
Project List
(Needs) CriteriaPrioritized
Project List
Inputs
Existing
documents
Figure 3. Project List
Generation
HIA: Clark County Bicycle & Pedestrian Master Plan Clark County Public Health 2010

50
for bicycle and pedestrian planning (FHWA, 2006), and only
some of them were employed in this planning process. For the
both bicycle projects and pedestrian projects, four of the six
strategies were used to varying degrees. In general, bicycle pro-
ject list generation methods were more thorough than those
used to identify potential pedestrian projects. A brief summary
of project list generation for each mode is provided below.
Bicycle projects
Potential bicycle projects were generated through citizen input,
an existing facility inventory, public input, and existing proposals.
Citizen input accounts for a relatively minor portion of the pro-
ject ideas, although many were identified by citizens at commu-
nity meetings early in the planning process. Existing proposals
were exhaustively compiled from all jurisdictions and Vancouver-
Clark Parks. Volunteers from the Bicycle and Pedestrian Advisory
Committee conducted an inventory of bicycle facilities in unin-
corporated areas.
Pedestrian projects
The majority of pedestrian projects are complaint/request-
driven through requests made to the county’s pedestrian infill
program. Additional pedestrian project proposals are drawn
from analysis of existing conditions and from open houses. Par-
tial inventories have been completed for unincorporated areas,
focusing on the sub-area planning areas that have recently been
completed or are underway. These include the Salmon Creek
and Highway 99 sub-areas.
Omitted inputs
Whereas crash data was analyzed in this HIA, it was not used as
an input in project list generation for bicycle projects nor for
sidewalk projects. Similarly omitted was any analysis of areas
that typically receive high volumes of bicycle or pedestrian traf-
fic, yet do not have adequate facilities. For sidewalk data, there
is no comprehensive, accurate inventory of the existing sidewalk
network making the identification of gaps impossible. It is possi-
ble however, that project lists from existing documents take
these inputs into consideration.
Impact of the Planning Process: Maximizing Health Benefits
The project prioritization criteria appropriately focus projects
where they can have the greatest impact on health. This is ac-
complished by targeting areas with lower socioeconomic status
SECTION 2: ASSESSMENT
HIA: Clark County Bicycle & Pedestrian Master Plan Clark County Public Health 2010

51
and high walkability potential.
The project list generation procedure may undermine the effort
to maximize health benefits of the proposed projects. Without
completing a comprehensive inventory of pedestrian facilities, it
is impossible to accurately map and prioritize the needs of the
county. Likewise, we are unable to determine which areas are
already well served by pedestrian facilities, limiting our ability to
determine whether existing conditions have disparate impacts
on vulnerable populations. Although safety is a prioritization cri-
terion, it is measured only by the degree of separation offered by
each proposed facility and does not take into account crash sta-
tistics. The emphasis on separation is appropriate given the im-
portance of perceived safety in cycling and walking, but failing to
include and respond to data on specific existing safety hazards
may lead to missed opportunities to identify and correct these.
The policy development process considered community needs as
well as research and is likely to facilitate increases in physical ac-
tivity as a result. A deliberative process and multiple revisions
took broad input into account in developing goals and policies,
and project criteria were linked to goals and vision statements
adopted by the committee. Public input is documented in the
appendix of the plan.
The process of creating program recommendations was con-
ducted by first reviewing a list of internationally recognized pro-
grams developed by a consultant, then selecting the few that
appeared to be a “best fit”. This selection was done by staff
without explicit criteria, apparently based largely on feasibility.
Staff made recommended five programs to the committee,
which adopted their recommendation. This process was less
transparent than the processes for developing projects and poli-
cies, so it is somewhat more difficult to judge its impacts.
Whereas CCPH staff were consulted in the selection of these pro-
grams, there was no formal or explicit intent to select programs
based on their potential to maximize physical activity.
Impact of the Planning Process: Building Social Cohesion
The process of developing projects, policies, and programs was
largely committee-driven and highly responsive to community
input, although the community of interested parties was rela-
tively small. As a result of a large degree of control by the plan-
ning committee, the process could be characterized as a fairly
SECTION 2: ASSESSMENT
HIA: Clark County Bicycle & Pedestrian Master Plan Clark County Public Health 2010

52
high level of citizen empowerment. However, the committee
itself was formed by volunteers invited by Community Planning,
and while they represent a diverse group of stakeholders and
public agencies, most (13) committee members were serving in a
professional capacity. An additional seven members repre-
sented an advocacy group or county committee, leaving only
three unaffiliated members. We point this out not because the
committee composition is in any way inappropriate or inade-
quate; on the contrary, the group worked diligently and produc-
tively to integrate community feedback into the plan. Rather,
the composition of the group tempers our conclusion that there
was a high degree of citizen empowerment throughout the proc-
ess. Citizens did indeed fully participate and influence the plan,
but many of them were doing so in a professional capacity.
Achieving a broader base of community input was a challenge in
this process, but if it could be met in the future, Clark County
could create a plan with more robust community input.
SECTION 2: ASSESSMENT
HIA: Clark County Bicycle & Pedestrian Master Plan Clark County Public Health 2010

53
References for Section 2 Adler N. & Newman K. (2002) Socioeconomic disparities in health: Pathways
and policies. Health Affairs, 2(21), 60-76
Adler N.E. & Rehkopf D.H. (2008) U.S. Disparities in health: Descriptions,
causes, and mechanisms. Annual Review of Public Health, (29), 235-52
US Census Bureau, American FactFinder. (2009) American community survey 1-
year estimates [data files]. Retrieved from http://factfinder.census.gov/
Besser L. & Dannenberg A. (2005) Walking to public transit: Steps to help meet
physical activity recommendations. American Journal of Preventive Medi-
cine, 29(4), 273-280
Brownson R.C., Hoehner C.M., Day K., Forsyth A., & Sallis J.F. (2009) Measuring
the built environment for physical activity. American Journal of Preventive
Medicine, 36 (4 Suppl), S99-123
CDC. (2005) Barriers to children walking and biking to school— United States,
2004. MMWR 54(38), 949-952
City of Portland (2010). Portland bicycle plan for 2030. Portland, OR: City of
Portland
Clark County Public Health (2009) Clark county, Washington demographic fact
sheet. Vancouver, WA: Clark County Public Health
Clark County Public Health (2010). Community planning, assessment, and
evaluation report. Vancouver, WA: Clark County Public Health
Clifton K.J., Smith A.D.L., & Rodriguez D. (2006) The development and testing
of an audit for the pedestrian environment. Landscape and Urban Plan-
ning, 80(1-2), 95-110
CNT (2010) H+T Affordability Index. [Interactive map] Retrieved from http://
htaindex.cnt.org/
Community Choices (2010). Community report card. Vancouver, WA: Commu-
nity Choices
CSDH (2008). Closing the gap in a generation: health equity through action on
the social determinants of health. Final Report of the Commission on Social
Determinants of Health. Geneva: World Health Organization
Dill, J. and Carr, T. (2003). Bicycle commuting and facilities in major U.S. cities:
If you build them, commuters will use them. Transportation Research
Record, 1828, 116-123
Dill J., & Gliebe J. (2008) Understanding and measuring bicycling behavior: A
focus on travel time and route choice. Portland, OR: Oregon Transporta-
tion Research and Education Consortium
Dill, J. (2009). Bicycling for transportation and health: the role of infrastructure.
Journal of Public Health Policy, 30, S95-S110
Dill J., & Haggerty B. (2009) Equity analysis of Portland's draft bicycle master
plan—findings. Portland, OR: Portland State University Center for Trans-
portation Studies Retrieved from http://www.portlandonline.com/
transportation/index.cfm?c=44597&a=264747
FHWA (2006). Bicycle and Pedestrian Planning. In Federal Highway Administra-
tion University Course on Bicycle and Pedestrian Transportation (Lesson 4).
Retrieved from http://www.fhwa.dot.gov/publications/research/safety/
pedbike/05085/chapt4.cfm
FHWA (2009). Manual on Uniform Traffic Control Devices. Washington, D.C.:
United States Department of Transportation
Frank L.D., Saelens B.E., Powell K.E., & Chapman J.E. (2007) Stepping towards
causation: Do built environments or neighborhood and travel preferences
explain physical activity, driving, and obesity?. Social Science & Medicine,
(65) 1898-1914
Institute of Portland Metropolitan Studies. (2010). Percent of Kaiser Perma-
nente adult members obese by census tract in Clark County, 2007. [Map
made at request of Public Health]. Portland, OR: Portland State University
SECTION 2: ASSESSMENT
HIA: Clark County Bicycle & Pedestrian Master Plan Clark County Public Health 2010
Jacobsen, P. (2003). Safety in numbers: more walkers and bicyclists, safe walking
and bicycling”. Injury Prevention, 3, 205-209.
Kerr J., Rosenberg D., Sallis J., et al. (2006) Active commuting to school: Associations
with environment and parental concerns. Medicine and Science in Sports and
Exercise, 38(4), 787-794
Krizek, K., & Johnson P.J. (2006) Proximity to trails and retail: Effects on urban
cycling and walking. Journal of the American Planning Association, 72(1), 33-42
Levi J., Vinter, S., St. Laurent R., Segal L.M. (2010) F as in fat: How obesity threatens
America's future. Washington, D.C.: Trust for America’s Health
McCormack G.R., Giles-Corti B., Bulsara M. (2008) The relationship between desti-
nation proximity, destination mix, and physical activity behaviors. Preventive
Medicine, (46), 33-40
Pucher, J., Buehler, R., (2008). Making cycling irresistible: Lessons from the Nether-
lands, Denmark, and Germany. Transport Reviews 28 (4), 495–528
Pucher J., Dill J., & Handy S. (2010) Infrastructure, programs, and policies to increase
bicycling: An international review. Preventive Medicine, (50) S106-S125
Saelens, B., Sallis J.F., Frank L.D. (2003) Environmental correlates of walking and
cycling: Findings from the transportation, urban design, and planning litera-
tures. Annals of Behavioral Medicine, 25(2), 80-91
Transportation Research Board and Institute of Medicine of the National Acad-
emies. (2005) Does the Built Environment Influence Physical Activity? Examin-
ing the Evidence. Special Report 282. Transportation Research Board, Wash-
ington, D.C.
US Census Bureau (2010). 2009 American community survey 1-year and 5-year
estimates. [Data files]. Retrieved from http://factfinder.census.gov
Washington State Department of Health. Behavioral risk factor surveillance system
2003-2008 [Data files]. Olympia, WA
Williams D.R.., Neighbors H.W., & Jackson J.S. (2008) Racial/ethnic discrimination
and health: Findings from community studies. American Journal of Public
Health, 98(Suppl 1) S29-S37

As the plan is implemented and updated, there are opportunities
to improve it and more fully realize health benefits. This section
enumerates specific recommendations that should be incorpo-
rated either as the plan is implemented or in future updates of
the plan. As in other sections of this report, we categorize rec-
ommendations as relating to projects, policies, and programs.
Also included are some overarching recommendations that re-
flect three themes drawn from analysis of the plan.
Overarching Recommendations
Recommendation 1. Update the plan within five years.
Although the plan presents a 20-year vision, it prioritizes projects
on a 6-year time horizon. Updating the plan could range from
small-scale, ad-hoc amendments to a complete revision. An up-
date will enable the county to revisit the prioritized projects as
well as the plan vision. Additionally, updating the plan allows
the community to respond to new needs and changing economic
conditions.
Recommendation 2. Use data to prioritize proposals and track
progress.
Quantitative indicators of progress should be adopted through
the implementation of this plan and in future efforts. According
to findings from the Federal Highway Administration, the Ameri-
can Association of State Highway and Transportation Officials,
and the National Cooperative Highway Research Program, juris-
dictions that successfully increase cycling and walking also use
progress indicators to ensure that goals are met. Adopting indi-
cators does not need to be tied to funding, but demonstrated
success can help position the county to be competitive in grant
applications. Future efforts in Clark County should include 1) ob-
jectives that lead to desirable levels of service; 2) identification
of government agency implementation responsibilities and time-
lines; and 3) benchmarks and performance measures for assess-
ing progress. Ensuring that the objectives of this plan are met
will likely increase physical activity.
SECTION 3: RECOMMENDATIONS 54
HIA: Clark County Bicycle & Pedestrian Master Plan Clark County Public Health 2010
SECTION 3: RECOMMENDATIONS
Recommendations
1. Update the plan within
five years.
2. Use data to prioritize
proposals and track
progress.
3. Respond to the needs
of a continuum of
users and trip types.
4. Use innovative
designs and a variety
of facility types.
5. Create a comprehen-
sive inventory of
sidewalks.
6. Fully implement
policies.
7. Target zero bicycle and
pedestrian crashes.
8. Use crash data in
project prioritization.
9. Focus on low SES
neighborhoods.
10. Develop criteria for
selecting programs.
11. Use proven approaches
in school programs

55
Recommendation 3. Respond to the needs of a continuum of
users and trip types.
Research supports the effectiveness of using a variety of facility
types to accommodate different skill levels and trip purposes. To
maximize health benefits in implementation of this and future
plans, increasing the number of cyclists and pedestrians is criti-
cal. Increasing the number of cyclists requires understanding
their needs. Some jurisdictions have approached this by identi-
fying a typology of cyclists ranging from the “strong and fearless”
to “interested but concerned” and finally to “not interested”.
This approach is increasingly supported by research showing that
recreational cyclists have different needs and behaviors than
utilitarian cyclists, and that cyclist needs differ depending on age,
gender, and skill/comfort level. Additionally, as the county
population ages, we are likely to see increasing numbers of dis-
abled individuals, emphasizing the need for universal design.
Project Recommendations
Recommendation 4. Use innovative designs and a variety of
facility types.
Evidence shows that a variety of facility types, especially low-
speed traffic designs, are more effective at attracting new cy-
clists (Pucher et al, 2009; Dill, 2009; Dill & Gliebe, 2008; FHWA,
2010). Designs such as bicycle boulevards and cycle tracks im-
prove real and perceived safety. While many of these designs
are included in the plan’s matrix of best practices, they are not
included in prioritized projects. A mix of low-speed traffic facility
types is likely to attract cyclists and increase physical activity.
Recommendation 5. Create a comprehensive inventory of
sidewalks.
Without a clear picture of existing conditions, it is difficult to
identify the highest priority pedestrian projects. An inventory
that includes qualitative information such as sidewalk width,
presence of planted buffers, and ADA compliance would result in
a better system of prioritization.
SECTION 3: RECOMMENDATIONS 55
HIA: Clark County Bicycle & Pedestrian Master Plan Clark County Public Health 2010

56
Policy Recommendations
Recommendation 6. Fully implement policies.
Many of the policies in the plan have strong potential to influ-
ence opportunities for physical activity in Clark County. To the
extent possible, these policies should be codified in the county’s
development code or included in the work plan for various agen-
cies.
Recommendation 7. Target zero pedestrian and bicycle crashes.
The target identified in policy 4.4.4 is a 10 percent reduction in
pedestrian and bicycle crashes on a per capita basis over twenty
years. If the community were to achieve this goal, bicycle and
pedestrian fatalities per 100,000 population would decline from
about .47 in 2009 to about .42 in 2030. Using Washington State
population projections, this would result in about 2.4 fatalities in
2030, up from 2.0 in 2009. Given that such crashes are prevent-
able, we envision a future for Clark County free of pedestrian
and bicycle crashes. Adopting a target of zero pedestrian and
bicycle injuries and fatalities by 2030 would be consistent with
Washington State goals as articulated in Washington State’s Stra-
tegic Highway Safety Plan (2010).
Recommendation 8. Use crash data in prioritization criteria.
To help accomplish a target of zero bicycle and pedestrian
crashes, relevant data should be used as an element of the pri-
oritization process. Using crash data as criteria in project list
generation could lead the county to identify hazardous locations
and target solutions to reduce crashes. Crash data should be in
alignment with current safety criterion, which focuses on degree
of separation from auto traffic. This approach would address
both real and perceived safety.
Recommendation 9. Focus on low SES neighborhoods.
Data from the CAPE (Community Assessment, Planning and
Evaluation) report show that lower SES residents have consis-
tently worse health outcomes than residents of middle and high
SES. One way to address this disparity is to increase opportuni-
ties for physical activity in lower SES neighborhoods.
SECTION 3: RECOMMENDATIONS
HIA: Clark County Bicycle & Pedestrian Master Plan Clark County Public Health 2010

57
HIA: Clark County Bicycle & Pedestrian Master Plan Clark County Public Health 2010
SECTION 3: RECOMMENDATIONS
Program Recommendations
Recommendation 10. Develop criteria for selecting programs.
Clear criteria for selecting projects are a strength of the plan, and
it could be strengthened more by establishing similar criteria for
programs. The plan prioritizes five program efforts to be under-
taken over the next six or more years. These programs were se-
lected by staff and adopted by the bicycle and pedestrian advi-
sory committee without defined criteria. Future updates of the
plan should establish selection criteria for programs. As with
project criteria, this would facilitate staff analysis and facilitate
review by advisory committee members.
Recommendation 11. Use proven approaches in school programs.
A substantial body of research exists demonstrating the effec-
tiveness of Safe Routes to School programs. The national Safe
Routes to School Partnership emphasizes the success of the 4-E
approach widely recognized for its effectiveness. This approach
goes beyond safety education and encouragement, citing the
reinforcing effects of combining Encouragement, Enforcement,
Engineering, and Education. Adopting evidence-based ap-
proaches will protect children, maximize Safe Routes funding,
and prepare the county for future competitive grants.

58
References for Section 3 Clark County Public Health (2010). Community Planning, Assessment, and Evaluation Report. Vancouver, WA;
Clark County Public Health
Dill J., & Gliebe J. (2008) Understanding and measuring bicycling behavior: A focus on travel time and route choice.
Portland, OR: Oregon Transportation Research and Education Consortium
Dill, J. (2009). Bicycling for transportation and health: the role of infrastructure. Journal of Public Health Policy,
(30), S95-S110
Fischer, E., Rousseau, G., Turner, S., Blais, E., Engelhart, C., Henderson, D., Kaplan, J., Keller, K., Mackay, J., Tobias,
P., Wigle, D., and Zegeer, C. (2010). Pedestrian and Bicyclist Safety and Mobility in Europe (FHWA-PL-10-010),
Federal Highway Administration, Washington, D.C.
Pucher J., Dill J., & Handy S. (2010) Infrastructure, programs, and policies to increase bicycling: An international
review. Preventive Medicine, (50) S106-S125
Washington State Department of Transportation (2010). Washington State Strategic Highway Safety Plan. Olym-
pia, WA: Washington State Department of Transportation. Retrieved from http://www.wsdot.wa.gov/
planning/SHSP.htm
SECTION 3: RECOMMENDATIONS
HIA: Clark County Bicycle & Pedestrian Master Plan Clark County Public Health 2010