
Comprehensive Economic Development Strategy Plan
84
Comprehensive Economic Development Strategy Plan for Metropolitan Kansas City April 2014 Mid-America Regional Council Community Services Corporation 600 Broadway, Suite 200 | Kansas City, MO 64105 816-474-4240 | www.marc.org MID-AMERICA REGIONAL COUNCIL
Transcript of Comprehensive Economic Development Strategy Plan

1 Comprehensive Economic Development Strategy PlanMid-America Regional Council • 2014
Comprehensive Economic Development Strategy Plan
for Metropolitan Kansas City
April 2014
Mid-America Regional Council Community Services Corporation
600 Broadway, Suite 200 | Kansas City, MO 64105816-474-4240 | www.marc.org
MID-AMERICA REGIONAL COUNCIL


1 Comprehensive Economic Development Strategy PlanMid-America Regional Council • 2014
Table of Contents
Introduction ...........................................................................................................................................................3
Analyzing Greater Kansas City’s Economy ...............................................................................................4Population Trends ........................................................................................................................................4Employment ...................................................................................................................................................5Industry Specialization ...............................................................................................................................8Exports .............................................................................................................................................................11Innovation and Entrepreneurship ..........................................................................................................12Education and Workforce ........................................................................................................................13Transportation Access .............................................................................................................................. 14
Kansas City’s Geography and Environment........................................................................................... 20Geography ................................................................................................................................................... 20Waterways and Water Resources ....................................................................................................... 20Air Quality .....................................................................................................................................................22
Disaster Preparedness and Resilience ......................................................................................................23Hazard Mitigation .......................................................................................................................................23Emergency Response ...............................................................................................................................23Recovery ........................................................................................................................................................25
Analysis of Opportunities and Barriers ................................................................................................... 26Capital Access and Business Support ................................................................................................27Education and Workforce ...................................................................................................................... 28Innovation and Entrepreneurship ........................................................................................................ 28Job Access ................................................................................................................................................... 29State Incentives ..........................................................................................................................................30
Economic Development Goals and Objectives ......................................................................................31Economic Development Opportunities ..............................................................................................31Effective Workforce Development ..................................................................................................... 33Infrastructure Development and Transportation........................................................................... 34Sustainable Future Development ........................................................................................................ 34
Action Plan ......................................................................................................................................................... 35
Performance Measures .................................................................................................................................. 38
Community and Private Sector Participation ....................................................................................... 39
Strategic Projects, Programs and Activities .......................................................................................... 43
Appendices ........................................................................................................................................................46A. About MARC ..........................................................................................................................................46B. County Profiles .......................................................................................................................................52C. Historic Places and Landmarks ........................................................................................................ 61D. Endangered Species ............................................................................................................................72E. Hazardous Waste Sites ........................................................................................................................74

2 Comprehensive Economic Development Strategy PlanMid-America Regional Council • 2014
This publication was prepared by the Mid-America Regional Council Community Services Corporation. The statements, findings, conclusions and
recommendations are those of the author(s) and do not necessarily reflect the views of the Economic Development Administration.
The Greater Kansas City Region

3 Comprehensive Economic Development Strategy PlanMid-America Regional Council • 2014
The Comprehensive Economic Development Strategy Plan (CEDS) for Metropolitan Kansas City provides an economic roadmap to help diversify and strengthen the regional economy. This plan is an update to the 2009 plan. It provides an analysis of the current regional economy, integrates human and physical capital into economic planning, and offers useful benchmarks for evaluating progress.
The Mid-America Regional Council Community Services Corporation, a 501(c)3 subsidiary of the Mid-America Regional Council, prepared this CEDS plan on behalf of the 119 cities and nine counties in the bistate Kansas City region. MARC serves as the association of city and county governments and the metropolitan planning organization for the Kansas City area. MARC provides a forum for local jurisdictions and diverse community interests to work together to address the region’s problems and identify the opportunities for cooperative solutions. (For more about MARC, see Appendix A.)
The Kansas City metropolitan region, as defined for this Comprehensive Economic Development Strategy, is composed of 119 municipalities in nine counties spanning 4,400 square miles in two states. The nine counties — Johnson, Leavenworth, Miami and Wyandotte in Kansas, and Cass, Clay, Jackson, Platte and Ray in Missouri — comprise roughly 94 percent of the population of the 15-county Kansas City Metropolitan Statistical Area (MSA) as defined by the Office of Management and Budget. The Kansas City MSA is the 30th largest metropolitan area in the U.S., with approximately 2 million people, 1.2 million jobs and 850,000 households. (For more details about each of the nine counties in the MARC region, see Appendix B.)
Introduction
PLAN GOALS
Economic Development Opportunities
Create a region that supports entrepreneurship and innovation.
Create a region that provides strong support to existing businesses.
Create a region that increases national visibility as a destination of choice for companies and talent.
Create a region that provides quality technology infrastructure.
Effective Workforce Development
Create a region that trains and develops an educated workforce.
Create a region that is able to recruit and attract talented individuals.
Infrastructure and Transportation
Create a region that provides mobility for the workforce.
Create a region that supports a developed infrastructure for targeted industries.
Sustainable Future Development
Create a region that supports development in key corridors and older built neighborhoods.

4 Comprehensive Economic Development Strategy PlanMid-America Regional Council • 2014
Population Trends
The population of the nine-county Kansas City region grew by 14 percent from 2000 to 2013, from 1,724,123 to 1,965,796. Growth is expected to continue, reaching 2.5 million by 2040. Population growth rates vary widely by county.
Jackson County is the region’s largest county in terms of population, followed by Johnson, Clay and Wyandotte counties. Johnson County has grown the most in recent years, though Platte County matches it in percentage terms and Cass and Clay counties are growing almost as fast.
Wyandotte and Jackson counties, which contain the region’s oldest housing and industrial areas, grew steadily until 1970, and then experienced a period of decline. Jackson County’s population began growing again in the 1980s. Recent census estimates indicate that Wyandotte County’s population is beginning to grow again, with a 2 percent increase since 2000.
As the region grows it has also become more diverse. The region’s population is predominantly white, but it has seen increased diversity since 1990. In 1990, the white population accounted for nearly 83 percent of the total, with 13 percent black and 3 percent Hispanic.
By 2010, the percent of white population had fallen to 74 percent, while the black population fell just slightly, to 12 percent. The Hispanic population grew considerably to 8 percent. Two-thirds of the region’s population growth over the past decade has been among people of color.
County2000
Population2013
PopulationChange
2000–2013Percent Change
Cass 82,092 100,641 18,549 23%Clay 184,006 230,473 46,467 25%Jackson 654,880 679,996 25,116 4%Platte 73,781 93,310 19,529 26%Ray 23,354 23,039 -315 -1%Johnson 451,086 566,933 115,847 26%Leavenworth 68,691 78,185 9,494 14%Miami 28,351 32,835 4,484 16%Wyandotte 157,882 160,384 2,502 2%Total 1,724,123 1,965,796 241,673 14%
Analyzing Greater Kansas City’s Economy
2000
1.7 million
2013
1.97 million
2040
2.5 million

5 Comprehensive Economic Development Strategy PlanMid-America Regional Council • 2014
Employment
After struggling to gain traction since the recession, Kansas City’s employment situation made solid progress in 2013. The metro’s seasonally adjusted employment level reached 1,011,200 in November 2013, its highest point since late 2008. Kansas City’s employment still isn’t at pre-recession levels, but should be there by the end of 2014. The metro’s seasonally adjusted unemployment rate ended the year at 5.6 percent.
From January through November 2013 the metro added nearly 12,000 jobs — a marked rebound from 2012 when only 7,500 jobs were added. MARC’s economic forecast projects an additional 14,000 jobs will be added in 2014.
According to a survey of local economic development agencies in September 2013, the top five industry clusters on which communities focused their recruitment efforts were manufacturing, distribution and logistics, automotive, bioscience and animal health, and information technology. Some of the major obstacles that communities face in recruiting new business prospects are a lack of available space, incentives and access to capital.
The region’s population is also aging. Between 2000 and 2010, the Kansas City Metropolitan Statistical Area’s population over age 65 grew from 212,002 to 243,624. The number of adults age 18-64 grew by 12 percent, from 1,136,912 to 1,269,850. Children under 18 grew by 7 percent, from 487,124 to 521,860.
As the Baby Boomer generation ages, the number of people aged 65 and over is expected to nearly double in the coming decades, growing from 11 percent of total population in 2010 to 19 percent in 2030.
20%
15%
10%2010 2020 2030
Projected Population Growth Age 65+, 2010–2030
2010 2011 2012 2013* 2014**
15,000
12,000
9,000
6,000
3,000
11,50012,800
7,500
11,800
14,000
Employment Change
* Through November 2013 ** Forecast for 2014
Unemployment Compared to Peer Metros
December 2013
Omaha ........................... 4.0%
Minneapolis .................. 4.4%
Oklahoma City ............ 5.0%
Austin ...............................5.1%
Kansas City ............... 5.6%
Dallas/Ft. Worth .........5.9%
Denver ........................... 6.0%
Nashville ........................6.2%
Indianapolis ..................6.3%
St. Louis .........................6.8%
Milwaukee .....................7.0%
Cincinnati ......................7.0%
Charlotte ........................7.0%
Sacramento .................. 7.9%

6 Comprehensive Economic Development Strategy PlanMid-America Regional Council • 2014

7 Comprehensive Economic Development Strategy PlanMid-America Regional Council • 2014

8 Comprehensive Economic Development Strategy PlanMid-America Regional Council • 2014
Industry Specialization
The chart below provides a snapshot of total employment by industry for the 15-county Kansas City Metropolitan Statistical Area (MSA). Jobs are grouped by industry using NAICS classifications — a categorization system used by business and government to classify establishments by type of economic activity. Government, including public schools and law enforcement, is by far the greatest employment industry in the region, with about 15 percent of all jobs. Not surprisingly, the Mining, Quarrying, and Oil and Gas Extraction industry ranks lowest in Kansas City regional employment.
Kansas City MSA Employment by Industry
Government
Other Services (Except Public Administration)
Educational Services (Private)
Health Care & Social Assistance
Finance & Insurance
Management of Companies & Enterprises
Retail Trade
Construction
Real Estate, Rental & Leasing
Accommodation & Food Services
Wholesale Trade
Utilities
Professional, Scientific & Technical Services
Transportation & Warehousing
Agriculture, Forestry, Fishing & Hunting
Manufacturing
Information
Mining, Quarrying, Oil & Gas Extraction
Administrative, Support, Waste Management & Remediation
Arts, Entertainment & Recreation
161,104
123,739
107,440
84,693
82,787
73,527
70,339
64,370
53,867
50,463
49,306
43,724
27,349
19,865
18,515
17,389
16,630
4,580
3,953
837
1,074,477TOTALJOBS
Source: EMSI

9 Comprehensive Economic Development Strategy PlanMid-America Regional Council • 2014
The following chart depicts several areas of economic specialization where Kansas City has a location quotient greater than 1, which indicates strength compared to the national average. Communications, heavy manufacturing, architecture and engineering and logistics are most well recognized as Kansas City specializations. Finance, computer, information technology, advertising and media and back office industries are also strong.
However, even in the areas where Kansas City has a strong specialization, many are losing employment. Some of these losses are well known, such as employment reductions at Sprint in the communications industry; Kansas City Star and Hallmark in the advertising and printing and publishing industry.
3.5
3.0
2.5
2.0
1.5
1.0
0.5
Finance
1.48 1.54
2.97
1.42
1.481.05
1.791.61
2.85
Communications Avertising & Media
Back Office
Heavy Manufacturing
LogisticsLife Sciences
Architecture & Engineering
Computer
Kansas City Metro Specialization by Location Quotient, 2013
Kansas City Metro Change in Employment by Industry Specializations, 2001–2013
50%
40%
30%
20%
10%
0%
-10%
-20%
-30%
-40%
-50%
-60%Finance Communications Avertising
& MediaBack Office
Heavy Manufacturing
LogisticsLife Sciences
Architecture & Engineering
Computer
12.8%
30.0%
-48.6%
5.7%
-49.4%
14.8%
38.5%
-8.7%
4.9%
Source: EMSI

10 Comprehensive Economic Development Strategy PlanMid-America Regional Council • 2014
METRO LOCATIONS QUOTIENTS BY INDUSTRY, 2012
Charlotte 1.69Omaha 1.54KANSAS CITY 1.48Minneapolis/St. Paul 1.47Dallas/Ft. Worth 1.44Milwaukee 1.30St. Louis 1.23Denver 1.18Indianapolis 1.16Cincinnati 1.16Nashville 1.06Austin 1.00Sacramento 0.99Oklahoma City 0.96
Austin 1.91Denver 1.74KANSAS CITY 1.54Omaha 1.52Dallas/Ft. Worth 1.48Minneapolis/St. Paul 1.28Charlotte 1.10Milwaukee 1.07Indianapolis 1.05St. Louis 0.98Nashville 0.79Sacramento 0.77Cincinnati 0.76Oklahoma City 0.54
Omaha 2.11Indianapolis 1.73KANSAS CITY 1.61Nashville 1.41Cincinnati 1.33Charlotte 1.26Dallas/Ft. Worth 1.22St. Louis 1.10Milwaukee 1.01Minneapolis/St. Paul 0.96Oklahoma City 0.89Denver 0.86Sacramento 0.84Austin 0.33
Denver 2.08Austin 1.74KANSAS CITY 1.42Cincinnati 1.12Sacramento 1.05Dallas/Ft. Worth 1.04Minneapolis/St. Paul 0.92Omaha 0.92Charlotte 0.89Indianapolis 0.89St. Louis 0.84Oklahoma City 0.82Nashville 0.80Milwaukee 0.80
Nashville 2.87KANSAS CITY 2.85Milwaukee 1.69Minneapolis/St. Paul 1.15Indianapolis 1.13Oklahoma City 1.08Cincinnati 1.07St. Louis 0.95Dallas/Ft. Worth 0.90Charlotte 0.83Denver 0.65Omaha 0.62Sacramento 0.35Austin 0.33
FINANCE COMPUTER
LOGISTICS
ARCHITECTURE/ENGINEERING
HEAVYMANUFACTURING
Charlotte 1.37Denver 1.31Austin 1.27Minneapolis/St. Paul 1.19Sacramento 1.18Dallas/Ft. Worth 1.13Omaha 1.07KANSAS CITY 1.05Indianapolis 0.98St. Louis 0.93Nashville 0.88Milwaukee 0.85Oklahoma City 0.73Cincinnati 0.73
KANSAS CITY 1.79Dallas/Ft. Worth 1.76Denver 1.65Omaha 1.64Charlotte 1.63Austin 1.60Nashville 1.31Oklahoma City 1.27St. Louis 1.08Cincinnati 1.02Sacramento 0.87Milwaukee 0.75Minneapolis/St. Paul 0.75Indianapolis 0.69
KANSAS CITY 2.97Denver 2.32Dallas/Ft. Worth 2.23St. Louis 1.49Austin 1.47Charlotte 1.12Oklahoma City 1.00Indianapolis 0.94Minneapolis/St. Paul 0.89Milwaukee 0.83Nashville 0.80Cincinnati 0.74Sacramento 0.52Omaha 0.32
LIFE SCIENCES BACK OFFICE
COMMUNICATIONS
Source: EMSI

11 Comprehensive Economic Development Strategy PlanMid-America Regional Council • 2014
Exports
Though Kansas City lags the nation in terms of overall export level in proportion to output, the region’s exports are increasing and are fairly robust, with only a modest lag behind the U.S. as a whole. More work is needed to understand Kansas City’s export profile and linkages, but these two data points suggest the region has some capacity and is making progress that can be more fully exploited. The following chart shows the change in exports over the starting year of 2003 and from 2009-2012. The region’s export activity increased 29 percent between 2009 and 2012, almost identical to the national rate.
Growth in International Exports | Percent Change in Export Value, 2003–2012
Top Exports to Countries Outside U.S., Metro Kansas City 2012
Source: Brookings Export Nation

12 Comprehensive Economic Development Strategy PlanMid-America Regional Council • 2014
Innovation & Entrepreneurship
The Kansas City region is home to several innovation and entrepreneurial programs, but it continues to lag in patents, startups and access to capital.
2012 International Exports as Percent of GDP
Patent Growth: Patents Per Year, 2000–2011, Kansas City MSA
Source: Brookings Export Nation
Source: U.S. Patent Office

13 Comprehensive Economic Development Strategy PlanMid-America Regional Council • 2014
Education & Workforce
The Kansas City region has a strong workforce delivery system that works closely with industry partners to prepare individuals for in-demand careers. While Kansas City has a higher percentage of residents with at least a bachelor’s degree than the U.S. a whole, it is average when compared with the top 100 metro areas. Kansas City also lags in science and engineering related bachelor’s degrees with only 38.6 percent of bachelor’s degrees are in science and engineering, compared to 44.4 percent for the top 100 metros.
While the region has several innovation centers, the ability to start and grow companies in Kansas City is difficult to measure. When considering the number of firms created, Kansas City performed roughly equal to the top 50 and better than its peers in the first part of the 2000s. However, Kansas City’s establishment birth rate for new businesses was weaker than U.S. metros and 15 peers during the recession, and remains weaker during the recovery thus far.
New Business Establishments Divided by Total Establishments
Population over age 25, Kansas City vs. Top 100 Metros, 2012
Source: Business Dynamics
Source: U.S. Census Bureau

14 Comprehensive Economic Development Strategy PlanMid-America Regional Council • 2014
Transportation Access
The Kansas City region, a major transportation hub, sits at the intersection of four interstate highways — Interstates 70, 35, 29 and 49 — which connect the region to both coasts, Canada and Mexico. In addition, the region is served by numerous interstate beltways, U.S. and state highways.
Major trucking concerns, including YRC, operate out of the Kansas City area. Air transportation, including considerable air freight operations and general aviation activity, is served by Kansas City International Airport and a number of smaller airports. Kansas City is the second busiest railroad center in the nation, with major rail yards for Union Pacific, Burlington Northern, and Canadian Pacific. The region is also served by barge transportation, with about a dozen regulated barge lines transporting goods through the metropolitan area on the Missouri River.
Roadway System Infrastructure
Kansas City’s system of roadways is among the most extensive in the nation. According to Federal Highway Administration statistics, the Kansas City region has the most freeway miles per person of all urbanized areas with populations greater than 500,000. The Kansas City metro area also has the second highest total roadway miles per person and the eighth highest daily vehicle miles traveled (DMVT) per person. These rankings are due in large part to the extensive highway projects implemented in the Kansas City region during the 1970s and 1980s, such as the construction of the Interstate 435 loop.
Bachelor’s Degree by Field, Kansas City vs. Top 100 Metros, 2012
Roadway Classification MilesInterstate 278Freeway/Expressway 204Other principal arterial 553Minor arterial 1,096Major collector 1,803Minor collector 202Local 11,507TOTAL 15,644
Source: U.S. Census Bureau
Source: KDOT and MoDOT

15 Comprehensive Economic Development Strategy PlanMid-America Regional Council • 2014
Interstates, Highways and Rail Lines in the Greater Kansas City Region

16 Comprehensive Economic Development Strategy PlanMid-America Regional Council • 2014
Roadway System Condition
According to data collected from The Road Information Program (TRIP), Kansas City’s average pavement conditions have improved significantly compared to national and peer city averages. In TRIP’s 2013 Bumpy Roads Ahead research report, Kansas City’s “poor” pavement conditions significantly exceeded both the national and peer city averages. In TRIP’s 2013 report, only 15 percent of Kansas City’s roads were classified as “poor” pavement conditions. Of 75 metros with populations over 500,000, only 13 had fewer “poor” roads than Kansas City. The report found 29 percent of the Kansas City region’s roads to be in mediocre condition; 18 percent fair; and 38 percent good. TRIP’s report uses 2011 FHWA data for its analysis.
Bicycle/Pedestrian Trails
Bicycle and pedestrian trails in the Kansas City metropolitan area are being developed at an increasing rate under the auspices of MetroGreen®, a plan for an 1,100-mile, area-wide, interconnected system of public and private open spaces, greenways and trails that will link seven counties in the Kansas City metropolitan area. Many communities in the region have adopted local plans for both on-road and off-road facilities.
Freight and Goods Movement Facilities
Kansas City’s rail system consists of five Class I railroads and several regional or shortline carriers. The extensive rail network throughout the region serves local industry with major intermodal yards and provides connection to international markets. BNSF Railway’s Transcontinental Route runs diagonally through the region from the southwest to the northeast. The “Transcon” connects the Ports of Los Angeles and Long Beach to Chicago via Kansas City with 80 to 90 trains per day. The Union Pacific (UP) Railroad’s major coal route runs east-west through the region from Topeka into Missouri where it parallels the Missouri River. This route carries upwards of 80 trains per day of loaded unit coal trains. (A unit train is typically one mile long.) Other significant routes in the region include Kansas City Southern (KCS) north-south route that connects to Mexico at Laredo, Texas and Norfolk Southern (NS) east-west route that ends in Kansas City. Canadian Pacific now serves Kansas City over the ICE route.
There are currently five intermodal yards in Kansas City. BNSF, KCS and NS each have one facility and UP has two facilities in the region. Along with intermodal activity there are numerous switching yards, classification yards, transload facilities and other rail operations that occur in the region. Kansas City Southern recently moved its intermodal operations to the former Richards Gebaur Airport site, which allows for more opportunities for complimentary development at the CenterPoint Intermodal Center – Kansas City. BNSF is moving its intermodal operations to Logistics Park KC in southern Johnson County, Kan., where significant warehouse space is also under development.
Kansas City International Airport (KCI) is home to the region’s air cargo terminal, one of the highest-volume air freight hubs in the six-state region. KCI has plans to expand service capabilities and enhance the attractiveness of aviation facilities associated with manufacturing and industrial operations. An initial phase includes a 800-acre master planned site, the KCI Intermodal Business Centre, which could include more than 5 million square feet of distribution, air cargo and on-ramp, airport-related logistics buildings.
Bikeways MilesBike lanes 45Mountain bike trails 83Walking / hiking trails 175Bike routes 188Share-the-road bikeways 1,225Paved trails 555TOTAL 1,273

17 Comprehensive Economic Development Strategy PlanMid-America Regional Council • 2014
Other airports in the region with runways of sufficient length to support large aircraft for air cargo operations include Kansas City’s Charles B. Wheeler downtown airport, and New Century AirCenter in Johnson County. Currently these facilities do not handle air cargo.
The Kansas City Port Authority operates the area’s only public port, located along the Missouri River near the confluence of the Kansas and Missouri Rivers. The port is an intermodal facility, transferring freight between barge, truck and rail. In addition, the Kansas City region benefits from numerous private ports, which are used by companies shipping commodities that include grains, sand and gravel, fertilizer, chemicals, coal and coke. Currently, river flows are managed by the U.S. Corps of Engineers’ Missouri River Master Manual which limits the navigation season to approximately six months each year.
The Kansas City area is also one of the nation’s top five trucking centers. Truck volumes in the region are heavily concentrated on interstates and U.S. highways. I-70 in Missouri is the most heavily traveled truck route in the region with some segments exceeding 12,000 trucks per day. The region’s national freight corridors are estimated to carry approximately 70 percent of truck vehicle miles traveled, with historic trends indicating a high rate of growth which is likely to continue.
Transit Service and Ridership
Transit service in the region is provided by the Kansas City Area Transportation Authority (KCATA), Johnson County Transit (JCT), Unified Government Transit (UGT) and IndeBus. For more than a decade, MARC and area transit providers have worked cooperatively to develop and implement the Smart Moves Transit Plan, a regional transportation plan for expanded transit service throughout a seven-county region.
For the last several years, the Kansas City area’s transit providers have seen an increase in transit ridership due to expanded services and dramatically increasing gasoline prices. Systemwide, transit ridership has grown by more than 20 percent since 2004.
Efforts are underway to expand transit services to meet a growing demand. In 2011, a bus rapid transit was added along the Troost Corridor in Kansas City, Mo., With funding from a Transportation Investments Generating Economic Recovery (TIGER) grant from the U.S. Department of Transportation, significant improvements were made to transit facilities across the region, including the Metcalf/Shawnee Mission corridor in Johnson County, Kan.; the State Avenue corridor in Wyandotte County, Kan.; the North Oak corridor in Clay County, Mo.; and several locations in Jackson County, Mo.
Work is currently underway on a new streetcar line. KC Streetcar is scheduled to become operational in the summer of 2015 in downtown Kansas City, Mo. It will operate a two-mile north-south route — approximately a four-mile round trip — on city streets that will
Freight movement in the Kansas City MSA, 2010
Type Tons ValueTruck 49,709,507 $38,852,588,766Rail 7,162,598 $1,837,835,018Water 9 $3,604Air (includes truck/air) 1,845 $130,477,098Multiple modes & mail 833,128 $10,676,976,049Pipeline 1,194 $485,369Other and Unknown 2,124,747 $10,868,911,556TOTAL 59,833,028 $62,367,277,460
Day Number of TripsWeekdays 53,550Saturdays 22,079Sundays 11,499
*Includes KCATA, The Jo and Unified Government Transit
Average Transit Trips, 2010

18 Comprehensive Economic Development Strategy PlanMid-America Regional Council • 2014
connect the River Market area to the Crown Center/Union Station area. The streetcar will also serve the Central Business District (“working home” to some 65,000 employees), the Crossroads Arts District and the Power and Light District. The route will run primarily on Main Street. MARC is currently working with transit partners to evaluate a potential northern extension to the streetcar line and two lines south and east from downtown.
Modes of Travel
The Kansas City metropolitan area is heavily dependent on the automobile as the dominant mode of transportation. According to 2006–2010 American Community Survey (ACS) 5-Year Estimates, 92 percent of all commute trips made in the region are by automobile (83 percent drive alone; 9 percent carpool). Public transportation accounts for 4 percent of all commute trips in the region, while only 1 percent walk to work.
Commute trips in the Kansas City region are generally characterized by very low vehicle occupancy rates. U.S. Census data on commuting found an average worker vehicle occupancy rate of 1.06 for the Kansas City metropolitan area in 2011, up slightly from 1.05 in 2010.
Roadway users in the Kansas City urban area travel more vehicle miles on average than roadway users in other urban areas of similar population size (1 to 3 million). The region experienced a slight increase in daily vehicle miles traveled (VMT) between 2010 and 2011, rising from 24.7 miles to 24.9 miles per capita. Total regional VMT increased from 46,813,223 miles to 47,649,645 miles over this same period.
Congestion
Traffic congestion has increased in metropolitan Kansas City, but it still ranks among the least congested metro areas. The Texas Transportation Institute (TTI) measures congestion in 439 urban areas each year. According to TTI’s 2011 Urban Mobility Report, the percent of congested travel during peak vehicle miles held steady at 23 percent — comparing very favorably to the 55 percent average for all large urban areas.
Work Trip Travel Modes, 2006–2010
Drove Alone 83%
Carpooled 9%
Walked 1%
Other Means 2%
Worked at Home 1%
Public Transportation 4%
Roadway Congestion Index
1982–2011
TTI Urban Mobility Reports
Source: U.S. Census Bureau

19 Comprehensive Economic Development Strategy PlanMid-America Regional Council • 2014
TTI also evaluates the annual cost of congestion per auto commuter. After years of steady increases, peaking at nearly $800 per year per commuter in 2005, the cost of congestion in the Kansas City region declined to just over $400 in 2008 before rising sharply; in 2011, the cost of congestion is $584 per year per auto commuter.
Travel Time
Because of its relatively low congestion levels, metropolitan Kansas City generally experiences shorter travel times than many other metropolitan areas. Travel time is a function of both the distance traveled and the degree of traffic congestion. While travel distances can be relatively long in Greater Kansas City because of the low-density urban form, limited congestion keeps travel times low. In MARC’s latest Travel Time Study, published in2013, regional travel speeds increased for all functional classifications of roads from 2010 to 2012. The study, available online at www.marc.org/Transportation/Plans-Studies, includes a full description of methodology.
Commuters into the Central Business District continue to experience a decrease in travel time. The 20-minute travel time distances from downtown increased slightly in every direction. Congestion in peak travel times was heaviest on the I-35 corridor from downtown south to Olathe, Kan.; the I-70 corridor from downtown east to Blue Springs, Mo.; U.S. 69 from I-35 to 151st Street; and U.S.71/I-49 from downtown to Belton, Mo.
20-Minute Travel Distance, 4–6 p.m.

20 Comprehensive Economic Development Strategy PlanMid-America Regional Council • 2014
Geography
The nine Missouri and Kansas counties that make up the Kansas City metropolitan area—Cass, Clay, Jackson, Platte and Ray in Missouri and Johnson, Leavenworth, Miami and Wyandotte in Kansas — have a combined area of nearly 4,000 square miles. The region is located in the west-central and northwest parts of Missouri and northeast parts of Kansas. It falls within the Central Dissected Till Plains and Osage Plains sections of the Central Lowlands, as defined by the U.S. Geological Survey and the Missouri Ecological Classification System.
Elevations in the region range from a low of 359 feet above sea level in Platte County to a high of 1,150 feet above sea level in Miami County, with most of the area falling between 700 and 1,000 foot elevations. Soils are mostly fertile and well drained, and are formed of loess, residuum and alluvium. The region’s underlying bedrock consists of shale, limestone and sandstone.
Topography in the region is heavily influenced by the Missouri and Kansas rivers and their tributaries. Much of the land is level to sloping, especially in floodplains and bottomlands, with uplands ranging from moderate slope to occasional steep bluffs and hills.
Waterways and Water Resources
Water, particularly surface water, is a great natural resource in the Kansas City area. The region is drained by three river basins: the Lower Missouri-Grand-Chariton River Basin, the Lower Missouri-Blackwater-Lamine River Basin and the Osage River Basin. The vast majority of the region’s watersheds drain into the Missouri River, which is one of Missouri’s (and the nation’s) major rivers. In Cass County, however, watersheds drain into the Osage River Basin.
Much of the region’s water supply comes from the Missouri River, and in recent years degradation of the riverbed has become a concern. The U.S. Army Corps of Engineers is conducting a multiyear study to assess riverbed degradation between Rulo, Neb., and St. Louis, Mo., focusing on the stretch of river in the Kansas City area where degradation is the most severe. The study will determine the causes of degradation, explore how future degradation can be prevented, and recommend ways public infrastructure can be protected.
According to the U.S. Army Corps of Engineers, the average flow of the region’s major rivers and streams range from a high of 35,070 million gallons per day in the Missouri River to a low of less than 13 million gallons per day in some of the region’s small streams. Some of the region’s rivers, such as the Missouri River, are subject to minimum flow requirements in order to maintain water quality standards. The minimum flow requirement for the Missouri River is
Kansas City’s Geography and Environment
Located at the confluence of the Missouri and Kansas rivers, Kansas City began in the mid-1800s as a trading post and jumping-off point for pioneers heading west on the Santa Fe, California and Oregon trails.

21 Comprehensive Economic Development Strategy PlanMid-America Regional Council • 2014
Waterways and Topography in the Greater Kansas City Region
2,620 million gallons per day. This requirement is maintained by the Corps’ regulation of upstream reservoirs and their respective dams in Montana, North and South Dakota and Nebraska — Fort Peck, Garrison, Oahe, Big Bend, Fort Randall and Gavins Point. There are no designated wild and scenic rivers under the National Wild & Scenic Rivers System.
In the Kansas City area, significant quantities of ground water are found only in alluvial deposits along the Missouri River. These alluvial deposits can be more than 100 feet deep in the Missouri river valley (with an average depth of 80 to 90 feet). Saturated water-bearing materials range in depth from 30 to 60 feet, although they are generally found near a depth of 40 feet. Water wells in these alluvial deposits can yield from 1,500 to 2,000 gallons per minute, with an average yield between 500 and 1,000 gallons per minute.
22 Comprehensive Economic Development Strategy PlanMid-America Regional Council • 2014
In the region’s tributary valleys, the availability of ground water is limited. The alluvial deposits in these areas range in thickness from 20 to 70 feet in the lower reaches to less than 10 feet in the upper reaches. In addition, the large amounts of shale in these tributary valleys results in mainly clay fill sediments in the alluvial aquifer. Because this material has a low water transmissibility, water well yields in these areas can be as low as one to 10 gallons per minute. Tributaries in areas comprised mainly of sandstone, however, may produce wells with higher yields, since these areas have sediments with greater water transmissibility.
Aquifers in the region’s uplands are found in materials of glacial origin or from weathered materials above bedrock. Neither of these areas produces substantial yields of ground water. Although some ground water yields in areas of glacial deposits can exceed 100 gallons per minute, the varying thickness of glacial deposits results in highly variable yields of ground water. Ground water from areas with deposits of material over bedrock provide yields that are generally less than 10 gallons per minute, although some isolated yields can be greater. In addition, water from bedrock tends to be mineralized and contains hardness and iron that exceed national drinking water standards.
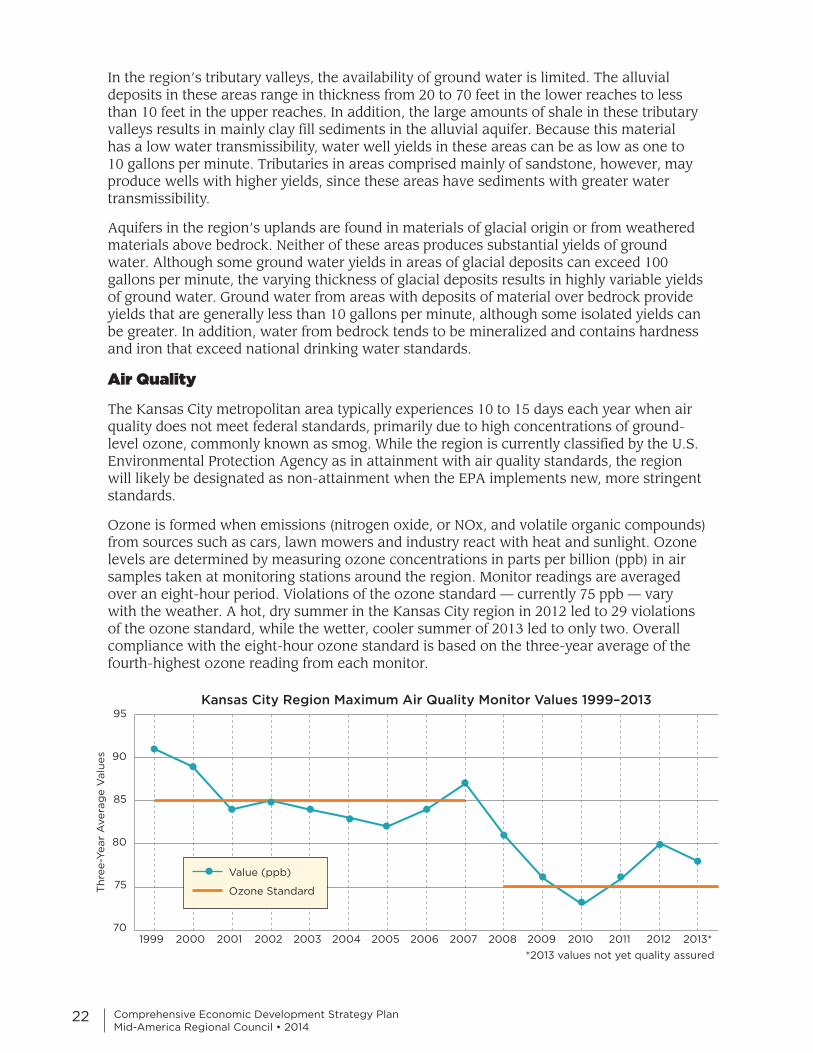
Air Quality
The Kansas City metropolitan area typically experiences 10 to 15 days each year when air quality does not meet federal standards, primarily due to high concentrations of ground-level ozone, commonly known as smog. While the region is currently classified by the U.S. Environmental Protection Agency as in attainment with air quality standards, the region will likely be designated as non-attainment when the EPA implements new, more stringent standards.
Ozone is formed when emissions (nitrogen oxide, or NOx, and volatile organic compounds) from sources such as cars, lawn mowers and industry react with heat and sunlight. Ozone levels are determined by measuring ozone concentrations in parts per billion (ppb) in air samples taken at monitoring stations around the region. Monitor readings are averaged over an eight-hour period. Violations of the ozone standard — currently 75 ppb — vary with the weather. A hot, dry summer in the Kansas City region in 2012 led to 29 violations of the ozone standard, while the wetter, cooler summer of 2013 led to only two. Overall compliance with the eight-hour ozone standard is based on the three-year average of the fourth-highest ozone reading from each monitor.
1999
95
80
90
75
85
702000 2001 2002 2003 2004 2005 2006 2007 2008 2009 2010 2011 2012 2013*
Kansas City Region Maximum Air Quality Monitor Values 1999–2013
Th
ree-Y
ear
Avera
ge V
alu
es
Value (ppb)
Ozone Standard
*2013 values not yet quality assured

23 Comprehensive Economic Development Strategy PlanMid-America Regional Council • 2014
The Kansas City region’s homeland security and emergency services program has established a vision for a region prepared to prevent, protect, respond to and recover from a broad range of threats and hazards — including terrorism — through strong relationships, protocols for regional action, strong regional and local plans, sharing and coordination of resources, equipment investments, coordinated training and exercise, improved surveillance capabilities, and the early detection and mitigation of hazards and threats.
To achieve that vision, local communities have worked together through MARC’s Regional Homeland Security Coordinating Committee since 2003 to invest federal resources and develop and strengthen regional capabilities.
Hazard Mitigation
Local cities and counties have adopted a Regional Hazard Mitigation Plan, developed by MARC for the five Missouri counties in the region, and individual county plans on the Kansas side of the state line. The Regional Hazard Mitigation Plan outlines actions that communities may take to reduce risks from both natural and man-made disasters. The plan supports the region’s goal of a disaster resilient community. With Community Development Block Grant (CDBG) Disaster Planning funds, MARC helped three counties that were impacted by 2010 floods develop plans to reduce risks from future flooding. MARC also prepared a model ordinance regarding requirements for basements and safe rooms as part of new housing construction.
Emergency Response
The Kansas City Metropolitan Area Regional Coordination Guide (RCG) is a planning guide that documents the protocols and mechanisms for coordination among jurisdictions in the metro area during emergency events with impacts or potential impacts that cross jurisdictional boundaries. It consists of a Base Guide and 15 Emergency Support Function (ESF) Annexes that ensure a series of formal actions are in place to facilitate communication and cooperation between the many agencies and organizations that could potentially be involved in emergency events requiring some degree of regional coordination. The RCG provides an overall framework for ensuring that regional coordination activities may be initiated and maintained when there is a need for the jurisdictions in the metro area to provide common messages and share information and resources.
The RCG addresses activities in all phases of emergency management (mitigation, preparedness, response and recovery) with an emphasis on the regional coordination activities necessary to ensure effective emergency response and recovery efforts.
Disaster Preparedness and Resilience

24 Comprehensive Economic Development Strategy PlanMid-America Regional Council • 2014
The RCG is designed to support the local Emergency Operations Plans (EOPs) maintained by the individual jurisdictions in the region. The RCG seeks to build on the emergency functions in these EOPs by addressing the actions necessary for effective regional coordination.
In addition to local EOPs, there are a variety of emergency plans, procedures, protocols and guidelines maintained by regional agencies and organizations throughout the metro area, including the Mid-America Local Emergency Planning Committee (LEPC) Plan, the MARC Emergency Rescue Committee (MARCER) Mass Casualty Incident (MCI) Plan, the Metropolitan Medical Response System (MMRS) Plan, the Tactical Interoperable Communications (TIC) Plan and others.
The following regional coordination principles provide the basis for the activities described in the RCG:
• Local jurisdictions in the metro area have the ultimate responsibility and legal authority for conducting emergency operations. Most emergencies are managed successfully by local response agencies and EOCs with no extraordinary regional coordination requirements.
• Emergency events with impacts that cross jurisdictional boundaries may require coordination among local jurisdictions to maximize available resources, accomplish common goals and more efficiently and effectively manage the event.
• The development of effective regional coordination protocols will help local governments accomplish their primary emergency response mission of saving lives, preventing injuries and property damage, and minimizing community disruption.
• Jurisdictions that are unaffected (or less affected) by an emergency may deploy resources to other communities in the region with a need for them. However, local jurisdictions will not be asked to provide assets to another that would leave their jurisdiction lacking potentially needed resources.
• MARC serves as the metropolitan planning organization for the region and, when requested, MARC may work on behalf of local jurisdictions to accomplish goals and objectives established by local governments.
• The RCG supports the National Incident Management System (NIMS) and the initiatives set forth in the National Preparedness Guidelines (NPG). Both NIMS and the NPG encourage jurisdictions to work together to strengthen collaboration and enhance regional capabilities.
• Development of the RCG supports the goals and objectives set forth in the Kansas City Urban Area Homeland Security Strategy whose focus is to “strengthen relationships between jurisdictions and across disciplines by leveraging the long history of cooperation and coordination which exists between emergency services agencies in the region.”

25 Comprehensive Economic Development Strategy PlanMid-America Regional Council • 2014
Recovery
The Kansas City region’s Homeland Security Strategy Plan outlines specific goals to ensure that the region can prevent, deter, respond to and recover from disaster events. With regard to recovery, the region’s local communities follow the federal Emergency Support Function (ESF) planning guidance.
RecoveryAction Description
1 Establish partnerships and secure funding sources to address resource shortfalls or gaps for agriculture and natural resource-related issues and concerns identified during the event.
2 Maintain open and ongoing communication with other local agencies in the region and as appropriate, assist in their overall efforts for recovery operations.
3 Assess mutual aid agreements, letters of understanding or contracts with departments, organizations or private entities used during the response and determine if those agreements need to be updated or revised.
4 Assess the current technical standards and specifications for essential pieces of equipment related to short and long-term agriculture and natural resource needs and update based upon the lessons learned from the most recent emergency response.
5 Assess the current level of training on emergency safety standards for personnel who responded to the agriculture and natural resources-related event, and determine their application and compliance with federal and state requirements and policies.
6 Assess the current usage and application of alternate agriculture and natural resource facilities, equipment and assets for essential services and determine if there are issues that need to be addressed for future response operations.
7 Work to change, if required, those ordinances, policies and administrative rules that relate directly to agriculture and natural resources, which may hinder the ability to provide emergency assistance.
MARC provides support to local communities affected by disasters, particularly small communities. MARC offers assistance in preparing applications for federal disaster funds and in administering grants as awarded to help the communities restore basic infrastructure and services and recover from the disaster.
The strong working relationships developed throughout the region as a result of the region’s homeland security work have enabled communities to respond to neighboring jurisdictions when disasters have created the need for support. Events such as tornados, floods, ice storms and heat-related power outages have impacted many local communities. For many of those events, both during and following the event, communities have provided critical mutual aid.

26 Comprehensive Economic Development Strategy PlanMid-America Regional Council • 2014
By several measures, the Kansas City metro is fairly competitive among its peers. In terms of educational attainment, unemployment, poverty, median incomes and the relative age our population, Kansas City falls in the middle or upper-middle tier. While not leading in any of these areas, the Kansas City region remains comparable and competitive.
BACHELOR DEGREE OR HIGHER
UNEMPLOYMENT RATE
POVERTY RATE
MEDIAN INCOME
PERCENT UNDER 18
1 Raleigh Minneapolis Minneapolis Minneapolis San Antonio
2 Austin Austin Pittsburgh Denver Raleigh
3 Denver Columbus Raleigh Raleigh Indianapolis
4 Minneapolis San Antonio Denver Austin Charlotte
5 Portland KANSAS CITY KANSAS CITY Portland KANSAS CITY
6 Columbus Nashville St. Louis KANSAS CITY Austin
7 KANSAS CITY Pittsburgh Portland Columbus Minneapolis
8 Charlotte Milwaukee Indianapolis St. Louis Denver
9 Milwaukee St. Louis Nashville Charlotte Columbus
10 Indianapolis Raleigh Charlotte Milwaukee Milwaukee
11 Nashville Indianapolis Austin Indianapolis Nashville
12 St. Louis Denver Louisville Nashville Louisville
13 Pittsburgh Portland Milwaukee San Antonio St. Louis
14 San Antonio Louisville Columbus Pittsburgh Portland
15 Louisville Charlotte San Antonio Louisville Pittsburgh
Kansas City is lagging behind selected peers in other areas, however.
10-YR. JOBGROWTH
RECESSION RECOVERY
GROSS METRO PRODUCT
GMP 10-YR.CHANGE
POPULATIONCHANGE
NETMIGRATION
OVERALLRANK
1 Austin Austin Portland Portland Raleigh Austin Austin
2 Raleigh San Antonio Charlotte Austin Austin Denver Raleigh
3 San Antonio Raleigh Denver Pittsburgh Charlotte San Antonio Denver
4 Nashville Nashville Minneapolis Milwaukee San Antonio Charlotte Minneapolis
5 Charlotte Pittsburgh Indianapolis Nashville Nashville Raleigh Portland
6 Portland Indianapolis Milwaukee Minneapolis Denver Portland San Antonio
7 Indianapolis Denver Austin San Antonio Portland Nashville Nashville
8 Denver Columbus Nashville KANSAS CITY Indianapolis Minneapolis Charlotte
9 Louisville Louisville KANSAS CITY Denver Columbus Columbus Indianapolis
10 Minneapolis Charlotte Raleigh St. Louis KANSAS CITY Indianapolis KANSAS CITY
11 Columbus Portland Columbus Louisville Minneapolis Pittsburgh Columbus
12 KANSAS CITY Minneapolis Pittsburgh Indianapolis Louisville Louisville Pittsburgh
13 Pittsburgh KANSAS CITY St. Louis Raleigh St. Louis KANSAS CITY Milwaukee
14 Milwaukee Milwaukee Louisville Charlotte Milwaukee Milwaukee St. Louis
15 St. Louis St. Louis San Antonio Columbus Pittsburgh St. Louis Louisville
Analysis of Opportunities and Barriers
Source: 2013 Data Profile, Jerry Lonergan, Civic Council

27 Comprehensive Economic Development Strategy PlanMid-America Regional Council • 2014
When comparing gross metro product, population change, in-migration and other factors in the second table, it seems Kansas City has not kept up with comparable metros. The region has seen relatively low job growth over the last decade and did not recover from the recession as quickly as other metros. In the Brookings Institution’s Metro Monitor — which rates the performance of the nation’s 100 largest metros on changes in jobs, unemployment, gross metro product, and house prices — the Kansas City MSA ranked 29th in performance during the recession and 62nd during the recovery.
Capital Access and Business Support
The cost of doing business is lower in Kansas City than in other metro areas, but access to capital is a challenge according to many businesses. Kansas City has very little venture capital and doesn’t even rank among the top 20 metros in terms of venture capital investments.
In recent years, access to capital has improved thanks to such programs as Network Kansas, SparkLab KC and Digital Sandbox KC. Both Kansas and Missouri have strong economic development departments that support recruitment and retention programs to help attract and grow businesses. Small Business Development Centers are also a resource for business creation and growth. MARC supports the Regional Workforce Intelligence Network, a regional forum for workforce and economic development professionals to share real time information on the Kansas City region’s economic clusters and identify steps to strengthen programs and services supporting business growth. MARC’s economic development planning helps local and regional partners with critical labor market and other data in support of business development and expansion.
Source: “America’s Leading Metros for Venture Capital,” Richard Florida for AtlanticCities.com

28 Comprehensive Economic Development Strategy PlanMid-America Regional Council • 2014
Education and Workforce
Though the Kansas City region is holding its own in terms of college attainment compared to the nation, education is not keeping pace with job market needs. About 40 percent of current job openings require bachelor’s degrees — and that percentage is expected to grow steadily — while only about 33.5 percent of the region’s population currently has a bachelor’s degree.
Two local nonprofit organizations, PREP-KC and the KC STEM Alliance, work with area high
schools to develop career pathways. The Blue Valley School District’s Center for Advanced Professional Studies (CAPS) and the Missouri Innovation Campus also offer support to students to prepare them to enter the workforce or post-secondary training. The region’s three community colleges — Kansas City Kansas Community College (KCKCC) and Johnson County Community College (JCCC) in Kansas, and Metropolitan Community College (MCC) — also work closely with area employers to develop training and curriculum to better meet industry needs.
Innovation and Entrepreneurship
In one measure of innovation that has typically lagged — new patents — the Kansas City region is seeing some improvement. Patent activity has grown steadily since 2005. In 2012, the Kansas City metro generated 636 patents, up from 545 in 2010. However, there are not very many contributors to the region’s patent pool. The bulk of patents are held by a small group of companies. Sprint and Sprint Spectrum accounted for nearly 300 of the region’s patents in 2011. Other local companies with the most patent activity include Garmin, Cerner, HNTB and Honeywell.
Several programs are driving innovation in Kansas City, including the Kauffman Foundation, KCSourceLink, UMKC’s Small Business & Technology Development Center, KC Digital Drive and KC Startup Village. After Google Fiber selected Kansas City for its first ultra-high-speed fiber network, the entrepreneurship community began to grow and coordinate to advance technology capabilities. Since then, several IT-related initiatives have surfaced and small business development activity has seemed to increase.
Share of Job Openingsby Education Required 2012
Share of Workforceby Educational Attainment 2012
Sources: U.S. Census Bureau, Conference Board
29 Comprehensive Economic Development Strategy PlanMid-America Regional Council • 2014
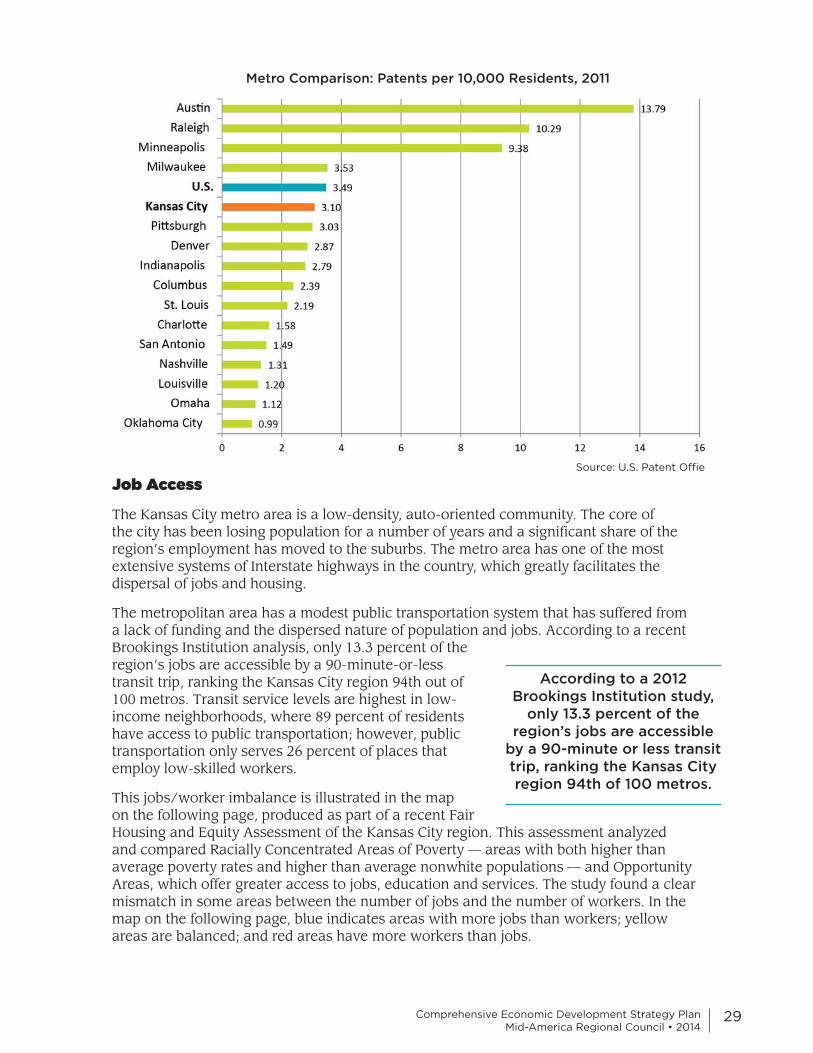
Metro Comparison: Patents per 10,000 Residents, 2011
Job Access
The Kansas City metro area is a low-density, auto-oriented community. The core of the city has been losing population for a number of years and a significant share of the region’s employment has moved to the suburbs. The metro area has one of the most extensive systems of Interstate highways in the country, which greatly facilitates the dispersal of jobs and housing.
The metropolitan area has a modest public transportation system that has suffered from a lack of funding and the dispersed nature of population and jobs. According to a recent Brookings Institution analysis, only 13.3 percent of the region’s jobs are accessible by a 90-minute-or-less transit trip, ranking the Kansas City region 94th out of 100 metros. Transit service levels are highest in low-income neighborhoods, where 89 percent of residents have access to public transportation; however, public transportation only serves 26 percent of places that employ low-skilled workers.
This jobs/worker imbalance is illustrated in the map on the following page, produced as part of a recent Fair Housing and Equity Assessment of the Kansas City region. This assessment analyzed and compared Racially Concentrated Areas of Poverty — areas with both higher than average poverty rates and higher than average nonwhite populations — and Opportunity Areas, which offer greater access to jobs, education and services. The study found a clear mismatch in some areas between the number of jobs and the number of workers. In the map on the following page, blue indicates areas with more jobs than workers; yellow areas are balanced; and red areas have more workers than jobs.
According to a 2012 Brookings Institution study,
only 13.3 percent of the region’s jobs are accessible
by a 90-minute or less transit trip, ranking the Kansas City region 94th of 100 metros.
Source: U.S. Patent Offie

30 Comprehensive Economic Development Strategy PlanMid-America Regional Council • 2014
Jobs/Worker Balance
State Incentives
Both Missouri and Kansas offer incentives to attract new businesses, but in a bistate region such as Greater Kansas City, incentives can offer challenges as well as opportunities. A recent analysis by the Hall Family Foundation found that relocation incentives from two state programs — the Kansas PEAK program and Missouri Works — have caused a number of businesses to shift across the state line within the metro.
The study found that 36 companies have relocated 3,343 existing jobs from Clay and Jackson counties in Missouri to Johnson or Wyandotte counties in Kansas under the PEAK program, resulting in lost revenue (forgiven taxes) of $141 million for the state of Kansas. At the same time, 15 companies have relocated 2,929 existing jobs from the two Kansas counties to Jackson County, Mo., under the Missouri Works program, resulting in a loss of $76 million in state revenue. This movement within the region resulted in a net gain of just 414 jobs for Kansas. At a cost of $141 million in forgiven taxes, that calculates to $340,000 per job.
In January 2014, the MARC Board of Directors began discussion of a policy position to encourage state legislators to evaluate the effectiveness of incentive programs that simply shift jobs within the metro area.
31 Comprehensive Economic Development Strategy PlanMid-America Regional Council • 2014
As part of the Comprehensive Economic Development Strategy plan, the Kansas City region has identified broad goals and specific, measurable objectives that can be accomplished in a five-year timeframe to advance the regional economy.
Economic development opportunities
A common concern in the Kansas City region is the lack of capital for investments by businesses of all sizes, but particularly startups. Many companies are limited in growth and startup capabilities due to lack of capital investment available in the Midwest and specifically in the Kansas City area.
Companies are constantly looking for new technologies that will improve operations and efficiency. Companies are eager to develop new and innovative tools, products and procedures. Assistance is needed to help identify and integrate new technologies, expand market reach for new products and identify capital for these projects. The region has a low rate of patenting — driven by just a handful of large firms — with 559 patents per year over the past four years (ranking 39th nationally) and a low 0.55 patents per worker (ranking 118th). This lag in innovation may explain some of the region’s lower labor productivity. With the increase of technology being used in the distribution and motor vehicle manufacturing sectors, innovation needs to be better integrated into operations.
Objectives:
• Improve available capital for entrepreneurs. • Provide affordable space for startup companies. • Grow technology commercialization efforts in the region. • Expand research and development capabilities.
Key Partners:
• KCSourceLink• Digital Sanbox KC• Whiteboard to Boardroom• Small Business Development Centers• NetWork Kansas• Universities
There are a number of small to mid-sized companies that want to become more involved with exporting. These companies need technical assistance to identify export opportunities, establish necessary agreements and arrangements and support business expansion.
Supply chain is a constant concern to manufacturers as they strive to run their operations as efficiently as possible. Kansas City manufacturers have suppliers all over the world, and there is increasing pressure for suppliers to be located in close proximity. Industry leaders have expressed interest in consolidating suppliers so they are more accessible to larger OEMs and make Kansas City a “supplier corridor.”
Economic Development Goals and Objectives
GOAL 1: Create a region that supports entrepreneurship and innovation
GOAL 2: Create a region that provides strong support to existing businesses

32 Comprehensive Economic Development Strategy PlanMid-America Regional Council • 2014
GOAL 3: Create a region that increases national visibility and is a destination of choice for companies and talent.
GOAL 4: Create a region that provides quality technology infrastructure.
Objectives:
• Connect existing businesses to available resources.• Develop local and state programs that meet the needs of businesses. • Improve supply chain opportunities between small and large companies.• Strengthen export and international trade activity within the region.
Key Partners:
• Regional and Local Economic Development Agencies• State Economic Development Agencies• Manufacturing Extension Partnerships• World Trade Center-KC• KCSourceLink
To maintain business recruitment efforts and attract talent to the Kansas City region, the community need to enhance awareness of the region’s assets and promote the region as the business location of choice.
Objectives:
• Promote doing business in Kansas City and develop targeted approaches in competitive industries, such as manufacturing, digital storytelling, information technology, supply chain and logistics, health care, engineering, bioscience/life sciences, and financial services
Key Partners:
• KCADC• KC SmartPort• Animal Health Corridor• Kansas City Life Sciences Institute• Local Economic Development Agencies
With high speed fiber and technologies deploying in communities around the globe, Kansas City needs to maintain a strong infrastructure that will be able to be attractive to companies looking to expand or relocated.
Objectives:
• Make technology available at sites and buildings to increase attractiveness to companies. • Use technology to foster innovative education and workforce development.
Key Partners:
• Utility providers• City and County Governments• Educators

33 Comprehensive Economic Development Strategy PlanMid-America Regional Council • 2014
GOAL 2: Create a region that is able to recruit and attract talented individuals.
GOAL 1: Create a region that trains and develops an educated workforce.
Effective workforce development
The Kansas City region has a strong workforce delivery system that works closely with industry partners to prepare individuals for in-demand careers.
Training and education programs, particularly at the community college level are easily accessible to companies throughout the region via the three community college systems. However, there is a need to better connect employer needs to available training programs. Companies want to ensure that the right mechanical and electrical skills are being taught.
Kansas City companies continue to express the need for the community to invest in advanced training in specific certifications and degrees. Essential employability skills and soft skills also continue to be of concern to employers, as they need people who are prepared for success in the work environment and have basic math skills. Several companies have strong relationships with local educational institutions, but many more could benefit from stronger relationships between their businesses and technical education resources.
Objectives:
• Develop effective training programs for high growth occupation areas: information technology, healthcare, manufacturing careers, distribution and engineering.
• Strengthen high-school based career pathways and technical training.
Key Partners:
• Workforce Investment Boards• Community Colleges• Universities• K-12 Education
The Kansas City region has a more highly educated workforce than the nation as a whole, with one-third of all adults earning a bachelor’s degree or higher. However, the workforce still does not meet all the needs of local employers and oftentimes employers need to recruit from outside the region.
Kansas City community needs to have a high quality of life that is able to attract individuals when companies are looking for talent.
Objectives:
• Promote Kansas City as a vibrant place to live with high quality careers.
Key Partners:
• Local Economic Development Agencies• Chambers of Commerce• Education Institutions

34 Comprehensive Economic Development Strategy PlanMid-America Regional Council • 2014
Infrastructure development and transportation
It is an important step toward future cohesion for the region’s transit system and support the development and expansion of the Kansas City Streetcar. Improved transit will help individuals access job opportunities they may not otherwise consider.
Objectives:
• Create a robust multi-modal transportation system to serve the region’s economy and make Kansas City more attractive to potential talent.
• Improve public transportation for residents to access jobs in employment hubs.
Key Partners:
• Local Governments• Transit Operators• State Departments of Transportation
While thousands of acres of land are available for new development, there is a limited supply of available sites and buildings that are shovel-ready. When companies are looking for new locations to expand, they oftentimes request sites and buildings that are move-in ready.
Objectives:
• Expand the availability of shovel-ready sites and available buildings
Key Partners:
• Local Economic Development Agencies• Utility Providers• City and County Governments
Sustainable future development
Sustainable places are vibrant, with activity centers that offer a rich mix of amenities and housing choices, with easy access to jobs, services and recreation. By investing in older built environments, communities are green and respect and preserve the natural environment.
Objectives:
• Protect the natural environment and utilize existing infrastructure. • Promote development along key transportation corridors and at key activity centers.
Key Partners:
• Local Economic Development Agencies• Local City Governments• Private For-Profit and Non-Profit Developers
GOAL 1: Create a region that provides mobility for the workforce.
GOAL 2: Create a region that supports a developed infrastructure for targeted industries.
GOAL 1: Create a region that supports development in key corridors and older built neighborhoods.

35 Comprehensive Economic Development Strategy PlanMid-America Regional Council • 2014
Economic Development Action Plan
GOAL 1: Create a region that supports entrepreneurship and innovation
Objective Strategy/Activity MeasurementImprove available capital for entrepreneurs.
• Continue support for KCSourceLink and angel investor groups in Kansas City.
• Support efforts to increase available capital for “second stage” businesses.
• Continue to support UMKC Innovation Center, UMKC Small Business & Technology Development Center and JCCC Small Business Development Center to provide entrepreneurship and business development training for new and second-stage businesses.
Amount of venture capital available.
Provide affordable space for startup companies.
• Promote and support business incubators and accelerators for startups and small businesses such as Think Big Partners and efforts led by Launch KC.
Number of available affordable spaces for startups.
Grow technology commercialization efforts in the region.
• Support commercialization efforts at local universities and research centers, such as UMKC SBTDC.
• Promote the Whiteboard2Boardroom.com website created by KCSourceLink.
Number of reported commercialization projects.
Expand research & development (R&D) capabilities.
• Connect companies to R&D assistance at local universities and colleges.
• Attract R&D investments to the region.
Number of patents developed.
GOAL 2: Create a region that provides strong support to existing businesses
Objective Strategy/Activity MeasurementConnect existing businesses to available resources.
• Local economic development agencies will continue to operate effective business retention programs.
• Assist companies with technical services to ensure they are meeting federal and state regulations (OHSA, MDNR, EPA).
Number of business retention visits conducted; number of times technical assistance is provided.
Develop local and state programs that meet the needs of businesses.
• Economic development agencies will act as a liaison between the business community and local, regional and state decision makers to develop strong business retention incentives.
• Continue to support JCCC SBDC/UMKC SBTDC and PTAC programs to provide technical assistance and training to second-stage businesses.
Improve supply chain opportunities between small and large companies.
• Develop strong collaboration within sectors that provides networking and connections between businesses.
• Increase capacity of small companies to innovate new products and services that meet market demands in the region.
Number of networking events; number of patents and business connections made.
Strengthen export and international trade activity within the region.
• Continue to strengthen Foreign Trade Zones and programs at KC SmartPort and World Trade Center.
• Provide technical assistance to help companies enter foreign markets.
Amount of export activity.
Economic development opportunities

36 Comprehensive Economic Development Strategy PlanMid-America Regional Council • 2014
GOAL 3: Create a region that increases national visibility and is a destination of choice for companies and talent.
Objective Strategy/Activity MeasurementPromote doing business in Kansas City and develop targeted approaches in competitive industries.
• Engage in regional marketing campaigns led by KCADC and partners.
• Promote low cost of doing business, strong workforce, entrepreneurship assets, strong education system and regional advantages.
• Review the use and efficacy of business recruitment Incentives.
• Promote available sites and buildings using LocationOne and KCADC.
Number of marketing impressions. Number of new businesses recruited.
GOAL 4: Create a region that provides quality technology infrastructure.
Objective Strategy/Activity MeasurementMake technology available at sites and buildings to increase attractiveness to companies.
• Identify industries in need of high speed Internet connectivity in next five years to plan infrastructure development.
Number of households/ businesses with high speed Internet.
Use technology to foster innovative education and workforce development.
• Identify ways educators and the public workforce system can connect job seekers to jobs and learning opportunities.
Effective Workforce Development
GOAL 1: Create a region that trains and develops an educated workforce.
Objective Strategy/Activity MeasurementDevelop effective training programs for high growth occupation areas: information technology, healthcare, manufacturing careers, distribution and engineering.
• Convene industry leaders to address skill gaps and workforce strategies.
• Help businesses access training and career development programs.
• Increase resources for on-the-job training (OJT) and work-based learning experiences.
• Expand industry driven training with a focus on industry certifications.
Number of meetings; number of available training programs; number of OJTs placed; number of industry certifications available.
Strengthen high-school based career pathways and technical training.
• Create new designs to engage high school students in postsecondary education and employment.
• Promote STEM occupations to secondary students.
GOAL 2: Create a region that is able to recruit and attract talented individuals.
Objective Strategy/Activity MeasurementPromote Kansas City as a vibrant place to live with high quality careers.
• Support KCADC, corporations and universities in recruitment efforts.
Campaigns to recruit talent.

37 Comprehensive Economic Development Strategy PlanMid-America Regional Council • 2014
Infrastructure Development and Transportation
GOAL 1: Create a region that provides mobility for the workforce.
Objective Strategy/Activity MeasurementImprove transit and public transportation for residents to access jobs in employment hubs.
• Invest in better public transportation to increase access to jobs; offer more specialized transit services to connect people to job centers.
Transit services available.
Create diverse transportation system to make Kansas City more attractive to potential talent.
• Support the KC Streetcar development. • Support investments in active transportation.• Support RideShare services.
Streetcar ridership; miles of new bicycle facilities; number using RideShare.
GOAL 2: Create a region that supports a developed infrastructure for targeted industries.
Objective Strategy/Activity MeasurementExpand the availability of shovel-ready sites and available buildings.
• Convene industry experts and development professionals to identify infrastructure needs.
• Evaluate the inventory of available properties with the region with highest potential for investment and reuse.
• Identify high-priority infrastructure projects that should be considered for publicly funded development projects.
Number of collaborations; number of available properties and sites.
Sustainable Future Development
GOAL 1: Create a region that supports development in key corridors and older built neighborhoods
Objective Strategy/Activity MeasurementProtect the natural environment and utilize existing infrastructure.
• Foster mixed use and high density development. • Repurpose the abundant number of vacant, blighted and
brownfield properties.• Assure proper investment in infrastructure, particularly
water and sewer.
Number of redeveloped projects; amount of investments made in infrastructure projects.
Promote development in key corridors.
• Reinvest in public infrastructure in older communities to retain and attract businesses in those areas.
State Economic Development Strategies
The CEDS for the Kansas City region is well aligned with both Kansas and Missouri economic development strategic initiatives. The Missouri Strategic Initiative for Economic Growth Report initiative engaged representatives from business, labor, higher education, and economic development across the state to chart a path for transforming the Missouri economy into a long-term, sustainable, 21st century growth economy. The initiative is focused on seven industry clusters: advanced manufacturing, energy solutions, bioscience, health sciences and services, information technology, financial and professional services, and transportation and logistics. The report is online at www.ded.mo.gov/strategic.aspx.
The Kansas Economic Development Strategic Plan also engaged industry throughout the state to identify key initiatives and clusters. The plan is online at https://governor.ks.gov/economic-development-strategic-plan.

38 Comprehensive Economic Development Strategy PlanMid-America Regional Council • 2014
Performance Measures
To evaluate the progress of the CEDS, MARC staff will meet annually with representatives of the region’s economic development organizations. MARC will encourage these representatives to engage other interested individuals from the region to ensure a broad representation of interests. During the meetings, MARC and the planning group will review the goals and action steps outline in the CEDS for the region and document progress on each activity. Also during the meeting, organizations will be asked about any significant changes or opportunities that have surfaced in the past year. Based on these changes, they will be asked to identify any new goals or projects that have been developed since the development of the 2014 CEDS.
The meetings will be held in the spring of each year and a follow-up report will be submitted to the Economic Development Administration on or before June 30 of each year. The report will be available for review by those that participated in the planning process as well as the general public.
The methods that MARC will use to support progress are:
• Providing best practices, training, and resources to communities related to development objectives.
• Providing assistance with project development, resource identification and implementation strategies to achieve development priorities.
• Providing grant writing assistance to support developments and help with compliance with grant regulations.
• Providing assistance to cities in the completion of certified site planning in cooperation with local utilities.
• Helping communities focus development along key transportation corridors and in strategic activity centers.
• Encouraging the use of brownfield programs to address mitigation and reuse opportunities.
• Continuing to support the Regional Workforce Intelligence Network with economic development agencies and workforce partners.
• Working with partners to increase global competitiveness.
• Working with partners to increase the manufacturing base and other key industry sectors, including digital media.
• Taking advantage of new high-speed fiber networks.
• Updating the CEDS as needed.
Measurements will include:
• The number of communities assisted with project development strategies (pre-funding stage).
• The number of communities assisted with grant applications as well as projects finalized regardless of funding source. Information also includes the amount of grant, matching funds, the number of residents affected, the result of the grant-funded project, and jobs created.

39 Comprehensive Economic Development Strategy PlanMid-America Regional Council • 2014
Community and Private Sector Participation
A number of organizations throughout the region, summarized below, are working together to engage industry and community members.
Regional Economic Development Agencies
KCADC
The Kansas City Area Development Council (KCADC) represents the economic interests of the entire two-state, 18-county region of Greater Kansas City. KCADC brands the region as one location to stimulate economic growth and enhance awareness of the metro’s assets to create positive perceptions. KCADC promotes the region as the business location of choice and positions the region competitively against other major metros for the retention, expansion and attraction of jobs and investment.
SmartPort
KC SmartPort is the authority on logistics opportunities in the 18-county, bistate Kansas City region. A nonprofit economic development organization, KC SmartPort promotes and enhances the Kansas City region’s status as a leading North American logistics hub. KC SmartPort has two main focuses in its mission: to grow the Kansas City area’s transportation industry by attracting businesses with significant transportation and logistics elements; and to make the industry and the region more competitive in the movement of goods into, out of and through the Kansas City area.
KCnext
KCnext – The Technology Council of Greater Kansas City is the recognized regional technology effort for the Kansas City area. The Technology Council promotes the region’s tech sector and strengthens the tech industry by recruiting and attracting technology companies to the Greater Kansas City region and growing the existing base of technology firms in the region through workforce development and industry advocacy. KCnext supports emerging and fast-growing tech firms by better coordinating regional business services and entrepreneurial resources to improve start-up success and collaborates with tech company partners to improve the IT workforce pipeline.
UMKC Small Business & Technology Development Center
The UMKC SBTDC is a resource for starting and developing businesses. The staff provides one-on-one counseling sessions and entrepreneurial training to individuals and businesses of all types and stages and assists thousands of entrepreneurs in the Kansas City region each year. Having experts in a variety of fields, the UMKC SBTDC specializes in technology development and commercialization, in addition to strategic planning and international trade. The UMKC SBTDC is part of the network of Missouri Small Business & Technology Development Centers and an affiliate of the UMKC Innovation Center.
Animal Health Corridor
The KC Animal Health Corridor is located within the world’s largest concentration of the animal health industry. The Animal Health Corridor is a conduit for interaction and innovation within the animal health industry. Related businesses in the corridor share initiatives and successes to allow the region to be known worldwide as the center of the animal health

40 Comprehensive Economic Development Strategy PlanMid-America Regional Council • 2014
industry. The corridor pursues federal and state legislation that will advance and promote the corridor’s assets, and develops workforce strategies to attract and retain a workforce skilled in key competencies to meet the needs of corridor companies and entities.
Local Economic Development Agencies
There are multiple local economic development agencies in the region that promote economic activity and working to attract new companies or help existing companies expand. Kansas City Power & Light (KCP&L) maintains a master license for a software system which tracks and analyzes existing businesses. Working with local economic development agencies, KCP&L has collected a database of information for 345 businesses. The data is used to analyze opportunities and threats in business retention and expansion. KCP&L makes the software available to its partner communities.
Entrepreneur Support Agencies
KCSourceLink
KCSourceLink helps small businesses in the 18-county Kansas City region grow and succeed by providing them with free, easy access to the help needed to start and grow businesses. KCSourceLink connects a network of 235+ nonprofit resource organizations that provide business-building services for small businesses. KCSourceLink facilitates the linking of these resource organizations to one another and to established, emerging and start-up small businesses throughout the region.
KC Digital Drive
KC Digital Drive works to ensure that Kansas City’s unique technology infrastructure (including gigabit speed fiber-to-the-home Internet) will result in positive civic and social outcomes for the region and its citizens. The organization is charged with implementation and stewardship of a digital playbook produced by the cities of Kansas City, Kansas, and Kansas City, Missouri, in cooperation with Mid-America Regional Council. Key areas of strategic priority are digital inclusion, the development of meaningful gigabit applications, expanding economic opportunities, and working with other gigabit cities across the nation.
Workforce Investment Boards
Full Employment Council
FEC is a private nonprofit organization serving the workforce needs of the Missouri side of the Kansas City region. FEC administers two workforce investment boards serving the region’s five Missouri counties, including Kansas City, Mo. FEC has operated programs totaling $20 million annually, including Missouri WIA Economically Disadvantaged —Adult and Youth Programs; WIA Dislocated Worker/Displaced Homemaker; and Temporary Assistance for Needy Families (TANF).
Workforce Partnership
Workforce Partnership is the Local Workforce Investment Board (LWIB) of Kansas Local Workforce Investment Area III. It serves Wyandotte, Johnson and Leavenworth counties in Kansas. Workforce Partnership is committed to building a workforce development system that meets the needs of both job seekers and employers throughout the Kansas City area, with a network of career centers in three counties offering professional expertise to employers and job seekers.

41 Comprehensive Economic Development Strategy PlanMid-America Regional Council • 2014
Higher Education
There are three public community college systems and four public universities serving the bistate region. In addition, there are numerous private colleges and universities that offer two-year, four-year and certificate programs.
Metropolitan Community College
MCC is a five-campus community college system serving a 50-mile radius area around Kansas City. More than 30,000 students are enrolled in credit coursework and another 12,000 in career workforce programs each year. MCC has a 95-year tradition of providing affordable, quality education, connecting with the community, and powering workforce and economic development, and its tuition is only one-third that of public four-year colleges. Collaborative relationships with more than 30 four-year colleges and universities provide easy credit transfer. The MCC student population is categorized as disadvantaged; within the associate degree program, 51 percent of students are classified as ethnic minority, socio-economically or educationally disadvantaged. Approximately 80 percent of students are in need of developmental education support. No other area college is as diverse. Students represent high school graduates, GED recipients, single parents, older returning students, and international students. Working students are the norm; 78 percent are employed. More than 27 percent are people of color; 43 percent are among the first generation in their families to attend college.
Johnson County Community College
JCCC has more than 34,000 students enrolled in credit and continuing education classes, Located in Overland Park, Kan., JCCC is the third largest institution of higher education in the state. JCCC offers undergraduate credit courses that form the first two years of most college curricula and features more than 50 one- and two-year career degree and certificate programs which prepare students to enter the job market. Professional continuing education is offered to individuals required by state licensing boards, certifying agencies and professional associations to obtain continuing education units (CEUs).
Kansas City Kansas Community College
KCKCC is a public, urban, open-door, and comprehensive community college committed to excellence in higher education. Through an accessible and supportive learning environment, the college’s mission is to provide higher education and lifelong learning to varied communities, primarily in its service area of Wyandotte and Leavenworth counties in Kansas. The total enrollment at the college is 7,000 students. KCKCC has received a TAACCCT grant from the Department of Labor to create the Training for Employment (T4E) program. T4E will focus on programs in construction (electrical, heating and refrigeration, building and property maintenance) with value added through additional green technology training (material reuse and recycling, lead, LEED, and environmental remediation); and advanced manufacturing (machine technology and welding).
University of Centeral Missouri
UCM’s main campus is located in Warrensburg, Mo., and hosts more than 11,000 students each year. The UCM Summit Center in Lee’s Summit, Mo., offers workforce development programs and helps individuals obtain a bachelor’s or master’s degree. The state-of-the-art Summit Center provides evening classes complemented with online and interactive classes.
University of Kansas Edwards Campus
The KU Edwards Campus is located in Overland Park, Kan. Courses at the Edwards Campus earn the same credit as those taught on the main campus in Lawrence, Kan., with students
42 Comprehensive Economic Development Strategy PlanMid-America Regional Council • 2014
earning KU degrees. The campus offers a wide variety of graduate and undergraduate degree completion programs for students to choose from and provides late afternoon and evening classes to help students balance the responsibilities of work and family.
University of Missouri–Kansas City UMKC
UMKC is a public research university located in Kansas City, Mo. It is a part of the University of Missouri System. The academic divisions of UMKC are the College of Arts and Sciences, the School of Education, the School of Nursing, the School of Management, the School of Medicine (one of six in Missouri), the School of Law (one of only four in Missouri), the School of Computing and Engineering, the School of Biological Sciences, the Conservatory of Music and Dance, the School of Dentistry, the School of Graduate Studies, and the School of Pharmacy.
Kansas State University Olathe Campus
Kansas State University is a three-campus system, and K-State Olathe is the newest member of the family. Complementing the main campus in Manhattan, Kan., and the College of Technology and Aviation in Salina, Kan., the Olathe campus is the academic research presence within the Kansas Bioscience Park, leveraging K-State’s broad capabilities and its many resources on the Manhattan campus.
Secondary Education Programs
PREP-KC
PREP-KC is a 501(c)3 funded by a collaborative of corporate, private and family foundations to increase college enrollment and access to high-quality employment for more than 60,000 mostly low-income students served by six of bistate Kansas City’s urban school districts. PREP-KC serves the region with a focus on urban school district partnerships. By maintaining this focus, PREP-KC has the opportunity to support improvements in student outcomes for school districts that serve mostly low-income students, many of whom are first-generation college students.
KC STEM Alliance
The KC STEM Alliance is a collaborative network of educators, business affiliates and organizations that inspires interest in science, technology, engineering and math careers to generate a robust force of related professionals for the community. KC STEM provides a shared services model for STEM programs, such as Project Lead the Way and FIRST, coordinating data collection and program evaluation as well as facilitating school and industry partnerships.
Manufacturing Extension Partnerships
Mid-America Manufacturing Technology Center (MAMTC) and Missouri Enterprise are the region’s National Institute of Standards and Technology Manufacturing Extension Partnership (NIST MEP) organizations. MAMTC serves Kansas and Missouri Enterprise serves the state of Missouri.
Both MEPs deliver solutions for manufacturing companies by providing technical assistance to implement technology to help resolve process challenges and evaluate products or parts for potential improvements in labor costs, accuracy and materials used. Services include innovation engineering, workforce training, supplier development, continuous improvement, ISO and AS 9100 certification and Six Sigma training, and energy management.

43 Comprehensive Economic Development Strategy PlanMid-America Regional Council • 2014
Strategic Projects, Programs and Activities
Regional Economic Development & Workforce Initiatives
Regional Workforce Intelligence Network (RWIN)
The Regional Workforce Intelligence Network of Greater Kansas City is a regional workforce and economic data exchange system convened by Mid-America Regional Council (MARC) to encourage greater collaboration among the region’s workforce data and information professionals. RWIN is a collaboration of economic development professionals, one-stop centers, workforce centers, community colleges and universities that meets on a regular basis to share information on current workforce development activities. The network provides input on real-time labor market reports, sector partnership development and other workforce development activities in the region.
Greater Kansas City Chamber of Commerce Big 5 Initiative
Led by the Greater Kansas City Chamber of Commerce, the Big 5 initiative elevates the Kansas City region onto the world stage and makes the area one of America’s best places to work, live, start a business, and grow a business. The Big 5 Ideas for were announced in September 2011:
1. Hosting the Global Symposium on Innovation in Animal Health.
2. Revitalizing Our Urban Neighborhoods Through the Urban Neighborhood Initiative (UNI).
3. Making Kansas City America’s Most Entrepreneurial City.
4. Growing Kansas City’s Medical Research, From Discovery to Cure.
5. Moving UMKC’s World-Class Arts Programs to a New Downtown Location.
Local Economic Developmentand Workforce Initiatives
GrowBlueSprings
GrowBlueSprings exists to inspire, encourage, connect and equip entrepreneurs in the Blue Springs, Mo., area and help them overcome the challenges of launching their businesses and moving from a great idea to a great business.
BOOST Lee’s Summit
A community-wide effort to attract, create, support and accelerate new and existing businesses within the city of Lee’s Summit and eastern Jackson County, BOOST Lee’s Summit connects businesses with resources through an integrated, systematic community ecosystem and portal.
Launch KC
The Launch KC initiative is designed to provide policy and marketing guidance for a sector specific recruitment and expansion initiative that will qualitatively change the perception of Kansas City’s capabilities for emerging innovation technology companies, and for public sector incentives. The function of Launch KC is to focus the attention of new and emerging firms to Kansas City on the Crossroads area (and the greater downtown) as a specific area

44 Comprehensive Economic Development Strategy PlanMid-America Regional Council • 2014
that currently provides exceptional data transmission capabilities, a youth-oriented quality of life, and a reputation for creativity.
America’s Creative Crossroads
America’s Creative Crossroads is a national positioning campaign to elevate the Kansas City region in the minds of potential visitors, residents, and businesses. It is both a visitor/convention attraction and economic development effort that is raising the region’s profile nationally. This campaign involves an unprecedented regional collaboration among the area’s largest civic leadership and arts organizations.
Entrepreneurship
Digital Sandbox KC
Digital Sandbox KC is the result of a U.S. Department of Commerce $1 million grant to create a proof of concept center to spur development of information technology-related start-up businesses in the Kansas City region. Consortium leaders anticipate that Digital Sandbox KC will generate a minimum of 10 new high-growth companies with either follow-on funding or at least $1 million in revenue each within two years of the launch.
Whiteboard to Boardroom
Led by the UMKC Innovation Center, a National Science Foundation Partnership for Innovation grant created the Whiteboard to Boardroom program (W2B) as a partnership between four regional schools — UMKC, the University of Kansas, Johnson County Community College and William Jewell College. It has since expanded to include numerous academic and research institutions in the bistate region. W2B is a team effort that includes research partners that provide the new technologies, a technology transfer office that collects technologies from research partners and helps with initial assessment and intellectual property issues, entrepreneurs with a depth of expertise and experience in different research areas that use a variety of business models, W2B staff members who serve as “match-makers,” and service providers such as the Small Business & Technology Development Center and KCSourceLink partners who help with business connections to facilitate start-up development. The Whiteboard2Boardroom program provides a number of services to the regional entrepreneurial community. These include, but are not limited to, identification of CEO talent for new companies, access to innovations developed at regional academic institutions and research organizations, establishment of strategic partnerships, and identification of sources of capital.
Urban Business Growth Initiative
The Urban Business Growth Initiative features training programs and technical assistance provided by the UMKC Small Business & Technology Development Center and the Missouri Procurement Technical Assistance Center. The initiative targets these services to low- to moderate-income individuals in the urban core who wish to start or grow businesses.
Workforce
KC 2.0
KC 2.0 is a marketing and branding initiative, led by KCADC, aimed at attracting Kansas City’s next generation of world-class talent. The primary goal of the initiative is to improve business success in attracting targeted employees to jobs in the Kansas City region. The program provides a suite of products and services primarily focused on promoting the lifestyle and career assets of the KC area.
45 Comprehensive Economic Development Strategy PlanMid-America Regional Council • 2014
Kansas City Women in Technology
KCWiT’s mission is to inspire young girls to join the technology field and help shape career opportunities through educational workshops, provide mentoring for young women entering the workforce, and to maintain a network for professional women in technology career paths in the Kansas City area.
Incubators
Ennovation Center
The Independence Regional Ennovation Center is a mixed-use business incubator which focuses on three core areas for the development of new businesses: bio-tech, kitchen/culinary, and business and technology. Located in Independence, Mo., the Ennovation Center has transformed the former Independence Regional Medical Center into a launching pad for entrepreneurs with the necessary facilities and support services to assist successful start-up businesses in an innovative environment that fosters collaboration.
Enterprise Center of Johnson County
Through the support of Johnson County, private donors, and in-kind support from the community, the Enterprise Center of Johnson County (ECJC) is able to provide services at a low cost to early-stage companies. ECJC works with companies in several different relationships. Companies can apply to receive advisory services from the ECJC management team, use the ECJC office space or services, or use the incubator services as a virtual tenant. Depending on the needs of the company, this may include conference room usage, mailbox services, and phone answering services.

46 Comprehensive Economic Development Strategy PlanMid-America Regional Council • 2014
The Mid-America Regional Council, commonly referred to as MARC, serves as the association of city and county governments and the metropolitan planning organization for the bistate Kansas City region. MARC seeks to build a stronger regional community through cooperation, leadership and planning. Through MARC’s leadership, area jurisdictions and diverse community interests sit down together to address the regions problems and identify the opportunities for cooperative solutions. These efforts, in turn, enhance the effectiveness of local government.
As a voluntary association, MARC strives to foster better understanding and cooperation on issues that extend beyond the jurisdiction of a single city, county or state. These issues include transportation, early education, older adult services, emergency services and homeland security, public safety communications, environmental protection, health care, economic development, sustainable development and others.
MARC’s Board of Directors consists of 33 locally elected leaders representing the nine counties and 119 cities in the bistate metropolitan Kansas City region. MARC plays an active leadership role in strengthening the metropolitan community by providing:
• A forum for addressing regional objectives and diverse community issues.
• Long-range planning and public policy coordination.
• Technical assistance and services to enhance the effectiveness of local government.
Transportation
MARC is the metropolitan planning organization (MPO) for the bistate Kansas City region. Federal highway and transit statutes require urbanized areas greater than 50,000 in population to designate MPOs as a condition for spending federal highway or transit funds. As the MPO, MARC receives federal funds to develop regional transportation plans and programs and to coordinate technical and policy studies on a wide range of transportation issues, working in cooperation with the Kansas and Missouri Departments of Transportation, local governments and transit providers.
MARC’s transportation planning activities serve Cass, Clay, Jackson, Johnson, Leavenworth, Miami, Platte and Wyandotte counties. MARC works with these communities, identified stakeholders and the public to plan for improvements to the region’s surface transportation system over the next 30 years as well as recommending investments through available federal and state grant funds.
The primary products of the transportation planning process include:
• The region’s long-range Metropolitan Transportation Plan.
• The Transportation Improvement Plan (TIP), a listing of projects recommended for federal and state transportation funds to support achieving the long-range plan.
• A Congestion Management System (CMS), a plan to reduce congestion on major highways and roadways.
• Regional Intelligent Transportation System (ITS) Architecture, a plan to use technology to better manage the region’s transportation system, including KC Scout, a freeway management system, and Operation Green Light, a synchronized traffic signalization project on major thoroughfares.
Appendix A: Overview of MARC

47 Comprehensive Economic Development Strategy PlanMid-America Regional Council • 2014
• The Smart Moves Plan, a long-range plan for the region’s public transit system.
• A Regional Transportation Safety Blueprint
• MetroGreen, a regional greenway trails system, and the Regional Bikeway Plan, a facility plan for non-motorized transportation.
Together these documents provide a blueprint for the development of the region’s transportation system and direct the expenditure of federal funds for highways, transit, bikeways and other modes of transportation.
MARC’s transportation department also oversees a grant program, Planning Sustainable Places, to fund local projects that support the vision of a more vibrant ,connected and green region through a centers-and-corridors strategy; special transportation programs that support disadvantaged populations, including the elderly, low-income and disabled; and a RideShare program to promote use of alternative modes of transportation.
Maintaining the region’s transportation infrastructure is critical to continued economic growth and development for the Kansas City area. The region’s prominence as a major transportation hub, its growing logistics industrial sector, and the need for workers to travel to and from employment centers are all factors in the region’s transportation planning work.
Community Development
MARC supports a coalition of officials from inner-ring suburbs that works on housing and commercial revitalization in those portions of the Kansas City region developed just prior to or following the second World War. The First Suburbs Coalition has developed a marketing strategy to encourage reinvestment, partners with a local credit union to provide low cost financing for housing rehabilitation, and is working on the design of reinvestment in older suburban strip centers.
Since 2010, MARC has worked with a consortium of more than 60 regional partners on the Creating Sustainable Places intitiative, which promotes our shared vision for a sustainable region — one that balances a thriving economy, social equity and a healthy environment, meeting today’s needs without compromising the needs of future generations — and a strategy for moving communities from planning to action.
MARC also supports the Homelessness Task Force of Greater Kansas City, a group of local governments and service providers focused on advocacy, information sharing, coordination and program development organization to help the region prevent and solve homelessness.
MARC receives funds from the U.S. Economic Development Administration and has been designated as an Economic Development District for the Kansas City metro area. MARC provides support to local agencies and organizations seeking to plan for, design and implement investments that address economic distress within the metro area. MARC maintains this Comprehensive Economic Development Strategy Plan (CEDS) to support the region’s economic development efforts.
Workforce Development
MARC convenes the Regional Workforce Intelligence Network of Greater Kansas City (RWIN), a regional workforce and economic data exchange system, to encourage greater collaboration among the region’s workforce data and information professionals.

48 Comprehensive Economic Development Strategy PlanMid-America Regional Council • 2014
RWIN is a collaboration of economic development professionals, one-stop centers, workforce centers, community colleges and universities that meets on a regular basis to share information on current workforce development activities. The network provides input on real-time labor market reports, sector partnership development and other workforce development activities in the region.
MARC has received federal and private foundation funds to support workforce development efforts and promote more effective training and education with secondary and post-secondary educators and programs that serve adult and dislocated workers.
Citizen Engagement
MARC supports a citizen engagement initiative that brings citizen input into local decision-making processes and helps the Greater Kansas City region find common ground on important issues. MARC uses workshops, online communities, blogs, social media and surveys to engage the public.
Local Government Services
The Government Innovations Forum was created when an organization of city and county managers and administrators from the Greater Kansas City metropolitan area committed to support a full-time staff person at MARC to manage communications between managers and jurisdictions and follow through on Roundtable ideas and initiatives. Supported by contributions from more than 40 cities and counties, the Government Innovations Forum provides staff support to the Managers’ Roundtable and its initiatives and connects members with a variety of regional research and decision-making mechanisms.
The Government Training Institute (GTI) provides targeted cost-efficient, high quality training services to local governments and nonprofit partner organizations. GTI provides training to 7,500 employees and officials on an annual basis. The training programs include leadership development, workshops for planning commissioners, technical environmental training, computer skills, certificate programs and customized training.
MARC’s Small Cities Program provides administrative, planning and informational resources to smaller local governments. There are 90 cities in the region with populations under 10,000, and only 23 of these cities employ a city manager or administrator. It is increasingly difficult for smaller cities to address the problems that confront their communities due to limited resources. The Small Cities Program supplements local staff with resources, while focusing on a limited number of issues and program areas. Included in the Small Cities Program are:
• Initiatives to help communities gain access to state and federal programs through grant writing and grant management services.
• Information on planning techniques for infrastructure development, economic and community initiatives .
• Training on the use of economic development tools to take advantage of private funding opportunities.
• Assistance with best practices, policy writing and a master contract for goods and services.
• Identification of revenue sources, use of special improvement districts and budget structure.
• Mapping support services.

49 Comprehensive Economic Development Strategy PlanMid-America Regional Council • 2014
Other local government services include the Kansas City Regional Purchasing Cooperative and a new shared services pilot project that allow cities to access building department services through a contract with the Institute of Building Technology and Safety.
Research Services
MARC’s Research Services Department provides various services to member cities and counties and regional initiatives. These services include data and research, Geographic Information Systems (GIS) and mapping, and information technology. Resources available to support economic development in the metro area include:
• KC Economy — A blog-based source for economic information for the Kansas City Metropolitan Area. MARC uses this forum to provide recent data and analysis to keep stakeholders up to date on Kansas City’s economy.
• Metro Dataline — Data on the region’s population, economy, social characteristics, and other areas, as well as maps of the region are housed on the Metro Dataline Web site. In addition, Metro Dataline provides unique reports from MARC’s Research Services staff, and links to other major sources of data about the Kansas City region.
• Geographic Information Systems (GIS) — Local governments use GIS every day to assist regional planning efforts in the areas of transportation, environment and emergency services. MARC supports collaboration between area governments on cross-jurisdictional GIS/mapping projects and cost-sharing endeavors.
• Publications — The Research Services Department publishes a wide variety of reports, including the annual Greater Kansas City Economic Forecast and the Long Range Forecast.
Environmental Protection
MARC’s primary environmental program areas of air quality, watershed management, solid waste management, energy and green infrastructure bring community partners together to address regional environmental issues in a cooperative setting. Each program includes a strong educational component based on the concepts of smart growth and sustainability, with messages directed at a variety of groups and audiences. MARC also works with several broad-based environmental initiatives that cut across program lines to achieve multiple objectives, including:
• The Kansas City Environmental Education Network works with environmental educators and organizations to expand environmental education in the region.
• The Natural Resources Inventory (NRI) uses digital map data to study valuable natural resource assets and ecological features in the Kansas City region.
• The region’s green building program encourages more environmentally-sensitive design and construction practices.
• Sustainable Growth for Small Cities provides tools to help growing communities with land use practices, zoning policies and funding resources.
• Creating Sustainable Places identifies how smart growth planning concepts may be applied to the Kansas City region.
• The Solar Ready KC initiative helped streamline local government permitting and planning processes, explore financing options and identify best practices in implementing solar energy in order to make it easier for residents and businesses to use solar energy.

50 Comprehensive Economic Development Strategy PlanMid-America Regional Council • 2014
Emergency Services, Homeland Security and Public Safety Communications
MARC has provided support to the region’s emergency services agencies for over 30 years, bringing officials together to develop plans, protocols and programs, and to manage local, state and federal resources. MARC coordinates the region’s 9-1-1 communications system, ensuring a high quality means for the public to access emergency response.
MARC administers the region’s homeland security funding, ensuring the region is working toward enhancing capabilities to reduce risks from and respond to all hazards, including those caused by terrorist acts. MARC also supports the Mid-America Local Emergency Planning Committee, charged with bringing industry and emergency response agencies together to reduce risks from hazardous chemical releases, and coordinates pre-hospital emergency care with hospitals and ambulance services.
Early Education
Since 1989, MARC has worked with community partners to develop a system of high quality early education programs and services in metropolitan Kansas City. Early education is important to ensure that all young children have the skills and support necessary to enter school ready to succeed.
Since 2005, MARC has served as the grantee for Mid-America Head Start (MAHS), serving Clay, Jackson and Platte counties in Missouri. MAHS ensures quality services for about 3,000 children and their families each year.
MARC’s early education program advocates for community support and adequate funding to ensure that all families have access to quality early learning programs, particularly children from lower income working families that need support to enter or remain in the work force.
Health Care
MARC’s Regional Health Care Initiative addresses ways to provide effective health care for citizens who do are uninsured or underinsured. The initiative’s current work involves:
• Developing a health information exchange network among safety net providers.
• Making sure the region is fully utilizing federal and state programs.
• Increasing access to health care services for those currently uninsured.
The project addresses these priorities by building on existing community programs and initiatives. It also brings together stakeholders with the appropriate technical assistance to develop and implement strategies to address the issues associated with the uninsured.
In partnership with three local public health agencies, MARC also supports Building a Healthier Jackson County, which focuses on chronic disease prevention by reducing the risks of secondhand smoke and encouraging healthy eating and active lifestyles.
Aging Services
MARC’s Department of Aging Services functions as the Area Agency on Aging for Cass, Clay, Jackson, Platte and Ray counties in Missouri. Area Agencies on Aging (AAAs), created through the Older Americans Act of 1965, advocate for, design and implement programs to meet the unique needs of older citizens within the counties they serve.
51 Comprehensive Economic Development Strategy PlanMid-America Regional Council • 2014
MARC coordinates a wide variety of services for older adults and their caregivers, including congregate and home-delivered meals, transportation services, case management services, an information and assistance phone line, and a volunteer ombudsman program for residents of long-term care facilities.
In 2012, MARC took on leadership of KC Communities for All Ages, an initiative working to ensure that the region is prepared to meet the needs of an expanding older population. The initiative has accelerated local efforts to make area communities age-friendly places to grow up and grow old, publishing a toolkit for local governments and introducing a pilot project to help cities earn a Communities for All Ages designation.

52 Comprehensive Economic Development Strategy PlanMid-America Regional Council • 2014
Appendix B: County Profiles
Cass County, Mo., is a rapidly growing county on the southern edge of Kansas City’s urbanized area, with just over 100,000 residents spread over 699 square miles.
While the northern part of the county is largely growing suburbs, much of the southern part of the county is rural.
The designation of US 71 as an interstate highway (I-49) presents an opportunity for the county to promote the corridor for economic activity.
There are approximately 23,000 workers in the county, about half of whom live in the county and the other half in surrounding counties. The county’s largest employers are concentrated in the retail and transportation/warehousing sectors.
QUICK FACTS:
2013 Population: 100,641
• 11th largest county by population in Missouri
• 23% growth since 2000
Median Household Income: $54,690
Poverty Rate: 8.7%
Unemployment Rate: 7.7%
POPULATION DENSITY POVERTY BY CENSUS TRACT
1 dot = 50 people
Cass County, Missouri

53 Comprehensive Economic Development Strategy PlanMid-America Regional Council • 2014
Clay County, Mo., is a large, mostly suburban county on the northern part of the metro area adjacent to the Missouri River.
Of the 89,387 workers in the county, 42 percent live in the county. Of the county’s 105,867 labor force, almost 36 percent work in Clay County and 64 percent commute out of the county to work.
Cerner Corporation, the Ford assembly plant and Hallmark Cards are among the county’s largest employers. Other major employers are in the entertainment and health care industries, including casinos, amusement parks and hospitals.
POPULATION DENSITY
1 dot = 50 people
Clay County, Missouri
QUICK FACTS:
2013 Population: 230,473
• 6th largest county by population in Missouri
• 25% growth since 2000
Median Household Income: $57,002
Poverty Rate: 8.7%
Unemployment Rate: 6.5%
POVERTY BY CENSUS TRACT

54 Comprehensive Economic Development Strategy PlanMid-America Regional Council • 2014
Jackson County, Missouri
Jackson County, Mo., is the largest county in the Kansas City Metro with 679,996 residents.
The county’s median household income is below the metro area median. Of the county’s 348,517 workers, 52 percent live in the county.
Jackson County is home to Kansas City’s central business district. Much of the western portion of the county is urbanized Kansas City, Mo., while eastern Jackson County is made up of smaller suburban communities.
Major employers include H&R Block, Hallmark Cards, DST, Peterson Manufacturing, Honeywell, Bayer CropScience, St. Luke’s Health System, BlueCross BlueShield, and Burns and McDonnell Engineers.
Cerner Corporation recently announced plans to open a new campus in southeastern Kansas City, eventually adding 14,000 jobs in the county. A new intermodal facility and Honeywell operations opened in southern Kansas City.
QUICK FACTS:
2013 Population: 679,996
• 2nd largest county by population in Missouri
• 4% growth since 2000
Median Household Income: $44,401
Poverty Rate: 18.9%
Unemployment Rate: 8.3%
POPULATION DENSITY
1 dot = 50 people
POVERTY BY CENSUS TRACT

55 Comprehensive Economic Development Strategy PlanMid-America Regional Council • 2014
Johnson County, Kansas
Johnson County, Kan., is the second largest county in the metro, with 544,179 residents.
The county’s median household income is above the metro area median.
The county’s adult population is more highly educated with over 50 percent holding at least a bachelor’s degree. Of the county’s 312,303 workers, 55 percent live in the county.
Johnson County is also a growing employment center with the opening of a new intermodal hub in southwest Johnson County near Edgerton and continued growth in the College Boulevard and I-35 corridors.
Major employers include Shawnee Mission Medical Center, Quest and Quintiles in health care; Honeywell and Garmin in manufacturing; and JCP Distribution, YRC and Sysco in transportation and warehousing. The county is also a hub for engineering with Black and Veatch headquarters in the county.
QUICK FACTS:
2013 Population: 566,933
• Largest county by population in Kansas
• 26% growth since 2000
Median Household Income: $73,227
Poverty Rate: 6.8%
Unemployment Rate: 4.9%
POPULATION DENSITY
1 dot = 50 people
POVERTY BY CENSUS TRACT

56 Comprehensive Economic Development Strategy PlanMid-America Regional Council • 2014
Leavenworth County, Kansas
Leavenworth County, Kan., is located on the northwest corner of the region. Its northeast boundary borders the Missouri River.
With Fort Leavenworth and the Leavenworth Federal Prison as major employers, over 30 percent of Leavenworth County employees work in the government sector.
The county’s median household income is slightly higher than the metro area median. Of the county’s workers, 61 percent are residents.QUICK FACTS:
2013 Population: 78,185
• 6th largest county by population in Kansas
• 14% growth since 2000
Median Household Income: $59,683
Poverty Rate: 9.4%
Unemployment Rate: 7.5%
POPULATION DENSITY POVERTY BY CENSUS TRACT
1 dot = 50 people

57 Comprehensive Economic Development Strategy PlanMid-America Regional Council • 2014
Miami County, Kansas
Miami County is a mostly rural county on the southwest corner of the Kansas City metro area.
The new intermodal facility in the Edgerton area is expected to create opportunities for housing and economic growth in the county.
The county’s median household income is higher than the metro area median.
Just over half of the county’s workers are residents, many in farming occupations. Major employers are concentrated in retail, health care, education and other service industries.
QUICK FACTS:
2013 Population: 32,835
• 19th largest county by population in Kansas
• 16% growth since 2000
Median Household Income: $60,018
Poverty Rate: 9.1%
Unemployment Rate: 7.2%
POPULATION DENSITY
1 dot = 50 people
POVERTY BY CENSUS TRACT

58 Comprehensive Economic Development Strategy PlanMid-America Regional Council • 2014
Platte County, Missouri
Platte County, Mo., located on the north side of the metro area adjacent to the Missouri River, is one of the fastest growing counties in the MSA.
Of the 39,253 workers in the county, 29 percent are residents and the 71 percent commute in from surrounding counties.
Business development is significant along the I-29 corridor and around Kansas City International Airport. Among the county’s major employers is a Harley-Davidson manufacturing plant. A recent business addition to the I-29 Corridor is Aviation Technical Services — an aircraft maintenance and repair operation.
The construction of a levee along the Missouri River has enabled the city of Riverside to open up industrial property and several automotive parts manufacturers have recently located in the county.
QUICK FACTS:
2013 Population: 93,310
• 12th largest county by population in Missouri
• 26% growth since 2000
Median Household Income: $65,449
Poverty Rate: 6.1%
Unemployment Rate: 6.1%
POPULATION DENSITY
1 dot = 50 people
POVERTY BY CENSUS TRACT

59 Comprehensive Economic Development Strategy PlanMid-America Regional Council • 2014
Ray County, Missouri
Ray County, Mo., sits in the northeast corner of the Kansas City Metro. It is predominantly rural with 11 smaller communities, the largest of which is Richmond, the county seat, with 5,681 residents.
The county has a median income of $49,783. The majority of workers who live in the county work in other counties — 38 percent in neighboring Clay County.QUICK FACTS:
2013 Population: 23,039
• 50th largest county by population in Missouri
• 1% decline since 2000
Median Household Income: $49,783
Poverty Rate: 12.3%
Unemployment Rate: 8.9%
POPULATION DENSITY
1 dot = 50 people
POVERTY BY CENSUS TRACT

60 Comprehensive Economic Development Strategy PlanMid-America Regional Council • 2014
Wyandotte County, Kansas
Wyandotte County, Kan., has seen its population stabilized in recent years after decades of population loss. This stability is due mostly to the rapid growth of the more suburban western half of the county. Major retail and entertainment investments in western Wyandotte County have and will continue to pay off.
One of the county’s challenges is that it is a leader in the metro area in high paying jobs, yet a small proportion of those jobs are held by county residents. Of the 70,477 workers in the county, 29 percent are residents and 71 percent come from surrounding counties.
The location of the Kansas Speedway in western Wyandotte County has spurred considerable retail development and the location of a minor league stadium and major league soccer stadium. The Cerner Corporation built a large office building, locating 4,000 jobs in the area, which has spurred residential construction. The county is working to enhance public transit services along State Avenue from downtown to the western business centers.
QUICK FACTS:
2013 Population: 160,384
• 4th largest county by population in Kansas
• 2% growth since 2000
Median Household Income: $37,529
Poverty Rate: 23.4%
Unemployment Rate: 8.5%
POPULATION DENSITY
1 dot = 50 people
POVERTY BY CENSUS TRACT

61 Comprehensive Economic Development Strategy PlanMid-America Regional Council • 2014
The Kansas City area has a rich cultural heritage, exemplified by the many places of historic interest and significance across the region.
There are seven historic sites across the Kansas City region that are National Historic Landmarks. These sites include:
• Fort Osage in Sibley (Jackson County)• Mutual Musicians Association Building in Kansas City (Jackson County)• Harry S. Truman Farm Home in Grandview (Jackson County)• Harry S. Truman Historic District in Independence (Jackson County)• Watkins Mill north of Excelsior Springs (Clay County)• Shawnee Methodist Mission (Johnson County)• Fort Leavenworth, (Leavenworth County)
There are four state parks located in the Kansas City metropolitan area:
• Thomas Hart Benton Home and Studio State Historic Site (Jackson County)• Hillsdale State Park (Miami County)• Watkins Mill State Park (Clay and Ray Counties)• Weston Bend State Park (Platte County)
National Historic Places (updated 1/14/14)
The National Register of Historic Places is the federal government’s official list of historic properties worthy of preservation. Listed below, by county, are the region’s historic properties, historic districts and archeological sites on the National Register of Historic Places. Dates in parentheses are dates that sites were added to the National Register of Historic Places.
Cass County, Mo.
Brown, Robert A., House, north of Harrisonville (6/15/70)Watkins Family Farm Historic District (3/19/07)Harrisonville Courthouse Square Historic District, (4/08/94)O’Bannon Homestead, northeast of Garden City (7/03/79)Pleasant Hill Downtown Historic District (3/23/05)St. Peter’s Episcopal Church, Harrisonville (9/09/82)Stumbaugh Post No. 180 G.A.R. Hall, Austin (6/8/00)
Clay County, Mo.
Aker Cemetery, northeast of Smithville (11/13/74)Antioch Christian Church, Kansas City (4/02/79)Armour Theatre Building (6/24/08)Arthur-Leonard Historic District, Liberty (1/4/01)Atkins-Johnson Farmhouse Property (11/07/07)Clay County Savings Association Building, Liberty (12/28/92)Claybrook House, Kearney vicinity (12/21/81)Clinton House, Liberty (11/22/78)Colonial Hotel (6/24/10)Compton, Dr. James, House, Kansas City (7/10/79)Dougherty-Prospect Heights Historic District, Liberty (1/4/01)
Appendix C: Historic Places and Landmarks

62 Comprehensive Economic Development Strategy PlanMid-America Regional Council • 2014
Elms Hotel, Excelsior Springs (3/29/85) Excelsior Springs Hall of Waters Commercial East Historic District, Excelsior Springs (5/27/99)Excelsior Springs Hall of Waters Commercial West Historic District, Excelsior Springs (5/27/99)First Methodist Church (10/28/09)Garrison School Historic District, Liberty (1/4/01)Hall of Waters, Excelsior Springs (6/09/83)Hughes, Frank, Memorial Library, Liberty (12/28/92)IOOF Liberty Lodge #49, Liberty (12/28/92)James Brothers’ House and Farm, northeast of Kearney (3/16/72); boundary increase (9/27/78)Jewell Hall, Liberty (9/6/78)Jewell-Lightburne Historic District, Liberty (1/4/01)Ligon Apartments (5/14/10)Major Hotel, Liberty (12/28/92)Miller Building, Liberty (12/28/92)Missouri City Savings Bank Building and Meeting Hall (7/30/10)Mt. Memorial Cemetery (4/12/12)Nebo Hill Archaeological Site (3/04/71)Odd Fellows Home District, Liberty (9/15/87)Sears, Roebuck and Company Warehouse Building, North Kansas City (5/9/97)South Liberty Courthouse Square Historic District, Liberty (12/28/92)Watkins Mill, northwest of Excelsior Springs (11/13/66) West Liberty Courthouse Square Historic District, Liberty (12/28/92)Wheeling Corrugating Company Building, North Kansas City (10/21/94)Woodneath, Kansas City (2/17/78)Wyman School (7/24/08)
Jackson County, Mo.
1524 Grand Avenue Building (4/15/04)1901 McGee Street Automotive Service Bldg. (1/22/09)18th and Vine Historic District, Kansas City (9/9/91)85th and Manchester “Three Trails” Trail Segment (8/22/12)A.B.C. Storage and Van Co. Building (2/01/07)Acme Brass and Machine Works Building (7/14/04)Aines Farm Dairy Building (10/01/08)Alana Apartment Hotel (7/05/06)Ambassador Hotel Historic District, Kansas City (2/17/83)Argyle Building (8/17/05)Armour Boulevard Post-World War II Apartment Building Historic District (11/07/07)Attucks School, Kansas City (9/9/91)Auto Coach Building (4/18/07)Bailey Family Farm Historic District (7/03/06)Baker-Vawter Building, Kansas City (5/5/00)Bancroft School (1/12/12)Barclay Building (2/8/07)Bayles Addition Historic District (2/13/13)Bellefontaine Avenue Historic District (2/14/11)Bellerive Hotel, Kansas City (2/28/80)Benton, Thomas Hart, House and Studio, Kansas City (11/21/80)Beth Shalom Synagogue, Kansas City (9/9/82)

63 Comprehensive Economic Development Strategy PlanMid-America Regional Council • 2014
Bingham-Waggoner Home and Estate, , Independence (5/22/80)Bixby, Walter E., House, Kansas City (11/21/78)Blackstone Hotel (10/18/03)Blue Mills, Independence (4/21/94)Boley Building, Kansas City (3/9/71)Bonfils Building, Kansas City (3/22/84)BMA Tower, Kansas City (8/21/02)Bon Air Apartments (7/30/08)Braley, Charles A. House (10/09/13)Bryant Building, Kansas City (4/24/89)Bryant, Dr. John S. Jr. and Harriet Smart, House, Independence (5/21/92)Buick Automobile Company Building (5/05/04)Bunker Building, Kansas City (9/5/75)Burnett-Berry House, 1030 W 65th St, Kansas City (2/18/11)Byram’s Ford Historic District (10/16/89)Cave Spring (8/10/78)Chambers Building (12/28/01)Chappell, Philip E., House (8/03/90)Chatham Hotel (6/24/08)Cherry Street Colonnades Historic District (9/22/05)Chicago Apartments (9/11/80)Christian Church Hospital (10/21/04)Circle Apartments (10/22/02)City Bank Building (2/17/83)Coates House Hotel (2/23/72)Coca-Cola Building (8/18/88)Colonnade Apartment Building at 4302 Oak Street (9/04/08)Columbia Building (05/05/00)Continental Hotel (8/08/83)Corrigan, Bernard, House, (1/18/78)Corrigan, Thomas, Building, (9/16/82)Crestwood Historic District (10/08/98)Crossroads Historic Freight District (12/22/00)Curtiss, Louis, Studio Building (6/19/72)Dean, O.H., Building (9/03/09)Dierks Building (1/29/2009)Disney, Walt, House and Garage (5/22/78)District I Armour Boulevard MRA (7/28/83)District I Hotels in Downtown Kansas City TR (8/08/83)District II Armour Boulevard MRA (7/28/83)District III Armour Boulevard MRA (7/28/83)Dorson Apartment Building (5/05/87)Drumm, Andrew, Institute (11/03/06)East 27th Street Colonnades Historic District (6/28/06)Ellsworth Apartments (10/22/02)Elmwood Cemetery (7/28/83)Exchange Building (6/13/03)Faultless Starch Co. Building (5/9/02)Federal Reserve Bank of Kansas City (4/10/07)Fidelity National Bank and Trust Co. Building (8/14/97)Fire Department Headquarters, Fire Station #2 (9/02/82)Firestone Building (1/03/86)

64 Comprehensive Economic Development Strategy PlanMid-America Regional Council • 2014
Floyd, Jacobs, House (9/08/83)Fort Osage (10/15/66; NHL 11/05/61)Fort Osage Archaeological District (3/17/72)Four Gates Farm (7/15/91)Fowler, Henry T. House (7/28/83)Gary, Hunter, House (2/13/08)Gate City National Bank Building (9/02/82)George, Todd M. Sr., House (2/12/10)Georgen, John and Adele, House (05/05/00)German Evangelical Pastors’ Home Historic District (10/13/88)Gillham Court Apartments Building (11/07/07)Globe Storage and Transfer Co. Building (4/18/07)Gloyd Building (7/25/85)Goodenow Textiles Co. Building (4/18/03)Grand Avenue Temple and Grand Avenue Temple Building (5/08/85)Grandview Residential Historic District (11/15/05)Graphic Arts Building (8/04/05)Greenlease Cadillac Building (6/13/03)Guadalupe Center (9/02/03)Gumbel Building (1/25/79)Harris, Col. John, House (10/18/72)Helping Hand Institute Building (05/05/00)Henderson, Dr. Generous, House (2/28/79)Hesse Carriage Co. Building (3/21/07)Hiland Telphone Exchange Building (5/06/05)Holy Name Catholic Church (9/25/03)Holy Rosary Historic District (2/07/07)Hook, Mary Rockwell, House (9/08/83)Hotel Phillips (6/04/79)House at 5011 Sunset Drive (9/08/83)House at 54 E 53rd Terrace (9/08/83)Howard Neighborhood Historic District (7/03/07)Howe, Frank M., Residence (4/18/85)Hughes, Mollie and Josephine, House (4/07/94)Hyde Park East Historic District (5/27/04)Hyde Park Historic District (11/21/80)Hyde Park West Historic District (5/27/04)Imperial Brewing Co. Brewery (2/11/11)Insurance Building-Consumers Cooperative Association Building (11/25/05)Inter-State Building (6/12/08)Ivanhoe Masonic Temple (5/02/85)Jackson County Courthouse (10/18/72)Jackson County Jail and Marshal’s House (6/15/70)Janssen Place Historic District (11/07/76)Jenkins Music Company Building, (3/02/79)Jensen-Salsbery Laboratories (7/16/85)Jones, Lewis, House (4/21/94)Jones, R. Bryson, House (4/15/09)Kansas City Athenaeum (10/11/79)Kansas City Club Building (11/19/02)Kansas City Cold Storage Co. Building (6/01/05)Kansas City Live Stock Exchange (4/05/84)

65 Comprehensive Economic Development Strategy PlanMid-America Regional Council • 2014
Kansas City Masonic Temple (11/14/80)Kansas City, Missouri Western Union Telegraph Building (2/12/03)Kansas City Police Station Number 4 (10/26/05)Kansas City Power and Light Co. Building (1/09/03)Kansas City Public Library (5/23/77)Kansas City Southern Railway Building (5/06/04)Kansas City Terminal Railway Co. Roundhouse Historic District (1/26/01)Kansas City Title and Trust Building (6/25/05)Kansas City Water Department Building (4/07/94)Katz, Michael H. and Rose, House (3/22/04)Keith, Charles S., House (03/31/00)Kelley-Reppert Motor Co. Building (11/12/04)Kelly’s Westport Inn (Albert G. Boone Store) (9/07/72)Kessler Apartments (10/22/02)Kirkwood Building (7/25/01)Knickerbocker Apartments (6/13/03)Knight, William Baker and Mary, House (10/18/03)Kritser House (4/10/85)Kuehne-Schmidt Apartments (2/13/07)Land Bank Building (1/18/85)Lee’s Summit Christian Church Building (4/20/11)Lee’s Summit Downtown Historic District (8/02/07)Lewis-Webb House (2/06/86)Liberty Memorial (10/06/00; NHL 9/20/06)Linwood Presbyterian Church and Home for Convalescent Employed Women (8/07/12)Liquid Carbonic Co. Building (4/29/94)Locust Street Apartments (4/29/11)Loew’s Midland Theater-Midland Building (9/28/77)Long, R. A., Building (1/08/03)Long, R. A., House (11/14/80)Longview Farm (10/24/85)Loose, Jacob, House ((7/28/83)Loretto Academy, (7/28/83)Love, Emily Rockwell, House (9/08/83)Lowe and Campbell Sporting Goods Building (1/12/12)Maine Apartments (10/22/02)Mainstreet Theatre (2/15/07)Majestic Apartments (10/17/03)Majors, Alexander, House (4/03/70)Maples Apartments (10/22/02)Marks and Garvey Historic District (6/28/06)Marty, Albert, Building (2/05/13)Maryland Apartments (10/22/02)McConahay Building (5/22/78)McIntire, Levi, House City (7/28/83)McMahon Apartments (10/22/02)Mercantile Bank & Trust Building (12/31/09)Meyer, August, House (9/09/82)Midwest Hotel (5/06/04)Milo Apartments (10/25/11)Mineral Hall (7/12/76)Minor, Charles, House (3/22/84)
66 Comprehensive Economic Development Strategy PlanMid-America Regional Council • 2014
Missouri Apartments (10/22/02)Missouri Pacific Depot (1/29/79)Monroe Hotel (5/06/04)Montgomery Ward and Company General Merchandise Warehouse (7/08/10)Morningside Acres Historic Ranch House District (2/03/12)Mount Washington School (4/23/13)Mutual Ice Co. Building, (8/04/04)Mutual Musician’s Foundation Building (2/07/79; NHL 12/21/81)Myers, George J., House (7/28/83)National Bank of Commerce Building (5/5/99)National Garage, (05/05/00)Nettleton, George H., Home (10/14/99)New England Apartments (10/22/02)New Santa Fe “Three Trails” Trail Swales (8/22/12)New York Life Building (7/08/70)Newbern Hotel (9/23/80)Newcomers, D. W., Sons Funeral Home (8/09/83)Nicholson, George E., House (11/25/05)Noland, Smallwood V., House (4/21/94)Northeast Douglas Street Residential Historic District (8/27/08)Northeast Forest Avenue and Northeast Green Street Residential Historic District (8/27/08)Northeast Green and 1st Streets Residential Historic District (8/27/08)Old New England Building (10/25/73)Old Town Historic District (6/07/78)Ostertag, Robert, House (9/08/83)Overfelt-Campbell-Johnston House (9/05/75)Owens-McCoy House (4/21/94)Palace Clothing Co. Building (1/18/85)Parade Park Maintenance Building (7/24/08)Paris and Weaver Apartment Buildings (7/05/06)Park Lane Apartments (5/05/04)Park Manor Historic District (2/01/06)Parkview, The (Apartment Buildings) (10/22/02)Paseo YMCA (9/09/91)Peck, George B., Dry Goods Co. BuildingCity (4/30/80)Pendergast, Thomas J., Headquarters (10/25/11)Pennbroke Apartments (4/15/09)Peppard, Joseph Grear, House (3/26/85)Peters, Nelle E., Troost Avenue Historic District (7/23/09)Pickwick Hotel, Office Building, Parking Garage and Bus Terminal (3/29/05)Pilgrim Lutheran Church for the Deaf of Greater Kansas City and Parsonage (1/25/01)Pink House (Residential Structures by Mary Rockwell Hook TR (9/08/83)Plaza House Apartments (10/16/13)Pratt and Whitney Plant Complex (8/28/13)President Gardens Apartments Historic District (12/10/98)President Hotel (Hotels in Downtown Kansas City TR (8/08/83)Professional Building (Bryant Building)(7/17/79)Quality Hill (7/07/78)Repp, William D., House (7/28/83)Rice-Tremonti House (3/02/79)Richards and Conover Hardware C (1/21/99)Rieger Hotel (5/06/04)

67 Comprehensive Economic Development Strategy PlanMid-America Regional Council • 2014
Rockhill Neighborhood (7/21/75)Rockwell, Bertrand, House (9/08/83)Row House Building (5/22/78)Row House Buildings (1/15/85)Sacred Heart Church, School and Rectory (11/14/78)Safeway Stores and Office and Warehouse Building (05/05/00)St. Mary’s Episcopal Church (11/07/78)St. Paul’s Episcopal Church (10/03/85)St. Regis Hotel (12/03/13)St. Teresa’s Academy Music and Arts Building (11/15/00)Santa Fe Place Historic District (5/30/86)Santa Fe Trail – Minor Park (6/30/94)Santa Fe Trail – Santa Fe Trail Park (4/21/94)Savoy Hotel and Grill (12/30/74)Scarritt Building and Arcade (3/09/71)Scarritt, Edward Lucky (5/23/77)Scarritt, Rev. Nathan, House (5/08/78)Scarritt, William Chick, House City (3/21/78)Scarritt Point North Historic District (12/01/97)Scarritt Point South Historic District (12/01/97)Seven Oaks School (10/09/12)Sewall Paint and Glass Co. Building (5/9/02)Shelley, William Francis, House (3/17/78)Sherwood Manufacturing Co. Building (10/28/10)Simpson-Yeomans Country Side Historic District (9/06/84)Simpson-Yeomans Country Side Historic District ((05/26/00)Simpson-Yeomans-Country Side Historic District (7/14/11)Smith and Sons Manufacturing Co. Building (12/18/07)Sophian Plaza (7/05/83)South Hyde Park Historic District (11/14/07)South Side Historic District (6/09/83)Southeast Grand Avenue and Fifth Street Residential Historic District (4/20/11)Southeast Green Street Historic Cottage District (10/14/10)Southeast Third Street and Southeast Corder Avenue Ranch House Historic District (9/15/11)Southeast Third Street Residential Historic District (10/14/10)Southwest Market Street Historic District (2/27/13)Southwest Third and Southwest Madison Historic District (2/13/13)Squibb, E.R. and Sons (12/07/10)Squier Park Historic District (4/24/12)Standard Theatre (6/05/74)Stenzel, R.O. and Co. Warehouse (7/20/07)Stine and McClure Undertaking Co. Building (7/19/90)Studna Garage Building (7/05/06)Swinney, E.F., School (10/16/13)Switzer School Buildings (12/18/09)Temple Block Building (6/19/85)Temple Site (9/22/70)Tocoma City (11/24/82)Toll, Alfred, House (7/28/83)Town of Kansas Site (6/28/11)Townley Metal and Hardware Co. Building (1/24/01)

68 Comprehensive Economic Development Strategy PlanMid-America Regional Council • 2014
Triangle Battery and Service Co. Building (10/17/03)Trinity Episcopal Church (4/27/79)Tromanhauser, Norman, House (1/26/01)Truman, Harry S, Historic District, Range 32 West, Township 49 North (11/11/71)Truman, Harry S, National Historic Site (5/31/85)TWA Corporate Headquarters’ Building (11/20/02)Twenty-Ninth Street Colonnaded Apartments Historic District (2/07/07)Twenty-Twenty Grand Building (4/16/12)Union Station (2/01/72; boundary increase 5/06/04)U.S. Courthouse and Post Office (11/20/07)United States Post Office (5/26/04)Unity School of Christianity Historic District (4/12/89)Uptown Building and Theatre (6/27/79)Vaccaro, Joe, Soda Water Manufacturing Co. Building (10/18/03)Vaile, Harvey M., Mansion (10/01/69)Valentine on Broadway Hotel (8/01/08)Van Noy, Ira C. and Charles S., House (7/08/87)Villa Serena Apartment Hotel (4/15/09)Virginia Apartments (10/22/02)Vitagraph Film Exchange Building (2/28/08)Volker, William, House (5/20/93)Waldo Water Tower (Frank T. Riley Memorial (4/18/77)Walnut Street Warehouse and Commercial Historic District (9/17/99)Walnut Street Warehouse and Commercial Historic District (6/13/08)Walnut Street Warehouse and Commercial Historic District (12/17/08)Waltower Building (8/8/01)Ward, Seth E., Homestead (2/17/78)Warner, Maj. William, House (5/23/77)Webster School (9/02/82)West Eleventh Street Historic District ((9/09/82)West Ninth Street-Baltimore Avenue Historic District (11/07/76)West Ninth Street-Baltimore Avenue Historic District (11/20/02)West Ninth Street-Baltimore Avenue Historic District (10/12/10)Western Newspaper Union Building (3/21/07)Westminster Congregational Church (2/28/80)Wholesale District (10/25/79)Wholesale District City (4/23/13)Windsor Hall Apartments (1/14/11)Woodson-Sawyer House (3/20/86)Woolworth, F. W., Building (5/06/05)Wornall, John B., House (5/21/69)Young, Solomon, Farm (5/05/78; NHL 2/04/85)
Platte County, Mo.
Babcock Site, address restricted (11/15/73)Benjamin Bannaker School, Parkville (9/22/95)Deister Archaeological Site, address restricted (1/21/70)Krause, Frederick, Mansion, Platte City (5/22/78)MacKay Building, Park College, Parkville (4/6/79)McCormick Distillery, Weston (4/16/74)Missouri District Warehouse, Weston (7/19/10)Platte County Courthouse, Platte City (1/17/79)

69 Comprehensive Economic Development Strategy PlanMid-America Regional Council • 2014
Pleasant Ridge United Baptist Church, near Weston (3/13/02)Renner Village Archaeological Site, address restricted (4/16/69)Scott, Charles Smith, Memorial Observatory, Parkville (5/29/92)Sugar Creek Site, address restricted (12/12/73)TWA Administrative Offices Building (11/06/07)Waddell “A” Truss Bridge, Parkville (1/25/91)Washington Chapel C.M.E. Church, Parkville (8/31/92)Weston Historic District, Weston (8/21/72)
Ray County, Mo.
Dougherty Auditorium (Farris Theater), Richmond (9/16/82)Mansur, Isaiah, Farmstead Historic District, Richmond vicinity (8/14/98)New Hope Primitive Baptist Church, southwest of Richmond (11/14/80)Ray County Courthouse, Richmond (10/11/79)Ray County Poor Farm (Ray County Historical Society & Museum), Richmond (7/10/79)Watkins House, Richmond (2/10/83)
Johnson County, Kan.
Blackfeather Farm, Stilwell (8/22/96)Broadmoor Ranch House Historic District (2/7/11)Dutton- Thomas- Soule Farm (8/26/06)Ensor Farm, Olathe (2/27/04)Foster, Herman D. House (Gardner Historical Museum), Gardner (11/28/07)Horn-Vincent-Russell Estate, Mission Hills (7/25/97)Lanesfield School, Edgerton (10/13/88)Lanter, Franklin R., House, Olathe (10/10/07)Loomis Historic District, Merriam (5/17/06)Mahaffie, J.B., House, Olathe (8/29/77)Majors (Alexander) House, Leawood (12/29/70)McCarthy (John) House, Edgerton (7/10/00)Ott, Albert, House, Olathe (4/1/98)Overland Theater, Overland Park (2/9/05)Parker, Martin Van Buren, House, Olathe (8/29/88)Pickering, I.O., House, Olathe (12/1/80)Redel Historic District, Stilwell (8/16/96)Shawnee Methodist Mission, Fairway (5/23/68)Turner (William Thomas) Barn, Gardner (4/1/99)Virginia School District #33, Shawnee (5/19/04)Voights (Herman J. and Ella B.) House, Leawood (5/18/95)WPA Beach House at Gardner Lake, Gardner (6/25/92)Westwood Hills Historic District (12/4/13)Wolcott House, Mission Hills (5/2/01)
Leavenworth County, Kan.
AXA Building, Leavenworth (3/16/72)Abernathy Furniture Company Factory, Leavenworth (10/12/04)Angell, A.J., House, Leavenworth (11/17/77)Arch Street Historic District, Leavenworth (7/3/02)Atchison, Topeka and Santa Fe Railroad Passenger Depot, Leavenworth (6/11/86)Begley Bridge, Millwood vicinity (5/9/03)Brewer, David J., House, Leavenworth (2/23/72)Burt, Nathaniel H., House, Leavenworth (10/27/87)

70 Comprehensive Economic Development Strategy PlanMid-America Regional Council • 2014
Caenen Site 14LV1083, Tonganoxie vicinity (9/6/05)Carroll, Edward, House, Leavenworth (10/02/86)Evans Site, Tonganoxie Vicinity (10/28/04)First Presbyterian Church, Leavenworth (01/11/06)Fort Leavenworth, (10/15/66 )Fort Leavenworth National Cemetery, Fort Leavenworth (7/15/99)Harris, Senator William A., House, Linwood (11/5/74)Harvey, Fred, House, Leavenworth (4/26/72)Helmers Manufacturing Company Building (10/8/09)Hollywood Theater, Leavenworth (10/25/90)Hund School, Leavenworth (3/9/00)Insley, Merritt, House and Outbuildings, Leavenworth (10/2/86)Lamborn, Horace and Rosemond, Farmstead (10/06/11)Lansing Man Archeological Site, Lansing (3/24/71)Leavenworth County Courthouse, Leavenworth (4/26/02)Leavenworth Downtown Historic District, Leavenworth (4/26/02)Leavenworth Historic Industrial District, Leavenworth (4/29/02)Leavenworth Landing Historic District (8/10/81)Leavenworth Public Library, Leavenworth (7/30/86)Leavenworth Terminal Railway & Bridge Company Freight Depot (5/06/09)North Broadway Historic District, Leavenworth (7/3/02)North Broadway School (8/13/11)North Esplanade Historic District, Leavenworth (12/12/77)Paul Site 14LV1043, Tonganoxie vicinity (9/6/05)Powers, David, House, Leavenworth (8/30/77)Quarry Creek Archeological Site, Fort Leavenworth (4/23/73)Scott Site, Tonganoxie Vicinity (10/29/04)South Esplanade Historic District, Leavenworth (7/3/02)Sumner Elementary School (7/04/11)Third Avenue Historic District, Leavenworth (7/3/02)Union Depot (Old), Leavenworth (3/11/82)Union Park Historic District, Leavenworth (7/3/02)Western Branch, National Home for Disabled Volunteer Soldiers, Leavenworth (4/30/99)Zacharias Archeological Site, Leavenworth (1/8/87)
Miami County, Kan.
Asylum Bridge, Osawatomie (1/4/90)Brown, John, Cabin, Osawatomie (3/24/71)Carey’s Ford Bridge, Rantoul (1/4/90)Creamery Bridge, Osawatomie (3/10/83)Hillsdale Archeological District, Hillsdale (5/12/77)Jackson Hotel, Paola (7/9/08)Jake’s Branch of Middle Creek Bridge, Louisburg (7/2/85)Miami County Courthouse, Paola (3/1/73)Mills, William, House, Osawatomie (11/20/86)New Lancaster General Store (12/11/13)New Lancaster Garage Hall (12/11/13)Pottawatomie Creek Bridge, Osawatomie (3/10/83)
Wyandotte County, Kan.
Argentine Carnegie Library, Kansas City (4/30/86)Bonner Springs High School, Bonner Springs (7/11/02)

71 Comprehensive Economic Development Strategy PlanMid-America Regional Council • 2014
Castle Rock, Kansas City (2/18/00)Fairfax Hills Historic District (Parkwood Estates), Kansas City (6/30/07)Fire Station No. 9, Kansas City (9/05/85)Franklin Elementary School (6/23/2013)Gates, Judge Louis, House, Kansas City (12/01/80)Granada Theater, Kansas City (2/9/05)Grinter Place, Kansas City (1/25/71)H.W. Gates Funeral Home (7/06/10)Hanover Heights Neighborhood Historic District, Kansas City (5/17/90)Huron Cemetery, Kansas City (9/3/71)Kansas City, Kansas City Hall and Fire Headquarters (4/25/86)Lake of the Forest Historic District, Bonner Springs (1/22/96)Lowell Elementary School, Kansas City (1/31/08)Mann, Horace Elementary School (1/20/12)Meeks, Cordell Senior House (10/9/13)Northeast Junior High School, Kansas City (10/16/08)Quindaro Townsite, Kansas City (5/22/02)Rosedale World War I Memorial Arch, Kansas City (8/2/77)Sauer Castle, Kansas City (8/2/77)Schleifer-McAlpine House, Kansas City (10/10/07)Scottish Rite Temple, Kansas City (9/11/85)Shafer (Theodore) House, Kansas City (2/18/00)Shawnee Street Overpass, Kansas City (3/8/84)Soldiers and Sailors Memorial Building, Kansas City (9/5/85)St. Augustine Hall, Kansas City (2/24/71)St. John the Divine Catholic Church (10/9/13)Sumner High School and Athletic Field, Kansas City (9/6/05)Trowbridge Archeological Site, Kansas City (2/24/71)Westheight Manor Historic District, Kansas City (2/19/82)Whitefeather Spring, Kansas City (8/27/75)Williamson, Roy, House, Edwardsville (4/18/07)Wyandotte County Courthouse, Kansas City (4/26/02)Wyandotte High School, Kansas City (4/30/86)

72 Comprehensive Economic Development Strategy PlanMid-America Regional Council • 2014
The Kansas City region is home to several species of mammals, birds, reptiles, fish and plants listed as endangered or threatened by the U.S. Fish and Wildlife Service. These species are listed below. This list also contains “candidate species”—species that have been studied and proposed for addition to the federal endangered and threatened species list by the U.S. Fish and Wildlife Service. The table contains the common name of the mammal, bird, reptile, amphibian, fish or plant; its scientific name; its habitat; and its status as an endangered, threatened or candidate species according to the U.S. Fish and Wildlife Service. Detailed information on endangered or threatened species in the Kansas City area is available through the USFWS Environmental Conservation Online System.
Endangered Species in the Greater Kansas City Region
Species Habitat Status
American Bittern Lakes, reservoirs, non-forested wetlands State endangered
Bald Eagle Forest land (deciduous, evergreen and mixed), water, streams and canals, lakes, reservoirs, forested and non-forested wetland
Federal threatened
State endangered
Barn Owl Residential, cropland and pasture, orchards, groves, vineyards, nurseries, herbaceous rangeland
State endangered
Black-Tailed Jackrabbit Residential, cropland and pasture, orchards, groves, mixed rangeland, other agricultural land, herbaceous rangeland
State endangered
Chestnut Lamprey Lower Kansas River and may occur in the Missouri River main stem
State threatened
Eastern Massasauga Herbaceous rangeland, shrub and brush rangeland, non-forested wetland
State endangered
Eastern Spotted Skunk Cropland and pasture, orchards, groves, herbaceous rangeland, shrub and brush rangeland, mixed rangeland, forest land (deciduous, evergreen and mixed)
State endangered
Flathead Chub Streams and canals State endangered
Gray Bat No critical habitat rules have been published for the Gray bat
Federal endangered
Indiana Bat Hibernacula habitat: caves and mines; maternity and foraging habitat: small stream corridors with well-developed riparian woods, upland forests
Federal endangered
Interior Least Tern Water, streams and canals, lakes, beaches, strip mines, quarries and gravel pits
Federal endangeredState endangered
King Rail Cropland and pasture, streams and canals, non-forested wetland
State endangered
Lake Sturgeon Streams and canals State endangered
Mead’s Milkweed Virgin prairies Federal threatened
Appendix D: Endangered Species

73 Comprehensive Economic Development Strategy PlanMid-America Regional Council • 2014
Northern Harrier Cropland and pasture, rangeland, herbaceous rangeland, shrub and brush rangeland, mixed rangeland, non-forested wetland
State endangered
Pallid Sturgeon Missouri and Mississippi Rivers Federal endangered
Peregrine Falcon Cropland and pasture, herbaceous rangeland, mixed rangeland
Federal endangeredState endangered
Redbelly Snake Wooded regions near rivers and lakes, sandstone woods, wooded hillsides, steep slopes of forested hills, moist areas
State threatened
Sicklefin Chub Streams and canals Federal candidate
Smooth Earth Snake Sandstone woods, rocky hillsides in moist woodlands, deciduous forests, wooded urban areas
State threatened
Snowy Egret Evergreen forest land, lakes, reservoirs, forested and non-forested wetland
State endangered
Silverband Shiner Moderately deep, flowing water along sand or gravel bars
State threatened
Sturgeon Chub Streams and canals Federal candidate
Topeka Shiner Streams and canals Federal endangered
Western Prairie Fringed Orchid
Unplowed, calcareous prairies and sedge meadows. Soil moisture is critical.
Federal threatened

74 Comprehensive Economic Development Strategy PlanMid-America Regional Council • 2014
The Kansas City area is also home to a number of sites used for the disposal of industrial byproducts and hazardous wastes. These sites are listed as Class 1 through Class 5 in the Missouri Department of Natural Resources’ Registry of Confirmed Abandoned or Uncontrolled Hazardous Waste Disposal Sites in Missouri, referred to as the Registry.
Class 1 Sites
Class 1 sites are defined in the Missouri Registry Annual Report as “sites that are causing or presenting an imminent danger of causing irreversible or irreparable damage to the public health or environment—immediate action required.” According to the Missouri Registry Annual Report, the Kansas City area contains two of these Class 1 sites:
• Armour Road Site (Clay County)
The Armour Road Site, located at 2251 Armour Road in North Kansas City, was the location of a herbicide blending facility from 1943 until 1983. The soil is contaminated with extremely high levels of arsenic, antimony, pentachlorophenol and lesser levels of numerous other substances and the groundwater at the site is also contaminated. This contamination is believed to be a result of spills and general operational practices at the facility. The 25,000 square foot building on site is also contaminated. The site, which covers an area of 1.8 acres, is located between an industrial area and a residential neighborhood. South of the property are rail yards, warehouses and industrial facilities. The site is adjacent to a commercial development zone and homes are about 1,200 feet away.
• Lake City Army Ammunition Plant (Jackson County)
The Lake City Army Ammunition Plant, located at the junction of Highways 7 and 78 near Independence, is a seven-square-mile, government-owned, contractor-operated plant that began operation in 1941. It is the largest small arms ammunition plant in the nation. Industrial operations generated large quantities of potentially hazardous waste, including solvents, explosives, heavy metals (such as barium, cadmium, chromium, lead, mercury and silver) and depleted uranium. Since 1941, the facility disposed of operational wastes in lagoons, landfills and burn pits located throughout the facility. Groundwater beneath the site, soil, and surface water are contaminated with volatile organic compounds and heavy metals. Air strippers and groundwater extraction wells were installed to remove contaminants from extracted groundwater and to contain contaminated groundwater plumes. Further investigations leading to final cleanup activities are taking place. Current disposal practices are in accordance with state and federal regulations. However, recent investigations indicate contaminants have migrated off site.
Class 2 Sites
The Missouri Registry Annual Report defines Class 2 sites as “a significant threat to the environment — action required.” There are five of these sites in the Kansas City area, including:
• BFI Missouri City Landfill (Clay County)
Browning-Ferris Industries (BFI) Missouri City Landfill is located along Stillhouse Road on a bluff above the Missouri River, about one mile north of Missouri City, west of County Road JJ in Clay County. The site consists of about 200 acres, of which the southern 90 acres were used for waste management activities. The site was originally developed as a sanitary landfill. Additional
Appendix E: Hazardous Waste Sites

75 Comprehensive Economic Development Strategy PlanMid-America Regional Council • 2014
industrial waste disposal trenches were constructed, filled and closed after BFI of Kansas City Inc. leased the site in 1972 from Lincoln Brothers Land, Inc. BFI operated the facility from 1972 until 1983. Waste management facilities included a sanitary landfill, a chemical processing center where bulk liquid wastes were received for temporary storage prior to treatment by fixation units, gelatin basins, seven bulk sludge disposal trenches, a chemical landfill, a wastewater treatment pond, a stormwater retention pond and sludge drying beds. At least 160 million pounds of industrial wastes were deposited at the site. Contaminants at the site include solvents, herbicide wastes, organophosphates, waste acids, waste oils, industrial wastewater treatment sludge, paint sludge and heavy metals sludge. Currently, the waste facility is adequately capped, vegetated and well-maintained, and a fence and locked gate control access to the site. Several residences are within less than half a mile.
• Conservation Chemical Company (Jackson County)
The Conservation Chemical Company site is located in an industrial area at 8900 Front Street, about 1.75 miles east of Interstate 435 along Levee Road in Kansas City. The site covers about six acres and is situated on the flood plain of the Missouri River near the confluence of the Missouri and Blue Rivers on the river side of the levee. This site operated as a chemical storage and disposal facility from 1960 to 1980. Waste disposal basins, which were either unlined or poorly lined, were used to receive and store wastes and also served as containers and drying beds for byproduct sludges. Pesticides, herbicides, waste oils, organic solvents, arsenic, acids, cyanide compounds and other materials were disposed at the facility; an estimated 93,000 cubic yards of material was disposed and eventually buried at the site. In 1975, the Missouri Department of Natural Resources investigated the operation and ordered it closed and cleaned up. The site was closed in 1979. Post-closure activities, which concluded in 1990, included capping six lagoons, grading, and placing vegetation on the remaining portion of the site.
• HCI Chemtech — Birmingham Road (Clay County)
The HCI Chemtech — Birmingham Road site is located at 6301 Northeast Birmingham Road in North Kansas City. The facility encompasses 11 acres along the northern bank of the Missouri River. Residences are located about 1,000 feet north of the site. This site is a bulk chemical storage and distribution facility that has been in operation since 1968. Current storage and handling activities are restricted to caustics and asphalt, due to the transfer of some operations to the HCI Chemtech — Stillwell Street facility. During previous site operations, as many as 66 above-ground storage tanks (ASTs) have been used. 46 of those tanks were located in containment areas with earthen floors until 1995, when the floors were paved with concrete. Bulk chemicals were delivered to the facility by trucks, barges and rail car and stored in ASTs. Chemicals have been mixed or repackaged prior to sale or sold in bulk. The truck fleet distributed the chemicals, primarily via tank truck or drums. Spills are the probable source of on-site contamination of soils and groundwater with volatile organic compounds, semi-volatile organic compounds and herbicides. The potential exists for contaminants to discharge into the Missouri River.
• HCI Chemtech — Stillwell Street (Jackson County)
The HCI Chemtech — Stillwell Street site, located at 5200 Stillwell Street in Kansas City, is a bulk chemical storage and distribution facility in operation since 1981. The site is in the Missouri River flood plain, occupying 6.5 acres along the northern bank of the Missouri River levee in a mixed commercial and industrial area. Residences are located approximately one-half mile from the site. Bulk chemicals are delivered to the facility by trucks and rail cars and are stored in ASTs. Chemicals may be mixed, repackaged prior to sale or sold in bulk. Releases and spills are the probable source of contamination of soils and groundwater. Volatile and semi-volatile organic compounds were detected in groundwater at concentrations above health-based screening levels.

76 Comprehensive Economic Development Strategy PlanMid-America Regional Council • 2014
Groundwater contaminants originating on the HCI Chemtech property are migrating off site to the north, and the potential exists for site contaminants to discharge into the Missouri River.
• Riverfront Landfill (Jackson County)
The Riverfront Landfill is located on Levee Road at Chouteau along the south bank of the Missouri River from River Mile 363.5 to 359.0 in Kansas City. The 492-acre site operated as a municipal landfill from 1950 until 1972. The site contains myriad hazardous wastes; waste disposed at the site was unregulated and no records exist about the wastes dumped at the site. A portion of the landfill was capped in 1992 and the western portion of the landfill was developed as a city park. Groundwater contamination is possible, due to the site’s history, the quantity and type of waste disposed at the site and the hydrogeologic setting of the area. The site was excavated to the water table and filled a liner, so infiltrating materials are likely to contaminate groundwater. Due to burning of liquid wastes at the site, polychlorinated dibenzofurans may have resulted from the burning of environmentally persistent polychlorinated biphenyls (PCBs). At one time, final cover material at the site eroded, exposing solid wastes, which entered the Missouri River (Kansas City corrected this problem). Principal concerns at this site are the potential for human contact with contaminated soils and groundwater.
Class 3 Sites
According to the Missouri Registry Annual Report, Class 3 sites “do not present a significant threat to the public health or the environment — action may be deferred.” There are five Class 3 sites in the Kansas City area:
• Amoco Oil Sugar Creek Refinery (Jackson County)
The Amoco Oil Sugar Creek Refinery is located at 1000 North Sterling in Sugar Creek. This site is the location of a former active oil refinery which began operations in 1904 and ceased refinement of crude oil and production of petroleum products in 1982. The former refinery area consists of about 423 acres. Amoco now operates a marketing terminal and an asphalt plant on the property. Five separate disposal areas of the Amoco property, totaling about 22 acres, are located next to the Missouri River. The registered areas include four inactive tank bottom disposal areas and one inactive sludge disposal area. There is also a land farm for the disposal of leaded gasoline storage sludge near the river, which the EPA has identified as having high concentrations of lead and chromium. Other contaminants identified at the site include cadmium, polycyclic aromatic hydrocarbons (PAHs), oil and sludges, arsenic, mercury, benzene, toluene, ethyl benzene and xylene. The location of the site next to the Missouri River presents problems because of flooding and groundwater contamination. Surface soil contamination is widespread but is contained within berms. During the flood of 1993, the inactive sludge disposal area was covered by floodwater. Groundwater contamination has resulted from past activities at the site, but the groundwater discharge to the Missouri River has had minor impacts on water quality. The Missouri River is used as a drinking water supply by the city of Lexington 31 miles downstream and the Missouri River alluvium supplies drinking water to the city of Independence 2.5 miles downstream. An exposure assessment conducted by the Missouri Department of Health and Senior Services did not uncover any evidence of human exposure occurring off site. However, according to the Missouri Registry Annual Report, the site poses a health risk because of the toxicity of the chemicals present and the known groundwater contamination.
• Independence FMGP #1 (Jackson County)
The Independence Former Manufactured Gas Plant (FMGP) #1 site is located in a combination residential, commercial and light industrial area northwest of the intersection of West Pacific Avenue and South River Boulevard in Independence. Gas plant operations occurred on property
77 Comprehensive Economic Development Strategy PlanMid-America Regional Council • 2014
currently owned by the Reorganized Church of Jesus Christ of Latter Day Saints (RLDS). In addition, several of the plant operations buildings were located beneath what is now West Pacific Avenue. The site is located within the drainage basin along the southeast edge of the RLDS Auditorium parking lot and extends beneath West Pacific Avenue. No visual remains of former gas plant structures remain and the entire basin area of the site is covered by vegetation. Waste present on the site is coal tar. Subsurface soil samples collected from the site contained volatile organic compounds and carcinogenic polycyclic aromatic hydrocarbons at concentrations exceeding health-based screening levels, as well as leachable benzene exceeding the Toxicity Characteristic Leaching Procedure regulatory limit of 0.5 parts per million. Although coal tar residuals are present in surface and subsurface soil at the site, the majority of contamination is located between six to seven feet below the ground and is not expected to pose a significant air or soil exposure risk. In addition, the potential for exposure to contaminants and their migration off site is minimal. However, disturbance of the soil (other than regular lawn care and parking lot maintenance) would increase the chance for public exposure to the buried hazardous wastes.
• Lake Lotawana Sportsmen’s Club (Jackson County)
The Lake Lotawana Sportsmen’s Club is located at 29709 Alley Road in Lake Lotawana. It is a 60 acre private sport club with a recreational small arms firing range. The site is surrounded by nearby residences. The principal environmental concern is lead associated with the operation of the firing range. Surface soils contain elevated concentrations of lead (as high as 4,700 parts per million) and one sample contained leachable lead at a concentration of 181 parts per million, exceeding the Toxicity Characteristic Leaching Procedure regulatory limit of 5.0 parts per million. In addition, low concentrations of lead were detected in sediment samples collected from a downgradient intermittent stream, indicating that some lead is migrating off site. No significant accumulation of lead is expected in the stream, however. The Missouri Department of Natural Resources has determined that no significant exposure risk is present through the soil or surface water. In addition, the potential for groundwater contamination is low to moderate. The chief health concern with this site is human exposure to unacceptable levels of lead-contaminated dust through inhalation or ingestion. Tracking lead-contaminated dust off site is also a concern because of the documented high levels of such contaminants found in the area.
• Plattco Landfill — Riverview Property (Platte County)
The Plattco Landfill — Riverview Property is located on FF Highway in Parkville, on the bluffs above the Missouri River and within a quarter mile of Rush Creek. The site was operated as a sanitary landfill from 1969 until its closure in 1978. Between 1969 and 1972, and prior to the Resource Conservation and Recovery Act (RCRA), a variety of industrial and residential wastes were deposited at the site. Since no waste identification records or transport receipts exist, the exact quantities and characteristics of industrial waste in the landfill can only be speculated. Intermittent inspection reports by the Missouri Department of Health and Senior Services and statements by the former operator indicate that the landfill accepted waste liquids, sludges and solids from local commercial and industrial operations until 1972. The presence of ignitable, corrosive and toxic wastes in significant quantities is probable, but unconfirmed. The wastes that may have been disposed at the site include wastewater treatment sludges and refinery sludges from industrial firms, including clarifier sludges, filtration sludges, paint sludges, solvent wastes, off-spec pesticides, refractory slag and air pollution residues. The main source of off-site migration of contaminants has been discharge periodically observed emanating from the leachate collection sump area. Surface discharge could lead to exposure through ingestion of contaminated surface or groundwater. Contamination of the Missouri River alluvial aquifer may also be possible. The potential for exposure exists due to the absence of sampling data and uncertainty about the kinds and concentrations of hazardous substances at the site (MDNR, 138-140).

78 Comprehensive Economic Development Strategy PlanMid-America Regional Council • 2014
• Prier Brass Manufacturing Company (Jackson County)
The Prier Brass Manufacturing Company is located in an industrial area at 7801 Truman Road in Kansas City and operated from 1907 to 1985 as a manufacturer of brass products. The site contained unacceptable levels of leachable lead and cadmium. Contaminated material has been removed from the site and excavated areas have been filled with clean fill. However, contaminated foundry wastes remain under a portion of the main building. The potential exists for off-site contamination via surface water, due to the proximity of waste materials to the Blue River (it is possible for floodwaters and surface runoff to wash contaminants into the river). The completion of removal action has decreased this threat, however.
According to the Missouri Registry Annual Report, municipal drinking water systems downstream are not expected to be adversely impacted by contaminants from the site unless a major release occurs. Also, it is likely that any effects of contamination on groundwater would be localized. Reoccupation of the site and ongoing renovation, however, raise the possibility of worker and visitor exposure to contaminants still present under the main building on the site.
Class 4 Sites
The Missouri Registry Annual Report defines Class 4 sites as being “properly closed--require continued management” (MDNR, 3). Two Class 4 sites exist in the Kansas City area:
• ARMCO (Jackson County)
ARMCO is an active steel manufacturing plant located at 7000 Winner Road in an industrial area of Kansas City. From 1962 to 1980, the company used two landfills at the site for the disposal of electric furnace baghouse dust generated by steel manufacturing processes. This dust was found to contain leachable quantities of lead and cadmium, as well as 10 to 12 percent zinc. This industrial waste became regulated by RCRA after 1980, and the two landfills are capped and covered with vegetation. Although no environmental problems currently exist, the potential exists for surface and groundwater contamination due to the leachable nature of the waste. A study conducted by the U.S. Geological Survey and Missouri Department of Natural Resources found that the only release of contaminants from the site appears to be from surface run-off into the Blue River. This study revealed a doubling of zinc levels and smaller increases in the concentration of lead in the river immediately following rainstorms. Cancer deaths between 1983 and 1993 for this site’s study population were higher than expected, compared to statewide cancer deaths. However, two natality studies found no significant differences compared to state averages and an exposure investigation by the Missouri Department of Health and Senior Services did not document any significant exposure from this site. The Missouri Registry Annual Report indicates a health threat exists at this site, based on available data (MDNR, 175-177).
• Lee Chemical (Clay County)
The 2.5-acre Lee Chemical site is located south of old Highway 210 and north of the railroad tracks, approximately 0.7 miles east of Highway 291 in Liberty. This site was used for packaging a variety of chemicals from 1966 to 1974, when Lee Chemical abandoned the facility. City of Liberty officials removed several hundred drums of chemicals on the site in 1977. Although the visible contamination has been removed, analyses indicate trichloroethylene (TCE) and volatile organic compounds are still present in groundwater and soil. In 1980, a drinking water study detected TCE in the city’s drinking water wells and Lee Chemical was identified as the source of the TCE in the city’s well, located a quarter-mile east of the site. Interim response and remedial actions by the city of Liberty, as well as well field management techniques and treatment modifications, have reduced TCE levels in the drinking water to below detection limits; no wells currently supplying drinking water to the city contain detectable levels of TCE. In addition, a new municipal well

79 Comprehensive Economic Development Strategy PlanMid-America Regional Council • 2014
field was developed about two miles from the site. Although the city of Liberty’s remedial actions were very effective, a health risk still exists at the Lee Chemical site, since levels of TCE in the groundwater (but not in the city’s public drinking water system) are still above the public drinking water standard (MDNR, 16, 201-204).
Class 5 Sites
The Missouri Registry Annual Report defines Class 5 sites as “properly closed with no evidence of present or potential adverse impact — no further action required” (MDNR, 3). Since Class 5 sites are removed from the registry, they are not included in this plan.
National Priorities List
Four of the aforementioned Class 1 through 4 sites are also included in the U.S. Environmental Protection Agency’s (EPA) National Priorities List (NPL). The NPL is the EPA’s list of national priorities among the known or threatened releases of hazardous substances, pollutants or contaminants throughout the United States (www.epa.gov). Registry sites on the NPL include:
• Armour Road site in North Kansas City
• Conservation Chemical Company site in Kansas City
• Lake City Army Ammunition Plant in Independence
• Lee Chemical site in Liberty
Former Manufactured Gas Plants
Prior to the availability of natural gas, many municipal and industrial gas plants manufactured gas from coal. These sites are now known as “former manufactured gas plants” (FMGPs). Many wastes, including coal tar, were generated by the coal gas production process at these plants. These wastes were often spilled or buried on site. The primary chemical contaminants in coal tar are potentially carcinogenic polycyclic aromatic hydrocarbons and volatile organic compounds. Other contaminants that may present a risk at FMGP sites are cyanide and several kinds of metals. The Missouri Registry Annual Report lists eight confirmed FMGP sites in the Kansas City area.
Wood Treating Facilities
The wood preservation process involves the penetration of a preservative, usually under pressurized applications, into the timber. Common preservatives used in this process include chromated copper arsenate (CCA), copper napthenate, creosote and pentachlorophenol. Past mismanagement of these preservatives at wood-treating facilities has caused significant contamination of soil and groundwater at some sites. Contamination is generally caused by excess preservative from the treated wood dripping onto the ground. These chemicals contaminate the soil and groundwater and can potentially be transported a considerable distance from the site. The Missouri Registry Annual Report lists five confirmed wood treater sites in the Kansas City area.
“Tier II” Facilities
Federal and state Emergency Planning and Community Right-to-Know regulations require that facilities that have on site (1) more than 10,000 pounds of hazardous materials for which a Material Safety Data Sheet (MSDS) is required; (2) more than 500 pounds, or the threshold planning quantity, of extremely hazardous substances as defined by 40 CFR Parts 300 and 355; or (3) more than 100 pounds of explosives or blasting agents, must provide the Missouri Emergency Response Commission (MERC), Local Emergency Planning Committees (LEPC) and local fire departments with annual reports (known as Tier II reports) of the types and quantities of these hazardous materials (MERC website,

80 Comprehensive Economic Development Strategy PlanMid-America Regional Council • 2014
online data). There are more than 700 of these “Tier II” facilities in Cass, Clay, Jackson, Platte and Ray counties.
Risk Management Program (RMP)
Section 112 (r) of the Clean Air Act established the Risk Management Program requirements for facilities processing or manufacturing one or more of 140 acutely toxic substances, flammable gases, and volatile liquids at certain threshold quantities. Under these requirements, industry has the obligation to prevent accidents, operate safely, and manage hazardous chemicals in a safe and responsible way through hazard assessment, a prevention program, and an emergency response program. These programs are summarized in a risk management plan (RMP). RMPs are submitted to the EPA with a required update of at least once every five years. The EPA maintains a reading library for RMPs and information contained in these plans can be accessed by permission of the EPA. Elements in the plan include:
• An off-site consequence analysis that evaluates specific potential release
• Scenarios, including worst-case and alternate scenarios.
• A five-year accident history of releases of regulated substances.
• An integrated accident prevention program.
• An emergency response program.
• An overall management system to supervise the implementation of these
• program elements.
There are a combined 52 RMP facilities in Johnson, Leavenworth, Wyandotte, Cass, Clay, Jackson, Platte and Ray counties.

81 Comprehensive Economic Development Strategy PlanMid-America Regional Council • 2014
FORMER MANUFACTURED GAS PLANTS
Site Address County Status
Excelsior Springs FMGP (Excelsior Springs Light & Power)
400 West Excelsior, Excelsior Springs
Clay Negotiations for cleanup ongoing; EPA removal ongoing
Independence FMGP #1 Pacific and Grand Avenue, Independence
Jackson Listed in Registry
Independence FMGP #2 (Missouri Gas Energy)
23rd Street and Pleasant Avenue, Independence
Jackson MDNR Site Evaluation Unit investigation planned; SAU investigation planned
Kansas City FMGP #1 (Kansas City Coal Gas Station A)
East 1st Street and Campbell, Kansas City
Jackson Voluntary Cleanup Program; cleanup ongoing
Kansas City FMGP #2 (Kansas City Coal Gas Station B)
Campbell and East 3rd Street, Kansas City
Jackson Voluntary Cleanup Program; cleanup ongoing
Kansas City FMGP #3 (MGE Natural Gas Storage/Kansas City Gas Light)
20th and Indiana Avenue, Kansas City
Jackson Voluntary Cleanup Program – Complete
Kansas City FMGP #5 (Missouri Gas Company)
Southwest Station (south of 25th Street), Kansas City
Jackson Voluntary deed restriction filed SAU
Parkville FMGP (Parkville Oil Company/Hugh T. Jones)
Not applicable Platte MDNR Site Evaluation Unit; no further action planned
WOOD TREATING FACILITIES
Site Address County Status
A.K. Gibbon Lumber (Gibbon Lumber)
1301 West 13th Street, Kansas City
Jackson MDNR Site Evaluation Unit investigation planned; cleanup pending
Curt Bean Lumber Company, Inc.
1320 E. Old Lexington Road, Buckner
Jackson EPA investigation ongoing
Kerr-McGee Chemical Corporation – Kansas City
2300 Oakland, Kansas City
Jackson Remedial action ongoing
Koppers Company, Inc. Forest Products Division (Beazer East)
6740 Stadium Drive, Kansas City
Jackson Remedial action ongoing
Southeast Wood (Georgia Pacific; International Paper Company)
Walker Road & Highway 58, Pleasant Hill
Cass Voluntary Cleanup Program; cleanup complete
Universal Forest Products (Southwest Company, Inc.)
2600 Precision Drive, Harrisonville
Cass EPA investigation planned

82 Comprehensive Economic Development Strategy PlanMid-America Regional Council • 2014


