Comprehensive Capacity Development Project for the ... · Bangsamoro Transition Commission (BTC)...
131
The Republic of the Philippines Bangsamoro Transition Commission (BTC) Bangsamoro Development Agency (BDA) Japan International Cooperation Agency (JICA) Comprehensive Capacity Development Project for the Bangsamoro Development Plan for the Bangsamoro Final Report Sector Report 2: Infrastructure April 2016 RECS International Inc. Oriental Consultants Global Co., Ltd. CTI Engineering International Co., Ltd. IC Net Limited EI JR 16-056
Transcript of Comprehensive Capacity Development Project for the ... · Bangsamoro Transition Commission (BTC)...

The Republic of the Philippines Bangsamoro Transition Commission (BTC) Bangsamoro Development Agency (BDA)
Japan International Cooperation Agency(JICA)
Comprehensive Capacity Development Project for the Bangsamoro
Development Plan for the Bangsamoro
Final Report
Sector Report 2: Infrastructure
April 2016
RECS International Inc. Oriental Consultants Global Co., Ltd.
CTI Engineering International Co., Ltd. IC Net Limited
EI
JR
16-056

The Republic of the Philippines Bangsamoro Transition Commission (BTC)Bangsamoro Development Agency (BDA)
Japan International Cooperation Agency(JICA)
Comprehensive Capacity Development Project for the Bangsamoro
Development Plan for the Bangsamoro
Final Report
Sector Report 2: Infrastructure
Source of GIS map on the cover: JICA Study Team (base map by U.S. National Park Service).
April 2016
RECS International Inc. Oriental Consultants Global Co., Ltd.
CTI Engineering International Co., Ltd. IC Net Limited

Currency Equivalents (average Interbank rates for May–July 2015) US$1.00=PHP 45.583 US$1.00=JPY 124.020 PHP 1=JPY 2.710 Source: OANDA.COM, http://www.oanda.com

Comprehensive capacity development project for the Bangsamoro Sector Report 2-1: Road Transport
Comprehensive Capacity Development Project for the Bangsamoro
Development Plan for the Bangsamoro
Final Report
Sector Report 2-1: Road Transport

Comprehensive capacity development project for the Bangsamoro Sector Report 2-1: Road Transport

Comprehensive capacity development project for the Bangsamoro Sector Report 2-1: Road Transport
1-i
Table of Contents
Chapter 1 Road Administration ........................................................................................................ 1-1 1.1 Road Administration System ................................................................................................. 1-1 1.2 Functional Road Classifications ............................................................................................ 1-1
Chapter 2 Agencies Involved In Road Development in Bangsamoro ............................................. 1-3 2.1 Function and Organization Structure of DPWH-ARMM ..................................................... 1-3 2.2 Budgetary Framework ........................................................................................................... 1-3 2.3 Priority Investment Programs/Projects (2014–2015) ............................................................ 1-4 2.4 Road Development Programs ............................................................................................... 1-6
2.4.1 Rapid Infrastructure Development Assistance (RIDA) for ARMM ................................ 1-6 2.4.2 Expanded ARMM Roads Mapping and Management System (E-ARMM System) ....... 1-7 2.4.3 Creation of Information and Communication Technology (ICT) Division ..................... 1-7
Chapter 3 Road Network in Bangsamoro ........................................................................................ 1-8 3.1 Road Length and Road Density ............................................................................................ 1-8 3.2 Pavement Rates ................................................................................................................... 1-11 3.3 Road Condition ................................................................................................................... 1-13 3.4 Traffic Volume..................................................................................................................... 1-19 3.5 Freight Transport in Bangsamoro ........................................................................................ 1-20
3.5.1 Polloc Port and other alternative Ports for Bangsamoro ............................................... 1-20 3.5.2 Road conditions leading to alternative ports ................................................................. 1-22 3.5.3 Exit port and freight movement of agroindustry products in Bangsamoro ................... 1-23 3.5.4 Infrastructure and Logistics challenges in Mindanao .................................................... 1-26
3.6 Summary of Road Issues and Logistics Issues .................................................................... 1-26
Chapter 4 Review of Relevant Policies, Plans and Projects for Road Sector ................................ 1-28 4.1 BDA’s Bangsamoro Development Plan: Phase 1 ................................................................ 1-28 4.2 ARMM’s Regional Development Plan: Medium Term Update (2013–2016) .................... 1-29 4.3 Asian Highway (Mindanao section) .................................................................................... 1-32 4.4 Mindanao’s Railway Plan ................................................................................................... 1-33
Chapter 5 Development Strategies for Road Sector ...................................................................... 1-35 5.1 Development Objectives ..................................................................................................... 1-35 5.2 Development Strategies ...................................................................................................... 1-36
5.2.1 Establishment of a road network supporting poverty alleviation .................................. 1-36 5.2.2 Establishment of a road network for agroindustry and tourism development ............... 1-36 5.2.3 Establishment of a road network for balance development of all areas ........................ 1-38 5.2.4 Establishment of logistics corridors .............................................................................. 1-38
Chapter 6 Development Plan for Road Sector ............................................................................... 1-42 6.1 Procedure for Formulation of Road Sector Development Plan ........................................... 1-42 6.2 Proposed Future Road Network .......................................................................................... 1-42
6.2.1 Procedure to develop future road network .................................................................... 1-42 6.2.2 Primary inter-city road network in Mindanao ............................................................... 1-43 6.2.3 Regional primary and secondary roads ......................................................................... 1-44 6.2.4 Proposed road network for Bangsamoro ....................................................................... 1-44
6.3 Project Identification ........................................................................................................... 1-51 6.3.1 Project identification criteria ......................................................................................... 1-51 6.3.2 Identified projects .......................................................................................................... 1-51 6.3.3 Approach to FMRs ........................................................................................................ 1-55
6.4 Standard Design .................................................................................................................. 1-57 6.4.1 Design standard ............................................................................................................. 1-57 6.4.2 Proposed typical cross sections ..................................................................................... 1-57
6.5 Project Cost Estimate .......................................................................................................... 1-57 6.5.1 DWPH funded projects 2015 ........................................................................................ 1-57 6.5.2 Construction cost estimate ............................................................................................. 1-57

Comprehensive capacity development project for the Bangsamoro Sector Report 2-1: Road Transport
1-ii
6.5.3 Engineering cost ............................................................................................................ 1-58 6.5.4 Cost of ROW acquisition and resettlement of affected families ................................... 1-58 6.5.5 Estimated cost of identified projects ............................................................................. 1-63 6.5.6 Project cost summary .................................................................................................... 1-68

Comprehensive capacity development project for the Bangsamoro Sector Report 2-1: Road Transport
1-iii
List of Tables
Table 1.1 Administrative Road Classifications .................................................................................... 1-1 Table 2.1 Past and Present Budget of DPWH-ARMM, 2012-2015 ..................................................... 1-4 Table 2.2 Summary of DPWH-ARMM Priority Investment Programs/Projects, 2014 ....................... 1-5 Table 2.3 Details of DPWH-ARMM Road Projects, 2015 ................................................................... 1-6 Table 3.1 National Road Length and Road Density by Region ............................................................ 1-8 Table 3.2 Pavement Rates of National Roads by Region, 2013 ......................................................... 1-11 Table 3.3 Pavement Surface of ARMM’s Roads ................................................................................ 1-11 Table 3.4 Pavement Types of ARMM’s National Roads by Province ................................................ 1-12 Table 3.5 Pavement Types of ARMM’s Provincial Roads by Province ............................................. 1-13 Table 3.6 Road Condition of Paved National Roads .......................................................................... 1-14 Table 3.7 Road Condition of Paved Provincial Roads ....................................................................... 1-14 Table 3.8 Missing Link Roads and Their Lengths .............................................................................. 1-14 Table 3.9 Traffic Volume in Bangsamoro and Surrounding Areas ..................................................... 1-19 Table 3.10 Distances of Alternative Ports from Cotabato City .......................................................... 1-22 Table 3.11 Summary of Road Conditions Leading to Alternative Ports ............................................ 1-22 Table 4.1 BDP Infrastructure Strategies and Project Types ................................................................ 1-28 Table 4.2 Project Implementation Arrangement ................................................................................. 1-28 Table 4.3 Proposed Projects for Transitional Plan Period .................................................................. 1-29 Table 4.4 Characteristics of AH26’s Sections in Mindanao ............................................................... 1-32 Table 4.5 Classification of Asian Highway ........................................................................................ 1-32 Table 5.1 Key Components of the Three Logistics Corridors ............................................................ 1-39 Table 6.1 Profiles of Tier I Cities ....................................................................................................... 1-43 Table 6.2 General Measures to Road Sector Issues ............................................................................ 1-51 Table 6.3 Summary of Identified Projects and Type of Improvement Works .................................... 1-55 Table 6.4 Estimated Length and Construction Cost of FMRs to Be Improved per Province ............. 1-55 Table 6.5 Minimum Design Standard of Philippine Highways .......................................................... 1-58 Table 6.6 Road Construction Cost ...................................................................................................... 1-63 Table 6.7 Cost Summary of Identified Projects .................................................................................. 1-64 Table 6.8 Cost Estimate for Bangsamoro Regional Artery Road Upgrading Projects ....................... 1-64 Table 6.9 Cost Estimate for Missing Links Development Projects .................................................... 1-65 Table 6.10 Cost Estimate for Bangsamoro Corridor Development Projects ...................................... 1-65 Table 6.11 Cost Estimate for Corridor Link Roads Improvement Projects (1/4): Lanao ................... 1-65 Table 6.12 Cost Estimate for Corridor Links Development Projects (2/4): Maguindanao ................ 1-66 Table 6.13 Cost Estimate for Corridor Links Development Projects (3/4): Basilan .......................... 1-66 Table 6.14 Cost Estimate for Corridor Links Development Projects (4/4): Sulu and Tawi-Tawi ...... 1-67 Table 6.15 Cost Estimate for Ring Road/Bypass Development Projects ........................................... 1-68 Table 6.16 Cost Estimate for Road Projects outside Bangsamoro ..................................................... 1-68 Table 6.17 Road Projects Cost Summary ........................................................................................... 1-68

Comprehensive capacity development project for the Bangsamoro Sector Report 2-1: Road Transport
1-iv
List of Figures
Figure 1.1 Functional Road Classifications .......................................................................................... 1-1 Figure 1.2 Functional Road Classification Map of Mindanao by DPWH ............................................ 1-2 Figure 2.1. DPWH-ARMM Organizational Structure .......................................................................... 1-4 Figure 2.2 Distribution of 2015 Budget by Infrastructure .................................................................... 1-5 Figure 2.3 Distribution of 2015 Budget by Province ........................................................................... 1-5 Figure 2.4 Major Road Infrastructure Projects of DPWH-ARMM for 2015 ....................................... 1-6 Figure 3.1 Present Road Network of Bangsamoro: Mainland Provinces ............................................. 1-9 Figure 3.2 Present Road Network of Bangsamoro: Island Provinces ................................................ 1-10 Figure 3.3 ARMM’s Road Type, Road Length, and Pavement Type ................................................. 1-12 Figure 3.4 Pavement Types of National Roads within ARMM ....................................................... 1-13 Figure 3.5 Pavement Types of Provincial Roads within ARMM .................................................... 1-13 Figure 3.6 Surface Condition of National Road of Bangsamoro (1/2): Mainland Provinces ............. 1-15 Figure 3.6 Surface Condition of National Road of Bangsamoro (2/2): Island Provinces .................. 1-16 Figure 3.7 Surface Condition of Provincial Road of Bangsamoro (1/2): Mainland Provinces .......... 1-17 Figure 3.7 Surface Condition of Provincial Road of Bangsamoro (2/2): Island Provinces ............... 1-18 Figure 3.8 Missing Links in Bangsamoro Network and Surrounding Regions .................................. 1-19 Figure 3.9 Traffic Volume in Bangsamoro and Surrounding Regions ............................................... 1-21 Figure 3.10 Locations of Alternative Ports for Bangsamoro .............................................................. 1-22 Figure 3.11 Number of Lanes of Mindanao’s Arterial Roads ............................................................ 1-24 Figure 3.12 Road Conditions of Mindanao’s Arterial Roads ............................................................. 1-24 Figure 3.13 Exit Ports and Transport Routes of Agroindustry Products in Bangsamoro ................... 1-25 Figure 4.1 Locations of Proposed Transitional Period Projects (1/2): Mainland Provinces .............. 1-30 Figure 4.1 Locations of Proposed Transitional Period Projects (2/2): Island Provinces .................... 1-31 Figure 4.2 Proposed Road Projects in ARMM’s RDP (2013–2016) .................................................. 1-31 Figure 4.3 Asian Highway’s Section in Mindanao ............................................................................. 1-33 Figure 4.4 Mindanao Railway Plan .................................................................................................... 1-34 Figure 5.1 Development Issues, Objectives and Strategies for Road Sector...................................... 1-35 Figure 5.2 Poverty Incidence (2012) and Present Road Network ...................................................... 1-36 Figure 5.3 Locations of Existing Agroindustry, Possible Expansion, and Road Network Condition 1-37 Figure 5.4 Inter-city Road Network of Mindanao as Logistics Corridor ........................................... 1-39 Figure 5.5 Possible Logistics Corridor for Bangsamoro .................................................................... 1-40 Figure 6.1 Procedures for Formulation of Road Sector Development Plan ....................................... 1-42 Figure 6.2 Procedure to Develop Future Road Network of Bangsamoro .......................................... 1-43 Figure 6.3 Primary Inter-city Road Network of Mindanao and Distribution of Towns ..................... 1-44 Figure 6.4 Basic Concept of Regional Primary Roads and Secondary Roads ................................... 1-45 Figure 6.5 Proposed Bangsamoro Road Network: Mainland Provinces ............................................ 1-46 Figure 6.6 Proposed Bangsamoro Road Network: Island Provinces .................................................. 1-47 Figure 6.7 Existing Condition of Proposed Bangsamoro Road Network: Mainland Provinces......... 1-48 Figure 6.8 Existing Condition of Proposed Bangsamoro Road Network: Island Provinces .............. 1-49 Figure 6.9 Proposed Bangsamoro Road Network with Region’s Resources ...................................... 1-50 Figure 6.10 Project Identification Criteria .......................................................................................... 1-51 Figure 6.11 Locations of Identified Projects: Mainland Provinces .................................................... 1-52 Figure 6.12 Locations of Identified Projects: Island Provinces .......................................................... 1-53 Figure 6.13 Locations of Missing Links outside Bangsamoro Region .............................................. 1-54 Figure 6.14 Example of FS of Two Provincial Roads Which Includes FMRs ................................... 1-56 Figure 6.15 FMR Rehabilitation in Sultan Mastura of Maguindanao Using Labor-based
Technology .................................................................................................................... 1-57 Figure 6.16 Proposed Typical Cross Section for New Road Construction ......................................... 1-59 Figure 6.17 Proposed Typical Cross Section for Road Surface Upgrading (Gravel/Earth Road to
PCC Paved Road) .......................................................................................................... 1-60 Figure 6.18 Proposed Typical Cross Section for Rehabilitation of Existing PCC Paved Roads ........ 1-61 Figure 6.19 Proposed Typical Cross Section for Reconstruction of Existing PCC Paved Roads ...... 1-62

Comprehensive capacity development project for the Bangsamoro Sector Report 2-1: Road Transport
1-v
Abbreviations
AAD annual average daily traffic AAGR average annual growth rate AAIIBP Al-Amanah Islamic Investment
Bank of the Philippines A&D alienable and disposable AC advisory circular ACC Area Control Center ACSR aluminum conductor steel
reinforced ADB Asian Development Bank AFB association of farmer beneficiaries AFMA Agriculture and Fisheries
Modernization Act AFP Armed Forces of the Philippines AHFF agriculture, hunting, forestry, and
fishery AJD Agrarian Justice Delivery AMARDI Al Mujahidun Agro Resources and
Development Inc. AO Administrative Order ARB agrarian reform beneficiary ARBO ARB organization ARC agrarian reform community ARCDSP ARC Development Support ProjectARCCESS ARC Connectivity and Economic
Support Services ARG or ARMM-RG
ARMM Regional Government
ARMM Autonomous Region in Muslim Mindanao
ARMM HELPS ARMM Health, Education, Livelihood, Peace and Governance and Synergy (Program)
ARMMIARC ARMM Integrated Agricultural Research Center
ASEAN Association of South East Asian Nations
ASPBI Annual Survey of Philippine Business and Industry
AT Agricultural technician ATI Agricultural Training Institute ATM air traffic movement ATM automated teller machines AWG American wire gauge BASELCO Basilan Electric Cooperative BASULTA or BaSulTa
Basilan, Sulu, and Tawi-Tawi
BBAC Bangsamoro Business Advisory Council
BBL Bangsamoro Basic Law BCT Bangsamoro Core Territory BDA Bangsamoro Development Agency BDH berthing/deberthing hours BDP Bangsamoro Development Plan BFAR Bureau of Fisheries Aquatic
Resources BHC Barangay Health Center BIAF Bangsamoro Islamic Armed Force BIFF Bangsamoro Islamic Freedom
Fighters BIMP-EAGA Brunei-Indonesia-Malaysia-
Philippines East ASEAN Growth Area
BIW Bangsamoro Investment Window BLGU Barangay Local Government Unit
BLMI Bangsamoro Leadership and Management Institute
BLMO Bangsamoro Land Management Office
BOD board of directors BOI Board of Investment BPO business process outsourcing BS Bachelor of Science BSP Central Bank of the Philippines
[Bangko Sentral ng Pilipinas] BSWM Bureau of Soils and Water
Management BTA Bangsamoro Transition Authority BTB boom truck with bucket BTC Bangsamoro Transition CommissionBTD boom truck with digger BuB or BUB bottom-up budgeting CA College of Agriculture CA compulsory acquisition CAAM Conflict Affected Areas of
Mindanao CAAP Civil Aviation Authority of the
Philippines CAB Comprehensive Agreement on
Bangsamoro CADT certificate(s) of ancestral domain
title CAGR compound annual growth rate CALABARZON Cavite, Laguna, Batangas, Rizal,
and Quezon CALT certificate(s) of ancestral land title CARD Center for Agricultural and Rural
Development CARL Comprehensive Agrarian Reform
Law CARP Comprehensive Agrarian Reform
Program CARPER CARP-Extension with Reforms CASELCO Cagayan De Sulu Electric
Cooperative CBCRM community-based costal resource
management CBFM Community-Based Forest
Management (Program) CBFMA community-based forest
management agreement CBO Cotabato (Awang) Airport CCA climate change adaptation CCCH Coordinating Committee for
Cessation of Hostilities CCDP or CCDP-B Comprehensive Capacity
Development Project for the Bangsamoro
CCT conditional cash transfer CDA Cooperative Development AuthorityCD-CAAM Community Development in CAAMCDOCCI Cagayan de Oro Chamber of
Commerce and Industry CDP Comprehensive Development
Program CDP-ELA Comprehensive Development Plan-
Executive Legislative Agenda CDRRMC City Disaster Risk Reduction and
Management Council CDS cooperative development staff

Comprehensive capacity development project for the Bangsamoro Sector Report 2-1: Road Transport
1-vi
CEB Cebu Pacific Air CEC cation-exchange capacity CEPALCO Cagayan Electric Power and Light
Company CIF cost, insurance, and freight CIS communal irrigation system CLOA certificate(s) of landownership
award CLPC Cotabato Light and Power CompanyCLT certificate(s) of land transfer CLUP comprehensive land use plan CMO central management office COSUCECO Cotabato Sugar Central CorporationCP core project CPO Cotabato Project Office CSO civil society organization CSR corporate social responsibility DA Department of Agriculture DA-BAR Department of Agriculture's Bureau
of Agricultural Research DA-RFO DA-Regional Field Office DAF Department of Agriculture and
Fisheries DAO Department Administrative Order DAR Department of Agricultural ReformDBM Department of Budget and
Management DBP Development Bank of the
Philippines DCCCII Davao City Chamber of Commerce
and Industry, Inc. DD detailed design DDP Distribution Development Plan DED detailed engineering design DENR Department of Environment and
Natural Resources DILG Department of Interior and Local
Government DLPC Davao Light and Power Company DME Distance measuring equipment DOF Department of Finance DOJ Department of Justice DOLE Department of Labor and
Employment DOST Department of Science and
Technology DOT Department of Tourism DOTC Department of Transportation and
Communications DPWH Department of Public Works and
Highways DRIMS Dynamic Response Intelligent
Monitoring System DRRM disaster risk reduction and
management DRRMCEP DRRM Capacity Enhancement
Project DSWD Department of Social Works and
Development DTI Department of Trade and Industry DTI-EMB DTI Export Marketing Bureau DUs distribution utilities DVOR Doppler VHF omnidirectional rangeEA environmental assessment EC electric cooperative ECA environmentally critical area ECC environmental clearance certificate
ECP environmentally critical project EEZ exclusive economic zone EIA environmental impact assessment EIAM Environmental Impact Assessment
and Management (Division) EIRR economic internal rate of return EIS environmental impact statement EMB Environmental Management BureauEO Executive Order EPIRA Electric Power Industry
Restructuring Act ERC Energy Regulatory Commission ESWM(P) Ecological Solid Waste
Management (Plan) EU European Union EWS early warning system FAA Federal Aviation Administration FAB Framework Agreement on
Bangsamoro FAD fish aggregating devices FAO Food and Agriculture Organization FDI foreign direct investment FFWS flood forecasting and warning
system FGD focus group discussion FIA federation of irrigators’ associationsFIDA Fiber Industry Development
Authority FIES Family Income and Expenditure
Survey FIT farmers information technology FIT feed-in-tariff FMB Forest Management Bureau FMR farm-to-market road FNRI Food and Nutrition Research
Institute FS feasibility study FTZ free trade zone GAA General Appropriations Act GDE grading and balling establishment GDP gross domestic product GEM Growth with Equity Mindanao
(Program) GIS geographical information system GIZ German Society for International
Cooperation [Deutsche Gesellschaft für Internationale Zusammenarbeit]
GM genetically modified GMP good manufacturing practice GPBP Grassroots Participatory Budgeting
Program GPH Government of the Philippines GPPB grassroots participatory planning
and budgeting GRDP gross regional domestic product GRP gross regional product GSR Green Super Rice HACCP hazard analysis and critical control
points HDI human development index HEART Humanitarian Emergency Action
Response Team HF high frequency HI horizontal inequality HIPC halal industry promotion center HVC high-value crops

Comprehensive capacity development project for the Bangsamoro Sector Report 2-1: Road Transport
1-vii
HVCDP High Value Crops Development Program
IA irrigators’ association IAC inter-agency committee IATA International Air Transport
Association ICAO International Civil Aviation
Organization ICT information and communication
technology ICTSI International Container Terminal
Services, Inc. IDP internally displaced people IEC information and education campaignIEE initial environmental examination
(or evaluation) IFAD International Fund for Agricultural
Development IFMA Integrated Forest Management
Agreement (Program) IFSAR interferometric synthetic aperture
radar ILO International Labour Organization ILPC Iligan Light and Power Company IMEM Interim Mindanao Electric Market IMT international monitoring team IP indigenous people IPA Investment Promotion Agency IPC Investment Promotion Center IPP independent power producer IPRA Indigenous People Rights Act IRA internal revenue allotment IRI International Roughness Index IRSG International Rubber Supply GroupIT information technology IWRM integrated water resources
management J-BIRD Japan-Bangsamoro Initiatives for
Reconstruction and Development JAKIM Department of Islamic Development
Malaysia JETRO Japan External Trade Organization JICA Japan International Cooperation
Agency JNC Joint Normalization Committee JOL Jolo Airport JST JICA Study Team JV joint venture KBA key biodiversity area KOICA Korea International Cooperation
Agency L length LAD land acquisition and distribution LAMP Land Administration and
Management Project LAMPCO Linabu Agrarian Multi-Purpose
Cooperative LASURECO Lanao Del Sur Electric CooperativeLBP Land Bank of the Philippines LCA local conservation area LCL less than full container load or less
container load LDRRMC Local DRRM Council LDRRMF Local DRRM Fund LGU local government unit LGUOUs LGU-owned utilities LiDAR light detection and ranging
LMB Land Management Bureau LMIP Leyte-Mindanao Interconnection
Project LOA length overall LRA Land Registration Authority LTI Land Tenure Improvement Magelco or MAGELCO
Maguindanao Electric Cooperative
MAO Municipal Agriculture Office MASL meter(s) above sea level MC moisture content MDGs Millennium Development Goals MEDP Missionary Electrification
Development Plan MEP Mindanao Energy Plan MF microfinance MFI microfinance institution MGB Mining and Geo-science Bureau MHPP mini-hydro power plant MICC Matling Industrial and Commercial
Corporation MILF Moro Islamic Liberation Front MIS Management Information Service MIMAROPA Mindoro, Marinduque, Romblon,
and Palawan MINDA or MinDA Mindanao Development Authority MLGU municipal local government unit MMAA Muslim Mindanao Autonomy Act MMDA Metropolitan Manila Development
Authority MMHCBI Mindanao Muslim Halal
Certification Board Inc. MNLF Moro National Liberation Front MOA memorandum of agreement MOOE maintenance and other operating
expenses MPA marine protected area MPC multi-purpose cooperative MPDC Municipal Planning and
Development Coordinator MRB Mindanao River Basin MRBIMDMP MRB Integrated Management and
Development Master Plan MRCC Mindanao Regional Control CenterMRDP Mindanao Rural Development
Program MRF material recovery facility MSME micro, small, and medium
enterprises MSU Mindanao State University MSU-IIT MSU-Iligan Institute of TechnologyMSU-LNCAT MSU-Lanao National College of
Arts and Trade MSU-TCTO MSU-Tawi-Tawi College of
Technology and Oceanography NADA Needs Assessment Design AnalysisNAIA Manila Ninoy Aquino International
Airport NAMRIA National Mapping and Resource
Information Agency NAPC National Anti-Poverty CommissionNASA National Aeronautics and Space
Administration NCIP National Commission on Indigenous
Peoples NCMF National Commission on Muslim
Filipinos

Comprehensive capacity development project for the Bangsamoro Sector Report 2-1: Road Transport
1-viii
NCR National Capital Region NDCC National Disaster Coordinating
Council NDRRMC National Disaster Risk Reduction
and Management Council NEA National Electrification
Administration NECP non-environmentally critical projectNEDA National Economic Development
Authority NFA National Food Authority NGA National Grains Authority NGCP National Grid Corporation of the
Philippines NGO non-governmental organization NGP National Greening Program NIA National Irrigation Administration NICCEP National Industrial Cluster Capacity
Enhancement Project NIPAS National Integrated Protected Areas
System NIS national irrigation system NLUC National Land Use Commission NOAH Nationwide Operational Assessment
of Hazards NPC National Power Corporation NPC-SPUG NPC-Small Power Utility Group NREL National Renewable Energy
Laboratory NREP National Renewable Energy
Program NSO National Statistics Office NWFP non-wood forest product NWRC National Water Resources Council OBOR optimum berth occupancy rate OCD Office of Civil Defense OCT original certificate(s) of title ODA official development assistance OECD Organization for Economic
Cooperation and Development OFID OPEC Fund for International
Development OIC Organization of Islamic CooperationOPAg Office of the Provincial
Agriculturist OPAPP Office of the Presidential Advisor
on the Peace Process OPEC Organization of Petroleum
Exporting Countries OPV Office of the Provincial VeterinarianOPV open-pollinated variety ORG Office of the Regional Governor OSCC Office for Southern Cultural
Communities OTOP one town one product PA protected area PAG private armed group PAGASA Philippine Atmospheric,
Geophysical and Astronomical Services Administration
PAL Philippine Airlines PAMANA Philippine Development Program
and Framework for Peace and Development [Payapa at Masaganang Pamayanan]
PAMB Protected Area Management BoardPAO Provincial Agriculture Office
PAPI precision approach path indicator PB Power Barge PCA Philippine Coconut Authority PCAARRD Philippine Council for Agriculture,
Aquatic and Natural Resources Research and Development
PCB power circuit breaker PCC Philippine Carabao Center PCC Portland cement concrete PCCI Philippine Chamber of Commerce
and Industry PCDP Provincial Comprehensive
Development Plan PCIC Philippine Crop Insurance
Corporation PCN pavement classification number PD Presidential Decree PDP Philippine Development Plan PDPFP Provincial Development and
Physical Framework Plan PEIS Philippine Environmental Impact
Statement PENRO Provincial Environment and Natural
Resources Office PERF Production Economic Research
Fund PEZA Philippine Economic Zone
Authority PFDA Philippine Fisheries Development
Authority PhilFIDA Philippine Fiber Development
Authority PHIVOLCS Philippine Institute of Volcanology
and Seismology PICRI Philippine Industrial Crops
Research Institute PIOUs private investor-owned utilities PMO project management office PO people’s organization PP Presidential Proclamation PPA Philippine Ports Authority PPP public private partnership PRA Philippine Retirement Agency PRDP Philippine Rural Development
Program PRTC Philippine Rubber Testing Center PSA Philippine Statistics Authority PSALM Power Sector Assets and LiabilitiesPSC project steering committee PSE Philippine Stock Exchange PTA Parent-Teacher Association PTB passenger terminal building PTF-MRBRD Presidential Task Force on MRB
Rehabilitation and Development RA Republic Act RBCO River Basin Control Office (of
DENR) R&D research and development RAED Regional Agricultural Engineering
Division RBOI Regional Board of Investment RC reinforced concrete RCC regional control center RCM rice crop manager RDC regional development council RDE research, development, and
extension

Comprehensive capacity development project for the Bangsamoro Sector Report 2-1: Road Transport
1-ix
RDRRMO Regional DRRM Office REDPB Regional Economic and
Development Planning Board RE renewable energy REZA Regional Economic Zone AuthorityRGDP regional gross domestic product RHU Rural Health Unit RIS River Irrigation System RNS National Route Numbering SystemRPMA Regional Ports Management
Authority ROPAX or RoPax roll-on/roll-off passenger RORO or RoRo roll-on/roll-off ROW right-of-way RPDO Regional Planning and
Development Office RWY runway SB Small Business SEA strategic environmental assessmentSERD-CAAM Socio-economic Restoration and
Development of Conflict-affected Areas in Mindanao
SEP-CDP Socio-Economic Profile-Comprehensive Development Program
SEZ special economic zone SGCP State of the Grid in China SIASELCO Siai Electric Cooperative SME small and medium-sized enterprise SMS short message system SOCSKSARGEN South Cotabato-Sultan Kudarat-
Saranggani-General Santos City SPUG small power utilities group SRA Sugar Regulatory Administration S/S or SS substation SSIPs small-scale irrigation projects SUCs State Universities and Colleges SULECO Sulu Electric Cooperative SV supervision SWIMP small water impoundments with
multipurpose potential (or small water impounding project)
SWISA small water irrigation system association
TAWELCO Tawi-Tawi Electric Cooperative TCP Technical Cooperation Project TCT transfer of certificate of title TDP transmission development plan TESDA Technical Education and Skills
Development Authority TIKA Turkish Cooperation and
Coordination Agency TISP Transition Investment Support PlanT/L transmission line TMS Technical Management Services TP turboprop TransCo National Transmission CorporationUAS Upi Agricultural School UN United Nations UNCTAD United Nations Conference on
Trade and Development UNEP United Nations Environment
Programme UNHCR United Nations High Commissioner
for Refugees UNICEF United Nations Children's Fund
USAID United States Agency for International Development
USDA United States Department of Agriculture
USM University of Southern Mindanao USMARC USM Agricultural Research CenterVAT value added tax VCA value chain analysis VHF very high frequency VLT voluntary land transfer VOS voluntary offer to sell VPA vehicle parking area VSU Visayas State University VTT Value transformation training WASH Water, Sanitation and Hygiene
(programs by UNICEF) WB World Bank WDIL wind direction indicator light ZAM Zamboanga International Airport ZAMBASULTA Zamboanga, Basilan, Sulu, and
Tawi-Tawi
Comprehensive capacity development project for the Bangsamoro Sector Report 2-1: Road Transport
1-x
Unit of Measurement
Area Weight m2 square meter µg microgram km2 square kilometer mg milligram ha hectare (= 10,000 m2) kg kilogram t ton (=1,000 kg) Energy DWT deadweight tonnage W watt GRT gross register tonnage kW kilowatt GT gross tonnage kWh kilowatt-hour kTOE kilo ton of oil equivalent MW megawatt MT metric ton GWh gigawatt-hour kV kilovolt Volume MVA megavolt-ampere L liter m3 cubic meter (= 1,000 liter) Length mm millimeter Other cm centimeter °C degree Celsius ft foot or feet % percent m meter mil. million LM linear meter MPa megapascal km kilometer mps meter per second Time sec, s second min minute hr hour yr year
Currency
JPY Japanese yen PHP Philippine peso US$ or USD United States dollar

Comprehensive capacity development project for the Bangsamoro Sector Report 2-1: Road Transport
1-1
CHAPTER 1 ROAD ADMINISTRATION
1.1 Road Administration System
Administration of roads in the Philippines is classified into five categories as shown in Table 1.1: National Road, Provincial Road, City Road, Municipal Road, and Barangay Road. National roads are administered by DPWH-National, but those within Bangsamoro are administered by DPWH-ARMM, based on RA 9054 (Organic Act) and other existing laws (e.g., EO No. 426 dated October 12, 1990).
Table 1.1 Administrative Road Classifications
Classification Responsible agency
National Road DPWH-National (except ARMM) DPWH-ARMM (within ARMM)
Provincial Road Provincial government City Road City government Municipal Road Municipal government Barangay Road City/Municipal government
Source: The Study on Infrastructure (Road Network) Development Plan for the ARMM, JICA, 2010.
1.2 Functional Road Classifications
The functional road classification of the Country’s national road was re-classified by DPWH in November 2014 through Department Order No. 119 (D.O. No. 119). Under this new functional classification, national roads are classified into three: Primary Road, Secondary Road and Tertiary Road (Figure 1.1). Likewise, the National Route Numbering System (RNS) was introduced to simplify and rationalized navigation along the network.
Under this new system, national roads categorized as Primary Road and Secondary Road are assigned with route number. No route number is assigned to National Roads classified as Tertiary as these perform local transport functions. The backbone of the entire network is Route Number 1 which originates in Laoag City, Ilocos Norte and terminates in Zamboanga City in Mindanao. Through combination of road and nautical highway, this route effectively links the three major islands of the Country: (Luzon, Visayas and Mindanao). In Mindanao, this road which passes through the Bangsamoro area connects the major urban centers of Surigao, Davao, General Santos, Cotabato, and Zamboanga (Figure 1.2).
Figure 1.1 Functional Road Classifications
National Road
National Primary Road
National Tertiary Road
National Secondary Road

Comprehensive capacity development project for the Bangsamoro Sector Report 2-1: Road Transport
1-2
Source: Road Numbering System, DPWH, 2014 (www.dpwh.gov.ph)
Figure 1.2 Functional Road Classification Map of Mindanao by DPWH
Comprehensive capacity development project for the Bangsamoro Sector Report 2-1: Road Transport
1-3
CHAPTER 2 AGENCIES INVOLVED IN ROAD DEVELOPMENT IN BANGSAMORO
2.1 Function and Organization Structure of DPWH-ARMM
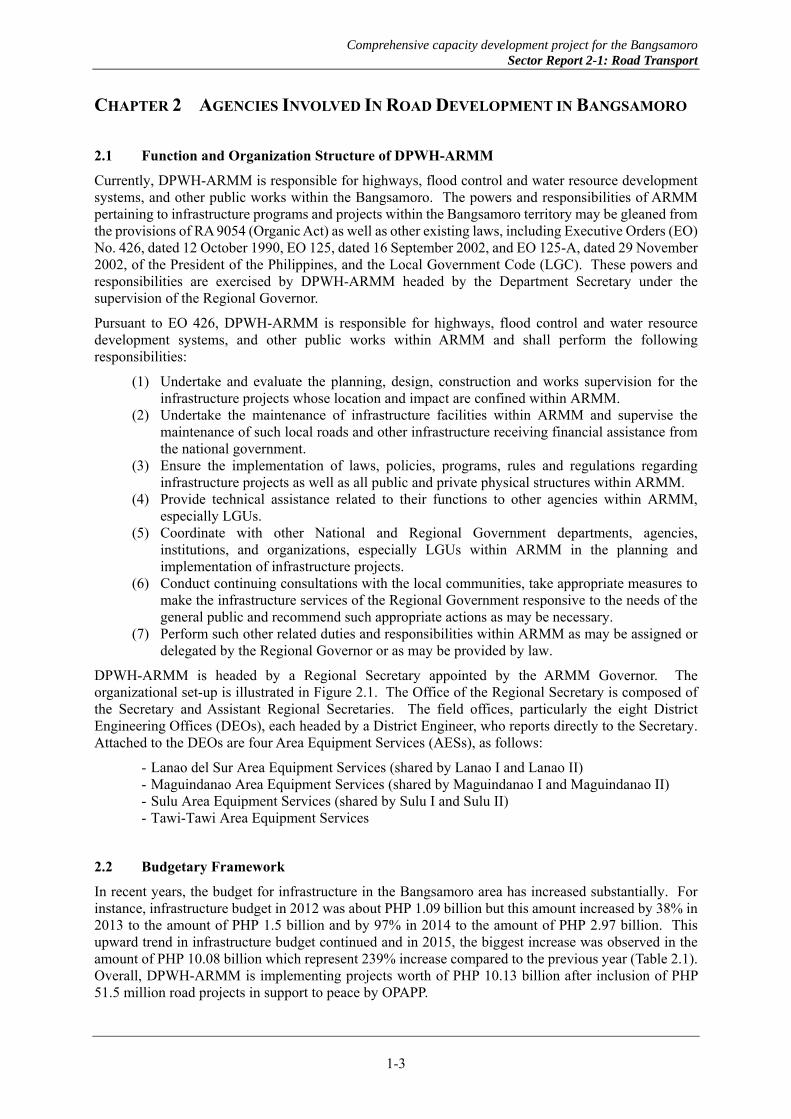
Currently, DPWH-ARMM is responsible for highways, flood control and water resource development systems, and other public works within the Bangsamoro. The powers and responsibilities of ARMM pertaining to infrastructure programs and projects within the Bangsamoro territory may be gleaned from the provisions of RA 9054 (Organic Act) as well as other existing laws, including Executive Orders (EO) No. 426, dated 12 October 1990, EO 125, dated 16 September 2002, and EO 125-A, dated 29 November 2002, of the President of the Philippines, and the Local Government Code (LGC). These powers and responsibilities are exercised by DPWH-ARMM headed by the Department Secretary under the supervision of the Regional Governor.
Pursuant to EO 426, DPWH-ARMM is responsible for highways, flood control and water resource development systems, and other public works within ARMM and shall perform the following responsibilities:
(1) Undertake and evaluate the planning, design, construction and works supervision for the infrastructure projects whose location and impact are confined within ARMM.
(2) Undertake the maintenance of infrastructure facilities within ARMM and supervise the maintenance of such local roads and other infrastructure receiving financial assistance from the national government.
(3) Ensure the implementation of laws, policies, programs, rules and regulations regarding infrastructure projects as well as all public and private physical structures within ARMM.
(4) Provide technical assistance related to their functions to other agencies within ARMM, especially LGUs.
(5) Coordinate with other National and Regional Government departments, agencies, institutions, and organizations, especially LGUs within ARMM in the planning and implementation of infrastructure projects.
(6) Conduct continuing consultations with the local communities, take appropriate measures to make the infrastructure services of the Regional Government responsive to the needs of the general public and recommend such appropriate actions as may be necessary.
(7) Perform such other related duties and responsibilities within ARMM as may be assigned or delegated by the Regional Governor or as may be provided by law.
DPWH-ARMM is headed by a Regional Secretary appointed by the ARMM Governor. The organizational set-up is illustrated in Figure 2.1. The Office of the Regional Secretary is composed of the Secretary and Assistant Regional Secretaries. The field offices, particularly the eight District Engineering Offices (DEOs), each headed by a District Engineer, who reports directly to the Secretary. Attached to the DEOs are four Area Equipment Services (AESs), as follows:
- Lanao del Sur Area Equipment Services (shared by Lanao I and Lanao II) - Maguindanao Area Equipment Services (shared by Maguindanao I and Maguindanao II) - Sulu Area Equipment Services (shared by Sulu I and Sulu II) - Tawi-Tawi Area Equipment Services
2.2 Budgetary Framework
In recent years, the budget for infrastructure in the Bangsamoro area has increased substantially. For instance, infrastructure budget in 2012 was about PHP 1.09 billion but this amount increased by 38% in 2013 to the amount of PHP 1.5 billion and by 97% in 2014 to the amount of PHP 2.97 billion. This upward trend in infrastructure budget continued and in 2015, the biggest increase was observed in the amount of PHP 10.08 billion which represent 239% increase compared to the previous year (Table 2.1). Overall, DPWH-ARMM is implementing projects worth of PHP 10.13 billion after inclusion of PHP 51.5 million road projects in support to peace by OPAPP.

Comprehensive capacity development project for the Bangsamoro Sector Report 2-1: Road Transport
1-4
Source: Sec. Emil Sadain (September 3, 2014).
Figure 2.1. DPWH-ARMM Organizational Structure
Table 2.1 Past and Present Budget of DPWH-ARMM, 2012-2015 (Unit: PHP ‘000)
Component 2012* 2013* 2014* 2015† A. Personal services (PS) 205,159 198,293 194,256 B. Maintenance and other operating expenditures (MOOE) 176,712 275,380 317,289 C. Capital outlays (regular infrastructure) 1,096,630 1,510,181 2,971,000 10,083,000Total DPWH-ARMM budget 1,478,501 1,983,854 3,482,545 10,083,000
PAMANA (Roads to Peace)‡ 2,052,400 51,500‡Total 1,478,501 1,983,854 5,534,945 10,134,500
*Based on the presentation by Sec. Emil Sadain of DPWH-ARMM., September3, 2014; †DPWH-ARMM infrastructure projects (CY 2015), National Expenditure Program; ‡National government program that extends intervention to isolated, hard-to-reach, and conflict-affected communities, ensuring that they are managed by OPAPP and not left behind.
Source: National Expenditure Program FY 2015 by DBM.
2.3 Priority Investment Programs/Projects (2014–2015)
The priority projects of DPWH-ARMM in 2014 are shown in Table 2.2. The bulk of the infrastructure budget is allocated to development of local roads which is about 65.4%. Funds dedicated for
Basilan Engineering District
Lanao Del Sur 2nd Engineering District
Maguindanao 1st Engineering District
Regional Secretary
Service Bureau Operation Bureau
Planning & Programming Division
Survey & Design Division
Administrative Division
Financial & Management Division
Construction Division
Maintenance Division
Materials Quality Control & Hydrology
Equipment Division
Maguindanao 2nd Engineering District
Lanao del Sur 1st Engineering District
Maguindanao Area Equipment
Services
Lanao del Sur Area Equipment
Services
Sulu 1st Engineering District
Sulu 2nd Engineering District
Tawi‐Tawi Engineering District
Sulu Area Equipment Services
Tawi‐Tawi Area Equipment Services
ICT Management Section
Assistant Regional Secretary

Comprehensive capacity development project for the Bangsamoro Sector Report 2-1: Road Transport
1-5
development of port, water supply and drainage/canal combined for 26.7%. Aside from regular infrastructure program of DPWH-ARMM, OPAPP is also implementing numerous local road projects in support of the peace process amounting to about PHP 2.0 billion.
Table 2.2 Summary of DPWH-ARMM Priority Investment Programs/Projects, 2014
ARMM infra budget OPAPP projects (Roads to Peace)
Programs/Projects (2014) Projects
(n) Length (km)
Amount (PHP mil.)
Projects (n)
Length (km)
Amount (PHP mil.)
National roads (repair, rehab, reblocking) 18 14.923 241.299 (8.1%) - - -Local roads 107 179.55 1,944.10 (65.4%) 34 205.24 2,052.40Bridges 13 - 124.42 (4.2%) - - -Ports 17 - 288.52 (9.7%) - - -Water supply 30 - 264.07 (8.9%) - - -Drainage/canal improvements 12 - 59.01 (2.0%) - - -Other structures 9 - 49.581 (1.7%) - - -
Total 206 226.04 2,971.00 (100%) 34 205.24 2,052.40
Source: 2013 DPWH-ARMM Accomplishment Report, Presentation of Sec. Emil Sadain during 11th Expanded Cabinet Meeting, Dec. 21-22, 2013, Waterfront Hotel, Davao City.
For the 2015 budget, of the PHP 10.03 billion fund allocated for infrastructure, PHP 8.10 billion is allocated to road network improvement which represents 80% of the budget as shown in Figure 2.2. Distribution of infrastructure budget, among the five provinces revealed that Basilan Province has the highest share at 31% and followed by Sulu Province with a share of 24%. The share of the rest of provinces is depicted in Figure 2.3.
Figure 2.2 Distribution of 2015 Budget by Infrastructure
Figure 2.3 Distribution of 2015 Budget by Province
The bulk of the budget for road infrastructure (62.7%) is dedicated to road surface upgrading from gravel/earth to concrete pavement of major roads (i.e., national and provincial roads) as presented in Table 2.3. When these projects are completed, a total of 274.76 km of paved road will be added to the network of the region. Improvement work for local roads (i.e., projects in support for recovery of communities affected by man-made and natural calamities, tourism development, etc.) involves surface upgrading from gravel/earth to concrete surface. A total of 230.55 km of local roads is subject to this improvement. Figure 2.4 shows the locations of major road projects by DPWH, and these road projects are summarized in Table 2.3.
Sea Ports System
7%
Road Netw ork80%
Water Supply System
7%
Other Infrastructure
(Shore Protection)
1%
Flood Control5%
Sulu24%
Lanao del Sur14%
Taw i-taw i11%
Basilan31%
Maguindanao20%

Comprehensive capacity development project for the Bangsamoro Sector Report 2-1: Road Transport
1-6
Note: Only major road projects shown.
Source: DPWH-ARMM’s Infrastructure Projects (CY 2015) data.
Figure 2.4 Major Road Infrastructure Projects of DPWH-ARMM for 2015
Table 2.3 Details of DPWH-ARMM Road Projects, 2015
Major road projects Local road projects Bridges Province (n) (km) (PHP mil.) (n) (km) (PHP mil.) (n) (PHP mil.) Basilan 10 64.58 1123.60 36 76.60 966.95 4 80.00 Sulu 42 84.67 1587.93 30 41.99 340.49 1 30.00 Tawi-Tawi 17 21.95 438.99 24 26.70 376.41 19 127.00 Maguindanao 29 64.88 1207.12 18 41.61 445.12 2 97.20 Lanao del Sur 31 38.69 721.16 35 43.64 480.40 7 84.00
Total 129 274.76 5078.80 143 230.55 2609.37 33 418.20
Source: DPWH-ARMM Infrastructure Projects (CY 2015), National Expenditure Program, DPWH-ARMM.
2.4 Road Development Programs
DPWH-ARMM has launched several programs aimed to facilitate rapid improvement of the road network in the Bangsamoro. This includes the following.
2.4.1 Rapid Infrastructure Development Assistance (RIDA) for ARMM
The objectives of Rapid Infrastructure Development Assistance for ARMM are
- Rapid and inclusive growth, - Zero backlog on ARMM infrastructure, and - Quality infrastructures and services.
The targets in improving the roads of ARMM are as follows:
- National road: the target of DPWH-ARMM is 100% fully paved national roads by 2015. Of the total 992.87 km of national road, only 179.67 km are not yet paved.

Comprehensive capacity development project for the Bangsamoro Sector Report 2-1: Road Transport
1-7
- Provincial road: the target in 2015 is that at least 54.32% of the roads will be funded for upgrading. The next target is 100% paved provincial roads by 2016 and beyond. Of 1,343.95 km, only 277.77 km are paved and the remaining 79% are not yet paved.
- Municipal road: the target in 2015 is that 45.82% of the municipal road will be funded for upgrading. The next target is to pave 100% of the road by 2016 and beyond. Currently, of the 2,100 km road length, only 420 km is paved leaving about 1,680 km of road length unpaved.
2.4.2 Expanded ARMM Roads Mapping and Management System (E-ARMM System)
The E-ARMM system is a database system containing all roads information (national, provincial and local) in ARMM, their connectivity and conditions (i.e., pavement type) and other infrastructure facilities within the ARMM.
2.4.3 Creation of Information and Communication Technology (ICT) Division
On the institutional side, the proposal by DPWH-ARMM to create the Information and Communication Technology (ICT) Division was approved by the Department of Budget and Management (DBM) on 25 July 2014. The ICT Division with 19 technical personnel is geared towards upgrading the systems and enhancement of the operations of the existing Management Information Service (MIS) to cover wider supervision of areas in the field of engineering and Management Information Technology.

Comprehensive capacity development project for the Bangsamoro Sector Report 2-1: Road Transport
1-8
CHAPTER 3 ROAD NETWORK IN BANGSAMORO
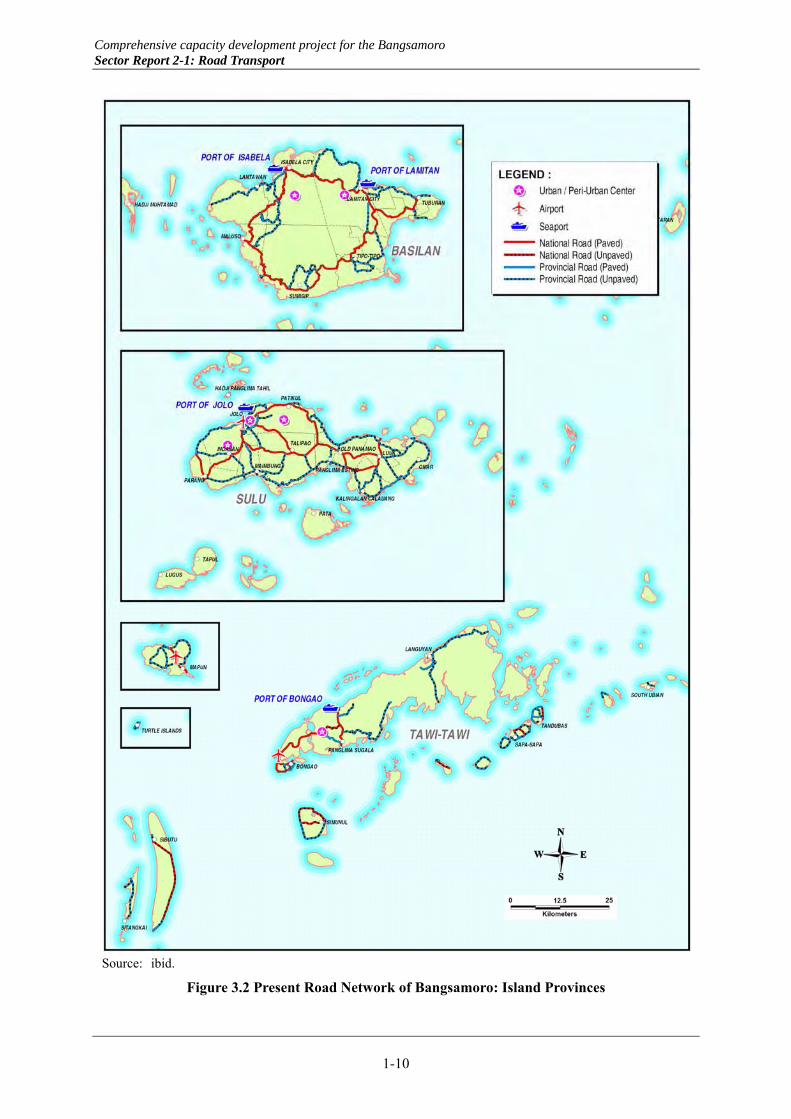
The road network in Bangsamoro is depicted in Figure 3.1 for the mainland provinces and Figure 3.2 for the island provinces. The two figures show the network connectivity of national and provincial roads as well as the condition of pavement (paved or unpaved). Detailed analysis of the region’s roads follows in the succeeding sections.
3.1 Road Length and Road Density
The Bangsamoro area has a total road length of 891 km in 2007 and increased to 993 km in 2013 which represents about 3% of the total national road. It is the only region in the Country where its national road is less than 1,000 km. In terms of road density which was calculated supply of road taking into account land area and population of a region, the Bangsamoro region has the lowest road density (0.10) among the 17 regions and way below the Mindanao average (0.17) and not even half of the National average (0.25). A supply of new 800 km of road is necessary for Bangsamoro to achieve the Mindanao average. Table 3.1 presents the road density of the Country by region.
Table 3.1 National Road Length and Road Density by Region
Road length (km) Road density‡
Region Population(103, 2010)
Land area (km2)
2007 2013Difference
(2013-2007) 2007 2010
Philippines (DPWH-National) 92,338 309,771 29,370 42,621 13,251 0.18 0.25
Luzon*
NCR 11,856 620 1,032 1,141 109 0.39 0.42CAR 1,617 19,422 1,846 2,185 339 0.34 0.39Region I 4,748 13,013 1,610 1,655 45 0.21 0.21Region II 3,229 28,229 1,765 1,890 125 0.19 0.20Region III 10,138 22,015 2,032 2,343 311 0.14 0.16Region IV-A 12,610 16,873 2,404 2,462 58 0.17 0.17Region IV-B 2,745 29,621 2,185 2,285 100 0.25 0.25Region V 5,420 18,156 2,197 2,344 147 0.23 0.24
Visayas Region VI 7,102 20,794 2,880 2,990 110 0.24 0.25Region VII 6,800 15,886 2,036 2,294 258 0.20 0.22Region VIII 4,101 23,251 2,372 2,511 139 0.25 0.26
Mindanao (average)† 21,968 135,402 7,900 9,261 1,361 0.14 0.17
Mindanao
Region IX 3,407 17,047 1,218 1,622 404 0.16 0.21Region X 4,297 20,496 1,682 1,923 241 0.19 0.20Region XI 4,469 20,357 1,447 1,668 221 0.16 0.17Region XII 4,110 22,513 1,304 1,541 237 0.14 0.16Region XIII 2,429 21,478 1,358 1,514 156 0.19 0.21ARMM (DPWH-ARMM) 3,256 33,511 891 993 102 0.08 0.10
*Data on Luzon and Visayas as of November 09, 2013 †Data on Mindanao as of December 03, 2013.
Source: DPWH Atlas, 2013 for road data and Philippine Statistics Authority for population.
‡

Comprehensive capacity development project for the Bangsamoro Sector Report 2-1: Road Transport
1-9
Source: Data from BDP1, DPWH’s e-ARMM, JICA’s 2010 ARMM Infra Masterplan.
Figure 3.1 Present Road Network of Bangsamoro: Mainland Provinces
Comprehensive capacity development project for the Bangsamoro Sector Report 2-1: Road Transport
1-10
Source: ibid.
Figure 3.2 Present Road Network of Bangsamoro: Island Provinces

Comprehensive capacity development project for the Bangsamoro Sector Report 2-1: Road Transport
1-11
3.2 Pavement Rates
The pavement rates of national roads by region are presented in Table 3.2. The paved portion of Bangsamoro’s national roads increased from 76.8% in 2007 to 81.9% in 2013. The increase corresponds to 50.62 km, increasing the paved national road length from 762.3 km in 2007 to 813.0 km in 2013. It should be noted, however, that the pavement rate in Bangsamoro is still below the national average of 83%.
Table 3.2 Pavement Rates of National Roads by Region, 2013
Region Total (km) Paved (km) Unpaved (km)Pavement rate (%) 2007 2013
Philippines (DPWH-National) 33,219.5 27,585.9 5,633.6 71.5 83.0
Luzon
NCR 1,140.9 1,140.9 - 100.0 100.0 CAR 2,184.8 1,304.5 880.3 35.7 59.7 RegionI 1,655.5 1,595.0 60.4 90.0 96.4 RegionII 1,889.5 1,578.9 310.7 69.5 83.6 RegionIII 2,343.3 2,207.8 135.5 87.2 94.2 RegionIV-A 2,462.0 2,276.4 185.5 85.8 92.5 RegionIV-B 2,285.1 1,590.6 694.5 46.1 69.6 RegionV 2,344.1 2,047.4 296.7 72.2 87.3
Visayas RegionVI 2,989.9 2,736.0 253.9 75.6 91.5 RegionVII 2,293.6 2,095.3 198.4 85.7 91.4 RegionVIII 2,510.6 2,291.9 218.7 81.3 91.3
Mindanao
RegionIX 1,567.5 1,088.0 479.6 68.6 69.4 RegionX 1,898.3 1,416.2 482.1 69.6 74.6 RegionXI 1,662.4 1,185.9 476.5 62.9 71.3 RegionXII 1,521.3 1,093.2 428.1 62.4 71.9 RegionXIII 1,478.4 1,125.1 353.3 46.3 76.1 ARMM (DPWH-ARMM) 992.6 813.0 179.6 76.8 81.9
Source: DPWH Atlas, 2013 except data from ARMM which was obtained from DPWH-ARMM.
A closer look at the ARMM’s roads as shown in Figure 3.3 reveals the following (as indicated in Table 3.3):
- National roads: Most roads surfaced with concrete (81%) and only 18% surfaced with gravel and earth, accounting for about 180 km.
- Provincial roads: Only 21% with concrete and asphalt surface and the remaining 79% with gravel and earth surface, which corresponds to 1,680 km.
- Municipal roads: Only 20% with concrete or asphalt surface and the rest about 1,680 km with gravel or earth surface.
- Barangay roads and farm-to-market roads (FMRs): Only 0.2% surfaced with concrete or asphalt surface and the remaining 4,814 km with gravel or earth surface.
Table 3.3 Pavement Surface of ARMM’s Roads
Level Concrete Asphalt Gravel & earth Total (km)
National Road (km) 802.62 10.35 179.62 992.59 81% 1% 18% 100%
Provincial Road (km) 277.52 0.25 1,065.18 1,342.95 21% 0% 79% 100%
Municipal Road (km) 420 - 1,680.00 2,100.00 20% - 80% 100%
*Barangay Road (km) 9.51 - 4814.72 4,824.23 0.2% 99.8% 100.0%
Total 1,509.65 10.60 7,739.52 9,259.77 16.3% 0.1% 83.6% 100%
Source: DPWH-ARMM, 2014 except with * where data was taken from ARMM Regional Development Plan Medium Term Update, 2013.

Comprehensive capacity development project for the Bangsamoro Sector Report 2-1: Road Transport
1-12
Source: DPWH-ARMM, 2014 except with barangay data which was culled from ARMM Regional Development Plan Medium Term Update, 2013.
Figure 3.3 ARMM’s Road Type, Road Length, and Pavement Type
By disaggregating further the data by provincial level, the following characterized the road network of Bangsamoro (Table 3.4 and 3.5 and Figure 3.4 and 3.5):
- Lanao del Sur has the longest national road length with a total of 306.53 km. Of the length, only 14% has either earth or gravel surface. Provincial roads in Lanao del Sur has a length of 396.34 km, of which 42% is unpaved.
- Maguindanao has the second longest national road length of 282.26 km. Of this only 6% is unpaved. Provincial roads in Maguindanao are mostly unpaved (90% of the total 427.55 km).
- Basilan has the third longest national road length with a total of 153.87 km, of which only 18% is yet to be paved. Basilan’s provincial roads are similar to Maguindanao’s with 89% of the total 172.65 km still surfaced with gravel or earth.
- Sulu has a total of 135.12 km of national roads, of which 20% is still surfaced with gravel or earth. Provincial roads in Sulu are mostly surfaced with earth or gravel, accounting for almost 200 km. Paved provincial roads have a length of about 16 km.
- Tawi-Tawi has a total of 115.10 km of national roads, of which 46% is paved and the rest is still surfaced with gravel or earth. This province has the longest national road length with gravel or earth surface.
Table 3.4 Pavement Types of ARMM’s National Roads by Province
No. Province Roads Bridges Total road &
bridge length (km)
Paved (km)
Unpaved (km)
Total (km)
No. Length (km)
1 Basilan 125.87 28 153.87 35 1.02 154.89
82% 18% 100%
2 Sulu 107.5 27.62 135.12 29 0.24 135.36 80% 20% 100%
3 Tawi-Tawi 52.64 62.46 115.1 10 0.4 115.5 46% 54% 100%
4 Maguindanao 264.6 17.66 282.26 58 2.62 284.88 94% 6% 100%
5 Lanao del Sur 262.59 43.92 306.52 78 2.44 308.96
86% 14% 100%
Total 813.2 179.66 992.87 210 6.72 999.59 82% 18% 100%
Source: DPWH-ARMM, 2014.
813.0277.8 420.0
9.5
179.6 1,065.2
1,680.0
4,814.7
-
1,000.0
2,000.0
3,000.0
4,000.0
5,000.0
NationalRoad
ProvincialRoad
MunicipalRoad
BarangayRoad
Le
ng
th (
Km
) Gravel/Earth
Concrete/Asphalt
81.9%
20.7% 20.0%
0.2%
18.1%
79.3% 80.0%
99.8%
0.0%
25.0%
50.0%
75.0%
100.0%
NationalRoad
ProvincialRoad
MunicipalRoad
BarangayRoad
Gravel/Earth
Concrete/Asphalt

Comprehensive capacity development project for the Bangsamoro Sector Report 2-1: Road Transport
1-13
Table 3.5 Pavement Types of ARMM’s Provincial Roads by Province
No. Province Roads
Paved (km) Unpaved (km) Total (km) Proposed new (km)
1 Basilan 18.35 154.3 172.65 58.9 11% 89% 100%
2 Sulu 16.1 200.3 216.4 - 7% 93% 100%
3 Tawi-Tawi 19.5 110.51 130.01 82.8 15% 85% 100%
4 Maguindanao 44.12 383.43 427.55 108.8 10% 90% 100%
5 Lanao del Sur 230.94 165.4 396.34 - 58% 42% 100%
Total 329.01 1,013.94 1,342.95 250.5 24% 76% 100%
Source: ibid.
Figure 3.4 Pavement Types of National Roads within ARMM
Figure 3.5 Pavement Types of Provincial Roads within ARMM
3.3 Road Condition
A road surface condition survey was undertaken by the JICA Study Team from February to October 2015 using the Dynamic Response Intelligent Monitoring System (DRIMS) to measure the International Roughness Index (IRI) of roads in the region. DRIMS was developed by the Bridge and Structures Laboratory at the University of Tokyo and this was the first time the equipment was utilized in the Philippines. The equipment gives estimated IRI of the road as a result of measuring and calculating acceleration according to vehicle motion.
Based on this survey, the length of the national road in bad condition thus required immediate intervention is about 180 km which represents 20.7% of the total length of the national road (Table 3.6). Those in poor condition accounts for 281.45 km. Roads in good and fair condition represent 47.2% of the entire network which correspond to 412.60 km. Maps showing the IRI values of the national road network are shown in Figure 3.6 (1/2) and Figure 3.6 (2/2).
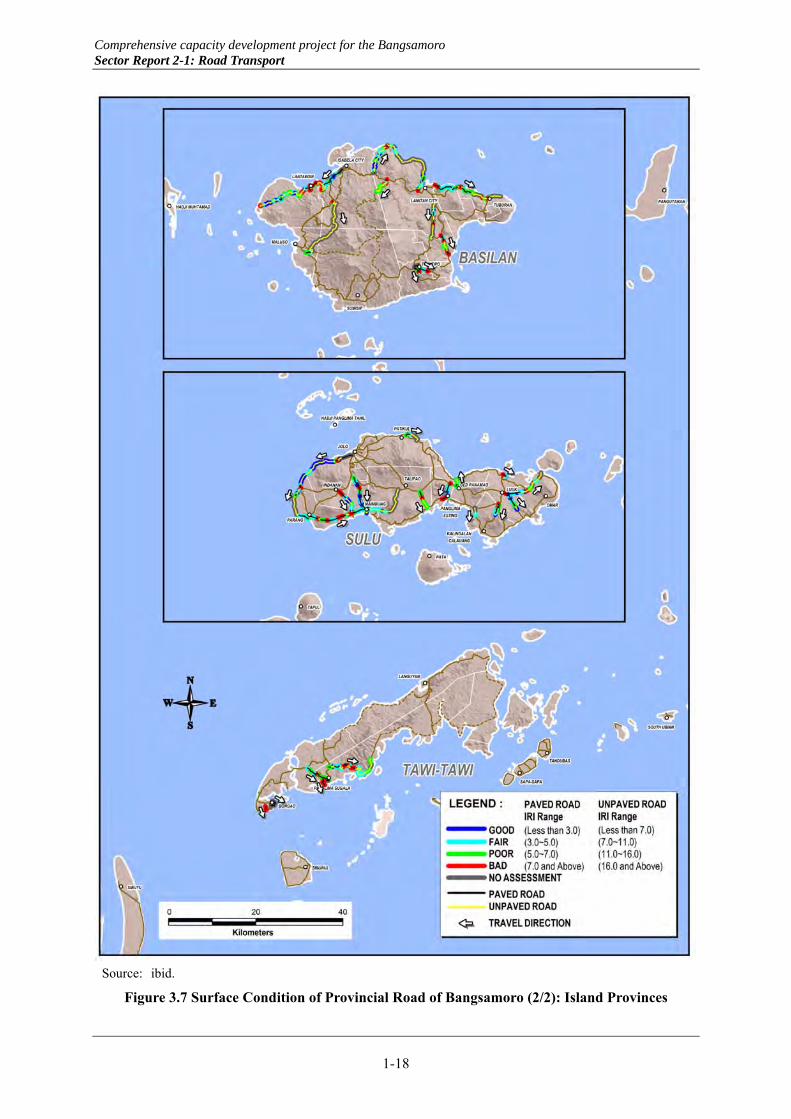
As indicated in Table 3.7, paved provincial roads in good and fair condition in the region are limited to 84.60 km, representing about 23.2% of the total length of paved provincial roads. Lack of maintenance of these roads led to the poor condition of large section of the provincial road as indicated in the table below where more than 50% of the network is in bad condition. This is significantly high compared to road in bad condition along the national road which is just 20% of the network. Maps showing the IRI value of the provincial road network are available in Figure 3.7 (1/2) and Figure 3.7 (2/2).
125.87107.5
52.64
264.6 262.592827.62
62.46
17.6643.92
0
50
100
150
200
250
300
350
Basilan Sulu Tawi-Tawi Maguindanao Lanao del Sur
Province
Km
Unpaved (km)
Paved (km)
18.4 16.1 19.544.1
230.9154.3
200.3
110.5
383.4
165.4
0.0
50.0
100.0
150.0
200.0
250.0
300.0
350.0
400.0
450.0
Basilan Sulu Tawi-Tawi Maguindanao Lanao del Sur
Province
Km
Unpaved (km)
Paved (km)

Comprehensive capacity development project for the Bangsamoro Sector Report 2-1: Road Transport
1-14
Table 3.6 Road Condition of Paved National Roads
Condition Good Fair Poor Bad
Total IRI range 3˂IRI 3˂IRI˂5 5˂IRI˂7 7>IRI
Mainland
Maguindanao (km) 5.35 73.75 104.20 106.99 290.29 Lanao del Sur (km) 41.15 131.35 76.85 32.50 281.85
Subtotal (km) 46.5 205.1 181.05 139.49 572.14(%) 8.1 35.8 31.6 24.4 100.0
Island
Basilan 14.90 73.95 41.50 16.10 146.45 Sulu 3.15 57.55 44.55 13.45 118.70 Tawi-Tawi 0.55 10.90 14.35 11.60 37.40
Subtotal (km) 18.60 142.40 100.40 41.15 302.55 (%) 6.1 47.1 33.2 13.6 100.0
Total 65.10 347.50 281.45 180.64 874.69 (%) 7.4 39.7 32.2 20.7 100.0
Note: IRI = International Roughness Index
Source: JICA Study Team.
Table 3.7 Road Condition of Paved Provincial Roads
Condition Good Fair Poor Bad
Total IRI range 3˂IRI 3˂IRI˂5 5˂IRI˂7 7>IRI
Mainland
Maguindanao (km) 0.70 38.70 44.00 25.80 109.20 Lanao del Sur (km) - 6.40 24.30 120.20 150.90
Subtotal (km) 0.70 45.10 68.30 146.00 260.10 (%) 0.3 17.3 26.3 56.1 100.0
Island
Basilan 1.00 9.20 10.60 15.30 36.10 Sulu 4.20 21.90 11.50 11.90 49.50 Tawi-Tawi - 2.50 5.40 11.20 19.10
Subtotal (km) 5.20 33.60 27.50 38.40 104.70 (%) 5.0 32.1 26.3 36.7 100.0
Total 5.90 78.70 95.80 184.40 364.80 (%) 1.6 21.6 26.3 50.5 100.0
Source: ibid.
The Infrastructure (Road Network) Development Plan for the ARMM, supported by JICA, identified five missing links and six new roads as critical sections to complete the primary and secondary road network of Bangsamoro (Table 3.8). The lack of these roads affect accessibility to large area of the region and people are forced to take a long detour. Hence, there are many areas with accessibility problems in Bangsamoro. As indicated in Figure 3.8, the presence of missing links in the Bangsamoro region is notable compared to the neighboring regions.
Table 3.8 Missing Link Roads and Their Lengths
Road name Length (km) Road class Missing Links 155.4 1. Molundo–Wao Road 30.4 Regional Primary Road 2. SK Border–Butig–Lumbayanague Road 25.0 Regional Primary Road 3. Malabang–Marogong–Tubaran–Bayang Road 25.0 Regional Secondary Road 4. Tapian–Lebak Road 50.0 Regional Secondary Road 5. Maganoy–Lebak Road 25.0 Regional Primary Road New Road (Mainland) 110.7 1. Parang–Balabagan Road 30.0 Regional Secondary Road 2. Matanog–Alamada Road (Matanog–Buldon section) 20.0 Regional Primary Road 3. Matanog–Alamada Road (Buldon–Alamada section) 15.0 Regional Primary Road 4. Manuangan–Parang Road 20.0 Regional Secondary Road 5. Midsayap–Datu Piang Road 20.0 Regional Primary Road 6. Molundo–Wao (part of Molundo–Wao missing link) 5.7 Regional Primary Road
Source: The Study on Infrastructure (Road Network) Development Plan for the ARMM, JICA, 2010.

Comprehensive capacity development project for the Bangsamoro Sector Report 2-1: Road Transport
1-15
Source: JICA Study Team DRIMS Survey February–October 2015.
Figure 3.6 Surface Condition of National Road of Bangsamoro (1/2): Mainland Provinces

Comprehensive capacity development project for the Bangsamoro Sector Report 2-1: Road Transport
1-16
Source: ibid.
Figure 3.6 Surface Condition of National Road of Bangsamoro (2/2): Island Provinces

Comprehensive capacity development project for the Bangsamoro Sector Report 2-1: Road Transport
1-17
Source: ibid.
Figure 3.7 Surface Condition of Provincial Road of Bangsamoro (1/2): Mainland Provinces
Comprehensive capacity development project for the Bangsamoro Sector Report 2-1: Road Transport
1-18
Source: ibid.
Figure 3.7 Surface Condition of Provincial Road of Bangsamoro (2/2): Island Provinces

Comprehensive capacity development project for the Bangsamoro Sector Report 2-1: Road Transport
1-19
Source: ibid.
Figure 3.8 Missing Links in Bangsamoro Network and Surrounding Regions
3.4 Traffic Volume
The traffic volume on the major roads of Bangsamoro is presented in Table 3.9 and depicted in Figure 3.9. Data were taken from the regular traffic count survey of DPWH-National. Since DPWH National is not undertaking traffic survey inside the Bangsamoro region, the 2008 survey data by the JICA study were used as base data to estimate current traffic in Bangsamoro. Annual growth rate of DPWH data (2008–2014) was used as guide to estimate growth rate inside the study area. Based on these traffic data, the following were observed:
Cotabato–Marawi corridor’s traffic volume is about 1,500 vehicles per day, Cotabato–Davao corridor is about 3,200 and Cotabato–Gen. Santos is about 2,200.
If traffic growth is taken as an indicator to recent progress in the area, arterial roads of major cities of Bangsamoro (Cotabato City and Marawi city) have a lower growth (between 1% and 4% annually) than arterial roads of Davao City and Gen. Santos which have an annual traffic growth of 5% to 16% annually.
Table 3.9 Traffic Volume in Bangsamoro and Surrounding Areas (Unit: No. of vehicles)
Road name 2008 AADT (DPWH) 2014 AADT (DPWH)
Car Jeep Bus Truck Total Car Jeep Bus Truck Total
Mai
nlan
d M
inda
nao
Digos–Makar Rd. 1,118 1,050 356 2,857 5,381 4,813 1,429 637 595 7,474 Cotabato–Marbel Rd. 972 189 95 243 1,499 1,161 1,846 350 390 3,747 Sarangani–SK Coastal Rd. 327 295 193 39 854 191 625 108 33 957 Cotabato–Marbel Rd. 1,957 2,241 11 304 4,513 384 448 75 143 1,050 Midsayap–Marbel Rd. 1,693 561 124 642 3,020 3,345 536 195 715 4,790 Butuan City–CDO-Iligan Rd. 4,037 2,455 308 748 7,548 1,112 1,544 566 1,025 4,247 Sayre Highway 1,118 1,050 356 2,857 5,039 1,235 968 415 485 3,104 Kibawe–Kadingilan Rd. 554 57 46 92 749 135 80 - 188 403 Sayre Highway 2,557 600 542 1,110 4,809 1,746 2,055 679 707 5,187 Davao–Cotabato Rd. (Jct. Digos) 1,592 494 178 1,138 3,402 1,175 1,677 313 321 3,486 Cotabato City Circ. Rd. 3,320 2,590 743 1,119 7,772 2,390 1,380 246 358 4,373 Davao–Cotabato Rd. (Sultan 1,736 358 272 656 3,022 1,279 1,304 187 438 3,208

Comprehensive capacity development project for the Bangsamoro Sector Report 2-1: Road Transport
1-20
Road name 2008 AADT (DPWH) 2014 AADT (DPWH)
Car Jeep Bus Truck Total Car Jeep Bus Truck Total Kudarat–Pigcawayan) Ozamis City-Oroquieta City Rd. 2,243 275 226 631 3,375 1,460 1,138 255 220 3,073 Linamon-Zamboanga Rd. 1,202 436 859 635 3,132 966 1,429 634 489 3,518 Misamis O.–Ma Cristina Rd. 5,054 3,872 5 517 9,448 6,195 4,712 1,183 831 12,921 Pagadian–Zamboanga City Rd. 2,851 379 482 1,187 4,899 1,785 1,625 641 626 4,678 Iligan City–Marawi City Rd. 3,134 598 13 248 4,157 3,414 367 - 268 4,049 Maramag–Maradugao Rd. 621 114 58 243 1,036 642 683 222 220 1,767
JICA’s ARMM Infrastructure Masterplan data Estimated by JICA Study Team Marawi–Saguiaran Rd. 3,163 734 - 259 4,156 4,112 954 - 337 5,403 Balindong–Marantao Rd. 1,728 944 - 109 2,781 2,246 1,227 - 142 3,615 Maguing–Molundo Rd. 381 579 - 113 1,073 495 753 - 147 1,395 Calanogas–Pagayawan Rd. 97 260 - 15 372 126 338 - 20 484 Tukuran–Karumatan Rd. 226 167 - 73 466 294 217 - 95 606 Labangan–Tukuran Rd. 378 208 5 110 701 491 270 7 143 911 Cotabato–Parang Rd. 783 432 1 153 1,369 1,018 562 1 199 1,780 Cotabato–Polloc Rd. 191 63 - 143 397 248 82 - 186 516 Cotabato–Kusiong Rd. 31 111 - 61 203 40 144 - 79 264 Cotabato–Upi Rd. 113 35 - 164 312 147 46 - 213 406 Upi–Lebak Rd. 61 2 - 40 103 79 3 - 52 134 Cotabato–DOS Rd. 891 609 38 155 1,693 1,158 792 49 202 2,201 Midsayap–Datu Piang Rd. 144 129 - 108 381 187 168 - 140 495 Ampatuan–Esperanza Rd. 611 334 29 136 1,110 794 434 38 177 1,443 Tacurong–Lambayong Rd. 488 149 - 172 809 634 194 - 224 1,052 Kabacan–Pagalungan Rd. 1,410 379 122 323 2,234 1,833 493 159 420 2,904 Carmen–Kabacan Rd. 689 480 35 282 1,486 896 624 46 367 1,932 Kitaotao–Dangcagan Rd. 897 233 129 420 1,679 1,166 303 168 546 2,183 Maramag–Quezon Rd. 997 81 70 469 1,617 1,296 105 91 610 2,102 Magpet–Kidapawan Rd. 715 104 216 29 1,064 930 135 281 38 1,383 Tacurong–Pres. Quirino Rd. 1,321 536 66 450 2,373 1,717 697 86 585 3,085 Gen. Santos–Polomolok Rd. 2,629 1,232 201 656 4,718 3,418 1,602 261 853 6,133 Bansalan–Makilala Rd. 2,386 1,034 140 915 4,475 3,102 1,344 182 1,190 5,818 Gen. Santos–Malungon Rd. 2,759 683 243 343 4,028 3,587 888 316 446 5,236 Balabagan–Malabang Rd.* 676 259 1 92 1067 879 485 1 172 1,536
Isla
nd P
rovi
nces
Isabela–Lamitan Rd. 1,208 345 309 677 2,539 1,570 449 402 880 3,301 Isabela–Maluso Rd. 923 317 117 522 1,879 1,200 412 152 679 2,443 Pasiagan–Patikul Rd. 546 414 - 592 1,552 710 538 - 770 2,018 Jolo–Indanan–Parang Rd. 114 455 - 391 960 148 592 - 508 1,248 Jolo–Talipao Rd. 80 689 - 127 896 104 896 - 165 1,165 Nalil-Bongao Rd. 84 103 - 41 228 109 134 - 53 296 Sanga Sanga–Bongao Rd. 110 93 - 52 255 143 121 - 68 332
*2003 JICA data ARMM Infrastructure (Road Network) Development Plan, 2010.
Source: DPWH National Road Traffic Survey Program 2014; JICA’s ARMM Infrastructure (Road Network) Development Plan, 2010.
3.5 Freight Transport in Bangsamoro
3.5.1 Polloc Port and other alternative Ports for Bangsamoro
The Polloc Port’s operations have considerable influence on how the freight transport in Bangsamoro is moved. Over the years, the level of port operation has shrunk. This has resulted in shippers in Bangsamoro changing to other ports in Mindanao, particularly the Sasa Port of Davao, ports of Cagayan de Oro (Cagayan de Oro port and Mindanao International Container Terminal), and the Makar Wharf of General Santos (Figure 3.10). This was confirmed by a 2009 survey on major agro-industries in the Bangsamoro (e.g., Lamsan, La Frutera, and Matling) as part of the Study on Infrastructure (Road Network) Development Plan for the ARMM by JICA. The survey results revealed that most of these firms used multiple ports outside Bangsamoro to ship their products. Of all the ports in Mindanao, the ports of Davao, Cagayan, and General Santos were preferred alternatives.
Unless operation of the Polloc Port is significantly improved, shippers in Bangsamoro will be forced to take the route of bringing their cargoes to any of the ports above. In terms of distance, the Makar Wharf of General Santos City and the Iligan Port are the closest (Table 3.10). However, the former has the advantage of passing through more peaceful areas which could explain the preference for the Makar Wharf.

Comprehensive capacity development project for the Bangsamoro Sector Report 2-1: Road Transport
1-21
Figure 3.9 Traffic Volume in Bangsamoro and Surrounding Regions

Comprehensive capacity development project for the Bangsamoro Sector Report 2-1: Road Transport
1-22
Source: Prepared by the JICA Study Team based on the MINDA’s Economic Corridor.
Figure 3.10 Locations of Alternative Ports for Bangsamoro
Table 3.10 Distances of Alternative Ports from Cotabato City
Port Distance* from Cotabato i. Macabalan Port and Mindanao Container Terminal, Cagayan de Oro City
250 km (via Narciso Ramos Highway) 320 km (via Kabacan-Kibawe Road)
ii. Iligan Port, Iligan City 185 km (via Narciso Ramos Highway) iii. Ozamis Port, Ozamis City 220 km (via Narciso Ramos Highway) iv. Sasa Port, Davao City 220 km (via Cotabato–Davao road) v. Makar Wharf, General Santos City 185 km (Tacurong–Koronadal Road) *Estimated based on Google map.
3.5.2 Road conditions leading to alternative ports
The arterial roads linking Bangsamoro to alternative ports are presented in Figure 3.11. Most of the roads are two-lane highway with some4-lane sections. The surface conditions of these roads are illustrated in Figure 3.12. Table 3.11 presents assessments of the following roads:
Table 3.11 Summary of Road Conditions Leading to Alternative Ports
Road link Assessment
Cotabato–Davao Road (to Sasa Port; L=220 km)
- Two-lane highway with some sections having 4-lane particularly between Digos City and Davao City.
- Traffic congestion is observed at the road sections passing the town centers such as in Libungan, Midsayap, Pikit, Kidapawan due to mixing of local traffic and through traffic and also inside Davao city before Sasa Port.
- Road condition is particularly poor in the municipalities of Pikit, Pagagawan and Pagalungan.
Cotabato–Gen. Santos Road (to Makar
- Two-lane highway with some sections having 4-lane. However, the section from Isulan to Gen. Santos is a 4-lane highway with the exception of some short sections.
Comprehensive capacity development project for the Bangsamoro Sector Report 2-1: Road Transport
1-23
Road link Assessment Wharf; L=185 km) - Flow of traffic is generally good with the exception of road section passing inside
Tacurong and Koronadal due to mixing of local traffic and through traffic. - Road condition is generally good with the exception of Isulan-Sto. Nino-Suralla
section and Koronadal-Tupi section.
Cotabato–Cagayan de Oro via Narciso Ramos Highway (to Cagayan de Oro Port and Mindanao Container Terminal; L=250 km)
- Two-lane highway until Iligan City. Four-lane highway is just observed inside Cagayan de Oro City.
- Traffic flow is generally good except the section passing Marawi City, Iligan City and Cagayan de Oro City.
- Road condition is generally poor from Parang to Marawi where large pot holes and serious pavement cracks are observed.
- Road alignment is also poor resulting in sharp curves that are not suitable to large trucks.
- This highway has a security concern as well
Cotabato–Cagayan de Oro via Kibawe Road (to Cagayan de Oro Port and Mindanao Container Terminal; L=320 km)
- Most sections are two-lane highway with some sections having 4-lane - Traffic flow is generally good with the exceptions to the section passing major
towns such as Libungan, Pikit, Maramag, Valencia City, etc. - Freight destined to Cagayan de Oro Port (Macabalan Wharf) passes the city center,
thus traffic congestion is experienced - Road condition is better than the shorter Narciso Ramos Highway route - This route is also passing a more peaceful areas
3.5.3 Exit port and freight movement of agroindustry products in Bangsamoro
The exit port of products produced by agroindustry firms operating in the Bangsamoro region was clarified through interviews carried out by agroindustry experts of the JST with these firms. In some cases interview with people knowledgeable of the subject as well as review of relevant studies were carried out. Based on the above, the freight flow was clarified as shown in Figure 3.13. The following were observed:
Most of the agri-industries in Bangsamoro are using ports of Davao and Panabo to ship out their products. Ports of Cagayan de Oro and General Santos are preferred by some.
As far as agroindustry in Bangsamoro is concerned, users of Polloc Port seem to be limited to a very few firms such as Lamsan Trading, Philippine Trade Inc. and perhaps other small-scale firms.
Routes used to transport products by these agri-industries are as follows (Figure 3.12): ‐ Wao and Bumbaran area to Davao (Wao-Kibawe-Carmen-Kidapawan-Digos-Davao), ‐ Malabang area to Davao (Malabang-Parang-Simuay-Kidapawan-Digos-Davao), ‐ Malabang area to General Santos (Malabang-Parang-Cotabato-Isulan-Tacurong-Gen.
Santos), ‐ Datu Paglas and Buluan area to Davao (Buluan-Datu Paglas-Makilala-Digos-Davao), and ‐ Talayan and Datu Abdullah Sangki area to Davao (Isulan-Tacurong-Datu Paglas-Makilala-
Digos-Davao).
The final destinations of agroindustry products from Mindanao including those coming from the Bangsamoro were also identified through review of the Mindanao Logistics Infrastructure Network Study by the JICA undertaken in 2014:
Banana Cavendish: Japan (50%) and the rest to China, South Korea, the Middle East (particularly Iran) and other smaller markets,
Coconut products/oil: USA (24%), Europe (25%) and the rest distributed to other countries, Pineapples: major markets and their approximate shares are Japan (55%), Korea (16%), New
Zealand (4%), Middle East (9%), among others, Mango-Carabao: China, Japan, and others, and Palm Oil: Cebu and Manila for further refinement.

Comprehensive capacity development project for the Bangsamoro Sector Report 2-1: Road Transport
1-24
Source: DPWH data (2014) and NSCB data.
Figure 3.11 Number of Lanes of Mindanao’s Arterial Roads
Source: DPWH Road Condition Data and NSCB data.
Figure 3.12 Road Conditions of Mindanao’s Arterial Roads

Comprehensive capacity development project for the Bangsamoro Sector Report 2-1: Road Transport
1-25
Source: Interview survey and secondary data.
Figure 3.13 Exit Ports and Transport Routes of Agroindustry Products in Bangsamoro
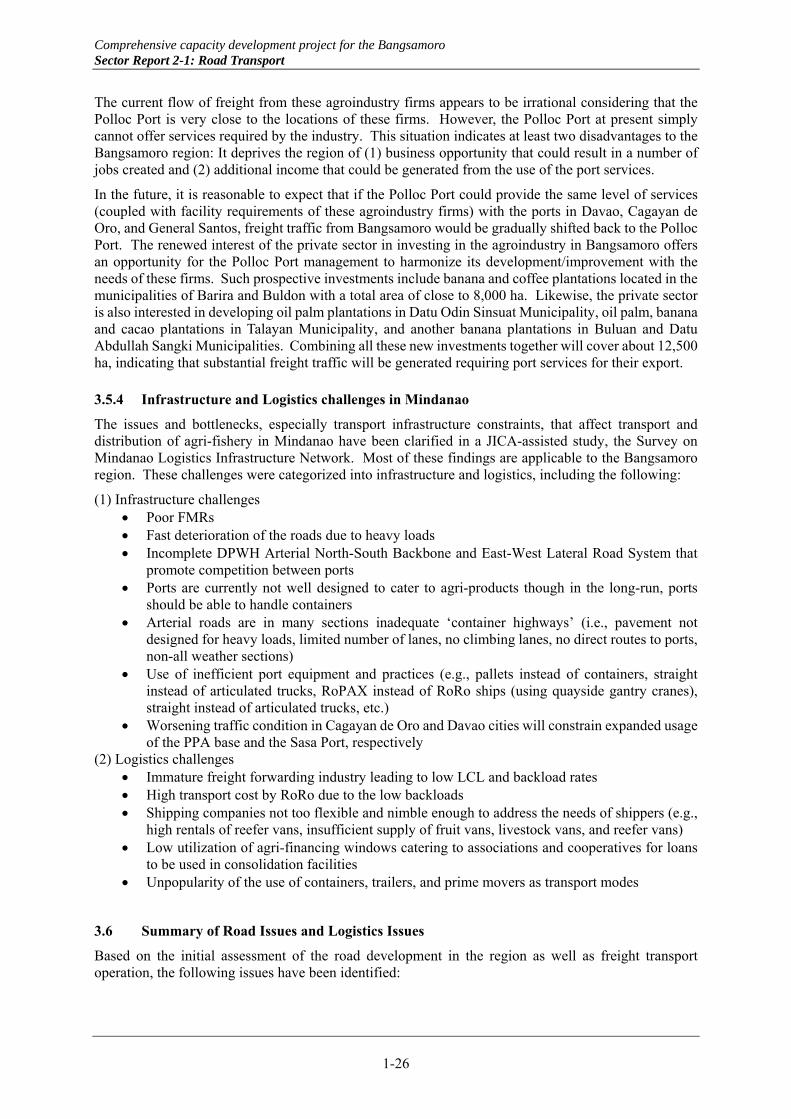
Comprehensive capacity development project for the Bangsamoro Sector Report 2-1: Road Transport
1-26
The current flow of freight from these agroindustry firms appears to be irrational considering that the Polloc Port is very close to the locations of these firms. However, the Polloc Port at present simply cannot offer services required by the industry. This situation indicates at least two disadvantages to the Bangsamoro region: It deprives the region of (1) business opportunity that could result in a number of jobs created and (2) additional income that could be generated from the use of the port services.
In the future, it is reasonable to expect that if the Polloc Port could provide the same level of services (coupled with facility requirements of these agroindustry firms) with the ports in Davao, Cagayan de Oro, and General Santos, freight traffic from Bangsamoro would be gradually shifted back to the Polloc Port. The renewed interest of the private sector in investing in the agroindustry in Bangsamoro offers an opportunity for the Polloc Port management to harmonize its development/improvement with the needs of these firms. Such prospective investments include banana and coffee plantations located in the municipalities of Barira and Buldon with a total area of close to 8,000 ha. Likewise, the private sector is also interested in developing oil palm plantations in Datu Odin Sinsuat Municipality, oil palm, banana and cacao plantations in Talayan Municipality, and another banana plantations in Buluan and Datu Abdullah Sangki Municipalities. Combining all these new investments together will cover about 12,500 ha, indicating that substantial freight traffic will be generated requiring port services for their export.
3.5.4 Infrastructure and Logistics challenges in Mindanao
The issues and bottlenecks, especially transport infrastructure constraints, that affect transport and distribution of agri-fishery in Mindanao have been clarified in a JICA-assisted study, the Survey on Mindanao Logistics Infrastructure Network. Most of these findings are applicable to the Bangsamoro region. These challenges were categorized into infrastructure and logistics, including the following:
(1) Infrastructure challenges Poor FMRs Fast deterioration of the roads due to heavy loads Incomplete DPWH Arterial North-South Backbone and East-West Lateral Road System that
promote competition between ports Ports are currently not well designed to cater to agri-products though in the long-run, ports
should be able to handle containers Arterial roads are in many sections inadequate ‘container highways’ (i.e., pavement not
designed for heavy loads, limited number of lanes, no climbing lanes, no direct routes to ports, non-all weather sections)
Use of inefficient port equipment and practices (e.g., pallets instead of containers, straight instead of articulated trucks, RoPAX instead of RoRo ships (using quayside gantry cranes), straight instead of articulated trucks, etc.)
Worsening traffic condition in Cagayan de Oro and Davao cities will constrain expanded usage of the PPA base and the Sasa Port, respectively
(2) Logistics challenges Immature freight forwarding industry leading to low LCL and backload rates High transport cost by RoRo due to the low backloads Shipping companies not too flexible and nimble enough to address the needs of shippers (e.g.,
high rentals of reefer vans, insufficient supply of fruit vans, livestock vans, and reefer vans) Low utilization of agri-financing windows catering to associations and cooperatives for loans
to be used in consolidation facilities Unpopularity of the use of containers, trailers, and prime movers as transport modes
3.6 Summary of Road Issues and Logistics Issues
Based on the initial assessment of the road development in the region as well as freight transport operation, the following issues have been identified:

Comprehensive capacity development project for the Bangsamoro Sector Report 2-1: Road Transport
1-27
(1) Road density
The Bangsamoro region’s road density (0.10) remains the lowest in the Country, which is not even a half of the national average (0.25). Another 800 km of national roads is necessary to reach the average of Mindanao (0.17), and a further addition of 800 km is in order to reach the national average.
(2) Pavement rate
The pavement rate of national roads in the region improved from 76.8% in 2007 to 81.9% in 2013. However, this is still below the national average of 83%. To reach the national level, paving another 179 km of national roads with gravel or earth surface is necessary.
Provincial roads in the region are mostly gravel- or earth-surfaced, which account for 79% (1,680 km) of the total length. This remains a major development issue to be addressed in the coming years.
Municipal roads are also mostly surfaced with gravel or earth (80% of the total or 1,680 km).
Barangay roads and FMRs are also mostly surfaced with gravel or earth (4,824 km of which only 0.2% has gravel surface).
(3) Road condition of paved national road
This will be confirmed after the road surface condition survey currently undertaken by another study team using DRIMS.
(4) Missing links
There are five missing links (155.4 km in total length), which prevent access to wide area in the region. Likewise, these missing links affect mobility of communities in these areas.
(5) Freight transport
Major challenges in freight transport are the poor condition of FMRs, secondary roads (provincial roads), and artery roads connecting Marawi and Cotabato; and the limited operation of the Polloc Port (which has led agroindustry firms in Bangsamoro to use alternative ports outside Bangsamoro).

Comprehensive capacity development project for the Bangsamoro Sector Report 2-1: Road Transport
1-28
CHAPTER 4 REVIEW OF RELEVANT POLICIES, PLANS AND PROJECTS FOR
ROAD SECTOR
4.1 BDA’s Bangsamoro Development Plan: Phase 1
A review of the Bangsamoro Development Plan (Phase 1) was carried out to confirm the strategic direction/investment as far as infrastructure development is concerned. During the transition, the strategy for roads and bridges will be to: (a) sustain current efforts to improve national roads through rehabilitation, reconstruction, upgrading, and maintenance; (b) address the most immediate and most un-served needs/gaps, especially at the barangay or community level by paving FMRs and building new ones; and (c) develop capacity in infrastructure planning, feasibility preparation, project supervision/management, and monitoring and evaluation for infrastructure staff. Table 4.1 shows the strategies the plan intends to pursue. It appears that the plan’s primary concern is the strengthening of infrastructure system of the region. This is in recognition of the poor state of infrastructure which significantly hampered efforts to bring to another level the socioeconomic condition of the region. Key to this overall effort to redress the region’s infrastructure is rehabilitation of FMRs that would directly benefits the poor.
Table 4.1 BDP Infrastructure Strategies and Project Types
Target strategy Project type a. Infrastructure to connect to economic growth centers
National, provincial roads and bridges; airports and seaports; telecommunications
b. Infrastructure to support production Farm-to-market roads (FMRs), irrigation facilities, small landing ports, energy requirements for economic activity
c. Infrastructure for access/social justice Access roads, household electrification (especially off-grid) for far-flung areas
d. Infrastructure to support security and normalization outcomes
Investments for the six priority camps and other requirements targeted for normalization
e. Infrastructure for climate-resilience, DRRM Flood control, retrofitting of existing infrastructure
Source: Bangsamoro Development Plan – Integrative Report, May 2014, BDA.
The project implementation arrangement was also touched by the plan. It was envisioned that during the transition period, national road projects will be implemented by the Department of Public Works and Highways (DPWH), while provincial and municipal road projects will be done by DPWH-ARMM. Barangay road and FMR projects shall be implemented by the Department of Agriculture (DA), Department of Agriculture and Fisheries (DAF)-ARMM, Department of Agrarian Reform (DAR), and DAR-ARMM (Table 4.3).
Table 4.2 Project Implementation Arrangement
Project type Implementing agency National Road Projects DPWH National Provincial Road Projects Municipal Road Projects
DPWH-ARMM
Barangay Road Projects FMR Projects
Department of Agriculture (DA) Department of Agriculture and Fisheries (DAF)-ARMM Department of Agrarian Reform (DAR), and DAR-ARMM.
Similarly, a review on the projects recommended for infrastructure (road) by the Transition Development Plan by JICA was carried out to see how these projects would fit in the overall plan and to confirm if any of these projects are funded by the National Government or Donor Institution for 2015 or 2016. The recommended projects for the short term (2015–2016) are presented in Table 4.3. It was envisaged that in the short-term, priority should be given to address the main bottlenecks of connectivity including the poor condition of FMRs as well as incomplete and unpaved national roads and main arterial roads which led to low productivity and limited income opportunities for rural communities. Location of these projects is depicted in Figure 4.1.

Comprehensive capacity development project for the Bangsamoro Sector Report 2-1: Road Transport
1-29
Table 4.3 Proposed Projects for Transitional Plan Period
No. Road Road length (km) 1 Davao–Cotabato Road (reblocking) 8.8 2 Marbel–Ala–Cotabato Road (reblocking) 4.0 3 SK Border–Butig–Lumbayanague Road 31.0 4 Maganoy–Sultan Sa Barongis Road (Provincial Road) 13.5 5 Datu Saudi Ampatuan Road (Provincial Road) 9.0 6 Manuangan–Parang Road 20.0
Source: Transitional Development Plan, 2014, JICA-PhilKoe International, Inc.
The list of road projects was then compared to the road projects by DPWH-ARMM funded for their 2015 budget. After cross checking, it was found out that identified projects in the Transition Plan are not in the list of 2015 priority projects of DPWH-ARMM. However two projects proposed by the BDP 1 for medium term/long term were included in the 2015 projects of DPWH-ARMM. These are:
Concreting of alternative road (Matanog–Barira–Buldon in the Province of Maguindanao) (L=1.0 km and budget is PHP 20 million), and
Concreting of Lakit lakit–Mandulan road, Bongao in the Province of Tawi-Tawi (L=2.0 km and budget is PHP 24 million)
It should be noted that the 2015 budget of DPWH-ARMM covers only 1 km of the 9 km unpaved sections of Matanog–Barira–Buldon.
4.2 ARMM’s Regional Development Plan: Medium Term Update (2013–2016)
The updated Regional Development Plan of the ARMM identified a couple of road projects critical to support social and economic development activities of the region. The projects are grouped into two based on the source of fund: (i) projects for funding by the Regional Government and (ii) projects for funding by the National Government or Official Development Assistance (Figure 4.2).
Priority projects to be funded by the ARMM are as follows:
i.) Completion of trans-central road (Sulu), ii.) Jolo island circumferential road (162 km), and iii.) Sanga- Sanga-Saldang road (16 km).
Priority projects for funding by the National Government or Official Development Assistance (ODA) are as follows:
i.) Lake Lanao circumferential road (118.7 km), ii.) Concreting of Semba-Linek-Kusiong road (25 km), iii.) Lumbatan-Marogong-Tubaran-Malabang road (40 km), iv.) Completion of Basilan circumferential road (86.2 km), v.) Completion of Cotabato City east diversion road (11.8 km), vi.) Concrete Paving of Molundo-Wao road (42 km), vii.) Concreting of Midsayap-Dulawan-Makar road, and viii.) Concrete Paving of Ganassi – Tubod road (12 km).

Comprehensive capacity development project for the Bangsamoro Sector Report 2-1: Road Transport
1-30
Figure 4.1 Locations of Proposed Transitional Period Projects (1/2): Mainland Provinces

Comprehensive capacity development project for the Bangsamoro Sector Report 2-1: Road Transport
1-31
Figure 4.1 Locations of Proposed Transitional Period Projects (2/2): Island Provinces
Source: ARMM’s RDP data.
Figure 4.2 Proposed Road Projects in ARMM’s RDP (2013–2016)

Comprehensive capacity development project for the Bangsamoro Sector Report 2-1: Road Transport
1-32
4.3 Asian Highway (Mindanao Section)
The Asian Highway (AH) has a strong influence to the future development of the Bangsamoro as it cuts through the heart of its territory. The Asian Highway network which was initiated in 1959 is a regional transport cooperation initiative among countries in Asia and Europe and the United Nations Economic and Social Commission for Asia and the Pacific (ESCAP) aimed at enhancing the efficiency and development of the road infrastructure in Asia, supporting the development of Euro-Asia transport linkages and improving connectivity for landlocked countries.
According to ESCAP, the Asian Highway network now comprises over 141,000 km of roads passing through 32 member countries. The network extends from Tokyo in the east to Kapikule, Turkey in the west and from Torpynovka, Russian Federation, in the north, to Denpasar, Indonesia in the south. The Philippines is part of this regional cooperation where the identified route has a total length of 3,379 km that traverses from Laoag City in the north passing Metro Manila, moving further south to Bicol then to Visayas and enters Mindanao via Surigao City (Lipata) down to Davao City and continues to General Santos City before swinging back north to Cotabato City and ends at the International Port of Zamboanga City (Table 4.4 and Figure 4.3).
Table 4.4 Characteristics of AH26’s Sections in Mindanao
Section Total length
(km) Surface type (km) Surface condition (%)
Concrete Asphalt Gravel Good Fair Poor Bad No ratingLipata to Davao City 398.79 198.96 199.83 - 42.0 20.9 27.4 14.3 32.6Davao City to Gen. Santos 144.48 63.38 80.98 0.12 12.4 10.0 12.8 16.8 1.8Gen. Santos to Zamboanga 513.86 444.51 54.34 15.02 20.4 54.7 51.2 28.1 27.3(Jct. Calinan) Davao City to CDO City
292.39 71.32 221.06 - 25.2 14.3 8.6 40.8 38.2
Total 1,349.52 778.17 556.21 15.14 100.0 100.0 100.0 100.0 100.0Note: Surface condition is based on 2012 Road Condition Data of DPWH
Source: Presentation of DPWH Assistant Secretary, Catalina Cabral, titled “Asian Highway (AH 26)” to UNESCO, 2013.
AH26 (route number given to the Philippines) is being developed as prime connector to other highways in neighboring countries to facilitate a smoother handling of trade and commerce in the region. To complete this connection, a dedicated sea route is necessary. Mindanao has two: port of Surigao City and port of Zamboanga City.
The entire stretch of AH26 in Mindanao is 1,349.52 km and connects the cities of Surigao, Davao, General Santos, Cotabato, Pagadian, and Zamboanga. Another branch of AH26 connects Davao City to Cagayan de Oro City. The efforts by DPWH to upgrade the AH26 to bring the network in conformity with Asian Highway classification and design standards will at the very least improve the horizontal and vertical curve of the highway linking Cotabato City to Marawi City which prevents the highway to function correctly. This highway is Bangsamoro’s primary corridor. Likewise, current efforts by the DPWH on AH26 indicate that there’s an intention to elevate the network to Class I. An ADB-assisted study is currently ongoing (TA-8574 PHI: Improving National Roads for Inclusive Growth in Mindanao Project) which tries to explore feasibility of widening from two-lane into four-lane the road from Lanao to Pagadian to Zamboanga. Most of these sections are part of the AH26. At present, four-lane (Class 1) sections of AH26 stands at 13.3% (Table 4.5).
Table 4.5 Classification of Asian Highway
Classification Description Pavement type Primary Access controlled motorway Asphalt or cement concrete Class I 4 or more lanes highway Asphalt or cement concrete Class II 2 lanes Asphalt or cement concrete Class III 2 lanes (narrow) Double bituminous treatment
Source: Asian Highway Standards, ESCAP 1995.

Comprehensive capacity development project for the Bangsamoro Sector Report 2-1: Road Transport
1-33
Source: DPWH data.
Figure 4.3 Asian Highway’s Section in Mindanao
4.4 Mindanao’s Railway Plan
There is a wide clamor to build a Mindanao circumferential railway system, but it has not been realized due to its substantial investment requirement that puts to question its economic feasibility. Nonetheless, short run railways in high traffic areas are being seriously considered such as the Cagayan–Iligan corridor. A feasibility study on an 82.5 km railway from Cagayan de Oro to Iligan has been completed and reviewed for possible external financing.
The Mindanao Development Authority (MinDA)-initiated plan, Mindanao 2020 Peace and Development Framework Plan (2011–2030), envisions that construction of Mindanao’s first railway will start by 2016 and operation will commence in 2020. Phase I is expected to run between Cagayan and Iligan with an estimated budget of PHP 57,733 million and to be financed through PPP.
Since the priority lines are outside Bangsamoro and financing and implementation plans are not yet clear, the impact of this project on the Bangsamoro development seems to be minimal. The planned railway route and stations are shown in Figure 4.4.

Comprehensive capacity development project for the Bangsamoro Sector Report 2-1: Road Transport
1-34
Source: Data from BDP1.
Figure 4.4 Mindanao Railway Plan

Comprehensive capacity development project for the Bangsamoro Sector Report 2-1: Road Transport
1-35
CHAPTER 5 DEVELOPMENT STRATEGIES FOR ROAD SECTOR
The issues and challenges to overcome to establish a well-functioning road network that respond to the socio-economic development needs of Bangsamoro have been identified in the previous section. At the outset, the road network is not complete leaving wide area inaccessible. Likewise, the narrow and poor condition and alignment of Narciso Ramos Highway affects transport of agri-products from this agricultural corridor. Further, the limited operation of Polloc Port forced shippers in the Bangsamoro region to truck out their cargoes either to General Santos, Davao or Cagayan de Oro. The issues, objectives and strategies to pursue in establishing plan for the road sector are illustrated in Figure 5.1.
Figure 5.1 Development Issues, Objectives and Strategies for Road Sector
5.1 Development Objectives
The development objectives and their requirements in the road sector can be further described as follows:
(1) To supply a road network supporting peace building and poverty reduction encompassing Roads supporting development of MILF camps, Roads providing access to areas with high poverty incidence, and Roads facilitating easy access to services such as hospitals, government centers, and markets.
(2) To develop road network supporting agroindustry and tourism development covering Roads providing access to agricultural potential areas, Roads connecting agricultural production areas to agri-processing centers to market centers and
to ports and airports, and Roads supporting access improvement to tourism sites.
(3) To pursue completion of the road network covering Roads serving as missing links in the network and can contribute to development of
agroindustry and New roads identified as critical in the road network.
(4) To revitalize primary port and pursue road network supporting freight transport encompassing Roads linking ports and airports to agricultural production areas and agri-processing centers, Strengthening of roads linking the Bangsamoro region to alternative ports in Mindanao, and Roads that support strengthening of primary urban functions.
Development Issues
- Conflict affected areas and poorest region in the country
- Agriculture is the mainstay of the economy
- Poor and incomplete road network
- Limited operation of the primary port to support freight transport
Development Objectives
- To supply a road network supporting peace building and poverty reduction
- To develop road network supporting agroindustry and tourism development
- To pursue completion of the road network
- To revitalize primary port and pursue road network supporting freight transport
Development Strategies
- Establishment of road network supporting poverty alleviation
- Establishment of road network for agro-industry and tourism development
- Establishment of road network for balance development of all Bangsamoro areas
- Establishment of logistics corridors

Comprehensive capacity development project for the Bangsamoro Sector Report 2-1: Road Transport
1-36
5.2 Development Strategies
5.2.1 Establishment of a road network supporting poverty alleviation
One of the development issues to be addressed in the Bangsamoro is the widespread poverty primarily caused by armed conflicts that has been part of the social landscape for decades and shortage of infrastructure supply like roads. Figure 5.2 identified the locations of municipalities having the highest poverty incidence (i.e., more than half of the population). Some of the areas experiencing extreme poverty happened to be hosting some of the missing links as shown in Figure 3.7 earlier. Elimination of these missing links coupled with program addressing the poor condition of FMRs will significantly contribute in the overall effort to alleviate poverty in the region. Thus, the following strategies should be pursued:
Rehabilitation and strengthening of primary roads down to FMRs, particularly those located in the poverty areas to provide reliable means of transportation; and
Exploration of the suitability of labor-based approaches to construction of FMRs and other roads, and maintenance of provincial, municipal, and FMRs to provide employment opportunities to the socially deprived.
Figure 5.2 Poverty Incidence (2012) and Present Road Network
5.2.2 Establishment of a road network for agroindustry and tourism development
One of the strategies being pursued in the plan to energize the economy of the region is the promotion of agri-industries with comparative advantage. An interview survey conducted by the agroindustry experts of the JICA Study Team revealed that efforts by the private sector to expand their investment in the Bangsamoro composed of banana, coffee and cacao are in advance stage. The locations of these newly planned plantations are indicated in Figure 5.3.

Comprehensive capacity development project for the Bangsamoro Sector Report 2-1: Road Transport
1-37
Source: Interviews by the agriculture experts of the team and various maps.
Figure 5.3 Locations of Existing Agroindustry, Possible Expansion, and Road Network Condition

Comprehensive capacity development project for the Bangsamoro Sector Report 2-1: Road Transport
1-38
Currently, access roads of these areas identified for agroindustry development are in poor conditions, and major upgrading of existing roads as well as construction of new roads are necessary to provide reliable means of transportation. Likewise, areas along the Cotabato–Marawi road have potential to become agricultural growth area, and thus strengthening of this corridor as well as upgrading of its secondary roads (provincial, municipal and FMRs) is vital. These efforts should be extended as well to roads leading to rice paddies and cultivated lands. The following strategies therefore will be pursued:
Strengthening of Cotabato–Marawi road to serve future growth of agriculture and agroindustry processing plants along this corridor;
Rehabilitation of FMRs leading to rice paddies and cultivated areas. Or in cases where access roads are not present, construct new FMRs connecting to rice paddies and cultivated areas; and
Development of tourism infrastructure along the corridor and strengthening access roads leading to tourism sites.
5.2.3 Establishment of a road network for balance development of all areas
As mention, one of the issues affecting development of the Bangsamoro region is the absent of access roads to some potential areas. This lack of roads isolates the communities and hold back development in the area. Likewise, produces by the farmers are greatly harmed by high transportation cost further aggravating the little income they could get. Further, these missing links of the network affect law enforcement. The following strategy will therefore
Eliminate identified missing links to attain balanced development of the Bangsamoro region and
Pursue realization of the identified new roads necessary for the whole network of Bangsamoro to function effectively.
5.2.4 Establishment of logistics corridors
(1) Definition of logistics corridors
A logistics corridor can be defined as a transport link formed to serve as major trunk route between terminals and play an important role for an effective transport of cargoes and passengers (Figure 5.4). The transport corridor often traverses a number of major urban centers and is composed of road, ports at both terminals of the link, trade facilities, major telecommunication link, power grid and alike. The terminal of a transport link is commonly composed of major urban center, sea port, inland container depot (ICD), economic zone, and other major industrial activities.
(2) Identified logistics corridors in Bangsamoro
In the Bangsamoro area, there are at least three roads that have potential to become logistics corridor and critical to strengthen to support revitalization of Polloc Port (Figure 5.5). Once the port is revitalized, the intention is not only to capture back the lost traffic to other ports but also offer a reasonable alternative to both domestic and international port cargoes produced outside the Bangsamoro region. These are: (i) Cotabato–Marawi–Iligan–Cagayan de Oro which referred as Northern Corridor (ii) Cotabato–Kidapawan–Davao which referred as Central Corridor and (iii) Cotabato–Koronadal–General Santos which referred as Southern Corridor (Figure 5.4). The Cotabato–Kabacan–Kibawe–Cagayan de Oro might serve as an alternative route for the Northern Corridor. The outline of these identified logistics corridors is presented below (see Table 5.1 for the summary).
a. Northern Corridor: This corridor traverses from central to north of Mindanao originating from Cotabato City and passing the major towns of Parang, Malabang, and the cities of Marawi, Iligan before linking up to Cagayan de Oro City. This corridor has high potential for agricultural growth due to suitability of soil and availability of large agricultural land. The road condition, however, is currently poor in terms of road surface and alignment. This road is not yet suitable for container traffic due to many sharp curves that make large cargo transport difficult.
The alternative route to the Northern Corridor is via Kabacan and Kibawe. This corridor follows the

Comprehensive capacity development project for the Bangsamoro Sector Report 2-1: Road Transport
1-39
Cotabato–Davao road before move north in the city of Kabacan to follow Sayre Highway passing the cities of Valencia and Malaybalay until it hit the city of Cagayan de Oro.
b. Central Corridor: This corridor moves from west to east passing the thriving municipalities of Sultan Kudarat, Pigcawayan, Midsayap, Pikit, Kabacan, and the cities of Kidapawan and Digos. This corridor is passing through the Mindanao’s largest plain and produces most of the region’s rice supply. The road condition is generally good and there is an ongoing effort by DPWH to widen the road carriageway from two-lanes to four-lanes.
c. Southern Corridor: This corridor links the Bangsamoro area to the flourishing city of General Santos passing the major towns of Datu Odin Sinsuat, Shariff Aguak, Esperanza, Isulan, and the cities of Tacurong and Koronadal. A newly identified site for banana and cacao plantations is along this corridor in the town of Talayan. The road condition in this corridor is generally good and efforts by DPWH for expansion from two-lane to four-lane have been ongoing for years.
Figure 5.4 Inter-city Road Network of Mindanao as Logistics Corridor
Table 5.1 Key Components of the Three Logistics Corridors
Corridor Trunk road
Port Airport From via To
a. Northern Corridor
Cotabato City
Marawi Cagayan de Oro City
Macabalan Port and Mindanao Container Terminal
Laguindingan International Airport Carmen
b. Central Corridor
Cotabato City
Kidapawan Davao City Sasa Port Davao International Airport
c. Southern Corridor
Cotabato City
Koronadal Gen. Santos City
Makar Wharf Gen. Santos International Airport
Note: There are three international airports in Mindanao (airports of Davao and Gen. Santos and Zamboanga); airports of Cotabato City and Cagayan de Oro city are classified as Principal Class 1

Comprehensive capacity development project for the Bangsamoro Sector Report 2-1: Road Transport
1-40
Figure 5.5 Possible Logistics Corridor for Bangsamoro
(3) Strategies for development of logistics corridors
The first strategy in developing logistics corridor is to strengthen the physical link that connects say two major urban centers (e.g., Cotabato City–Marawi City). The second strategy is promotion of the corridor as investment area (e.g., tourism area, agricultural growth corridor, and economic zone), which could be considered as further elevating the corridor into economic corridor. Accumulation of economic activities along the corridor both attracts and generates freight and passenger traffic. The success of

Comprehensive capacity development project for the Bangsamoro Sector Report 2-1: Road Transport
1-41
logistics corridor will depend on its ability to attract investments. Attracting investment, in turn, largely depends on ability to provide appropriate infrastructure and policies to facilitate movement of people and freight. Thus the following will be pursued:
Strengthening of the three identified corridors by upgrading of pavement and widening of lane. This strategy supports strengthening of linkages among major urban areas as well as strengthening linkages between indigenous industries and export industries to ports and airports; and
Improvement of logistics corridors by strengthening links to agricultural areas and primary processing plants.
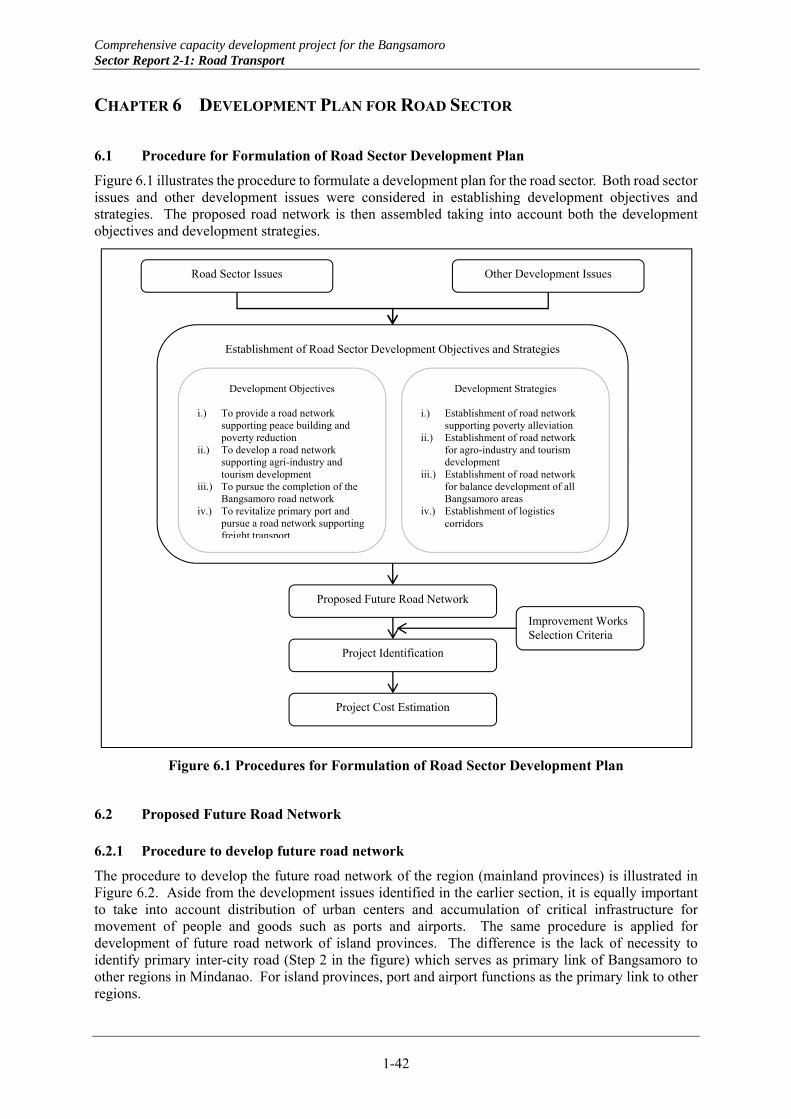
Comprehensive capacity development project for the Bangsamoro Sector Report 2-1: Road Transport
1-42
CHAPTER 6 DEVELOPMENT PLAN FOR ROAD SECTOR
6.1 Procedure for Formulation of Road Sector Development Plan
Figure 6.1 illustrates the procedure to formulate a development plan for the road sector. Both road sector issues and other development issues were considered in establishing development objectives and strategies. The proposed road network is then assembled taking into account both the development objectives and development strategies.
Figure 6.1 Procedures for Formulation of Road Sector Development Plan
6.2 Proposed Future Road Network
6.2.1 Procedure to develop future road network
The procedure to develop the future road network of the region (mainland provinces) is illustrated in Figure 6.2. Aside from the development issues identified in the earlier section, it is equally important to take into account distribution of urban centers and accumulation of critical infrastructure for movement of people and goods such as ports and airports. The same procedure is applied for development of future road network of island provinces. The difference is the lack of necessity to identify primary inter-city road (Step 2 in the figure) which serves as primary link of Bangsamoro to other regions in Mindanao. For island provinces, port and airport functions as the primary link to other regions.
Establishment of Road Sector Development Objectives and Strategies
Other Development Issues Road Sector Issues
Proposed Future Road Network
Project Identification
Project Cost Estimation
Development Objectives i.) To provide a road network
supporting peace building and poverty reduction
ii.) To develop a road network supporting agri-industry and tourism development
iii.) To pursue the completion of the Bangsamoro road network
iv.) To revitalize primary port and pursue a road network supporting freight transport
Development Strategies i.) Establishment of road network
supporting poverty alleviation ii.) Establishment of road network
for agro-industry and tourism development
iii.) Establishment of road network for balance development of all Bangsamoro areas
iv.) Establishment of logistics corridors
Improvement Works Selection Criteria

Comprehensive capacity development project for the Bangsamoro Sector Report 2-1: Road Transport
1-43
Figure 6.2 Procedure to Develop Future Road Network of Bangsamoro
The three road functional classifications shown in Figure 6.3 are further clarified.
(1) Primary inter-city road ‐ A major road which serves as the primary link of the Bangsamoro region to other regions in
Mindanao, ‐ A major road connecting at least two major urban centers and both ends of the road has a major
port and airport, and ‐ A major road has the potential to function as logistics corridor not only for the Bangsamoro
region but also for the island of Mindanao. (2) Regional primary road
‐ A major road which serves as the primary link within the Bangsamoro region (intra-regional road),
‐ A major road connecting two primary inter-city roads, and ‐ A major road providing access to primary processing center (agroindustry).
(3) Regional secondary road ‐ A major road which functions as collector/distributor road in the road network of Bangsamoro, ‐ A major road connecting regional primary road and regional secondary road, and ‐ A major road connecting to camps, tourism sites, agricultural areas, areas with high poverty
incidence, etc.
6.2.2 Primary inter-city road network in Mindanao
The urban hierarchy in Mindanao has been clarified and reflected in Table 6.1. Seven cities were classified under Tier I which gather highest score taking into account population, population growth, income class, and city category. In the Bangsamoro region, Marawi City has the highest score at 8, followed by Sultan Kudarat and Isabela City at 7.
Table 6.1 Profiles of Tier I Cities
City Population 2010 Pop. change (2010/00) Income class Category* Butuan City (Capital) 309,709 1.18 1st HUC Cagayan de Oro City 602,088 1.31 1st HUC Cotabato City 271,786 1.66 3rd ICC Davao City 1,449,296 1.30 1st HUC General Santos City 538,086 1.31 1st HUC Iligan City 322,821 1.13 1st HUC Zamboanga City 807,129 1.35 1st HUC *HUC=Highly Urbanized City; ICC=Independent Component City
Distribution of urban centers
Distribution of major ports and airports
Logistics corridor Development issues
(poverty, agri-industry, camps, tourism, etc.)
Development of Inter-Regional Network (Bangsamoro’s primary link to Mindanao) Primary Inter-city Road
Development of Intra-Regional Network (Bangsamoro intra-network) Bangsamoro’s Regional
Primary Road Bangsamoro’s Regional
Secondary Road
Proposed Road
Network
1 2 3 4
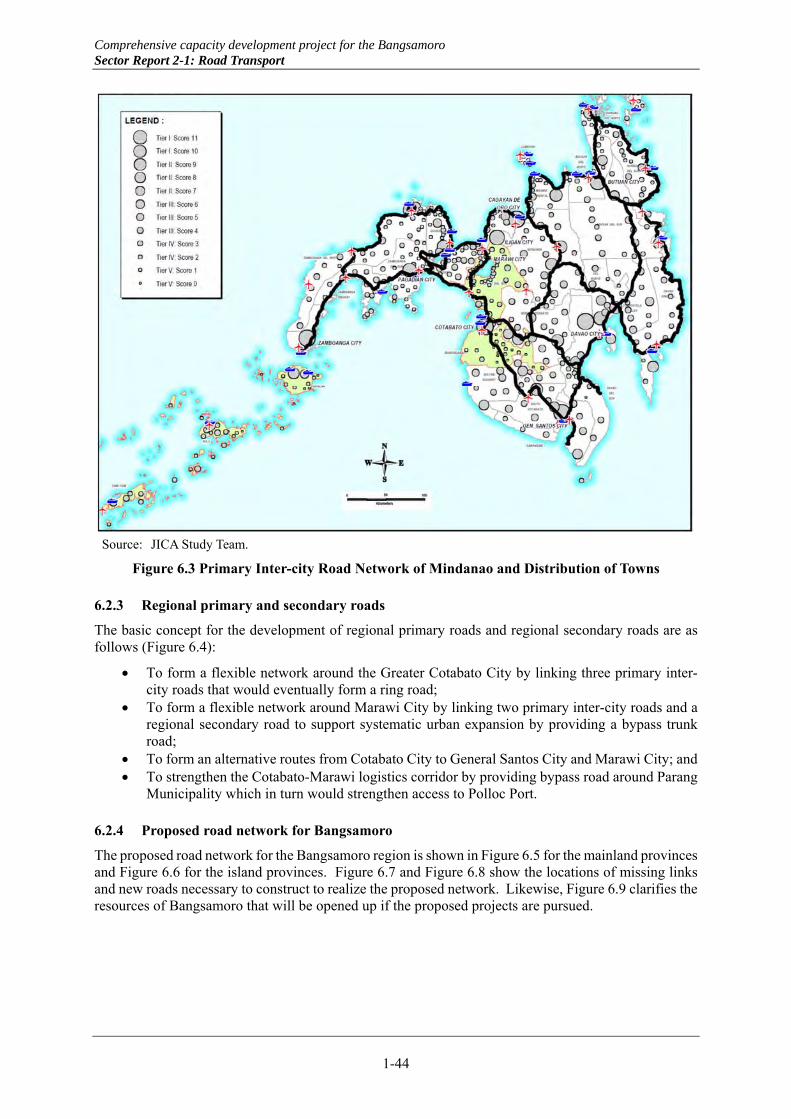
Comprehensive capacity development project for the Bangsamoro Sector Report 2-1: Road Transport
1-44
Source: JICA Study Team.
Figure 6.3 Primary Inter-city Road Network of Mindanao and Distribution of Towns
6.2.3 Regional primary and secondary roads
The basic concept for the development of regional primary roads and regional secondary roads are as follows (Figure 6.4):
To form a flexible network around the Greater Cotabato City by linking three primary inter-city roads that would eventually form a ring road;
To form a flexible network around Marawi City by linking two primary inter-city roads and a regional secondary road to support systematic urban expansion by providing a bypass trunk road;
To form an alternative routes from Cotabato City to General Santos City and Marawi City; and To strengthen the Cotabato-Marawi logistics corridor by providing bypass road around Parang
Municipality which in turn would strengthen access to Polloc Port.
6.2.4 Proposed road network for Bangsamoro
The proposed road network for the Bangsamoro region is shown in Figure 6.5 for the mainland provinces and Figure 6.6 for the island provinces. Figure 6.7 and Figure 6.8 show the locations of missing links and new roads necessary to construct to realize the proposed network. Likewise, Figure 6.9 clarifies the resources of Bangsamoro that will be opened up if the proposed projects are pursued.
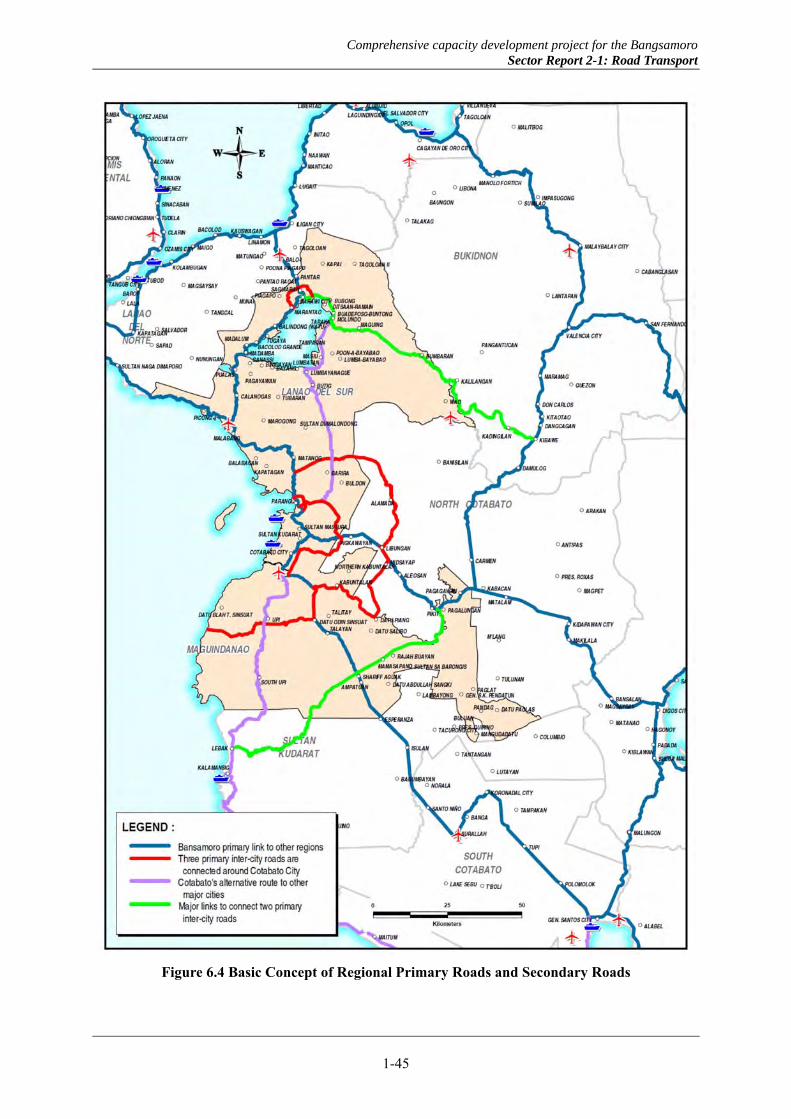
Comprehensive capacity development project for the Bangsamoro Sector Report 2-1: Road Transport
1-45
Figure 6.4 Basic Concept of Regional Primary Roads and Secondary Roads

Comprehensive capacity development project for the Bangsamoro Sector Report 2-1: Road Transport
1-46
Figure 6.5 Proposed Bangsamoro Road Network: Mainland Provinces

Comprehensive capacity development project for the Bangsamoro Sector Report 2-1: Road Transport
1-47
Figure 6.6 Proposed Bangsamoro Road Network: Island Provinces

Comprehensive capacity development project for the Bangsamoro Sector Report 2-1: Road Transport
1-48
Figure 6.7 Existing Condition of Proposed Bangsamoro Road Network: Mainland Provinces

Comprehensive capacity development project for the Bangsamoro Sector Report 2-1: Road Transport
1-49
Figure 6.8 Existing Condition of Proposed Bangsamoro Road Network: Island Provinces

Comprehensive capacity development project for the Bangsamoro Sector Report 2-1: Road Transport
1-50
Figure 6.9 Proposed Bangsamoro Road Network with Region’s Resources
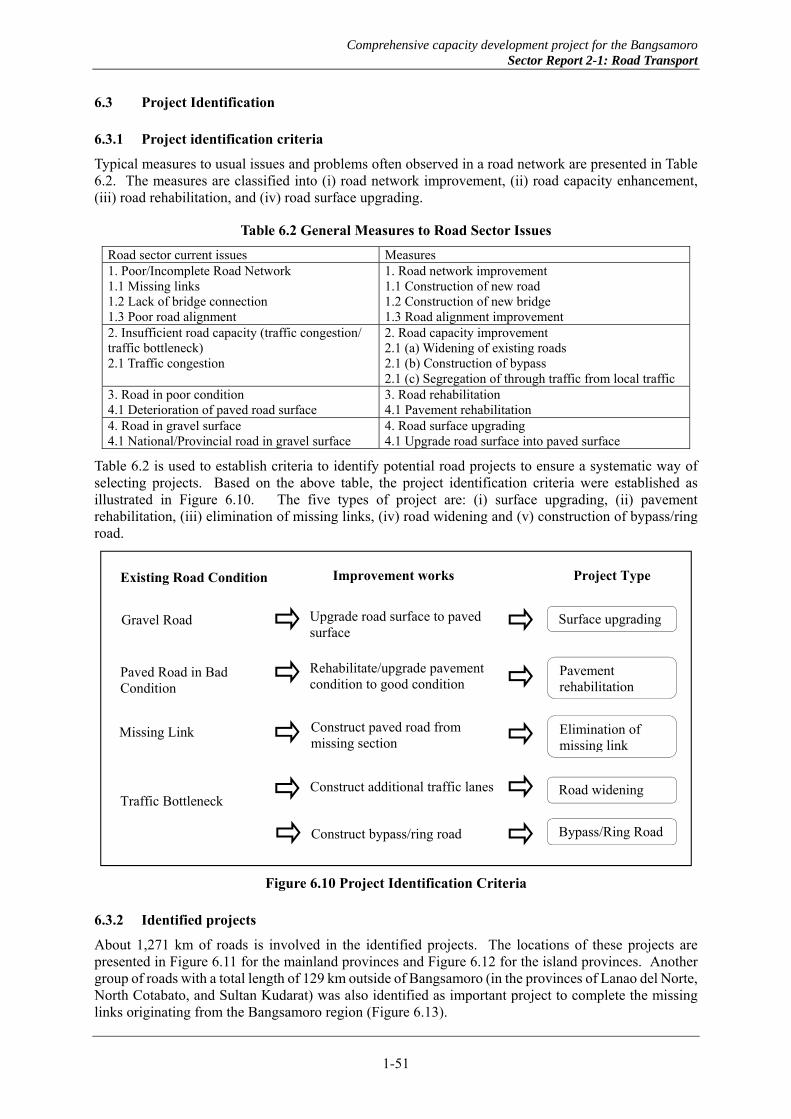
Comprehensive capacity development project for the Bangsamoro Sector Report 2-1: Road Transport
1-51
6.3 Project Identification
6.3.1 Project identification criteria
Typical measures to usual issues and problems often observed in a road network are presented in Table 6.2. The measures are classified into (i) road network improvement, (ii) road capacity enhancement, (iii) road rehabilitation, and (iv) road surface upgrading.
Table 6.2 General Measures to Road Sector Issues
Road sector current issues Measures 1. Poor/Incomplete Road Network 1.1 Missing links 1.2 Lack of bridge connection 1.3 Poor road alignment
1. Road network improvement 1.1 Construction of new road 1.2 Construction of new bridge 1.3 Road alignment improvement
2. Insufficient road capacity (traffic congestion/ traffic bottleneck) 2.1 Traffic congestion
2. Road capacity improvement 2.1 (a) Widening of existing roads 2.1 (b) Construction of bypass 2.1 (c) Segregation of through traffic from local traffic
3. Road in poor condition 4.1 Deterioration of paved road surface
3. Road rehabilitation 4.1 Pavement rehabilitation
4. Road in gravel surface 4.1 National/Provincial road in gravel surface
4. Road surface upgrading 4.1 Upgrade road surface into paved surface
Table 6.2 is used to establish criteria to identify potential road projects to ensure a systematic way of selecting projects. Based on the above table, the project identification criteria were established as illustrated in Figure 6.10. The five types of project are: (i) surface upgrading, (ii) pavement rehabilitation, (iii) elimination of missing links, (iv) road widening and (v) construction of bypass/ring road.
Figure 6.10 Project Identification Criteria
6.3.2 Identified projects
About 1,271 km of roads is involved in the identified projects. The locations of these projects are presented in Figure 6.11 for the mainland provinces and Figure 6.12 for the island provinces. Another group of roads with a total length of 129 km outside of Bangsamoro (in the provinces of Lanao del Norte, North Cotabato, and Sultan Kudarat) was also identified as important project to complete the missing links originating from the Bangsamoro region (Figure 6.13).
Existing Road Condition Improvement works
Gravel Road
Paved Road in Bad Condition
Missing Link
Traffic Bottleneck
Upgrade road surface to paved surface
Surface upgrading
Rehabilitate/upgrade pavement condition to good condition
Pavement rehabilitation
Construct paved road from missing section
Construct additional traffic lanes
Elimination of missing link
Road widening
Project Type
Construct bypass/ring road Bypass/Ring Road

Comprehensive capacity development project for the Bangsamoro Sector Report 2-1: Road Transport
1-52
Figure 6.11 Locations of Identified Projects: Mainland Provinces

Comprehensive capacity development project for the Bangsamoro Sector Report 2-1: Road Transport
1-53
Figure 6.12 Locations of Identified Projects: Island Provinces

Comprehensive capacity development project for the Bangsamoro Sector Report 2-1: Road Transport
1-54
Figure 6.13 Locations of Missing Links outside Bangsamoro Region

Comprehensive capacity development project for the Bangsamoro Sector Report 2-1: Road Transport
1-55
The identified projects are grouped into five to fit into the regional development plan. The grouping is as follows: (1) Artery Roads Upgrading Project, (2) Missing Links Development Project, (3) Corridor Development Project, (4) Corridor Link Roads Improvement Project, and (5) Ring Roads/Bypass Roads Development Project.
The Corridor Development Project involved upgrading of 262 km of road inside the Bangsamoro and 292 km in the neighboring regions to complete the proposed three economic corridors. The combined length is about 700 km, of which 21% (144 km) have four lanes or more.
Table 6.3 Summary of Identified Projects and Type of Improvement Works
Project Type
INSIDE BANGSAMORO OUTSIDE BANGSAMORO
Grand Total for Road to be improved
(km)
Roa
d L
engt
h (K
m)
Type of Works (km)
Tot
al L
engt
h to
be
impr
oved
Roa
d L
engt
h (K
m)
Type of Works (km)
Tot
al L
engt
h to
be
impr
oved
New
Con
stru
ctio
n
Sur
face
Upg
radi
ng
Reh
abil
itat
ion
Rec
onst
ruct
ion
New
Con
stru
ctio
n
Sur
face
Upg
radi
ng
Reh
abil
itat
ion
Rec
onst
ruct
ion
a. Bangsamoro Regional Artery Roads Upgrading Project
250.2 79.4 93.9 - 7.5 180.8 - - - - - - 180.8
b. Missing Links Development Project
168.8 136.4 23.8 - 8.5 168.8 - - - - - - 168.8
c. Bangsamoro Corridor Development Project
267.6 - - - 13.7 13.7 - - - - - - 13.7
d. Corridor Link Roads Improvement Project
692.1 93.2 478.3 - 120.5 692.1 168.4 120.3 23.8 - - 144.1 836.2
e. Ring Roads/Bypass Roads Development Project
69.9 41.2 19.6 - 2.5 63.3 9.1 - 9.1 - - 9.1 72.4
`Total 1,448.5 350.2 615.7 - 152.7 1,118.6 177.6 120.3 32.9 - - 153.2 1,271.8
6.3.3 Approach to FMRs
The dominant industry in the region is agri-fishery, and thus the road sector should be planned in a way that it supports the agri-fishery industry. This can be done by adopting a new approach in road development in which whenever a national road or provincial road or other type of trunk roads is planned, FMR improvement is included in the project. Labor-based road rehabilitation and maintenance technology should be pursued.
The master plan has identified 80 road projects, and during the project preparation, improvement of FMRs should be included in the scope of work to ensure their inclusion in the feasibility study (FS). The results of FS indicate the specific FMR to be improved in each road project. Figure 6.14 is an example (output) of an FS that included FMRs in the scope of work. In the two road projects implemented in the JICA study (2010), it was observed that for every 10 km trunk road, the length of FMRs to be improved was about 8 km. This is roughly 45% of all the roads linked to the trunk road (and 55% to unproductive areas or in some cases already funded). Assuming that every 10 km of a trunk road has 8 km of FMRs, the estimated length of FMRs to be improved is about 884 km. This ratio should be revised if new figures appear as more feasibility studies are undertaken. Table 6.4 indicates estimated lengths of FMRs for improvement by province.
Table 6.4 Estimated Length and Construction Cost of FMRs to Be Improved per Province
Province Road length (km)
Road to improve
(km)
Estimated length of
FMR
Construction cost (PHP)
Engineering services (PHP)
Total cost (PHP)
Lanao 325.4 138.6 110.9 1,716,682,464 240,335,545 1,957,018,009 Maguindanao 515.2 375.3 300.2 4,647,479,904 650,647,186 5,298,127,090 Basilan 228.1 228.1 182.5 2,825,000,928 395,500,130 3,220,501,058 Sulu 201.9 201.9 161.5 2,499,883,776 349,983,729 2,849,867,505 Tawi-Tawi 178.0 161.1 128.9 1,994,690,880 279,256,723 2,273,947,603
Total 1,448.5 1,105.0 884.0 13,683,737,952 1,915,723,313 15,599,461,265

Comprehensive capacity development project for the Bangsamoro Sector Report 2-1: Road Transport
1-56
Note: FMRs in pink = recommended for improvement; FMRs in brown = not recommended for improvement
Source: The Study on Infrastructure (Road Network) Development Plan for the Autonomous Region in Muslim Mindanao (ARMM), JICA, 2010.
Figure 6.14 Example of FS of Two Provincial Roads Which Includes FMRs
The average construction cost for an FMR in the ARMM by the Department of Agriculture’s Philippine Rural Development Project is PHP 11.5 million/km. Using this figure as a basis, the total construction cost (including direct, overhead, profit, contingency, and VAT) of the 884 km FMRs is about PHP 13.68 billion. Engineering services such as FS, detailed design, and supervision are assumed to be undertaken during the improvement plan for the main trunk road to which these FMRs are connected. If the engineering services are undertaken separately, estimated cost for the 884 km is about PHP 1.92 billion, which would bring the total cost to PHP 15.60 billion.
Taking into account the importance of peace-building and job-creation, which demand immediate attention after combatants return to civilian life, labor-based road construction and maintenance methods should be applied to FMRs works. JICA has recently completed two-pilot projects in the municipalities of Sultan Mastura (Maguindanao) and Matungao (Lanao del Norte) using such labor-based technology. The two projects were successful and useful examples for future projects involving the labor-based technology. From this experience, Basic Manual for Road Rehabilitation and Maintenance by Labor-Based Technology was produced. In this manual, the technology is defined as “the construction technology utilizing the participation of the community as labor force supplemented with light equipment such as compactors to ensure the quality of construction works”. The manual established correct procedure in terms of (i) road standards (ii) construction methodology, (iii) work supervision and monitoring, (iv) community organization for its involvement, and (v) other important aspects of construction works. It is envisioned that a considerable portion of work force would come from the community and combatants under the overall supervision of a municipal engineer.
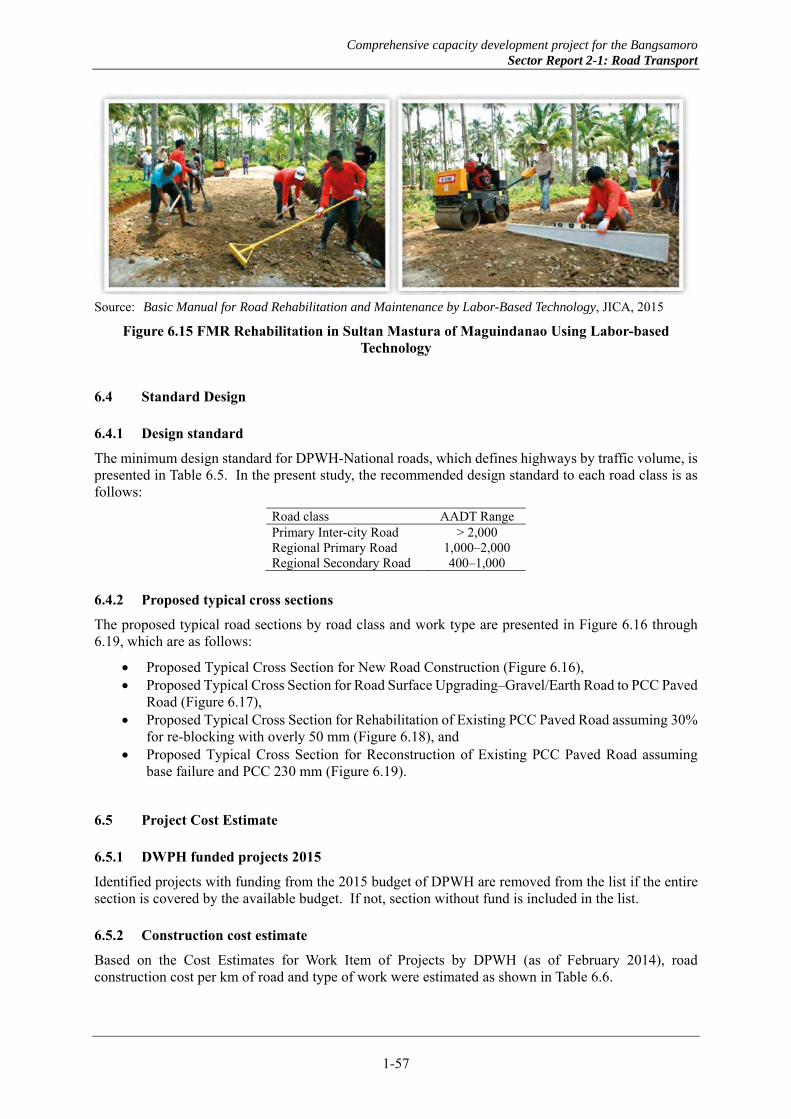
Comprehensive capacity development project for the Bangsamoro Sector Report 2-1: Road Transport
1-57
Source: Basic Manual for Road Rehabilitation and Maintenance by Labor-Based Technology, JICA, 2015
Figure 6.15 FMR Rehabilitation in Sultan Mastura of Maguindanao Using Labor-based Technology
6.4 Standard Design
6.4.1 Design standard
The minimum design standard for DPWH-National roads, which defines highways by traffic volume, is presented in Table 6.5. In the present study, the recommended design standard to each road class is as follows:
Road class AADT RangePrimary Inter-city Road > 2,000 Regional Primary Road 1,000–2,000 Regional Secondary Road 400–1,000
6.4.2 Proposed typical cross sections
The proposed typical road sections by road class and work type are presented in Figure 6.16 through 6.19, which are as follows:
Proposed Typical Cross Section for New Road Construction (Figure 6.16), Proposed Typical Cross Section for Road Surface Upgrading–Gravel/Earth Road to PCC Paved
Road (Figure 6.17), Proposed Typical Cross Section for Rehabilitation of Existing PCC Paved Road assuming 30%
for re-blocking with overly 50 mm (Figure 6.18), and Proposed Typical Cross Section for Reconstruction of Existing PCC Paved Road assuming
base failure and PCC 230 mm (Figure 6.19).
6.5 Project Cost Estimate
6.5.1 DWPH funded projects 2015
Identified projects with funding from the 2015 budget of DPWH are removed from the list if the entire section is covered by the available budget. If not, section without fund is included in the list.
6.5.2 Construction cost estimate
Based on the Cost Estimates for Work Item of Projects by DPWH (as of February 2014), road construction cost per km of road and type of work were estimated as shown in Table 6.6.

Comprehensive capacity development project for the Bangsamoro Sector Report 2-1: Road Transport
1-58
Table 6.5 Minimum Design Standard of Philippine Highways
400–1000 1000–2000 > 2000 Av. daily traffic on opening < 200 200–400 Minimum Desirable Minimum Desirable Minimum DesirableDesign speed (km/h) Flat topography 60 70 70 90 80 95 90 100 Rolling topography 40 50 60 80 60 80 70 90 Mountainous topography 30 40 40 50 50 60 60 70 Radius (m) Flat topography 120 160 160 280 220 320 260 350 Rolling topography 55 85 120 220 120 220 160 280 Mountainous topography 30 50 50 80 80 120 180 160 Grade (%) Flat topography 6.0 6.0 5.0 3.0 4.0 3.0 4.0 3.0 Rolling topography 8.0 7.0 6.0 5.0 5.0 5.0 5.0 4.0 Mountainous topography 10.0 9.0 8.0 6.0 7.0 6.0 1.0 5.0 Pavement width (m) 4.0 5.5; 6.0 6.10 6.70 6.70 7.30 Shoulder width (m) 0.50 1.00 1.50 2.00 2.50 3.00 3.00 Right-of-way width (m) 20 30 30 30 60 Super elevation (m/m) 0.10 (max) 0.10 (max) 0.10 (max) 0.10 (max) Non-passing sight distance (m) Flat topography 70 90 90 135 115 150 135 160 Rolling topography 40 60 70 115 70 115 90 135 Mountainous topography 40 40 40 60 60 70 70 90 Passing sight distance (m) Flat topography 420 490 490 615 560 645 615 675 Rolling topography 270 350 420 560 420 560 490 615 Mountainous topography 190 270 270 350 360 420 420 490 Type of surfacing Gravel, crushed
gravel, or crushed stone bit, preservative treatment, single or double bit, surface treatment, bituminous macadam pavement
Bituminous macadam pavement, dense or open graded plant mix surface course, bitu-minous concrete sur-face course
Bituminous concrete surface course
Bituminous concrete surface course, portland cement concrete pavement
Road Class Proposed Standard for Regional Secondary Road
Proposed Standard for Regional Primary Road
Proposed Standard for Primary Inter-city Road
Source: Design Guidelines, Criteria and Standards, Bureau of Design, DPWH.
6.5.3 Engineering cost
Engineering cost was estimated based on the past experiences as shown below:
Feasibility study (2% of construction cost), Detailed design (4% of construction cost), and Construction supervision (8% of construction cost).
6.5.4 Cost of ROW acquisition and resettlement of affected families
The cost of right-of-way (ROW) acquisition and resettlement of affected families was estimated based on experiences by DPWH-ARMM and DPWH Region XII. The unit price is between PHP 150 and 200 per m2. For planning purposes, the upper bracket is adopted:
Unit price of ROW acquisition and resettlement of affected families: PHP 200 per m2 Width of ROW to be acquired: 30 m
The unit cost per km for ROW acquisition and resettlement of affected families is, therefore, set at PHP 6.0 million per km.
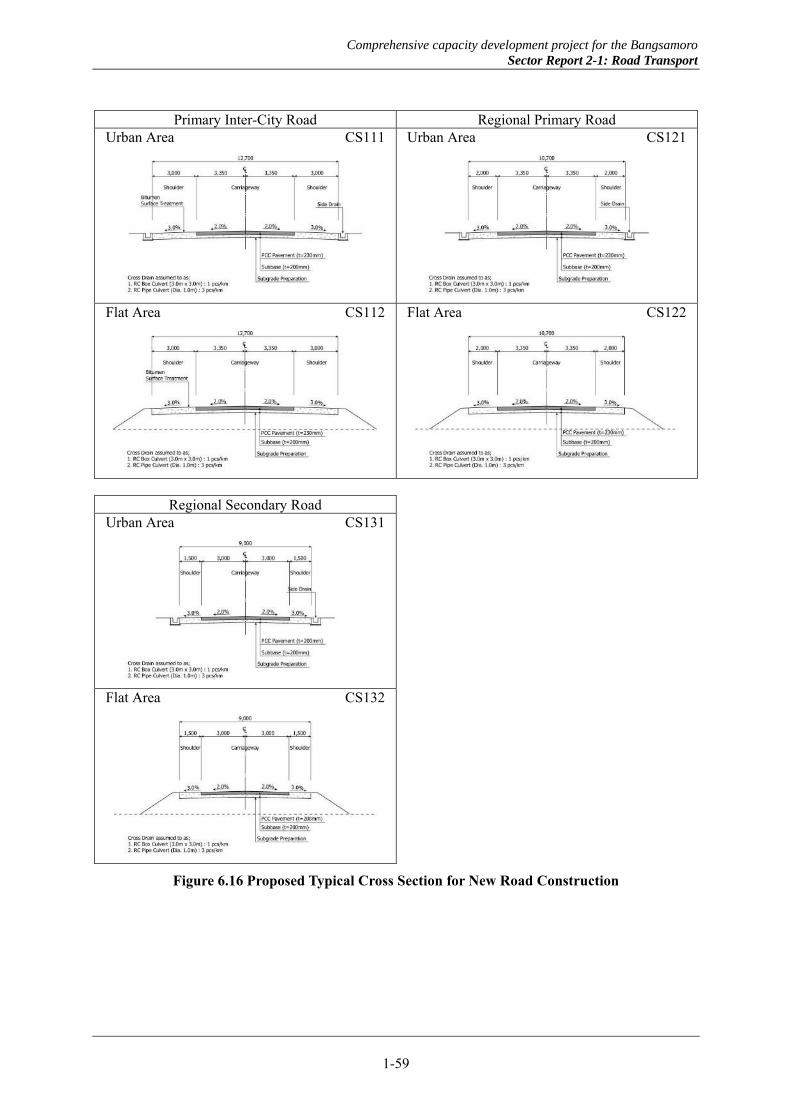
Comprehensive capacity development project for the Bangsamoro Sector Report 2-1: Road Transport
1-59
Primary Inter-City Road Regional Primary Road
Urban Area CS111 Urban Area CS121
Flat Area CS112 Flat Area CS122
Regional Secondary Road
Urban Area CS131
Flat Area CS132
Figure 6.16 Proposed Typical Cross Section for New Road Construction

Comprehensive capacity development project for the Bangsamoro Sector Report 2-1: Road Transport
1-60
Primary Inter-City Road Regional Primary Road
Flat Area CS211 Flat Area CS221
Rolling and Mountainous Area CS212 Rolling and Mountainous Area CS222
Regional Secondary Road
Flat Area CS231
Rolling and Mountainous Area CS232
Figure 6.17 Proposed Typical Cross Section for Road Surface Upgrading (Gravel/Earth Road to PCC Paved Road)
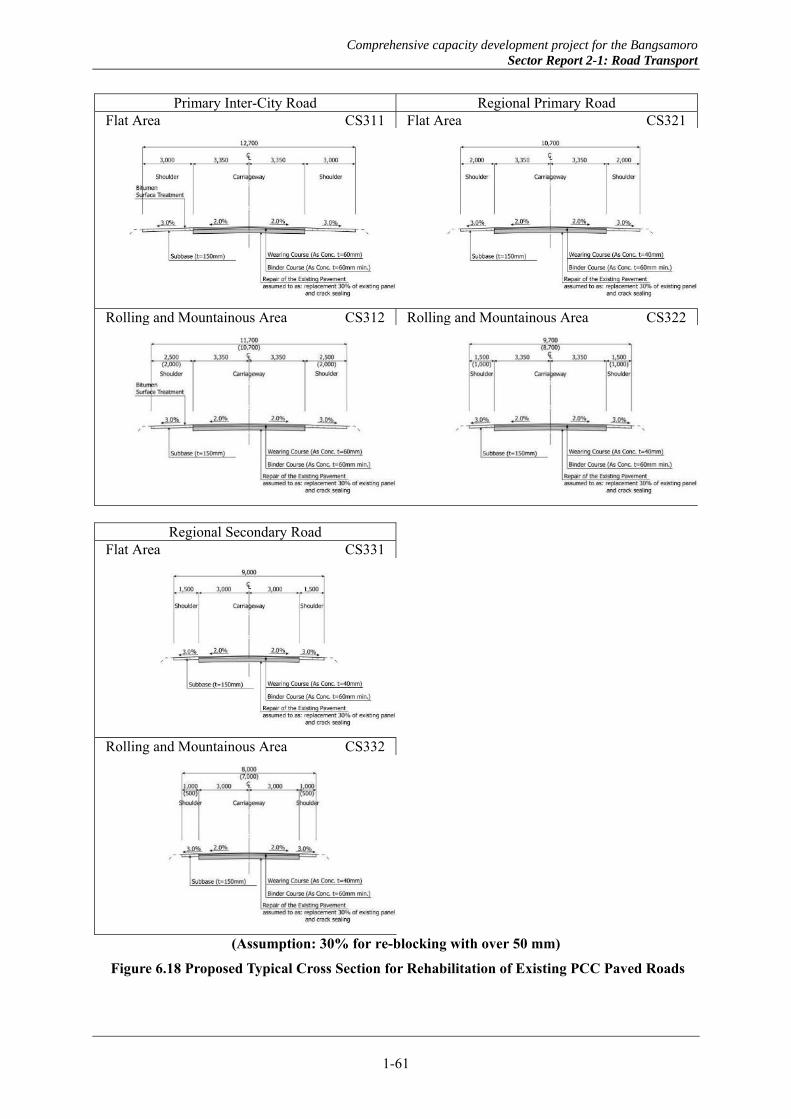
Comprehensive capacity development project for the Bangsamoro Sector Report 2-1: Road Transport
1-61
Primary Inter-City Road Regional Primary Road Flat Area CS311 Flat Area CS321
Rolling and Mountainous Area CS312 Rolling and Mountainous Area CS322
Regional Secondary Road
Flat Area CS331
Rolling and Mountainous Area CS332
(Assumption: 30% for re-blocking with over 50 mm)
Figure 6.18 Proposed Typical Cross Section for Rehabilitation of Existing PCC Paved Roads

Comprehensive capacity development project for the Bangsamoro Sector Report 2-1: Road Transport
1-62
Primary Inter-City Road Regional Primary Road Flat Area CS411 Flat Area CS421
Rolling and Mountainous Area CS412 Rolling and Mountainous Area CS422
Regional Secondary Road
Flat Area CS431
Rolling and Mountainous Area CS432
(Assumption: Base failure and PCC 230mm)
Figure 6.19 Proposed Typical Cross Section for Reconstruction of Existing PCC Paved Roads

Comprehensive capacity development project for the Bangsamoro Sector Report 2-1: Road Transport
1-63
Table 6.6 Road Construction Cost (Unit: PHP 1,000)
Note: Rolling terrain = cost factor of 10%; Mountainous terrain = cost factor of 15%
Source: DPWH's Cost Estimates for Work Item of Projects (as of February 2014).
6.5.5 Estimated cost of identified projects
The estimated cost for identified road projects is about PHP 38.93 billion as indicated in Table 6.7. Projects are classified as follows with their corresponding cost:
a. Cost estimates for Bangsamoro Regional Artery Roads Upgrading Project (Table 6.8), b. Cost estimates for Missing Links Development Project (Table 6.9), c. Cost estimates Bangsamoro Corridor Development Project (Table 6.10), d. Cost estimates for Corridor Link Roads Improvement Project (Table 6.11 through Table 6.14),
and e. Cost estimates for Ring Roads/Bypass Roads Development Project (Table 6.15)
The estimated cost for projects outside of the Bangsamoro is provided in Table 6.16. The estimated cost is about PHP 6.20 billion.
Total 6.00% 6.00% 5.00% 12.00% 2.00% 4.00% 8.00%
Urban 25,750 1,545 1,545 1,288 3,090 33,218 664 1,329 2,657 6,000 10,650 43,868
Flat 25,000 1,500 1,500 1,250 3,000 32,250 645 1,290 2,580 6,000 10,515 42,765
Rolling 27,500 1,650 1,650 1,375 3,300 35,475 710 1,419 2,838 6,000 10,967 46,442
Mt. 28,750 1,725 1,725 1,438 3,450 37,088 742 1,484 2,967 6,000 11,193 48,281
Urban 23,635 1,418 1,418 1,182 2,836 30,489 610 1,220 2,439 6,000 10,269 40,758
Flat 22,946 1,377 1,377 1,147 2,754 29,601 592 1,184 2,368 6,000 10,144 39,745
Rolling 25,241 1,514 1,514 1,262 3,029 32,560 651 1,302 2,605 6,000 10,558 43,118
Mt. 26,388 1,583 1,583 1,319 3,167 34,040 681 1,362 2,723 6,000 10,766 44,806
Urban 19,800 1,188 1,188 990 2,376 25,542 511 1,022 2,043 6,000 9,576 35,118
Flat 19,223 1,153 1,153 961 2,307 24,797 496 992 1,984 6,000 9,472 34,269
Rolling 21,145 1,269 1,269 1,057 2,537 27,277 546 1,091 2,182 6,000 9,819 37,096
Mt. 22,106 1,326 1,326 1,105 2,653 28,516 570 1,141 2,281 6,000 9,992 38,508
Flat 17,500 1,050 1,050 875 2,100 22,575 0 903 1,806 0 2,709 25,284
Rolling 19,250 1,155 1,155 963 2,310 24,833 0 993 1,987 0 2,980 27,813
Mt. 20,125 1,208 1,208 1,006 2,415 25,962 0 1,038 2,077 0 3,115 29,077
Flat 16,062 964 964 803 1,927 20,720 0 829 1,658 0 2,487 23,207
Rolling 17,669 1,060 1,060 883 2,120 22,792 0 912 1,823 0 2,735 25,527
Mt. 18,472 1,108 1,108 924 2,217 23,829 0 953 1,906 0 2,859 26,688
Flat 13,456 807 807 673 1,615 17,358 0 694 1,389 0 2,083 19,441
Rolling 14,802 888 888 740 1,776 19,094 0 764 1,527 0 2,291 21,385
Mt. 15,475 928 928 774 1,857 19,962 0 798 1,597 0 2,395 22,357
Flat 17,200 1,032 1,032 860 2,064 22,188 0 888 1,775 0 2,663 24,851
Rolling 18,920 1,135 1,135 946 2,270 24,406 0 976 1,952 0 2,928 27,334
Mt. 19,780 1,187 1,187 989 2,374 25,517 0 1,021 2,041 0 3,062 28,579
Flat 15,787 947 947 789 1,894 20,364 0 815 1,629 0 2,444 22,808
Rolling 17,366 1,042 1,042 868 2,084 22,402 0 896 1,792 0 2,688 25,090
Mt. 18,155 1,089 1,089 908 2,179 23,420 0 937 1,874 0 2,811 26,231
Flat 13,225 794 794 661 1,587 17,061 0 682 1,365 0 2,047 19,108
Rolling 14,548 873 873 727 1,746 18,767 0 751 1,501 0 2,252 21,019
Mt. 15,209 913 913 760 1,825 19,620 0 785 1,570 0 2,355 21,975
Flat 17,500 1,050 1,050 875 2,100 22,575 452 903 1,806 0 3,161 25,736
Rolling 19,250 1,155 1,155 963 2,310 24,833 497 993 1,987 0 3,477 28,310
Mt. 20,125 1,208 1,208 1,006 2,415 25,962 519 1,038 2,077 0 3,634 29,596
Flat 15,072 904 904 754 1,809 19,443 389 778 1,555 0 2,722 22,165
Rolling 16,579 995 995 829 1,990 21,388 428 856 1,711 0 2,995 24,383
Mt. 17,333 1,040 1,040 867 2,080 22,360 447 894 1,789 0 3,130 25,490
Flat 15,072 904 904 754 1,809 19,443 389 778 1,555 0 2,722 22,165
Rolling 16,579 995 995 829 1,990 21,388 428 856 1,711 0 2,995 24,383
Mt. 17,333 1,040 1,040 867 2,080 22,360 447 894 1,789 0 3,130 25,490
Land Acqui-sition,
Compe-nsation
Sub-TotalF/SCase
RoadClass
Area
Sub-TotalS/V
Cost per Km
Total
PrimaryInter-City
Road
NewConstruction
RegionalPrimaryRoad
RegionalSecondary
Road
Road Surface Upgrading
(Gravel/Earth surface to Concrete surface)
PrimaryInter-City
Road
RegionalPrimaryRoad
RegionalSecondary
Road
RegionalSecondary
Road
Rehabilitation of Existing PCC Paved Road (Assumption:
30% for reblocking with overly 50mm)
PrimaryInter-City
Road
RegionalPrimaryRoad
RegionalSecondary
Road
Engineering Services
Reconstruction of Existing PCC
Paved Road (Assumption
with base failure and PCC 230mm)
PrimaryInter-City
Road
RegionalPrimaryRoad
D/D
Construction Cost
VATDirect Cost
Over-head
Contin-gency
Profit

Comprehensive capacity development project for the Bangsamoro Sector Report 2-1: Road Transport
1-64
Table 6.7 Cost Summary of Identified Projects
Table 6.8 Cost Estimate for Bangsamoro Regional Artery Road Upgrading Projects
Note: RPR=Regional Primary Road; RSR=Regional Secondary Road
(km) (km) (km) (km) (PhP Mil) 2% 4% 8% (PhP Mil) (PhP Mil)
250.2 79.4 93.9 0.0 7.5 6723.4 134.5 268.9 537.9 476.3 8141.0
168.8 136.4 23.8 0.0 8.5 5436.8 108.7 217.5 434.9 818.5 7016.4
267.6 0.0 0.0 0.0 13.7 332.8 0.0 13.3 26.6 0.0 372.8
692.1 93.2 478.3 0.0 120.5 16847.9 337.0 673.9 1347.8 559.3 19765.9
69.9 41.2 19.6 0.0 2.5 2809.4 56.2 112.4 224.8 247.3 3632.2
1448.5 350.2 615.7 0.0 152.7 32150.3 636.3 1286.0 2572.0 2101.4 38928.3
Road Length (Km)
Type of Works
New Const
Road Surface Upgrading
Rehabilitation
Recon-struction
Const Cost
Engineering ServicesLand Acquisition,
CompensationTotal
F/S D/D S/V
e. Ring Roads/Bypass Roads Development Project
Total
Project Type
a. Bangsamoro Regional Artery Roads Upgrading Project
b. Missing Links Development Project
c. Bangsamoro Corridor Development Project
d. Corridor Link Roads Improvement Project
(km) (km) (km) (km) (PhP Mil) 2% 4% 8% (PhP Mil) (PhP Mil)
RA-L1Malundo-Bumbaran-Wao Rd
RPR 69.7 0.0 14.8 0.0 2.4 693.1 13.9 27.7 55.4 0.0 790.1
RA-M1
Parang-Buldon-Barira-Butig-Lumbayanague Rd.
RPR 25.6 17.1 8.5 0.0 0.0 972.0 19.4 38.9 77.8 102.4 1210.5
RA-M2Matanog-Barira-Alamada-Libungan Rd
RPR 21.2 21.2 0.0 0.0 0.0 912.4 18.2 36.5 73.0 127.0 1167.1
RA-M3Pagalungan-Mamasapano-Sharief Aguak Rd
RPR 43.8 17.4 26.4 0.0 0.0 1416.5 28.3 56.7 113.3 104.2 1719.0
RA-T1Biraddali-Parangan Road
RSR 26.0 0.0 22.8 0.0 3.2 1206.0 24.1 48.2 96.5 0.0 1374.9
RA-T2Languyan Coastal Road
RSR 23.8 23.8 0.0 0.0 0.0 916.5 18.3 36.7 73.3 142.8 1187.6
RA-T3 Kamagong Road RSR 5.9 0.0 3.9 0.0 1.9 147.5 2.9 5.9 11.8 0.0 168.1
RA-T4Seratang-Dungon Road
RSR 11.3 0.0 11.3 0.0 0.0 300.2 6.0 12.0 24.0 0.0 342.3
Lapid-Lapid-Batu-Batu Road
RPR 9.3 0.0 6.2 0.0 0.0 159.1 3.2 6.4 12.7 0.0 181.4
Sanga-Sanga-Lapid-Lapid Road
RPR 13.8 0.0 0.0 0.0 0.0 0.0 0.0 0.0 0.0 0.0 0.0
Sub-total 250.2 79.4 93.9 0.0 7.5 6723.4 134.5 268.9 537.9 476.3 8141.0
RA-T5
F/S D/D S/V
Land Acquisition, Compensation
Engineering Services
Project Type CodeRoad Type
Const CostRoad Surface Upgrading
Rehabilitation
New Const
Type of Works
Recon-struction
Road Length (Km)
Total
a. Bangsamoro Regional Artery Roads Upgrading Project
Road Name

Comprehensive capacity development project for the Bangsamoro Sector Report 2-1: Road Transport
1-65
Table 6.9 Cost Estimate for Missing Links Development Projects
Note: ML=Missing link
Table 6.10 Cost Estimate for Bangsamoro Corridor Development Projects
Note: CD-N=Corridor Development (Northern Corridor); CD-C=Corridor Development (Central Corridor); CD-S=Corridor Development (Southern Corridor)
Table 6.11 Cost Estimate for Corridor Link Roads Improvement Projects (1/4): Lanao
Note: CL-L=Corridor link Lanao
(km) (km) (km) (km) (PhP Mil) 2% 4% 8% (PhP Mil) (PhP Mil)
ML-M1Parang-Balabagan Road
RSR 23.6 17.6 0.0 0.0 6.0 809.3 16.2 32.4 64.7 105.5 1028.1
ML-B1Sta. Clara-Tumahubong-Sumisip Road
RSR 38.5 38.5 0.0 0.0 0.0 1482.6 29.7 59.3 118.6 231.0 1921.1
ML-B2Kamanggaan-Tumahubong-Sumisip Road
RSR 20.4 20.4 0.0 0.0 0.0 785.6 15.7 31.4 62.8 122.4 1018.0
ML-T1Dungon-Parangan Road
RSR 42.0 42.0 0.0 0.0 0.0 1617.4 32.3 64.7 129.4 252.0 2095.8
ML-T2Batu-Batu-Dungon Road
RSR 40.8 14.4 23.8 0.0 2.6 610.3 12.2 24.4 48.8 86.3 782.0
ML-T3New Port Access Road
RSR 3.6 3.6 0.0 0.0 0.0 131.7 2.6 5.3 10.5 21.3 171.4
Sub-total 168.8 136.4 23.8 0.0 8.5 5436.8 108.7 217.5 434.9 818.5 7016.4
Total
b. Missing Links Development Project
Road NameRoad Type
Const CostRoad Surface Upgrading
Rehabilitation
New Const
Type of Works
Recon-struction
Road Length (Km)
Project Type Code F/S D/D S/V
Land Acquisition, Compensation
Engineering Services
(km) (km) (km) (km) (PhP Mil) 2% 4% 8% (PhP Mil) (PhP Mil)
CD-NCotabato-Marawi-Iligan-Cagayan de Oro
PICR 157.3 0.0 0.0 0.0 13.3 323.1 0.0 12.9 25.8 0.0 361.8
CD-CCotabato-Kidapawan-Digos-Davao
PICR 31.4 0.0 0.0 0.0 0.3 7.3 0.0 0.3 0.6 0.0 8.2
CD-SCotabato-Koronadal-Gen. Santos
PICR 74.0 0.0 0.0 0.0 0.1 2.4 0.0 0.1 0.2 0.0 2.7
Sub-total 262.7 0.0 0.0 0.0 13.7 332.8 0.0 13.3 26.6 0.0 372.8
F/S D/D S/V
Land Acquisition, Compensation
Engineering Services
Project Type CodeRoad Type
Const CostRoad Surface Upgrading
Rehabilitation
New Const
Type of Works
Recon-struction
Road Length (Km)
Total
c. Bangsamoro Corridor Development Project
Road Name
(km) (km) (km) (km) (PhP Mil) 2% 4% 8% (PhP Mil) (PhP Mil)
CL-L1Marawi-Kapai Road
RSR17.4
0.0 10.8 0.0 6.6 388.0 7.8 15.5 31.0 0.0 442.3
CL-L2 Madalum Road RSR 7.4 0.0 7.4 0.0 0.0 165.4 3.3 6.6 13.2 0.0 188.6
CL-L3Ganassi-Tubud Road
RSR11.4
0.0 3.3 0.0 8.1 252.9 5.1 10.1 20.2 0.0 288.3
CL-L4Malabang-Lumba-Caunayan Road
RSR
27.6
0.0 12.9 0.0 14.7 972.7 19.5 38.9 77.8 0.0 1108.8
Piagapo-Marantao-Balindong Road
RSR
17.4
0.0 2.5 0.0 14.9 385.9 7.7 15.4 30.9 0.0 439.9
Makir-Sibutu Road RSR14.0
0.0 14.0 0.0 0.0 313.0 6.3 12.5 25.0 0.0 356.8
d. Corridor Link Roads
ImprovementProject
CL-L5
F/S D/D S/V
Land Acquisition, Compensation
Engineering Services
Project Type CodeRoad Type
Const CostRoad Surface Upgrading
Rehabilitation
New Const
Type of Works
Recon-struction
Road Length (Km)
TotalRoad Name

Comprehensive capacity development project for the Bangsamoro Sector Report 2-1: Road Transport
1-66
Table 6.12 Cost Estimate for Corridor Links Development Projects (2/4): Maguindanao
Note: CL-M=Corridor link Maguindanao
Table 6.13 Cost Estimate for Corridor Links Development Projects (3/4): Basilan
Note: CL-B=Corridor link Basilan
(km) (km) (km) (km) (PhP Mil) 2% 4% 8% (PhP Mil) (PhP Mil)
Sibutu-Blensong-Nuro Road
RSR14.0
0.0 14.0 0.0 0.0 313.0 6.3 12.5 25.0 0.0 356.8
Nuro-Pinansaran Road
RSR
10.5
10.5 0.0 0.0 0.0 404.7 8.1 16.2 32.4 63.1 524.4
CL-M2Ramongaob-Pandan-Pilar-Itao San Jose Road
RSR
15.6
0.0 15.6 0.0 0.0 347.6 7.0 13.9 27.8 0.0 396.3
Lipongo-Sayap-Ahan Road
RSR18.9
0.0 0.0 0.0 18.9 419.4 8.4 16.8 33.5 0.0 478.1
CL-M3Maganoy-Lebak Road
RSR24.4
12.5 8.8 0.0 3.1 747.2 14.9 29.9 59.8 75.1 926.8
Ganta-Gambar--Libungan Road
RSR12.3
2.5 9.8 0.0 0.0 316.3 6.3 12.7 25.3 15.2 375.8
Tabiran-Ganta Road
RSR16.2
0.0 16.2 0.0 0.0 362.0 7.2 14.5 29.0 0.0 412.6
Ligawasan Road RSR44.5
17.7 26.8 0.0 0.0 1126.6 22.5 45.1 90.1 106.0 1390.3
Alip-Lumoyon Road
RSR7.2
0.0 7.2 0.0 0.0 139.2 2.8 5.6 11.1 0.0 158.7
CL-M6Tamontaka-Tapian Road
RSR13.0
0.0 13.0 0.0 0.0 290.6 5.8 11.6 23.3 0.0 331.3
CL-M7Tapian-Lebak Coastal Road
RSR50.0
50.0 0.0 0.0 0.0 1925.4 38.5 77.0 154.0 300.0 2495.0
d. Corridor Link Roads
ImprovementProject
CL-M5
F/S D/D S/V
Land Acquisition, Compensation
Engineering Services
Project Type CodeRoad Type
Const CostRoad Surface Upgrading
Rehabilitation
New Const
Type of Works
Recon-struction
Road Length (Km)
Total
CL-M4
CL-M1
Road Name
(km) (km) (km) (km) (PhP Mil) 2% 4% 8% (PhP Mil) (PhP Mil)
Sumagdang-Kumalarang Road
RSR
7.9
0.0 4.1 0.0 3.7 175.3 3.5 7.0 14.0 0.0 199.9
Kumalarang-Pangasaan Road
RSR
29.8
0.0 28.3 0.0 1.5 664.8 13.3 26.6 53.2 0.0 757.9
Kumalarang-Lumbang Road
RSR4.7
0.0 4.7 0.0 0.0 105.6 2.1 4.2 8.4 0.0 120.4
Lumbang-Mahayhay Road
RSR
26.8
0.0 24.0 0.0 2.8 598.6 12.0 23.9 47.9 0.0 682.4
CL-B3Baluno-Balas Coastal Road
RSR19.4
0.0 18.4 0.0 1.0 432.4 8.6 17.3 34.6 0.0 492.9
Kulay Bato-Tuburan Proper Road
RSR
18.1
0.0 14.5 0.0 3.6 403.8 8.1 16.2 32.3 0.0 460.4
Lamitan-Tuburan Road
RSR16.3
0.0 0.0 0.0 16.3 361.3 7.2 14.5 28.9 0.0 411.9
Parangbasak-Guinanta Road
RSR12.3
0.0 6.3 0.0 6.0 267.3 5.3 10.7 21.4 0.0 304.7
Tipo-Tipo-Al Barka Circumferential Road
RSR
10.4
0.0 7.6 0.0 2.8 223.9 4.5 9.0 17.9 0.0 255.3
CL-B6Kanas-Baiwas Road
RSR21.3
0.0 21.3 0.0 0.0 475.3 9.5 19.0 38.0 0.0 541.8
d. Corridor Link Roads
ImprovementProject
CL-B4
CL-B1
CL-B2
CL-B5
F/S D/D S/V
Land Acquisition, Compensation
Engineering Services
Project Type CodeRoad Type
Const CostRoad Surface Upgrading
Rehabilitation
New Const
Type of Works
Recon-struction
Road Length (Km)
TotalRoad Name
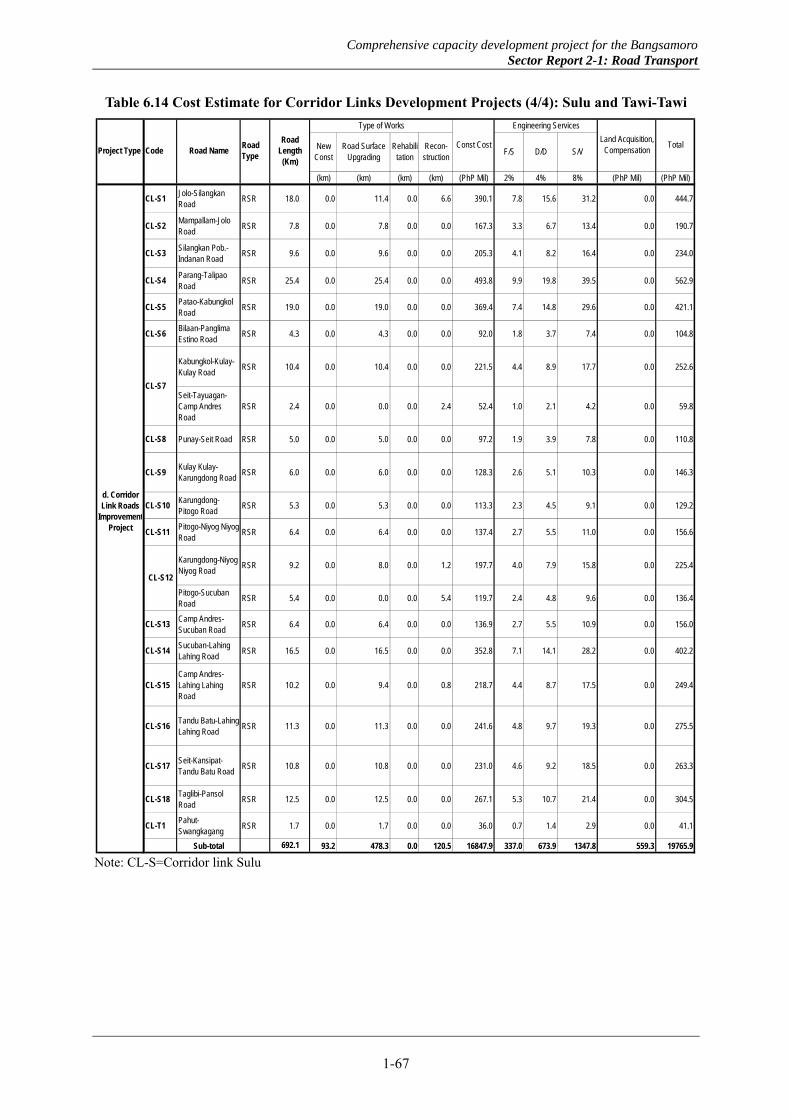
Comprehensive capacity development project for the Bangsamoro Sector Report 2-1: Road Transport
1-67
Table 6.14 Cost Estimate for Corridor Links Development Projects (4/4): Sulu and Tawi-Tawi
Note: CL-S=Corridor link Sulu
(km) (km) (km) (km) (PhP Mil) 2% 4% 8% (PhP Mil) (PhP Mil)
CL-S1Jolo-Silangkan Road
RSR 18.0 0.0 11.4 0.0 6.6 390.1 7.8 15.6 31.2 0.0 444.7
CL-S2Mampallam-Jolo Road
RSR 7.8 0.0 7.8 0.0 0.0 167.3 3.3 6.7 13.4 0.0 190.7
CL-S3Silangkan Pob.-Indanan Road
RSR 9.6 0.0 9.6 0.0 0.0 205.3 4.1 8.2 16.4 0.0 234.0
CL-S4Parang-Talipao Road
RSR 25.4 0.0 25.4 0.0 0.0 493.8 9.9 19.8 39.5 0.0 562.9
CL-S5Patao-Kabungkol Road
RSR 19.0 0.0 19.0 0.0 0.0 369.4 7.4 14.8 29.6 0.0 421.1
CL-S6Bilaan-Panglima Estino Road
RSR 4.3 0.0 4.3 0.0 0.0 92.0 1.8 3.7 7.4 0.0 104.8
Kabungkol-Kulay-Kulay Road
RSR 10.4 0.0 10.4 0.0 0.0 221.5 4.4 8.9 17.7 0.0 252.6
Seit-Tayuagan-Camp Andres Road
RSR 2.4 0.0 0.0 0.0 2.4 52.4 1.0 2.1 4.2 0.0 59.8
CL-S8 Punay-Seit Road RSR 5.0 0.0 5.0 0.0 0.0 97.2 1.9 3.9 7.8 0.0 110.8
CL-S9Kulay Kulay-Karungdong Road
RSR 6.0 0.0 6.0 0.0 0.0 128.3 2.6 5.1 10.3 0.0 146.3
CL-S10Karungdong-Pitogo Road
RSR 5.3 0.0 5.3 0.0 0.0 113.3 2.3 4.5 9.1 0.0 129.2
CL-S11Pitogo-Niyog Niyog Road
RSR 6.4 0.0 6.4 0.0 0.0 137.4 2.7 5.5 11.0 0.0 156.6
Karungdong-Niyog Niyog Road
RSR 9.2 0.0 8.0 0.0 1.2 197.7 4.0 7.9 15.8 0.0 225.4
Pitogo-Sucuban Road
RSR 5.4 0.0 0.0 0.0 5.4 119.7 2.4 4.8 9.6 0.0 136.4
CL-S13Camp Andres-Sucuban Road
RSR 6.4 0.0 6.4 0.0 0.0 136.9 2.7 5.5 10.9 0.0 156.0
CL-S14Sucuban-Lahing Lahing Road
RSR 16.5 0.0 16.5 0.0 0.0 352.8 7.1 14.1 28.2 0.0 402.2
CL-S15Camp Andres-Lahing Lahing Road
RSR 10.2 0.0 9.4 0.0 0.8 218.7 4.4 8.7 17.5 0.0 249.4
CL-S16Tandu Batu-Lahing Lahing Road
RSR 11.3 0.0 11.3 0.0 0.0 241.6 4.8 9.7 19.3 0.0 275.5
CL-S17Seit-Kansipat-Tandu Batu Road
RSR 10.8 0.0 10.8 0.0 0.0 231.0 4.6 9.2 18.5 0.0 263.3
CL-S18Taglibi-Pansol Road
RSR 12.5 0.0 12.5 0.0 0.0 267.1 5.3 10.7 21.4 0.0 304.5
CL-T1Pahut-Swangkagang
RSR 1.7 0.0 1.7 0.0 0.0 36.0 0.7 1.4 2.9 0.0 41.1
Sub-total 692.1 93.2 478.3 0.0 120.5 16847.9 337.0 673.9 1347.8 559.3 19765.9
d. Corridor Link Roads
ImprovementProject
CL-S12
CL-S7
F/S D/D S/V
Land Acquisition, Compensation
Engineering Services
Project Type CodeRoad Type
Const CostRoad Surface Upgrading
Rehabilitation
New Const
Type of Works
Recon-struction
Road Length (Km)
TotalRoad Name

Comprehensive capacity development project for the Bangsamoro Sector Report 2-1: Road Transport
1-68
Table 6.15 Cost Estimate for Ring Road/Bypass Development Projects
Note: BR=Bypass Road
Table 6.16 Cost Estimate for Road Projects outside Bangsamoro
6.5.6 Project cost summary
As presented in Table 6.17, the estimated cost of the projects identified in the plan is about PHP 66.36 billion. Cost per project type is indicated in the table below. The total cost of projects inside the Bangsamoro is about PHP 52.62 billion and of those outside the Bangsamoro (road projects that terminate in the neighboring regions) is about PHP 6.22 billion. The cost estimate on FMRs that branch out from the trunk road is about PHP 13.69 billion.
Table 6.17 Road Projects Cost Summary
Cost (PHP million) Project Inside Bangsamoro Outside Bangsamoro*Artery roads upgrading project 8,141.0 Missing links development project 7,016.4 Corridor development project 372.8 Corridor link improvment project 19,765.9 6,003.9 Ring roads/bypass roads development project 3,632.2 201.0 FMRs 13,683.73†
Total 52,612.03 6,205.8 Grand Total (Inside + Outside Bangsamoro) 66,357.81
*Continuation of project roads originating in Bangsamoro and beyond the Bangsamoro boundary. †If construction engineering services are undertaken separately, estimated cost for the 884 km FMRs is about PHP 1.92 billion, bringing the total cost from PHP 13.683 billion to PHP 15.60 billion. Consequently, the grand total will be PHP 68.27 billion.
(km) (km) (km) (km) (PhP Mil) 2% 4% 8% (PhP Mil) (PhP Mil)
BR-L1Marawi City Ring Road
RSR 16.7 9.7 6.9 0.0 0.0 522.6 10.5 20.9 41.8 58.4 836.3
BR-M1Parang East Diversion Road
RSR 11.3 11.3 0.0 0.0 0.0 434.8 8.7 17.4 34.8 67.7 563.4
BR-M2Parang Bypass Road (small)
RSR 2.5 2.5 0.0 0.0 0.0 94.5 1.9 3.8 7.6 14.7 122.5
BR-M3Pinaring-Simsiman Road
RSR 20.1 0.0 17.6 0.0 2.5 431.8 8.6 17.3 34.5 0.0 492.2
BR-M4Manuangan-Parang Road
RSR 17.0 17.0 0.0 0.0 0.0 631.2 12.6 25.2 50.5 102.1 821.6
BR-B1Isabel City Bypass Road
RSR 2.4 0.7 1.7 0.0 0.0 835.7 16.7 33.4 66.9 4.4 957.1
Sub-total 69.9 41.2 26.2 0.0 2.5 2950.5 59.0 118.0 236.0 247.3 3793.1
F/S D/D S/V
Land Acquisition, Compensation
Engineering Services
Project Type CodeRoad Type
Const CostRoad Surface Upgrading
Rehabilitation
New Const
Type of Works
Recon-struction
Road Length (Km)
Total
e. Ring Roads/Bypass Roads Development Project
Road Name
(km) (km) (km) (km) (PhP Million) 2.00% 4.00% 8.00% (PhP Million)
CL-L2 Madalum Road 38.1 14.3 23.8 0.0 0.0 548.7 11.0 21.9 43.9 85.5 711.1CL-L3 Ganassi-Tubud Road 40.2 15.9 0.0 0.0 0.0 612.7 12.3 24.5 49.0 95.5 793.9CL-M3 Maganoy-Lebak Road 46.3 46.3 0.0 0.0 0.0 1782.2 35.6 71.3 142.6 277.7 2309.4
Alip-Lumoyon Road 40.2 40.2 0.0 0.0 0.0 1547.3 30.9 61.9 123.8 241.1 2005.0
CL-M7 Tapian-Lebak Coastal Road 3.7 3.7 0.0 0.0 0.0 142.5 2.8 5.7 11.4 22.2 184.6Sub-total 168.4 120.3 23.8 0.0 0.0 4633.3 92.7 185.3 370.7 721.9 6003.9
BR-M3 Pinaring-Simsiman Road 9.1 0.0 9.1 0.0 0.0 177.1 3.5 7.1 14.2 0.0 201.9Sub-total 9.1 0.0 9.1 0.0 0.0 177.1 3.5 7.1 14.2 0.0 201.9
GRAND TOTAL 177.6 120.3 32.9 0.0 0.0 4810.4 96.2 192.4 384.8 721.9 6205.8
Sub-Total
Construction CostRoad Surface
Upgrading Rehabilit
ationReconstru
ctionF/S D/D
New Const
Type of Works Engineering Services
e. Ring Roads/Bypass
d. Corridor Link Roads Improvement Project
CL-M5
Land Acquisition,
CompensationProject Type Code Road Name
Road Length (Km)
S/V

Comprehensive capacity development project for the Bangsamoro Sector Report 2-2: Port Development
Comprehensive Capacity Development Project for the Bangsamoro
Development Plan for the Bangsamoro
Final Report
Sector Report 2-2: Port Development

Comprehensive capacity development project for the Bangsamoro Sector Report 2-2: Port Development

Comprehensive capacity development project for the Bangsamoro Sector Report 2-2: Port Development
2-i
Table of Contents
Chapter 1 Port System and Water Traffic ......................................................................................... 2-1 1.1 Philippine Port Development Strategy .................................................................................. 2-1 1.2 Existing Ports Network in Mindanao .................................................................................... 2-1 1.3 Cargo, Passenger Traffic and Ship Calls of Major Ports in Mindanao ................................. 2-1
Chapter 2 Existing Ports Network in Bangsamoro ........................................................................... 2-5 2.1 Overview ............................................................................................................................... 2-5 2.2 Cargo, Passenger Traffic and Ship Calls at Major Ports in Bangsamoro .............................. 2-5 2.3 Characteristics of Major Ports in Bangsamoro ..................................................................... 2-7 2.4 Other Small Ports in Bangsamoro ......................................................................................... 2-8 2.5 Existing Port Facilities of Each Port ..................................................................................... 2-8
2.5.1 Polloc port ........................................................................................................................ 2-8 2.5.2 Bongao, Jolo, Sitangkai, and Isabela ports .................................................................... 2-13
Appendix A: Historical Data on Cargo and Passenger Traffic at Existing Polloc Port .................. 2-17
Chapter 3 Demand Forecast for Bangsamoro Ports ....................................................................... 2-18 3.1 Historical Growth of Traffic at Polloc Port ......................................................................... 2-18 3.2 Projected Cargo Traffic for Bangsamoro ............................................................................ 2-18 3.3 Cargo Traffic Shares of Island Provinces Ports .................................................................. 2-19 3.4 Cargo Traffic Projection for Polloc Port ............................................................................. 2-19 3.5 Share of Polloc Port in Total Cargo Traffic of Bangsamoro ............................................... 2-19 3.6 Growth of Cargo Traffic ..................................................................................................... 2-19 3.7 Future Passenger Traffic ..................................................................................................... 2-20 Appendix B: Detailed Projections of Polloc Port Cargo Traffic ..................................................... 2-22
Chapter 4 Proposal of Priority Projects .......................................................................................... 2-23 4.1 Cargo and Passenger Traffic of Bangsamoro Ports ............................................................. 2-23 4.2 Polloc Port ........................................................................................................................... 2-23
4.2.1 Overview ........................................................................................................................ 2-23 4.2.2 Existing system of the port operation ............................................................................ 2-23 4.2.3 Cargo handling capacity of representative ports in Mindanao and Manila ports .......... 2-24 4.2.4 Present conditions for new development for Polloc port ............................................... 2-25 4.2.5 Proposed port development ........................................................................................... 2-27 4.2.6 Urgent improvement plan .............................................................................................. 2-30 4.2.7 Institution of Polloc port ................................................................................................ 2-31 4.2.8 Necessity of cargo and passenger traffic between Polloc and BaSulTa ......................... 2-31 4.2.9 Development plan of new Cotabato port ....................................................................... 2-31
4.3 Bongao Port ........................................................................................................................ 2-32 4.3.1 Present conditions of Bongao port ................................................................................. 2-32 4.3.2 Urgent expansion of the port .......................................................................................... 2-32 4.3.3 Cargo and passenger forecast ......................................................................................... 2-33 4.3.4 Proposed port development ........................................................................................... 2-34
4.4 Jolo Port .............................................................................................................................. 2-36 4.4.1 Present condition of Jolo port ........................................................................................ 2-36 4.4.2 Cargo and passenger forecast ......................................................................................... 2-37 4.4.3 Proposed port development ........................................................................................... 2-37 4.4.4 Rough cost estimate ....................................................................................................... 2-39
4.5 Isabela Port ......................................................................................................................... 2-39 4.5.1 Present conditions of Isabela port .................................................................................. 2-40 4.5.2 Cargo and passenger forecast ......................................................................................... 2-41 4.5.3 Proposed port development ........................................................................................... 2-41 4.5.4 PPA expansion plan and land acquisition by Provincial Government ........................... 2-41

Comprehensive capacity development project for the Bangsamoro Sector Report 2-2: Port Development
2-ii
List of Tables
Table 1.1 Philippine Port System Strategy ........................................................................................... 2-2 Table 2.1 Summery of Characteristics of Ports in Bangsamoro ........................................................... 2-7 Table 2.2 General Layout of Bongao, Jolo, Sitangkai, and Isabela Ports ........................................... 2-13 Table 2.3 Results of Cargo and Passenger Traffic and Shipcall Forecast for Bongao, Jolo, Sitangkai,
and Isabela Ports ............................................................................................................ 2-14 Table 2.4 Proposed Development According to FS ............................................................................ 2-15 Table 3.1 Growth Rate of Traffic at Polloc Port ................................................................................. 2-18 Table 3.2 Projected Cargo Traffic Volume for Mindanao and Bangsamoro ....................................... 2-18 Table 3.3 Bangsamoro Port Traffic and Island Provinces Ports Traffic ............................................. 2-19 Table 3.4 Projecting Current Cargo Traffic at Polloc Port ................................................................. 2-19 Table 3.5 Cargo Traffic Volume at Ports in Bangsamoro and Their Shares, 2013 ............................. 2-19 Table 3.6 Share of Ports in Total Bangsamoro Cargo Traffic for 2013, 2019, 2022, and 2030 ......... 2-20 Table 3.7 Projected Growth in Cargo Traffic at Ports in Bangsamoro for 2013–2030 ...................... 2-20 Table 3.8 Cargo Volume at Ports in Bangsamoro for 2013, 2019, 2022, and 2030 ............................ 2-20 Table 3.9 Existing Data and Projections on Passenger Traffic ........................................................... 2-21 Table 4.1 Future Port Traffic at Ports in Bangsamoro (2015–2030) .................................................. 2-23 Table 4.2 Tons per Lineal Meter of Berth in Mindanao and Manila .................................................. 2-25 Table 4.3 Latest Data on Cargo Volume at Polloc Port (2013–2015) ................................................. 2-26 Table 4.4 Relation of Water Depth and Berth Length ........................................................................ 2-27 Table 4.5 Cargo Forecast for Polloc Port in 2019, 2022, and 2030 .................................................... 2-27 Table 4.6 Required Berth Length for General Cargo at Polloc Port in 2019, 2022, and 2030 ........... 2-27 Table 4.7 Required Berth Length for Container Cargo in 2019, 2022, and 2030 ............................... 2-27 Table 4.8 Required Berth Length for General and Container Cargo in 2019, 2022, and 2030 .......... 2-27 Table 4.9 Completion of Port Facilities at Polloc Port by 2022 and 2030 ......................................... 2-29 Table 4.10 Estimated Polloc Port Construction Costs for 2022 and 2030 .......................................... 2-30 Table 4.11 Estimated Cost of Fenders and Bollards Replacement ..................................................... 2-30 Table 4.12 Rough Cost Estimate for Urgent Expansion of Bongao Port ........................................... 2-33 Table 4.13 Cargo Forecast for Bongao Port in 2019, 2022, and 2030 ............................................... 2-33 Table 4.14 Required Berth Length at Bongao Port in 2019, 2022, and 2030 ..................................... 2-34 Table 4.15 Completion of Port Facilities at Bongao Port by 2022 and 2030 ..................................... 2-35 Table 4.16 Estimated Bongo Port Construction Costs for 2022 and 2030 ......................................... 2-36 Table 4.17 Cargo Forecast for Jolo Port Based on FS in Southern Mindanao ................................... 2-37 Table 4.18 Cargo Forecast for Jolo Port in 2019, 2022, and 2030 ..................................................... 2-37 Table 4.19 Estimated Cargo Volume by Vessel Type at Jolo Port in 2019, 2022, and 2030 .............. 2-37 Table 4.20 Required Number of Berths at Jolo Port in 2019, 2022, and 2030 ................................... 2-38 Table 4.21 Rough Cost Estimates of Jolo Port Development for 2030 .............................................. 2-39 Table 4.22 Cargo Volume and Passenger Traffic at Isabela Port (1980–1997) .................................. 2-40 Table 4.23 Cargo Forecast for Isabela Port in 2019, 2022, and 2030 ................................................. 2-41

Comprehensive capacity development project for the Bangsamoro Sector Report 2-2: Port Development
2-iii
List of Figures
Figure 1.1 Existing Ports in Mindanao ................................................................................................. 2-3 Figure 1.2 Cargo Throughput for Davao, Cagayan de Oro, General Santos, and Zamboanga ............ 2-3 Figure 1.3 Passenger Traffic for Davao, Cagayan de Oro, General Santos, and Zamboanga .............. 2-3 Figure 1.4 Ship Calls for Davao, Cagayan de Oro, General Santos, and Zamboanga ......................... 2-4 Figure 2.1 Existing Ports in Bangsamoro ............................................................................................. 2-5 Figure 2.2 Cargo Throughput for Major Ports in Bangsamoro ............................................................ 2-6 Figure 2.3 Passenger Traffic for Major Port in Bangsamoro ............................................................... 2-6 Figure 2.4 Ship Calls for Major Port in Bangsamoro ........................................................................... 2-6 Figure 2.5 Process of Concrete Deterioration .................................................................................... 2-11 Figure 2.6 General Layout Plan of Existing Polloc Port .................................................................... 2-13 Figure 2.7 Master Plan of New Isabela Port ....................................................................................... 2-15 Figure 2.8 Master Plan of Jolo Port .................................................................................................... 2-16 Figure 4.1 Schematic Drawing of Oil Handling and Deposit at Polloc Port ...................................... 2-25 Figure 4.2 Polloc Port Development Plan by 2022 ............................................................................ 2-29 Figure 4.3 Polloc Port Development Plan by 2030 ............................................................................ 2-29 Figure 4.4 Existing Organization of Polloc Port (REZA) .................................................................. 2-31 Figure 4.5 Cargo and Passenger Traffic between Polloc and BaSulTa .............................................. 2-32 Figure 4.6 General Plan of Urgent Expansion of Bongao Port .......................................................... 2-33 Figure 4.7 General Layout Plan of New Bongao Port for Year 2022 and 2030 ................................. 2-35 Figure 4.8 General Layout Plan of Jolo Port for 2019 and 2030 ........................................................ 2-39 Figure 4.9 General Layout Plan of Isabela Port ................................................................................. 2-41 Figure 4.10 General Plan of New Isabela Port ................................................................................... 2-42 Figure 4.11 Location Map of Proposed New Port .............................................................................. 2-42

Comprehensive capacity development project for the Bangsamoro Sector Report 2-2: Port Development
2-iv
Abbreviations, Unit of Measurement, and Currency
(Refer to Sector Report 2-1: Road Transport, pp. 1-v through 1-x.)

Comprehensive capacity development project for the Bangsamoro Sector Report 2-2: Port Development
2-1
CHAPTER 1 PORT SYSTEM AND WATER TRAFFIC
1.1 Philippine Port Development Strategy
The Philippine Development Plan (PDP) 2011–16 was formulated by the National Economic Development Authority (NEDA) through coordination and collaboration with all the related organizations. They include all departments/agencies of the National Government, government-owned and controlled corporations (GOCC’s), government financial institutions, and State Universities and Colleges (SUCs) in identifying and prioritizing key programs and projects.
As one of the specific outputs in the PDP, the Study on the Master Plan for the Strategic Development of the National Port System in the Republic of the Philippines was conducted by Department of Transportation and Communications (DOTC) supported by JICA in January 2004. The Philippine Port System Strategy was drawn up in the study as shown in Table 3.1. Strategic ports in Mindanao covering Davao, Cagayan de Oro, Zamboanga, and General Santos have been selected as the international ports out of nine ports in the Philippines to be a major window to the global market that will be developed until 2024. This means that Mindanao is considered very important in the sea transportation network especially for transportation of agricultural and marine products.
The Philippines port system strategy is summarized in Table 1.1.
1.2 Existing Ports Network in Mindanao
The existing ports network in Mindanao is shown in Figure 1.1. The ports are classified as follows:
1) Base ports, mainly the major ports operated by PPA, 2) Terminal ports with less activities operated by PPA, 3) Secondary ports, 4) Private ports, and 5) Fishing ports.
Administratively, PPA is mandated to develop commercial ports all over the Philippines as well to regulate private ports and control port tariffs. Other small municipal ports are operated by LGU’s.
1.3 Cargo, Passenger Traffic and Ship Calls of Major Ports in Mindanao
There are four major ports around the Bangsamoro region: Davao, General Santos, Zamboanga, and Cagayan de Oro. Figures 1.2, 1.3, and 1.4 show the historical change in cargo throughput, passenger traffic, and ship calls for the four major ports, respectively.
The average annual growth rate (AAGR) of cargo throughput of the Davao port is 5.7%, which is the most remarkable compared to 2.1% to 5.0% for the other major ports as shown in Figure 1.2.
The AAGR for passenger traffic of Zamboanga port decrease by 3.9%. The AAGR for Cagayan de Oro, General Santos and Davao are -1.8%, -14.4% and -18.5% respectively as shown in Figure 1.3. The decrease in the number of passengers is due to the conversion from sea to air transportation by low cost carriers (LCC).
Number of ship calls in Zamboanga decreased drastically while cargo throughput slightly increased. This means that ship size calling at the Zamboanga port has become larger progressively. For the other three ports, number of ship calls still maintain the similar levels, but cargo throughput increased as ship size calling at these ports is also increasing. These tendencies are common in the Philippines and worldwide as well.

Comprehensive capacity development project for the Bangsamoro Sector Report 2-2: Port Development
2-2
Table 1.1 Philippine Port System Strategy
Mission 1. Establishment of a fast, economical, reliable and safe maritime transport network accelerating the development of national economy 2. Formation of maritime transport bases to support regional society
Planning Strategies
Establishment of a nationwide port development plan coordinated with the plans of various port management public corporations Port classification
Principles for planning 1) Establishment of nationwide maritime transport
1) Concentrated Development of Specific International Container Gateway Bases 2) Improvement of Domestic Container Transport Efficiency 3) Development of Facilities for Break Bulk and Bulk Cargo 4) Port Planning at the Greater Capital Region 5) Formation of Major Corridors
2) Formation of maritime transport bases to support regional society
1) Enhancing the Mobility of People and Goods in the Region 2) Securing Transportation Bases to Support Daily Life in Remote Islands 3) Supporting Social Reforms
Strategic development port
Investment in long term development plan (2004–2024); about 150 billion pesos Investment in short term development plan (2004–2009); about 41 billion pesos
Management and Operation
Modification of port administration as well as improvement of port management/operation - Establishment of National Plan for Port Development (NPPD) Council - Increasing cargo handling efficiency - Appropriate port tariff setting
Investment and Financing
Investment scheme and proper financial resource allocation for feasible port development - Proposed financial policies for public port development - Acceleration of private sector participation to port projects
Source: The Study on the Master Plan for the Strategic Development of the National Port System in the Republic of the Philippines.
LEGEND
International Gateway Port Principal International Trade Port 2 Lane Nat’l Roads 4 Lane Nat’l Roads
General Santos
CDO/MCT
CebuIloilo
Batangas
Manila
Davao
Zamboanga
Subic

Comprehensive capacity development project for the Bangsamoro Sector Report 2-2: Port Development
2-3
Figure 1.1 Existing Ports in Mindanao
Figure 1.2 Cargo Throughput for Davao, Cagayan de Oro, General Santos, and Zamboanga
Figure 1.3 Passenger Traffic for Davao, Cagayan de Oro, General Santos, and Zamboanga

Comprehensive capacity development project for the Bangsamoro Sector Report 2-2: Port Development
2-4
Figure 1.4 Ship Calls for Davao, Cagayan de Oro, General Santos, and Zamboanga

Comprehensive capacity development project for the Bangsamoro Sector Report 2-2: Port Development
2-5
CHAPTER 2 EXISTING PORTS NETWORK IN BANGSAMORO
2.1 Overview
The port network in the Bangsamoro includes 13 major ports under the Regional Economic Zone Authority (REZA), 11 Regional Ports Management Authority (RPMA) and the Philippine Ports Authority (PPA) as shown Figure 2.1 (Final Report; Survey on Mindanao Logistics Infrastructure Network, Volume 1 Main Report, January 2014, Applied Planning and Infrastructure, Inc.).
Figure 2.1 Existing Ports in Bangsamoro
2.2 Cargo, Passenger Traffic and Ship Calls at Major Ports in Bangsamoro
The historical change of cargo throughput, passenger traffic and ship calls for the major ports are shown in Figures 2.2 through 2.4. Cargo throughput for Isabela and Cotabato gradually decreased from 2004 to 2013, but that of Bongao and Lamitan increased as indicated Figure 2.2. The largest cargo handling volume in 2013 in the Bangsamoro is at the Polloc port. There are no data available for the Polloc port from 2006 to 2012, but the data from 1995 to 2003 are available as attached in Appendix A. According to this record, the maximum cargo throughput of the Polloc port was 742,923 ton in 1992.
The passenger traffic volume has not basically changed, except Isabela and Lamitan, as shown Figure 2.3. Considering the population of Basilan is around 300,000, passenger traffic of 1.2 million is quite large. This reflects active economic transactions between Isabela and Zamboanga as well as students commuting from Basilan to Zamboanga.
The number of ship calls in Isabela decreased once but drastically increased in 2010 as shown in Figure 2.4. Ship calls for the other ports gradually decreased or unchanged, the cargo volume of the other ports also unchanged. This implies that economic activities around these ports were stagnant during

Comprehensive capacity development project for the Bangsamoro Sector Report 2-2: Port Development
2-6
this period. Cargo throughput of Bongao rapidly increased more than the number of ship calls, implying the ship size has become larger recently.
Figure 2.2 Cargo Throughput for Major Ports in Bangsamoro
Figure 2.3 Passenger Traffic for Major Port in Bangsamoro
Figure 2.4 Ship Calls for Major Port in Bangsamoro

Comprehensive capacity development project for the Bangsamoro Sector Report 2-2: Port Development
2-7
2.3 Characteristics of Major Ports in Bangsamoro
Basic data and information collected for the ports in the Bangsamoro region are summarized in Table 2.1. All major ports are managed by REZA, RPMA, and PPA except small ports managed by LGUs. The Polloc port has the largest volume handled among the ports in Bangsamoro, about 300,000 ton per annum followed by Bongao and Isabela. Isabela has the largest volume of passenger traffic and the main origin and destination are Zamboanga, followed by Jolo and Bongao. The Polloc port has the most modern and developed port facilities among all ports including berth, apron, backup area building facilities, port access, etc. There are designated Freeport and Ecozone located behind the port.
All the ports are operated by private operators including cargo handlers. Privatization of operations and management of the port facilities has been promoted in the world even for small ports in order to establish a more efficient operation and keep competitive power among other ports. Advantages of privatization include efficiency of the system operation, responding to demand promptly and in an innovative manner under the absolute criterion of profit making.
There are feasibility studies (FSs) for the Polloc, Bongao, Jolo, Sitangkai, and Isabela ports development. These ports are considered of high potential to be developed by PPA, ADB, and ARMM. These FSs will be discussed later. According to the available information, cargoes handled at these ports are copra, banana, rice, sugar, flour of agricultural product, fresh/dried fish, shell and seaweeds of marine product, general cargo, bottled cargo of consumable materials and cement, plywood, log, and equipment of construction materials.
Table 2.1 Summery of Characteristics of Ports in Bangsamoro
Name ofPort
Body/Owner
Cargothroughput
PassengerTraffic
Ship callBerthing FacilityLength and depth
Other facilityBackup
areaBuildingFacility
OperatorOperatingShippingCompany
Main Commodity
Polloc REZA296,354t in
20130 181 in 2013
Marginal wharf 400m (-10.5m), Lighter dock
67m(-3m)
Anchorage, area forprivate warehouse75,645m2, parking
area 23,364m2
Openstorage
area42,940m2
Transit shed 2x5,980m2, PTB600 persons,
Amenity Bldg.760m2, Barter
trade bldg.900m2
Lamsan (PTC)till 2022
Lorenzo shippingcorp., Philippine
Span AsiaCarrier Corp
OUT: Corn 95,289t, Riversand 63,076t, Plywood 5,622t,Rolling cargo 2,142t, IN: Iron
steel 52,243t, Corn 44,832t,Rice 16,578t
Bongao RPMA125,331t in
2013223,522 in
2013392 in 2012
Main wharf 139x9m(-6to 7m), RORO 24x9m(-8m), Fast craft 21x9m(-
4.5 to 5m)
Causeway20x10m,Channel 680m(-15.3
to 18m), B.Dolphin2set
None MPTB35x12m 3K CorporationAleson Shipping
Lines, EverShipping Lines
OUT: Seaweeds, Copra, Livefish/Octopus, Dried fish, Seashells
Jolo RPMA157,027t in
2013459,826 in
20131,746 in
2013Total berth length 585m
Coast buard, BFAR,SULU Barter
Trade, Ice plant1.0ha
ADM, PTB,Ticketing office,
Gate house
Piyagsulutan,INC.
Katrafar shippinglines, Alesonshipping lines,
EbenezerShipping Lines
IN: Cement, Salt, Flour, Sugar,Fresh eggs, Dress chicken,
Lard/Margarine OUT: Copra,Seaweeds, Abaca, Charcoal,
Dried fish, Fresh fish
Siasi RPMA276 May 9to31, 2013
4,064 May 9to31, 2013
20 May 9to31, 2013
Main wharf 65m, RoRoramp 15x10m
Gate house NoneTerminal
Managementoffice
SIASI Arrastreand Stevedoring
Services
MagnoliaShipping Lines,Ever Shipping
Lines
IN: Cement, Flour, SugarOUT: Copra, Dried fish
Sitangkai RPMA10,526t in
201326,466 in 2013 150 in 2013
Main wharf 60m (3.02mdepth), Maneuvering
area (6.03m)Rock causeway 60mx36m
TerminalManagementoffice, CHOoffice, PCGDetachment,Warehouse
AnakmoslemMulti-PurposeCooperative
Aleson ShippingLines
OUT: Seaweeds, Copra, Driedfish, Sea shells
Isabela PPA106,195t in
20131,203,187 in
20133,745 in
2013
209x9m(-5m) in 2000,Extension to 300m in
2014
Seawall 275, Rockbulkhead 235m
Openstorage
area1,242m2
Passengerterminal 91m2,
Temporarystorage 12m2,ADM 80m2
BasilanDockhandlers
Corp.
Aleson ShippingLines
Out; Copra, General cargo, In;Bottled cargo, Petroleumproduct, Palay/Rice, Cement
Lamitan RPMA39,965t in
2013255,908 in
2013740 in 2013 Total berth length 82m Causeway 50m None
Passengerterminal bldg.
LamitanDockholder,
INC.
Out: Copra, rubber, fish,bananaIn: rice, sugar, fish, equipment
Mapun RPMA8,664t in
20134,857 in 2013 246 in 2013
Pier (30m x 11.5m)Piles for 30m extensionare installed at site
None None NoneTripler Muti-
PurposeCooperative
Charter only OUT: Copra, Dried fish
y p g g

Comprehensive capacity development project for the Bangsamoro Sector Report 2-2: Port Development
2-8
2.4 Other Small Ports in Bangsamoro
In addition to the major ports in Bangsamoro, there are small ports under LGUs according to the information from RPMA as listed below. There are no available data and information such as cargo volume, passenger traffic, size of port facility, ancillary facilities, etc. for the region.
A. Sulu a. Banguingui, Municipality of Tongkil b. Pata, Municipality of Pata c. Maimbung, Municipality of Maimbung d. Poblacion, Poblacion Parang, Parang e. Tando Bato Port, Tando Bato, lunk f. Pangutaran g. Panamao Port, Brgy. Su’uh
B. Tawi-Tawi a. Port in Balimbing, Panglima Sugala b. Port in Sapa-sapa, Poblacion c. Chinese Pier, Municipality of Bongao d. Ubol Simunul e. Tubig Indangan f. Nusa Simunul g. Languyan
C. Basilan a. Sub-Port of Maluso, Municipality of Maluso
D. Malaban a. Sub-Port of Malabang, Municipality of Malabang
2.5 Existing Port Facilities of Each Port
2.5.1 Polloc port
(1) General information of Polloc port
Basic information on facilities at the Polloc port is summarized below.
Location: Lat. 07° 21’ 22”, long. 124’ 113’E Port limits: Entrance to Bay Navigational approach: Mariga Bato Point Entrance channel: Parang Channel Turning basin: Polloc Anchorage Description: RC structure, general purpose marginal wharf with two lighter docks on
both sides, handling conventional and containerized cargo Area: 129 ha Pilotage: Compulsory pilotage for all vessels 100 GRT and above Total berth length
a. Marginal wharf: 400 LM b. Lighter dock: 67 LM
Draft Limitation a. Main wharf: Depth 10.5 m b. Lighter dock: Depth 3.0 m c. Anchorage: No draft limitation d. Transit shed 01: 5,980 m2 e. Transit shed 02: 5,980 m2
Total backup area a. Open storage: 42,940 m2 b. Private warehousing: 75,645 m2

Comprehensive capacity development project for the Bangsamoro Sector Report 2-2: Port Development
2-9
c. Parking area: 23,364 m2 Engineering/navigational aids
a. Beacon light: 1 b. Service roads: 127, 836 m2 c. Buoys: 1 pilot station d. Weighbridge: 52 tons e. Passenger terminal bldg.: Capacity 600 passengers f. Amenity bldg.: 760 m2 g. Public restrooms: 48 m2 x 2 h. Water resource facility: Capacity 1,060 m3 i. Barter trade center bldg.: 900 m2
(2) Advantages for natural and physical environmental
The Polloc port has high potential as a major port with respect to construction, operation and management, and it is considered one of the best ports in the Philippine considering the following.
Wind
According to the wind rose analysis for South Cotabato taken from the daily data for the period 1971–2000, 43.5% of the time the wind direction comes from the south with 43.4% ranging from 1 to 4 m per second (mps), 0.1% in the range of 5–8, and 0.0% greater than 8 mps. The prevailing wind direction throughout the year is south followed by north direction with 99.2% ranging from 1 to 4 mps.
Wave
No wave behavior data from direct measurement is available in South Cotabato, but according to the available information no significant wave has occurred to prevent the port operation throughout the year. It should be considered that the port and marine structure is given adequate protection from destructive waves related to cyclonic activities. The Polloc port is protected topographically from the southwest monsoon wave and sheltered from the west wave by the Bongo Island facing the port area.
Current
The current outside the Molo Gulf is 0.01–0.02 knot based on PAGASA. The tidal current in front of the Polloc harbor is north to south during flood tide and south to north during ebb tide based on the available chart. It is expected that velocity in front of the Polloc harbor is small in view of the local topography.
Water depth of the approach to the port
Water depth around the Polloc port is suitable for ship anchorage and maneuvering for docking to the berth. Water depth can reach 4,000 m at 80 km to southwest from the Polloc port, and 400 m within 7 km near the port and the depth of Polloc harbor in front of the berth is 40 m.
Accessibility to the port
The Polloc port is accessible by land from Cotabato City through a 13 km modern four lanes (two lanes partially) concrete pavement.
Siltation issues
There are no siltation issues as no major river exist around the port and no littoral drift from outside of the Polloc harbor.
(3) Current conditions of the port facilities
Berth structure
The main berth structure is generally fine despite more than three decades of service operations after its completion in 1977 except damage/deterioration. However, the following are found by inspection on the structure and facilities.

Comprehensive capacity development project for the Bangsamoro Sector Report 2-2: Port Development
2-10
a. All upper portions of the steel pipes supporting concrete deck have been corroded and some of concrete cover is peeled off and re-bars are corroded (Photos 1–7). It is very important to repair pile heads immediately to protect them from the re-bar corrosion.
Photo 1: Corroded upper portions of piles Photo 2: Exposed and corroded re-bars
b. All rubber fenders are either broken or totally damaged.
Photo 3: Totally damaged Photo 4: Broken fender
c. Many bollards are totally damaged but several new bollards are installed on the wharf
Photo 5: Damaged bollard Photo 6: New bollard
d. Concrete cover on the concrete beam of the deck slab is peeled off and re-bar is corroded.
Photo 7: Corroded re-bar
Even with proper design, reinforced concrete structures in the coastal zone normally undergo a process of deterioration as illustrated in Figure 2.5. At the initial stage, re-bars in concrete are statically corroded. The expansion of corrosion causes small cracks of concrete and some rust gradually appears
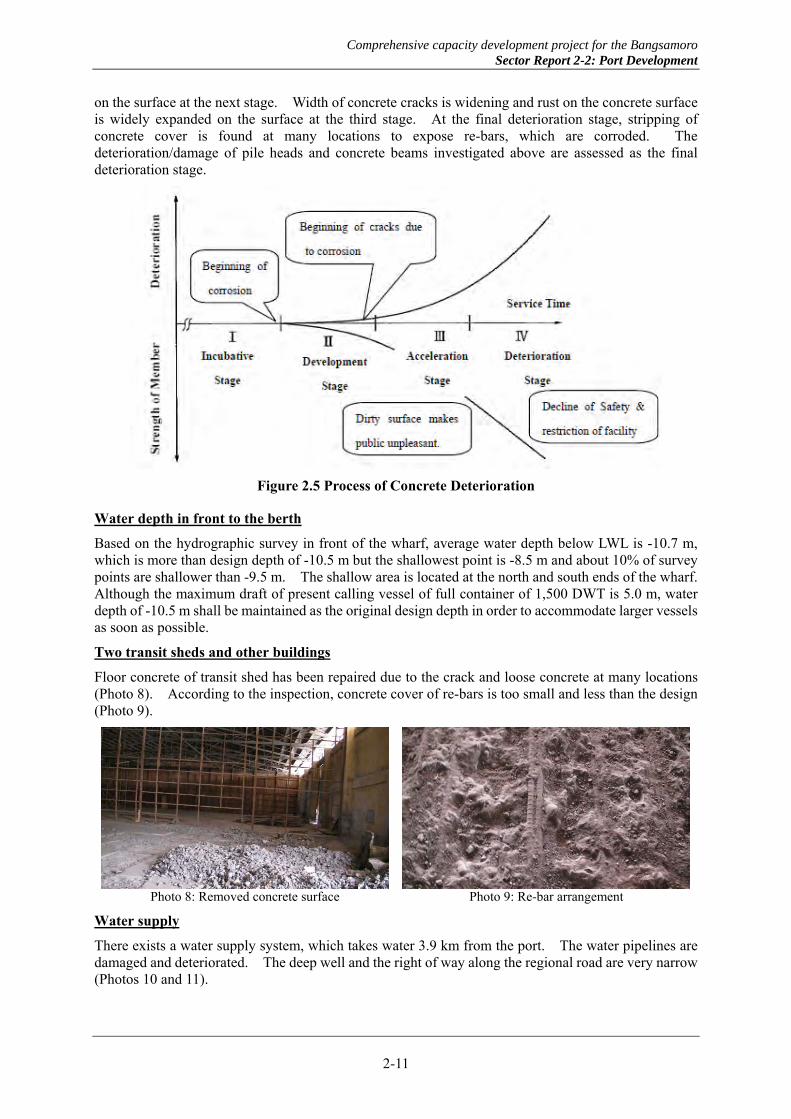
Comprehensive capacity development project for the Bangsamoro Sector Report 2-2: Port Development
2-11
on the surface at the next stage. Width of concrete cracks is widening and rust on the concrete surface is widely expanded on the surface at the third stage. At the final deterioration stage, stripping of concrete cover is found at many locations to expose re-bars, which are corroded. The deterioration/damage of pile heads and concrete beams investigated above are assessed as the final deterioration stage.
Figure 2.5 Process of Concrete Deterioration
Water depth in front to the berth
Based on the hydrographic survey in front of the wharf, average water depth below LWL is -10.7 m, which is more than design depth of -10.5 m but the shallowest point is -8.5 m and about 10% of survey points are shallower than -9.5 m. The shallow area is located at the north and south ends of the wharf. Although the maximum draft of present calling vessel of full container of 1,500 DWT is 5.0 m, water depth of -10.5 m shall be maintained as the original design depth in order to accommodate larger vessels as soon as possible.
Two transit sheds and other buildings
Floor concrete of transit shed has been repaired due to the crack and loose concrete at many locations (Photo 8). According to the inspection, concrete cover of re-bars is too small and less than the design (Photo 9).
Photo 8: Removed concrete surface Photo 9: Re-bar arrangement
Water supply
There exists a water supply system, which takes water 3.9 km from the port. The water pipelines are damaged and deteriorated. The deep well and the right of way along the regional road are very narrow (Photos 10 and 11).

Comprehensive capacity development project for the Bangsamoro Sector Report 2-2: Port Development
2-12
Photo 10: Existing deep well Photo 11: Narrow right of way
(4) Existing port layout plan
The existing port layout plan is shown in Figure 2.6. Container cargoes are loaded/unloaded on the apron and transported to the container stack yard behind two transit sheds by a trailer (Photos 12–13). After several dwelling days at the container yard, the containers are loaded/unloaded on trucks by the land cranes (Photo 14). River sand from the Simuay River is stockpiled at the back yard temporarily and is loaded to a bulk barge (Photo 15) and transported to the Sulu archipelago for the construction materials.
Photo 12: Container handling Photo 13: General cargo handling
Photo 14: Bulk cargo handling Photo 15: Liquid bulk handling

Comprehensive capacity development project for the Bangsamoro Sector Report 2-2: Port Development
2-13
Figure 2.6 General Layout Plan of Existing Polloc Port
2.5.2 Bongao, Jolo, Sitangkai, and Isabela ports
(1) Overview
A feasibility study on the Bongao, Jolo, and Sitangkai ports was conducted in the Intermodal Transport Development Project (ITDP) supported by Asian Development Bank (ADB) in September 2006. The Bongao and Jolo ports are expected to become important sub-hub ports connecting numerous smaller nearby island ports to other ports in the Sulu Archipelago as well as the regional hub of Zamboanga and west Mindanao. For this purpose, improvement and expansion of port facilities are planned in order to increase the port capacity. The Sitangkai port can function as a maritime linkage between remote islands and the sub-hub for Zamboanga and to BIMA-EAGA as well by improvement of the port facilities.
The handling volume at the port of Isabela decreased in 2000 due to the limited work area, low operating hours, and limited back-up area in the port. In view of this, PPA conducted the FS of transferring the existing port to an alternative site, about 1 km from the town, where a modern seaport would be established for economic growth of the entire Basilan Island.
(2) Present port facilities
Present port layout, magnitude of the port facilities, cargo and passenger traffic are summarized in Table 2.2. The Jolo port is the largest port handling largest cargo traffic among the four ports, but the Isabela port handles the largest passenger traffic volume at present.
Table 2.2 General Layout of Bongao, Jolo, Sitangkai, and Isabela Ports
Port Layout Major Port Facilities Traffic Volume
Bon
gao
- Main wharf 139 m - RORO 24 m - Fast craft 21 m - MPTB 35 x 12 m
Cargo: 125,331t in 2013Passenger: 223,522 in 2013

Comprehensive capacity development project for the Bangsamoro Sector Report 2-2: Port Development
2-14
Port Layout Major Port Facilities Traffic Volume Jo
lo
- Total berth length 585 m- A part of wharf (left) has been improved based on FS
Cargo: 157,027t in 2013Passenger: 459,826 in 2013
Sita
ngka
i
- Main wharf 60 m Cargo: 10,526t in 2013 Passenger: 26,446 in 2013
Isab
ela
- General cargo berth length 280 m - RORO berth 20 x 12 m
Cargo: 106,195t in 2013Passenger: 1,203,187 in 2013
(3) Cargo/passenger traffic and shipcall forecast
Cargo and passenger traffic and shipcalls at the Bongao, Jolo, Sitagkai, and Isabela ports for 2020, 2030, and 2036 was estimated by ADB in 2006 and by PPA in 2000 as summarized in Table 2.3. The cargo throughput at both Bongao and Jolo in 2013 was 140,000 ton/year, but the AAGR of Bongao at 5.1% is higher than that of Jolo which is 3.2% only. For passenger traffic, the AAGRs of Bongao and Jolo are 7.2% and 6.2%, respectively. Based on this, the Bongao port should be given slightly more priority than the Jolo port for development.
Table 2.3 Results of Cargo and Passenger Traffic and Shipcall Forecast for Bongao, Jolo, Sitangkai, and Isabela Ports
Port 2020 2030 2036
Bongao Cargo 283,912 377,256 447,470 Passenger 776,554 1,032,034 1,224,073 Shipcall 4,788 6,362 7,546
Jolo Cargo 192,995 253,055 297,660 Passenger 1,078,922 1,426,169 1,677,703 Shipcall 3,509 4,601 5,412
Sitangkai Cargo 59,934 96,790 129,217 Passenger 180,260 239,564 284,142 Shipcall 856 1,383 1,846
Isabela Cargo 435,800 530,000 Passenger 1,931,000 2,212,000 Shipcall 8,490 9,129
Note: Values of 2020 and 2030 for Isabel are those of 2017 and 2022, respectively.
(4) Proposed development
The proposed development works for the Bongao, Jolo and Sitanagkai ports are shown in Table 2.4. The proposed Isabela port is a totally new port recommended at 1 km from the town proper.
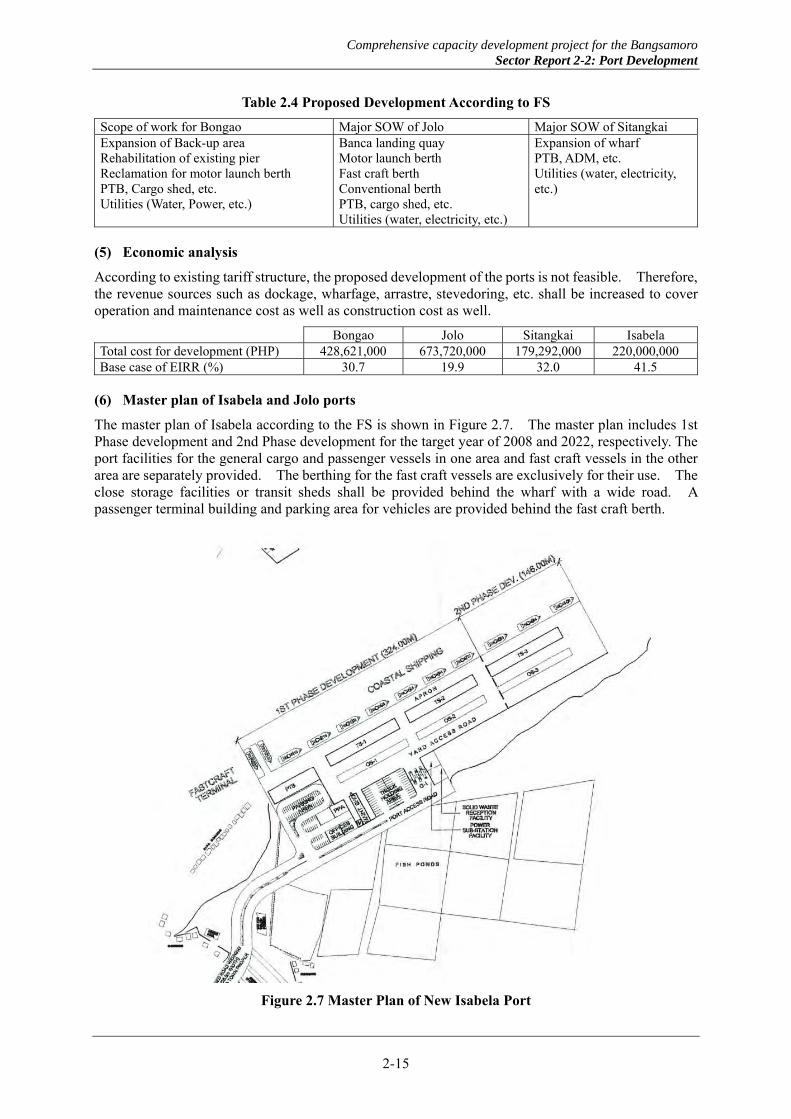
Comprehensive capacity development project for the Bangsamoro Sector Report 2-2: Port Development
2-15
Table 2.4 Proposed Development According to FS
Scope of work for Bongao Major SOW of Jolo Major SOW of Sitangkai Expansion of Back-up area Rehabilitation of existing pier Reclamation for motor launch berth PTB, Cargo shed, etc. Utilities (Water, Power, etc.)
Banca landing quay Motor launch berth Fast craft berth Conventional berth PTB, cargo shed, etc. Utilities (water, electricity, etc.)
Expansion of wharf PTB, ADM, etc. Utilities (water, electricity, etc.)
(5) Economic analysis
According to existing tariff structure, the proposed development of the ports is not feasible. Therefore, the revenue sources such as dockage, wharfage, arrastre, stevedoring, etc. shall be increased to cover operation and maintenance cost as well as construction cost as well.
Bongao Jolo Sitangkai Isabela Total cost for development (PHP) 428,621,000 673,720,000 179,292,000 220,000,000 Base case of EIRR (%) 30.7 19.9 32.0 41.5
(6) Master plan of Isabela and Jolo ports
The master plan of Isabela according to the FS is shown in Figure 2.7. The master plan includes 1st Phase development and 2nd Phase development for the target year of 2008 and 2022, respectively. The port facilities for the general cargo and passenger vessels in one area and fast craft vessels in the other area are separately provided. The berthing for the fast craft vessels are exclusively for their use. The close storage facilities or transit sheds shall be provided behind the wharf with a wide road. A passenger terminal building and parking area for vehicles are provided behind the fast craft berth.
Figure 2.7 Master Plan of New Isabela Port

Comprehensive capacity development project for the Bangsamoro Sector Report 2-2: Port Development
2-16
Besides the ADB FS described above, PPA prepared a master plan of the Jolo port as indicated in Figure 2.8. The berths are allocated to motorized bancas, fast craft, RORO, conventional vessels, and liners. Motorized banca berths are provided for transport to/from the surrounding islands, and other berths for cargo and passenger transport to/from the surrounding islands and the sub-hub ports of Bangsamoro.
Figure 2.8 Master Plan of Jolo Port
(7) Cargo handling on the berths at Jolo port
Of the ports of Bongao, Jolo, Isabela, and Sitangkai, the Jolo port is the busiest port at present. At the Jolo port, all cargoes are temporary stacked on the berth prior to loading onto ships. The narrow berths are occupied by the cargoes, and there is no space for port vehicles to pass. This causes inefficient performance and low productivity in cargo handling at the Jolo port.

Comprehensive capacity development project for the Bangsamoro Sector Report 2-2: Port Development
2-17
Appendix A: Historical Data on Cargo and Passenger Traffic at Existing Polloc Port Year 1992 1993 1994 1995 1996 1997 1998 1999 2000 2001 2002 2003 2004 2005 Decrease GR (%)
1. Total Cargo Throughput (MT) 742,923 504,840 525,115 704,633 559,981 606,043 570,875 414,789 347,000 452,370 322,105 361,505 284,486 249,788 454,845 2.05 a. Domestic 712,610 481,035 484,733 552,613 459,679 496,567 471,622 340,540 284,887 371,396 264,448 296,795 233,564 205,076 347,527 1.35
Inbound 274,418 180,714 198,934 243,401 206,195 222,424 250,834 152,897 127,914 166,757 118,737 133,261 104,870 92,079 151,322 2.26 Breakbulk 19,840 39,502 33,549 50,997 89,805 97,400 109,364 66,657 55,770 72,706 51,769 58,102 45,723 40,146 10,851 3.94 Bulk 254,578 53,742 63,279 79,299 0 0 0 0 0 0 0 0 0 0 79,299 Containerized 0 87,470 102,106 113,105 116,390 125,024 141,470 86,240 72,144 94,051 66,968 75,159 59,147 51,933 61,172 4.37 Outbound 438,192 300,321 285,799 309,212 253,484 274,143 220,788 187,643 156,973 204,639 145,711 163,534 128,694 112,997 196,205 1.08 Breakbulk 313,983 123,904 111,525 108,855 95,418 103,078 83,016 70,554 59,022 76,944 54,787 61,489 48,389 42,487 66,368 0.67 Bulk 117,666 10,665 6,493 17,016 0 0 0 0 0 0 0 0 0 0 17,016 Containerized 6,543 165,752 167,781 183,341 158,066 171,065 137,772 117,089 97,951 127,695 90,924 102,045 80,305 70,510 112,821 6.75
b. Foreign 30,313 23,805 40,382 152,020 100,302 109,476 99,253 74,249 62,113 80,974 57,656 64,710 50,923 44,712 107,308 5.14 Import 26,396 10,151 30,490 120,694 76,443 82,659 75,631 56,578 47,330 61,702 43,934 49,309 38,803 34,071 86,623 5.29 Breakbulk 22,479 10,151 30,490 120,694 76,443 82,659 75,631 56,578 47,330 61,702 43,934 49,309 38,803 34,071 86,623 5.11 Bulk 3,917 0 0 0 0 0 0 0 0 0 0 0 0 0 0 Containerized 0 0 0 0 0 0 0 0 0 0 0 0 0 0 0 Export 3,917 13,654 9,892 31,326 23,859 26,817 23,622 17,671 14,783 19,272 13,722 15,401 12,120 10,641 20,685 4.64 Breakbulk 3,917 13,654 9,892 31,326 23,859 26,817 23,622 17,671 14,783 19,272 13,722 15,401 12,120 10,641 20,685 4.64 Bulk 0 0 0 0 0 0 0 0 0 0 0 0 0 0 0 Containerized 0 0 0 0 0 0 0 0 0 0 0 0 0 0 0
c. Transit cargo 0 0 0 0 0 0 0 0 0 0 0 0 0 0 0 Domestic 0 0 0 0 0 0 0 0 0 0 0 0 0 0 0 Inward 0 0 0 0 0 0 0 0 0 0 0 0 0 0 0 Outward 0 0 0 0 0 0 0 0 0 0 0 0 0 0 0 Foreign 0 0 0 0 0 0 0 0 0 0 0 0 0 0 0 Import 0 0 0 0 0 0 0 0 0 0 0 0 0 0 0 Export 0 0 0 0 0 0 0 0 0 0 0 0 0 0 0
d. Foreign (transshipment) 0 0 0 0 0 0 0 0 0 0 0 0 0 0 0 2. Passenger Traffic (n) 76,728 124,526 149,196 159,501 299,492 300,593 -- -- -- -- -- -- -- -- 159,501 1.62
Disembarking 39,981 58,837 74,297 77,212 140,659 141,279 0 0 0 0 0 0 0 0 77,212 1.53 Embarking 36,747 65,689 74,899 82,289 158,833 159,314 0 0 0 0 0 0 0 0 82,289 1.61

Comprehensive capacity development project for the Bangsamoro Sector Report 2-2: Port Development
2-18
CHAPTER 3 DEMAND FORECAST FOR BANGSAMORO PORTS
3.1 Historical Growth of Traffic at Polloc Port
As presented in Table 3.1, the growth rate of the cargo traffic at the Polloc port keep on declining at any given period. The latest data recorded were for 2005. From that period onward, no data have been recorded. Since no major improvement has been made to the port during the recent years, the declining number of -6.3% per year was applied to estimate the 2014 and 2015 cargo traffic.
Table 3.1 Growth Rate of Traffic at Polloc Port
Particulars AAGR
(1992–1997)AAGR
(1992–1999)AAGR
(1992–2005) AAGR
(2000–2005)Cargo and Passenger Traffic 1. Total Cargo Throughput -3.99% -7.99% -7.49% -6.36%
a. Domestic -6.97% -10.01% -8.51% -6.36%Inbound -4.11% -8.02% -7.50% -6.36%Breakbulk 37.47% 18.90% 5.16% -6.36%Bulk Containerized -6.36%Outbound -8.95% -11.41% -9.23% -6.36%Breakbulk -19.97% -19.21% -13.31% -6.36%Bulk -100.00% -100.00% -100.00% Containerized 92.08% 51.00% 18.51% -6.36%
b. Foreign 29.28% 13.65% 2.82% -6.36%Import 25.65% 11.51% 1.84% -6.36%Breakbulk 29.75% 14.10% 3.02% -6.36%Bulk Containerized Export 46.92% 24.01% 7.40% -6.36%Breakbulk 46.92% 24.01% 7.40% -6.36%Bulk Containerized
c. Transit Cargo Domestic Inward Outward Foreign Import Export
d. Foreign (Tran-shipment) 2. Passenger Traffic 31.40%
Disembarking 28.72% Embarking 34.09%
3.2 Projected Cargo Traffic for Bangsamoro
Cargo traffic for Bangsamoro is expected to reach 4.8 million ton in 2019, 5.4 million ton in 2022 and further increase to 7.7 million ton in 2030 (Table 3.2).
Table 3.2 Projected Cargo Traffic Volume for Mindanao and Bangsamoro
Mindanao Total (1,000 ton) Bangsamoro (1,000 ton) Commodity 2013 2019 2022 2030 2013 2019 2022 2030 Total 25,310 32,980 37,770 54,850 3,730 4,790 5,440 7,740 Inbound 13,100 18,600 22,200 35,600 1,600 2,300 2,800 4,400 Outbound 12,300 14,400 15,600 19,300 2,100 2,500 2,700 3,300

Comprehensive capacity development project for the Bangsamoro Sector Report 2-2: Port Development
2-19
3.3 Cargo Traffic Shares of Island Provinces Ports
Assuming that the five ports captured all the port cargo traffic in the island provinces, the share of ports from island provinces would be as follows: 12.5% in 2019, 13.7% in 2022 and 13.3% in 2030. It is assumed then that the remaining cargo traffic has its origin/destination in the mainland and ship out/in via the Davao, Cagayan de Oro, General Santos, and Polloc ports.
Table 3.3 Bangsamoro Port Traffic and Island Provinces Ports Traffic
Port 2013 (ton) 2019 (ton) 2022 (ton) 2030 (ton) Bangsamoro total 3,730,717 4,785,359 5,438,968 7,741,208 1. Isabela Port 114,653 129,118 145,240 170,172 2. Bongao Port 182,709 253,363 348,384 538,728 3. Jolo Port 167,795 196,880 230,528 285,291 4. Lamitan Port 4,747 5,473 6,300 7,616 5. Sitangkai Port 9,428 12,490 16,444 23,928 Share of ports in island provinces (%) 12.8 12.5 13.7 13.3
3.4 Cargo Traffic Projection for Polloc Port
The latest available data of cargo traffic at the Polloc port are for 2005 (249,788 MT). From 2000 to 2005, the cargo traffic was estimated by applying an annual rate of -6.3%. Since no major improvement was effected since then, it is fairly reasonable to assume that the decrease continued from 2005 to the present time. Assuming that is the case, the 2014 cargo traffic was about 138,232 MT (see Appendix B for details).
Table 3.4 Projecting Current Cargo Traffic at Polloc Port (Unit: MT)
1992 1999 2000 2005 2006 2007 2008 2009 2010 2011 2012 2013 2014 2015 AAGR AAGR=-7.9% AAGR=-6.3% Projected (growth rate -6.36%) Total Cargo
742,923 414,789 347,000 249,788 233,894 219,012 205,077 192,028 179,810 168,369 157,656 147,625 138,232 129,436
3.5 Share of Polloc Port in Total Cargo Traffic of Bangsamoro
The share of the Polloc port and the island provinces in the total port traffic generated in and attracted to the Bangsamoro region was 16.8% in 2013 (Table 3.5). Of that, the Polloc port’s share was only 4%. Given this, it can be assumed that more than 80% of the cargo traffic enter and exit the ports of Davao, General Santos, and even Cagayan de Oro.
Table 3.5 Cargo Traffic Volume at Ports in Bangsamoro and Their Shares, 2013
Port 2013 (MT) Share (%) Bangsamoro total 3,730,717 100 1. Polloc 147,625 4.0 2. Isabela 114,653 3.1 3. Bongao 182,709 4.9 4. Jolo 167,795 4.5 5. Lamitan 4,747 0.1 6. Sitangkai 9,428 0.3 Island provinces total 479,333 12.8 Polloc and island provinces total 626,957 16.8
3.6 Growth of Cargo Traffic
The annual growth rates of cargo traffic in the Bangsamoro region are assumed to be 4.2% for 2013–2019, 4.4% for 2019–2022, and 4.5% for 2020–2022. The Polloc port’s share in 2013 is estimated to be about 4.0% of the total Bangsamoro cargo traffic as shown in Table 3.6. If at least 5% of the total

Comprehensive capacity development project for the Bangsamoro Sector Report 2-2: Port Development
2-20
cargo traffic is to pass through the Polloc port in 2019, traffic volume must increase by 8.4% annually taking 2013 as the base year. This will bring the share of the Polloc port and the island provinces in the total cargoes passing through Bangsamoro ports to 17.5%.
If the Polloc port’s share in the Bangsamoro cargo traffic increases to 10% by 2019, the traffic volume must grow at an annual rate of 31.5% (Table 3.7). Such increase is possible if the needs of shippers are met and all the plantations in Bangsamoro planned for expansion will use the Polloc port instead of the Davao port or the General Santos port.
It should be noted that a 10% share of all the cargoes at Bangsamoro ports in 2022 means 543,897 MT (Table 3.8). The Polloc port once handled a traffic volume of 742,923 MT in 1997. Thus, the port capacity is not an issue. Inbound and outbound cargoes to/from Bangsamoro are mostly from outside of the region.
Table 3.6 Share of Ports in Total Bangsamoro Cargo Traffic for 2013, 2019, 2022, and 2030
Port 2013 (%) 2019 (%) 2022 (%) 2030 (%) 1. Polloc (target share) 4.0 5.0 10.0 15.0 2. Isabela 3.1 2.7 2.7 2.2 3. Bongao 4.9 5.3 6.4 7.0 4. Jolo 4.5 4.1 4.2 3.7 5. Lamitan 0.1 0.1 0.1 0.1 6. Sitangkai 0.3 0.3 0.3 0.3 Island provinces total 12.8 12.5 13.7 13.3 Polloc and island provinces total 16.8 17.5 23.7 28.3
Table 3.7 Projected Growth in Cargo Traffic at Ports in Bangsamoro for 2013–2030
Port 2013–19 (% p.a.) 2019–22 (% p.a.) 2022–30 (% p.a.)Bangsamoro total 4.2 4.4 4.5 1. Polloc 8.4 31.5 9.9 2. Isabela 2.0 4.0 2.0 3. Bongao 5.6 11.2 5.6 4. Jolo 2.7 5.4 2.7 5. Lamitan 2.4 4.8 2.4 6. Sitangkai 4.8 9.6 4.8 Island provinces total 3.7 7.7 4.0 Polloc and island provinces total 4.9 15.6 6.8
Table 3.8 Cargo Volume at Ports in Bangsamoro for 2013, 2019, 2022, and 2030
Port 2013 (ton) 2019 (ton) 2022 (ton) 2030 (ton) Bangsamoro total 3,730,717 4,785,359 5,438,968 7,741,208 1. Polloc 147,625 239,268 543,897 1,161,181 2. Isabela 114,653 129,118 145,240 170,172 3. Bongao 182,709 253,363 348,384 538,728 4. Jolo 167,795 196,880 230,528 285,291 5. Lamitan 4,747 5,473 6,300 7,616 6. Sitangkai 9,428 12,490 16,444 23,928 Island provinces total 479,333 597,325 746,896 1,025,735 Polloc and island provinces total 626,957 836,593 1,290,793 2,186,916
3.7 Future Passenger Traffic
The only passenger traffic data available for the Polloc port are for the period between 1992 and 1997. During this period, the annual growth rate was 31.4%. Assuming that this trend continued, the traffic volume in 2013 would have been about 24 million. This may not be a reasonable estimate. The existing and projected passenger traffic are presented in Table 3.9.

Comprehensive capacity development project for the Bangsamoro Sector Report 2-2: Port Development
2-21
Table 3.9 Existing Data and Projections on Passenger Traffic
Existing Data 1992 1993 1994 1995 1996 1997 Passenger Traffic (n) 76,728 124,526 149,196 159,501 299,492 300,593 - Disembarking 39,981 58,837 74,297 77,212 140,659 141,279 - Embarking 36,747 65,689 74,899 82,289 158,833 159,314 Growth Rate (%/year) Passenger Traffic 62 20 7 88 0 - Disembarking 47 26 4 82 0 - Embarking 79 14 10 93 0
Projections 1998 2013 2019 2022 2030 AAGR (92–97)Passenger Traffic (n) 394,988 23,749,738 122,261,240 277,398,295 2,465,720,028 31.40% - Disembarking 181,854 8,024,062 36,497,493 77,839,029 586,618,489 28.72% - Embarking 213,629 17,408,306 101,203,370 244,013,697 2,550,735,864 34.09% Growth Rate (%/year) 1998–2013 2013–19 2019–22 2022–30 Passenger Traffic 31 31 31 31 - Disembarking 29 29 29 29 - Embarking 34 34 34 34

Comprehensive capacity development project for the Bangsamoro Sector Report 2-2: Port Development
2-22
Appendix B: Detailed Projections of Polloc Port Cargo Traffic
Year 1992 1993 1994 1995 1996 1997 1998 1999 2000 2001 2002 2003 2004 2005 AAGR 7.9% 6.3%
1. Total Cargo Throughput (MT) 742,923 504,840 525,115 704,633 559,981 606,043 570,875 414,789 347,000 452,370 322,105 361,505 284,486 249,788a. Domestic 712,610 481,035 484,733 552,613 459,679 496,567 471,622 340,540 284,887 371,396 264,448 296,795 233,564 205,076
Inbound 274,418 180,714 198,934 243,401 206,195 222,424 250,834 152,897 127,914 166,757 118,737 133,261 104,870 92,079Breakbulk 19,840 39,502 33,549 50,997 89,805 97,400 109,364 66,657 55,770 72,706 51,769 58,102 45,723 40,146Bulk 254,578 53,742 63,279 79,299 0 0 0 0 0 0 0 0 0 0Containerized 0 87,470 102,106 113,105 116,390 125,024 141,470 86,240 72,144 94,051 66,968 75,159 59,147 51,933Outbound 438,192 300,321 285,799 309,212 253,484 274,143 220,788 187,643 156,973 204,639 145,711 163,534 128,694 112,997Breakbulk 313,983 123,904 111,525 108,855 95,418 103,078 83,016 70,554 59,022 76,944 54,787 61,489 48,389 42,487Bulk 117,666 10,665 6,493 17,016 0 0 0 0 0 0 0 0 0 0Containerized 6,543 165,752 167,781 183,341 158,066 171,065 137,772 117,089 97,951 127,695 90,924 102,045 80,305 70,510
b. Foreign 30,313 23,805 40,382 152,020 100,302 109,476 99,253 74,249 62,113 80,974 57,656 64,710 50,923 44,712Import 26,396 10,151 30,490 120,694 76,443 82,659 75,631 56,578 47,330 61,702 43,934 49,309 38,803 34,071Breakbulk 22,479 10,151 30,490 120,694 76,443 82,659 75,631 56,578 47,330 61,702 43,934 49,309 38,803 34,071Bulk 3,917 0 0 0 0 0 0 0 0 0 0 0 0 0Containerized 0 0 0 0 0 0 0 0 0 0 0 0 0 0Export 3,917 13,654 9,892 31,326 23,859 26,817 23,622 17,671 14,783 19,272 13,722 15,401 12,120 10,641Breakbulk 3,917 13,654 9,892 31,326 23,859 26,817 23,622 17,671 14,783 19,272 13,722 15,401 12,120 10,641Bulk 0 0 0 0 0 0 0 0 0 0 0 0 0 0Containerized 0 0 0 0 0 0 0 0 0 0 0 0 0 0
c. Transit Cargo 0 0 0 0 0 0 0 0 0 0 0 0 0 0Domestic 0 0 0 0 0 0 0 0 0 0 0 0 0 0Inward 0 0 0 0 0 0 0 0 0 0 0 0 0 0Outward 0 0 0 0 0 0 0 0 0 0 0 0 0 0Foreign 0 0 0 0 0 0 0 0 0 0 0 0 0 0Import 0 0 0 0 0 0 0 0 0 0 0 0 0 0Export 0 0 0 0 0 0 0 0 0 0 0 0 0 0
d. Foreign (transshipment) 0 0 0 0 0 0 0 0 0 0 0 0 0 0
Particulars 2006 2007 2008 2009 2010 2011 2012 2013 2014 2015
AAGR 6.36% (projected) 1. Total Cargo Throughput (MT) 233,894 219,012 205,077 192,028 179,810 168,369 157,656 147,625 138,232 129,436
a. Domestic 192,027 179,809 168,368 157,655 147,624 138,231 129,436 121,200 113,488 106,267 Inbound 86,220 80,734 75,597 70,787 66,283 62,066 58,117 54,419 50,956 47,714 Breakbulk 37,592 35,200 32,960 30,863 28,899 27,060 25,338 23,726 22,217 20,803 Bulk - - - - - - - - - - Containerized 48,629 45,535 42,637 39,924 37,384 35,005 32,778 30,693 28,740 26,911 Outbound 105,807 99,075 92,771 86,868 81,341 76,165 71,319 66,781 62,532 58,553 Breakbulk 39,784 37,252 34,882 32,663 30,584 28,638 26,816 25,110 23,512 22,016 Bulk - - - - - - - - - - Containerized 66,024 61,823 57,889 54,206 50,757 47,527 44,503 41,671 39,020 36,537
b. Foreign 41,867 39,203 36,709 34,373 32,186 30,138 28,220 26,425 24,743 23,169 Import 31,903 29,873 27,973 26,193 24,526 22,966 21,505 20,136 18,855 17,656 Breakbulk 31,903 29,873 27,973 26,193 24,526 22,966 21,505 20,136 18,855 17,656 Bulk - - - - - - - - - - Containerized - - - - - - - - - - Export 9,964 9,330 8,736 8,180 7,660 7,172 6,716 6,288 5,888 5,513 Breakbulk 9,964 9,330 8,736 8,180 7,660 7,172 6,716 6,288 5,888 5,513 Bulk - - - - - - - - - - Containerized - - - - - - - - - -
c. Transit Cargo - - - - - - - - - - Domestic - - - - - - - - - - Inward - - - - - - - - - - Outward - - - - - - - - - - Foreign - - - - - - - - - - Import - - - - - - - - - - Export - - - - - - - - - -
d. Foreign (transshipment) - - - - - - - - - -

Comprehensive capacity development project for the Bangsamoro Sector Report 2-2: Port Development
2-23
CHAPTER 4 PROPOSAL OF PRIORITY PROJECTS
4.1 Cargo and Passenger Traffic of Bangsamoro Ports
The future cargo and passenger traffic at the ports in Bangsamoro reported in Chapter 3 is summarized in Table 4.1.
Table 4.1 Future Port Traffic at Ports in Bangsamoro (2015–2030)
Port Item 2015 2019 2022 2030 Polloc Cargo (MT) 432,598 921,197 1,060,318 1,542,860
Isabela Cargo (MT) 119,285 129,118 145,240 170,172 Passenger 1,365,269 1,443,345 1,568,013 1,752,480
Bongao Cargo (MT) 203,746 253,363 348,384 538,728 Passenger 213,974 233,434 265,623 316,135
Jolo Cargo (MT) 282,950 314,769 368,564 456,118 Passenger 471,158 524,141 613,720 759,511
Lamitan Cargo (MT) 4,978 5,473 6,300 7,616 Passenger 332,271 384,245 476,015 636,577
Sitangkai Cargo (MT) 10,355 12,490 16,444 23,928 Passenger 28,576 32,037 37,941 47,691
4.2 Polloc Port
4.2.1 Overview
The Polloc port was constructed by Nam Kwang Construction Company, Ltd. in 1977 funded by ADB. Port operation was started by PPA in March 1980 and transferred to DOTC-ARRM. Operation and management of the Polloc Freeport was started in 2010 by REZA. As mentioned in Chapter 2, the Polloc port has high potential as a major port with respect to construction, operation and management, and it is one of the best ports in the Philippines.
4.2.2 Existing system of the port operation
The study of the port operation of the Polloc port is based on available actual statistical data obtained from REZA. There are no data available for the Polloc port from 2006 to 2012, but data from 1995 to 2003 are available as attached in Appendix A. The latest record of cargo throughput at the Polloc port in 2013 was 296,354 tons.
1) Berth length: 400 m 2) Ship call: 181 ships 3) Ship size: 2,000 GT container ship 4) Vessel waiting time: Once a month 5) Forklift: 2 units 6) Truck chassis: 6 units 7) Reach stacker: 2 units (new)
For port operation, productivity is the primary concern for the production and any service activities. This could be measured in many ways, as in the manufacturing and services sectors, but the bottom line always is to produce more at the least possible cost. Indicators of productivity in port operation are used to measure the proficiency and ability to serve the port’s constituents. These are as follows.
(1) Indicators of output
The major indicators of output are the annual berth throughput, ship output and gang output. The annual berth throughput measures the total volume of cargo handled at the berth yearly. As indicated above, no data are available for the Polloc port from 2006 to 2012. The ship output indicator measures

Comprehensive capacity development project for the Bangsamoro Sector Report 2-2: Port Development
2-24
the rate at which cargo is handled to and from a vessel at a berth. It is expressed in one of three ways, depending on the time period used to measure the weight of cargo handled such as working hour, ship-hour at berth and lineal meter of berth. These records, however, are not available for the Polloc port.
(2) Indicators of service
There are many indicators that can be used to measure the quality of service that a port provides for its users (shippers, importers, ship owners), but the most commonly used indicator is ship turnaround time, i.e., the total time spent by a particular vessel in the port.
(3) Indicators of utilization
Indicators of utilization are measures of how intensively berth facilities and resources are used. There are two important indicators in this group: berth occupancy (the proportion of time a berth is occupied by vessels) and capacity utilization (the proportion of actual traffic to either the optimum capacity using optimum berth occupancy rate (OBOR) or maximum capacity using 100% OBOR. Berth occupancy effectively indicates the level of demand for port services. It can be measured over various time intervals, and is normally expressed as a percentage:
Berth occupancy rate = {(Ship calls)(Average LOA)(Spacing factor)(Average service time)(100)}/{(Available berth length)(Days/year)(Hours/day)}
High berth occupancy causes quality of service to decline. It is signals for congestion, and there is a danger that ships have to queue for a berth. The other extreme, low berth occupancy (45% or less in the case of general cargo berth) indicates that resources are being underused.
Berth occupancy is an indicator to be used with caution- aiming for high values may be very dangerous (in terms of congestion delays), while low values may be uneconomic (in terms of return on investment). Research and experience have shown that, at a general cargo berth, berth occupancy values within the range of 40% to 70% are perhaps the optimum.
(4) Indicators of efficiency
Indicators of efficiency, as measured by the cost per ton of cargo, are determined from a cost-based study. It is analogous to time utilization, but in this case, it involves prorating the cost among the contributory port facilities and related services.
There are no available data for the Polloc port to measure the port performance by the four indicators described above, therefore, it is recommended to apply general indicators for port development. For reference, tonnage per lineal meter of berth specified in UNCTAD standard will be examined in the next paragraph.
Tons/Lineal meter of berth = Total tonnage/Berth length
4.2.3 Cargo handling capacity of representative ports in Mindanao and Manila ports
In order to determine the required scale of the plan for future cargo traffic, it is necessary to determine the present cargo handling capacity of the port. Port capacity is generally calculated in terms of the volume of cargo. Since port capacity varies according to the types of the cargo, size of lot, size of the berth, methods of loading and unloading, etc., it is often represented simply as the volume of cargo handled at the port.
To assess the handling volume per lineal meter for busy and increasing handling volume of cargo, the Davao, General Santos, Zamboanga and Manila North Harbor ports were selected and the ton/lineal meter was calculated together with ratio of container cargo. Generally, if container cargo is increased, the handling volume of cargo is increased as well due to the efficiency of the movement of cargo. The result of the calculation is indicated in Table 4.2.
The present handling ton/lineal meter at the Polloc port is 296,354 tons/400 m = 740 ton/m which indicates under-utilization of the port and port facilities. According to the statistic of cargo throughput of the Polloc port in 2013, percentage of container cargo is 47% which is less than that of the Zamboanga

Comprehensive capacity development project for the Bangsamoro Sector Report 2-2: Port Development
2-25
port. Based on the above, the port capacity of Polloc port is estimated at 2,000 ton/m/year considering the increase in the containerization of cargos handled at the port in the future.
Table 4.2 Tons per Lineal Meter of Berth in Mindanao and Manila
Davao Zamboanga General Santos Manila North HarborTon/LM 3,925 1,503 3,154 2,581 Ratio of Container (%) 88 57 83 80
4.2.4 Present conditions for new development for Polloc port
(1) Fuel oil depot
Based on the REZA information, DS3 Management started the construction of an oil supply facility in the Polloc port in May 2015. The information is summarized as follows (Figure 4.1).
1) DS3 will invest in the Polloc port with strong Philippines based fuel supply
2) Initially floating storage will be used to provide immediate storage
3) Once fuel volumes have grown, storage tanks will be built in the eco-zone of Polloc port; the proposed size of the tanks is two 8 million liters tanks for diesel oil and one 5 million liter tank for gasoline for a total of 21 million liters.
4) By providing local storage, the serious logistical problems of delivering fuel by road from Davao will be removed.
5) Local fuel price will be reduced, which will promote economic growth with larger fuel usage
Figure 4.1 Schematic Drawing of Oil Handling and Deposit at Polloc Port
(2) Corn import from Indonesia
The import of 40,000 tons of corn from Indonesia for the LAMSAM corn starch company started in June 2015. The port operator LAMSAM purchased a pneumatic unloader for corn unloading from ship to truck (Photo 16).
Berthing facility
Pipeline
Oil tanks

Comprehensive capacity development project for the Bangsamoro Sector Report 2-2: Port Development
2-26
Photo 16
(3) RORO ramp
REZA prepared a RORO ramp construction plan (Photos 17 and 18). Objectives of the RORO ramp (12 m x 20 m) are as follows:
1) RORO transportation will become part of the Strong Nautical Highway of the Philippines and included in the Western Mindanao RORO link.
2) RORO will enhance mobility and improve linkages between islands, provide access to markets or activity centers, and support different business sectors in ARMM.
3) The delivery of basic goods and farm produce is made easier, economical and efficient as travel time to and from destinations as well as transportation costs are considerably reduced.
Photo 17 Photo 18
(4) Latest cargo volume handled in Polloc port
The latest statistic of cargo volume handled in the Polloc port is indicated in Table 4.3. According to the above data, increase of the cargo volume is significant in recent years.
Table 4.3 Latest Data on Cargo Volume at Polloc Port (2013–2015)
Year 2013 2014 2015 Cargo throughput (ton) 296,351 358,111 433,380 Growth ratio (%) - 20.8 21.0 Note: Cargo throughput in 2015 estimated from January–June data.

Comprehensive capacity development project for the Bangsamoro Sector Report 2-2: Port Development
2-27
4.2.5 Proposed port development
(1) Required number of berths
The number of berths required to handle a given volume of cargo differs greatly depending on the nature of the port, kind of cargos, cargo handling facilities, etc. There are several methods in determining the berth length. For the rough estimate of the required total length of berth, the unit productivity method is mainly used as below.
Unit productivity = (Converted cargo volume)/(Converted berth length) Unit productivity = 700–1,100 t/m (1,000ton/m for general cargo and 2,000 ton/m for container to be used for calculation.)
The adjusting rates for bulk and general cargo and containers are 0.5 and 1.0, respectively, and the adjusting rate for berth is as shown in Table 4.4.
Table 4.4 Relation of Water Depth and Berth Length
Water depth of berth Converted berth length 2.10–3.90 m 1/3 x berth length 4.00–7.40 m 2/3 x berth length
7.50 m ≤ Berth length
Projections of cargo volume and required berth lengths at the Polloc port for 2019, 2022, and 2030 are summarized in Tables 4.5 through 4.8.
Table 4.5 Cargo Forecast for Polloc Port in 2019, 2022, and 2030
Polloc port Year 2019 2022 2030
Cargo (MT) 921,197 1,060,318 1,542,860
Table 4.6 Required Berth Length for General Cargo at Polloc Port in 2019, 2022, and 2030
Year Cargo throughput
(ton) Required berth length* (m) [a]
Existing berth length (m) [b]
Required extension of berth [a]-[b]
2019 460,599 230 200 30 2022 530,159 265 200 65 2030 771,430 386 200 186
*Assuming that general cargo accounts for 50% of total throughput.
Table 4.7 Required Berth Length for Container Cargo in 2019, 2022, and 2030
Year Cargo throughput
(ton) Required berth length (m) [a]
Existing berth length (m) [b]
Required extension of berth [a]-[b]
2019 460,599 230 200 30 2022 530,159 265 200 65 2030 771,430 386 200 186
*Assuming that container cargo accounts for 50% of total throughput.
Table 4.8 Required Berth Length for General and Container Cargo in 2019, 2022, and 2030
Year Cargo throughput
(ton) Required berth length (m) [a]
Existing berth length (m) [b]
Required extension of berth [a]-[b]
Proposed extension of berth (m)
2019 921,197 460 400 60 0 2022 1,060,318 530 400 130 200 2030 1,542,860 772 400 372 200
(2) Required transit shed area
The transit shed area required to handle the cargo volume is determined by the following:
Transit shed area = (VET x RF x 2.2)/SD
Comprehensive capacity development project for the Bangsamoro Sector Report 2-2: Port Development
2-28
VET = (DT x ET x PF)/365 Where
VET: Volume within a dwell time DT: Design traffic volume ET: Dwell time PF: Peak factor RF: Re-stowing factor SD: Stacking density (1.0–1.50 MT/m2 for general cargo)
Transit shed area = (DT x ET x PF x RF x 2.2)/(SD x 365) Transit shed area = (771,430 x 25% x 5 x 1.12 x 1.05 x 2.2)/(1.5 x 365) Transit shed area = 4,556 m2 (existing shed 11,960 m2)
No additional transit shed is necessary.
(3) Required open storage
The open storage area required is calculated as follows:
Open storage area = (VET x RF x 2.0)/SD VET = (DT x ET x PF)/365
Where VET: Vol. within a dwell time DT: Design traffic volume ET: Dwell time PF: Peak factor RF: Re-stowing factor SH: Stacking density (1.0–1.50 MT/m2 for general cargo)
Open storage area = (DT x ET x PF x RF x 2.0)/(SD x 365) Open storage area = (771,430 x 55% x 5 x 1.12 x 1.05 x 2.0)/(1.5 x 365) Open storage area = 9,113 m2 Open storage area = 9,200 m2 (using existing open yard)
(4) Required container yard
The container yard necessary to store and handle the expected volume of containers is determined as follows:
Ground slots = (VET x RF x 2.0)/SH VET = (DT x ET x PF)/365
Where VET: Volume within a dwell time DT: Design traffic volume ET: Dwell time PF: Peak factor RF: Re-stowing factor SH: Stacking height
Ground slots = (DT x ET x PF x RF x 2.0)/(SH x 365) Ground slots = (771,430 x 5 x 1.12 x 1.05 x 2.0)/(1.0 x 365) Ground slots = 24,854 m2 Ground slots ≈ 25,000 m2
(5) Medium/long-term development plans for Polloc port
The construction of the wharf including the aforementioned expansion and construction of the berth and other facilities will be completed by 2030 as presented in Table 4.9. The medium- and long-term development plans for 2022 and 2030 are indicated by Figures 4.2 and 4.3 based on the required facilities described above.

Comprehensive capacity development project for the Bangsamoro Sector Report 2-2: Port Development
2-29
Table 4.9 Completion of Port Facilities at Polloc Port by 2022 and 2030
2022 2030 Completion of wharf construction 200 m 200 m Completion of container yard 25,000 m2
(6) Cost estimate on Polloc port development
The costs of the medium- and long-term development plans for 2022 and 2030 are estimated and summarized in Table 4.10.
Figure 4.2 Polloc Port Development Plan by 2022
Figure 4.3 Polloc Port Development Plan by 2030

Comprehensive capacity development project for the Bangsamoro Sector Report 2-2: Port Development
2-30
Table 4.10 Estimated Polloc Port Construction Costs for 2022 and 2030 (Unit: US$)
2022 2030 Cost component Local portion Foreign portion Total Local portion Foreign portion Total A. Construction 10,616,806 7,940,070 18,556,876 14,214,224 10,659,147 24,873,371 1. Preparation works 580,000 1,270,000 1,850,000 580,000 1,270,000 1,850,000 2. Dredging and reclamation 2,614,500 560,500 3,175,000 2,956,500 596,000 3,552,500 3. Berth construction 5,168,650 2,741,050 7,909,700 5,168,650 2,741,050 7,909,700 4. Yard construction 1,431,150 682,350 2,113,500 4,402,875 1,923,375 6,326,250 5. Other expenses 782,506 1,926,170 2,708,676 1,021,199 2,513,722 3,534,921 6. Equipment procurement 40,000 760,000 800,000 85,000 1,615,000 1,700,000B. Contingency and taxes 3,129,704 952,808 4,082,513 4,619,471 1,598,872 6,218,343 1. Physical contingency 530,840 397,003 927,844 710,711 532,957 1,243,669 2. Price escalation 743,176 555,805 1,298,981 1,421,422 1,065,915 2,487,337 3. Taxes and duties 1,855,688 0 1,855,688 2,487,337 0 2,487,337C. Consulting services 467,633 1,019,144 1,558,778 626,809 1,462,554 2,089,363Total project cost (A+B+C) 14,214,144 9,984,022 24,198,166 19,460,504 13,720,573 33,181,077
4.2.6 Urgent improvement plan
Due to the minimal maintenance since 1977, after the completion of port facilities, the fender system and bollards need to be replaced, the water supply system should be rehabilitated, and the soil deposit in front of the wharf should be removed. A detailed investigation should be conducted before the implementation of the improvement of these works. Damaged fenders and bollards are shown in Photos 19 and 20). A rough cost estimate of fenders and bollards replacement is presented in Table 4.11.
Photo 19: Damaged Fenders Photo 20: Damaged Bollards
Table 4.11 Estimated Cost of Fenders and Bollards Replacement
Estimated cost (US$)Fenders 656,000 Bollards 115,500
Total 771,500

Comprehensive capacity development project for the Bangsamoro Sector Report 2-2: Port Development
2-31
4.2.7 Institution of Polloc port
The Polloc port was constructed in 1977 funded by ADB and started its operation in March 1980 by RPMA until 2010. By virtue of MMAA No. 154 and Proclamation No. 1 dated May 15, 2010, the Polloc port was transferred to REZA as the Polloc Freeport and Ecozone as shown on the right. The organization of the Polloc port is composed of the port Manager and Divisions of Resource Management, Port Services, Planning, Business and Investment, Port Police and Engineering Services as shown in Figure 4.4. The Polloc port is operated by a private operator, PTC. However, a new operator of Lamsan Trading will continue the port operation until 2022.
Figure 4.4 Existing Organization of Polloc Port (REZA)
4.2.8 Necessity of cargo and passenger traffic between Polloc and BaSulTa
Cotabato City with its surroundings is envisioned to be the capital of Bangsamoro. With the port and other means of transportation, it is a central location for the transfer of goods and people to and from the nearby main islands, namely, Basilan, Sulu, and Tawi-Tawi. In addition, the Polloc port will be along a trunk line for marine transportation with the three main islands, which may constitute the fundamental infrastructure development to support economic and social activities.
In addition, small islands which are located near the three main islands shall be interconnected to the main islands by feeder lines. The inter-connection between Isabela and Zamboanga is also very important for three main islands. Figure 4.5 shows the schematic flow of marine transportation among all ports in Bangsamoro considering the volume and origins and destinations.
Conventional type ships or RORO ships are commonly used in the Philippines to transport cargos and passengers. The BaSulTa area is rich in agriculture and fishery resources and it also has the potential to establish an agri-industrial center for the processing of agriculture and fishery products. There is a plan to develop the Bongao port into an international seaport and a gateway for trade with Indonesia of BIMP-EAGA.
4.2.9 Development plan of new Cotabato port
The new Cotabato port (Timaco port) was proposed by the defunct Metro Cotabato Regional Agro-Industrial Center. The proposed Timaco port development was denied by the Regional Planning and Development Office (ARMM NEDA) because of the existing and nearby Polloc port only 25 km away.
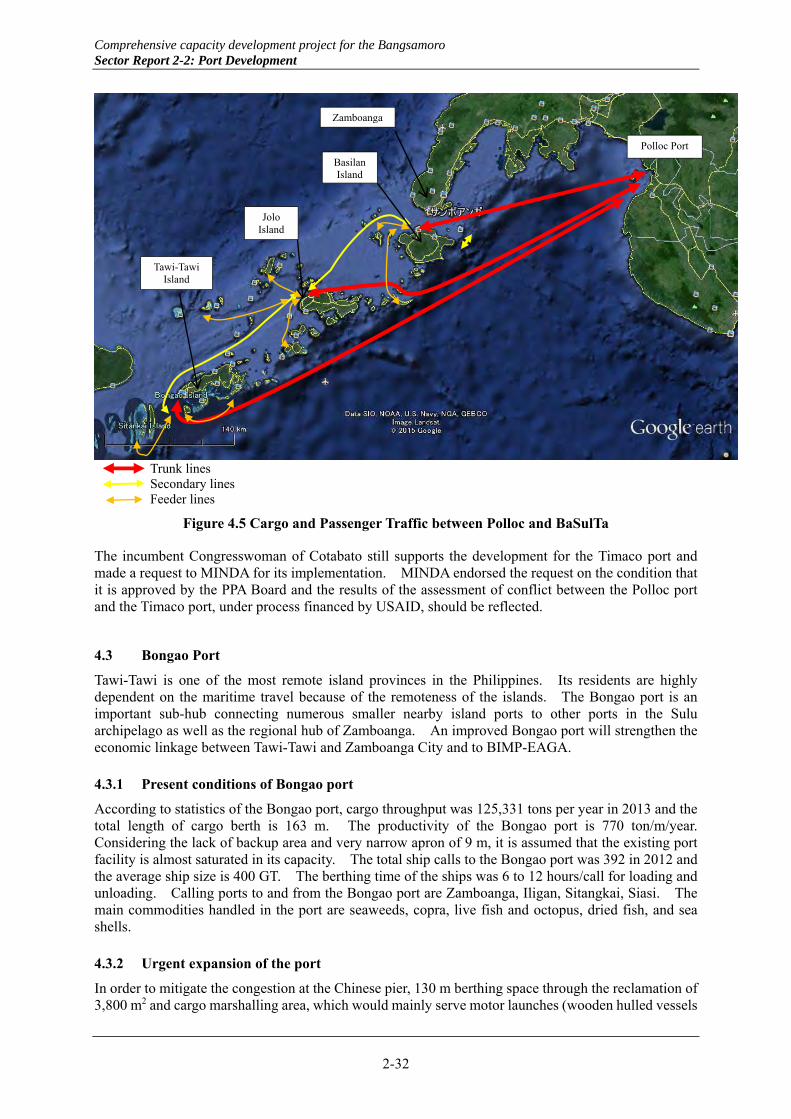
Comprehensive capacity development project for the Bangsamoro Sector Report 2-2: Port Development
2-32
Trunk lines Secondary lines Feeder lines
Figure 4.5 Cargo and Passenger Traffic between Polloc and BaSulTa
The incumbent Congresswoman of Cotabato still supports the development for the Timaco port and made a request to MINDA for its implementation. MINDA endorsed the request on the condition that it is approved by the PPA Board and the results of the assessment of conflict between the Polloc port and the Timaco port, under process financed by USAID, should be reflected.
4.3 Bongao Port
Tawi-Tawi is one of the most remote island provinces in the Philippines. Its residents are highly dependent on the maritime travel because of the remoteness of the islands. The Bongao port is an important sub-hub connecting numerous smaller nearby island ports to other ports in the Sulu archipelago as well as the regional hub of Zamboanga. An improved Bongao port will strengthen the economic linkage between Tawi-Tawi and Zamboanga City and to BIMP-EAGA.
4.3.1 Present conditions of Bongao port
According to statistics of the Bongao port, cargo throughput was 125,331 tons per year in 2013 and the total length of cargo berth is 163 m. The productivity of the Bongao port is 770 ton/m/year. Considering the lack of backup area and very narrow apron of 9 m, it is assumed that the existing port facility is almost saturated in its capacity. The total ship calls to the Bongao port was 392 in 2012 and the average ship size is 400 GT. The berthing time of the ships was 6 to 12 hours/call for loading and unloading. Calling ports to and from the Bongao port are Zamboanga, Iligan, Sitangkai, Siasi. The main commodities handled in the port are seaweeds, copra, live fish and octopus, dried fish, and sea shells.
4.3.2 Urgent expansion of the port
In order to mitigate the congestion at the Chinese pier, 130 m berthing space through the reclamation of 3,800 m2 and cargo marshalling area, which would mainly serve motor launches (wooden hulled vessels
Polloc Port
Tawi-Tawi Island
Jolo Island
Basilan Island
Zamboanga

Comprehensive capacity development project for the Bangsamoro Sector Report 2-2: Port Development
2-33
with GRT ranging from about 60 to 125 tons) and some conventional vessels (steel-hulled vessels with GRT about 100 tons), should be provided. The expansion of the port will help to decongest the Chinese pier. The Chinese pier would then be better able to accommodate inter-island provincial traffic which uses smaller vessels.
Transit sheds will also be constructed to provide storage space for cargo. An additional small passenger terminal will be constructed to serve vessels at the reclaimed area. Perimeter fences and gates will be constructed to allow for better security. A lighting system will be built to allow for better operations at night. These improvements are expected to increase the capacity of the port while improving efficiency, security and safety. The improvement plan is indicated in Figure 4.6.
Figure 4.6 General Plan of Urgent Expansion of Bongao Port
Rough cost estimate for the urgent expansion of the Bongao port is as presented in Table 4.12.
Table 4.12 Rough Cost Estimate for Urgent Expansion of Bongao Port (Unit: US$)
Cost component Local portion Foreign portion Total A. Construction 1,656,202 1,095,067 2,751,269 1. Preparation works 136,000 284,000 420,000 2. Dredging and reclamation 76,680 8,520 85,200 3. Berth construction 661,260 421,260 1,082,520 4. Yard construction 268,383 132,643 401,025 5. Other expenses 286,379 151,145 437,524 6. Equipment procurement 227,500 97,500 325,000 B. Contingency and taxes 473,871 131,408 605,279 C. Consulting services 161,775 69,332 231,107 Total project cost (A+B+C) 2,291,847 1,295,807 3,587,655
4.3.3 Cargo and passenger forecast
Estimated cargo volume and passenger traffic at the Bongao port for 2019, 2022, and 2030 are presented in Table 4.13.
Table 4.13 Cargo Forecast for Bongao Port in 2019, 2022, and 2030
Bongao port Year 2019 2022 2030
Cargo (MT) 253,363 348,384 538,728 Passengers 233,434 265,623 316,135

Comprehensive capacity development project for the Bangsamoro Sector Report 2-2: Port Development
2-34
4.3.4 Proposed port development
(1) Required number of berths
The number of berths required to handle a given volume of cargos differs greatly depending on the nature of the port, kind of cargo, cargo handling facilities, etc. There are several methods in determining the number of berth length. For the rough estimate of the required total length of berth, the unit productivity method is mainly used as below.
Unit productivity = (Converted Cargo volume)/(converted berth length) Unit productivity = 700–1,100 t/m
The adjusting rate for bulk and general cargo is 0.5, and the adjusting rate for berth is presented in Table 4.4 (see the subsection 4.2.5 for the Polloc port). The required berth length at the Bongao port for the target year of 2019, 2022, and 2030 is projected as presented in Table 4.14.
Table 4.14 Required Berth Length at Bongao Port in 2019, 2022, and 2030
Year Cargo throughput
(ton) Required berth length (m) [a]
Existing berth length (m) [b]
Required extension of berth [a]-[b]
Proposed extension of berth (m)
2019 253,363 189 163 26 0 2022 348,384 260 163 97 200 2030 538,728 402 163 239 100
(2) Required transit shed area
The transit shed area required to handle the expected volume of cargos is calculated as follows:
Transit shed area = (VET x RF x 2.2)/SD VET = (DT x ET x PF)/365
Where VET: Volume within a dwell time DT: Design traffic volume ET: Dwell time PF: Peak factor RF: Restowing factor SD: Stacking density (1.0–1.50 MT/m2 for general cargo)
Transit shed area = (DT x ET x PF x RF x 2.2)/(SD x 365) Transit shed area = (538,728 x 25% x 5 x 1.12 x 1.05 x 2.2)/(1.5 x 365) Transit shed area = 3,182 m2 Transit shed area ≈ 3,200 m2
(3) Required open storage
The open storage area required is calculated as follows.
Open storage area = (VET x RF x 2.0)/SD VET = (DT x ET x PF)/365
Where VET: Vol. within a dwell time DT: Design traffic volume ET: Dwell time PF: Peak factor RF: Restowing factor SD: Stacking density (1.0–1.50 MT/m2 for general cargo)
Open storage area = (DT x ET x PF x RF x 2.0)/(SD x 365) Open storage area = (538,728 x 55% x 5 x 1.12 x 1.05 x 2.0)/(1.5 x 365) Open storage area = 6,364 m2 Open storage area ≈ 6,400 m2

Comprehensive capacity development project for the Bangsamoro Sector Report 2-2: Port Development
2-35
(4) Development plan for new Bongao port
The construction of the wharf including the aforementioned expansion and construction of the berth and other facilities will be completed by 2030 as presented in Table 4.15.
Table 4.15 Completion of Port Facilities at Bongao Port by 2022 and 2030
2022 2030 Completion of wharf construction 200 m 100 m Completion of transit shed 1,600 m2 1,600 m2 Completion of open storage area 3,200 m2 3,200 m2
The provincial government plans to implement the Tawi-Tawi ecozone agri-industrial project with 83 ha in Barangay Marasa of Bongao Municipality. Due to the narrow passage and shallow water depth and the lack of space for expansion at the existing Bongao port, a new Bongao port will be constructed in this project area as illustrated in Figure 4.7.
Location Plan of New Bongao Port Key Map of Barangay Marasa
Figure 4.7 General Layout Plan of New Bongao Port for Year 2022 and 2030
New Bongao Port Brgy. Marasa
Existing Port

Comprehensive capacity development project for the Bangsamoro Sector Report 2-2: Port Development
2-36
(5) Cost estimate on new Bongao port construction
A summary of cost estimates for the Bongao port development is presented in Table 4.16.
Table 4.16 Estimated Bongo Port Construction Costs for 2022 and 2030 (Unit: US$)
2022 2030 Cost component Local portion Foreign portion Total Local portion Foreign portion Total A. Construction 8,642,198 8,294,967 16,937,165 4,140,292 4,057,868 8,198,160 1. Preparation works 242,000 498,000 740,000 144,000 286,000 430,000 2. Dredging and reclamation 1,255,950 165,300 1,421,250 648,000 72,000 720,000 3. Berth construction 1,530,400 2,545,600 4,076,000 695,450 1,169,050 1,864,500 4. Yard construction 3,472,700 1,560,300 5,033,000 1,720,250 773,250 2,493,500 5. Building construction 1,255,100 537,900 1,793,000 504,000 216,000 720,000 6. Other expenses 836,048 2,037,867 2,873,915 398,592 971,568 1,370,160 7. Equipment procurement 50,000 950,000 1,000,000 30,000 570,000 600,000B. Contingency and taxes 2,730,780 995,396 3,726,176 1,316,651 486,944 1,803,595C. Consulting services 533,521 1,244,882 1,778,403 482,052 206,594 688,645Total project cost (A+B+C) 11,906,499 10,535,245 22,441,744 5,938,995 4,751,406 10,690,401
4.4 Jolo Port
The port of Jolo is the main entry port via the sea to the province of Sulu. It is protected on the northwest by the islands of Cabucan, Marongas and Pangasinan, and on the east by the mountainous range on the island. The port has adequate water and land frontage for the development of port facilities and port oriented industries. According to the feasibility studies and the formulation of a master plan for selected ports in Southern Mindanao conducted in April 2012 by PPA (“the FS in Southern Mindanao” hereinafter), the superstructure of the pier has deteriorated and reinforcing bars have been exposed which are severely corroded. The concrete piles above water have cracks, and many reinforcing bars are rusted completely (Photos 21 and 22).
Photo 21: Superstructure Photo 22: Piles
4.4.1 Present condition of Jolo port
According to the statistics of the Jolo port, cargo throughput at the port is 157,072 tons in 2013 and the total length of the cargo berth is 585 m. The productivity of the Jolo port is only 268 ton/m/year. The one of reasons for under-utilization of the port is the considerable deterioration of the port facilities. Urgent rehabilitation of the berthing facility should be undertaken for handling of increased cargo volume and safety of the port operation. The total ship calls to the Jolo port in 2013 was 1,746, the average ship size was 321 GT and the average berthing time of the ships was 16 hours per call for loading and unloading as recorded in 2009 and 2010. The calling ports to and from the Jolo port are Zamboanga, Sandakan, Bongao, Sitangkai, Siasi, and Luuk. The main commodities handled at the port are cement, food (inbound), copra, seaweeds, abaca, charcoal, and dried/fresh fish (outbound).

Comprehensive capacity development project for the Bangsamoro Sector Report 2-2: Port Development
2-37
4.4.2 Cargo and passenger forecast
Based on the FS in Southern Mindanao, cargo throughput and passenger traffic are estimated and presented in Table 4.17. In the present study, cargo and passenger traffic is estimated as presented in Table 4.18.
Table 4.17 Cargo Forecast for Jolo Port Based on FS in Southern Mindanao
Year Motor launch
cargo (t) RoRo cargo
(t) Conventional
cargo (t) Liner/RoPax
(t) WHV cargo
(t) Total cargo
(t) Passengers
(n) 2011 26,886 72,592 169,381 8,856 277,715 621,690 2012 28,012 75,634 176,478 9,227 289,351 649,355 2013 29,186 78,803 159,969 23,903 9,614 301,475 678,251 2014 30,409 82,104 165,551 26,026 10,016 314,106 708,433 2015 31,683 85,545 171,268 28,336 10,436 327,268 739,959 2016 33,011 89,129 177,115 30,852 10,873 340,980 772,887 2017 34,394 92,863 183,090 33,592 11,329 355,268 807,281 2018 35,835 96,754 189,186 36,574 11,804 370,153 843,205 2019 37,336 100,808 195,398 39,821 12,298 385,661 880,727 2020 38,901 105,032 201,719 43,357 12,814 401,823 919,920 2025 50,151 128,243 233,263 65,970 15,733 493,360 1,143,6482030 64,508 156,578 264,493 100,856 19,317 605,752 1,421,786
Table 4.18 Cargo Forecast for Jolo Port in 2019, 2022, and 2030
Jolo Port Year 2019 2022 2030
Cargo (MT) 314,769 368,564 456,118 Passengers 524,141 613,720 759,511
The difference in both forecasts by the FS in South Mindanao is due to the decrease in cargo and passenger traffic between 2010 and 2013; specifically the cargo throughput decreased from 268,268 tons in 2010 to 153,769 tons in 2011, 98,835 tons in 2012 and 157,027 tons in 2013. It is considered that the Jolo port still has the potential cargo volume of 268,268 tons in 2015 after the normalization of Bangsamoro, and therefore, the decreasing cargo volume from 2011 to 2013 is not taken into account.
The estimated cargo throughput by vessel type for the target years is summarized in Table 4.19.
Table 4.19 Estimated Cargo Volume by Vessel Type at Jolo Port in 2019, 2022, and 2030
Year Motor launch
cargo (t) RoRo cargo
(t) Conventional
cargo (t) Liner/RoPax
(t) WHV cargo
(t) Total cargo
(t) 2019 30,473 82,278 159,480 32,501 10,037 314,769 2022 35,681 96,339 186,736 38,056 11,753 368,564 2030 48,573 117,900 199,157 75,942 14,545 456,118
4.4.3 Proposed port development
The required capacities of facilities are calculated based on the types of vessels calling such as RoRo passenger/cargo type, RoPax passenger/cargo vessels, fast craft type, motor launches, the motorized banca/wooden hulled passenger/cargo vessels and the conventional cargo vessels. The requirements of berths in 2030 are calculated for each vessel type are calculated below.
(1) RoRo berth
Number of berth (NOB) = (Design traffic)/(Gross productivity [{8,760 x ABOR} - BDH]) Where:
NOB: Number of berth DT: Design traffic GP: Gross productivity considering the effects of berthing/deberthing hours (BDH) NOB = 117,900/(22.83 x (8760 x 0.51)
Comprehensive capacity development project for the Bangsamoro Sector Report 2-2: Port Development
2-38
NOB = 1.15 berths
(2) Conventional berth
NOB = 199,157 /(10.09 x (8760 x 0.65) NOB = 3.47 berths
Berth length 4 x 1.1 x 55 = 242 m
(3) Liner/RoPax berth
NOB = 75,942 /(68.21 x (8760 x 0.47) NOB = 0.27 berths
Berth length 1 x 1.1 x 95 = 104.5 m
(4) Motor launch
NOB = 48,573 /(7.99 x (8760 x 0.55) NOB = 1.26 berths
Berth length 1 x 1.1 x 35 = 39 m
(5) Motorized banca/WHV (wooden hulled vessel)
NOB = 14,545 /(0.63 x (8760 x 0.67) NOB = 3.93 berths
Berth length 4 x 1.1 x 15 = 66 m
(6) Transit shed
Transit shed area = (DT x ET x PF x RF x 2.2)/(SD x 365) Transit shed area = (456,118 x 25% x 5 x 1.12 x 1.05 x 2.2)/(1.5 x 365) Transit shed area = 2,694 m2 (≈ 2,700 m2)
(7) Open storage
Open storage area = (DT x ET x PF x RF x 2.0)/(SD x 365) Open storage area = (456,118 x 55% x 5 x 1.12 x 1.05 x 2.0)/(1.5 x 365) Open storage area = 5,388 m2 (≈ 5,400 m2)
(8) Container slots
Ground slots = (DT x ET x PF x RF x 2.0)/(SH x 365) Ground slots = (75,942 x 5 x 1.12 x 1.05 x 2.0)/(1.0 x 365) Ground slots = 2,446 m2 (≈ 2,500 m2)
The number of berths required in 2019, 2022, and 2030 is presented in Table 4.20. Considering the berth arrangement, one finger pier will not be constructed by 2019 as indicated in Figure 4.8.
Table 4.20 Required Number of Berths at Jolo Port in 2019, 2022, and 2030
Year RoRo berth
(n) Conventional
berth (n) Liner/RoPax
berth (n) Motor
launch (n)Motorized
banca/WHV (n) Fast craft
(n) 2019 1 3 1 1 3 1 2022 1 4 1 1 4 1 2030 1 4 1 1 4 1

Comprehensive capacity development project for the Bangsamoro Sector Report 2-2: Port Development
2-39
Figure 4.8 General Layout Plan of Jolo Port for 2019 and 2030
4.4.4 Rough cost estimate
Rough cost estimates of the Jolo port development for 2030 are summarized in Table 4.21.
Table 4.21 Rough Cost Estimates of Jolo Port Development for 2030
Cost component Amount (US$)A. General expenses 339,284B. Marine works 9,573,925 - Reclamation 1,603,885 - Finger pier 1,108,919 - RC wharf (piles) L=152 m 1,843,714 - RC wharf (RC sheet piles) L=138 m 2,511,035 - Retaining wall 1,674,304 - RoRo ramp (1 & 2) 478,580 - Revetment 156,647 - Demolition works 196,842C. Civil works 2,611,171D. Building works 2,332,565E. Utilities 723,530Subtotal (construction cost) 15,580,476F. Contingency and taxes 3,428,305 - Physical contingency 779,024 - Price escalation 1,090,633 - Taxes and duties 1,558,648G. Consulting services 1,246,438Total project cost (A+B+C+D+E+F+G) 20,255,218
4.5 Isabela Port
The port of Isabela handled only domestic cargo traffic up to the present. The traffic cargo volume handled at this port as compared to the port of Zamboanga was very much smaller and most of the cargo traffic was transported to and from the port of Zamboanga. From 1980 to 1997, the cargo volume and passenger traffic is indicated as shown in Table 4.22.

Comprehensive capacity development project for the Bangsamoro Sector Report 2-2: Port Development
2-40
Table 4.22 Cargo Volume and Passenger Traffic at Isabela Port (1980–1997)
Year 1980 1984 1985 1986 1987 1988 1989 1990 Cargo (MT) 115,723 107,005 102,807 109,681 110,069 116,336 138,972 153,198Passengers 533,193 292,442 295,541 298,800 299,244 817,877 620,479 615,434
Year 1991 1992 1993 1994 1995 1996 1997
Cargo (MT) 116,781 119,312 137,114 160,223 187,210 175,072 198,793Passengers 506,877 496,033 618,324 571,283 653,776 708,189 731,111
The cargo volume at the port in the past years was characterized by fluctuation. The trend in 1980 to 1985 was downward and decreased steadily to only 102,807 tons, which is equivalent to a negative growth rate of 2.34% per year. The cargo traffic started increasing in 1986 and for the period from 1885 to 1997, the trend was increasing at an average rate of 5.65% per year although the cargo volume went down in 1991. This decrease in volume may have been due to in the effect of the oil price increase in December 1990 and the power crisis that started in 1991. However, in spite of the decrease of volume, the trend for this period was a positive growth. The record of maximum volume in this period is 198,793 tons in 1997.
On the other hand, the port of Isabela handled 533,193 passengers in 1980. The number of passengers has increased to 731,111 in 1997. The average growth rate of passengers handled by the port was only 1.87% per year. The number of passengers went down to 292,442 in 1984, and decreased at the rate of 11.13% per year. However, the number increased in the succeeding years at the rate of 15.80% per year from 1985 to 1990 and by 2.49% per year from 1990 to 1997. The largest number of passengers recorded in this period was 817,877 in 1988, but the largest number of passengers until 2013 was 1,618,837 in 2004.
4.5.1 Present conditions of Isabela port
According to statistics of the Isabela port, cargo throughput was 106,195 tons in 2013 and the total length of the cargo berth is 300 m. The productivity of the Isabela port is only 354 ton/m/year. One of the reasons for the under-utilization of the port is the considerable cargo throughput decrease from 150,000 tons in 2004 to 100,000 tons in 2013 and the lack of a backup area behind the wharf. The total ship calls to the Isabela port was 3,745 in 2013, the average ship size was 283 GT and the average berthing time of the ships was 15 hours/call for loading and unloading in the record of 1980 to 1997.
The calling ports to and from the Isabela port are Zamboanga, Jolo and Bongao. The main commodities handled in the port are bottled cargo, petroleum products, palay/rice, cement (inbound), and copra and general cargo (outbound). In addition, deterioration of the port facilities was found in the feasibility study with the master plan port package V port of Isabela, Basilan in 2000 by PPA (FS PPA 2000). Urgent rehabilitation of the berthing facility should be undertaken for the handling of increased cargo volume and safety of the port operation. Typical damages are shown in Photos 23 and 24.
Photo 23: Peeled concrete cover and exposed re-bars Photo 24: Badly damaged concrete pile of deck

Comprehensive capacity development project for the Bangsamoro Sector Report 2-2: Port Development
2-41
4.5.2 Cargo and passenger forecast
Estimated cargo volume and passenger traffic at the Isabela port for 2019, 2022 and 2030 are indicated in Table 4.23.
Table 4.23 Cargo Forecast for Isabela Port in 2019, 2022, and 2030
Isabela portYear 2019 2022 2030
Cargo (MT) 129,118 145,240 170,172 Passengers 1,443,345 1,568,013 1,752,480
4.5.3 Proposed port development
Estimated cargo throughput in 2030 is 170,172 tons per year which is smaller than the recorded maximum cargo throughput of 198,793 tons in 1997. The total berth length in 2000 was only 209 m but the berth length has been extended up to 300 m as of 2015. This means the present port capacity will be increased to more than 198,793 tons to accommodate the estimated cargo throughput in 2030. Also, the passenger forecast of 1,752,480 in 2030 is almost the same as the maximum record of the passengers of 1,618,837 in 2004. Therefore, expansion of the port facilities will not be necessary for the Isabela port. As mentioned above, however, urgent rehabilitation of the wharf structure such as concrete slab and piles should be made immediately for the handling of increased cargo volume and safety of the port operation. In addition, the apron width for the loading/unloading of cargo is very narrow at present and this causes the low productivity, and so it is recommended to expand the backup area to stack the incoming cargo temporarily from outside in order to load at night time.
Figure 4.9 General Layout Plan of Isabela Port
4.5.4 PPA expansion plan and land acquisition by Provincial Government
A new port construction is proposed in the northern area based on the cargo throughput of 530,000 tons per year in the FS PPA 2000 as shown in Figures 4.10 and 4.11. For the new port, the provincial government purchased the land for the new port construction area south of Isabela City (Photo 25).
Expansion of backup area

Comprehensive capacity development project for the Bangsamoro Sector Report 2-2: Port Development
2-42
Figure 4.10 General Plan of New Isabela Port
Figure 4.11 Location Map of Proposed New Port
Photo 25: Land purchased by Provincial Government