Comprehensive Cannabis Analysis-Pesticides, Aflatoxins ... notes/Comprehensive-Cannabis... · p 1...
5
p 1 Comprehensive Cannabis Analysis: Pesticides, Aflatoxins, Terpenes, and High Linear Dynamic Range Potency from One Extract Using One Column and One Solvent System Robert Di Lorenzo 1 , Diana Tran 2 , KC Hyland 2 , Simon Roberts 2 , Scott Krepich 3 , Paul Winkler 2 , Craig Butt 2 , April Quinn-Paquet 2 and Christopher Borton 2 1 SCIEX, Canada, 2 SCIEX, USA, 3 Phenomenex, USA Increased legalization of Cannabis for medical and adult use in the United States and Canada substantiates the need for robust and reproducible methods for analysis of Cannabis products for consumer health and safety. The state of Oregon released its list of pesticides and action limits required for products in 2015, with several states since adopting this or modified versions 1 . Some pesticides on this list have been historically monitored by GC-MS requiring complicated sample preparation with derivatization and relatively long sample run times. Additionally, quantitation of aflatoxins and terpenes are increasingly demanded. The SCIEX vMethod™ Application demonstrates the capability of the SCIEX Triple Quad™ or QTRAP ® 6500+ system in meeting the maximum residual levels (MRLs) for the full suite of pesticides comprising the Oregon Pesticide List in Cannabis flower matrix, and typical potency assessment through cannabinoid quantitation. In order to perform comprehensive testing of Cannabis products, four compounds classes (pesticides, cannabinoids, aflatoxins and terpenes) were measured using a novel high LDR potency analysis strategy (Figure 1) in flower samples, using a single sample preparation protocol and two sample injections. Key Advantages of Comprehensive Cannabis Analysis • The SCIEX vMethod application for Quantitation of Pesticide Residues in Cannabis Matrices presents a simplified sample preparation protocol complete with analysis of all 59 compounds using electrospray ionization (ESI) and LC- MS/MS 2 . A 16 minute gradient maximizes separation of endogenous isobaric matrix interferences for pesticide and aflatoxin analyses. • Additionally, the method can be used to analyze ten cannabinoids and six terpenes from the same sample extract using a seven-minute acquisition method utilizing atmospheric pressure chemical ionization (APCI). This single method can be used to determine potency from product cannabinoid concentrations between 0.03-90%, provide baseline separation of isobaric cannabinoids, and separate terpene isomers to assess the Cannabis flavor profile. Figure 1. High LDR Potency Analysis Strategies Employed for Three Example Cannabinoids. Sample concentration is expected to be below 1% for cannabinoids requiring detuning. All concentrations of cannabinoids are listed as effective concentrations pre-dilution. Calibration range is 10 ppb-30 ppm in vial.
Transcript of Comprehensive Cannabis Analysis-Pesticides, Aflatoxins ... notes/Comprehensive-Cannabis... · p 1...

p 1
Comprehensive Cannabis Analysis: Pesticides, Aflatoxins,
Terpenes, and High Linear Dynamic Range Potency from
One Extract Using One Column and One Solvent System
Robert Di Lorenzo1, Diana Tran2, KC Hyland2, Simon Roberts2, Scott Krepich3, Paul Winkler2, Craig Butt2, April Quinn-Paquet2 and Christopher Borton2 1SCIEX, Canada, 2SCIEX, USA, 3Phenomenex, USA
Increased legalization of Cannabis for medical and adult use in
the United States and Canada substantiates the need for robust
and reproducible methods for analysis of Cannabis products for
consumer health and safety. The state of Oregon released its list
of pesticides and action limits required for products in 2015, with
several states since adopting this or modified versions1. Some
pesticides on this list have been historically monitored by GC-MS
requiring complicated sample preparation with derivatization and
relatively long sample run times. Additionally, quantitation of
aflatoxins and terpenes are increasingly demanded.
The SCIEX vMethod™ Application demonstrates the capability
of the SCIEX Triple Quad™ or QTRAP® 6500+ system in
meeting the maximum residual levels (MRLs) for the full suite of
pesticides comprising the Oregon Pesticide List in Cannabis
flower matrix, and typical potency assessment through
cannabinoid quantitation. In order to perform comprehensive
testing of Cannabis products, four compounds classes
(pesticides, cannabinoids, aflatoxins and terpenes) were
measured using a novel high LDR potency analysis strategy
(Figure 1) in flower samples, using a single sample preparation
protocol and two sample injections.
Key Advantages of Comprehensive Cannabis Analysis
• The SCIEX vMethod application for Quantitation of Pesticide
Residues in Cannabis Matrices presents a simplified sample
preparation protocol complete with analysis of all 59
compounds using electrospray ionization (ESI) and LC-
MS/MS2. A 16 minute gradient maximizes separation of
endogenous isobaric matrix interferences for pesticide and
aflatoxin analyses.
• Additionally, the method can be used to analyze ten
cannabinoids and six terpenes from the same sample extract
using a seven-minute acquisition method utilizing atmospheric
pressure chemical ionization (APCI). This single method can
be used to determine potency from product cannabinoid
concentrations between 0.03-90%, provide baseline
separation of isobaric cannabinoids, and separate terpene
isomers to assess the Cannabis flavor profile.
Figure 1. High LDR Potency Analysis Strategies Employed for Three Example Cannabinoids. Sample concentration is expected to be below 1% for cannabinoids requiring detuning. All concentrations of cannabinoids are listed as effective concentrations pre-dilution. Calibration range is 10 ppb-30 ppm in vial.

p 2
Experimental
Extraction: Samples were extracted into acetonitrile according
to the modified vMethod™ protocol (Figure 2)2. No further
sample cleanup was performed, although additional dilution was
used for potency and terpene analysis.
HPLC Conditions: Analytes from all compound classes were
separated on a Phenomenex Kinetex 2.6 µm Biphenyl LC
Column (150 x 4.6 mm) using a SCIEX ExionLC™ AD system,
with mobile phases consisting of A) Water + 5 mM ammonium
acetate + 0.1% formic acid and B) Methanol:Water (98:2) + 5
mM ammonium acetate. Pesticides and aflatoxins can be
separated concurrently in a 16 minute gradient, while
cannabinoids and terpenes can be separated concurrently in a
seven minute gradient.
MS Conditions: All compounds were analyzed using a SCIEX
QTRAP® 6500+ system with Scheduled MRM™ Algorithm
(Analyst® software 1.6.3). Pesticides and aflatoxins were
analyzed using electrospray ionization (ESI) in positive polarity
with the following source settings: ISV = 5500 V, TEM = 450 ºC,
CUR = 35 psi, CAD = 11, GS1 = 80 psi, GS2 = 70 psi. Terpenes
and cannabinoids were analyzed using atmospheric pressure
chemical ionization (APCI) in positive polarity with the following
source settings: NC = 1 µA, TEM = 625 ºC, CUR = 35 psi, CAD
= 11, GS1 = 37 psi.
Figure 2. Simplified Sample Preparation. A simplified extraction procedure is outlined by the SCIEX vMethod Application for Quantitation of Pesticide Residues in Cannabis Matrices which is also employed for the analysis of terpenes and aflatoxins.
Pesticides and Aflatoxins by ESI(+)
The 59 OR list pesticides include multiple highly polar
compounds which can be difficult to retain using C18 column
chemistry. The Kinetex biphenyl column improves retention of
such compounds (eg. acephate, daminozide) while also
providing improved separation of target analytes from isobaric
matrix interferences (Figure 3). Cannabis flower samples, with
variation observed between strains, typically exhibit an
endogenous background signal for pyrethrin- like compounds,
separation of which from target pyrethrins is critical for
quantitation2.
Figure 3: Improved Chromatographic Separation. A.) OR list pesticides analyzed in ESI+ mode. Chromatography achieved using a Kinetex biphenyl column. Elution profile is shown for a calibration standard. B.) Separation of four aflatoxins was achieved in conjunction with the pesticides using a Kinetex biphenyl column and a 16-minute gradient.
Some states, including California, regulate or have proposed
regulation of Alflatoxin residues in Cannabis. Action levels
defined for aflatoxins are well below those outlined for most
pesticides and quantitation in the parts per trillion range is
necessary. Four target aflatoxins were monitored in the same
acquisition method as the pesticides. Two transitions of each
were included in the ESI+ data collection with the pesticide suite,
using the same prepared sample and solvent system. Excellent
linearity and precision were demonstrated for all targets.
Cannabis flower action limits of 2ppb in plant correspond to
0.0133ppb in the injected sample. Chromatographic peaks at
LOQs below this concentration (at 0.0125ppb) are clearly
detectable (Figure 4).
A
B

p 3
Figure 4. Monitoring Aflatoxins. Calibration linearity, as well and precision and replicate (n=4) chromatographic peaks for aflatoxins at LOQ concentrations of 12.5ppt.
High Linear Dynamic Range (LDR) Potency Analysis by APCI(+)
Potency analysis involves quantitative reporting of cannabinoid
compounds. Cannabinoid levels can differ vastly between
cannabinoids in a single sample, but also across strain or
product types, with products claiming concentrations 90%+ by
weight for some compounds (i.e. THCA). High LDR Potency
Analysis is a strategy to extend the range for cannabinoids
quantitation from 0.05-100% by weight in a single analysis. The
strategy utilizes dilution, alternative MRM transitions, and
detuned instrument voltages.
Dilution: 1:200 dilution applied to the already 1:6 diluted sample
extract used for pesticide/aflatoxin anaysis. A 10ppb standard
becomes equivalent to 0.03% concentration in extract, achieving
quantitation at the low end. Additional calibration standards up to
33ppm (equivalent of 99% in sample) extend quantitation to the
high end range.
Alternative transitions: Multiple MRM transitions can be
monitored for each cannabinoid compound, and some transitions
are significantly more sensitive than others (Figure 1). More
sensitive transitions can be used for low end cannabinoid
quantitation, and less sensitive transitions can be used to avoid
saturation and achieve quantitation at the high end. Detuned transitions: Declustering Potential (DP) and/or
Collision Energy (CE) voltages are adjusted to non-optimized
values, decreasing the sensitivity for transitions corresponding to
high concentration cannabinoids in order to avoid detector
saturation at the high end of calibration.
Application of these strategies to extend quantitative
concentration range of cannabinoids of very different
endogenous concentrations during product potency analysis was
demonstrated effective. In Figure 1 above, three examples are
shown: in the sample flower matrix tested, THC is shown to be
measurable within the concentration range of the calibration
curve for the primary, optimized MRM transition. No further
adjustment to the data processing is necessary. THCA, present
at a higher concentration in the sample, requires the use of an
alternative (less sensitive) transition for processing in order to
keep signal in the calibration range. In a third example, the high
concentration of THCV necessitates further adjustment in
utilization of the detuned (further decreased sensitivity) MRM
transitions to achieve a signal within the calibration range (Figure
1).
These strategies combined with an appropriate calibration curve
range spanning relevant concentration ranges allow for potency
analysis with a single sample preparation and acquisition
method. Including all alternative and detuned transitions in the
acquisition method provides the flexibility in data processing to
choose the transitions for quantitation that are suitable for the
individual sample or scenario. A decision tree (Figure 5) outlines
the process for deciding when to use each strategy during post-
acquisition processing. Table 1 details the achievable linear
quantitation range for each target cannabinoid.
p 4
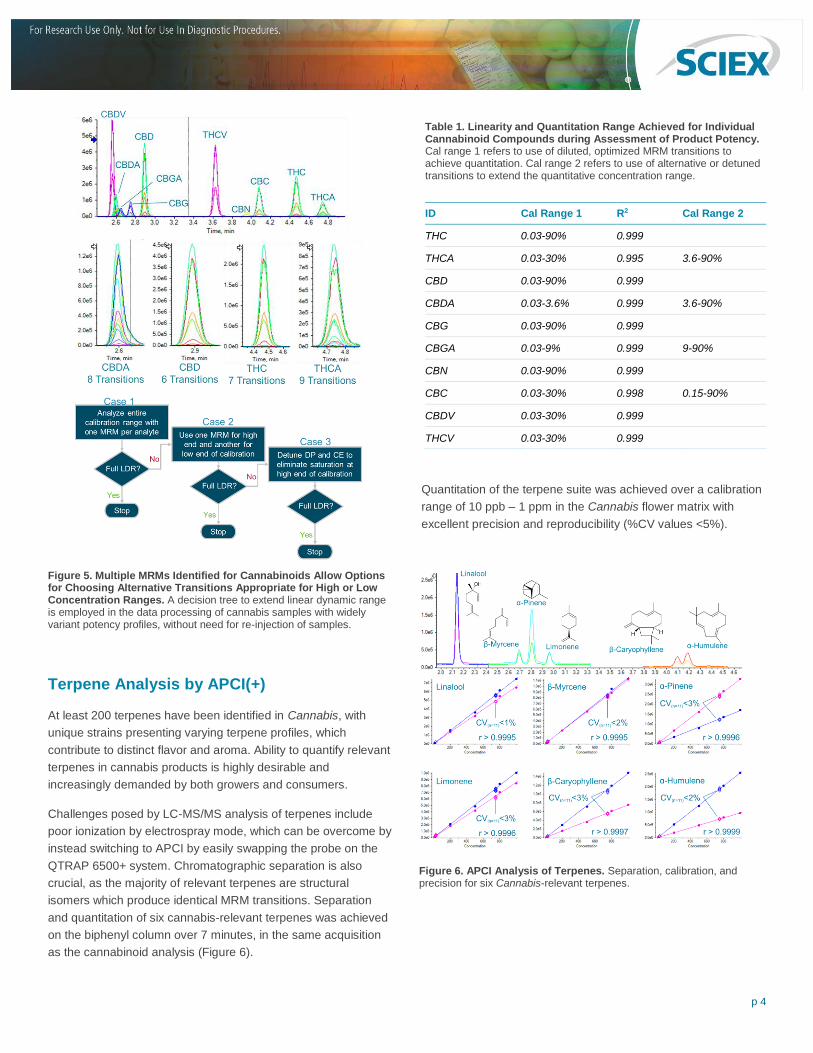
Terpene Analysis by APCI(+)
At least 200 terpenes have been identified in Cannabis, with
unique strains presenting varying terpene profiles, which
contribute to distinct flavor and aroma. Ability to quantify relevant
terpenes in cannabis products is highly desirable and
increasingly demanded by both growers and consumers.
Challenges posed by LC-MS/MS analysis of terpenes include
poor ionization by electrospray mode, which can be overcome by
instead switching to APCI by easily swapping the probe on the
QTRAP 6500+ system. Chromatographic separation is also
crucial, as the majority of relevant terpenes are structural
isomers which produce identical MRM transitions. Separation
and quantitation of six cannabis-relevant terpenes was achieved
on the biphenyl column over 7 minutes, in the same acquisition
as the cannabinoid analysis (Figure 6).
Quantitation of the terpene suite was achieved over a calibration
range of 10 ppb – 1 ppm in the Cannabis flower matrix with
excellent precision and reproducibility (%CV values <5%).
Figure 5. Multiple MRMs Identified for Cannabinoids Allow Options for Choosing Alternative Transitions Appropriate for High or Low Concentration Ranges. A decision tree to extend linear dynamic range is employed in the data processing of cannabis samples with widely variant potency profiles, without need for re-injection of samples.
Table 1. Linearity and Quantitation Range Achieved for Individual Cannabinoid Compounds during Assessment of Product Potency. Cal range 1 refers to use of diluted, optimized MRM transitions to achieve quantitation. Cal range 2 refers to use of alternative or detuned transitions to extend the quantitative concentration range.
ID Cal Range 1 R2 Cal Range 2
THC 0.03-90% 0.999
THCA 0.03-30% 0.995 3.6-90%
CBD 0.03-90% 0.999
CBDA 0.03-3.6% 0.999 3.6-90%
CBG 0.03-90% 0.999
CBGA 0.03-9% 0.999 9-90%
CBN 0.03-90% 0.999
CBC 0.03-30% 0.998 0.15-90%
CBDV 0.03-30% 0.999
THCV 0.03-30% 0.999
Figure 6. APCI Analysis of Terpenes. Separation, calibration, and precision for six Cannabis-relevant terpenes.

p 5
Summary
The SCIEX vMethod is verified for extraction of Cannabis flower
and concentrate and subsequent analysis for Oregon mandated
pesticides and potency2. Additional work is also presented
showing quantitation and characterization of a comprehensive
suite of residues and active ingredients- including pesticides,
aflatoxins, cannabinoids, and terpenes- using a single extraction
protocol, mass spectrometer, and LC separation configuration.
These compounds can all be analyzed using two acquisition
methods: one which monitors pesticides and aflatoxins, and the
other monitoring terpenes and cannabinoids.
Pesticides: LOQs were established in both solvent as well as
extracted cannabis flower. LOQ’s in cannabis flower were
achieved with ±20 %CV for all pesticides on the Oregon list. It
was observed that there were many differences in the nature and
extent of matrix interference between cannabis flower strains.
However, during development, ten different matrix strains were
analyzed and the target transitions were found to be
chromatographically separated from endogenous interferences
in 9 of the tested strains.
Aflatoxins: Sensitive and precise quantitation of four commonly
targeted aflatoxins is achieved to ppt levels in the same data
acquisition as the pesticide method with no additional processing
requirements.
Potency (Cannabinoids): High linear dynamic range
quantitation of the cannabinoid suite from 0.03% - 90%
concentration by weight was achieved using a combination of
dilution, monitoring alternative MRM transitions, and detuning
instrument voltages for MRM transitions. These plus an
appropriate calibration curve range allow for potency analysis
with a single sample preparation and acquisition method. These
transitions were monitored in the same acquisition method as the
terpenes.
Terpenes: Using APCI allows for the ionization of these flavor
and aroma compounds. Chromatographic separation allows the
distinction between structural isomers. Precise and accurate
quantitation using the same acquisition method as the
cannabinoids is demonstrated.
References
1. Farrer DG. Technical report: Oregon Health Authority’s
process to decide which types of contaminants to test for in
cannabis. Oregon Health Authority. (2015)
2. Tran, D., Hyland, K., Roberts, S., Krepich, S., Winkler, P.,
Butt, C. Quinn-Paquet, A., and C. Borton. Quantitation of
Oregon List of Pesticides and Cannabinoids in Cannabis
Matrices by LC-MS/MS. SCIEX Application Note. (2016)
AB Sciex is doing business as SCIEX.
© 2017 AB Sciex. For Research Use Only. Not for use in diagnostic procedures. The trademarks mentioned herein are the property of AB Sciex Pte. Ltd. or their respective owners. AB SCIEX™ is being used under license.
Document number: RUO-MKT-02-7218-A