Comprehensive Annual Financial ... - Tuolumne County, CA
151
County of Tuolumne California Comprehensive Annual Financial Report Fiscal Year Ended June 30, 2019 Deborah Bautista, CPA Clerk and Auditor-Controller
Transcript of Comprehensive Annual Financial ... - Tuolumne County, CA
County of Tuolumne
California
Comprehensive Annual Financial Report
Fiscal Year Ended
June 30, 2019
Deborah Bautista, CPA
Clerk and Auditor-Controller


County of Tuolumne California
Comprehensive Annual Financial Report
Fiscal Year Ended June 30, 2019
Prepared by The Office of the Tuolumne County Auditor-Controller
Deborah Bautista, CPA Clerk & Auditor-Controller


COUNTY OF TUOLUMNE, CALIFORNIA COMPREHENSIVE ANNUAL FINANCIAL REPORT
FOR THE YEAR ENDED JUNE 30, 2019
Table of Contents Page(s)
Introductory Section Letter of Transmittal ........................................................................................................................ i-vi Elected and Appointed Officials ....................................................................................................... vii Organization Table ........................................................................................................................... viii
Financial Section Independent Auditor’s Report .......................................................................................................... 1-3
Management’s Discussion and Analysis (Required Supplementary Information - Unaudited) .... 4-12
Basic Financial Statements: Government-wide Financial Statements:
Statement of Net Position ........................................................................................................... 13 Statement of Activities .......................................................................................................... 14-15
Fund Financial Statements: Balance Sheet – Governmental Funds ........................................................................................ 16 Reconciliation of the Balance Sheet of Governmental Funds to the Statement of Net Position ............................................................................................... 17 Statement of Revenues, Expenditures, and Changes in Fund Balances – Governmental Funds .............................................................................................. 18 Reconciliation of the Statement of Revenues, Expenditures, and Changes in Fund Balances of Governmental Funds to the Statement of Activities .................................... 19 Statement of Net Position – Proprietary Funds .......................................................................... 20 Statement of Revenues, Expenses, and Changes in Fund Net Position – Proprietary Funds .............................................................................................. 21 Statement of Cash Flows – Proprietary Funds....................................................................... 22-23 Statement of Fiduciary Net Position – Fiduciary Funds ............................................................. 24 Statement of Changes in Fiduciary Net Position – Investment Trust Fund ................................ 25
Notes to the Basic Financial Statements ................................................................................... 26-56
Required Supplementary Information (Unaudited): Schedule of the County’s Proportionate Share of the Net Pension Liability .............................. 57 Schedule of the County’s Pension Contributions ....................................................................... 58 Schedule of the County’s Proportionate Share of the Total Other Postemployment Benefits Liability ........................................................................................... 59 Schedules of Revenues, Expenditures, and Changes in Fund Balance – Budget and Actual:
General Fund ............................................................................................................ 60-61 Roads Special Revenue Fund ........................................................................................ 62 Health and Welfare Special Revenue Fund ................................................................... 63
Note to the Required Supplementary Information ...................................................................... 65

COUNTY OF TUOLUMNE, CALIFORNIA COMPREHENSIVE ANNUAL FINANCIAL REPORT
FOR THE YEAR ENDED JUNE 30, 2019
Table of Contents
Page(s) Combining and Individual Fund Statements and Schedules: Combining Balance Sheet – Other Governmental Funds ........................................................... 67 Combining Statement of Revenues, Expenditures, and Changes in Fund Balances – Other Governmental Funds ........................................................................... 68
Combining Balance Sheet – Other Special Revenue Funds .................................................. 70-71 Combining Statement of Revenues, Expenditures, and Changes in Fund Balances – Other Special Revenue Funds .................................................................. 72-73 Schedules of Revenues, Expenditures, and Changes in Fund Balance – Budget and Actual – Other Special Revenue Funds: Fish and Game Fund ...................................................................................................... 74 National Disaster Resiliency Fund ................................................................................ 75 Criminal Justice Facility Fund ....................................................................................... 76 Monument Preservation Fund ....................................................................................... 77 Tuolumne County BH Housing Fund ............................................................................ 78 County Fire Special Revenue Fund ............................................................................... 79 Cemetery Districts Fund ................................................................................................ 80 Children and Families Commission Fund ..................................................................... 81 County Service Areas Fund ...................................................................................... 82-83 Lighting Districts Fund .................................................................................................. 84
Schedules of Revenues, Expenditures, and Changes in Fund Balance – Budget and Actual – Capital Projects Funds: County Capital Fund ...................................................................................................... 86 Road Construction Fund ................................................................................................ 87 Airport Construction Fund ............................................................................................. 88
Schedule of Revenues, Expenditures, and Changes in Fund Balance – Budget and Actual – Permanent Fund ..................................................................... 90
Combining Statement of Net Position – Internal Service Funds ........................................... 92-93 Combining Statement of Revenues, Expenses, and Changes in Fund Net Position – Internal Service Funds ........................................................................ 94-95 Combining Statement of Cash Flows – Internal Service Funds ............................................ 96-97
Combining Statement of Changes in Assets and Liabilities – Agency Funds ..................................................................................................... 100
COUNTY OF TUOLUMNE, CALIFORNIA COMPREHENSIVE ANNUAL FINANCIAL REPORT
FOR THE YEAR ENDED JUNE 30, 2019
Table of Contents
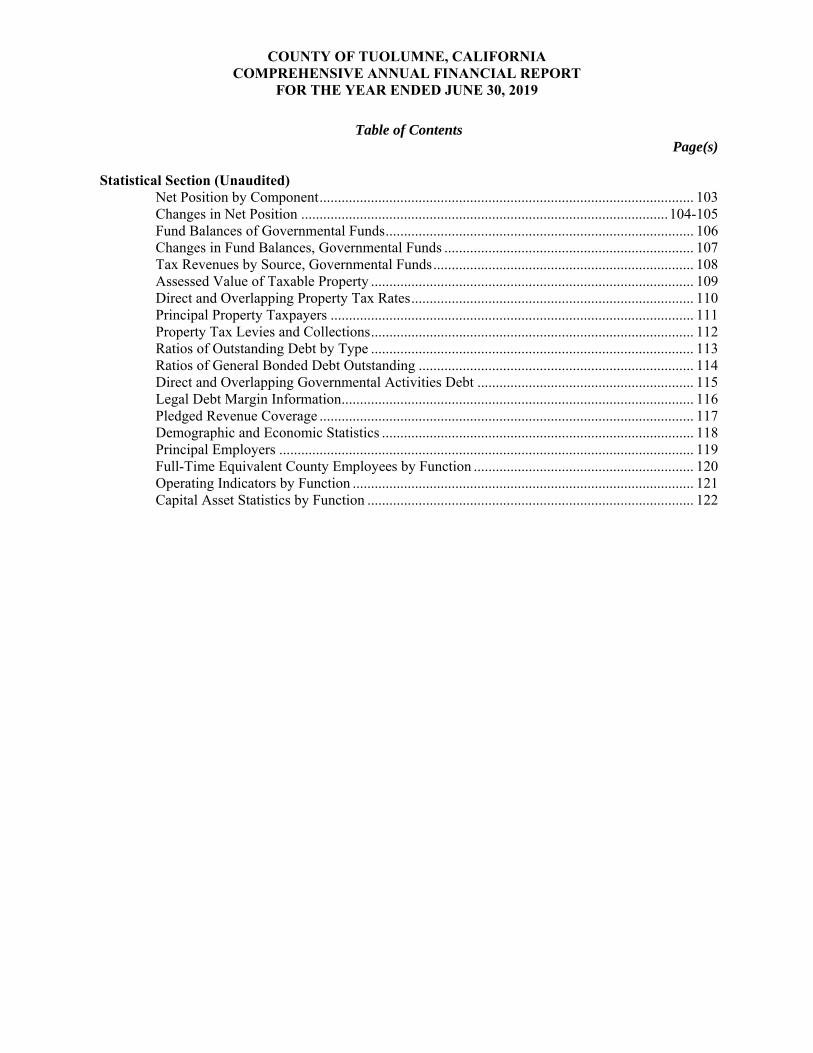
Page(s) Statistical Section (Unaudited) Net Position by Component ...................................................................................................... 103 Changes in Net Position .................................................................................................... 104-105 Fund Balances of Governmental Funds .................................................................................... 106 Changes in Fund Balances, Governmental Funds .................................................................... 107
Tax Revenues by Source, Governmental Funds ....................................................................... 108 Assessed Value of Taxable Property ........................................................................................ 109 Direct and Overlapping Property Tax Rates ............................................................................. 110 Principal Property Taxpayers ................................................................................................... 111 Property Tax Levies and Collections ........................................................................................ 112 Ratios of Outstanding Debt by Type ........................................................................................ 113 Ratios of General Bonded Debt Outstanding ........................................................................... 114 Direct and Overlapping Governmental Activities Debt ........................................................... 115 Legal Debt Margin Information ................................................................................................ 116 Pledged Revenue Coverage ...................................................................................................... 117 Demographic and Economic Statistics ..................................................................................... 118 Principal Employers ................................................................................................................. 119 Full-Time Equivalent County Employees by Function ............................................................ 120 Operating Indicators by Function ............................................................................................. 121 Capital Asset Statistics by Function ......................................................................................... 122

This page intentionally left blank

INTRODUCTORY SECTION


ii
The independent audit of the financial statements of the County was part of a broader, federally mandated “Single Audit” designed to meet the special needs of federal grantor agencies. The standard governing the Single Audit requires the independent auditor to report not only on the fair presentation of the financial statements, but also on the government’s internal controls and compliance with legal requirements, with special emphasis on internal controls over compliance involving the administration of federal awards. These reports are available in the County’s separately issued Single Audit Report. GAAP requires that management provide a narrative introduction, overview, and analysis to accompany the basic financial statements in the form of Management’s Discussion and Analysis (MD&A). This letter of transmittal is designed to complement the MD&A and should be read in conjunction with it. The County’s MD&A can be found immediately following the report of the independent auditors. Profile of the Government County Government The County of Tuolumne (population 54,590) was incorporated on February 18, 1850 as one of the original 27 counties in the State of California. The name Tuolumne is of Indian origin and has been given different meanings, such as ‘Many Stone Houses, the Land of Mountain Lions and Straight Up Steep’, the latter the interpretation of William Fuller, a native Indian chief. The County covers approximately 2,293 square miles. There is only one incorporated city within the County, the City of Sonora, which is also the County seat. Stretching from the foothills to the crest of the Sierra Nevada Mountains, Tuolumne County is both a recreation paradise and a wonderful place to live. The County contains historic gold mining towns, the pristine Emigrant Wilderness, world-renowned Yosemite National Park, and numerous lakes and rivers. Its proximity to San Francisco (2.5 hours) and Sacramento (2 hours) makes the County accessible. The County has a general law form of government. Its five-member Board of Supervisors (the ‘Board’) is elected by district for four-year terms of office. The Supervisors’ terms are staggered – two Supervisors are elected in one general election, and three Supervisors in the next. Other elected officials include the Assessor-Recorder, Clerk & Auditor-Controller, District Attorney, Sheriff-Coroner and Treasurer-Tax Collector. The County Administrator and County Counsel are appointed by the Board. The County is located in the 4th Congressional District, the 8th Senatorial District and the 5th Assembly District.

iii
As the governing body for the County, the Board is responsible for the planning and providing of services related to public needs, as required by state and federal law including: adopting the annual budget, adopting County ordinances, setting policies, confirming appointments of most non-elected officials, and assisting citizens in solving problems and addressing local concerns. County Services The County, with an authorized staff of 649 full-time equivalents (FTE), provides a full range of services to its residents. We provide “unincorporated area” services (e.g., land use planning) in the areas of the County that are not within the City of Sonora. We also provide certain “countywide” services to County residents regardless of where they live. The following is a list of countywide services provided by the County: Environmental Health Agricultural Commissioner, Weights & Measures Two Airports Public and Mental Health Services Child Protection and Social Services Emergency Medical Services Veterans Services Maintenance of County Roads and Bridges Snow Removal Services Law Enforcement of the Unincorporated County U.C. Cooperative Extension Services Tax Assessment, Collection and Apportionment Elections and Voter Registration Jail Facilities Probation Supervision Clerk and Recorder Maintain the Historical Records (Archive) Public Defender/Alternative Defense Coroner and Forensic Services Grand Jury Criminal Prosecution (District Attorney) Libraries Parks Animal Care Services Building and Safety Ambulance Services

iv
Factors Affecting Financial Condition Budgetary Information In accordance with stipulations of the California Government Code contained in Sections 29000 through 29144, and other statutory provisions, commonly known as the County Budget Act, the County prepares and legally adopts a budget for each fiscal year. The annual budget serves as the foundation for the County’s financial planning and control. All agencies under the control of the Board of Supervisors are required to submit budget requests to the County Administrator for review. The County Administrator recommends a proposed budget to the Board for consideration and approval. The Board is required to hold public hearings on the proposed budget and to adopt a final budget. The 2018-2019 County final budget was adopted on September 11, 2018. The budget is prepared by fund (e.g. General Fund), department (e.g., Sheriff), and account (e.g., Regular Salaries). Transfers of appropriations between accounts within a department provided the total appropriation of the budget is not changed, may be requested by the Department Head and authorized by both the County Administrator and the Auditor-Controller. Transfers of appropriations between departments within a fund, however, require a majority vote of the Board. Transfers of appropriations between funds require a four-fifths vote of the Board of Supervisors. Unanticipated revenue received during the year is subject to the same four-fifths vote requirement prior to expenditure. Unexpended appropriations lapse at year-end. Encumbrances, which are appropriations that are committed through purchase orders or contracts that are open at year-end are reported as a component of restricted and assigned fund balance and re-appropriated as part of the following year’s budget. Budget-to-actual comparisons are provided in this report for each individual governmental fund for which an appropriated annual budget was adopted. The County Board of Supervisors has, historically, practiced conservative budgeting principles. The Board has established eight (8) budget polices:
1. Balance annual operating budgets without the use of one-time revenues. 2. Non-earmarked General Fund Contingencies should be budgeted at 1% of the
total operating budget for governmental funds. 3. Maintain a comprehensive quarterly budget monitoring and reporting
program. 4. Strive towards fully funding future liabilities. 5. Strive to provide funding to adequately maintain existing plant and
infrastructure. 6. Continue an active long-term Capital Improvement Program which includes a
section describing financing methods. 7. Tax and Revenue Anticipation Notes should be issued only when deemed
necessary. 8. Match specific state and federal funding reductions with commensurate cuts in
specific expenses.

v
Population The County’s population as of January 2019 was approximately 54,590, a decrease of 0.3% over last year and an increase of 0.2% over the 2000 (54,501) census. The County’s population ranks 43rd out of 58 California counties. Local Economy The County showed a moderate increase in economic indicators during fiscal year 2018-19. Indicators for next year show a modest increase in the local economic base. A primary factor contributing to the County’s long-standing good financial position is the consistent growth in assessed valuation. For fiscal year 2018-19, the assessed values increased by 5.8%, and are projected to increase 4.4% for fiscal year 2019-20. Construction of new homes and the volume of real estate sales of all kinds showed a modest increase in our County. Other economic indicators that reflect local conditions include taxable retail sales and transient occupancy taxes. Countywide retail sales were 0.2% less in fiscal year 2018-19 than in the previous year. Countywide transient occupancy taxes increased by 5.9% in fiscal year 2018-19 from the previous year. This is due to a better and longer snow year, which also resulted in more water in our rivers and lakes for the summer. The Countywide transient occupancy tax rate is 10%. Although revenue streams to counties from the State of California have been more reliable over the past few years, the state has proven its willingness to significantly reduce state funding to local governments during times of economic hardship. This places counties in a tenuous situation with future state funding agreements, grants and subventions. The County’s unemployment rate continues to be higher than the state average. The state averages in fiscal years 2017-18 and 2018-19 were 4.5% and 4.2%, respectively, while the County’s rates were 4.9% and 4.6%, respectively. Major Initiatives:
During the last fiscal year, several outstanding key programs and projects were successfully undertaken by the County, including, among others:
The County started planning and design on the County Jail during fiscal year 2015-16, construction started in fiscal year 2017-18, and expects to complete in fiscal year of 2020-21 (October).
The County started planning and design of the Taxilane Reconstruction at the Columbia Airport and expects to complete in fiscal year 2019-20.


AGRICULTURAL COMMISSIONER KELLE SCHROEDOR
AIR POLLUTION
WEIGHTS & MEASURES
ANIMAL CONTROL KELLE SCHROEDOR
* ASSESSOR/RECORDER KAENAN WHITMAN
* BOARD OF SUPERVISORS
SUPERVISOR, DISTRICT #1 SHERRI BRENNAN
SUPERVISOR, DISTRICT #2 RYAN CAMPBELL
SUPERVISOR, DISTRICT #3 ANAIAH KIRK
SUPERVISOR, DISTRICT #4 JOHN GRAY
SUPERVISOR, DISTRICT #5 KARL RODEFER
* CLERK & AUDITOR/CONTROLLER DEBORAH BAUTISTA
ELECTIONS
COMMUNITY RESOURCES AGENCY DAVID GONZALES
COMMUNITY DEVELOPMENT DEPT
AIRPORTS
ENVIRONMENTAL HEALTH
FLEET SERVICES
PUBLIC WORKS
SOLID WASTE
COUNTY ADMINISTRATIVE OFFICER TRACIE RIGGS
COUNTY COUNSEL SARAH CARRILLO
COUNTY FIRE JOSH WHITE
COUNTY LIBRARIAN DEBORAH SAMSON
* DISTRICT ATTORNEY LAURA KRIEG
VICTIM WITNESS
VERTICAL PROSECUTION
FARM ADVISOR SCOTT ONETO
HUMAN SERVICES DIRECTOR ANN CONNOLLY
DEPT OF SOCIAL SERVICES
HEALTH
TOBACCO CONTROL
PUBLIC ADMINISTRATOR
PUBLIC GUARDIAN
AMBULANCE
BEHAVIORAL HEALTH
VETERANS SERVICES
PERSONNEL DIRECTOR/RISK OFFICER ANN FREMD
PROBATION OFFICER LINDA DOWNEY
PUBLIC DEFENDER ROBERT PRICE
PURCHASING AGENT TRACIE TRIGGS
* SHERIFF/CORONER JAMES MELE
COURTROOM SECURITY
COMMUNICATIONS
TUOLUMNE NARCOTICS TEAM
COUNTY JAIL
BOAT PATROL
* SUPERINTENDENT OF SCHOOLS CATHY PARKER
* TREASURER/TAX COLLECTOR JUSTIN BIRTWHISTLE
OFFICE OF REVENUE RECOVERY
* INDICATES ELECTED OFFICIAL
COUNTY OF TUOLUMNE, CALIFORNIA
Elected and Appointed Officials
vii

viii
Agricultural Comm/ Community Resource Farm Advisor * Auditor/Controller Ambulance Weights & Measures Agency Library * Assessor/Recorder Animal Control * County Clerk/Elections Public Works Recreation * Treasurer/Tax Collector Environmental Health * District Attorney Fleet Services Behavioral Health Fire Protection LAFCO Public Health Probation Airports Social Services Public Defender Veterans Services * Sheriff/Coroner
* Elected Department Head
County of Tuolumne Organization Table
Electorate
Board of Supervisors Elected Officials
C.A.O. County Counsel
Emergency ServicesFacilities ManagementInformation TechnologyPersonnel/Risk MgmtPurchasing/Special SvcsLibraryRecreationPublic Power AgencyRadio/Communications
Leisure & Education SvcsCommunity DevelopmentPublic Protection Financial Services Health & Welfare

FINANCIAL SECTION


www.mgocpa.com Macias Gini & O’Connell LLP 3000 S Street, Suite 300 Sacramento, CA 95816
1
Independent Auditor’s Report
The Honorable Board of Supervisors of the County of Tuolumne, California Sonora, California
Report on the Financial Statements
We have audited the accompanying financial statements of the governmental activities, the business-type activities, each major fund and the aggregate remaining fund information of the County of Tuolumne, California (County), as of and for the year ended June 30, 2019, and the related notes to the financial statements, which collectively comprise the County’s basic financial statements as listed in the table of contents.
Management’s Responsibility for the Financial Statements
Management is responsible for the preparation and fair presentation of these financial statements in accordance with accounting principles generally accepted in the United States of America; this includes the design, implementation, and maintenance of internal control relevant to the preparation and fair presentation of financial statements that are free from material misstatement, whether due to fraud or error.
Auditor’s Responsibility
Our responsibility is to express opinions on these financial statements based on our audit. We conducted our audit in accordance with auditing standards generally accepted in the United States of America and the standards applicable to financial audits contained in Government Auditing Standards, issued by the Comptroller General of the United States. Those standards require that we plan and perform the audit to obtain reasonable assurance about whether the financial statements are free from material misstatement.
An audit involves performing procedures to obtain audit evidence about the amounts and disclosures in the financial statements. The procedures selected depend on the auditor’s judgment, including the assessment of the risks of material misstatement of the financial statements, whether due to fraud or error. In making those risk assessments, the auditor considers internal control relevant to the entity’s preparation and fair presentation of the financial statements in order to design audit procedures that are appropriate in the circumstances, but not for the purpose of expressing an opinion on the effectiveness of the entity’s internal control. Accordingly, we express no such opinion. An audit also includes evaluating the appropriateness of accounting policies used and the reasonableness of significant accounting estimates made by management, as well as evaluating the overall presentation of the financial statements.
We believe that the audit evidence we obtained is sufficient and appropriate to provide a basis for our audit opinions.
Opinions
In our opinion, the financial statements referred to above present fairly, in all material respects, the respective financial position of the governmental activities, the business-type activities, each major fund and the aggregate remaining fund information of the County of Tuolumne, California, as of June 30, 2019, and the respective changes in financial position, and, where applicable, cash flows thereof for the year then ended in accordance with accounting principles generally accepted in the United States of America.

2
Other Matters Required Supplementary Information Accounting principles generally accepted in the United States of America require that the management’s discussion and analysis, schedule of the County’s proportionate share of the net pension liability, schedule of the County’s pension contributions, schedule of the County’s proportionate share of the total other postemployment benefits liability, and schedules of revenues, expenditures, and changes in fund balance – budget and actual listed as required supplementary information in the table of contents be presented to supplement the basic financial statements. Such information, although not a part of the basic financial statements, is required by the Governmental Accounting Standards Board who considers it to be an essential part of financial reporting for placing the basic financial statements in an appropriate operational, economic, or historical context. We have applied certain limited procedures to the required supplementary information in accordance with auditing standards generally accepted in the United States of America, which consisted of inquiries of management about the methods of preparing the information and comparing the information for consistency with management’s responses to our inquiries, the basic financial statements, and other knowledge we obtained during our audit of the basic financial statements. We do not express an opinion or provide any assurance on the information because the limited procedures do not provide us with sufficient evidence to express an opinion or provide any assurance. Other Information Our audit was conducted for the purpose of forming opinions on the financial statements that collectively comprise the County’s basic financial statements. The introductory section, combining and individual fund statements and schedules, and statistical section are presented for purposes of additional analysis and are not a required part of the basic financial statements. The combining and individual fund statements and schedules are the responsibility of management and were derived from and relate directly to the underlying accounting and other records used to prepare the basic financial statements. Such information has been subjected to the auditing procedures applied in the audit of the basic financial statements and certain additional procedures, including comparing and reconciling such information directly to the underlying accounting and other records used to prepare the basic financial statements or to the basic financial statements themselves, and other additional procedures in accordance with auditing standards generally accepted in the United States of America. In our opinion, the combining and individual fund statements and schedules are fairly stated, in all material respects, in relation to the basic financial statements as a whole. The introductory and statistical sections have not been subjected to the auditing procedures applied in the audit of the basic financial statements, and accordingly, we do not express an opinion or provide any assurance on them.

3
Other Reporting Required by Government Auditing Standards In accordance with Government Auditing Standards, we have also issued our report dated July 2, 2020, on our consideration of the County’s internal control over financial reporting and on our tests of its compliance with certain provisions of laws, regulations, contracts, and grant agreements and other matters. The purpose of that report is solely to describe the scope of our testing of internal control over financial reporting and compliance and the results of that testing, and not to provide an opinion on the effectiveness of the County’s internal control over financial reporting or on compliance. That report is an integral part of an audit performed in accordance with Government Auditing Standards in considering the County’s internal control over financial reporting and compliance.
Sacramento, California July 2, 2020

4
Management’s Discussion and Analysis (Required Supplementary Information – Unaudited)
As management of the County of Tuolumne (County), we offer readers of the County’s financial statements this narrative overview and analysis of the financial activities of the County for the year ended June 30, 2019. All amounts, unless otherwise indicated, are expressed in thousands of dollars. Financial Highlights The assets and deferred outflows of resources of the County exceeded its liabilities and deferred inflows of resources at the close of the 2018-19 fiscal year by $49,714 (net position). Of this amount, $135,935 was the net investment in capital assets and $42,507 was restricted for specific purposes (restricted net position), leaving a deficit unrestricted balance of $128,728. The County’s total net position, which may serve as a useful indicator of financial position, increased by $17,612. The deficit unrestricted balance increased by $5,240. Restricted net position decreased by $1,206. The net investment in capital assets increased by $24,058. As of June 30, 2019, the County governmental funds reported combined ending fund balances of $53,553, a decrease of $8,442 in comparison with the prior year. Approximately $52,555 was available for spending (restricted, committed, assigned, and unassigned fund balances). As of June 30, 2019, the spendable fund balance for the General Fund was $7,173 or 9.8% of total General Fund expenditures and transfers out. The County’s net pension liability and total other postemployment benefits (OPEB) liability increased $4,202 (4.1%) and $134 (0.4%), respectively, during fiscal year 2018-19. Overview of Financial Statements The Financial Section of the Comprehensive Annual Financial Report for the County consists of four parts – management’s discussion and analysis (this section), the basic financial statements, required supplementary information, and an optional section that presents combining statements and schedules for nonmajor governmental funds, internal service funds, and agency funds. This discussion and analysis is intended to serve as an introduction to the County’s basic financial statements. The County’s basic financial statements comprise three components: 1) government-wide financial statements, 2) fund financial statements, and 3) notes to the basic financial statements. The two types of financial statements are designed to present two different views of the County. Government-wide financial statements. The government-wide financial statements provide readers with a broad overview of the long-term and short-term information about the County’s overall financial status in a manner similar to private-sector business. The two government-wide statements report the County’s net position and how it has changed. Net position is one way to measure the County’s financial health or position. The government-wide financial statements of the County are divided into two categories: Governmental activities – most of the County’s basic services are included here, such as fire, public works and general administration, which receive approximately 70% of their support from charges for services, operating grants and contributions, and capital grants and contributions. Property taxes, sales taxes, and other revenues cover the remaining costs.

5
Business-type activities – fees charged to users are intended to cover all or a significant portion of their costs for certain services, such as solid waste disposal. The statement of net position presents information on all of the County’s assets, deferred outflows of resources, liabilities, and deferred inflows of resources with the difference reported as net position. Over time, increases or decreases in net position may serve as a useful indicator of the improvement or deterioration in the financial position of the County. The statement of activities presents information showing how the County’s net position changed during the most recent fiscal year. All changes in net position are reported as soon as the underlying event giving rise to the change occurs, regardless of the timing of the related cash flows. Thus, revenues and expenses are reported in the statement for some items that are the result of cash flows in future fiscal periods (e.g., uncollected taxes and earned but unused vacation leave). The government-wide financial statements include not only the County itself (known as the primary government), but also legally separate organizations for which the elected officials of the County are financially accountable. Financial information for these blended component units is combined with the financial information presented for the primary government itself. Tuolumne County Public Power Agency, all County Service Areas and Lighting Districts are presented as blended component units. The government-wide financial statements can be found in the basic financial statements section following the management’s discussion and analysis. Fund financial statements. A fund is used to maintain control over resources that have been segregated for specific activities or objectives. The County, like other state and local governments, uses fund accounting to ensure and demonstrate compliance with finance-related legal requirements. The fund financial statements focus on individual parts of the County’s government. All of the funds of the County can be divided into three categories: governmental funds, proprietary funds, and fiduciary funds. Governmental funds. Governmental funds are used to account for essentially the same functions reported as governmental activities in the government-wide financial statements. However, unlike the government-wide financial statements, governmental fund financial statements focus on near-term inflows and outflows of spendable resources, as well as on balances of spendable resources available for future spending. Such information may be useful in evaluating a government’s near-term financing requirements. Because the focus of governmental funds is narrower than that of the government-wide financial statements, it is useful to compare the information presented for governmental funds with similar information presented for governmental activities in the government-wide financial statements. By doing so, readers may better understand the long-term impact of the County’s near-term financing decisions. Both the governmental funds balance sheet and the governmental funds statement of revenues, expenditures, and changes in fund balances provide a reconciliation to facilitate this comparison between governmental funds and governmental activities. For the governmental funds, information is presented separately for the General, Roads, Health and Welfare, Community Development Block Grants, County Capital, and Road Construction funds, all of which are considered to be major funds. Data from the other governmental funds are combined into a single, aggregated presentation. Individual fund data for each of these nonmajor governmental funds is provided in the form of combining statements and schedules elsewhere in this report.

6
The County adopts an annual appropriated budget for its General Fund and its other governmental funds with the exception of its Community Development Block Grants Special Revenue Fund. Budgetary comparison schedules have been provided in this report for the General Fund and the other governmental funds. The basic governmental fund financial statements can be found following the government-wide financial statements in the basic financial statements section of this report. Proprietary funds. The County maintains two different types of proprietary funds. Enterprise funds are used to report the same functions presented as business-type activities in the government-wide financial statements. The County uses enterprise funds to account for its solid waste, ambulance, airport, and Public Power Agency activities. Internal service funds are used to accumulate and allocate costs internally. The County uses internal service funds to account for its self-insurance programs, purchasing and special services, telecommunications, various employee benefits, and fleet and radio services. They have been included within governmental activities in the government-wide financial statements. Proprietary funds provide the same type of information as the government-wide financial statements, only in more detail. The County’s internal service funds are combined into a single, aggregated presentation in the proprietary fund financial statements. Individual fund data for the internal service funds is provided in the form of combining statements elsewhere in this report. Fiduciary funds. Fiduciary funds are used to account for resources held for the benefit of parties outside the County. They provide information about financial relationships in which the County acts solely as a trustee or agent for the benefit of others, to whom the resources belong. All of the County’s fiduciary activities are reported in a separate statement of fiduciary net position. Fiduciary funds are not reflected in the government-wide financial statements because the resources of those funds are not available to support the County’s own programs. The accounting used for fiduciary funds is much like that used for proprietary funds. The basic fiduciary fund financial statements can be found in the fund financial statements section of this report. Notes to basic financial statements. The notes provide additional information that is essential to a full understanding of the data provided in the government-wide and fund financial statements. The notes to the basic financial statements can be found following the fund financial statements in this report. Required supplementary information. Required supplementary information includes budgetary comparison schedules for the County’s General, Roads, and Health and Welfare funds, as well as information about the County’s pension plans and other postemployment benefits plan. The required supplementary information can be found immediately following the notes to the basic financial statements. Combining statements and schedules. The combining statements and schedules referred to earlier in connection with nonmajor governmental funds, internal service funds, and agency funds are presented immediately following the required supplementary information. Government-wide Financial Analysis As noted earlier, net position may serve over time as a useful indicator of a government’s financial position. In the case of the County, assets and deferred outflows of resources exceeded liabilities and deferred inflows of resources by $49,714 at June 30, 2019.

7
Key elements of the County’s net position for both governmental activities and business-type activities as of June 30, 2019 and 2018 are as follows:
As of June 30, 2019 2018 2019 2018 2019 2018
Current and other assets 91,966$ 95,195$ 5,330$ 4,068$ 97,296$ 99,263$ Capital assets 138,242 107,697 9,147 9,225 147,389 116,922
Total assets 230,208 202,892 14,477 13,293 244,685 216,185
Deferred outflows of resources 18,591 24,257 203 373 18,794 24,630
Long-term debt 46,797 47,301 3,024 3,138 49,821 50,439 Other long-term obligations 136,634 132,196 1,856 1,958 138,490 134,154 Other liabilities 18,954 17,603 534 506 19,488 18,109
Total liabilities 202,385 197,100 5,414 5,602 207,799 202,702
Deferred inflows of resources 5,846 5,987 120 24 5,966 6,011
Net investment in capital assets 126,788 102,652 9,147 9,225 135,935 111,877 Restricted 41,888 43,129 619 584 42,507 43,713 Unrestricted (128,108) (121,719) (620) (1,769) (128,728) (123,488)
Total net position 40,568$ 24,062$ 9,146$ 8,040$ 49,714$ 32,102$
GovernmentalActivities
Business-typeActivities Total
A significant portion of the County’s net position, $135,935 reflects its investment in capital assets (e.g., land, infrastructure, buildings, equipment, and vehicles), less any related outstanding debt used to acquire those assets. The County uses these capital assets to provide services to citizens; consequently, these assets are not available for future spending. Although the County’s investment in its capital assets is reported net of related debt, it should be noted that the resources needed to repay this debt must be provided from other sources, since the capital assets themselves cannot be used to liquidate these liabilities. Another significant portion of the County’s net position, $42,507 represents resources that are subject to external restriction on how they may be used (restricted net position). That leaves a deficit balance for unrestricted net position of $128,728. At June 30, 2018, the deficit balance for unrestricted net position was $123,488. During 2018-19, the County’s unrestricted deficit increased by $5,240, mainly the result of increases in the net pension and total OPEB liabilities, which reduced net position by $4,336. As of June 30, 2019, the County was able to report positive balances in the net investment in capital assets and restricted categories of net position for the County as a whole, as well as total governmental and business-type activities. However, the unrestricted net position was in a deficit position primarily due to the unfunded long-term liabilities such as compensated absences, net pension liability, total OPEB liability, accrued claims, and the landfill closure/postclosure liability. Current and other assets for the County decreased by $1,967. The decrease is partly due to an increase in intergovernmental receivables ($6,739) due from the state to reimburse the County for costs incurred for the construction of the Law and Justice Center Jail Project offset by a decrease in restricted cash and investments ($7,010) as bond proceeds were spent for construction of the Jail Project. Other long-term obligations for the County increased by $4,336 due to increases in the net pension liability ($4,202) and total OPEB liability ($134).

8
Key elements of the County’s changes in net position for both governmental activities and business-type activities for the years ended June 30, 2019 and 2018 are as follows:
For the Year Ended June 30, 2019 2018 2019 2018 2019 2018
Revenues:Program Revenues:
Charges for services 18,429$ 15,324$ 9,700$ 9,747$ 28,129$ 25,071$ Operating grants and contributions 49,368 44,283 275 346 49,643 44,629 Capital grants and contributions 24,904 9,923 - - 24,904 9,923
General Revenues:Property taxes 29,394 27,376 - - 29,394 27,376 Sales taxes 17,283 16,932 - - 17,283 16,932 Other taxes 5,287 5,084 - - 5,287 5,084 Grants and contributions not restricted to specific programs 3,426 3,633 - - 3,426 3,633 Other 1,848 1,846 98 41 1,946 1,887
Total revenues 149,939 124,401 10,073 10,134 160,012 134,535
Expenses:General government 26,000 24,973 - - 26,000 24,973 Public protection 47,843 42,871 - - 47,843 42,871 Public ways and facilities 11,215 9,050 - - 11,215 9,050 Health and sanitation 18,603 19,136 - - 18,603 19,136 Public assistance 24,656 23,986 - - 24,656 23,986 Education 1,259 1,262 - - 1,259 1,262 Recreation and cultural services 1,813 1,814 - - 1,813 1,814 Unallocated interest 1,189 708 - - 1,189 708 Solid waste - - 1,018 764 1,018 764 Ambulance - - 6,217 5,903 6,217 5,903 Airport - - 876 898 876 898 Public Power Agency - - 1,711 1,891 1,711 1,891
Total expenses 132,578 123,800 9,822 9,456 142,400 133,256
Changes in net position before transfers 17,361 601 251 678 17,612 1,279 Transfers (855) (105) 855 105 - - Changes in net position 16,506 496 1,106 783 17,612 1,279
Net position, July 1, reported 24,062 35,463 8,040 7,449 32,102 42,912 Restatement - (11,897) - (192) - (12,089) Net position, July 1, restated 24,062 23,566 8,040 7,257 32,102 30,823
Net position, June 30 40,568$ 24,062$ 9,146$ 8,040$ 49,714$ 32,102$
GovernmentalActivities
Business-typeActivities Total
During the current fiscal year, the County’s net position increased $17,612 from that reported last year mainly due to the capital grants and contributions related to the construction of the Jail Project.
9
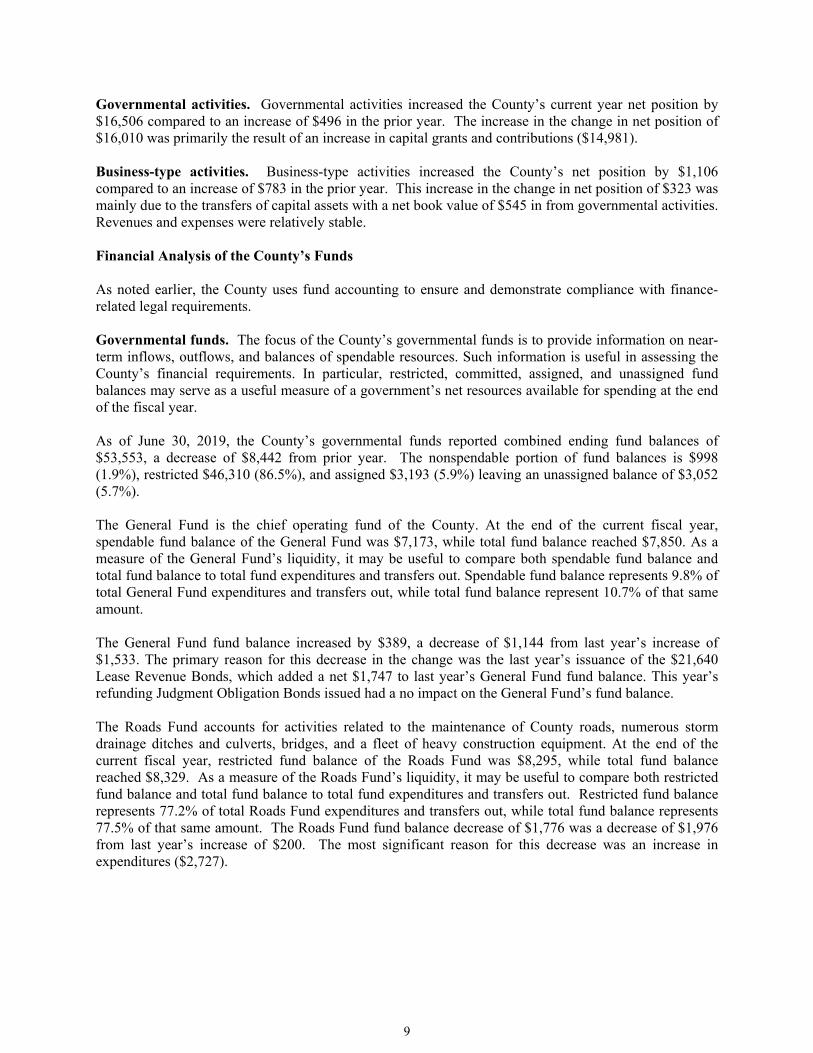
Governmental activities. Governmental activities increased the County’s current year net position by $16,506 compared to an increase of $496 in the prior year. The increase in the change in net position of $16,010 was primarily the result of an increase in capital grants and contributions ($14,981). Business-type activities. Business-type activities increased the County’s net position by $1,106 compared to an increase of $783 in the prior year. This increase in the change in net position of $323 was mainly due to the transfers of capital assets with a net book value of $545 in from governmental activities. Revenues and expenses were relatively stable. Financial Analysis of the County’s Funds As noted earlier, the County uses fund accounting to ensure and demonstrate compliance with finance-related legal requirements. Governmental funds. The focus of the County’s governmental funds is to provide information on near-term inflows, outflows, and balances of spendable resources. Such information is useful in assessing the County’s financial requirements. In particular, restricted, committed, assigned, and unassigned fund balances may serve as a useful measure of a government’s net resources available for spending at the end of the fiscal year. As of June 30, 2019, the County’s governmental funds reported combined ending fund balances of $53,553, a decrease of $8,442 from prior year. The nonspendable portion of fund balances is $998 (1.9%), restricted $46,310 (86.5%), and assigned $3,193 (5.9%) leaving an unassigned balance of $3,052 (5.7%). The General Fund is the chief operating fund of the County. At the end of the current fiscal year, spendable fund balance of the General Fund was $7,173, while total fund balance reached $7,850. As a measure of the General Fund’s liquidity, it may be useful to compare both spendable fund balance and total fund balance to total fund expenditures and transfers out. Spendable fund balance represents 9.8% of total General Fund expenditures and transfers out, while total fund balance represent 10.7% of that same amount. The General Fund fund balance increased by $389, a decrease of $1,144 from last year’s increase of $1,533. The primary reason for this decrease in the change was the last year’s issuance of the $21,640 Lease Revenue Bonds, which added a net $1,747 to last year’s General Fund fund balance. This year’s refunding Judgment Obligation Bonds issued had a no impact on the General Fund’s fund balance. The Roads Fund accounts for activities related to the maintenance of County roads, numerous storm drainage ditches and culverts, bridges, and a fleet of heavy construction equipment. At the end of the current fiscal year, restricted fund balance of the Roads Fund was $8,295, while total fund balance reached $8,329. As a measure of the Roads Fund’s liquidity, it may be useful to compare both restricted fund balance and total fund balance to total fund expenditures and transfers out. Restricted fund balance represents 77.2% of total Roads Fund expenditures and transfers out, while total fund balance represents 77.5% of that same amount. The Roads Fund fund balance decrease of $1,776 was a decrease of $1,976 from last year’s increase of $200. The most significant reason for this decrease was an increase in expenditures ($2,727).

10
The Health and Welfare Fund accounts for services provided to County residents in the areas of health, mental health, substance abuse, social services, employment assistance, and public assistance. At the end of the current fiscal year, restricted fund balance of the Health and Welfare Fund was $9,184, while total fund balance was $9,193. As a measure of the Health and Welfare Fund’s liquidity, it may be useful to compare both restricted and total fund balances to total fund expenditures and transfers out. Both restricted and total fund balances represent 25.0% of total Health and Welfare Fund expenditures and transfers out. The funding sources of this fund are the federal and state governments. Most programs are mandated by those governments. The Health and Welfare Fund fund balance decrease of $221 was a decrease of $8 from last year’s decrease of $213. Revenues increased by $556, expenditures increased by $690, and net transfers in increased $126. The Community Development Block Grants Fund accounts for activities of federally-funded community development block grants. At the end of the current fiscal year, restricted fund balance of the Community Development Block Grants Fund was $14,228, which represents 1,200.6% of the fund’s expenditures. The Community Development Block Grants Fund fund balance increase of $425 was mainly due to the receipt of grants that were then loaned out to third-parties ($519). The County Capital Fund accounts for activities related to large construction projects not accounted for in the Road Construction Fund. At the end of the current fiscal year, fund balance of the County Capital Fund was $5,582, a decrease of $5,883 from last year’s balance of $11,464. The decrease of the change in fund balance is mainly the result of spending down last year’s unspent bond proceeds of $6,225 for building the Law and Justice Center and all of its peripheral projects such as the Juvenile Detention Center and Jail Project, of which $8,663 remained unspent as of June 30, 2019. The Road Construction Fund accounts for activities related to major road construction projects like bridges and new roads or highways. At the end of the current fiscal year, fund balance of the Road Construction Fund was $1,206, a decrease of $1,215 from last year’s balance of $2,421. The decrease of the change in fund balance is mainly the result of deferring $1,766 in revenues because they were not available to pay for current year expenditures. Proprietary funds. The County’s proprietary funds provide the same type of information found in the government-wide financial statements for business-type activities, but in more detail. Enterprise funds net position increased $1,104. The majority of the increase resulted from the increase of the Solid Waste Fund ($588) due to the County’s effort to reduce the fund’s deficit net position. General Fund Budgetary Highlights
The Board of Supervisors of the County made several budgetary amendments increasing appropriations by $1,745 (2.4%) to the General Fund throughout the fiscal year. This increase is mostly the result of increases due to the new grants for victim witness ($95) and tree mortality ($220), establishing a new General Services Department ($143), information technology for additional maintenance for software ($166), court security for more deputies ($118), additional overtime for training on the new 911 system ($46), increase in Jail overtime ($125) due to under-filled positions, debt service due to the refinancing of the County Judgement Bonds ($161), and Community Resources Agency for professional services for plan checks ($238). For the current year, $2,456 was originally budgeted from beginning available fund balance. Actual revenues recognized were $2,642 less than budgetary estimates mostly due to State revenues being $3,161, less than budget, most of which was a result of state grant revenues for tree mortality being less by $542, Master Stewardship Grant being less by $1,645, and Hazardous Fuel Grant being less by $536. Expenditures for the current year were $7,216 below budgetary estimates. The most significant savings were for the Master Stewardship Grant ($1,971) and information technology ($836).

11
Capital Asset and Debt Administration
Capital Assets. The County’s investment in capital assets for its governmental and business-type activities at current year-end amounts to $147,389 (net of accumulated depreciation). This investment in capital assets includes land, structures and improvements, equipment, roads, bridges, and construction in progress. Major capital asset events during the fiscal year included the following:
County improvements to 5th Avenue at Highway 108 signal ($2,832) County continued improvements to Hardin Flat Road ($1,527) County repaired numerous roads due to storm damage ($2,889) County continued improvements to the Columbia Airport taxi way ($3,016) County continued the Jail Project ($19,387) County continued improvements to the Law and Justice Center ($492) County improvements to Highway 120 ($762)
County’s Capital Assets (net of depreciation)
As of June 30, 2019 2018 2019 2018 2019 2018
Land 6,751$ 6,642$ 2,083$ 2,083$ 8,834$ 8,725$ Structures and improvements 33,001 34,014 6,492 6,395 39,493 40,409 Equipment 6,901 6,398 572 747 7,473 7,145 Roads 22,922 20,704 - - 22,922 20,704 Bridges 5,490 5,925 - - 5,490 5,925 Construction in progress 63,177 34,014 - - 63,177 34,014
Total 138,242$ 107,697$ 9,147$ 9,225$ 147,389$ 116,922$
GovernmentalActivities
Business-typeActivities Total
At June 30, 2019, the significant construction commitments included $15,650 for the County Jail at the Law and Justice Center. Additional information on the County’s capital assets can be found in Note 3 of this report.

12
Long-Term Liabilities. As of June 30, 2019, the County had total long-term liabilities of $188,311. Of this amount, 5% ($9,320) relates to claims liability, 2% ($4,102) relates to compensated absences, 2% ($2,978) relates to the landfill closure/postclosure, 18% ($33,421) relates to bonds payable, 16% ($30,655) relates to total OPEB liability, and 57% ($107,835) relates to net pension liability.
County’s Long-Term Liabilities
As of June 30, 2019 2018 2019 2018 2019 2018
Claims liability 9,320$ 9,001$ -$ -$ 9,320$ 9,001$ Compensated absences 4,056 3,882 46 54 4,102 3,936 Landfill closure/postclosure - - 2,978 3,034 2,978 3,034 Bonds payable 33,421 34,378 - - 33,421 34,378 Notes payable - 40 - 50 - 90 Total OPEB liability 30,463 30,338 192 183 30,655 30,521 Net pension liability 106,171 101,858 1,664 1,775 107,835 103,633
Total 183,431$ 179,497$ 4,880$ 5,096$ 188,311$ 184,593$
GovernmentalActivities
Business-typeActivities Total
The overall increase of long-term liabilities of the County from the prior year is $3,718. Claims liability increased ($319) due to workers’ compensation claims. Compensated absences increased ($166) due to long-time employees retiring. The landfill closure/postclosure decreased ($56) due to closure and postclosure costs payments made during the year. Bonds payable decreased ($957) due to principal payments made during the year, and notes payable decreased by ($90) due to principal payments made during the year. The total OPEB liability increased ($134). The net pension liability increased ($4,202) mainly due to interest on the total pension liability exceeding the net investment income earned on plan assets. Additional information on the County’s long-term debt, net pension liability, and total OPEB liability can be found in Note 4, Note 6, and Note 7, respectively, of this report. Economic Factors and Next Year’s Budgets
County has estimated a 4.41% increase in property tax revenue for fiscal year 2019-20. The County will finish the construction of the new $44 million County Jail at the Law and Justice
Center in June 2020. The County Jail will be starting operations in October of 2020. The County will be installing a new enterprise resource planning system in January of 2021. The County installed a new budget system in February of 2020. OE3 and Management employees will receive a 2-5% cost-of-living adjustment for fiscal year
2019-20. At June 30, 2019, General Fund fund balance of $3,193 was assigned to balance the 2019-20 fiscal year budget. Requests for Information This financial report is designed to provide a general overview of the County’s finances for all those with an interest in the County’s finances. Questions concerning any of the information provided in this report or requests for additional financial information should be addressed to the Tuolumne County Auditor – Controller’s Office, 2 South Green St., Sonora CA 95370.

BASIC FINANCIAL STATEMENTS


ASSETSCash and investments 39,020,077$ 4,404,623$ 43,424,700$ Receivables, net 2,043,448 959,365 3,002,813 Intergovernmental receivables 25,265,395 230,279 25,495,674 Prepaid items 112,575 - 112,575 Inventories 34,881 - 34,881 Restricted cash and investments 9,773,434 619,004 10,392,438 Deposits with others - 67,000 67,000 Loans receivable 14,089,599 - 14,089,599 Internal balances 950,399 (950,399) - Receivables from fiduciary funds 676,000 - 676,000 Capital assets:
Nondepreciable 69,928,558 2,083,017 72,011,575 Depreciable, net 68,313,908 7,064,206 75,378,114
Total assets 230,208,274 14,477,095 244,685,369
DEFERRED OUTFLOWS OF RESOURCESRelated to other postemployment benefits 938,240 4,265 942,505 Related to pension 17,652,381 199,036 17,851,417
Total deferred outflows of resources 18,590,621 203,301 18,793,922
LIABILITIESAccounts payable 8,046,022 469,640 8,515,662 Salaries and benefits payable 934,727 12,750 947,477 Accrued interest 87,712 - 87,712 Unearned revenue 9,155,800 38,087 9,193,887 Other liabilities 729,127 13,350 742,477 Long-term debt:
Due within one year 4,829,158 185,236 5,014,394 Due in more than one year 41,968,200 2,838,991 44,807,191
Other long-term obligations:Total other postemployment benefits liability 30,463,410 191,619 30,655,029 Net pension liability 106,170,576 1,664,192 107,834,768
Total liabilities 202,384,732 5,413,865 207,798,597
DEFERRED INFLOWS OF RESOURCESRelated to other postemployment benefits 3,903,907 24,556 3,928,463 Related to pension 1,942,287 95,901 2,038,188
Total deferred inflows of resources 5,846,194 120,457 5,966,651
NET POSITIONNet investment in capital assets 126,788,168 9,147,223 135,935,391 Restricted for:
Capital projects 3,068,826 - 3,068,826 Public ways and facilities 13,197,335 - 13,197,335 Health and welfare 9,218,541 - 9,218,541 Children and Families Commission 729,461 - 729,461 Community development 14,331,006 - 14,331,006 Public protection 897,322 - 897,322 Energy services - 619,004 619,004 Perpetual care:
Expendable 156,331 - 156,331 Nonexpendable 174,697 - 174,697
Other purposes 113,932 - 113,932 Unrestricted (128,107,650) (620,153) (128,727,803)
Total net position 40,567,969$ 9,146,074$ 49,714,043$
COUNTY OF TUOLUMNE, CALIFORNIASTATEMENT OF NET POSITION
JUNE 30, 2019
Governmental Activities
Business-type Activities Total
The accompanying notes are an integral part of the basic financial statements.13

Operating CapitalCharges for Grants and Grants and
Functions/Programs Services Contributions Contributions
Governmental activities:General government 9,406,117$ 1,554,266$ -$ Public protection 4,417,188 12,891,780 -Public ways and facilities 3,246,230 3,263,971 24,903,937Health and sanitation 525,581 11,090,055 -Public assistance 570,868 20,103,080 -Education 14,693 88,412 -Recreation and cultural services 248,008 376,960 -Interest on long-term debt - - -
Total governmental activities 18,428,685 49,368,524 24,903,937
Business-type activities:Solid waste 1,526,612 64,119 -Ambulance 5,671,915 146,410 -Airport 563,142 64,796 -Public Power Agency 1,937,762 - -
Total business-type activities 9,699,431 275,325 -
Total 28,128,116$ 49,643,849$ 24,903,937$
875,614 6,217,183 1,017,680
142,400,401$
1,711,598
9,822,075
132,578,326
26,000,132$ 47,843,284 11,215,003
1,189,105
18,602,373 24,656,281
1,259,365
Expenses
COUNTY OF TUOLUMNE, CALIFORNIASTATEMENT OF ACTIVITIES
FOR THE YEAR ENDED JUNE 30, 2019
Program Revenues
1,812,783
The accompanying notes are an integral part of the basic financial statements.14

Total
Governmental activities:(15,039,749)$ (15,039,749)$ General government(30,534,316) (30,534,316) Public protection20,199,135 20,199,135 Public ways and facilities(6,986,737) (6,986,737) Health and sanitation(3,982,333) (3,982,333) Public assistance(1,156,260) (1,156,260) Education(1,187,815) (1,187,815) Recreation and cultural services(1,189,105) (1,189,105) Interest on long-term debt
(39,877,180) (39,877,180) Total governmental activities
Business-type activities:573,051$ 573,051 Solid waste
(398,858) (398,858) Ambulance (247,676) (247,676) Airport 226,164 226,164 Public Power Agency
152,681 152,681 Total business-type activities
(39,877,180) 152,681 (39,724,499) Total
General revenues:Taxes:
29,393,666 - 29,393,666 Property 460,532 - 460,532 Property transfer
4,826,458 - 4,826,458 Transient occupancy 17,283,123 - 17,283,123 Sales taxes shared state revenue
Grants and other intergovernmental revenue 3,425,981 - 3,425,981 not restricted to specific programs 1,243,814 80,685 1,324,499 Unrestricted investment earnings
54,026 17,574 71,600 Gain on sale of capital assets 550,526 - 550,526 Other
(855,263) 855,263 - Transfers
56,382,863 953,522 57,336,385 Total general revenues and transfers
16,505,683 1,106,203 17,611,886 Changes in net position
24,062,286 8,039,871 32,102,157 Net position, beginning of year
40,567,969$ 9,146,074$ 49,714,043$ Net position, end of year
Business-type Activities
Changes in Net PositionNet (Expense) Revenue and
Governmental Activities
The accompanying notes are an integral part of the basic financial statements.15

CommunityHealth and Development County Road Other Total
General Roads Welfare Block Grants Capital Construction Governmental Governmental
Assets:Cash and investments 9,084,227$ 8,625,689$ 7,852,703$ 436$ 28,907$ 1,642,322$ 7,131,447$ 34,365,731$ Accounts receivable 1,816,209 4,992 - - - - 210 1,821,411 Taxes receivable 19,553 - - - - - 2,916 22,469 Intergovernmental receivables 3,559,441 729,219 6,115,379 521,416 4,209,756 7,060,759 3,067,863 25,263,833 Prepaid items 1,170 - 8,405 103,000 - - - 112,575 Inventories - 34,881 - - - - - 34,881 Restricted cash and investments 927,851 - - - 8,662,851 - 7,732 9,598,434 Loans receivable - - - 14,089,599 - - - 14,089,599 Advances to other funds 676,000 408,514 - - - - - 1,084,514
Total assets 16,084,451$ 9,803,295$ 13,976,487$ 14,714,451$ 12,901,514$ 8,703,081$ 10,210,168$ 86,393,447$
Liabilities, deferred inflows of
resources, and fund balances:
Liabilities:
Accounts payable 2,275,211$ 31,445$ 1,215,085$ 60,116$ 223,701$ 1,128,464$ 2,549,060$ 7,483,082$
Salaries and benefits payable 582,681 56,399 288,085 - - - 6,066 933,231
Unearned revenue 4,961,953 1,385,991 2,557,673 - - 242,901 7,282 9,155,800
Other liabilities 6,292 - 722,835 - - - - 729,127
Advances from other funds 408,514 - - 323,329 6,118,290 4,360,500 584,800 11,795,433
Total liabilities 8,234,651 1,473,835 4,783,678 383,445 6,341,991 5,731,865 3,147,208 30,096,673
Deferred inflows of resources:
Unavailable revenue - - - - 977,804 1,765,509 - 2,743,313
Fund balances:Nonspendable:
Not in spendable form 677,170 34,881 8,405 103,000 - - - 823,456 To be maintained intact - - - - - - 174,697 174,697
Restricted:Capital projects 927,851 - - - 5,581,719 1,205,707 97,610 7,812,887 Public ways and facilities - 8,294,579 - - - - 4,867,875 13,162,454 Health and welfare - - 9,184,404 - - - 25,732 9,210,136 Children and Families Commission - - - - - - 729,461 729,461 Community development - - - 14,228,006 - - - 14,228,006 Public protection - - - - - - 897,322 897,322 Perpetual care - - - - - - 156,331 156,331 Other purposes - - - - - - 113,932 113,932
Assigned:Subsequent year budget 3,192,909 - - - - - - 3,192,909
Unassigned 3,051,870 - - - - - - 3,051,870
Total fund balances 7,849,800 8,329,460 9,192,809 14,331,006 5,581,719 1,205,707 7,062,960 53,553,461
Total liabilities, deferred inflows of resources, and fund balances 16,084,451$ 9,803,295$ 13,976,487$ 14,714,451$ 12,901,514$ 8,703,081$ 10,210,168$ 86,393,447$
COUNTY OF TUOLUMNE, CALIFORNIABALANCE SHEET
GOVERNMENTAL FUNDSJUNE 30, 2019
The accompanying notes are an integral part of the basic financial statements.16

Amounts reported for governmental activities in the statement of net position are different because:
Total fund balances - total governmental funds 53,553,461$
Capital assets used in governmental activities are not financial resources and, therefore, are not reported in the funds. 137,348,864
Other long-term assets are not available to pay for current-period expenditures and, therefore, are deferred in the funds. 2,743,313
Internal service funds are used by management to charge the costs of worker's compensation and general liability self-insurance, purchasing and special services, telecommunications, various employee benefits, and fleet and radio services to individual funds. The assets and liabilities of the internal service funds are included in governmental activities in the statement of net position. 4,320,546
Deferred outflows and inflows of resources for pension items in governmental activities are not financial resources and, therefore, are not reported in the governmental funds.
Deferred outflows of resources 17,652,381$ Deferred inflows of resources (1,942,287) 15,710,094
Deferred outflows and inflows of resources for other postemployment benefit items in governmental activities are not financial resources and, therefore, are not reported in the governmental funds.
Deferred outflows of resources 938,240$ Deferred inflows of resources (3,903,907) (2,965,667)
Long-term and other liabilities are not due and payable in the current period and therefore are not reported in the funds.
Bonds payable (32,961,000)$ Less: Issuance premium (to be amortized as interest expense) (459,944)
Accrued interest payable (87,712) Net pension liability (106,170,576) Total other postemployment benefits liability (30,463,410) (170,142,642)
Net position of governmental activities 40,567,969$
COUNTY OF TUOLUMNE, CALIFORNIARECONCILIATION OF THE BALANCE SHEET OF GOVERNMENTAL
FUNDS TO THE STATEMENT OF NET POSITIONJUNE 30, 2019
The accompanying notes are an integral part of the basic financial statements.17

CommunityHealth and Development County Road Other Total
General Roads Welfare Block Grants Capital Construction Governmental GovernmentalRevenues:
Taxes 31,691,725$ -$ -$ -$ -$ -$ 2,988,931$ 34,680,656$ Licenses and permits 2,526,736 132,563 - - - - 21,963 2,681,262 Fines, forfeits, and penalties 1,493,774 - 12,421 - - - 171,034 1,677,229 Investment earnings, rents, and concessions 370,460 5,293 1,355 2,461 257,060 - 224,540 861,169 Intergovernmental:
State 21,791,673 4,030,589 21,217,212 - 13,477,435 1,733,277 1,300,193 63,550,379 Federal 5,069,230 720,740 11,047,732 1,607,301 - 4,644,082 3,547,259 26,636,344 Other 676,192 646,385 25,000 - - 434,709 136,945 1,919,231
Charges for services 9,677,162 2,322,608 1,023,923 - 150,371 129 896,001 14,070,194 Miscellaneous 321,053 22,624 188,661 - 120 - 150,366 682,824
Total revenues 73,618,005 7,880,802 33,516,304 1,609,762 13,884,986 6,812,197 9,437,232 146,759,288
Expenditures:Current:
General government 17,765,898 880,456 - - - - 20 18,646,374 Public protection 41,764,669 - - - - - 5,477,898 47,242,567 Public ways and facilities 92,157 7,627,860 - - 230,126 80,218 461,713 8,492,074 Health and sanitation 628,566 - 15,294,818 - - - 804,779 16,728,163 Public assistance 228,181 - 21,418,413 1,185,096 - - - 22,831,690 Education 1,236,750 - - - - - - 1,236,750 Recreation and cultural services 1,754,887 - - - - - - 1,754,887
Capital outlay 1,190,120 190,602 19,809 - 20,532,540 10,708,614 3,168,993 35,810,678 Debt service:
Principal 1,099,000 - - - - - 40,116 1,139,116 Bond issuance costs 161,160 - - - - - - 161,160 Interest 1,176,816 - - - - - 3,024 1,179,840
Total expenditures 67,098,204 8,698,918 36,733,040 1,185,096 20,762,666 10,788,832 9,956,543 155,223,299
Excess (deficiency) of revenues over (under) expenditures 6,519,801 (818,116) (3,216,736) 424,666 (6,877,680) (3,976,635) (519,311) (8,464,011)
Other financing sources (uses):Transfers in 4,531 1,051,581 3,006,519 - 994,928 2,761,385 871,475 8,690,419 Transfers out (6,323,864) (2,043,860) (10,517) - - - (512,759) (8,891,000) Refunding bonds issued 4,900,000 - - - - - - 4,900,000 Premium on refunding bonds issued 18,217 - - - - - - 18,217 Payment to refunded bond escrow agent (4,757,057) - - - - - - (4,757,057) Proceeds from sale of capital assets 27,341 34,110 - - - - - 61,451
Total other financing sources (uses) (6,130,832) (958,169) 2,996,002 - 994,928 2,761,385 358,716 22,030
Changes in fund balances 388,969 (1,776,285) (220,734) 424,666 (5,882,752) (1,215,250) (160,595) (8,441,981)
Fund balances, beginning of year 7,460,831 10,105,745 9,413,543 13,906,340 11,464,471 2,420,957 7,223,555 61,995,442
Fund balances, end of year 7,849,800$ 8,329,460$ 9,192,809$ 14,331,006$ 5,581,719$ 1,205,707$ 7,062,960$ 53,553,461$
COUNTY OF TUOLUMNE, CALIFORNIASTATEMENT OF REVENUES, EXPENDITURES, AND CHANGES IN FUND BALANCES
GOVERNMENTAL FUNDSFOR THE YEAR ENDED JUNE 30, 2019
The accompanying notes are an integral part of the basic financial statements.18

Amounts reported for governmental activities in the statement of activities are different because:
Changes in fund balances - total governmental funds (8,441,981)$
cost of those assets is allocated over their estimated useful lives and reported as depreciation expense. This is the amount by which capital outlay exceeded depreciation expense in the current period:
Capital outlay 35,810,678$ Depreciation (5,237,085) 30,573,593
The net effect of various miscellaneous transactions involving capital assets (i.e., sales and transfers) is a change net position.
The statement of activities reports losses arising from the disposal of existing capital assets. However, in the governmental funds, any proceeds from the sale of disposed capital assets increases financial resources. Thus, the change in net position differs from the change in fund balance by the book value of the disposed assets. (7,425)$ Transfers of capital assets to business-type activities decrease net position of the governmental activities in the statement of activities, but do not appear in the governmental funds because they are not a use of financial resources. (545,167) Transfer of capital assets from internal service funds do not impact net position of the governmental activities in the statement of activities as internal service funds are already part of governmental activities, however they are reported in the internal service funds as a loss on sale of capital assets. 4,287 (548,305)
Revenues in the statement of activities that do not provide current financial resources are not reported as revenues in the funds. 2,743,313
Internal service funds are used by management to charge the costs of worker's compensation and general liability self-insurance, purchasing and special services, telecommunications, various employee benefits, and fleet and radio services to individual funds. The net revenue of certain internal service funds is reported with governmental activities. 1,174,912
Some expenses reported in the statement of activities do not require the use of current financial resources and, therefore, are not reported as expenditures in governmental funds.
Amortization of bond premium 70,738$ Interest included in payment to refunded bond escrow agent (52,057) Change in accrued interest (27,946) (9,265)
Governmental funds report pension and other postemployment benefits contributions made during the year as expenditures. The statement of activities reports pension and other postemployment benefit expenses as the change in the liabilities and related deferred outflows and inflows of resources.
Pension (9,101,540)$ Other postemployment benefits (863,000) (9,964,540)
The issuance of long-term debt provides current financial resources to governmental funds, while the repayment of the principal of long-term debt consumes the current financial resources of governmental funds. Neither has an effect on net position.
Refunding bonds issued (4,900,000)$ Premium on refunding bonds issued (18,217) Payment to refunded bond escrow agent 4,757,057 Principal repayments 1,139,116 977,956
Change in net position of governmental activities 16,505,683$
Governmental funds report capital outlays as expenditures. However, in the statement of activities the
COUNTY OF TUOLUMNE, CALIFORNIARECONCILIATION OF THE STATEMENT OF REVENUES, EXPENDITURES,
AND CHANGES IN FUND BALANCES OF GOVERNMENTAL FUNDS
FOR THE YEAR ENDED JUNE 30, 2019TO THE STATEMENT OF ACTIVITIES
The accompanying notes are an integral part of the basic financial statements.19

GovernmentalNonmajor Activities -
Public InternalSolid Power Service
Waste Ambulance Airport Agency Total FundsAssets:Current assets:
Cash and investments 1,136,993$ 1,647,283$ 156,363$ 1,463,984$ 4,404,623$ 4,654,346$ Accounts receivable, net 153,989 805,376 - - 959,365 199,568 Intergovernmental receivables - 143,329 - 86,950 230,279 1,562
Total current assets 1,290,982 2,595,988 156,363 1,550,934 5,594,267 4,855,476 Noncurrent assets:
Restricted cash and investments - - - 619,004 619,004 175,000 Deposits with others - - - 67,000 67,000 - Advances to other funds - - - - - 12,218,796 Capital assets:
Nondepreciable 408,236 501,251 1,173,530 - 2,083,017 - Depreciable, net 31,330 2,952,703 4,080,173 - 7,064,206 893,602 Total noncurrent assets 439,566 3,453,954 5,253,703 686,004 9,833,227 13,287,398 Total assets 1,730,548 6,049,942 5,410,066 2,236,938 15,427,494 18,142,874
Deferred outflows of resources:Related to other postemployment benefits 1,422 948 1,895 - 4,265 - Related to pension 78,503 40,031 80,502 - 199,036 -
Total outflows of resources 79,925 40,979 82,397 - 203,301 -
Liabilities:Current liabilities:
Accounts payable 35,327 252,264 6,979 175,070 469,640 562,940 Salaries and benefits payable 6,766 1,939 4,045 - 12,750 1,496 Unearned revenue 38,087 - - - 38,087 - Other liabilities - 2,550 10,800 - 13,350 - Accrued compensated absences, current 14,278 8,261 12,237 - 34,776 1,811,747 Accrued claims, current - - - - - 1,893,021 Landfill closure/postclosure, current 150,460 - - - 150,460 -
Total current liabilities 244,918 265,014 34,061 175,070 719,063 4,269,204 Noncurrent liabilities:
Advances from other funds - - - - - 831,877 Accrued compensated absences 6,061 5,490 - - 11,551 2,244,667 Total other postemployment benefits liability 63,873 42,582 85,164 - 191,619 - Net pension liability 649,431 316,450 698,311 - 1,664,192 - Accrued claims - - - - - 7,426,979 Landfill closure/postclosure 2,827,440 - - - 2,827,440 -
Total noncurrent liabilities 3,546,805 364,522 783,475 - 4,694,802 10,503,523 Total liabilities 3,791,723 629,536 817,536 175,070 5,413,865 14,772,727
Deferred inflows of resources:Related to other postemployment benefits 8,185 5,457 10,914 - 24,556 - Related to pension 56,235 6,593 33,073 - 95,901 -
Total inflows of resources 64,420 12,050 43,987 - 120,457 -
Net position:Net investment in capital assets 439,566 3,453,954 5,253,703 - 9,147,223 893,602 Restricted for:
Energy services - - - 619,004 619,004 - Unrestricted (2,485,236) 1,995,381 (622,763) 1,442,864 330,246 2,476,545
Total net position (2,045,670)$ 5,449,335$ 4,630,940$ 2,061,868$ 10,096,473 3,370,147$ Adjustment to reflect the consolidation of internal service fund activities related to enterprise funds. (950,399)
Net position of business-type activities 9,146,074$
MajorBusiness-type Activities - Enterprise Funds
COUNTY OF TUOLUMNE, CALIFORNIASTATEMENT OF NET POSITION
PROPRIETARY FUNDSJUNE 30, 2019
The accompanying notes are an integral part of the basic financial statements.20

GovernmentalNonmajor Activities -
Public InternalSolid Power ServiceWaste Ambulance Airport Agency Total Funds
Operating revenues:Charges for services 1,525,589$ 5,611,612$ 508,244$ 1,937,762$ 9,583,207$ 18,612,935$ Miscellaneous 1,023 60,303 54,898 - 116,224 334,058
Total operating revenues 1,526,612 5,671,915 563,142 1,937,762 9,699,431 18,946,993
Operating expenses:Salaries and benefits 326,206 210,674 416,547 2,120 955,547 2,054,220 Purchased services 104,612 4,074,351 4,345 - 4,183,308 - Professional fees 499,308 411,683 53,241 61,527 1,025,759 530,020 Claims - - - - - 3,555,752 Health insurance benefits - - - - - 10,437,531 Unemployment benefits - - - - - 73,745 General and administrative 77,842 1,005,207 117,691 99,363 1,300,103 1,378,378 Utilities - 56,227 41,166 1,548,724 1,646,117 - Depreciation 10,668 459,587 243,660 - 713,915 8,560
Total operating expenses 1,018,636 6,217,729 876,650 1,711,734 9,824,749 18,038,206
Operating income (loss) 507,976 (545,814) (313,508) 226,028 (125,318) 908,787
Nonoperating revenues (expenses):Investment earnings 15,905 23,392 2,280 39,108 80,685 382,645 Intergovernmental
State 64,119 - 54,071 - 118,190 - Federal - 146,410 10,725 - 157,135 -
Gain (loss) on sale of capital assets - 15,504 2,070 - 17,574 (4,287) Interest expense - - - - - (44)
Total nonoperating revenues (expenses) 80,024 185,306 69,146 39,108 373,584 378,314
Income (loss) before capital contribustions and transfers 588,000 (360,508) (244,362) 265,136 248,266 1,287,101
Capital contributions - - 545,167 - 545,167 - Transfers in - 396,108 14,429 - 410,537 - Transfers out - - (100,441) - (100,441) (109,515)
Changes in net position 588,000 35,600 214,793 265,136 1,103,529 1,177,586
(2,633,670) 5,413,735 4,416,147 1,796,732 2,192,561
Net position, end of year (2,045,670)$ 5,449,335$ 4,630,940$ 2,061,868$ 3,370,147$
Adjustment to reflect the consolidation of internal service fund activities related to enterprise funds. 2,674
Change in net position of business-type activities 1,106,203$
Net position, beginning of year
MajorBusiness-type Activities - Enterprise Funds
COUNTY OF TUOLUMNE, CALIFORNIASTATEMENT OF REVENUES, EXPENSES, AND CHANGES IN FUND NET POSITION
PROPRIETARY FUNDSFOR THE YEAR ENDED JUNE 30, 2019
The accompanying notes are an integral part of the basic financial statements.21
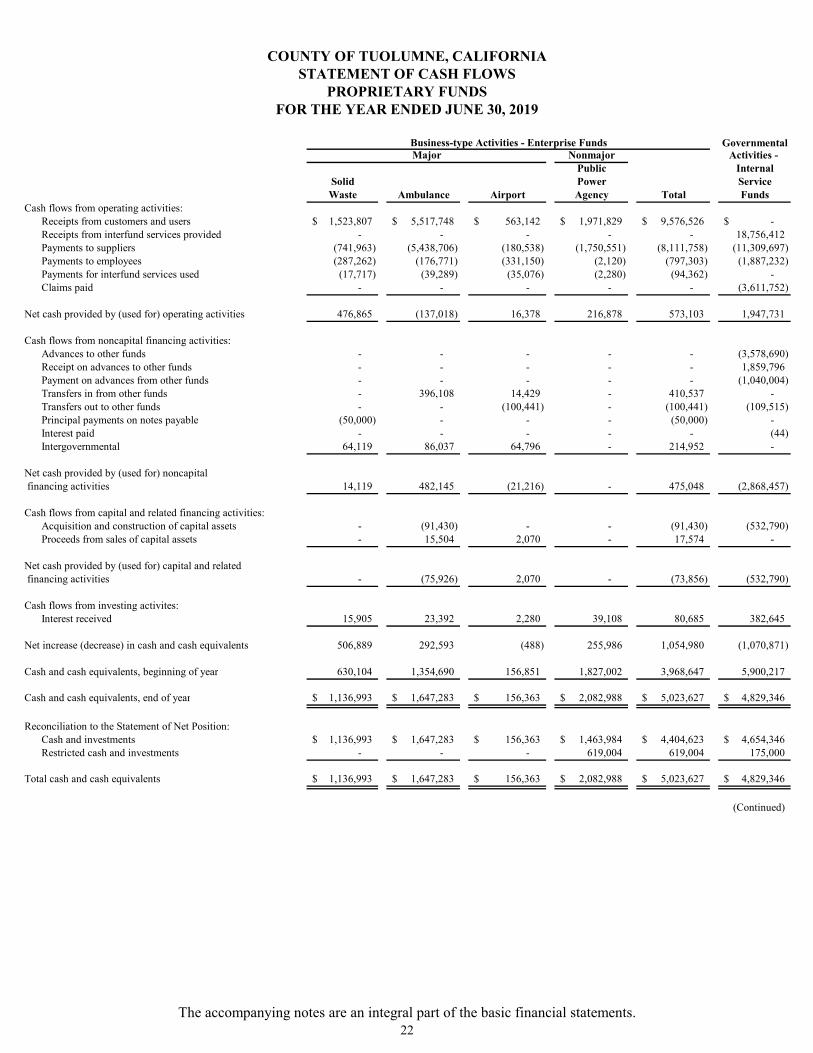
GovernmentalNonmajor Activities -
Public InternalSolid Power ServiceWaste Ambulance Airport Agency Total Funds
Cash flows from operating activities:Receipts from customers and users 1,523,807$ 5,517,748$ 563,142$ 1,971,829$ 9,576,526$ -$ Receipts from interfund services provided - - - - - 18,756,412 Payments to suppliers (741,963) (5,438,706) (180,538) (1,750,551) (8,111,758) (11,309,697) Payments to employees (287,262) (176,771) (331,150) (2,120) (797,303) (1,887,232) Payments for interfund services used (17,717) (39,289) (35,076) (2,280) (94,362) - Claims paid - - - - - (3,611,752)
Net cash provided by (used for) operating activities 476,865 (137,018) 16,378 216,878 573,103 1,947,731
Cash flows from noncapital financing activities:Advances to other funds - - - - - (3,578,690) Receipt on advances to other funds - - - - - 1,859,796 Payment on advances from other funds - - - - - (1,040,004) Transfers in from other funds - 396,108 14,429 - 410,537 - Transfers out to other funds - - (100,441) - (100,441) (109,515) Principal payments on notes payable (50,000) - - - (50,000) - Interest paid - - - - - (44) Intergovernmental 64,119 86,037 64,796 - 214,952 -
Net cash provided by (used for) noncapital financing activities 14,119 482,145 (21,216) - 475,048 (2,868,457)
Cash flows from capital and related financing activities:Acquisition and construction of capital assets - (91,430) - - (91,430) (532,790) Proceeds from sales of capital assets - 15,504 2,070 - 17,574 -
Net cash provided by (used for) capital and related financing activities - (75,926) 2,070 - (73,856) (532,790)
Cash flows from investing activites:Interest received 15,905 23,392 2,280 39,108 80,685 382,645
Net increase (decrease) in cash and cash equivalents 506,889 292,593 (488) 255,986 1,054,980 (1,070,871)
Cash and cash equivalents, beginning of year 630,104 1,354,690 156,851 1,827,002 3,968,647 5,900,217
Cash and cash equivalents, end of year 1,136,993$ 1,647,283$ 156,363$ 2,082,988$ 5,023,627$ 4,829,346$
Reconciliation to the Statement of Net Position:Cash and investments 1,136,993$ 1,647,283$ 156,363$ 1,463,984$ 4,404,623$ 4,654,346$ Restricted cash and investments - - - 619,004 619,004 175,000
Total cash and cash equivalents 1,136,993$ 1,647,283$ 156,363$ 2,082,988$ 5,023,627$ 4,829,346$
(Continued)
Major
COUNTY OF TUOLUMNE, CALIFORNIA
Business-type Activities - Enterprise Funds
FOR THE YEAR ENDED JUNE 30, 2019PROPRIETARY FUNDS
STATEMENT OF CASH FLOWS
The accompanying notes are an integral part of the basic financial statements.22

GovernmentalNonmajor Activities -
Public InternalSolid Power ServiceWaste Ambulance Airport Agency Total Funds
Reconciliation of operating income (loss) to net cash provided by (used for) operating activities:
Operating income (loss) 507,976$ (545,814)$ (313,508)$ 226,028$ (125,318)$ 908,787$ Adjustments to reconcile operating income (loss) to net cash provided by (used for) operating activities:
Depreciation expense 10,668 459,587 243,660 - 713,915 8,560 Changes in assets, liabilities, and deferred outflows and inflows of resources:
Accounts receivable, net (22,733) (154,167) - - (176,900) (199,568) Intergovernmental receivables - - - 34,067 34,067 8,987 Prepaid items - - - - - 669,494 Inventories - - - - - 8,000 Accounts payable (22,121) 69,473 529 (43,217) 4,664 432,483 Salaries and benefits payable 4,250 166 (1,556) - 2,860 (7,017) Unearned revenue 19,928 - - - 19,928 - Other liabilities - - 300 - 300 (375,000) Total other postemployment benefits liability and related deferred outflows/inflows 737 491 12,857 - 14,085 - Net pension liability and related deferred outflows/inflows 30,742 30,993 87,923 - 149,658 - Accrued compensated absences 3,215 2,253 (13,827) - (8,359) 174,005 Accrued claims - - - - - 319,000 Landfill closure/postclosure (55,797) - - - (55,797) -
Net cash provided by (used for) operating activities 476,865$ (137,018)$ 16,378$ 216,878$ 573,103$ 1,947,731$
Noncash investing, capital, and financing activities:Contribution of capital assets from governmental activities -$ -$ 545,167$ -$ 545,167$ -$ Transfer out of capital assets - - - - - 4,287
Business-type Activities - Enterprise FundsMajor
COUNTY OF TUOLUMNE, CALIFORNIASTATEMENT OF CASH FLOWS (Continued)
PROPRIETARY FUNDSFOR THE YEAR ENDED JUNE 30, 2019
The accompanying notes are an integral part of the basic financial statements.23
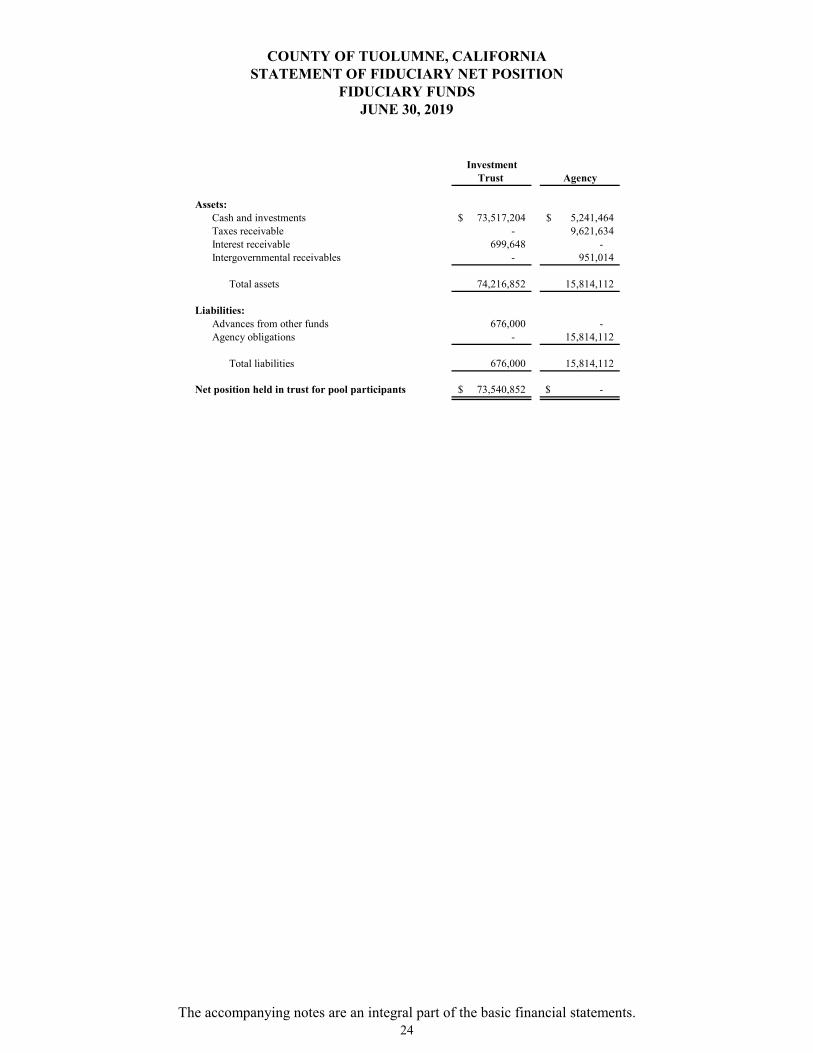
InvestmentTrust Agency
Assets:Cash and investments 73,517,204$ 5,241,464$ Taxes receivable - 9,621,634 Interest receivable 699,648 - Intergovernmental receivables - 951,014
Total assets 74,216,852 15,814,112
Liabilities:Advances from other funds 676,000 - Agency obligations - 15,814,112
Total liabilities 676,000 15,814,112
Net position held in trust for pool participants 73,540,852$ -$
COUNTY OF TUOLUMNE, CALIFORNIA
FIDUCIARY FUNDSSTATEMENT OF FIDUCIARY NET POSITION
JUNE 30, 2019
The accompanying notes are an integral part of the basic financial statements.24

Additions: Contribution to pooled investments 95,827,891$
Net investment income: Investment earnings 1,345,804
Total additions 97,173,695
Deductions: Distribution from pooled investments 89,637,731
Change in net position 7,535,964
Net position, beginning of year 66,004,888
Net position, end of year 73,540,852$
COUNTY OF TUOLUMNE, CALIFORNIA STATEMENT OF CHANGES IN FIDUCIARYNET POSITION - INVESTMENT TRUST FUND
FOR THE YEAR ENDED JUNE 30, 2019
The accompanying notes are an integral part of the basic financial statements.25
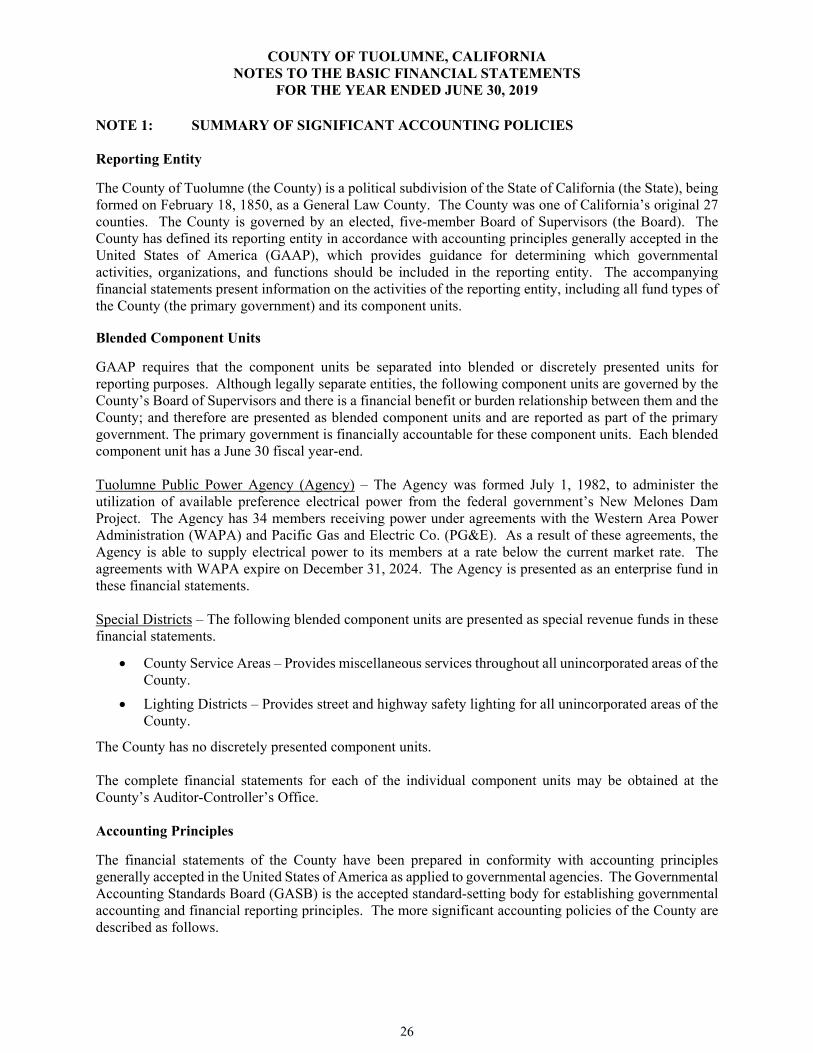
COUNTY OF TUOLUMNE, CALIFORNIA NOTES TO THE BASIC FINANCIAL STATEMENTS
FOR THE YEAR ENDED JUNE 30, 2019
26
NOTE 1: SUMMARY OF SIGNIFICANT ACCOUNTING POLICIES Reporting Entity
The County of Tuolumne (the County) is a political subdivision of the State of California (the State), being formed on February 18, 1850, as a General Law County. The County was one of California’s original 27 counties. The County is governed by an elected, five-member Board of Supervisors (the Board). The County has defined its reporting entity in accordance with accounting principles generally accepted in the United States of America (GAAP), which provides guidance for determining which governmental activities, organizations, and functions should be included in the reporting entity. The accompanying financial statements present information on the activities of the reporting entity, including all fund types of the County (the primary government) and its component units. Blended Component Units
GAAP requires that the component units be separated into blended or discretely presented units for reporting purposes. Although legally separate entities, the following component units are governed by the County’s Board of Supervisors and there is a financial benefit or burden relationship between them and the County; and therefore are presented as blended component units and are reported as part of the primary government. The primary government is financially accountable for these component units. Each blended component unit has a June 30 fiscal year-end. Tuolumne Public Power Agency (Agency) – The Agency was formed July 1, 1982, to administer the utilization of available preference electrical power from the federal government’s New Melones Dam Project. The Agency has 34 members receiving power under agreements with the Western Area Power Administration (WAPA) and Pacific Gas and Electric Co. (PG&E). As a result of these agreements, the Agency is able to supply electrical power to its members at a rate below the current market rate. The agreements with WAPA expire on December 31, 2024. The Agency is presented as an enterprise fund in these financial statements. Special Districts – The following blended component units are presented as special revenue funds in these financial statements.
County Service Areas – Provides miscellaneous services throughout all unincorporated areas of the County.
Lighting Districts – Provides street and highway safety lighting for all unincorporated areas of the County.
The County has no discretely presented component units. The complete financial statements for each of the individual component units may be obtained at the County’s Auditor-Controller’s Office. Accounting Principles
The financial statements of the County have been prepared in conformity with accounting principles generally accepted in the United States of America as applied to governmental agencies. The Governmental Accounting Standards Board (GASB) is the accepted standard-setting body for establishing governmental accounting and financial reporting principles. The more significant accounting policies of the County are described as follows.

COUNTY OF TUOLUMNE, CALIFORNIA NOTES TO THE BASIC FINANCIAL STATEMENTS (Continued)
FOR THE YEAR ENDED JUNE 30, 2019
27
NOTE 1: SUMMARY OF SIGNIFICANT ACCOUNTING POLICIES (Continued) Government-Wide and Fund Financial Statements
The statement of net position and statement of activities report information on all of the nonfiduciary activities of the primary government (the County) and its component units. Governmental activities, which normally are supported by taxes and intergovernmental revenues, are reported separately from business-type activities, which rely to a significant extent on fees and charges for support. The statement of activities demonstrates the degree to which the expenses of a given function or segment are offset by program revenues. Expenses include those that are clearly identifiable with a specific program or function (direct), but also include an element of indirect costs. Program revenues include 1) charges to customers or applicants who purchase, use, or directly benefit from goods, services or privileges provided by a given function or segment and 2) grants and contributions that are restricted to meeting the operational or capital requirements of a particular function or segment. Taxes and other items not properly included among program revenues are reported instead as general revenues. Separate financial statements are provided for governmental funds, proprietary funds, and fiduciary funds, even though the latter are excluded from the government-wide financial statements. Major individual governmental funds and major individual enterprise funds are reported as separate columns in the fund financial statements. Measurement Focus, Basis of Accounting and Financial Statement Presentation
The government-wide financial statements are reported using the economic resources measurement focus and the accrual basis of accounting, as are the proprietary funds and Investment Trust fiduciary fund financial statements. The Agency fiduciary fund financial statements also are reported using the accrual basis of accounting, however they have no measurement focus. Revenues are recorded when earned and expenses are recorded when a liability is incurred, regardless of the timing of the related cash flows. Property taxes are recognized as revenues in the year for which they are levied. Grants and similar items are recognized as revenue as soon as all eligibility requirements imposed by the provider have been met. Governmental fund financial statements are reported using the current financial resources measurement focus and the modified accrual basis of accounting. Revenues are recognized as soon as they are both measurable and available. Revenues are considered to be available when they are collectible within the current period or soon enough thereafter to pay liabilities of the current period. For this purpose, the County considers revenues to be available if they are collected within 120 days of the end of the current fiscal period, except for property taxes and some intergovernmental revenues. The County considers property taxes available if they are collected within 60 days of the end of the current fiscal period. For some intergovernmental revenues, the County considers them available if they are collected within 365 days. Expenditures generally are recorded when a liability is incurred, as under accrual accounting. However, debt service expenditures, as well as expenditures related to compensated absences and claims and judgments, are recorded only when payment is due. Property taxes, franchise taxes, sales and use taxes, transient occupancy taxes, gas taxes, licenses, grants, charges for services, and investment earnings associated with the current fiscal period are all considered to be susceptible to accrual and so have been recognized as revenues of the current fiscal period. All other revenue items are considered to be measurable and available only when cash is received by the County.

COUNTY OF TUOLUMNE, CALIFORNIA NOTES TO THE BASIC FINANCIAL STATEMENTS (Continued)
FOR THE YEAR ENDED JUNE 30, 2019
28
NOTE 1: SUMMARY OF SIGNIFICANT ACCOUNTING POLICIES (Continued) The County reports the following major governmental funds:
The General Fund is the County’s primary operating fund and accounts for all financial resources, except those required to be accounted for in another fund. The major revenue sources of this fund are taxes and state funding.
The Roads Special Revenue Fund accounts for activities related to the maintenance of County roads, numerous storm drainage ditches and culverts, bridges, and a fleet of heavy construction equipment. The major revenue sources of this fund are state and federal grants and charges for services.
The Health and Welfare Special Revenue Fund accounts for the services provided to County residents in the areas of health, mental health, substance abuse, social services, employment assistance and public assistance. The major revenue sources of this fund are state and federal grants.
The Community Development Block Grants Special Revenue Fund accounts for the activities of federally funded community development block grants. The fund source is the federal block grants for housing, business, and first-time homeowners.
The County Capital Capital Projects Fund accounts for all County capital projects not accounted for in the Road Construction Fund. The major revenue source of this fund is state funding.
The Road Construction Capital Projects Fund accounts for the activities related to major construction projects like bridges and new roads or highways.
The County reports the following major enterprise funds:
The Solid Waste Enterprise Fund accounts for the landfill closure and postclosure costs for the Central and Big Oak Flat landfills.
The Ambulance Enterprise Fund accounts for the operations of the County’s emergency response services provided to its residents.
The Airport Enterprise Fund accounts for the operations of the Columbia and Pine Mountain Lake airports.
Additionally, the County reports the following:
The Public Power Agency nonmajor enterprise fund accounts for the operations of the 30-member Tuolumne Public Power Agency, which supplies electrical power to its members at a rate below the current market rate.
Internal Service Funds account for the financing of goods and services provided by one department to other departments of the County, on a cost-reimbursement basis. Activities include the County’s self-insurance programs, purchasing and special services, telecommunications, various employee benefits, and fleet and radio services.
The Investment Trust Fund accounts for the pooling of resources in an investment portfolio for external County agencies and legally separate participants.
Agency Funds account for property tax collections, local transportation funds held for the Tuolumne County Transportation Council (Council), and fines collected for medical services and allocated to third parties.
As a general rule, the effect of interfund activity has been eliminated from the government-wide financial statements, except for interfund services provided and used, which are not eliminated in the process of consolidation.

COUNTY OF TUOLUMNE, CALIFORNIA NOTES TO THE BASIC FINANCIAL STATEMENTS (Continued)
FOR THE YEAR ENDED JUNE 30, 2019
29
NOTE 1: SUMMARY OF SIGNIFICANT ACCOUNTING POLICIES (Continued) Proprietary funds distinguish operating revenues and expenses from nonoperating items. Operating revenues and expenses generally result from providing services and producing and delivering goods in connection with a proprietary fund’s principal ongoing operations. The principal operating revenues of the County’s proprietary funds are charges to customers for sales and services rendered. Operating expenses include the cost of sales and services, administrative expenses, and depreciation on capital assets. All revenues and expenses not meeting this definition are reported as nonoperating revenues and expenses. Financial Statement Elements
Cash and Investments
A pooled cash and investment system is used for substantially all funds except specified funds, which by law must be segregated. The share of each fund in the pooled cash and investment account is separately accounted for and interest earned is apportioned quarterly based on the relationship of its daily balance to the total of pooled cash and investments. The County has stated required investments at fair value in the basic financial statements. The fair value of investments is based on the requirements of GASB Statement No. 72. In accordance with GASB Statement No. 9, for purposes of the statement of cash flows, the County considers all pooled cash and investments held by the Treasurer as cash equivalents. The County Treasurer’s investment pool values participants’ shares on an amortized cost basis. At June 30, 2019, there is no material difference between pool participants’ shares valued on an amortized cost basis compared to fair value. Property Tax Levy, Collection and Maximum Rates
Article XIII of the California Constitution (Proposition 13) limits ad valorem taxes on real property to one percent of value plus taxes necessary to pay indebtedness approved by voters prior to July 1, 1978. The Article also established the 1975/76 assessed valuation as the base and limits annual increases to the cost of living, not to exceed two percent, for each year thereafter. Property may also be reassessed to full market value after a sale, transfer of ownership, or completion of new construction. Property may also be reassessed when there is a decline in the full market value. The State is prohibited under the Article from imposing new ad valorem, sales, or transactions taxes on real property. Local governments may impose special taxes (except on real property) with the approval of two-thirds of the qualified electors.
The County is responsible for assessing, collecting and distributing property taxes in accordance with state law. Liens on real property are established January 1 for the ensuing fiscal year. The property tax is levied as of July 1 on all taxable property located in the County. Secured property taxes are due in two equal installments on November 1 and February 1 and are delinquent after December 10 and April 10, respectively. Additionally, supplemental property taxes are levied on a pro rata basis when changes in assessed valuation occur due to sales transactions or the completion of construction. In fiscal year 1993-94, the County adopted the Alternate Method of Property Tax Allocation (commonly referred to as the Teeter Plan). Under the Teeter Plan, the County Auditor-Controller, an elected official, is authorized to pay 100 percent of the property taxes billed (secured, supplemental, and debt service) to the taxing agencies within the County. The County recognizes property tax revenues in the period for which the taxes are levied and in governmental funds when measurable and available.

COUNTY OF TUOLUMNE, CALIFORNIA NOTES TO THE BASIC FINANCIAL STATEMENTS (Continued)
FOR THE YEAR ENDED JUNE 30, 2019
30
NOTE 1: SUMMARY OF SIGNIFICANT ACCOUNTING POLICIES (Continued) Receivables
The majority of the loans receivable balance of $14,089,599 is not expected to be collected within one year and the proceeds from their collection are restricted. Accounts receivable of the Ambulance enterprise fund of $805,376 is reported net of bad debt allowances of $2,112,539.
Interfund Receivables and Payables
Activity between funds that are representative of lending and/or borrowing arrangements outstanding at the end of the fiscal year are referred to as either due to/from other funds (i.e., the current portion of interfund loans) or advances to/from other funds (i.e., the noncurrent portion of interfund loans) in the balance sheet of governmental funds and the statements of net position for proprietary and fiduciary funds. Any residual balances outstanding between the governmental activities and business-type activities are reported in the government-wide financial statements as internal balances. Advances to other funds, as reported in the governmental funds balance sheet, are reported as nonspendable fund balance in the applicable governmental funds to indicate those amounts that are not in spendable form, unless the proceeds from the collection of the advances are restricted, committed, or assigned, in which case the advances are included in the appropriate fund balance classification. Prepaid Items and Inventories
Prepaid items represent payments made prior to the end of the fiscal year for goods and/or services benefitting periods beyond the end of the year that are expended as consumed. In governmental funds, a portion of fund balance has been classified as nonspendable to indicate that prepaid items are not in spendable form. Inventory is valued at average cost and consists of expendable supplies held for consumption that are expended as consumed. Inventories reported in governmental funds are reported as nonspendable fund balance, which indicates that they are not in spendable form. Capital Assets
Capital assets, which include land, structures, equipment (vehicles, computers and office equipment) and infrastructure (i.e., roads and bridges), are reported in the applicable governmental and business-type activities columns in the government-wide financial statements and in the proprietary fund financial statements. The County defines capital assets as assets with an initial cost of more than $5,000 and an estimated useful life in excess of one year. Capital assets are recorded at cost or estimated historical cost if purchased or constructed. Donated capital assets are valued at their estimated fair value prior to July 1, 2015 and at acquisition value thereafter on the date of the donation. The costs of normal maintenance and repairs that do not add to the value of the asset or materially extend assets lives are not capitalized. Buildings and structures, equipment, and infrastructure assets of the primary government are depreciated using the straight-line method over the following estimated useful lives:
Assets Years
Structures and Improvements 5 – 25 Equipment 3 – 15 Infrastructure 25 – 30

COUNTY OF TUOLUMNE, CALIFORNIA NOTES TO THE BASIC FINANCIAL STATEMENTS (Continued)
FOR THE YEAR ENDED JUNE 30, 2019
31
NOTE 1: SUMMARY OF SIGNIFICANT ACCOUNTING POLICIES (Continued) GASB Statement No. 34 requires that the County report infrastructure, including roads, bridges, sidewalks and traffic signals, in the government-wide financial statements. The County has retroactively reported infrastructure capital assets back to June 30, 1972. The County is not reporting any infrastructure assets using the modified approach. Federal, State and Local Grants
Proprietary fund type grants received for operating assistance are recorded as nonoperating revenues in the year in which all eligibility requirements have been met. Governmental fund grants received are recorded as revenues in the year they become both measurable and available and when all eligibility requirements have been met. Monies received that do not meet these criteria are recorded as unearned revenue. Compensated Absences
Employees accumulate vacation time in accordance with the employee’s respective “Memorandum of Understanding”. The amount of vacation and sick time vested and accrued depends on years of service and date of hire. Sick leave vested may be accumulated until termination or retirement. Upon termination or retirement, after 5 years of continuous service, an employee may receive full cash payment of the accumulated sick leave vested up to a maximum of 240 hours and receive a 50% payment for hours in excess of 240 hours. The liabilities for compensated absences are recorded in the Employee Leave Liability Internal Service Fund and the enterprise funds. Pension and Other Postemployment Benefits Plans
For purposes of measuring the net pension liability, deferred outflows of resources and deferred inflows of resources related to pensions, and pension expense, information about the fiduciary net position of the CalPERS Miscellaneous Plan and Safety Plan (collectively, Pension Plans) and additions to/deductions from the Pension Plans’ fiduciary net position have been determined on the same basis. For this purpose, benefit payments (including refunds of employee contributions) are recognized when currently due and payable in accordance with the benefit terms. Investments are reported at fair value. The Retiree Healthcare Plan, an other postemployment benefits plan (OPEB Plan), does not have a trust or equivalent arrangement and is funded on a pay-as-you-go basis. GASB Statement Nos. 68 and 75 require that the reported results must pertain to liability and asset information within certain defined timeframes. For this report, the following timeframes are used: Pension OPEB Valuation Date: June 30, 2017, rolled June 30, 2017, rolled forward to June 30, 2018 forward to June 30, 2018 Measurement Date: June 30, 2018 June 30, 2018 Measurement Period: July 1, 2017 to June 30, 2018 July 1, 2017 to June 30, 2018 Unearned Revenue
Unearned revenue represents financial resources received before eligibility requirements have been met. Primarily, these resources are advances from the State of California and the federal government for costs of various programs administered by the County’s Health and Social Services Department. Long-term Liabilities
In the government-wide financial statements, and proprietary fund types in the fund financial statements, the long-term debt and other long-term obligations are reported as liabilities in the applicable governmental activities, business-type activities, or proprietary fund type statement of net position.

COUNTY OF TUOLUMNE, CALIFORNIA NOTES TO THE BASIC FINANCIAL STATEMENTS (Continued)
FOR THE YEAR ENDED JUNE 30, 2019
32
NOTE 1: SUMMARY OF SIGNIFICANT ACCOUNTING POLICIES (Continued) Encumbrances
Encumbrance accounting is used in governmental funds. In conformity with accounting principles generally accepted in the United States of America, encumbrances (i.e., purchase orders and contracts) outstanding at year-end are reported within fund balance categories and do not constitute expenditures or liabilities because the commitments will be reappropriated and honored during the subsequent year. Net Position/Fund Balances
The government-wide and proprietary fund financial statements utilize a net position presentation. Net position is categorized as net investment in capital assets, restricted, and unrestricted.
Net investment in capital assets. This category groups all capital assets, including infrastructure, into one component of net position. Accumulated depreciation and the outstanding balances of debt that are attributable to the acquisition, construction or improvement of these assets reduce the balance in this category.
Restricted. This category represents assets externally restricted by creditors, grantors, contributors or laws or regulations of other governments and restricted by law through constitutional provisions or enabling legislation reduced by liabilities related to those assets.
Unrestricted. This category represents net position of the County, not restricted for any project or other purpose.
When both restricted and unrestricted net position is available for use, it is the County’s policy to use restricted resources first, then unrestricted resources as they are needed. The governmental funds utilize a classified fund balance presentation. Fund balances are reported in classifications that comprise a hierarchy based primarily on the extent to which the government is bound to honor constraints on the specific purposes for which amounts can be spent as follows:
Nonspendable – to reflect amounts that cannot be spent because they are either (a) not in spendable form or (b) legally or contractually required to be maintained intact.
Restricted – to reflect amounts that can only be used for specific purposes pursuant to constraints either (a) externally imposed by creditors (such as debt covenants), grantors, contributors, or laws or regulations of other governments or (b) imposed by law through constitutional provisions or enabling legislation.
Committed – to reflect amounts that can only be used for specific purposes pursuant to constraints imposed by the passage of an ordinance by the County Board of Supervisors.
Assigned – to reflect amounts that are constrained by the County’s intent to be used for specific purposes, but are neither restricted nor committed. The County Board of Supervisors has authorized the County Administrative Officer or the Auditor-Controller to assign amounts to a specific purpose via the County ordinance assigning purchasing agents.
Unassigned – to reflect amounts that have not been assigned to other funds and that have not been restricted, committed, or assigned to specific purposes within the general fund. In other governmental funds, it may be necessary to report a negative unassigned fund balance.

COUNTY OF TUOLUMNE, CALIFORNIA NOTES TO THE BASIC FINANCIAL STATEMENTS (Continued)
FOR THE YEAR ENDED JUNE 30, 2019
33
NOTE 1: SUMMARY OF SIGNIFICANT ACCOUNTING POLICIES (Continued)
When both restricted and unrestricted fund balance amounts are available for use, it is the County’s policy to use restricted resources first, then unrestricted resources as they are needed. When committed, assigned, and unassigned fund balance amounts are available for use, it is the County’s policy to use committed resources first, then assigned resources, and then unassigned resources as they are needed. Self-Insurance
The County self-insures for property damage, liability, workers’ compensation, and unemployment claims. Self-insurance programs are accounted for in internal service funds. Excess workers’ compensation insurance is provided by the CSAC Excess Insurance Authority, a public agency. Use of Estimates
The preparation of financial statements in conformity with accounting principles generally accepted in the United States of America requires management to make estimates and assumptions. These estimates and assumptions affect the reported amounts of assets and liabilities at the date of the financial statements and the reported amounts of revenues and expenses/expenditures during the reporting period. Accordingly, actual results could differ from those estimates. Future Implementation of New Governmental Accounting Standards
GASB has issued statements that are effective for the County in the future, however their impact, if any, on the County has yet to be determined. The following are the GASB statements that will be effective for the County in the future:
In November 2016, the GASB issued Statement No. 83, Certain Asset Retirement Obligations. This statement addresses accounting and financial reporting for certain asset retirement obligations (AROs). An ARO is a legally enforceable liability associated with the retirement of a tangible capital asset. This statement establishes criteria in determining the timing and pattern of recognition of a liability and a corresponding deferred outflow of resources for AROs and requires that recognition occur when the liability is both incurred and reasonably estimable. The requirements of this statement, as amended by GASB Statement No. 95, are effective for the County’s year ending June 30, 2020.
In January 2017, GASB issued Statement No. 84, Fiduciary Activities. This statement is to improve guidance regarding the identification of fiduciary activities for accounting and financial reporting purposes and how those activities should be reported. The requirements of this statement, as amended by GASB Statement No. 95, are effective for the County’s year ending June 30, 2021.
In June 2017, GASB issued Statement No. 87, Leases. This statement is to recognize in the financial statements certain lease assets and liabilities for leases that previously were classified as operating leases and recognized as inflows of resources or outflows of resources based on the payment provisions of the contract. The requirements of this statement, as amended by GASB Statement No. 95, are effective for the County’s year ending June 30, 2022.
In March 2018, GASB issued Statement No. 88, Certain Disclosures Related to Debt, including Direct Borrowings and Direct Placements. This statement is to improve the information that is disclosed in notes to government financial statements related to debt, including direct borrowings and direct placements. It also clarifies which liabilities governments should include when disclosing information related to debt. The requirements of this statement, as amended by GASB Statement No. 95, are effective for the County’s year ending June 30, 2020.

COUNTY OF TUOLUMNE, CALIFORNIA NOTES TO THE BASIC FINANCIAL STATEMENTS (Continued)
FOR THE YEAR ENDED JUNE 30, 2019
34
NOTE 1: SUMMARY OF SIGNIFICANT ACCOUNTING POLICIES (Continued)
In June 2018, GASB issued Statement No. 89, Accounting for Interest Cost Incurred before the End of a Construction Period. This statement is to enhance the relevance and comparability of information about capital assets and the cost of borrowing for a reporting period and to simplify accounting for interest cost incurred before the end of a construction period. The requirements of this statement, as amended by GASB Statement No. 95, are effective for the County’s year ending June 30, 2022.
In August 2018, GASB issued Statement No. 90, Majority Equity Interests–an amendment of GASB Statements No. 14 and No. 61. This statement is to improve the consistency and comparability of reporting a government’s majority equity interest in a legally separate organization and to improve the relevance of financial statement information for certain component units. The requirements of this statement, as amended by GASB Statement No. 95, are effective for the County’s year ending June 30, 2021.
In May 2019, GASB issued Statement No. 91, Conduit Debt Obligations. This statement is to provide a single method of reporting conduit debt obligations by issuers and eliminate diversity in practice associated with (1) commitments extended by issuers, (2) arrangements associated with conduit debt obligations, and (3) related note disclosures. The requirements of this statement, as amended by GASB Statement No. 95, are effective for the County’s year ending June 30, 2023.
In January 2020, GASB issued Statement No. 92, Omnibus 2020. This statement establishes accounting and financial reporting requirements for specific issues related to leases, intra-entity transfers of assets, postemployment benefits, government acquisitions, risk financing and insurance-related activities of public entity risk pools, fair value measurements, and derivative instruments. The requirements of this statement, as amended by GASB Statement No. 95, are effective for the County’s year ending June 30, 2022.
In March 2020, GASB issued Statement No. 93, Replacement of Interbank Offered Rates. This statement establishes accounting and financial reporting requirements related to the replacement of interbank offered rates in hedging derivative instruments and leases. It also identifies appropriate benchmark interest rates for hedging derivative instruments. The requirements of this statement, as amended by GASB Statement No. 95, are effective for the County’s year ending June 30, 2022.
In March 2020, GASB issued Statement No. 94, Public-Private and Public-Public Partnerships and Availability Payment Arrangements. This statement establishes standards of accounting and financial reporting for public-private and public-public partnership arrangements and availability payment arrangements for governments. The requirements of this statement are effective for the County’s year ending June 30, 2023.
In May 2020, GASB issued Statement No. 96, Subscription-Based Information Technology Arrangements. This statement establishes standards of accounting and financial reporting for subscription-based information technology arrangements (SBITAs) by a government end user. The requirements of this statement are effective for the County’s year ending June 30, 2023.

COUNTY OF TUOLUMNE, CALIFORNIA NOTES TO THE BASIC FINANCIAL STATEMENTS (Continued)
FOR THE YEAR ENDED JUNE 30, 2019
35
NOTE 2: CASH AND INVESTMENTS The County follows the practice of pooling cash and investments of all funds except for funds required to be held by outside fiscal agents under the provisions of bond indentures. Cash and investments are comprised of the following shown on the financial statements:
Government-wide:Cash and investments 43,424,700$ Restricted cash and investments 10,392,438
Fiduciary funds:Investment Trust Fund 73,517,204 Agency Funds 5,241,464
Total cash and investments 132,575,806$
The County’s total cash and investments are detailed as follows:
Deposits 2,782,558$ Investments 129,784,371 Cash on hand 8,877
Total cash and investments 132,575,806$
Authorized Investments
Under provisions of the County's investment policy or bond indentures, and in accordance with Section 53601 of the California Government Code, the County is authorized to invest in obligations of the U.S. Treasury, U.S. government agencies and instrumentalities, the California Local Agency Investment Fund (LAIF), California Asset Management Program (CAMP), prime commercial paper as rated by Standard & Poor’s Corporation or Moody’s Commercial Paper Record, medium-term corporate notes, bankers’ acceptances, money market mutual funds, repurchase agreements, negotiable certificates of deposit, supranational obligations, obligations of the State of California, and obligations of local agencies within California. The County’s policy is more restrictive than the California Government Code in that it does not permit investments in reverse repurchase agreements. The County is a voluntary participant in LAIF. LAIF is part of the California Pooled Money Investment Account (PMIA), which at June 30, 2019 had a balance of $105.7 billion. Of that amount, 1.77% was invested in structured notes and asset-backed securities. PMIA is not SEC-registered, but is required to invest according to the California Government Code. The average maturity of PMIA investments was 173 days as of June 30, 2019. The Local Investment Advisory Board (LIAB) has oversight responsibility for LAIF. The LIAB consists of five members as designated by state statute. The value of the pool shares in LAIF, which may be withdrawn, is determined on an amortized cost basis, which is different than the fair value of the County’s portion in the pool. The County is a voluntary participant in CAMP, a California Joint Powers Authority that falls under California Government Code Section 53601(p), which is directed by a Board of Trustees that is made up of experienced local government finance directors and treasurers. At June 30, 2019, CAMP had a balance of $5.4 billion with an average maturity of 54 days. The value of the pool shares in CAMP, which may be withdrawn, is determined on an amortized cost basis, which is the same as the fair value of the County’s portion in the pool.

COUNTY OF TUOLUMNE, CALIFORNIA NOTES TO THE BASIC FINANCIAL STATEMENTS (Continued)
FOR THE YEAR ENDED JUNE 30, 2019
36
NOTE 2: CASH AND INVESTMENTS (Continued) Concentration of Credit Risk
Investments in any one issuer (other than U.S. Treasury Securities, money market mutual funds or external investment pools) that exceed 5% of the total investments of the County are Federal Farm Credit Bank (11.5%), Federal National Mortgage Association (8.5%), Federal Home Loan Mortgage Corporation (6.9%), and Federal Home Loan Bank (6.2%). Custodial Credit Risk
Custodial credit risk for deposits is the risk that, in the event of the failure of a depository financial institution, a government will not be able to recover its deposits or will not be able to recover collateral securities that are in the possession of an outside party. The custodial credit risk for investments is the risk that, in the event of the failure of the counterparty to a transaction, a government will not be able to recover the value of its investment or collateral securities that are in the possession of another party. The California Government Code and the County’s investment policy do not contain legal or policy requirements that would limit the exposure to custodial credit risk for deposits or investments, except that the California Government Code requires that a financial institution secure deposits made by state or local governmental units by pledging securities in an undivided collateral pool held by a depository regulated under state law. The market value of the pledged securities in the collateral pool must equal at least 110% of the total amount deposited by the public agencies. Also, a financial institution may, in accordance with the California Government Code, secure local agency deposits using first trust deed mortgages; however, the fair value of the first trust deed mortgages collateral must be at least 150% of the total amount deposited. At June 30, 2019, the carrying amount of deposits was $2,782,558 and the bank balance was $10,452,161. Of the bank balance, $932,732 was covered by federal deposit insurance and $9,519,429 was collateralized (i.e., collateralized with securities held by the pledging financial institutions at 110% of the County's cash deposits, in accordance with the State of California Government Code). Interest Rate and Credit Risk
Interest rate risk is the risk that changes in market interest rates will adversely affect the fair value of an investment. Generally, the longer the maturity of an investment, the greater the sensitivity its fair value is to changes in market interest rates. As a means of limiting its exposure to fair value losses arising from rising interest rates, the County mitigates interest rate risk by structuring the portfolio based on historical and current cash flow analysis eliminating the need to sell securities prior to maturity, and avoiding the purchase of long-term securities for the sole purpose of short-term speculation. Generally, credit risk is the risk that an issuer of an investment will not fulfill its obligation to the holder of the investment. This is measured by the assignment of a rating by a nationally recognized statistical rating organization. The County mitigates its exposure to credit risk by purchasing investment grade securities with the minimum ratings required by the California Government Code and by diversifying the investment portfolio so that the failure of any one issuer would not unduly harm the County’s capital base and cash flow. Pursuant to Government Code Sections 27131 through 27132, the Board of Supervisors adopted an investment policy. The investment policy has the following objectives: legality of investment, safety of principal, liquidity, and yield. In addition, the investment policy establishes cash management and investment guidelines for the Treasurer’s responsibility for the stewardship of public funds. All collateral on investments is to be either held by the Treasurer or in the County’s name by a third party trust department. The Treasurer annually presents a report at a public board meeting on the current year’s activity.
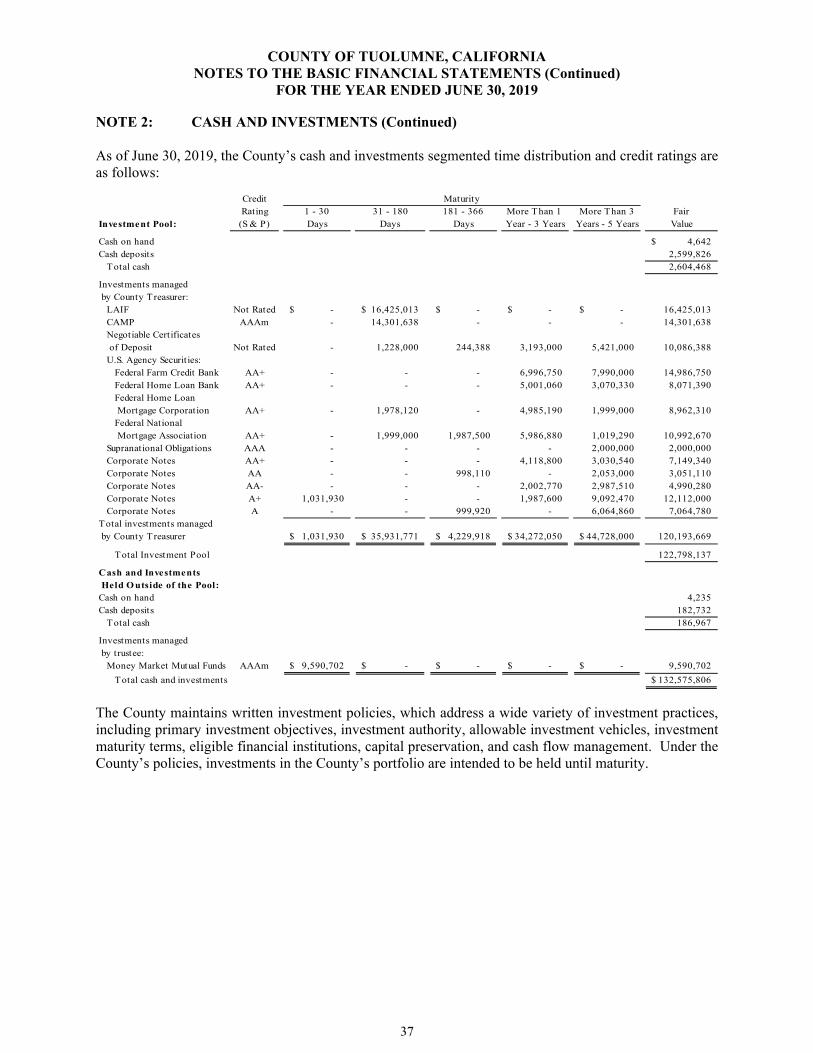
COUNTY OF TUOLUMNE, CALIFORNIA NOTES TO THE BASIC FINANCIAL STATEMENTS (Continued)
FOR THE YEAR ENDED JUNE 30, 2019
37
NOTE 2: CASH AND INVESTMENTS (Continued) As of June 30, 2019, the County’s cash and investments segmented time distribution and credit ratings are as follows:
CreditRating 1 - 30 31 - 180 181 - 366 More Than 1 More Than 3 Fair
Investment Pool: (S & P) Days Days Days Year - 3 Years Years - 5 Years Value
Cash on hand 4,642$ Cash deposits 2,599,826
Total cash 2,604,468
Investments managed by County Treasurer:
LAIF Not Rated -$ 16,425,013$ -$ -$ -$ 16,425,013 CAMP AAAm - 14,301,638 - - - 14,301,638 Negotiable Certificates of Deposit Not Rated - 1,228,000 244,388 3,193,000 5,421,000 10,086,388 U.S. Agency Securit ies:
Federal Farm Credit Bank AA+ - - - 6,996,750 7,990,000 14,986,750 Federal Home Loan Bank AA+ - - - 5,001,060 3,070,330 8,071,390 Federal Home Loan Mortgage Corporation AA+ - 1,978,120 - 4,985,190 1,999,000 8,962,310 Federal National Mortgage Association AA+ - 1,999,000 1,987,500 5,986,880 1,019,290 10,992,670
Supranational Obligations AAA - - - - 2,000,000 2,000,000 Corporate Notes AA+ - - - 4,118,800 3,030,540 7,149,340 Corporate Notes AA - - 998,110 - 2,053,000 3,051,110 Corporate Notes AA- - - - 2,002,770 2,987,510 4,990,280 Corporate Notes A+ 1,031,930 - - 1,987,600 9,092,470 12,112,000 Corporate Notes A - - 999,920 - 6,064,860 7,064,780
Total investments managed by County Treasurer 1,031,930$ 35,931,771$ 4,229,918$ 34,272,050$ 44,728,000$ 120,193,669
Total Investment Pool 122,798,137
Cash and Investments Held O utside of the Pool:Cash on hand 4,235 Cash deposits 182,732
Total cash 186,967
Investments managed by trustee:
Money Market Mutual Funds AAAm 9,590,702$ -$ -$ -$ -$ 9,590,702
Total cash and investments 132,575,806$
Maturity
The County maintains written investment policies, which address a wide variety of investment practices, including primary investment objectives, investment authority, allowable investment vehicles, investment maturity terms, eligible financial institutions, capital preservation, and cash flow management. Under the County’s policies, investments in the County’s portfolio are intended to be held until maturity.

COUNTY OF TUOLUMNE, CALIFORNIA NOTES TO THE BASIC FINANCIAL STATEMENTS (Continued)
FOR THE YEAR ENDED JUNE 30, 2019
38
NOTE 2: CASH AND INVESTMENTS (Continued) Fair Value Measurements
The County categorizes its fair value measurements within the fair value hierarchy established by generally accepted accounting principles (GASB Statement No. 72). The hierarchy is based on the valuation inputs used to measure the fair value of the asset. Level 1 inputs are quoted prices in active markets for identical assets; Level 2 inputs are significant other observable inputs; and Level 3 inputs are significant unobservable inputs. Union Bank is the custodian of the County’s investments. Union Bank utilizes pricing services that deliver current fair values and security information, which is input into their trust accounting systems. A security will be valued on the basis of valuations provided by a pricing service vendor if it has a substantial public market (i.e., is not thinly traded), is freely tradable without restriction, has a valid CUSIP or SEDOL, and resides on one of the depositories. Based on their direction, Union Bank will continue to obtain valuations for all other securities and assets for which they do not receive a pricing feed and/or descriptive information from their pricing service vendors from various sources independent of Union Bank. The County has the following recurring fair value measurements as of June 30, 2019:
Investments Total Level 2
Negotiable Certificates of Deposit 10,086,388$ 10,086,388$ U.S. Agency Securities 43,013,120 43,013,120 Supranational Obligations 2,000,000 2,000,000 Corporate Notes 34,367,510 34,367,510
Total investments subject to fair value hierarchy 89,467,018 89,467,018$
Investments not subject to fair value hierarchyLAIF 16,425,013 CAMP 14,301,638
Total investments 120,193,669$
Fair Value Measurements
Using
The valuation of 2a-7 money market mutual funds held by the County is at one-dollar net asset value (NAV) per share. The total value of these at June 30, 2019 was $9,590,702, with zero unfunded commitments. The redemption frequency is daily and redemption notice period of intra-daily. This type of investment primarily invests in short-term U.S. Treasury and government securities (including repurchase agreements collateralized by U.S. Treasury and government agency securities).

COUNTY OF TUOLUMNE, CALIFORNIA NOTES TO THE BASIC FINANCIAL STATEMENTS (Continued)
FOR THE YEAR ENDED JUNE 30, 2019
39
NOTE 2: CASH AND INVESTMENTS (Continued) Investment Pool
The Pool values participants’ shares on an amortized cost basis. The Pool distributes income to participants quarterly based on their relative participation during the quarter, which is calculated based on (1) realized investment gains and losses computed on an amortized cost basis, (2) interest income based on stated rates (both paid and accrued), (3) amortization of discounts and premiums on a straight-line basis, and (4) investment and administrative expenses. This method differs from the fair value method used to value investments in these financial statements because the amortized cost method is not designed to distribute to participants all unrealized gains and losses in the fair value of the Pool’s investments. Investment income related to investments reported in certain funds is assigned to other funds based upon legal or contractual provisions. Certain agencies outside the County reporting entity participate in the Pool. The participation of these agencies is both voluntary and involuntary and is reported as part of the Investment Trust Fund. The involuntary participation in the Pool totals $65,448,387 as of June 30, 2019. A summary of the investments held by the Treasurer’s Pool is as follows:
Interest MaturityInvestments Fair Value Principal Rate Range
LAIF 16,425,013$ 16,425,013$ 2.39% 8/23/19*CAMP 14,301,638 14,301,638 2.45% 12/20/19*Negotiable Certificates of Deposit 10,086,388 10,087,000 1.40-3.20% 9/17/19-5/30/24U.S. Agency Securities 43,013,120 43,000,000 1.25-3.25% 8/1/19-4/15/24Supranational Obligations 2,000,000 2,000,000 1.93% 4/27/22Corporate Notes 34,367,510 34,000,000 1.55-5.00% 7/8/19-3/15/24
Total investments 120,193,669$ 119,813,651$
* LAIF and CAMP are investment pools, and as such, their maturities are measured as a weighted average; LAIF being 173 days and CAMP being 54 days. The following are condensed statements of fiduciary net position and changes in fiduciary net position for the County’s external investment pool as of June 30, 2019:
Statement of Net Position:
Net position held for pool participants 122,821,785$
Equity of internal pool participants 49,280,933$ Equity of external pool participants 73,540,852
Total equity 122,821,785$
Statement of Changes in Net Position:
Net position at July 1, 2018 116,751,730$ Net change in investment by pool participants 6,070,055
Net position at June 30, 2019 122,821,785$

COUNTY OF TUOLUMNE, CALIFORNIA NOTES TO THE BASIC FINANCIAL STATEMENTS (Continued)
FOR THE YEAR ENDED JUNE 30, 2019
40
NOTE 3: CAPITAL ASSETS Capital assets activity for the year ended June 30, 2019 for the governmental activities and business-type activities are as follows:
Balance BalanceJuly 1, 2018 Increases Decreases June 30, 2019
Governmental activities:Capital assets, not being depreciated:
Land 6,641,474$ 110,000$ -$ 6,751,474$ Construction in progress 34,014,211 34,389,212 (5,226,339) 63,177,084
Total capital assets, not being depreciated 40,655,685 34,499,212 (5,226,339) 69,928,558
Capital assets, being depreciated:Structures and improvements 74,715,172 1,125,641 - 75,840,813 Equipment 41,321,627 1,954,256 (3,239,286) 40,036,597 Roads 365,135,250 3,438,106 - 368,573,356 Bridges 10,888,194 - - 10,888,194
Total capital assets, being depreciated 492,060,243 6,518,003 (3,239,286) 495,338,960
Less accumulated depreciation for:Structures and improvements (40,700,684) (2,139,102) - (42,839,786) Equipment (34,923,570) (1,451,588) 3,239,286 (33,135,872) Roads (344,431,492) (1,219,428) - (345,650,920) Bridges (4,962,947) (435,527) - (5,398,474)
Total accumulated depreciation (425,018,693) (5,245,645) 3,239,286 (427,025,052)
Total capital assets, being depreciated, net 67,041,550 1,272,358 - 68,313,908
Governmental activities, net 107,697,235$ 35,771,570$ (5,226,339)$ 138,242,466$
Business-type activities:Capital assets, not being depreciated:
Land 2,083,017$ -$ -$ 2,083,017$
Capital assets, being depreciated:Structures and improvements 17,541,891 545,167 - 18,087,058 Equipment 2,754,041 100,211 (338,418) 2,515,834
Total capital assets, being depreciated 20,295,932 645,378 (338,418) 20,602,892
Less accumulated depreciation for:Structures and improvements (11,146,801) (447,856) - (11,594,657) Equipment (2,007,607) (274,840) 338,418 (1,944,029)
Total accumulated depreciation (13,154,408) (722,696) 338,418 (13,538,686)
Total capital assets, being depreciated, net 7,141,524 (77,318) - 7,064,206
Business-type activities, net 9,224,541$ (77,318)$ -$ 9,147,223$
Capital assets with a net book value of zero (net of accumulated depreciation of $8,781) were transferred from governmental activities to business-type activities to during the year.

COUNTY OF TUOLUMNE, CALIFORNIA NOTES TO THE BASIC FINANCIAL STATEMENTS (Continued)
FOR THE YEAR ENDED JUNE 30, 2019
41
NOTE 3: CAPITAL ASSETS (Continued) Depreciation expense was charged to the governmental and business-type activities as follows:
Governmental activities:
General government 2,367,852$ Public protection 736,155 Public ways and facilities 1,916,001 Health and sanitation 106,637 Public assistance 49,694 Education 11,448 Recreation and cultural services 49,298 Capital assets held by the government's internal service funds are charged to the various functions based on their usage of the assets 8,560
Total depreciation expense - governmental activities 5,245,645$
Business-type activities:
Solid Waste 10,668$ Ambulance 459,587 Airport 243,660
Total depreciation expense - business-type activities 713,915$
NOTE 4: LONG-TERM DEBT A summary of changes in long-term debt for governmental and business-type activities is as follows:
Balance Balance Due WithinJuly 1, 2018 Additions Deletions June 30, 2019 One Year
Governmental activities:Accrued claims 9,001,000$ 3,555,176$ (3,236,176)$ 9,320,000$ 1,893,021$ Compensated absences 3,882,409 1,635,233 (1,461,228) 4,056,414 1,811,747 Bonds payable 33,865,000 4,900,000 (5,804,000) 32,961,000 1,108,000
Plus premium 512,465 18,217 (70,738) 459,944 16,390 Note payable 40,116 - (40,116) - -
Total governmental activities 47,300,990$ 10,108,626$ (10,612,258)$ 46,797,358$ 4,829,158$
Business-type activities:Compensated absences 54,686$ 23,298$ (31,657)$ 46,327$ 34,776$ Landfill closure and postclosure 3,033,697 90,427 (146,224) 2,977,900 150,460 Note payable 50,000 - (50,000) - -
Total business-type activities 3,138,383$ 113,725$ (227,881)$ 3,024,227$ 185,236$
Internal service funds predominantly serve the governmental funds. Accordingly, long-term debt for them, which includes accrued claims and compensated absences, are included as part of the above totals for governmental activities.

COUNTY OF TUOLUMNE, CALIFORNIA NOTES TO THE BASIC FINANCIAL STATEMENTS (Continued)
FOR THE YEAR ENDED JUNE 30, 2019
42
NOTE 4: LONG-TERM DEBT (Continued) Bonds Payable
On November 16, 2006, the County issued $6,195,000 Judgment Obligation Bonds pursuant to the terms of a stipulated judgment in the case entitled The People of the State of California ex rel. Attorney General Bill Lockyer and the California Regional Water Quality Control Board, Central Valley Region v. Sonora Mining Corp., et al. In July 2018, the County issued $4,900,000 in Judgment Obligation Bonds with interest rates ranging from 2.125% to 5%, which included a premium of $18,217. The net proceeds of $4,757,057 (after $161,160 in underwriting fees and other issuance costs) were deposited in an irrevocable trust with an escrow agent to currently refund the $4,705,000 outstanding balance on the 2006 Judgment Obligation Bonds with interest rates ranging from 3.5% to 4.5%, including accrued interest of $52,057. As a result, the 2006 Judgment Obligation Bonds are considered defeased and the liability for those bonds has been removed from the statement of net position. The County refunded the 2006 Judgment Obligation Bonds to reduce its total debt service payments over 19 years by $570,781 and to obtain an economic gain (difference between the present value of the debt service payments on the old and new debt) of $436,325. The County pays principal and interest semi-annually that began on November 1, 2018 and will end on November 1, 2036. The balance at June 30, 2019 is $4,675,000 and is presented in governmental activities. Annual principal and interest payments range from $331,894 to $341,025. On December 1, 2014, the County entered into an agreement with Umpqua Bank for the $8,205,000 Taxable Pension Obligation Refunding Bonds to pay off the CalPERS safety Tier 1 side fund. The County pays principal and interest quarterly that began on March 1, 2015 and will end on June 1, 2032. The interest rate is 4%. The balance at June 30, 2019 is $7,241,000 and is presented in governmental activities. Annual principal and interest payments range from $588,140 to $883,550. On March 1, 2018, the County entered into an agreement with the California Municipal Finance Authority for the $21,640,000 Lease Revenue Bonds to finance: (1) the County match for the New County Jail; (2) the extension of infrastructure throughout the Law and Justice Center campus; (3) the County match for the New Juvenile Detention Facility; and (4) the replacement of the County’s Enterprise Resource Planning system and upgrade of the County computer network. The County pays principal and interest semi-annually that began on June 1, 2018 and will end on December 1, 2047. The interest rate varies from 3% to 4%. The balance at June 30, 2019 is $21,045,000 and is presented in governmental activities. Annual principal and interest payments range from $1,013,650 to $1,367,000. The annual debt service requirements to maturity for the bonds are as follows:
Year EndingJune 30, Principal Interest
2020 1,108,000$ 1,182,565$ 2021 1,177,000 1,138,055 2022 1,247,000 1,087,635 2023 1,328,000 1,036,415 2024 1,403,000 984,270
2025-2029 7,864,000 4,063,046 2030-2034 6,684,000 2,645,721 2035-2039 4,335,000 1,748,227 2040-2044 4,030,000 1,053,672 2045-2048 3,785,000 280,665
Total 32,961,000$ 15,220,271$
Governmental activities

COUNTY OF TUOLUMNE, CALIFORNIA NOTES TO THE BASIC FINANCIAL STATEMENTS (Continued)
FOR THE YEAR ENDED JUNE 30, 2019
43
NOTE 5: INTERFUND TRANSACTIONS Advances to/from other funds
Advances to/from other funds represent long-term cash advances to support various agencies’ cash flow needs. The following schedule briefly summarizes the amounts of advances to/from other funds at June 30, 2019: Receivable Fund Payable Fund Amount
General Investment Trust 676,000$
Roads General 408,514
Internal Service Community Development Block Grants 323,329 County Capital 6,118,290 Road Construction 4,360,500 Other Governmental 584,800 Internal Service 831,877
12,218,796
13,303,310$
The County Board of Supervisors authorized an advance from the General Fund to the Investment Trust Fund to cover a cash deficit in the Resources Conservation District subaccount. The outstanding balance at June 30, 2019 totaled $676,000. The General Fund borrowed from the Roads Fund for the purchase of the land for the Law and Justice Center. The outstanding balance at June 30, 2019 totaled $408,514. The County Board of Supervisors authorized advances from the Workers’ Compensation Internal Service Fund to the Community Development Block Grants Fund to cover cash deficit due to timing of grant payments from the State. The outstanding balance at June 30, 2019 totaled $323,329. The County Board of Supervisors authorized advances from the Workers’ Compensation and Post Retirement Insurance internal service funds to County Capital Fund to cover cash deficits due to timing of grant payments. The outstanding balances at June 30, 2019 totaled $854,300 and $5,263,990, respectively. The County Board of Supervisors authorized advances to cover cash deficits in the Road Construction Fund, which borrowed from the Workers’ Compensation Internal Service Fund. The outstanding balance at June 30, 2019 totaled $4,360,500. The County Board of Supervisors authorized advances to cover cash deficits in the National Disaster Resilience other governmental funds, which borrowed from the Workers’ Compensation Internal Service Fund. The outstanding balance at June 30, 2019 totaled $584,800. The County Board of Supervisors authorized advances to cover cash deficits in the Employee Leave Liability Internal Service Fund, which borrowed from the Post Retirement Insurance Internal Service Fund. The outstanding balance at June 30, 2019 totaled $831,877.

COUNTY OF TUOLUMNE, CALIFORNIA NOTES TO THE BASIC FINANCIAL STATEMENTS (Continued)
FOR THE YEAR ENDED JUNE 30, 2019
44
NOTE 5: INTERFUND TRANSACTIONS (Continued) Transfers in/out
Transfers are indicative of funding for capital projects, re-allocations of special revenues and subsidies of various County operations. The following schedule briefly summarizes the County’s transfer activity for the year ended June 30, 2019: Transfer From Transfer To Amount
General Roads 942,066$ Health and Welfare 3,006,519 County Fire 520,306 County Capital 826,000 Road Construction 717,525 Other Governmental 240,211 Ambulance 56,808 Airport 14,429
6,323,864
Roads Road Construction 2,043,860
Health and Welfare Other Governmental 10,517
Other Governmental General 4,531 County Capital 168,928 Ambulance 339,300
512,759
Airport Other Governmental 100,441
Internal Service Roads 109,515
9,100,956$
The General Fund made contributions of $6,323,864 to other funds to offset operating costs of the programs. Of the amount transferred out, the County Capital Fund received $826,000 for roofing projects ($315,013) and repayment of advances from other funds ($400,000), the Health and Welfare Fund received 3,006,519 representing transfer of vehicle license fee revenue received from the State, the Road Construction Fund received $717,525 to cover the County’s share of 2017 and 2018 flood damage, and the Roads Fund received $942,066 to offset operational road treatment costs. The Road Construction Fund received $2,043,860 from the Roads Fund for major road projects.

COUNTY OF TUOLUMNE, CALIFORNIA NOTES TO THE BASIC FINANCIAL STATEMENTS (Continued)
FOR THE YEAR ENDED JUNE 30, 2019
45
NOTE 6: PENSION PLANS General Information about the Pension Plans Pension Plans Description, Benefits Provided, and Employees Covered – All of the County’s qualified employees are eligible to participate in the County’s Miscellaneous Pension Plan, an agent multiple-employer defined benefit pension plan, or the County’s Safety Pension Plan, a cost-sharing multiple-employer defined benefit pension plan. Both Pension Plans are administered by the California Public Employees’ Retirement System (CalPERS). Outside agencies associated with the County also participate in the County’s Miscellaneous Pension Plan, so the departments and funds of the County, along with these outside agencies, are in a cost-sharing arrangement in which all risks and costs are shared proportionately. A full description of the Pension Plans regarding number of employees covered, benefit provisions, assumptions (for funding, but not accounting purposes), and membership information are listed in the June 30, 2016 Annual Actuarial Valuation Reports (funding valuations). Details of the benefits provided can be obtained in Appendix B of the actuarial valuation reports. These reports and CalPERS’ audited financial statements are publicly available reports that can be obtained at CalPERS’ website at www.calpers.ca.gov under Forms and Publications. The California Legislature passed and the Governor signed the “Public Employees’ Pension Reform Act of 2013” (PEPRA) on September 12, 2012. PEPRA contained a number of provisions intended to reduce future pension obligations. PEPRA primarily affects new pension plan members who are enrolled for the first time after December 2012. Benefit provisions under the Plans and other requirements are established by state statute and County resolution. The benefits for the Pension Plans are based on members’ years of services, age, final compensation, and benefit formula. Benefits are provided for disability, death, and survivors of eligible members or beneficiaries. Members become fully vested in their retirement benefits earned to date after five years of credited service. The Pension Plans’ provisions and benefits in effect at June 30, 2019 are summarized as follows:
Miscellaneous Plan:
Prior to March 13, 2011 to On or AfterHire date March 13, 2011 December 31, 2012 January 1, 2013
Benefit formula 2% @ 55 2% @ 60 2% @ 62Benefit vesting schedule 5 years of service 5 years of service 5 years of serviceBenefit payments monthly for life monthly for life monthly for lifeRetirement age 50 to 67 50 to 67 52 to 67Monthly benefits, as a % of eligible compensation 1.426 to 2.418% 1.092 to 2.418% 1.000 to 2.500% Safety Plan:
Benefit formula 3% @ 50 2% @ 50 2.7% @ 57Benefit vesting schedule 5 years of service 5 years of service 5 years of serviceBenefit payments monthly for life monthly for life monthly for lifeRetirement age 50 to 55 50 to 55 50 to 57Monthly benefits, as a % of eligible compensation 3.000% 2.000 to 2.700% 2.000 to 2.700%

COUNTY OF TUOLUMNE, CALIFORNIA NOTES TO THE BASIC FINANCIAL STATEMENTS (Continued)
FOR THE YEAR ENDED JUNE 30, 2019
46
NOTE 6: PENSION PLANS (Continued) Contributions – Section 20814(c) of the California Public Employees’ Retirement Law (PERL) requires that the employer contribution rates for all public employers are determined on an annual basis by the actuary and shall be effective on the July 1 following notice of a change in the rate. The total plan contributions are determined through CalPERS’ annual actuarial valuation process. The Miscellaneous Plan’s actuarially determined rate is the estimated amount necessary to finance the costs of benefits earned by employees during the year, with an additional amount to finance any unfunded accrued liability. The Safety Plan’s actuarially determined rate is based on the estimated amount necessary to pay the Safety Plan’s allocated share of the risk pool’s costs of benefits earned by employees during the year, and any unfunded accrued liability. The County is required to contribute the difference between the actuarially determined rate and the contribution rate of employees. Employer contribution rates may change if plan contracts are amended. Payments made by the employer to satisfy contribution requirements that are identified by the pension plan terms as plan member contribution requirements are classified as plan member contributions. For the measurement period ended June 30, 2018 (the measurement date), the active employee contribution rates were 7.000%, 6.250%, 9.000%, 9.000%, and 11.500% of member earnings, and the employer contribution rates were 20.846%, 20.846%, 19.723%, 14.971%, and 11.990% of member earnings for the Miscellaneous First and Second Tier Plans, the Miscellaneous PEPRA Plan, the Safety First Tier Plan, the Safety Second Tier Plan, and the Safety PEPRA Plan, respectively. Employer contribution rates may change if plan contracts are amended. It is the responsibility of the County to make necessary accounting adjustments to reflect the impact due to any employer-paid member contributions or situations where members are paying a portion of the employer contribution. Payments made by the employer to satisfy contribution requirements that are identified by the pension plan terms as plan member contribution requirements are classified as plan member contributions. For the year ended June 30, 2019, the County contributed $6,725,923 and $2,815,267 for the Miscellaneous and Safety Plans, respectively. Pension Liabilities, Pension Expense, and Deferred Outflows of Resources and Deferred Inflows of Resources Related to Pensions As of June 30, 2019, the County reported a liability of $85,142,907 and $22,691,861 for its proportionate shares of the Miscellaneous and Safety Plans’ net pension liabilities, respectively. The net pension liabilities were measured as of June 30, 2018, using an annual actuarial valuation as of June 30, 2017 rolled forward to June 30, 2018 using standard update procedures. The County’s proportion of the Miscellaneous Plan’s net pension liability was based on its fiscal year 2017-18 total contributions to the Miscellaneous Plan relative to all fiscal year 2017-18 contributions to the Miscellaneous Plan. The County’s proportions of the Miscellaneous Plan’s net pension liability as of June 30, 2018 and 2017 were 92.37612% and 91.51202%, respectively, for an increase of 0.86410%. The County’s Safety Plan’s net pension liability is the difference between its proportion of the total pension liability based on its share of the actuarial accrued liability and its proportion of the fiduciary net position based on its share of the fair value of assets. The County’s proportions of the Safety Plan’s net pension liability as of June 30, 2018 and 2017 were 0.23548% and 0.22583%, respectively, for an increase of 0.00965%.

COUNTY OF TUOLUMNE, CALIFORNIA NOTES TO THE BASIC FINANCIAL STATEMENTS (Continued)
FOR THE YEAR ENDED JUNE 30, 2019
47
NOTE 6: PENSION PLANS (Continued) For the year ended June 30, 2019, the County recognized pension expense of $16,130,388 and $2,662,000 for the Miscellaneous and Safety Plans, respectively. At June 30, 2019, the County reported deferred outflows of resources and deferred inflows of resources related to pension from the following sources:
Deferred Outflows Deferred Inflowsof Resources of Resources
Miscellaneous Plan:Contributions subsequent to the measurement date 6,725,923$ -$ Differences between expected and actual experience 1,851,258 (20,251) Change in assumptions 636,308 (626,592) Net differences between projected and actual earnings on plan investments 621,652 - Change in employer's proportion 458,223 (83,258) Difference between the employer's contributions and the employer's proportionate share of contributions 670,666 -
Total Miscellaneous Pension Plan 10,964,030 (730,101)
Safety Plan:Contributions subsequent to the measurement date 2,815,267 - Differences between expected and actual experience 576,813 (2,188) Change in assumptions 2,633,985 (355,372) Net differences between projected and actual earnings on plan investments 181,755 - Change in employer's proportion 679,567 (276,168) Difference between the employer's contributions and the employer's proportionate share of contributions - (674,359)
Total Safety Pension Plan 6,887,387 (1,308,087)
Total 17,851,417$ (2,038,188)$
The $6,725,923 and $2,815,267 reported as deferred outflows of resources related to pension contributions subsequent to the measurement date for the Miscellaneous and Safety Plans, respectively, will be recognized as a reduction of the net pension liability during the year ending June 30, 2020. The remainder reported as deferred outflows and inflows of resources related to pension will be recognized as pension expense as follows:
Year EndingJune 30, Miscellaneous Plan Safety Plan
2020 4,892,464$ 2,228,755$ 2021 925,738 1,378,941 2022 (1,821,033) (657,719) 2023 (489,163) (185,944)
Total 3,508,006$ 2,764,033$
Deferred Outflows / (Inflows) of Resources

COUNTY OF TUOLUMNE, CALIFORNIA NOTES TO THE BASIC FINANCIAL STATEMENTS (Continued)
FOR THE YEAR ENDED JUNE 30, 2019
48
NOTE 6: PENSION PLANS (Continued) Actuarial Assumptions – The June 30, 2017 valuation was rolled forward to determine the June 30, 2018 total pension liability, based on the following actuarial method and assumptions:
Actuarial Cost Method Entry-Age NormalActuarial Assumptions:
Discount Rate 7.15%Inflation 2.50%Salary Increases Varies by Entry Age and ServiceInvestment Rate of Return 7.15% Net of Pension Plan Investment Expenses, includes Inflation
Mortality Rate Table (1)
Derived using CalPERS' Membership Data for all FundsPost Retirement Benefit Increase Contract COLA up to 2.0% until Purchasing Power Protection
Allowance Floor on Purchasing Power applies, 2.50% thereafter
(1) The mortality table used was developed based on CalPERS' specific data. The table includes 15 years of mortality improvements
using Society of Actuaries Scale 90% of scale MP 2016. For more details on this table, please refer to the 2017 experience study report (based on CalPERS demographic data from 1997 to 2015) that can be found on the CalPERS website.
Discount Rate – The discount rate used to measure the total pension liability was 7.15 percent. The projection of cash flows used to determine the discount rate assumed that contributions from plan members will be made at the current member contribution rates and that contributions from employers will be made at statutorily required rates, actuarially determined. Based on those assumptions, the Pension Plans’ fiduciary net position was projected to be available to make all projected future benefit payments of current plan members. Therefore, the long-term expected rate of return on plan investments was applied to all periods of projected benefit payments to determine the total pension liability. The long-term expected rate of return on pension plan investments was determined using a building-block method in which expected future real rates of return (expected returns, net of pension plan investment expense and inflation) are developed for each major asset class. In determining the long-term expected rate of return, CalPERS staff took into account both short-term and long-term market return expectations as well as the expected pension fund cash flows. Using historical returns of all the funds’ asset classes, expected compound (geometric) returns were calculated over the short-term (first 10 years) and the long-term (11+ years) using a building-block approach. Using the expected nominal returns for both short-term and long-term, the present value of benefits was calculated for each fund. The expected rate of return was set by calculating the rounded single equivalent expected return that arrived at the same present value of benefits for cash flows as the one calculated using both short-term and long-term returns. The expected rate of return was then set equal to the single equivalent rate calculated above and adjusted to account for assumed administrative expenses.

COUNTY OF TUOLUMNE, CALIFORNIA NOTES TO THE BASIC FINANCIAL STATEMENTS (Continued)
FOR THE YEAR ENDED JUNE 30, 2019
49
NOTE 6: PENSION PLANS (Continued) The expected real rates of return by asset class are as follows:
Asset Class (1)
Global equity 50.0 % 4.80 % 5.98 %Fixed income 28.0 1.00 2.62 Inflation assets - 0.77 1.81 Private equity 8.0 6.30 7.23 Real assets 13.0 3.75 4.93 Liquidity 1.0 - (0.92)
(1)
(2)An expected inflation of 2.00% used for this period.
(3)An expected inflation of 2.92% used for this period.
In CalPERS' CAFR, Fixed Income is included in Global Debt Securities; Liquidity is included in Short-term Investment; Inflation Assets are included in both Global Equity Securities and Global Debt Securities.
Assumed Asset
Allocation
Real Return
Years 1 - 10 (2)
Real Return
Years 11+ (3)
Sensitivity of the County’s Proportionate Share of the Net Pension Liability to Changes in the Discount Rate – The following presents the net pension liability of the Pension Plans as of the measurement date, calculated using the discount rate of 7.15 percent, as well as what the net pension liability would be if it were calculated using a discount rate that is 1 percentage-point lower (6.15 percent) or 1 percentage-point higher (8.15 percent) than the current rate:
Discount Rate Current Discount Discount Rate- 1% (6.15%) Rate (7.15%) + 1% (8.15%)
County's Proportionate Share of Pension Plans' Net Pension Liability:
Miscellaneous Plan 117,549,534$ 85,142,907$ 58,066,685$ Safety Plan 36,601,586 22,691,861 11,295,332
Total 154,151,120$ 107,834,768$ 69,362,017$
Pension Plan Fiduciary Net Position – Detailed information about the pension plan’s fiduciary net position is available in the separately issued CalPERS financial report that can be obtained at CalPERS’ website under Forms and Publications.

COUNTY OF TUOLUMNE, CALIFORNIA NOTES TO THE BASIC FINANCIAL STATEMENTS (Continued)
FOR THE YEAR ENDED JUNE 30, 2019
50
NOTE 7: OTHER POSTEMPLOYMENT BENEFITS PLAN Plan Description – The County participates in a Retiree Healthcare Plan, a multiple-employer defined benefit plan, which does not issue a publicly available report, with the Tuolumne County Transportation Council (Council), which is not a component unit of the County. The County provides medical coverage for its employees through the CalPERS healthcare program (PEMHCA). The OPEB Plan is not administered in a trust or equivalent arrangement that meets the criteria in paragraph 4 of GASB Statement No. 75. For financial reporting purposes, the County reports a proportionate share of the collective total OPEB liability, OPEB expense, and deferred outflows and inflows of resources. Accordingly, the disclosures and required supplementary information have been reported for the County as a cost-sharing participant. Benefits Provided – The County allows retirees to continue participating in the OPEB Plan after retirement. The following summarizes the County’s retiree OPEB Plan benefits:
PEMHCA Minimum: Retirees participating in PEMHCA receive the PEMHCA minimum required employer contribution towards the retiree monthly premium.
Implied Subsidy: An implied subsidy generally exists when retiree premiums are based on blended active and retiree experience. Since PEMHCA is a community rated plan, an implied subsidy is required.
Contributions – The County currently contributes based on a pay-as-you-go funding method, that is, benefits are payable when due. For fiscal year 2018-19, the County contributed $942,505 in benefit payments. Employees are not required to contribute to the OPEB Plan. Employees Covered by Benefit Terms – At June 30, 2019, the following number of participants were covered by the benefit terms:
Inactives currently receiving benefits 187 Inactives entitled to but not yet receiving benefits 498 Active employees 609
Total 1,294
Total OPEB Liability – At June 30, 2019, the County reported a liability of $30,655,029 for its proportionate share of the OPEB Plan total OPEB liability in accordance with the parameters of GASB Statement No. 75. The total OPEB liability was measured as of June 30, 2018 as determined by an actuarial valuation as of June 30, 2017. The County’s proportion of the total OPEB liability was based on its 2017-18 number of employees relative to all 2017-18 number of County and Council employees. The County’s proportionate share based on its number of employees as of June 30, 2018 and 2017 were 99.51618% and 99.50926%, respectively, for an increase of 0.00692%.
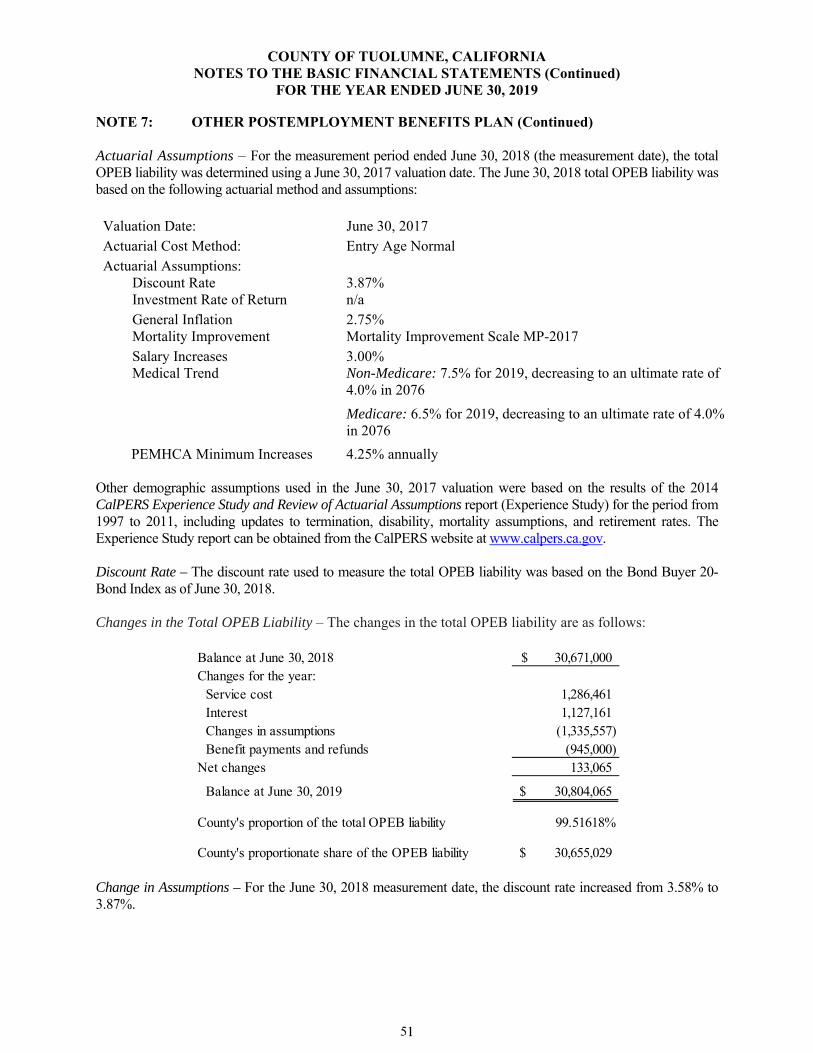
COUNTY OF TUOLUMNE, CALIFORNIA NOTES TO THE BASIC FINANCIAL STATEMENTS (Continued)
FOR THE YEAR ENDED JUNE 30, 2019
51
NOTE 7: OTHER POSTEMPLOYMENT BENEFITS PLAN (Continued) Actuarial Assumptions – For the measurement period ended June 30, 2018 (the measurement date), the total OPEB liability was determined using a June 30, 2017 valuation date. The June 30, 2018 total OPEB liability was based on the following actuarial method and assumptions: Valuation Date: June 30, 2017 Actuarial Cost Method: Entry Age Normal Actuarial Assumptions:
Discount Rate 3.87% Investment Rate of Return n/a General Inflation 2.75% Mortality Improvement Mortality Improvement Scale MP-2017 Salary Increases 3.00% Medical Trend Non-Medicare: 7.5% for 2019, decreasing to an ultimate rate of
4.0% in 2076
Medicare: 6.5% for 2019, decreasing to an ultimate rate of 4.0% in 2076
PEMHCA Minimum Increases 4.25% annually Other demographic assumptions used in the June 30, 2017 valuation were based on the results of the 2014 CalPERS Experience Study and Review of Actuarial Assumptions report (Experience Study) for the period from 1997 to 2011, including updates to termination, disability, mortality assumptions, and retirement rates. The Experience Study report can be obtained from the CalPERS website at www.calpers.ca.gov. Discount Rate – The discount rate used to measure the total OPEB liability was based on the Bond Buyer 20-Bond Index as of June 30, 2018. Changes in the Total OPEB Liability – The changes in the total OPEB liability are as follows:
Balance at June 30, 2018 30,671,000$ Changes for the year:
Service cost 1,286,461 Interest 1,127,161 Changes in assumptions (1,335,557) Benefit payments and refunds (945,000)
Net changes 133,065
Balance at June 30, 2019 30,804,065$
County's proportion of the total OPEB liability 99.51618%
County's proportionate share of the OPEB liability 30,655,029$ Change in Assumptions – For the June 30, 2018 measurement date, the discount rate increased from 3.58% to 3.87%.

COUNTY OF TUOLUMNE, CALIFORNIA NOTES TO THE BASIC FINANCIAL STATEMENTS (Continued)
FOR THE YEAR ENDED JUNE 30, 2019
52
NOTE 7: OTHER POSTEMPLOYMENT BENEFITS PLAN (Continued) Sensitivity of the County's Proportionate Share of the Total OPEB Liability to Changes in the Discount Rate – The following presents the County's proportionate share of the total OPEB liability, as well as what the County’s proportionate share of the total OPEB liability would be if it were calculated using a discount rate that is 1 percentage-point lower or 1 percentage-point higher than the current discount rate:
Discount Rate Current Discount Discount Rate-1% (2.87%) Rate (3.87%) +1% (4.87%)
County's Proportionate Share of OPEB Plan's Total OPEB Liability 35,624,845$ 30,655,029$ 26,655,903$
Sensitivity of the County's Proportionate Share of the Total OPEB Liability to Changes in Healthcare Costs Trend Rates – The following presents the County's proportionate share of the total OPEB liability, as well as what the County's proportionate share of the total OPEB liability would be if it were calculated using a healthcare cost trend rate that is 1 percentage-point lower or 1 percentage-point higher than the current healthcare cost trend rates:
Healthcare Current HealthcareCost Trend Healthcare Cost Cost TrendRate -1% Trend Rate Rate +1%
County's Proportionate Share of OPEB Plan's Total OPEB Liability 26,081,282$ 30,655,029$ 36,454,938$
OPEB Expense and Deferred Outflows/Inflows of Resources Related to OPEB – For fiscal year 2018-19, the County recognized OPEB expense of $1,819,590. At June 30, 2019, the County reported deferred outflows of resources and deferred inflows of resources related to OPEB from the following sources:
Deferred DeferredOutflows of Inflows ofResources Resources
Changes in assumptions -$ (3,928,463)$ County's contributions subsequent to the measurement date 942,505 -
Total 942,505$ (3,928,463)$

COUNTY OF TUOLUMNE, CALIFORNIA NOTES TO THE BASIC FINANCIAL STATEMENTS (Continued)
FOR THE YEAR ENDED JUNE 30, 2019
53
NOTE 7: OTHER POSTEMPLOYMENT BENEFITS PLAN (Continued) The $942,505 reported as deferred outflows of resources related to contributions subsequent to the measurement date will be recognized as a reduction of the total OPEB liability during fiscal year 2019-20. Other amounts reported as deferred inflows of resources related to OPEB will be recognized as OPEB expense as follows:
Year EndingJune 30
2020 (586,145)$ 2021 (586,145) 2022 (586,145) 2023 (586,145) 2024 (586,145)
Thereafter (997,738)
Total (3,928,463)$
NOTE 8: RISK MANAGEMENT The County is exposed to various risks of loss related to torts; theft of, damage to, and destruction of assets; errors and omissions; injuries to and illnesses of employees; and natural disasters. The County maintains the Workers’ Compensation and Liability Insurance internal service funds to account for and finance its risks of loss. Under this program, the County is self-insured for the following risks up to the maximum claim as follows: workers’ compensation $300,000, liability $10,000, property varies depending on the type (most vehicles: $10,000; watercraft: $1,000), and medical malpractice $10,000. The County purchases commercial insurance for claims in excess of the preceding coverage amounts. All operating funds participate in the program and make payments to the internal service funds based on historical cost of the amounts needed to pay prior and current year claims, and to allow accrual of estimated incurred but not reported claims including loss adjustment expenses. Insurance premiums to commercial insurers are also processed through the internal service funds. There have been no settlements in excess of insurance coverage in the past three years. The total determined claims liability at June 30, 2019 is $9,320,000. These claim estimates are based on the requirements of GASB Statement No. 10, and include estimated claims incurred but not yet reported as of June 30, 2019. Changes in the internal service funds claims liabilities during the years ended June 30, 2018 and 2019 were as follows:
Current Year Current Fiscal Balance Claims and Changes Year Claim Balance Year at July 1 in Estimates Payments at June 30
2017-18 $ 8,748,000 $ 3,644,084 $ (3,391,084) $ 9,001,000
2018-19 9,001,000 3,555,176 (3,236,176) 9,320,000
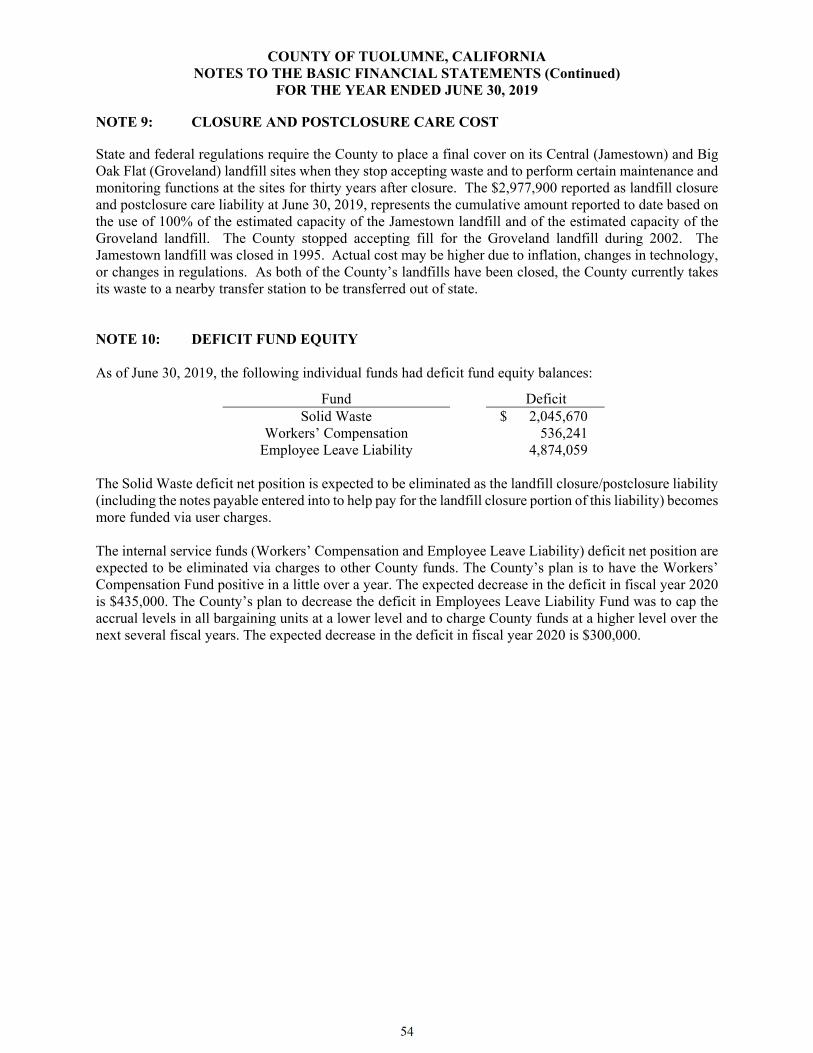
COUNTY OF TUOLUMNE, CALIFORNIA NOTES TO THE BASIC FINANCIAL STATEMENTS (Continued)
FOR THE YEAR ENDED JUNE 30, 2019
54
NOTE 9: CLOSURE AND POSTCLOSURE CARE COST State and federal regulations require the County to place a final cover on its Central (Jamestown) and Big Oak Flat (Groveland) landfill sites when they stop accepting waste and to perform certain maintenance and monitoring functions at the sites for thirty years after closure. The $2,977,900 reported as landfill closure and postclosure care liability at June 30, 2019, represents the cumulative amount reported to date based on the use of 100% of the estimated capacity of the Jamestown landfill and of the estimated capacity of the Groveland landfill. The County stopped accepting fill for the Groveland landfill during 2002. The Jamestown landfill was closed in 1995. Actual cost may be higher due to inflation, changes in technology, or changes in regulations. As both of the County’s landfills have been closed, the County currently takes its waste to a nearby transfer station to be transferred out of state. NOTE 10: DEFICIT FUND EQUITY As of June 30, 2019, the following individual funds had deficit fund equity balances:
Fund Deficit Solid Waste $ 2,045,670
Workers’ Compensation 536,241 Employee Leave Liability 4,874,059
The Solid Waste deficit net position is expected to be eliminated as the landfill closure/postclosure liability (including the notes payable entered into to help pay for the landfill closure portion of this liability) becomes more funded via user charges. The internal service funds (Workers’ Compensation and Employee Leave Liability) deficit net position are expected to be eliminated via charges to other County funds. The County’s plan is to have the Workers’ Compensation Fund positive in a little over a year. The expected decrease in the deficit in fiscal year 2020 is $435,000. The County’s plan to decrease the deficit in Employees Leave Liability Fund was to cap the accrual levels in all bargaining units at a lower level and to charge County funds at a higher level over the next several fiscal years. The expected decrease in the deficit in fiscal year 2020 is $300,000.

COUNTY OF TUOLUMNE, CALIFORNIA NOTES TO THE BASIC FINANCIAL STATEMENTS (Continued)
FOR THE YEAR ENDED JUNE 30, 2019
55
NOTE 11: COMMITMENTS AND CONTINGENCIES Commitments
At June 30, 2019, the significant construction commitments included $15,649,935 for the County Jail at the Law and Justice Center. In addition, the County’s encumbrances as of June 30, 2019 were as follows:
Fund Encumbrances General $ 476,886 Roads 4,195
County Fire 403 County Capital 132,055
Solid Waste 9,250 Ambulance 238,778
Contingencies
Grants and subventions
The County receives a number of federal and State grants either directly from federal or State governmental agencies or as subgrantee of federal grants passed through the State. Several of these grants are passed through to subgrantees of the County, who are required to comply with the same terms and conditions. All of these grants are subject to audit, whether under the federal Single Audit or by the State. The amount of disallowed costs by grantor agencies, if any, as a result of audits cannot be determined at this time. The County believes that any such disallowances would not have a material effect of the financial statements. Continued funding of these grants is dependent upon the budgeting process of the federal, state, and county governments. Litigation
The County from time to time is a party to various claims, legal actions, and complaints arising in the ordinary course of business. In the opinion of the County’s administration, the various claims, legal actions and complaints resulting from such litigation not covered by insurance would not materially affect the financial position of the County. NOTE 12: JOINT VENTURES Central Sierra Child Support Agency
On September 7, 2010, the County of Tuolumne approved joining the Central Sierra Child Support Agency (CSCSA) effective January 1, 2011. CSCSA acts as the local child support agency for Amador, Alpine, Tuolumne and Calaveras counties. CSCSA operates under a Joint Powers Agreement with applicable standards and regulations set forth by the State of California. CSCSA has an independent governing board including members from the Board of Supervisors of Amador, Alpine, Calaveras and Tuolumne counties. The County does not have an equity interest in CSCSA. The County would be mandated to assume responsibility for child support services in the event of the dissolution of the Central Sierra Child Support Agency. Audited financial statements for CSCSA can be obtained at the Agency’s offices: 639 New York Ranch Road, Jackson, California 95642, 75A Diamond Valley Road, Markleeville, California 96120, and 975 Morning Star Drive, Sonora, California 95370.

COUNTY OF TUOLUMNE, CALIFORNIA NOTES TO THE BASIC FINANCIAL STATEMENTS (Continued)
FOR THE YEAR ENDED JUNE 30, 2019
56
NOTE 12: JOINT VENTURES (Continued) Tuolumne County Economic Development Authority
On September 15, 2008, the County of Tuolumne and the City of Sonora created the Tuolumne County Economic Development Authority (TCEDA). The TCEDA is a public entity separate and apart from the County and City. TCEDA is governed by a board of seven members. Two (2) appointed from each the County Board of Supervisors and the City Council of Sonora and three (3) at-large member appointed by the City and County members of the governing board. The TCEDA has the power to administer, carryout and implement economic development for Tuolumne County. The County does not have an equity interest in TCEDA. The County contributed $344,292 to TCEDA during the year ended June 30, 2019. On February 5, 2019, both the County and the City voted to withdraw from the TCEDA and plan to dissolve the TCEDA by June 30, 2020. Per the JPA agreement, the County and the City are liable for any unfunded liabilities after the dissolution of the TCEDA. The TCEDA was last audited for the year ended June 30, 2018. Those audited financial statements can be obtained at the Tuolumne County Auditor’s Office: 2 South Green Street, Sonora, California 95370. NOTE 13: SUBSEQUENT EVENT Coronavirus
Subsequent to year end, the World Health Organization declared the spread of the novel Coronavirus (COVID-19) a worldwide pandemic. The COVID-19 pandemic is having significant effects on global markets, supply chains, businesses, and communities. Specific to the County, COVID-19 may impact various areas of operations and financial results, including, but not limited to, costs for emergency preparedness and shortages of personnel. Management believes the County is taking appropriate actions to mitigate the negative impact, however, the full impact of COVID-19 is unknown and cannot be reasonably estimated as these events are still developing. From the time of the California governor issuing the stay-in-place order, all County libraries, youth centers, and recreation services have been closed. Many County departments were not open to the public during phase 1. Some are slowly opening in phase 2. In the State’s May revised budget, the County has been allocated $5,576,000 for Coronavirus Relief. These funds are to be used for COVID-19 expenses incurred during the event.
Required Supplementary Information


Fiscal Year
Measurement Period
County's Proportion of
the Net Pension Liability
County's Proportionate
Share of the Net Pension Liability
County's Covered Payroll
County's Proportionate
Share of the Net Pension Liability as a Percentage
of Their Covered Payroll
Plan Fiduciary Net Position as a Percentage of
the Total Pension Liability
Miscellaneous Plan:2019 2018 92.37612% 85,142,907$ 27,449,050$ 310.19% 68.33%2018 2017 91.51202% 81,237,123 27,135,295 299.38% 68.24%2017 2016 91.37628% 71,795,420 25,938,751 276.79% 69.38%2016 2015 90.59927% 54,936,469 22,822,833 240.71% 75.24%2015 2014 91.53140% 47,229,938 23,217,545 203.42% 78.39%
Safety Plan:2019 2018 0.23548% 22,691,861$ 10,231,142$ 221.79% 75.26%2018 2017 0.22583% 22,395,910 9,450,502 236.98% 73.31%2017 2016 0.22056% 19,084,961 8,722,242 218.81% 74.06%2016 2015 0.20701% 14,208,731 7,382,620 192.46% 78.40%2015 2014 0.33072% 20,578,819 7,563,748 272.07% 80.43%
Notes to Schedule:
* - GASB 68 was implemented in 2015 (2014 measurement period). Therefore, only five years of information ispresented.
Benefit changes: The figures above do not include any liability impact that may have resulted from plan changeswhich occurrred after the June 30, 2016 valuation date. This applies for voluntary benefit changes as well as anyoffers of Two Years Additional Service Credit (a.k.a. Golden Handshakes).
Changes in assumptions: In 2018, there were no changes. In 2017, the accounting discount rate reduced from 7.65percent to 7.15 percent. In 2016, there were no changes. In 2015, amounts reported reflect an adjustment of thediscount rate from 7.5 percent (net of administrative expense) to 7.65 percent (without a reduction for pension planadministrative expense). In 2014, amounts reported were based on the 7.5 percent discount rate.
COUNTY OF TUOLUMNE, CALIFORNIAREQUIRED SUPPLEMENTARY INFORMATION - UNAUDITED
SCHEDULE OF THE COUNTY'S PROPORTIONATE SHAREOF THE NET PENSION LIABILITY
LAST TEN YEARS*
57

Measurement Period
Contractually Required
Contribution
Contributions in Relation to the Contractually
Required Contribution
Contribution Deficiency
County's Covered Payroll
Contributions as a Percentage
of Covered Payroll
Miscellaneous Plan:2019 6,725,923$ 6,725,923$ -$ 28,133,697$ 23.907%2018 5,722,029 5,722,029 - 27,449,050 20.846%2017 5,384,728 5,384,728 - 27,135,295 19.844%2016 4,686,873 4,686,873 - 25,938,751 18.069%2015 4,245,021 4,245,021 - 22,822,833 18.600%2014 3,290,039 3,290,039 - 23,217,545 14.170%
Safety Plan:2019 2,815,267$ 2,815,267$ -$ 9,981,106$ 28.206%2018 2,565,135 2,565,135 - 10,231,142 25.072%2017 2,286,925 2,286,925 - 9,450,502 24.199%2016 2,008,228 2,008,228 - 8,722,242 23.024%2015 2,307,975 2,307,975 - 7,382,620 31.262%2014 1,486,370 1,486,370 - 7,563,748 19.651%
* - GASB 68 was implemented in 2015 (2014 measurement period). Therefore, only six years ofinformation is presented.
COUNTY OF TUOLUMNE, CALIFORNIAREQUIRED SUPPLEMENTARY INFORMATION - UNAUDITEDSCHEDULE OF THE COUNTY'S PENSION CONTRIBUTIONS
LAST TEN YEARS*
58

Fiscal Year
Measurement Period
County's Proportion of the
Total Other Postemployment Benefits Liability
County's Proportionate
Share of the Total Other
Postemployment Benefits Liability
County's Covered-Employee
Payroll
County's Proportionate
Share of the Total Other
Postemployment Benefits Liability as a Percentage of
Their Covered-Employee Payroll
2019 2018 99.51618% 30,655,029$ 35,302,534$ 86.84%2018 2017 99.50926% 30,520,486 37,896,113 80.54%
* - GASB 75 was implemented in 2018 (2017 measurement period). Therefore, only two years ofinformation is presented.
COUNTY OF TUOLUMNE, CALIFORNIAREQUIRED SUPPLEMENTARY INFORMATION - UNAUDITED
SCHEDULE OF THE COUNTY'S PROPORTIONATE SHAREOF THE TOTAL OTHER POSTEMPLOYMENT BENEFITS LIABILITY
LAST TEN YEARS*
59

Variance withFinal Budget
Actual PositiveOriginal Final Amounts (Negative)
Revenues:Taxes 30,753,125$ 31,148,435$ 31,584,519$ 436,084$ Licenses and permits 2,502,293 2,493,840 2,526,736 32,896 Fines, forfeits, and penalties 1,574,146 1,564,146 1,493,774 (70,372) Investment earnings, rents, and concessions 390,842 381,742 370,460 (11,282) Intergovernmental:
State 24,897,580 24,952,849 21,791,673 (3,161,176) Federal 4,054,204 4,838,011 5,069,230 231,219 Other 691,477 671,477 676,192 4,715
Charges for services 9,858,235 9,748,510 9,649,138 (99,372) Miscellaneous 259,584 325,391 321,053 (4,338)
Total revenues 74,981,486 76,124,401 73,482,775 (2,641,626)
Expenditures:General government:
Board of supervisors 690,333 729,657 714,526 15,131 Appropriation for contingencies 750,165 643,719 - 643,719 County administrative office 1,453,776 1,448,468 1,446,939 1,529 County auditor-controller 1,604,941 1,586,121 1,560,651 25,470 Treasurer-tax collector 591,681 582,438 526,565 55,873 Assessor-recorder 1,560,227 1,546,807 1,544,928 1,879 Recorder-modernization 131,685 131,685 97,075 34,610 Archives 172,077 169,660 163,292 6,368 Office of revenue recovery 665,392 697,819 701,872 (4,053) County counsel 1,229,088 1,296,247 1,248,393 47,854 Human resources 610,561 617,766 618,278 (512) County clerk - elections 672,352 675,052 652,250 22,802 Facilities management 3,419,839 3,423,663 3,161,983 261,680 General services department - 142,543 139,863 2,680 Economic development and promotion 1,584,792 1,641,417 1,595,349 46,068 Economic development department - 1,183 1,182 1 Information technology 4,560,920 4,726,959 3,890,588 836,371 Outside agency partners 448,412 446,755 454,631 (7,876) Radio/communications 110,604 117,334 108,972 8,362 Debt service 2,699,415 2,865,905 2,448,167 417,738 Total general government 22,956,260 23,491,198 21,075,504 2,415,694
Public protection:CAO emergency services 158,119 244,694 253,846 (9,152) CAO homeland security 166,951 166,951 16,262 150,689 OES - tree mortality hazard 3,298,291 3,517,980 3,564,193 (46,213) Master Stewardship Grant 2,500,000 2,500,000 528,620 1,971,380 Transfer to outside fire districts 8,439 8,439 8,439 - Donnell fire 58,000 - - - Hazardous fuel reduction grant 550,000 550,000 12,669 537,331 Grand jury 35,526 37,571 32,710 4,861 District attorney 2,242,015 2,242,988 2,132,345 110,643 Victim witness prosecution program 312,746 407,433 329,016 78,417 District attorney victim advocacy/outreach 208,788 226,791 211,985 14,806 KC child advocacy 155,480 148,237 145,392 2,845 Public defender 967,878 954,688 943,462 11,226 PD Conflict division - 312 311 1 County - court related AB 233 1,017,944 1,009,944 987,479 22,465 Sheriff - coroner 11,502,313 11,615,959 11,485,144 130,815 Sheriff - courtroom security 1,001,355 1,119,526 981,811 137,715 Sheriff - communications 1,490,228 1,590,492 1,591,398 (906) Tuolumne narcotics team 662,137 472,190 442,214 29,976 County jail 6,340,599 6,677,758 6,421,038 256,720
(Continued)
COUNTY OF TUOLUMNE, CALIFORNIA
SCHEDULE OF REVENUES, EXPENDITURES, AND CHANGES IN FUND BALANCE
FOR THE YEAR ENDED JUNE 30, 2019BUDGET AND ACTUAL - GENERAL FUND
Budgeted Amounts
REQUIRED SUPPLEMENTARY INFORMATION - UNAUDITED
The accompanying note is an integral part of the required supplementary information.60
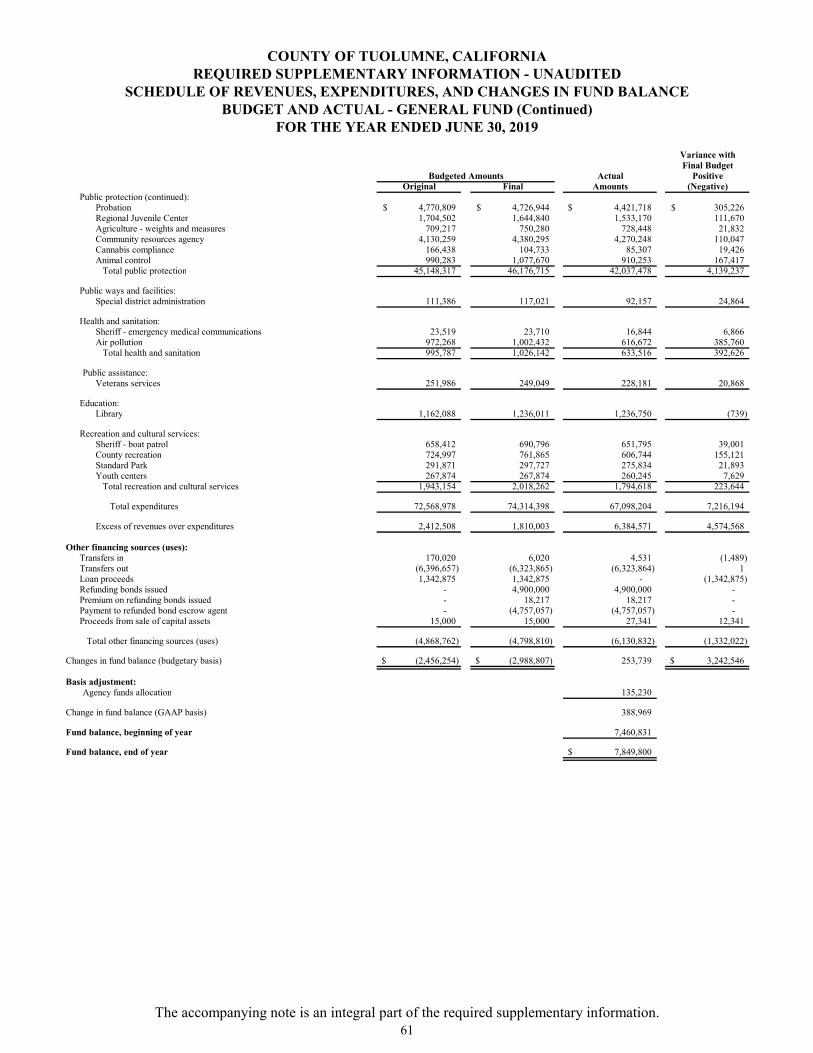
Variance withFinal Budget
Actual PositiveOriginal Final Amounts (Negative)
Public protection (continued):Probation 4,770,809$ 4,726,944$ 4,421,718$ 305,226$ Regional Juvenile Center 1,704,502 1,644,840 1,533,170 111,670 Agriculture - weights and measures 709,217 750,280 728,448 21,832 Community resources agency 4,130,259 4,380,295 4,270,248 110,047 Cannabis compliance 166,438 104,733 85,307 19,426 Animal control 990,283 1,077,670 910,253 167,417 Total public protection 45,148,317 46,176,715 42,037,478 4,139,237
Public ways and facilities:Special district administration 111,386 117,021 92,157 24,864
Health and sanitation:Sheriff - emergency medical communications 23,519 23,710 16,844 6,866 Air pollution 972,268 1,002,432 616,672 385,760 Total health and sanitation 995,787 1,026,142 633,516 392,626
Public assistance:Veterans services 251,986 249,049 228,181 20,868
Education:Library 1,162,088 1,236,011 1,236,750 (739)
Recreation and cultural services:Sheriff - boat patrol 658,412 690,796 651,795 39,001 County recreation 724,997 761,865 606,744 155,121 Standard Park 291,871 297,727 275,834 21,893 Youth centers 267,874 267,874 260,245 7,629 Total recreation and cultural services 1,943,154 2,018,262 1,794,618 223,644
Total expenditures 72,568,978 74,314,398 67,098,204 7,216,194
Excess of revenues over expenditures 2,412,508 1,810,003 6,384,571 4,574,568
Other financing sources (uses):Transfers in 170,020 6,020 4,531 (1,489) Transfers out (6,396,657) (6,323,865) (6,323,864) 1 Loan proceeds 1,342,875 1,342,875 - (1,342,875) Refunding bonds issued - 4,900,000 4,900,000 - Premium on refunding bonds issued - 18,217 18,217 - Payment to refunded bond escrow agent - (4,757,057) (4,757,057) - Proceeds from sale of capital assets 15,000 15,000 27,341 12,341
Total other financing sources (uses) (4,868,762) (4,798,810) (6,130,832) (1,332,022)
Changes in fund balance (budgetary basis) (2,456,254)$ (2,988,807)$ 253,739 3,242,546$
Basis adjustment:Agency funds allocation 135,230
Change in fund balance (GAAP basis) 388,969
Fund balance, beginning of year 7,460,831
Fund balance, end of year 7,849,800$
COUNTY OF TUOLUMNE, CALIFORNIA
Budgeted Amounts
SCHEDULE OF REVENUES, EXPENDITURES, AND CHANGES IN FUND BALANCE
FOR THE YEAR ENDED JUNE 30, 2019BUDGET AND ACTUAL - GENERAL FUND (Continued)
REQUIRED SUPPLEMENTARY INFORMATION - UNAUDITED
The accompanying note is an integral part of the required supplementary information.61

Variance withFinal Budget
Actual PositiveOriginal Final Amounts (Negative)
Revenues:Licenses and permits 106,400$ 106,400$ 132,563$ 26,163$ Investment earnings, rents, and concessions - 487 5,293 4,806 Intergovernmental:
State 5,365,846 5,300,437 4,030,589 (1,269,848) Federal 1,158,322 758,322 720,740 (37,582) Other - 416,200 646,385 230,185
Charges for services 1,872,518 2,783,484 2,322,608 (460,876) Miscellaneous 1,000 1,025 22,624 21,599
Total revenues 8,504,086 9,366,355 7,880,802 (1,485,553)
Expenditures: Public ways and facilities: Fleet 924,990 925,160 880,459 44,701 Public works administration 2,654,524 2,606,868 2,353,397 253,471 SB1 2,372,480 3,139,109 1,495,665 1,643,444 Road maintenance 5,238,625 4,578,048 3,969,397 608,651
Total public ways and facilities 11,190,619 11,249,185 8,698,918 2,550,267
Deficiency of revenues under expenditures (2,686,533) (1,882,830) (818,116) 1,064,714
Other financing sources:Transfers in 942,066 1,051,581 1,051,581 - Proceeds from sale of capital assets - - 34,110 34,110
Total other financing sources 942,066 1,051,581 1,085,691 34,110
Changes in fund balance (budgetary basis) (1,744,467)$ (831,249)$ 267,575 1,098,824$
Basis adjustment:Agency funds allocation (2,043,860)
Change in fund balance (GAAP basis) (1,776,285)
Fund balance, beginning of year 10,105,745
Fund balance, end of year 8,329,460$
Budgeted Amounts
COUNTY OF TUOLUMNE, CALIFORNIA
SCHEDULE OF REVENUES, EXPENDITURES, AND CHANGES IN FUND BALANCE
FOR THE YEAR ENDED JUNE 30, 2019BUDGET AND ACTUAL - ROADS SPECIAL REVENUE FUND
REQUIRED SUPPLEMENTARY INFORMATION - UNAUDITED
The accompanying note is an integral part of the required supplementary information.62

Variance withFinal Budget
Actual PositiveOriginal Final Amounts (Negative)
Revenues:Fines, forfeits, and penalties 13,000$ 13,000$ 12,421$ (579)$ Investment earnings, rents, and concessions 1,000 1,000 1,355 355 Intergovernmental:
State 22,951,930 22,018,201 21,745,640 (272,561) Federal 12,109,022 11,741,597 11,047,732 (693,865) Other 25,000 25,000 25,000 -
Charges for services 1,028,051 1,050,551 1,023,923 (26,628) Miscellaneous 216,750 247,963 188,661 (59,302)
Total revenues 36,344,753 35,097,312 34,044,732 (1,052,580)
Expenditures: Health and sanitation: Health 5,617,541 5,600,257 4,171,906 1,428,351 Tobacco control program 407,740 456,740 377,924 78,816 Women, infants, and children 672,610 618,775 637,390 (18,615) Behavioral health 13,424,950 12,273,010 9,867,872 2,405,138 California children services 323,000 310,000 239,726 70,274
Total health and sanitation 20,445,841 19,258,782 15,294,818 3,963,964
Public assistance: Social services administration 17,102,274 17,320,994 13,961,627 3,359,367 Welfare and security 8,869,730 8,938,409 7,476,595 1,461,814
Total public assistance 25,972,004 26,259,403 21,438,222 4,821,181
Total expenditures 46,417,845 45,518,185 36,733,040 8,785,145
Deficiency of revenues under expenditures (10,073,092) (10,420,873) (2,688,308) 7,732,565
Other financing sources (uses):Transfers in 2,944,108 3,003,139 3,006,519 3,380 Transfers out (206,450) (270,364) (10,517) 259,847
Total other financing sources (uses) 2,737,658 2,732,775 2,996,002 263,227
Changes in fund balance (budgetary basis) (7,335,434)$ (7,688,098)$ 307,694 7,995,792$
Basis adjustment:Agency funds allocation (528,428)
Change in fund balance (GAAP basis) (220,734)
Fund balance, beginning of year 9,413,543
Fund balance, end of year 9,192,809$
Budgeted Amounts
COUNTY OF TUOLUMNE, CALIFORNIA
SCHEDULE OF REVENUES, EXPENDITURES, AND CHANGES IN FUND BALANCE
FOR THE YEAR ENDED JUNE 30, 2019BUDGET AND ACTUAL - HEALTH AND WELFARE SPECIAL REVENUE FUND
REQUIRED SUPPLEMENTARY INFORMATION - UNAUDITED
The accompanying note is an integral part of the required supplementary information.63

This page intentionally left blank

COUNTY OF TUOLUMNE, CALIFORNIA NOTE TO THE REQUIRED SUPPLEMENTARY INFORMATION
FOR THE YEAR ENDED JUNE 30, 2019
65
Budgets and Budgetary Accounting The County operates under the general laws of the State of California and annually adopts a budget for its General Fund, special revenue funds, capital projects funds, and permanent fund with the exception of its Community Development Block Grants Special Revenue Fund. From the effective date of the budget, which is adopted and controlled at the department level, the amounts stated therein, as proposed expenditures become appropriations to the various County departments. The Board of Supervisors may amend the budget by resolution during the year. Department heads may, upon approval from the County Administrator and the Auditor-Controller, make transfers from one object or purpose to another within the same budget unit. Encumbrances outstanding at year-end are included in restricted and assigned fund balances for subsequent year expenditures, based on the authorized encumbered appropriation carried over. All appropriations lapse at year-end. Annual budgets are adopted on a basis of accounting, which differs from generally accepted accounting principles (GAAP) in the United States of America. As a result, if there’s a difference between the budgetary basis and GAAP basis, the budgetary comparison schedules present a reconciliation between the bases. The differences are as follows:
1. Agency funds allocation – The County does not budget for its agency funds. However, in accordance with GASB Statement No. 34, the County has allocated many of its agency funds’ activities to its governmental funds.
2. Loan proceeds – The County budgets for internal loan proceeds as an other financing source.
As expenditures are controlled at the department level, the budget and actual comparisons presented in these financial statements are not segregated by type (i.e., current, capital outlay, and debt service) as the statements of revenues, expenditures, and changes in fund balances are presented.

This page intentionally left blank

COMBINING AND INDIVIDUAL FUND STATEMENTS AND SCHEDULES

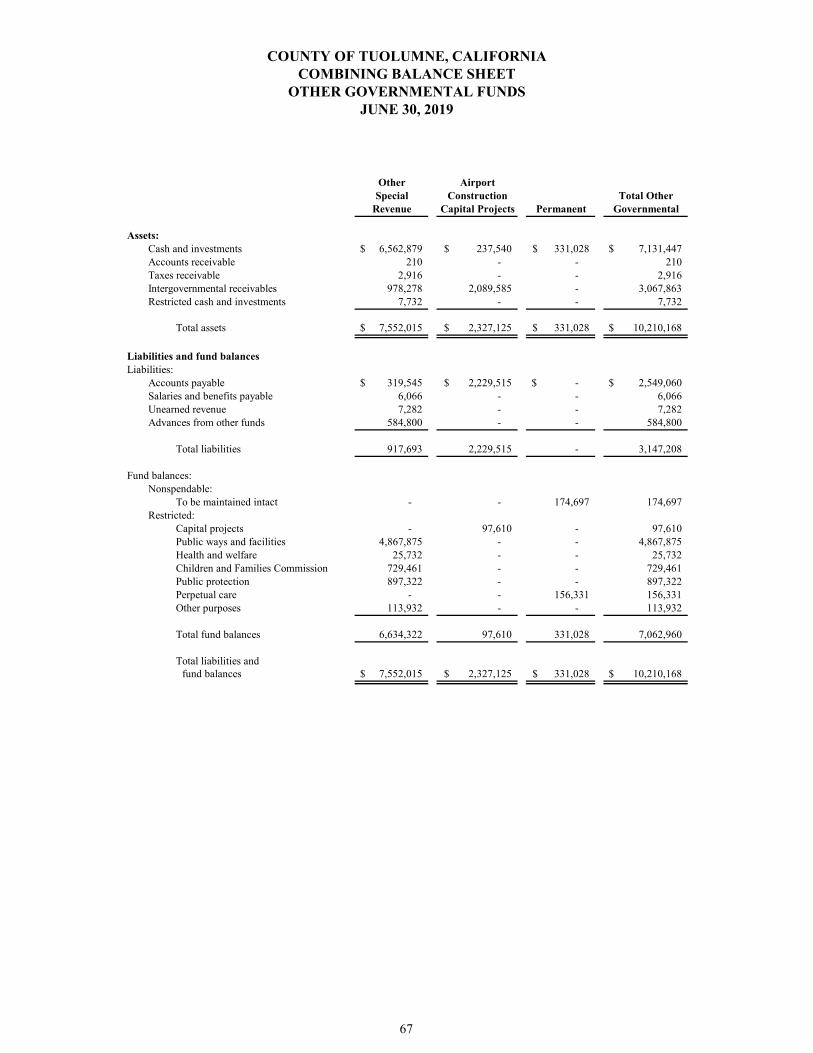
Other AirportSpecial Construction Total Other
Revenue Capital Projects Permanent Governmental
Assets:Cash and investments 6,562,879$ 237,540$ 331,028$ 7,131,447$ Accounts receivable 210 - - 210 Taxes receivable 2,916 - - 2,916 Intergovernmental receivables 978,278 2,089,585 - 3,067,863 Restricted cash and investments 7,732 - - 7,732
Total assets 7,552,015$ 2,327,125$ 331,028$ 10,210,168$
Liabilities and fund balancesLiabilities:
Accounts payable 319,545$ 2,229,515$ -$ 2,549,060$ Salaries and benefits payable 6,066 - - 6,066 Unearned revenue 7,282 - - 7,282 Advances from other funds 584,800 - - 584,800
Total liabilities 917,693 2,229,515 - 3,147,208
Fund balances:Nonspendable:
To be maintained intact - - 174,697 174,697 Restricted:
Capital projects - 97,610 - 97,610 Public ways and facilities 4,867,875 - - 4,867,875 Health and welfare 25,732 - - 25,732 Children and Families Commission 729,461 - - 729,461 Public protection 897,322 - - 897,322 Perpetual care - - 156,331 156,331 Other purposes 113,932 - - 113,932
Total fund balances 6,634,322 97,610 331,028 7,062,960
Total liabilities and fund balances 7,552,015$ 2,327,125$ 331,028$ 10,210,168$
COUNTY OF TUOLUMNE, CALIFORNIACOMBINING BALANCE SHEET
OTHER GOVERNMENTAL FUNDSJUNE 30, 2019
67

Other AirportSpecial Construction Total Other
Revenue Capital Projects Permanent GovernmentalRevenues:
Taxes 2,988,931$ -$ -$ 2,988,931$ Licenses and permits 21,963 - - 21,963 Fines, forfeits, and penalties 171,034 - - 171,034 Investment earnings, rents and concessions 217,950 - 6,590 224,540 Intergovernmental:
State 1,247,819 52,374 - 1,300,193 Federal 832,738 2,714,521 - 3,547,259 Other 136,945 - - 136,945
Charges for services 892,601 - 3,400 896,001 Miscellaneous 149,446 - 920 150,366
Total revenues 6,659,427 2,766,895 10,910 9,437,232
Expenditures:Current:
General government 20 - - 20 Public protection 5,477,898 - - 5,477,898 Public ways and facilities 461,713 - - 461,713 Health and sanitation 804,779 - - 804,779
Capital outlay 152,856 3,016,137 - 3,168,993 Debt service:
Principal 40,116 - - 40,116 Interest 3,024 - - 3,024
Total expenditures 6,940,406 3,016,137 - 9,956,543
Excess (deficiency) of revenues over (under) expenditures (280,979) (249,242) 10,910 (519,311)
Other financing sources (uses):Transfers in 530,823 340,652 - 871,475 Transfers out (512,759) - - (512,759)
Total other financing sources (uses) 18,064 340,652 - 358,716
Changes in fund balances (262,915) 91,410 10,910 (160,595)
Fund balances, beginning of year 6,897,237 6,200 320,118 7,223,555
Fund balances, end of year 6,634,322$ 97,610$ 331,028$ 7,062,960$
FOR THE YEAR ENDED JUNE 30, 2019
COUNTY OF TUOLUMNE, CALIFORNIACOMBINING STATEMENT OF REVENUES, EXPENDITURES,
OTHER GOVERNMENTAL FUNDSAND CHANGES IN FUND BALANCES
68

69
OTHER GOVERNMENTAL FUNDS
OTHER SPECIAL REVENUE FUNDS
Special revenue funds are used to account for the proceeds of specific revenue sources (other than capital projects) that are legally restricted to expenditures for specified purposes. Included in the Special Revenue classification are the following funds: Fish and Game – This fund is used to account for revenues and expenditures related to the protection, conservation, propagation and preservation of fish and wildlife in the County. National Disaster Resilience – This fund is used to account for revenues and expenditures to build two (2) resilient centers in the footprint of the Rim Fire of 2013. Criminal Justice Facility – This fund is used to account for the revenues and expenditures resulting from criminal justice activities such as fines and facility fees. Monument Preservation – This fund is used to account for the revenues and expenditures resulting from historical monument maintenance and preservation activity. Tuolumne County BH Housing – This fund is used to account for the revenues and expenditures related to activities of housing clients who are transitioning from a supervised facility to independent living. County Fire – This fund is used to account for revenues and expenditures related to fire protection services in the unincorporated areas of the County. The major revenue source of this fund is taxes. Cemetery Districts – This fund is used to account for the revenues and expenditures resulting from County cemetery maintenance and preservation. Children and Families Commission – This fund is used to account for activities of the Tuolumne County Children and Families Commission. County Service Areas – This fund is used to account for miscellaneous services throughout all unincorporated areas of the County. Lighting Districts – This fund is used to account for street and highway safety lighting for all unincorporated areas of the County.

National Criminal TuolumneFish and Disaster Justice Monument County BH County
Game Resilience Facility Preservation Housing Fire
Assets:Cash and investments 155,443$ 79$ -$ 113,722$ 18,830$ 341,226$ Accounts receivable - - - 210 - - Taxes receivable - - - - - 2,617 Intergovernmental receivables - 642,234 - - - 127,473 Restricted cash and investments - - - - 7,732 -
Total assets 155,443$ 642,313$ -$ 113,932$ 26,562$ 471,316$
Liabilities and fund balances:Liabilities:
Accounts payable 4,710$ 57,513$ -$ -$ 830$ 158,528$ Salaries and benefits payable - - - - - 4,845 Unearned revenue 7,282 - - - - - Advances from other funds - 584,800 - - - -
Total liabilities 11,992 642,313 - - 830 163,373
Fund balances:Restricted:
Public ways and facilities - - - - - - Health and welfare - - - - 25,732 - Children and Families Commission - - - - - - Public protection 143,451 - - - - 307,943 Other purposes - - - 113,932 - -
Total fund balances 143,451 - - 113,932 25,732 307,943
Total liabilities and fund balances 155,443$ 642,313$ -$ 113,932$ 26,562$ 471,316$
COUNTY OF TUOLUMNE, CALIFORNIACOMBINING BALANCE SHEET
OTHER SPECIAL REVENUE FUNDSJUNE 30, 2019
70

TotalChildren County Other
Cemetery and Families Service Lighting SpecialDistricts Commission Areas Districts Revenue
Assets:448,119$ 614,807$ 3,105,256$ 1,765,397$ 6,562,879$ Cash and investments
- - - - 210 Accounts receivable90 - 86 123 2,916 Taxes receivable
- 208,571 - - 978,278 Intergovernmental receivables- - - - 7,732 Restricted cash and investments
448,209$ 823,378$ 3,105,342$ 1,765,520$ 7,552,015$ Total assets
Liabilities and fund balances:Liabilities:
1,060$ 93,917$ -$ 2,987$ 319,545$ Accounts payable 1,221 - - - 6,066 Salaries and benefits payable
- - - - 7,282 Unearned revenue- - - - 584,800 Advances from other funds
2,281 93,917 - 2,987 917,693 Total liabilities
Fund balances:Restricted:
- - 3,105,342 1,762,533 4,867,875 Public ways and facilities- - - - 25,732 Health and welfare
Children and Families- 729,461 - - 729,461 Commission
445,928 - - - 897,322 Public protection- - - - 113,932 Other purposes
445,928 729,461 3,105,342 1,762,533 6,634,322 Total fund balances
Total liabilities and448,209$ 823,378$ 3,105,342$ 1,765,520$ 7,552,015$ fund balances
71

National Criminal TuolumneFish and Disaster Justice Monument County BH County
Game Resilience Facility Preservation Housing Fire
Revenues:Taxes -$ -$ -$ -$ -$ 2,679,178$ Licenses and permits - - - - - 21,963 Fines, forfeits, and penalties 2,607 - 168,427 - - - Investment earnings, rents and concessions 3,009 - 501 2,139 44,971 47,790 Intergovernmental:
State - - - - 25,309 606,584 Federal - 655,756 - - - 161,429 Other - - - - - 119,383
Charges for services - - - 15,120 - 132,934 Miscellaneous - 888 - - - 147,582
Total revenues 5,616 656,644 168,928 17,259 70,280 3,916,843
Expenditures:Current:
General government - - - 20 - - Public protection 4,746 597,903 - - - 4,735,993 Public ways and facilities - - - - - - Health and sanitation - - - - 77,797 -
Capital outlay - - - - - 152,856 Debt service:
Principal - - - - - - Interest - - - - - -
Total expenditures 4,746 597,903 - 20 77,797 4,888,849
Excess (deficiency) of revenues over (under) expenditures 870 58,741 168,928 17,239 (7,517) (972,006)
Other financing sources (uses):Transfers in - - - - 10,517 520,306 Transfers out (4,531) - (168,928) - - -
Total other financing sources (uses) (4,531) - (168,928) - 10,517 520,306
Changes in fund balances (3,661) 58,741 - 17,239 3,000 (451,700)
Fund balances (deficit), beginning of year 147,112 (58,741) - 96,693 22,732 759,643
Fund balances, end of year 143,451$ -$ -$ 113,932$ 25,732$ 307,943$
COUNTY OF TUOLUMNE, CALIFORNIACOMBINING STATEMENT OF REVENUES, EXPENDITURES, AND
CHANGES IN FUND BALANCESOTHER SPECIAL REVENUE FUNDS
FOR THE YEAR ENDED JUNE 30, 2019
72

TotalChildren County Other
Cemetery and Families Service Lighting SpecialDistricts Commission Areas Districts Revenue
Revenues:93,131$ -$ 87,323$ 129,299$ 2,988,931$ Taxes
- - - - 21,963 Licenses and permits- - - - 171,034 Fines, forfeits, and penalties
9,730 14,422 59,653 35,735 217,950 Investment earnings, rents and concessionsIntergovernmental:
1,234 612,329 969 1,394 1,247,819 State- 15,553 - - 832,738 Federal- 17,562 - - 136,945 Other
27,925 - 716,622 - 892,601 Charges for services976 - - - 149,446 Miscellaneous
132,996 659,866 864,567 166,428 6,659,427 Total revenues
Expenditures:Current:
- - - - 20 General government139,256 - - - 5,477,898 Public protection
- - 241,304 220,409 461,713 Public ways and facilities- 726,982 - - 804,779 Health and sanitation- - - - 152,856 Capital outlay
Debt service:40,116 - - - 40,116 Principal
3,024 - - - 3,024 Interest
182,396 726,982 241,304 220,409 6,940,406 Total expenditures
Excess (deficiency) of revenues (49,400) (67,116) 623,263 (53,981) (280,979) over (under) expenditures
Other financing sources (uses):- - - - 530,823 Transfers in- - (339,300) - (512,759) Transfers out
Total other financing- - (339,300) - 18,064 sources (uses)
(49,400) (67,116) 283,963 (53,981) (262,915) Changes in fund balances
495,328 796,577 2,821,379 1,816,514 6,897,237 Fund balances (deficit), beginning of year
445,928$ 729,461$ 3,105,342$ 1,762,533$ 6,634,322$ Fund balances, end of year
73

Variance withFinal Budget
Actual PositiveOriginal Final Amounts (Negative)
Revenues:Fines, forfeits, and penalties 2,300$ 2,300$ 2,607$ 307$ Investment earnings, rents, and concessions 2,000 2,000 3,009 1,009
Total revenues 4,300 4,300 5,616 1,316
Expenditures: Public protection: Fish and wildlife 25,050 25,109 4,746 20,363
Excess (deficiency) of revenues over (under) expenditures (20,750) (20,809) 870 21,679
Other financing uses:Transfers out (4,520) (4,532) (4,531) 1
Changes in fund balance (25,270)$ (25,341)$ (3,661) 21,680$
Fund balance, beginning of year 147,112
Fund balance, end of year 143,451$
Budgeted Amounts
COUNTY OF TUOLUMNE, CALIFORNIASCHEDULE OF REVENUES, EXPENDITURES, AND CHANGES IN FUND BALANCE
FOR THE YEAR ENDED JUNE 30, 2019BUDGET AND ACTUAL - FISH AND GAME SPECIAL REVENUE FUND
74

Variance withFinal Budget
Actual PositiveOriginal Final Amounts (Negative)
Revenues:Intergovernmental:
Federal 247,884$ 763,668$ 655,756$ (107,912)$ Miscellaneous - - 888 888
Total revenues 247,884 763,668 656,644 (107,024)
Expenditures: Public protection: Other protection 247,884 762,768 597,903 164,865
Changes in fund balance -$ 900$ 58,741 57,841$
Fund deficit, beginning of year (58,741)
Fund balance, end of year -$
COUNTY OF TUOLUMNE, CALIFORNIASCHEDULE OF REVENUES, EXPENDITURES, AND CHANGES IN FUND BALANCE
BUDGET AND ACTUAL - NATIONAL DISASTER RESILIENCY SPECIAL REVENUE FUNDFOR THE YEAR ENDED JUNE 30, 2019
Budgeted Amounts
75

Variance withFinal Budget
Actual PositiveOriginal Final Amounts (Negative)
Revenues:Fines, forfeits, and penalties 164,000$ 168,427$ 168,427$ -$ Investment earnings, rents, and concessions - 501 501 -
Excess of revenues over expenditures 164,000 168,928 168,928 -
Other financing uses:Transfers out (164,000) (168,928) (168,928) -
Changes in fund balance -$ -$ - -$
Fund balance, beginning of year -
Fund balance, end of year -$
Budgeted Amounts
COUNTY OF TUOLUMNE, CALIFORNIASCHEDULE OF REVENUES, EXPENDITURES, AND CHANGES IN FUND BALANCE
FOR THE YEAR ENDED JUNE 30, 2019BUDGET AND ACTUAL - CRIMINAL JUSTICE FACILITY SPECIAL REVENUE FUND
76

Variance withFinal Budget
Actual PositiveOriginal Final Amounts (Negative)
Revenues:Investment earnings, rents, and concessions -$ 1,000$ 2,139$ 1,139$ Charges for services 2,500 6,710 15,120 8,410
Total revenues 2,500 7,710 17,259 9,549
Expenditures: General government Monumentation 1,000 6,210 20 6,190
Excess of revenues over expenditures 1,500 1,500 17,239 15,739
Other financing uses:Transfers out (1,500) (1,500) - 1,500
Changes in fund balance -$ -$ 17,239 17,239$
Fund balance, beginning of year 96,693
Fund balance, end of year 113,932$
Budgeted Amounts
COUNTY OF TUOLUMNE, CALIFORNIASCHEDULE OF REVENUES, EXPENDITURES, AND CHANGES IN FUND BALANCE
FOR THE YEAR ENDED JUNE 30, 2019BUDGET AND ACTUAL - MONUMENT PRESERVATION SPECIAL REVENUE FUND
77

Variance withFinal Budget
Actual PositiveOriginal Final Amounts (Negative)
Revenues:Investment earnings, rents, and concessions 36,437$ 37,437$ 44,971$ 7,534$ Intergovernmental:
State 33,000 29,000 25,309 (3,691)
Total revenues 69,437 66,437 70,280 3,843
Expenditures: Health and sanitation:
Cabrini House 70,964 73,364 37,391 35,973 Tuolumne County BH housing 53,437 49,437 40,406 9,031
Total health and sanitation 124,401 122,801 77,797 45,004
Deficiency of revenues under expenditures (54,964) (56,364) (7,517) 48,847
Other financing sources:Transfers in 54,964 56,364 10,517 (45,847)
Changes in fund balance -$ -$ 3,000 3,000$
Fund balance, beginning of year 22,732
Fund balance, end of year 25,732$
COUNTY OF TUOLUMNE, CALIFORNIASCHEDULE OF REVENUES, EXPENDITURES, AND CHANGES IN FUND BALANCE
BUDGET AND ACTUAL - TUOLUMNE COUNTY BH HOUSING SPECIAL REVENUE FUNDFOR THE YEAR ENDED JUNE 30, 2019
Budgeted Amounts
78

Variance withFinal Budget
Actual PositiveOriginal Final Amounts (Negative)
Revenues:Taxes 2,629,250$ 2,629,250$ 2,679,178$ 49,928$ Licenses and permits 28,000 28,000 21,963 (6,037) Investment earnings, rents, and concessions 43,061 43,061 47,790 4,729 Intergovernmental:
State 637,797 637,797 606,584 (31,213) Federal 62,500 203,359 161,429 (41,930) Other 166,500 166,500 119,383 (47,117)
Charges for services 135,000 135,000 112,092 (22,908) Miscellaneous 148,150 148,150 147,582 (568)
Total revenues 3,850,258 3,991,117 3,896,001 (95,116)
Expenditures: PPublic protection: County Fire Department 4,968,011 5,262,421 4,888,849 373,572
Deficiency of revenues under expenditures (1,117,753) (1,271,304) (992,848) 278,456
Other financing sources:Transfers in 520,306 520,306 520,306 -
Changes in fund balance (budgetary basis) (597,447)$ (750,998)$ (472,542) 278,456$
Basis adjustment:Agency funds allocation 20,842
Change in fund balance (GAAP basis) (451,700)
Fund balance, beginning of year 759,643
Fund balance, end of year 307,943$
Budgeted Amounts
COUNTY OF TUOLUMNE, CALIFORNIASCHEDULE OF REVENUES, EXPENDITURES, AND CHANGES IN FUND BALANCE
FOR THE YEAR ENDED JUNE 30, 2019BUDGET AND ACTUAL - COUNTY FIRE SPECIAL REVENUE FUND
79

Variance withFinal Budget
Actual PositiveOriginal Final Amounts (Negative)
Revenues:Taxes 91,551$ 91,551$ 93,131$ 1,580$ Investment earnings, rents, and concessions 6,902 6,902 9,730 2,828 Intergovernmental:
State 1,186 1,186 1,234 48 Charges for services 34,900 34,900 27,925 (6,975) Miscellaneous 800 800 976 176
Total revenues 135,339 135,339 132,996 (2,343)
Expenditures: Public protection: Carter cemetery 323,786 323,786 151,451 172,335 Columbia cemetery 88,203 88,203 18,764 69,439 Jamestown cemetery 46,519 46,519 2,407 44,112 Oak Grove cemetery 16,860 16,860 7,954 8,906 Shaws Flat Springfield cemetery 155,299 155,299 1,820 153,479
Total public protection 630,667 630,667 182,396 448,271
Changes in fund balance (495,328)$ (495,328)$ (49,400) 445,928$
Fund balance, beginning of year 495,328
Fund balance, end of year 445,928$
Budgeted Amounts
COUNTY OF TUOLUMNE, CALIFORNIASCHEDULE OF REVENUES, EXPENDITURES, AND CHANGES IN FUND BALANCE
FOR THE YEAR ENDED JUNE 30, 2019BUDGET AND ACTUAL - CEMETERY DISTRICTS SPECIAL REVENUE FUND
80

Variance withFinal Budget
Actual PositiveOriginal Final Amounts (Negative)
Revenues:Investment earnings, rents, and concessions 7,660$ 8,500$ 14,422$ 5,922$ Intergovernmental:
State 626,000 630,012 612,329 (17,683) Federal - 15,553 15,553 - Other 10,000 12,195 17,562 5,367
Total revenues 643,660 666,260 659,866 (6,394)
Expenditures: Health and sanitation: Prop. 10 - general 707,894 762,851 726,982 35,869
Changes in fund balance (64,234)$ (96,591)$ (67,116) 29,475$
Fund balance, beginning of year 796,577
Fund balance, end of year 729,461$
Budgeted Amounts
COUNTY OF TUOLUMNE, CALIFORNIASCHEDULE OF REVENUES, EXPENDITURES, AND CHANGES IN FUND BALANCE
FOR THE YEAR ENDED JUNE 30, 2019
BUDGET AND ACTUAL - CHILDREN AND FAMILIESCOMMISSION SPECIAL REVENUE FUND
81

Variance withFinal Budget
Actual PositiveOriginal Final Amounts (Negative)
Revenues:Taxes 86,008$ 96,967$ 87,323$ (9,644)$ Investment earnings, rents, and concessions 23,594 13,662 59,653 45,991 Intergovernmental:
State 1,823 1,003 969 (34) Charges for services 716,419 716,419 716,622 203
Total revenues 827,844 828,051 864,567 36,516
Expenditures: Public ways and facilities:
CSA #2 Lake Don Pedro #2,3 115,803 115,803 151 115,652 CSA #3 Lake Don Pedro #1 271,948 271,948 59,088 212,860 CSA #4 Jupiter Subdivision 7,466 7,466 62 7,404 CSA #5 Emerald Ranch 78,197 78,197 296 77,901 CSA #8 Lake Don Pedro #4,5 5,332 5,332 54 5,278 CSA #10 Monte Grande Heights 118,379 118,379 14,207 104,172 CSA #13 Yosemite Highland 107,461 107,461 17,557 89,904 CSA #20 Cedar Ridge Road 230,106 230,106 10,219 219,887 CSA #26 Manzanita Drive 28,634 28,634 14,722 13,912 CSA #28 Rough & Ready Ridge 130,837 130,837 13,710 117,127 CSA #29 Comstock Ranch 210,303 210,303 8,606 201,697 CSA #31 Curtis Creek Ranch 9,422 9,422 8,531 891 CSA #32 Ridgewood Units 2,3 278,859 278,859 30,969 247,890 CSA #36 Columbia Vista Estates 7,418 7,418 50 7,368 CSA #37 Mi-Wuk Pines Estates 112,273 112,273 10,864 101,409 CSA #40 Sunnyhill Subdivision 1,870 1,870 50 1,820 CSA #42 Meadow Oak Park 5,283 5,318 85 5,233 CSA #43 Black Oak Estates 117,917 117,917 18,371 99,546 CSA #45 Buena Oaks Estates 3,368 3,368 50 3,318 CSA #46 MT. Ridge Estates 2,240 2,240 50 2,190 CSA #47 Cherry Valley Golf & Co 362,127 362,127 2,470 359,657 CSA #48 Sonora Vista Estate 208,541 208,541 6,779 201,762 CSA #49 Poppy Hill Subdivision 82,140 82,140 1,052 81,088 CSA #50 Yosemite Estates 2,898 2,898 50 2,848 CSA #51 Twain Harte Heights 69,520 69,520 8,963 60,557 CSA #52 Gina Lane 1,858 1,858 50 1,808 CSA #53 Whispering Woods 151,773 151,773 3,709 148,064 CSA #55 Vilas Lanes 1,635 1,635 50 1,585 CSA #56 Milla Villa Estates 116,419 116,419 3,830 112,589 CSA #58 Chaparral Heights 43,177 43,177 180 42,997 CSA #59 Mountain Vista 74,576 74,576 1,183 73,393 CSA #61 Granite Ridge 2,208 2,208 1,198 1,010
(Continued)
Budgeted Amounts
COUNTY OF TUOLUMNE, CALIFORNIASCHEDULE OF REVENUES, EXPENDITURES, AND CHANGES IN FUND BALANCE
FOR THE YEAR ENDED JUNE 30, 2019
BUDGET AND ACTUAL - COUNTY SERVICE AREASSPECIAL REVENUE FUND
82

Variance withFinal Budget
Actual PositiveOriginal Final Amounts (Negative)
Public ways and facilities (continued):CSA #62 Sierra Meadows 208,524$ 208,524$ 1,901$ 206,623$ CSA #64 Eagle Ridge 116,229 116,229 1,325 114,904 CSA #65 Deer Park 4,458 4,563 154 4,409 PRD-Apple Valley Unit 03 13,375 13,375 718 12,657 PRD4-Apple Valley Manor 7,349 7,349 - 7,349
Total public ways and facilities 3,309,923 3,310,063 241,304 3,068,759
Excess (deficiency) of revenues over (under) expenditures (2,482,079) (2,482,012) 623,263 3,105,275
Other financing sources:Transfers out (339,300) (339,300) (339,300) -
Changes in fund balance (2,821,379)$ (2,821,312)$ 283,963 3,105,275$
Fund balance, beginning of year 2,821,379
Fund balance, end of year 3,105,342$
Budgeted Amounts
COUNTY OF TUOLUMNE, CALIFORNIASCHEDULE OF REVENUES, EXPENDITURES, AND CHANGES IN FUND BALANCE
BUDGET AND ACTUAL - COUNTY SERVICE AREAS
FOR THE YEAR ENDED JUNE 30, 2019SPECIAL REVENUE FUND (Continued)
83

Variance withFinal Budget
Actual PositiveOriginal Final Amounts (Negative)
Revenues:Taxes 131,346$ 131,346$ 129,299$ (2,047)$ Investment earnings, rents, and concessions 24,774 24,774 35,735 10,961 Intergovernmental:
State 1,483 1,483 1,394 (89)
Total revenues 157,603 157,603 166,428 8,825
Expenditures: Public ways and facilities: Columbia Lighting District 560,492 560,492 8,711 551,781 Groveland Lighting District 409,285 409,285 2,439 406,846 Jamestown Lighting District 229,865 229,865 13,849 216,016 Rolling Hills Lighting District 78,046 78,046 1,731 76,315 South Sonora Lighting District 184,426 184,426 176,711 7,715 Tuolumne Lighting District 399,965 399,965 11,987 387,978 Valle Vista Lighting District 28,165 28,165 1,717 26,448 Volponi Acres Lighting District 83,873 83,873 3,264 80,609
Total public ways and facilities 1,974,117 1,974,117 220,409 1,753,708
Changes in fund balance (1,816,514)$ (1,816,514)$ (53,981) 1,762,533$
Fund balance, beginning of year 1,816,514
Fund balance, end of year 1,762,533$
Budgeted Amounts
COUNTY OF TUOLUMNE, CALIFORNIASCHEDULE OF REVENUES, EXPENDITURES, AND CHANGES IN FUND BALANCE
FOR THE YEAR ENDED JUNE 30, 2019BUDGET AND ACTUAL - LIGHTING DISTRICTS SPECIAL REVENUE FUND
84
85
OTHER GOVERNMENTAL FUNDS
CAPITAL PROJECTS FUNDS
Capital projects funds are used to account for financial resources to be used for the acquisition of major capital facilities (other than those financed by proprietary funds).
Airport Construction – This fund is used to account for construction and improvement of Pine Mountain Lake and Columbia airports.

Variance withFinal Budget
Actual PositiveOriginal Final Amounts (Negative)
Revenues:Interest, rents, and concessions -$ -$ 257,060$ 257,060$ Intergovernmental:
State 27,641,965 27,641,965 13,477,435 (14,164,530) Charges for services - 94,000 150,371 56,371 Miscellaneous 7,800 7,800 120 (7,680)
Total revenues 27,649,765 27,743,765 13,884,986 (13,858,779)
Expenditures: Public ways and facilities: County capital projects 42,128,563 42,404,328 20,762,666 21,641,662
Deficiency of revenues under expenditures (14,478,798) (14,660,563) (6,877,680) 7,782,883
Other financing sources:Transfers in 14,478,798 1,119,928 994,928 (125,000)
Changes in fund balance -$ (13,540,635)$ (5,882,752) 7,657,883$
Fund balance, beginning of year 11,464,471
Fund balance, end of year 5,581,719$
Budgeted Amounts
COUNTY OF TUOLUMNE, CALIFORNIASCHEDULE OF REVENUES, EXPENDITURES, AND CHANGES IN FUND BALANCE
FOR THE YEAR ENDED JUNE 30, 2019BUDGET AND ACTUAL - COUNTY CAPITAL CAPITAL PROJECTS FUND
86

Variance withFinal Budget
Actual PositiveOriginal Final Amounts (Negative)
Revenues:Intergovernmental:
State 6,397,521$ 7,310,293$ 1,733,277$ (5,577,016)$ Federal 15,522,461 16,385,431 4,644,082 (11,741,349) Other 627,781 604,541 434,709 (169,832)
Charges for services 3,715,010 3,738,010 129 (3,737,881)
Total revenues 26,262,773 28,038,275 6,812,197 (21,226,078)
Expenditures: Public ways and facilities: Storms/Floods 2017 3,876,639 5,539,762 1,410,811 4,128,951 Storms/Floods 2018 4,416,567 3,910,178 1,477,939 2,432,239 Public works projects 19,720,648 20,761,965 7,900,082 12,861,883
Total public ways and facilities 28,013,854 30,211,905 10,788,832 19,423,073
Deficiency of revenues under expenditures (1,751,081) (2,173,630) (3,976,635) (1,803,005)
Other financing sources:Transfers in 717,525 717,525 717,525 -
Changes in fund balance (budgetary basis) (1,033,556)$ (1,456,105)$ (3,259,110) (1,803,005)$
Basis adjustment:Agency funds allocation 2,043,860
Change in fund balance (GAAP basis) (1,215,250)
Fund balance, beginning of year 2,420,957
Fund balance, end of year 1,205,707$
Budgeted Amounts
COUNTY OF TUOLUMNE, CALIFORNIASCHEDULE OF REVENUES, EXPENDITURES, AND CHANGES IN FUND BALANCE
FOR THE YEAR ENDED JUNE 30, 2019BUDGET AND ACTUAL - ROAD CONSTRUCTION CAPITAL PROJECTS FUND
87

Variance withFinal Budget
Actual PositiveOriginal Final Amounts (Negative)
Revenues:Intergovernmental:
State 55,074$ 55,074$ 52,374$ (2,700)$ Federal 3,642,339 3,642,339 2,714,521 (927,818)
Total revenues 3,697,413 3,697,413 2,766,895 (930,518)
Expenditures: Public ways and facilities: Plant acquisition - airport construction 4,047,044 4,047,044 3,016,137 1,030,907
Deficiency of revenues under expenditures (349,631) (349,631) (249,242) 100,389
Other financing sources:Transfers in 343,431 343,856 340,652 (3,204)
Changes in fund balance (6,200)$ (5,775)$ 91,410 97,185$
Fund balance, beginning of year 6,200
Fund balance, end of year 97,610$
Budgeted Amounts
COUNTY OF TUOLUMNE, CALIFORNIASCHEDULE OF REVENUES, EXPENDITURES, AND CHANGES IN FUND POSITION
FOR THE YEAR ENDED JUNE 30, 2019BUDGET AND ACTUAL - AIRPORT CONSTRUCTION CAPITAL PROJECTS FUND
88

89
OTHER GOVERNMENTAL FUNDS
PERMANENT FUND
The Permanent Fund is used to account for financial resources of the Cemetery Endowment that are legally restricted to the extent that only earnings, and not principal, may be used.
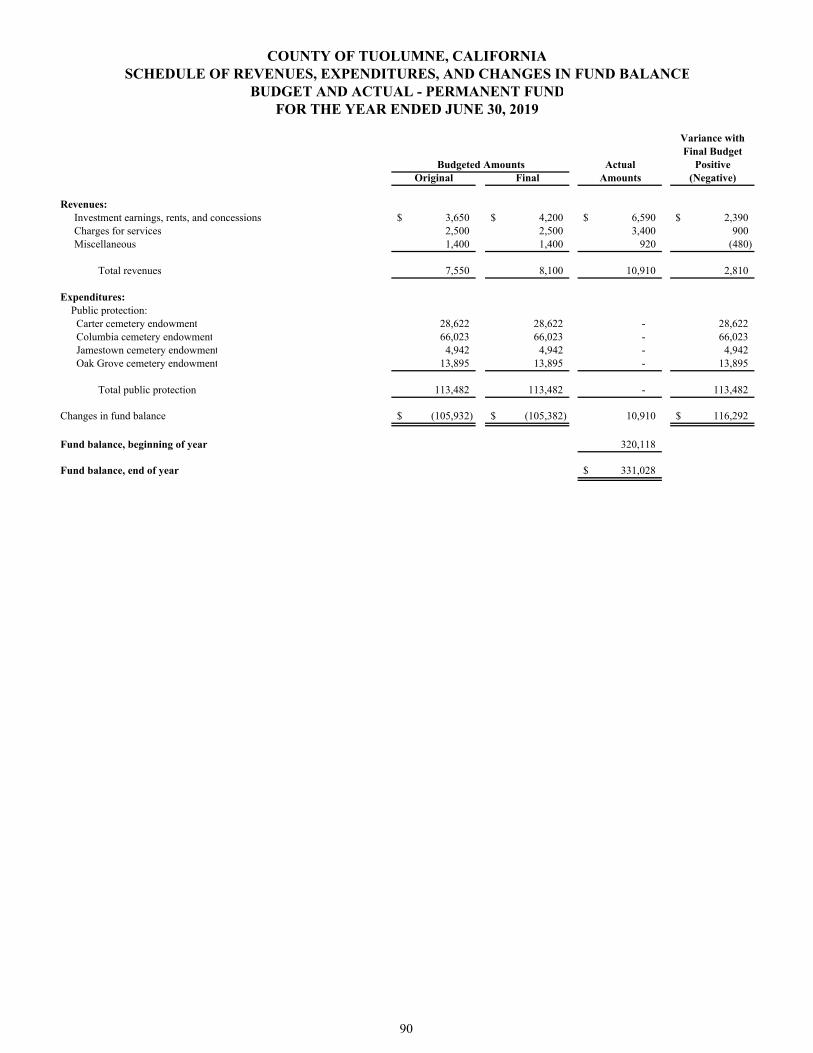
Variance withFinal Budget
Actual PositiveOriginal Final Amounts (Negative)
Revenues:Investment earnings, rents, and concessions 3,650$ 4,200$ 6,590$ 2,390$ Charges for services 2,500 2,500 3,400 900 Miscellaneous 1,400 1,400 920 (480)
Total revenues 7,550 8,100 10,910 2,810
Expenditures: Public protection: Carter cemetery endowment 28,622 28,622 - 28,622 Columbia cemetery endowment 66,023 66,023 - 66,023 Jamestown cemetery endowment 4,942 4,942 - 4,942 Oak Grove cemetery endowment 13,895 13,895 - 13,895
Total public protection 113,482 113,482 - 113,482
Changes in fund balance (105,932)$ (105,382)$ 10,910 116,292$
Fund balance, beginning of year 320,118
Fund balance, end of year 331,028$
Budgeted Amounts
COUNTY OF TUOLUMNE, CALIFORNIASCHEDULE OF REVENUES, EXPENDITURES, AND CHANGES IN FUND BALANCE
FOR THE YEAR ENDED JUNE 30, 2019BUDGET AND ACTUAL - PERMANENT FUND
90

91
INTERNAL SERVICE FUNDS
Internal service funds are used to account for the financing of goods or services by one department or agency to other departments or agencies of the County, or to other governments, on a cost-reimbursement basis. A more detailed description of the funds established and used by the County follows:
Workers’ Compensation – This fund is used to account for the County’s workers’ compensation revenues, expenses and estimated long-term liability.
Liability Insurance – This fund is used to account for the County’s general liability revenues, expenses and estimated long-term liability.
Purchasing and Special Services – This fund is used to account for the County’s general purchasing and special services activity.
Telecommunications – This fund is used to account for the activity of telecommunications services provided for County activities.
Unemployment Insurance – This fund is used to account for the activity related to the County’s unemployment insurance benefits.
Employee Group Insurance – This fund is used to account for the activity related to the County’s employee group insurance benefits.
Employee Leave Liability – This fund is used to account for the activity related to the County’s employee leave liability benefits.
Post Retirement Insurance – This fund is used to account for the activity related to the County’s post retirement insurance benefits.
Fleet/Radio Services – This fund is used to account for the activity related to the maintenance of the County’s vehicles and radio communication services.

PurchasingWorkers' Liability and Special Unemployment
Compensation Insurance Services Telecommunications Insurance
Assets:Current assets:
Cash and investments 2,511,140$ 839,300$ 128,079$ 600,319$ 83,725$ Accounts receivable - 199,568 - - - Intergovernmental receivables - - 994 568 -
Total current assets 2,511,140 1,038,868 129,073 600,887 83,725
Noncurrent assets:Restricted cash and investments 175,000 - - - - Advances to other funds 6,122,929 - - - - Capital assets:
Depreciable, net - - - 893,602 -
Total noncurrent assets 6,297,929 - - 893,602 -
Total assets 8,809,069 1,038,868 129,073 1,494,489 83,725
Liabilities:Current liabilities:
Accounts payable 50,310 481,123 153 17,518 10,901 Salaries and benefits payable - - 1,496 - - Accrued compensated absences, current - - 11,747 - - Accrued claims, current 1,868,021 25,000 - - -
Total current liablilities 1,918,331 506,123 13,396 17,518 10,901
Noncurrent liabilities:Advances from other funds - - - - - Accrued compensated absences - - 2,485 - - Accrued claims 7,426,979 - - - -
Total noncurrent liabilities 7,426,979 - 2,485 - -
Total liabilities 9,345,310 506,123 15,881 17,518 10,901
Net Position:Net investment in capital assets - - - 893,602 - Unrestricted (536,241) 532,745 113,192 583,369 72,824
Total net position (536,241)$ 532,745$ 113,192$ 1,476,971$ 72,824$
COUNTY OF TUOLUMNE, CALIFORNIA
INTERNAL SERVICE FUNDSCOMBINING STATEMENT OF NET POSITION
JUNE 30, 2019
92

Employee Employee Post TotalGroup Leave Retirement Fleet/Radio Internal
Insurance Liability Insurance Services Service
Assets:Current assets:
20,200$ -$ 471,583$ -$ 4,654,346$ Cash and investments- - - - 199,568 Accounts receivable- - - - 1,562 Intergovernmental receivables
20,200 - 471,583 - 4,855,476 Total current assets
Noncurrent assets:- - - - 175,000 Restricted cash and investments- - 6,095,867 - 12,218,796 Advances to other funds
Capital assets:- - - - 893,602 Depreciable, net
- - 6,095,867 - 13,287,398 Total noncurrent assets
20,200 - 6,567,450 - 18,142,874 Total assets
Liabilities:Current liabilities:
2,935 - - - 562,940 Accounts payable- - - - 1,496 Salaries and benefits payable- 1,800,000 - - 1,811,747 Accrued compensated absences, current- - - - 1,893,021 Accrued claims, current
2,935 1,800,000 - - 4,269,204 Total current liablilities
Noncurrent liabilities:- 831,877 - - 831,877 Advances from other funds- 2,242,182 - - 2,244,667 Accrued compensated absences- - - - 7,426,979 Accrued claims
- 3,074,059 - - 10,503,523 Total noncurrent liabilities
2,935 4,874,059 - - 14,772,727 Total liabilities
Net Position:- - - - 893,602 Net investment in capital assets
17,265 (4,874,059) 6,567,450 - 2,476,545 Unrestricted
17,265$ (4,874,059)$ 6,567,450$ -$ 3,370,147$ Total net position
93

PurchasingWorkers' Liability and Special Unemployment
Compensation Insurance Services Telecommunications Insurance
Operating revenues:Charges for services 2,824,945$ 1,857,270$ 768,483$ 341,582$ 125,117$ Miscellaneous - 332,657 1,401 - -
Total operating revenues 2,824,945 2,189,927 769,884 341,582 125,117
Operating expenses:Salaries and benefits 329,154 - 94,356 - - Professional fees 192,087 113,055 13,524 195,292 10,112 Claims 2,157,282 1,397,894 - - 576 Health insurance benefits - - - - - Unemployment benefits - - - - 73,745 General and administrative 181,302 353,284 675,392 145,146 10,068 Depreciation - - - 8,560 -
Total operating expenses 2,859,825 1,864,233 783,272 348,998 94,501
Operating income (loss) (34,880) 325,694 (13,388) (7,416) 30,616
Nonoperating revenues (expenses):Investment earnings 172,302 12,008 2,338 17,506 1,444 Loss on sale of capital assets - - - - - Interest expense - - - - -
Total nonoperating revenues (expenses) 172,302 12,008 2,338 17,506 1,444
Income (loss) before transfers 137,422 337,702 (11,050) 10,090 32,060
Transfers out - - - - -
Changes in net position 137,422 337,702 (11,050) 10,090 32,060
(673,663) 195,043 124,242 1,466,881 40,764
Net position, end of year (536,241)$ 532,745$ 113,192$ 1,476,971$ 72,824$
Net position, beginning of year
FOR THE YEAR ENDED JUNE 30, 2019
COUNTY OF TUOLUMNE, CALIFORNIA
INTERNAL SERVICE FUNDS
COMBINING STATEMENT OF REVENUES, EXPENSES, ANDCHANGES IN FUND NET POSITION
94

Employee Employee Post TotalGroup Leave Retirement Fleet/Radio Internal
Insurance Liability Insurance Services Service
Operating revenues:9,734,135$ 1,835,222$ 1,126,181$ -$ 18,612,935$ Charges for services
- - - - 334,058 Miscellaneous
9,734,135 1,835,222 1,126,181 - 18,946,993 Total operating revenues
Operating expenses:- 1,727,229 - (96,519) 2,054,220 Salaries and benefits504 - 5,446 - 530,020 Professional fees- - - - 3,555,752 Claims
9,727,376 - 710,155 - 10,437,531 Health insurance benefits- - - - 73,745 Unemployment benefits
12,633 - 553 - 1,378,378 General and administrative- - - - 8,560 Depreciation
9,740,513 1,727,229 716,154 (96,519) 18,038,206 Total operating expenses
(6,378) 107,993 410,027 96,519 908,787 Operating income (loss)
Nonoperating revenues (expenses):- 36,622 140,425 - 382,645 Investment earnings- - - (4,287) (4,287) Loss on sale of capital assets(44) - - - (44) Interest expense
(44) 36,622 140,425 (4,287) 378,314 Total nonoperating revenues (expenses)
(6,422) 144,615 550,452 92,232 1,287,101 Income (loss) before transfers
- - - (109,515) (109,515) Transfers out
(6,422) 144,615 550,452 (17,283) 1,177,586 Changes in net position
23,687 (5,018,674) 6,016,998 17,283 2,192,561
17,265$ (4,874,059)$ 6,567,450$ -$ 3,370,147$ Net position, end of year
Net position, beginning of year
95

PurchasingWorkers' Liability and Special Unemployment
Compensation Insurance Services Telecommunications Insurance
Cash flows from operating activities:Receipts from interfund services provided 2,824,945$ 1,990,359$ 768,890$ 351,563$ 125,117$ Payments to suppliers (340,000) (23,521) (689,670) (345,440) (105,450) Payments to employees (329,154) - (94,434) - - Claims paid (1,838,282) (1,772,894) - - (576)
Net cash provided by (used for) operating activities 317,509 193,944 (15,214) 6,123 19,091
Cash flows from noncapital financing activities:Advances to other funds - - - - - Receipt on advances to other funds 1,859,796 - - - - Payment on advances from other funds - - - - - Transfers out to other funds - - - - - Interest paid - - - - -
Net cash provided by (used for) noncapital financing activities 1,859,796 - - - -
Cash flows from capital and related financing activities:Acquisition and construction of capital assets - - - (532,790) -
Cash flows from investing activites:Interest received 172,302 12,008 2,338 17,506 1,444
Net increase (decrease) in cash and cash equivalents 2,349,607 205,952 (12,876) (509,161) 20,535
Cash and cash equivalents, beginning of year 336,533 633,348 140,955 1,109,480 63,190
Cash and cash equivalents, end of year 2,686,140$ 839,300$ 128,079$ 600,319$ 83,725$
Reconciliation to the Statement of Net Position:Cash and investments 2,511,140$ 839,300$ 128,079$ 600,319$ 83,725$ Restricted cash and investments 175,000 - - - -
Total cash and cash equivalents 2,686,140$ 839,300$ 128,079$ 600,319$ 83,725$
Reconciliation of operating income (loss) to net cash provided by (used for) operating activities:
Operating income (loss) (34,880)$ 325,694$ (13,388)$ (7,416)$ 30,616$ Adjustments to reconcile operating income (loss) to net cash provided by (used for) operating activities:
Depreciation expense - - - 8,560 - Changes in assets and liabilities:
Accounts receivable - (199,568) - - - Intergovernmental receivables - - (994) 9,981 - Prepaid items - - - - - Inventories - - - - - Accounts payable 33,389 442,818 (754) (5,002) (11,525) Salaries and benefits payable - - (312) - - Other liabilities - (375,000) - - - Accrued compensated absences - - 234 - - Accrued claims 319,000 - - - -
Net cash provided by (used for) operating activities 317,509$ 193,944$ (15,214)$ 6,123$ 19,091$
Noncash investing, capital, and financing activities:Transfer out of capital assets -$ -$ -$ -$ -$
COUNTY OF TUOLUMNE, CALIFORNIA
INTERNAL SERVICE FUNDSCOMBINING STATEMENT OF CASH FLOWS
FOR THE YEAR ENDED JUNE 30, 2019
96

Employee Employee Post TotalGroup Leave Retirement Fleet/Radio Internal
Insurance Liability Insurance Services Service
Cash flows from operating activities:9,734,135$ 1,835,222$ 1,126,181$ -$ 18,756,412$ Receipts from interfund services provided
(9,088,792) - (698,716) (18,108) (11,309,697) Payments to suppliers- (1,456,940) - (6,704) (1,887,232) Payments to employees- - - - (3,611,752) Claims paid
645,343 378,282 427,465 (24,812) 1,947,731 Net cash provided by (used for) operating activities
Cash flows from noncapital financing activities:- - (3,578,690) - (3,578,690) Advances to other funds- - - - 1,859,796 Receipt on advances to other funds
(625,100) (414,904) - - (1,040,004) Payment on advances from other funds- - - (109,515) (109,515) Transfers out to other funds(44) - - - (44) Interest paid
(625,144) (414,904) (3,578,690) (109,515) (2,868,457) Net cash provided by (used for) noncapital financing activities:
Cash flows from capital and related financing activities:- - - - (532,790) Acquisition and construction of capital assets
Cash flows from investing activites:- 36,622 140,425 - 382,645 Interest received
20,199 - (3,010,800) (134,327) (1,070,871) Net increase (decrease) in cash and cash equivalents
1 - 3,482,383 134,327 5,900,217 Cash and cash equivalents, beginning of year
20,200$ -$ 471,583$ -$ 4,829,346$ Cash and cash equivalents, end of year
Reconciliation to the Statement of Net Position:20,200$ -$ 471,583$ -$ 4,654,346$ Cash and investments
- - - - 175,000 Restricted cash and investments
20,200$ -$ 471,583$ -$ 4,829,346$ Total cash and cash equivalents
Reconciliation of operating income (loss) to net cash provided by (used for) operating activities:
(6,378)$ 107,993$ 410,027$ 96,519$ 908,787 Operating income (loss)Adjustments to reconcile operating income (loss) to net cash provided by (used for) operating activities:
- - - - 8,560 Depreciation expenseChanges in assets and liabilities:
- - - - (199,568) Accounts receivable, net- - - - 8,987 Intergovernmental receivables
652,056 - 17,438 - 669,494 Prepaid items- - - 8,000 8,000 Inventories
(335) - - (26,108) 432,483 Accounts payable- - - (6,705) (7,017) Salaries and benefits payable- - - - (375,000) Other liabilities- 270,289 - (96,518) 174,005 Accrued compensated absences- - - - 319,000 Accrued claims
645,343$ 378,282$ 427,465$ (24,812)$ 1,947,731$ Net cash provided by (used for) operating activities
Noncash investing, capital, and financing activities:-$ -$ -$ 4,287$ 4,287$ Transfer out of capital assets
97

This page intentionally left blank

99
AGENCY FUNDS
Agency funds are custodial in nature and do not involve measurement of results of operations. Such funds have no equity since all assets are due to individuals or entities at some future time.
Property Tax Collection – This fund is used to account for property tax collections awaiting apportionment to other governmental agencies.
Local Transportation – This fund is used to account for the quarter of one percent sales tax collected by the State Board of Equalization and deposited with the county of origin for local transportation support. The Tuolumne County Transportation Council, the regional agency responsible for administration of these monies, directs their use and distribution.
Emergency Medical – This fund is used to account for fines collected to pay for medical services for the indigent (SB611) and allocated to third parties.

Balance at Balance atJune 30, 2018 Additions Deductions June 30, 2019
Property Tax Collection
Assets:Cash and investments 2,249,989$ 108,532,564$ 109,623,326$ 1,159,227$ Taxes receivable 9,190,553 10,437,160 10,006,079 9,621,634
Total assets 11,440,542$ 118,969,724$ 119,629,405$ 10,780,861$
Liabilities:Agency obligations 11,440,542$ 268,324$ 928,005$ 10,780,861$
Local Transportation
Assets:Cash and investments 3,405,919$ 8,254,406$ 7,654,084$ 4,006,241$ Intergovernmental receivables 1,354,603 1,298,465 1,702,054 951,014
Total assets 4,760,522$ 9,552,871$ 9,356,138$ 4,957,255$
Liabilities:Agency obligations 4,760,522$ 5,236,481$ 5,039,748$ 4,957,255$
Emergency Medical
Assets:Cash and investments 76,892$ 121,678$ 122,574$ 75,996$
Liabilities:Agency obligations 76,892$ 73,189$ 74,085$ 75,996$
Total - All Agency Funds
Assets:Cash and investments 5,732,800$ 116,908,648$ 117,399,984$ 5,241,464$ Taxes receivable 9,190,553 10,437,160 10,006,079 9,621,634 Intergovernmental receivables 1,354,603 1,298,465 1,702,054 951,014
Total assets 16,277,956$ 128,644,273$ 129,108,117$ 15,814,112$
Liabilities:Agency obligations 16,277,956$ 5,577,994$ 6,041,838$ 15,814,112$
COUNTY OF TUOLUMNE, CALIFORNIACOMBINING STATEMENT OF CHANGES IN
ASSETS AND LIABILITIESAGENCY FUNDS
FOR THE YEAR ENDED JUNE 30, 2019
100

County of Tuolumne California
Statistical Section
Yosemite National Park


101
STATISTICAL SECTION
This part of the County of Tuolumne’s comprehensive annual financial report provides supplemental information for the benefit of the readers. This section presents detailed information as a context for understanding what the information in the financial statements, note disclosures and required supplementary information says about the County’s overall financial health.
Financial Trends – These schedules contain trend information to help the reader understand how the County’s financial performance and well-being have changed over time.
Schedule 1 – Net Position by Component Schedule 2 – Changes in Net Position Schedule 3 – Fund Balances of Governmental Funds Schedule 4 – Changes in Fund Balances, Governmental Funds Schedule 5 – Tax Revenues by Source, Governmental Funds
Revenue Capacity Information – These schedules contain information to help the reader assess the County’s most significant local revenue source, the property tax.
Schedule 6 – Assessed Value of Taxable Property Schedule 7 – Direct and Overlapping Property Tax Rates Schedule 8 – Principal Property Taxpayers Schedule 9 – Property Tax Levies and Collections
Debt Capacity Information – These schedules present information to help the reader assess the affordability of the County’s current levels of outstanding debt and the County’s ability to issue additional debt in the future.
Schedule 10 – Ratios of Outstanding Debt by Type Schedule 11 – Ratios of General Bonded Debt Outstanding Schedule 12 – Direct and Overlapping Governmental Activities Debt Schedule 13 – Legal Debt Margin Information Schedule 14 – Pledged Revenue Coverage
Demographic and Economic Information – These schedules offer demographic and economic indicators to help the reader understand the environment within which the County’s financial activities take place.
Schedule 15 – Demographic and Economic Statistics Schedule 16 – Principal Employers
Operating Information – These schedules contain service and infrastructure data to help the reader understand how the information in the County’s financial report relates to the services the County provides and the activities it performs.
Schedule 17 – Full-Time Equivalent County Employees by Function Schedule 18 – Operating Indicators by Function Schedule 19 – Capital Assets Statistics by Function
Sources: Unless otherwise noted, the information in these schedules is derived from the comprehensive annual financial reports for the relevant year.

This page intentionally left blank

Schedule 1Financial Trends
2009-10 2010-11 2011-12 2012-13 2013-14 2014-15 2015-16 2016-17 2017-18 2018-19Governmental activities
Net investment in capital assets 54,462,497$ 55,709,298$ 59,513,815$ 59,227,052$ 59,526,824$ 65,891,575$ 80,518,581$ 92,769,376$ 102,652,883$ 126,788,168$ Restricted 28,862,829 28,984,395 33,328,953 35,235,273 37,539,706 37,930,800 40,468,597 42,813,293 43,128,881 41,887,451 Unrestricted (10,731,061) (12,551,180) (13,457,907) (13,529,684) (12,959,053) (95,360,939) (92,657,948) (100,119,939) (121,719,478) (128,107,650)
Total governmental activities net position 72,594,265 72,142,513 79,384,861 80,932,641 84,107,477 8,461,436 28,329,230 35,462,730 24,062,286 40,567,969
Business-type activitiesNet investment in capital assets 11,854,379 10,729,007 8,956,738 8,467,600 8,099,395 7,933,306 7,800,266 9,712,465 9,224,541 9,147,223 Restricted 432,143 472,727 500,394 523,379 561,586 462,582 508,038 528,324 583,939 619,004 Unrestricted (11,312,348) (11,263,363) (9,453,361) (7,850,004) (6,857,810) (5,518,948) (3,589,350) (2,791,448) (1,768,609) (620,153)
Total business-type activities net position 974,174 (61,629) 3,771 1,140,975 1,803,171 2,876,940 4,718,954 7,449,341 8,039,871 9,146,074
Primary governmentNet investment in capital assets 66,316,876 66,438,305 68,470,553 67,694,652 67,626,219 73,824,881 88,318,847 102,481,841 111,877,424 135,935,391 Restricted 29,294,972 29,457,122 33,829,347 35,758,652 38,101,292 38,393,382 40,976,635 43,341,617 43,712,820 42,506,455 Unrestricted (22,043,409) (23,814,543) (22,911,268) (21,379,688) (19,816,863) (100,879,887) (96,247,298) (102,911,387) (123,488,087) (128,727,803)
Total net position 73,568,439$ 72,080,884$ 79,388,632$ 82,073,616$ 85,910,648$ 11,338,376$ 33,048,184$ 42,912,071$ 32,102,157$ 49,714,043$
Source: Annual Financial Reports
(Accrual Basis of Accounting)Last Ten Fiscal Years
Net Position by ComponentCOUNTY OF TUOLUMNE, CALIFORNIA
Fiscal Year
103
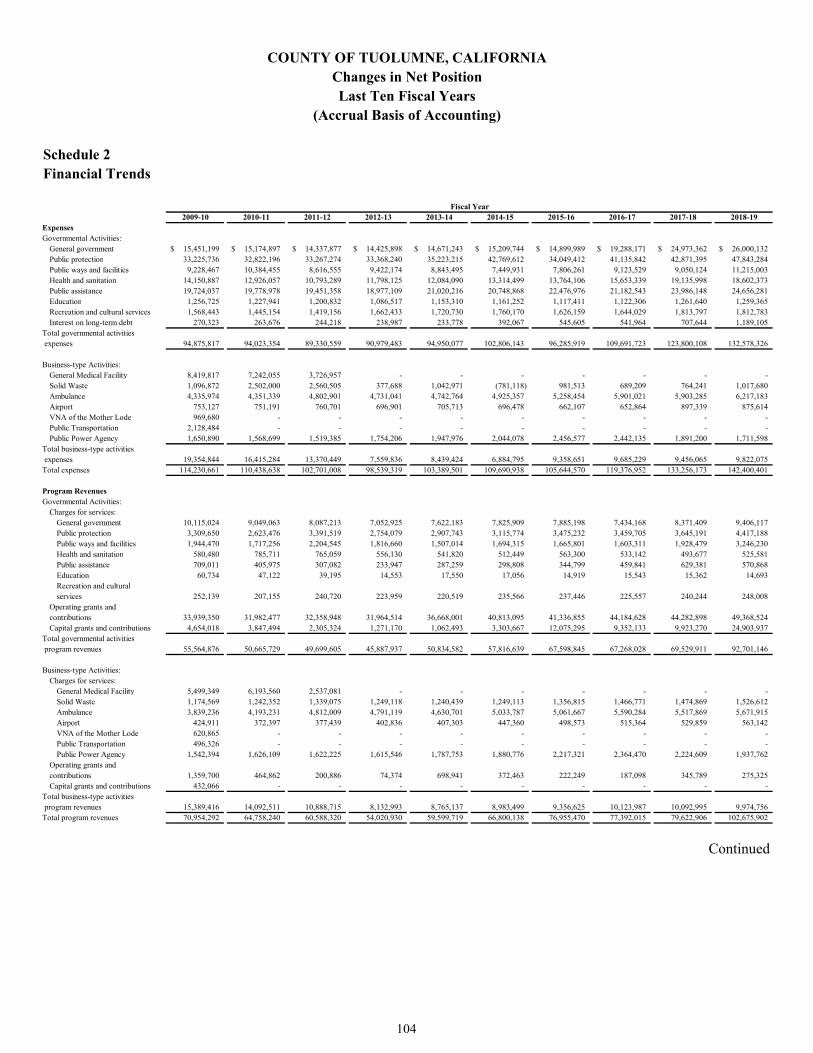
Schedule 2Financial Trends
2009-10 2010-11 2011-12 2012-13 2013-14 2014-15 2015-16 2016-17 2017-18 2018-19ExpensesGovernmental Activities:
General government 15,451,199$ 15,174,897$ 14,337,877$ 14,425,898$ 14,671,243$ 15,209,744$ 14,899,989$ 19,288,171$ 24,973,362$ 26,000,132$ Public protection 33,225,736 32,822,196 33,267,274 33,368,240 35,223,215 42,769,612 34,049,412 41,135,842 42,871,395 47,843,284 Public ways and facilities 9,228,467 10,384,455 8,616,555 9,422,174 8,843,495 7,449,931 7,806,261 9,123,529 9,050,124 11,215,003 Health and sanitation 14,150,887 12,926,057 10,793,289 11,798,125 12,084,090 13,314,499 13,764,106 15,653,339 19,135,998 18,602,373 Public assistance 19,724,037 19,778,978 19,451,358 18,977,109 21,020,216 20,748,868 22,476,976 21,182,543 23,986,148 24,656,281 Education 1,256,725 1,227,941 1,200,832 1,086,517 1,153,310 1,161,252 1,117,411 1,122,306 1,261,640 1,259,365 Recreation and cultural services 1,568,443 1,445,154 1,419,156 1,662,433 1,720,730 1,760,170 1,626,159 1,644,029 1,813,797 1,812,783 Interest on long-term debt 270,323 263,676 244,218 238,987 233,778 392,067 545,605 541,964 707,644 1,189,105
Total governmental activities expenses 94,875,817 94,023,354 89,330,559 90,979,483 94,950,077 102,806,143 96,285,919 109,691,723 123,800,108 132,578,326
Business-type Activities:General Medical Facility 8,419,817 7,242,055 3,726,957 - - - - - - - Solid Waste 1,096,872 2,502,000 2,560,505 377,688 1,042,971 (781,118) 981,513 689,209 764,241 1,017,680 Ambulance 4,335,974 4,351,339 4,802,901 4,731,041 4,742,764 4,925,357 5,258,454 5,901,021 5,903,285 6,217,183 Airport 753,127 751,191 760,701 696,901 705,713 696,478 662,107 652,864 897,339 875,614 VNA of the Mother Lode 969,680 - - - - - - - - - Public Transportation 2,128,484 - - - - - - - - - Public Power Agency 1,650,890 1,568,699 1,519,385 1,754,206 1,947,976 2,044,078 2,456,577 2,442,135 1,891,200 1,711,598
Total business-type activities expenses 19,354,844 16,415,284 13,370,449 7,559,836 8,439,424 6,884,795 9,358,651 9,685,229 9,456,065 9,822,075 Total expenses 114,230,661 110,438,638 102,701,008 98,539,319 103,389,501 109,690,938 105,644,570 119,376,952 133,256,173 142,400,401
Program RevenuesGovernmental Activities:
Charges for services:General government 10,115,024 9,049,063 8,087,213 7,052,925 7,622,183 7,825,909 7,885,198 7,434,168 8,371,409 9,406,117 Public protection 3,309,650 2,623,476 3,391,519 2,754,079 2,907,743 3,115,774 3,475,232 3,459,705 3,645,191 4,417,188 Public ways and facilities 1,944,470 1,717,256 2,204,545 1,816,660 1,507,014 1,694,315 1,665,801 1,603,311 1,928,479 3,246,230 Health and sanitation 580,480 785,711 765,059 556,130 541,820 512,449 563,300 533,142 493,677 525,581 Public assistance 709,011 405,975 307,082 233,947 287,259 298,808 344,799 459,841 629,381 570,868 Education 60,734 47,122 39,195 14,553 17,550 17,056 14,919 15,543 15,362 14,693 Recreation and culturalservices 252,139 207,155 240,720 223,959 220,519 235,566 237,446 225,557 240,244 248,008
Operating grants andcontributions 33,939,350 31,982,477 32,358,948 31,964,514 36,668,001 40,813,095 41,336,855 44,184,628 44,282,898 49,368,524 Capital grants and contributions 4,654,018 3,847,494 2,305,324 1,271,170 1,062,493 3,303,667 12,075,295 9,352,133 9,923,270 24,903,937
Total governmental activities program revenues 55,564,876 50,665,729 49,699,605 45,887,937 50,834,582 57,816,639 67,598,845 67,268,028 69,529,911 92,701,146
Business-type Activities:Charges for services:
General Medical Facility 5,499,349 6,193,560 2,537,081 - - - - - - - Solid Waste 1,174,569 1,242,352 1,339,075 1,249,118 1,240,439 1,249,113 1,356,815 1,466,771 1,474,869 1,526,612 Ambulance 3,839,236 4,193,231 4,812,009 4,791,119 4,630,701 5,033,787 5,061,667 5,590,284 5,517,869 5,671,915 Airport 424,911 372,397 377,439 402,836 407,303 447,360 498,573 515,364 529,859 563,142 VNA of the Mother Lode 620,865 - - - - - - - - - Public Transportation 496,326 - - - - - - - - - Public Power Agency 1,542,394 1,626,109 1,622,225 1,615,546 1,787,753 1,880,776 2,217,321 2,364,470 2,224,609 1,937,762
Operating grants andcontributions 1,359,700 464,862 200,886 74,374 698,941 372,463 222,249 187,098 345,789 275,325 Capital grants and contributions 432,066 - - - - - - - - -
Total business-type activities program revenues 15,389,416 14,092,511 10,888,715 8,132,993 8,765,137 8,983,499 9,356,625 10,123,987 10,092,995 9,974,756 Total program revenues 70,954,292 64,758,240 60,588,320 54,020,930 59,599,719 66,800,138 76,955,470 77,392,015 79,622,906 102,675,902
Continued
(Accrual Basis of Accounting)
COUNTY OF TUOLUMNE, CALIFORNIAChanges in Net PositionLast Ten Fiscal Years
Fiscal Year
104

Schedule 2Financial Trends
2009-10 2010-11 2011-12 2012-13 2013-14 2014-15 2015-16 2016-17 2017-18 2018-19
Net (expense) revenueGovernmental activities (39,310,941)$ (43,357,625)$ (39,630,954)$ (45,091,546)$ (44,115,495)$ (44,989,504)$ (28,687,074)$ (42,423,695)$ (54,270,197)$ (39,877,180)$ Business-type activities (3,965,428) (2,322,773) (2,481,734) 573,157 325,713 2,098,704 (2,026) 438,758 636,930 152,681
Total net expense (43,276,369) (45,680,398) (42,112,688) (44,518,389) (43,789,782) (42,890,800) (28,689,100) (41,984,937) (53,633,267) (39,724,499)
General Revenues and Other Changes in Net PositionGovernmental Activities:
Taxes:Property 26,309,709 25,000,179 24,518,857 24,050,554 24,383,703 25,288,708 26,777,028 26,331,905 27,376,169 29,393,666 Property transfer 209,899 227,688 232,647 282,707 329,650 346,954 376,558 473,705 525,720 460,532 Transient occupancy 1,491,006 1,823,081 2,208,794 2,416,923 2,250,796 2,645,360 3,325,364 4,541,718 4,559,015 4,826,458
Sales taxes shared state revenue 11,956,647 13,543,771 14,366,215 15,797,046 16,031,868 14,199,815 15,308,648 16,309,963 16,932,051 17,283,123 Grants and other intergovern- mental revenue not restricted to specific programs 2,798,355 2,475,266 3,077,383 2,921,866 3,162,302 3,000,069 3,386,150 2,886,783 3,632,809 3,425,981 Unrestricted investment earnings 725,136 395,416 436,165 482,115 394,022 555,750 589,327 648,052 774,763 1,243,814 Gain on sale of capital assets - 70,439 157,347 465,903 - - 36,523 10,251 19,468 54,026 Other 1,140,107 949,973 852,328 656,454 1,055,745 572,979 568,133 614,911 1,051,744 550,526 Transfers (4,816,762) (1,579,940) 1,023,566 (203,831) (317,755) (219,602) (48,985) (2,260,093) (104,757) (855,263)
Total governmental activities 39,814,097 42,905,873 46,873,302 46,869,737 47,290,331 46,390,033 50,318,746 49,557,195 54,766,982 56,382,863
Business-type Activities:Unrestricted investment earnings 35,232 21,753 20,700 20,762 13,728 27,950 27,136 28,656 37,053 80,685 Gain on sale of capital assets 158,837 5,041 - 4,230 - 3,375 4,041 2,880 3,600 17,574 Other 1,381,864 566,025 - - 5,000 - - - - - Special items - (885,789) - - - - - - - - Extraordinary items - - 3,550,000 335,224 - - - - - - Transfers 4,816,762 1,579,940 (1,023,566) 203,831 317,755 219,602 48,985 2,260,093 104,757 855,263
Total business-type activities 6,392,695 1,286,970 2,547,134 564,047 336,483 250,927 80,162 2,291,629 145,410 953,522 Total revenues and other changes in net position 46,206,792$ 44,192,843$ 49,420,436$ 47,433,784$ 47,626,814$ 46,640,960$ 50,398,908$ 51,848,824$ 54,912,392$ 57,336,385$
Changes in Net PositionGovernmental activities 503,156$ (451,752)$ 7,242,348$ 1,778,191$ 3,174,836$ 1,400,529$ 21,631,672$ 7,133,500$ 496,785$ 16,505,683$ Business-type activities 2,427,267 (1,035,803) 65,400 1,137,204 662,196 2,349,631 78,136 2,730,387 782,340 1,106,203
Total changes in net position 2,930,423$ (1,487,555)$ 7,307,748$ 2,915,395$ 3,837,032$ 3,750,160$ 21,709,808$ 9,863,887$ 1,279,125$ 17,611,886$
Source: Annual Financial Reports
Fiscal Year
Last Ten Fiscal Years(Accrual Basis of Accounting)
COUNTY OF TUOLUMNE, CALIFORNIAChanges in Net Position (Continued)
105

Schedule 3Financial Trends
2009-10 2010-11 2011-12 2012-13 2013-14 2014-15 2015-16 2016-17 2017-18 2018-19
General Fund
Nonspendable 5,014,522$ 4,763,564$ 5,226,827$ 2,961,554$ 1,371,182$ 1,449,037$ 53,670$ 1,170$ 430,770$ 677,170$
Committed - - - - 1,002,814 816,846 - - - -
Restricted - - - - - - - - 1,747,445 927,851
Assigned 259,097 1,732,385 214,780 274,768 564,948 584,395 4,239,665 2,532,877 2,706,254 3,192,909
Unassigned 1,117,806 - 85,938 4,148,506 5,487,358 5,968,686 3,135,362 3,393,633 2,576,362 3,051,870
Total General Fund 6,391,425 6,495,949 5,527,545 7,384,828 8,426,302 8,818,964 7,428,697 5,927,680 7,460,831 7,849,800
All other governmental funds
Nonspendable 11,285,183 242,351 197,515 208,167 224,419 254,965 275,165 189,092 223,300 320,983
Restricted 17,653,766 28,742,044 33,131,438 35,027,106 37,315,287 37,675,835 40,193,432 42,624,201 54,370,052 45,382,678
Unassigned (2,928,065) (2,614,109) (769,766) (997,638) (367,948) - - (3,563,561) (58,741) -
Total all other governmental
funds 26,010,884 26,370,286 32,559,187 34,237,635 37,171,758 37,930,800 40,468,597 39,249,732 54,534,611 45,703,661
Total governmental funds 32,402,309$ 32,866,235$ 38,086,732$ 41,622,463$ 45,598,060$ 46,749,764$ 47,897,294$ 45,177,412$ 61,995,442$ 53,553,461$
Note: The County implemented GASB Statement No. 54 beginning with fiscal year 2009-10.
Source: Annual Financial Reports
(Modified Accrual Basis of Accounting)Last Ten Fiscal Years
Fund Balances of Governmental FundsCOUNTY OF TUOLUMNE, CALIFORNIA
Fiscal Year
106

Schedule 4Financial Trends
2009-10 2010-11 2011-12 2012-13 2013-14 2014-15 2015-16 2016-17 2017-18 2018-19Revenues
Taxes 28,010,614$ 27,050,948$ 26,960,298$ 26,750,184$ 26,964,149$ 28,281,022$ 30,478,950$ 31,347,328$ 32,460,904$ 34,680,656$ Licenses and permits 1,603,198 1,461,649 1,514,500 1,418,628 1,691,726 1,916,170 1,871,032 2,121,716 2,090,645 2,681,262 Fines, forfeits and penalties 1,841,961 1,781,742 1,691,907 1,666,606 1,614,039 1,606,964 1,754,267 1,612,814 1,684,973 1,677,229 Investment earnings, rents, and concessions 548,290 277,561 341,048 381,309 332,004 436,462 454,093 469,334 503,808 861,169 Intergovernmental 53,238,413 51,806,686 52,107,870 51,879,386 56,791,108 61,145,042 72,033,646 72,627,966 74,689,413 92,105,954 Charges for services 13,526,349 11,592,367 11,828,926 9,567,019 9,798,323 10,176,743 10,561,396 9,996,737 11,548,125 14,070,194 Miscellaneous 1,140,107 949,973 852,328 731,664 1,189,301 744,583 641,435 720,452 1,133,359 682,824 Total revenues 99,908,932 94,920,926 95,296,877 92,394,796 98,380,650 104,306,986 117,794,819 118,896,347 124,111,227 146,759,288
ExpendituresGeneral government 13,756,470 13,503,834 12,794,736 12,835,466 13,165,000 13,964,306 14,474,301 16,488,899 16,583,970 18,646,374 Public protection 30,899,115 30,547,011 31,284,748 31,680,634 34,095,028 42,743,228 37,041,481 40,464,294 43,001,266 47,242,567 Public ways and facilities 6,895,127 8,024,537 6,121,423 6,925,772 6,419,857 5,676,059 6,124,263 6,838,844 6,483,756 8,492,074 Health and sanitation 13,976,029 12,589,600 10,658,527 11,680,183 11,968,711 13,432,698 14,159,255 15,000,673 17,006,184 16,728,163 Public assistance 19,618,137 19,425,536 19,217,444 18,771,883 20,839,430 20,800,971 22,846,935 20,580,902 22,007,970 22,831,690 Education 1,181,421 1,119,057 1,114,349 1,064,910 1,137,690 1,150,472 1,106,362 1,105,513 1,223,095 1,236,750 Recreation and cultural services 1,455,283 1,328,737 1,330,601 1,508,891 1,581,057 1,748,947 1,581,575 1,590,497 1,711,705 1,754,887 Capital outlay 13,234,840 6,065,975 7,997,842 5,175,294 4,691,555 11,229,418 18,487,777 18,558,223 19,791,772 35,810,678 Debt service
Principal 173,575 131,026 136,358 141,707 142,076 228,465 288,876 387,350 417,768 1,139,116 Bond issuance costs - - - - - 111,175 - - 236,889 161,160 Interest 274,092 267,478 248,056 242,741 237,563 395,882 549,499 545,901 690,414 1,179,840
Total expenditures 101,464,089 93,002,791 90,904,084 90,027,481 94,277,967 111,481,621 116,660,324 121,561,096 129,154,789 155,223,299
Excess (deficiency) of revenues over (under) expenditures (1,555,157) 1,918,135 4,392,793 2,367,315 4,102,683 (7,174,635) 1,134,495 (2,664,749) (5,043,562) (8,464,011)
Other financing sources (uses)Transfers in 7,504,251 6,204,927 8,949,491 5,375,658 5,739,019 11,137,173 8,361,498 6,901,772 25,462,973 8,690,419 Transfers out (12,045,778) (7,735,428) (9,149,554) (5,579,489) (5,892,118) (11,296,586) (8,386,759) (6,967,156) (25,722,732) (8,891,000) Debt issued - - - - - 8,205,000 - - 21,640,000 - Premium on debt issued - - - - - - - - 461,883 - Refunding bonds issued - - - - - - - - - 4,900,000 Premium on refunding bond issued - - - - - - - - - 18,217 Payment to refunded bond escrow agent - - - - - - - - - (4,757,057)
Proceeds from sale of capital assets 27,737 76,292 1,027,767 1,372,247 26,013 280,752 38,296 10,251 19,468 61,451 Total other financing sources (uses) (4,513,790) (1,454,209) 827,704 1,168,416 (127,086) 8,326,339 13,035 (55,133) 21,861,592 22,030
Net change in fund balances (6,068,947)$ 463,926$ 5,220,497$ 3,535,731$ 3,975,597$ 1,151,704$ 1,147,530$ (2,719,882)$ 16,818,030$ (8,441,981)$
Debt service as a percentage of non-capital expenditures 0.51% 0.46% 0.46% 0.45% 0.42% 0.62% 0.85% 0.91% 1.01% 1.94%
Source: Annual Financial Reports
(Modified Accrual Basis of Accounting)Last Ten Fiscal Years
Changes in Fund Balances, Governmental FundsCOUNTY OF TUOLUMNE, CALIFORNIA
Fiscal Year
107
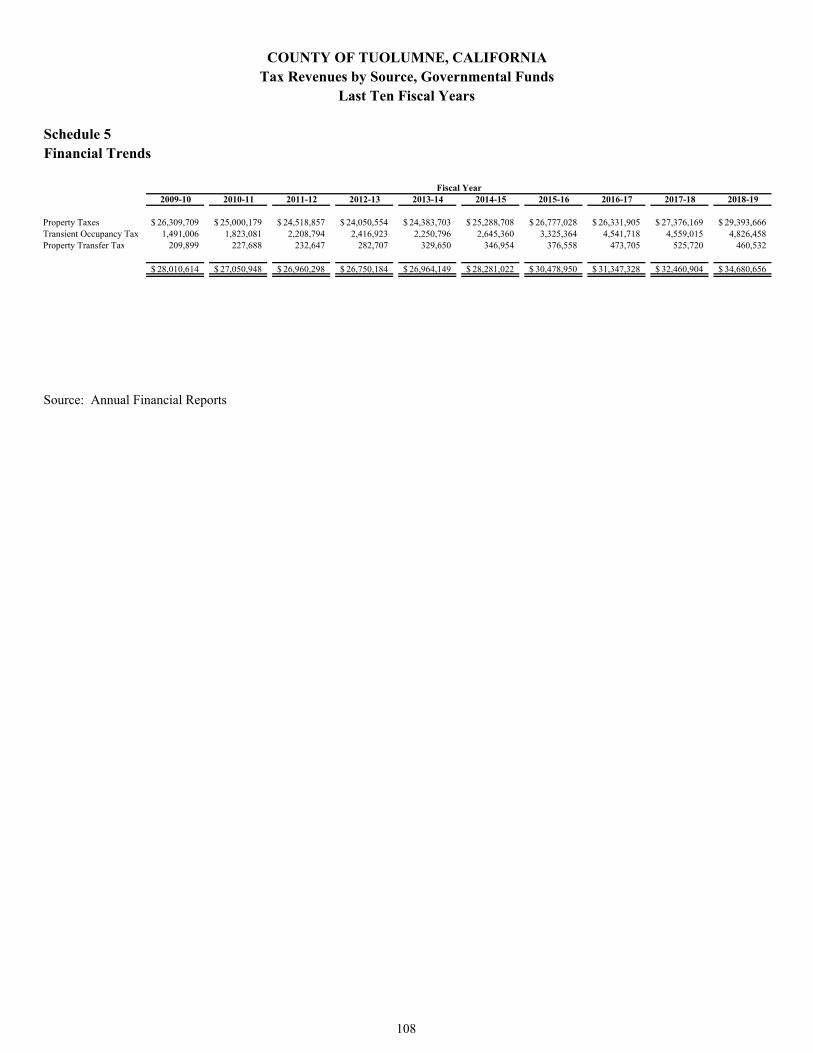
Schedule 5Financial Trends
2009-10 2010-11 2011-12 2012-13 2013-14 2014-15 2015-16 2016-17 2017-18 2018-19
Property Taxes 26,309,709$ 25,000,179$ 24,518,857$ 24,050,554$ 24,383,703$ 25,288,708$ 26,777,028$ 26,331,905$ 27,376,169$ 29,393,666$ Transient Occupancy Tax 1,491,006 1,823,081 2,208,794 2,416,923 2,250,796 2,645,360 3,325,364 4,541,718 4,559,015 4,826,458 Property Transfer Tax 209,899 227,688 232,647 282,707 329,650 346,954 376,558 473,705 525,720 460,532
28,010,614$ 27,050,948$ 26,960,298$ 26,750,184$ 26,964,149$ 28,281,022$ 30,478,950$ 31,347,328$ 32,460,904$ 34,680,656$
Source: Annual Financial Reports
COUNTY OF TUOLUMNE, CALIFORNIATax Revenues by Source, Governmental Funds
Last Ten Fiscal Years
Fiscal Year
108

Schedule 6Revenue Capacity Information
Fixed Personal
Fiscal Land Improvement Equipment Property Total Total Direct
Year Value Value Value Value Exemptions Value Tax Rate
2009-10 2,271,634,724$ 4,199,985,004$ 63,634,216$ 270,136,621$ (279,277,026)$ 6,526,113,539$ 1.000000
2010-11 2,151,336,639 4,028,578,248 58,328,750 188,623,454 (282,889,854) 6,143,977,237 1.000000
2011-12 2,029,511,527 3,928,332,808 60,551,794 258,429,348 (290,404,590) 5,986,420,887 1.000000
2012-13 1,971,293,241 3,851,220,543 71,364,256 256,188,947 (294,220,576) 5,855,846,411 1.000000
2013-14 1,985,819,504 3,909,973,464 69,508,305 259,043,511 (293,355,715) 5,930,989,069 1.000000
2014-15 2,020,641,139 4,039,958,358 68,276,758 252,836,622 (302,922,613) 6,078,790,264 1.000000
2015-16 2,103,582,655 4,282,554,733 60,538,445 251,980,860 (295,736,469) 6,402,920,224 1.000000
2016-17 2,175,152,336 4,489,754,278 55,485,178 246,774,703 (317,045,303) 6,650,121,192 1.000000
2017-18 2,250,474,974 4,748,499,392 * 249,325,528 (320,751,723) 6,927,548,171 1.000000
2018-19 2,345,994,825 5,004,936,550 * 286,050,511 (349,852,726) 7,287,129,160 1.000000
Notes:
Source: County of Tuolumne - Assessor's Office
Includes locally assessed Secured and Unsecured Roll property values, does not include Utility Roll values.Breakdown of residential and commercial values not available.
Due to passage of the Proposition 13 (Prop 13) property tax initiative in 1978, the County does not track theestimated actual value of all properties in the County. Under Prop 13, property is assessed at the 1975 marketvalue with an annual increase limited to 2% on properties not involved in a change of ownership or propertiesthat did not undergo new construction. Newly acquired property is assessed at its new market value (usuallythe purchase price) and the value of any new construction is added to the existing base value of a parcel. As aresult, similar properties can have substantially different assessed values based on the date of purchase.Additionally, Prop 13 limits the property tax rate to 1% of assessed value, plus the rate necessary to fund localvoter-approved bonds and special assessments.
COUNTY OF TUOLUMNE, CALIFORNIAAssessed Value of Taxable Property
Last Ten Fiscal Years
* Due to a change in the reporting format of the Assessment Roll Summary prepared by the Assessor's Office,beginning with fiscal year 2017-18, Fixed Equipment is now included with Personal Property.
109

Schedule 7Revenue Capacity Information
Countywide Special Districts Schools Cities
Fiscal Year AB-8 Bonds Bonds Bonds Total
2009-10 1.0000 0.0146 0.1640 0.0000 1.1786
2010-11 1.0000 0.0114 0.1640 0.0000 1.1754
2011-12 1.0000 0.0067 0.2027 0.0000 1.2094
2012-13 1.0000 0.0069 0.2124 0.0000 1.2193
2013-14 1.0000 0.0151 0.2041 0.0000 1.2192
2014-15 1.0000 0.0181 0.2141 0.0000 1.2322
2015-16 1.0000 0.0122 0.2109 0.0000 1.2231
2016-17 1.0000 0.0119 0.2192 0.0000 1.2311
2017-18 1.0000 0.0105 0.2625 0.0000 1.2729
2018-19 1.0000 0.0111 0.1981 0.0000 1.2092
Source: Tuolumne County Auditor-Controller Property Tax Section
COUNTY OF TUOLUMNE, CALIFORNIADirect and Overlapping Property Tax Rates
Last Ten Fiscal Years
Note: In June 1978, California voters approved Proposition 13, which restricted property taxes to a County-wide rate of 1% per $100of assessed value plus voter approved indebtedness. The distribution of County-wide basic tax rate of 1% is based on the County'sAB 8 Apportionment factors.
110

Schedule 8Revenue Capacity Information
Assessed % of Assessed % of
Taxpayer Value Rank County Value Rank County
Pacific Gas & Electric 164,086,977$ 1 2.25% 92,928,821$ 1 1.42%
Sierra Pacific Industries 55,742,883 2 0.76% 51,693,214 2 0.79%
City & County of San Francisco 50,020,524 3 0.69% 43,302,652 3 0.66%
Rush Creek Lodge LLC 29,492,301 4 0.40%
Wal-Mart 18,633,845 5 0.26% 13,200,854 8 0.20%
Nationwide Health Prop Inc (Avalon) 16,842,206 6 0.23%
Sonora/Five Assoc. 16,420,696 7 0.23% 17,969,350 6 0.28%
Portola Minerals (Blue Mountain) 15,590,008 8 0.21% 18,172,556 5 0.28%
Snider Lumber Products Inc 14,436,762 9 0.20%
Sonora Plaza 1 LLC 13,132,229 10 0.18%
AT&T California 18,899,954 4 0.30%
Pacific Ultra Power 14,600,000 7 0.23%
R1 Timberhills LLC 11,370,122 9 0.17%
Skyline Place Holdings LLC 11,221,685 10 0.17%
394,398,431$ 5.41% 293,359,208$ 4.50%
Countywide Assessed Value 7,287,129,160$ 6,526,113,539$
Source: Tuolumne County Assessor/Recorder
Fiscal Year 2019
COUNTY OF TUOLUMNE, CALIFORNIAPrincipal Property Taxpayers
Fiscal Year 2010
Fiscal Years 2019 and 2010
111

Schedule 9Revenue Capacity Information
Taxes Levied Collections
Fiscal for the in Subsequent
Year Fiscal Year Amount % of Levy Years Amount 1 % of Levy
2009-10 71,433,620$ 68,273,766$ 95.58% 2,435,151$ 70,708,917$ 98.99%
2010-11 68,476,487 65,882,390 96.21% 1,700,816 67,583,206 98.70%
2011-12 67,064,957 64,990,600 96.91% 2,043,038 67,033,638 99.95%
2012-13 66,032,479 64,002,893 96.93% 1,926,685 65,929,578 99.84%
2013-14 67,379,307 65,480,715 97.18% 1,980,231 67,460,946 100.12%
2014-15 69,247,328 67,312,030 97.21% 2,646,784 69,958,814 101.03%
2015-16 72,883,118 71,249,372 97.76% 2,340,267 73,589,639 100.97%
2016-17 75,453,865 73,824,169 97.84% 1,923,167 75,747,336 100.39%
2017-18 79,841,858 78,126,021 97.85% 1,925,686 80,051,707 100.26%
2018-19 83,629,560 81,627,669 97.61% N/A 81,627,669 97.61%
Source: Auditor-Controller Office/Crest Tax System
1 Collections include delinquent (abstract) bills. Also, the County's property tax system does not provide abreakdown of collections in subsequent years by fiscal year collected for. The amounts included in thecollections in subsequent years column represent all delinquent collections received in the following fiscal year(i.e., the $1,925,686 presented for fiscal year 2017-18 were all delinquencies received during fiscal year 2018-19).
Fiscal Year of the Levy Total Collections to Date
COUNTY OF TUOLUMNE, CALIFORNIAProperty Tax Levies and Collections
Last Ten Fiscal Years
Collected within the
112

Schedule 10Debt Capacity Information
Percentage PercentageTotal of Taxable of
Bonds Notes Notes Capital Primary Assessed Personal PerPayable Payable Payable Leases Government Value 1 Income 2 Capita 2
5,913,183$ 98,742$ 7,385,580$ 154,682$ 13,552,187$ 0.21% 0.71% 245.56$ 5,785,214 92,716 5,705,932 - 11,583,862 0.19% 0.58% 211.26 5,652,245 86,358 2,087,768 - 7,826,371 0.13% 0.38% 144.30 5,514,276 79,651 1,683,547 - 7,277,474 0.12% 0.36% 134.72 5,376,307 72,575 1,289,588 - 6,738,470 0.11% 0.31% 125.13
13,357,338 65,110 886,659 - 14,309,107 0.24% 0.61% 267.02 13,073,369 57,234 474,489 - 13,605,092 0.21% 0.56% 252.94 12,691,400 48,883 100,000 - 12,840,283 0.19% 0.52% 236.70 34,377,465 40,116 50,000 - 34,467,581 0.50% 1.32% 629.66 33,420,944 - - - 33,420,944 0.46% N/A 612.22
1 See Schedule 6, Assessed Value and Actual Value of Taxable Property, for total taxable assesssed value.2
Source: Annual Financial Reports
COUNTY OF TUOLUMNE, CALIFORNIARatios of Outstanding Debt by Type
Last Ten Fiscal Years
Year
Governmental Activities Business-Type ActivitiesFiscal
2009-102010-11
2013-14
2011-12
2015-16
2012-13
See Schedule 15, Demographic and Economic Statistics, for the population and personal income figures. Theseratios are calculated using personal income and population for the most recent fiscal year.
2017-18
2014-15
2016-17
2018-19
113

Schedule 11Debt Capacity Information
Percentage
Total of Taxable
Bonds General Bonded Assessed Per
Payable Debt Value 1 Capita 2
5,913,183$ 5,913,183$ 0.09% 107.15$
5,785,214 5,785,214 0.09% 105.51
5,652,245 5,652,245 0.09% 104.21
5,514,276 5,514,276 0.09% 102.08
5,376,307 5,376,307 0.09% 99.83
13,357,338 13,357,338 0.22% 249.26
13,073,369 13,073,369 0.20% 243.06
12,691,400 12,691,400 0.19% 233.95
34,377,465 34,377,465 0.50% 628.01
33,420,944 33,420,944 0.46% 612.22
1
2
Source: Annual Financial Reports
Year
Fiscal
Ratios of General Bonded Debt OutstandingCOUNTY OF TUOLUMNE, CALIFORNIA
Last Ten Fiscal Years
2009-10
2010-11
2014-15
2011-12
See Schedule 6, Assessed Value and Actual Value of Taxable Property, for total taxable assesssed value.
See Schedule 15, Demographic and Economic Statistics, for the population figures. These ratios are calculatedusing population for the most recent fiscal year.
2012-13
2013-14
2017-18
2015-16
2016-17
2018-19
114

Schedule 12Debt Capacity Information
Percentage County's
Net Debt Applicable Share of
Outstanding to County Debt
DEBT REPAID WITH PROPERTY TAXES:
SCHOOL DISTRICTS
Summerville High School 1,942,993$ 100% 1,942,993$
Summerville High School 2012 A 4,097,620 100% 4,097,620
Summerville High School 2012 B 2,150,115 100% 2,150,115
Summerville High School 2012 C 1,752,264 100% 1,752,264
Sonora Union High School 7,110,000 100% 7,110,000
Sonora Union High School B 9,835,000 100% 9,835,000
Sonora Union High School C 4,805,000 100% 4,805,000
Sonora Elementary School - Ref 2016 2,855,000 100% 2,855,000
Sonora Elementary School - 2016 bond 2,000,000 100% 2,000,000
Sonora Elementary School 255,550 100% 255,550
Big Oak Flat School 2005 4,797,000 100% 4,797,000
Big Oak Flat School 2005B 1,269,000 100% 1,269,000
Big Oak Flat School 2006 2,220,000 100% 2,220,000
Big Oak Flat School 2007 3,040,000 100% 3,040,000
Columbia Elementary School 5,069,682 100% 5,069,682
Soulsbyville Elementary School 573,046 100% 573,046
SPECIAL DISTRICTS
Groveland Community Service Dist 11,323 100% 11,323
Twain Harte Community Services District 282,284 100% 282,284
Sub-total Overlapping Debt 54,065,877
COUNTY 33,420,944
Total Direct and Overlapping Debt 87,486,821$
Source: Auditor-Controller, County of Tuolumne
COUNTY OF TUOLUMNE, CALIFORNIADirect and Overlapping Governmental Activities Debt
As of June 30, 2019
115
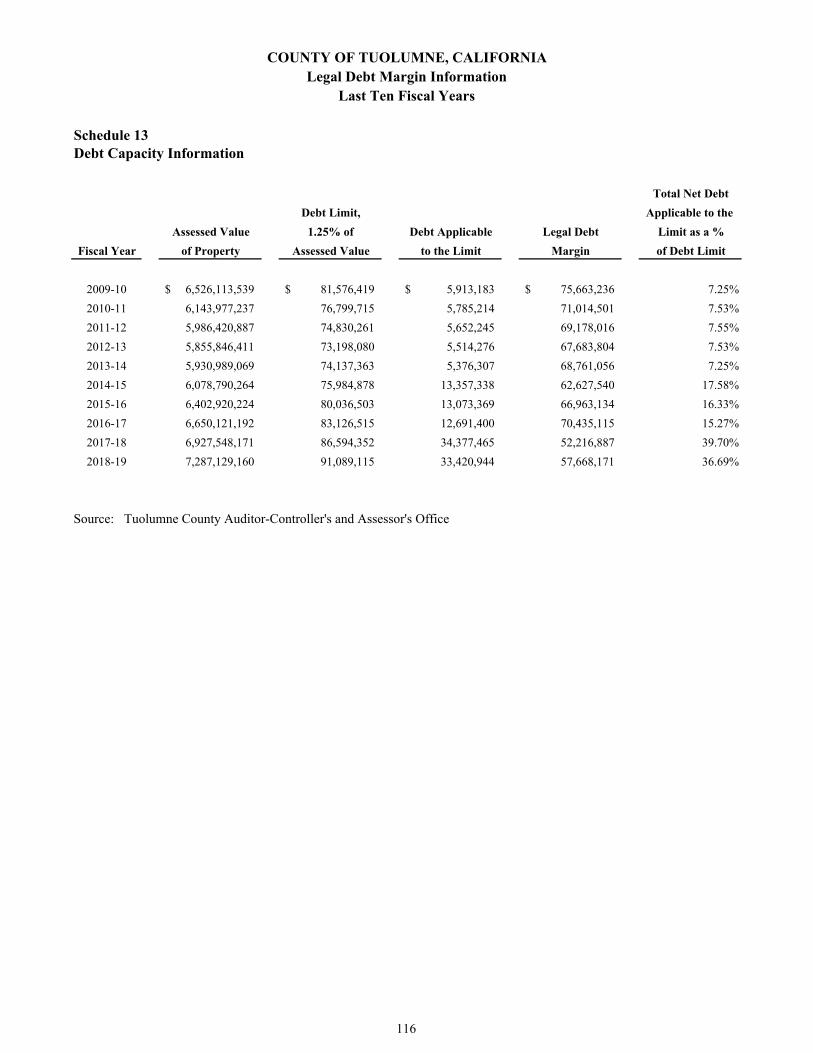
Schedule 13Debt Capacity Information
Total Net Debt
Debt Limit, Applicable to the
Assessed Value 1.25% of Debt Applicable Legal Debt Limit as a %
Fiscal Year of Property Assessed Value to the Limit Margin of Debt Limit
2009-10 6,526,113,539$ 81,576,419$ 5,913,183$ 75,663,236$ 7.25%
2010-11 6,143,977,237 76,799,715 5,785,214 71,014,501 7.53%
2011-12 5,986,420,887 74,830,261 5,652,245 69,178,016 7.55%
2012-13 5,855,846,411 73,198,080 5,514,276 67,683,804 7.53%
2013-14 5,930,989,069 74,137,363 5,376,307 68,761,056 7.25%
2014-15 6,078,790,264 75,984,878 13,357,338 62,627,540 17.58%
2015-16 6,402,920,224 80,036,503 13,073,369 66,963,134 16.33%
2016-17 6,650,121,192 83,126,515 12,691,400 70,435,115 15.27%
2017-18 6,927,548,171 86,594,352 34,377,465 52,216,887 39.70%
2018-19 7,287,129,160 91,089,115 33,420,944 57,668,171 36.69%
Source: Tuolumne County Auditor-Controller's and Assessor's Office
COUNTY OF TUOLUMNE, CALIFORNIALegal Debt Margin Information
Last Ten Fiscal Years
116

Schedule 14Debt Capacity Information
COUNTY OF TUOLUMNE, CALIFORNIAPledged Revenue Coverage
GASB Statement No. 44, Economic Condition Reporting: The Statistical Section, requires that theCounty show all nongeneral obligation long-term debt backed by pledged revenues. The County has nonongeneral obligation long-term debt backed by pledged revenues.
117

Schedule 15Demographic and Economic Information
Personal Per
Income1 Capita
Fiscal (Thousand Personal Unemployment
Year Population1 Change of dollars) Change Income1 Change Rate1
2009-10 55,188 -1.2% 1,909,171$ 5.6% 34,592$ 6.8% 14.2%
2010-11 54,832 -0.6% 2,000,659 4.8% 36,492 5.5% 14.9%
2011-12 54,237 -1.1% 2,038,193 1.9% 37,593 3.0% 13.8%
2012-13 54,018 -0.4% 2,029,449 -0.4% 37,582 0.0% 11.8%
2013-14 53,852 -0.3% 2,181,788 7.5% 40,533 7.9% 9.7%
2014-15 53,589 -0.5% 2,332,354 6.9% 43,555 7.5% 7.7%
2015-16 53,787 0.4% 2,441,785 4.7% 45,467 4.4% 6.5%
2016-17 54,248 0.9% 2,486,689 1.8% 46,017 1.2% 5.9%
2017-18 54,740 0.9% 2,609,032 4.9% 47,838 4.0% 4.9%
2018-19 54,590 -0.3% n/a 2 n/a 2 4.6%
Note:
Bureau of Economic Analysis revised estimates for 2010-2018 included. Updated Nov 2019.
Sources:1 US Dept. of Commerce - Bureau of Economic Analysis2 Data not yet published.
COUNTY OF TUOLUMNE, CALIFORNIA
Last Ten Fiscal YearsDemographic and Economic Statistics
118

Schedule 16Demographic and Economic Information
Number of % of Number of % ofEmployer Employees County Employer Employees CountyAdventist Health Sonora 1,000-4,999 4.5% - 22.6% Sierra Conservation Corrections Dept 1,000-4,999 4.4% - 21.8%Sierra Conservation Corrections Dept 1,000-4,999 4.5% - 22.6% Sonora Regional Medical Center 1,000-4,999 4.4% - 21.8%Black Oak Casino 500-999 2.3% - 4.5% Black Oak Casino 500-999 2.2% - 4.4%Dodge Ridge Ski Resort 500-999 2.3% - 4.5% Dodge Ridge Ski Resort 500-999 2.2% - 4.4%Hetch Hetchy Project 250-499 1.1% - 2.3% MRL Industries Inc 250-499 1.1% - 2.2%Tuolumne General Hospital 250-499 1.1% - 2.3% Wal-Mart 250-499 1.1% - 2.2%Wal-Mart 250-499 1.1% - 2.3% Avalon Care Center 100-249 .4% - 1.1%ATCAA 100-249 .5% - 1.1% Chicken Ranch Bingo & Casino 100-249 .4% - 1.1%Chicken Ranch Bingo & Casino 100-249 .5% - 1.1% Columbia College 100-249 .4% - 1.1%Columbia College 100-249 .5% - 1.1% Diestel Turkey Ranch 100-249 .4% - 1.1%Diestel Turkey Ranch 100-249 .5% - 1.1% Hetch Hetchy Water & Power 100-249 .4% - 1.1%Kohl's 100-249 .5% - 1.1% Sierra Pacific Industries 100-249 .4% - 1.1%Lair of the Golden Bear 100-249 .5% - 1.1% Sonora School District 100-249 .4% - 1.1%
Lowe's Home Improvement Center 100-249 .5% - 1.1% Safeway 100-249 .4% - 1.1%Pine Mountain Lake Association 100-249 .5% - 1.1%Safeway 100-249 .5% - 1.1%Sierra Pacific Industries 100-249 .5% - 1.1%Sonora High School 100-249 .5% - 1.1%Sonora School District 100-249 .5% - 1.1%Tuolumne County Special Ed 100-249 .5% - 1.1%Tuolumne Mewuk Tribal Council 100-249 .5% - 1.1%
Total Workforce in Tuolumne County: Labor Workers
Year Force Employed7/19 22,100 21,100 7/18 21,570 20,590 7/17 21,780 20,610 7/16 21,880 20,520 7/15 21,780 20,230 7/14 21,830 19,930 7/13 21,960 19,660 7/12 22,770 19,860 7/11 23,190 19,910 7/10 22,980 19,630
Note:
Source: EDD Labor Market Info
Tuolumne County itself is a principal employer but is excluded for the purposes of this report.Number of employees reflect an average range based on California Employment DevelopmentDepartment data.
June 30, 2010June 30, 2019
COUNTY OF TUOLUMNE, CALIFORNIAPrincipal Employers
June 30, 2019 and June 30, 2010
119

Schedule 17Operating Information
2009-10 2010-11 2011-12 2012-13 2013-14 2014-15 2015-16 2016-17 2017-18 2018-19General Government
Assessor/Recorder 18.00 15.00 15.00 15.00 15.00 15.00 17.00 17.00 15.00 14.00 Auditor-Controller 13.00 13.00 13.00 13.00 13.00 13.00 13.00 13.00 13.00 13.00 Board of Supervisors 6.80 6.00 6.00 6.00 6.00 6.00 6.00 6.00 6.00 6.00 County Administrative Office 5.00 5.00 5.00 5.00 5.00 5.00 6.00 6.00 6.00 6.00 County Counsel 5.00 5.00 4.80 5.00 4.00 5.00 5.00 5.00 5.00 6.00 Economic Development - - - - - - - - - 1.00 Elections 2.00 2.00 1.00 1.00 1.00 1.00 2.00 2.00 2.00 2.00 Facilities Management 27.00 24.00 17.00 17.00 16.00 16.00 16.00 16.00 16.00 15.00 General Services Agency - - - - - - - - - 2.00 Film Commissioner 1.00 - - - - - - - - - Human Resources 4.80 3.80 3.80 3.80 3.80 3.80 3.80 3.80 4.00 4.00 Information Technology 22.00 20.00 15.00 15.00 14.00 14.00 15.00 16.00 16.00 16.00 Jamestown Mine 1.00 1.00 0.50 - - - - - - - Office of Revenue Recovery 8.00 7.50 6.50 6.50 6.50 7.00 7.00 7.00 6.00 6.00 Radio - - 1.00 1.00 1.00 1.00 1.00 1.00 1.00 1.00 Treasurer/Tax Collector 4.50 4.00 4.00 4.00 4.00 4.00 4.00 4.50 4.50 4.00 Total General Government 118.10 106.30 92.60 92.30 89.30 90.80 95.80 97.30 94.50 96.00
Public ProtectionAgriculture Comm/Wts & Meas 5.00 5.00 4.00 4.00 4.00 5.00 5.00 5.00 5.00 5.00 Animal Control 9.00 9.00 8.75 8.75 8.00 9.00 10.00 10.00 10.00 10.00 Child Support Services 24.50 - - - - - - - - - Community Development Dept 22.75 20.75 23.63 23.50 22.50 24.75 31.00 31.00 28.00 32.00 County Fire 7.00 4.50 4.80 3.00 3.00 3.00 3.00 3.00 3.00 3.00 District Attorney 21.00 20.00 19.00 19.00 19.00 19.00 19.00 22.00 22.00 26.00 Office of Emergency Services - - - - - - 2.00 3.00 4.00 3.00 Probation 31.00 30.00 30.00 37.00 37.00 35.00 47.50 48.00 47.90 45.90 Public Defender 7.00 6.80 6.30 6.30 6.50 6.50 6.50 6.50 6.50 9.50 Sheriff/Coroner 131.00 129.50 125.00 126.00 127.50 129.50 134.00 134.00 132.00 135.00 Surveyor 2.00 2.00 2.00 2.00 2.00 2.00 - - - - Total Public Protection 260.25 227.55 223.48 229.55 229.50 233.75 258.00 262.50 258.40 269.40
Public Ways and FacilitiesPublic Works Admin, Eng, Dev, Roads 57.00 44.80 43.80 43.00 42.00 44.00 44.00 39.00 40.00 45.00 Total Public Ways and Facilities 57.00 44.80 43.80 43.00 42.00 44.00 44.00 39.00 40.00 45.00
Health and SanitationAir Pollution Control 2.00 2.00 2.00 2.00 2.00 2.00 2.00 2.00 2.00 2.00 Behavioral Health 50.00 49.50 48.80 52.60 53.00 58.00 63.00 68.00 67.20 68.20 Environmental Health 8.63 6.63 - - - - - - - - Health, Tobacco Control, WIC 22.40 22.00 21.90 23.00 24.40 26.20 27.20 26.70 27.90 27.90 Total Health and Sanitation 83.03 80.13 72.70 77.60 79.40 86.20 92.20 96.70 97.10 98.10
Public AssistanceSocial Services 104.00 101.00 98.50 107.00 110.60 108.60 109.80 112.80 109.30 103.50 Veterans 2.00 2.00 2.00 2.00 2.00 2.00 2.00 2.98 2.63 2.98 Total Public Assistance 106.00 103.00 100.50 109.00 112.60 110.60 111.80 115.78 111.93 106.48
EducationFarm Advisor 2.00 2.00 - - - - - - - - Library 11.00 9.75 8.25 8.25 8.25 8.25 10.00 10.00 10.00 10.00 Total Education 13.00 11.75 8.25 8.25 8.25 8.25 10.00 10.00 10.00 10.00
RecreationBoat Patrol 3.00 3.00 3.00 3.00 3.00 3.00 3.00 3.00 3.00 3.00 Recreation 8.60 6.55 6.00 6.80 7.20 7.20 7.80 7.80 7.80 8.00 Total Recreation & Cultural 11.60 9.55 9.00 9.80 10.20 10.20 10.80 10.80 10.80 11.00
Enterprises & Internal Service FundsAirports 4.00 3.00 3.50 3.50 3.50 3.50 3.50 4.00 4.00 4.00 Ambulance - - 2.00 2.00 2.00 2.00 2.00 2.00 2.00 2.00 Fleet Services - - 6.00 7.00 7.00 7.00 7.00 7.00 7.00 - Public Transportation 5.00 - - - - - - - - - Purchasing 2.00 2.00 2.00 2.00 2.00 2.00 2.00 2.00 1.50 2.00 Solid Waste 5.00 4.00 4.00 3.00 3.00 3.00 3.00 3.00 4.00 5.00 Tuolumne General Medical Center 37.40 34.70 - - - - - - - - Total Enterprise & Internal 53.40 43.70 17.50 17.50 17.50 17.50 17.50 18.00 18.50 13.00
Grand Total 702.38 626.78 567.83 587.00 588.75 601.30 640.10 650.08 641.23 648.98
Source: County of Tuolumne Adopted Budgets
Last Ten Fiscal YearsFull-time Equivalent County Employees By Function
COUNTY OF TUOLUMNE, CALIFORNIA
Fiscal Year
120

Schedule 18Operating Information
Function 2018-19 2017-18 2016-17 2015-16 2014-15 2013-14 2012-13 2011-12 2010-11 2009-10
General GovernmentRecorded documents - Asessor-Recorder 15,202 15,489 16,815 17,873 16,015 14,866 20,306 17,049 16,165 16,342 Fictitious Business Names - County Clerk 524 455 511 470 446 530 404 469 487 504 Number of registered voters - Elections 32,128 31,999 31,137 29,703 28,237 29,784 32,108 31,295 30,646 31,699 Applications received - Human Resources 4,491 3,984 3,556 3,055 3,391 2,217 2,441 1,655 1,244 1,248 Maintenance service requests received - Facilities Mgmt 3,992 3,442 3,414 3,713 3,681 3,173 3,195 3,402 6,165 7,592
Public ProtectionMisdemeanor cases filed - District Attorney 2,893 2,918 2,680 2,560 2,335 2,357 2,372 2,448 2,721 2,620 Felony cases filed - District Attorney 985 1,037 973 770 901 939 848 908 785 816 Arrests - Adults - Sheriff 4,878 5,831 5,084 4,816 4,707 4,204 4,173 4,447 4,722 4,517 Arrests - Juveniles - Sheriff 92 78 72 111 56 119 244 156 240 238 Average Daily Jail Population - Sheriff 143 146 145 146 144 139 136 128 129 130 Cases supervised - Probation - Adult 1,439 1,328 1,446 1,685 2,096 2,574 2,181 2,075 2,292 2,284 Cases supervised - Probation - AB-109 315 322 304 287 119 87 65 - - - Cases supervised - Probation - Juvenile 107 87 159 212 121 43 102 119 125 98 Fire emergency responses - County Fire 1,602 1,790 1,452 1,683 1,346 701 587 741 673 696 EMS / Medical Aids - County Fire/CDF 4,196 4,567 4,870 5,157 5,537 5,743 5,812 5,491 5,321 5,518 Building permits issued - Community Development Dept 1,963 1,754 1,558 1,445 1,373 1,260 1,263 1,507 1,237 1,120 Received calls for response - Animal Control 3,452 3,338 3,196 3,044 2,651 2,787 2,617 2,960 2,847 3,223
Public Ways & FacilitiesMaintained road lanes (in miles/lanes) 610/1220 610/1220 610/1220 610/1220 610/1220 607.5/1214 607.5/1214 607.5/1214 607.5/1214 607.5/1214Percent of roadway miles rehabilitated 0.02 0.2 - 1 19 - - 10 16 24 Potholes repaired 1,000's 1,000's 1,000's 1,000's 1,000's 1,000's 1,000's 1,000's 1,000's 1,000's
Health & SanitationFood inspections - Environmental Health 540 582 620 570 636 542 621 591 668 700 Unduplicated Open Clients served - Mental Health 1,780 2,013 1,958 1,973 2,041 1,925 1,800 1,974 1,626 1,671 Hazardous waste lbs accepted - Solid Waste 660,619 649,700 572,479 498,344 447,776 443,704 482,448 558,871 623,556 654,029 Hazardous waste lbs recycled - Solid Waste 609,630 599,293 530,921 454,863 396,542 391,247 422,697 502,892 565,691 604,429
Public AssistanceHuman ServicesAverage Medi-Cal cases 6,677 6,739 7,015 7,014 6,325 4,188 3,063 2,963 2,836 2,728 Average CalFresh cases 2,749 2,752 3,072 3,237 3,094 2,962 2,903 2,852 2,685 2,373 Average General Assistance cases 3 5 5 3 2 3 3 2 2 3 Average CALWORKS cases 381 450 479 535 613 653 670 658 717 683
EducationLibraryNumber of library visitors 161,530 170,589 162,989 166,524 167,268 174,219 177,181 178,811 174,501 291,122 Number of registered card holders 29,456 34,671 33,400 32,372 31,366 30,472 27,878 29,138 27,664 26,042 Public internet sessions 22,257 25,496 26,732 34,550 33,748 33,864 42,122 27,875 28,839 23,788
RecreationRecreational registrations/participants 3,000 2,694 2,424 2,073 2,065 1,850 4,300 3,100 1,400 1,400
* Estimated
Source: Various County Departments
COUNTY OF TUOLUMNE, CALIFORNIAOperating Indicators by Function
Last Ten Fiscal Years
Fiscal Year
121

Schedule 19Operating Information
2018-19 2017-18 2016-17 2015-16 2014-15 2013-14 2012-13 2011-12 2010-11 2009-10
Function
General GovernmentAdministration Buildin 4 4 4 4 4 4 4 4 4 4 Vehicles 31 33 33 33 30 31 35 34 37 25
Public ProtectionAdministration buildin 9 9 9 9 9 9 9 9 8 8 Jail and detention facili 2 2 2 1 1 1 1 1 1 1 Sheriff sub-stations 5 5 5 5 5 5 5 5 5 5 Patrol boats 9 9 8 8 7 7 8 7 7 11 Vehicles/Patrol cars 179 187 186 184 186 185 183 175 165 221 Fire stations 12 11 14 14 14 14 14 14 14 14 Fire engines 19 19 18 18 20 19 19 19 19 19
Public Ways & FacilitiesAdministration buildin 1 1 1 1 1 1 1 1 1 1 Maintenance buildings 5 5 5 5 5 5 5 5 5 5 Bridges 54 54 53 53 53 53 53 53 53 53 Roads (miles) 610 610 610 610 610 608 608 608 608 608 Traffic Signals 24 23 21 21 20 20 20 20 20 19 Heavy Equipment 49 49 49 48 43 45 50 46 54 54 Vehicles 61 58 61 61 62 63 67 65 63 70
Health & SanitationAdministration buildin 3 3 3 3 3 3 3 1 1 1 Medical Facility - - - - - - - - 1 1 Hazardous Waste Facil 3 3 3 3 3 3 3 3 3 3 Vehicles 31 32 29 29 27 25 29 24 25 17
Public AssistanceAdministration buildin 1 1 1 1 1 1 1 1 1 1 Vehicles 32 32 32 30 28 30 33 31 30 49
EducationLibraries - main 1 1 1 1 1 1 1 1 1 1 Libraries - branches 3 3 3 3 3 3 3 6 6 6 Vehicles 3 3 3 3 3 3 3 3 3 3
RecreationAdministration buildin 5 5 5 5 5 5 5 5 5 5 Sports fields 15 15 9 9 9 9 9 9 9 9 Vehicles 13 13 14 9 9 9 9 9 9 8
Source: Auditor-Controller's Office capital asset records.
COUNTY OF TUOLUMNE, CALIFORNIACapital Asset Statistics by Function
Last Ten Fiscal Years
Fiscal Year
122