Comprehensive Annual Financial Report...October 1, 2015 - September 30, 2016 Department of Finance...
230
CITY OF COLUMBIA, MISSOURI Comprehensive Annual Financial Report For the Fiscal Year October 1, 2015 - September 30, 2016 Department of Finance Michele Nix, CPA Director of Finance
Transcript of Comprehensive Annual Financial Report...October 1, 2015 - September 30, 2016 Department of Finance...

CITY OF COLUMBIA, MISSOURI
Comprehensive
Annual Financial Report
For the Fiscal Year
October 1, 2015 - September 30, 2016
Department of Finance
Michele Nix, CPA
Director of Finance

CITY OF COLUMBIA, MISSOURI
Comprehensive
Annual Financial Report
For the Fiscal Year
October 1, 2015 - September 30, 2016
Department of Finance
Michele Nix, CPA
Director of Finance
CITY OF COLUMBIA, MISSOURI
Table of Contents Page INTRODUCTORY SECTION: Transmittal Letter i-iii Certificate of Achievement v Organizational Chart vi-vii List of Officials ix FINANCIAL SECTION: Independent Auditors’ Report 5-6 Management’s Discussion and Analysis 9-18 Basic Financial Statements Government-Wide Financial Statements Statement of Net Position 21 Statement of Activities 22-23 Fund Financial Statements Governmental Funds Financial Statements Balance Sheet 24 Reconciliation of the Governmental Funds Balance Sheet to the Statement
of Net Position 25
Statement of Revenues, Expenditures, and Changes in Fund Balances 26
Reconciliation of the Statement of Revenues, Expenditures, and
Changes in Fund Balances of Governmental Funds to the
Statement of Activities 27 Proprietary Funds Financial Statements Statement of Net Position 28
Statement of Revenues, Expenses, and Changes in Fund Net Position 29 Statement of Cash Flows 30
Fiduciary Fund Financial Statements Statement of Fiduciary Net Position 31
Statement of Changes in Fiduciary Net Position 33 Notes to the Basic Financial Statements 39-98
(Continued)
CITY OF COLUMBIA, MISSOURI
Table of Contents
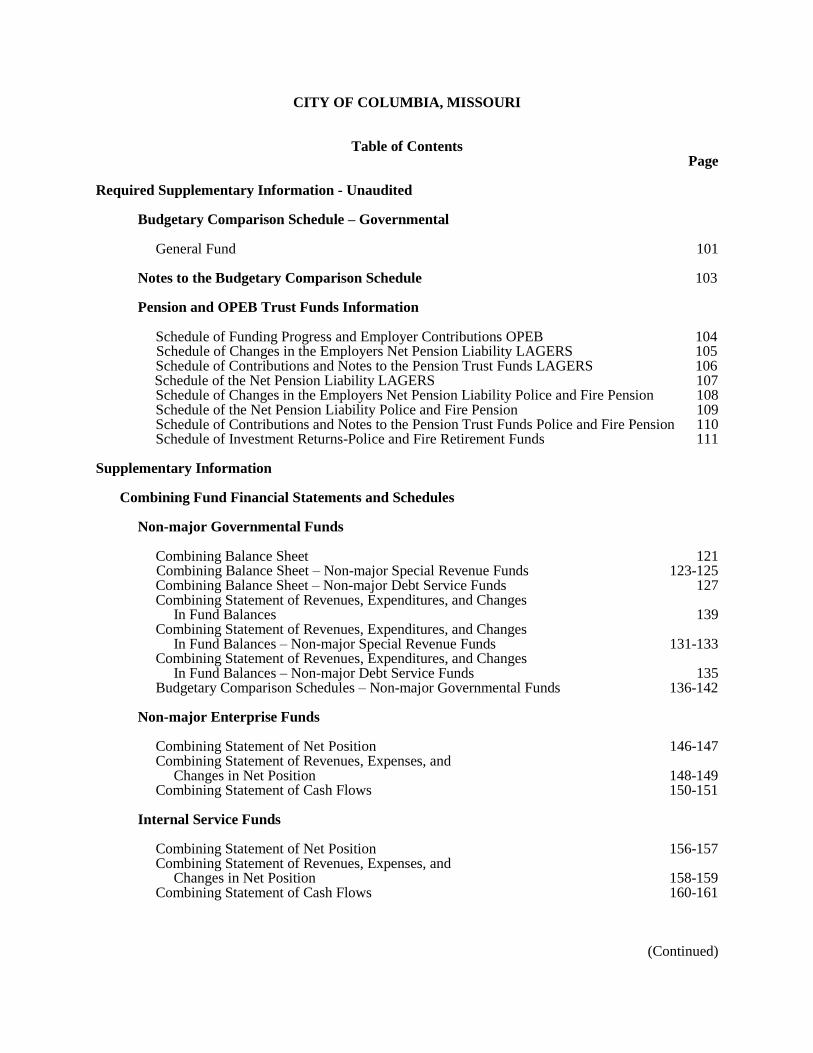
Page Required Supplementary Information - Unaudited Budgetary Comparison Schedule – Governmental General Fund 101 Notes to the Budgetary Comparison Schedule 103 Pension and OPEB Trust Funds Information Schedule of Funding Progress and Employer Contributions OPEB 104 Schedule of Changes in the Employers Net Pension Liability LAGERS 105 Schedule of Contributions and Notes to the Pension Trust Funds LAGERS 106 Schedule of the Net Pension Liability LAGERS 107 Schedule of Changes in the Employers Net Pension Liability Police and Fire Pension 108 Schedule of the Net Pension Liability Police and Fire Pension 109 Schedule of Contributions and Notes to the Pension Trust Funds Police and Fire Pension 110 Schedule of Investment Returns-Police and Fire Retirement Funds 111 Supplementary Information Combining Fund Financial Statements and Schedules Non-major Governmental Funds Combining Balance Sheet 121 Combining Balance Sheet – Non-major Special Revenue Funds 123-125 Combining Balance Sheet – Non-major Debt Service Funds 127 Combining Statement of Revenues, Expenditures, and Changes In Fund Balances 139 Combining Statement of Revenues, Expenditures, and Changes In Fund Balances – Non-major Special Revenue Funds 131-133 Combining Statement of Revenues, Expenditures, and Changes In Fund Balances – Non-major Debt Service Funds 135 Budgetary Comparison Schedules – Non-major Governmental Funds 136-142 Non-major Enterprise Funds Combining Statement of Net Position 146-147 Combining Statement of Revenues, Expenses, and Changes in Net Position 148-149 Combining Statement of Cash Flows 150-151 Internal Service Funds Combining Statement of Net Position 156-157 Combining Statement of Revenues, Expenses, and Changes in Net Position 158-159 Combining Statement of Cash Flows 160-161
(Continued)

CITY OF COLUMBIA, MISSOURI
Table of Contents Table Page Fiduciary Funds Combining Statement of Fiduciary Net Position 166 Combining Statement of Changes in Fiduciary Net Position 167 Combining Statement of Fiduciary Net Position – Agency 168 Combining Statement of Changes in Fiduciary Net Position – Agency 169 STATISTICAL SECTION: Net Position by Component – Last Ten Fiscal Years 1 174-175 Changes in Net Position – Last Ten Fiscal Years 2 176-177 Fund Balance – Governmental Funds – Last Ten Fiscal Years 3 178-179 Changes in Fund Balances – Governmental Funds – Last Ten Fiscal Years 4 180-181 Assessed Value and Estimated Actual Value of Taxable Property – Last Ten Fiscal Years 5 183 Property Tax Rates and Tax Levies – Direct and Overlapping Governments – Last Ten Fiscal Years 6 184-185 Principal Taxpayers – Current and Nine Years Ago 7 187 General Fund – Property Tax Levies and Tax Collections – Last Ten Fiscal Years 8 188-189 Schedule of Electric Service Rates – Last Ten Fiscal Years 9 190-191 Schedule of Electric Service Rates – Last Ten Fiscal Years 10 192-193 Schedule of Water Service Rates – Last Ten Fiscal Years 11 194-195 Schedule of Sanitary Sewer Service Rates – Last Ten Fiscal Years 12 196 Schedule of Marketable Securities and Investments 13 197-203 Federal and State Grants Revenue 14 205 Taxable Sales by Category – Last Ten Fiscal Years 15 206-207 Ratios of Outstanding Debt by Type – Last Ten Fiscal Years 16 209 Direct and Overlapping Governmental Activities Debt 17 211 Legal Debt Margin Information – Last Ten Fiscal Years 18 212-213 Water and Electric Utility Revenue Bond Coverage – Last Ten Fiscal Years 19 214 Sanitary Sewer Utility Revenue Bond Coverage – Last Ten Fiscal Years 20 215 Property Value, Construction, and Bank Deposits – Last Ten Fiscal Years 21 217 Largest Electric Utility Customers 22 218 Largest Water Utility Customers 23 219 Demographic Statistics – Last Ten Fiscal Years 24 220 Principal Employers – Current and Nine Years Ago 25 221 Full-Time Equivalent City Government Employees by Function/Program – Last Ten Fiscal Years 26 222 Operating Indicators by Function/Program – Last Ten Fiscal Years 27 223 Capital Asset Statistics by Function/Program – Last Nine Fiscal Years 28 225 Insurance in Force 29 226-227

CITY OF COLUMBIA, MISSOURI
INTRODUCTORY
SECTION

701 E. BROADWAY ~ P.O. BOX 6015 ~ COLUMBIA, MISSOURI 65205-6015
(573) 874-7365 ~ FAX (573) 874-7761 ~ TTY (573) 874-7625
CITY OF COLUMBIA, MISSOURI __________________________________________________________________________________________________
FINANCE DEPARTMENT
ADMINISTRATION
February 7, 2017
Honorable Mayor, City Council, City Manager, and the Citizens of the City of Columbia:
Introduction
Management Responsibility
The Comprehensive Annual Financial Report (CAFR) of the City of Columbia, Missouri (the City) is submitted for your
review in compliance with the provisions of Article II, Section 17 of the City Charter. This CAFR was prepared by the staff
of the Finance Department in close cooperation with the external auditor, RSM US LLP. Responsibility for both the
accuracy of the data and the completeness and fairness of the presentation, including all disclosures, rests with the City. We
believe the data, as presented, is accurate in all material aspects, that it is presented in a manner designed to fairly set forth
the financial activity of its various funds and that all disclosures necessary to enable the reader to gain the maximum
understanding of the City’s financial affairs have been included. Management’s Discussion and Analysis (“MD&A”)
immediately follows the independent auditor’s report and provides a narrative introduction, overview and analysis of the
basic financial statements. This letter of transmittal is designed to complement the MD&A and should be read in
conjunction with it.
The Financial Reporting Entity
The Governmental Accounting Standards Board has established the criteria to determine the financial reporting entity for a
municipal government’s financial report. Therefore, the City used these criteria to examine the relationship of the City to
other associated but legally separate entities, to determine if their inclusion in this report would be necessary to fairly
present the financial position of the City. These criteria generally have to do with financial benefit or burden, and levels of
influence over the activities of these organizations.
The financial reporting entity includes all funds of the City. This financial report does not include the Columbia Regional
Library District, the Columbia Housing Authority or the City of Columbia New Century Fund, Inc. For a more detailed
explanation of the relationship to these entities, refer to footnote number one in the Notes to the Basic Financial Statements
on page 39.
Government Structure
The City of Columbia is a constitutional home rule charter city and was organized in 1892 pursuant to the laws of the State
of Missouri. The City is governed by a home rule charter and has a Council-Manager, non-partisan form of government
which was adopted in 1949. The Mayor and six council members are elected for three year staggered terms with two
council members elected each year. The City is divided into six wards, with one council member representing each ward
and the Mayor being elected at large.
Columbia is a full service City which provides not only the traditional basic services such as public safety, public works
and planning, but also a wide variety of enterprise activities. Columbia provides a majority of utility services including
water, electricity, solid waste, and sanitary sewers. Additionally, Columbia operates three transportation enterprises: the
regional airport, public transportation and railroad operations. It is this comprehensive service approach that allows
Columbia to be responsive to the community while managing growth in a professional and fiscally responsible manner.

ii
Economic Condition and Outlook
The City of Columbia is located in Boone County in the central portion of the State of Missouri. The City’s central location
serves as a crossroad for travelers going east and west on Interstate 70 and north and south on U.S. 63. Columbia has
excellent transportation resources being serviced by the Columbia Regional Airport, Columbia Terminal Railroad,
Columbia Area Transit System and one interstate bus service. The City encompasses approximately 64 square miles and
has a current estimated population of approximately 121,627.
The City is the location of the main campus of the University of Missouri, Columbia College, and Stephens College.
Approximately 51,095 students attend these institutions of higher education during the regular school year. In addition to
higher education, Columbia is also a regional medical center with eight hospitals. Insurance is a major business operation in
the City with home offices of Shelter Insurance Companies, the Columbia Insurance Group, and a regional office of State
Farm Insurance Company. Columbia is a regional shopping area for central Missouri with 16 shopping centers. Other area
industries consist of printing, structural metal fabrication, structural materials production, electronic products, auto parts
and food processing.
All of these activities have given Columbia a fairly stable employment base. Public education (including the University)
and government comprise over 31% of all non-farm employment and are four of the top ten employers in the Columbia
area. Service industries provide approximately 42% of non-farm employment with the medical industry comprising two of
the top ten employers. The retailing industry is also strong providing approximately 16% of the employment in the area.
The unemployment rate in Columbia, approximately 2.2% in 2016, has been well below the national average of
approximately 4.5%.
Financial Planning & Fiscal Responsibility
The City of Columbia utilizes an annual budget process that results in both annual and long-term financial planning. It is
important to use a balanced budget approach to ensure that the City operates within its means. Every budget is approached
with a conservative view of revenues and expenditures that capture all reasonably predicted events and needs for the
upcoming year. The process begins with the City staff who are responsible for each fund and ends with the Council
approving the budget before the new fiscal year begins. During the process, there are several opportunities for citizens to
attend meetings and express views on the budget as it is being developed. Work sessions were held with the City Council
during this fiscal year to keep Council informed and to allow the Council to provide additional information regarding
service levels to our citizens.
The City of Columbia uses various methods of communicating the financial condition of the City. Financial reports such as
the Capital Improvement Plan, Ten Year Trend Manual, Budget document, Comprehensive Annual Financial Report and
Interim Financial reports are published on the City’s website.
Major Initiatives
During FY 2016, City staff worked to implement new city-wide enterprise resource planning software system across the
City (COFERS). The new COFERS system will integrate internal and external management information across the entire
city, enhancing effectiveness and efficiency.
During Fiscal Year 2016, the City began implementation of the Strategic Plan adopted by City Council on September 21,
2015 including the development of a structure to measure the City’s progress towards achieving its Strategic Plan priorities
within the identified areas of: public safety, infrastructure, operational excellence economy and social equity.
As part of the Strategic Plan, the City has worked towards a collaborative effort with community partners and others to
achieve the vision of Columbia as the best place for everyone to live, work, learn and play by obtaining input from two
public meetings in strategic neighborhoods with a third planned for the near future. Some of the initiatives that advance the
strategic goals in FY 2016 were the distribution of single fare bus pass booklets, the creation of a public safety community
outreach unit, offering a Building Inclusive Communities workshop for City employees and the successful accreditation of
Public Health and Human Services which adds to the six other departments/division accredited prior to 2016.

Other Information
Independent Audit
The State of Missouri statutes require an annual audit of all funds of the City. The fIrm ofRSM US LLP has included its opinion in this report.
Certificate of Achievement
We believe this report meets and conforms to the very high standards of the Government Finance OffIcers Association (GFOA) of the United States and Canada for fInancial reporting of state and local governments. The City of Columbia, Missouri has received a CertifIcate of Achievement for Excellence in Financial Reporting for each of the last thirty six years, and we believe our current report continues to conform to the CertifIcate of Achievement Program requirements.
We will be submitting this report to GFOA to determine its eligibility for another certifIcate because a CertifIcate of Achievement is valid for a one-year period only. In order to be awarded a CertifIcate, the fInancial report must satisfy accounting principles and must be organized to strict program standards. Such reports must also satisfy applicable legal requirements.
Finally, I would like to say the preparation of the Comprehensive Annual Financial Report could not have been accomplished without the dedicated staff of the Finance Department, especially personnel in the Accounting Division who actually compiled the report. Appreciation is also extended to the Mayor, the City Council, and the City Manager, for their part in planning and conducting the fInancial operations of the City in a responsible and progressive manner.
Respectfully submitted,
Michele Nix, CPA Director of Finance
1ll

iv
THIS PAGE IS INTENTIONALLY LEFT BLANK

jlgunnel
Rectangle
jlgunnel
Typewritten Text
jlgunnel
Typewritten Text
jlgunnel
Typewritten Text
jlgunnel
Typewritten Text
jlgunnel
Typewritten Text
jlgunnel
Typewritten Text
jlgunnel
Typewritten Text
jlgunnel
Typewritten Text
jlgunnel
Typewritten Text
jlgunnel
Typewritten Text
jlgunnel
Typewritten Text
v
jlgunnel
Typewritten Text
jlgunnel
Typewritten Text
jlgunnel
Typewritten Text

CITYMANAGER
Approveddate
City Manager
CDBG
VOLUNTEERPROGRAMS
BUILDING & SITE
NEIGHBORHOODPROGRAMS
STORMWATER
CUSTOMER
FACILITYTRANSLOAD
ELECTRIC
SANITARY
DEVELOPMENT
OPERATION
PARK
SUPPORT
INFRASTRUCTURECOMMUNITY
SEWER
SOLIDWASTE
GIS
CITY
SERVICES
UTILITY
RAILROAD
COUNSELOR STEERINGCITY GIS/IT
DEPUTY
CITY
PARKS AND
PROSECUTOR
HUMAN
PLANNING
HUMAN SERVICESUTILITIES
DIRECTOR
CITY
DIRECTOR
C.A.R.E.ENVIRONMENTAL
ZONING WATER
PARK
HUMANSERVICES
HELP DESK
APPLICATION SERVICES
RESOURCES
ADMINISTRATIONADMINISTRATION PUBLIC HEALTH
RECREATION
CONTROL
HEALTH
ANIMAL
SERVICES
INFORMATION
FUNCTIONAL ORGANIZATIONAL CHART
CITY MANAGEMENTFELLOWS
MUNICIPAL CITY BOARDS ANDCOMMISSIONSJUDGE
INTERNALAUDITOR
CLERK
CITIZENS OFCOLUMBIA,MISSOURI
CITY COUNCILMAYOR AND
ASSISTANT TOPROJECTTHE CITY MANAGERMANAGER
DEVELOPMENTDIRECTOR OF DIRECTOR OF COMMUNITY
PUBLIC HEALTH &
MANAGER
COMMITTEE
TRUSTFUNDS
DEPUTYCITY
MANAGER
DIRECTOR
RECREATION
DEVELOPMENT &
80
ADMINISTRATION
EMPLOYEE
HEALTH
TELEPHONE
DEVELOPMENT
BENEFITS
CITYUNIVERSITY
LABORNEGOTIATIONS
DIRECTOR TECHNOLOGY
City of Columbia, Missouri www.CoMo.gov
jlgunnel
Typewritten Text
jlgunnel
Typewritten Text
vi

AIRPORT
SELF INSURANCE/
ACCOUNTING
COMMUNITY
PLAN
MANAGER
STRATEGIC
STREETS & PLANNING
ADMINISTRATIONENGINEERING ADMINISTRATION ADMINISTRATION/ADMIN SUPPORT
EMERGENCY
TRAINING
& FINANCIAL
TREASURYOPERATIONS/
OPER. SUPPORT
PARKING
DIRECTORDIRECTOR CHIEF DEVELOPMENT
LEGISLATIVE
OPERATIONS
SOLID WASTE DIST
MANAGEMENT
LICENSE
SUPPORT SERVICES
TRANSIT
RISKPARKING
FLEET
DOCUMENTCUSTODIAL &MAINTENANCE
MID MISSOURI
ENFORCEMENT
SERVICESSIDEWALKS
TRAFFIC
PURCHASING
CITY CHANNEL
EMERGENCY
SERVICES
CENTER
EVENT SERVICES
RELATIONS DIRECTORWORKSDIRECTOR
CHIEFECONOMIC
CULTURAL CIVIC RELATIONS
DIRECTOR BUREAUDIRECTOR
AFFAIRS
PUBLIC COMMUNITY POLICEFIREFINANCE
AFFAIRS
CITY OF COLUMBIA, MISSOURI
ASSISTANT
MANAGER
& VISITORS
CITY
CONVENTION
SPECIAL EVENTS
SUSTAINABILITY
OFFICER
81
BUSINESS
MANAGEMENT
CONTACT
City of Columbia, Missouri www.CoMo.gov
jlgunnel
Typewritten Text
vii

THIS PAGE INTENTIONALLY LEFT BLANK
viii

CITY OF COLUMBIA, MISSOURI
CITY OF COLUMBIA
OFFICIALS
MAYOR
Brian Treece
CITY COUNCIL
Clyde Ruffin Ward 1 Ian Thomas Ward 4
Michael Trapp Ward 2 Laura Nauser Ward 5
Karl Skala Ward 3 Betsy Peters Ward 6
CITY MANAGER
Mike Matthes
DIRECTOR OF FINANCE
Michele Nix
INDEPENDENT AUDITORS
RSM US LLP
ix

THIS PAGE INTENTIONALLY LEFT BLANK
x

CITY OF COLUMBIA, MISSOURI
FINANCIAL SECTION

CITY OF COLUMBIA, MISSOURI
INDEPENDENT
AUDITORS' REPORT

5
Independent Auditor’s Report To the Honorable Mayor and Members of the City Council of the City of Columbia, Missouri Columbia, Missouri Report on the Financial Statements We have audited the accompanying financial statements of the governmental activities, the business-type activities, each major fund, and the aggregate remaining fund information of the City of Columbia, Missouri (the City) as of and for the year ended September 30, 2016, and the related notes to the financial statements, which collectively comprise the City’s basic financial statements as listed in the table of contents. Management’s Responsibility for the Financial Statements Management is responsible for the preparation and fair presentation of these financial statements in accordance with accounting principles generally accepted in the United States of America; this includes the design, implementation, and maintenance of internal control relevant to the preparation and fair presentation of financial statements that are free from material misstatement, whether due to fraud or error. Auditor’s Responsibility Our responsibility is to express opinions on these financial statements based on our audit. We conducted our audit in accordance with auditing standards generally accepted in the United States of America. Those standards require that we plan and perform the audit to obtain reasonable assurance about whether the financial statements are free from material misstatement. An audit involves performing procedures to obtain audit evidence about the amounts and disclosures in the financial statements. The procedures selected depend on the auditor’s judgment, including the assessment of the risks of material misstatement of the financial statements, whether due to fraud or error. In making those risk assessments, the auditor considers internal control relevant to the entity’s preparation and fair presentation of the financial statements in order to design audit procedures that are appropriate in the circumstances, but not for the purpose of expressing an opinion on the effectiveness of the entity’s internal control. Accordingly, we express no such opinion. An audit also includes evaluating the appropriateness of accounting policies used and the reasonableness of significant accounting estimates made by management, as well as evaluating the overall presentation of the financial statements. We believe that the audit evidence we have obtained is sufficient and appropriate to provide a basis for our audit opinions. Opinions In our opinion, the financial statements referred to above present fairly, in all material respects, the respective financial position of the governmental activities, the business-type activities, each major fund, and the aggregate remaining fund information of the City, as of September 30, 2016, and the respective changes in financial position and, where applicable, cash flows thereof for the year then ended in accordance with accounting principles generally accepted in the United States of America.

6
Other Matters Required Supplementary Information Accounting principles generally accepted in the United States of America require that the Management’s Discussion and Analysis, the Budgetary Comparison Schedules, and the pension and postemployment information, as listed in the table of contents, be presented to supplement the basic financial statements. Such information, although not a part of the basic financial statements, is required by the Governmental Accounting Standards Board who considers it to be an essential part of financial reporting for placing the basic financial statements in an appropriate operational, economic or historical context. We have applied certain limited procedures to the required supplementary information in accordance with auditing standards generally accepted in the United States of America, which consisted of inquiries of management about the methods of preparing the information and comparing the information for consistency with management’s responses to our inquiries, the basic financial statements, and other knowledge we obtained during our audit of the basic financial statements. We do not express an opinion or provide any assurance on the information because the limited procedures do not provide us with sufficient evidence to express an opinion or provide any assurance. Other Information Our audit was conducted for the purpose of forming opinions on the financial statements that collectively comprise the City’s basic financial statements. The combining and individual nonmajor fund financial statements and other schedules, listed in the table of contents as supplementary information, and the other information, such as the introductory and statistical section are presented for purposes of additional analysis and are not a required part of the basic financial statements. The combining and individual nonmajor fund financial statements and other schedules are the responsibility of management and were derived from and relate directly to the underlying accounting and other records used to prepare the basic financial statements. Such information has been subjected to the auditing procedures applied in the audit of the basic financial statements and certain additional procedures, including comparing and reconciling such information directly to the underlying accounting and other records used to prepare the basic financial statements or to the basic financial statements themselves, and other additional procedures in accordance with auditing standards generally accepted in the United States of America. In our opinion, this information is fairly stated, in all material respects, in relation to the basic financial statements as a whole. The accompanying introductory, statistical sections and other schedules, as listed in the table of contents, have not been subjected to the auditing procedures applied in the audit of the basic financial statements, and accordingly, we do not express an opinion or provide any assurance on them.
Kansas City, Missouri February 7, 2017

CITY OF COLUMBIA, MISSOURI
MANAGEMENT'S
DISCUSSION AND ANALYSIS

9
City of Columbia, Missouri
Management’s Discussion and Analysis
As management of the City of Columbia (the “City”), we offer readers of the City’s Comprehensive Annual
Financial Report (CAFR), this narrative and analysis of the financial activities of the City for the fiscal year ended
September 30, 2016. We encourage readers to consider the information presented here in conjunction with
additional information provided in this report in our letter of transmittal and basic financial statements.
Financial Highlights
Columbia continues to be a growing city. The City provides a full range of governmental and proprietary services
that include eleven enterprise activities.
Total tax revenues of $69,929,462 decreased .5% in fiscal year 2016. Sales tax revenue decreased in fiscal
year 2016 by $8,948.
Charges for services in business-type activities increased $11,470,466 or 5.7%.
The City’s total net position increased $31,552,204 or 3.5%. Governmental activities net position
increased $9,161,746 or 2.2% while business-type activities net position increased $22,390,458 or 4.7%.
Total unrestricted net position increased $5,042,073.
The City continued to make all required contributions to its pension plans.
The Comprehensive Annual Financial Report
This comprehensive annual financial report consists of six parts:
Introductory section, which includes the transmittal letter and general information,
Management’s discussion and analysis (this part),
The basic financial statements, which include the government-wide and the fund financial
statements, along with the notes to the basic financial statements,
Required supplementary information,
Combining statements for non-major governmental funds, non-major enterprise funds, internal
service funds, and fiduciary funds, and
Statistical section
The basic financial statements present two kinds of information. The government-wide financial statements provide
both long-term and short-term information about the City’s overall financial status. These statements are prepared
on a full accrual basis to present information in a more corporate-like presentation. Fund financial statements are
included to provide useful information on individual parts of the government. The City, like other state and local
governments, uses fund accounting to ensure and demonstrate compliance with finance-related legal requirements.
More relevant detail is provided by distinct presentation of major funds in the basic financial statements, rather than
summaries by total fund types.
Government-Wide Financial Statements
The basic financial statements include two government-wide financial statements: the Statement of Net Position and
the Statement of Activities. The Statement of Net Position presents information on all of the City’s assets and
liabilities. The difference between the City’s total assets and deferred outflows of resources, and total liabilities and
deferred inflows of resources are reported as net position. Over time, increases or decreases in net position may
serve as a useful indicator of whether the financial position of the City is improving or deteriorating. The Statement
of Activities presents information showing how the City’s net position changed during the most recent fiscal year.

10
The governmental activities financial statements include the functions of the City that are principally supported by
taxes and intergovernmental revenues. The business-type activities financial statements include functions that are
intended to recover all, or a significant portion, of their costs through user fees and charges.
These statements can be found on pages 21 to 23. The government-wide financial statements report information
about the City as a whole using accounting methods similar to those used by the private sector.
The statement of net position and statement of activities divide the City into the following:
Governmental activities – All of the City’s basic services are considered to be governmental activities,
including public safety, public works, health, parks, planning, cultural and economic development and
general administration. These activities are supported primarily with general City revenue such as sales
taxes, gross receipts taxes, Payment in Lieu of Taxes (PILOT), property taxes, fines and specific program
revenue like permit fees and grants.
Business-type activities – All the City’s enterprise activities are included here. These operations derive
revenues from charges for services that are intended to recoup the full cost (or a significant portion of the
cost) of operations. Three of these operations require subsidies from tax revenue (airport, transit and
recreation services).
The government-wide financial statements are required to also include legally separate entities (if any) for which the
City is financially accountable. The City does not have any such entity that is required to be included as a
“component unit” in its financial statements.
Fund Financial Statements
Another major section of the basic financial statements is the fund financial statements. These statements are on
pages 24 to 33. The fund financial statements provide detailed information about each of the City’s most significant
funds, called “major funds”. The city has four “major funds”, two governmental-type and two business type. The
major governmental-type funds are the General Fund and Capital Projects Fund. The business-type major funds are
the Water and Electric Utility and the Sanitary Sewer Utility. All “non-major” funds are summarized and presented
in a single column.
The City has three kinds of funds:
Governmental funds – Most of the City’s basic services are included in governmental funds. These fund
statements are prepared on a modified accrual basis. Governmental funds are used to account for
essentially the same functions as governmental activities in the government-wide financial statements.
However, unlike the government-wide financial statements, governmental fund financial statements focus
on near-term inflows and outflows of spendable resources, as well as on balances of spendable resources
available at the end of the fiscal year. Such information may be useful in evaluating a government’s near-
term financing requirements. Capital assets and other long-lived assets, along with long-term liabilities, are
not presented in the governmental fund statements. Because this information does not encompass the long-
term focus of the government-wide financial statements, additional information is provided on pages 25 to
27 to explain the differences between them.
Proprietary funds – These statements include both enterprise funds and internal service funds. Statements
are prepared on the full accrual basis and include all their assets and liabilities, current and long-term. This
is the same basis used in the government-wide financial statements.
Fiduciary funds - These statements include activity of funds that report trust responsibilities of the City.
These funds are summarized by type: pension, other employee benefit, private purpose trust and agency
funds. These assets are restricted in purpose and do not represent discretionary assets of the City.
Therefore, these assets are not presented as a part of the government-wide financial statements.

11
Schedule of Net Position
The following table reflects the condensed schedule of net position as of September 30, 2016 and 2015:
A review of the government-wide financial statement of net position reveals the following:
In fiscal year 2015, the City adopted GASB Statements No. 68 and No. 71 which established standards for
measuring and recognizing liabilities, deferred outflows and inflows of resources and expenses related to pension
plans. The City reported a net pension liability on the Statement of Net Position and related deferred outflows and
inflows of resources related to its defined benefit plan with the Missouri Local Government Employees Retirement
System (LAGERS) and two single employer defined benefit plans for police and firemen. The net pension liability
for LAGERS as of September 30, 2016 was approximately $14.2 million and the liability as of September 30, 2016
for the single employer plans for police plan and firemen’s plan was approximately $113.8 million.
Total assets for the City as a whole are $1,425,224,986, an increase of $14,088,120. This is due primarily to a
decrease in the bond covenant account cash of $12,218,320 and net additions to capital assets during the year of
$11,488,220 for governmental activities, and $14,513,062 for business-type activities.
Overall the City experienced an increase in total liabilities of $15,689,280, from $536,787,720 to $552,477,000
primarily due to an increase in net pension liability.
Total long-term liabilities increased $17,833,675 from $500,370,962 to $518,204,637. Long-term liabilities in
governmental activities increased $21,340,473 primarily due to an increase in net pension liability and long-term
liabilities in business-type activities decreased $3,506,798 due to a reduction in bonds payable.
Governmental net investment in capital assets increased $19,951,855, from $359,339,161 to $379,291,016 primarily
due to capitalizing projects that have been completed.
Net investment in capital assets for business-type activities increased by $13,397,720, from $352,395,872 to
$365,793,592. Total restricted net position decreased $6,839,444 and unrestricted net position increased $5,042,073.
2016 2015 2016 2015 2016 2015
Current and other assets $ 158,365,606 163,755,657 $ 225,228,044 231,751,155 $ 383,593,650 395,506,812
Capital assets 407,757,558 396,269,338 633,873,778 619,360,716 1,041,631,336 1,015,630,054
Total assets 566,123,164 560,024,995 859,101,822 851,111,871 1,425,224,986 1,411,136,866
Deferred Outflows of Resources 37,471,696 12,465,488 29,670,458 17,954,507 67,142,154 30,419,995
Long-term liabilities 160,005,089 138,664,616 358,199,548 361,706,346 518,204,637 500,370,962
Other liabilities 10,223,620 10,944,320 24,048,743 25,472,438 34,272,363 36,416,758
Total liabilities 170,228,709 149,608,936 382,248,291 387,178,784 552,477,000 536,787,720
Deferred Inflows of Resources 10,632,856 9,309,998 3,490,522 1,244,585 14,123,378 10,554,583
Net position
Net investment in capital assets 379,291,016 359,339,161 365,793,592 352,395,872 745,084,608 711,735,033
Restricted 75,639,922 84,328,836 21,988,771 20,139,301 97,628,693 104,468,137
Unrestricted (32,197,643) (30,096,448) 115,251,104 108,107,836 83,053,461 78,011,388
Total net position $ 422,733,295 413,571,549 $ 503,033,467 480,643,009 $ 925,766,762 894,214,558
City of Columbia's Net Position
Governmental
Activities
Business-type
Activities Total

12
Schedule of Activities
The following table reflects the revenues and expenses for the City’s activities for the years ended September 30,
2016 and 2015:
The government-wide statement of activities indicates the major sources of program revenues are charges for
services, which increased by $12,016,617 or 5.5% mostly due to an increase in business activities of $11,470,466.
This is largely due to increased revenues in the electric utility due to a 3.5% customer increase along with mild
weather conditions.
Total revenues increased $13,763,222, or 4.2%, for 2016. The largest increase, $12,016,617, was in charges for
services. Operating grants and contributions for fiscal year 2016 decreased $1,385,137, or 14.5%, due mostly to the
decrease in County revenues in Public Safety Joint Communications expense decreases as they transition to the
county, thus decreasing revenues as well. Governmental activities miscellaneous revenues experienced an increase
of 30.7% due to a one time billing of approximately $483,000 to Columbia Public Schools for their contribution to a
capital project.
Sales tax is the most significant revenue of the governmental activities. The city receives voter approved sales tax
revenue of 1% for general revenue, .5% for transportation, .25% for capital improvements and .25% for parks.
Amounting to $47,165,825 in 2016, sales tax revenue represents 63% of the total $74,944,432 general revenue for
governmental activities. This is a decrease of $8,948 in sales tax revenue over 2015 revenue. Staff continues to
closely monitor the monthly sales tax files provided by the state.
On August 2, 2016 voters approved a temporary increase in the gross receipts license tax on hotels and motels from
4% to 5% effective January 1, 2017. The additional tax collected is to be used for planning and constructing airport
terminal improvements. The rate will be reduced from 5% to 4% on or before January 1, 2040.
City of Columbia's Schedule of Activities
Governmental Business-type
Activities Activities Total
2016 2015 2016 2015 2016 2015
Revenues:
Program revenues:
Charges for services $ 19,984,691 19,438,540 $ 211,903,848 200,433,382 $ 231,888,539 219,871,922
Grants and contributions 5,585,621 7,049,014 2,557,913 2,479,657 8,143,534 9,528,671
Capital grants and contributions 8,419,494 5,301,736 9,029,170 8,119,011 17,448,664 13,420,747
General revenues:
Property taxes 7,898,843 7,572,050 - - 7,898,843 7,572,050
Sales tax 47,165,825 47,174,773 - - 47,165,825 47,174,773
Other taxes 14,864,794 15,559,138 - - 14,864,794 15,559,138
Investment revenue 2,744,200 3,462,509 4,433,709 5,209,590 7,177,909 8,672,099
Other 2,270,770 1,737,308 2,598,540 2,157,488 4,869,310 3,894,796
Total revenues 108,934,238 107,295,068 230,523,180 218,399,128 339,457,418 325,694,196
Expenses:
Policy development and admin. 30,623,152 24,465,111 - - 30,623,152 24,465,111
Public safety 42,145,164 42,482,569 - - 42,145,164 42,482,569
Transportation 14,525,441 15,600,627 - - 14,525,441 15,600,627
Health and environment 10,931,589 10,769,579 - - 10,931,589 10,769,579
Personal development 8,971,813 8,968,495 - - 8,971,813 8,968,495
Interest on long-term debt 978,720 1,710,708 - - 978,720 1,710,708
Electric Utility - - 116,326,371 115,496,885 116,326,371 115,496,885
Water Utility - - 19,797,334 18,045,445 19,797,334 18,045,445
Sanitary Sewer Utility - - 18,488,108 17,651,612 18,488,108 17,651,612
Regional Airport - - 3,776,315 3,469,327 3,776,315 3,469,327
Public Transportation - - 8,202,880 7,830,577 8,202,880 7,830,577
Solid Waste Utility - - 19,864,870 15,844,537 19,864,870 15,844,537
Parking Facilities - - 3,220,290 3,244,277 3,220,290 3,244,277
Recreation Services - - 7,255,936 6,859,026 7,255,936 6,859,026
Railroad - - 1,027,458 983,603 1,027,458 983,603
Transload - - 339,835 582,750 339,835 582,750
Storm Water Utility - - 1,429,937 1,544,375 1,429,937 1,544,375
Total expenses 108,175,879 103,997,089 199,729,335 191,552,414 307,905,214 295,549,503
Increase in net position before
transfers 758,359 3,297,979 30,793,845 26,846,714 31,552,204 30,144,693
Transfers 8,403,387 7,743,778 (8,403,387) (7,743,778) - -
Increase in net position 9,161,746 11,041,757 22,390,458 19,102,936 31,552,204 30,144,693
Net position, beginning 413,571,549 402,529,792 480,643,009 461,540,073 894,214,558 864,069,865
Net position, ending $ 422,733,295 413,571,549 $ 503,033,467 480,643,009 $ 925,766,762 894,214,558

13
Investment revenue for both governmental activities and business-type activities decreased by a total of $1,494,190,
due to unfavorable market conditions for the year ending September 30, 2016.
Seven of the eleven business-type activities show program revenue in excess of expenses. The City budgets for
subsidies or transfers to the Public Transportation, Recreation Services and Airport Funds. The City maintains
appropriate reserves in all of the business-type funds.
Total program expenses for FY 2016 are $307,905,214, an increase of $12,355,711. The majority of these expenses,
$199,729,335, are for business-type activities. Business-type activity expenses increased $8,176,921, or 4.3%. The
most significant increase was in the Solid Waste utility where operating expenses increased $4,101,756 due
primarily to an increase in the recognition of Closure and Post Closure Cost which resulted in an expense of
$2,690,137. Governmental activities increased $4,178,790, or 4% with the largest increase being in Policy
Development and Administration due to increased pension expense for Police and Fire.
Net transfers from business-type activities to governmental activities were $8,403,387. However, the City
transferred over $6.7 million in general funds, transportation sales tax and parks sales tax funds to support the
operations of various business-type activities. For purposes of the government-wide financial statements, over $15
million in payment in lieu of tax funds that are paid by the Water and Electric Utilities to the general fund are
included as transfers. Detail of individual transfers can be found in the notes to the financial statements.
Fund Statements
The City’s fund statements can be found on pages 24 to 33 of the basic financial statements. A reconciliation to the
government-wide financial statements has been provided with these fund statements.
As noted earlier, the City uses fund accounting to ensure and demonstrate compliance with finance related legal
requirements. The focus of the City’s governmental funds is to provide information on near-term inflows, outflows,
and balances of spendable resources. Such information is useful in assessing the City’s financing requirements. In
particular, unassigned fund balance may serve as a useful measure of a government’s net resources available for
spending at the end of the fiscal year. The City’s proprietary funds provide the same type of information found in
the government-wide financial statements, but show more detail.
The proprietary funds ended FY 2016 with an increase in net position due in part to the completion of several
capital projects which caused capital assets to increase from $619,360,716 in FY15 to $633,873,778 in FY16, and
the change in the GASB 68 pension liability which caused the deferred outflow of resources to increase from
$17,954,507 in FY15 to $29,670,458 in FY16.
The governmental funds ended FY 2016 with a decrease in fund balance due in part to a capital projects fund
balance decrease due to capital projects being finished and closed.

14
General Fund
The unassigned general fund balance is $29,245,964. This is 36.6% of expenditures and transfers of $79,972,309,
well above the 20% target set by Council policy in August 2012. Care is taken to identify capital or other one-time
uses of fund balance when the amount of appropriated fund balance increases substantially.
Overall revenues and transfers into the general fund were below the budgeted amount by $1,392,974. Revenue from
other governmental units was below budget by $815,127, while sales tax receipts were $460,171 below budget and
fees and service charge revenue was $761,893 above budget. As shown on page 101, for budgeting purposes,
Payment in Lieu of Tax from the Water & Electric fund is treated as revenue, while generally accepted accounting
principles require that it be recognized as a transfer from other funds. General fund revenues excluding appropriated
fund balance and transfers decreased $977,948 or (-1.6%). The overall property tax rate remained constant at 41
cents for every $100 of assessed value.
General fund expenditures and transfers out were $11.2 million under budget. Of the $11.2 million, there were $2.7
million in encumbrances and projects of $2.0 million not encumbered which will be spent in FY17, leaving 6.5
million under budget. General fund expenditures, including transfers, decreased $7,270,698 or (8.3%). Also, there
was a decrease in Miscellaneous Non-programmed expenses of $5.3 million due to an appropriation in Sept 2015 for
a one time Police and Fire retirement Employer contribution.
$0
$2
$4
$6
$8
$10
$12
$14
$16
$18
$20
$22
$24
$26
$28
Pro
pe
rty T
axe
s
Sa
les T
axe
s
Oth
er L
oca
l Ta
xe
s
Lic
en
se
s a
nd
Pe
rmits
Fin
es
Fe
es a
nd
Se
rvic
eC
ha
rge
s
Intra
go
ve
rnm
en
tal
Re
ve
nu
e
Re
ve
nu
e fro
m O
the
rG
ov. U
nits
Inve
stm
en
t Inco
me
(loss)
Mis
ce
llan
eo
us R
eve
nu
e
Tra
nsfe
rsM
illio
ns
General Fund Revenues
2015 2016

15
The total fund balance of non-major governmental funds decreased by $2,198,146 due in part to a decrease in the
debt service funds caused by paying off the 2006B SO bond as well as an advanced refunding of the 2008B SO
bond.
$0
$5
$10
$15
$20
$25
$30
$35
$40
$45
PolicyDevelopment
andAdministration
Public Safety Transportation Health andEnvironmental
PersonalDevelopment
MiscellaneousNon-
Programmed
Debt Service
Mil
lio
ns
General Fund Expenditures
2015 2016

16
Enterprise Funds
A review of the net position of the proprietary funds indicates that all funds have positive unrestricted net position
except the Transload fund. Operating revenues increased for the City’s enterprise funds in FY 2016 by 5.73% and
operating expenses decreased by 4.77%, respectively. The change in net position of $21,298,649 was an increase of
$1,736,690. The City’s enterprise funds continue to experience limited growth in customer base. Two of the City’s
internal service funds experienced a loss for FY 2016. The losses were budgeted as the accumulated balances were
above those required to operate on a break even basis.
In FY16, there were no rate increases for water, electric, sewer or trash. The only residential rate increase for FY
2016 was a 25% storm water increase which was approved by the voters in April of 2015. Columbia continues to
have very competitive utility rates for our region.
Budget Variances
It is the City's policy to allow departments to carry forward the budget allocation for project funds or for items that
are encumbered at fiscal year end. The FY 2016 final budget for the general fund includes approximately $2.3
million of encumbered funds carried forward from FY 2015. An increase of approximately $2.9 million in the FY
2016 budget was in part for grants, surplus funds and contributions appropriated during the year, which also in part
increased the general fund revenue budget in FY 2016.
Overall, the general fund ended FY 2016 with favorable budget variances for revenues, expenditures and transfers of
$9.8 million. Sales tax revenue ended the year with a 1.93% unfavorable variance. Other local tax revenues fell
short of budget projections by $1,051,034 and revenue from other governmental units (grants) fell short of budget
projections by $815,127.
General fund expenditures and transfers out were $11.2 million under budget for FY 2016.
$0
$20
$40
$60
$80
$100
$120
$140
$160
$180
$200
$220
$240
Operating Revenue Operating Expenses Net Income
Mil
lio
ns
Enterprise Funds
2016 2015

17
Capital Assets
Major Capital Asset Events Fiscal Year 2016
The enterprise resource planning software project continued with the new payroll system going into
production on January 1, 2016. The new utility billing software came on-line in August 2016 with more
modules to follow shortly.
Major exterior improvements were made to the Walton Building (home of Convention and Tourism).
A replacement pumper truck was purchased for the Fire Department at a cost of about $750,000
Land was purchased for a future Municipal Service Center in North Columbia
Hominy Branch Outfall Relief sewer project was completed at a cost of $3.8 million
Reconstruction was completed on the Airport’s Crosswind Runway project at a cost of $5.3 million. This
project was 90% funded by an FAA grant.
Additional information on the City’s capital assets can be found in Note VI on pages 59-61 of the footnotes of this
report.
Debt Administration
The City’s debt issues are discussed in Note IX on pages 66-79 of this report. Please refer to it for additional
information.
In December of 2015 the City issued $7,080,000 in Special Obligations Bonds, these funds were used to refund the
2006 Special Obligation Bonds. Both the refunding and the defeased issue have a 2026 maturity date. Total debt
service requirements were reduced by $2,667,087 with the refunding.
In July 2016 the City issued $17,580,000 Special Obligation Refunding Bonds to advance refund the 2008B Special
Obligation Improvement Bonds. Both the refunding issue and the defeased issue have a 2028 maturity date. Total
debt service requirements were reduced by $4,640,040 with this refunding.
Governmental Business-type
Activities Activities Total
2016 2015 2016 2015 2016 2015
Land $ 47,912,053 46,747,583 $ 22,047,358 21,487,681 $ 69,959,411 68,235,264
Buildings 53,160,149 54,546,280 - - 53,160,149 54,546,280
Improvements other than buildings 33,032,861 29,170,405 - - 33,032,861 29,170,405
Structures and improvements - - 334,014,177 320,954,510 334,014,177 320,954,510
Furniture, fixtures and equipment 15,417,123 16,651,829 262,225,860 248,785,794 277,642,983 265,437,623
Infrastructure 232,434,018 234,234,850 - - 232,434,018 234,234,850
Construction in progress 25,801,354 14,918,391 15,586,383 28,132,731 41,387,737 43,051,122
Total $ 407,757,558 396,269,338 $ 633,873,778 619,360,716 $ 1,041,631,336 1,015,630,054
City of Columbia Capital Assets
(net of accumulated depreciation)

18
FY 2016 FY 2015
Governmental Activities
Special Obligation Bonds/Notes $ 29,879,526 $ 36,896,045
$ 29,879,526 $ 36,896,045
Business-type Activities
Revenue Bonds $ 251,018,822 $ 261,979,540
Special Obligation Bonds 91,569,509 96,831,150
$ 342,588,331 $ 358,810,690
City of Columbia Net Outstanding Debt
Fiscal Year 2017 Budget
There are no proposed City tax increases for FY 2017 and no rate increases for gross receipts. In our business-type
activities, rate increases include Water (2% operating rate increase), Electric (2% operating rate increase), Solid
Waste (rate increase for commercial services and landfill fee increases), Sewer (4% voter approved and 1%
operating rate increase to base and volume charges), and Storm Water (25% utility rate increase passed by the voters
in April 2015).
The City is projecting a 1.0% increase in sales taxes for FY 2017.
An across the board (ATB) pay increase for permanent positions of $0.25/hour or $0.1786/hour for Firefighters for
those not at or above the maximum of their job class is included in FY 2017. The pay increase will not cover all of
the health insurance increases.
Overall there is a 29.00 net FTE increase in positions for FY 2017 with a net of 6.70 FTE positions added in the
general Fund and a net of 22.30 FTE positions added in other funds.
Financial Contact
The City’s financial statements are designed to present users (citizens, taxpayers, customers, investors and creditors)
with a general overview of the City’s finances and to demonstrate the City’s accountability. Any questions
regarding the report or request for additional information should be directed to the Director of Finance, 701 East
Broadway, Columbia, Missouri 65201. Financial reports may also be found on the City’s web site at
www.como.gov.

CITY OF COLUMBIA, MISSOURI
BASIC FINANCIAL STATEMENTS

CITY OF COLUMBIA, MISSOURI
STATEMENT OF NET POSITION
SEPTEMBER 30, 2016
Governmental Business-type
Activities Activities Total
ASSETS
Cash and investments 106,987,789$ 90,996,677$ 197,984,466$
Receivables (net of allowance
for uncollectibles) 28,326,745 31,868,654 60,195,399
Due from fiduciary fund 1,735,990 - 1,735,990
Internal balances 5,434,456 (5,434,456) -
Inventories 1,253,259 6,844,761 8,098,020
Prepaid items 69,693 92,185 161,878
Other postemployment benefit (OPEB) asset 855,612 - 855,612
Other assets 53,632 - 53,632
Restricted assets:
Cash and investments 11,663,141 - 11,663,141
Bond covenant account cash and investments - 90,982,611 90,982,611
Closure and postclosure reserve - 2,690,137 2,690,137
Customer security and escrow deposits - 5,859,489 5,859,489
Grants receivable 1,985,289 1,327,986 3,313,275
Capital assets:
Non depreciable 73,713,407 37,633,741 111,347,148
Depreciable, net 334,044,151 596,240,037 930,284,188
Total Assets 566,123,164 859,101,822 1,425,224,986
DEFERRED OUTLOWS
Deferred outflow related to pension 36,048,580 20,009,786 56,058,366 Deferred charge on refundings of debt 1,423,116 9,660,672 11,083,788
Total deferred outflows 37,471,696 29,670,458 67,142,154
LIABILITIES
Accounts payable 5,485,141 5,618,953 11,104,094
Accrued payroll and payroll taxes 2,092,073 1,362,821 3,454,894
Accrued interest payable 91,455 4,693,544 4,784,999
Due to other governments - 490,408 490,408
Unearned revenue 198,107 533,040 731,147
Construction contracts payable - 4,853,231 4,853,231
Customer security and escrow deposits - 5,878,930 5,878,930
Other liabilities 2,356,844 617,816 2,974,660
Long-term liabilities:
Due within one year:
Accrued compensated absences 2,774,595 1,518,663 4,293,258
Revenue bonds payable - 10,737,000 10,737,000
Special obligation bonds and notes payable 3,294,772 2,750,000 6,044,772
Capital lease obligation 10,132 72,643 82,775
Claims payable - health insurance 1,075,710 - 1,075,710
Claims payable - workers' compensation
and general liability 2,279,489 - 2,279,489
Due in more than one year:
Accrued compensated absences 1,499,041 818,754 2,317,795
Revenue bonds payable - 240,281,822 240,281,822
Special obligation bonds and notes payable 26,584,754 88,819,509 115,404,263
Capital lease obligation - 653,034 653,034
Claims payable - workers' compensation
and general liability 4,222,387 - 4,222,387
Net pension liability 118,264,209 9,857,986 128,122,195
Other long-term liabilities - 2,690,137 2,690,137
Total Liabilities 170,228,709 382,248,291 552,477,000
DEFERRED INFLOWS
Inflows related to pension 2,895,627 3,353,938 6,249,565
Deferred gain on refunding of debt - 136,584 136,584
Property taxes 7,737,229 - 7,737,229
Total deferred inflows 10,632,856 3,490,522 14,123,378
NET POSITION
Net investment in capital assets 379,291,016 365,793,592 745,084,608
Restricted for:
Debt service 1,360,739 18,153,670 19,514,409
Capital projects 33,388,328 1,327,986 34,716,314 Permanent Fund: Nonexpendable 1,500,000 - 1,500,000 Expendable 7,438,759 - 7,438,759 Statutory restrictions 31,952,096 2,507,115 34,459,211
Unrestricted (32,197,643) 115,251,104 83,053,461 Total Net Position 422,733,295$ 503,033,467$ 925,766,762$
The notes to the financial statements are an integral part of this statement.
21

CITY OF COLUMBIA, MISSOURI
STATEMENT OF ACTIVITIES
FOR THE YEAR ENDED SEPTEMBER 30, 2016
Program Revenues
Operating
Charges for Grants and
Expenses Services Contributions
Functions/Programs
Governmental activities:
Policy development and administration 30,623,152$ 13,138,620$ 215,233$
Public safety 42,145,164 2,041,378 996,335
Transportation 14,525,441 56,135 1,386,683
Health and environment 10,931,589 4,748,558 2,945,584
Personal development 8,971,813 - 41,786
Interest on long-term debt 978,720 - -
Total governmental activities 108,175,879 19,984,691 5,585,621
Business-type activities:
Electric Utility 116,326,371 129,693,077 -
Water Utility 19,797,334 26,050,798 -
Sanitary Sewer Utility 18,488,108 22,771,018 -
Regional Airport 3,776,315 712,502 183,558
Public Transportation 8,202,880 2,031,376 2,305,196
Solid Waste Utility 19,864,870 20,031,354 62,689
Parking Facilities 3,220,290 4,154,260 -
Recreation Services 7,255,936 4,243,961 6,470
Railroad 1,027,458 331,815 -
Transload 339,835 256,693 -
Storm Water Utility 1,429,937 1,626,994 -
Total business-type activities 199,729,335 211,903,848 2,557,913
Total City 307,905,214$ 231,888,539$ 8,143,534$
General revenues:
Property taxes
Sales tax
Gasoline tax
Cigarette tax
Motor vehicle tax
Utilities tax
Gross receipts tax
Investment revenue
Miscellaneous
Transfers
Total general revenues and transfers
Change in net position
Net position - beginning
Net position - ending
The notes to the financial statements are an integral part of this statement.
22

Program Net (Expense) Revenue and
Revenues Changes in Net Position
Capital
Grants and Governmental Business-type
Contributions Activities Activities Total
-$ (17,269,299)$ -$ (17,269,299)$
11,514 (39,095,937) - (39,095,937)
5,599,135 (7,483,488) - (7,483,488)
1,711,395 (1,526,052) - (1,526,052)
1,097,450 (7,832,577) - (7,832,577)
- (978,720) - (978,720)
8,419,494 (74,186,073) - (74,186,073)
2,299,716 - 15,666,422 15,666,422
750 - 6,254,214 6,254,214
2,584,145 - 6,867,055 6,867,055
4,122,543 - 1,242,288 1,242,288
22,016 - (3,844,292) (3,844,292)
- - 229,173 229,173
- - 933,970 933,970
- - (3,005,505) (3,005,505)
- - (695,643) (695,643)
- - (83,142) (83,142)
- - 197,057 197,057
9,029,170 - 23,761,596 23,761,596
17,448,664$ (74,186,073) 23,761,596 (50,424,477)
7,898,843 - 7,898,843
47,165,825 - 47,165,825
2,884,004 - 2,884,004
544,198 - 544,198
1,400,290 - 1,400,290
7,480,427 - 7,480,427
2,555,875 - 2,555,875
2,744,200 4,433,709 7,177,909
2,270,770 2,598,540 4,869,310
8,403,387 (8,403,387) -
83,347,819 (1,371,138) 81,976,681
9,161,746 22,390,458 31,552,204
413,571,549 480,643,009 894,214,558
422,733,295$ 503,033,467$ 925,766,762$
The notes to the financial statements are an integral part of this statement.
23

CITY OF COLUMBIA, MISSOURI
BALANCE SHEET
GOVERNMENTAL FUNDS
SEPTEMBER 30, 2016
Major Funds Total
Capital Non-Major Governmental
General Projects Funds Funds
ASSETS
Cash and cash equivalents 31,685,775$ 34,435,040$ 17,368,523$ 83,489,338$
Accounts receivable, net 277,289 2,386,583 99,033 2,762,905
Due from other funds 2,729,746 - - 2,729,746
Due from Pension fund 1,735,990 - - 1,735,990
Taxes receivable, net 12,359,827 - 4,487,815 16,847,642
Grants receivable 149,711 - 522,632 672,343
Rehabilitation loans receivable, net - - 7,171,856 7,171,856
Accrued interest 55,876 56,564 200,730 313,170
Prepaid items 46,798 - 3,018 49,816
Inventory 329,996 - - 329,996
Advances to other funds - - 3,777,485 3,777,485
Other assets - current - - 53,632 53,632
Restricted assets:
Cash and cash equivalents - - 11,663,141 11,663,141
Grants receivable - 1,985,289 - 1,985,289
Total assets 49,371,008$ 38,863,476$ 45,347,865$ 133,582,349$
LIABILITIES
Accounts payable 2,443,729$ 2,064,172$ 106,482$ 4,614,383$
Accrued payroll and payroll taxes 1,764,408 8,836 32,045 1,805,289
Due to other funds - - 236,950 236,950
Advances from other funds - 329,000 - 329,000 Unearned revenue 198,107 - - 198,107
Other liabilities 2,210,091 - 103,468 2,313,559
Total liabilities 6,616,335 2,402,008 478,945 9,497,288
DEFERRED INFLOWS
Unavailable revenue-property taxes 7,805,029 - - 7,805,029
Unvailable revenue-grants 37,584 539,412 227,746 804,742
Total deferred inflows 7,842,613 539,412 227,746 8,609,771
FUND BALANCES
Nonspendable 376,794 - 1,503,018 1,879,812
Restricted - 33,388,328 32,933,023 66,321,351
Committed 2,995,787 2,533,728 9,996,941 15,526,456
Assigned 2,293,515 - 213,104 2,506,619
Unassigned 29,245,964 - (4,912) 29,241,052
Total fund balances 34,912,060 35,922,056 44,641,174 115,475,290
Total liabilities, deferred inflows of resources
and fund balances 49,371,008$ 38,863,476$ 45,347,865$ 133,582,349$
The notes to the financial statements are an integral part of this statement.
24

CITY OF COLUMBIA, MISSOURI
RECONCILIATION OF THE GOVERNMENTAL FUNDS BALANCE SHEET
TO THE STATEMENT OF NET POSITION
SEPTEMBER 30, 2016
Amounts reported for governmental activities in the statement of net position are different because:
Total fund balance - total governmental funds 115,475,290$
Capital assets used in governmental activities, including applicable
internal service funds, are not current financial resources, and
therefore, are not reported in the governmental funds.
Governmental capital assets 523,840,625$
Less accumulated depreciation (119,243,447)
404,597,178
Internal service funds are used by management to charge the costs of
custodial maintenance, information technology, public communications,
fleet operations, self insurance, and employee benefits; and, therefore,
the assets and liabilities of the internal service funds are included in
governmental activities in the statement of net position, net of capital assets. 20,522,775
(see page 50)
Certain deferred outflows and inflows of resources represent a consumption or
acquisition of net position in a future period and therefore are not reported in the funds.
Deferred charge on refundings of debt 1,423,116
Pension related outflows - Lagers 9,624,338
Pension related outflows - Police and Fire Fund 22,979,220
Pension related inflows - Lagers (1,850,712)
Pension related inflows - Police and Fire Fund (382,456)
Long-term liabilities, including special obligation bonds and notes, accrued
compensated absences and pension liabilities are not due and payable in
the current period and therefore, are not reported as liabilities in the
governmental funds.
Accrued compensated absences (3,799,044)$
Special Obligation Bonds, including unamortized bond premium (19,249,375)
Lemone Trust Note (5,806,420)
MTFC Loan (4,823,731)
Net pension liability - Lagers (3,233,569)
Net pension liability - Police and Fire (113,873,189)
Accrued interest payable (91,455)
(150,876,783)
Some of the City's revenues will be collected after year-end, but are not available soon enough to pay for the current period's expenditures, and therefore,
are reported as a deferred inflow of resources. 872,542
The OPEB asset reported in governmental activities is not a financial resource and
therefore is not reported in the funds 855,612
Internal service fund allocated to business type activities (506,825)
Net Position of Governmental Activities 422,733,295$
The notes to the financial statements are an integral part of this statement.
25

CITY OF COLUMBIA, MISSOURI
STATEMENT OF REVENUES, EXPENDITURES AND CHANGES IN FUND BALANCES
GOVERNMENTAL FUNDS
FOR THE YEAR ENDED SEPTEMBER 30, 2016
Major Funds Total
Capital Non-Major Governmental
General Projects Funds Funds
REVENUES
General property taxes 7,898,843$ -$ -$ 7,898,843$
Sales tax 23,321,470 - 24,346,267 47,667,737
Other local taxes 11,641,679 - 2,555,875 14,197,554
Licenses and permits 1,031,218 - - 1,031,218
Fines 1,805,859 - - 1,805,859
Fees and service charges 3,251,931 - 1,674,275 4,926,206
Intragovernmental revenue 4,407,469 - - 4,407,469
Revenue from other governmental units 4,119,790 6,955,561 3,312,764 14,388,115
Lease revenue - - 1,755,731 1,755,731
Investment revenue 699,133 961,667 682,139 2,342,939
Miscellaneous 1,215,312 917,119 138,339 2,270,770
Total Revenues 59,392,704 8,834,347 34,465,390 102,692,441
EXPENDITURES
Current:
Policy development and administration 10,397,355 - 2,275,952 12,673,307
Public safety 40,664,606 - - 40,664,606
Transportation 7,643,352 - 79,549 7,722,901
Health and environment 9,265,460 - 1,638,644 10,904,104
Personal development 7,702,207 - 145,817 7,848,024
Misc. nonprogrammed activities 272,656 - - 272,656
Capital outlay 1,744,541 20,990,373 - 22,734,914
Debt service:
Principal - - 8,508,973 8,508,973
Interest - - 1,209,593 1,209,593
Bond issuance and other costs - - 237,281 237,281
Total Expenditures 77,690,177 20,990,373 14,095,809 112,776,359
Excess (Deficiency) of Revenues
over Expenditures (18,297,473) (12,156,026) 20,369,581 (10,083,918)
OTHER FINANCING SOURCES (USES)
Transfers in 24,987,499 10,493,388 11,565,923 47,046,810
Transfers out (2,282,132) (1,511,322) (34,373,903) (38,167,357)
Proceeds of refunding bonds issued - - 17,580,000 17,580,000
Premium on refunding bonds issued - - 1,699,838 1,699,838
Payment to refunded bond escrow agent - - (19,039,585) (19,039,585)
Total Other Financing Sources (Uses) 22,705,367 8,982,066 (22,567,727) 9,119,706
Net Change in Fund Balances 4,407,894 (3,173,960) (2,198,146) (964,212)
FUND BALANCE - BEGINNING 30,504,166 39,096,016 46,839,320 116,439,502
FUND BALANCE - ENDING 34,912,060$ 35,922,056$ 44,641,174$ 115,475,290$
The notes to the financial statements are an integral part of this statement.
26

CITY OF COLUMBIA, MISSOURI
RECONCILIATION OF THE STATEMENT OF REVENUES,
EXPENDITURES, AND CHANGES IN FUND BALANCES OF GOVERNMENTAL FUNDS
TO THE STATEMENT OF ACTIVITIES
FOR THE YEAR ENDED SEPTEMBER 30, 2016
Amounts reported for governmental activities in the statement of activities are different because:
Net change in fund balances - total governmental funds (964,212)$
Governmental funds report capital outlays as expenditures. However, in the
statement of activities the cost of those assets is allocated over their estimated
useful lives and reported as depreciation expense. Additionally, contributions
of capital assets to the City are recorded as capital contributions on the Statement
of Activities. This is the amount by which capital outlays and capital contributions,
meeting the capitalization threshold, exceeded depreciation expense in the current
year. Details of the reported amounts are as follows:
Capital outlay 22,734,915
Net transfer from Internal Service fund 36,225
Capital contribution 11,514
Loss on disposal of capital assets (280,120)
Depreciation expense (10,816,245)
11,686,289
Revenues in the statement of activities that do not provide current financial resources
are not reported as revenues in the funds. (913,450)
The repayment of the principal of long-term debt consumes the current financial
resources of governmental funds. 6,314,473
Bond proceeds provide current financial resources to governmental funds; however
issuing debt increases long-term liabilities in the Statement of Net Position:
Issuance of 2016 Bonds (17,580,000)
Premium on Bonds Payable (1,699,838)
Unamortized charge on refunding 1,449,085
Payment for 2008 refunded bonds 19,785,000
1,954,247
Amortization of deferred outflow of resources resulting from deferred refunding loss. (29,302)
Amortized premium on Bonds Payable 196,884
In the Statement of Activities compensated absences is accrued whereas in the
Governmental Funds an expenditure is reported when due and matured. (628,083)
In the Statement of Activities interest is accrued whereas in the governmental funds
an expenditure is reported when due. 63,717
Some expenses reported in the Statement of Activities do not require the use of
current financial resources and therefore are not reported as expenditures in
governmental funds:
Pension related amounts, pension expense - Lagers (1,806,103)
Pension related amounts, pension expense - Police and Fire (7,612,788)
Change in other post employment benefit asset (obligation) 442,368
Change in internal service funds allocated to business-type activities (921,934)
Internal service funds are used by the City to charge the costs of custodial maintenance,
information technology, public communications, fleet operations, self insurance, and
employee benefits to individual funds. The net revenue of certain activities of
internal service funds is reported with governmental activities. (see page 51) 1,379,640
Change in net position of governmental activities 9,161,746$
The notes to the financial statement are an integral part of this statement.
27

STATEMENT OF NET POSITION
PROPRIETARY FUNDS
SEPTEMBER 30, 2016
Major Enterprise Funds Non-Major Total
Water and Sanitary Enterprise Enterprise Internal
Electric Utility Sewer Utility Funds Funds Service Funds
ASSETS
Current assets:
Cash and cash equivalents 49,256,229$ 14,932,483$ 25,542,171$ 89,730,883$ 23,463,478$
Investments - - - - 1,300,767
Receivables (net of allowance for uncollectibles) 24,342,315 1,790,610 3,144,323 29,277,248 455,730
Grants receivable - - 2,320,896 2,320,896 13,260
Accrued interest 172,060 69,930 80,293 322,283 38,066
Loans receivable from other funds 153,205 - - 153,205 -
Inventories 6,312,335 7,577 524,849 6,844,761 923,263
Prepaid items 14,273 5 77,892 92,170 19,892
Total current assets 80,250,417 16,800,605 31,690,424 128,741,446 26,214,456
Noncurrent assets:
Restricted assets:
Bond covenant account cash 62,699,173 25,727,216 2,556,222 90,982,611 - Closure and postclosure reserve - - 2,690,137 2,690,137 -
Customer security and escrow cash 4,097,150 1,110,528 651,811 5,859,489 -
Grants receivable - - 1,327,986 1,327,986 -
Total restricted assets 66,796,323 26,837,744 7,226,156 100,860,223 -
Loans receivable from other funds 2,553,934 - - 2,553,934 -
Capital assets:
Land 10,113,693 4,332,508 7,601,157 22,047,358 308,563
Structures and improvements 44,005,813 281,383,339 158,319,580 483,708,732 1,014,490
Improvements other than buildings - - - - 891,779
Furniture, fixtures and equipment 452,620,882 8,455,383 39,654,435 500,730,700 8,024,078
Construction in progress 6,483,601 5,180,750 3,922,032 15,586,383 -
Less accumulated depreciation (228,321,894) (72,031,022) (87,846,479) (388,199,395) (7,078,530)
Total capital assets (net of accumulated depreciation) 284,902,095 227,320,958 121,650,725 633,873,778 3,160,380
Total noncurrent assets 354,252,352 254,158,702 128,876,881 737,287,935 3,160,380
Total Assets 434,502,769 270,959,307 160,567,305 866,029,381 29,374,836
DEFERRED OUTFLOWS
Outflows related to pension 10,815,194 2,346,089 6,354,418 19,515,701 3,939,107
Deferred charge on refunding of debt 9,450,892 43,409 166,371 9,660,672 -
Total deferred outflows 20,266,086 2,389,498 6,520,789 29,176,373 3,939,107
LIABILITIES
Current liabilities:
Accounts payable 4,107,450 252,035 1,156,690 5,516,175 973,536
Accrued payroll and payroll taxes 677,931 148,637 508,315 1,334,883 314,722
Accrued compensated absences 866,216 161,894 462,887 1,490,997 334,044
Accrued sales taxes 490,206 - 202 490,408 -
Due to other funds 2,030,196 - 462,600 2,492,796 -
Loan payable to other funds - current maturities - - 153,205 153,205 -
Obligations under capital leases - - 72,643 72,643 10,132
Unearned revenue - - 533,040 533,040 -
Other liabilities 570,749 11,828 35,239 617,816 3,398,484
Construction contracts payable 2,170,814 1,151,672 1,530,745 4,853,231 -
Accrued interest 3,530,640 1,071,613 91,291 4,693,544 -
Revenue bonds payable - current maturities 5,690,000 5,047,000 - 10,737,000 -
Special obligation bonds payable - current maturities 1,370,000 510,000 870,000 2,750,000 -
Customer security and escrow deposits 4,097,150 1,124,252 657,528 5,878,930 -
Total current liabilities 25,601,352 9,478,931 6,534,385 41,614,668 5,030,918
Noncurrent liabilities:
Accrued compensated absences 467,995 87,467 251,028 806,490 180,478
Loans payable to other funds - - 2,553,934 2,553,934 -
Obligations under capital leases - - 653,034 653,034 -
Revenue bonds payable 150,978,102 89,303,720 - 240,281,822 -
Special obligation bonds payable 61,190,922 4,940,331 22,688,256 88,819,509 -
Advances from other funds - - 3,448,485 3,448,485 -
Other long-term liabilities - - 2,690,137 2,690,137 4,222,387 Net pension liability 6,768,803 788,235 2,134,946 9,691,984 1,323,453
Total noncurrent liabilities 219,405,822 95,119,753 34,419,820 348,945,395 5,726,318
Total Liabilities 245,007,174 104,598,684 40,954,205 390,560,063 10,757,236
DEFERRED INFLOWS
Deferred gain on refunding of debt 136,584 - - 136,584 -
Inflows related to pension 1,585,865 451,141 1,221,922 3,258,928 757,469
Total deferred inflows 1,722,449 451,141 1,221,922 3,395,512 757,469
NET POSITION
Net investment in capital assets 123,253,109 143,314,726 99,225,757 365,793,592 3,150,248
Restricted for:
Debt service 9,402,803 7,897,078 853,789 18,153,670 -
Capital projects - - 1,327,986 1,327,986 -
Statutory restrictions 1,500,000 1,007,115 - 2,507,115 -
Unrestricted 73,883,320 16,080,061 23,504,435 113,467,816 18,648,990
Total Net Position 208,039,232$ 168,298,980$ 124,911,967$ 501,250,179 21,799,238$
Some amounts reported for business-type activities in the Statement of Net Position
are different because certain internal service fund assets and liabilities are included
with business-type activities. 1,783,288
Net position of business-type activities 503,033,467$
CITY OF COLUMBIA, MISSOURI
The notes to the financial statements are an integral part of this statement.
28
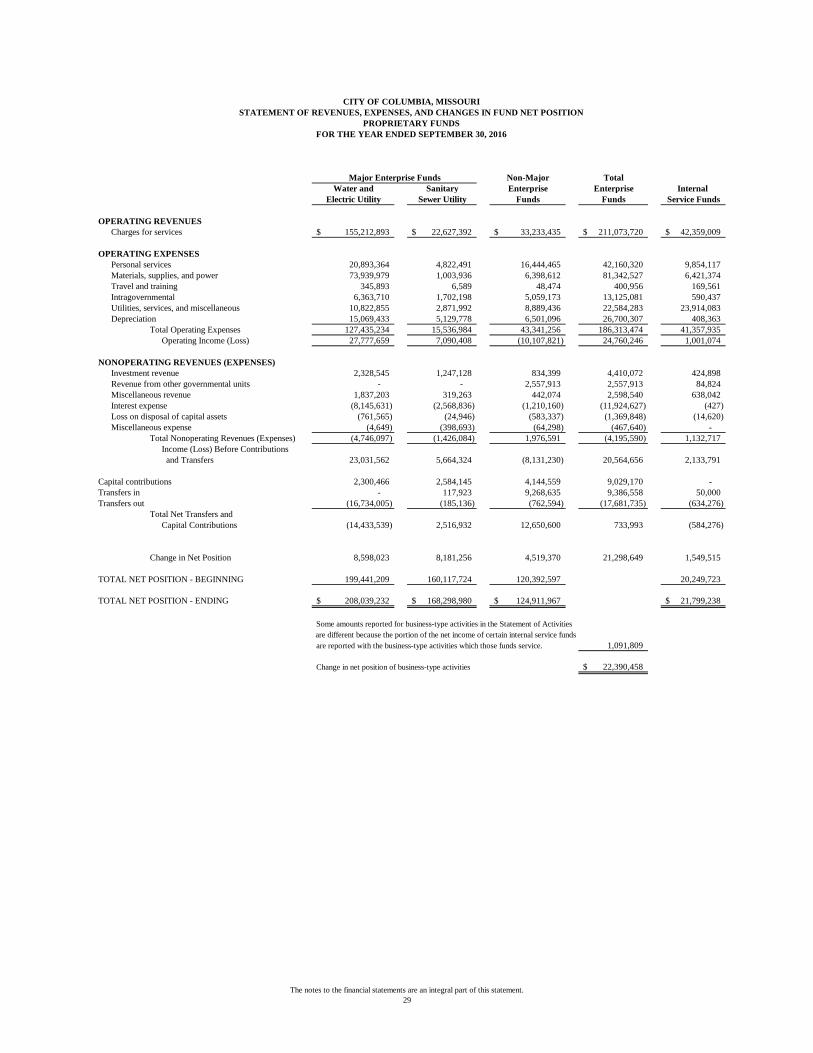
Major Enterprise Funds Non-Major Total
Water and Sanitary Enterprise Enterprise Internal
Electric Utility Sewer Utility Funds Funds Service Funds
OPERATING REVENUES
Charges for services 155,212,893$ 22,627,392$ 33,233,435$ 211,073,720$ 42,359,009$
OPERATING EXPENSES
Personal services 20,893,364 4,822,491 16,444,465 42,160,320 9,854,117
Materials, supplies, and power 73,939,979 1,003,936 6,398,612 81,342,527 6,421,374
Travel and training 345,893 6,589 48,474 400,956 169,561
Intragovernmental 6,363,710 1,702,198 5,059,173 13,125,081 590,437
Utilities, services, and miscellaneous 10,822,855 2,871,992 8,889,436 22,584,283 23,914,083
Depreciation 15,069,433 5,129,778 6,501,096 26,700,307 408,363
Total Operating Expenses 127,435,234 15,536,984 43,341,256 186,313,474 41,357,935
Operating Income (Loss) 27,777,659 7,090,408 (10,107,821) 24,760,246 1,001,074
NONOPERATING REVENUES (EXPENSES)
Investment revenue 2,328,545 1,247,128 834,399 4,410,072 424,898
Revenue from other governmental units - - 2,557,913 2,557,913 84,824
Miscellaneous revenue 1,837,203 319,263 442,074 2,598,540 638,042
Interest expense (8,145,631) (2,568,836) (1,210,160) (11,924,627) (427)
Loss on disposal of capital assets (761,565) (24,946) (583,337) (1,369,848) (14,620)
Miscellaneous expense (4,649) (398,693) (64,298) (467,640) -
Total Nonoperating Revenues (Expenses) (4,746,097) (1,426,084) 1,976,591 (4,195,590) 1,132,717
Income (Loss) Before Contributions
and Transfers 23,031,562 5,664,324 (8,131,230) 20,564,656 2,133,791
Capital contributions 2,300,466 2,584,145 4,144,559 9,029,170 -
Transfers in - 117,923 9,268,635 9,386,558 50,000
Transfers out (16,734,005) (185,136) (762,594) (17,681,735) (634,276)
Total Net Transfers and
Capital Contributions (14,433,539) 2,516,932 12,650,600 733,993 (584,276)
Change in Net Position 8,598,023 8,181,256 4,519,370 21,298,649 1,549,515
TOTAL NET POSITION - BEGINNING 199,441,209 160,117,724 120,392,597 20,249,723
TOTAL NET POSITION - ENDING 208,039,232$ 168,298,980$ 124,911,967$ 21,799,238$
Some amounts reported for business-type activities in the Statement of Activities
are different because the portion of the net income of certain internal service funds
are reported with the business-type activities which those funds service. 1,091,809
Change in net position of business-type activities 22,390,458$
CITY OF COLUMBIA, MISSOURI
STATEMENT OF REVENUES, EXPENSES, AND CHANGES IN FUND NET POSITION
PROPRIETARY FUNDS
FOR THE YEAR ENDED SEPTEMBER 30, 2016
The notes to the financial statements are an integral part of this statement.
29

CITY OF COLUMBIA, MISSOURI
STATEMENT OF CASH FLOWS
PROPRIETARY FUNDS
FOR THE YEAR ENDED SEPTEMBER 30, 2016
Major Enterprise Funds Non-major Total
Water and Electric Sanitary Sewer Enterprise Enterprise Internal
Utility Fund Utility Fund Funds Funds Service Funds
CASH FLOWS FROM OPERATING ACTIVITIES
Cash received from customers (including other funds) 153,910,597$ 22,974,344$ 33,140,254$ 210,025,195$ 42,476,021$
Cash received from other sources 1,837,203 319,263 442,074 2,598,540 638,042
Cash payments to suppliers (84,001,359) (3,825,729) (12,723,450) (100,550,538) (30,604,162)
Cash payments to employees (19,323,387) (4,521,021) (15,476,481) (39,320,889) (9,411,458)
Cash payments to other funds (6,363,710) (1,702,198) (5,763,073) (13,828,981) (590,437)
Cash received (payments) for other expenses 28,318 - 202 28,520 -
Net cash provided (used) for operating activities 46,087,662 13,244,659 (380,474) 58,951,847 2,508,006
CASH FLOWS FROM NONCAPITAL FINANCING ACTIVITIES
Transfers in - 117,923 9,268,635 9,386,558 50,000
Transfers out (16,734,005) (185,136) (762,594) (17,681,735) (634,276)
Payments of advances from other funds - - (533,898) (533,898) -
Revenue from other governmental units - - 1,019,217 1,019,217 101,769
Net cash provided (used) for noncapital financing activities (16,734,005) (67,213) 8,991,360 (7,809,858) (482,507)
CASH FLOWS FROM CAPITAL AND RELATED FINANCING ACTIVITIES
Proceeds from bonds and loans - 4,983,228 2,468,512 7,451,740 -
Debt service - interest payments (7,545,593) (2,715,889) (1,390,040) (11,651,522) (427)
Debt service - principal (7,435,652) (10,953,152) (5,247,163) (23,635,967) (24,001)
Acquisition and construction of capital assets (18,145,647) (7,905,308) (13,220,210) (39,271,165) (224,914)
Fiscal agent fees payments (4,694) (398,693) (64,298) (467,685) -
Capital contributions, cash - - 5,724,347 5,724,347 -
Net cash (used) for capital and related financing activities (33,131,586) (16,989,814) (11,728,852) (61,850,252) (249,342)
CASH FLOWS FROM INVESTING ACTIVITIES
Interest received 2,328,704 1,243,176 827,166 4,399,046 413,566
Purchase of investments - - - - (1,300,767) Sale of investments - - - - 4,862,414
Net cash provided for investing activities 2,328,704 1,243,176 827,166 4,399,046 3,975,213
Net increase (decrease) in cash and cash equivalents (1,449,225) (2,569,192) (2,290,800) (6,309,217) 5,751,370
CASH AND CASH EQUIVALENTS AT BEGINNING OF PERIOD 117,501,777 44,339,419 33,731,141 195,572,337 17,712,108
CASH AND CASH EQUIVALENTS AT END OF PERIOD 116,052,552$ 41,770,227$ 31,440,341$ 189,263,120$ 23,463,478$
Displayed as:
Cash and cash equivalents 49,256,229$ 14,932,483$ 25,542,171$ 89,730,883$ 23,463,478$
Restricted assets 66,796,323 26,837,744 5,898,170 99,532,237 -
116,052,552$ 41,770,227$ 31,440,341$ 189,263,120$ 23,463,478$
RECONCILIATION OF OPERATING INCOME (LOSS) TO NET CASH PROVIDED (USED) FOR OPERATING ACTIVITIES
Operating income (loss) 27,777,659$ 7,090,408$ (10,107,821)$ 24,760,246$ 1,001,074$
Adjustments to reconcile operating income (loss) to net cash provided (used)
for operating activities
Depreciation 15,069,433 5,129,778 6,501,096 26,700,307 408,363
Changes in assets and liabilities:
(Increase)/decrease in receivable (2,158,700) 56,898 (95,901) (2,197,703) (58,193)
(Increase)/decrease in loans receivable from other funds 70,808 - - 70,808 -
(Increase)/decrease in inventory 959,122 (3,860) (189,535) 765,727 (20,208)
(Increase)/decrease in prepaid items (4,006) 234 8,552 4,780 26,100
Increase/(decrease) in accounts payable 148,884 61,509 144,343 354,736 (27,791)
Increase/(decrease) in accrued payroll and payroll taxes (129,522) (121,924) (317,766) (569,212) (175,290)
Increase/(decrease) in accrued sales tax 28,318 - 202 28,520 -
Increase/(decrease) in due to other funds 389,592 - (703,900) (314,308) (3,298)
Increase/(decrease) in loans payable to other funds - - 2,720 2,720 -
Increase/(decrease) in other liabilities 399,372 288,959 2,649,712 3,338,043 (22,055)
Increase/(decrease) in claims payable - workers'
compensation and general liability and health insurance - - - - 123,313
Increase/(decrease) in pension related items 1,699,499 423,394 1,285,750 3,408,643 617,949
Other non-operating revenue 1,837,203 319,263 442,074 2,598,540 638,042
Net cash provided (used) for operating activities 46,087,662$ 13,244,659$ (380,474)$ 58,951,847$ 2,508,006$
NONCASH INVESTING AND CAPITAL AND RELATED FINANCING ACTIVITIES
Contributed water and sewer lines 2,300,466$ 2,584,145$ -$ 4,884,611$ -$
Change in fair value of investments and cash equivalents 202,843 71,482 29,526 303,851 75,971
Capital lease obligations - - - - 34,133
Contributions of capital assets from governments - - 1,579,788 - -
Construction contracts payable 2,170,814 1,151,672 1,530,745 4,853,231 -
Total noncash capital and related financing activities 4,674,123$ 3,807,299$ 3,140,059$ 10,041,693$ 110,104$
The notes to the financial statements are an integral part of this statement.
30

Pension and OPEB Private
Trust Purpose Agency
Funds Trust Fund Funds
ASSETS
Cash and cash equivalents 505,427$ 340,631$ 5,546,455$
Accounts receivable - - 126,905
Taxes receivable, net - - 3,955,104
Accrued interest 297,315 568 9,177
Other assets - 161,307 -
Investments:
Corporate bonds 22,802,346 - -
Common stock and mutual funds 71,518,183 - -
U.S. Government and agency securities 11,275,460 - -
Money market 6,611,464 - -
Asset-backed securities 9,242,450 - -
OPEB investments-money market funds 2,689,471 - -
Capital assets 11,687 - -
Accumulated depreciation (11,687) - -
Total Assets 124,942,116 502,506 9,637,641
LIABILITIES
Accounts payable - 10,961 237,602
Accrued payroll and payroll taxes 24,312 - -
Loan payable - 404,740 -
Due to other funds 1,735,990 - -
Due to other entities - - 3,949,689
Other liabilities - 1,230 5,450,350
Total Liabilities 1,760,302 416,931 9,637,641
NET POSITION
Net position held in trust 123,181,814 85,575
Total Net Position 123,181,814$ 85,575$
CITY OF COLUMBIA, MISSOURI
STATEMENT OF FIDUCIARY NET POSITION
FIDUCIARY FUNDS
SEPTEMBER 30, 2016
The notes to the financial statements are an integral part of this statement.
31

THIS PAGE INTENTIONALLY LEFT BLANK
32

CITY OF COLUMBIA, MISSOURI
STATEMENT OF CHANGES IN FIDUCIARY NET POSITION
FOR THE YEAR ENDED SEPTEMBER 30, 2016
Pension and OPEB Private
Trust Purpose
Funds Trust Fund
ADDITIONS
Contributions:
Chamber -$ 187,520$
City 9,038,442 46,000
County - 35,000
University - 35,000
Employee 1,553,634 -
Net investment revenue:
Interest and dividends (includes net appreciation
in fair value of investments, net of investment fees) 7,371,418 10,795
Miscellaneous - 146,943
Total Additions 17,963,494 461,258
DEDUCTIONS
Policy development and administration:
Materials and supplies - 15,395
Travel and training 4,576 19,010
Intragovernmental 48,306 -
Services and miscellaneous 63,145 475,423
Debt Service:
Interest expense - 21,695
Pension benefits 12,204,442 -
Refund of employees' contributions 243,453 -
Total Deductions 12,563,922 531,523
Change in net position 5,399,572 (70,265)
NET POSITION - BEGINNING 117,782,242 155,840
NET POSITION - ENDING 123,181,814$ 85,575$
FIDUCIARY FUNDS
The notes to the financial statements are an integral part of this statement.
33

THIS PAGE INTENTIONALLY LEFT BLANK
34

CITY OF COLUMBIA, MISSOURI
NOTES TO THE BASIC
FINANCIAL STATEMENTS
The Notes to the Basic Financial Statements include a summary of accounting policies that
are followed. They also include information used by the City that is judged to be the most
appropriate for full disclosure in the preparation of the financial statements.

CITY OF COLUMBIA, MISSOURI
Notes to the Basic Financial Statements
September 30, 2016
Index
Topic Page(s)
401(a) Retirement Plan 95
Adoption of New Accounting Pronouncements 48-49
Advance Refunding 80
Annual Pension Cost 82-98
Basis of Accounting 40-42
Bond Issuance Costs 48
Capital Assets 43, 59-61
Capital Lease Agreement 77-79
Capitalization of Interest 43
Changes in Long-term Liabilities 66-69
City of Columbia New Century Fund, Inc. 39
Columbia Housing Authority 39
Columbia Regional Library District 39
Commitments 61-62
Compensated Absences 44
Construction Commitments 61
Contingencies 82
Custodial credit risk 54
Debt Service Requirement to Maturity 69-76
Defeasance 80
Deferred Outflows and Inflows of Resources 47
Deferred Retirement Option Program 90-91
Deposits 51
Direct Loan Agreement - Missouri Transportation Finance Corporation 71-72
Employee Retirement Systems and Plans 82-98
Employees' Health Plan 81
Encumbrances 63
Equity in Pooled Cash and Investments, Cash, Investments, and Obligations Under
Reverse Repurchase Agreements 51-57
Financial Statement Presentation 40-41
Fund Balance Classifications 45
Fund Balance Policy 44
Funded Status 96
Funding Policy - Police and Fire Pensions 83-84
Future Accounting Pronouncements 47
Government-Wide and Fund Financial Accounting 39-40
Grants 82
Interfund Receivables, Payables, and Transfers 64-65
Intragovernmental Revenue 44
Inventories 42
Investments 52-57
Lagers Pension Plan 91-95
37

CITY OF COLUMBIA, MISSOURI
Notes to the Basic Financial Statements
September 30, 2016
Index
Topic Page(s)
Landfill Closure and Postclosure Care Costs 81-82
Legal Debt Margin 79
Litigation 82
Long-term Liabilities 66-68
Loss on Refunding 47
Measurement Focus 40-41
Minimum Fund Balance Policy 46
Miscellaneous Revenue 49
Municipal Court Traffic Violations Fines and Costs 49
Net Position 46
Obligation to Purchase Electric Power 61-62
Other Post Employment Benefits (OPEB) 95-98
Pension Trust Funds' Investments 43
Plan Descriptions - Deferred Retirement Option Program (DROP) 90-91
Plan Descriptions - LAGERS 91-95
Plan Descriptions - Police and Firefighter Pension 82-90
Pledged Revenues 79
Police and Fire Pension 82-90
Pollution Remediation Obligations 63
Pooled Cash and Marketable Securities 42
Post Employment Health Plan (PEHP) 95
Property Tax Revenue Recognition 44
Receivables and Payables 58
Reconciliation of Government-Wide and Fund Financial Statements 50
Reporting Entity 39
Reverse Repurchase Agreements 57
Risk Management 80-81
Sanitary Sewer Revenue Bonds 74-76
Self Insurance 80-81
Special Obligation Improvement Bonds-Series 2012A-1, Series 2012A-2, and 2009A 70-71
Special Obligation Notes-Series 2010 71
Special Obligation Refunding and Capital Improvement Bonds - Series 2015, 2006 and 2006B 72
Special Obligation Refunding and Capital Improvement Bonds - Series 2012 B, C, D, E, and 2016 70
Statement of Cash Flows 51
Statements of Changes in Fiduciary Net Position for the Firefighters and Police Retirement Funds 90
Statements of Fiduciary Net Position for the Firefighters’ and Police Retirement Funds 89
Statements of Changes in Fiduciary Net Position - OPEB 98
Statements of Fiduciary Net Position - OPEB 97
Stewardship, Compliance, and Accountability 51
Tax Bills Receivable 42
Unbilled Revenue 42
Use of Estimates 42
Water and Electric Revenue Bonds 72-73
38

CITY OF COLUMBIA, MISSOURI
Notes to the Basic Financial Statements
September 30, 2016
39 (Continued)
I. SUMMARY OF SIGNIFICANT ACCOUNTING POLICIES
The following is a summary of significant accounting policies employed in the preparation of the accompanying
basic financial statements.
A. Reporting Entity
The City of Columbia (the City) operates under a City Manager/Council, home rule charter form of government.
The City's Basic Financial Statements include the accounts of all City operations: Policy Development and
Administration, Public Safety, Transportation, Health and Environment, and Personal Development. Enterprise
operations owned by the City include a Water and Electric Utility, Sanitary Sewer Utility, Regional Airport, Public
Transportation System, Solid Waste Collection Operation, Parking Facilities, Recreation Services, Railroad System,
Transload Facility and Storm Water System.
The City's relationship to other legally separate organizations has been examined to determine if their inclusion in
the City's basic financial statements is necessary to fairly present the financial position and activities of the City. The
criteria used in this determination included an examination of the nature and significance of the organization's
relationship with the City, financial benefit or burden to the City, the ability of the City Council to appoint members
of the entity's governing board, and the level of influence the City has over the activities of the organization. Based
on these criteria, the following related organizations have been excluded from the accompanying financial
statements:
Columbia Regional Library District (Library District) - The City's Mayor appoints all members to the Library
District's board on a staggering-term basis (appointments do not correspond to the mayoral term), and a board
member cannot be removed except for specific acts (illegal acts, etc.). The Library District is able to establish and
approve its own budget and legally set its own tax rates. Therefore, although the City appoints all members of the
Library District's board, the entity is able to act independently without City oversight.
Columbia Housing Authority (Authority) – The relationship with this entity is similar to the Columbia Regional
Library District. The City's Mayor appoints members of the Authority's board with the same restrictions, and cannot
remove members without cause. The Authority establishes its own budgets, and is financed with federal funds and
rentals. Operations are administered by the Authority without City oversight.
City of Columbia New Century Fund, Inc. (Foundation) - The Foundation is a legally separate, tax-exempt entity
that acts primarily as a fund-raising organization to solicit contributions for the betterment of the City. The ten
member Board is appointed by the City Council to serve a three-year term. No board member is allowed to serve
more than two consecutive full terms on the Board. Although the City does not control the timing or amount of
receipts from the Foundation, the majority of resources, or incomes thereon that the Foundation holds and invests
are restricted to the activities of the City by the donors. However, the accumulation of restricted resources and the
support given during the current year are not significant to the City.
B. Government-Wide and Fund Financial Accounting
The government-wide financial statements (i.e., the statement of net position and the statement of activities) report
information on all of the non-fiduciary activities of the City. The effect of interfund activities has been removed
from these statements. Governmental activities, which normally are supported by taxes, intergovernmental
revenues, and other nonexchange transactions, are reported separately from business-type activities, which rely to a
significant extent on fees and charges to external parties.

CITY OF COLUMBIA, MISSOURI
Notes to the Basic Financial Statements
September 30, 2016
40 (Continued)
The statement of activities demonstrates the degree to which the direct expenses of a given function or segment is
offset by program revenues. Direct expenses are those that are clearly identifiable with a specific function or
segment. Program revenues include 1) charges to customers or applicants who purchase, use, or directly benefit
from goods, services, or privileges provided by a given function or segment and 2) grants and contributions that are
restricted to meeting the operational or capital requirements of a particular function or segment. Taxes and other
items not properly included among program revenues are reported instead as general revenues.
Separate financial statements are provided for governmental funds, proprietary funds, and fiduciary funds, even
though the latter are excluded from the government-wide financial statements. Major individual governmental funds
and major individual enterprise funds are reported as separate columns in the fund financial statements.
C. Measurement Focus, Basis of Accounting, and Financial Statement Presentation
The government-wide financial statements are reported using the economic resources measurement focus and the
accrual basis of accounting, as are the proprietary fund financial statements and the private purpose trust fund
financial statements. Agency funds adhere to the accrual basis of accounting and do not have a measurement focus.
Revenues are recorded when earned and expenses are recorded when a liability is incurred, regardless of the timing
of related cash flows. Property taxes are recognized as revenues in the year for which they are levied. Grants and
similar items are recognized as revenue as soon as all eligibility requirements imposed by the provider have been
met.
The financial statements for the pension and other post employment benefits trust funds are prepared using
economic resources measurement focus and the accrual basis of accounting. Plan member contributions are
recognized in the period in which the contributions are due. Employer contributions to each plan are recognized
when due, as the City has a formal commitment to provide the contributions. Benefits and refunds are recognized
when due and payable in accordance with the terms of each plan.
Governmental fund financial statements are reported using the current financial resources measurement focus and
the modified accrual basis of accounting. Revenues are recognized as soon as they are both measurable and
available. Revenues are considered to be available when they are collected within the current period or soon enough
thereafter to pay liabilities of the current period. For this purpose, the City considers revenues to be available if they
are collected within 60 days of the end of the current fiscal period. Expenditures generally are recorded when a
liability is incurred, as under accrual accounting. However, interest and principal on general long-term debt is
recognized when due, or when payments are due early in the next fiscal year, and the advance of resources to the
debt service fund is mandatory, and debt service expenditures are recognized before year-end to match the resources
provided for these payments.
Sales tax, gasoline tax, motor vehicle tax, interest, and revenues from other governmental units associated with the
current fiscal period are all considered to be susceptible to accrual and so they have been recognized as revenues of
the current fiscal period, when available. All other revenue items are considered to be measurable and available
only when cash is received by the government.
The City reports the following major governmental funds:
The general fund is the City’s primary operating fund. It accounts for all financial resources of the general
government, except those required to be accounted for in another fund.
The capital projects fund is used to account for and report financial resources that are restricted, committed, or
assigned to expenditure for capital outlays, including the acquisition or construction of capital facilities and other

CITY OF COLUMBIA, MISSOURI
Notes to the Basic Financial Statements
September 30, 2016
41 (Continued)
capital assets. Capital project funds exclude those types of capital related outflows financed by proprietary funds
or for assets that will be held in trust for individuals, private organizations, or other governments.
The City reports the following major proprietary funds:
The water and electric utility fund accounts for the billing and collection of charges for water and electric service
for most city residents. Revenues are used to pay for both operating expenses and capital expenditures to maintain
these services.
The sanitary sewer utility fund is used to account for the provision of sanitary sewer services to the residents of the
city and a limited number of customers outside the city limits. All activities necessary to provide such services are
accounted for in this fund.
Additionally, the City reports the following fund types:
Internal service funds account for custodial and maintenance services, utility customer services, information
technology, community relations, fleet operations, self-insurance reserves, geographic information systems (GIS)
and employee benefits for covered employees, provided to other departments or agencies of the City, or to other
governments, on a cost reimbursement basis.
The pension and other post employment benefits trust funds are used to account for the accumulation of resources
for pension benefit payments to qualified police and firefighter personnel and to account for the accumulation of
resources for post employment benefits to qualified plan participants.
The private purpose trust fund is used to account for resources held by the City as an agent to account for REDI
(Regional Economic Development, Inc.) transactions.
Special revenue funds are used to account for specific revenues that are legally restricted to expenditure for
particular purposes.
Agency funds account for resources held by the City in a trustee capacity.
The Permanent fund is used to report resources that are legally restricted to the extent that only earnings, not
principal, may be used for purposes that support the City’s programs.
Debt service funds are used to account for the accumulation of resources and payment of general and special
obligation bond principal and interest from governmental resources and special assessment bond principal and
interest from special assessment levies when the City is obligated in some manner for the payment.
The financial statements of the City have been prepared in conformity with accounting principles generally accepted
in the United States of America (U.S. GAAP) as applied to local governmental units. The Governmental
Accounting Standards Board (GASB) is the accepted standard-setting body for establishing governmental
accounting and financial reporting principles.
As a general rule, the effect of interfund activity has been eliminated from the government-wide financial statements
except for interfund services provided and used.
Proprietary funds distinguish operating revenues and expenses from nonoperating items. Operating revenues and
expenses generally result from providing services and producing and delivering goods in connection with a
proprietary fund’s principal ongoing operations. Federal S02 allowances that are sold represent allowances not

CITY OF COLUMBIA, MISSOURI
Notes to the Basic Financial Statements
September 30, 2016
42 (Continued)
required for use in the normal operation of the Electric Utility; therefore sales of allowances are classified as
nonoperating revenue.
D. Assets, Liabilities, Deferred Outflows/Inflows of Resources, and Net Position/Fund Balance
1. Pooled Cash and Marketable Securities
Cash resources of certain individual funds are combined to form a pool of cash and investments. All amounts of
pooled cash and investments are reported as cash and cash equivalents in the financial statements because the City is
able to withdraw cash at any time without prior notice or penalty. Interest income earned as a result of pooling is
distributed to the appropriate funds based on the ending monthly balance of cash and marketable securities of each
fund.
When a fund overdraws its share of pooled cash, the overdraft is reported as an interfund payable in that fund, and
an interfund receivable in the General Fund. At September 30, 2016, $65,745 had been reclassified due to fund
overdrafts in the Non Motorized Grant Special Revenue Fund, $85,139 had been reclassified due to fund overdrafts
in CDBG/HOME Special Revenue Fund, $1,735,990 had been reclassified due to fund overdrafts in Police and Fire
Retirement Fund and $462,600 had been reclassified due to fund overdrafts for Public Transportation Fund.
All City investments are reported at fair value in accordance with Governmental Accounting Standards Board
(GASB) Statement No. 72, Fair Value Measurement and Application, except for money market investments which
are reported at amortized cost.
Collateral is required for demand deposits and certificates of deposit. The fair value of the collateral must equal
100% of the value of the cash and investments in excess of deposit insurance. Obligations that may be pledged as
collateral are of the same type as authorized for investment by the City. All legal requirements relating to deposits
and investments were met during the year ended September 30, 2016.
Obligations pledged to secure deposits are delivered to the custodial bank. Written custodial agreements are
required that provide that the collateral securities be held separate from the assets of the custodial bank.
Repurchase agreements are purchased from brokers and local banks. Securities underlying a repurchase agreement
must have a fair value of at least 100% of the cost of the repurchase agreement. No substitution of securities is
permitted. Securities underlying overnight repurchase agreements are held as collateral in the Federal Reserve
Bank. For bank repurchase agreements, the securities are not held in the City's name but are pledged against the
repurchase agreement pool held by the dealer bank. For broker repurchase agreements, the securities are held in the
City’s name.
2. Unbilled Revenue
The City records as accounts receivable in the Enterprise Fund financial statements the amount of accrued, but
unbilled revenue for the Water and Electric Utility and Sanitary Sewer Utility Fund and non major Enterprise funds
Solid Waste and Storm Water Utility Fund, determined by prorating actual subsequent billings.
3. Tax Bills Receivable
Special assessment tax bills are sold at book value, without recourse, to the Designated Loan and Special Tax Bill
Investment Fund (a non-major governmental fund) when the special assessment project is completed. These tax
bills are reported as taxes receivable in the Designated Loan Fund.

CITY OF COLUMBIA, MISSOURI
Notes to the Basic Financial Statements
September 30, 2016
43 (Continued)
4. Inventories
Inventories are adjusted to annual and periodic physical counts and are valued at cost utilizing the following
methods of valuation:
General Fund - first-in, first-out
Enterprise Funds - weighted average and first-in, first-out
Internal Service Funds - first-in, first-out
The cost of governmental fund-type inventories are recorded as expenditures when consumed.
5. Capital Assets
Capital assets, which include property, plant, equipment, and infrastructure assets (e.g., roads, bridges, sidewalks,
and similar items), are reported in the applicable governmental or business-type activities columns in the
government-wide financial statements and in the proprietary fund financial statements. Capital assets are defined as
assets with an initial, individual cost of $5,000 or more and an estimated useful life in excess of one year. Such
assets are recorded at historical cost if purchased or constructed. Donated capital assets are recorded at acquisition
value at the date of donation.
In accordance with GASB Statement No. 34, general government infrastructure assets (streets, bridges, sidewalks)
have been capitalized retroactively to 1980 at historical cost.
The costs of normal maintenance and repairs that do not enhance functionality or materially extend the life of an
asset are not capitalized.
Capital assets, with two exceptions, are depreciated using the straight-line method over the following estimated
useful lives:
Buildings 40 years
Structures & Improvements 20-50 years
Air Easements 35 years
Mains & Sewers 99 years
Streets, Bridges, Sidewalks 50 years
Furniture and Other Equipment 10-20 years
Vehicles 2-10 years
Computer Equipment 5 years
Software 3 years
Net interest costs on funds borrowed to finance the construction of capital assets are capitalized and depreciated over
the life of the related asset for business-type activities and proprietary fund types. Interest is not capitalized for
governmental activities or governmental fund types within the fund financial statements. In fiscal year 2016, the
City capitalized $203,378 of interest in the business-type activities.
Water and Electric assets are depreciated using estimated useful lives established by the Federal Energy Regulatory
Commission. Landfill cells are depreciated using the units of consumption method.

CITY OF COLUMBIA, MISSOURI
Notes to the Basic Financial Statements
September 30, 2016
44 (Continued)
6. Property Tax Revenue Recognition
Property tax revenue is recognized independent of receivable recognition in the fiscal year for which the taxes have
been levied (budgeted). Delinquent taxes expected to be received later than 60 days after the close of the fiscal year
are classified as a deferred inflow of resources within the governmental fund financial statements.
The City's property tax is levied each December 31 on the assessed valuation of property located within the City as
of the preceding January 1, the lien date. Taxes are due in full on December 31, and become delinquent on
January 1. The delinquent penalty for 2016 was 9% in January, increased by 2% in each succeeding month up
through September for a maximum of 25%.
7. Intragovernmental Revenue
Several funds remit to the General Fund a budgeted fixed amount for management and accounting services rendered
by the General Fund.
8. Compensated Absences
All vested or accumulated vacation and scheduled holiday leave is accrued when incurred in the government-wide
and proprietary financial statements. Certain amounts have been recorded in the governmental fund financial
statements as part of accrued payroll and payroll taxes, since such amounts came due (matured) during the fiscal
year ended September 30, 2016.
9. Fund Balance
In the fund financial statements, fund balance is divided into five classifications based primarily on the extent to
which the City is bound to observe constraints imposed upon the use of the resources in the City governmental funds
which include the General Fund, the Capital Projects Fund and Non Major governmental funds (Special Revenue
and Debt Service Funds, for example). Amounts that are restricted to specific purposes either by a) constraints
placed on the use of resources by creditors, grantors, contributors, or laws or regulations of other governments or b)
imposed by law through constitutional provisions or enabling legislation are classified as restricted fund balances.
Amounts that can only be used for specific purposes pursuant to constraints imposed by the City Council through an
ordinance or resolution (which are equally binding) are classified as committed fund balances. Commitments may
be established, modified, or rescinded only through ordinances or resolutions approved by the City Council.
Amounts that are constrained by the City’s intent to be used for specific purposes but are neither restricted nor
committed are classified as assigned fund balances. The City has not established a policy regarding the assignment
of funds so assignments are made by City management based on Council direction. Non-spendable fund balances
include amounts that cannot be spent because they are either (a) not in spendable form (inventory and prepaid items)
or (b) legally or contractually required to be maintained intact. Unassigned fund balance is the residual
classification for the government's general fund and includes all spendable amounts not contained in the other
classifications. The general fund will be the only fund that reports a positive unassigned fund balance amount. In
the other governmental funds, if expenditures exceed the amounts restricted, committed or assigned to those
purposes, it may be necessary to report a negative unassigned fund balance.
When an expenditure is incurred in governmental funds which may be paid using either restricted or unrestricted
resources, the City’s policy is to pay the expenditure from the restricted fund balance and then from less-restrictive
classifications – committed, assigned and then unassigned fund balances.

CITY OF COLUMBIA, MISSOURI
Notes to the Basic Financial Statements
September 30, 2016
45 (Continued)
Below are the fund balance classifications for the governmental funds at September 30, 2016:
General Capital Non Major Total
Fund Projects Governmental Governmental
Fund Balances
Nonspendable:
Prepaid items $ 46,798 $ - $ 3,018 $ 49,816
Designated Loan Fund - - 1,500,000 1,500,000
Inventory 329,996 - - 329,996
376,794 - 1,503,018 1,879,812
Restricted:
Capital Projects - 33,388,328 - 33,388,328
TDD Revenue - - 250,780 250,780
HUD Grant - - 7,344,868 7,344,868
Debt Service - - 1,360,739 1,360,739
Mid Mo Solid Waste Service - - 4,284 4,284
Capital Improvement Sales Tax - - 4,310,958 4,310,958
Transportation - - 5,247,115 5,247,115
Convention & Tourism - - 4,466,509 4,466,509
Parks Sales Tax - - 1,990,060 1,990,060
Development charge - - 7,547,130 7,547,130
Donations for Contribution Fund - - 410,580 410,580
- 33,388,328 32,933,023 66,321,351
Committed:
Policy Development and Administration 734,302 - - 734,302
Public Safety 493,082 - - 493,082
Health and Environment 1,407,111 - - 1,407,111
Personal Development 116,358 - - 116,358
Transportation 244,934 - - 244,934
Debt Service - - 2,001,084 2,001,084
Designated Loan Fund - - 7,438,759 7,438,759
Capital Projects - 2,533,728 - 2,533,728
Public Improvements - - 557,098 557,098
2,995,787 2,533,728 9,996,941 15,526,456
Assigned
Policy Development and Administration 53,448 - - 53,448
Public Safety 364,316 - - 364,316
Transportation 1,242,204 - - 1,242,204
Health and Environment 5,584 - - 5,584
Personal Development 127,963 - - 127,963
Appropriated Fund Balance 500,000 - 213,104 713,104
2,293,515 - 213,104 2,506,619
Unassigned 29,245,964 - (4,912) 29,241,052 Total Fund Balance $ 34,912,060 $ 35,922,056 $ 44,641,174 $ 115,475,290

CITY OF COLUMBIA, MISSOURI
Notes to the Basic Financial Statements
September 30, 2016
46 (Continued)
10. Minimum Fund Balance Policy
The City shall maintain a minimum unassigned fund balance equal to twenty percent (20%) of the General Fund
budgeted expenditures for any given year. The reserves shall be used when approved by formal City Council action
or under the following circumstances:
1. Large one-time cost but use of reserves would provide a long-term cost savings.
2. To mitigate service impacts during a significant economic downturn in the economy or a significant
and unexpected loss of revenue.
3. Catastrophic event or natural disaster that threatens the safety of persons and property within the City.
4. City sustains unexpected liabilities created by Federal, State or other mandates out of its control.
If in any fiscal year the General Fund reserve balance is required to be used or is not achieved, the City Manager and
Finance Director shall present to the City Council a strategy to meet the fund balance within two (2) fiscal years.
All other funds of the City shall maintain a minimum fund balance of ten percent (10%) of the fund’s budgeted
expenditures but shall work to achieve a twenty percent (20%) or greater fund balance reserve given the fund’s
specific operational needs.
11. Net Position
In the government-wide and proprietary fund financial statements, equity is displayed in three components as
follows:
Net Investment in Capital Assets – This consists of capital assets, net of accumulated depreciation, less the
outstanding balances of any bonds, notes, or other borrowings that are attributable to the acquisition,
construction, or improvements of those assets. Net investment in capital assets excludes unspent bond and loan
proceeds. As of September 30, 2016, the City had unspent bond proceeds of $48,265,730 in the Water and
Electric Utility, $15,751,410 in the Sanitary Sewer Utility, and $1,692,594 in the Parking Fund.
Restricted – This consists of amounts that are legally restricted by outside parties or by law through
constitutional provisions or enabling legislation. Governmental activities Net Position Restricted for Statutory
Restrictions is $31,952,096 which are restricted for capital projects, convention and tourism, transportation and
health and environment. Business-type activities Net Position Restricted for Statutory Restrictions is $2,507,115
which is for debt service.
Unrestricted – This consists of amounts that do not meet the definition of “restricted” or “net investment in
capital assets.”
When both restricted and unrestricted resources are available for use, it is the City’s policy to use restricted
resources first, and then unrestricted resources as they are needed.

CITY OF COLUMBIA, MISSOURI
Notes to the Basic Financial Statements
September 30, 2016
47 (Continued)
12. Deferred Outflows/ Inflows of Resources and Unearned Revenue
In addition to assets, the financial statements will sometimes report a separate section for deferred outflows of
resources. This separate financial statement element, deferred outflows of resources, represents a consumption of net
position or fund balance that applies to a future period(s) and so will not be recognized as an outflow of resources
(expense/expenditure) until then. In addition to liabilities, the financial statements will sometimes report a separate
section for deferred inflows of resources. This separate financial statement element, deferred inflows of resources,
represents an acquisition of net position or fund balance that applies to a future period(s) and so will not be
recognized as an inflow of resources (revenue) until that time. The City reports Deferred Outflows/Inflows of
Resources as follows:
Unavailable Revenues - Unavailable revenue is reported in the governmental funds balance sheet. The
governmental funds report unavailable revenues from two sources: property taxes and grants. These amounts are
deferred and recognized as an inflow of resources in the period that the amounts become available. In the City’s
government-wide statement of net position, only the property tax revenue remains as a deferred inflow of resources
and will become an inflow in the year for which they are levied.
Gain/Loss on Refunding - In the government-wide and proprietary fund financial statements, deferred
outflows/inflows of resources on refunding represent the difference between the reacquisition price of a refunded
bond and its net carrying amount, which is amortized and recognized as a component of interest expense over the
remaining life of the old refunded bonds or the new refunding bonds, whichever is shorter.
Pension Related Items - In relation to GASB Statement No. 68, Accounting and Financial Reporting for Pensions -
An Amendment of GASB Statement 27, and GASB Statement No. 71, Pension Transition for Contributions Made
Subsequent to the Measurement Date – an amendment of GASB Statement No. 68, deferred outflows of resources for
pension contributions of $33,079,146 for LAGERS represents the deferral of the City’s contributions subsequent to
the measurement date of June 30, 2016 as well as the net difference between projected and actual earnings on
pension plan investments and changes in assumptions. A deferred outflow of $22,979,220 in the Police and Fire
pension represents the unamortized portion of the net difference between projected and actual experience on plan
assumptions and plan investments and change in assumptions.
The government-wide and the proprietary fund statements of net position report pension related deferred inflows,
which consists of the unamortized portion of the difference between expected and actual experience on plan
assumptions, and deficit investment returns.
Unearned Revenue – Unearned revenue arises when resources are received by the City before it has a legal claim to
them. In subsequent periods, when both revenue recognition criteria are met or when the government has a legal
claim to the resources, revenue is recognized.
13. Future Accounting Pronouncements
This report does not incorporate GASB Statement No. 74, Financial Reporting for Postemployment Benefit Plans
Other Than Pension Plans, GASB Statement No. 75, Accounting and Financial Reporting for Postemployment
Benefits Other Than Pensions, GASB Statement No. 77, Tax Abatement Disclosures, GASB Statement No. 78,
Pensions Provided through Certain Multiple-Employer Defined Benefit Pension Plans, GASB Statement No. 80,
Blending Requirements for Certain Component Units—an amendment of GASB Statement No. 14, GASB Statement
No. 81, Irrevocable Split-Interest Agreements, GASB Statement No. 82, Pension Issues—an amendment of GASB
Statements No. 67, No. 68, and No. 73 and GASB Statement No. 83, Certain Asset Retirement Obligations. The
City will adopt and implement these statements at the required time. The City’s management has not yet determined
the effect the statements will have on the City’s financial statements.

CITY OF COLUMBIA, MISSOURI
Notes to the Basic Financial Statements
September 30, 2016
48 (Continued)
14. Bond Issuance Costs, Premiums/Discounts and Gain/Loss on Refunding
In the government-wide financial statements and the proprietary fund types in the fund financial statements, bond
discounts and premiums are recorded as a reduction or addition to the debt obligation and bond issuance costs are
expensed in the period in which they are incurred. Bond discounts and premiums are amortized using a method
which approximates the effective interest method over the term of the related bonds. The gain or loss on refunding is
amortized as a component of interest expense over the remaining life of the bonds using a method which
approximates the effective interest method and gains and losses are reported as deferred inflows and outflows.
In the fund financial statements, governmental fund types recognize bond premiums and discounts, as well as bond
issuance costs, during the period in which the debt is issued. The face amount of debt issued and any related
premiums or discounts are reported as other financing sources/uses. Issuance costs, whether or not withheld from
the actual debt proceeds received, are reported as debt service expenditures during the year they are incurred.
15. Adoption of New Accounting Pronouncements
Effective October 1, 2015, the City adopted GASB Statement No. 72, Fair Value Measurement and Application.
This Statement addresses accounting and financial reporting issues related to fair value measurements. This
Statement provides guidance for determining a fair value measurement for financial reporting purposes. This
Statement also provides guidance for applying fair value to certain investments and disclosures related to all fair
value measurements. The adoption of this statement added additional disclosures to the financial statements.
Effective October 1, 2015, the City adopted GASB Statement No. 73, Accounting and Financial Reporting for
Pensions and Related Assets That Are Not within the Scope of GASB Statement 68, and Amendments to Certain
Provisions of GASB Statements 67 and 68. This Statement establishes requirements for defined benefit pensions
that are not within the scope of Statement No. 68, Accounting and Financial Reporting for Pensions, as well as for
the assets accumulated for purposes of providing those pensions. In addition, it establishes requirements for defined
contribution pensions that are not within the scope of Statement 68. It also amends certain provisions of Statement
No. 67, Financial Reporting for Pension Plans, and Statement 68 for pension plans and pensions that are within
their respective scopes. This statement had no impact on the City’s financial statements.
Effective October 1, 2015, the City adopted GASB Statement No. 76, The Hierarchy of Generally Accepted
Accounting Principles for State and Local Governments. The requirements in this Statement improve financial
reporting by (1) raising the category of GASB Implementation Guides in the GAAP hierarchy, thus providing the
opportunity for broader public input on implementation guidance; (2) emphasizing the importance of analogies to
authoritative literature when the accounting treatment for an event is not specified in authoritative GAAP; and (3)
requiring the consideration of consistency with the GASB Concepts Statements when evaluating accounting
treatments specified in nonauthoritative literature. This statement had no impact on the City’s financial statements.
Effective October 1, 2015, the City adopted GASB Statement No. 79, Certain External Investment Pools and Pool
Participants. This Statement establishes accounting and financial reporting standards for qualifying external investment
pools that elect to measure for financial reporting purposes all of their investments at amortized cost. This Statement also
establishes accounting and financial reporting standards for state and local governments that participate in a qualifying
external investment pool that measures for financial reporting purposes all of its investments at amortized cost. This
statement had no impact on the City’s financial statements.

CITY OF COLUMBIA, MISSOURI
Notes to the Basic Financial Statements
September 30, 2016
49 (Continued)
16. Miscellaneous Revenue
Miscellaneous revenue includes sources such as auction revenue, photocopies, Housing Authority PILOT and other
immaterial revenues.
17. Municipal Court Traffic Violations Fines and Costs
Missouri House Bill No. 103 amending RSMo Section 302.341.1 became effective on August 28, 2013. The
amendments to the statute now require municipalities to report an accounting of the percent of “annual general
operating revenue” from fines and court costs for traffic violations, including amended charges from any charged
traffic violation, occurring within the city, town, village, or county and charged in the municipal court of that city,
town, village, or county.
The State Auditor’s office defines general operating revenue as: revenue that is not required by the enacting
ordinance, law or Constitution to be used only for a designated purpose and can be used to pay any bill or obligation
of a city, county, or other political subdivision. This includes, but is not limited to, general sales tax, general use tax,
general property tax, and fees from certain licenses and permits, interest, fines and penalties. "General operating
revenue" does not include, among other items, designated sales or use taxes, user fees, grant funds or other revenue
designated by law, ordinance, or Constitution, for a specific purpose.
The City collected $760,628 of fines and court costs for traffic violations which represents 1.12% of General Fund
operating revenues of $67,767,346 (does not include appropriation of prior year fund balance, user fees and service
charges, operating transfers and grants) for the year ended September 30, 2016.
18. Pension
The net pension liability, deferred inflows and outflows of resources related to pensions, pension expense,
information about the fiduciary net position of the Missouri Local Government Employees Retirement System
(LAGERS) and the Police and Fire retirement funds, and additions to/deductions from these fiduciary net positions
has been determined on the same basis as they are reported by LAGERS and Police and Fire retirement funds. For
this purpose, benefit payments (including refunds of employee contributions) are recognized when due and payable
in accordance with the benefit terms. Investments are reported at fair value.

CITY OF COLUMBIA, MISSOURI
Notes to the Basic Financial Statements
September 30, 2016
50 (Continued)
II. RECONCILIATION OF GOVERNMENT-WIDE AND FUND FINANCIAL STATEMENTS
A. Explanation of certain differences between the governmental fund balance sheet and the government-wide
statement of net position
An element of that reconciliation states that “internal service funds are used by management to charge the costs of
custodial maintenance, information technology, community relations, fleet operations, self insurance, GIS and
employee benefits.” The assets and liabilities of the internal service funds are therefore included in governmental
activities in the following line items in the statement of net position (excluding certain internal service fund assets
and liabilities that are included with business-type activities):
Net Position – all Internal Service Funds $21,799,238
Net Position – Internal Service Fund Reported with
Business Type Activities (1,276,463)
Net Position - Governmental Activities $20,522,775
B. Explanation of certain differences between the governmental fund statement of revenues, expenditures,
and changes in fund balances and the government-wide statement of activities
An element of that reconciliation states that “internal service funds are used by management to charge the costs of
custodial maintenance, information technology, community relations, fleet operations, self insurance, GIS and
employee benefits.” The portion of the net revenue (expense) of these internal service funds arising out of their
transactions with governmental funds is reported with governmental activities, because they service those activities.
Change in Net Position – all Internal Service Funds $1,549,515
Change in Net Position of Internal Service Funds
Reported with Business-Type Activities (169,875)
Net adjustment to increase net changes in fund
balances-total governmental funds to arrive at
changes in net position of governmental activities $1,379,640

CITY OF COLUMBIA, MISSOURI
Notes to the Basic Financial Statements
September 30, 2016
51 (Continued)
III. STEWARDSHIP, COMPLIANCE, AND ACCOUNTABILITY
A. Statement of Cash Flows
The City defines cash and cash equivalents used in the statement of cash flows as cash deposits, amounts included in
the City’s cash and investment pool and highly liquid investments with an original maturity of three months or less
(both restricted and unrestricted) at the date of purchase.
B. Use of Estimates
The preparation of financial statements in conformity with U.S. GAAP requires management to make estimates and
assumptions that affect the amounts reported in the financial statements and accompanying notes. Actual results
could differ from those estimates.
IV. EQUITY IN POOLED CASH AND INVESTMENTS, CASH, INVESTMENTS, AND
OBLIGATIONS UNDER REVERSE REPURCHASE AGREEMENTS
The City maintains a cash and investment pool that is available for use by all funds. Each fund type's portion of the
pool is displayed on the governmental funds’ balance sheet and proprietary funds’ statement of net position as "Cash
and Cash Equivalents" and displayed in total on the government-wide statement of net position as “Cash and
Investments.” The investments of the pension and other post-employment benefit trust funds, certain debt service
reserve accounts and cash with fiscal agents in the enterprise funds are held separately from those of other City
funds.
A. Deposits
At year-end, the bank balances of the City's deposits were covered by federal depository insurance or by collateral
held by the City's agent in the City's name. At September 30, 2016, the bank balances in the City's checking
accounts were $6,518,662.
B. Investments
Statutes, the City Charter, Policy Resolutions, and legal opinions authorize the City to invest in obligations of the
U.S. Treasury, agencies, and instrumentalities; states, agencies and political subdivisions thereof; mutual funds
containing authorized securities; certificates of deposit of banks and savings and loans in Missouri; and repurchase
agreements. U.S. government agency securities consist of investments in FNMA, FHLMC, FFCB, FHLB and
Government National Mortgage Association mortgage-backed securities. Mortgage-backed securities do not have a
contractual maturity date and the City is subject to the risk of prepayment on these securities when changes in
market interest rates occur. The City is also authorized to enter into reverse repurchase agreements.
The assets of the Police and Firefighters' Retirement Funds may be invested, reinvested and managed by an
investment fiduciary who shall "act with the same care, skill, prudence, and diligence under the circumstances then
prevailing that a prudent person acting in a similar capacity and familiar with those matters would use in the conduct
of a similar enterprise with similar aims.” Authorized investment securities include those listed above as well as
common stock, preferred stock, real estate mortgages, corporate debt securities including bonds and prime
commercial paper, prime banker’s acceptances and taxable municipal debt instruments.
Money market mutual funds held by fiscal agents are classified as cash and cash equivalents on the balance sheet but
as investments for custodial risk disclosure.

CITY OF COLUMBIA, MISSOURI
Notes to the Basic Financial Statements
September 30, 2016
52 (Continued)
Fair Value of Investments
The City measures and records its investments, other than money market accounts, using fair value measurement
guidelines established by generally accepted accounting principles. The definition of fair value is the price that
would be received to sell an asset or paid to transfer a liability in an orderly transaction between market participants
at the measurement date. These guidelines recognize a three-tiered fair value hierarchy, as follows:
Level 1: quoted prices (unadjusted) in active markets/exchanges for identical assets or liabilities;
Level 2: quoted prices for similar assets or liabilities, quoted prices for identical or similar assets or
liabilities in markets that are not active, or other than quoted prices that are observable,
Level 3: unobservable inputs based on the best information available in the circumstances, to the extent
observable inputs are not available.
The City of Columbia and the Police and Fire pension invest in fixed income investments seeking to achieve
positive returns utilizing experienced portfolio managers. These investments are valued at least monthly with
pricing available daily. Investments are available in 1-3 days.
For the City and Police and Fire pension, the following fair value techniques were utilized in measuring the fair
value of its investments:
U.S. Treasury securities, corporate equities, and mutual funds: These investments are reported at fair value
based on quoted market prices obtained from exchanges and market maker trade pricing.
Corporate obligations, fixed income securities and other fixed income: These investments are reported at fair
value based on evaluation using market sources and integrating relative credit information, observed market
movements, and sector news into the evaluated pricing applications and models.
U.S. Government securities: U.S. Government securities are reported at fair value based on bullet (non-call)
spread scale for each issuer for maturities going out to forty years. These spreads represent credit risk and are
obtained from the new issue market, secondary trading, and dealer quotes.
Mortgage-backed securities: Mortgage-backed securities are reported at fair value via models using various inputs
such as but not limited to daily cash flow, snapshots of the TBA market and the U.S. Treasury market.
Municipal bonds: Municipal bonds are reported at fair value based on trades, bid price or spread, two–sided
markets, quotes, benchmark curves including but not limited to treasury benchmarks and LIBOR and swap curves,
market data feeds such as MSRB, financial statements, discount rate, capital rates, and trustee reports.
Corporate bonds: Most corporate bond evaluations found on customer statements are obtained by UBS from
Interactive Data Pricing and Reference Data. Interactive Data’s evaluators gather information from several market
sources and integrate relative credit information, observed market movements, and sector news into the evaluated
pricing applications and models.
Exchange traded funds: ETFs are exchange traded funds, quoted on the ASX. The units of an ETF trade like listed
shares.

CITY OF COLUMBIA, MISSOURI
Notes to the Basic Financial Statements
September 30, 2016
53 (Continued)
At September 30, 2016, the City had the following recurring fair value measurements:
Investments Measured at Totals
Fair Value: as of 9/30/16 Level One Level Two Level Three
Guaranteed U.S. Agencies $ 33,625,415 $ - $ 33,625,415 $ -
U.S. Treasuries 9,199,052 9,199,052 - -
U.S. Agencies 190,516,422 - 190,516,422 -
Corporate Bonds Inv Grade 18,882,841 - 18,882,841 -
Corporate Bonds High Yield 3,919,505 - 3,919,505 -
International Bonds 85,480 - 85,480 -
Mutual Funds 7,112,500 7,112,500 - -
Common Stock 67,095,154 67,095,154 - -
Guar. Invest. Contracts 332,770 332,770 - -
330,769,139 83,739,476 247,029,663 -
Investments measured at amortized cost:
Money Market Accounts 91,865,959
$ 422,635,098
Quoted Prices
in Active
Markets for
Identical
Assets
Significant Other
Observable
Inputs
Significant
Unobservable
Inputs
Fair Value Measurement Using

CITY OF COLUMBIA, MISSOURI
Notes to the Basic Financial Statements
September 30, 2016
54 (Continued)
Interest Rate Risk
Interest rate risk is the risk that the fair value of investments will be adversely affected by a change in interest rates.
The City does not have a formal interest rate risk policy.
As of September 30, 2016, the City had the following investments and maturities:
Investment Maturities (in years)
Fair Less More
Investment Type Value Than 1 1-5 6-10 Than 10
Guaranteed U.S. Agencies $ 33,625,415 $ - $ - $ 462,479 $ 33,162,936
U.S. Treasuries 9,199,052 1,300,767 5,943,900 681,384 1,273,001
U.S. Agencies 190,516,422 8,300 13,433,213 20,853,843 156,221,066
Corporate Bonds 22,802,346 2,005,366 14,292,410 4,242,944 2,261,626
International Bonds 85,480 - - 85,480 -
Total $ 256,228,715 $ 3,314,433 $ 33,669,523 $ 26,326,130 $ 192,918,629
Credit Risk & Concentration of Credit Risk
Credit risk is the risk that an issuer or other counterparty to an investment will not fulfill its obligations. Credit risk
is measured using credit quality ratings of investments in debt securities as described by nationally recognized rating
agencies such as Standard & Poor’s and Moody’s. Concentration of credit risk is the risk of loss attributed to the
magnitude of investment in a single issuer.
The City does not have a specific credit risk policy and there is no limit on the amount that may be invested in one
issuer. The City’s investments are to be purchased using the “Prudent Person” standard. Investments shall be made
with judgment and care, under circumstances then prevailing, which persons of prudence, discretion and intelligence
exercise in the management of their own affairs, not for speculation, but for investment, considering the probable
safety of their capital as well as the probable income to be derived.
Of the City’s total investments, 22.32% are issues of the Federal Home Loan Mortgage Corporation (FreddieMac),
18.73% are issues of the Federal National Mortgage Association (FannieMae) and 7.95% are issues of the
Government National Mortgage Association (Ginnie Mae).
Custodial Credit Risk
In the event of a failure of a financial institution or counterparty, custodial credit risk is the risk that the City would
not be able to recover its deposits, investments or collateral securities in the possession of an outside party. The
City’s investment policy requires assets held by a custodian as determined by the board of trustees be held in the
name of the City of Columbia. In addition, the City addresses custodial credit risk by diversifying its investment
portfolio and requiring all assets to be invested with the care, skill and diligence that a prudent person familiar with
such matters acting in a like capacity would use in a similar enterprise.

CITY OF COLUMBIA, MISSOURI
Notes to the Basic Financial Statements
September 30, 2016
55 (Continued)
The following table lists the credit ratings per Fitch, Moody’s and/or Standard and Poor’s of the City’s investments
as of September 30, 2016:
Quality Ratings
Investment Type Fair Value AAA Aa2 AA+ AA
Guaranteed U.S. Agencies* $ 33,625,415 $ $ $ $
U.S Treasuries* 9,199,052 7,738,222
U.S. Agencies 190,516,422 178,778,338 3,291,695 75,548
Corporate Bonds 22,802,346 165,997 640,944 102,276 43,110
International Bonds 85,480
Total $ 256,228,715 $ 186,682,557 $ 640,944 $ 3,393,971 $ 118,658
continued below
Quality Ratings
Investment Type AA- A+ A A- A1
Guaranteed U.S. Agencies* $ $ $ $ $
U.S Treasuries*
U.S Agencies 282,702 240,334 532,549 213,829
Corporate Bonds 151,665 2,219,598 4501865 1,385,140 1,347,057
International Bonds
$ 434,367 $ 2,459,932 $ 5,034,414 $ 1,598,969 $ 1,347,057
continued below Quality Ratings
Investment Type A3 BBB+ BBB BBB- BB+
Guaranteed U.S. Agencies* $ $ $ $ $
U.S. Treasuries*
U.S. Agencies 213,725 1,464,635 169,125
Corporate Bonds 749,973 1,935,253 3,193,278 1,830,016 266,178
International Bonds 85,480
Total $ 749,973 $ 2,234,458 $ 4,657,913 $ 1,999,141 $ 266,178
continued next page

CITY OF COLUMBIA, MISSOURI
Notes to the Basic Financial Statements
September 30, 2016
56 (Continued)
Quality Ratings
Investment Type BB BB- B+ B1 B
Guaranteed U.S. Agencies* $ $ $ $ $
U.S. Treasuries*
U.S. Agencies
Corporate Bonds 373,071 513,448 95,850 242,925 24,483
International Bonds
Total $ 373,071 $ 513,448 $ 95,850 $ 242,925 $ 24,483
continued below
Quality Ratings
Investment Type Ba1 Ba2 Ba3 Baa1 Baa3
Guaranteed U.S. Agencies* $ $ $ $ $
U.S. Treasuries*
U.S. Agencies 51,174 262,818
Corporate Bonds 1,001,658 654,528 1,183,965 114,068
International Bonds
Total $ 1,001,658 $ 654,528 $ 1,183,965 $ 51,174 $ 376,886
continued below
Investment Type D Unrated/
Not applicable
Guaranteed U.S. Agencies* $ 33,625,415
U.S. Treasuries* 1,460,830
U.S. Agencies 28,526 4,911,424
Corporate Bonds 66,000
International Bonds
Total $ 28,526 $ 40,063,669
Quality Ratings
* U.S. Treasury securities and certain U.S. Agency securities are explicitly guaranteed by the U.S. government and
therefore, are not subject to credit risk disclosures.

CITY OF COLUMBIA, MISSOURI
Notes to the Basic Financial Statements
September 30, 2016
57 (Continued)
A reconciliation of cash and cash equivalents as shown on the government-wide statement of net position is as
follows:
Balance
September 30,
2016
Investments $ 419,900,499
Investments with fiscal agents 2,734,599
Cash with fiscal agents 12,549,277
Cash on hand 36,821
Imprest accounts 4,490,535
Total $ 439,711,731
Government- Fiduciary Funds
Wide Statement Statement of
of Net Position Net Position Total
Cash and investments $ 197,984,466 $ 6,392,513 $ 204,376,979
Investments — 124,139,374 124,139,374
Restricted assets:
Cash and investments 11,663,141 — 11,663,141
Bond covenant account cash and investments 90,982,611 — 90,982,611
Closure and postclosure reserve 2,690,137 — 2,690,137
Customer security and
escrow deposits 5,859,489 — 5,859,489
Total $ 309,179,844 $ 130,531,887 $ 439,711,731
The City generally intends to buy and hold the securities in its portfolios, and to sell only when a gain is present or
when a swap that offers substantial economic gains is available. The City maintains a minimum of 5% of the pooled
investment portfolio in cash and cash equivalents to reduce the likelihood of selling a security to meet cash
requirements. During the next fiscal year, the City does not intend to sell any securities at a loss in order to meet
cash requirements.
The City's investment policies require that securities underlying repurchase agreements must have a fair value of at
least 100% of the cost of the repurchase agreement.
C. Reverse Repurchase Agreements
The City is permitted to enter into reverse repurchase agreements; that is, a sale of securities with a simultaneous
agreement to repurchase them in the future at the same price plus a contracted rate of interest. The fair value of the
securities underlying reverse repurchase agreements normally exceeds the cash received, providing the dealers a
margin against a decline in fair value of the securities. If the dealers default on their obligations to resell these
securities to the City or provide securities or cash of equal value, the City would suffer an economic loss equal to the
difference between the fair value plus accrued interest of the underlying securities and the agreement obligation,
including accrued interest. There were no defaults during the year, and there were no reverse repurchase agreements
outstanding at year-end.

CITY OF COLUMBIA, MISSOURI
Notes to the Basic Financial Statements
September 30, 2016
58 (Continued)
V. RECEIVABLES AND PAYABLES
Balances at September 30, 2016 were as follows:
Grants
Receivable/ Allowance
Accounts Accrued Rehabilitation Total for Doubtful Receivables,
Receivable Interest Loan Taxes Receivables Accounts Net
Governmental activities:
General 331,382$ 55,876$ 149,711$ 12,378,760$ 12,915,729$ (73,026)$ 12,842,703$
Capital Projects 2,393,900 56,564 1,985,289 - 4,435,753 (7,317) 4,428,436
Non-major Governmental
Funds 99,033 200,730 8,224,231 4,487,815 13,011,809 (529,743) 12,482,066
Internal Service Funds 545,264 35,995 13,260 - 594,519 (35,690) 558,829 Total - governmental activities 3,369,579$ 349,165$ 10,372,491$ 16,866,575$ 30,957,810$ (645,776)$ 30,312,034$
Business-type activities:
Water and Electric Utility 28,238,265$ 172,060$ -$ -$ 28,410,325$ (3,895,950)$ 24,514,375$
Sanitary Sewer Utility 2,449,747 69,930 - - 2,519,677 (659,137) 1,860,540
Non-major Enterprise
Funds 4,119,616 80,293 2,320,896 - 6,520,805 (975,293) 5,545,512
Internal Service Funds 1,260,589 2,071 - - 1,262,660 (1,314,433) (51,773) Total - business type activities 36,068,217$ 324,354$ 2,320,896$ -$ 38,713,467$ (6,844,813)$ 31,868,654$
Accounts payable consist of amounts due to vendors and are expected to be paid within one year.

CITY OF COLUMBIA, MISSOURI
Notes to the Basic Financial Statements
September 30, 2016
59 (Continued)
VI. CAPITAL ASSETS
Capital asset activity for the year ended September 30, 2016 was as follows:
Balance Balance
October 1, September 30,
2015 Additions Deductions 2016
Governmental activities:
Capital assets, not being depreciated:
Land $ 46,747,583 $ 1,179,470 $ (15,000) $ 47,912,053
Construction in process 14,918,391 20,990,372 (10,107,409) 25,801,354
Total capital assets, not being
depreciated 61,665,974 22,169,842 (10,122,409) 73,713,407
Capital assets, being depreciated:
Buildings 73,995,759 351,228 — 74,346,987
Improvements other than buildings 36,679,633 3,781,337 — 40,460,970
Furniture, fixtures and equipment 46,095,182 2,770,441 (1,376,313) 47,489,310
Infrastructure 293,973,583 4,095,278 — 298,068,861
Total capital assets being
depreciated 450,744,157 10,998,284 (1,376,313) 460,366,128
Less accumulated depreciation for:
Buildings (19,449,479) (1,737,359) — (21,186,838)
Improvements other than buildings (7,509,230) (915,328) — (8,424,558)
Furniture, fixtures and equipment (29,443,351) (2,675,811) 1,043,424 (31,075,738)
Infrastructure (59,738,733) (5,896,110) — (65,634,843)
Total accumulated depreciation (116,140,793) (11,224,608) 1,043,424 (126,321,977)
Total capital assets, being
depreciated, net 334,603,364 (226,324) (332,889) 334,044,151
Governmental activities
capital assets, net $ 396,269,338 $ 21,943,518 $ (10,455,298) $ 407,757,558

CITY OF COLUMBIA, MISSOURI
Notes to the Basic Financial Statements
September 30, 2016
60 (Continued)
Balance Balance
October 1, September 30,
2015 Additions Deductions 2016
Business-type activities:
Capital assets, not being depreciated:
Land and land rights $ 21,487,681 $ 559,677 $ — $ 22,047,358
Construction in progress 28,132,732 31,091,153 (43,637,502) 15,586,383
Total capital assets not
being depreciated 49,620,413 31,650,830 (43,637,502) 37,633,741
Capital assets, being depreciated:
Structures and improvements 460,701,812 23,006,920 — 483,708,732
Furniture, fixtures and equipment 473,112,018 31,930,801 (4,279,620) 500,763,199
Total capital assets being
depreciated 933,813,830 54,937,721 (4,279,620) 984,471,931
Less accumulated depreciation for:
Structures and improvements (139,747,303) (9,947,252) — (149,694,555)
Furniture, fixtures and equipment (224,326,223) (16,753,055) 2,541,939 (238,537,339)
Total accumulated depreciation (364,073,526) (26,700,307) 2,541,939 (388,231,894)
Total capital assets being
depreciated, net 569,740,304 28,237,414 (1,737,681) 596,240,037
Business-type activities
capital assets, net $ 619,360,717 $ 59,888,244 $ (45,375,183) $ 633,873,778
Depreciation expense was charged to functions/programs of the primary government as follows:
Business-type activities:
Water and Electric $ 15,069,433
Sanitary Sewer 5,129,778
Non-major enterprise funds 6,501,096
Total depreciation expense - business-type activities 26,700,307

CITY OF COLUMBIA, MISSOURI
Notes to the Basic Financial Statements
September 30, 2016
61 (Continued)
Depreciation expense was charged to functions/programs of the primary government as follows:
Governmental activities:
Policy Development and administration $ 1,345,430
Public Safety 1,655,148
Transportation 6,602,400
Health and Environment 69,659
Personal Development 1,143,608
Capital assets held by the government's internal
service funds are charged to the various
functions based on their usage of the asset 408,363
$ 11,224,608
VII. COMMITMENTS
A. Construction Commitments
At September 30, 2016, construction contract commitments of the City were:
Amounts
Major Governmental Fund:
Capital Projects Fund $ 1,780,329
Enterprise Funds:
Major Funds:
Sanitary Sewer Utility 1,737,703
Nonmajor Funds 2,997,690
Total Enterprise Funds 4,735,393
Total $ 6,515,722
Construction contract commitments of the City will be paid from capital improvement sales tax, parks sales tax,
federal and state grant revenues, county road tax, development fees, bond proceeds, enterprise revenues, and general
revenues of the City.
B. Obligations to Purchase Electric Power
The Water and Electric Utility has an agreement with the Board of Municipal Utilities, Sikeston, Missouri, to
purchase electric power effective through May 31, 2021. The City agreed to purchase 55 Megawatts at 110% of its
proportionate share of monthly power costs (including debt service costs related to the revenue bond issue) as
defined in the agreement. The City also contracted to purchase an additional 11 Megawatts from Sikeston

CITY OF COLUMBIA, MISSOURI
Notes to the Basic Financial Statements
September 30, 2016
62 (Continued)
commencing on June 1, 1992. The 11 Megawatts was purchased at $4.50 per kilowatt per month until May 31,
2002. On June 1, 2002, the capacity charge for the 11 Megawatts changed to 100% of the fixed costs and the energy
charge changed to 110% of the energy costs.
The City has a wind generation purchase and transmission service agreement with Associated Electric Coop., Inc.
effective through June 2027. The City has been allocated 11.1% of the net energy and green tags produced by the
Bluegrass Ridge Wind Farm. The City pays an energy charge of $55 per MWH during the term of this agreement,
and receives transmission service from Associated Electric. The current transmission charge is $10,844.06 per
month.
The City has an agreement with Ameresco Jefferson City LLC to purchase power from a 3.17 megawatt generator
from a landfill gas plant located in Jefferson City, Missouri. The City has agreed to purchase the electric output of
the plant over a twenty year period starting in March 2009 at a fixed cost of $52.50 per megawatt hour.
The City has agreed to purchase solar power from Free Power Company, Inc. Free Power has provided solar
equipment which is installed at sites owned by the City. Power production started in December 2011. In 2013, the
City paid $54.95 per MWH with the price per MWH increasing by 1.75% in January 2014 and every year thereafter.
The City of Columbia is a member of the Missouri Joint Municipal Electric Utility Commission (MJMEUC).
MJMEUC is a state wide agency that is authorized by state law to operate as an electric utility for the benefit of its
members. The City has two agreements with MJMEUC for the purchase of power, the Prairie State Energy Campus
from Peabody Energy, and the Iatan 2 project from Kansas City Power & Light Company. The agreements establish
advisory committees that consist of representatives of the participating unit power purchasers. All decisions of the
MJMEUC Board of Directors regarding Prairie State, or Iatan 2 will give consideration to the recommendations of
their respective member committee, but final decision on any matter effecting either agreement shall be made by the
MJMEUC Board of Directors.
In June 2007, the MJMEUC Board of Directors gave final approval for the participation in the construction,
operation, and financing of the Prairie State Energy Campus. MJMEUC’s interests are approximately 195 MW, and
the City expects to receive approximately 26%, or about 50 MW from the units. The City’s agreement with
MJMEUC does not create any ownership rights on the part of the City to the Prairie State units. MJMEUC has
capitalized its total costs incurred in connection with the development and construction of the Prairie State units and
intends recover those costs through monthly capacity charges. Unit one of Prairie State was placed in service in June
2012 and unit two was placed in service in November 2012. The City started paying capacity charges on unit one in
February 2012. The City agreed to make payments to MJMEUC for costs associated with Prairie State that were not
capitalized, or rolled into the financing of the project based on the City’s purchase percentage.
In 2009, the MJMEUC board gave final approval for an agreement with Kansas City Power & Light Company for a
unit power interest in Iatan 2; a coal fired generating station near Weston, Missouri. MJMEUC will receive 100MW
from the new unit. Of MJMEUC’s 100 MW ownership, Columbia has agreed to buy 20 MW. The City’s agreement
with MJMEUC does not create ownership rights on the part of the City to the Iatan 2 Unit. MJMEUC has capitalized
its costs in connection with the development and construction of the Iatan 2 unit and intends to recover those costs
through a monthly capacity charge now that the Iatan 2 unit has begun commercial operation. Iatan 2 started
production in January 2011. The City agreed to make payments to MJMEUC for its purchase percentage of costs
associated with Iatan 2 that could not be capitalized.
The City has an agreement with Crystal Lake Wind III, LLC to purchase 21 megawatts of wind energy from Iowa.
This is a 20 year contract with energy cost starting at $42.50 per megawatt hour in 2012, increasing to $43.50 in
2013, and $44.50 in 2014. In 2015 the price increases to $45.00 per megawatt hour, and remains at that rate until
the end of the contract term.

CITY OF COLUMBIA, MISSOURI
Notes to the Basic Financial Statements
September 30, 2016
63 (Continued)
C. Pollution Remediation Obligations
The Missouri Department of Natural Resources issued the City a "Letter of Warning" on March 19, 2009. The letter
notified the City that the Water Treatment Plant site was in non-compliance with Clean Water Laws and Operating
Permit #MO-G640087 and "caused pollution of an unnamed tributary to Perche Creek, waters of the state or placed
or caused or permitted to be placed water contaminants in a location where it is reasonably certain to cause pollution
of waters of the state." The contaminant is lime softening sludge which was improperly disposed of by stockpiling it
on-site.
Due to the non-compliance with this permit, the City was required to: prepare a site specific sludge management
plan for the water treatment plant site; to install storm water Best Management Practices (BMP) to prevent a
discharge of contaminated storm water from the site; and, apply for a site specific storm water discharge permit for
this site.
The City applied for a beneficial use exemption for the stockpiled sludge at the water treatment plant to allow the
stockpiled sludge to remain in place. The request has been approved by the Missouri Department of Natural
Resources, with conditions. The City is required to prepare plans and install a clay cap to contain the stockpiled
sludge.
It is estimated that the cost of the work will range from $501,500 to $936,000 with the primary variant being the
availability of materials near the plant. The estimated cost to the City is $783,925, calculated as follows:
65% probability that the actual costs will be $936,000 (65% * $936,000) = $608,400
35% probability that the actual costs will be $501,500 (35% * $501,500) = $175,525
Total estimated liability $783,925
The City does not expect to recover the remediation outlays from insurance, or any other parties. The total
estimated liability is recorded in the Water and Electric utility fund in Accounts Payable.
D. Encumbrances
Purchase orders are issued throughout the fiscal year to encumber budgets in the governmental funds. Outstanding
encumbrances as of September 30, 2016 are as follows:
Major Funds:
General Fund $ 2,558,382
Capital Projects Fund 4,491,321
Total Major Funds 7,049,703
Total Nonmajor Funds 160,176
Total encumbrances $ 7,209,879

CITY OF COLUMBIA, MISSOURI
Notes to the Basic Financial Statements
September 30, 2016
64 (Continued)
VIII. INTERFUND ACTIVITY
Interfund receivable and payable balances and advances at September 30, 2016 are as follows:
Interfund Interfund
receivables payables
and advances and advances
Major Governmental Funds:
General Fund $ 4,465,736 $ —
Capital Projects Fund — 329,000
Nonmajor governmental funds-Permanent Fund 3,777,485 —
Nonmajor governmental funds-Special Revenue Funds — 236,950
Fiduciary Fund, Police and Fire Pension — 1,735,990
Enterprise Funds:
Major Funds:
Water and Electric Utility 2,707,139 2,030,196
Nonmajor enterprise — 6,618,224
Total $ 10,950,360 $ 10,950,360
Advances at September 30, 2016 include $811,519 in the Non-Major Enterprise Parking Utility Fund, $2,539,275 in
the Non-Major Enterprise Solid Waste Utility Fund and $97,691 in the Non-Major Enterprise Recreation Services
Fund that are classified as Noncurrent Liabilities because the funds advanced from the Permanent Fund-Designated
Loan Fund were restricted for use on capital projects. The $2,539,275 advance to the Solid Waste Utility was for
land purchased on Route B and an advance for the construction of a Solid Waste Facility. The $811,519 to the
Parking Utility was for construction of the Short Street garage and the $97,691 to Recreation Services was for
construction of improvements to the H.J. Waters and C.B. Moss Memorial Wildlife Area. These advances generally
are not scheduled to be repaid in the next fiscal year. Management considers these collectible.
Advances of $329,000 from the Permanent Fund-Designated Loan Fund to the Capital Projects Fund are for special
assessment tax bills. These will be repaid when the associated capital projects are completed and the special
assessment taxes are levied.
Payment in lieu of taxes of $2,030,196 is reported as a receivable in the General Fund and a payable in the Water
and Electric Utility Fund.
Payables from the Non-Major Special Revenue Non-Motorized Grant Fund of $65,745, and $85,139 from
Community Development Grant Fund are due to the General Fund for fund overdrafts of cash and cash equivalents
on September 30, 2016.
Loans with a balance of $500,749 from the Water and Electric Utility to the Railroad Fund relate to construction
work and the purchase of a locomotive. The current portion of this loan is $73,529, payable within the next fiscal
year.
A loan with a balance of $2,206,390 from the Water and Electric Utility to the Transload Fund was transferred from
the Railroad Fund and was originally used for the purchase of the intermodal facility. The current portion of this
loan is $79,676, payable within the next fiscal year.

CITY OF COLUMBIA, MISSOURI
Notes to the Basic Financial Statements
September 30, 2016
65 (Continued)
Interfund transfers consisted of the following amounts:
Transfers are used to (1) move revenues from the fund that budgets or ordinance requires to collect them to the fund
that budgets or ordinance requires to expend them, (2) move receipts restricted to debt service from the funds
collecting the receipts to the debt service fund as debt service payments become due, and (3) use unrestricted
revenues collected in the general fund to finance various programs accounted for in other funds in accordance with
budgetary authorizations.
Included in the transfers schedule is a transfer from the Water and Electric Utilities Fund to the General Fund of
$15,746,363. The transfer represents PILOT payments.
General Capital Nonmajor Water and Sanitary Non-Major Internal
Fund Projects Governmental Electric Utility Sewer Utility Enterprise Service Total
Major Governmental
Funds:
General Fund -$ 757,459$ 8,279,681$ 15,758,151$ 42,597$ 132,617$ 16,994$ 24,987,499$
Capital Projects Fund 1,938 - 10,141,450 104,880 25,984 119,136 100,000 10,493,388
Nonmajor Governmental 1,118,284 706,863 8,521,970 462,324 116,555 122,645 517,282 11,565,923
Major Enterprise Fund:Water and Electric - - - - - - - -
Sewer Fund - - - - - 117,923 117,923
Nonmajor Enterprise 1,161,910 47,000 7,430,802 358,650 - 270,273 - 9,268,635
Internal Service - - - 50,000 - - - 50,000
Total 2,282,132$ 1,511,322$ 34,373,903$ 16,734,005$ 185,136$ 762,594$ 634,276$ 56,483,368$
Tra
nsf
er T
o
Transfer From
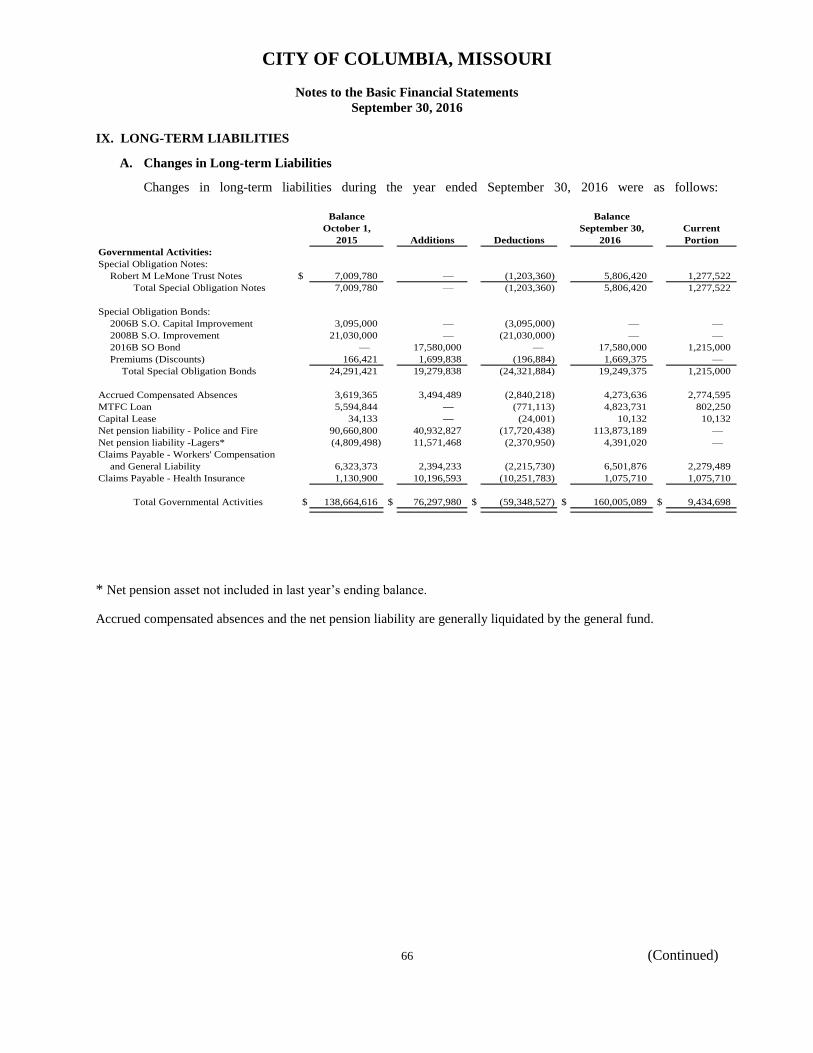
CITY OF COLUMBIA, MISSOURI
Notes to the Basic Financial Statements
September 30, 2016
66 (Continued)
IX. LONG-TERM LIABILITIES
A. Changes in Long-term Liabilities
Changes in long-term liabilities during the year ended September 30, 2016 were as follows:
Balance Balance
October 1, September 30, Current
2015 Additions Deductions 2016 Portion
Governmental Activities:
Special Obligation Notes:
Robert M LeMone Trust Notes $ 7,009,780 — (1,203,360) 5,806,420 1,277,522
Total Special Obligation Notes 7,009,780 — (1,203,360) 5,806,420 1,277,522
Special Obligation Bonds:
2006B S.O. Capital Improvement 3,095,000 — (3,095,000) — —
2008B S.O. Improvement 21,030,000 — (21,030,000) — —
2016B SO Bond — 17,580,000 — 17,580,000 1,215,000
Premiums (Discounts) 166,421 1,699,838 (196,884) 1,669,375 —
Total Special Obligation Bonds 24,291,421 19,279,838 (24,321,884) 19,249,375 1,215,000
Accrued Compensated Absences 3,619,365 3,494,489 (2,840,218) 4,273,636 2,774,595
MTFC Loan 5,594,844 — (771,113) 4,823,731 802,250
Capital Lease 34,133 — (24,001) 10,132 10,132
Net pension liability - Police and Fire 90,660,800 40,932,827 (17,720,438) 113,873,189 —
Net pension liability -Lagers* (4,809,498) 11,571,468 (2,370,950) 4,391,020 —
Claims Payable - Workers' Compensation
and General Liability 6,323,373 2,394,233 (2,215,730) 6,501,876 2,279,489
Claims Payable - Health Insurance 1,130,900 10,196,593 (10,251,783) 1,075,710 1,075,710
Total Governmental Activities $ 138,664,616 $ 76,297,980 $ (59,348,527) $ 160,005,089 $ 9,434,698
* Net pension asset not included in last year’s ending balance.
Accrued compensated absences and the net pension liability are generally liquidated by the general fund.

CITY OF COLUMBIA, MISSOURI
Notes to the Basic Financial Statements
September 30, 2016
67 (Continued)
Balance Balance
October 1, Additions/ September 30, Current
2015 Adjustments Deductions 2016 Portion
Business-type Activities:
Revenue Bonds:
Water & Electric Utility:
2009 Water and Electric 16,635,000 — (95,000) 16,540,000 105,000
2011 Water and Electric 77,870,000 — (2,495,000) 75,375,000 2,620,000
2014 Water and Electric 12,830,000 — (1,280,000) 11,550,000 770,000
2015 Water and Electric 51,280,000 — (1,825,000) 49,455,000 2,195,000
Premiums (Discounts) 3,997,216 3,212 (252,326) 3,748,102 —
Total Water & Electric Utility 162,612,216 3,212 (5,947,326) 156,668,102 5,690,000
Sanitary Sewer Utility:
1999 Sanitary Sewer System Series A 1,075,000 — (205,000) 870,000 210,000
1999 Sanitary Sewer System Series B 410,000 — (80,000) 330,000 80,000
2000 Sanitary Sewer System Series B 840,000 — (130,000) 710,000 135,000
2002 Sanitary Sewer System Series A 995,000 — (115,000) 880,000 115,000
2003 Sanitary Sewer System Series B 1,805,000 — (180,000) 1,625,000 185,000
2004 Sanitary Sewer System Series B 365,000 — (30,000) 335,000 35,000
2006 Sanitary Sewer System Series B 550,000 — (45,000) 505,000 45,000
2007 Sanitary Sewer System Series B 1,245,000 — (85,000) 1,160,000 85,000
2009 Sanitary Sewer System 10,405,000 — — 10,405,000 —
2010 Sanitary Sewer System Series A 51,678,000 — (2,580,300) 49,097,700 2,632,000
2012 Sanitary Sewer System 8,515,000 — (295,000) 8,220,000 300,000
2013 Sanitary Sewer System Refunding 1,990,000 — (665,000) 1,325,000 660,000
2015 Sanitary Sewer System 18,200,000 — (535,000) 17,665,000 565,000
Premiums (Discounts) 1,294,324 94 (71,398) 1,223,020 —
Total Sanitary Sewer Utility 99,367,324 94 (5,016,698) 94,350,720 5,047,000
Total Revenue Bonds 261,979,540 3,306 (10,964,024) 251,018,822 10,737,000
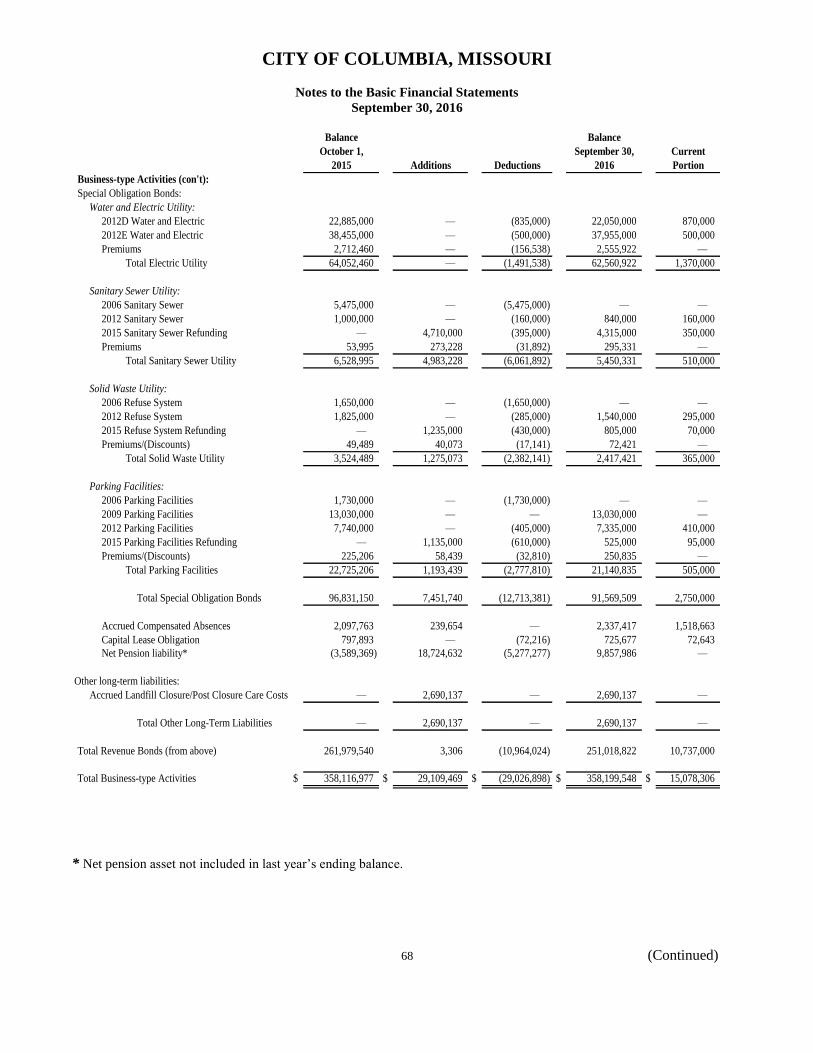
CITY OF COLUMBIA, MISSOURI
Notes to the Basic Financial Statements
September 30, 2016
68 (Continued)
Balance Balance
October 1, September 30, Current
2015 Additions Deductions 2016 Portion
Business-type Activities (con't):
Special Obligation Bonds:
Water and Electric Utility:
2012D Water and Electric 22,885,000 — (835,000) 22,050,000 870,000
2012E Water and Electric 38,455,000 — (500,000) 37,955,000 500,000
Premiums 2,712,460 — (156,538) 2,555,922 —
Total Electric Utility 64,052,460 — (1,491,538) 62,560,922 1,370,000
Sanitary Sewer Utility:
2006 Sanitary Sewer 5,475,000 — (5,475,000) — —
2012 Sanitary Sewer 1,000,000 — (160,000) 840,000 160,000
2015 Sanitary Sewer Refunding — 4,710,000 (395,000) 4,315,000 350,000
Premiums 53,995 273,228 (31,892) 295,331 —
Total Sanitary Sewer Utility 6,528,995 4,983,228 (6,061,892) 5,450,331 510,000
Solid Waste Utility:
2006 Refuse System 1,650,000 — (1,650,000) — —
2012 Refuse System 1,825,000 — (285,000) 1,540,000 295,000
2015 Refuse System Refunding — 1,235,000 (430,000) 805,000 70,000
Premiums/(Discounts) 49,489 40,073 (17,141) 72,421 —
Total Solid Waste Utility 3,524,489 1,275,073 (2,382,141) 2,417,421 365,000
Parking Facilities:
2006 Parking Facilities 1,730,000 — (1,730,000) — —
2009 Parking Facilities 13,030,000 — — 13,030,000 —
2012 Parking Facilities 7,740,000 — (405,000) 7,335,000 410,000
2015 Parking Facilities Refunding — 1,135,000 (610,000) 525,000 95,000
Premiums/(Discounts) 225,206 58,439 (32,810) 250,835 —
Total Parking Facilities 22,725,206 1,193,439 (2,777,810) 21,140,835 505,000
Total Special Obligation Bonds 96,831,150 7,451,740 (12,713,381) 91,569,509 2,750,000
Accrued Compensated AbsencesAccrued Compensated Absences 2,097,763 239,654 — 2,337,417 1,518,663
Capital Lease Obligation 797,893 — (72,216) 725,677 72,643
Net Pension liability* (3,589,369) 18,724,632 (5,277,277) 9,857,986 —
Other long-term liabilities:
Accrued Landfill Closure/Post Closure Care Costs — 2,690,137 — 2,690,137 —
Total Other Long-Term Liabilities — 2,690,137 — 2,690,137 —
Total Revenue Bonds (from above) 261,979,540 3,306 (10,964,024) 251,018,822 10,737,000
Total Business-type Activities $ 358,116,977 $ 29,109,469 $ (29,026,898) $ 358,199,548 $ 15,078,306
* Net pension asset not included in last year’s ending balance.

CITY OF COLUMBIA, MISSOURI
Notes to the Basic Financial Statements
September 30, 2016
69 (Continued)
B. Debt Service Requirements to Maturity
The annual requirements to amortize all bonded debt outstanding as of September 30, 2016 totaling $497,141,414
including interest payments of $134,488,563, are as follows:
G o v e rn m e n ta l Ac tiv itie s :
Le m o n e T ru s t Lo a n a n d No te s ,
MT FC Lo a n a n d S p e c ia l
Ye a r e n d in g O b lig a tio n 2 0 16 Re fu n d in g
S e p te m b e r 3 0 P rin c ip a l In te re s t P rin c ip a l In te re s t
2017 $ 3,294,722 1,048,459 2,750,000 3,039,633
2018 3,424,156 914,636 4,705,000 2,923,580
2019 3,569,648 774,329 4,895,000 2,738,452
2020 3,720,772 621,020 5,085,000 2,538,256
2021 2,498,493 471,854 5,270,000 2,333,750
2022–2026 8,207,360 1,093,652 26,475,000 9,210,562
2027–2031 3,495,000 70,450 27,575,000 4,936,515
2032–2036 — — 11,640,000 624,877
$ 28,210,151 $ 4,994,400 $ 88,395,000 $ 28,345,625
Ye a r e n d in g S a n ita ry S e we r Utility
S e p te m b e r 3 0 P rin c ip a l In te re s t P rin c ip a l In te re s t
2017 $ 5,047,000 2,556,717 5,690,000 5,957,288
2018 5,155,000 2,431,620 6,450,000 5,711,663
2019 4,608,900 2,305,838 6,715,000 5,446,263
2020 4,719,000 2,178,676 7,020,000 5,155,213
2021 4,525,100 2,053,678 7,310,000 4,881,213
2022–2026 22,993,300 8,523,444 35,070,000 19,794,750
2027–2031 28,886,700 5,250,009 30,320,000 14,448,666
2032–2036 16,657,700 1,439,210 28,845,000 8,610,516
2037–2041 535,000 10,031 15,755,000 3,492,331
2042–2046 — — 9,745,000 901,412
$ 93,127,700 $ 26,749,223 $ 152,920,000 $ 74,399,315
T O T AL DE B T
S E RVICE RE Q UIRE ME NT S
Ye a r e n d in g T O MAT URIT Y
S e p te m b e r 3 0 P rin c ip a l In te re s t
2017 $ 16,781,722 12,602,097
2018 19,734,156 11,981,499
2019 19,788,548 11,264,882
2020 20,544,772 10,493,165
2021 19,603,593 9,740,495
2022–2026 92,745,660 38,622,408
2027–2031 90,276,700 24,705,640
2032–2036 57,142,700 10,674,603
2037–2041 16,290,000 3,502,362
2042–2046 9,745,000 901,412
$ 362,652,851 $ 134,488,563
W a te r a n d E le c tric
B u s in e s s - ty p e Ac tiv itie s :
2 0 0 9 , 2 0 12 , 2 0 12 B , 2 0 12 C
B u s in e s s - ty p e Ac tiv itie s : ( c o n tin u e d )
Re v e n u e B o n d s
S p e c ia l O b lig a tio n
2 0 12 D, 2 0 12 E , a n d 2 0 15 Re fu n d in g

CITY OF COLUMBIA, MISSOURI
Notes to the Basic Financial Statements
September 30, 2016
(Continued) 70
C. Special Obligation Refunding and Capital Improvement Bonds – Series 2012 B, C, D, E, 2016
In July 2016 the City issued $17,580,000 of Special Obligation Refunding Bonds for the purpose of advance
refunding the 2008B Special Obligation Improvement Bonds, outstanding in the principal amount of $19,785,000.
Interest is paid semiannually on March 1 and September 1 with final payment due on March 1, 2028. The interest
rates on this issue range from 2% to 5%.
In December of 2012, the City issued $39,955,000 of Special Obligation Electric Utility Improvement Bonds. The
bonds are special obligations of the City payable solely from the annual appropriation of funds by the City for that
purpose. The bonds are treated as utility revenue bonds of the Electric Utility, and are secured by pledged revenues
of the Electric Utility. The bonds were issued for the advance refunding of the 2006C Electric special obligation
bonds. Interest is paid semiannually on March 1 and September 1. Principal is due each year on September 1,
through September 2032. At the option of the City bonds are subject to optional redemption and payment prior to
maturity on or after September 1, 2020 at the redemption price of 100% of principal amount redeemed plus accrued
interest on redemption date. The interest rates on this issue range from 2.00% to 4.00%.
In May of 2012, the City issued $1,465,000 of Special Obligation Refunding Bonds, Series B. The bonds are
special obligations of the City payable solely from the annual appropriation of funds by the City for that purpose.
The bonds are to be treated as revenue bonds of the Sanitary Sewer Utility and are secured by a first lien on the
revenues of the system. The bonds were issued to currently refund the 2001A Special Obligation Capital
Improvement Bonds. Principal is due annually on October 1 through October 1, 2020 and interest is payable on
April 1 and October 1. At the option of the City, bonds maturing on and after October 1, 2019, are redeemable on
October 1, 2018 and thereafter at par plus accrued interest. The interest rate on this issue is 2.0%. The bonds
require $146,500 in a debt service reserve account.
In May of 2012, the City issued $2,650,000 of Special Obligation Refunding Bonds, Series C. The bonds are
special obligations of the City payable solely from the annual appropriation of funds by the City for that purpose.
The bonds were issued to currently refund the 2001B Special Obligation Capital Improvement Bonds. Principal is
due annually on February 1 through February 1, 2021 and interest is payable on February 1 and August 1. At the
option of the City, bonds maturing on and after February 1, 2019, are redeemable on February 1, 2018 and thereafter
at par plus accrued interest. The interest rate on this issue is 2.0%.
In May of 2012, the City issued $25,400,000 of Special Obligation Electric Utility Improvement Bonds. The bonds
are special obligations of the City payable solely from the annual appropriation of funds by the City for that purpose.
The bonds are to be treated as utility revenue bonds of the Electric Utility, and are secured by pledged revenues of
the Electric Utility. The bonds were issued for the advance refunding of the 2008A Electric special obligation bonds.
Interest is paid semiannually on April 1 and October 1. Principal is due each year on October 1, through October 1,
2033. At the option of the City bonds maturing on and after October 1, 2021, may be subject to redemption and
payment prior to maturity on or after October 1, 2020 at the redemption price of 100% of the principal amount
redeemed plus accrued interest to the redemption date. The interest rates on this issue range from 2.00% to 5.00%.
The bonds require $1,666,350 in a debt service reserve account.
D. Special Obligation Improvement Bonds – Series 2012A-1, Series 2012 A-2, and Series 2009A
In March of 2012, the City issued $8,925,000 of Taxable and Tax-Exempt Special Obligation Improvement Bonds,
Series A-1 and A-2, $1,665,000 and $7,260,000 respectively. The bonds are special limited obligations of the City,
payable solely from the annual appropriation of funds of the City for that purpose. The bonds were issued for the
purpose of financing the cost of certain capital improvements, making a deposit to the reserve account and paying
costs incident to the issuance of the Bonds. Principal payments are due annually on March 1 through March 1, 2031
and interest payments are due on March 1 and September 1. The A-1 Series Bonds are not subject to optional
redemption. The A-2 Series Bonds maturing on or after March 1, 2021, are redeemable on March 1, 2020 and
thereafter at par plus accrued interest. The interest rates on this issue range from .55% to 4.0%. The bonds require
$621,278 in a debt service reserve account.

CITY OF COLUMBIA, MISSOURI
Notes to the Basic Financial Statements
September 30, 2016
(Continued) 71
In September of 2009, the City issued $13,030,000 of Taxable Special Obligation Improvement Bonds (Build
America Bonds/Direct Subsidy). The bonds are special limited obligations of the City, payable solely from the
annual appropriation of funds of the City for that purpose. The bonds were issued for the purpose of i) providing
funds to acquire, construct and equip extensions, improvements, additions and enlargements of the City’s Parking
Utility; ii) making a deposit to the Debt Service Reserve Account; and iii) paying costs and expenses incident to the
issuance of the Bonds. Interest is paid semiannually on March 1 and September 1. Principal maturities are to be
paid March 1, 2017 and annually thereafter through March 1, 2034. At the option of the City, the Bonds may be
subject to redemption and payment prior to maturity, on March 1, 2019 and thereafter in whole or in part at any time
in any order of maturity selected by the City and by lot in multiples of $5,000 within a maturity, at the redemption
price of 100% of the principal amount thereof, plus accrued interest thereon to the redemption date. The interest
rates on this issue range from 4.3% to 6.2%, prior to the interest subsidy as explained in the following paragraph.
The bonds require $1,071,317 in a debt service reserve account.
The City is making the irrevocable election to have Section 54AA of the Internal Revenue Code of 1986, as
amended (the “Code”) apply to the Bonds so the Bonds may qualify as “build America bonds” (the “BABs”) under
Code Section 54AA(d). The City is further making the irrevocable election to have Section 54AA(g) of the Code
apply to the Bonds so the Bonds qualify as “qualified bonds” under Code Section 54AA(g) in order to receive the
refundable credits allowed to issuers pursuant to Sections 54AA(g)(1) and 6431 of the Code with respect to
“qualified bonds” (the “BABs Interest Subsidy Payments”). Under current law, the BABs Interest Subsidy
Payments are to be paid by the United States directly to any issuer of bonds that qualify as BABs and as “qualified
bonds” in an amount equal to 35% of the interest payable by such issuer on such bonds on each interest payment
date, provided that certain requirements, as described in the Code and related IRS pronouncements, as to the uses
and investment of the bond proceeds and other matters, are continuously satisfied by such issuer. The City is
covenanting to comply with the requirements of the Code necessary to maintain the qualification of the Bonds as
BABs under Code Section 54AA(d) and as “qualified bonds” under Code Section 54AA(g). In 2014, the IRS Office
of Tax Exempt Bonds announced a sequester reduction percentage for payments to issuers of direct pay bonds and
the 35% subsidy was reduced by 7.2%.
E. Special Obligation Notes - 2010
In December 2010 the City assumed a bank loan in the amount of $2,550,000 taken by Columbia Area Jobs
Foundation (CAJF) to pay Robert F LeMone Trust for the purchase of 2810 LeMone Industrial Boulevard (the IBM
building). This loan has an interest rate of 5.25% and will be paid in monthly installments commencing February 1,
2011 and maturing December 31, 2020. Additionally, the city paid interest due from the initiation of the loan in
May 2010 through December 2010. City funds are held in escrow at Boone County National Bank equal to the
outstanding principal of the loan. Interest payments are subject to annual appropriation.
In December 2010 the City assumed a bank loan in the amount of $9,229,723 taken by the Columbia Area Jobs
Foundation (CAJF) to fund reconstruction of the building located at 2810 LeMone Industrial Boulevard (the IBM
building). This loan has an interest rate of 6% and will be paid in monthly installments commencing February 1,
2011 and maturing October 1, 2020. The loan is not a general liability of the City except to the extent of fixed rental
income from the lease of the property. The City assumed the ten year lease for the property between CAJF and
IBM. The lender may not satisfy or seek a repayment of any sum due pursuant to the Loan from the City except by
foreclosing on the items of collateral which secure the payment of the loan (the IBM building).
F. Direct Loan Agreement – Missouri Transportation Finance Corporation
In July 2008 the City was authorized to execute a direct loan agreement and promissory note with the Missouri
Transportation Finance Corporation (MTFC) for transportation improvements to the Stadium Boulevard corridor
from Broadway to I-70. The MTFC deposited the loan proceeds in three disbursements. The first disbursement of
$1.5 million was received by the City in March 2012. The second disbursement of $1 million was deposited to the
Missouri Transportation Commission’s Local Fund on behalf of the City in March 2012. The third and final
disbursement was made October 1, 2012 to the Local Fund in the amount of $5.7 million for a total of $8.2 million.

CITY OF COLUMBIA, MISSOURI
Notes to the Basic Financial Statements
September 30, 2016
(Continued) 72
The loan has an interest rate of 3.92% and will be paid in semi-annual installments commencing September 1, 2012
and maturing March 1, 2022. The loan is to be repaid with revenues received from the Columbia Mall
Transportation Development District, the Shoppes at Stadium Transportation Development District and the Stadium
Corridor Transportation Development District. Should these revenues be insufficient to meet the debt service
requirements the City is responsible for the balance.
G. Special Obligation Refunding and Capital Improvement Bonds - Series 2015, 2006, and 2006B
On December 8, 2015 the City of Columbia issued $7,080,000 in Special Obligation refunding bonds with an
average interest rate of 3.069% to currently refund $8,855,000 of outstanding 2006 Special Obligation bonds with an
interest rate ranging from 4.00% to 5.00%. The interest in paid semiannually on February 1 and August 1. Principal
payments are due on February 1. The final payment is due on August 1 2026. The Bonds are special limited
obligations of the City, payable solely from the annual appropriation of the funds by the City for that purpose. The
reacquisition price was greater than the net carrying amount of the old debt by $1,030,713. This amount is being
netted against the new debt and amortized over the remaining life of the current debt, which is the same as the life of
the refunded debt. As a result of the current refunding the City reduced its total debt service requirements by
$2,667,087, which resulted in an economic gain of $648,817.
In June of 2006, the City issued $25,615,000 of Special Obligation Revenue Refunding and Improvement Bonds for
the purpose of i) advance refunding the Certificates of Participation (City of Columbia, Missouri, Lessee), Series
2001A, outstanding in the principal amount of $2,085,000; ii) funding certain public safety and road capital
improvements within the City; iii) making a deposit to the Debt Service Reserve Account; and iv) paying costs of
issuance. Interest is paid semiannually on February 1 and August 1. Principal payments are due on February 1. The
final payment is due February 1, 2016. The interest rate on this issue is 5.00%. The Bonds are special limited
obligations of the City, payable solely from the annual appropriation of funds by the City for that purpose. The
bonds require $2,561,500 in a debt service reserve account.
On February 1, 2006, the City issued $20,005,000 of Special Obligation Revenue Refunding and Improvement
Bonds for the purpose of i) currently refunding the outstanding portion of the City’s Special Obligation Refunding
and Capital Improvement Bonds, Series 1996; ii) currently refunding the outstanding portion of the City’s Parking
Utility Revenue Bonds, Series 1995; iii) construction, improving and extending the City-owned sanitary sewer
utility; iv) construction and improving the City-owned solid waste utility; v) funding a debt service reserve account;
vi) paying cost of issuance. Interest is paid semiannually on February 1 and August 1. Principal payments are due on
February 1. The final payment is due February 1, 2026. Interest rates on this issue range from 4.00% to 5.00%. The
Bonds are special limited obligations of the City, payable solely from the annual appropriation of funds by the City
for that purpose. The bonds require $1,752,268 in a debt service reserve account. This bond was refunded on
December 7, 2015.
H. Water and Electric Revenue Bonds – 2015 Series, 2014 Series, 2011 Series, and 2009 Series
In August of 2015, the City issued $51,280,000 of Water and Electric System Revenue Refunding Bonds. The bonds
are to be paid by the net revenues of the system and certain accounts under the Ordinance to the extent pledged
under the Ordinance. $18,065,000 of the bonds was issued for the current refunding of the 2005A Water and Electric
System Revenue Bonds and $33,215,000 was issued to provide funding for improvements in the Electric Utility.
Interest is paid semiannually on April 1 and October 1. Principal is due each year on October 1, through October 1,
2045. At the option of the City, the bonds or portions thereof maturing on October 1, 2024 and thereafter may be
called for redemption and payment prior to their stated maturity on October 1, 2023 and thereafter, in whole or in
part at any time in any order of maturity selected by the City and by lot in multiples of $5,000 within a maturity, at
the redemption price equal to the principal amount thereof, plus accrued interest thereon to the date of redemption.
The interest rates on this issue range from 3.00% to 5.00%. The bonds require $3,684,714 in a debt service reserve
account.
In July of 2014, the City issued $14,180,000 of Water and Electric System Revenue Refunding Bonds. The bonds
are to be paid by the net revenues of the system and certain accounts under the Ordinance to the extent pledged

CITY OF COLUMBIA, MISSOURI
Notes to the Basic Financial Statements
September 30, 2016
(Continued) 73
under the Ordinance. The bonds were issued for the current refunding of the 2003A Water and Electric System
Revenue Refunding Bonds and the advance refunding of the 2004A Water and Electric System Revenue Bonds.
Interest is paid semiannually on April 1 and October 1. Principal is due each year on October 1, through October 1,
2028. At the option of the City, the bonds or portions thereof maturing on October 1, 2023 and thereafter may be
called for redemption and payment prior to their stated maturity on October 1, 2022 and thereafter, in whole or in
part at any time in any order of maturity selected by the City and by lot in multiples of $5,000 within a maturity, at
the redemption price equal to the principal amount thereof, plus accrued interest thereon to the date of redemption.
The interest rates on this issue range from 2.00% to 3.00%. The bonds require $1,418,000 in a debt service reserve
account.
In May of 2011, the City issued $84,180,000 of Water and Electric System Revenue Bonds. The bonds are to be
paid by the net revenues of the system and are secured by a first lien on the revenues. $12,465,000 of the bonds were
issued to refund $11,680,000 of the outstanding 2002 Water and Electric Revenue Bonds, $49,500,000 was issued to
purchase the Columbia Energy Center, and $22,215,000 was issued to provide funding for improvements and
additions to the City’s waterworks facilities. Interest is paid semiannually on April 1 and October 1. Principal is due
each year on October 1 through October 1, 2041. Bonds maturing on October 1, 2020, and thereafter are subject to
redemption prior to maturity at the option of the City at any time on or after October 1, 2019, at redemption price of
100% of the principal amount redeemed plus accrued interest to the redemption date. The interest rates on this issue
range from 3.00% to 5.00%.
In September of 2009, the City issued $16,725,000 of Water and Electric System Revenue Bonds. The bonds are to
be paid by the net revenues of the system and are secured by a first lien on the revenues. The bonds were issued to
provide funding for improvements and additions to the City’s waterworks. Interest is paid semiannually on April 1
and October 1. Principal is due each year on October 1 through October 1, 2034. Bonds maturing on October 1,
2020, and thereafter are subject to redemption prior to maturity at the option of the City at any time on or after
October 1, 2019, at redemption price of 100% of the principal amount redeemed plus accrued interest to the
redemption date. The interest rates on this issue range from 3.00% to 4.125%.
The bond ordinances require 110% coverage of the aggregate debt service for each fiscal year. The Water and
Electric Utility Fund is required to be accounted for in a separate enterprise fund under the bond ordinances. These
ordinances also require that after sufficient current assets have been set aside to operate the fund, all remaining
monies held by the fund be restricted in separate accounts in the following sequence:
Nature of accounts Amount Authorized expenditures
(a) Current bond maturities and
interest
Monthly accumulations equal to
semiannual debt service.
Paying current principal and interest on
bonds.
(b) Revenue bond reserve Amount equal to 1/60th of the debt
service requirements until said
account shall equal the debt reserve
requirements in the amount of
$18,602,525.
Paying principal and interest in the event of
a deficiency in the current bond maturities
and interest account.
(c) Renewal and replacement
account
Amount of $25,000 per month. Such
payments shall be continued until the
amount deposited and held in said
fund shall equal $1,500,000.
Paying unforeseen contingencies and
meeting emergencies arising in the operation
of the system.
(d) Revenue bond construction To account for revenue bond issue
proceeds prior to their expenditure for
construction of utility plant.
To provide funds to pay construction cost to
the extent such monies are available.

CITY OF COLUMBIA, MISSOURI
Notes to the Basic Financial Statements
September 30, 2016
(Continued) 74
I. Sanitary Sewer Revenue Bonds – 2015 Series, 2013 Refunding Series, 2012 Series, 2010 Series A, 2009
Series, 2007 Series B, 2006 Series B, 2004 Series B, 2003 Series B, 2002 Series A, 2000 Series B, 1999 Series A,
and 1999 Series B
In March of 2015, the City issued $18,200,000 of Sewerage System Revenue Bonds. These bonds are to be paid by
the net revenues of the system, and are secured by a first lien on the revenues of the system. These bonds were
issued for extending and improving the sewerage system. Payments of principal are due on October 1 of each year
through October 1, 2035, and interest payments are due on April 1 and October 1. The bonds maturing on and after
October 1, 2024, are redeemable on October 1, 2023 and thereafter at par plus accrued interest. The interest rates
range from 3.0% to 5.0% on this issue. The bonds require $1,232,886 in a debt service reserve account.
The City issued $3,325,000 of Sewerage System Revenue Refunding Bonds in July of 2013. These bonds are
special, limited obligations of the City, payable by the net revenues of the system. These bonds were issued to
refund the 2002 Sewerage System Revenue Refunding Bonds. Payments of principal are due on October 1 of each
year through October 1, 2017, and interest payments are due on October 1 and April 1. The interest rates range from
.38% to 1.10% on this issue.
In March of 2012, the City issued $9,365,000 of Sewerage System Revenue Bonds, Series A. These bonds are to be
paid by the net revenues of the system, and are secured by a first lien on the revenues of the system. These bonds
were issued for extending and improving the sewerage system. Payments of principal are due on October 1 of each
year through October 1, 2036, and interest payments are due on April 1 and October 1. The bonds maturing on and
after October 1, 2021, are redeemable on October 1, 2020 and thereafter at par plus accrued interest. The interest
rates range from .35% to 3.75% on this issue. The bonds require $550,070 in a debt service reserve account.
The City issued $59,335,000 of Sewerage System Revenue Bonds, Series A in January of 2010. This issue had a
not to exceed amount of $59,335,000. The final drawdown has been made and the total was $58,030,645. As of
September 30, 2015, $51,678,000 is outstanding and recorded as revenue bonds payable in the Sanitary Sewer
Utility Fund. These bonds are to be paid by the net revenues of the system, and are secured by a first lien on the
revenues of the system. These bonds were issued for extending and improving the sewerage system. Payments of
principal are due on each January 1 and July 1 beginning July 1, 2013 through July 1, 2032. Interest payments are
due on January 1 and July 1. The Bonds may be called for redemption and payment prior to stated maturity in
whole or in part at any time, at the redemption price of 100% of the principal amount thereof plus accrued interest
thereon to the date of redemption. The interest rate on this issue is 1.49%.
In September of 2009, the City issued $10,405,000 of Taxable Sewerage System Revenue Bonds (Build America
Bonds/Direct Subsidy). The bonds are special limited obligations of the City, payable solely from the net income
and revenues derived by the City from the operation of its sewerage system, after payment of costs of operation and
maintenance. The bonds were issued for the purpose of i) providing funds to acquire, construct and equip
extensions, improvements, additions and enlargements of the City’s Sewer System; ii) making a deposit to the Debt
Service Reserve Account; and iii) paying costs and expenses incident to the issuance of the Bonds. Interest is paid
semiannually on April 1 and October 1. Principal maturities are to be paid October 1, 2024 and annually thereafter
through October 1, 2034. At the option of the City, the Bonds may be subject to redemption and payment prior to
maturity, on October 1, 2019 and thereafter in whole or in part at any time in any order of maturity selected by the
City and by lot in multiples of $5,000 within a maturity, at the redemption price of 100% of the principal amount
thereof, plus accrued interest thereon to the redemption date. The interest rates on this issue range from 5.44% to
6.02%, prior to the interest subsidy as explained in the following paragraph.
The City is making the irrevocable election to have Section 54AA of the Internal Revenue Code of 1986, as
amended (the “Code”) apply to the Bonds so the Bonds may qualify as “build America bonds” (the “BABs”) under
Code Section 54AA(d). The City is further making the irrevocable election to have Section 54AA(g) of the Code
apply to the Bonds so the Bonds qualify as “qualified bonds” under Code Section 54AA(g) in order to receive the
refundable credits allowed to issuers pursuant to Sections 54AA(g)(1) and 6431 of the Code with respect to
“qualified bonds” (the “BABs Interest Subsidy Payments”). Under current law, the BABs Interest Subsidy
Payments are to be paid by the United States directly to any issuer of bonds that qualify as BABs and as “qualified

CITY OF COLUMBIA, MISSOURI
Notes to the Basic Financial Statements
September 30, 2016
(Continued) 75
bonds” in an amount equal to 35% of the interest payable by such issuer on such bonds on each interest payment
date, provided that certain requirements, as described in the Code and related IRS pronouncements, as to the uses
bonds” in an amount equal to 35% of the interest payable by such issuer on such bonds on each interest payment
date, provided that certain requirements, as described in the Code and related IRS pronouncements, as to the uses
and investment of the bond proceeds and other matters, are continuously satisfied by such issuer. The City is
covenanting to comply with the requirements of the Code necessary to maintain the qualification of the Bonds as
BABs under Code Section 54AA(d) and as “qualified bonds” under Code Section 54AA(g). In 2014, the IRS Office
of Tax Exempt Bonds announced a sequester reduction percentage for payments to issuers of direct pay bonds and
the 35% subsidy was reduced by 7.2%.
The City issued $1,800,000 of Sewerage System Bonds, Series B in November of 2007. These bonds are to be paid
by the net revenues of the system, and are secured by a first lien on the revenues of the system. These bonds were
issued for extending and improving the sewerage system. Payments of principal are due on January 1 of each year,
beginning in 2009, through January 1, 2028, and interest payments are due on January 1 and July 1. The bonds
maturing on and after January 1, 2018, are redeemable on each June 1 and December 1, commencing on December
1, 2016, at par plus accrued interest. The interest rates range from 4.00% to 5.00% on this issue.
The City issued $915,000 of Sewerage System Bonds, Series B in November of 2006. These bonds are to be paid
by the net revenues of the system, and are secured by a first lien on the revenues of the system. These bonds were
issued for extending and improving the sewerage system. Payments of principal are due on July 1 of each year,
beginning in 2007, through July 1, 2026, and interest payments are due on January 1 and July 1. The bonds
maturing on and after July 1, 2017, are redeemable on each June 1 and December 1, commencing on June 1, 2016,
at par plus accrued interest. The interest rates range from 4.00% to 5.00% on this issue.
The City issued $650,000 of Sewerage System Bonds, Series B in May of 2004. These bonds are to be paid by the
net revenues of the system, and are secured by a first lien on the revenues of the system. These bonds were issued
for extending and improving the sewerage system. Payments of principal are due on January 1 of each year through
January 1, 2025, and interest payments are due on January 1 and July 1. The bonds maturing on and after
January 1, 2015, are redeemable on each June 1 and December 1, commencing on June 1, 2014, at par plus accrued
interest. The interest rates range from 2.00% to 5.25% on this issue.
The City issued $3,620,000 of Sewerage System Revenue Bonds, Series B in May of 2003. These bonds are to be
paid by the net revenues of the system, and are secured by a first lien on the revenues of the system. These bonds
were issued for extending and improving the sewerage system. Payments of principal are due on January 1 of each
year through January 1, 2024, and interest payments are due on January 1 and July 1. The bonds maturing on and
after January 1, 2014, are redeemable on each June 1 and December 1, commencing on December 1, 2012, at par
plus accrued interest. The interest rates range from 2.00% to 5.25% on this issue.
The City issued $2,230,000 of Sewerage System Revenue Bonds, Series A in May of 2002. These bonds are to be
paid by the net revenues of the system, and are secured by a first lien on the revenues of the system. These bonds
were issued for extending and improving the sewerage system. Payments of principal are due on January 1 of each
year through January 1, 2023, and interest payments are due on January 1 and July 1. The bonds maturing on and
after January 1, 2013, are redeemable on each June 1 and December 1, commencing on June 1, 2012, at par plus
accrued interest. The interest rates range from 3.0% to 5.375% on this issue.
The City issued $2,445,000 of Sewerage System Revenue Bonds, Series B in November of 2000. These bonds are to
be paid by the net revenues of the system, and are secured by a first lien on the revenues of the system. These bonds
were issued for extending and improving the sewerage system. Payments of principal are due on July 1 of each year
through July 1, 2021, and interest payments are due on January 1 and July 1. The bonds maturing on and after
July 1, 2013, are redeemable on each June 1 and December 1, commencing on December 1, 2010, at par plus
accrued interest. The interest rates range from 4.350% to 5.625% on this issue.
The City issued $1,420,000 of Sewerage System Revenue Bonds, Series B in December of 1999. These bonds are to
be paid by the net revenues of the system, and are secured by a first lien on the revenues of the system. These bonds

CITY OF COLUMBIA, MISSOURI
Notes to the Basic Financial Statements
September 30, 2016
(Continued) 76
were issued for extending and improving the sewerage system. Payments of principal are due on July 1 of each year
through July 1, 2020, and interest payments are due on January 1 and July 1. The bonds maturing on and after
July 1, 2011, are redeemable on each June 1 and December 1, commencing on June 1, 2010, at par plus accrued
interest. The interest rates range from 4.125% to 6.000% on this issue.
The City issued $3,730,000 of Sewerage System Revenue Bonds, Series A in June of 1999. These bonds are to be
paid by the net revenues of the system, and are secured by a first lien on the revenues of the system. These bonds
were issued for extending and improving the sewerage system. Payments of principal are due on January 1 of each
year through January 1, 2020, and interest payments are due on January 1 and July 1. The bonds maturing on and
after January 1, 2010, are redeemable on each June 1, and December 1, commencing on June 1, 2009, at par plus a
premium of 1% reduced by .5% each year thereafter to June 1, 2011. The interest rates range from 3.625% to 5.25%
on this issue.
The bond ordinances require 110% coverage of the aggregate debt service for each fiscal year. In compliance with
the bond ordinances, the Sanitary Sewer Utility Fund is accounted for in a separate enterprise fund. Additional bond
ordinance requirements provide for the restricting of operating revenues after current operating expenses have been
met. These restrictions occur in the following sequence:
Nature of accounts Amount Authorized expenditures
(a) Operation and mainte-
nance
Equal to one month’s operating
expenses of the utility.
Operating expenses when non-
restricted current assets are not
available for payment.
(b) Sinking fund (cash with
fiscal agent)
Current fiscal year bond maturity
and interest accumulated monthly.
Payment of current principal and
interest on bonds.
(c) Revenue bond reserve Amount equal to $624,241 for the
2006 Special Obligation Bonds,
$937,989 for the 2009 Revenue
Bonds, $550,070 for the 2012
Revenue Bonds, $131,000 for the
2012B Special Obligation
Refunding Bonds and $1,232,886
for the 2015 Revenue Bonds.
Payment of principal and interest
due on bonds when other funds are
unavailable.
(d) Contingency Amount of $2,000 per month.
Such payments shall continue
until the amount deposited and
held in said fund shall equal
$200,000.
Unforeseen contingencies; emer-
gencies affecting operation and
maintenance replacement for
effective and efficient operation.
(e) Revenue bond
construction
To account for revenue bond issue
proceeds prior to expenditure for
construction of utility plant addi-
tions.
Cost of construction projects.
In November 2013, voters approved the issuance of $32,340,000 of Sanitary Sewer Revenue bonds and as of
September 30, 2016, there is $21,561,000 remaining from this authorization that has not been issued.

CITY OF COLUMBIA, MISSOURI
Notes to the Basic Financial Statements
September 30, 2016
(Continued) 77
J. Capital Lease Agreements
1. Governmental Activities:
In December 2013, the City entered into a lease purchase agreement as lessee for financing the acquisition of computer
equipment for the Information Technology Department. Lease payments began in March 2014 when the equipment was
received. This agreement qualifies as a capital lease for accounting purposes; the City will make thirty six monthly payments
including interest of 1.84%.
The following schedule provides an analysis of the City’s investment in capital assets under lease arrangements as of
September 30, 2016:
Furniture, fixtures and equipment $71,247
Less: Accumulated depreciation (40,374)
(9,676) Total net book value of lease assets $30,873
Future minimum lease payments for this lease are as follows:
Debt
Governmental
Activities
Year ending September 30:
2017 10,178
Total minimum lease payment 10,178
Less interest amount 46
Present value of net minimum
lease payment $ 10,132
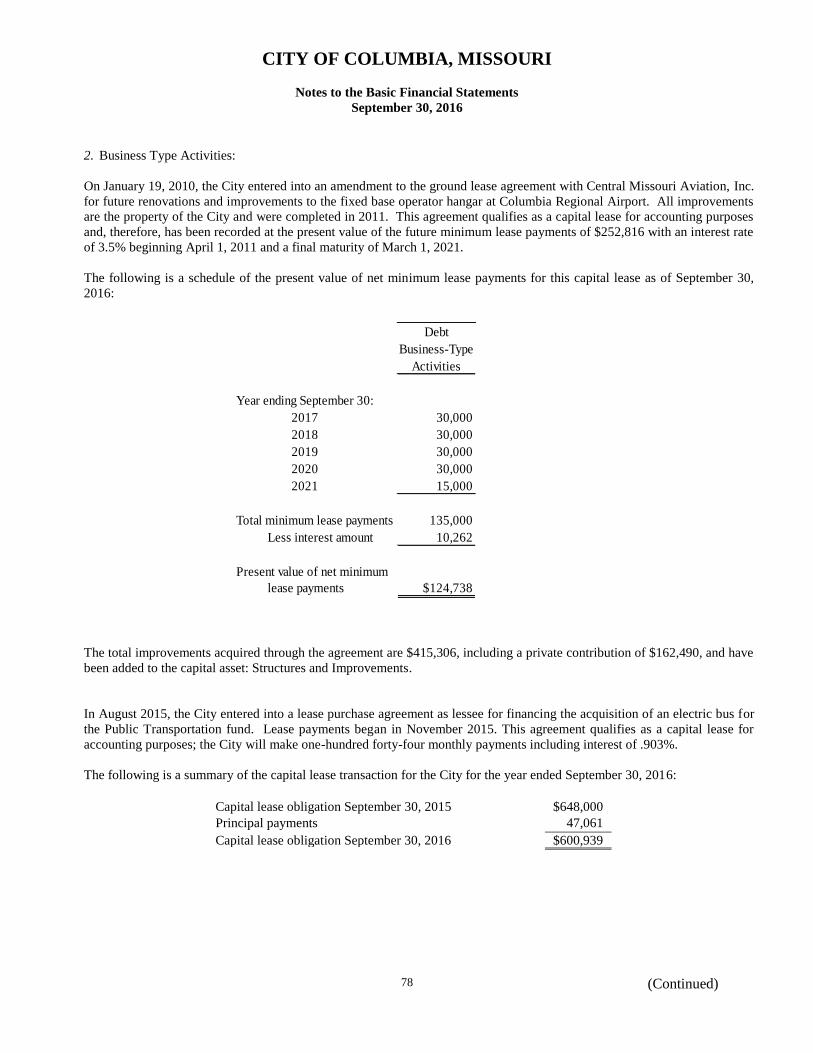
CITY OF COLUMBIA, MISSOURI
Notes to the Basic Financial Statements
September 30, 2016
(Continued) 78
2. Business Type Activities:
On January 19, 2010, the City entered into an amendment to the ground lease agreement with Central Missouri Aviation, Inc.
for future renovations and improvements to the fixed base operator hangar at Columbia Regional Airport. All improvements
are the property of the City and were completed in 2011. This agreement qualifies as a capital lease for accounting purposes
and, therefore, has been recorded at the present value of the future minimum lease payments of $252,816 with an interest rate
of 3.5% beginning April 1, 2011 and a final maturity of March 1, 2021.
The following is a schedule of the present value of net minimum lease payments for this capital lease as of September 30,
2016:
The total improvements acquired through the agreement are $415,306, including a private contribution of $162,490, and have
been added to the capital asset: Structures and Improvements.
In August 2015, the City entered into a lease purchase agreement as lessee for financing the acquisition of an electric bus for
the Public Transportation fund. Lease payments began in November 2015. This agreement qualifies as a capital lease for
accounting purposes; the City will make one-hundred forty-four monthly payments including interest of .903%.
The following is a summary of the capital lease transaction for the City for the year ended September 30, 2016:
Capital lease obligation September 30, 2015 $648,000
Principal payments 47,061
061
-
Capital lease obligation September 30, 2016
$600,939
Debt
Business-Type
Activities
Year ending September 30:
2017 30,000
2018 30,000
2019 30,000
2020 30,000
2021 15,000
Total minimum lease payments 135,000
Less interest amount 10,262
Present value of net minimum
lease payments $124,738
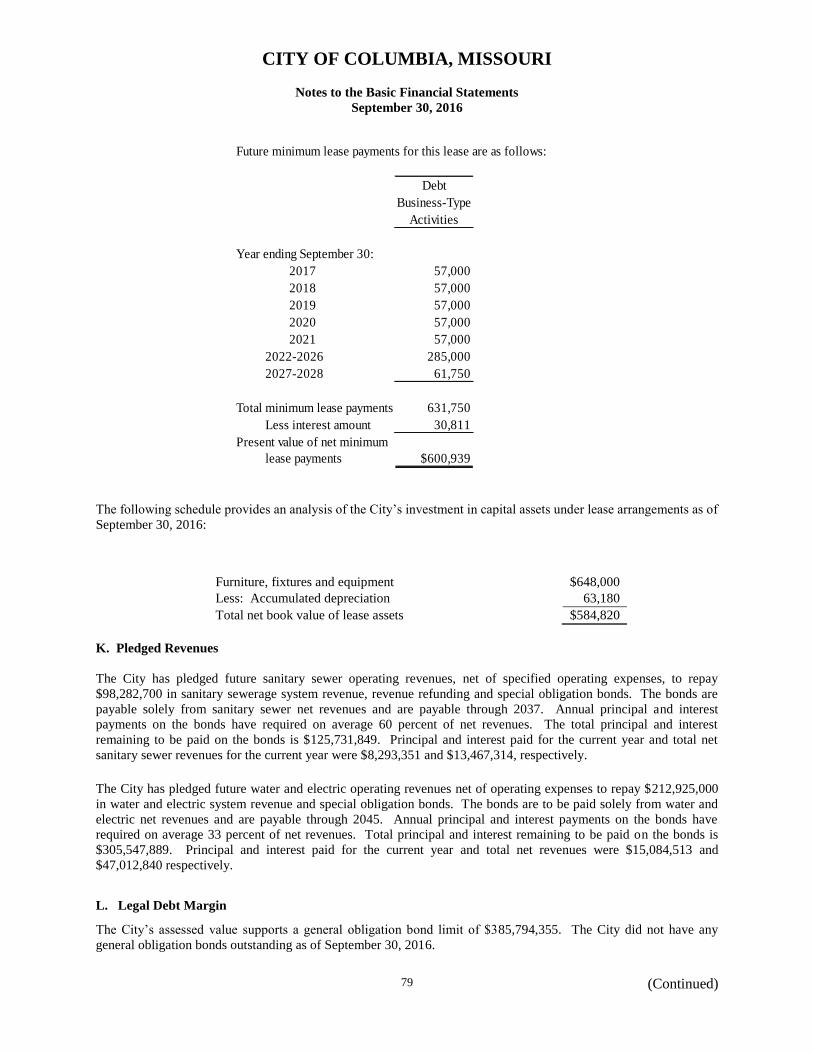
CITY OF COLUMBIA, MISSOURI
Notes to the Basic Financial Statements
September 30, 2016
(Continued) 79
The following schedule provides an analysis of the City’s investment in capital assets under lease arrangements as of
September 30, 2016:
Furniture, fixtures and equipment $648,000
Less: Accumulated depreciation 63,180
Total net book value of lease assets $584,820
K. Pledged Revenues
The City has pledged future sanitary sewer operating revenues, net of specified operating expenses, to repay
$98,282,700 in sanitary sewerage system revenue, revenue refunding and special obligation bonds. The bonds are
payable solely from sanitary sewer net revenues and are payable through 2037. Annual principal and interest
payments on the bonds have required on average 60 percent of net revenues. The total principal and interest
remaining to be paid on the bonds is $125,731,849. Principal and interest paid for the current year and total net
sanitary sewer revenues for the current year were $8,293,351 and $13,467,314, respectively.
The City has pledged future water and electric operating revenues net of operating expenses to repay $212,925,000
in water and electric system revenue and special obligation bonds. The bonds are to be paid solely from water and
electric net revenues and are payable through 2045. Annual principal and interest payments on the bonds have
required on average 33 percent of net revenues. Total principal and interest remaining to be paid on the bonds is
$305,547,889. Principal and interest paid for the current year and total net revenues were $15,084,513 and
$47,012,840 respectively.
L. Legal Debt Margin
The City’s assessed value supports a general obligation bond limit of $385,794,355. The City did not have any
general obligation bonds outstanding as of September 30, 2016.
Future minimum lease payments for this lease are as follows:
Debt
Business-Type
Activities
Year ending September 30:
2017 57,000
2018 57,000
2019 57,000
2020 57,000
2021 57,000
2022-2026 285,000
2027-2028 61,750
Total minimum lease payments 631,750
Less interest amount 30,811
Present value of net minimum
lease payments $600,939
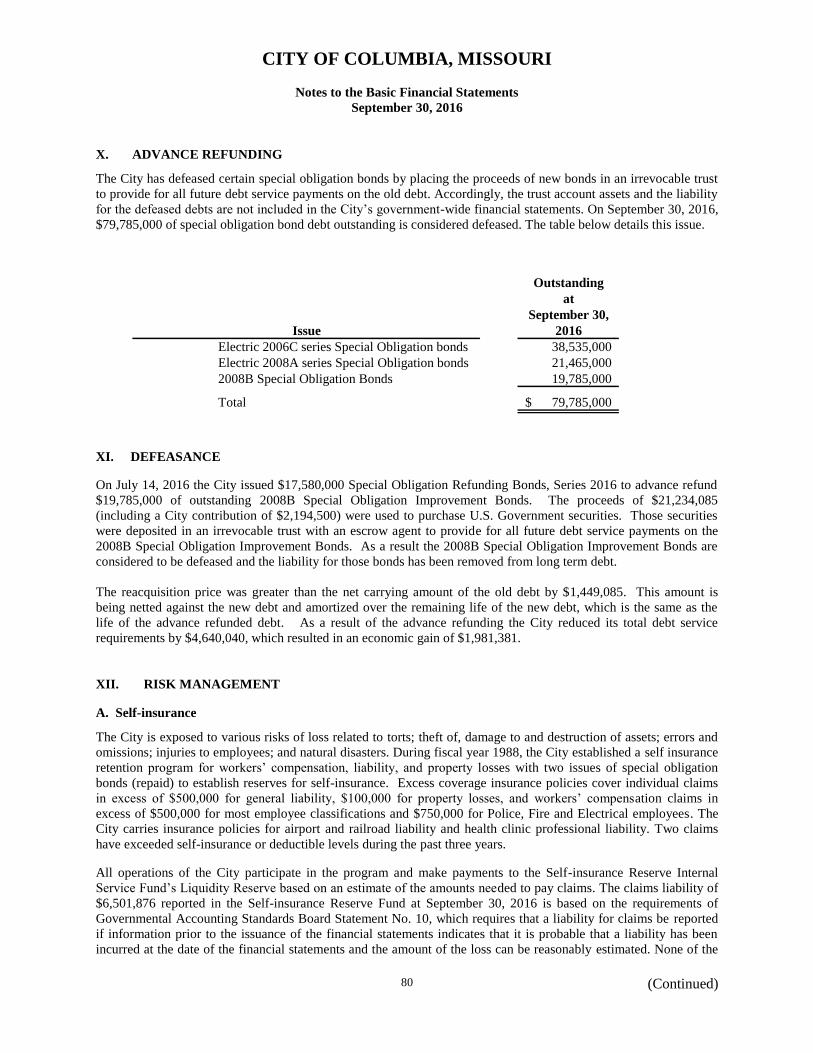
CITY OF COLUMBIA, MISSOURI
Notes to the Basic Financial Statements
September 30, 2016
(Continued) 80
X. ADVANCE REFUNDING
The City has defeased certain special obligation bonds by placing the proceeds of new bonds in an irrevocable trust
to provide for all future debt service payments on the old debt. Accordingly, the trust account assets and the liability
for the defeased debts are not included in the City’s government-wide financial statements. On September 30, 2016,
$79,785,000 of special obligation bond debt outstanding is considered defeased. The table below details this issue.
Outstanding
at
September 30,
Issue 2016
Electric 2006C series Special Obligation bonds 38,535,000
Electric 2008A series Special Obligation bonds 21,465,000
2008B Special Obligation Bonds 19,785,000
Total 79,785,000$
XI. DEFEASANCE
On July 14, 2016 the City issued $17,580,000 Special Obligation Refunding Bonds, Series 2016 to advance refund
$19,785,000 of outstanding 2008B Special Obligation Improvement Bonds. The proceeds of $21,234,085
(including a City contribution of $2,194,500) were used to purchase U.S. Government securities. Those securities
were deposited in an irrevocable trust with an escrow agent to provide for all future debt service payments on the
2008B Special Obligation Improvement Bonds. As a result the 2008B Special Obligation Improvement Bonds are
considered to be defeased and the liability for those bonds has been removed from long term debt.
The reacquisition price was greater than the net carrying amount of the old debt by $1,449,085. This amount is
being netted against the new debt and amortized over the remaining life of the new debt, which is the same as the
life of the advance refunded debt. As a result of the advance refunding the City reduced its total debt service
requirements by $4,640,040, which resulted in an economic gain of $1,981,381.
XII. RISK MANAGEMENT
A. Self-insurance
The City is exposed to various risks of loss related to torts; theft of, damage to and destruction of assets; errors and
omissions; injuries to employees; and natural disasters. During fiscal year 1988, the City established a self insurance
retention program for workers’ compensation, liability, and property losses with two issues of special obligation
bonds (repaid) to establish reserves for self-insurance. Excess coverage insurance policies cover individual claims
in excess of $500,000 for general liability, $100,000 for property losses, and workers’ compensation claims in
excess of $500,000 for most employee classifications and $750,000 for Police, Fire and Electrical employees. The
City carries insurance policies for airport and railroad liability and health clinic professional liability. Two claims
have exceeded self-insurance or deductible levels during the past three years.
All operations of the City participate in the program and make payments to the Self-insurance Reserve Internal
Service Fund’s Liquidity Reserve based on an estimate of the amounts needed to pay claims. The claims liability of
$6,501,876 reported in the Self-insurance Reserve Fund at September 30, 2016 is based on the requirements of
Governmental Accounting Standards Board Statement No. 10, which requires that a liability for claims be reported
if information prior to the issuance of the financial statements indicates that it is probable that a liability has been
incurred at the date of the financial statements and the amount of the loss can be reasonably estimated. None of the

CITY OF COLUMBIA, MISSOURI
Notes to the Basic Financial Statements
September 30, 2016
(Continued) 81
claims liability have been discounted. The City has not purchased annuity contracts from commercial insurers to
satisfy liabilities for any claim, therefore, no liability for claims has been removed from the balance sheet. Changes
in the claims liability amount in fiscal years 2015 and 2016 were:
Current year
Beginning Claims and Balance
of fiscal year changes in Claim fiscal
liability estimates payments year-end
9/30/2015 $ 5,487,590 $ 3,532,227 $ (2,696,444) $ 6,323,373
9/30/2016 $ 6,323,373 $ 2,394,233 $ (2,215,730) $ 6,501,876
B. Employees’ Health Plan
The Employee Benefit Internal Service Fund accounts for the transactions and reserves associated with the City’s
medical, dental, prescription drug, life, and long-term disability programs for City employees. Coverage for health,
dental, and prescription drug plans are self-insured. The City has a stop-loss attachment point of $100,000 per
person. Other coverages are with commercial insurance carriers.
Incurred but not reported claims of $1,075,710 are reported in the Employee Benefit Fund as of September 30, 2016.
These medical, prescription, and dental reserves are estimated based on submitted claim lag reports using a 15-
month run-off, which are adjusted for inflation/utilization trends, plan design and population changes. Changes in
the claims liability amount in fiscal years 2015 and 2016 were:
Current year
Beginning Claims and Balance
of fiscal year changes in Claim fiscal
liability estimates payments year-end
9/30/2015 $ 891,500 $ 10,339,046 $ (10,099,646) $ 1,130,900
9/30/2016 $ 1,130,900 $ 10,196,593 $ (10,251,783) $ 1,075,710
XIII. LANDFILL CLOSURE AND POSTCLOSURE CARE COSTS
State and federal laws and regulations require that the City of Columbia place a final cover on its landfill when
closed and perform certain maintenance and monitoring functions at the landfill site for thirty years after closure.
During fiscal year 1994, the City adopted the provisions of Governmental Accounting Standards Board (GASB)
Statement No. 18, Accounting for Municipal Solid Waste Landfill Closure and Postclosure Care Costs. GASB No.
18 requires that, in addition to recognizing operating expenses related to current activities of the landfill, an expense
provision and related liability be recognized for future closure and postclosure care costs that will be incurred near
or after the date the landfill no longer accepts waste. The recognition of these landfill closure and postclosure care
costs is accrued ratably over the useful life of the landfill based on the portion of the landfill used during the year
and is being recorded in the Solid Waste Utility Enterprise Fund.
Landfill closure and postclosure costs to date are $8,569,945 which is based on 66.92% usage of the landfill. The
recorded liability is $2,690,137 as of September 30, 2016. The City will recognize the remaining costs of closure
and postclosure care of $1,956,540 as the remaining capacity is filled. The estimated total current costs of the
landfill closure and postclosure care ($10,526,485) is based on the amount that would be paid if all equipment,
facilities, and services required to close, monitor and maintain the landfill were acquired as of September 30, 2016.
However, the actual cost of closure and postclosure care may be higher due to inflation, changes in technology, or
changes in landfill laws and regulations. The estimated remaining life of the landfill is approximately 12 years.

CITY OF COLUMBIA, MISSOURI
Notes to the Basic Financial Statements
September 30, 2016
(Continued) 82
The City of Columbia has executed a contract of obligation with the Missouri Department of Natural Resources for
landfill closure and postclosure care costs. This financial assurance instrument allows the Missouri Department of
Natural Resources to collect the required amount from any state funds which could be dispersed to the City should
the City fail to perform closure or postclosure care activities.
XIV. CONTINGENCIES
A. Grants
The City receives significant financial assistance from numerous federal, state, and local governmental agencies in
the form of grants. The disbursement of funds received under these programs generally requires compliance with
terms and conditions specified in the grant agreements and are subject to audit by the grantor agencies. Any
disallowed claims resulting from such audits could become a liability of the General Fund or other applicable funds.
However, in the opinion of management, any such disallowed claims will not have a material effect on any of the
financial statements of the individual fund types included herein or on the overall financial position of the City at
September 30, 2016.
B. Litigation
Various suits and claims against the City are presently pending involving claims for personal injury, tax appeals, and
miscellaneous cases. In the opinion of management, both individually and in the aggregate, such suits or claims will
not have a material effect on the financial position of the City.
XV. EMPLOYEE RETIREMENT SYSTEMS AND PLANS
Except for Railroad employees, all full-time, regular employees of the City of Columbia participate in one of three
retirement plans. The City administers two single-employer defined benefit pension plans, the Police Retirement
Fund which covers full-time regular police officers, and the Firefighters’ Retirement Fund which covers full-time
regular firefighters. The Authority to provide pensions for Police and Firefighters is established in Revised Statutes
of Missouri (RSMo) Section 86.583, and firefighters’ retirement and relief systems for all municipalities in RSMo
Section 87.005-87.105. Benefit provisions and contribution requirements are established by City ordinance, and may
be amended by City ordinance. Management of the retirement plans is vested in the Police Retirement Board and
the Firefighters’ Retirement Board. Each board shall consist of five (5) members, two (2) of whom shall be
members of each department, two (2) of whom shall be registered voters and residents of the city. The chief of each
department shall be an ex officio, nonvoting member of the board.
The City participates in the Missouri Local Government Employees Retirement System (LAGERS) which is a
defined benefit pension plan that provides certain retirement, disability and death benefits to plan members and
beneficiaries. This plan covers substantially all of the City’s employees not covered by the Police or Firefighters
Retirement Funds. LAGERS is an agent multiple-employer, statewide public employee pension plan established in
1967 and administered in accordance with RSMo. 70.600-70.755. As such, it is LAGERS responsibility to
administer the law in accordance with the expressed intent of the General Assembly. The plan is qualified under the
Internal Revenue Code Section 401(a) and is tax exempt. The responsibility for the operations and administration of
LAGERS is vested in the LAGERS Board of Trustees consisting of seven persons. LAGERS issues a publicly
available financial report that includes financial statements and required supplementary information. This report
may be obtained by accessing the LAGERS website at www.molagers.org.
A. Police and Fire Pension
1. Plan Description
Participants in the Police and the Firefighters’ Retirement plans become fully vested at the completion of their
probationary period, which is generally one year after employment. Participants employed September 30, 2012 or
earlier are eligible for retirement benefits, payable monthly for life, upon reaching the age of 65, or 20 years of
credited service. Police participants employed October 1, 2012 or later are eligible for retirement benefits, payable

CITY OF COLUMBIA, MISSOURI
Notes to the Basic Financial Statements
September 30, 2016
(Continued) 83
monthly for life, upon reaching the age of 65, or 25 years of credited service. Firefighter participants employed
October 1, 2012 or later are eligible for retirement benefits, payable monthly for life, upon having completed at least
one year of active service and reaching the age of 55. The plans also provide early retirement, death, and disability
benefits. Benefits and refunds of the Police and the Firefighters’ Retirement pension plans are recognized and
payable when due.
Participants in the Police Retirement plan employed September 30, 2012 or earlier receive a normal benefit equal to
3.0% of their highest average salary multiplied by the number of years of active service up to 20 years, plus 2% of
the highest average salary for each year of service in excess of 20 years, but not to exceed 70% of the highest
average salary. This benefit shall continue for life. Participants in the Police Retirement plan employed as of
October 1, 1991 could elect a second option. Under this option employees retiring after January 4, 1993 receive a
benefit increase of 3% each year from retirement to age 62. When a covered employee reaches age 62, the
retirement benefit shall equal 2.2% of the highest average salary times the years of service to a maximum of 52.5%
of the highest average salary with 25 years of continuous service. The benefit calculated at age 62 is then increased
by 2% for each year from retirement to age 61. This benefit is then payable from age 62 and increased in each
future year by 2% of the preceding year’s benefit.
Participants in the Police Retirement plan employed October 1, 2012 or later receive a normal benefit equal to 2.0%
of highest average salary per year of covered employment up to twenty-five years. For each year of service in
covered employment over twenty-five, the retiree shall receive an additional 1.5% of highest average salary per
year, up to a maximum of 57.5% for twenty-five years of service. In the first month of each plan year the retirement
benefit shall be increased by 0.6%.
Participants in the Firefighters’ Retirement plan employed September 30, 2012 or earlier with 20 or more years of
service receive a normal benefit equal to 70% of the highest annual salary plus 2% per year for each year in excess
of 20 years, up to a maximum of 80% of the highest annual salary. The normal benefit is increased annually by 2%.
Participants in the Firefighters’ Retirement plan employed October 1, 2012 or later receive a retirement benefit equal
to 2.5% of the retiree’s highest average salary multiplied by the number of years of active service. If a retiree is age
50 and not yet age 55 at the date of retirement, the retirement benefit payable will be reduced by 0.5% for each
month that the retirement date precedes age 55.
Membership of each plan consisted of the following at the date of the latest actuarial valuation:
Police Fire
Pension Pension
Number of participants:
Current membership (receiving benefits)* 157 156
Terminated entitled, not yet receiving benefits 19 3
Current active members* 150 125
* Included in the total for current active and current membership (receiving benefits) Police and Fire members are 3
Fire DROP (Deferred Retirement Option Program) members and 6 Police DROP members.
Financial Statements for the Police and Firefighters’ Retirement Funds are presented within this document. There
are no separately issued financial statements for the Police and Firefighters’ Retirement Funds.
2. Funding Policy and Assumptions
The City’s Police and Fire pension contributions for the fiscal year ended September 30, 2016, were made in
accordance with actuarially determined contribution requirements determined through actuarial valuation.
The roll-forward of total pension liability from September 30, 2015 to September 30, 2016 reflects expected service
cost and interest reduced by actual benefit payments and administrative expenses. Actuarially determined

CITY OF COLUMBIA, MISSOURI
Notes to the Basic Financial Statements
September 30, 2016
(Continued) 84
contribution rates are calculated as of September 30 which is 1 year prior to the beginning of the fiscal year in which
contributions are reported.
The City’s annual pension cost for Police and Fire pensions and the related information for each plan is as follows:
Police Plan Fire Plan
Contribution rates:
City 39.19% 56.46%
Plan members – contributory 8.35% 16.32%
Plan members – noncontributory 3.50% —
Annual pension cost $3,812,192 $5,226,250
Contributions made $3,812,192 $5,226,250
Actuarial valuation date 9/30/2015 9/30/2015
Actuarial cost method entry age normal entry age normal
Amortization method level % of pay–closed level % of pay–closed
Remaining amortization period 24 years 24 years
Asset valuation method smooth 4 year market smooth 4 year market
Actuarial assumptions:
Investment rate of return 7.5% 7.5%
Projected salary increases * 0% – 10.3% 0% – 10.3%
* Includes inflation at 3.5% 3.5%
Benefit increases 2% annually until 2% annually
attained age of 62; 2.2%
thereafter
The healthy retiree mortality tables, for post-retirement mortality, used in evaluating allowances to be paid were the
RP-2014 Healthy Annuitant mortality table for males and females, adjusted for mortality improvement back to the
observation period base year of 2006. The base year for males was then established to be 2017. Mortality rates for a
particular calendar year are determined by applying the MP-2015 mortality improvement scale to the above
described tables. This assumption was last reviewed and updated as part of the 5-year experience study for the
period October 1, 2010 through September 30, 2015.
The actuarial assumptions used in the September 30, 2015 valuation were based on results of an actuarial experience
study for the five year period October 31, 2010 through September 30, 2015. Amounts reported as changes in
assumptions resulted primarily from the changes in the investment rate of return (from 7.5% to 7.0%), wage
inflation (from 3.5% to 3.25%) and the amortization period to a 30-year period.
Prior to September 22, 1985, participants in the police retirement plan were able to elect to receive a higher salary
and make a contribution to the plan or elect to receive a lower salary and not make a contribution.
3. Investments
Due to the compatible investment objectives of the funds, the City pools the Police and Firefighters’ Retirement
Funds portfolio. Investments shall be made by the director of finance or the director's designee under the direction
and review of the investment committee. The investment committee shall establish a general policy for investments,
and the fund shall be invested by the director of finance in accordance with that policy. The investment committee
shall review the investments from time to time as it shall deem appropriate. The director of finance shall make a
quarterly report of investments and disbursements.
The long-term expected rate of return on pension plan investments was determined using a building-block method in
which best-estimate ranges of expected future real rates of return are developed for each major asset class. The
fund’s investment policy establishes the following target allocation across asset classes:
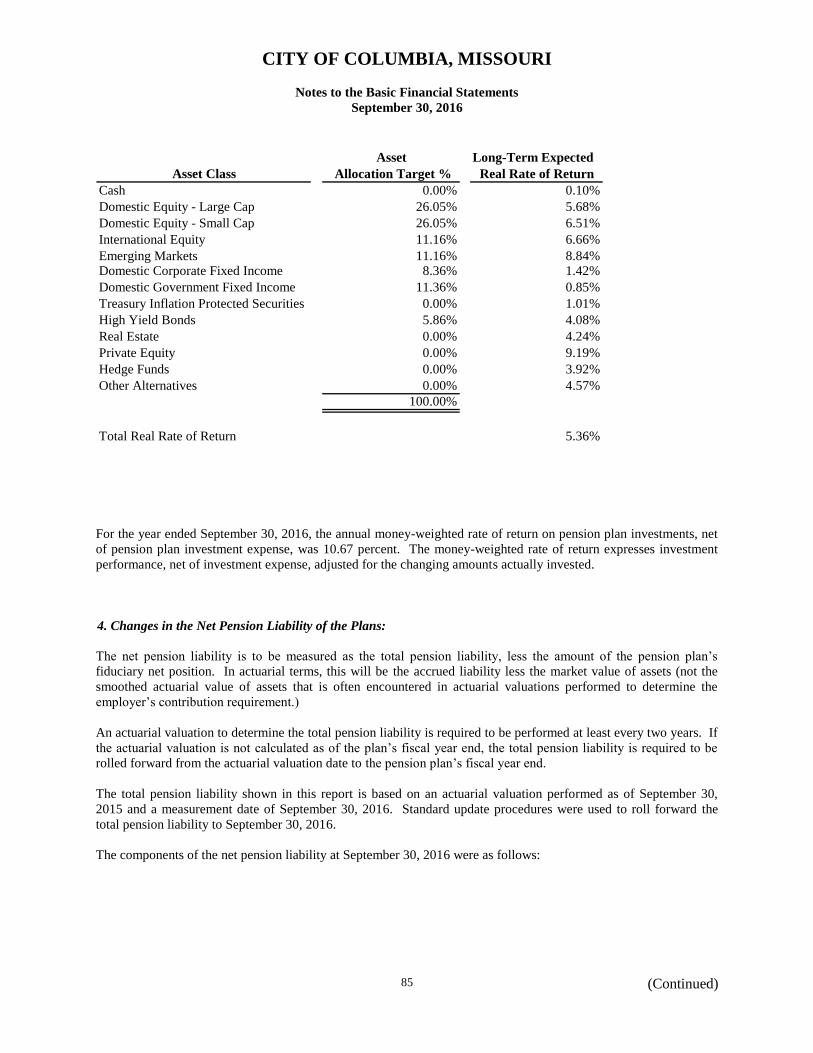
CITY OF COLUMBIA, MISSOURI
Notes to the Basic Financial Statements
September 30, 2016
(Continued) 85
Asset Long-Term Expected
Asset Class Allocation Target % Real Rate of Return
Cash 0.00% 0.10%
Domestic Equity - Large Cap 26.05% 5.68%
Domestic Equity - Small Cap 26.05% 6.51%
International Equity 11.16% 6.66%
Emerging Markets 11.16% 8.84%Domestic Corporate Fixed Income 8.36% 1.42%
Domestic Government Fixed Income 11.36% 0.85%
Treasury Inflation Protected Securities 0.00% 1.01%
High Yield Bonds 5.86% 4.08%
Real Estate 0.00% 4.24%
Private Equity 0.00% 9.19%
Hedge Funds 0.00% 3.92%
Other Alternatives 0.00% 4.57%
100.00%
Total Real Rate of Return 5.36%
For the year ended September 30, 2016, the annual money-weighted rate of return on pension plan investments, net
of pension plan investment expense, was 10.67 percent. The money-weighted rate of return expresses investment
performance, net of investment expense, adjusted for the changing amounts actually invested.
4. Changes in the Net Pension Liability of the Plans:
The net pension liability is to be measured as the total pension liability, less the amount of the pension plan’s
fiduciary net position. In actuarial terms, this will be the accrued liability less the market value of assets (not the
smoothed actuarial value of assets that is often encountered in actuarial valuations performed to determine the
employer’s contribution requirement.)
An actuarial valuation to determine the total pension liability is required to be performed at least every two years. If
the actuarial valuation is not calculated as of the plan’s fiscal year end, the total pension liability is required to be
rolled forward from the actuarial valuation date to the pension plan’s fiscal year end.
The total pension liability shown in this report is based on an actuarial valuation performed as of September 30,
2015 and a measurement date of September 30, 2016. Standard update procedures were used to roll forward the
total pension liability to September 30, 2016.
The components of the net pension liability at September 30, 2016 were as follows:

CITY OF COLUMBIA, MISSOURI
Notes to the Basic Financial Statements
September 30, 2016
(Continued) 86
a: Fire division:
Total Pension Plan Fiduciary Net Pension
Liability Net Position Liability
(a) (b) (a)-(b)
Balances at 9/30/2015 123,200,865$ 69,028,862$ 54,172,003$
Changes for the year:
Service Cost 2,915,282 - 2,915,282
Interest 9,051,984 - 9,051,984
Benefit changes - - -
Difference between expected and actual experience (67,212) - (67,212)
Contributions-employer - 5,226,250 (5,226,250)
Contributions-employee - 1,212,139 (1,212,139)
Assumption changes 12,883,084 - 12,883,084
Net investment income - 4,266,438 (4,266,438)
Benefit payments, including refunds (7,930,765) (7,930,765) -
Administrative expense - (31,700) 31,700
Other changes - (37,252) 37,252
Net changes 16,852,373 2,705,110 14,147,263
Balances at 9/30/2016 140,053,238$ 71,733,972$ 68,319,266$
Increase (Decrease)
b: Police division:
Total Pension Plan Fiduciary Net Pension
Liability Net Position Liability
(a) (b) (a)-(b)
Balances at 9/30/2015 82,299,414$ 45,810,617$ 36,488,797$
Changes for the year:
Service Cost 1,786,078 - 1,786,078
Interest 6,070,042 - 6,070,042
Benefit changes - - -
Difference between expected and actual experience (58,757) - (58,757)
Asumption changes 8,226,357 - 8,226,357
Contributions-employer - 3,812,192 (3,812,192)
Contributions-employee - 341,495 (341,495)
Net investment income - 2,850,982 (2,850,982)
Benefit payments, including refunds (4,517,130) (4,517,130) -
Administrative expense - (21,182) 21,182
Other changes - (24,893) 24,893
Net changes 11,506,590 2,441,464 9,065,126
Balances at 9/30/2016 93,806,004$ 48,252,081$ 45,553,923$
Increase (Decrease)
5. Single Discount Rate and Rate Sensitivity:
Projected benefit payments are required to be discounted to their actuarial present values using a Single Discount
Rate that reflects (1) a long-term expected rate of return on pension plan investments (to the extent that the plan’s
fiduciary net position is projected to be sufficient to pay benefits) and (2) tax-exempt municipal bond rate based on
the Bond Buyer Index, general obligation, 20 years to maturity, mixed quality. The Bond Buyer notes that the

CITY OF COLUMBIA, MISSOURI
Notes to the Basic Financial Statements
September 30, 2016
(Continued) 87
bonds’ average credit quality is roughly equivalent to Moody’s Investors Service’s Aa2 rating and Standard &
Poor’s Corp.’s AA as of the measurement date (to the extent that the contributions for use with the long-term
expected rate of return are not met).
A single discount rate of 7.0% was used to measure the total pension liability. This single discount rate was based on
the expected rate of return on pension plan investments of 7.0%. The projection of cash flows used to determine this
single discount rate assumed that plan member contributions will be made at the current contribution rate and that
employer contributions will be made at rates equal to the difference between actuarially determined contribution
rates and the member rate. Based on these assumptions, the pension plan’s fiduciary net position was projected to be
available to make all projected future benefit payments of current plan members. Therefore, the long-term expected
rate of return on pension plan investments was applied to all periods of projected benefit payments to determine the
total pension liability.
Regarding the sensitivity of the net position liability to changes in the single discount rate, the following presents the
plan’s net pension liability, calculated using a single discount rate of 7.00% as well as what the plan’s net pension
liability would be if it were calculated using a single discount rate that is 1-percentage-point lower or 1-percentage
point higher:
FIRE
Current Single Discount
1% Decrease Rate Assumption 1% Increase
6.00% 7.00% 8.00%
Total Pension Liability (TPL) $159,260,378 $140,053,238 $124,337,209
Net Pension Restricted for Pensions 71,733,972 71,733,972 71,733,972
Net Pension Liability (NPL) $87,526,406 $68,319,266 $52,603,237
Fire fiduciary net position as a percentage 51.22%
of the total pension liability
POLICE
Current Single Discount
1% Decrease Rate Assumption 1% Increase
6.00% 7.00% 8.00%
Total Pension Liability (TPL) $106,165,441 $93,806,004 $83,651,061
Net Pension Restricted for Pensions 48,252,081 48,252,081 48,252,081
Net Pension Liability (NPL) $57,913,360 $45,553,923 $35,398,980
Police fiduciary net position as a percentage 51.44%
of the total pension liability
Sensitivity of Net Pension Liability
to the Single Discount Rate Assumption

CITY OF COLUMBIA, MISSOURI
Notes to the Basic Financial Statements
September 30, 2016
(Continued) 88
6. Pension Expense and Deferred Inflows and Outflows of Resources Related to Pension
For the year ended September 30, 2016, the City recognized pension expense of $16,651,230 in the Police and Fire
Funds. The employer reported deferred outflows and inflows of resources related to pensions from the following
sources:
Deferred Deferred
Outflows Inflows
of Resources of Resources
Differences in experience -$ (275,306)$
Changes in assumption 9,920,843 -
Difference between projected and actual investment returns 3,924,077 -
Total 13,844,920$ (275,306)$
Deferred Deferred
Outflows Inflows
of Resources of Resources
Differences in experience -$ (107,150)$
Changes in assumption 6,369,727 -
Difference between projected and actual investment returns 2,764,573 -
Total 9,134,300$ (107,150)$
Fire Fund
Police Fund
Amounts reported as deferred outflows and inflows of resources related to pensions will be recognized in pension
expense as follows:
Fire Fund Net Deferred
Year ending Outflows of
September 30 Resources
2017 $4,104,622
2018 4,104,622
2019 4,161,210
2020 1,199,160
Total $13,569,614
Police Fund Net Deferred
Year ending Outflows of
September 30 Resources
2017 $2,700,883
2018 2,700,883
2019 2,717,369
2020 908,015
Total $9,027,150
Deferred inflows of resources are being amortized over a closed period equal to the average of the expected service
lives of all employees as of the beginning of each measurement period. The deferred outflows of resources related
to the difference between expected and actual investment earnings is being amortized over a closed five year period.

CITY OF COLUMBIA, MISSOURI
Notes to the Basic Financial Statements
September 30, 2016
(Continued) 89
The City’s funding policy provides for periodic employer contributions at actuarially determined rates that,
expressed as percentages of annual covered payroll, are designed to accumulate sufficient assets to pay benefits
when due. Administration costs are financed by the revenues of the Police and Firefighters’ Retirement Funds.
There were no long-term contracts for contributions outstanding on September 30, 2016.
Although the assets of the plans are commingled for investment purposes, each plan’s assets may be used only for
the payment of benefits to the members of that plan, in accordance with the terms of the plan.
7. Statements of Fiduciary Net Position for the Firefighters’ and Police Retirement Funds as of
September 30, 2016 are as follows:
Firefighters’ Police
Retirement Fund Retirement Fund Total
ASSETS
Accrued interest 177,235$ 119,217$ 296,452$
Investments 72,609,189 48,840,714 121,449,903
Capital assets 6,987 4,700 11,687
Accumulated depreciation (6,987) (4,700) (11,687)
Total Assets 72,786,424 48,959,931 121,746,355
LIABILITIES
Accrued payroll and payroll taxes 14,585 9,727 24,312
Due to other funds 1,037,867 698,123 1,735,990
Total Liabilities 1,052,452 707,850 1,760,302
NET POSITION
Net position held in trust 71,733,972 48,252,081 119,986,053
Total Net Position 71,733,972$ 48,252,081$ 119,986,053$

CITY OF COLUMBIA, MISSOURI
Notes to the Basic Financial Statements
September 30, 2016
(Continued) 90
8. Statements of Changes in Fiduciary Net Position for the year ended September 30, 2016 are as follows:
Firefighters’ Police
Retirement Fund Retirement Fund Total
ADDITIONS
Contributions:
City 5,226,250$ 3,812,192$ 9,038,442$
Employee 1,212,139 341,495 1,553,634
Net investment income:
Interest and dividends 4,266,438 2,850,982 7,117,420
Total additions 10,704,827 7,004,669 17,709,496
DEDUCTIONS
Current:
Policy development and administration:
Travel 2,743 1,833 4,576
Intragovernmental 28,957 19,349 48,306
Utilities, services, and miscellaneous 37,252 24,893 62,145
Pension benefits 7,786,819 4,417,623 12,204,442
Refund of employees' contributions 143,946 99,507 243,453
Total deductions 7,999,717 4,563,205 12,562,922
Change in net position 2,705,110 2,441,464 5,146,574
NET POSITION - BEGINNING 69,028,862 45,810,617 114,839,479
NET POSITION - ENDING 71,733,972$ 48,252,081$ 119,986,053$
DROP
The Deferred Retirement Option Program (DROP), implemented on August 21, 2007, is a program that allows
qualified employees to retire without terminating their employment for up to 5 years while their retirement benefits
accumulate and earn interest compounded monthly at an effective annual rate of 4.0% for DROP members with an
effective DROP date on or before September 1, 2012, and 2% for DROP members with an effective DROP date
after September 1, 2012. This program is available to eligible active members of the Columbia Police Department
or the Columbia Fire Department who are in the Police Retirement Fund or Firefighters’ Retirement Fund,
respectively. DROP participants are still eligible for COLA increases. Employer and member contributions
continue to be made while the member participates in the DROP. Member contributions are not deposited to the
member’s DROP account.
Eligible members of the Police Retirement Fund or Firefighters’ Retirement Fund may participate in DROP when
vested and they have reached their normal retirement date. In most cases an employee’s normal retirement date is
when vested and upon reaching age 65, or when they have completed 20 years of service, regardless of their age.
DROP eligibility begins the first month an employee reaches their normal retirement date. DROP participants must
have written authorization from their employer and approval by the Administrator. In no event may the DROP
period exceed 60 months.

CITY OF COLUMBIA, MISSOURI
Notes to the Basic Financial Statements
September 30, 2016
(Continued) 91
If the qualified employee fails to terminate employment at the end of the DROP period, both the retirement and
DROP participation will be voided, and the employer must pay any additional contributions that may be required to
establish service credit for the time the participant was in DROP.
Changes in the DROP balance in fiscal year 2016 were:
Year Balance at Balance at
Ended Beginning End of
September 30 of Year Credits Interest Distributions Adjustments Year
2016 $2,113,318 $676,717 $54,908 $1,713,436 $0 $1,131,507
B. LAGERS
1. General Information about the Pension Plan
Benefits Provided:
LAGERS provides retirement, death and disability benefits. Participants in the LAGERS plan become fully vested
after five years of service. Participants are eligible for a monthly defined service retirement benefit with full benefits
for general and utility employees at age sixty. Actuarially reduced benefits are available for general and utility
employees at age fifty-five. An alternate unreduced retirement provision is available based on age and service
totaling 80 years. LAGERS also provides disability and death benefits.
2016 Valuation
Benefit Multiplier: 2.00%
Final Average Salary: 3 Years
Member Contributions: 0%
Benefit terms provide for annual post retirement adjustments to each member’s retirement allowance subsequent to
the member’s retirement date. The annual adjustment is based on the increase in the Consumer Price Index and is
limited to 4% per year.
At June 30, 2016, the following employees were covered by the benefit terms:
LAGERS
Number of participants:
Inactive employees or beneficiaries currently receiving benefits 621
Inactive employees entitled to but not yet receiving benefits 293
Active members 998
1,912

CITY OF COLUMBIA, MISSOURI
Notes to the Basic Financial Statements
September 30, 2016
(Continued) 92
Contributions:
The LAGERS contribution requirements of plan members are determined by the governing body of the political
subdivision. The contribution provisions of the political subdivision are established by state statute.
The employer is required to contribute amounts at least equal to the actuarially determined rate, as established by
LAGERS. The actuarially determined rate is the estimated amount necessary to finance the cost of benefits earned
by employees during the year, with an additional amount to finance an unfunded accrued liability. Full-time
employees of the employer do not contribute to the pension plan. Employer contribution rates are 15.1% General
and 17.0% Utility.
Net Pension Liability:
The employer’s net pension liability was measured as of June 30, 2016, and the total pension liability used to
calculate the net pension liability was determined by an actuarial valuation as of February 29, 2016. Standard
update procedures were used to roll forward the total pension liability to June 30, 2016.
Actuarial Assumptions:
The total pension liability in the February 29, 2016 actuarial valuation was determined using the following actuarial
assumptions, applied to all periods included in the measurement:
Wage Inflation 3.25%
Salary Increase 3.25% to 6.55% including inflation
Investment rate of return: 7.25%
The healthy retiree mortality tables, for post-retirement mortality were the RP-2014 Healthy Annuitant mortality
table for males and females. The disabled retiree mortality tables, for postretirement mortality, were the RP-2014
disabled mortality for males and females. The preretirement mortality tables used were the RP-2014 employees
mortality table for males and females. Both the post-retirement and pre-retirement tables were adjusted for mortality
improvement back to the observation period base year of 2006. The base year for males was then established to be
2017. Mortality rates for a particular calendar year are determined by applying the MP-2015 mortality improvement
scale to the above described tables.
The actuarial assumptions used in the February 29, 2016 valuation were based on the results of an actuarial
experience study for the period March 1, 2010 through February 28, 2015.
The long-term expected rate of return on pension plan investments was determined using a model method in which
the best-estimate ranges of expected future real rates of return (expected returns, net of investment expenses and
inflation) are developed for each major asset class. These ranges are combined to produce the long-term expected
rate of return by weighting the expected future real rates of return by the target asset allocation percentage and by
adding expected inflation. The target allocation and best estimates of arithmetic real rates of return for each major
asset class are summarized in the following table:

CITY OF COLUMBIA, MISSOURI
Notes to the Basic Financial Statements
September 30, 2016
(Continued) 93
Target Long-Term Expected
Asset Class Allocation Real Rate of Return
Equity 43.00% 5.29%
Fixed Income 26.00% 2.23%
Real Assets 21.00% 3.31%
Strategic Assets 10.00% 5.73%
Discount rate:
The discount rate used to measure the total pension liability is 7.25%. The projection of cash flows used to
determine the discount rate assumes that employer and employee contributions will be made at the rates agreed upon
for employees and the actuarially determined rates for employers. Based on these assumptions, the pension plan’s
fiduciary net position was projected to be available to pay all projected future benefit payments of current active and
inactive employees. Therefore, the long-term expected rate of return on pension plan investments was applied to all
periods of projected benefit payment to determine the total pension liability.
2. Changes in the Net Pension Liability
a: General/Utility division:
Total Pension Plan Fiduciary Net Pension
Liability Net Position Liability
(a) (b) (a)-(b)
Balances at 9/30/2015 253,348,057$ 261,746,924$ (8,398,867)$
Changes for the year:
Service Cost 5,688,991 - 5,688,991
Interest 18,155,342 - 18,155,342
Difference between expected and actual experience (4,815,293) - (4,815,293)
Changes of assumptions 9,162,647 - 9,162,647
Contributions-employer - 7,633,688 (7,633,688)
Contributions-employee - 14,539 (14,539)
Net investment income - (340,762) 340,762
Benefit payments, including refunds (11,652,442) (11,652,442) -
Administrative expense - (156,560) 156,560
Other changes - (1,607,091) 1,607,091
Net changes 16,539,245 (6,108,628) 22,647,873
Balances at 9/30/2016 269,887,302$ 255,638,296$ 14,249,006$
Increase (Decrease)
The amounts reported as changes in assumptions were primarily from changes to the mortality table, as well as
salary increases and inflation.
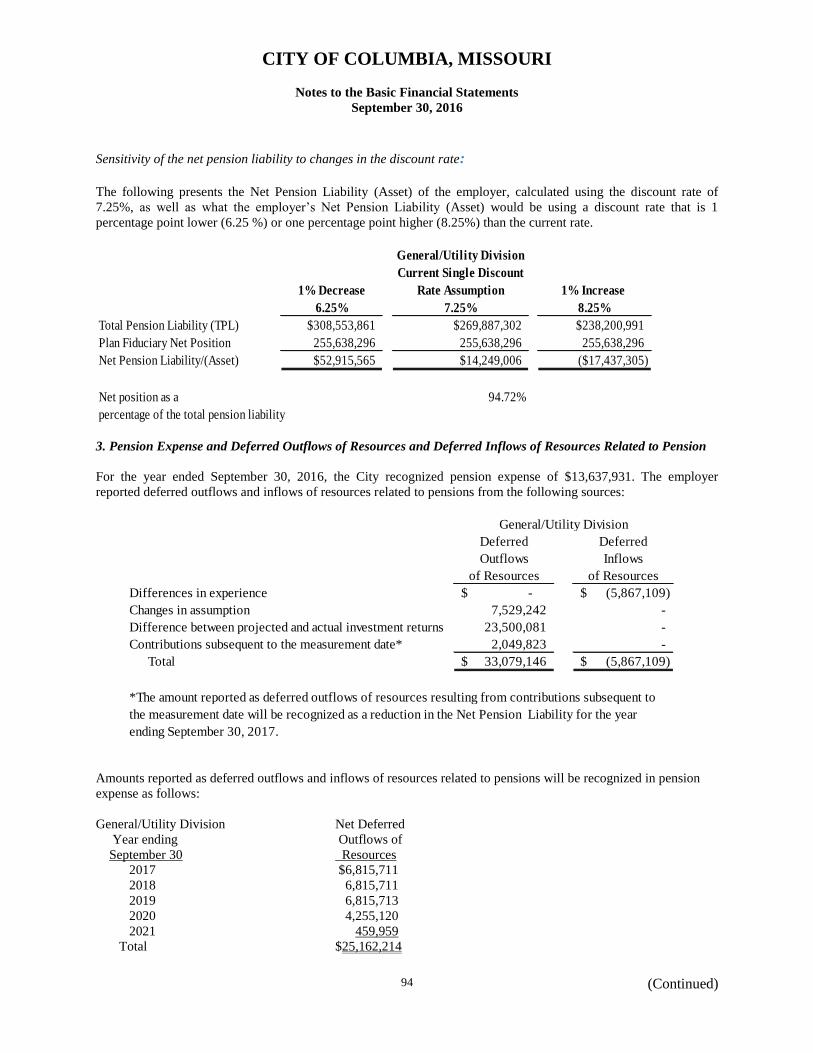
CITY OF COLUMBIA, MISSOURI
Notes to the Basic Financial Statements
September 30, 2016
(Continued) 94
Sensitivity of the net pension liability to changes in the discount rate:
The following presents the Net Pension Liability (Asset) of the employer, calculated using the discount rate of
7.25%, as well as what the employer’s Net Pension Liability (Asset) would be using a discount rate that is 1
percentage point lower (6.25 %) or one percentage point higher (8.25%) than the current rate.
General/Utility Division
Current Single Discount
1% Decrease Rate Assumption 1% Increase
6.25% 7.25% 8.25%
Total Pension Liability (TPL) $308,553,861 $269,887,302 $238,200,991
Plan Fiduciary Net Position 255,638,296 255,638,296 255,638,296
Net Pension Liability/(Asset) $52,915,565 $14,249,006 ($17,437,305)
Net position as a 94.72%
percentage of the total pension liability
3. Pension Expense and Deferred Outflows of Resources and Deferred Inflows of Resources Related to Pension
For the year ended September 30, 2016, the City recognized pension expense of $13,637,931. The employer
reported deferred outflows and inflows of resources related to pensions from the following sources:
Deferred Deferred
Outflows Inflows
of Resources of Resources
Differences in experience -$ (5,867,109)$
Changes in assumption 7,529,242 -
Difference between projected and actual investment returns 23,500,081 -
Contributions subsequent to the measurement date* 2,049,823 -
Total 33,079,146$ (5,867,109)$
*The amount reported as deferred outflows of resources resulting from contributions subsequent to
the measurement date will be recognized as a reduction in the Net Pension Liability for the year
ending September 30, 2017.
General/Utility Division
Amounts reported as deferred outflows and inflows of resources related to pensions will be recognized in pension
expense as follows:
General/Utility Division Net Deferred
Year ending Outflows of
September 30 Resources
2017 $6,815,711
2018 6,815,711
2019 6,815,713
2020 4,255,120
2021 459,959
Total $25,162,214

CITY OF COLUMBIA, MISSOURI
Notes to the Basic Financial Statements
September 30, 2016
(Continued) 95
Deferred inflows of resources are being amortized over a closed period equal to the average of the expected service
lives of all employees as of the beginning of each measurement period. The deferred outflows of resources related
to the difference between expected and actual investment earnings is being amortized over a closed five year period.
G. 401(a) Retirement Plan
The City sponsors and administers, through a contract with Boone County National Bank, a 401(a) plan which is a
defined contribution plan established to provide benefits at retirement to permanent employees of the City. At
September 30, 2016, there were 1,314 plan members. The City will contribute to the plan on behalf of each
participant an amount equal to 2.0% of the participant’s salary contingent upon the participant making a matching
contribution to a Section 457 deferred compensation plan. For the year ended September 30, 2016, the City
contributed $797,274 to the plan. Plan provisions and contribution requirements are established and may be
amended by the City Council.
H. Post Employment Health Plan (PEHP)
Beginning with the fiscal year ended September 30, 2010, the City no longer makes contributions towards the
employee post employment health plan. However, employees who terminate employment after 10 or more years of
service may be eligible to convert unused sick leave hours (at the rate of $2.00 for every hour of final accumulated
sick leave) for deposit into the employee’s PEHP account. For the year ended September 30, 2016, $71,836 was
contributed to the plan.
I. Other Post Employment Benefits (OPEB)
Plan Description
The City of Columbia post employment Health Plan is a single employer defined benefit plan that is self funded.
The Plan provides medical and prescription drug benefits to eligible retirees and their dependents. Eligible non-
Medicare retirees receive health care coverage through a self-insured Point-of-Service plan offered through United
Healthcare. Eligible Medicare retirees receive health care coverage through a fully-insured Medicare Supplement
Plan F and a Part D Rx plan offered through United American.
As of October 1, 2014, the date of the latest actuarial valuation, plan membership consisted of the following:
Retirees receiving benefits 75
Active members 1,338
Total plan members 1,413
Funding Policy
The City recognizes requirements for other post employment benefits (OPEB) in accordance with GASB 45. In
2014, retiree premium subsidies were eliminated. Retirees now pay 100% of the premium to participate in the
City’s health plan or to purchase coverage under the fully insured Medicare supplement plan.
Annual OPEB Cost and Net OPEB Obligation
The City of Columbia’s annual other post employment benefit (OPEB) cost (expense) is calculated based on the
annual required contribution of the employer (ARC), an amount actuarially determined in accordance with the
parameters of GASB Statement 45. The ARC represents a level of funding that, if paid on an ongoing basis, is
projected to cover the normal cost each year and amortize any unfunded actuarial liabilities (or funding excess) over

CITY OF COLUMBIA, MISSOURI
Notes to the Basic Financial Statements
September 30, 2016
(Continued) 96
a period not to exceed thirty years. The following table shows the components of the City’s annual OPEB cost for
the year, the amount actually contributed to the plan, and the changes on the City’s net OPEB obligation (asset) to
the post employment health plan:
Annual Required Contribution ($126,898)
Interest on Net OPEB Obligation (28,927)
Adjustment to Annual Required Contribution 58,837
Annual OPEB Cost (Expense) (96,988)
Employer contributions (345,380)
Increase in Net OPEB Obligation (Asset) (442,368)
Net OPEB Obligation (Asset)-October 1, 2015 (413,244)
Net OPEB Obligation (Asset)-September 30, 2016 ($855,612)
The City’s annual OPEB cost, the percentage of annual OPEB cost contributed to the plan, and the net OPEB
obligation (asset) for fiscal year 2016 and the preceding two years is as follows:
Fiscal Year Ended Annual OPEB Cost
Percentage of Annual OPEB
Cost Contributed Net OPEB Obligation (Asset)
September 30, 2014 $91,744 19.99% $73,215
September 30, 2015 ($132,197) 267.98% ($413,244)
September 30, 2016 ($96,988) 356.10% ($855,612)
Financial statements for the OPEB plan are presented within this document. There are no separately issued financial
statements for the OPEB plan.
Funded Status and Funding Progress
As of October 1, 2014, the most recent valuation date, the plan was 205% funded. The actuarial accrued liability for
benefits was $1,465,000 and the actuarial value of assets is $3,002,000 resulting in an unfunded actuarial accrued
liability (asset) of $(1,537,000). Covered payroll (annual payroll of active employees covered by the plan) is
$65,437,191 and the ratio of the unfunded actuarial accrued liability to the covered payroll is (2.3%)
Actuarial Methods and Assumptions
Actuarial valuations of an ongoing plan involve estimates of the value of reported amounts and assumptions about
the probability of occurrence of events far into the future. Examples include assumptions about future employment,
mortality, and the healthcare cost trend. Amounts determined regarding the funded status of the plan and the annual
required contributions of the employer are subject to continual revision as actual results are compared with past
expectations and new estimates are made about the future. The schedule of funding progress, presented as required
supplementary information following the notes to the financial statements, will present multiyear trend information
about whether the actuarial value of plan assets is increasing or decreasing over time relative to the actuarial accrued
liabilities for benefits.
Projections of benefits for financial reporting purposes are based on the substantive plan (the plan as understood by
the employer and the plan members) and included the types of benefits provided at the time of each valuation and
the historical pattern of sharing of benefit costs between the employer and plan members to that point. The initial
unfunded actuarial accrued liability is being amortized over ten years. The actuarial methods and assumptions used

CITY OF COLUMBIA, MISSOURI
Notes to the Basic Financial Statements
September 30, 2016
(Continued) 97
include techniques that are designed to reduce the effects of short-term volatility in actuarial accrued liabilities and
the actuarial value of assets, consistent with the long-term perspective of the calculations. Additional information as
of the latest actuarial valuation follows:
Valuation date October 1, 2014
Actuarial cost method Projected unit credit
Amortization method Level dollar, open over 10 yrs
Asset valuation method Market Value
Actuarial assumptions:
Investment rate of return 7% *
Projected salary increases 4%
Healthcare cost trend rate 9.5% initially
5% ultimate
* Based on the expected long term investment return of the employer’s own investments used to pay plan benefits.
Statement of Fiduciary Net Position for OPEB as of September 30, 2016 is as follows:
OPEB
ASSETS
Cash and cash equivalents 505,427$
Accrued interest 863
Investments 2,689,471
Total Assets 3,195,761
NET POSITION
Net position held in trust 3,195,761
Total Net Position 3,195,761$

CITY OF COLUMBIA, MISSOURI
Notes to the Basic Financial Statements
September 30, 2016
98
Statement of Changes in Fiduciary Net Position for OPEB the year ended September 30, 2016 is as follows:
OPEB
ADDITIONS
Contributions:
City -$
Net investment income:
Interest and dividends (includes net
appreciation in fair value of investments) 253,998
Total additions 253,998
DEDUCTIONS
Current:
Policy development and administration:
Utilities, services, and miscellaneous 1,000
Total deductions 1,000
Change in net position 252,998
NET POSITION BEGINNING 2,942,763
NET POSITION ENDING 3,195,761$

CITY OF COLUMBIA, MISSOURI
REQUIRED SUPPLEMENTARY
INFORMATION

CITY OF COLUMBIA, MISSOURIREQUIRED SUPPLEMENTARY INFORMATION
BUDGETARY COMPARISON SCHEDULEGENERAL FUND
FOR THE YEAR ENDED SEPTEMBER 30, 2016
Budgeted AmountsActual Variance with
Original Final Amounts Final Budget
REVENUES:General property taxes 7,701,927 7,701,927 7,898,843 196,916 Sales tax 23,781,641 23,781,641 23,321,470 (460,171) Other local taxes 12,692,713 12,692,713 11,641,679 (1,051,034) Licenses and permits 1,025,400 1,025,400 1,031,218 5,818 Fines 1,930,500 1,930,500 1,805,859 (124,641) Fees and service charges 2,490,038 2,490,038 3,251,931 761,893 Intragovernmental revenue 20,311,271 20,311,271 4,407,469 (15,903,802) Revenue from other governmental units 4,271,381 4,934,917 4,119,790 (815,127) Investment revenue 661,584 661,584 699,133 37,549 Miscellaneous revenue 959,899 971,760 1,215,312 243,552
TOTAL REVENUES 75,826,354 76,501,751 59,392,704 (17,109,047)
EXPENDITURES:Current:
Policy development and administration: City Council 253,526 312,637 194,190 118,447 City Clerk 301,269 356,117 271,400 84,717 City Manager 1,585,680 1,788,425 1,571,500 216,925 Election 126,600 328,765 322,964 5,801 Financial Services 4,561,951 4,803,539 4,256,087 547,452 Human Resources 1,199,661 1,268,185 1,068,609 199,576 City Counselor 1,311,853 1,395,248 1,142,651 252,597 Public Works Administration 1,997,194 1,984,132 1,633,420 350,712 Miscellaneous nonprogrammed activities 750,867 795,874 218,381 577,493
Total policy development and administration 12,088,601 13,032,922 10,679,202 2,353,720 Public safety:
Police 21,953,455 23,162,311 21,296,594 1,865,717 City Prosecutor 691,630 691,904 559,874 132,030 Fire 17,418,747 17,840,407 17,336,359 504,048 Animal Control 708,261 722,425 681,775 40,650 Municipal Court 989,091 1,084,364 905,282 179,082 Joint Communications 1,104,449 1,145,489 644,560 500,929
Total public safety 42,865,633 44,646,900 41,424,444 3,222,456 Transportation:
Streets and Sidewalks 7,912,790 9,065,702 7,087,996 1,977,706 Street Lighting 229,000 - - - Traffic 1,271,823 1,576,627 1,237,658 338,969
Total transportation 9,413,613 10,642,329 8,325,654 2,316,675 Health and environment:
Health Services 5,006,626 5,794,222 4,877,788 916,434 Planning 4,147,237 5,135,296 3,883,348 1,251,948 Department of Economic Development 553,849 607,111 570,355 36,756 Miscellaneous nonprogrammed activities 98,770 104,690 28,726 75,964
Total health and environment 9,806,482 11,641,319 9,360,217 2,281,102 Personal development:
Parks and Recreation 5,953,975 6,072,904 5,729,928 342,976 Cultural Affairs 540,105 581,163 521,181 59,982 Office of Community Services 748,432 862,317 749,448 112,869 Social Assistance 893,556 1,195,460 874,554 320,906 Miscellaneous nonprogrammed activities 87,848 93,114 25,549 67,565
Total personal development 8,223,916 8,804,958 7,900,660 904,298
TOTAL EXPENDITURES 82,398,245 88,768,428 77,690,177 11,078,251
DEFICIENCY OF REVENUES OVEREXPENDITURES (6,571,891) (12,266,677) (18,297,473) (6,030,796)
OTHER FINANCING SOURCES (USES):Transfers from other funds 8,349,861 9,271,426 24,987,499 15,716,073 Transfers to other funds (2,427,219) (2,429,157) (2,282,132) 147,025
Appropriation of prior year fund balance 649,249 649,249 649,249 -
TOTAL OTHER FINANCING SOURCES 6,571,891 7,491,518 23,354,616 15,863,098
NET CHANGE IN FUND BALANCE - (4,775,159) 5,057,143 9,832,302
Effect of appropriation of prior year
fund balance (649,249) (649,249) (649,249) -
FUND BALANCE, BEGINNING OF PERIOD 30,504,166 30,504,166 30,504,166 -
FUND BALANCE, END OF PERIOD 29,854,917 25,079,758 34,912,060 9,832,302
See Note to the Required Supplementary Information.
101

THIS PAGE INTENTIONALLY LEFT BLANK
102

CITY OF COLUMBIA, MISSOURI Required Supplementary Information
Notes to the Budgetary Comparison Schedule
For The Year Ended September 30, 2016
103
Budgetary Information
An annual budget prepared under the modified accrual basis of accounting is adopted in September prior to
the beginning of each fiscal year for all revenues and expenditures of the General Fund of the City.
Accordingly, the budget schedule presents actual expenditures in accordance with accounting principles
generally accepted in the United States of America. The primary basis of budgetary control is at the
department level. Departments may not legally exceed their total appropriation without City Council
approval. A review of the current year's budget is made by the departments in September of each year and
interdepartmental transfers are made with City Council approval. Any remaining unencumbered
appropriations lapse at fiscal year end. Any increase in appropriations during the fiscal year must be
approved by the City Council. During the current budget year, supplemental budget appropriations were
necessary to approve funding for new grant programs, as well as other approved City programs. These
appropriations increased the General Fund budget by $6,370,183 and this increase is reflected in the final
budgeted amounts in the accompanying required supplemental information.
Project budgets prepared under the modified accrual basis of accounting are adopted for the Capital
Projects Fund. All projects remain appropriated until completed or until the City Council decides to
eliminate the project. The Debt Service Funds are controlled by related bond ordinances. Special Revenue
Funds with legally adopted annual budgets are: Convention and Tourism Fund, Public Improvement Fund,
Capital Improvement Sales Tax Fund, Park Sales Tax Fund, Contributions Fund, Non-Motorized Grant
Fund, Stadium TDD’s, Mid Mo Solid Waste Mgt District Fund and the Transportation Sales Tax Fund.

CITY OF COLUMBIA, MISSOURI
Required Supplementary Information
Schedule of Funding Progress
OPEB
Projected-unit
credit Unfunded UAAL as a
Actuarial Actuarial actuarial actuarial Annual percentage
valuation value of accrued liability (asset) Funded covered of covered
date assets liability (UAAL) ratio payroll payroll
10/1/2010 1,236,000 4,817,000 3,581,000 26% 55,586,129 6.4%
10/1/2012 2,155,000 2,095,000 (60,000) 103% 57,823,146 (0.10%)
10/1/2014 3,002,000 1,465,000 (1,537,000) 205% 65,437,191 (2.30%)
The valuation date is October 1, 2014.
Annual
Year ended required Percent
September 30 contributions contributed
2014 91,744 19.99% 73,215
2015 (132,197) 267.98% (413,244)
2016 (96,988) 356.10% (855,612)
Note: The significant assumptions for the OPEB plan are as follows:
OPEB
projected unit credit
level dollar, open
10 years
market value
Investment rate of return 7%
Projected salary increases * 4%
* Includes inflation at -
Benefit increases -
Healthcare cost trend rate 9.5% initially and 5%
ultimate
Remaining amortization period
Asset valuation method
Actuarial assumptions:
Schedule of Employer Contributions
OPEB
Net
OPEB
obligation (asset)
Amortization method
Actuarial cost method
104

Fiscal year ending September 30, 2016 2015
Total Pension Liability
Service Cost 5,688,991$ 5,575,446$
Interest on the Total Pension Liability 18,155,342 17,515,917
Benefit Changes - -
Differences Between Expected and Actual Experience (4,815,293) (2,949,734)
Changes of Assumptions 9,162,647 -
Benefit Payments, Including Refunds of Member Contributions (11,652,442) (11,112,523)
Net Change in Total Pension Liability 16,539,245 9,029,106
Total Pension Liability - Beginning 253,348,057 244,318,951
Total Pension Liability - Ending 269,887,302$ 253,348,057$
Plan Fiduciary Net Position
Contributions - Employer 7,633,688$ 8,135,287$
Contributions - Employee 14,539 -
Net Investment Income (340,762) 5,105,889
Benefit Payments, Including Refunds of Member Contributions (11,652,442) (11,112,523)
Administrative Expense (156,560) (169,259)
Other (1,607,091) (1,830,332)
Net Change in Plan Fiduciary Net Position (6,108,628) 129,062
Plan Net Position - Beginning 261,746,924 261,617,862
Plan Net Position - Ending 255,638,296 261,746,924
Employer's Net Pension Liability 14,249,006 (8,398,867)
Plan fiduciary net position as a percentage of the total
pension liability 94.72% 103.32%
Covered-employee payroll 47,029,728$ 45,696,354$
Employer's net pension liability as a percentage of covered- 30.30% (18.38%)
employee payroll
*Information for prior years is not available; amounts presented for the year end were
determined as of June 30, the measurement date.
LAGERS (General and Utility Divisions)
FOR THE LAST TWO FISCAL YEARS*
CITY OF COLUMBIA, MISSOURI
Required Supplementary Information
SCHEDULE OF CHANGES IN THE EMPLOYERS NET PENSION LIABILITY
105

Contribution in
Actuarially Relation to the Contribution Actual Contribution
FY Ending Determined Actuarially Deficiency Covered as a % of
September 30, Contribution Required Contribution (Excess) Payroll Covered Payroll
2016 $ 7,801,471 $ 7,801,471 $ 0 $ 49,814,131 15.66%
2015 8,085,918 8,085,592 326 46,960,661 17.22%
2014 8,384,318 8,037,243 347,075 45,782,304 17.56%
2013 8,422,709 7,909,632 513,077 44,272,221 17.87%
2012 7,996,358 7,196,952 799,406 42,719,889 16.85%
2011 8,024,400 6,716,311 1,308,089 42,389,564 15.84%
2010 6,231,312 6,231,313 (1) 41,986,168 14.84%
2009 6,011,583 6,011,582 1 41,047,618 14.65%
2008 5,795,660 5,795,661 (1) 39,005,285 14.86%
2007 5,378,232 5,378,080 152 37,200,524 14.46%
Valuation Date:
The roll-forward of total pension liability from February 29, 2016 to June 30, 2016
reflects expected service cost and interest reduced by actual benefit payments and
administrative expenses.
Methods and assumptions used to determine contribution rates:
Valuation date February 29, 2016
Actuarial cost method Entry-Age Normal and Modified Terminal Funding
Amortization method Level Percentage of Payroll, Closed
Remaining amortization period Multiple bases from 13 to 26 years
Asset valuation method 5-year smoothed market; 20% corridor
Inflation 3.25% wage inflation; 2.50% price inflation
Salary increases 3.25% to 6.55% including wage inflation
Investment rate of return 7.25%, net of administrative and investment expenses
Retirement age Experience-based table of rates that are specific to the type of eligibility condition.
Mortality The healthy retiree mortality tables, for post-retirement mortality, were the
RP-2014 Healthy Annuitant mortality table for males and females. The disabled
retiree mortality tables, for post-retirement mortality, were the RP-2014 disabled
mortality table for males and females. The pre-retirement mortality tables used
were the RP-2014 employees mortality table for males and females.
Both the post-retirement and pre-retirement tables were adjusted for mortality
improvement back to the observation period base year of 2006. The base year
for males was then established to be 2017. Mortality rates for a particular
calendar year are determined by applying the MP-2015 mortality improvement
scale to the above described tables.
Other information New assumptions adopted based on the 5-year experience study for the period
March 1,2010 through Febraury 28,2015.
Notes to Schedule of Contributions
CITY OF COLUMBIA, MISSOURI
Required Supplementary Information
SCHEDULE OF CONTRIBUTIONS
LAST TEN FISCAL YEARS
LAGERS (General and Utility Divisions)
106

Total Plan Net Position Net Pension Liability
FY Ending Pension Plan Net Net Pension as a % of Total Covered as a % of
September 30, Liability Position Liability (Asset) Pension Liability Payroll Covered Payroll
2015 253,348,057$ 261,746,924$ (8,398,867)$ 103.32% 45,696,354$ (18.38%)
2016 269,887,302 255,638,296 14,249,006 94.72% 47,029,728 30.30%
*Information for prior years is not available
CITY OF COLUMBIA, MISSOURI
Required Supplementary Information
SCHEDULE OF THE NET PENSION LIABILITY
LAGERS (General and Utility Divisions)
FOR THE LAST TWO FISCAL YEARS*
107

Fire Police Fire Police Fire Police
Fiscal year ending September 30,
Total Pension Liability
Service Cost 2,915,282$ 1,786,078$ 2,916,326$ 1,731,740$ 2,881,753$ 1,815,459$
Interest on the Total Pension Liability 9,051,984 6,070,042 8,741,128 5,839,052 8,359,275 5,614,050
Benefit Changes - - 3,649 - - -
Differences Between Expected and Actual Experience (67,212) (58,757) (410,306) (113,748) - -
Changes of Assumptions 12,883,084 8,226,357 - - - -
Benefit Payments, Including Refunds of Member Contributions (7,930,765) (4,517,130) (6,280,290) (4,291,585) (6,053,587) (4,483,636)
Net Change in Total Pension Liability 16,852,373 11,506,590 4,970,507 3,165,459 5,187,441 2,945,873
Total Pension Liability - Beginning 123,200,865 82,299,414 118,230,358 79,133,955 113,042,917 76,188,082
Total Pension Liability - Ending 140,053,238$ 93,806,004$ 123,200,865$ 82,299,414$ 118,230,358$ 79,133,955$
Plan Fiduciary Net Position
Contributions - Employer 5,226,250$ 3,812,192$ 7,751,496$ 5,486,784$ 4,674,412$ 3,245,420$
Contributions - Member 1,212,139 341,495 1,175,671 318,361 1,170,726 303,444
Net Investment Income 4,266,438 2,850,982 (282,312) (422,604) 5,395,826 4,251,737
Benefit Payments, Including Refunds of Member Contributions (7,930,765) (4,517,130) (6,280,290) (4,291,585) (6,053,587) (4,483,636)
Administrative Expense (31,700) (21,182) (34,038) (22,706) (31,599) (21,406)
Other (37,252) (24,893) (565,953) (377,519) (265,268) (885,742)
Net Change in Plan Fiduciary Net Position 2,705,110 2,441,464 1,764,574 690,731 4,890,510 2,409,817
Plan Net Position - Beginning 69,028,862 45,810,617 67,264,288 45,119,886 62,373,778 42,710,069
Plan Net Position - Ending 71,733,972$ 48,252,081$ 69,028,862$ 45,810,617$ 67,264,288$ 45,119,886$
Employer's Net Pension Liability 68,319,266$ 45,553,923$ 54,172,003$ 36,488,797$ 50,966,070$ 34,014,069$
*Information for prior years is not readily available
20142015
CITY OF COLUMBIA, MISSOURI
Required Supplementary Information
SCHEDULE OF CHANGES IN THE EMPLOYERS NET PENSION LIABILITY
PENSION TRUST FUNDS
FOR THE LAST THREE FISCAL YEARS*
2016
108

Total Plan Net Position Net Pension Liability
FY Ending Pension Plan Net Net Pension as a % of Total Covered as a % of
September 30, Liability Position Liability Pension Liability Payroll Covered Payroll
2014 118,230,358$ 67,264,288$ 50,966,070$ 56.89% 7,539,548$ 675.98%
2015 123,200,865 69,028,862 54,172,003 56.03% 7,753,834 698.65%
2016 140,053,238 71,733,972 68,319,266 51.22% 8,056,819 847.97%
Total Plan Net Position Net Pension Liability
FY Ending Pension Plan Net Net Pension as a % of Total Covered as a % of
September 30, Liability Position Liability Pension Liability Payroll Covered Payroll
2014 79,133,955$ 45,119,886$ 34,014,069$ 57.02% 8,276,896$ 410.95%
2015 82,299,414 45,810,617 36,488,797 55.66% 8,140,637 448.23%
2016 93,806,004 48,252,081 45,553,923 51.44% 8,723,289 522.21%
*Information for prior years is not readily available
FIRE
POLICE
CITY OF COLUMBIA, MISSOURI
Required Supplementary Information
SCHEDULE OF THE NET PENSION LIABILITY
PENSION TRUST FUNDS
FOR THE LAST THREE FISCAL YEARS*
109

Actuarially Contribution Actual Contribution
FY Ending Determined Actual Deficiency Covered as a % of
September 30, Contribution Contribution (Excess) Payroll Covered Payroll
2016 $ 5,226,250 $ 5,226,250 $ - $ 8,056,819 58.91%
2015 4,751,496 7,751,496 (3,000,000) 7,753,834 95.96%
2014 4,674,412 4,674,412 - 7,539,548 62.00%
2013 4,382,296 4,382,296 - 7,209,301 60.79%
2012 3,995,869 3,995,869 - 7,170,923 55.72%
2011 3,598,321 3,598,321 - 7,251,272 49.62%
2010 3,330,409 3,330,409 - 7,216,527 46.15%
2009 3,098,617 3,098,617 - 6,996,192 44.29%
2008 2,853,109 2,853,109 - 6,719,424 42.46%
2007 2,759,165 2,759,165 - 6,358,006 43.40%
Actuarially Contribution Actual Contribution
FY Ending Determined Actual Deficiency Covered as a % of
September 30, Contribution Contribution (Excess) Payroll Covered Payroll
2016 $ 3,812,192 $ 3,812,192 $ - $ 8,723,289 41.58%
2015 3,486,784 5,486,784 (2,000,000) 8,140,637 64.28%
2014 3,245,420 3,245,420 - 8,276,896 39.21%
2013 3,243,455 3,243,455 - 8,279,852 39.17%
2012 3,153,367 3,153,367 - 8,475,940 37.20%
2011 3,033,164 3,033,164 - 8,549,787 35.48%
2010 2,693,152 2,693,152 - 8,285,768 32.50%
2009 2,549,967 2,549,967 - 8,198,959 31.10%
2008 2,520,373 2,520,373 - 7,912,481 31.85%
2007 2,232,864 2,232,864 - 7,435,393 30.03%
Valuation Date:
The roll-forward of total pension liability from September 30, 2015 to September 30, 2016
reflects expected service cost and interest reduced by actual benefit payments.
Actuarially determined contribution rates are calculated as of September 30, 2015
which is 1 year prior to the beginning of the fiscal year in which contributions are reported.
Methods and assumptions used to determine contribution rates:
Valuation date September 30, 2015
Actuarial cost method Entry-Age Normal
Amortization method Level Percentage of Payroll, Closed
Remaining amortization period 24 years
Asset valuation method 4-year smoothed market; 25% corridor
Inflation 3.5% wage inflation; 3.00% price inflation
Salary increases 0% to 10.3% (including 3.5% wage inflation)
Investment rate of return 7.5%, net of administrative and investment expenses
Retirement age Experience-based table of rates that are specific to the type of eligibility condition.
Mortality RP 2000 mortality table (the mortality rates for pre-retirement mortality are 50%
of 1971 Group Annuity Mortality Table projected to 1984, set back 0 years for men
and 6 years for women.)
Other information:
Notes: The TPL as of September 30, 2016 was calculated using assumptions adopted from the
October 31, 2010 - September 30, 2015 experience study (dated November 7, 2016.)
In particular, an investment rate of return of 7.0%, a wage inflation assumption of
3.25% and a 30-year amortization period.
Notes to Schedule of Contributions
FIRE
POLICE
CITY OF COLUMBIA, MISSOURI
Required Supplementary Information
SCHEDULE OF CONTRIBUTIONS
PENSION TRUST FUNDS
LAST TEN FISCAL YEARS
110
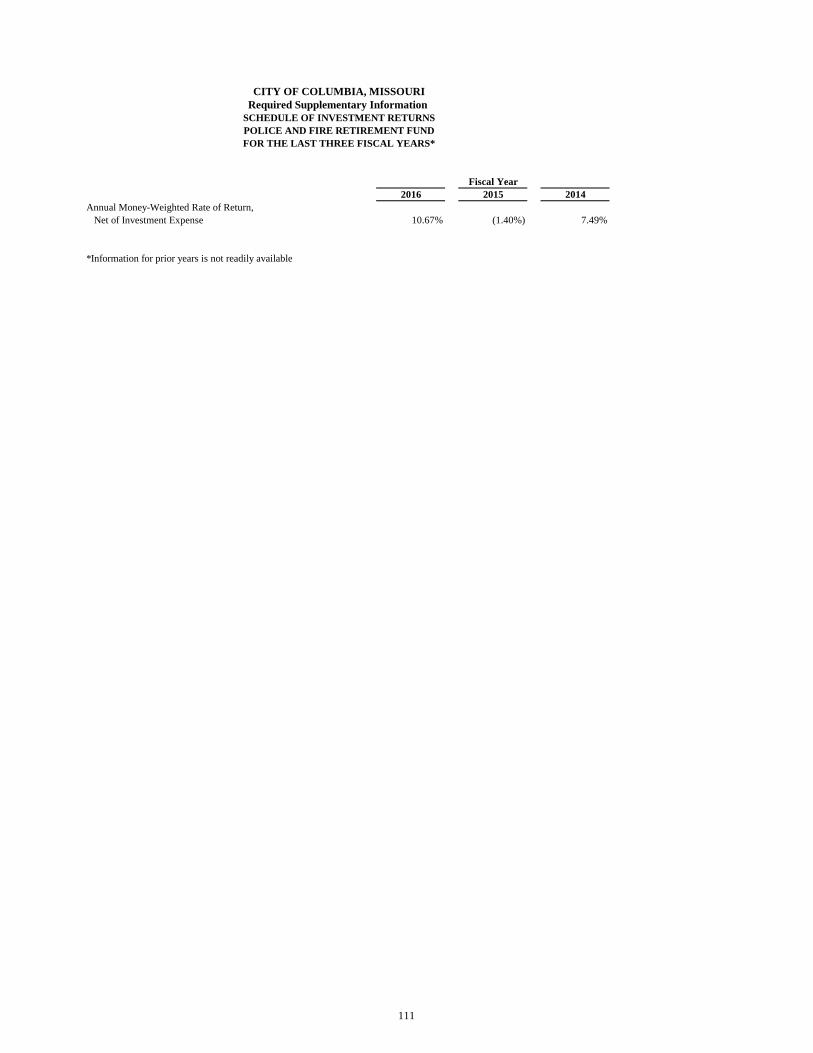
2016 2015 2014
Annual Money-Weighted Rate of Return,
Net of Investment Expense 10.67% (1.40%) 7.49%
*Information for prior years is not readily available
POLICE AND FIRE RETIREMENT FUND
FOR THE LAST THREE FISCAL YEARS*
CITY OF COLUMBIA, MISSOURI
Required Supplementary Information
SCHEDULE OF INVESTMENT RETURNS
Fiscal Year
111

THIS PAGE INTENTIONALLY LEFT BLANK
112

CITY OF COLUMBIA, MISSOURI
SUPPLEMENTARY INFORMATION

CITY OF COLUMBIA, MISSOURI
COMBINING FUND
FINANCIAL STATEMENTS
AND SCHEDULE

CITY OF COLUMBIA, MISSOURI
NON-MAJOR
GOVERNMENTAL FUNDS
Special Revenue Funds
Special Revenue Funds are used to account for specific revenues that are legally restricted to
expenditure for particular purposes.
Non Motorized Grant Fund - to account for federal grant monies reserved for non-motorized transportation projects.
Mid MO Solid Waste Management District Fund - to account for the operations of the MMSWMD funded by a state collected landfill fee. Operations are administered by the
City per council approved agreement with the District.
Convention and Tourism Fund - to account for the four percent tax levied on the gross daily
rental receipts due from or paid by transient guests at hotels or motels. The revenues are used
by the City for the purpose of promoting convention and tourism in the City.
Community Development Grant Fund - to account for all federal monies received by the
City and disbursed on Community Development Grant projects.
Public Improvement Fund - to account for and disburse monies the City receives from the
City sales tax and voter-approved development fees. This fund receives a portion of the City
sales tax which is allocated for a wide range of public improvements to the City
including streets, sidewalks and parks. Development fees are used solely for construction
of collector and arterial streets.
Capital Improvement Sales Tax Fund - to account for the 1/4 cent sales tax renewed by
voters in August 2015, to be collected until December 31, 2025 for funding of
capital improvement projects.
Stadium TDD's Fund - to account for receipts from the Stadium TDD's: Shoppes at
Stadium, Columbia Mall and Stadium Corridor.
Park Sales Tax Fund - to account for the voter-approved, City-enacted 1/4 percent
sales tax and expenditures for funding of local parks.

CITY OF COLUMBIA, MISSOURI
NON-MAJOR
GOVERNMENTAL FUNDS
Special Revenue Funds (continued)
Contributions Fund - to account for all gifts, bequests, or other funds derived from property
which may have been purchased or held in trust by or for the City of Columbia, Missouri.
Transportation Sales Tax Fund - to account for the voter approved, City-enacted sales tax
and expenditures for transportation purposes which include financial support of the public
mass transportation system, construction and maintenance of streets, roads, bridges, and
airports to the extent of tax revenues.
Permanent Fund
The Permanent Fund is used to report resources that are legally restricted to the extent that
only earnings, not principal, may be used for purposes that support the reporting government’s
programs.
Designated Loan & Special Tax Bill Investment Fund - to account for the purchase of all
special assessment tax bills. The fund also makes loans and advances to other funds.

CITY OF COLUMBIA, MISSOURI
NON-MAJOR
GOVERNMENTAL FUNDS
Debt Service Funds
The Debt Service Funds are used to account for the accumulation of resources and payment of general obligation bond principal and interest from governmental resources and special
assessment bond principal and interest from special assessment levies when the government is
obligated in some manner for the payment.
2006B Special Obligation Bonds - to accumulate monies for payment of Series 2006B
$25,615,000 5% Special Obligation Bonds with semi-annual installments of principal
plus interest until maturity in 2016. Financing is to be provided by the Capital Improvement
Sales Tax.
2008B Special Obligation Bonds - to accumulate monies for payment of Series 2008B
$26,795,000 4.3% Special Obligation Bonds with semi-annual installments of principal
plus interest until maturity in 2028. Financing is to be provided by property tax and lease
payments from enterprise funds. This series was refunded in 2016.
Lemone Trust Note - to accumulate monies for payment of the loan for the purchase of2810 Lemone Industrial Blvd. (the IBM building.) The City assumed the obligation to
pay this loan on December 31, 2010.
Missouri Transportation Finance Corporation Loan - to accumulate monies for
payment of the loan for transportation improvements to the Stadium Boulevard corridor
from Broadway to I-70. Financing is to be provided by contributions from the Columbia
Mall and Stadium Corridor TDD's.
2016 Special Obligation Refunding Bonds - to refund the City's Special Obligation Bonds,
Series 2008B.

CITY OF COLUMBIA, MISSOURI
COMBINING BALANCE SHEET
NONMAJOR GOVERNMENTAL FUNDS
Special Debt Total Nonmajor
Revenue Service Permanent Governmental
ASSETS Funds Funds Fund Funds
Cash and cash equivalents 11,227,179$ 2,021,430$ 4,119,914$ 17,368,523$
Accounts receivable 99,033 - - 99,033
Taxes receivable, net 3,607,401 - 880,414 4,487,815
Grants receivable 522,632 - - 522,632
Rehabilitation loans receivable, net 7,171,856 - - 7,171,856
Prepaid expenses 3,018 - - 3,018
Accrued interest 35,580 3,285 161,865 200,730
Advances to other funds - - 3,777,485 3,777,485
Other assets 53,632 - - 53,632
Restricted assets:
Cash and cash equivalents 10,326,033 1,337,108 - 11,663,141
TOTAL ASSETS 33,046,364$ 3,361,823$ 8,939,678$ 45,347,865$
LIABILITIES, DEFERRED INFLOWS
AND FUND BALANCE
LIABILITIES:
Accounts payable 106,482$ -$ -$ 106,482$
Accrued payroll and payroll taxes 32,045 - - 32,045
Due to other funds 236,950 - - 236,950
Other liabilities 102,549 - 919 103,468
TOTAL LIABILITIES 478,026 - 919 478,945
DEFERRED INFLOWS OF RESOURCES:
Unavailable revenue-grants 227,746 - - 227,746
TOTAL DEFERRED INFLOWS 227,746 - - 227,746
FUND BALANCE:
Nonspendable 3,018 - 1,500,000 1,503,018
Restricted 31,572,284 1,360,739 - 32,933,023
Committed 557,098 2,001,084 7,438,759 9,996,941
Assigned 213,104 - - 213,104
Unassigned (deficit) (4,912) - - (4,912)
TOTAL FUND BALANCE 32,340,592 3,361,823 8,938,759 44,641,174
TOTAL LIABILITIES, DEFERRED INFLOWS
AND FUND BALANCE 33,046,364$ 3,361,823$ 8,939,678$ 45,347,865$
SEPTEMBER 30, 2016
121

THIS PAGE INTENTIONALLY LEFT BLANK
122

Non Mid Mo Convention Community
Motorized Solid Waste and Tourism Development
ASSETS Grant Fund Mgmt Dist Fund Fund Grant Fund
Cash and cash equivalents -$ 7,824$ 1,676,940$ -$
Accounts receivable - - - -
Taxes receivable, net - - 208,926 -
Grants receivable 74,990 - - 447,642
Rehabilitation loans receivable, net - - - 7,171,856
Prepaid expenses - - 3,018 -
Accrued interest - 11 7,114 -
Other assets - - - 53,632
Restricted assets:
Cash and cash equivalents - - 2,778,903 -
TOTAL ASSETS 74,990$ 7,835$ 4,674,901$ 7,673,130$
LIABILITIES, DEFERRED INFLOWS
AND FUND BALANCE
LIABILITIES:
Accounts payable 4,929$ 37$ 83,410$ 15,489$
Accrued payroll and payroll taxes 4,316 3,514 20,262 3,953
Due to other funds 65,745 - - 85,139
Other liabilities - - 101,702 847
TOTAL LIABILITIES 74,990 3,551 205,374 105,428
DEFERRED INFLOWS OF RESOURCES:
Unavailable revenue-grants 4,912 - - 222,834
TOTAL DEFERRED INFLOWS 4,912 - - 222,834
FUND BALANCE:
Nonspendable - - 3,018 -
Restricted - 4,284 4,466,509 7,344,868
Committed - - - -
Assigned - - - -
Unassigned (deficit) (4,912) - - -
TOTAL FUND BALANCE (DEFICIT) (4,912) 4,284 4,469,527 7,344,868
TOTAL LIABILITIES, DEFERRED INFLOWS
AND FUND BALANCE 74,990$ 7,835$ 4,674,901$ 7,673,130$
CITY OF COLUMBIA, MISSOURI
COMBINING BALANCE SHEET
NONMAJOR SPECIAL REVENUE FUNDS
SEPTEMBER 30, 2016
123 (Continued)

Public Capital Stadium
Improvement Improvement TDD's
ASSETS Fund Sales Tax Fund Fund
Cash and cash equivalents 405,982$ 3,488,154$ 160,708$
Accounts receivable - - 89,735
Taxes receivable, net 138,143 816,959 -
Grants receivable - - -
Rehabilitation loans receivable, net - - -
Prepaid expenses - - -
Accrued interest 12,973 5,845 337
Other assets - - -
Restricted assets:
Cash and cash equivalents 7,547,130 - -
TOTAL ASSETS 8,104,228$ 4,310,958$ 250,780$
LIABILITIES, DEFERRED INFLOWS
AND FUND BALANCE
LIABILITIES:
Accounts payable -$ -$ -$
Accrued payroll and payroll taxes - - -
Due to other funds - - -
Other liabilities - - -
TOTAL LIABILITIES - - -
DEFERRED INFLOWS OF RESOURCES:
Unavailable revenue - grants - - -
TOTAL DEFERRED INFLOWS - - -
FUND BALANCE:
Nonspendable - - -
Restricted 7,547,130 4,310,958 250,780
Committed 557,098 - -
Assigned - - -
Unassigned (deficit) - - -
TOTAL FUND BALANCE 8,104,228 4,310,958 250,780
TOTAL LIABILITIES, DEFERRED INFLOWS
AND FUND BALANCE 8,104,228$ 4,310,958$ 250,780$
CITY OF COLUMBIA, MISSOURI
COMBINING BALANCE SHEET
NONMAJOR SPECIAL REVENUE FUNDS
SEPTEMBER 30, 2016
124 (Continued)

Transportation Total Nonmajor
Park Sales Contributions Sales Tax Special Revenue
Tax Fund Fund Fund Funds
1,170,925$ 623,487$ 3,693,159$ 11,227,179$
7,529 1,769 - 99,033
809,429 - 1,633,944 3,607,401
- - - 522,632
- - - 7,171,856
- - - 3,018
2,177 1,045 6,078 35,580
- - - 53,632
- - - 10,326,033
1,990,060$ 626,301$ 5,333,181$ 33,046,364$
-$ 2,617$ -$ 106,482
- - - 32,045
- - 86,066 236,950
- - - 102,549
- 2,617 86,066 478,026
- - - 227,746
- - - 227,746
- - - 3,018
1,990,060 410,580 5,247,115 31,572,284
- - - 557,098
- 213,104 - 213,104
- - - (4,912)
1,990,060 623,684 5,247,115 32,340,592
1,990,060$ 626,301$ 5,333,181$ 33,046,364$
NONMAJOR SPECIAL REVENUE FUNDS
SEPTEMBER 30, 2016
CITY OF COLUMBIA, MISSOURI
COMBINING BALANCE SHEET
125 (Continued)
jlgunnel
Highlight
jlgunnel
Text Box

THIS PAGE INTENTIONALLY LEFT BLANK
126

2016 Special Lemone MO Transportation Total
Obligation Trust Finance Corp Nonmajor
Bonds Note Loan Debt Service
ASSETS Debt Service Fund Debt Service Fund Debt Service Fund Funds
Cash and cash equivalents 1,129,364$ 159,308$ 732,758$ 2,021,430$
Accrued interest 1,978 219 1,088 3,285
Restricted assets:
Cash and cash equivalents - 1,320,059 17,049 1,337,108
TOTAL ASSETS 1,131,342$ 1,479,586$ 750,895$ 3,361,823$
FUND BALANCE:
Restricted - 1,343,690 17,049 1,360,739
Committed 1,131,342 135,896 733,846 2,001,084
TOTAL FUND BALANCE 1,131,342$ 1,479,586$ 750,895$ 3,361,823$
CITY OF COLUMBIA, MISSOURI
COMBINING BALANCE SHEET
NONMAJOR DEBT SERVICE FUNDS
SEPTEMBER 30, 2016
127

THIS PAGE INTENTIONALLY LEFT BLANK
128

CITY OF COLUMBIA, MISSOURI
COMBINING STATEMENT OF REVENUES, EXPENDITURES, AND CHANGES IN FUND BALANCES
NONMAJOR GOVERNMENTAL FUNDS
FOR THE YEAR ENDED SEPTEMBER 30, 2016
Special Debt Total Nonmajor
Revenue Service Permanent Governmental
Funds Funds Fund Funds
REVENUES:
Sales tax 24,346,267$ -$ -$ 24,346,267$
Other local taxes 2,555,875 - - 2,555,875
Fees and service charges 1,674,275 - - 1,674,275
Revenue from other
governmental units 3,312,764 - - 3,312,764
Lease revenue - 1,755,731 - 1,755,731
Investment revenue 402,281 102,692 177,166 682,139
Miscellaneous 138,339 - - 138,339
TOTAL REVENUES 32,429,801 1,858,423 177,166 34,465,390
EXPENDITURES:
Current:
Policy development
and administration 2,230,661 - 45,291 2,275,952
Transportation - 79,549 - 79,549
Health and environment 1,116,776 521,868 - 1,638,644
Personal development 145,817 - - 145,817
Debt Service:
Redemption of serial bonds - 8,508,973 - 8,508,973
Interest - 1,209,593 - 1,209,593
Bond issuance and other costs - 237,281 - 237,281
TOTAL EXPENDITURES 3,493,254 10,557,264 45,291 14,095,809
EXCESS (DEFICIENCY) OF REVENUES
OVER EXPENDITURES 28,936,547 (8,698,841) 131,875 20,369,581
OTHER FINANCING SOURCES (USES):
Transfers in 2,446,219 9,119,704 - 11,565,923
Transfers out (28,394,470) (5,979,433) - (34,373,903)
Proceeds of refunding bond issued - 17,580,000 - 17,580,000
Premium on refunding bond issued - 1,699,838 - 1,699,838
Payment to refunded bond escrow agent - (19,039,585) - (19,039,585)
TOTAL OTHER FINANCING
SOURCES (USES) (25,948,251) 3,380,524 - (22,567,727)
NET CHANGE IN FUND BALANCE 2,988,296 (5,318,317) 131,875 (2,198,146)
FUND BALANCE, BEGINNING OF PERIOD 29,352,296 8,680,140 8,806,884 46,839,320
FUND BALANCE, END OF PERIOD 32,340,592$ 3,361,823$ 8,938,759$ 44,641,174$
129

THIS PAGE INTENTIONALLY LEFT BLANK
130

CITY OF COLUMBIA, MISSOURICOMBINING STATEMENT OF REVENUES, EXPENDITURES, AND CHANGES IN FUND BALANCES
NONMAJOR SPECIAL REVENUE FUNDSFOR THE YEAR ENDED SEPTEMBER 30, 2016
Non Mid Mo Convention Community
Motorized Solid Waste and Tourism Development
Grant Fund Mgmt Dist Fund Fund Grant Fund
REVENUES:
Other local taxes -$ -$ 2,555,875$ -$
Revenue from other
governmental units 429,602 84,023 52,030 1,711,395
Investment revenue - 223 117,070 11,315
Miscellaneous - - 19,272 1,000
TOTAL REVENUES 429,602 84,246 2,744,247 1,723,710
EXPENDITURES:
Current:
Policy development
and administration 226,540 128,233 1,820,875 -
Health and environment - - - 1,116,776
Personal development 79,501 - - -
TOTAL EXPENDITURES 306,041 128,233 1,820,875 1,116,776
EXCESS (DEFICIENCY) OF REVENUES
OVER EXPENDITURES 123,561 (43,987) 923,372 606,934
OTHER FINANCING SOURCES (USES):
Transfers in - 48,271 - -
Transfers out - - (283,616) (291,723)
TOTAL OTHER FINANCING
SOURCES (USES) - 48,271 (283,616) (291,723)
NET CHANGE IN FUND BALANCE 123,561 4,284 639,756 315,211
FUND BALANCE (DEFICIT), BEGINNING OF PERIOD (128,473) - 3,829,771 7,029,657
FUND BALANCE (DEFICIT), END OF PERIOD (4,912)$ 4,284$ 4,469,527$ 7,344,868$
131 (Continued)

Public Capital Stadium
Improvement Improvement TDD's
Fund Sales Tax Fund Fund
REVENUES:
Sales tax 996,320$ 5,837,471$ -$
Other local taxes - - -
Fees and service charges 1,674,275 - -
Revenue from other
governmental units - - 1,035,714
Investment revenue 153,482 19,585 8,162
Miscellaneous - - -
TOTAL REVENUES 2,824,077 5,857,056 1,043,876
EXPENDITURES:
Current:
Policy development
and administration 55,013 - -
Health and environment - - -
Personal development - 12,117 -
TOTAL EXPENDITURES 55,013 12,117 -
EXCESS (DEFICIENCY) OF REVENUES
OVER EXPENDITURES 2,769,064 5,844,939 1,043,876
OTHER FINANCING SOURCES (USES):
Transfers in - 2,397,948 -
Transfers out (2,068,965) (6,649,244) (983,476)
TOTAL OTHER FINANCING
SOURCES (USES) (2,068,965) (4,251,296) (983,476)
NET CHANGE IN FUND BALANCE 700,099 1,593,643 60,400
FUND BALANCE (DEFICIT), BEGINNING OF PERIOD 7,404,129 2,717,315 190,380
FUND BALANCE (DEFICIT), END OF PERIOD 8,104,228$ 4,310,958$ 250,780$
CITY OF COLUMBIA, MISSOURICOMBINING STATEMENT OF REVENUES, EXPENDITURES, AND CHANGES IN FUND BALANCES
NONMAJOR SPECIAL REVENUE FUNDSFOR THE YEAR ENDED SEPTEMBER 30, 2016
132 (Continued)

COMBINING STATEMENT OF REVENUES, EXPENDITURES, AND CHANGES IN FUND BALANCES
Transportation Total Nonmajor
Park Sales Contributions Sales Tax Special Revenue
Tax Fund Fund Fund Funds
5,837,277$ -$ 11,675,199$ 24,346,267$
- - - 2,555,875
- - - 1,674,275
- - - 3,312,764
3,144 13,151 76,149 402,281
- 118,067 - 138,339
5,840,421 131,218 11,751,348 32,429,801
- - - 2,230,661
- - - 1,116,776
21,066 20,960 12,173 145,817
21,066 20,960 12,173 3,493,254
5,819,355 110,258 11,739,175 28,936,547
- - - 2,446,219
(5,974,927) (95,777) (12,046,742) (28,394,470)
(5,974,927) (95,777) (12,046,742) (25,948,251)
(155,572) 14,481 (307,567) 2,988,296
2,145,632 609,203 5,554,682 29,352,296
1,990,060$ 623,684$ 5,247,115$ 32,340,592$
FOR THE YEAR ENDED SEPTEMBER 30, 2016
CITY OF COLUMBIA, MISSOURI
NONMAJOR SPECIAL REVENUE FUNDS
133 (Continued)
jlgunnel
Text Box

THIS PAGE INTENTIONALLY LEFT BLANK
134

CITY OF COLUMBIA, MISSOURICOMBINING STATEMENT OF REVENUES, EXPENDITURES, AND CHANGES IN FUND BALANCES
NONMAJOR DEBT SERVICE FUNDSFOR THE YEAR ENDED SEPTEMBER 30, 2016
2006B Special 2008B Special 2016 Special Lemone MO Transportation TotalObligation Obligation Obligation Trust Finance Corp Nonmajor
Bonds Bonds Bonds Note Loan Debt ServiceDebt Service Fund Debt Service Fund Debt Service Fund Debt Service Fund Debt Service Fund Funds
REVENUES:Lease revenue -$ -$ -$ 1,755,731$ -$ 1,755,731$ Investment revenue 30,750 60,930 5,075 3,307 2,630 102,692
TOTAL REVENUES 30,750 60,930 5,075 1,759,038 2,630 1,858,423
EXPENDITURES:Health and Environment - - - 521,868 - 521,868 Transportation - - - - 79,549 79,549 Debt Service:
Redemption of serial bonds 3,095,000 1,245,000 2,194,500 1,203,360 771,113 8,508,973 Interest 77,600 462,624 74,560 382,446 212,363 1,209,593 Bond issuance and other costs - - 237,281 - - 237,281
TOTAL EXPENDITURES 3,172,600 1,707,624 2,506,341 2,107,674 1,063,025 10,557,264
EXCESS (DEFICIENCY) OF REVENUES OVER EXPENDITURES (3,141,850) (1,646,694) (2,501,266) (348,636) (1,060,395) (8,698,841)
OTHER FINANCING SOURCES (USES):Transfers in 2,064,938 1,898,107 3,392,355 73,965 1,690,339 9,119,704 Transfers out (2,635,108) (3,344,325) - - - (5,979,433) Proceeds of refunding bond issued - - 17,580,000 - - 17,580,000 Premium on refunding bond issued - - 1,699,838 - - 1,699,838 Payment to refunded bond escrow agent - - (19,039,585) - - (19,039,585)
TOTAL OTHER FINANCING SOURCES (USES) (570,170) (1,446,218) 3,632,608 73,965 1,690,339 3,380,524
NET CHANGE IN FUND BALANCE (3,712,020) (3,092,912) 1,131,342 (274,671) 629,944 (5,318,317)
FUND BALANCE, BEGINNING OF PERIOD 3,712,020 3,092,912 - 1,754,257 120,951 8,680,140
FUND BALANCE, END OF PERIOD -$ -$ 1,131,342$ 1,479,586$ 750,895$ 3,361,823$
135

CITY OF COLUMBIA, MISSOURI CITY OF COLUMBIA, MISSOURI
BUDGETARY COMPARISON SCHEDULE BUDGETARY COMPARISON SCHEDULENONMAJOR GOVERNMENTAL FUNDS NONMAJOR GOVERNMENTAL FUNDS
FOR THE YEAR ENDED SEPTEMBER 30, 2016 FOR THE YEAR ENDED SEPTEMBER 30, 2016
Stadium TDD's Transportation Sales Tax Fund
Budgeted ActualAmounts Amounts Variance
REVENUES:
General property taxes -$ -$ -$
Sales tax - - -
Other local taxes - - -
Fees and service charges - - -
Revenue from other governmental units 1,087,490 1,035,714 (51,776)
Lease revenue
Investment revenue 4,408 8,162 3,754
Miscellaneous revenue - - -
TOTAL REVENUES 1,091,898 1,043,876 (48,022)
EXPENDITURES:
Current:
Policy development and administration - - -
Health and environment - - -
Transportation - - -
Personal development - - -
Transportation - - -
Miscellaneous nonprogrammed activities:
Capital outlay - - -
Debt Service - - -
TOTAL EXPENDITURES - - -
EXCESS OF REVENUES OVER
EXPENDITURES 1,091,898 1,043,876 (48,022)
OTHER FINANCING SOURCES (USES):
Transfers from other funds - - -
Transfers to other funds (983,476) (983,476) -
Miscellaneous - - -
Loan proceeds - - -
Proceeds of refunding bond issued - - -
Premium on refunding bond issued - - -
Payment to refunded bond escrow agent - - -
TOTAL OTHER FINANCING SOURCES
(USES) (983,476) (983,476) -
NET CHANGE IN FUND BALANCE 108,422 60,400 (48,022)
FUND BALANCE, BEGINNING OF PERIOD 199,360 190,380 (8,980)
FUND BALANCE, END OF PERIOD 307,782$ 250,780$ (57,002)$
136 (Continued)

CITY OF COLUMBIA, MISSOURI CITY OF COLUMBIA, MISSOURIBUDGETARY COMPARISON SCHEDULE BUDGETARY COMPARISON SCHEDULENONMAJOR GOVERNMENTAL FUNDS NONMAJOR GOVERNMENTAL FUNDS
FOR THE YEAR ENDED SEPTEMBER 30, 2016 FOR THE YEAR ENDED SEPTEMBER 30, 2016
Transportation Sales Tax Fund Convention and Tourism Fund
Budgeted Actual Budgeted ActualAmounts Amounts Variance Amounts Amounts Variance
-$ -$ -$ -$ -$ -$
11,819,737 11,675,199 (144,538) - - -
- - - 2,445,450 2,555,875 110,425
- - - - - -
- - - 82,266 52,030 (30,236)
- - - - - -
66,254 76,149 9,895 49,110 117,070 67,960
- - - 37,000 19,272 (17,728)
11,885,991 11,751,348 (134,643) 2,613,826 2,744,247 130,421
- - - 2,397,966 1,820,875 577,091
- - - - - -
- - - - - -
12,173 12,173 - - - -
- - - - - -
- - - - - -
- - - - - -
12,173 12,173 - 2,397,966 1,820,875 577,091
11,873,818 11,739,175 (134,643) 215,860 923,372 707,512
- - - - - -
(12,046,742) (12,046,742) - (274,116) (283,616) (9,500)
- - - - - -
- - - - - -
- - - - - -
- - - - - -
- - - - - -
(12,046,742) (12,046,742) - (274,116) (283,616) (9,500)
(172,924) (307,567) (134,643) (58,256) 639,756 698,012
5,734,808 5,554,682 (180,126) 3,401,704 3,829,771 428,067
5,561,884$ 5,247,115$ (314,769)$ 3,343,448$ 4,469,527$ 1,126,079$
137 (Continued)

CITY OF COLUMBIA, MISSOURI CITY OF COLUMBIA, MISSOURIBUDGETARY COMPARISON SCHEDULE BUDGETARY COMPARISON SCHEDULENONMAJOR GOVERNMENTAL FUNDS NONMAJOR GOVERNMENTAL FUNDS
FOR THE YEAR ENDED SEPTEMBER 30, 2016 FOR THE YEAR ENDED SEPTEMBER 30, 2016
Public Improvement Fund Capital Improvement Sales Tax Fund
Budgeted ActualAmounts Amounts Variance
REVENUES:
General property taxes -$ -$ -$
Sales tax 1,016,814 996,320 (20,494)
Other local taxes - - -
Fees and service charges 1,350,000 1,674,275 324,275
Revenue from other governmental units - - -
Lease revenue - - -
Investment revenue 125,226 153,482 28,256
Miscellaneous revenue - - -
TOTAL REVENUES 2,492,040 2,824,077 332,037
EXPENDITURES:
Current:
Policy development and administration 55,013 55,013 -
Health and environment - - -
Transportation - - -
Personal development - - -
Transportation - - -
Miscellaneous nonprogrammed activities:
Capital outlay - - -
Debt Service - - -
TOTAL EXPENDITURES 55,013 55,013 -
EXCESS OF REVENUES OVER
EXPENDITURES 2,437,027 2,769,064 332,037
OTHER FINANCING SOURCES (USES):
Transfers from other funds - - -
Transfers to other funds (2,068,965) (2,068,965) -
Miscellaneous - - -
Loan proceeds - - -
Proceeds of refunding bond issued - - -
Premium on refunding bond issued - - -
Payment to refunded bond escrow agent - - -
TOTAL OTHER FINANCING SOURCES
(USES) (2,068,965) (2,068,965) -
NET CHANGE IN FUND BALANCE 368,062 700,099 332,037
FUND BALANCE, BEGINNING OF PERIOD 7,524,634 7,404,129 (120,505)
FUND BALANCE, END OF PERIOD 7,892,696$ 8,104,228$ 211,532$
138 (Continued)

CITY OF COLUMBIA, MISSOURI CITY OF COLUMBIA, MISSOURIBUDGETARY COMPARISON SCHEDULE BUDGETARY COMPARISON SCHEDULENONMAJOR GOVERNMENTAL FUNDS NONMAJOR GOVERNMENTAL FUNDS
FOR THE YEAR ENDED SEPTEMBER 30, 2016 FOR THE YEAR ENDED SEPTEMBER 30, 2016
Capital Improvement Sales Tax Fund Park Sales Tax Fund
Budgeted Actual Budgeted ActualAmounts Amounts Variance Amounts Amounts Variance
-$ -$ -$ -$ -$ -$
5,827,398 5,837,471 10,073 4,427,497 5,837,277 1,409,780
- - - - - -
- - - - - -
- - - - - -
- - - - - -
- 19,585 19,585 19,366 3,144 (16,222)
- - - - - -
5,827,398 5,857,056 29,658 4,446,863 5,840,421 1,393,558
- - - - - -
- - - - - -
- - - - - -
12,117 12,117 - 21,066 21,066 -
- - - - - -
- - - - - -
- - - - - -
12,117 12,117 - 21,066 21,066 -
5,815,281 5,844,939 29,658 4,425,797 5,819,355 1,393,558
2,397,948 2,397,948 - - - -
(7,607,619) (6,649,244) 958,375 (5,974,927) (5,974,927) -
- - - - - -
- - - - - -
- - - - - -
- - - - - -
- - - - - -
(5,209,671) (4,251,296) 958,375 (5,974,927) (5,974,927) -
605,610 1,593,643 988,033 (1,549,130) (155,572) 1,393,558
2,704,725 2,717,315 12,590 2,187,487 2,145,632 (41,855)
3,310,335$ 4,310,958$ 1,000,623$ 638,357$ 1,990,060$ 1,351,703$
139 (Continued)

CITY OF COLUMBIA, MISSOURIBUDGETARY COMPARISON SCHEDULENONMAJOR GOVERNMENTAL FUNDS
FOR THE YEAR ENDED SEPTEMBER 30, 2016
Contributions Fund Fund
Budgeted ActualAmounts Amounts Variance
REVENUES:
General property taxes -$ -$ -$
Sales tax - - -
Other local taxes - - -
Fees and service charges - - -
Revenue from other governmental units - - -
Lease revenue - - -
Investment revenue 12,618 13,151 533
Miscellaneous revenue 81,842 118,067 36,225
TOTAL REVENUES 94,460 131,218 36,758
EXPENDITURES:
Current:
Policy development and administration 12,974 - 12,974
Health and environment - - -
Transportation - - -
Personal development 11,404 20,960 (9,556)
Transportation - - -
Miscellaneous nonprogrammed activities:
Capital outlay - - -
Debt Service - - -
TOTAL EXPENDITURES 24,378 20,960 3,418
EXCESS (DEFICIENCY) OF REVENUES OVER
EXPENDITURES 70,082 110,258 40,176
OTHER FINANCING SOURCES (USES):
Transfers from other funds - - -
Transfers to other funds (95,778) (95,777) 1
Miscellaneous - - -
Loan proceeds - - -
Proceeds of refunding bond issued - - -
Premium on refunding bond issued - - -
Payment to refunded bond escrow agent - - -
TOTAL OTHER FINANCING SOURCES
(USES) (95,778) (95,777) 1
NET CHANGE IN FUND BALANCE (25,696) 14,481 40,177
FUND BALANCE, BEGINNING OF PERIOD 608,375 609,203 828
FUND BALANCE (DEFICIT), END OF PERIOD 582,679$ 623,684$ 41,005$
140 (Continued)

CITY OF COLUMBIA, MISSOURIBUDGETARY COMPARISON SCHEDULENONMAJOR GOVERNMENTAL FUNDS
Fund Fund
Budgeted Actual Budgeted ActualAmounts Amounts Variance Amounts Amounts Variance
-$ -$ -$ -$ -$ -$
- - - - - -
- - - - - -
- - - - - -
779,613 429,602 (350,011) 95,583 84,023 (11,560)
- - - - - -
- - - - 223 223
- - - - - -
779,613 429,602 (350,011) 95,583 84,246 (11,337)
742,981 226,540 516,441 - 128,233 (128,233)
- - - 143,854 - 143,854
- - - - - -
99,016 79,501 19,515 - - -
- - - - - -
- - - - - -
- - - - - -
841,997 306,041 535,956 143,854 128,233 15,621
(62,384) 123,561 185,945 (48,271) (43,987) 4,284
- - - 48,271 48,271 -
- - - - - -
- - - - - -
- - - - - -
- - - - - -
- - - - - -
- - - - - -
- - - 48,271 48,271 -
(62,384) 123,561 185,945 - 4,284 4,284
- (128,473) (128,473) - - -
(62,384)$ (4,912)$ 57,472$ -$ 4,284$ 4,284$
FOR THE YEAR ENDED SEPTEMBER 30, 2016
Non-Motorized Grant Mid Mo Solid Waste Mgt District
CITY OF COLUMBIA, MISSOURIBUDGETARY COMPARISON SCHEDULENONMAJOR GOVERNMENTAL FUNDS
141 (Continued)

CITY OF COLUMBIA, MISSOURIBUDGETARY COMPARISON SCHEDULENONMAJOR GOVERNMENTAL FUNDS
Debt Service Funds (Combined)
Budgeted ActualAmounts Amounts Variance
REVENUES:
General property taxes -$ -$ -$
Sales tax - - -
Other local taxes - - -
Fees and service charges - - -
Revenue from other governmental units - - -
Lease revenue - 1,755,731 1,755,731
Investment revenue 132,606 102,692 (29,914)
Miscellaneous revenue 1,257,494 - (1,257,494)
TOTAL REVENUES 1,390,100 1,858,423 468,323
EXPENDITURES:
Current:
Policy development and administration - - -
Health and environment - 521,868 (521,868)
Transportation - 79,549 (79,549)
Personal development - - -
Transportation - - -
Miscellaneous nonprogrammed activities:
Capital outlay - - -
Debt Service 7,880,251 9,955,847 (2,075,596)
TOTAL EXPENDITURES 7,880,251 10,557,264 (2,677,013)
EXCESS OF REVENUES OVER
EXPENDITURES (6,490,151) (8,698,841) (2,208,690)
OTHER FINANCING SOURCES (USES):
Transfers from other funds 9,269,773 9,119,704 (150,069)
Transfers to other funds (5,744,103) (5,979,433) (235,330)
Miscellaneous - -
Loan proceeds - -
Proceeds of refunding bond issued - 17,580,000 17,580,000
Premium on refunding bond issued - 1,699,838 1,699,838
Payment to refunded bond escrow agent - (19,039,585) (19,039,585)
TOTAL OTHER FINANCING SOURCES
(USES) 3,525,670 3,380,524 (145,146)
NET CHANGE IN FUND BALANCE (2,964,481) (5,318,317) (2,353,836)
FUND BALANCE, BEGINNING OF PERIOD 9,419,547 8,680,140 (739,407)
FUND BALANCE, END OF PERIOD 6,455,066$ 3,361,823$ (3,093,243)$
FOR THE YEAR ENDED SEPTEMBER 30, 2016
142

CITY OF COLUMBIA, MISSOURI
NON-MAJOR
ENTERPRISE FUNDS
Enterprise Funds are used to account for operations that are financed and operated in a manner
similar to private business enterprises-where the intent of the government's council is that the
costs of providing goods or services to the general public on a continuing basis be financed or
recovered primarily through user charges; or where the government's council has decided that
periodic determination of net income is appropriate for accountability purposes.
Parking Facilities Fund - to account for revenues and expenses resulting from the operation
and maintenance of City parking lots, municipal garages, and parking meters.
Recreational Services Fund - to account for revenues and expenses for various recreational
services provided by the Parks and Recreation Department for which participants are charged fees.
Storm Water Utility Fund - to account for storm water funding, implementation of storm
water management projects, and provide maintenance to existing drainage facilities.
Solid Waste Fund - to account for the provision of solid waste collection and operation of the landfill.
Regional Airport Fund - to account for all the expenses incurred and revenues received by
operations at the Columbia Regional Airport.
Public Transportation Fund - to account for all the expenses and revenues resulting from the
provision of public transportation services by the Columbia Area Transportation System.
Railroad Fund - to account for revenues and expenses resulting from the operation of a
railroad branch line which runs from a Norfolk and Southern main line in Centralia, Missouri
to the City of Columbia.
Transload Fund - to account for revenues and expenses associated with the operation
and maintenance of the Transload Facility.

THIS PAGE IS INTENTIONALLY LEFT BLANK
145

Parking Recreational Storm Solid
Facilities Services Water Waste
Fund Fund Fund Fund
ASSETS
Current assets:
Cash and cash equivalents 3,280,780$ 2,050,543$ 3,142,877$ 11,378,346$
Receivable, net 77,119 6,249 131,612 2,295,796
Grants receivable - - - 61,248
Accrued interest 38,823 2,578 5,179 24,810
Inventory - 27,133 - 349,800
Prepaid items - 1,876 - 600
Total current assets 3,396,722 2,088,379 3,279,668 14,110,600
Noncurrent assets:
Restricted assets:
Bond covenant account cash 2,299,616 - - 256,606
Closure and postclosure reserve - - - 2,690,137
Customer security and escrow cash - - - 651,811
Grants receivable - - - -
Total restricted assets 2,299,616 - - 3,598,554
Capital assets:
Land 2,589,201 398,674 426,041 1,446,082
Structures and improvements 43,406,619 21,735,777 13,044,756 20,780,525
Furniture, fixtures and equipment 457,595 1,190,283 410,452 19,030,093
Construction in progress 4,500 - 323,629 2,201,512
Less accumulated depreciation (12,639,229) (10,801,426) (7,023,161) (25,538,048)
Total capital assets 33,818,686 12,523,308 7,181,717 17,920,164
Total noncurrent assets 36,118,302 12,523,308 7,181,717 21,518,718
Total Assets 39,515,024 14,611,687 10,461,385 35,629,318
DEFERRED OUTFLOWS
Outflows related to pension 256,544 905,098 228,310 2,966,409
Deferred charge on refunding of debt 106,702 - - 59,669
Total deferred outflows 363,246 905,098 228,310 3,026,078
LIABILITIES
Current liabilities:
Accounts payable 39,979 63,345 40,649 819,496
Accrued interest 81,452 - - 9,839
Accrued payroll and payroll taxes 17,685 108,045 8,383 186,396
Accrued compensated absences 9,441 129,501 19,434 171,678
Accrued sales taxes - 26 - -
Due to other funds - - - -
Loans payable to other funds –
current maturities - - - -
Obligations under capital leases - - - -
Unearned revenue 408,467 30,758 - -
Other liabilities 15,205 - 5,052 4,704
Construction contracts payable 481,929 30,150 19,554 635,528
Special obligation bonds payable 505,000 - - 365,000
Customer security and escrow deposits - - - 657,528
Total current liabilities 1,559,158 361,825 93,072 2,850,169
Noncurrent liabilities:
Accrued compensated absences 5,100 69,966 10,500 92,754
Special obligation bonds payable 20,635,835 - - 2,052,421
Advances from other funds 811,519 97,691 - 2,539,275
Loans payable to other funds - - - -
Obligations under capital leases - - - -
Other long-term liabilities - - - 2,690,137
Net pension liability 86,193 304,093 76,707 996,649
Total noncurrent liabilities 21,538,647 471,750 87,207 8,371,236
Total Liabilities 23,097,805 833,575 180,279 11,221,405
DEFERRED INFLOWS
Inflows related to pension 49,332 174,046 43,903 570,425
Total deferred inflows 49,332 174,046 43,903 570,425
NET POSITION
Net investment in capital assets 14,477,147 12,523,308 7,181,717 15,562,412
Restricted for:
Capital Projects - - - -
Debt Service 607,022 - - 246,767
Unrestricted 1,646,964 1,985,856 3,283,796 11,054,387
Total Net Position 16,731,133$ 14,509,164$ 10,465,513$ 26,863,566$
NONMAJOR ENTERPRISE FUNDS
SEPTEMBER 30, 2016
CITY OF COLUMBIA, MISSOURI
COMBINING STATEMENT OF NET POSITION
146 (Continued)

Regional Public Total Nonmajor
Airport Transportation Railroad Transload Enterprise
Fund Fund Fund Fund Funds
3,336,767$ 1,770,281$ 376,228$ 206,349$ 25,542,171$
79,497 340,494 58,865 154,691 3,144,323
- 2,259,648 - - 2,320,896
5,815 2,142 616 330 80,293
- - 147,916 - 524,849
1,050 74,366 - - 77,892
3,423,129 4,446,931 583,625 361,370 31,690,424
- - - - 2,556,222
- - - - 2,690,137
- - - - 651,811
1,305,970 22,016 - - 1,327,986
1,305,970 22,016 - - 7,226,156
1,670,696 - 93,530 976,933 7,601,157
40,368,294 3,947,109 12,472,617 2,563,883 158,319,580
3,044,583 13,939,661 1,522,000 59,768 39,654,435
1,352,992 39,399 - - 3,922,032
(15,822,270) (9,115,073) (6,449,924) (457,348) (87,846,479)
30,614,295 8,811,096 7,638,223 3,143,236 121,650,725
31,920,265 8,833,112 7,638,223 3,143,236 128,876,881
35,343,394 13,280,043 8,221,848 3,504,606 160,567,305
506,301 1,410,314 - 81,442 6,354,418
- - - - 166,371
506,301 1,410,314 - 81,442 6,520,789
127,731 51,227 12,536 1,727 1,156,690
- - - - 91,291
48,569 134,154 5,083 - 508,315
58,870 58,065 11,549 4,349 462,887
176 - - - 202
- 462,600 - - 462,600
- - 73,529 79,676 153,205
25,155 47,488 - - 72,643
205 93,610 - - 533,040
6,144 - 3,150 984 35,239
361,632 1,100 852 - 1,530,745
- - - - 870,000
- - - - 657,528
628,482 848,244 106,699 86,736 6,534,385
31,806 31,372 6,240 3,290 251,028
- - - - 22,688,256
- - - - 3,448,485
- - 427,220 2,126,714 2,553,934
99,583 553,451 - - 653,034
- - - - 2,690,137
170,106 473,835 - 27,363 2,134,946
301,495 1,058,658 433,460 2,157,367 34,419,820
929,977 1,906,902 540,159 2,244,103 40,954,205
97,359 271,196 - 15,661 1,221,922
97,359 271,196 - 15,661 1,221,922
30,489,557 8,210,157 7,638,223 3,143,236 99,225,757
1,305,970 22,016 - - 1,327,986
- - - - 853,789
3,026,832 4,280,086 43,466 (1,816,952) 23,504,435
34,822,359$ 12,512,259$ 7,681,689$ 1,326,284$ 124,911,967$
NONMAJOR ENTERPRISE FUNDS
SEPTEMBER 30, 2016
CITY OF COLUMBIA, MISSOURI
COMBINING STATEMENT OF NET POSITION
147 (Continued)
jlgunnel
Text Box

Parking Recreational Storm Solid
Facilities Services Water Waste
Fund Fund Fund Fund
OPERATING REVENUES:
Charges for services 4,154,260$ 4,243,961$ 1,613,480$ 19,889,348$
OPERATING EXPENSES:
Personal services 538,910 3,635,982 481,402 6,148,634
Materials, supplies, and power 143,274 1,020,471 136,037 3,536,284
Travel and training 3,518 7,290 2,899 8,016
Intragovernmental 192,011 765,058 220,600 2,344,825
Utilities, services, and miscellaneous 341,260 1,131,793 71,477 5,279,422
Depreciation 1,003,833 688,325 506,186 1,945,074
Total Operating Expenses 2,222,806 7,248,919 1,418,601 19,262,255
Operating Income (Loss) 1,931,454 (3,004,958) 194,879 627,093
NONOPERATING REVENUES
(EXPENSES):
Investment revenue 356,322 35,654 62,993 284,960
Revenue from other governmental
units - 6,470 - 62,689
Miscellaneous revenue 416 110,333 12,150 188,404
Interest expense (961,240) (2,622) - (122,505)
Loss on disposal of capital assets (660) - (15,977) (534,418)
Miscellaneous expense (35,584) (4,395) - (22,581)
Total Nonoperating
Revenues (Expenses) (640,746) 145,440 59,166 (143,451)
Income (Loss) Before
Contributions and Transfers 1,290,708 (2,859,518) 254,045 483,642
Transfers in - 2,362,547 47,000 -
Transfers out (296,058) (90,000) (182,448) (188,081)
Capital contribution - - - -
Total Transfers & Contributions (296,058) 2,272,547 (135,448) (188,081)
Changes in Net Position 994,650 (586,971) 118,597 295,561
NET POSITION-BEGINNING 15,736,483 15,096,135 10,346,916 26,568,005
NET POSITION-ENDING 16,731,133$ 14,509,164$ 10,465,513$ 26,863,566$
CITY OF COLUMBIA, MISSOURI
NONMAJOR ENTERPRISE FUNDS
FOR THE YEAR ENDED SEPTEMBER 30, 2016
COMBINING STATEMENT OF REVENUES, EXPENSES, AND CHANGES IN FUND NET POSITION
148 (Continued)

COMBINING STATEMENT OF REVENUES, EXPENSES, AND CHANGES IN FUND NET POSITION
Regional Public Total Nonmajor
Airport Transportation Railroad Transload Enterprise
Fund Fund Fund Fund Funds
712,502$ 2,031,376$ 331,815$ 256,693$ 33,233,435$
1,326,809 3,958,268 256,335 98,125 16,444,465
211,631 1,297,631 48,461 4,823 6,398,612
22,694 4,057 - - 48,474
354,766 1,051,908 85,888 44,117 5,059,173
910,202 885,830 157,190 112,262 8,889,436
863,215 965,977 459,010 69,476 6,501,096
3,689,317 8,163,671 1,006,884 328,803 43,341,256
(2,976,815) (6,132,295) (675,069) (72,110) (10,107,821)
39,682 45,067 8,173 1,548 834,399
183,558 2,305,196 - - 2,557,913
67,677 49,810 13,284 - 442,074
(86,998) (5,189) (20,574) (11,032) (1,210,160)
- (32,282) - - (583,337)
- (1,738) - - (64,298)
203,919 2,360,864 883 (9,484) 1,976,591
(2,772,896) (3,771,431) (674,186) (81,594) (8,131,230)
3,183,552 3,316,886 150,000 208,650 9,268,635
- (1,530) - (4,477) (762,594)
4,122,543 22,016 - - 4,144,559
7,306,095 3,337,372 150,000 204,173 12,650,600
4,533,199 (434,059) (524,186) 122,579 4,519,370
30,289,160 12,946,318 8,205,875 1,203,705 120,392,597
34,822,359$ 12,512,259$ 7,681,689$ 1,326,284$ 124,911,967$
CITY OF COLUMBIA, MISSOURI
NONMAJOR ENTERPRISE FUNDS
FOR THE YEAR ENDED SEPTEMBER 30, 2016
CITY OF COLUMBIA, MISSOURI
NONMAJOR ENTERPRISE FUNDS
FOR THE YEAR ENDED SEPTEMBER 30, 2016
COMBINING STATEMENT OF REVENUES, EXPENSES, AND CHANGES IN FUND NET POSITION
149 (Continued)
jlgunnel
Text Box
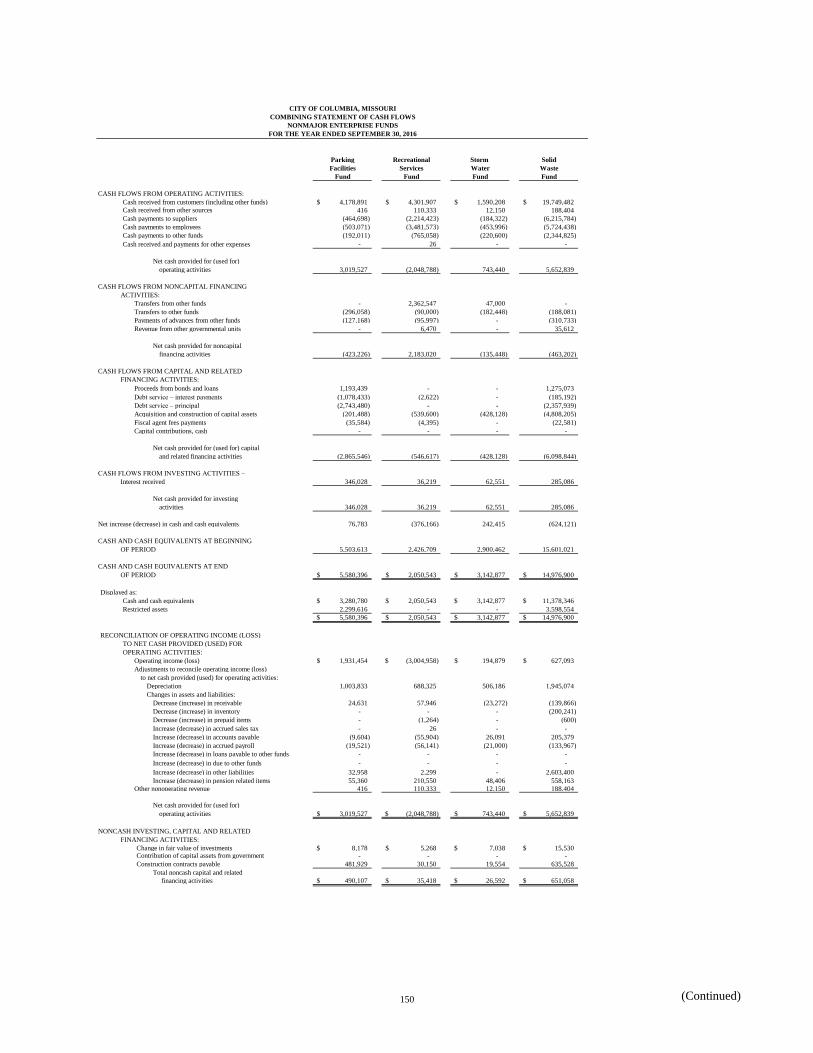
Parking Recreational Storm Solid
Facilities Services Water Waste
Fund Fund Fund Fund
CASH FLOWS FROM OPERATING ACTIVITIES:
Cash received from customers (including other funds) 4,178,891$ 4,301,907$ 1,590,208$ 19,749,482$
Cash received from other sources 416 110,333 12,150 188,404
Cash payments to suppliers (464,698) (2,214,423) (184,322) (6,215,784)
Cash payments to employees (503,071) (3,481,573) (453,996) (5,724,438)
Cash payments to other funds (192,011) (765,058) (220,600) (2,344,825)
Cash received and payments for other expenses - 26 - -
Net cash provided for (used for)
operating activities 3,019,527 (2,048,788) 743,440 5,652,839
CASH FLOWS FROM NONCAPITAL FINANCING
ACTIVITIES:
Transfers from other funds - 2,362,547 47,000 -
Transfers to other funds (296,058) (90,000) (182,448) (188,081)
Payments of advances from other funds (127,168) (95,997) - (310,733)
Revenue from other governmental units - 6,470 - 35,612
Net cash provided for noncapital
financing activities (423,226) 2,183,020 (135,448) (463,202)
CASH FLOWS FROM CAPITAL AND RELATED
FINANCING ACTIVITIES:
Proceeds from bonds and loans 1,193,439 - - 1,275,073
Debt service – interest payments (1,078,433) (2,622) - (185,192)
Debt service – principal (2,743,480) - - (2,357,939)
Acquisition and construction of capital assets (201,488) (539,600) (428,128) (4,808,205)
Fiscal agent fees payments (35,584) (4,395) - (22,581)
Capital contributions, cash - - - -
Net cash provided for (used for) capital
and related financing activities (2,865,546) (546,617) (428,128) (6,098,844)
CASH FLOWS FROM INVESTING ACTIVITIES –
Interest received 346,028 36,219 62,551 285,086
Net cash provided for investing
activities 346,028 36,219 62,551 285,086
Net increase (decrease) in cash and cash equivalents 76,783 (376,166) 242,415 (624,121)
CASH AND CASH EQUIVALENTS AT BEGINNING
OF PERIOD 5,503,613 2,426,709 2,900,462 15,601,021
CASH AND CASH EQUIVALENTS AT END
OF PERIOD 5,580,396$ 2,050,543$ 3,142,877$ 14,976,900$
Displayed as:
Cash and cash equivalents 3,280,780$ 2,050,543$ 3,142,877$ 11,378,346$
Restricted assets 2,299,616 - - 3,598,554
5,580,396$ 2,050,543$ 3,142,877$ 14,976,900$
RECONCILIATION OF OPERATING INCOME (LOSS)
TO NET CASH PROVIDED (USED) FOR
OPERATING ACTIVITIES:
Operating income (loss) 1,931,454$ (3,004,958)$ 194,879$ 627,093$
Adjustments to reconcile operating income (loss)
to net cash provided (used) for operating activities:
Depreciation 1,003,833 688,325 506,186 1,945,074
Changes in assets and liabilities:
Decrease (increase) in receivable 24,631 57,946 (23,272) (139,866)
Decrease (increase) in inventory - - - (200,241)
Decrease (increase) in prepaid items - (1,264) - (600)
Increase (decrease) in accrued sales tax - 26 - -
Increase (decrease) in accounts payable (9,604) (55,904) 26,091 205,379
Increase (decrease) in accrued payroll (19,521) (56,141) (21,000) (133,967)
Increase (decrease) in loans payable to other funds - - - -
Increase (decrease) in due to other funds - - - -
Increase (decrease) in other liabilities 32,958 2,299 - 2,603,400
Increase (decrease) in pension related items 55,360 210,550 48,406 558,163
Other nonoperating revenue 416 110,333 12,150 188,404
Net cash provided for (used for)
operating activities 3,019,527$ (2,048,788)$ 743,440$ 5,652,839$
NONCASH INVESTING, CAPITAL AND RELATED
FINANCING ACTIVITIES:
Change in fair value of investments 8,178$ 5,268$ 7,038$ 15,530$ Contribution of capital assets from government - - - -
Construction contracts payable 481,929 30,150 19,554 635,528
Total noncash capital and related
financing activities 490,107$ 35,418$ 26,592$ 651,058$
NONMAJOR ENTERPRISE FUNDS
FOR THE YEAR ENDED SEPTEMBER 30, 2016
CITY OF COLUMBIA, MISSOURI
COMBINING STATEMENT OF CASH FLOWS
150 (Continued)

Regional Public Total Nonmajor
Airport Transportation Railroad Transload Enterprise
Fund Fund Fund Fund Funds
731,883$ 2,031,215$ 379,582$ 177,086$ 33,140,254$
67,677 49,810 13,284 - 442,074
(1,163,183) (2,171,675) (196,144) (113,221) (12,723,450)
(1,240,035) (3,723,231) (262,886) (87,251) (15,476,481)
(1,521,266) (589,308) (85,888) (44,117) (5,763,073)
176 - - - 202
(3,124,748) (4,403,189) (152,052) (67,503) (380,474)
3,183,552 3,316,886 150,000 208,650 9,268,635
- (1,530) - (4,477) (762,594)
- - - - (533,898)
183,558 793,577 - - 1,019,217
3,367,110 4,108,933 150,000 204,173 8,991,360
- - - - 2,468,512
(86,998) (5,189) (20,574) (11,032) (1,390,040)
(25,155) (47,061) (73,528) - (5,247,163)
(7,046,988) (82,427) (113,374) - (13,220,210)
- (1,738) - - (64,298)
5,720,730 3,617 - - 5,724,347
(1,438,411) (132,798) (207,476) (11,032) (11,728,852)
41,220 46,230 8,487 1,345 827,166
41,220 46,230 8,487 1,345 827,166
(1,154,829) (380,824) (201,041) 126,983 (2,290,800)
4,491,596 2,151,105 577,269 79,366 33,731,141
3,336,767$ 1,770,281$ 376,228$ 206,349$ 31,440,341$
3,336,767$ 1,770,281$ 376,228$ 206,349$ 25,542,171$
- - - - 5,898,170
3,336,767$ 1,770,281$ 376,228$ 206,349$ 31,440,341$
(2,976,815)$ (6,132,295)$ (675,069)$ (72,110)$ (10,107,821)$
863,215 965,977 459,010 69,476 6,501,096
19,381 (161) 45,047 (79,607) (95,901)
- - 10,706 - (189,535)
(136) 1,750 - 8,802 8,552
176 - - - 202
(17,712) 2,230 (1,199) (4,938) 144,343
(8,904) (64,699) (6,551) (6,983) (317,766)
- - 2,720 - 2,720
(1,166,500) 462,600 - - (703,900)
(808) 11,863 - - 2,649,712
95,678 299,736 - 17,857 1,285,750
67,677 49,810 13,284 - 442,074
(3,124,748)$ (4,403,189)$ (152,052)$ (67,503)$ (380,474)$
(14,994)$ 8,750$ (509)$ 265$ 29,526$
1,598,187 (18,399) - - 1,579,788
361,632 1,100 852 - 1,530,745
1,944,825$ (8,549)$ 343$ 265$ 3,140,059$
CITY OF COLUMBIA, MISSOURI
COMBINING STATEMENT OF CASH FLOWS
NONMAJOR ENTERPRISE FUNDS
FOR THE YEAR ENDED SEPTEMBER 30, 2016
151 (Continued)
jlgunnel
Text Box

THIS PAGE IS INTENTIONALLY LEFT BLANK
152

CITY OF COLUMBIA, MISSOURI
INTERNAL SERVICE FUNDS
Internal Service Funds are used to account for the financing of goods or services provided by
one department or agency to other departments or agencies of the government and to other
government units, on a cost reimbursement basis.
Custodial and Maintenance Services Fund - to account for the provision of custodial
services and building maintenance for City departments.
Utility Customer Services Fund - to account for utility accounts billing and
customer service provided by the Finance Department for the Water and Electric, Sanitary
Sewer, Solid Waste and Storm Water utilities.
Information Technology Fund - to account for the provision of hardware infrastructure
to support the computing requirements of the City, as well as developing or implementing
software to improve the operating efficiencies of departments within the City.
Public Communications Fund - to account for the provision of printing, copying,
interdepartmental mail, and postage services to City departments, as well as cable
television operations.
Fleet Operations Fund - to account for operating an automotive and equipment
maintenance facility, and for fuel used by City departments.
Self Insurance Reserve Fund - to account for the payment of property and casualty losses,
and uninsured workers' compensation claims.
GIS Fund - to account for the provision of geospatial technologies including computer,
mapping, geographic information systems, global positioning systems, remote sensing,
and the accompanying spatial data to all City departments.
Employee Benefit Fund - to account for the City of Columbia's self-insurance program for health, disability and life insurance for covered employees. Other employee benefits
accounted for in this fund include retirement sick leave, medical services, service awards,
cafeteria plan and employee health/wellness.

THIS PAGE INTENTIONALLY LEFT BLANK
155

Custodial and Utility Information
Maintenance Customer Technology
Services Fund Services Fund Fund
ASSETS
CURRENT ASSETS:
Cash and cash equivalents 1,012,547$ 1,265,794$ 2,921,383$
Investments - - -
Receivable, net - (53,844) 6,343
Grants receivable - - -
Accrued interest 1,660 2,071 4,770
Inventory 14,204 - -
Prepaid items - 15 19,614
Total Current Assets 1,028,411 1,214,036 2,952,110
CAPITAL ASSETS:
Land - - -
Buildings - - -
Improvements other than buildings 253,813 - 35,506
Furniture, fixtures and equipment 185,069 32,500 5,635,399
Less accumulated depreciation (193,738) (32,500) (5,076,188)
Total Capital Assets 245,144 - 594,717
TOTAL ASSETS 1,273,555 1,214,036 3,546,827
DEFERRED OUTFLOWS OF RESOURCES
Outflows related to pension 476,982 494,085 955,593
LIABILITIES AND NET POSITION
LIABILITIES:
Current liabilities:
Accounts payable 45,308 102,778 220,582
Accrued payroll and payroll taxes 21,859 27,938 97,209
Accrued compensated absences 19,532 25,924 134,818
Claims payable - health insurance - - -
Claims payable - worker's compensation and general liability - - -
Obligations under capital leases - - 10,132
Other liabilities - - -
Total current liabilities 86,699 156,640 462,741
Noncurrent liabilities:
Accrued compensated absences 10,553 14,006 72,839
Claims payable - worker's compensation and general liability - - -
Net pension liability 160,256 166,002 321,058
Total noncurrent liabilities 170,809 180,008 393,897
Total Liabilities 257,508 336,648 856,638
DEFERRED INFLOWS OF RESOURCES
Inflows related to pension 91,721 95,010 183,756
Total liabilities and deferred inflows of resources 349,229 431,658 1,040,394
NET POSITION
Net investment in capital assets 245,144 - 584,585
Unrestricted 1,156,164 1,276,463 2,877,441
Total Net Position 1,401,308$ 1,276,463$ 3,462,026$
SEPTEMBER 30, 2016
COMBINING STATEMENT OF NET POSITION
CITY OF COLUMBIA, MISSOURI
INTERNAL SERVICE FUNDS
156 (Continued)

Community Fleet Self Insurance Employee Total
Relations Operations Reserve GIS Benefit Internal Service
Fund Fund Fund Fund Fund Funds
1,552,407$ 1,407,755$ 12,014,759$ 362,098$ 2,926,735$ 23,463,478$
- - 1,300,767 - - 1,300,767
138,765 11,942 - - 352,524 455,730
- - - 13,260 - 13,260
2,564 2,377 19,189 583 4,852 38,066
4,052 905,007 - - - 923,263
250 13 - - - 19,892
1,698,038 2,327,094 13,334,715 375,941 3,284,111 26,214,456
- 308,563 - - - 308,563
- 1,014,490 - - - 1,014,490
- 602,460 - - - 891,779
1,151,731 978,239 33,350 7,790 - 8,024,078
(835,352) (903,723) (33,350) (3,679) - (7,078,530)
316,379 2,000,029 - 4,111 - 3,160,380
2,014,417 4,327,123 13,334,715 380,052 3,284,111 29,374,836
502,229 1,037,850 116,735 169,944 185,689 3,939,107
9,401 385,098 2,087 6,690 201,592 973,536
38,343 73,399 8,100 17,545 30,329 314,722
31,865 74,233 12,853 21,728 13,091 334,044
- - - - 1,075,710 1,075,710
- - 2,279,489 - - 2,279,489
- - - - - 10,132
- - - - 43,285 43,285
79,609 532,730 2,302,529 45,963 1,364,007 5,030,918
17,216 40,107 6,945 11,739 7,073 180,478
- - 4,222,387 - - 4,222,387
168,738 348,695 39,220 57,097 62,387 1,323,453
185,954 388,802 4,268,552 68,836 69,460 5,726,318
265,563 921,532 6,571,081 114,799 1,433,467 10,757,236
96,576 199,573 22,447 32,679 35,707 757,469
362,139 1,121,105 6,593,528 147,478 1,469,174 11,514,705
316,379 2,000,029 - 4,111 - 3,150,248
1,838,128 2,243,839 6,857,922 398,407 2,000,626 18,648,990
2,154,507$ 4,243,868$ 6,857,922$ 402,518$ 2,000,626$ 21,799,238$
CITY OF COLUMBIA, MISSOURI
COMBINING STATEMENT OF NET POSITION
INTERNAL SERVICE FUNDS
SEPTEMBER 30, 2016
157 (Continued)
jlgunnel
Text Box

CITY OF COLUMBIA, MISSOURI CITY OF COLUMBIA, MISSOURICOMBINING STATEMENT OF REVENUES, EXPENSES, AND CHANGES IN NET POSITION COMBINING STATEMENT OF REVENUES, EXPENSES, AND CHANGES IN NET POSITION
INTERNAL SERVICE FUNDS INTERNAL SERVICE FUNDSFOR THE YEAR ENDED SEPTEMBER 30, 2016 FOR THE YEAR ENDED SEPTEMBER 30, 2016
Custodial and Utility InformationMaintenance Customer TechnologyServices Fund Services Fund Fund
OPERATING REVENUES:Charges for services and other benefits 1,589,243$ 2,725,192$ 6,211,450$
OPERATING EXPENSES:Personal services 788,506 936,214 3,099,219 Materials and supplies 211,632 59,904 576,527 Travel and training 3,719 5,330 97,820 Intragovernmental 22,383 357,287 16,514 Utilities, services, and miscellaneous 458,066 1,444,957 1,362,544 Depreciation 15,633 - 246,980
TOTAL OPERATING EXPENSES 1,499,939 2,803,692 5,399,604
OPERATING INCOME (LOSS) 89,304 (78,500) 811,846
NONOPERATING REVENUES (EXPENSES):Investment revenue 19,481 23,637 40,823 Revenue from other governmental units - - - Miscellaneous revenue 89 332,948 4,405 Interest expense - - (427) Loss on disposal of fixed assets - - -
TOTAL NONOPERATING REVENUES (EXPENSES) 19,570 356,585 44,801
INCOME (LOSS) BEFORE TRANSFERS 108,874 278,085 856,647
Transfers in - - - Transfers out (69,646) (108,210) (273,520)
CHANGE IN NET POSITION 39,228 169,875 583,127
NET POSITION-BEGINNING 1,362,080 1,106,588 2,878,899
NET POSITION-ENDING 1,401,308$ 1,276,463$ 3,462,026$
158 (Continued)

CITY OF COLUMBIA, MISSOURICOMBINING STATEMENT OF REVENUES, EXPENSES, AND CHANGES IN NET POSITION
INTERNAL SERVICE FUNDSFOR THE YEAR ENDED SEPTEMBER 30, 2016
Community Fleet Self Insurance Employee TotalRelations Operations Reserve GIS Benefit Internal Service
Fund Fund Fund Fund Fund Funds
1,730,143$ 8,156,399$ 5,759,704$ 487,194$ 15,699,684$ 42,359,009$
1,188,187 2,501,251 305,138 528,736 506,866 9,854,117 223,150 5,278,507 1,807 15,660 54,187 6,421,374
6,836 13,238 4,695 19,387 18,536 169,561 14,727 172,703 328 3,763 2,732 590,437
134,774 75,603 3,868,614 184,696 16,384,829 23,914,083 66,785 76,368 - 2,597 - 408,363
1,634,459 8,117,670 4,180,582 754,839 16,967,150 41,357,935
95,684 38,729 1,579,122 (267,645) (1,267,466) 1,001,074
30,705 23,878 209,784 8,646 67,944 424,898 - - - 84,824 - 84,824
720 168,553 63,101 55 68,171 638,042 - - - - - (427)
(4,700) (9,920) - - - (14,620)
26,725 182,511 272,885 93,525 136,115 1,132,717
122,409 221,240 1,852,007 (174,120) (1,131,351) 2,133,791
50,000 - - - - 50,000 (119,562) (5,625) (35,845) - (21,868) (634,276)
52,847 215,615 1,816,162 (174,120) (1,153,219) 1,549,515
2,101,660 4,028,253 5,041,760 576,638 3,153,845 20,249,723
2,154,507$ 4,243,868$ 6,857,922$ 402,518$ 2,000,626$ 21,799,238$
159 (Continued)
jlgunnel
Text Box

CITY OF COLUMBIA, MISSOURI CITY OF COLUMBIA, MISSOURICOMBINING STATEMENT OF CASH FLOWS COMBINING STATEMENT OF CASH FLOWS
INTERNAL SERVICE FUNDS INTERNAL SERVICE FUNDSFOR THE YEAR ENDED SEPTEMBER 30, 2016 FOR THE YEAR ENDED SEPTEMBER 30, 2016
Custodial and Utility InformationMaintenance Customer TechnologyServices Fund Services Fund Fund
CASH FLOWS FROM OPERATING ACTIVITIES:Cash received from customers (including other funds) 1,589,243$ 2,785,215$ 6,210,699$ Cash received from other sources 89 332,948 4,405 Cash payments to suppliers (655,056) (1,505,463) (1,943,533) Cash payments to employees (723,969) (901,057) (2,971,259) Cash payments to other funds (22,383) (357,287) (16,514)
Net cash provided for (used for)operating activities 187,924 354,356 1,283,798
CASH FLOWS FROM NONCAPITAL FINANCING ACTIVITIES:
Transfers in - - -
Transfers out (69,646) (108,210) (273,520)
Operating grants - - -
Net cash provided for (used for)
noncapital financing activities (69,646) (108,210) (273,520)
CASH FLOWS FROM CAPITAL ANDRELATED FINANCING ACTIVITIES:
Debt service – interest - - (427) Debt service – principal - - (24,001) Acquisition and construction of capital
assets - - (118,125)
Net cash provided for (used for)capital and related financing activities - - (142,553)
CASH FLOWS FROM INVESTING ACTIVITIES:Interest received 19,243 23,186 39,359 Purchase of investments - - - Sale of investments - - -
Net cash provided forinvesting activities 19,243 23,186 39,359
Net increase (decrease) in cash and cashequivalents 137,521 269,332 907,084
CASH AND CASH EQUIVALENTSAT BEGINNING OF PERIOD 875,026 996,462 2,014,299
CASH AND CASH EQUIVALENTSAT END OF PERIOD 1,012,547$ 1,265,794$ 2,921,383$
RECONCILIATION OF OPERATING INCOME (LOSS)TO NET CASH PROVIDED (USED) FOROPERATING ACTIVITIES:Operating income (loss) 89,304$ (78,500)$ 811,846$
Adjustments to reconcile operatingincome (loss) to net cash provided (used) foroperating activities:
Depreciation 15,633 - 246,980 Changes in assets and liabilities:
Decrease (increase) in receivables - 60,023 (751) Decrease (increase) in inventory 4,824 - - Decrease (increase) in prepaid items 370 1,555 12,818 Increase (decrease) in accounts payable 13,167 3,173 80,540 Increase in accrued payroll (15,667) (15,599) (51,583) Increase (decrease) in due other funds - - - Increase (decrease) in other liabilities - - - Increase in claims payable - workers'
compensation and general liability and health insurance - - - Increase (decrease) in pension related items 80,204 50,756 179,543
Other nonoperating revenue 89 332,948 4,405
Net cash provided for (used for)operating activities 187,924$ 354,356$ 1,283,798$
NONCASH INVESTING ACTIVITIES:
Change in fair value of investments 2,292$ 2,784$ 21,626$
Capital lease obligations - - 34,133
Total noncash capital and related
financing activities 2,292$ 2,784$ 55,759$
160 (Continued)

CITY OF COLUMBIA, MISSOURICOMBINING STATEMENT OF CASH FLOWS
INTERNAL SERVICE FUNDSFOR THE YEAR ENDED SEPTEMBER 30, 2016
Community Fleet Self Insurance Employee TotalRelations Operations Reserve GIS Benefit Internal Service
Fund Fund Fund Fund Fund Funds
1,734,509$ 8,176,433$ 5,938,208$ 487,194$ 15,554,520$ 42,476,021$ 720 168,553 63,101 55 68,171 638,042
(419,004) (5,450,438) (3,872,543) (254,530) (16,503,595) (30,604,162) (1,150,468) (2,338,988) (314,023) (505,055) (506,639) (9,411,458)
(14,727) (172,703) (328) (3,763) (2,732) (590,437)
151,030 382,857 1,814,415 (276,099) (1,390,275) 2,508,006
50,000 - - - - 50,000
(119,562) (5,625) (35,845) - (21,868) (634,276)
- - - 101,769 - 101,769
(69,562) (5,625) (35,845) 101,769 (21,868) (482,507)
- - - - - (427) - - - - - (24,001)
(72,326) (34,463) - - - (224,914)
(72,326) (34,463) - - - (249,342)
30,593 23,258 199,054 8,898 69,975 413,566 - - (1,300,767) - - (1,300,767) - - 4,862,414 - - 4,862,414
30,593 23,258 3,760,701 8,898 69,975 3,975,213
39,735 366,027 5,539,271 (165,432) (1,342,168) 5,751,370
1,512,672 1,041,728 6,475,488 527,530 4,268,903 17,712,108
1,552,407$ 1,407,755$ 12,014,759$ 362,098$ 2,926,735$ 23,463,478$
95,684$ 38,729$ 1,579,122$ (267,645)$ (1,267,466)$ 1,001,074$
66,785 76,368 - 2,597 - 408,363
4,366 20,034 2,995 - (144,860) (58,193) 1,228 (26,260) - - - (20,208)
649 33 1,058 1,951 7,666 26,100 (56,121) (56,863) 1,515 (36,738) 23,536 (27,791)
9,236 (56,438) (9,108) 5,983 (42,114) (175,290) - - (2,994) - (304) (3,298) - - - - (22,055) (22,055)
- - 178,503 - (55,190) 123,313 28,483 218,701 223 17,698 42,341 617,949
720 168,553 63,101 55 68,171 638,042
151,030$ 382,857$ 1,814,415$ (276,099)$ (1,390,275)$ 2,508,006$
14,838$ 3,305$ 24,705$ 1,066$ 5,355$ 75,971$
- - - - - 34,133
14,838$ 3,305$ 24,705$ 1,066$ 5,355$ 110,104$
161 (Continued)
jlgunnel
Text Box

THIS PAGE INTENTIONALLY LEFT BLANK
162

CITY OF COLUMBIA, MISSOURI
FIDUCIARY FUNDS
Fiduciary Funds are used to report assets held in a trustee or agency capacity for others and
therefore cannot be used to support the City’s own programs.
Police and Firefighters' Retirement Funds - to account for the accumulation of resources
for pension benefit payments to qualified police and firefighter personnel.
Other Post Employment Benefit Trust Fund - to account for the accumulation of resources
for post employment benefits to qualified plan participants.
Agency Funds - to report funds held for Daniel Boone Regional Library until
requested by the Library board, and the Tiger Hotel and Regency Hotel TIF funds.

THIS PAGE INTENTIONALLY LEFT BLANK
165

CITY OF COLUMBIA, MISSOURI CITY OF COLUMBIA, MISSOURI
COMBINING STATEMENT OF FIDUCIARY NET POSITION COMBINING STATEMENT OF CHANGES IN FIDUCIARY NET POSITION
FIDUCIARY FUNDS FIDUCIARY FUNDS
SEPTEMBER 30, 2016 FOR THE YEAR ENDED SEPTEMBER 30, 2016
Pension Trust and OPEB Funds
Pension Trust and OPEB Funds
Firefighters’ Police
Retirement Fund Retirement Fund OPEB Total
ASSETS
Cash and cash equivalents -$ -$ 505,427$ 505,427$
Accrued interest 177,235 119,217 863 297,315
Investments 72,609,189 48,840,714 2,689,471 124,139,374
Capital assets 6,987 4,700 - 11,687
Accumulated depreciation (6,987) (4,700) - (11,687)
Total Assets 72,786,424 48,959,931 3,195,761 124,942,116
LIABILITIES
Accrued payroll and payroll taxes 14,585 9,727 - 24,312
Due to other funds 1,037,867 698,123 - 1,735,990
Total Liabilities 1,052,452 707,850 - 1,760,302
NET POSITION
Net position held in trust 71,733,972 48,252,081 3,195,761 123,181,814
Total Net Position 71,733,972$ 48,252,081$ 3,195,761$ 123,181,814$
166

CITY OF COLUMBIA, MISSOURI CITY OF COLUMBIA, MISSOURI
COMBINING STATEMENT OF FIDUCIARY NET POSITION COMBINING STATEMENT OF CHANGES IN FIDUCIARY NET POSITION
FIDUCIARY FUNDS FIDUCIARY FUNDS
SEPTEMBER 30, 2016 FOR THE YEAR ENDED SEPTEMBER 30, 2016
Pension Trust and OPEB Funds
Firefighters’ Police
Retirement Fund Retirement Fund OPEB Total
ADDITIONS
Contributions:
City 5,226,250$ 3,812,192$ -$ 9,038,442$
Employee 1,212,139 341,495 - 1,553,634
Net investment income:
Interest and dividends (includes net
appreciation in fair value of investments,
net of investment fees) 4,266,438 2,850,982 253,998 7,371,418
Total additions 10,704,827 7,004,669 253,998 17,963,494
Current:
Policy development and administration:
Travel and training 2,743 1,833 - 4,576
Intragovernmental 28,957 19,349 - 48,306
Utilities, services, and miscellaneous 37,252 24,893 1,000 63,145
Pension benefits 7,786,819 4,417,623 - 12,204,442
Refund of employee’s contributions 143,946 99,507 - 243,453
Total deductions 7,999,717 4,563,205 1,000 12,563,922
Change in net position 2,705,110 2,441,464 252,998 5,399,572
NET POSITION- BEGINNING 69,028,862 45,810,617 2,942,763 117,782,242
NET POSITION- ENDING 71,733,972$ 48,252,081$ 3,195,761$ 123,181,814$
167

CITY OF COLUMBIA, MISSOURI
STATEMENT OF FIDUCIARY ASSETS AND LIABILITIES
AGENCY FUNDS
SEPTEMBER 30, 2016
Collections
for other
taxing units Total
ASSETS
Cash and cash equivalents 5,546,455$ 5,546,455$
Accounts receivable 126,905 126,905
Taxes receivable, net 3,955,104 3,955,104
Accrued interest 9,177 9,177
Total Assets 9,637,641$ 9,637,641$
LIABILITIES
Accounts Payable 237,602$ 237,602$
Due to other entities 3,949,689 3,949,689
Other liabilities 5,450,350 5,450,350
Total Liabilities 9,637,641$ 9,637,641$
168

Balance Balance
October 1 September 30
2015 Additions Deductions 2016
ASSETS
Cash and cash equivalents 4,879,971$ 4,665,400$ 3,998,916$ 5,546,455$
Accounts receivable 220,288 12,516 105,899 126,905
Taxes receivable, net 3,963,263 3,886,889 3,895,048 3,955,104
Accrued interest 8,069 111,379 110,271 9,177
Total Assets 9,071,591$ 8,676,184$ 8,110,134$ 9,637,641$
LIABILITIES
Accounts payable 228,184$ 237,602$ 228,184$ 237,602$
Due to other entities 3,956,445 3,887,389 3,894,145 3,949,689
Other liabilities 4,886,962 4,559,259 3,995,871 5,450,350
Total Liabilities 9,071,591$ 8,684,250$ 8,118,200$ 9,637,641$
CITY OF COLUMBIA, MISSOURI
STATEMENT OF CHANGES IN ASSETS AND LIABILITIES
AGENCY FUNDS
FOR THE YEAR ENDED SEPTEMBER 30, 2016
169

THIS PAGE INTENTIONALLY LEFT BLANK
170

CITY OF COLUMBIA, MISSOURI
STATISTICAL SECTION
The Statistical Section "relates to the physical, economic, social and political characteristics
of the City." Its design is to provide financial statement users with additional historical
perspective, context, and detail to assist in using the information in the financial statements,
notes to the financial statements, and required supplementary information to understand and
assess the City's economic condition.
Financial Trends Information - is intended to assist users in understanding and assessing
how the City's financial position has changed over time.
Revenue Capacity Information - is intended to assist users in understanding and assessing
the factors affecting the City's ability to generate its own-source revenues, sales tax and
property tax.
Debt Capacity Information - is intended to assist users in understanding and assessing the
City's debt burden and its ability to issue additional debt.
Demographic and Economic Information - is intended (1) to assist users in understanding
the socioeconomic environment within which the City operates and (2) to provide information
that facilitates comparisons of financial statement information over time.
Operating Information - is intended to provide contextual information about the City's
operations and resources to assist readers in using financial statement information to
understand and assess the City's economic condition.
Sources: Unless otherwise noted, the information provided in these schedules is derived
from the comprehensive annual financial reports for the relevant year.

THIS PAGE INTENTIONALLY LEFT BLANK
173

2016 2015 2014 2013
Governmental Activities
Net investment in capital assets 379,291,016$ 359,339,161$ 349,384,646$ 327,336,088$
Restricted for:
Debt service 1,360,739 8,680,140 9,528,532 12,833,301
Capital projects 33,388,328 39,096,016 39,307,829 40,032,818
Nonexpendable 1,500,000 1,500,000 1,500,000 1,500,000
Expendable 7,438,759 7,306,884 7,103,402 7,008,119
Other purposes 31,952,096 27,745,796 24,767,118 21,302,056
Unrestricted (32,197,643) (30,096,448) 47,015,313 41,994,312
Total governmental activities net position 422,733,295$ 413,571,549$ 478,606,840$ 452,006,694$
Business-type activities
Net investment in capital assets 365,793,592$ 352,395,872$ 325,322,206$ 326,634,842$
Restricted for:
Debt service 18,153,670 14,741,447 14,853,938 16,074,387
Capital projects 1,327,986 2,907,774 2,900,865 3,581,753
Nonexpendable - - - -
Other purposes 2,507,115 2,490,080 2,450,472 2,448,634
Unrestricted 115,251,104 108,107,836 105,185,789 97,168,643
Total business-type activities net position 503,033,467$ 480,643,009$ 450,713,270$ 445,908,259$
Primary government
Net investment in capital assets 745,084,608$ 711,735,033$ 674,706,852$ 653,970,930$
Restricted for:
Debt service 19,514,409 23,421,587 24,382,470 28,907,688
Capital projects 34,716,314 42,003,790 42,208,694 43,614,571
Nonexpendable 1,500,000 1,500,000 1,500,000 1,500,000
Expendable 7,438,759 7,306,884 7,103,402 7,008,119
Other purposes 34,459,211 30,235,876 27,217,590 23,750,690
Unrestricted 83,053,461 78,011,388 152,201,102 139,162,955
Total primary government net position 925,766,762$ 894,214,558$ 929,320,110$ 897,914,953$
Fiscal Year
City of Columbia, Missouri
NET POSITION BY COMPONENT
LAST TEN FISCAL YEARS
(accrual basis of accounting)
174

Table 1, cont.
2012 2011 2010 2009 2008 2007
314,263,826$ 302,588,445$ 282,847,173$ 260,097,787$ 244,275,475$ 216,858,792$
10,065,860 9,177,970 8,918,365 5,778,995 5,503,137 3,076,665
39,254,648 40,660,673 41,106,562 46,490,295 38,560,449 22,792,647
1,500,000 1,500,000 1,500,000 1,500,000 1,500,000 -
7,097,129 6,906,079 6,710,867 6,446,329 6,147,453 -
20,267,861 16,508,073 20,758,215 20,157,428 21,108,040 19,624,016
41,149,606 39,060,566 38,429,987 35,215,173 37,860,189 48,580,507
433,598,930$ 416,401,806$ 400,271,169$ 375,686,007$ 354,954,743$ 310,932,627$
311,717,270$ 307,497,810$ 310,054,260$ 283,331,995$ 276,597,165$ 272,485,494$
11,181,154 12,411,147 11,165,691 11,478,081 7,851,943 8,112,494
9,745,060 9,279,147 2,988,585 290,464 1,107,426 1,379,024
- - - - - -
2,352,238 2,274,042 2,253,899 2,210,713 2,167,641 2,110,973
102,009,020 87,614,040 75,790,214 85,495,521 86,655,622 74,352,607
437,004,742$ 419,076,186$ 402,252,649$ 382,806,774$ 374,379,797$ 358,440,592$
625,981,096$ 610,086,255$ 592,901,433$ 543,429,782$ 520,872,640$ 489,344,286$
21,247,014 21,589,117 20,084,056 17,257,076 13,355,080 11,189,159
48,999,708 49,939,820 44,095,147 46,780,759 39,667,875 24,171,671
1,500,000 1,500,000 1,500,000 1,500,000 1,500,000 -
7,097,129 6,906,079 6,710,867 6,446,329 6,147,453 -
22,620,099 18,782,115 23,012,114 22,368,141 23,275,681 21,734,989
143,158,626 126,674,606 114,220,201 120,710,694 124,515,811 122,933,114
870,603,672$ 835,477,992$ 802,523,818$ 758,492,781$ 729,334,540$ 669,373,219$
Fiscal Year
City of Columbia, Missouri
NET POSITION BY COMPONENT
LAST TEN FISCAL YEARS
(accrual basis of accounting)
175

Table 2
2016 2015 2014 2013 2012 2011
Expenses
Governmental activities:
Policy development and administration 30,623,152$ 24,465,111$ 22,486,499$ 21,764,609$ 21,918,164$ 19,240,568$
Public safety 42,145,164 42,482,569 39,965,212 38,674,243 38,674,200 39,177,408
Transportation 14,525,441 15,600,627 18,362,328 15,977,709 12,646,608 12,782,598
Health and environment 10,931,589 10,769,579 9,248,764 9,376,511 8,663,673 10,376,671
Personal development 8,971,813 8,968,495 8,086,860 7,717,775 7,410,779 6,724,219
Interest on long-term debt 978,720 1,710,708 1,995,213 2,288,306 2,303,076 2,375,909
Total governmental activities expenses 108,175,879 103,997,089 100,144,876 95,799,153 91,616,500 90,677,373
Business-type activities:
Electric utility 116,326,371 115,496,885 120,262,601 116,439,978 104,978,962 111,974,736
Water Utility 19,797,334 18,045,445 18,396,775 18,107,142 18,085,072 15,850,805
Sanitary Sewer Utility 18,488,108 17,651,612 17,166,301 14,209,805 14,490,560 12,738,819
Regional Airport 3,776,315 3,469,327 3,153,606 2,548,916 2,500,780 2,471,114
Public Transportation 8,202,880 7,830,577 7,161,194 6,739,903 6,588,233 5,974,604
Solid Waste Utility 19,864,870 15,844,537 15,405,338 15,197,074 15,194,469 14,282,699
Parking Facilities 3,220,290 3,244,277 3,248,368 2,764,438 2,630,624 2,358,564
Recreation Services 7,255,936 6,859,026 7,103,597 7,126,020 6,987,907 6,884,213
Railroad 1,027,458 983,603 1,043,610 1,020,846 1,118,697 1,085,623
Transload 339,835 582,750 949,642 1,156,798 - -
Storm Water Utility 1,429,937 1,544,375 1,351,708 1,277,435 1,256,360 1,254,303
Total business-type activities expenses 199,729,335 191,552,414 195,242,740 186,588,355 173,831,664 174,875,480
Total primary government expenses 307,905,214$ 295,549,503$ 295,387,616$ 282,387,508$ 265,448,164$ 265,552,853$
Program Revenues
Governmental Activities:
Charges for services:
Policy Development and Administration 13,138,620$ 12,649,708$ 11,808,239$ 12,359,753$ 11,966,490$ 11,181,841$
Public Safety 2,041,378 1,945,204 2,787,804 2,306,281 2,512,573 2,446,392
Transportation 56,135 477,064 412,006 75,890 233,412 191,711
Health and Environment 4,748,558 4,013,382 4,474,509 4,111,601 3,188,325 2,623,846
Personal Development - 353,182 7,074 - - -
Operating grants and contributions 5,585,621 7,049,014 6,582,168 5,733,896 6,173,618 6,891,283
Capital grants and contributions 8,419,494 5,301,736 15,186,759 14,054,726 7,082,525 10,716,352
Total governmental activities program revenues 33,989,806 31,789,290 41,258,559 38,642,147 31,156,943 34,051,425
Business-type activities:
Charges for services:
Electric utility 129,693,077 125,161,680 125,045,630 121,764,673 119,260,514 127,546,900
Water Utility 26,050,798 23,364,440 24,345,239 23,568,147 24,206,711 20,331,142
Sanitary Sewer Utility 22,771,018 20,738,058 19,527,300 19,512,333 17,219,234 14,523,432
Regional Airport 712,502 694,012 540,540 555,715 642,170 684,631
Public Transportation 2,031,376 2,073,373 2,300,558 2,080,065 1,873,872 1,671,933
Solid Waste Utility 20,031,354 18,161,089 17,303,865 16,959,850 16,834,253 16,635,234
Parking Facilities 4,154,260 4,044,297 3,551,116 2,977,159 2,688,403 2,038,935
Recreation Services 4,243,961 4,145,589 4,205,270 4,429,863 4,373,766 4,136,896
Railroad 331,815 431,885 726,641 696,640 738,185 828,593
Transload 256,693 328,724 984,884 965,853 - -
Storm Water Utility 1,626,994 1,290,235 1,396,700 1,355,150 1,316,160 1,233,891
Operating grants and contributions 2,557,913 2,479,657 2,602,538 2,436,134 2,163,513 1,844,800
Capital grants and contributions 9,029,170 8,119,011 3,479,133 10,200,801 4,232,060 3,176,929
Total business-type activities program revenues 223,490,931 211,032,050 206,009,414 207,502,383 195,548,842 194,653,317
Total primary government program revenues 257,480,737$ 242,821,340$ 247,267,973$ 246,144,530$ 226,705,785$ 228,704,742$
Net (Expense)/Revenue
Governmental activities (74,186,073)$ (72,207,799)$ (58,886,317)$ (57,157,006)$ (60,459,557)$ (56,625,948)$
Business-type activities 23,761,596 19,479,636 10,766,674 20,914,028 21,717,178 19,777,837
Total primary government net expense (50,424,477)$ (52,728,163)$ (48,119,643)$ (36,242,978)$ (38,742,379)$ (36,848,111)$
General Revenues and Other Changes in Net Position
Governmental activities:
Taxes
Property taxes 7,898,843$ 7,572,050$ 7,319,211$ 7,228,203$ 7,099,442$ 7,026,844$
Sales tax 47,165,825 47,174,773 45,730,160 44,150,547 42,514,771 40,538,522
Other taxes 14,864,794 15,559,138 15,861,990 15,059,833 14,597,936 14,274,548
Investment revenue (loss) 2,744,200 3,462,509 1,974,801 (1,380,683) 1,692,935 2,717,257
Miscellaneous 2,270,770 1,737,308 2,263,437 1,821,115 1,904,434 2,873,628
Transfers 8,403,387 7,743,778 12,355,827 8,916,183 9,847,163 9,275,101
Total governmental activities 83,347,819 83,249,556 85,505,426 75,795,198 77,656,681 76,705,900
Business-type activities
Investment revenue (loss) 4,433,709 5,209,590 3,474,081 (778,591) 3,231,938 4,344,222
Miscellaneous 2,598,540 2,157,488 2,920,083 2,385,748 2,826,603 1,976,579
Transfers (8,403,387) (7,743,778) (12,355,827) (8,916,183) (9,847,163) (9,275,101)
Total business-type activities (1,371,138) (376,700) (5,961,663) (7,309,026) (3,788,622) (2,954,300)
Total primary government 81,976,681$ 82,872,856$ 79,543,763$ 68,486,172$ 73,868,059$ 73,751,600$
Change in Net Position
Governmental activities 9,161,746$ 11,041,757$ 26,619,109$ 18,638,192$ 17,197,124$ 20,079,952$
Business-type activities 22,390,458 19,102,936 4,805,011 13,605,002 17,928,556 16,823,537
Total primary government 31,552,204$ 30,144,693$ 31,424,120$ 32,243,194$ 35,125,680$ 36,903,489$
City of Columbia, Missouri
CHANGES IN NET POSITION
LAST TEN FISCAL YEARS
(accrual basis of accounting)
Fiscal Year
176

Table 2, cont.
2010 2009 2008 2007
18,810,092$ 14,427,609$ 15,762,421$ 16,162,970$
38,075,595 38,011,371 36,142,924 34,547,514
12,129,815 11,198,089 10,104,040 9,989,096
9,209,905 8,903,255 8,403,019 8,343,812
11,004,972 10,344,600 10,350,937 9,832,710
1,985,817 2,149,871 1,595,972 1,189,668
91,216,196 85,034,795 82,359,313 80,065,770
107,836,042 99,694,306 91,847,957 84,599,965
14,559,336 16,021,650 14,517,123 13,783,103
12,507,201 12,030,951 10,970,073 10,475,106
2,488,947 2,232,666 2,107,172 2,064,326
5,547,130 5,382,338 5,069,495 4,501,492
14,131,288 13,747,082 14,044,574 12,505,734
1,748,966 1,295,897 1,432,705 1,362,421
6,863,924 6,823,710 6,804,775 6,433,091
878,449 941,661 980,760 954,111
- - - -
1,284,941 1,654,512 1,548,103 1,445,133
167,846,224 159,824,773 149,322,737 138,124,482
259,062,420$ 244,859,568$ 231,682,050$ 218,190,252$
12,020,506$ 7,931,919$ 6,900,361$ 6,601,539$
2,324,632 1,781,033 1,657,240 1,698,523
186,584 243,700 252,885 428,045
1,087,198 1,026,327 1,106,543 1,270,739
- - - -
8,754,370 7,410,843 7,777,301 6,019,212
13,187,432 15,608,834 28,476,557 37,822,556
37,560,722 34,002,656 46,170,887 53,840,614
120,448,779 110,753,285 106,481,160 100,857,750
17,354,581 15,876,107 15,314,326 16,071,201
12,275,136 10,654,076 9,312,516 9,071,132
599,804 481,984 434,980 462,054
1,517,701 1,447,616 1,240,255 1,172,095
15,045,374 14,074,055 14,120,946 12,966,592
1,796,627 1,737,094 1,593,938 1,562,110
4,079,714 4,120,606 3,848,181 3,952,786
824,472 662,749 1,190,026 1,042,370
- - - -
1,138,804 1,229,374 1,391,760 1,380,233
1,723,698 2,026,465 1,588,506 1,532,740
9,376,080 2,476,997 4,366,361 9,643,692
186,180,770 165,540,408 160,882,955 159,714,755
223,741,492$ 199,543,064$ 207,053,842$ 213,555,369$
(53,655,474)$ (51,032,139)$ (36,188,426)$ (26,225,156)$
18,334,546 5,715,635 11,560,218 21,590,273
(35,320,928)$ (45,316,504)$ (24,628,208)$ (4,634,883)$
10,849,831$ 10,703,734$ 10,724,486$ 10,301,967$
38,296,731 37,615,054 38,669,141 38,745,372
14,148,024 13,557,057 13,687,438 11,157,118
4,598,349 6,163,536 6,031,249 6,518,778
2,998,383 2,753,039 5,348,082 1,994,256
7,349,318 6,110,870 5,750,147 4,981,765
78,240,636 76,903,290 80,210,543 73,699,256
6,680,164 6,760,213 6,064,180 6,689,670
1,780,483 2,061,999 4,064,955 3,974,057
(7,349,318) (6,110,870) (5,750,147) (4,981,765)
1,111,329 2,711,342 4,378,988 5,681,962
79,351,965$ 79,614,632$ 84,589,531$ 79,381,218$
24,585,162$ 25,871,151$ 44,022,117$ 47,474,100$
19,445,875 8,426,977 15,939,206 27,272,235
44,031,037$ 34,298,128$ 59,961,323$ 74,746,335$
Fiscal Year
City of Columbia, Missouri
CHANGES IN NET POSITION
LAST TEN FISCAL YEARS
(accrual basis of accounting)
177
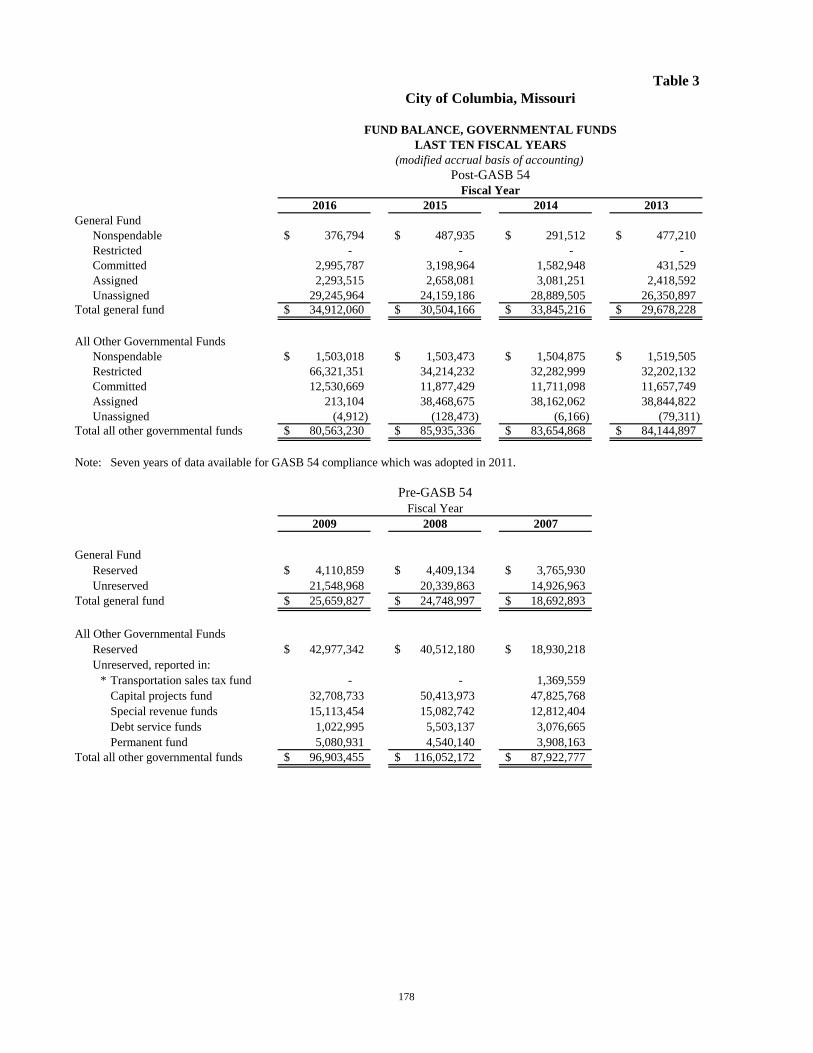
Table 3
2016 2015 2014 2013
General Fund
Nonspendable 376,794$ 487,935$ 291,512$ 477,210$
Restricted - - - -
Committed 2,995,787 3,198,964 1,582,948 431,529
Assigned 2,293,515 2,658,081 3,081,251 2,418,592
Unassigned 29,245,964 24,159,186 28,889,505 26,350,897
Total general fund 34,912,060$ 30,504,166$ 33,845,216$ 29,678,228$
All Other Governmental Funds
Nonspendable 1,503,018$ 1,503,473$ 1,504,875$ 1,519,505$
Restricted 66,321,351 34,214,232 32,282,999 32,202,132
Committed 12,530,669 11,877,429 11,711,098 11,657,749
Assigned 213,104 38,468,675 38,162,062 38,844,822
Unassigned (4,912) (128,473) (6,166) (79,311)
Total all other governmental funds 80,563,230$ 85,935,336$ 83,654,868$ 84,144,897$
Note: Seven years of data available for GASB 54 compliance which was adopted in 2011.
2009 2008 2007
General Fund
Reserved 4,110,859$ 4,409,134$ 3,765,930$
Unreserved 21,548,968 20,339,863 14,926,963
Total general fund 25,659,827$ 24,748,997$ 18,692,893$
All Other Governmental Funds
Reserved 42,977,342$ 40,512,180$ 18,930,218$
Unreserved, reported in:
* Transportation sales tax fund - - 1,369,559
Capital projects fund 32,708,733 50,413,973 47,825,768
Special revenue funds 15,113,454 15,082,742 12,812,404
Debt service funds 1,022,995 5,503,137 3,076,665
Permanent fund 5,080,931 4,540,140 3,908,163
Total all other governmental funds 96,903,455$ 116,052,172$ 87,922,777$
City of Columbia, Missouri
FUND BALANCE, GOVERNMENTAL FUNDS
Pre-GASB 54
Fiscal Year
LAST TEN FISCAL YEARS
(modified accrual basis of accounting)
Post-GASB 54
Fiscal Year
178

Table 3, cont.
2012 2011 2010
412,902$ 421,250$ 550,483$
- - 400,827
911,186 737,491 503,067
2,541,869 3,099,217 6,391,299
25,955,804 23,660,321 18,759,242
29,821,761$ 27,918,279$ 26,604,918$
1,503,709$ 1,502,053$ 1,503,064$
28,320,670 25,486,928 32,812,393
10,951,115 10,755,442 11,531,443
38,530,941 39,227,961 36,047,628
- - -
79,306,435$ 76,972,384$ 81,894,528$
City of Columbia, Missouri
FUND BALANCE, GOVERNMENTAL FUNDS
LAST TEN FISCAL YEARS
(modified accrual basis of accounting)
Post-GASB 54
Fiscal Year
179

Table 4
2016 2015 2014 2013
REVENUES
General property taxes 7,898,843$ 7,572,050$ 7,319,211$ 7,228,203$
Sales tax 47,667,737 46,672,861 45,730,160 44,150,547
Other local taxes 14,197,554 14,860,992 15,170,622 14,415,576
Licenses and permits 1,031,218 1,012,346 965,309 921,132
Fines 1,805,859 2,081,131 1,883,631 1,970,138
Fees and service charges 4,926,206 3,687,353 4,776,008 4,584,151
Special assessment taxes - - - -
Intragovernmental revenue 4,407,469 4,247,354 3,944,617 3,931,555
Revenue from other governmental units 14,388,115 12,155,793 11,380,966 12,683,976
Lease revenue 1,755,731 1,893,255 1,786,851 1,828,913
Investment revenue (loss) 2,342,939 3,040,800 1,744,574 (1,175,168)
Miscellaneous 2,270,770 1,737,308 2,263,437 1,821,115
Total Revenues 102,692,441 98,961,243 96,965,386 92,360,138
EXPENDITURES
Current:
Policy development and administration 12,673,307 11,933,061 10,243,414 9,910,193
Public safety 40,664,606 40,931,976 38,329,749 37,839,647
Transportation 7,722,901 9,091,369 12,123,055 10,421,314
Health and environment 10,904,104 10,648,858 9,277,074 9,373,336
Personal development 7,848,024 7,878,973 7,160,184 6,922,477
Misc. nonprogrammed activities 272,656 5,642,247 4,785,017 5,006,410
Capital outlay 22,734,914 13,935,589 16,237,557 15,067,900
Debt service:
Principal 8,508,973 6,032,862 5,838,116 5,595,733
Interest 1,209,593 1,866,517 2,147,444 2,397,462
Bond issuance and other costs 237,281 - - -
Total Expenditures 112,776,359 107,961,452 106,141,610 102,534,472
Excess (Deficiency) of Revenues
over Expenditures (10,083,918) (9,000,209) (9,176,224) (10,174,334)
OTHER FINANCING SOURCES (USES)
Transfers in 47,046,810 37,405,837 39,741,645 37,409,252
Transfers out (38,167,357) (29,466,210) (26,869,499) (28,239,989)
Issuance of 2007A S.O. Notes - - - -
Issuance of 2008B S.O. Bonds - - - -
Premium on 2008B S.O. Bonds - - - -
Issuance of Lemone Trust Note - - - -
MTFC Note Proceeds - - - 5,700,000
Capital lease proceeds - - - -
Proceeds of 2016B S.O. Bonds 17,580,000 - - -
Premium on 2016B S.O. Bonds 1,699,838 - - -
Payment to refunded bond escrow agent (19,039,585) - - -
Total Other Financing Sources (Uses) 9,119,706 7,939,627 12,872,146 14,869,263
Net Change in Fund Balances (964,212)$ (1,060,582)$ 3,695,922$ 4,694,929$
Debt service as a percentage of
noncapital expenditures 10.79% 8.40% 8.88% 9.14%
Fiscal Year
City of Columbia, Missouri
CHANGES IN FUND BALANCES, GOVERNMENTAL FUNDS
LAST TEN FISCAL YEARS
(modified accrual basis of accounting)
180

Table 4, cont.
2012 2011 2010 2009 2008 2007
7,099,442$ 7,026,844$ 10,849,831$ 10,703,734$ 10,511,523$ 9,967,339$
42,514,771 40,538,522 38,296,731 37,615,054 38,669,141 38,745,372
13,938,135 13,614,566 13,504,093 13,199,548 13,387,438 10,857,118
883,815 864,719 835,864 842,850 835,668 833,247
2,184,075 2,049,392 1,900,869 1,457,963 1,367,376 1,387,447
3,323,319 2,916,163 2,214,818 1,917,453 2,137,096 2,379,845
- - - - - 81,412
4,130,138 4,139,602 4,200,389 4,025,046 3,634,049 3,353,142
11,205,817 15,717,748 17,624,734 17,295,161 13,628,052 10,894,018
1,740,808 1,267,667 - - - -
1,552,235 2,447,870 4,258,602 5,789,199 5,512,478 5,870,563
1,904,434 2,873,628 2,998,383 2,753,039 5,348,082 1,994,256
90,476,989 93,456,721 96,684,314 95,599,047 95,030,903 86,363,759
9,679,187 11,268,430 12,143,800 12,013,837 11,717,872 10,390,474
37,426,056 37,847,252 36,661,665 35,970,659 34,271,625 32,751,068
7,280,684 7,821,261 7,775,001 7,092,854 6,339,224 6,880,329
8,748,990 10,411,813 9,170,450 8,824,133 8,338,490 8,271,922
6,612,768 5,998,949 10,206,251 9,719,922 9,683,200 9,253,029
4,775,185 815,943 921,771 1,238,802 1,145,650 1,200,495
18,195,526 32,825,543 36,014,773 42,008,951 17,256,742 24,574,512
5,113,954 5,089,434 3,580,000 3,205,000 3,070,000 2,110,000
2,391,766 2,427,400 2,081,731 2,242,906 1,593,623 1,266,232
661 661 661 661 238,954 37,180
100,224,777 114,506,686 118,556,103 122,317,725 93,655,380 96,735,241
(9,747,788) (21,049,965) (21,871,789) (26,718,678) 1,375,523 (10,371,482)
37,677,752 50,570,961 37,063,260 33,106,245 56,874,109 34,906,932
(26,427,431) (40,960,187) (29,255,307) (26,939,792) (51,061,200) (29,948,435)
- - - - - 3,740,000
- - - - 26,795,000 -
- - - - 202,067 -
- 11,779,723 - - - -
2,500,000 - - - - -
235,000 - - - - -
- - - - - -
- - - - - -
- - - - - -
13,985,321 21,390,497 7,807,953 6,166,453 32,809,976 8,698,497
4,237,533$ 340,532$ (14,063,836)$ (20,552,225)$ 34,185,499$ (1,672,985)$
9.15% 9.20% 6.86% 6.78% 6.42% 4.73%
Fiscal Year
City of Columbia, Missouri
CHANGES IN FUND BALANCES, GOVERNMENTAL FUNDS
LAST TEN FISCAL YEARS
(modified accrual basis of accounting)
181

THIS PAGE INTENTIONALLY LEFT BLANK
182

Table 5
Fiscal State Total Estimated Assessed Value Total
Year Real Personal Assessed Assessed Actual as a Percentage Direct
Ended Property Property Value Value Taxable Value of Actual Value Tax Rate
2007 1,207,930,492 260,021,334 6,122,350 1,474,074,176 6,141,975,733 24.0% 0.94
2008 1,292,414,862 273,363,667 5,843,391 1,571,621,920 6,548,424,667 24.0% 0.94
2009 1,347,522,235 275,394,049 5,522,897 1,628,439,181 6,785,163,254 24.0% 0.93
2010 1,379,654,147 254,289,515 5,451,561 1,639,395,223 6,830,813,429 24.0% 0.93
2011 1,400,192,298 250,581,100 5,140,761 1,655,914,159 6,899,642,329 24.0% 0.93
2012 1,413,996,612 264,972,925 4,354,717 1,683,324,254 7,013,851,058 24.0% 0.93
2013 1,423,905,462 293,420,631 4,138,118 1,721,464,211 7,172,767,546 24.0% 0.94
2014 1,449,632,179 298,129,549 4,108,905 1,751,870,633 7,299,460,971 24.0% 0.95
2015 1,506,138,234 303,450,790 4,095,085 1,813,684,109 7,557,017,121 24.0% 0.95
2016 1,553,310,919 317,367,258 4,193,727 1,874,871,904 7,811,966,267 24.0% 0.93
Source: Certified Copy of Order, Boone County Court.
ASSESSED VALUE AND ESTIMATED ACTUAL VALUE OF TAXABLE PROPERTY
LAST TEN FISCAL YEARS
City of Columbia, Missouri
183
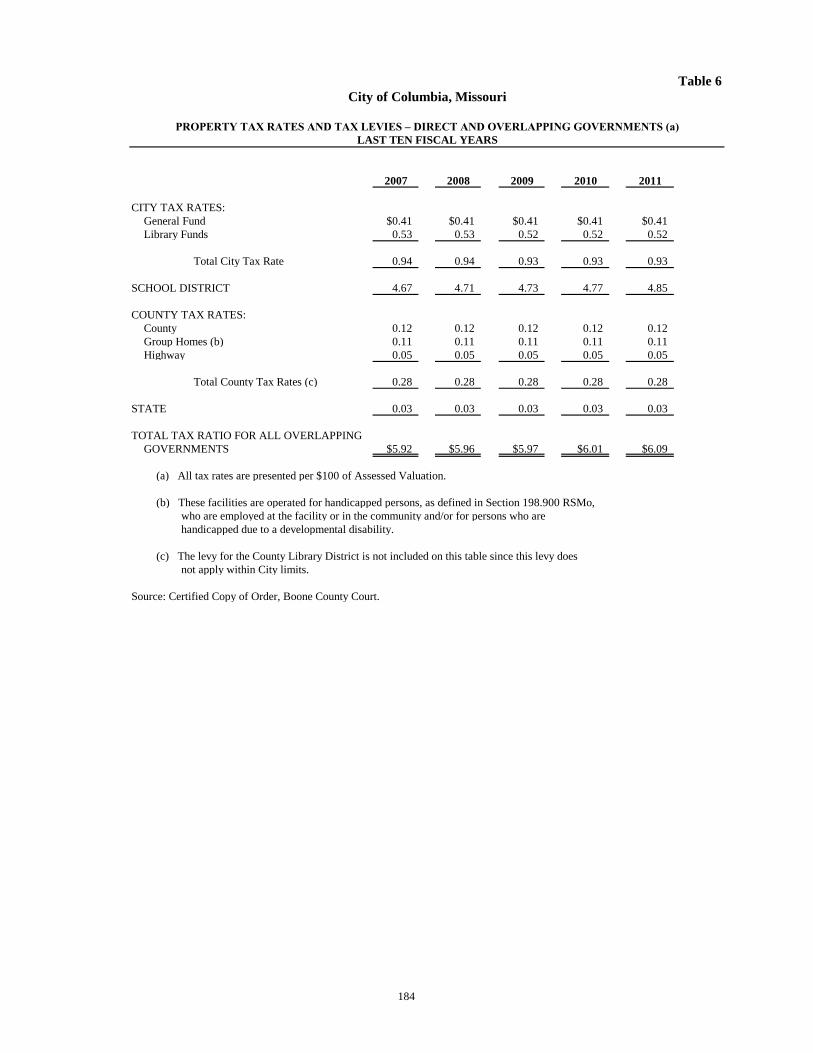
Table 6
PROPERTY TAX RATES AND TAX LEVIES – DIRECT AND OVERLAPPING GOVERNMENTS (a)
2007 2008 2009 2010 2011
CITY TAX RATES:
General Fund $0.41 $0.41 $0.41 $0.41 $0.41
Library Funds 0.53 0.53 0.52 0.52 0.52
Total City Tax Rate 0.94 0.94 0.93 0.93 0.93
SCHOOL DISTRICT 4.67 4.71 4.73 4.77 4.85
COUNTY TAX RATES:
County 0.12 0.12 0.12 0.12 0.12
Group Homes (b) 0.11 0.11 0.11 0.11 0.11
Highway 0.05 0.05 0.05 0.05 0.05
Total County Tax Rates (c) 0.28 0.28 0.28 0.28 0.28
STATE 0.03 0.03 0.03 0.03 0.03
TOTAL TAX RATIO FOR ALL OVERLAPPING
GOVERNMENTS $5.92 $5.96 $5.97 $6.01 $6.09
(a) All tax rates are presented per $100 of Assessed Valuation.
(b) These facilities are operated for handicapped persons, as defined in Section 198.900 RSMo,
who are employed at the facility or in the community and/or for persons who are
handicapped due to a developmental disability.
(c) The levy for the County Library District is not included on this table since this levy does
not apply within City limits.
Source: Certified Copy of Order, Boone County Court.
City of Columbia, Missouri
LAST TEN FISCAL YEARS
184

Table 6, cont.
2012 2013 2014 2015 2016
$0.41 $0.41 $0.41 $0.41 $0.41
0.52 0.53 0.54 0.54 0.52
0.93 0.94 0.95 0.95 0.93
4.88 5.40 5.42 5.49 5.47
0.12 0.12 0.12 0.12 0.12
0.11 0.11 0.11 0.11 0.11
0.05 0.05 0.05 0.05 0.05
0.28 0.28 0.28 0.28 0.28
0.03 0.03 0.03 0.03 0.03
$6.12 $6.65 $6.68 $6.75 $6.71
PROPERTY TAX RATES AND TAX LEVIES – DIRECT AND OVERLAPPING GOVERNMENTS (a)
LAST TEN FISCAL YEARS
City of Columbia, Missouri
185

THIS PAGE INTENTIONALLY LEFT BLANK
186

Table 7
Percentage Percentageof Total of Total
Type of Assessed Assessed Assessed AssessedTaxpayer Business Valuation Rank Valuation Valuation Rank Valuation
Union Electric Utility 28,177,504$ 1 1.50% -- --
Shelter Insurance/Shelter Enterprises Insurance 16,177,067 2 0.86% 5,461,706 7 0.37%
3M Company Manufacturer 12,604,776 3 0.67% -- --
TKG Biscayne LLC Property/Developer 9,778,083 4 0.52% -- --
Hubbell Power Systems Manufacturer 9,045,000 5 0.48% -- --
Grindstone Properties Property/Developer 8,078,039 6 0.43% -- --
Breckenridge Group Property/Developer 7,939,457 7 0.42% -- --
JDM II SF National (formerly State Farm) Insurance 7,807,371 8 0.42% 7,913,247 4 0.54%
The Links Columbia Property/Developer 6,839,287 9 0.36% -- --
Boone Hospital Medical 6,713,024 10 0.36% -- --
The Kroenke Group Property/Developer -- -- 10,215,695 1 0.69%
Columbia Mall Limited Partnership Property/Developer -- -- 8,520,254 3 0.58%
Boone Electric Cooperative Utility -- -- 9,911,936 2 0.67%
Boone Crossing Property/Developer -- -- 7,864,177 5 0.53%
Grindstone Plaza Development Property/Developer -- -- 5,740,711 6 0.39%
AB Chance Co Manufacturer -- -- 4,431,741 8 0.30%
Rayman Columbia Center Trust Property/Developer -- -- 4,343,968 9 0.29%
Broadway Fairview Venture Property/Developer -- -- 4,126,262 10 0.28%
113,159,608$ 6.02% 68,529,697$ 4.64%
Note: The assessed value is approximately 32% of the estimated actual value of the property.Information provided by the Boone County Government Center Treasurer's Office
City of Columbia, Missouri
2016 2007
PRINCIPAL TAXPAYERSCURRENT AND NINE YEARS AGO
187

Table 8
Fiscal Net Current Current Percent DelinquentYear Tax Tax Of Levy Tax
Ended Levy (a) Collections Collected Collections
2007 $ 6,064,823 (b) $ 5,857,996 96.59% $ 79,467
2008 $ 6,543,022 (b) $ 6,357,847 97.17% $ 107,581
2009 $ 6,749,498 (b) $ 6,506,350 96.40% $ 83,791
2010 $ 6,783,852 (b) $ 6,615,594 97.52% $ 114,785
2011 $ 6,615,690 (b) $ 6,425,234 97.12% $ 80,029
2012 $ 6,780,699 (b) $ 6,635,787 97.86% $ 88,841
2013 $ 6,862,793 (b) $ 6,783,993 98.85% $ 66,532
2014 $ 7,086,610 (b) $ 6,973,354 98.40% $ 82,535
2015 $ 7,293,515 (b) $ 7,221,899 99.02% $ 73,600
2016 $ 7,674,533 (b) $ 7,571,408 98.66% $ 68,331
(a) Balances are net of amounts deducted for collection fees withheld by County.
(b) Includes unearned property tax revenue.
City of Columbia, Missouri
GENERAL FUND
PROPERTY TAX LEVIES AND TAX COLLECTIONSLAST TEN FISCAL YEARS
188

Table 8, cont.
Total OutstandingCollections Delinquent
Total As A Percent Of Outstanding As A Percent Tax Net Current Delinquent Net Current
Collections Tax Levy Taxes Tax Levy
$ 5,937,463 97.90% $ 27,182 0.45%
$ 6,465,428 98.81% $ 29,228 0.45%
$ 6,590,141 97.64% $ 31,012 0.46%
$ 6,730,379 99.21% $ 33,325 0.49%
$ 6,505,263 98.33% $ 33,053 0.50%
$ 6,724,628 99.17% $ 33,168 0.49%
$ 6,850,525 99.82% $ 33,551 0.49%
$ 7,055,889 99.57% $ 29,816 0.42%
$ 7,295,499 100.03% $ 33,755 0.46%
$ 7,639,739 99.55% $ 37,041 0.48%
City of Columbia, Missouri
GENERAL FUND
PROPERTY TAX LEVIES AND TAX COLLECTIONSLAST TEN FISCAL YEARS
189

Table 9
RESIDENTIAL SERVICE RATE (per kilowatt hour) FY 2015-2016Customer charge per month $15.60Energy charge first 300 kWh all season ¢ per KWH 7.520Energy charge next 450 kWh all season ¢ per KWH 9.8000Energy charge next 1,250 kWh summer ¢ per KWH 13.3600Energy charge All remaining kWh summer ¢ per KWH 14.4500Energy charge All remaining kWh nonsummer ¢ per KWH 11.3200Electric Heating (October through May) First 300 kWh ¢ per KWH 7.520Electric Heating (October through May) Next 450 kWh ¢ per KWH 9.800Electric Heating (October through May) all remaining kWh ¢ per KWH 9.420Heat Pump (October through May) First 300 kWh ¢ per KWH 7.520Heat Pump (October through May) next 450 kWh ¢ per KWH 9.800Heat Pump (October through May) all remaining kWh ¢ per KWH 8.9300
SMALL GENERAL SERVICE RATE (per kilowatt hour)Customer charge (single-phase) per month $15.60Customer charge (three-phase) per month $25.70Energy charge first 500 kWh all season ¢ per KWH 8.000Energy charge next 1,000 kWh summer ¢ per KWH 10.200Energy charge All remaining kWh summer ¢ per KWH 14.070Energy charge All remaining kWh nonsummer ¢ per KWH 10.200Electric Heating (October through May) First 500 kWh ¢ per KWH 8.000Electric Heating (October through May) Next 1,000 kWh ¢ per KWH 10.200Electric Heating (October through May) all remaining kWh ¢ per KWH 9.400Heat Pump (October through May) First 500 kWh ¢ per KWH 8.000Heat Pump (October through May) next 1,000 kWh ¢ per KWH 10.200Heat Pump (October through May) all remaining kWh ¢ per KWH 8.8600
SPECIAL OUTDOOR LIGHTINGCustomer Charge per month $55.00Cost per KWH ¢ per KWH 12.490
RESIDENTIAL SERVICE RATE (per kilowatt hour) 2013-2014Customer charge per month $8.45All kWh winter, first 750 kWh summer ¢ per KWH 9.440Next 1,250 kWh summer ¢ per KWH 12.7700Electric Heating (October through May) All kWh ¢ per KWH 9.440Electric Heating (October through May) Over 750 kWh ¢ per KWH 8.307Heat Pump (October through May) All kWh ¢ per KWH 8.450Heat Pump (October through May) Over 750 kWh ¢ per KWH 8.0240
SMALL GENERAL SERVICE RATE (per kilowatt hour)Customer charge (single-phase) per month $8.45Customer charge (three-phase) per month $10.85All kWh winter, first 1,500 kWh summer ¢ per KWH 9.440Over 1,500 kWh summer ¢ per KWH 12.7700Electric Heating (October through May) All k Wh ¢ per KWH 9.440Electric Heating (October through May) Over 1,500 kWh ¢ per KWH 8.4960Heat pump (October through May) All k Wh ¢ per KWH 9.440Heat pump (October through May) over 1,500 kWh ¢ per KWH 8.0240
PRIVATE STREET AND OUTDOOR AREA LIGHTING RATE 100 Watt Mercury Vapor (M.V.) per month $4.00100 Watt High Pressure Sodium (H.P.S.) per month $4.38175 Watt M.V. per month $5.04250 Watt M.V. per month $7.13250 Watt H.P.S. per month $12.97310 Watt H.P.S. per month n/a400 Watt H.P.S. per month $15.57400 Watt M.V. per month $10.10700 Watt M.V. per month $20.751,000 Watt M.V. per month n/a100 Watt H.P.S. PTL per month $9.78175 Watt H.P.S. PTL per month $9.72
SPECIAL OUTDOOR LIGHTINGCustomer Charge per month $50.00Cost per KWH ¢ per KWH 11.000
69 KV SERVICE RATEDemand charge (All KW of billing demand) per KW n/aEnergy charge (All KWH) ¢ per KWH n/a
*
City of Columbia, Missouri
SCHEDULE OF ELECTRIC SERVICE RATES *LAST TEN FISCAL YEARS
Rate structure was changed as of October 1, 2014 and the FY2015-2016 column reflects the rates in effect as of June 1,
2015. The electric service rates for residential service, small general service, and the energy charge portion for large
general service and industrial services are increased or decreased by a fuel adjustment allowance. The fuel adjustment
allowance is computed annually based on the energy costs estimate (purchased power and fuel) per kilowatt hour.
190

Table 9, cont.
FY 2014-2015per month $15.60¢ per KWH 7.520¢ per KWH 9.8000¢ per KWH 13.3600¢ per KWH 14.4500¢ per KWH 11.3200¢ per KWH 7.520¢ per KWH 9.800¢ per KWH 9.420¢ per KWH 7.520¢ per KWH 9.800¢ per KWH 8.9300
per month $15.60per month $25.70¢ per KWH 8.000¢ per KWH 10.200¢ per KWH 14.070¢ per KWH 10.200¢ per KWH 8.000¢ per KWH 10.200¢ per KWH 9.400¢ per KWH 8.000¢ per KWH 10.200¢ per KWH 8.8600
per month $55.00¢ per KWH 12.490
2012-2013 2011-2012 2010-2011 2009-2010 2008-2009 2007-2008 2006-2007$8.45 $7.20 $7.20 $6.95 $6.56 $6.25 $5.809.440 9.440 9.440 9.275 8.750 8.330 7.660
12.7700 12.7700 12.7700 12.6370 11.8100 11.2456 9.9589.440 9.440 9.440 9.275 8.750 8.330 7.6608.307 8.040 8.040 7.350 7.000 6.664 6.1288.450 7.200 7.200 6.950 6.560 6.250 5.800
8.0240 7.5680 7.5680 6.8880 6.560 6.2475 5.362
$8.45 $7.20 $7.20 $6.95 $6.56 $6.25 $5.80$10.85 $9.58 $9.58 $9.30 $8.85 $8.43 $7.82
9.440 9.300 9.300 9.036 8.453 8.050 7.72612.7700 11.7470 11.7470 11.7470 10.9890 10.4650 10.0438
9.440 9.300 9.300 9.036 8.453 n/a n/a8.4960 8.3700 8.3700 8.1300 8.0300 7.6475 7.3397
9.440 9.300 9.300 9.036 8.453 n/a n/a8.0240 7.9050 7.9050 7.6800 6.7630 6.4400 6.5671
$4.00 $4.00 $4.00 $4.65 $4.65 $4.43 $4.22$4.38 $4.38 $4.17 $5.00 $5.00 $4.76 $4.53$5.04 $5.04 $4.80 $5.76 $5.76 $5.49 $5.23$7.13 $7.13 $6.79 $8.15 $8.15 $7.76 $7.39
$12.97 $12.97 $12.35 $14.82 $14.82 $14.11 $13.44n/a n/a n/a $16.18 $16.18 $15.41 $14.68
$15.57 $15.57 $14.83 $17.80 $17.80 $16.95 $16.14$10.10 $10.10 $9.62 $11.55 $11.55 $11.00 $10.48$20.75 $20.75 $20.75 $21.87 $21.87 $20.83 $19.84
n/a n/a n/a $29.27 $29.27 $27.88 $26.55$9.78 $9.78 $9.31 $11.18 $11.18 $10.65 $10.14$9.72 $9.72 $9.26 $11.11 $11.11 $10.58 $10.08
$50.00 $50.00 $50.00 $44.80 $44.80 $44.80 $44.8011.000 11.000 11.000 10.875 10.875 10.875 10.875
n/a n/a n/a n/a n/a n/a n/an/a n/a n/a n/a n/a n/a n/a
SCHEDULE OF ELECTRIC SERVICE RATES *LAST TEN FISCAL YEARS
City of Columbia, Missouri
1,
large
adjustment
191

Table 10
LARGE GENERAL SERVICE RATE Summer Nonsummer Summer Nonsummer
Customer charge: per month $45.00 $45.00 $45.00 $45.00
Demand charge:
First 25 KW or less billing demand $360.00 $270.00 $360.00 $270.00
Additional KW per KW $15.60 $12.50 $15.60 $12.50
Energy charge:
All KW ¢ per KWH 5.630 4.900 5.630 4.900
INDUSTRIAL SERVICE RATE Summer Nonsummer Summer Nonsummer
Customer charge: per month $150.00 $150.00 $150.00 $150.00
Demand charge:
First 750 KW or less billing demand $15,525.00 $12,375.00 $15,525.00 $12,375.00
All additional KW per KW $20.70 $16.50 $20.70 $16.50
Energy charge (All KWH) ¢ per KWH 4.730 4.040 4.730 4.040
LARGE GENERAL SERVICE RATE Summer Nonsummer Summer Nonsummer
Customer charge: n/a n/a n/a n/a
Demand charge:
First 25 KW or less billing demand per KW $376.50 $301.00 $369.75 $295.75
Additional KW per KW $15.06 $12.04 $14.79 $11.83
Energy charge:
All KW ¢ per KWH 5.50 4.780 5.40 4.697
First 360 KWH per KW of billing demand ¢ per KWH n/a n/a n/a n/a
All additional KWH ¢ per KWH n/a n/a n/a n/a
INDUSTRIAL SERVICE RATE Summer Nonsummer Summer Nonsummer
Customer charge: n/a n/a n/a n/a
Demand charge:
First 750 KW or less billing demand $14,887.50 $11,910.00 $14,595.00 $11,677.50
All additional KW per KW $19.85 $15.88 $19.46 $15.57
Energy charge (All KWH) ¢ per KWH 4.434 3.800 4.347 3.728
*
FY 2010 - 2011
FY 2014 - 2015
City of Columbia, Missouri
SCHEDULE OF ELECTRIC SERVICE RATES *
LAST TEN FISCAL YEARS
FY 2015 - 2016
FY 2009 - 2010
The rates shown in this table are those in effect at June 1, 2015. The electric service rates for residential
service, small general service, and the energy charge portion for large general service and industrial services
are increased or decreased by a fuel adjustment allowance. The fuel adjustment allowance is computed
annually based on the energy costs estimate (purchased power and fuel) per kilowatt hour.
192

Table 10, cont.
Summer Nonsummer Summer Nonsummer Summer Nonsummer
n/a n/a n/a n/a n/a n/a
$382.25 $305.50 $382.25 $305.50 $376.50 $301.00
$15.29 $12.22 $15.29 $12.22 $15.06 $12.04
5.555 4.828 5.555 4.828 5.50 4.780
Summer Nonsummer Summer Nonsummer Summer Nonsummer
n/a n/a n/a n/a n/a n/a
$14,962.50 $11,970.00 $14,962.50 $11,970.00 $14,887.50 $11,910.00
$19.95 $15.96 $19.95 $15.96 $19.85 $15.88
4.456 3.819 4.456 3.819 4.434 3.800
Summer Nonsummer Summer Nonsummer Summer Nonsummer
n/a n/a n/a n/a n/a n/a
$360.75 $288.50 $343.50 $274.75 $316.50 $253.25
$14.43 $11.54 $13.74 $10.99 $12.66 $10.13
5.22 4.54 4.97 4.32 4.58 3.98
n/a n/a n/a n/a n/a n/a
n/a n/a n/a n/a n/a n/a
Summer Nonsummer Summer Nonsummer Summer Nonsummer
n/a n/a n/a n/a n/a n/a
$14,100.00 $11,280.00 $12,195.00 $9,757.50 $11,287.50 $9,030.00
$18.80 $15.04 $16.26 $13.01 $15.05 $12.04
4.200 3.60 3.565 3.10 3.08 2.93
FY 2008 - 2009
City of Columbia, Missouri
SCHEDULE OF ELECTRIC SERVICE RATES *
LAST TEN FISCAL YEARS
FY 2007 - 2008
FY 2013 - 2014 FY 2012 - 2013 FY 2011 - 2012
FY 2006 - 2007
193

Table 11
Inside City
Limits
Outside City
Limits
Inside City
Limits
Outside City
LimitsResidential*: All CCF per 100 CCF $2.790 $3.710 $2.790 $3.710
Commercial*: All CCF per 100 CCF $2.600 $3.460 $2.600 $3.460
Large Commercial*: All CCF per 100 CCF $2.430 $3.230 $2.430 $3.230
*Summer Surcharged Rate:(June, July, August, and September per 100 CCF $3.910 $5.200 $3.910 $5.200water use in excess of 100% averagefor nonsummer use)
Inside City
Limits
Outside City
Limits
Inside City
Limits
Outside City
LimitsMeter Size5/8 inch and 3/4 inch $8.30 $11.04 $8.30 $11.041 inch $8.73 $11.61 $8.73 $11.611 1/2 inch $12.84 $17.08 $12.84 $17.082 inch $13.46 $17.90 $13.46 $17.903 inch $22.67 $28.71 $21.59 $28.714 inch $33.61 $42.58 $32.01 $42.586 inch $64.63 $81.86 $61.55 $81.86
Inside City
Limits
Outside City
Limits
Inside City
Limits
Outside City
LimitsResidential*: All CCF per 100 CCF $2.400 $3.190 $2.182 $2.902
Commercial*: All CCF per 100 CCF $2.222 $2.955 $2.020 $2.687
Large Commercial*: All CCF per 100 CCF $2.084 $2.772 $1.894 $2.519
*Summer Surcharged Rate:(June, July, August, and September per 100 CCF $3.360 $4.470 $3.055 $4.063water use in excess of 100% averagefor nonsummer use)
Minimum Charge Per MonthInside City
Limits
Outside City
Limits
Inside City
Limits
Outside City
LimitsMeter Size5/8 inch and 3/4 inch $6.33 $8.42 $5.86 $7.791 inch $6.64 $8.83 $6.15 $8.181 1/2 inch $8.60 $11.44 $7.96 $10.592 inch $9.07 $12.06 $8.40 $11.173 inch $19.04 $25.32 $17.63 $23.454 inch $28.23 $37.55 $26.14 $34.776 inch $54.28 $72.19 $50.26 $66.85
2010-2011
SCHEDULE OF WATER SERVICE RATES *
2014-2015
LAST TEN FISCAL YEARS
Minimum Charge Per Month
City of Columbia, Missouri
Minimum Charge Per MonthMinimum Charge Per Month
2015-2016
Minimum Charge Per Month
2009-2010
194

Table 11 Table 11, cont.
Inside City
Limits
Outside City
Limits
Inside City
Limits
Outside City
Limits
Inside City
Limits
Outside City
Limits$2.790 $3.710 $2.720 $3.620 $2.590 $3.450
$2.600 $3.460 $2.520 $3.350 $2.400 $3.190
$2.430 $3.230 $2.360 $3.140 $2.250 $2.990
$3.910 $5.200 $3.810 $5.070 $3.630 $4.830
Minimum Charge Per Month
Inside City
Limits
Outside City
Limits
Inside City
Limits
Outside City
Limits
Inside City
Limits
Outside City
Limits
$8.30 $11.04 $7.90 $10.50 $7.52 $10.00$8.73 $11.61 $8.31 $11.05 $7.91 $10.51
$12.84 $17.08 $12.22 $16.26 $11.64 $15.48$13.46 $17.90 $12.81 $17.04 $12.20 $16.23$21.59 $28.71 $21.59 $28.71 $20.56 $27.35$32.01 $42.58 $32.01 $42.58 $30.49 $40.55$61.55 $81.86 $61.55 $81.86 $58.62 $77.97
Inside City
Limits
Outside City
Limits
Inside City
Limits
Outside City
Limits
Inside City
Limits
Outside City
Limits$1.980 $2.630 $1.932 $2.570 $1.840 $2.447
$1.830 $2.430 $1.750 $2.328 $1.606 $2.136
$1.720 $2.290 $1.670 $2.221 $1.505 $2.002
$2.772 $3.687 $2.705 $3.598 $2.576 $3.426
Minimum Charge Per Month
Inside City
Limits
Outside City
Limits
Inside City
Limits
Outside City
Limits
Inside City
Limits
Outside City
Limits
$5.40 $7.18 $5.40 $7.18 $5.40 $7.18$5.80 $7.71 $5.80 $7.71 $5.80 $7.71$7.85 $10.44 $8.35 $11.11 $8.35 $11.11$8.29 $11.03 $8.97 $11.92 $8.97 $11.92
$17.45 $23.21 $21.96 $29.20 $21.96 $29.20$25.89 $34.43 $33.93 $45.13 $33.93 $45.13$47.84 $63.63 $67.86 $90.26 $67.86 $90.26
2008-2009
SCHEDULE OF WATER SERVICE RATES
2011-2012
LAST TEN FISCAL YEARS
City of Columbia, Missouri
Minimum Charge Per Month Minimum Charge Per Month
2012-2013
2006-2007
2013-2014
2007-2008
Minimum Charge Per Month Minimum Charge Per Month
195

Table 12
Residential: (a) 2015-2016 2014-2015 2013-2014 2012-2013 2011-2012Base Charge per month $11.01 $11.01 $7.30 $7.30 $6.35All Volume per 100 cu. ft. $2.270 $2.270 $2.414 $2.414 $2.099
Non-Residential: (a)
Meter size
5/8 inch $11.01 $11.01 $7.30 $7.30 $6.35
3/4 inch $16.52 $16.52 $12.17 $12.17 $10.58
1 inch $27.53 $27.53 $24.33 $24.33 $21.16
1 1/2 inch $55.05 $55.05 $48.67 $48.67 $42.32
2 inch $88.08 $88.08 $77.87 $77.87 $67.71
3 inch $176.16 $176.16 $155.73 $155.73 $135.42
4 inch $275.25 $275.25 $243.34 $243.34 $211.60
6 inch* $550.50 $550.50 $1,460.04 $1,460.04 $1,269.60
8 inch* $880.80 $880.80 $1,946.72 $1,946.72 $1,692.80
10 inch* $1,266.15 $1,266.15 $2,676.74 $2,676.74 $2,327.60
12 inch* $2,367.15 $2,367.15 $3,650.10 $3,650.10 $3,174.00
All Volume per 100 cu. ft. $2.270 $2.270 $2.414 $2.414 $2.099
Residential: (a) 2010-2011 2009-2010 2008-2009 2007-2008 2006-2007
Service Charge per month $7.00 $6.09 $5.30 $4.61 $4.35
All Volume per 100 cu. ft. $1.660 $1.440 $1.250 $1.090 $1.030
(a) Prior to 2012, the base charge was for residential and commercial users. In fiscal year 2012, the
classifications and definitions of users for sanitary sewer charges was amended from residential
and commercial to residential and non-residential.
* In FY15, the meter capacity flow ratios were changed to incorporate the American Water Works Association
maximum flow ratio standards and the base charge was adjusted accordingly.
SCHEDULE OF SANITARY SEWER SERVICE RATESLAST TEN FISCAL YEARS
City of Columbia, Missouri
Base Charge per month
196

Table 13
Face Coupon Fair
Purchase Amount, Maturity Interest Value
Date or Shares Date Rate Cost 09/30/16
POOLED CASH:
U. S. Government and Agency Securities:
FHLMC PL291302 - 31344XNTO various 58,282,764 04/01/17 7.000% 59,329 8,300
FHLMC C90211 - 31335HGU1 12/12/02 3,500,000 04/01/18 6.500% 59,274 2,856
FHLMC J07957 - 3128PKZW7 04/16/09 1,500,000 05/01/18 5.000% 99,421 42,449
FNMA 257428 - 31371N4M4 10/20/08 2,000,000 10/01/18 5.000% 59,234 59,654
FNMA 756831 - 31403SY42 02/18/09 2,677,630 12/01/18 5.000% 78,107 41,427
FHLMC C90263 - 31335HJG9 05/17/99 1,000,000 04/01/19 7.000% 27,408 4,490
FED INVESTMENT CORP - 317705AP6 05/26/09 1,710,000 09/26/19 8.600% 2,290,545 2,083,088
FNMA GTD MTG 826269 - 31407B6E4 06/17/08 1,540,000 07/01/20 5.000% 54,873 53,367
FHR 1013 Z - 312904RL1 11/21/02 780,000 10/15/20 9.000% 23,360 1,302
FHLMC G11813 - 31336WAM1 09/21/07 2,600,000 11/01/20 5.000% 87,318 118,332
FGG 11945 - 3128M1BN8 06/27/08 2,000,000 12/01/20 5.000% 69,363 86,833
FGJ15115 - 3128PUVG4 10/16/12 3,100,000 04/01/21 3.500% 815,632 718,984
FG G12740 - 3128MBHR1 11/17/11 6,150,000 05/01/21 5.000% 448,307 303,714
FNMA PL 253945 - 31371KBN0 04/29/02 1,200,000 08/01/21 6.500% 31,558 8,499
FHR 1116 I 11/30/98 505,000 08/15/21 5.500% - 2,635
FHR 1125 X - 312906XG0 various 950,000 08/15/21 8.250% 43,153 13,144
FFCB BOND - 31331XX64 04/03/09 2,045,000 08/23/21 5.550% 2,244,878 2,447,599
FHLMC CTFS J03849 - 3128PFH24 06/22/07 2,000,000 11/01/21 5.000% - 44,022
FHR 1163 JA - 3129072D9 11/29/99 500,000 11/15/21 7.000% 1,169 4,092
FHLMC MED TERM NOTE - 3134G45T1 06/10/13 2,000,000 12/10/21 2.000% 2,000,000 2,052,900
FNR 91-162 GA - 31358KF37 02/20/01 493,000 12/25/21 8.250% 16,990 3,228
FHLMC REMIC 1280 CL B - 312909J88 various 78,574,999 04/15/22 6.000% 135,881 39,437
FNMA 2013-123 WG - 3136A9ZB7 11/27/13 2,700,000 11/25/22 2.500% 1,895,517 1,977,619
FN 254797 - 31371K7J4 05/20/09 4,000,000 06/01/23 5.000% 208,539 157,570
FHLMC C90787 GOLD - 31335H2U6 02/12/04 1,758,744 11/01/23 4.000% 57,579 157,596
FNMA 255114 - 31371LK32 04/15/04 2,000,000 03/01/24 5.000% 141,421 130,447
GNMA 782603 - 36241K3L0 03/15/12 3,500,000 03/15/24 4.000% 591,862 462,479
FNMA PL 890112 - 31410K3V4 06/23/11 3,000,000 04/01/24 4.000% 277,122 194,543
FHLMC CALLABLE - 3134G8ZT9 04/26/16 3,000,000 04/26/24 1.500% 3,000,000 2,983,740
FNMA 255271 - 31371LQY8 05/20/04 2,000,000 05/01/24 5.000% 59,421 118,655
FHLB CALLABLE - 3130A1RQ3 05/14/14 2,000,000 05/14/24 2.000% 2,000,000 2,046,940
FGG 18312 - 3128MMK28 09/19/11 3,000,000 06/01/24 4.000% 423,005 324,842
FHLMC C90844 - 31335H5D1 12/13/10 7,900,000 08/01/24 4.500% 521,401 402,944
FHLMC CTFS J11270 - 3128PQMT5 12/17/09 2,154,035 11/01/24 4.000% 256,213 207,226
FHLB BOND STEP UP CALLABLE - 3130A43T7 02/27/15 2,000,000 02/27/25 1.000% 2,000,000 1,999,020
FHR 3649 BW - 31398V7F7 06/15/12 2,000,000 03/15/25 4.000% 583,716 489,618
FHLMC G14052 - 3128MCWM3 12/15/11 3,270,417 04/01/25 4.000% 609,157 501,618
FNR 2014-14 KV - 3136AJRQ1 05/28/14 2,000,000 08/25/25 3.000% 1,702,290 1,716,410
FN 890263 - 31410LB84 11/17/11 3,050,000 11/01/25 4.000% 710,840 610,103
FNR 2011-58 KA - 31397UZT9 08/15/11 2,500,000 02/25/26 3.500% 240,043 128,218
FHR 3840 KT - 3137A9FB7 04/29/11 2,000,000 03/15/26 3.500% 629,379 654,222
FHLMC REMIC 4215 KV - 3137B34Q8 08/20/13 2,000,000 06/15/26 3.500% 1,659,260 1,662,005
FHLMC PC GOLD 15 Yr - 3128PWEA2 09/19/11 2,500,000 08/01/26 3.000% 1,064,586 1,028,690
FHR 1883 L - 3133T7WD7 05/10/02 2,000,000 09/15/26 7.000% 149,051 84,148
FHLMC GOLD #G30307 - 3128CUKU9 05/13/08 2,500,000 01/01/27 6.000% 187,950 157,672
FNR 2012-43 AC - 3136A5YY6 04/30/12 2,200,000 04/25/27 1.750% 1,034,504 999,517
FN 256751 - 31371NEY7 07/13/09 3,500,000 06/01/27 5.500% 272,211 185,831
FHLMC REMIC 4097 HK - 3137ATKU5 10/17/12 2,000,000 08/15/27 1.750% 1,272,773 1,220,095
FHLMC REMIC 4129 AP - 3137AVYK7 12/11/12 2,000,000 11/15/27 1.500% 1,260,385 1,241,581
FHLMC CTFS D97497 - 3128E4KJ0 12/12/07 1,143,366 12/01/27 5.000% 110,116 139,345
FGC C91164 - 3128P7JH7 various 4,000,000 03/01/28 5.000% 202,770 146,806
FNMA GTD MTG 257154 - 31371NTK1 03/28/08 2,294,345 03/01/28 4.500% 70,013 114,272
FNMA REMIC 2013-18 CL AE - 3136ACA27 05/13/13 2,500,000 03/25/28 2.000% 1,572,885 1,527,172
FGC 91167 - 3128P7JL8 04/29/08 2,000,000 04/01/28 5.000% 71,487 91,081
FHLB BOND STEP UP CALLABLE - 3130A7P41 04/28/16 3,000,000 04/28/28 2.000% 3,000,000 3,000,270
FNMA REMIC 2013-45 AB - 3136AD2P3 06/25/14 2,000,000 05/25/28 1.500% 788,877 820,724
GNMA POOL 002633M - 36202C4S9 08/24/98 1,000,000 08/20/28 8.000% 34,959 2,594
FHR 4493 VH - 3137BKMA5 09/22/15 3,000,000 09/15/28 3.000% 2,897,196 2,937,343
FHLMC REMIC 3845 EK - 3137A9RZ1 09/20/11 3,555,000 01/15/29 4.000% 757,475 578,312
FGC 91281 - 3128P7M67 03/12/12 2,685,000 12/01/29 4.500% 517,502 429,107
FNMA REMIC 2013-128 CL A - 3136AHNW6 05/23/14 2,000,000 12/25/30 3.500% 1,108,848 1,057,933
FNMA CALLABLE - 3136G3JC0 04/28/16 2,000,000 04/28/31 2.000% 1,998,000 1,995,820
FNMA 0816 - 31417Y4A2 10/13/11 2,035,707 08/01/31 4.500% 862,514 794,043
FNMA MA0878 - 31417Y6Q5 11/14/11 2,000,000 10/01/31 4.000% 810,976 777,609
FNMA MA0885 - 31417Y6X0 11/14/11 2,000,000 10/01/31 3.500% 613,738 579,167
FHR 2647 A - 31394GBQ5 08/24/11 11,373,000 04/15/32 3.250% 513,222 471,773
FNR 2003-18 PA - 31392JVZ9 11/18/09 25,750,000 07/25/32 4.000% 504,729 463,460
FHLMC REMIC 4160 HP - 3137AXUG6 02/12/13 3,000,000 01/15/33 2.500% 2,038,124 1,981,952
GNR 2003-70 TE - 38374BG80 12/14/06 923,000 02/20/33 5.500% 113,796 119,334
FHR 4342 DA - 3137BAYE6 08/28/14 2,050,000 03/15/33 2.500% 1,473,579 1,479,846
FNMA SER 03-43 CL YA - 31393A5B9 10/29/10 5,500,000 03/25/33 4.000% 168,932 124,028
FNR 2013-35 KL - 3136ADSY6 03/15/16 4,000,000 04/25/33 2.000% 2,799,235 2,760,606
FNR 2003-35 UM - 31393BM77 08/11/09 15,000,000 05/25/33 4.500% 457,054 449,271
FHLMC ARM 1B0984 - 31336SUH9 02/23/04 2,000,000 07/01/33 3.295% 85,943 102,363
FHR 2877 PA - 31395HMH0 12/16/08 1,550,000 07/15/33 5.500% 90,586 69,943
FNMA ARM 742243 - 31402YS88 12/23/03 1,000,000 09/01/33 3.816% 46,039 41,993
FHLMC CO1647 - 31292HZL1 12/13/10 5,500,000 10/01/33 4.500% 520,377 444,133
FNMA 190346 - 31368HL35 05/13/10 5,695,000 12/01/33 5.500% 339,858 257,122
FHR 3778 - 3137A45W3 05/09/11 2,500,000 12/15/33 4.000% 2,036,198 2,231,681
FNMA 725206 - 31402CU75 12/13/10 7,800,000 02/01/34 5.500% 468,658 336,042
FNMA PL 777716 - 31404TAR4 04/26/04 2,000,000 04/01/34 3.750% 140,427 151,621
FNMA ARM 775566 - 31404QTX7 02/22/05 1,000,000 05/01/34 4.146% 34,810 35,572
FNMA ARM 779076 - 31404UQ52 06/24/04 2,000,000 05/01/34 3.790% 105,297 148,910
FHR 2881 AE - 31395J5C6 03/24/09 5,080,000 08/15/34 5.000% 296,766 214,611
FHR 2963 BK - 31395TLX0 07/01/11 5,000,000 09/15/34 4.000% 100,998 25,073
FHR 2963 BP - 31395TM35 12/19/06 2,160,000 09/15/34 5.000% - 10,823
FHLMC ARM 1B2795 - 3128JM7H4 03/23/05 2,000,000 03/01/35 4.446% 206,838 220,406
FHR 2942 LA - 31395PHQ8 08/13/09 2,250,000 03/15/35 5.000% 238,278 239,907
FNR 2005-29 AU - 31394DHY9 03/28/08 2,000,000 04/25/35 4.500% 140,884 175,389
FHR 3289 ND - 31397FP48 05/18/09 2,000,000 06/15/35 5.500% 106,270 10,061
SARM 05-22 1A2 - 863579F52 12/07/05 980,772 12/25/35 5.250% 74,383 28,526
FHLMC PL G02252 - 3128LXQD5 06/13/11 6,500,000 07/01/36 5.500% 381,719 232,129
FNR 2008-41 MD - 31397LLU1 03/09/10 3,000,000 11/25/36 4.500% 476,620 455,745
FNMA 888131 - 31410FVY8 07/13/09 3,615,000 02/01/37 5.500% 182,809 145,699
FHR 3283 - 31397EXX8 10/29/09 3,457,300 02/15/37 5.000% 112,426 34,843
FHLMC G03035 - 3128M4V42 05/12/11 5,360,000 07/01/37 5.500% 333,490 196,294
FNMA CL 888707 - 31410GKU6 05/12/09 1,550,000 10/01/37 7.500% 151,429 88,001
FHR 4385 JA - 3137BDSX5 04/12/16 5,000,000 10/15/37 2.500% 3,162,459 3,128,716
GNMA 2012-07 PH - 38378CQF7 08/28/13 2,000,000 01/20/38 2.750% 777,867 774,558
City of Columbia, Missouri
SCHEDULE OF MARKETABLE SECURITIES AND INVESTMENTS
SEPTEMBER 30, 2016
Identification Number and
Issuing Institution
197

Table 13
Face Coupon Fair
Purchase Amount, Maturity Interest Value
Date or Shares Date Rate Cost 09/30/16
City of Columbia, Missouri
SCHEDULE OF MARKETABLE SECURITIES AND INVESTMENTS
SEPTEMBER 30, 2016
Identification Number and
Issuing Institution
FHLMC PL G04913 - 3128M6YJ1 04/12/12 5,250,000 03/01/38 5.000% 493,682 369,522
FHLMC ARM 783263 - 31349UTU2 06/24/08 1,500,000 05/01/38 4.500% 27,853 125,522
FHLMC ARM 783264 - 31349UTV0 11/24/08 2,000,000 05/01/38 4.460% 79,798 38,247
FHR 3448 AG - 31397TJ37 03/19/09 3,100,000 05/15/38 5.000% 317,567 248,340
GNR 2008-82A - 38375YEK4 10/14/08 2,000,000 09/20/38 6.000% 170,060 133,799
GNR 2009-93 PB - 38376KLZ2 08/26/11 4,000,000 12/16/38 3.000% 210,176 137,739
FNR 2010-134 DJ - 31398SMH3 11/14/11 2,225,000 03/25/39 2.250% 837,708 824,858
FHR 3796 LA - 3137A5ZA5 07/10/12 2,200,000 06/15/39 2.000% 704,536 679,972
GNMA 4461M - 36202E5W5 11/18/10 2,050,000 06/20/39 4.500% 198,756 113,382
GNR 10-125 TC - 38377JD83 01/22/14 3,000,000 06/20/39 2.500% 726,665 749,367
FNR 2009-50 MJ - 31396QMC0 08/22/11 3,100,000 06/25/39 4.000% 248,412 170,258
FNR 2009-78 BQ - 31398FKY6 02/17/12 3,500,000 06/25/39 4.500% 507,949 379,453
FNR 2009-78 BM - 31398FLA7 03/25/11 2,500,000 06/25/39 4.000% 313,744 269,333
GNMA 2012-27 CL A - 38378BQA0 05/01/13 2,000,000 07/16/39 1.614% 1,317,634 1,280,389
GNR 2009-58 AC - 38375D3D8 03/16/11 3,000,000 07/20/39 4.000% 358,607 318,182
GNR 2010-30 BP - 38376XZC0 04/23/14 5,645,000 07/20/39 3.500% 1,494,052 1,411,420
GNMA SER 2010-04 JC - 38376T2H4 12/16/10 2,350,000 08/16/39 3.000% 316,219 269,289
GNR 2012-39 MP - 38378DPL3 09/13/12 2,000,000 08/20/39 2.000% 744,450 698,577
FHR 3753 PG - 3137A3ME6 07/18/13 4,000,000 09/15/39 2.500% 1,236,040 1,304,496
GNR 2011-39 NE - 38377QXX0 02/18/15 7,000,000 09/16/39 3.500% 1,220,744 1,165,633
GNMA REMIC 09-093 HB - 38376KKX8 10/30/09 2,000,000 09/20/39 3.000% 169,522 170,660
FNR 2011-27 JQ - 31397SGM0 07/31/12 2,000,000 09/25/39 4.000% 493,766 385,108
FHR 3795 EB - 3137A5MK7 11/26/14 3,500,000 10/15/39 2.500% 1,306,632 1,302,999
GNR 10-117 GD - 38377JZ48 08/06/13 2,429,000 10/20/39 3.000% 679,330 674,196
FNR 2015-12 DA - 3136AMJ75 12/16/15 1,700,000 11/25/39 2.500% 1,315,892 1,322,487
FHR 3725 PD - 3137A1UP6 10/17/14 4,100,000 01/15/40 2.500% 1,230,444 1,223,397
GNR 2015-57 GA - 38379LLU8 07/22/15 2,050,000 01/20/40 2.500% 1,340,052 1,310,824
FNR 2010- 57 HA - 31398RC94 02/29/12 2,577,000 02/25/40 3.500% 508,326 417,943
FHR 3997 LN - 3137AMBU0 02/29/12 2,000,000 03/15/40 2.500% 585,414 543,506
FNR 12-114 GB - 3136A9LG1 12/07/12 1,698,474 03/25/40 1.750% 982,571 974,392
GNR 12-94 GA - 38375GQW4 07/26/13 2,350,000 05/20/40 2.500% 925,444 971,376
FNR 2012-129 TD - 3136AAEK7 11/30/12 2,000,000 05/25/40 2.000% 909,365 863,326
FHR 3819 - 3137A8LS5 05/27/11 2,000,000 06/15/40 4.000% 856,112 820,186
FNR 2010-87 PJ - 31398TZJ3 05/24/11 2,000,000 06/25/40 3.500% 261,475 244,122
FNR 2014-19 HA - 3136AJPG5 04/21/14 2,000,000 06/25/40 2.000% 511,573 501,544
FNR 2010-100 LA - 31398NJE5 03/12/12 2,600,000 07/25/40 2.500% 682,606 635,998
FHR 4103 DC - 3137AU7H6 09/28/12 2,000,000 09/15/40 2.000% 1,185,244 1,175,999
FHLMC REMIC 3752 PD - 3137A2W98 04/29/15 2,000,000 09/15/40 2.750% 738,876 723,174
GNR 2011-81 MC - 38376LZB8 11/08/13 2,000,000 10/20/40 3.000% 553,286 548,829
GNR 2010-134 YA - 38377LT57 various 9,200,000 10/20/40 2.500% 2,766,808 2,796,467
FNR 2010-133 GB - 31398N7B4 07/06/11 2,635,000 10/25/40 2.500% 969,061 1,064,999
FNR 2010-137 HP - 31398SQY2 05/18/12 2,200,000 10/25/40 3.500% 342,855 281,325
FNR 2012-30 HA - 3136A5UE4 12/22/15 5,134,000 12/25/40 2.000% 2,227,673 2,259,509
FHR 3798 PQ - 3137A6AM4 06/16/11 2,000,000 01/15/41 3.500% 489,554 463,064
FHR 3816 HN - 3137A6R46 03/30/11 2,000,000 01/15/41 4.500% 529,283 518,071
FNR 2012-129 CL - 3136AADT9 11/30/12 3,000,000 01/25/41 1.750% 2,013,184 2,004,399
FHR 4019 LM - 3137ANME2 07/03/12 2,000,000 02/15/41 4.000% 102,452 9,859
GNR 2012-136 PD - 38377X4E9 12/03/12 2,000,000 02/20/41 1.500% 1,273,291 1,246,030
FNMA REMIC 2011-134 NJ - 3136A2V59 06/11/14 2,500,000 02/25/41 3.000% 1,215,516 1,201,541
FNR 2012-21 PA - 3136A35Y3 04/21/15 3,000,000 03/25/41 2.000% 1,571,756 1,566,227
FHR 4036 PA - 3137ANQF5 04/30/12 2,000,000 04/15/41 2.750% 762,820 713,633
FHR 4106 EC - 3137ATW57 09/28/12 2,500,000 04/15/41 1.750% 1,570,738 1,546,462
FNR 2012-46 CA - 3136A5H66 10/10/14 3,792,000 04/25/41 2.000% 1,508,766 1,601,346
FHR 4091 TG - 3137ATGB2 09/24/12 2,000,000 05/15/41 1.750% 1,230,044 1,207,102
FHR 4050 BC - 3137AQJB5 11/05/12 3,000,000 05/15/41 2.000% 1,401,336 1,354,026
FHR 4019 JD - 3137AN3S2 10/22/15 2,000,000 05/15/41 3.000% 919,735 923,402
GNR 2015-88 GC - 38379PP27 07/21/15 2,000,000 05/20/41 2.500% 1,540,463 1,548,745
FNR 2012-2 HA - 3136A3XT3 01/30/12 2,000,000 05/25/41 2.500% 422,760 405,157
FHR 4104 HA - 3137AUCV9 11/08/12 3,443,000 07/15/41 2.000% 2,194,786 2,128,001
FNR 2013-56 GM - 3136AEZZ3 04/06/15 3,500,000 08/25/41 2.000% 1,267,874 1,260,796
FNR 2012-14 PA - 3136A4WN5 08/11/15 3,000,000 08/25/41 2.000% 1,484,426 1,511,873
FHR 4119 PA - 3137AUVJ5 12/10/12 2,000,000 09/15/41 1.500% 1,235,632 1,199,820
FHR 4050 ND - 3137AQLG1 02/22/16 6,500,000 09/15/41 2.500% 2,833,500 2,842,485
FNR 2012-103 MB - 3136A8YZ7 09/04/12 2,000,000 09/25/41 2.000% 1,209,304 1,167,737
FHLMC REMIC 4026 JL - 3137AP2J8 01/16/15 3,300,000 10/15/41 2.250% 1,394,942 1,423,029FHR 4107 HA - 3137AUF46 09/28/12 2,000,000 10/15/41 2.000% 1,153,092 1,128,651FHR 4209 MA - 3137B1VC3 10/22/15 1,675,000 10/15/41 2.500% 790,296 792,779FNMA 2012-16 AL - 3136A4QK8 02/29/12 2,332,126 11/25/41 3.000% 2,212,605 2,499,783FNR 2012-66 PC - 3136A6B45 06/11/12 2,000,000 11/25/41 2.000% 886,858 873,618FHR 4312 GA - 3137B7PR4 12/11/14 4,073,930 12/15/41 2.500% 994,154 985,958GNR 2012-63 UE - 38378EF73 10/30/15 5,000,000 12/20/41 2.000% 1,702,781 1,716,404FNR 12-111 EC - 3136A9GM4 03/11/13 3,000,000 12/25/41 2.000% 1,907,063 1,867,669FHR 4000 PJ - 3137ALYC7 04/04/16 5,700,000 01/15/42 3.000% 1,784,256 1,768,411FHR 4030 BC - 3137APJG6 various 8,300,000 01/15/42 2.000% 3,193,765 3,197,000GNR 2012-97 CP - 38375GYE5 05/16/13 2,100,000 01/20/42 1.500% 1,272,567 1,236,537GNR 2012-59 NE - 38378ESK0 10/18/12 2,000,000 01/20/42 2.500% 546,944 487,004GNR 2015-79 A - 38379L2P0 08/25/15 3,100,000 02/20/42 2.500% 2,505,131 2,547,061FNR 2012-20 TD - 3136A4JR1 05/25/12 2,000,000 02/25/42 4.500% 637,382 528,745FHLMC REMIC 4034 PK - 3137ANNS0 06/19/14 3,000,000 03/15/42 2.250% 856,175 916,537GNMA REMIC 2012-110 KJ - 38375G2Y6 03/18/15 3,500,000 03/20/42 3.000% 1,532,677 1,514,130FNR 2012-90 DA - 3136A7RE4 05/16/16 5,000,000 03/25/42 1.500% 1,705,340 1,711,941FNR 2012-103 PD - 3136A8ZW3 10/15/12 2,500,000 04/25/42 2.000% 1,465,595 1,411,281FNR 2013-13 PH - 3136ACH53 07/28/14 2,250,000 04/25/42 2.500% 1,476,284 1,506,145FHR 4077 BA - 3137ASAG9 01/17/13 3,030,000 05/15/42 2.000% 1,221,819 1,146,846GNR 2013-44 PA - 38378JQU9 08/06/13 2,100,000 05/16/42 2.500% 1,330,101 1,366,432FNR 2012-128 QC - 3136A9UY2 04/25/13 2,000,000 06/25/42 1.750% 1,237,791 1,217,617FNR 2013-1 PG - 3136ABB28 03/13/13 6,000,000 06/25/42 2.000% 3,692,595 3,697,642FNR 2013-37 JA - 3136AC6U0 03/24/15 3,000,000 06/25/42 1.750% 1,525,621 1,525,833FHLMC REMIC 4129 CL PA - 3137AVZB6 06/23/15 4,650,000 07/15/42 2.500% 2,212,725 2,225,980GNR 2012-149 GH - 38378GX78 02/13/13 3,000,000 07/20/42 1.500% 1,303,921 1,278,053FNR 2013-2 LC - 3136AB5T6 02/13/13 3,000,000 08/25/42 1.750% 2,027,937 1,986,253FHR 4120 DB - 3137AVAK3 11/18/15 5,000,000 10/15/42 1.500% 2,765,674 2,838,902FHR 4181 PE - 3137B0LN2 03/28/13 3,000,000 11/15/42 1.750% 1,624,388 1,557,996GNR 2013-24 PJ - 38378FR51 11/25/13 2,926,000 11/20/42 3.000% 1,708,166 1,703,297GNMA 2012-149 MD - 38378GL97 06/15/15 3,690,000 12/20/42 2.000% 1,649,743 1,665,013FNR 2013-18 NA - 3136ACYK1 02/28/13 3,000,000 12/25/42 2.000% 1,708,082 1,672,944FHR 4158 LD - 3137AXUZ4 05/16/13 2,000,000 01/15/43 2.000% 1,010,965 1,002,451
198

Table 13
Face Coupon Fair
Purchase Amount, Maturity Interest Value
Date or Shares Date Rate Cost 09/30/16
City of Columbia, Missouri
SCHEDULE OF MARKETABLE SECURITIES AND INVESTMENTS
SEPTEMBER 30, 2016
Identification Number and
Issuing Institution
FHR 4219 AE - 3137B2LG3 07/01/13 2,000,000 01/15/43 2.250% 1,343,470 1,387,060FNR 12-146 QA - 3136ABFP3 01/17/13 2,774,304 01/25/43 1.000% 676,796 646,517FNR 2014-46 PG - 3136AKUZ4 09/03/14 2,000,000 01/25/43 3.000% 805,296 760,456GNR 2013-27 KA - 38378FZQ6 04/26/16 5,000,000 02/20/43 2.250% 1,399,576 1,398,685GNR 2013-77 GD - 38378PAF5 07/29/15 2,600,000 02/20/43 1.500% 1,598,553 1,642,973FNR 2013-23 AB - 3136ADAB5 12/30/15 4,000,000 02/25/43 2.000% 1,819,088 1,860,960FNR 2013-23 AG - 3136ADCM9 05/03/16 5,000,000 02/25/43 1.750% 2,302,681 2,309,922FHR 4402 PB - 3137BEMD3 04/10/15 2,000,000 03/15/43 2.000% 1,382,649 1,384,461
FNR 2013-29 KE - 3136ADKY4 08/15/13 3,000,000 04/25/43 1.250% 827,138 910,756FNR 2014-33 PE - 3136AKAW3 12/31/14 1,100,000 04/25/43 3.000% 732,898 723,648FNR 2013-42 KP - 3136AEBP1 09/22/15 4,300,000 05/25/43 1.500% 1,434,398 1,449,588
FNR 2013-130 CD - 3136AHL24 10/15/14 2,250,000 06/25/43 3.000% 1,466,846 1,447,052
FHR 4314 LE - 3137B9G33 01/08/16 1,700,000 07/15/43 3.000% 1,050,338 1,056,625
FHR 4314 PE - 3137B9GR0 01/08/16 1,800,000 07/15/43 3.000% 1,198,637 1,210,673
FNR 2014-68 GM - 3136ALTE1 12/03/15 2,500,000 10/25/43 3.000% 1,946,220 1,944,179
FHR 4468 GP - 3137BJKL6 08/24/15 2,050,000 11/15/43 3.000% 1,856,842 1,842,857
FHR 4347 PA - 3137BBTB6 05/10/16 1,912,000 03/15/44 3.500% 1,314,584 1,305,372
FHR 4474 JA - 3137BJFJ7 06/23/15 2,000,000 06/15/44 3.000% 1,823,161 1,828,046
FHR 4434 QD - 3137BGES4 02/22/16 2,250,000 06/15/44 2.000% 1,923,231 1,924,538
FHR 4464 MA - 3137BHNM5 11/12/15 2,650,000 08/15/44 3.000% 2,418,248 2,399,203
FHR 4389 CA - 3137BDNG7 12/10/15 3,000,000 09/15/44 3.000% 1,808,334 1,800,390
FHR 4425 HA - 3137BG4N6 07/16/15 3,000,000 01/15/45 2.000% 2,122,350 2,180,710
FNR 2015-62 M - 3136APZD7 12/18/15 2,600,000 03/25/45 2.500% 2,279,658 2,312,592
FHR 4572 ND - 3137BNY32 05/02/16 2,000,000 04/15/46 2.000% 1,940,430 1,936,837
Total U. S. Government and
Agency Securities $ 215,904,537 $ 211,607,692
Miscellaneous Securities
UBS Select Treasury various 82,852,666 - - $ 82,852,666 $ 82,852,666
Total Pooled Cash Marketable
Securities $ 298,757,203 $ 294,460,358
SELF-INSURANCE RESERVE:
US Treasury Note 912828H78 05/25/16 1,300,000 01/31/17 0.500% $ 1,300,000 $ 1,300,767
Total U. S. Government and Agency
Securities $ 1,300,000 $ 1,300,767
Total Self-Insurance Reserve $ 1,300,000 $ 1,300,767
POST-EMPLOYMENT HEALTH FUND:
Stocks and Mutual Funds:
AmFds Euro Pacfc various 5,607 — — $ 204,247 $ 261,687
BlkRkEq Divd Inv various 20,045 — — 389,755 444,393
FidAdv New Insights A various 17,859 — — 390,828 492,190
Gdmnscs Strat Inc A various 11,151 — — 116,083 106,609
JPM EmrgMrk Eq A various 4,601 — — 97,086 101,077
JPM SmCap Eq A various 3,948 — — 140,899 173,264
Loomis Bd Admn various 16,869 — — 240,096 234,821
LrdAbtGr Oppr A various 8,151 — — 155,337 154,955
Okmrk Intl II various 12,725 — — 230,556 276,649
Prudntl Ttl Rtn Bd A various 29,948 — — 434,464 443,826
Total Mutual Funds $ 2,399,351 $ 2,689,471
Total Post Employment Health Fund $ 2,399,351 $ 2,689,471
199

Table 13
Face Coupon Fair
Purchase Amount, Maturity Interest Value
Date or Shares Date Rate Cost 09/30/16
City of Columbia, Missouri
SCHEDULE OF MARKETABLE SECURITIES AND INVESTMENTS
SEPTEMBER 30, 2016
Identification Number and
Issuing Institution
POLICE AND FIREFIGHTERS’ RETIREMENT FUND:
Corporate Bonds:CNH Cptl LLC - 12623EAB7 various 120,000 11/01/16 6.250% 131,700 120,360
Sabine Pass Lng - 785583AF2 various 125,000 11/30/16 7.500% 138,845 125,937
Greif Inc - 397624AE7 various 115,000 02/01/17 6.750% 121,774 116,437
Intl Lease Fin Corp - 459745GG4 various 120,000 03/15/17 8.750% 140,156 123,450
Centurytel Inc - 156700AL0 various 125,000 04/01/17 6.000% 138,090 127,500
Aircastle Ltd - 00928QAF8 various 120,000 04/15/17 6.750% 134,661 122,400
Morgan Stanley Mtn - 617446H51 06/03/13 75,000 04/27/17 5.550% 84,160 76,731
CIT Group - 125581GM4 various 120,000 05/15/17 5.000% 128,756 122,250
Toyota Motor Credit - 89233P6D3 various 775,000 05/22/17 1.750% 783,592 778,813
Centene Corp - 15135BAC5 various 110,000 06/01/17 5.750% 116,669 112,475
Commercial Metals - 201723AH6 various 123,000 07/15/17 6.500% 137,460 127,305
Gulf South Pipeline - 402524AC6 various 50,000 08/15/17 6.300% 53,854 51,708
Watson Pharmaceutical - 942683AG8 05/24/13 95,000 10/01/17 1.875% 94,877 95,328
Whirlpool Corp NTS B/E - 963320AS5 03/09/16 775,000 11/01/17 1.650% 774,589 777,185
DCP Midstream Op-2311VAC1 03/09/16 110,000 12/01/17 2.500% 107,387 109,450
Walt Disney Company - 25458PCV6 various 775,000 12/01/17 1.100% 774,808 775,535
Ecolab Inc - 278865AP5 12/14/12 80,000 12/08/17 1.450% 80,046 80,152
Intel Corp Nts - 458140AL4 various 775,000 12/15/17 1.350% 778,363 777,418
NRG Energy - 629377BN1 various 110,000 01/15/18 7.625% 120,875 117,150
Buckeye Partners - 118230AG6 04/13/16 75,000 01/15/18 6.050% 79,106 78,749
Bear Stearns - 073902RU4 11/14/12 70,000 02/01/18 7.250% 87,069 75,173
Medtronic Inc - 585055BQ8 01/26/16 775,000 03/15/18 1.500% 776,659 778,495
Health Care Reit Inc - 42217KAZ9 12/06/12 65,000 03/15/18 2.250% 64,884 65,571
Bank of Amer Nts - 06050TLY6 03/26/15 170,000 03/26/18 1.650% 170,138 170,705
Telefonica Emisiones - 87938WAQ6 07/09/15 200,000 04/27/18 3.192% 206,164 204,720
Harsco Corp - 415864AJ6 various 110,000 05/15/18 5.750% 113,971 111,540
Comcast Corp - 20030NAW1 various 700,000 05/15/18 5.700% 766,674 749,973
Cisco Systems Inc - 17275RAU6 varioius 565,000 06/15/18 1.650% 571,896 569,639
GFI Group - 361652AA8 10/20/15 115,000 07/19/18 8.375% 125,431 124,200
CHS/Cmnty Health - 12543DAR1 various 90,000 08/15/18 5.125% 92,066 90,900
Northern Trst Co Nts - 66586GCD7 various 510,000 08/15/18 6.500% 572,001 557,506
T-Mobile - 87264AAB1 various 110,000 09/01/18 5.250% 114,237 111,512
Genl Motors Finl - 37045VAD2 various 60,000 10/02/18 3.500% 60,149 61,851
Tenet Healthcare Corp - 88033GBP4 various 110,000 11/01/18 6.250% 120,300 117,425
Pepsico Inc - 713448BJ6 06/07/16 250,000 11/01/18 7.900% 289,032 283,557
Stanley Black & Decker - 854502AB7 03/09/16 775,000 11/17/18 4.250% 783,827 791,810
Ares Capital Corp - 04010LAN3 01/15/15 45,000 11/30/18 4.875% 47,731 46,974
IAC Interactivecorp - 44919PAF9 various 72,000 11/30/18 4.875% 73,921 73,710
Citigroup Inc - 172967KE0 05/10/16 40,000 12/07/18 2.050% 40,311 40,303
BNP Paribas - 05574LTX6 various 180,000 12/12/18 2.400% 181,673 182,740
Black Hills Corp - 092113AK5 01/13/16 50,000 01/11/19 2.500% 49,938 50,747
Walmart - 931142CP6 various 600,000 02/01/19 4.125% 599,394 640,944
ARC Pptys - 03879QAD6 various 120,000 02/06/19 3.000% 116,212 121,634
Unilever Cptl Corp NTS - 904764AK3 various 510,000 02/15/19 4.800% 557,380 552,034
HCA Inc NTS B/E - 404119BM0 various 110,000 03/15/19 3.750% 112,359 113,712
Lyondellbasell - 552081AG6 06/21/13 25,000 04/15/19 5.000% 27,682 26,832
Chevron Corp NTS - 166764BH2 05/16/19 60,000 05/16/19 1.561% 60,056 60,317
Amgen Inc - 031162BU3 various 75,000 05/22/19 2.200% 74,987 76,393
Bank of Amer Corp Nts - 06051GDZ9 10/08/13 40,000 06/01/19 7.625% 49,318 45,904
Home Depot Inc NTS - 737076BE1 06/06/16 555,000 06/15/19 2.000% 567,032 567,598
Teekay Offshore Partners - 87901BAA0 various 80,000 07/30/19 6.000% 76,375 66,000
American Honda Fin Nts - 02665WAH4 08/08/16 550,000 08/15/19 2.250% 566,269 563,645
Gannett Co Inc - 364725BD2 12/23/15 110,000 10/15/19 5.125% 113,850 112,888
Lennar Corp - 526057BU7 various 110,000 11/15/19 4.500% 114,637 115,912
Targa Res Partners - 87612BAR3 various 110,000 11/15/19 4.125% 110,681 111,540
Alibaba Group - 01609WAC6 09/23/16 50,000 11/28/19 2.500% 50,967 51,003
Costco Whsl Corp - 22160KAF2 08/05/16 310,000 12/15/19 1.700% 316,073 313,770
Airlease Corp - 00912XAU8 09/28/16 15,000 01/15/20 2.125% 14,971 14,971
JP Morgan Chase - 46625HKA7 02/05/15 240,000 01/23/20 2.250% 240,730 243,154
PBF Hldg Co - 69318FAB4 various 125,000 02/15/20 8.250% 132,651 128,938
Equinix Inc - 29444UAL0 various 110,000 04/01/20 4.875% 113,308 113,987
Frontier Comm Corp - 35906AAH1 various 110,000 04/15/20 8.500% 115,675 118,937
Dish DBS Corp - 25470XAQ8 various 110,000 05/01/20 5.125% 111,844 114,125
Newstar Finl - 65251FAB1 11/13/15 115,000 05/01/20 7.250% 113,861 113,275
AES Corp Nts - 00130HBN4 various 105,000 06/01/20 8.000% 122,253 123,637
ICAHN Enterprises - 451102AX5 08/30/16 120,000 08/01/20 6.000% 117,900 120,600
Sunoco LP - 86765LAC1 09/20/16 35,000 08/01/20 5.500% 35,150 35,525
Arcelormittal - 03938LAQ7 05/13/16 45,000 08/05/20 5.750% 45,548 48,937
Kinder Morgan Energy B/E - 494550BE5 various 45,000 09/15/20 5.300% 44,419 48,552
Stifel Financial - 860630AE2 12/01/15 45,000 12/01/20 3.500% 44,826 45,967
Stifel Fin Corp - 860630AE2 various 25,000 12/01/20 3.500% 24,959 25,537
First Horizon Natl - 320517AB1 10/26/15 65,000 12/15/20 3.500% 64,843 66,342
Bank of Amer Corp - 06051GEE5 02/04/15 30,000 01/05/21 5.875% 35,288 34,406
Santander UK Group - 80281LAD7 01/08/16 45,000 01/08/21 3.125% 44,994 45,726
Nustar Logistics - 67059TAD7 04/28/16 15,000 02/01/21 6.750% 14,850 16,162
Petroleos Mexicanos - 71656LBJ9 02/04/16 40,000 02/04/21 6.375% 40,000 43,604
AT&T Inc - 00206RCZ3 03/23/16 65,000 02/15/21 4.600% 70,923 71,308
Arcelormittal - 03938LAU8 07/13/16 65,000 03/01/21 6.250% 67,949 72,312
Air Canada NTS - 008911AZ2 05/11/16 25,000 04/15/21 7.750% 26,302 27,000
GLP CAP L P / GLP Fing- 361841AG4 04/28/16 110,000 04/15/21 4.375% 112,403 115,775
Terex Corp - 880779AY9 various 105,000 05/15/21 6.000% 107,949 107,362
Clean Harbors Inc - 184496AL1 03/17/16 15,000 06/01/21 5.125% 15,037 15,375
Scottrade Finance - 81014AAA9 various 55,000 07/11/21 6.125% 59,637 59,118
Wells Fargo & Co - 949746SA0 07/25/16 95,000 07/26/21 2.100% 95,067 94,674
JP Morgan Chase - 46623EKG3 08/08/16 85,000 08/15/21 2.295% 85,000 85,185
Mattel Inc - 577081BA9 08/10/16 60,000 08/15/21 2.350% 60,055 60,827
Nvidia Corp Nts - 67066GAD6 09/16/16 105,000 09/16/21 2.200% 104,792 105,320
Huntington Banschares - 446150AK0 08/09/16 75,000 01/14/22 2.300% 74,887 74,723
Crown Castle - 22822RBB5 various 50,000 05/15/22 3.222% 50,070 51,476
Motorola Inc - 620076BB4 03/11/15 115,000 05/15/22 3.750% 115,722 117,947
Universal Health Svcs - 913903AR1 various 50,000 08/01/22 4.750% 51,731 51,625
Intl Lease Fin Corp - 459745GN9 08/09/16 50,000 08/15/22 5.875% 56,875 55,437
Hertz Corp Nts - 428040CN7 09/28/15 14,000 10/15/22 6.250% 14,367 14,420
Celanese US Holdings - 15089QAD6 various 45,000 11/15/22 4.625% 48,894 49,325
E*Trade Finl Corp - 269246BL7 03/24/16 50,000 11/15/22 5.375% 53,062 53,298
MPLX LP NTS - 55336VAC4 various 55,000 02/15/23 5.500% 54,413 56,820
MGM Resorts - 552953CC3 various 21,000 03/15/23 6.000% 21,479 22,785
Lender Processing - 52602EAD4 01/15/15 13,000 04/15/23 5.750% 13,781 13,682
200

Table 13
Face Coupon Fair
Purchase Amount, Maturity Interest Value
Date or Shares Date Rate Cost 09/30/16
City of Columbia, Missouri
SCHEDULE OF MARKETABLE SECURITIES AND INVESTMENTS
SEPTEMBER 30, 2016
Identification Number and
Issuing Institution
Regency Energy - 75886AAG3 various 55,000 04/15/23 5.500% 56,100 56,781
Genl Motors Finl - 37045XBK1 05/09/16 50,000 05/09/23 3.700% 49,872 50,853
Diamond 1/Diamond 2 - 25272KAG8 06/01/16 50,000 06/15/23 5.450% 49,979 53,573
LAM Research Corp - 512807AQ1 06/07/16 60,000 06/15/23 3.450% 60,608 61,372
Walgreens Boots Alliance - 931427AP3 06/07/16 110,000 06/15/23 3.100% 110,912 113,460
Express Scripts - 30219GAQ1 07/11/16 25,000 07/15/23 3.000% 25,282 25,392
Microsoft Corp - 594918BQ6 08/08/16 75,000 08/08/23 2.000% 74,776 74,900
Kinder Morgan - 494550BQ8 various 65,000 09/01/23 3.500% 59,526 65,101
Sprint Corp - 85207UAF2 01/15/15 10,000 09/15/23 7.875% 10,050 10,063
Oracle Corp - 68389XBL8 07/08/16 25,000 09/15/23 2.400% 25,348 25,201
Shire Acquisitions - 82481LAC3 09/23/16 60,000 09/23/23 2.875% 59,992 60,290
Kinder Morgan - 49456BAB7 02/04/15 50,000 11/15/23 5.625% 55,109 55,127
CCO Holdings - 1248EPBE2 01/15/15 50,000 01/15/24 5.750% 50,450 53,125
Comcast Corp - 20030NBJ9 various 115,000 03/01/24 3.600% 116,821 125,794
HCA - 404119BN8 04/28/16 25,000 03/15/24 5.000% 25,975 26,375
Interpub Group of Cos - 460690BL3 02/19/16 50,000 04/15/24 4.200% 49,728 53,695
Tesoro Logistics - 88160QAM5 05/12/16 15,000 05/04/24 6.375% 15,088 16,088
Enable Midstream Partner - 292480AH3 05/27/16 30,000 05/15/24 3.900% 25,388 27,976
Davita Healthcare - 23918KAQ1 01/15/15 30,000 07/15/24 5.125% 30,600 30,600
Sirius XM Holdings Inc - 82967NAS7 05/03/16 25,000 07/15/24 6.000% 26,500 26,656
Sinclair Television - 829259AR1 04/28/16 13,000 08/01/24 5.625% 13,423 13,293
Graphic Packaging - 38869PAM6 various 15,000 08/15/24 4.125% 15,131 15,113
Bank of Amer Corp - 06051GFH7 01/23/15 45,000 08/26/24 4.200% 46,327 47,652
Antero Midstream - 03690AAA4 09/13/16 15,000 09/15/24 5.375% 15,000 15,188
Tallgrass Energy Prtnr - 87470LAA9 09/01/16 25,000 09/15/24 5.500% 25,000 25,188
Ally Financial Inc - 02005NAV2 01/15/15 24,000 09/30/24 5.125% 24,564 25,440
Trinity Industries - 896522AH2 10/22/15 50,000 10/01/24 4.550% 47,773 49,724
Dish DBS Corp - 25470XAW5 various 18,000 11/15/24 5.875% 17,719 17,775
United Rentals North - 911365BB9 01/15/15 23,000 11/15/24 5.750% 23,457 23,863
Brixmor Operating Part - 11120VAA1 various 45,000 02/01/25 3.850% 43,827 45,760
HCA Inc - 404119BR9 various 31,000 02/01/25 5.375% 31,225 32,008
Lazard Group LLC - 52107QAG0 11/16/15 25,000 02/13/25 3.750% 23,266 25,167
T-Mobile USA - 87264AAN5 various 38,000 03/01/25 6.375% 38,595 41,325
Albertsons Cos LLC - 013093AC3 08/10/16 20,000 03/15/25 5.750% 20,325 19,950
Medtronic - 585055BS4 02/10/16 25,000 03/15/25 3.500% 25,813 26,922
Hospitality Prop - 44106MAT9 various 90,000 03/15/25 4.500% 93,156 91,811
HCA Inc - 404119BQ1 02/02/16 10,000 04/15/25 5.250% 10,275 10,663
Glencore Fndg - 378272AL2 04/08/15 25,000 04/16/25 4.000% 24,783 24,442
Southern Copper Corp - 84265VAH8 04/21/15 65,000 04/23/25 3.875% 64,973 65,260
Citigroup Inc - 172967JP7 05/11/15 40,000 04/27/25 3.300% 39,071 41,145
Columbia Pipeline Group - 198280AF6 various 80,000 06/01/25 4.500% 86,831 86,893
Energizer Spinco Inc - 29273AAA4 04/27/16 20,000 06/15/25 5.500% 20,150 20,600
Monsanto Co New - 61166WAE1 06/08/16 75,000 08/15/25 5.500% 86,731 87,982
Biogen Inc Nts - 09062XAF0 09/15/15 85,000 09/15/25 4.050% 85,677 92,544
Aviation Cptl - 05367AAH6 08/17/16 65,000 10/01/25 4.875% 69,300 70,525
Ally Financial Inc - 02005NBF6 11/20/15 9,000 11/20/25 5.750% 8,916 9,416
Morgan Stanley - 6174467X1 01/15/15 25,000 11/24/25 5.000% 27,096 27,893
Hawaiian Airlines - 419838AA5 01/15/15 50,000 01/15/26 3.900% 43,182 43,797
Expedia - 30212PAL9 12/08/15 25,000 02/15/26 5.000% 24,884 26,313
Goldman Sachs Group Inc - 38143U8H7 05/10/16 60,000 02/25/26 3.750% 62,254 63,002
CBRE Services - 12505BAD2 08/06/15 50,000 03/01/26 4.875% 49,620 52,123
Citigroup Inc - 172967KJ9 04/12/16 85,000 03/09/26 4.600% 87,646 90,777
HollyFrontier Corp - 436106AA6 03/22/16 30,000 04/01/26 5.875% 29,812 32,498
Loews Corp - 540424AS7 various 80,000 04/01/26 3.750% 83,946 84,974
American Intl Group - 026874DH7 03/22/16 85,000 04/01/26 3.900% 85,511 89,925
Hanover Ins Group - 410867AF2 04/08/16 50,000 04/15/26 4.500% 49,884 51,965
Amcor Fin USA Inc - 02343UAA3 04/28/16 35,000 04/28/26 3.625% 34,991 36,136
Avalonbay Communities - 05348EAX7 05/16/16 45,000 05/11/26 2.950% 45,324 44,967
Hanesbrands Inc - 410345AL6 05/03/16 14,000 05/15/26 4.875% 14,070 14,315
Goodyear Tire & Rubber - 382550BF7 05/13/16 10,000 05/31/26 5.000% 10,000 10,288
Aramark Services Inc - 038522AM0 various 20,000 06/01/26 4.750% 20,000 20,100
Priceline Group Inc - 741503AZ9 06/03/16 45,000 06/01/26 3.600% 45,236 47,182
Broadridge Finl Soln - 11133TAC7 06/27/16 40,000 06/15/26 3.400% 39,836 41,028
Voya Finl Inc - 929089AB6 06/13/16 50,000 06/15/26 3.650% 50,071 49,776
Under Armour - 904311AA5 06/14/16 100,000 06/15/26 3.250% 100,146 100,675
Sovran Acquisition - 84610WAB1 06/20/16 30,000 07/01/26 3.500% 29,834 30,616
Western Gas Partners - 958254AF1 07/12/16 31,000 07/01/26 4.650% 30,937 32,082
Enlink Midstream - 29336UAF4 07/11/16 25,000 07/15/26 4.850% 24,965 25,157
Morgan Stanley - 61761J3R8 07/27/16 45,000 07/27/26 3.125% 45,096 45,269
Caterpillar Financial - 14912L6T3 08/09/16 65,000 08/09/26 2.400% 64,994 64,526
Columbia Ppty Trust - 19828JAB4 08/12/16 50,000 08/15/26 3.650% 49,813 50,295
Bunge Ltd Fin - 120568AX8 08/17/16 85,000 08/15/26 3.250% 85,667 85,526
Fidelity Natl - 31620MAT3 08/16/16 20,000 08/15/26 3.000% 19,778 19,804
Amgen Inc - 031162CJ7 08/19/16 40,000 08/19/26 2.600% 39,976 39,231
Valero Energy Corp - 91913YAU4 09/12/16 50,000 09/15/26 3.400% 49,828 49,667
Valero Energy Corp - 91913YAU4 09/12/16 35,000 09/15/26 3.400% 34,879 34,767
Thermo Fisher Scientific - 883556BR2 09/19/16 30,000 09/19/26 2.950% 29,636 29,773
Crown Amers LLC - 22819KAA8 09/15/16 15,000 09/30/26 4.250% 15,075 15,019
CCL Industries Inc - 124900AB7 09/20/16 55,000 10/01/26 3.250% 54,729 55,205
Flowers Foods - 343498AB7 09/28/16 45,000 10/01/26 3.500% 44,866 44,902
Ingredion Inc - 457187AB8 09/22/16 75,000 10/01/26 3.200% 74,968 76,497
Kite Realty Group - 49803XAA1 09/26/16 45,000 10/01/26 4.000% 44,820 45,359
Teva Pharmaceutical - 88167AAE1 07/18/16 20,000 10/01/26 3.150% 19,947 20,093
Boston Properties - 10112RAY0 08/17/16 60,000 10/01/26 2.750% 59,642 59,103
Citigroup Inc - 172967JC6 01/15/15 50,000 11/20/26 4.300% 50,886 52,439
Morgan Stanley - 61761JZN2 08/01/16 45,000 04/23/27 3.950% 46,192 46,739
Wells Fargo & Co- 94974BGL8 07/16/15 70,000 07/22/27 4.300% 69,948 75,442
Citigroup Inc - 172967KA8 08/22/16 80,000 09/29/27 4.450% 84,086 83,718
JP Morgan Chase - 46625HNJ5 07/19/16 50,000 10/01/27 4.250% 53,621 53,647
Latam Airlines - 51817TAA0 05/14/15 60,000 11/15/27 4.200% 56,774 56,296
Kilroy Realty - 49427RAK8 01/15/15 55,000 08/15/29 4.250% 57,733 57,987
Toronto Dominion Bank - 891160MJ9 09/15/16 80,000 09/15/31 3.625% 79,837 80,221
Toronto Dominion Bank - 891160MJ9 09/15/16 85,000 09/15/31 3.625% 85,152 85,235
Genl Elec Cap Corp - 36962GXZ2 12/04/15 65,000 03/15/32 6.750% 86,028 91,348
Comcast Corp New B/E - 20030NBH3 12/23/15 20,000 01/15/33 4.250% 20,228 22,214
AT&T Inc - 00206RCP5 05/04/15 90,000 05/15/35 4.500% 82,872 94,562
Owens Corning New - 690742AB7 04/05/16 50,000 12/01/36 7.000% 55,903 63,119
Time Warner Cable - 88732JAJ7 various 45,000 05/01/37 6.550% 57,407 53,353
Pacificorp - 695114CN6 various 65,000 02/01/42 4.100% 65,251 71,254
Verizon Communications - 92343VBT0 10/08/14 56,000 09/15/43 6.550% 69,370 75,717
Phillips 66 - 718546AL8 07/18/16 80,000 11/15/44 4.875% 91,301 88,871
201

Table 13
Face Coupon Fair
Purchase Amount, Maturity Interest Value
Date or Shares Date Rate Cost 09/30/16
City of Columbia, Missouri
SCHEDULE OF MARKETABLE SECURITIES AND INVESTMENTS
SEPTEMBER 30, 2016
Identification Number and
Issuing Institution
Federal Realty Invs Trust - 313747AV9 03/16/15 50,000 12/01/44 4.500% 52,690 56,663
Lockheed Martin - 539830BD0 02/17/15 80,000 03/01/45 3.800% 77,461 81,541
Amgen Inc - 031162BZ2 08/19/16 95,000 05/01/45 4.400% 101,924 99,790
Sunoco Logistics - 86765BAQ2 05/02/16 10,000 05/15/45 5.350% 8,920 10,217
Goldman Sachs - 38148LAF3 05/19/15 25,000 05/22/45 5.150% 24,837 27,263
Celgene Corp - 151020AU8 07/11/16 50,000 08/15/45 5.000% 56,910 56,296
Anheuser Busch InBev Fin - 035242AN6 01/25/16 70,000 02/01/46 4.900% 69,835 83,285
Fedex Corp - 31428XBG0 07/08/16 25,000 04/01/46 4.550% 28,081 27,769
Lowes Cos Inc B/E - 548661DN4 04/20/16 90,000 04/15/46 3.700% 89,919 92,986
Shell Intl Fin B/E - 822582BQ4 05/10/16 25,000 05/10/46 4.000% 24,549 25,575
Shell Intl Fin - 822582BQ4 07/28/16 85,000 05/10/46 4.000% 88,089 86,955
Abbvie Inc - 00287YAW9 08/02/16 20,000 05/14/46 3.850% 21,414 20,888
Kraft Heinz Foods - 50077LAB2 05/24/16 50,000 06/01/46 4.375% 49,842 52,901
Tri-State Generation - 89566EAK4 05/23/16 50,000 06/01/46 4.250% 49,597 53,161
Aetna Inc - 00817YAX6 06/22/16 65,000 06/15/46 4.375% 66,622 68,065
Voya Finl Inc - 929089AC4 06/13/16 90,000 06/15/46 4.800% 90,457 89,808
Apple Inc B/E - 037833CD0 08/04/16 100,000 08/04/46 3.850% 103,302 102,276
Microsoft Corp - 594918BT0 08/08/16 90,000 08/08/46 3.700% 89,752 91,097
Verizon Communications - 92343VDC5 08/01/16 20,000 08/15/46 4.125% 19,989 20,006
Verizon Communications - 92343VCK8 various 55,000 08/21/46 4.862% 57,710 61,603
Duke Energy - 26441CAT2 08/12/16 20,000 09/01/46 3.750% 19,989 19,395
SBA Tower Trust - 78403DAH3 02/05/15 70,000 10/15/49 3.869% 73,150 72,197
Wells Fargo - 949746RN3 01/15/15 23,000 12/29/49 5.875% 23,056 24,955
New York & Presbyterian - 649322AD6 06/28/16 40,000 08/01/56 4.063% 39,998 43,110
Total Corporate Bonds $ 22,722,630 $ 22,802,346
Stock and Mutual Funds:
Common/Preferred Stock various 1,725,193 — — $ 59,424,872 $ 67,095,154
UBS Cash/Money Market Funds various 6,611,464 — — 6,611,464 6,611,464
PNC Small Cap Fund Class I - PPCIX various 199,415 — — 3,744,731 4,423,029
Total Stock and Mutual Funds $ 69,781,067 $ 78,129,647
U. S. Government and Agency Securities:FHLB Bond 3133XMQ87 various 1,000,000 11/17/17 5.000% 1,096,011 1,047,789
Freddie Mac Nts 3137EABP3 various 1,000,000 06/13/18 4.875% 1,197,638 1,068,139
US Tsy Note - 912828K82 various 125,000 08/15/18 1.000% 125,019 125,528
US Tsy Note - 912828T42 09/28/16 160,000 09/30/18 0.750% 160,006 160,062
US Tsy Note - 912828A34 10/10/14 445,000 11/30/18 1.250% 441,367 449,103
US Tsy Note - 912828P95 03/22/16 120,000 03/15/19 1.000% 119,828 120,460
Freddie Mac Nts 3137EACA5 various 1,100,000 03/27/19 3.750% 1,245,054 1,175,767
US Tsy Note - 912828C65 04/04/14 160,000 03/31/19 1.625% 159,187 163,043
US Tsy Note - 912828Q52 various 535,000 04/15/19 0.875% 533,887 535,353
US Tsy Note - 912828SX9 04/18/16 115,000 05/31/19 1.125% 115,737 115,853
US Tsy Note - 9128282B5 various 365,000 08/15/19 0.750% 363,582 363,730
US Tsy Note - 912828TN0 10/10/14 520,000 08/31/19 1.000% 503,953 521,664
US Tsy Note - 912828G61 12/15/14 210,000 11/30/19 1.500% 208,991 213,683
US Tsy Note - 912828UB4 10/23/15 220,000 11/30/19 1.000% 217,714 220,438
US Tsy Note - 912828J50 03/04/15 65,000 02/29/20 1.375% 64,345 65,851
US Tsy Note - 912828K58 various 80,000 04/30/20 1.375% 79,177 81,041
US Tsy Note - 912828XH8 07/07/15 60,000 06/30/20 1.625% 59,784 61,308
US Tsy Note - 912828XM7 various 250,000 07/31/20 1.625% 250,096 255,440
US Tsy Note - 912828L32 various 290,000 08/31/20 1.375% 288,339 293,558
US Tsy Note - 912828L65 10/23/15 155,000 09/30/20 1.375% 155,137 156,846
US Tsy Note - 912828P87 03/10/16 60,000 02/28/21 1.125% 59,170 60,038
US Tsy Note - 912828Q37 05/03/16 110,000 03/31/21 1.250% 109,798 110,575
US Tsy Note - 912828Q78 various 820,000 04/30/21 1.375% 828,253 828,584
Us Tsy Note - 912828R77 various 325,000 05/31/21 1.375% 327,230 328,517
US Tsy Note - 9128282F6 09/01/16 126,000 08/31/21 1.125% 125,807 125,871
US Tsy Note - 9128282F6 09/22/16 65,000 08/31/21 1.125% 64,761 64,934
US Tsy Note - 912828F21 10/14/14 500,000 09/30/21 2.250% 503,983 522,420
US Tsy Note - 912828M49 various 170,000 10/31/22 1.875% 173,506 175,386
US Tsy Note - 9128282D1 09/01/16 295,000 08/31/23 1.375% 293,790 294,080
United Mexican States - 91086QBC15 01/14/15 80,000 10/02/23 4.000% 83,880 85,480
US Tsy Note - 9128282A7 various 154,000 08/15/26 1.500% 152,305 152,502
Us Tsy Note - 9128282A7 various 60,000 08/15/26 1.500% 59,398 59,416
US Tsy Bond - 912810PW2 01/09/15 260,000 02/15/38 4.375% 351,802 362,658
US Tsy Bond - 912810QB7 03/21/16 175,000 05/15/39 4.250% 227,698 239,948
US Tsy Bond - 912810RD2 various 70,000 11/15/43 3.750% 74,462 91,104
US Tsy Bond - 912810RM2 various 185,000 05/15/45 3.000% 186,750 210,930
US Tsy Bond - 912810RQ3 various 70,000 02/15/46 2.500% 73,262 72,351
US Tsy Bond - 912810RS9 various 136,000 05/15/46 2.500% 142,612 140,760
US Tsy Bond - 912810RS9 08/23/16 150,000 05/15/46 2.500% 157,589 155,250
Total U. S. Government and Agency
Securities $ 11,380,908 $ 11,275,460
Asset-Backed SecuritiesGMALT 2015 - 38013GAC3 06/17/15 30,000 12/20/18 1.680% 29,998 30,135
FHLMC PL G11503 - 31283KU48 09/28/11 500,000 01/01/19 5.000% 23,420 14,587
GMALT - 36250UAD6 02/25/16 30,000 07/20/19 2.220% 29,999 30,172
WOLS 2016 - 98161FAD7 07/20/16 91,000 08/15/19 1.450% 90,989 91,384
AFIN 2015 - 13974LAC2 10/15/15 93,000 03/20/20 1.830% 92,980 93,548
AMOT 2015-3 - 02005AFL7 02/01/16 45,000 05/15/20 1.630% 44,944 45,193
GFORT 2015-1 - 361886AG9 02/01/16 100,000 05/15/20 2.220% 99,500 100,097
AMCAR 2014-4 D 03065JAG9 01/22/15 200,000 11/09/20 3.070% 201,641 203,532
AMCAR 2015 - 03065LAF6 05/12/15 90,000 01/08/21 2.400% 89,733 91,097
AMCAR 2015 - 03065NAF2 08/11/15 53,000 03/08/21 2.940% 52,999 54,074
Carmx 2015-2 - 143127AE8 01/13/16 33,000 03/15/21 2.150% 32,959 33,475
SDART 2015 1 - 80284CAG7 06/15/15 130,000 04/15/21 3.240% 130,589 132,945
SDART 2015 3 - 80284LAG7 01/26/16 175,000 05/17/21 3.510% 175,820 180,086
AMCAR 2015 - 03065LAG4 various 210,000 06/08/21 3.000% 210,864 213,725
AMCAR 2016-2 - 03066DAF3 04/14/16 25,000 11/08/21 2.870% 24,999 25,653
SDART 16-2 - 80285CAH4 05/11/16 30,000 11/15/21 2.660% 29,993 30,469
AMCAR 16-1 - 03065VAF4 01/21/16 27,000 01/10/22 2.890% 27,000 27,734
Amcar 2016 - 03065VAG2 07/14/16 180,000 02/08/22 3.590% 185,168 186,323
FREMF - 30292QAA4 05/14/15 52,000 02/25/22 3.669% 51,777 51,174
SDART 2016-1 C - 80285EAF4 02/17/16 46,000 04/15/22 3.230% 45,992 47,198
202

Table 13
Face Coupon Fair
Purchase Amount, Maturity Interest Value
Date or Shares Date Rate Cost 09/30/16
City of Columbia, Missouri
SCHEDULE OF MARKETABLE SECURITIES AND INVESTMENTS
SEPTEMBER 30, 2016
Identification Number and
Issuing Institution
AMCAR 2016 - 03065DAG2 08/11/16 325,000 09/08/22 2.710% 325,525 326,865
FNMA PL 889009 - 31410GVA8 10/18/11 600,000 01/01/23 5.000% 48,934 33,404
AFIN 2016-1 D - 13975NAG8 03/16/16 185,000 08/21/23 4.030% 185,000 192,557
FNR 2015 - 3136ANLH8 05/04/15 120,000 12/25/24 2.502% 118,500 122,740
FHLMC STACR - 3137GODT3 05/06/15 165,000 01/25/25 2.583% 133,739 132,010
WFNMT 2016 - 981464FK1 07/27/16 42,000 04/15/25 2.330% 41,993 42,073
US A1 2013-1 - 90346WAA1 01/15/15 100,000 05/15/27 3.950% 90,795 92,384
FNMA PL AO7976 - 3138LY2J5 11/19/12 180,000 06/01/27 3.000% 105,261 99,386
CRNN 2013 1A - 227170AE7 various 150,000 04/18/28 3.080% 98,836 95,851
FNMA CAS 2016-C02 - 30711XBZ6 06/22/16 25,000 09/25/28 2.596% 24,431 24,471
CAS 2016-C04 - 30711XCZ5 07/28/16 144,000 01/25/29 2.376% 142,653 143,520
Spirit Airlines - 84858DAA6 08/11/15 46,000 10/01/29 4.100% 46,100 45,327
SRFC - 82652DAA8 various 300,000 06/20/31 2.050% 87,903 90,525
Citi 2016 - 17325CAA3 09/26/16 100,000 09/10/31 2.228% 99,999 99,991
MVWOT 2015 - 55388PAA8 08/13/15 100,000 12/20/32 2.520% 74,099 72,475
FNMA - 31418AWD6 01/26/15 210,000 08/01/33 3.500% 152,709 150,519
BBCCR 2015 - 05490TAC6 08/20/15 113,000 08/10/33 4.216% 116,382 121,885
FHLMC - 3132LMBZ8 11/12/15 79,000 09/01/33 3.500% 61,142 60,991
FNMA - 3138WDKC4 02/10/15 686,393 11/01/34 4.000% 512,008 493,039
FHLMC - 3128P8AR2 03/12/15 104,000 03/01/35 3.500% 92,913 92,727
FHLMC - 3128P8AV3 03/12/15 104,000 03/01/35 3.500% 92,467 92,492
FHLMC - 3128P8A68 04/07/15 24,000 04/01/35 3.500% 22,402 22,379
BBCMS 2015-SRCH B - 05547HAJ0 12/15/15 100,000 08/10/35 4.498% 102,996 110,217
FHLMC G02882 - 3128M4RB1 11/14/11 1,000,000 04/01/37 5.500% 66,581 44,753
FNMA PL 954859 - 31413TJC7 09/13/12 370,000 11/01/37 6.000% 36,512 28,511
FHLMC PL G06685 - 3128M8XN9 10/03/11 201,434 03/01/39 6.500% 79,509 65,791
FNMA PL AD0242 - 31418MHU9 11/14/11 500,000 09/01/39 5.500% 74,199 56,264
FNMA PL 932639 - 31412REL7 10/25/11 400,000 03/01/40 5.000% 109,468 96,157
FNMA PL 890247 - 31410LBQ4 01/14/13 100,000 08/25/40 6.000% 21,375 17,622
FNMA PL AE4350 - 31419EZQ5 11/14/11 90,000 10/01/40 4.000% 46,993 46,876
GNMA PL 738246X - 3620ASET2 02/19/13 725,000 04/15/41 4.500% 148,475 124,793
FNMA PL AI1886 - 3138AFCY4 09/13/12 70,000 05/01/41 4.500% 29,563 26,265
FNMA PL AJ1696 - 3138AS3E0 03/12/12 130,000 09/01/41 4.000% 50,296 47,164
FHLMC PL Q03968 - 3132GKCD6 11/14/11 60,000 10/01/41 3.500% 37,062 38,342
FNMA PL AB3678 - 31417ACQ0 11/14/11 60,000 10/01/41 3.500% 37,040 38,193
FNMA PL MA0926 - 31418AA40 04/12/12 270,000 12/01/41 4.000% 48,873 42,014
FNMA - 3138Y63W2 various 460,000 01/01/42 4.000% 381,554 376,198
FNMA PL AJ9172 - 3138E2FN0 03/12/12 130,000 01/01/42 4.000% 60,977 57,981
GNMA PL 005333C - 36202F4S2 02/19/13 135,000 03/20/42 4.500% 47,002 41,164
FNMA PL AB5462 - 31417CB87 10/11/12 130,000 06/01/42 3.000% 89,102 84,836
FNMA PL AB6212 - 31417C3W3 10/11/12 90,000 09/01/42 3.000% 65,833 62,828
CSCM 2013 - 12646UAK4 06/17/13 140,000 03/25/43 3.000% 96,356 100,219
FNMA AB9345 - 31417GL38 11/13/14 425,000 05/01/43 3.000% 316,960 325,509
FNMA AB9558 - 31417GTQ9 10/22/14 425,000 06/01/43 3.000% 330,620 337,122
FHLMC Q20576 - 3132JMT90 11/13/14 425,000 08/01/43 3.000% 330,971 341,848
WBCMT 2007 - 92978QAH0 08/22/16 60,000 12/15/43 5.383% 60,806 60,536
DBUBS 2011 LC2 - 23305XAJ0 11/05/13 90,000 07/10/44 5.625% 91,048 94,827
FNMA - 3138WDAM3 10/22/15 241,000 10/01/44 3.500% 215,713 217,793
FNMA PL BC 5090 - 3140FOUQ5 04/13/16 33,000 10/01/44 4.000% 29,766 29,496
FNMA PL AS4370 - 3138WD2C4 07/14/15 150,000 02/01/45 4.000% 139,081 142,020
JPMBB 2013 - 46639NAN1 06/10/15 69,000 07/15/45 3.272% 71,833 72,257
FNMA PL - 3138EQKP6 12/10/15 55,000 10/01/45 3.500% 54,886 56,365
COMME 2012 - 12624QAE3 various 170,000 10/15/45 4.579% 160,003 166,274
FHLMC - 3132L7MC0 05/31/16 57,000 12/01/45 4.000% 53,808 53,843
FHLMC PL G08703 - 3128MJX96 07/14/16 114,000 04/01/46 4.000% 117,872 117,654
Taco Bell Funding LLC - 87342RAA2 05/11/16 75,000 05/25/46 3.823% 75,172 76,053
FHLMC PL Q41083 - 3132WEFZ0 06/24/16 191,000 06/01/46 3.000% 195,257 196,894
FNMA PL BC - 3140EVK71 08/26/16 94,000 07/01/46 3.000% 97,192 97,240
FHLMC PL - 31335AX86 09/14/16 125,000 09/01/46 4.000% 134,316 134,522
FNMA PL - 3138WHZ21 09/29/16 232,000 09/01/46 4.000% 255,781 254,913
JPMBB 2014 - 46641WBB2 03/18/15 150,000 04/15/47 4.678% 159,375 157,179
CSAIL 2015 - 12635FBA1 08/25/15 145,000 08/15/48 3.507% 114,069 108,589
JPMBB 2015 - 46644FAK7 06/24/15 175,000 10/15/48 4.382% 169,887 162,136
WFMC 2016 - 95000GBD5 08/18/16 50,000 08/15/49 2.967% 51,498 50,599
GSMS 2016 - 36251PAL8 09/30/16 55,000 10/10/49 4.000% 56,349 56,650
TPMT 2016 - 89172YAA8 07/29/16 100,000 08/25/55 2.250% 95,632 95,731
Total Asset-Backed Securities $ 9,352,816 $ 9,242,450
Total Police and Firefighters’ Investments $ 113,237,421 $ 121,449,903
Total Restricted/Unrestricted Marketable
Securities and Investments $ 415,693,975 $ 419,900,499
203

THIS PAGE INTENTIONALLY LEFT BLANK
204

Table 14
FEDERAL AND STATE GRANTS REVENUE
SEPTEMBER 30, 2016
Policy Development and Administration:
Convention & Tourism Grants 52,030$
Total Policy Development and Administration 52,030$
Public Safety:
Police 274,686
Fire 60,527
Total Public Safety 335,213
Transportation:
Planning 198,535
Street Construction 1,264,939
Non Motorized Transportation Projects 2,732,850
Airport 4,306,100
Public Transportation 2,316,024
Total Transportation 10,818,448
Health and Environment:
Health Department 1,500,120
CDBG/HOME 1,711,395
Solid Waste 146,712
Total Health and Environment 3,358,227
Personal Development:
Trails Grants 175,000
Non Motorized projects 429,602
Cultural Affairs 12,567
Parks & Recreation 68,089
Total Personal Development 685,258
Total Federal and State Grants Revenue 15,249,176$
City of Columbia, Missouri
205

Table 15
2007 2008 2009 2010
Agriculture, forestry, fishing $3,738,744 $3,703,641 $3,654,970 $4,034,939
Construction 5,309,423 6,605,135 6,189,123 8,391,340
Finance, insurance, real estate 1,129,272 1,230,495 1,601,141 1,731,830
Manufacturing 8,666,372 9,359,687 8,563,491 8,441,526
Public Administration 95,080,030 95,328,438 88,902,385 82,485,976
Retail Trade 1,450,439,128 1,451,308,614 1,422,599,321 1,442,787,676
Services 111,721,502 117,475,959 110,831,173 113,318,121
Transportation, communications, utilities 186,319,662 197,474,469 200,652,089 208,104,657
Unclassified Establishments 129,508,137 117,154,928 100,260,458 121,366,211
$1,991,912,270 $1,999,641,366 $1,943,254,151 $1,990,662,276
Source: State of Missouri Department of Revenue; numbers reported on cash basis
Report generated by Budgeting Staff via the Sales Tax Database
Note: Data subject to change as more precise numbers become available.
General 1.00% 1.00% 1.00% 1.00%
Transportation 0.50% 0.50% 0.50% 0.50%
Capital Improvement Plan 0.25% 0.25% 0.25% 0.25%
Parks 0.25% 0.25% 0.25% 0.25%
Total City Direct Sales Tax Rate 2.00% 2.00% 2.00% 2.00%
City Direct Sales Tax Rates
City of Columbia, Missouri
LAST TEN FISCAL YEARS
TAXABLE SALES BY CATEGORY
206

Table 15, cont
2011 2012 2013 2014 2015 2016
$4,295,651 $4,748,854 $5,188,990 $4,734,225 $4,668,042 $5,014,000
10,159,262 12,643,956 15,538,571 16,433,648 21,627,716 21,413,051
1,841,365 5,079,871 4,905,322 5,205,207 6,037,059 7,148,456
8,051,895 8,234,983 8,726,021 8,915,018 8,601,704 8,765,696
85,873,365 86,717,860 85,805,115 92,559,596 89,097,753 79,964,202
1,510,185,437 1,606,167,451 1,674,651,789 1,691,111,569 1,744,558,358 1,651,751,410
118,984,696 122,788,745 129,228,043 140,249,397 149,348,423 139,698,126
215,221,024 191,522,423 197,173,582 210,383,766 207,297,428 183,599,792
134,314,994 148,464,570 157,478,983 185,187,848 205,208,943 238,282,424
$2,088,927,689 $2,186,368,713 $2,278,696,416 $2,354,780,274 $2,436,445,426 $2,335,637,157
1.00% 1.00% 1.00% 1.00% 1.00% 1.00%
0.50% 0.50% 0.50% 0.50% 0.50% 0.50%
0.25% 0.25% 0.25% 0.25% 0.25% 0.25%
0.25% 0.25% 0.25% 0.25% 0.25% 0.25%
2.00% 2.00% 2.00% 2.00% 2.00% 2.00%
City Direct Sales Tax Rates, cont.
City of Columbia, Missouri
LAST TEN FISCAL YEARS
TAXABLE SALES BY CATEGORY
207

THIS PAGE INTENTIONALLY LEFT BLANK
208

Table 16
Fiscal Capital Notes and Special SpecialYear Lease Loans Obligation Obligation
Ended Obligations Payable Bonds Notes
2016 $ 10,132 $ 4,823,731 $ 19,249,375 $ 5,806,420
2015 34,133 5,594,844 24,291,421 7,009,780
2014 57,697 6,337,186 28,575,582 8,145,301
2013 106,198 7,051,261 32,656,417 9,215,859
2012 209,447 2,056,161 36,580,582 10,225,183
2011 - 40,339,747 11,175,289
2010 - - 43,948,910 995,000
2009 - - 46,693,075 1,950,000
2008 - - 49,102,240 2,865,000
2007 - - 24,412,957 3,740,000
PercentageFiscal Capital Special Water ofYear Lease Obligation & Electric Sewer Total Per Capita Per
Ended Obligations Bonds Bonds Bonds Government Personal Income a
Capita a
2016 $ 725,677 $ 91,569,509 $ 156,668,102 $ 94,350,720 $ 373,203,666 n/a % n/a
2015 797,893 96,831,150 162,612,216 99,367,324 396,538,761 5.36 % 3,329
2014 174,183 100,644,111 135,699,854 84,374,663 364,008,577 5.09 % 3,056
2013 197,639 93,821,039 140,617,441 88,772,182 372,438,036 5.32 % 3,117
2012 220,290 100,490,422 145,824,435 86,871,118 382,477,638 5.74 % 3,318
2011 242,163 93,208,599 151,238,623 56,589,896 352,794,317 5.37 % 3,138
2010 - 94,857,956 82,023,648 33,207,073 255,032,587 4.05 % 2,293
2009 - 96,437,311 86,066,307 28,357,275 259,503,968 4.31 % 2,624
2008 - 84,885,220 73,322,485 19,292,241 229,467,186 4.16 % 2,356
2007 - 64,705,863 77,104,088 18,684,800 188,647,708 3.57 % 1,963
n/a = information not available for current year
Business-Type Activities
City of Columbia, Missouri
RATIOS OF OUTSTANDING DEBT BY TYPELAST TEN FISCAL YEARS
Governmental Activities
a See Table 24 for personal income and population
data
209

THIS PAGE INTENTIONALLY LEFT BLANK
210

Table 17
DIRECT AND OVERLAPPING GOVERNMENTAL ACTIVITIES DEBTSEPTEMBER 30, 2016
Amount Percentage AmountAvailable Applicable to Applicable to
Bond Issues Debt Service Net Debt City of City ofJurisdiction Outstanding Funds Outstanding Columbia (a) Columbia
City of Columbia $0 $0 $0 0.0% $0
Columbia School District 326,032,000 42,123,566 283,908,434 83.4% 236,761,097
Boone County 18,486,646 533,022 17,953,624 72.6% 13,042,375
Totals $344,518,646 $42,656,588 $301,862,058 $249,803,472
Source: Assessed value data used to estimate applicable percentages provided by the Boone County Collectors Office. Debt outstanding
data provided by each governmental unit.
Note: Overlapping governments are those that coincide, at least in part, with the geographic boundaries of the City. This schedule
estimates the portion of the outstanding debt of those overlapping governments that is borne by the residents and businesses of the City.
This process recognized that, when considering the City's ability to issue and repay long-term debt, the entire debt burden borne by the
residents and businesses should be taken into account. However, this does not imply that every taxpayer is a resident, and therefore
responsible for repaying the debt, of each overlapping government.
(a) For debt repaid with property taxes, the percentage of overlapping debt applicable is estimated using taxable assessed property values.
Applicable percentages were estimated by determining the portion of another governmental unit's taxable assessed value that is within the
City's boundaries and dividing it by each unit's total taxable assessed value.
City of Columbia, Missouri
211

Table 18
$1,928,971,776 *Assessed value (2015)
Constitutional debt limit ** $385,794,355
(20% assessed value)
Total bonded debt $246,047,700
Less:Water and Electric Utility Bonds $152,920,000Sanitary Sewer Utility Bonds 93,127,700 246,047,700
Total amount of debtapplicable to debt limit 0
Legal debt margin $385,794,355
2007 2008 2009 2010
Debt limit $312,992,986 $324,507,278 $328,051,141 $329,972,141
Total net debt applicable to limit $0 $0 $0 $0
Legal debt margin $312,992,986 $324,507,278 $328,051,141 $329,972,141
Total net debt applicable to the limit as a percentage of debt limit 0.00% 0.00% 0.00% 0.00%
City of Columbia, Missouri
Fiscal Year
LEGAL DEBT MARGIN INFORMATIONLAST TEN FISCAL YEARS
All tangible property.
Section 95.115 of the 1978 Missouri Revised Statutes permits any county or city, by vote of two-thirds of qualified
electors voting thereon, to incur additional indebtedness for city purposes not to exceed 5 percent of the taxable
tangible property therein, as shown by the last assessment.
Section 95.120 of the 1978 Missouri Revised Statutes permits any county or city, by a vote of two-thirds of qualified
electors voting thereon, to incur additional indebtedness for city purposes not to exceed 5 percent of the taxable
tangible property therein, as shown by the last assessment.
Sections 95.125 and 95.130 of the 1978 Missouri Revised Statutes provide that any city may become indebted not
exceeding in the aggregate an additional 10 percent for the purpose of acquiring right-of-ways, constructing, extending,
and improving streets and avenues and/or sanitary or storm sewer system, and an additional 10 percent for purchasing
or construction of waterworks, electric, or other light plants, provided the total general obligation indebtedness of the
city does not exceed 20 percent of the assessed valuation.
* **
212

Table 18, cont.
2011 2012 2013 2014 2015 2016
$334,950,607 $342,349,711 $348,567,093 $360,946,391 $373,258,227 $385,794,355
$0 $0 $0 $0 $0 $0
$334,950,607 $342,349,711 $348,567,093 $360,946,391 $373,258,227 $385,794,355
0.00% 0.00% 0.00% 0.00% 0.00% 0.00%
City of Columbia, Missouri
Fiscal Year
LEGAL DEBT MARGIN INFORMATIONLAST TEN FISCAL YEARS
213

Table 19
WATER AND ELECTRIC UTILITY REVENUE BOND COVERAGE (a)LAST TEN FISCAL YEARS
Fiscal RevenueYear Operating Operating Net Bond
Ended Revenue (d) Expenses Revenue Principal Interest (b) Total Coverage
2007 $ 116,758,098 $ 84,055,177 $ 32,702,921 $ 3,595,000 $ 4,332,137 $ 7,927,137 4.13
2008 121,609,839 90,723,595 30,886,244 3,755,000 5,079,238 8,834,238 3.50
2009 132,415,953 99,094,026 33,321,927 3,875,000 6,125,758 10,000,758 3.33
2010 142,829,724 104,960,352 37,869,372 4,020,000 6,206,577 10,226,577 3.70
2011 151,526,817 107,813,998 43,712,819 4,175,000 6,354,157 10,529,157 4.15
2012 147,075,417 100,038,432 47,036,985 5,360,000 8,714,110 14,074,110 3.34
2013 146,188,407 111,187,318 35,001,089 6,545,000 8,501,203 15,046,203 2.33
2014 152,473,820 116,235,925 36,237,895 6,665,000 7,798,291 14,463,291 2.51
2015 152,500,629 110,335,849 42,164,780 6,745,000 7,174,035 13,919,035 3.03
2016 159,378,641 112,365,801 47,012,840 7,668,750 7,415,763 15,084,513 3.12
WATER AND ELECTRIC UTILITY REVENUE / REFUNDING BONDS (c)
City of Columbia, Missouri
(a) Revenue bonds and their related interest are payable solely from the revenues derived from the operation of the
enterprise owned by the City. The taxing power of the City is not pledged to secure payment of the bonds and
interest.
(b) Interest payments made in the fiscal year.
(c) This includes Special Obligation Bonds, Series 2012D and 2012E, which are to be treated as a water and electric utility revenue
bond issue.
(d) Includes investment and miscellaneous revenue in fiscal year 2009 and thereafter.
214
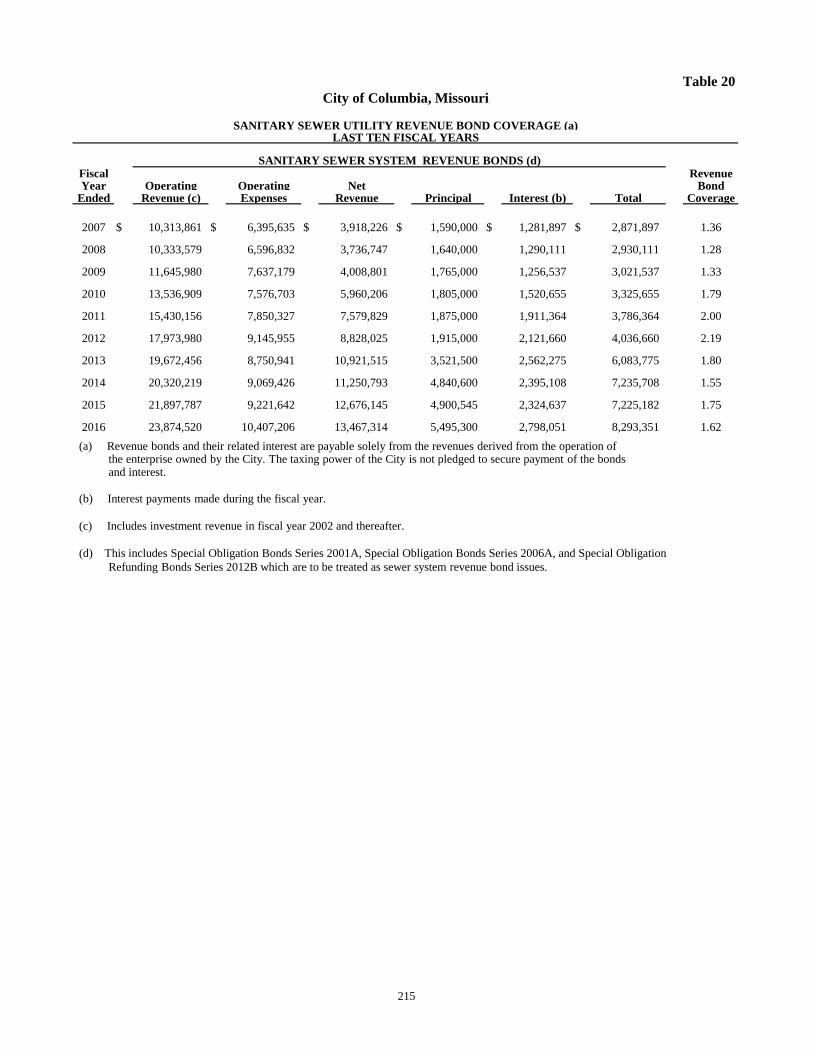
Table 20
SANITARY SEWER UTILITY REVENUE BOND COVERAGE (a)LAST TEN FISCAL YEARS
Fiscal RevenueYear Operating Operating Net Bond
Ended Revenue (c) Expenses Revenue Principal Interest (b) Total Coverage
2007 $ 10,313,861 $ 6,395,635 $ 3,918,226 $ 1,590,000 $ 1,281,897 $ 2,871,897 1.36
2008 10,333,579 6,596,832 3,736,747 1,640,000 1,290,111 2,930,111 1.28
2009 11,645,980 7,637,179 4,008,801 1,765,000 1,256,537 3,021,537 1.33
2010 13,536,909 7,576,703 5,960,206 1,805,000 1,520,655 3,325,655 1.79
2011 15,430,156 7,850,327 7,579,829 1,875,000 1,911,364 3,786,364 2.00
2012 17,973,980 9,145,955 8,828,025 1,915,000 2,121,660 4,036,660 2.19
2013 19,672,456 8,750,941 10,921,515 3,521,500 2,562,275 6,083,775 1.80
2014 20,320,219 9,069,426 11,250,793 4,840,600 2,395,108 7,235,708 1.55
2015 21,897,787 9,221,642 12,676,145 4,900,545 2,324,637 7,225,182 1.75
2016 23,874,520 10,407,206 13,467,314 5,495,300 2,798,051 8,293,351 1.62
SANITARY SEWER SYSTEM REVENUE BONDS (d)
City of Columbia, Missouri
(a) Revenue bonds and their related interest are payable solely from the revenues derived from the operation of the enterprise owned by the City. The taxing power of the City is not pledged to secure payment of the bonds and interest.
(b) Interest payments made during the fiscal year.
(c) Includes investment revenue in fiscal year 2002 and thereafter.
(d) This includes Special Obligation Bonds Series 2001A, Special Obligation Bonds Series 2006A, and Special Obligation
Refunding Bonds Series 2012B which are to be treated as sewer system revenue bond issues.
215

THIS PAGE INTENTIONALLY LEFT BLANK
216

Table 21
PROPERTY VALUE, CONSTRUCTION, AND BANK DEPOSITSLAST TEN FISCAL YEARS
Commercial Construction (a) Residential Construction (a) BankFiscal Number Number Deposits EstimatedYear of Permits Value of Permits Value (in thousands) Property Value
2007 68 89,104,177 730 126,755,467 2,430,000 (b) 6,141,975,733
2008 58 51,336,697 408 69,590,716 2,487,000 (b) 6,548,424,667
2009 42 90,871,538 355 55,436,649 2,702,000 (b) 6,785,163,254
2010 32 15,776,890 374 69,360,630 2,890,000 (b) 6,830,813,429
2011 33 20,508,272 424 112,250,462 3,005,000 (b) 6,899,642,329
2012 34 64,741,303 411 94,993,740 3,174,000 (b) 7,013,851,058
2013 42 55,728,531 953 214,609,987 3,108,000 (b) 7,172,767,546
2014 36 59,173,040 577 209,135,925 3,239,000 (b) 7,299,460,971
2015 48 38,720,198 493 157,889,702 3,464,000 (b) 7,557,017,121
2016 64 71,368,438 611 242,584,577 3,937,000 (b) 7,811,966,267
(a) Source: City of Columbia Public Works Department.(b) Source: FDIC Summary of Deposits
City of Columbia, Missouri
217
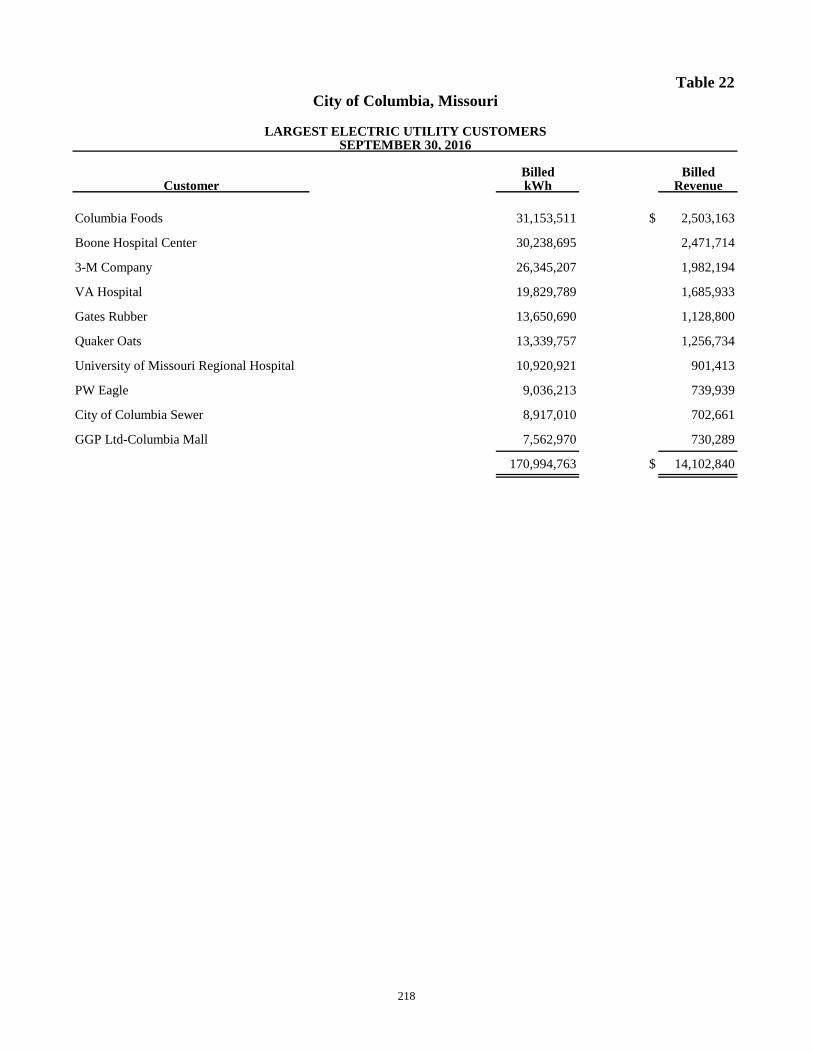
Table 22
LARGEST ELECTRIC UTILITY CUSTOMERSSEPTEMBER 30, 2016
Billed BilledCustomer kWh Revenue
Columbia Foods 31,153,511 $ 2,503,163
Boone Hospital Center 30,238,695 2,471,714
3-M Company 26,345,207 1,982,194
VA Hospital 19,829,789 1,685,933
Gates Rubber 13,650,690 1,128,800
Quaker Oats 13,339,757 1,256,734
University of Missouri Regional Hospital 10,920,921 901,413
PW Eagle 9,036,213 739,939
City of Columbia Sewer 8,917,010 702,661
GGP Ltd-Columbia Mall 7,562,970 730,289
170,994,763 $ 14,102,840
City of Columbia, Missouri
218

Table 23
Billed BilledCustomer CCF Revenue
Columbia Foods 359,918 $ 920,458
Boone Hospital Center 51,903 151,799
3M Company 49,208 125,956
JM Eagle 41,147 118,018
VA Hospital 32,759 96,261
Linen King 24,615 65,028
Best Men LLC 24,318 78,931
University of MO 23,383 63,320
State Farm Insurance 21,364 73,685
Executive Center 15,700 49,550
644,315 $ 1,743,005
City of Columbia, Missouri
LARGEST WATER UTILITY CUSTOMERSSEPTEMBER 30, 2016
219

Table 24
Fiscal Estimated Personal Per Capita Median Unemployment
Year Population*
Income a
Personal Incomea
Age Rate
2015 119,108e
$7,401,758b
$42,302b
26.6d
2.8%c
2014 119,476c
7,153,637 41,418 26.6 3.5%
2013 115,276 7,006,491 41,028 26.9 3.7%
2012 112,414 6,667,000 39,557 29.8 4.7%
2011 111,213 6,567,000 37,350 26.5 5.9%
2010 98,893 6,293,000 35,875 26.5 6.2%
2009 97,403 6,025,000 36,241 28.2 5.1%
2008 96,093 5,521,000 33,604 31.8 4.4%
2007 94,645 5,283,000 32,548 28.1 3.6%
2006 93,219 5,087,000 32,608 29.7 3.3%
*Based on updated census population data
aColumbia is reported as a Metropolitan Statistical Area (MSA) which includes Boone and Howard Counties
Source: US Department of Commerce, Bureau of Economic Analysis.
bBureau of Economic Analysis preliminary information
cCity of Columbia Annual Budget adopted October 1, 2016
dUS Census American Community Survey (ACS) 1 year estimate 2014
City of Columbia, Missouri
DEMOGRAPHIC STATISTICSLAST TEN FISCAL YEARS
220

Table 25
Number of Percentage Number of Percentage
Full time, benefited of Total City Full time, benefited of Total City
Employer Employees Rank Employment** Employees Rank Employment**
University of Missouri - Columbia 8,740 1 9.03% 8,640 1 9.61%
University Hospital and Clinics 4,502 2 4.65% 4,371 2 4.86%
Columbia Public Schools 2,524 3 2.61% 2,150 3 2.39%
Boone Hospital Center 2,000 4 2.07% 1,610 4 1.79%
Veterans United Home Loans 1,442 5 1.49% n/a n/a n/a
Truman Veterans Hospital 1,400 6 1.45% 985 9 1.10%
City of Columbia 1,360 7 1.41% 1,220 5 1.36%
Shelter Insurance 1,128 8 1.17% 1,006 8 1.12%
MBS Textbook Exchange 851 9 0.88% 1,086 7 1.21%
State Farm 850 10 0.88% 1,095 6 1.22%
US Government n/a n/a n/a 731 10 0.81%
Note: Information from Columbia Regional Economic Development Inc.
**information from the US Bureau of Labor Statistics-2015 annual
2016
City of Columbia, Missouri
PRINCIPAL EMPLOYERSCURRENT AND NINE YEARS AGO
2007
221

Table 26
2016 2015 2014 2013 2012 2011 2010 2009 2008 2007
Function/Program
Governmental Activities
General Administrative
City Clerk and Elections 3.00 3.00 3.00 3.00 3.00 3.00 3.00 2.00 2.00 2.00
City Manager 11.50 11.30 11.30 10.00 7.00 7.00 8.00 9.00 8.00 8.00
Finance (incl. Risk Management) 55.40 51.35 48.20 46.20 47.00 42.25 41.25 41.25 40.25 36.25
Human Resources 9.16 8.95 8.85 8.85 8.85 9.00 9.00 9.00 9.00 8.00
Law 16.75 15.50 15.50 14.75 12.00 12.50 13.50 9.00 10.00 9.00
Public Works Administration 1.30 2.10 - - - - - - - -
*Neighborhood Services - - - - - - - 2.25 2.25 2.25
Convention & Tourism 9.25 8.25 8.25 8.00 8.00 9.00 9.00 9.00 9.00 7.00
Public Safety
Police 200.00 197.00 194.00 191.00 191.00 192.00 191.00 190.00 186.00 183.00
Fire 145.00 141.00 140.00 141.00 136.00 136.00 140.00 140.00 138.00 135.00
Municipal Court 12.00 12.00 12.00 12.00 12.00 12.00 13.00 9.00 9.00 8.90
Emergency Mgmt & Comm 0.00 0.00 27.75 34.75 34.75 35.75 33.75 32.75 32.75 32.75
Health & Environment
Health and Human Services 69.00 66.15 64.60 62.25 62.00 62.35 62.35 63.35 61.10 60.75
*Planning (incl. CDBG) - - - - - - - 12.50 12.50 12.00
*Community Development 46.25 46.00 41.75 39.50 40.00 41.58 34.00 0.00 0.00 0.00
Economic Development 3.00 3.00 3.00 3.00 3.00 3.00 3.00 3.00 4.00 4.00
Mid Mo Solid Waste Mgt Dist 2.00 - - - - - - - - -
Cultural Affairs 3.00 3.00 3.00 3.00 3.00 2.75 2.75 2.75 2.75 2.75
Parks & Recreation 47.41 48.16 47.50 46.50 47.50 43.50 43.50 43.50 43.50 42.50
Public Works
Admin & Engineering - - 17.92 17.51 22.10 23.85 33.15 30.30 28.74 28.74
Non-Motorized Grants 4.80 5.10 4.90 4.95 2.35 1.10 2.00 2.00 2.00 -
Streets and Engineering 51.90 51.46 - - - - - - - -
Streets & Sidewalks - - 40.81 40.92 40.35 39.35 39.30 40.30 39.50 39.50
Parking Enforcement 13.10 12.01 5.01 4.02 4.00 4.00 4.00 4.00 4.00 4.00
*Building and Site Development - - - - - - - 17.75 16.75 16.75
Custodial & Maintenance 17.57 16.56 16.39 16.43 16.00 16.25 13.25 13.25 10.50 10.50
Fleet Operations 38.23 38.43 37.43 33.51 31.50 31.45 28.40 28.40 25.55 25.90
GIS Fund 6.26 5.31 5.31 4.40 4.50 3.50 - - - -
Employee Benefit 6.84 7.05 6.15 6.15 5.15 4.00 4.00 4.00 3.00 3.00
Information Technology 35.20 34.20 32.20 32.00 28.00 27.00 28.00 26.00 25.00 24.00
Public Communications 18.50 14.40 13.40 10.90 8.75 10.75 10.75 11.75 11.75 11.75
Office of Sustainability 0.00 0.00 0.00 1.00 1.25 1.00 1.00 - - -
Business-Type Activities
Railroad 3.00 3.00 4.00 4.00 4.00 4.00 4.00 5.00 5.00 5.00
Transload 3.00 3.00 3.00 3.00 0.00 0.00 0.00 0.00 0.00 0.00
Water & Electric 286.29 282.75 271.75 266.75 259.60 252.60 249.60 246.60 239.60 238.60
Recreation Services 33.34 34.59 34.25 34.25 34.25 34.25 34.25 36.25 36.25 36.25
Public Works
Public Transportation 51.95 52.36 41.36 40.67 39.20 37.80 37.75 37.75 38.80 34.79
Airport 18.65 18.15 17.15 17.40 17.25 17.20 17.20 17.20 16.20 16.20
Sanitary Sewer 86.42 83.02 80.52 81.39 80.35 76.97 73.10 64.47 61.87 58.87
Parking Facilities 9.45 9.57 9.27 9.29 7.85 7.85 6.80 6.80 5.70 5.70
Solid Waste 109.27 106.21 94.71 93.02 92.90 87.95 85.90 84.73 84.68 83.68
Stormwater Utility 8.41 8.47 6.47 6.49 6.40 6.40 6.40 11.55 12.46 12.46
Utility Customer Services 18.20 15.40 14.30 14.30 14.00 12.00 12.00 12.00 12.00 12.00
Total 1,454.40 1,417.80 1,385.00 1,366.15 1,334.85 1,310.95 1,297.95 1,278.45 1,249.45 1,221.84
Note: Information from City of Columbia Annual Budget adopted October 1, 2016
*Community Development department includes:
Planning
Volunteer Services
Neighborhood Programs
Building and Site Development
CDBG
FULL-TIME EQUIVALENT CITY GOVERNMENT EMPLOYEES BY FUNCTION/PROGRAMLAST TEN FISCAL YEARS
City of Columbia, Missouri
Full-time Equivalent Employees as of September 30
222
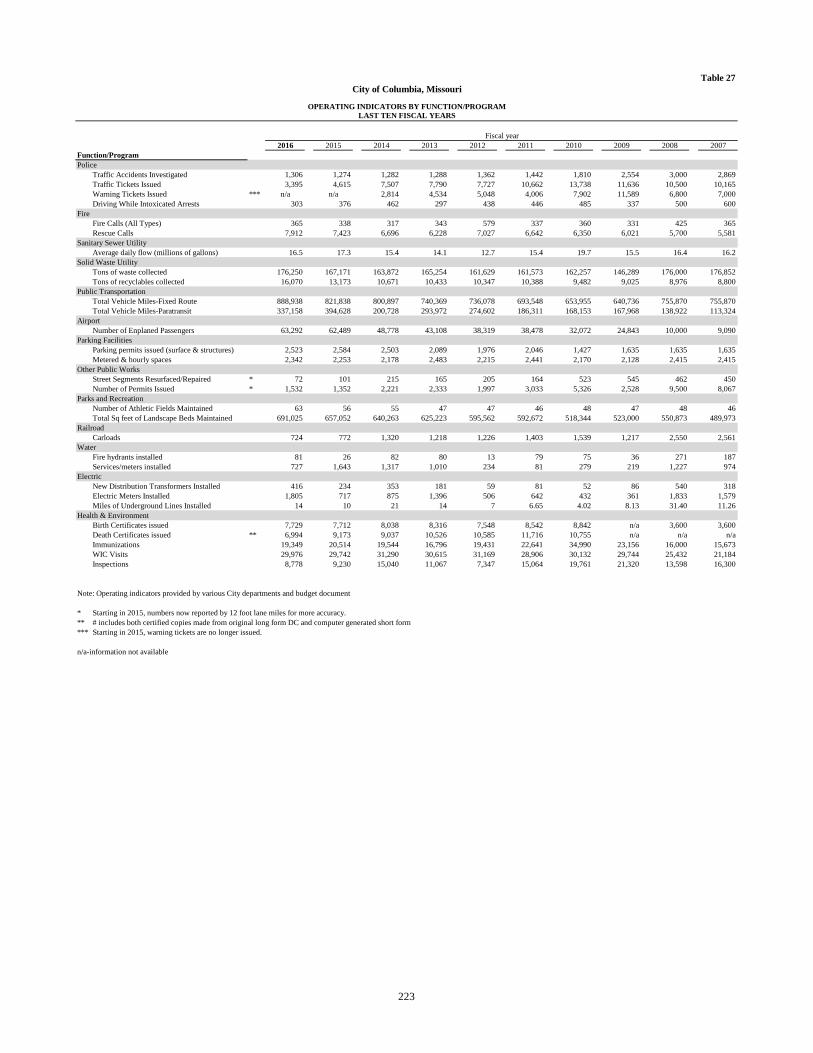
Table 27
2016 2015 2014 2013 2012 2011 2010 2009 2008 2007
Function/Program
Police
Traffic Accidents Investigated 1,306 1,274 1,282 1,288 1,362 1,442 1,810 2,554 3,000 2,869
Traffic Tickets Issued 3,395 4,615 7,507 7,790 7,727 10,662 13,738 11,636 10,500 10,165
Warning Tickets Issued *** n/a n/a 2,814 4,534 5,048 4,006 7,902 11,589 6,800 7,000
Driving While Intoxicated Arrests 303 376 462 297 438 446 485 337 500 600
Fire
Fire Calls (All Types) 365 338 317 343 579 337 360 331 425 365
Rescue Calls 7,912 7,423 6,696 6,228 7,027 6,642 6,350 6,021 5,700 5,581
Sanitary Sewer Utility
Average daily flow (millions of gallons) 16.5 17.3 15.4 14.1 12.7 15.4 19.7 15.5 16.4 16.2
Solid Waste Utility
Tons of waste collected 176,250 167,171 163,872 165,254 161,629 161,573 162,257 146,289 176,000 176,852
Tons of recyclables collected 16,070 13,173 10,671 10,433 10,347 10,388 9,482 9,025 8,976 8,800
Public Transportation
Total Vehicle Miles-Fixed Route 888,938 821,838 800,897 740,369 736,078 693,548 653,955 640,736 755,870 755,870
Total Vehicle Miles-Paratransit 337,158 394,628 200,728 293,972 274,602 186,311 168,153 167,968 138,922 113,324
Airport
Number of Enplaned Passengers 63,292 62,489 48,778 43,108 38,319 38,478 32,072 24,843 10,000 9,090
Parking Facilities
Parking permits issued (surface & structures) 2,523 2,584 2,503 2,089 1,976 2,046 1,427 1,635 1,635 1,635
Metered & hourly spaces 2,342 2,253 2,178 2,483 2,215 2,441 2,170 2,128 2,415 2,415
Other Public Works
Street Segments Resurfaced/Repaired * 72 101 215 165 205 164 523 545 462 450
Number of Permits Issued * 1,532 1,352 2,221 2,333 1,997 3,033 5,326 2,528 9,500 8,067
Parks and Recreation
Number of Athletic Fields Maintained 63 56 55 47 47 46 48 47 48 46
Total Sq feet of Landscape Beds Maintained 691,025 657,052 640,263 625,223 595,562 592,672 518,344 523,000 550,873 489,973
Railroad
Carloads 724 772 1,320 1,218 1,226 1,403 1,539 1,217 2,550 2,561
Water
Fire hydrants installed 81 26 82 80 13 79 75 36 271 187
Services/meters installed 727 1,643 1,317 1,010 234 81 279 219 1,227 974
Electric
New Distribution Transformers Installed 416 234 353 181 59 81 52 86 540 318
Electric Meters Installed 1,805 717 875 1,396 506 642 432 361 1,833 1,579
Miles of Underground Lines Installed 14 10 21 14 7 6.65 4.02 8.13 31.40 11.26
Health & Environment
Birth Certificates issued 7,729 7,712 8,038 8,316 7,548 8,542 8,842 n/a 3,600 3,600
Death Certificates issued ** 6,994 9,173 9,037 10,526 10,585 11,716 10,755 n/a n/a n/a
Immunizations 19,349 20,514 19,544 16,796 19,431 22,641 34,990 23,156 16,000 15,673
WIC Visits 29,976 29,742 31,290 30,615 31,169 28,906 30,132 29,744 25,432 21,184
Inspections 8,778 9,230 15,040 11,067 7,347 15,064 19,761 21,320 13,598 16,300
Note: Operating indicators provided by various City departments and budget document
* Starting in 2015, numbers now reported by 12 foot lane miles for more accuracy.
** # includes both certified copies made from original long form DC and computer generated short form
*** Starting in 2015, warning tickets are no longer issued.
n/a-information not available
City of Columbia, Missouri
OPERATING INDICATORS BY FUNCTION/PROGRAM
LAST TEN FISCAL YEARS
Fiscal year
223

THIS PAGE INTENTIONALLY LEFT BLANK
224

Table 28
2016 2015 2014 2013 2012 2011 2010 2009 2008 2007
Function/Program
Police
Stations 1 1 1 1 1 1 1 1 1 1
Substations 5 5 5 4 4 4 4 7 7 7
Vehicles 106 107 100 97 97 98 111 103 103 101
Fire
Stations 9 9 9 9 9 9 9 8 8 8
Vehicles 38 38 38 38 38 38 39 40 34 34
Sanitary Sewer Utility
Collection system (total miles) 714 707 697 695 698 684 683 665 637 607
Solid Waste Utility
Collection vehicles 50 48 45 45 45 44 44 44 44 44
Public Transportation
Buses-General Fixed Route 19 11 19 25 25 21 17 19 14 13
Buses-Campus Fixed Route 12 17 11 9 9 9 13 10 15 10
Buses-Paratransit 8 8 17 11 11 12 11 9 9 7
Airport
Pavement Surface (Square yards) 473,449 473,449 470,949 468,020 464,950 464,950 464,950 464,950 464,950 464,950
Parking Facilities
Parking Structures 6 6 6 6 5 5 4 4 4 4
Surface Lots-Permit 5 5 5 4 5 6 7 7 4 7
Surface Lots-Meter 4 5 5 5 4 4 5 7 5 2
Other Public Works
* Streets (miles) 1,339 1,338 551 515 507 507 465 465 425 425
Signalized Intersections 47 47 47 45 43 42 39 40 37 37
Parks and Recreation
Pools 5 5 5 5 5 5 5 5 5 5
Golf Courses (18 hole) 2 2 2 2 2 2 2 2 2 2
Athletic fields with lights and/or irrigation systems 44 41 40 35 33 32 30 25 25 25
Rec/Nature Centers 2 2 2 2 2 2 2 2 1 1
Railroad
Locomotives 2 2 2 2 2 2 2 2 2 2
Miles of main track 21 21 21 21 21 21.3 21.31 21.34 21.34 21.34
Water
Water mains (miles) 700 695 689 682 671 668.57 664.25 662 648.7 635.44
Electric
Circuit Miles of Distribution Lines 848 836 827 808 796 791.26 787.7 782 751.64 722
Note: Asset information provided by various City departments and budget document
* Starting in 2015, numbers now reported by 12 foot lane miles for more accuracy.
LAST TEN FISCAL YEARSCAPITAL ASSET STATISTICS BY FUNCTION/PROGRAM
City of Columbia, Missouri
Fiscal year
225

Table 29
City of Columbia - Property/Casualty Insurance Program
Policy Period - October 1, 2015 to October 1, 2016
I. Property/Inland Marine/Boiler and Machinery Coverages
A. Insurance Provider – Factory Mutual Insurance Company (FM Global)
B. Best’s Rating is A+ XV and Admitted in Missouri
C. Policy # – 1005120
D. Annual Premium is $793,936, plus $29,093 TRIA Premium - Total Premium is $823,029, less $86,340 membership credit.
E. Coverages and Limits:
1. $550,000,000 Blanket Property Limit excess $100,000 Retention
a. Power Plant Retention - $250,000
b. Columbia Energy Center Retention - $525,000
2. Earth Movement - $100,000,000 Aggregate Limit excess $100,000 Retention; $5,000,000 for Vehicles and Mobile Equipment
3. Flood - $100,000,000 Aggregate Limit excess $100,000 Retention (excludes Zones A, B, and V);
a. $500,000 Retention for locations 0002-WWTP, 0017-Hinkson Creek Substations, 0105-Production Wells #1-15
and 0127 Wetlands Effluent Pump Station
b. $5,000,000 Limit for Vehicles and Mobile Equipment
c. $1,000,000 Limit for Infrastructure property
4. Debris Removal - $5,000,000 Limit or 25% of the loss, whichever is greater, excess $100,000 Retention
5. Licensed Vehicles (Including Mobile Equipment) - $10,000,000 Limit excess $100,000 Retention (while on premises);
Flood and earthquake limit is $5,000,000
6. EDP Equipment and Media - $10,000,000 Limit excess $100,000 Retention
7. Extra Expense - $5,000,000 Limit excess $100,000 Retention
8. Newly Acquired Property - $10,000,000 Limit excess $100,000 Retention
9. Includes Boiler and Machinery Coverages
10. Infrastructure property - $5,000,000 not to exceed $2,000,000 for bridges
II. Excess Workers' Compensation
A. Insurance Company-Safety National Casualty Corporation
B. Best's Rating is A+ XIII and Admitted in Missouri
C. Policy # - SP4053824
D. Annual Premium is $302,935
E. Work Comp-Statutory Limits
F. Employers Liability Limit - $1,000,000
G. $500,000 Self-Insured Retention, except $750,000 SIR for Police, Fire and Electrical Workers
III. Package Liability Program
A. Insurance Provider - States Risk Retention Group
B. Administered by Berkley Risk - W.R. Berkley and admitted in Missouri
C. Policy # - SEL 3017804
D. Annual Premium is $237,682
E. Coverages and Limits:
1. $3,000,000 Public Entity (Coverage A) limit of liability for any one occurrence covered under the policy
2. $3,000,000 Management Practices Liability (Coverage B) for any one occurrence covered under the policy
3. $10,000,000 maximum limit of liability (A and B) for damages for all occurrences covered under this policy
4. Self-insurance retention of $500,000 per occurrence applicable to Coverage A and B.
F. Coverages include General Liability, Public Officials Liability, Police Professional Liability,
Products/Completed Operations Liability, Employment Practices Liability, Sexual Abuse Liability,
Employee Benefits Liability, and Automobile Liability.
IV. Crime Coverages
A. Insurance Company – National Union Fire Ins Co of Pittsburgh, PA (AIG)
B. Best’s Rating is A XV and Admitted in Missouri
C. Policy # – 018198538
D. Annual Premium is $6,241
E. Coverages include:
1. Employee Dishonesty (Theft) - $500,000 Limit
2. Forgery or Alteration - $500,000 Limit
3. Inside the Premises - Theft of Money and Securities - $500,000 Limit
4. Inside the Premises - Robbery or Safe Burglary of Other Property - $500,000 Limit
5. Computer Fraud - $500,000 Limit
6. Fund Transfer Fraud (including Impersonation Fraud) - $500,000 limit
7. Money Orders and Counterfeit Fraud - $500,000 Limit
8 Credit, Debit or Charge Card Fraud- $500,000 Limit
F. Deductible: $25,000
City of Columbia, Missouri
INSURANCE IN FORCE
SEPTEMBER 30, 2016
226

Table 29, cont.
V. Aviation Ground Operations Liability
A. Insurance Company – Global Aerospace, Inc.
B. Best's Rating MGU/Pooled Carriers and Admitted in Missouri
C. Policy # – 14001082
D. Annual Premium is $10,000 (includes TRIA)
E. Coverages include:
1. General Liability - $10,000,000 Limit Each Occurrence
2. Products/Completed Operations - $10,000,000 Aggregate Limit
3. Personal and Advertising Injury - $10,000,000 Aggregate Limit
4. Personal Injury for Discrimination or Humiliation - $1,000,000 Each Individual/Aggregate
5. Incidental Medical Malpractice - $10,000,000 Limit Each Occurrence/Aggregate
6. Non-Owned Aircraft Liability - $10,000,000 Limit Each Occurrence
7. Hangarkeepers Liability - $10,000,000 Each Aircraft/$10,000,000 Occurrence
a. Deductible - $1,000 Each Aircraft
8. Excess Auto Liability - $10,000,000 excess of $3,000,000 scheduled underlying Automobile Liability
9. Non-FAA Control Tower Operator - $10,000,000 each occurrence; operation of control tower by
Midwest ATC Services, Inc.
VI. Health Department Professional Liability
A. Insurance Company – Darwin Select Ins Co (AWAC)
B. Best’s Rating is AXIV – Non-Admitted in Missouri
C. Policy # – 0309-7988
D. Annual Premium is $8,924
E. Limits are $1,000,000 Each Claim/$3,000,000 Aggregate
1. Professional Liability - $1,000,000 Each Claim/$3,000,000 Aggregate
2. Sexual Misconduct Liability - $1,000,000 Each Claim/$3,000,000 Aggregate
F. Deductible - $5,000 Each Claim
VII. Railroad Liability
A. Insurance Company –Liberty Surplus Insurance Corporation
B. Best’s Rating is A XV and Non-Admitted in Missouri
C. Policy # – RRHV290905-4
D. Annual Premium is $25,500 (No TRIA)
E. Limits are $5,000,000 Any One Incident/$10,000,000 Aggregate
F. $25,000 Retention Per Claim
G. Claims Made Policy
VIII. Railroad Rolling Stock
A. Insurance Company – Hanover Insurance Company
B. Best’s Rating is A XIV and Admitted in Missouri
C. Policy # – IHH968366503
D. Annual Premium is $3,119 (No TRIA)
E. Coverages:
1 $400,000 Limit All Covered Property-Any One Occurrence-$1,000 Deductible
a. SW120 Electromotive Div. GM Corp. 1200 HP Diesel – Electric RR Eng, S#4278-1-COLT
b. EMD Model GP-10, 1952 – HP: 1,750: Axles 4
IX. Network Security & Privacy
A. Insurance Company – National Union Fire Ins. Co. of Pittsburgh, PA (AIG)
B. Best’s Rating is A XV and Admitted in Missouri
C. Policy # –01-817-80-48
D. Annual Premium is $31,851
E. Claims Made Coverage
F. Retroactive Date: 10/1/2014
F. Coverages and Limits:
1. Media Content - $2,000,000, Retention $25,000
2. Security & Privacy Liability - $2,000,000, Retention $25,000
3. Regulatory Action Defense - $2,000,000, Retention $25,000
4. Event Management (Privacy Breach) - $2,000,000, Retention $50,000
5. Cyber Extortion - $2,000,000, Retention $25,000
6. Identity/Credit Monitoring - Covered expense for up to 1,000,000 Notified Individuals (outside the policy limit)
Note: Information from Division of Risk Management, City of Columbia
INSURANCE IN FORCE
SEPTEMBER 30, 2016
City of Columbia, Missouri
227