Comprehensive Annual Financial Report...Northfield Township High School District 225 Glenview,...
180
Northfield Township High School District 225 Glenview, Illinois Comprehensive Annual Financial Report for the Fiscal Year Ended June 30, 2016
Transcript of Comprehensive Annual Financial Report...Northfield Township High School District 225 Glenview,...

Northfield Township High School
District 225
Glenview, Illinois
Comprehensive Annual
Financial Reportfor the
Fiscal Year Ended June 30, 2016

Northfield Township High School District 225
Glenview, Illinois
Comprehensive Annual Financial Report
Fiscal Year Ended June 30, 2016
Prepared by:
Dr. R.J. Gravel
Assistant Superintendent for Business Services / CSBO
Ms. Vicki Tarver
Director of Business Services / CSBO
Department Issuing Report:
Business Services

Page
TABLE OF CONTENTS i-iii
INTRODUCTORY SECTION
Organizational Chart - District Administration iv
Officers and Officials v
Transmittal Letter vi - xiii
Association of School Business Officials International - Certificate of Excellence xiv
Government Finance Officers Association -
Certificate of Achievement for Excellence in Financial Reporting xv
FINANCIAL SECTION
Independent Auditors' Report 1 - 4
Management's Discussion and Analysis (Unaudited) 5 - 16
Basic Financial Statements
Government-wide Financial Statements
Statement of Net Position - Governmental Activities 17
Statement of Activities 18
Fund Financial Statements
Balance Sheet - Governmental Funds 19 - 20
Reconciliation of the Balance Sheet of Governmental Funds to
the Statement of Net Position 21
Statement of Revenues, Expenditures, and Changes in Fund
Balances (Deficit) - Governmental Funds 22 - 23
Reconciliation of the Statement of Revenues, Expenditures, and Changes in
Fund Balances of Governmental Funds to the Statement of Activities 24
Statement of Fiduciary Net Position - Fiduciary Funds 25
Statement of Changes in Fiduciary Net Position - Fiduciary Funds 26
Notes to the Financial Statements 27 - 68
Required Supplementary Information (Unaudited)
Multiyear Schedule of Changes in Net Pension Liability and Related Ratios -
Illinois Municipal Retirement Fund 69
Multiyear Schedule of Contributions - Illinois Municipal Retirement Fund 70
Multiyear Schedule of the District's Proportionate Share of the Net Pension Liability -
Teachers' Retirement System of the State of Illinois 71
(Continued)
-i-
Northfield Township High School District 225COMPREHENSIVE ANNUAL FINANCIAL REPORT
For the Year Ended June 30, 2016
TABLE OF CONTENTS

Page
Northfield Township High School District 225COMPREHENSIVE ANNUAL FINANCIAL REPORT
For the Year Ended June 30, 2016
TABLE OF CONTENTS
FINANCIAL SECTION (Continued)
Multiyear Schedule of District Contributions -
Teachers' Retirement System of the State of Illinois 72
Schedule of Funding Progress - Other Postemployment Benefits 73
Schedule of Revenues, Expenditures, and Changes in Fund Balances -
Budget and Actual - General (Educational) Fund 74 - 87
88 - 89
90 - 91
92 - 95
Notes to the Required Supplementary Information 96 - 98
SUPPLEMENTARY FINANCIAL INFORMATION
General Fund
Combining Balance Sheet 99
Combining Schedule of Revenues, Expenditures, and Changes in Fund Balance 100 - 101
Individual Fund Statements and Schedules
Schedule of Revenues, Expenditures, and Changes in Fund Balances -
Budget and Actual - Debt Service Fund 102 - 103
Schedule of Revenues, Expenditures, and Changes in Fund Balances (Deficit) -
Budget and Actual - Capital Projects Fund 104 - 105
Statement of Changes in Assets and Liabilities Agency Fund - Student Activity Funds 106 - 114
General Long-Term Debt
Schedule of General Obligation Bonds 115 - 117
STATISTICAL SECTION (Unaudited)
Statistical Section Contents 118
Net Position by Component - Last Ten Fiscal Years 119 - 120
Change In Net Position - Last Ten Fiscal Years 121 - 122
Fund Balances of Governmental Funds - Last Ten Fiscal Years 123 - 124
Governmental Funds Revenues - Last Ten Fiscal Years 125 - 126
Governmental Funds Expenditures and Debt Service Ratio - Last Ten Fiscal Years 127 - 128
Government-Wide Revenues - Last Ten Fiscal Years 129 - 130
(Continued)
Budget and Actual - Municipal Retirement/Social Security Fund
-ii-
Schedule of Revenues, Expenditures, and Changes in Fund Balances -
Budget and Actual - Operations and Maintenance Fund
Schedule of Revenues, Expenditures, and Changes in Fund Balances -
Budget and Actual - Transportation Fund
Schedule of Revenues, Expenditures, and Changes in Fund Balances -

Page
Northfield Township High School District 225COMPREHENSIVE ANNUAL FINANCIAL REPORT
For the Year Ended June 30, 2016
TABLE OF CONTENTS
STATISTICAL SECTION (Unaudited) (Continued)
Property Tax Rates - Levies and Collections - Last Ten Tax Levy Years 131 - 132
Equalized Assessed Valuation and Estimated Actual Value of Taxable Property
133
Property Tax Rates - Direct and Overlapping Governments
- Last Ten Tax Levy Years 134
Major Categories of Equalized Assessed Valuation - Last Ten Tax Levy Years 135
Direct and Overlapping General Obligation Bonded Debt 136
Legal Debt Margin - Last Ten Fiscal Years 137 - 138
Ratio of Net General Bonded Debt to Assessed Value and Net
General Bonded Debt per Capita - Last Ten Fiscal Years 139
Ratio of Annual Debt Service Expenditures for General Bonded
Debt to Total General Expenditures - Last Ten Fiscal Years 140
Ratio of Outstanding Debt by Type - Last Ten Fiscal Years 141 - 142
Principal Taxpayers in the District - Current Tax Year and Nine Years Ago 143
Principal Employers - Current Year and Nine Years Ago 144
Demographic and Economic Statistics - Last Ten Years 145
School Building Information - Last Ten Fiscal Years 146 - 147
Number of Employees by Function - Last Ten Fiscal Years 148 - 149
Operating Indicators by Function 150
District History 151- 154
Schedule of Insurance in Force 155 - 156
Operating Costs and Tuition Charge 157
(Concluded)
- Last Ten Levy Years
-iii-

INTRODUCTORY SECTION

-iv-
Superintendent
Assistant Superintendent for
Educational Services
Director of Innovation and Instructional
Technology
Director of Special Education
Instructional Supervisor/Dean for
Off Campus
Principal of Evening School
Assistant Superintendent for Business Services
Director of Business Services/CSBO
Director of Operations/CSBO
Director of Technology Services
Assistant Superintendent for Human Resources
Director of Human Resources
Building Principals
Associate Principals
Assistant Principals
Instructional Supervisors
Director of Public Information and Communications
Board of
Education
Northfield Township High School District 225 Administration

Term Expires
Skip Shein President 2019
Robert A. Boron Vice President 2019
Joel Taub Member 2019
Bruce Doughty Member 2017
Scott Martin Member 2017
Sonia Kim Member 2017
Karen Stang Hanley Member 2017
Dr. Michael Riggle Superintendent
Mrs. Hillarie Siena (retired 6/30/16)
Dr. R.J. Gravel (effective 7/1/16)
Dr. R.J. Gravel
Vicki Tarver Director of Business Services/CSBO
Dr. John Finan Glenbrook North
Lauren Fagel Glenbrook South
Fiscal Year Ended June 30, 2016
Northfield Township High School District 2253801 West Lake Avenue
Glenview, Illinois 60026
Comprehensive Annual Financial Report
Officers and Officials
Department Issuing Report
Business Services
Board of Education
Township School Treasurer
Dr. Craig Schilling
District Administration
Officials Issuing Report
Principals
Assistant Superintendent for Business Services/CSBO
Assistant Superintendent for Business Services/CSBO
Assistant Superintendent for Business Services/CSBO
-v-

-vi-
January 12, 2017
Members of the Board of Education and Citizens of District 225
Northfield Township High School District 225
3801 W. Lake Ave
Glenview, IL 60026
The Illinois State Board of Education requires that every school district issue a complete set of audited financial
statements. This report is published to fulfill that requirement for the fiscal year ended June 30, 2016.
The Comprehensive Annual Financial Report of Northfield Township High School District 225 for the fiscal year
ended June 30, 2016, is submitted herewith.
The District’s leadership team assumes full responsibility for the completeness and reliability of the information
contained in this report, based on a comprehensive framework of internal control that has been established for this
purpose. Because the cost of internal control should not exceed anticipated benefits, the objective is to provide
reasonable, rather than absolute, assurance that the financial statements are free from any material misstatements.
Miller Cooper & Co., Ltd., Certified Public Accountants, have issued an unmodified (“clean”) opinion on the
Northfield Township High School District 225 financial statements for the year ended June 30, 2016. The
independent auditors’ report is located at the front of the financial section of this report.
A discussion and analysis from the District’s leadership team is provided in the management’s discussion and
analysis (MD&A) section, immediately following the independent auditors’ report, providing a narrative
introduction, overview and analysis of the basic financial statements. MD&A complements this letter of transmittal
and should be read in conjunction with it.
Profile of the District
Northfield Township High School District 225, doing business as Glenbrook High School District 225, located
approximately twenty-five miles north of downtown Chicago, Illinois, is a high school district serving students in
grades 9 – 12. During fiscal year 2016, the District served 5,059 students1 in two high schools, Glenbrook North,
located in Northbrook, and Glenbrook South, located in Glenview, as well as in a therapeutic day school (Glenbrook
Off-Campus) also located in Glenview.
The governing body consists of a seven-member Board of Education elected from within the Northfield Township
boundaries, who each serve a four-year term. Board members are volunteers who do not receive a salary for their
services. The most common areas of action for the Board of Education include approving policies for the operation
of the schools, adopting and monitoring the budget, adopting the levy, authorizing curriculum development,
approving the appointment of teachers and other staff members, and providing overall direction.
1 Enrollment data based on October 1, 2015 actual counts.

-vii-
The Board of Education appoints a superintendent, who in turn recommends to the Board of Education the
appointment of the remaining administrative team. An organizational chart is provided at the front of this report.
Glenbrook High School District 225 serves students in the Villages of Glenview and Northbrook and offers its
diverse student population a broad cross-section of courses and opportunities tailored to the needs of every student.
Extensive curricular offerings are available from which students may choose, including Advanced Placement (AP),
Work Study opportunities and a comprehensive special education program. We also encourage student involvement
in extra-curricular activities, athletics, clubs and the fine arts. There are more than 25 competitive sports and over
150 clubs for our students to join. District 225’s students enjoy an excellent blend of educational opportunities in
academics, athletics and activities.
The District is required to adopt an annual budget for all of its funds by September 30 of each year. The annual
budget serves as a foundation for financial planning and control. The budget is organized by fund, location, function
(e.g., instruction, support services), object (e.g., salaries, employee benefits), and program. Development and
presentation of the budget is progressive and presented in distinguishable parts beginning in January of each calendar
year. A complete presentation of the tentative budget is presented to the Board of Education in July, and made
available for public inspection throughout the month of August. After a public hearing, the Board of Education
formally adopts a finalized budget for the fiscal year in September. Throughout the fiscal year, the Board of
Education participates in the regular review and approval of personnel actions, awarding of bids, and payments to
vendors at its meetings throughout the year.
Local Economy
Northfield Township is located in Cook County, Illinois, and is comprised of the Villages of Glenview, Northbrook,
and unincorporated parts of northern Cook County. In addition to its residential real estate, the Township houses
numerous national and international businesses, such as Allstate Insurance Company, Baxter Healthcare Corp.,
Walgreen Company, Underwriters Laboratories, Inc., CVS Caremark, Astellas Pharmacy US, Inc., ABT Electronics,
Anixter International, Inc., Kraft Foods, Inc., Takeda Pharmaceuticals North America, and North Shore University
Health Systems Glenbrook Hospital.
The equalized assessed valuation of all real property located within the boundaries of Northfield Township has
increased by 3.3% from tax year 2014 to 2015. This appreciation represents an upward trend in property values,
which due to economic conditions, had been declining over the last four years.
In February 1995, the Illinois General Assembly passed tax cap legislation (P.A. 89-1) for Cook County making it
retroactive to the 1994 tax year. This legislation, known as the Property Tax Extension Limitation Law (PTELL),
controls the District’s ability to generate property tax revenues. In addition to P.A. 89-1, the Illinois General
Assembly amended Article 20, which limits the amount of taxes for debt service that can be generated through the
sale of non-referendum bonds, to the district’s 1994 aggregate non-referendum debt service amount, increased
annually by the change in the Consumer Price Index (CPI). For District 225 this current limit is $2.3 million.
In November 2006, the voters of District 225 approved a $94 million building bond referendum increasing the debt
service tax rate by 8.5 cents. As outlined in the District’s pre-referendum planning process, initial proceeds were
used to restructure debt, with the balance of funds invested for future capital projects. As a result of these
transactions, approximately $4 million was replenished to the District’s operating funds that had previously been
restricted for alternate revenue bond payments, building maintenance and infrastructure.
For information regarding the District’s financial position and respective changes in financial position, please read
the Management’s Discussion and Analysis.

-viii-
Long-Term Financial Planning
Although the District has benefited from a successful building referendum, it will continue to monitor its operating
budget. Key areas of concern are property tax refunds, reduced/deferred state funding, unfunded mandates, utility
costs, growing special education student needs, increasing health care costs, decreasing investment earnings, and the
overall impact of economic conditions. The District will continue to explore reducing expenditures wherever
possible.
District administration routinely completes five year projections as part of its comprehensive financial planning
process. Over the past five years, the District has aggressively reviewed every area of operations for improvements
in efficiencies. This on-going review has resulted in major cost reductions in the areas of energy, insurance,
bookstore operations, food service, technology infrastructure, transportation, printing and copy services and
investment property.
District finances are monitored through such means as periodic financial reports to the Board of Education, the
annual budget process and long-term financial projections. The Board of Education has an established Finance
Committee that meets several times per year to review financial reports, updated budgetary data, significant
legislative issues and pending events that may have a financial impact upon the District.
As a result of the District’s internal control policies and procedures, budget oversight and fiscal management, both
Standard and Poor’s Financial Services LLC and Moody’s Investors Service have awarded the District “AAA” bond
ratings. In addition to these excellent financial ratings, Standard and Poor’s has awarded the District their highest
management rating of “strong”, which reflects an independent opinion of excellence in financial management.
Relevant Financial Policies
Budget planning for the upcoming fiscal year begins no later than October, following adoption of the District’s final
budget. The proposed budget is available for public inspection and comment at least 30 days before the budget
hearing. Within 30 days of adoption, the budget is filed with the Cook County Clerk’s office and filed electronically
with the Illinois State Board of Education (ISBE). Also, the adopted budget is posted on the District’s website. The
Board of Education may amend the budget by following the same procedure as provided for in the original adoption.
The Board of Education maintains an established budget policy that requires unassigned reserves in the operating
funds be maintained at a level equal to approximately 33% of the next year’s projected operating expense budget.
The budget policy outlines parameters for the distribution of resources, maintenance of the District’s tax rate,
provisions for safe and operationally sound facilities, compliance with all applicable regulation, establishment of
reasonable contingencies and the continuous monitoring of efficiencies.
The Township Treasurer serves as the Chief Investment Officer. The Township Treasurer invests funds not required
for current operations in accordance with Board policy and State law. The Board of Education has an established
investment policy to ensure safety of principal, liquidity of principal, return on investments, and maintenance of the
public’s trust. See the Notes to the Basic Financial Statements for additional information on cash and investments.
The certificate of property tax levy is filed with the Cook County Clerk’s office by the last Tuesday in December.
The District annually publishes a statement of affairs regarding its financial position by December 1st of each year.

-ix-
Major Initiatives
Building Capacities/Student Enrollment
The District has been carefully monitoring student enrollment and building capacities, especially with respect to
increasing enrollment at Glenbrook South. After commissioning an independent demographic enrollment study and
gathering input from the community, the Board of Education determined that both Glenbrook North and Glenbrook
South schools can accommodate anticipated student populations without a need to consider changes to District
boundaries or practices. Student enrollment is projected to increase over the next several years, stabilizing at some
point in the future. This trend may require temporary facility modifications in order to maintain ideal student
capacity in some curricular areas.
Curriculum and Instruction
District 225 believes in the importance of community input relative to future initiatives in the area of curriculum and
instruction. The District is embarking upon a comprehensive strategic planning process in this area, obtaining
feedback from stakeholders regarding academic skills, course offerings and student academic work. In addition, the
District’s instructional practices enhance student engagement with an emphasis on collaboration, communication,
critical thinking, and creativity. A three-year strategic plan in the area of curriculum is being developed with input
from a variety of stakeholders.
Student Wellness
District 225 believes in the importance of community input relative to future initiatives in the area of student
wellness. The District is embarking upon a comprehensive strategic planning process, obtaining feedback from
stakeholders regarding student emotional wellbeing, physical wellbeing, mental health issues and substance use. A
three-year strategic plan in the area of student wellness is being developed with input from a variety of stakeholders.
Technology Integration
The District approved the adoption of a 3-year technology vision that provides a roadmap for areas in which to focus
on, enabling a greater degree of innovation in our schools. The plan emphasizes the need for ongoing communication
across stakeholder groups in order to create effective learning environments, enriched by technology, and designed
to develop citizenship, collaboration, communication, critical thinking, and creativity across the curriculum.
Communication
The District utilizes a three-year communications plan to guide efforts to build trust and support for the Glenbrook
schools. In year two of the plan (FY2016), the communications office planned the design of a new external website
and mobile device interface. The new social media campaigns conducted several focus groups of students, parents,
and staff, with a goal of launching the new website during FY2017.

-x-
Awards and Achievements
Journalism Awards
Glenbrook South High School’s The Etruscan was the only yearbook in Illinois to win the National Scholastic Press
Association Pacemaker award for outstanding journalism. The yearbook was also recognized as a Crown Award
winner by Columbia University’s School of Journalism. GBS yearbook sponsor Brenda Field was named Master
Journalism Educator by the Journalism Education Association. GBS student Dani Tuchman was runner-up for the
Illinois High School Journalist of the Year award by the Illinois Journalism Education Association. The Oracle won
“Best Newspaper” among many accolades at the IHSA Journalism Awards.
Glenbrook South broadcasting students won 8 awards at the Midwest Media Educators Association Annual Video
Festival. Glenbrook North was also well represented at the festival taking home six top 3 finishes including:
Demonstration (How to Video), Movie Trailer, and New Package. Overall, there were more than 600 videos entered
into this high school competition in 14 different categories. All videos are judged by 3-4 professionals in the specific
category industry. In each category, they award 1st, 2nd, and 3rd place prizes as well as gold recognition which
amounts to a top 5 finish.
Glenbrook North’s literary magazine, The Euphonium, was selected to receive a rank of “excellent” in the 2015
NCTE Program to recognize excellence in student literary magazines. The Euphonium is published by freshman and
sophomores showcasing short stories, poems, art work and photography submitted by GBN students.
Fine Arts Awards
Eight GBS students were selected as finalists for the Illinois Music Educators Association All-State
Competition. Three GBS students were chosen to perform in the Chicago Youth in Music Festival. The Marching
Band was Overall Winner & Grand Champion, Class AAA Winner and Outstanding Winds, Guards, Percussion and
Drum Major at the St. Rita Mustang Stampede Marching Band Competition. The band also took 2nd place at the
Prospect Knights of Champions Competition.
Jidapa Thia won Honorable Mention in the 2016 Scholastic Art Competition; and Jini John received an honorable
mention at the National Scholastic Art Awards.
Family, Career and Technical Education Awards
Twenty-four GBS Family & Consumer Science students brought home 12 gold medals at the Family Career and
Community Leaders of America (FCCLA) State Competition; 2 students also qualified to compete at state FCCLA
for Star Culinary Arts at Kendall College; and 2 students, qualified for the National FCCLA competition. Five
Fashion students also competed at the State Conference and received gold medal recognition. One of the five
qualified for the STAR State Fashion Event.
Thirty-four GBS students competed at the State Business Professionals of America (BPA) competition, and 7
qualified for the national competition in Boston. GBS won 6 Outstanding Achievement Awards; Megan Briggs was
one of 5 students in the nation to earn the President’s Volunteer Service Award and one of 2 earning the Gold Level
Award. Megan Briggs and Sarah Briggs were awarded Ambassador Torch Awards; Megan also won a national BPA
medal for Human Resource Management; and Alex Velis finished 8th in the nation for Medical Office Procedures.
Nine Architecture and CAD students competed at the IDEA State Competition, culminating in three 2nd place
finishes. At the SkillsUSA State Leadership and Skills Conference, GBS students competed in over 90 contests of
Architectural Drafting, Cabinetmaking, and Culinary Arts against over 2,000 competitors. Francine Yoon brought
home a bronze medal in Culinary Arts and Jake Bertog took 5th place in Cabinetmaking.

-xi-
Glenbrook North’s DECA program was well represented at this year’s national conference. 25 students qualified to
participate nationally, with 10 qualifiers finishing in first place in respective events. At the Nashville international
conference, Jake Feiger (Senior) and Ricky Kirkpatrick (Senior) took the 1st place trophy as the Sports and
Entertainment Marketing Team; Ben Zhao (Junior) 3rd Place with their Fashion Merchandising Promotion Plan;
Jason Spector (Senior) 3rd place in the area of Human Resources Management.
Debate Awards
GBS Debate Society ranked in the top 0.6% in the US among over 3,200 schools by the National Speech and Debate
Association. Brian Roche and Doug Stryker won the prestigious Pace Round Robin Tournament in Atlanta; Max
Kruger and senior Jake Lee were crowned champions of the Badgerland Tournament in Madison; Brian Roche and
Doug Stryker finished 2nd out of over 100 teams at the University of Michigan tournament. The GBS Debate team
finished in the top four at the IHSA Debate Tournament. Three debaters earned all-state recognition: Michael
Callahan, Vignesh Alla, and Doug Stryker. The team of Doug Stryker and Brian Roche finished 3rd in the Debate
Tournament of Champions in Iowa City.
The National Speech and Debate Association has once again recognized the Glenbrook North High School speech
and debate program. The GBN chapter achieved 400 or more degrees last year, and has ranked among the top 1%
of schools nationwide and earned membership in the Association’s prestigious Societé de 400. This milestone is
remarkable because it demonstrates outstanding commitment to teaching students essential life skills - including
communication, research, listening, writing and organization. Nine Glenbrook North students in five different events
qualified to advance to the National Speech and Debate Tournament. Qualifying students from GBN include Emma
Kawasaki in Dramatic Interpretation, Brooks Whitlock and junior Julia Shelley in Duo Interpretation, Catherine
Seno and Elaine Currie in Original Oratory, Isaac Kim in International Extemporaneous Speaking, and freshman
Kacie Leidwinger in Humorous Interpretation.
Social Studies Awards
GBS Model United Nations team earned a 1st place Award of Distinction at the National Model U. N. Conference
of over 3,800 students from 35 countries. The team also earned the 1st place Best Delegation award at the University
of Chicago Model UN Conference, with 5 students earning Best Delegate awards. The team also took 1st at the
Stanford Model U.N. Conference.
Athletic Awards
GBS student Charlie Nikitas placed 6th at the IHSA State golf tournament and earned a spot on the All-State team.
Nikol Blinov and Sophie Hensley in doubles and sophomore Kendall Oldham in singles advanced to the state IHSA
tennis tournament. GBS had a total of 93 All-Conference athletes this year.
GBN students Colette and Catherine O'Regan finished in third place in doubles competition at the IHSA State Tennis
Championships. The GBN girls tennis team won the CSL North AND finished in 5th place in the state as a team.
GBN students had several successful individual finishes at the state tournament including, Amy Hong 16th, Emma
Vickery 26, Dan Cole 39, and Henry Knez 103.The boys golf team won the CSL north division.
GBN Football Coach John Clark was the first-ever "Helix Camera & Video Athlete of The Year" which was awarded
on Saturday, December 5th in Itasca by the Rewind Sports 60 Radio and TV show. Also, John was named IHSA
Illinois Football Coaches Association First team all-state at TB in Class 7A.
Academic Program Awards
Seniors Emily Chen and Sue Hong were honored as recipients of the National Council of Teachers of English
(NCTE) Achievement in Writing Award. Emily and Sue earned this recognition for outstanding writing by
submitting polished and impromptu pieces this past spring. A panel of English teachers judged more than 1,600
entries from across the country.

-xii-
The American Association of Teachers of French has unanimously accorded to Glenbrook North High School the
award of Exemplary French Program, with honors, 2016-2018.
GBS had 5 National Merit finalists and 7 semifinalists. In addition, 19 students received Commended status.
Freshmen Engineering students Ahmed Malik, Nicholas Ermolov, Matthew Moran, and Jesus Crespo took 1st place
in the High School Division of the Huskie Hackathon at Northern Illinois University. Nine engineering students won
1st place in Design and Innovation, 2nd place in performance, and 2nd place in engineering and fabrication at the
Autonomous Innovative Vehicle Design competition at the University of Michigan. The GBS Science Olympiad had
numerous students medal at the state competition; and 6 students at the Illinois Junior Academy of Science State
Competition won gold and numerous monetary awards for independent science research in biochemistry, physics,
astronomy, and computer science.
At the American Association of Teachers of Spanish and Portuguese Poetry Contest, 3 GBS students took 1st place,
6 took 2nd place, and 2 took 3rd place. Two GBS students were Gold Medal winners in the Japanese National Exam;
2 were winners in the Japanese Original Poem Contest. Fourteen GBS students received Gold Medals in the National
Spanish Exam.
The GBS Math team qualified for the state competition and finished in 9th place overall, with several notable
individual performances. GBS had 11 QuestBridge finalists and two received College Match Scholarships to
Princeton University and to the University of Chicago.
Faculty Awards
Larry Faulkner was named the National Federation of High Schools Boys’ Tennis Coach of the Year. CTE teacher
Corey Duzan was nominated for a Golden Apple Award, and Dan Leipert was named New Teacher of the Year by
the International Technology and Engineering Educators Association. Choir Director Marty Sirvatka won the Mary
Hoffman Award of Excellence for Music Education. Band Director Greg Wojcik was a Grammy Foundation
Educator Award quarterfinalist. Assistant Principal Jim Shellard was awarded Varsity Brand’s 2016 Spirit Superstar
Award. Science teachers Suzanne Webb and Linda Kocian were co-recipients of the David Peterson Outstanding
Educator Award from the North Shore Special Education District.
GBN Band Director, Mark Running, is one of this year's recipients of the Mary Hoffman Award of Excellence from
the Illinois Music Educators Association. He will receive this award at the 2016 IMEA Conference in Peoria, IL.
This award is given to educators who have demonstrated excellence in music education and recognizes the numerous
contributions that Mark has made to our profession over the years.
Awards for Excellence in Financial Reporting
The District received the Certificate of Excellence in Financial Reporting from the Association of School Business
Officials International and the Certificate of Achievement for Excellence in Financial Reporting from the
Government Finance Officers Association, for the FY2015 Comprehensive Annual Financial Report.
In order to be awarded these Certificates, the District must publish an easily readable and efficiently organized
comprehensive annual financial report, whose contents conform to program standards. Certificates are valid for a
period of one year only. We believe our current report continues to conform to the Certificate requirements.

-xiii-
Acknowledgements
The preparation of this report would not have been possible without the efficient and dedicated service of the entire
Central Office staff. We wish to express our appreciation to all members of the Central Office who assisted and
contributed to the preparation of this report. Also, credit must be given to the President and members of the Board
of Education for their desire and commitment to maintain the highest standards of professionalism in the
management of Northfield Township High School District 225 finances.

The Certificate of Excellence in Financial Reporting Award
is presented to
Northfield Township High School District 225
for its Comprehensive Annual Financial Report (CAFR)
for the Fiscal Year Ended June 30, 2015.
The CAFR has been reviewed and met or exceeded
ASBO International’s Certificate of Excellence standards.
Brenda R. BurkettBrenda R. BurkettBrenda R. BurkettBrenda R. Burkett, , , , CPACPACPACPA, , , , CSBACSBACSBACSBA, SFO, SFO, SFO, SFO John D. MussJohn D. MussJohn D. MussJohn D. Musso, CAE, RSBAo, CAE, RSBAo, CAE, RSBAo, CAE, RSBA
President Executive Director
-xiv-

-xv-

FINANCIAL SECTION

Report on the Financial Statements
Management’s Responsibility for the Financial Statements
Auditors' Responsibility
(Continued)
INDEPENDENT AUDITORS' REPORT
The Members of the Board of Education
Northfield Township High School District 225
Glenview, Illinois
We have audited the accompanying financial statements of the governmental activities, each major fund, and the
aggregate remaining fund information of Northfield Township High School District 225, as of and for the year
ended June 30, 2016, and the related notes to the financial statements, which collectively comprise Northfield
Township High School District 225’s basic financial statements, as listed in the table of contents.
Northfield Township High School District 225 management is responsible for the preparation and fair
presentation of these financial statements in accordance with accounting principles generally accepted in the
United States of America; this includes the design, implementation, and maintenance of internal control relevant to
the preparation and fair presentation of financial statements that are free from material misstatement, whether due
to fraud or error.
Our responsibility is to express opinions on these financial statements based on our audit. We conducted our audit
in accordance with auditing standards generally accepted in the United States of America and the standards
applicable to financial audits contained in Government Auditing Standards, issued by the Comptroller General of
the United States. Those standards require that we plan and perform the audit to obtain reasonable assurance
about whether the financial statements are free from material misstatement.
An audit involves performing procedures to obtain audit evidence about the amounts and disclosures in the
financial statements. The procedures selected depend on the auditors' judgment, including the assessment of the
risks of material misstatement of the financial statements, whether due to fraud or error. In making those risk
assessments, the auditor considers internal control relevant to the entity’s preparation and fair presentation of the
financial statements in order to design audit procedures that are appropriate in the circumstances, but not for the
purpose of expressing an opinion on the effectiveness of the entity’s internal control. Accordingly, we express no
such opinion. An audit also includes evaluating the appropriateness of accounting policies used and the
reasonableness of significant accounting estimates made by management, as well as evaluating the overall
presentation of the financial statements.
We believe that the audit evidence we have obtained is sufficient and appropriate to provide a basis for our audit
opinions.
-1-

Glenview, Illinois
Opinions
Other Matters
Required Supplementary Information
Other Information
(Continued)
Our audit was conducted for the purpose of forming opinions on the financial statements that collectively comprise
Northfield Township High School District 225’s basic financial statements. The other schedules listed in the table
of contents in the introductory section, statistical section, and the supplementary financial information are
presented for purposes of additional analysis and are not a required part of the basic financial statements.
The Members of the Board of Education
Northfield Township High School District 225
(Continued)
In our opinion, the financial statements referred to above present fairly, in all material respects, the respective
financial position of the governmental activities, each major fund, and the aggregate remaining fund information of
Northfield Township High School District 225, as of June 30, 2016, and the respective changes in financial
position for the year then ended, in accordance with accounting principles generally accepted in the United States
of America.
Accounting principles generally accepted in the United States of America require that the management’s discussion
and analysis on pages 5 through 16, the Illinois Municipal Retirement Fund and Teachers' Retirement System of
the State of Illinois pension data on pages 69 through 72, the other postemployment benefits data on page 73,
budgetary comparison schedules and notes to the required supplementary information on pages 74 through 98 be
presented to supplement the basic financial statements. Such information, although not a part of the basic financial
statements, is required by the Governmental Accounting Standards Board, who considers it to be an essential part
of financial reporting for placing the basic financial statements in an appropriate operational, economic, or
historical context. We have applied certain limited procedures to the required supplementary information in
accordance with auditing standards generally accepted in the United States of America, which consisted of
inquiries of management about the methods of preparing the information and comparing the information for
consistency with management’s responses to our inquiries, the basic financial statements, and other knowledge we
obtained during our audit of the basic financial statements. We do not express an opinion or provide any assurance
on the information because the limited procedures do not provide us with sufficient evidence to express an opinion
or provide any assurance.
-2-
������������������� ���������������������� ���������������������� ���������������������� �������

Glenview, Illinois
Other Information (Continued)
(Continued)
The Introductory and Statistical Sections, as stated in the table of contents, have not been subjected to the auditing
procedures applied in the audit of the basic financial statements, and accordingly, we do not express an opinion or
provide any assurance on it.
The Members of the Board of Education
Northfield Township High School District 225
(Continued)
The supplementary financial information is the responsibility of management and was derived from and relates
directly to the underlying accounting and other records used to prepare the basic financial statements. Such
information for the year ended June 30, 2016 has been subjected to the auditing procedures applied in the audit of
the basic financial statements for the year ended June 30, 2016, and certain additional procedures, including
comparing and reconciling such information directly to the underlying accounting and other records used to
prepare the basic financial statements or to the basic financial statements themselves, and other additional
procedures in accordance with auditing standards generally accepted in the United States of America. In our
opinion, the supplementary financial information for the year ended June 30, 2016 is fairly stated, in all material
respects, in relation to the basic financial statements as a whole for the year ended June 30, 2016.
We also have previously audited, in accordance with auditing standards generally accepted in the United States of
America, the basic financial statements of Northfield Township High School District 225, as of and for the year
ended June 30, 2015 (not presented herein), and have issued our report thereon dated January 6, 2016, which
contained unmodified opinions on the respective financial statements of the governmental activities, each major
fund, and the aggregate remaining fund information. That audit was conducted for the purpose of forming opinions
on the financial statements that collectively comprise the Northfield Township High School District 225's basic
financial statements as a whole. The Schedule of Revenues, Expenditures, and Changes in Fund Balance – Budget
and Actual for the Capital Projects Fund and Debt Service Fund with comparative actual amounts for the year
ended June 30, 2015 are presented for purposes of additional analysis and are not a required part of the basic
financial statements. Such information is the responsibility of management and was derived from and relates
directly to the underlying accounting and other records used to prepare the 2015 basic financial statements. The
Schedule of Revenues, Expenditures and Changes in Fund Balance - Budget and Actual for Capital Projects Fund
and the Debt Service Fund has been subjected to the auditing procedures applied in the audit of the 2015 basic
financial statements and certain additional procedures, including comparing and reconciling such information
directly to the underlying accounting and other records used to prepare the basic financial statements or to the
basic financial statements themselves, and other additional procedures in accordance with auditing standards
generally accepted in the United States of America. In our opinion, the Schedule of Revenues, Expenditures, and
Changes in Fund Balance – Budget and Actual for the Capital Projects Fund and Debt Service Fund are fairly
stated in all material respects in relation to the basic financial statements as a whole for the year ended June 30,
2015.
-3-
������������������� ���������������������� ���������������������� ���������������������� �������

Glenview, Illinois
Other Reporting Required by Government Auditing Standards
Deerfield, Illinois
January 12, 2017
MILLER, COOPER & CO., LTD.
The Members of the Board of Education
Northfield Township High School District 225
(Continued)
In accordance with Government Auditing Standards, we have also issued our report dated October 11, 2016 on
our consideration of Northfield Township High School District 225’s internal control over financial reporting and
on our tests of its compliance with certain provisions of laws, regulations, contracts, and grant agreements and
other matters. The purpose of that report is to describe the scope of our testing of internal control over financial
reporting and compliance and the results of that testing, and not to provide an opinion on internal control over
financial reporting or on compliance. That report is an integral part of an audit performed in accordance with
Government Auditing Standards in considering Northfield Township High School District 225’s internal control
over financial reporting and compliance.
Certified Public Accountants
-4-
������������������� ���������������������� ���������������������� ���������������������� �������

Northfield Township High School District 225 Management’s Discussion and Analysis (Unaudited)
For the Year Ended June 30, 2016
-5-
The discussion and analysis of Northfield Township High School 225’s (the District) financial
performance provides an overall review of the District’s financial activities for the year ended June 30,
2016. The District’s leadership team encourages readers to consider the information presented herein in
conjunction with the basic financial statements to enhance their understanding of the District’s financial
performance. Certain comparative information between the current year and the prior is required to be
presented in the Management’s Discussion and Analysis (the “MD&A”).
Financial Highlights
For tax year 2015, payable in 2016, the District’s aggregate equalized assessed value (EAV) for
all real property within the boundaries of Northfield Township decreased approximately 3.3%
from $4.54 billion to $4.39 billion. This depreciation indicates a negative trend in overall property
values within the District’s tax base.
The District continued to aggressively pay down its existing debt, retiring $5.9 million of
outstanding general obligation bonds.
General revenues accounted for $118.6 million, or 76.1% of total revenue. Program specific
revenues in the form of charges for services and grants and contributions accounted for $37.2
million, or 23.6% of total revenue.
The District had $152.7 million in expenses related to governmental activities, of which $37.2
million were offset by program specific charges for services or operating grants and contributions.
General revenues of $118.6 million were adequate to provide for the remaining costs of these
programs.
Among the major funds, the General Fund (Educational and Working Cash Accounts) had $127.9
million in revenues, primarily consisting of property taxes, state and federal aid, and other local
revenue, and $127.1 million in expenditures.
Enrollment remained relatively stable, increasing slightly by 2.6% or 126 students between
FY2015 and FY2016.
The FY2016 budget included numerous efficiency initiatives that were implemented during the
year. These initiatives are on-going and include a continuous review of all District operations by
School and District leadership teams, as well as by the Board of Education.

Northfield Township High School District 225 Management’s Discussion and Analysis (Unaudited)
For the Year Ended June 30, 2016
-6-
Overview of the Financial Statements
This discussion and analysis is intended to serve as an introduction to the District’s basic financial
statements. The basic financial statements are comprised of three components:
Government-wide financial statements
Fund financial statements
Notes to the financial statements
This report also contains required supplementary information and supplementary financial information in
addition to the basic financial statements.
Government-wide financial statements
The government-wide financial statements are designed to provide readers with a broad overview of the
District’s finances, in a manner similar to a private-sector business.
The statement of net position presents information on all of the District’s assets and deferred outflows of
resources and liabilities and deferred inflows of resources, with the difference reported as net position.
Over time, increases or decreases in net position may serve as a useful indicator of whether the financial
position of the District is improving or deteriorating.
The statement of activities presents information showing how the government’s net position changed
during the fiscal year. All changes in net position are reported as soon as the underlying event giving rise
to the change occurs, regardless of the timing of related cash flows. Thus, revenues and expenses are
reported in this statement for some items that will only result in cash flows in future fiscal periods.
The government-wide financial statements present the functions of the District that are principally
supported by taxes and intergovernmental revenues (governmental activities). The District has no
business-type activities; that is, functions that are intended to recover all or a significant portion of their
costs through user fees and charges. The District’s governmental activities include instructional services
(regular education, special education and other), supporting services, operation and maintenance of
facilities and transportation services.

Northfield Township High School District 225 Management’s Discussion and Analysis (Unaudited)
For the Year Ended June 30, 2016
-7-
Overview of the Financial Statements (Continued)
Fund financial statements
A fund is a grouping of related accounts that is used to maintain control over resources that have been
segregated for specific activities or objectives. The District uses fund accounting to ensure and
demonstrate compliance with finance-related legal requirements. All of the funds of the District can be
divided into two categories: governmental funds and fiduciary funds (the District maintains no proprietary
funds).
Governmental funds are used to account for essentially the same functions reported as governmental
activities in the government-wide financial statements. However, unlike the government-wide financial
statements, governmental funds financial statements focus on near-term inflows and outflows of spendable
resources, as well as on balances of spendable resources available at the end of the fiscal year. Such
information may be useful in evaluating a school district’s near-term financing requirements.
Because the focus of governmental funds is narrower than that of the government-wide financial
statements, it is useful to compare the information presented for governmental funds with similar
information presented for governmental activities in the government-wide financial statements. By doing
so, readers may better understand the long-term impact of the government’s near-term financing decisions.
Both the governmental funds balance sheet and the governmental funds statement of revenues,
expenditures and changes in fund balances provide a reconciliation to facilitate this comparison between
governmental funds and governmental activities.
The District maintains six governmental funds. Information is presented separately in the governmental
funds balance sheet and in the governmental funds statement of revenues, expenditures and changes in
fund balances for the General (includes the Educational and Working Cash Accounts), Operations and
Maintenance, Transportation, Municipal Retirement/Social Security, Debt Service, and Capital Projects,
all of which are considered to be major funds.
The District adopts an annual budget for each of the funds listed above. A budgetary comparison statement
has been provided for each fund to demonstrate compliance with this budget.
Fiduciary (agency) funds are used to account for resources held for the benefit of parties outside the school
district. Fiduciary (agency) funds are not reflected in the government-wide financial statements because
the resources of those funds are not available to support the District’s own programs. The accounting
used for fiduciary (agency) funds is much like that for the government wide financial statements.

Northfield Township High School District 225 Management’s Discussion and Analysis (Unaudited)
For the Year Ended June 30, 2016
-8-
Overview of the Financial Statements (Continued)
Notes to the financial statements
The notes to the financial statements provide additional information that is essential to a better
understanding of the data provided in the government-wide and fund financial statements.
Other information
In addition to the basic financial statements and accompanying notes, this report also presents certain
required supplementary information, including fund budgetary data, as well as pension data related to the
Teachers’ Retirement System of Illinois (TRS), and the Illinois Municipal Retirement Fund (IMRF).

Northfield Township High School District 225 Management’s Discussion and Analysis (Unaudited)
For the Year Ended June 30, 2016
-9-
Government-Wide Financial Analysis
The District’s reported net position increased compared to June 30, 2015, by $3.2 million. The increase
is primarily due to an increase in operating grants and contributions as well as tax revenues.
Table 1
Condensed Statement of Net Position
Governmental
Activities
2015
Governmental
Activities
2016
Current and other assets $138,683,436 $139,924,530
Capital assets 136,240,640 138,585,093
Construction in progress 5,110,139 1,045,766
Total assets
Deferred outflows of resources
280,034,215
3,836,544
279,555,389
7,135,919
Long-term liabilities 107,334,474 106,903,391
Other liabilities 6,123,613 5,930,141
Total liabilities
Deferred inflows of resources
113,458,087
53,488,668
112,833,532
53,745,460
Net position:
Net investment in capital assets 66,726,008 69,325,221
Restricted 20,153,278 20,707,159
Unrestricted 30,044,718 30,079,936
Total net position
$116,924,004
$120,112,316

Northfield Township High School District 225 Management’s Discussion and Analysis (Unaudited)
For the Year Ended June 30, 2016
-10-
Government-Wide Financial Analysis (Continued)
Governmental
Activities
2015
%
Of
Total
Governmental
Activities
2016
%
Of
Total
Revenues:
Program revenues:
Charges for services $2,858,737 1.9% $2,777,150 1.8%
Operating grants and
contributions 32,145,265 21.4% 34,396,186 22.1%
General revenues:
Taxes 113,055,342 75.4% 115,501,417 74.1%
General state aid 1,153,612 0.8% 1,648,367 1.0%
Other 686,436 0.5% 1,520,920 1.0%
Total revenues 149,899,392 100% 155,844,040 100%
Expenses:
Instruction 95,782,160 65.0% 99,114,383 65.0%
Pupil and instructional
services 15,043,050 10.2% 14,973,826 9.8%
Administration and business 13,391,733 9.1% 12,764,975 8.4%
Transportation 2,846,541 1.9% 2,940,055 1.9%
Operations and maintenance 9,859,385 6.7% 10,268,457 6.7%
Other 10,498,311 7.1% 12,594,032 8.2%
Total expenses 147,421,180 100% 152,655,728 100%
Increase in net position 2,478,212 3,188,312
Net position, beginning of
year 114,445,792 116,924,004
Net position, end of year $116,924,004 $120,112,316
Table 2
Changes in Net Position

Northfield Township High School District 225 Management’s Discussion and Analysis (Unaudited)
For the Year Ended June 30, 2016
-11-
Revenues by Source: Property taxes and personal property replacement taxes in the amount of $115.5
million accounted for 74.1% of total revenues, while operating grants and contributions in the amount of
$34.4 million accounted for 22.1%, charges for services in the amount of $2.8 million accounted for 1.8%,
general state aid in the amount of $1.6 million accounted for 1.0% and other local revenue in the amount
of $1.5 million accounted for 1.0% (Figure A-1).
1.8%
22.1%
74.1%
1.0%
1.0%
Figure A-1 Government-Wide Revenues by Source
Charges for services Operating grants and contributionsProperty and Personal Property Replacement Taxes General State AidOther

Northfield Township High School District 225 Management’s Discussion and Analysis (Unaudited)
For the Year Ended June 30, 2016
-12-
Expenses by Function: Expenses for instruction in the amount of $99.1 million accounted for 65.0% of
total expenses, while pupil and instructional services in the amount of $15.0 million accounted for 9.8%,
administration and business in the amount of $12.8 million accounted for 8.4%, transportation in the
amount of $2.9 million accounted for 1.9%, operations and maintenance in the amount of $10.3 million
accounted for 6.7%, and other expenses in the amount of $12.6 million accounted for 8.2% (Figure A-2).
Financial Analysis of the District’s Funds
As the District closed the year, the District’s governmental funds reported a combined fund balance of
$82,329,552, higher than last year’s ending fund balance of $81,545,321, an increase of approximately
1.0%. This slightly higher fund balance is mainly the result of increased revenues in the current year.
The General Fund is the largest of the governmental funds. The fund balance at the beginning of the year
was $61,224,470. Actual total revenues were $127,875,064; actual total expenditures were $127,094,643.
There were capital lease payments of $745,380 as well as a transfer to the Capital Projects Fund of
$350,000 and capital lease proceeds of $460,330. The net change in fund balance was an increase of
$145,371; the fund balance at the end of the year was $61,369,841.
The Operation and Maintenance Fund fund balance at the beginning of the year was $11,846,560. Actual
total revenues were $11,183,105; actual total expenditures were $7,726,249. There were transfers out of
the fund in the amount of $3,274,394 for the payment of long-term liabilities. The net change in fund
balance was an increase of $182,462; the fund balance at the end of the year was $12,029,022.
65.0%9.8%
8.4%
1.9%6.7%
8.2%
Figure A-2 Government-Wide Expenses by Function
Instruction Pupil and Instructional Services Administration & Business Transportation Operations & Maintenance Other

Northfield Township High School District 225 Management’s Discussion and Analysis (Unaudited)
For the Year Ended June 30, 2016
-13-
Financial Analysis of the District’s Funds (Continued)
The Transportation Fund fund balance at the beginning of the year was $2,254,655. Actual total revenues
were $2,414,180; actual total expenditures were $2,885,849. The net change in fund balance was a
decrease of $471,669; the fund balance at the end of the year was $1,782,986. This net decrease in fund
balance is mainly the result of an increase in expenses for additional school buses due to increasing
enrollment.
The Municipal Retirement/Social Security Fund fund balance at the beginning of the year was $1,810,812.
Actual total revenues were $3,562,147; actual total expenditures were $3,429,772. The net change in fund
balance was an increase of $132,375; the fund balance at the end of the year was $1,943,187. This net
increase in fund balance is mainly the result of an increase in property tax revenues.
The Debt Service Fund fund balance at the beginning of the year was $4,509,271. Actual total revenues
were $9,011,146; actual total expenditures were $9,809,008. There were transfers into the fund in the
amount of $745,380 from the General Fund, and $374,394 from the Operations and Maintenance Fund.
The net change in fund balance was an increase of $321,912; the fund balance at the end of the year was
$4,831,183.
The Capital Projects Fund fund deficit at the beginning of the year was $100,447. Actual total revenues
were $1,798,398; actual total expenditures were $4,574,618. There was a transfer into the fund in the
amount of $2,900,000 for capital projects from the Operation and Maintenance Fund and $350,000 for
capital projects from the General Fund. The net change in fund balance was an increase of $473,780; the
fund balance at the end of the year was $373,333. This net increase in fund balance is mainly the result
of transfers into the fund, which will be used to fund future projects.
General Fund Budgetary Highlights
The District’s final budget for the General Fund (Educational and Working Cash Funds) anticipated that
expenses would exceed revenues by $3,182,883. The year ended with an actual $780,421 surplus,
resulting in a favorable variance. Actual revenues exceeded the budgeted amount by $2.0 million, resulting
from higher than budgeted revenue from other local, state and federal sources. Actual expenditures were
less than the budgeted amount by $2.0 million, resulting from $2.0 million less than budgeted general
operating expenses.
Capital Asset and Debt Administration
Capital assets
By the end of FY16, the District had invested $140 million (net of depreciation) in a broad range of capital
assets, including land, construction in progress, buildings and improvements, and equipment and vehicles
(Table 3). Additional detailed information on capital assets is in Note E to the financial statements.

Northfield Township High School District 225 Management’s Discussion and Analysis (Unaudited)
For the Year Ended June 30, 2016
-14-
Capital Asset and Debt Administration (Continued)
Capital assets (Continued)
Table 3
Capital Assets (net of depreciation)
Governmental
Activities
2015
Governmental
Activities
2016
Land $1,477,361 $1,477,361
Construction in process 5,110,139 1,045,766
Buildings and improvements 130,452,795 133,039,859
Equipment and vehicles 4,310,484 4,067,873
Total $141,350,779 $139,630,859
Long-term liabilities
Long-term debt and other long-term liabilities
The District continued to pay down its existing debt, retiring $5.9 million of outstanding bonds. The
District reports compensated absences, net pension liabilities, and other postemployment benefits as
long-term liabilities. Additional detailed information on long-term liabilities, pension obligations, and
other postemployment benefits are in Note F, Note G, and Note H to the financial statements.
Table 4
Long-Term Liabilities
2015
2016
General obligation bonds $92,453,995 $87,635,042
Other postemployment benefits 3,506,512 3,601,645
Capital lease 1,442,002 1,172,869
Compensated absences 632,502 410,376
IMRF net pension liability 3,206,740 7,113,453
TRS net pension liability 6,092,723 6,970,006
Total $107,334,474 $106,903,391

Northfield Township High School District 225 Management’s Discussion and Analysis (Unaudited)
For the Year Ended June 30, 2016
-15-
Factors bearing on the District’s Future
Following are significant issues that will affect the District’s future:
Corporate Campus Consolidation and Relocations: The Villages of Glenview and Northbrook
benefit from a strong corporate campus presence within their communities. As corporations continue
to evaluate their real estate holdings and the residential preferences of their workforce, larger suburban
corporate offices have been consolidating and relocating to metropolitan areas. While the District’s
largest representative taxpayers remain committed to our two communities, this is an area that is
closely monitored by the District as we plan for the future.
The Glen TIF: The Glen (formally known as the Glenview Naval Air Station, “GNAS”) TIF (Tax
Incremental Financing) provides that the District receives make-whole payments for new students
attending the District. A critical factor for future financial planning is the rate at which housing is
occupied and high school enrollment increases. It is anticipated that the property located in The Glen
will become part of the District’s EAV in tax year 2022. The District is working closely with the
Village of Glenview regarding the future impact of development upon student enrollment.
Property Tax Appeals: Business taxpayers have the choice of filing property tax appeals through
either the Property Tax Appeals Board (PTAB) or the Cook County Circuit Court (tax court). The
District has the right to intervene in cases filed through the PTAB or the Circuit Court for assessment
adjustments over $100,000. Over the last fifteen fiscal years, District 225 has lost over $32 million to
property tax refunds, through both the PTAB and the tax court. This is an average of $2.2 million per
year, which is included in the District’s annual operating budget. If not for the District’s intervention,
this amount would be significantly higher. The District will continue to exercise its legal right to
reduce losses through property tax appeals.
Collective Bargaining: The District successfully negotiated multi-year contracts with the Glenbrook
Education Association (G.E.A.), the Glenbrook Educational support Staff Association (G.E.S.S.A.)
and the Glenbrook Educational Support Paraprofessionals Association (G.E.S.P.A.). The negotiated
agreements are within the parameters set by the Board of Education and provide for consistency and
stability across all employee groups. The G.E.A. contract is scheduled to expire on June 30, 2018; the
G.E.S.S.A. and G.E.S.P.A. contracts are scheduled to expire on June 30, 2019.
Health Care Reform: The Patient Protection and Affordable Care Act (PPACA) and Health Care
and Education Reconciliation Act of 2010 were signed into law in the spring of 2010. The District is
pursuing legal and analytical advice from experts in the field in order to stay proactive and in full
compliance with the law. The District has also established a joint committee of school leaders and
collective bargaining representatives to review health care claim trends, and propose health benefit
plan changes for each plan renewal cycle.

Northfield Township High School District 225 Management’s Discussion and Analysis (Unaudited)
For the Year Ended June 30, 2016
-16-
Factors bearing on the District’s Future (Continued)
Student Enrollment: Recent enrollment and census data indicate a projected increase in student
enrollment over the next four years, particularly at Glenbrook South High School. Two distinct
methodologies have been implemented to measure enrollment trends on an annual basis, and have
resulted in near precise enrollment estimates since FY2014. Current District budget strategies include
provisions for future enrollment variances.
Requests for Information
This financial report is designed to provide the District’s citizens, taxpayers, and creditors with a general
overview of the District’s finances and to demonstrate the District’s accountability for the money it
receives. If you have questions about this report, or need additional financial information, contact the
Business Services Department: Northfield Township High School District 225, 3801 W. Lake Avenue,
Glenview, IL 60026.

BASIC FINANCIAL STATEMENTS

STATEMENT OF NET POSITION - GOVERNMENTAL ACTIVITIES
ASSETS
Cash and investments 84,791,621$
Receivables (net of allowance for uncollectibles):
Interest 109,792
Property taxes 52,047,599
Replacement taxes 443,231
Accounts 54,605
Intergovernmental 2,121,339
Prepaid items 356,343
Capital assets:
Land 1,477,361
Construction in progress 1,045,766
Depreciable buildings, property, and equipment, net 137,107,732
Total assets 279,555,389
DEFERRED OUTFLOW OF RESOURCES
Deferred outflows related to pensions 7,135,919
Total deferred outflows 7,135,919
LIABILITIES
Accounts payable 2,805,742
Salaries and wages payable 156,823
Claims payable 1,946,907
Other current liabilities 25,737
Due to other goverments 313,122
Interest payable 252,552
Unearned revenue 429,258
Long-term liabilities:
Due within one year 6,929,290
Due after one year 99,974,101
Total liabilities 112,833,532
DEFERRED INFLOW OF RESOURCES
Deferred inflows related to pensions 1,828,071
Property taxes levied for a future period 51,917,389
Total deferred inflows 53,745,460
NET POSITION
Net investment in capital assets 69,325,221
Restricted For:
Operations and maintenance 12,029,022
Debt service 4,578,631
Student transportation 1,782,986
Retirement benefits 1,943,187
Capital projects 373,333
Unrestricted 30,079,936
Total net position 120,112,316$
The accompanying notes are an integral part of this statement.
June 30, 2016
Northfield Township High School District 225
-17-

PROGRAM REVENUES Net (Expenses)
Operating Revenue and
Charges for Grants and Changes in
Functions / Programs Expenses Services Contributions Net Position
Governmental activities
Instruction:
Regular programs 42,178,702$ 1,006,863$ 540,076$ (40,631,763)$
Special programs 15,990,390 - 4,324,560 (11,665,830)
Other instructional programs 13,115,369 324,234 194,369 (12,596,766)
State retirement contributions 27,829,922 - 27,829,922 -
Support services:
Pupils 11,035,046 - - (11,035,046)
Instructional staff 3,938,780 - 57,959 (3,880,821)
General administration 2,910,467 - - (2,910,467)
School administration 7,729,428 - - (7,729,428)
Business 2,125,080 39,808 - (2,085,272)
Transportation 2,940,055 660,266 1,256,872 (1,022,917)
Operations and maintenance 10,268,457 745,979 - (9,522,478)
Central 6,126,019 - - (6,126,019)
Other supporting services - - 192,428 192,428
Community services 149,853 - - (149,853)
Interest and fees 4,245,124 - - (4,245,124)
Unallocated depreciation 2,073,036 - - (2,073,036)
Total governmental activities 152,655,728$ 2,777,150$ 34,396,186$ (115,482,392)$
General revenues:
Taxes:
Real estate taxes, levied for general purposes 91,013,665
Real estate taxes, levied for specific purposes 6,678,026
Real estate taxes, levied for debt service 8,810,339
Personal property replacement taxes 2,148,606
Other payments in lieu of taxes 6,850,781
State aid-formula grants 1,648,367
Investment earnings 296,712
Miscellaneous 1,224,208
Total general revenues 118,670,704
Change in net position 3,188,312
Net position, beginning of year 116,924,004
Net position, end of year 120,112,316$
The accompanying notes are an integral part of this statement.
For the Year Ended June 30, 2016
STATEMENT OF ACTIVITIES
Northfield Township High School District 225
-18-
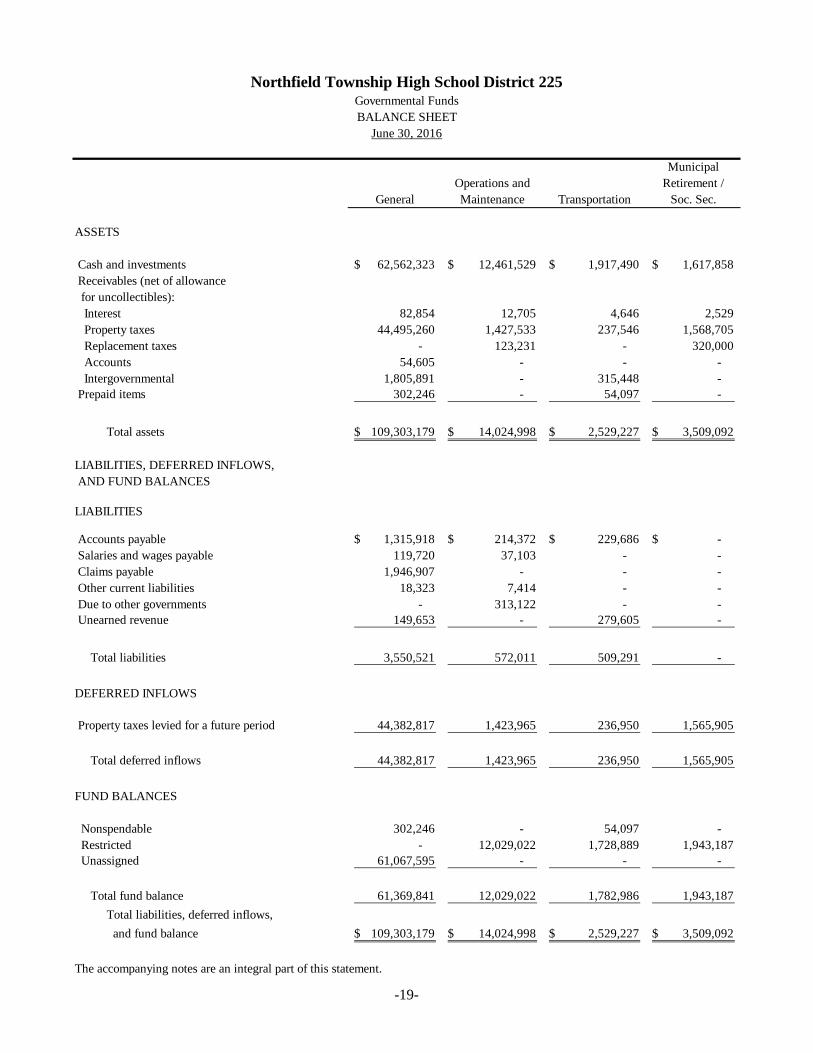
Municipal
Operations and Retirement /
General Maintenance Transportation Soc. Sec.
ASSETS
Cash and investments 62,562,323$ 12,461,529$ 1,917,490$ 1,617,858$
Receivables (net of allowance
for uncollectibles):
Interest 82,854 12,705 4,646 2,529
Property taxes 44,495,260 1,427,533 237,546 1,568,705
Replacement taxes - 123,231 - 320,000
Accounts 54,605 - - -
Intergovernmental 1,805,891 - 315,448 -
Prepaid items 302,246 - 54,097 -
Total assets 109,303,179$ 14,024,998$ 2,529,227$ 3,509,092$
LIABILITIES, DEFERRED INFLOWS,
AND FUND BALANCES
LIABILITIES
Accounts payable 1,315,918$ 214,372$ 229,686$ -$
Salaries and wages payable 119,720 37,103 - -
Claims payable 1,946,907 - - -
Other current liabilities 18,323 7,414 - -
Due to other governments - 313,122 - -
Unearned revenue 149,653 - 279,605 -
Total liabilities 3,550,521 572,011 509,291 -
DEFERRED INFLOWS
Property taxes levied for a future period 44,382,817 1,423,965 236,950 1,565,905
Total deferred inflows 44,382,817 1,423,965 236,950 1,565,905
FUND BALANCES
Nonspendable 302,246 - 54,097 -
Restricted - 12,029,022 1,728,889 1,943,187
Unassigned 61,067,595 - - -
Total fund balance 61,369,841 12,029,022 1,782,986 1,943,187
Total liabilities, deferred inflows,
and fund balance 109,303,179$ 14,024,998$ 2,529,227$ 3,509,092$
The accompanying notes are an integral part of this statement.
Northfield Township High School District 225Governmental Funds
BALANCE SHEET
June 30, 2016
-19-

Debt Capital
Service Projects Total
4,814,896$ 1,417,525$ 84,791,621$
5,484 1,574 109,792
4,318,555 - 52,047,599
- - 443,231
- - 54,605
- - 2,121,339
- - 356,343
9,138,935$ 1,419,099$ 139,924,530$
-$ 1,045,766$ 2,805,742$
- - 156,823
- - 1,946,907
- - 25,737
- - 313,122
- - 429,258
- 1,045,766 5,677,589
4,307,752 - 51,917,389
4,307,752 - 51,917,389
- - 356,343
4,831,183 373,333 20,905,614
- - 61,067,595
4,831,183 373,333 82,329,552
9,138,935$ 1,419,099$ 139,924,530$
-20-

Amounts reported for governmental activities in the statement of net position are different because:
Total fund balances - governmental funds $ 82,329,552
139,630,859
Deferred outflows of resources related to pensions 5,959,474$
Deferred outflows of 2016 employer contributions related to pensions 1,176,445 7,135,919
(1,828,071)
(106,903,391)
(252,552)
Net position of governmental activities $ 120,112,316
The accompanying notes are an integral part of this statement.
Interest on long-term liabilities accrued in the statement of net position will not be paid with
current financial resources and, accordingly, are not included in the governmental funds
balance sheet.
Northfield Township High School District 225RECONCILIATION OF THE BALANCE SHEET OF GOVERNMENTAL
FUNDS TO THE STATEMENT OF NET POSITION
June 30, 2016
Net capital assets used in governmental activities and included in the statement of net
position do not require the expenditure of financial resources and, therefore, are not
reported in the governmental funds balance sheet.
Long-term liabilities included in the statement of net position are not due and payable in the
current period and, accordingly, are not included in the governmental funds balance sheet.
Deferred outflows and inflows or resources related to pensions are applicable to future
periods and, therefore, are not reported in the governmental funds:
Deferred inflows of resources related to pensions
-21-

Municipal
Operations and Retirement /
General Maintenance Transportation Soc. Sec.
Revenues
Property taxes 91,013,665$ 2,945,018$ 490,861$ 3,242,147$
Replacement taxes - 1,828,606 - 320,000
State aid 31,370,269 - 1,256,872 -
Federal aid 3,224,984 - - -
Interest 261,776 20,376 6,181 -
Other 2,004,370 6,389,105 660,266 -
Total revenues 127,875,064 11,183,105 2,414,180 3,562,147
Expenditures
Current:
Instruction:
Regular programs 37,047,123 - - 590,815
Special programs 15,660,723 - - 309,974
Other instructional programs 12,765,615 - - 383,884
State retirement contributions 27,829,922 - - -
Support services:
Pupils 10,543,829 - - 461,329
Instructional staff 3,672,665 - - 118,841
General administration 2,828,425 - - 77,430
School administration 7,048,629 - - 274,058
Business 1,975,191 173,163 - 107,509
Transportation 48,902 - 2,885,849 3,207
Operations and maintenance 1,728,037 7,328,089 - 727,479
Central 5,378,155 46,455 - 325,388
Community services 95,492 - - 49,858
Debt service:
Principal - - - -
Interest and other - - - -
Capital outlay 471,935 178,542 - -
Total expenditures 127,094,643 7,726,249 2,885,849 3,429,772
Excess (deficiency) of revenues
over expenditures 780,421 3,456,856 (471,669) 132,375
Other financing sources (uses)
Transfers in - - - -
Transfers out (1,095,380) (3,274,394) - -
Proceeds from capital lease 460,330 - - -
Total other financing sources (uses) (635,050) (3,274,394) - -
Net change in fund balance 145,371 182,462 (471,669) 132,375
Fund balance (deficit), beginning of year 61,224,470 11,846,560 2,254,655 1,810,812
Fund balance, end of year 61,369,841$ 12,029,022$ 1,782,986$ 1,943,187$
Northfield Township High School District 225Governmental Funds
STATEMENT OF REVENUES, EXPENDITURES, AND CHANGES IN FUND BALANCES (DEFICIT)
For the Year Ended June 30, 2016
The accompanying notes are an integral part of this statement.
-22-

Debt Capital
Service Projects Total
8,810,339$ -$ 106,502,030$
- - 2,148,606
- - 32,627,141
192,428 - 3,417,412
8,379 - 296,712
- 1,798,398 10,852,139
9,011,146 1,798,398 155,844,040
- - 37,637,938
- - 15,970,697
- - 13,149,499
- - 27,829,922
- - 11,005,158
- - 3,791,506
- - 2,905,855
- - 7,322,687
- 600 2,256,463
- - 2,937,958
- - 9,783,605
- - 5,749,998
- - 145,350
6,664,463 - 6,664,463
3,144,545 - 3,144,545
- 4,574,018 5,224,495
9,809,008 4,574,618 155,520,139
(797,862) (2,776,220) 323,901
1,119,774 3,250,000 4,369,774
- - (4,369,774)
- - 460,330
1,119,774 3,250,000 460,330
321,912 473,780 784,231
4,509,271 (100,447) 81,545,321
4,831,183$ 373,333$ 82,329,552$
-23-

Amounts reported for governmental activities in the statement of activities are different because:
Net change in fund balances - total governmental funds $ 784,231
(1,719,920)
15,468
2,596,935
1,080,515
230,039
201,044
Change in net position - governmental activities $ 3,188,312
The accompanying notes are an integral part of this statement.
The issuance of long-term debt provides current financial resources to governmental funds,
while the repayment of the principal of long-term debt consume the current financial resources
of the government funds.
Governmental funds report the effect of premiums and discounts when the debt is issued.
However, these amounts are deferred and amortized in the statement of activities. This is the
amount of the current year, net effect of these differences.
Northfield Township High School District 225RECONCILIATION OF THE STATEMENT OF REVENUES, EXPENDITURES, AND CHANGES IN
FUND BALANCES OF GOVERNMENTAL FUNDS TO THE STATEMENT OF ACTIVITIES
For the Year Ended June 30, 2016
Governmental funds report capital outlays as expenditures. However, in the statement of
activities, the cost of those assets is allocated over their estimated useful lives and reported as
depreciation expense. This is the amount by which depreciation expense exceeds capital
outlay in the current period.
Accrued interest reported in the statement of activities does not require the use of current
financial resources and, therefore, is not reported as expenditures in the governmental funds.
This is the amount of net change during the year.
Changes in deferred outflows and inflows or resources related to pensions are reported only in
the statement of activities:
Deferred outflow and inflows or resources related to IMRF pension
Deferred outflow and inflows or resources related to TRS pension
-24-

Student Private Purpose
Activity Trust
Fund Fund
ASSETS
Cash and investments 1,545,431$ 291,337$
LIABILITIES
Due to student groups 1,545,431 -
NET ASSETS HELD IN TRUST FOR EXTERNAL PARTIES - $ 291,337$
The accompanying notes are an integral part of this statement.
Northfield Township High School District 225Fiduciary Funds
STATEMENT OF FIDUCIARY NET POSITION
June 30, 2016
-25-

Private Purpose
Trust
Fund
ADDITIONS
Fundraising and fee revenue 728,495$
Interest income 398
Total additions 728,893
DEDUCTIONS
Personnel expenses 437,879
Administrative expenses 205,960
Total deductions 643,839
Changes in net position 85,054
Net position, beginning of year 206,283
Net position, end of year 291,337$
Northfield Township High School District 225Fiduciary Funds
STATEMENT OF CHANGES IN FIDUCIARY NET POSITION
For the fiscal year ended June 30, 2016
The accompanying notes are an integral part of this statement.
-26-

NOTE A - SUMMARY OF SIGNIFICANT ACCOUNTING POLICIES
The more significant of the District's accounting policies are described below.
1. Reporting Entity
2. New Accounting Pronouncement
Northfield Township High School District 225NOTES TO THE FINANCIAL STATEMENTS
June 30, 2016
The financial statements of Northfield Township High School District 225 (the District) have been prepared in
conformity with accounting principles generally accepted in the United States of America as applied to government
units (hereinafter referred to as generally accepted accounting principles (GAAP)). The Governmental Accounting
Standards Board (GASB) is the standard-setting body for establishing governmental accounting and financial
reporting principles.
The District is located in Cook County, Illinois. The District is governed by an elected Board of Education.
The Board of Education maintains final responsibility for all budgetary, taxing, and debt matters.
The District includes all funds of its operations that are controlled by or dependent upon the District as
determined on a basis of financial accountability. Financial accountability includes appointment of the
organization's governing body, imposition of will, and fiscal dependency. The accompanying financial
statements include only those funds of the District, as there are no organizations for which it has financial
accountability.
Also, the District is not included as a component unit in any other governmental reporting entity, as defined by
GASB pronouncements.
The Governmental Accounting Standards Board (GASB) has issued Statement No. 72, Fair Value
Measurement and Application, issued in February 2015, which was implemented by the District during the
fiscal year ended June 30, 2016. This Statement addresses accounting and financial reporting issues related to
fair value measurements. This Statement provides guidance for determining fair value measurement for
financial reporting purposes. This Statement also provides guidance for applying fair value to certain
investments and disclosures related to all fair value investments.
-27-

Northfield Township High School District 225NOTES TO THE FINANCIAL STATEMENTS
June 30, 2016
NOTE A - SUMMARY OF SIGNIFICANT ACCOUNTING POLICIES (Continued)
3. Fund Accounting
4. Government-Wide and Fund Financial Statements
The accounts of the District are organized on the basis of funds. A fund is an independent fiscal and
accounting entity with a self-balancing set of accounts. Fund accounting segregates funds according to their
intended purpose and is used to aid management in demonstrating compliance with finance-related and
contractual provisions. The minimum number of funds maintained are consistent with legal and managerial
requirements.
Funds are classified into the following categories: governmental and fiduciary.
Governmental funds are used to account for all or most of the District's general activities, including the
collection and disbursement of earmarked monies (special revenue funds) and the servicing of general long-
term debt (Debt Service Fund), and the acquisition or construction of major capital facilities (Capital Projects
Fund). The General Fund is used to account for all activities of the general government not accounted for in
some other fund. The District considers all governmental funds to be major.
Fiduciary funds are used to account for assets held on behalf of outside parties, including other governments,
or on behalf of other funds within the District.
The government-wide financial statements (i.e., the statement of net position and the statement of activities)
report information on all the nonfiduciary activities of the District. The effect of interfund activity has been
eliminated from these statements. Governmental activities normally are supported by property taxes,
intergovernmental revenues, and local fees.
The statement of activities demonstrates the degree to which the direct expenses of a given function are offset
by program revenues. Direct expenses are those that are clearly identifiable with a specific function. Program
revenues include (1) amounts paid by recipient of goods or services offered by the program and (2) grants and
contributions that are restricted to meeting the operational or capital requirements of a particular function.
Taxes and other items not properly included among program revenues are reported as general revenues.
Separate financial statements are provided for governmental funds and fiduciary funds, even though the latter
are excluded from the government-wide financial statements.
-28-

Northfield Township High School District 225NOTES TO THE FINANCIAL STATEMENTS
June 30, 2016
NOTE A - SUMMARY OF SIGNIFICANT ACCOUNTING POLICIES (Continued)
4. Government-Wide and Fund Financial Statements (Continued)
a.
b.
c. Debt Service
Debt Service Fund - accounts for accumulation of resources for, and the payment of, general long-term
debt principal, interest, and related costs. The primary revenue source is local property taxes levied
specifically for debt service and transfers from other funds.
The General Fund includes the Educational Account and the Working Cash Account. The Educational
Account is the District's primary operating account. It accounts for all financial resources of the general
government, except those required to be accounted for in another fund. The Working Cash Account is for
the financial resources held by the District to be used as temporary interfund loans for working capital
requirements. Money loaned by the Working Cash Account to other funds must be repaid within one year.
As allowed by the School Code of Illinois, this Account may be permanently abolished and become part of
the Educational Account, or it may be partially abated to any fund in need as long as the District maintains
a balance in the Working Cash Account of at least 0.05% of the District's current equalized assessed
valuation.
Special Revenue Funds
The special revenue funds are used to account for the proceeds of specific revenue sources (other than those
accounted for in the Debt Service, Capital Projects, or fiduciary funds) that are legally restricted to
expenditures for specified purposes.
Each of the District's special revenue funds has been established as a separate fund in accordance with the
fund structure required by the state of Illinois for local educational agencies. These funds account for local
property taxes restricted to specific purposes. A brief description of the District's special revenue funds are
as follows:
Operations and Maintenance Fund - accounts for all revenues and expenditures made for operations,
repair, and maintenance of the District's buildings and land. Revenue consists primarily of local property
taxes and personal property replacement taxes.
Transportation Fund - accounts for all revenue and expenditures made for student transportation. Revenue
is derived primarily from local property taxes and state reimbursement grants.
General Fund
Municipal Retirement/Social Security Fund - accounts for the District's portion of pension contributions to
the Illinois Municipal Retirement Fund, payments to Medicare, and payments to the Social Security System
for noncertified employees. Revenue to finance contributions is derived primarily from local property taxes
and personal property replacement taxes.
-29-

Northfield Township High School District 225NOTES TO THE FINANCIAL STATEMENTS
June 30, 2016
NOTE A - SUMMARY OF SIGNIFICANT ACCOUNTING POLICIES (Continued)
4. Government-Wide and Fund Financial Statements (Continued)
d.
e.
5. Measurement Focus, Basis of Accounting, and Basis of Presentation
Capital Projects Fund - accounts for financial resources to be used for the acquisition or construction of
major capital facilities. Revenues are derived from bond proceeds and transfers from other funds.
Fiduciary Fund
Capital Projects Fund
The fiduciary funds account for assets held by the District in a trustee capacity or as an agent for
individuals, private organizations, other governments, or other funds.
The Student Activity Funds are custodial in nature (assets equal liabilities) and do not involve the
measurement of the results of operations. These funds account for assets held by the District which are
owned, operated, and managed generally by the student body, under the guidance and direction of adults or
a staff member, for educational, recreational, or cultural purposes. It accounts for activities such as student
yearbook, student clubs and council, and scholarships.
The Private Purpose Trust Fund is accounted for on the flow of economic resources measurement focus
and uses the accrual basis of accounting. Under this method, revenues are recorded when earned and
expenses are recorded at the time liabilities are incurred. This fund accounts for the activity of Glenbrook
Aquatics, a year-round aquatics program run by the District.
The government-wide financial statements are reported using the economic resources measurement focus and
the accrual basis of accounting. Revenues and additions are recorded when earned, and expenses and
deductions are recorded when a liability is incurred. Property taxes are recognized as revenues in the year for
which they are levied (i.e. intended to finance). Grants and similar items are recognized as revenue as soon as
all eligibility requirements imposed by the provider have been met.
Governmental funds are used to account for the District's general governmental activities. Governmental fund
types use the flow of current financial resources measurement focus and the modified accrual basis of
accounting. Under the modified accrual basis of accounting, revenues are recognized when susceptible to
accrual, i.e., when they are both "measurable and available". "Measurable" means that the amount of the
transaction can be determined, and "available" means collectible within the current period or soon enough
thereafter to be used to pay liabilities of the current period. The District considers most revenues available if
they are collected within 60 days after year-end. Revenues that are paid to the District by the Illinois State
Board of Education are considered available if they are vouchered by year-end. Expenditures are recorded
when the related fund liability is incurred, except for unmatured principal and interest on general long-term
debt, which is recognized when due, and certain compensated absences, claims, and judgments, which are
recognized when the obligations are expected to be liquidated with expendable available financial resources.
-30-

Northfield Township High School District 225NOTES TO THE FINANCIAL STATEMENTS
June 30, 2016
NOTE A - SUMMARY OF SIGNIFICANT ACCOUNTING POLICIES (Continued)
5. Measurement Focus, Basis of Accounting, and Basis of Presentation (Continued)
6. Deferred Outflows / Deferred Inflows
7. Fund Balance
a.
b.
Property taxes, replacement taxes, interest, and intergovernmental revenues associated with the current fiscal
period are all considered to be susceptible to accrual and are recognized as revenues of the current fiscal
period. All other revenue items are considered to be measurable and available only when cash is received by
the District.
The District reports unearned and unavailable revenue on its financial statements. Unearned and unavailable
revenue arises when a potential revenue does not meet both the "measurable" and "available" criteria for
recognition in the current period. In subsequent periods, when both revenue recognition criteria are met, or
when the District has a legal claim to the resources, the liability or deferred inflow of resources for unearned or
unavailable revenue is removed from the balance sheet and revenue is recognized. Governmental Funds also
defer revenue recognition in connection with resources received, but not yet earned.
In addition to assets, the statement of net position and the governmental funds balance sheet may report
deferred outflows of resources. Deferred outflows of resources represent a consumption of net position / fund
balance that applies to future periods. At June 30, 2016, the District reported deferred outflows of resources
related to pension liabilities. In addition to liabilities, the District may report deferred inflows of resources.
Deferred inflows of resources represent the acquisition of resources that is applicable to future reporting
periods. At June 30, 2016, the District reported deferred inflows related to property taxes levied for a future
period and pension liabilities.
The governmental funds report five components of fund balance: nonspendable, restricted, committed,
assigned, and unassigned.
Nonspendable - includes amounts that cannot be spent because they are either not in spendable form or
legally or contractually required to be maintained intact. The nonspendable in form criteria includes items
that are not expected to be converted to cash such as prepaid items or inventories.
Restricted - refers to amounts that are subject to outside restrictions such as creditors, grantors,
contributors, laws and regulations of other governments, or imposed by law through enabling legislation.
Special revenue funds as well as debt service and capital projects funds are by definition restricted for those
specified purposes.
The fiduciary fund statements are reported using the accrual basis of accounting.
-31-

Northfield Township High School District 225NOTES TO THE FINANCIAL STATEMENTS
June 30, 2016
NOTE A - SUMMARY OF SIGNIFICANT ACCOUNTING POLICIES (Continued)
7. Fund Balance (Continued)
c.
d.
e.
8. Deposits and Investments
Unless specifically identified, expenditures act to reduce restricted balances first, then committed balances,
next assigned balances, and finally they act to reduce unassigned balances. Expenditures for a specifically
identified purpose will act to reduce the specific classification of fund balance that is identified.
The District also has a contingency reserve policy. The policy states that unassigned reserves in the operating
funds shall be maintained at a level equal to not less than 33.0% of the next year's projected operating budget.
The operating budget is composed of the Educational, Operations and Maintenance, Transportation, Municipal
Retirement/Social Security, Working Cash Funds, and any other fund, as may be required by state law.
Committed - refers to amounts that can only be used for specific purposes pursuant to constraints imposed
by formal action of the District's highest level of decision making authority (the Board of Education). The
Board of Education commits fund balances by passing a resolution. Amounts committed cannot be used for
any purpose unless the District removes or changes the specific use by taking the same type of formal
action it employed to previously commit those funds. As of June 30, 2016, the District had no committed
fund balances.
Assigned - refers to amounts that are constrained by the District's intent to be used for a specific purpose,
but are neither restricted or committed. Intent may be expressed by the Board of Education or the
individual the Board of Education delegates the authority to assign amounts to be used for specific
purposes. The Board of Education delegated this authority to the Assistant Superintendent for Business
Services/CSBO. As of June 30, 2016, the District has no assigned fund balances.
The Illinois Compiled Statutes require the District to utilize the investment services of the Northfield Township
School Treasurer (the Treasurer). Investments are stated at cost, amortized cost, or net asset value (NAV) per
share, as disclosed in the related notes. No amortization is made to interest income for discounted federal
securities. Gains and losses on the sale of investments are recorded as interest income at the date of sale or
maturity.
Unassigned - refers to all spendable amounts not contained in the other four classifications described
above. In funds other than the general fund, the unassigned classification is used only to report a deficit
balance resulting from overspending for specific purposes for which amounts had been restricted,
committed, or assigned.
The nonspendable fund balance in the General Fund and Transportation Fund consists of $302,246 and
$54,097, respectively, for prepaid items.
-32-

Northfield Township High School District 225NOTES TO THE FINANCIAL STATEMENTS
June 30, 2016
NOTE A - SUMMARY OF SIGNIFICANT ACCOUNTING POLICIES (Continued)
9. Personal Property Replacement Taxes
10. Prepaid Items
11. Capital Assets
Assets Years
Land improvements 20 - 40
Buildings 40
Equipment 5 - 15
Vehicles 8
12. Long-Term Obligations
In the government-wide financial statements, long-term debt and other long-term obligations are reported as
liabilities in the statement of net position. Bond premiums and discounts and losses on refunding are deferred
and amortized over the life of the bonds. Bonds payable are reported net of the applicable bond premium or
discount or loss on refunding. Bond issuance costs are expensed as incurred.
In the fund financial statements, governmental funds recognize bond premiums and discounts, losses on
refunding, and bond issuance costs during the current period. The face amount of debt issued is reported as
other financing sources. Premiums received on debt issuances are reported as other financing sources, while
discounts on debt issuances are reported as other financing uses. Issuance costs are reported as debt service
expenditures.
Personal property replacement tax revenues are first allocated to the Municipal Retirement/Social Security
Fund, with the balance allocated at the discretion of the District.
Capital assets, which include land, construction in progress, land improvements, buildings, vehicles, and
equipment, are reported in the government-wide financial statements. Capital assets are defined by the District
as assets with an initial individual or group cost of more than $2,500 and an estimated useful life in excess of
one year. Such assets are recorded at historical cost or estimated historical cost if purchased or constructed.
Donated capital assets are recorded at acquisition value at the date of donation.
The costs of normal maintenance and repairs that do not add to the value of the asset or materially extend
assets' lives are not capitalized.
Depreciation of capital assets is provided over the estimated useful lives using the straight-line method. The
estimated useful lives are as follows:
Certain payments to vendors that reflect costs applicable to future accounting periods are recorded as prepaid
items in both the government-wide and fund financial statements. The costs of prepaid items is recorded as
expenditures when consumed rather than when purchased.
-33-

Northfield Township High School District 225NOTES TO THE FINANCIAL STATEMENTS
June 30, 2016
NOTE A - SUMMARY OF SIGNIFICANT ACCOUNTING POLICIES (Continued)
13. Accumulated Unpaid Vacation and Sick Pay
14. Use of Estimates
15. Budgetary Data
Employees who work a twelve-month year are entitled to be compensated for vacation time. Vacations are
usually taken within the calendar year. Accrued but unpaid vacation leave at June 30, 2016 has been reflected
as a liability. All accrued vacation is considered a long-term liability, with a portion reported as due within
one year. When a certified employee with 120 or more days of service resigns from the District, he/she receives
payment for up to 15 days of unused accrued vacation time payable at their current salary rate.
A liability for these amounts is only reported in governmental funds if they have matured, for example, as a
result of employee termination, resignation, or retirements. These amounts are recorded in the fund from
which the employees who have accumulated vacation leave are paid.
All certified employees receive a specified number of sick days per year depending on their years of service, in
accordance with the agreement between the Board of Education and the Education Association. Unused sick
leave days accumulate to a maximum of 360 days. Upon retirement, a certified employee may apply up to 180
days of unused sick leave toward service credit for the Teachers' Retirement System (TRS). Upon retirement,
a member of the Illinois Municipal Retirement Fund (IMRF) may apply up to 221 days of unused sick leave
toward IMRF service credit.
Educational support personnel receive 11 vacation days per year, which can accumulate up to a maximum of
15 days. The District reimburses employees for unused accrued vacation days remaining upon termination of
employment at their current salary rate.
In preparing financial statements, management is required to make estimates and assumptions that affect the
reported amounts of assets, deferred outflows of resources, liabilities and deferred inflows of resources and
disclosure of contingent assets, deferred outflows of resources, liabilities, and deferred inflows of resources at
the date of the financial statements, and the reported amounts of revenues and expenses/expenditures during
the reporting period. Actual results could differ from those estimates.
Budgets are adopted on a basis consistent with generally accepted accounting principles, except for the
General Fund which does not budget for on-behalf pension payments from the State of Illinois. Annual
budgets are adopted at the fund level for the governmental funds. The annual budget is legally enacted and
provides for a legal level of control at the fund level. All annual budgets lapse at fiscal year-end.
Due to the nature of the policies on sick leave, and the fact that any liability is contingent upon future events,
and cannot be reasonably determined, no liability for unused sick leave has been reported within the financial
statements. The General and Operations and Maintenance Funds are used to liquidate the liability for
compensated absences.
-34-

Northfield Township High School District 225NOTES TO THE FINANCIAL STATEMENTS
June 30, 2016
NOTE A - SUMMARY OF SIGNIFICANT ACCOUNTING POLICIES (Continued)
16. Pensions
17. Restricted Net Position
NOTE B - RECONCILIATION OF GOVERNMENT-WIDE AND FUND FINANCIAL STATEMENTS
1.
$ (86,122,192)
(1,172,869)
(1,512,850)
(410,376)
(7,113,453)
(6,970,006)
(3,601,645)
$ (106,903,391)
Capital lease
Unamortized bond premium and discount, net
Compensated absences
Other postemployment benefit obligations
Explanation of Certain Differences Between the Governmental Funds Balance Sheet and the Government-
wide Statement of Net Position
General obligation bonds
For purposes of measuring the net pension liability, deferred outflows of resources and deferred inflows of
resources related to pensions, and pension expense, information about the fiduciary net position of the pension
plan and additions to/deductions from the pension plan's fiduciary net position have been determined on the
same basis as they are reported by the pension plan. For this purpose, benefit payments (including refunds of
employee contributions) are recognized when due and payable in accordance with the benefit terms.
Investments are at fair value.
The governmental funds balance sheet includes a reconciliation between fund balance - total governmental
funds and net position - governmental activities as reported in the government-wide statement of net position.
One element of that reconciliation explains that "Long-term liabilities included in the statement of net position
are not due and payable in the current period and, accordingly, are not reported in the governmental funds
balance sheet." The details of this difference are as follows:
IMRF net pension liability
TRS net pension liability
For the government-wide financial statements, net position is reported as restricted when constraints placed on
net position are either: (1) externally imposed by creditors (such as debt covenants), grantors, contributors, or
laws or regulations of other governments, (2) imposed by law through constitutional provisions, or (3) imposed
by enabling legislation. The District's restricted net position was restricted as a result of enabling legislation.
When both restricted and unrestricted resources are available for use, it is the District's policy to use restricted
resources first, and then unrestricted resources, as the resources are needed.
Net adjustment to reduce fund-balance total governmental funds
to arrive at net position - governmental activities
-35-

Northfield Township High School District 225NOTES TO THE FINANCIAL STATEMENTS
June 30, 2016
NOTE B - RECONCILIATION OF GOVERNMENT-WIDE AND FUND FINANCIAL STATEMENTS
(Continued)
2.
$ 5,741,021
(7,460,941)
$ (1,719,920)
$ 5,935,000
729,463
(460,330)
Accretion of capital appreciation bonds (1,317,091)
222,126
(3,906,713)
(877,283)
(95,133)
$ 230,039
Net adjustment to decrease net change in fund balances - total
governmental funds to arrive at change in net position of
governmental activities
Principal repayments
General obligation bonds
Explanation of Certain Differences Between the Governmental Funds Statement of Revenues, Expenditures,
and Changes in Fund Balances and the Government-wide Statement of Activities
Capital outlay
Depreciation expense
The governmental funds statement of revenues, expenditures, and changes in fund balance includes a
reconciliation between net changes in fund balance - total governmental funds and changes in net position -
governmental activities as reported in the government-wide statement of activities. One element of that
reconciliation explains that "Governmental funds report capital outlays as expenditures. However, in the
statement of activities, the cost of those assets is allocated over their estimated useful lives and reported as
depreciation expense." The details of this difference are as follows:
Another element of that reconciliation states that "The issuance of long-term debt provides current financial
resources to governmental funds, while the repayment of the principal of long-term debt and increase in
compensated absences consume the current financial resources of the governmental funds." The details of this
difference are as follows:
Capital leases
Issuance of capital lease
Compensated absences, net
Net adjustment to increase net change in fund balances - total
governmental funds to arrive at change in net position of
governmental activities.
TRS pension expense, net
IMRF pension expense, net
Other postemployment benefit obligations, net
-36-

Northfield Township High School District 225NOTES TO THE FINANCIAL STATEMENTS
June 30, 2016
NOTE C - DEPOSITS AND INVESTMENTS
At June 30, 2016, the District's cash and investments consisted of the following:
Governmental Fiduciary Total
$ 84,791,621 $ 1,836,768 $ 86,628,389
Total
$ 100
69,439,507
2,258,027
4,650,000
10,280,755
$ 86,628,389
At June 30, 2016, the District's investments consisted of the following:
Percentage
Amortized Cost Maturity of Total
$ 1,997,543 07/15/16 19.43 %
1,198,224 07/29/16 11.66
4,491,131 08/15/16 43.68
2,593,857 08/31/16 25.23
$ 10,280,755
1.
US Govt-Gov't. Agencies
Illinois School District Liquid Asset Fund Plus
Illinois Institutional Investors Trust
* Includes accounts held in demand and savings accounts, but primarily consists of money market savings
accounts and certificates of deposit that are valued at cost.
Investments
Cash and investments
For disclosure purposes, cash held by the District and Treasurer is segregated into three components as
follows:
Cash on hand
Investment Type
US Govt-Gov't. Agencies
US Govt-Gov't. Agencies
US Govt-Gov't. Agencies
Cash and Investments Under the Custody of the Township Treasurer
The Treasurer's and the District's investment policies are in line with State Statutes. The investments that the
District may purchase are limited by Illinois law to the following: (1) securities that are fully guaranteed by the
U.S. government as to principal and interest; (2) certain U.S. government agency securities; (3) interest-
bearing savings accounts, interest-bearing certificates of deposit or time deposits or any other investments
constituting direct obligations of any bank as defined by the Illinois Banking Act; (4) short-term discount
obligations of corporations organized in the United States with assets exceeding $500,000,000; (5) interest-
bearing bonds of any county, township, city, village, incorporated town, municipal corporation or school
district; (6) fully collateralized repurchase agreements; (7) the State Treasurer's Illinois and Prime Funds; and
(8) money market mutual funds and certain other instruments.
Deposits with financial institutions*
-37-

Northfield Township High School District 225NOTES TO THE FINANCIAL STATEMENTS
June 30, 2016
NOTE C - DEPOSITS AND INVESTMENTS (Continued)
1.
2.
The Treasurer also holds money market-type investments, government agency investments, and deposits with
financial institutions, including certificates of deposit. As of June 30, 2016, the value of all cash and
investments held by the Treasurer's office was $84,262,742.
Interest Rate Risk
As explained in Note A, the Illinois Compiled Statutes require the District to utilize the investment services of
the Township School Treasurer (the Treasurer). As such, the Treasurer is the lawful custodian of these school
funds. The Treasurer is appointed by the Township Treasurer's Board of Trustees, an independently elected
body, to serve the school districts in the township. The investment policies are established by the Treasurer,
which are in line with state statutes. The Treasurer is the direct recipient of property taxes, replacement taxes,
and most state and federal aid, and disburses school funds upon lawful order to the School Board. The
Treasurer invests excess funds at his discretion, subject to the legal restrictions discussed above.
District cash and investments (other than the student activity and imprest funds) are held by the Township
Treasurer. The Treasurer maintains records that segregate the cash and investment balances by district. Cash
for all funds, including cash applicable to the Debt Service Fund and the Municipal Retirement/Social Security
Fund, is not deemed available for purposes other than those for which these balances are intended.
The Illinois Institutional Investors Trust (IIIT) is a qualified external investment pool formed pursuant to the
Illinois School Code and managed by a Board of Trustees, elected from participating members. Investments
are measured at NAV per share using the amortized cost basis provided by the pool. There are no funded
commitments and no redemption limitation or notice period.
Cash and Investments Under the Custody of the Township Treasurer (Continued)
Credit Risk
Credit risk is the risk that an issuer or other counterparty to an investment will not fulfill its obligations. The
Illinois School District Liquid Asset Fund Plus (ISDLAF+) is a qualified external investment pool formed
pursuant to the Illinois Municipal Code and managed by a Board of Trustees, elected from participating
members. Investments are measured at NAV per share, using the amortized cost basis provided by the pool.
There are no funded commitments and no redemption limitation or notice period.
The District's investment policy, which is the same as the Treasurer's office, seeks to ensure preservation of
capital in the District's overall portfolio. The highest return on investments is sought, consistent with the
preservation of principal and prudent investment principles. The investment portfolio is required to provide
sufficient liquidity to pay District obligations as they come due, considering maturity and marketability. The
investment portfolio is also required to be diversified as to maturities and investments, as appropriate to the
nature, purpose, and amount of funds.
-38-

Northfield Township High School District 225NOTES TO THE FINANCIAL STATEMENTS
June 30, 2016
NOTE C - DEPOSITS AND INVESTMENTS (Continued)
3.
4.
5.
NOTE D - PROPERTY TAXES RECEIVABLE
The Cook County Assessor is responsible for the assessment of all taxable real property within Cook County
except for certain railroad property, which is assessed directly by the state. One-third of the county is reassessed
every year by the Assessor.
Cash and Investments in the Custody of the District
At June 30, 2016, the carrying value of the District's student activity fund and private purpose trust fund was
$1,836,768, all of which was deposited with financial institutions and fully insured or collateralized.
Concentration of Credit Risk
The District's investment policy requires diversification of the investment portfolio to minimize the risk of loss
resulting from overconcentration in a particular type of security, risk factor, issuer, or maturity. The policy
requires diversification strategies to be determined and revised periodically by the District's Investment Officer
(Treasurer) to meet the District's ongoing need for safety, liquidity, and rate of return.
Custodial Credit Risk
With respect to deposits, custodial credit risk is the risk that, in the event of a bank failure, the District's
deposits may not be returned to it. The District's investment policy limits the exposure to deposit custodial
credit risk by requiring all deposits in excess of FDIC insurable limits to be secured by collateral in the event
of default or failure of the financial institution holding the funds.
With respect to investments, custodial credit risk is the risk that, in the event of the failure of the counterparty,
the District will not be able to recover the value of its investments or collateral securities that are in the
possession of an outside party.
The District must file its tax levy resolution by the last Tuesday in December of each year. The tax levy resolution
was approved by the Board on December 14, 2015. The District's property tax is levied each year on all taxable
real property located in the District and becomes a lien on the property on January 1 of that year. The owner of
real property on January 1 (the lien date), in any year, is liable for taxes of that year. The District's annual
property tax levy is subject to two statutory limitations; individual fund rate ceilings and the Property Tax
Extension Limitation Law (PTELL).
The PTELL limitation is applied in the aggregate to the total levy (excluding certain levies for the repayment of
debt). PTELL limits the increase in total taxes billed to the lesser of 5% or the percentage increase in the
Consumer Price Index (CPI) for the preceding year. The amount can be exceeded to the extent there is "new
growth" in the District's tax base. The new growth consists of new construction, annexations, and tax increment
finance district property becoming eligible for taxation. The CPI applicable to the 2015 and 2014 levies was 0.8%
and 1.5%, respectively.
-39-

Northfield Township High School District 225NOTES TO THE FINANCIAL STATEMENTS
June 30, 2016
NOTE D - PROPERTY TAXES RECEIVABLE (Continued)
The Illinois Department of Revenue has the statutory responsibility of ensuring uniformity of real property
assessments throughout the state. Each year, the Illinois Department of Revenue furnishes the county clerks with
an adjustment factor to equalize the level of assessment between counties at one-third of market value. This factor
(the equalization factor) is then applied to the assessed valuation to compute the valuation of property to which the
tax rate will be applied (the equalized assessed valuation). The equalization factor for Cook County was 2.6685
for 2015.
The County Clerk adds the equalized assessed valuation of all real property in the county to the valuation of
property assessed directly by the state (to which the equalization factor is not applied) to arrive at the base amount
(the assessment base) used to calculate the annual tax rates, as described above. The equalized assessed valuation
for the extension of the 2015 tax levy was $4,390,619,134.
Property taxes are collected by the Cook County Collector/Treasurer who remits them to the School Treasurer.
Taxes levied in one year become due and payable in two installments on March 1 and approximately August 1
during the following year. The first installment is an estimated bill, and is fifty-five percent of the prior year's tax
bill. Property taxes are normally collected by the District within 60 days of the respective installment dates. The
second installment is based on the current levy, assessment, and equalization, and any changes from the prior year
will be reflected in the second installment bill.
The portion of the 2015 property tax levy not received by June 30 is recorded as a receivable, net of estimated
uncollectibles of 1%. The net receivable collected within the current year or due and expected to be collected soon
enough thereafter to be used to pay liabilities of the current period, less the taxes collected soon enough after the
end of the previous fiscal year, are recognized as revenue. Such time, thereafter, does not exceed 60 days. Net
taxes receivable less the amount expected to be collected within 60 days is reflected as deferred inflows of
resources - property taxes levied for a future period.
-40-
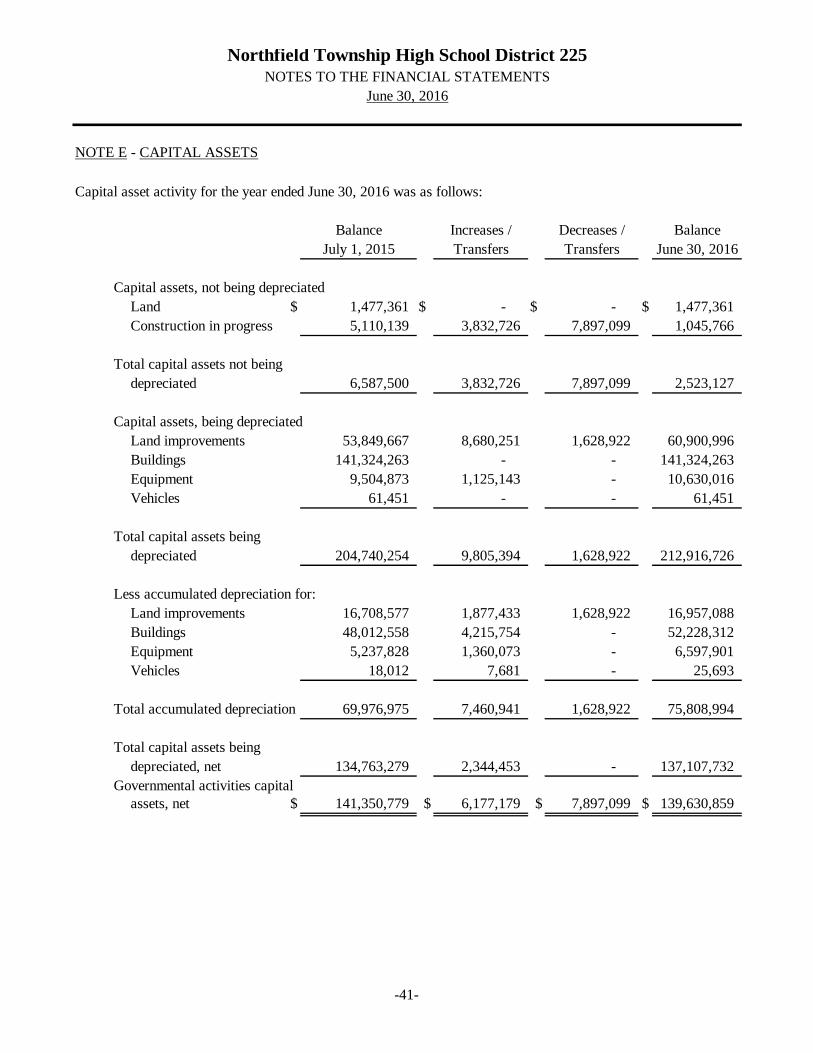
Northfield Township High School District 225NOTES TO THE FINANCIAL STATEMENTS
June 30, 2016
NOTE E - CAPITAL ASSETS
Capital asset activity for the year ended June 30, 2016 was as follows:
Balance Increases / Decreases / Balance
July 1, 2015 Transfers Transfers June 30, 2016
Capital assets, not being depreciated
Land $ 1,477,361 $ - $ - $ 1,477,361
Construction in progress 5,110,139 3,832,726 7,897,099 1,045,766
Total capital assets not being
depreciated 6,587,500 3,832,726 7,897,099 2,523,127
Capital assets, being depreciated
Land improvements 53,849,667 8,680,251 1,628,922 60,900,996
Buildings 141,324,263 - - 141,324,263
Equipment 9,504,873 1,125,143 - 10,630,016
Vehicles 61,451 - - 61,451
Total capital assets being
depreciated 204,740,254 9,805,394 1,628,922 212,916,726
Less accumulated depreciation for:
Land improvements 16,708,577 1,877,433 1,628,922 16,957,088
Buildings 48,012,558 4,215,754 - 52,228,312
Equipment 5,237,828 1,360,073 - 6,597,901
Vehicles 18,012 7,681 - 25,693
Total accumulated depreciation 69,976,975 7,460,941 1,628,922 75,808,994
Total capital assets being
depreciated, net 134,763,279 2,344,453 - 137,107,732
Governmental activities capital
assets, net $ 141,350,779 $ 6,177,179 $ 7,897,099 $ 139,630,859
-41-

Northfield Township High School District 225NOTES TO THE FINANCIAL STATEMENTS
June 30, 2016
NOTE E - CAPITAL ASSETS (Continued)
Depreciation expense was charged to functions/programs of the primary government as follows:
Governmental activities
General Government
Regular programs $ 4,772,089
Special programs 11,231
Other instructional programs 29,211
Pupils 26,911
General administration 3,584
School administration 5,822
Business 352,956
Operations and maintenance 26,459
Central 159,643
Unallocated 2,073,035
$ 7,460,941
NOTE F - LONG-TERM LIABILITIES
1.
The following is the long-term liability activity for the District for the year ended June 30, 2016:
Balance at Additions / Balance at
July 1, 2015 Accretion Deletions June 30, 2016
$ 90,740,101 $ 1,317,091 $ 5,935,000 $ 86,122,192
Add unamortized premium 1,878,485 - 241,886 1,636,599
(164,591) - (40,842) (123,749)
Total bonds payable 92,453,995 1,317,091 6,136,044 87,635,042
Capital leases 1,442,002 460,330 729,463 1,172,869
Compensated absences 632,502 410,376 632,502 410,376
IMRF net pension liability 3,206,740 6,809,480 2,902,767 7,113,453
TRS net pension liability 6,092,723 1,258,362 381,079 6,970,006
Other postemployment benefit
obligations 3,506,512 95,133 - 3,601,645
$ 107,334,474 $ 10,350,772 $ 10,781,855 $ 106,903,391
Changes in General Long-term Liabilities
Bonds payable:
General obligation bonds
Less unamortized discount
Total long-term liabilities -
governmental activities
-42-
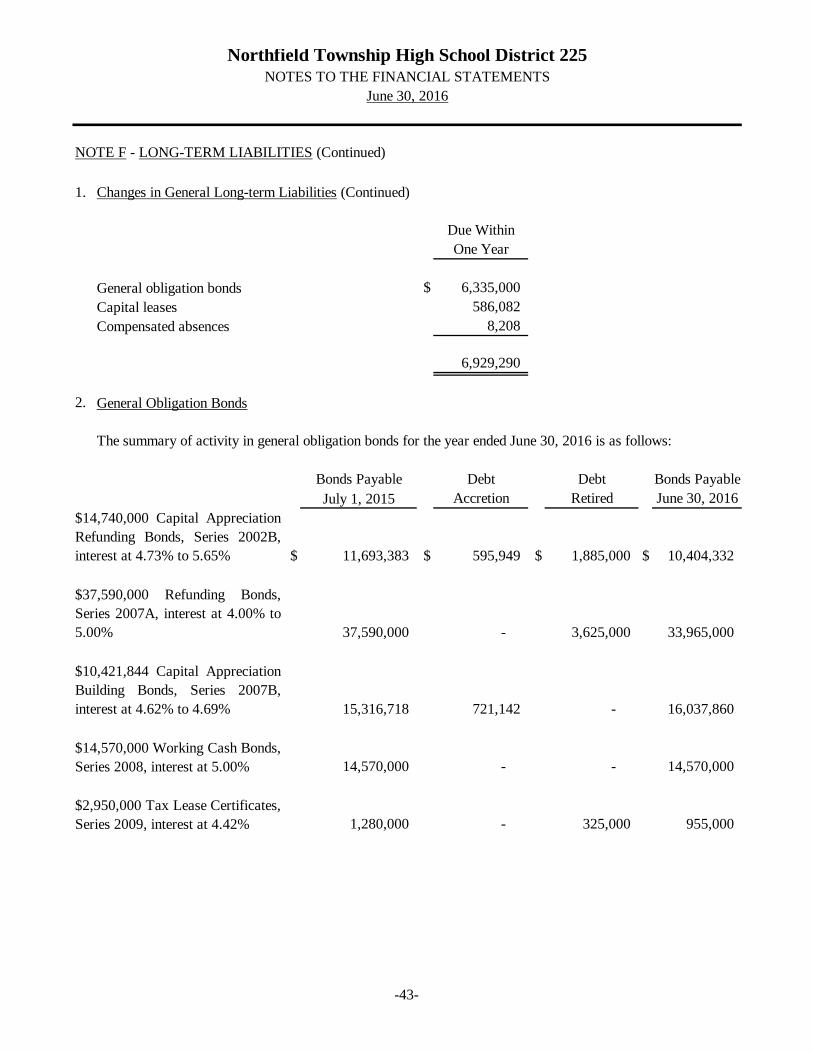
Northfield Township High School District 225NOTES TO THE FINANCIAL STATEMENTS
June 30, 2016
NOTE F - LONG-TERM LIABILITIES (Continued)
1.
Due Within
One Year
$ 6,335,000
586,082
8,208
6,929,290
2.
Bonds Payable Debt Debt Bonds Payable
July 1, 2015 Accretion Retired June 30, 2016
$ 11,693,383 $ 595,949 $ 1,885,000 $ 10,404,332
37,590,000 - 3,625,000 33,965,000
15,316,718 721,142 - 16,037,860
14,570,000 - - 14,570,000
1,280,000 - 325,000 955,000
General obligation bonds
General Obligation Bonds
The summary of activity in general obligation bonds for the year ended June 30, 2016 is as follows:
$14,740,000 Capital Appreciation
Refunding Bonds, Series 2002B,
interest at 4.73% to 5.65%
$37,590,000 Refunding Bonds,
Series 2007A, interest at 4.00% to
5.00%
$10,421,844 Capital Appreciation
Building Bonds, Series 2007B,
interest at 4.62% to 4.69%
$14,570,000 Working Cash Bonds,
Series 2008, interest at 5.00%
$2,950,000 Tax Lease Certificates,
Series 2009, interest at 4.42%
Capital leases
Compensated absences
Changes in General Long-term Liabilities (Continued)
-43-

Northfield Township High School District 225NOTES TO THE FINANCIAL STATEMENTS
June 30, 2016
NOTE F - LONG-TERM LIABILITIES (Continued)
2.
Bonds Payable Debt Debt Bonds Payable
July 1, 2015 Accretion Retired June 30, 2016
10,190,000 - - 10,190,000
100,000 - 100,000 -
Total $ 90,740,101 $ 1,317,091 $ 5,935,000 $ 86,122,192
Interest Face Carrying
Rates Amount Amount
Capital Appreciation Refunding Bonds - 2002B 4.73%-5.65% $ 12,210,000 $ 10,404,332
4.00%-5.00% 33,965,000 33,965,000
Capital Appreciation Building Bonds - 2007B 4.62%-4.69% 22,580,000 16,037,860
5.00% 14,570,000 14,570,000
4.42% 955,000 955,000
5.70%-5.90% 10,190,000 10,190,000
$ 94,470,000 $ 86,122,192
General obligation bonds are direct obligations and pledge the full faith and credit of the District. General
obligation bonds currently outstanding are as follows:
Purpose
Refunding Bonds - 2007A
Working Cash - 2008
Tax Lease Certificates - 2009
Build America Bonds - 2010
$10,190,000 Build America
Bonds, Series 2010, interest at
5.70-5.90%
$3,690,000 Refunding Bonds,
Series 2012, interest at 0.55%-
1.25%
General Obligation Bonds (Continued)
-44-

Northfield Township High School District 225NOTES TO THE FINANCIAL STATEMENTS
June 30, 2016
NOTE F - LONG-TERM LIABILITIES (Continued)
2.
Year Ending
June 30 Principal Interest Total
2017 $ 6,335,000 $ 2,927,857 $ 9,262,857
2018 7,065,000 2,711,373 9,776,373
2019 7,370,000 2,463,781 9,833,781
2020 7,550,000 2,193,285 9,743,285
2021 9,225,000 1,875,660 11,100,660
2022 - 2026 40,640,000 6,506,305 47,146,305
2027 - 2028 16,285,000 876,055 17,161,055
Total $ 94,470,000 $ 19,554,316 $ 114,024,316
These payments will be made from amounts budgeted from the debt service tax levies in future periods. There
is $4,831,183 in the Debt Service Fund to service the outstanding bonds payable. A portion of the interest
amount reported on the Build America Bonds will be refunded to the District by the Federal government.
The District is subject to the Illinois School Code, which limits the bond indebtedness to 6.9% of the most
recent available equalized assessed valuation of the District. As of June 30, 2016, the statutory debt limit for
the District was $302,952,720, of which $207,309,851 is fully available.
At June 30, 2016, the District's future cash flow requirements for retirement of bond principal and interest was
as follows:
General Obligation Bonds (Continued)
-45-
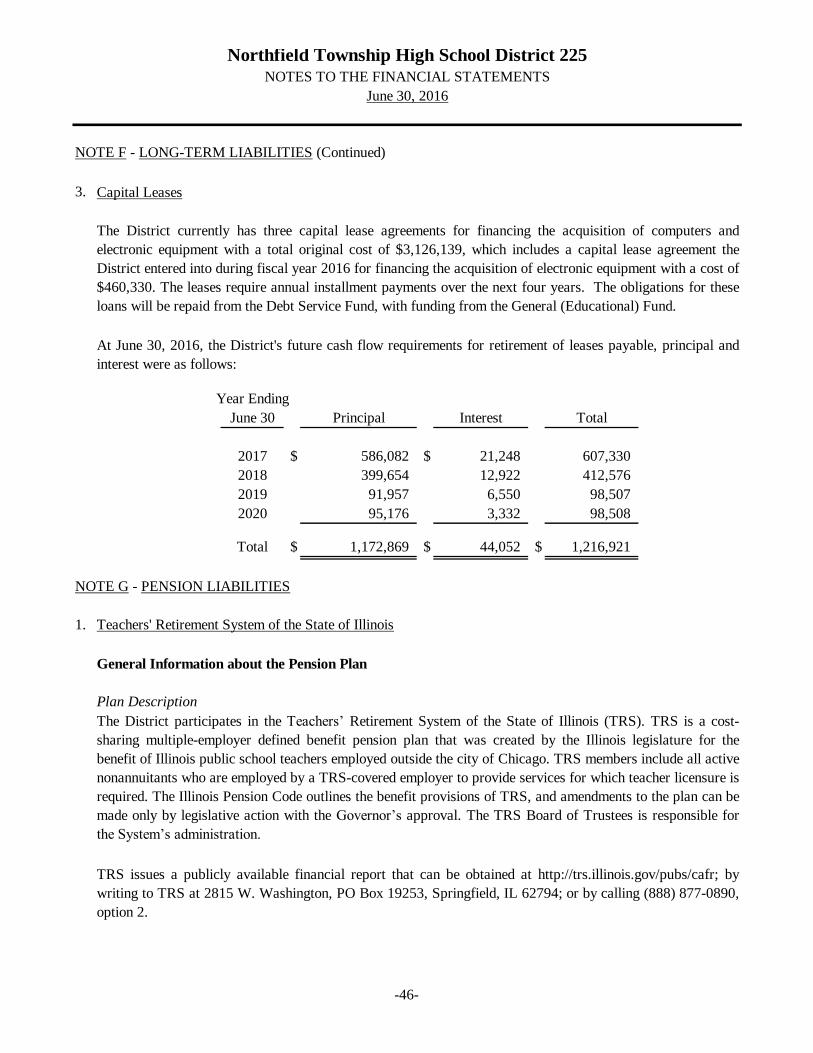
Northfield Township High School District 225NOTES TO THE FINANCIAL STATEMENTS
June 30, 2016
NOTE F - LONG-TERM LIABILITIES (Continued)
3.
Year Ending
June 30 Principal Interest Total
2017 $ 586,082 $ 21,248 607,330
2018 399,654 12,922 412,576
2019 91,957 6,550 98,507
2020 95,176 3,332 98,508
Total $ 1,172,869 $ 44,052 $ 1,216,921
1. Teachers' Retirement System of the State of Illinois
General Information about the Pension Plan
At June 30, 2016, the District's future cash flow requirements for retirement of leases payable, principal and
interest were as follows:
Capital Leases
The District currently has three capital lease agreements for financing the acquisition of computers and
electronic equipment with a total original cost of $3,126,139, which includes a capital lease agreement the
District entered into during fiscal year 2016 for financing the acquisition of electronic equipment with a cost of
$460,330. The leases require annual installment payments over the next four years. The obligations for these
loans will be repaid from the Debt Service Fund, with funding from the General (Educational) Fund.
Plan Description
The District participates in the Teachers’ Retirement System of the State of Illinois (TRS). TRS is a cost-
sharing multiple-employer defined benefit pension plan that was created by the Illinois legislature for the
benefit of Illinois public school teachers employed outside the city of Chicago. TRS members include all active
nonannuitants who are employed by a TRS-covered employer to provide services for which teacher licensure is
required. The Illinois Pension Code outlines the benefit provisions of TRS, and amendments to the plan can be
made only by legislative action with the Governor’s approval. The TRS Board of Trustees is responsible for
the System’s administration.
TRS issues a publicly available financial report that can be obtained at http://trs.illinois.gov/pubs/cafr; by
writing to TRS at 2815 W. Washington, PO Box 19253, Springfield, IL 62794; or by calling (888) 877-0890,
option 2.
NOTE G - PENSION LIABILITIES
-46-

Northfield Township High School District 225NOTES TO THE FINANCIAL STATEMENTS
June 30, 2016
1. Teachers' Retirement System of the State of Illinois (Continued)
On-behalf Contributions to TRS
The State of Illinois maintains the primary responsibility for funding TRS. The Illinois Pension Code, as
amended by Public Act 88-0593 and subsequent acts, provides that for years 2010 through 2045, the minimum
contribution to the System for each fiscal year shall be an amount determined to be sufficient to bring the total
assets of the System up to 90 percent of the total actuarial liabilities of the System by the end of fiscal year
2045.
Contributions
NOTE G - PENSION LIABILITIES (Continued)
Benefits Provided
TRS provides retirement, disability, and death benefits. Tier I members have TRS or reciprocal system service
prior to January 1, 2011. Tier I members qualify for retirement benefits at age 62 with five years of service, at
age 60 with 10 years, or age 55 with 20 years. The benefit is determined by the average of the four highest
years of creditable earnings within the last 10 years of creditable service and the percentage of average salary
to which the member is entitled. Most members retire under a formula that provides 2.2 percent of final
average salary up to a maximum of 75 percent with 34 years of service. Disability and death benefits are also
provided.
Tier II members qualify for retirement benefits at age 67 with 10 years of service, or a discounted annuity can
be paid at age 62 with 10 years of service. Creditable earnings for retirement purposes are capped and the final
average salary is based on the highest consecutive eight years of creditable service rather than the last four.
Disability provisions for Tier II are identical to those of Tier I. Death benefits are payable under a formula that
is different from Tier I.
Essentially all Tier I retirees receive an annual 3 percent increase in the current retirement benefit beginning
January 1 following the attainment of age 61 or on January 1 following the member’s first anniversary in
retirement, whichever is later. Tier II annual increases will be the lesser of three percent of the original benefit
or one-half percent of the rate of inflation beginning January 1 following attainment of age 67 or on January 1
following the member’s first anniversary in retirement, whichever is later.
Contributions from active members and TRS contributing employers are also required by the Illinois Pension
Code. The contribution rates are specified in the pension code. The active member contribution rate for the
year ended June 30, 2016, was 9.4 percent of creditable earnings. The member contribution, which may be
paid on behalf of employees by the employer, is submitted to TRS by the employer.
The State of Illinois makes employer pension contributions on behalf of the employer. For the year ended
June 30, 2016, state of Illinois contributions recognized by the District were based on the State’s
proportionate share of the collective net pension liability associated with the District, and the District
recognized revenue and expenditures of $27,225,550 in pension contributions from the State of Illinois.
-47-

Northfield Township High School District 225NOTES TO THE FINANCIAL STATEMENTS
June 30, 2016
1. Teachers' Retirement System of the State of Illinois (Continued)
2.2 Formula Contributions
Federal and Special Trust Fund Contributions
Early Retirement Cost Contributions
NOTE G - PENSION LIABILITIES (Continued)
Contributions (Continued)
Employers contribute 0.58 percent of total creditable earnings for the 2.2 formula change. The contribution
rate is specified by statute. Contributions for the year ended June 30, 2016, were $327,604, and are
deferred because they were paid after the June 30, 2015 measurement date.
When TRS members are paid from federal and special trust funds administered by the employer, there is a
statutory requirement for the employer to pay an employer pension contribution from those funds. Under a
policy adopted by the TRS Board of Trustees that has been in effect since the fiscal year ended June 30,
2006, employer contributions for employees paid from federal and special trust funds will be the same as
the state contribution rate to TRS. Public Act 98-0674 now requires the two rates to be the same.
For the year ended June 30, 2016, the employer pension contribution was 36.06 percent of salaries paid
from federal and special trust funds. For the year ended June 30, 2016, salaries totaling $142,975 were paid
from federal and special trust funds that required employer contributions of $51,557 These contributions
are deferred because they were paid after the June 30, 2015 measurement date.
Under GASB Statement No. 68, contributions that an employer is required to pay because of a TRS
member retiring are categorized as specific liability payments. The employer is required to make a one-time
contribution to TRS for members retiring under the Early Retirement Option (ERO). The payments vary
depending on the member’s age and salary. The maximum employer ERO contribution under the current
program is 146.5 percent and applies when the member is age 55 at retirement. For the year ended June 30,
2016, the District paid $521,042 to TRS for employer ERO contributions.
The District is also required to make a one-time contribution to TRS for members granted salary increases
over 6 percent if those salaries are used to calculate a retiree’s final average salary. A one-time contribution
is also required for members granted sick leave days in excess of the normal annual allotment if those days
are used as TRS service credit. For the year ended June 30, 2016, the District paid $1,223 to TRS for
employer contributions due on salary increases in excess of 6 percent and $0 for sick leave days granted in
excess of the normal annual allotment.
-48-

Northfield Township High School District 225NOTES TO THE FINANCIAL STATEMENTS
June 30, 2016
1. Teachers' Retirement System of the State of Illinois (Continued)
Resources Related to Pensions
District’s proportionate share of the net pension liability $ 6,970,006
State’s proportionate share of the net pension liability associated with the District 332,308,931
Total $ 339,278,937
NOTE G - PENSION LIABILITIES (Continued)
Pension Liabilities, Pension Expense, and Deferred Outflows of Resources and Deferred Inflows of
At June 30, 2016, the District reported a liability for its proportionate share of the net pension liability (first
amount shown below) that reflected a reduction for state pension support provided to the District. The state’s
support and total are for disclosure purposes only. The amount recognized by the District as its proportionate
share of the net pension liability, the related state support, and the total portion of the net pension liability that
was associated with the District were as follow:
The net pension liability was measured as of June 30, 2015, and the total pension liability used to calculate the
net pension liability was determined by an actuarial valuation as of June 30, 2014, and rolled forward to June
30, 2015. The District’s proportion of the net pension liability was based on the District’s share of
contributions to TRS for the measurement year ended June 30, 2015, relative to the projected contributions of
all participating TRS employers and the state during that period. At June 30, 2015, the District’s proportion
was 0.0106395943 percent, which was an increase of 0.000628263 percent from its proportion measured as of
June 30, 2014.
-49-

Northfield Township High School District 225NOTES TO THE FINANCIAL STATEMENTS
June 30, 2016
1. Teachers' Retirement System of the State of Illinois (Continued)
Resources Related to Pensions (Continued)
Deferred Deferred
Outflows of Inflows of
Resources Resources
Differences between expected and actual experience $ 2,590 $ 7,640
Change of assumptions 96,388 -
Net difference between projected and actual earnings on pension plan
investments 138,036 244,066
Changes in proportion and differences between District contributions and
proportionate share of contributions 319,951 1,438,789
Total deferred amounts to be recognized in
pension expense in future periods 556,965 1,690,495
District contributions subsequent to the measurement date 379,160 -
$ 936,125 $ 1,690,495
Net Deferred
Inflows (Outflows) of
Year ended June 30: Resources
2017 $ 403,172
2018 403,172
2019 403,172
2020 (75,986)
Thereafter -
Total $ 1,133,530
NOTE G - PENSION LIABILITIES (Continued)
Pension Liabilities, Pension Expense, and Deferred Outflows of Resources and Deferred Inflows of
For the year ended June 30, 2016, the District recognized pension expense of $27,417,363 and revenue of
$27,225,550 for support provided by the state. At June 30, 2016, the District reported deferred outflows of
resources and deferred inflows of resources related to pensions from the following sources:
Total deferred amounts related to pensions
The District reported $379,160 as deferred outflows of resources related to pensions resulting from District
contributions subsequent to the measurement date will be recognized as a reduction of the net pension liability
in the reporting year ended June 30, 2017. Other amounts reported as deferred outflows of resources and
deferred inflows of resources related to pensions will be recognized in pension expense as follows:
-50-

Northfield Township High School District 225NOTES TO THE FINANCIAL STATEMENTS
June 30, 2016
1. Teachers' Retirement System of the State of Illinois (Continued)
Actuarial Assumptions
Inflation
Salary increases varies by amount of service credit
Investment rate of return 7.50 percent, net of pension plan investment expense, including inflation
NOTE G - PENSION LIABILITIES (Continued)
The total pension liability in the June 30, 2015 actuarial valuation was determined using the following
actuarial assumptions, applied to all periods included in the measurement:
3.00 percent
Mortality rates were based on the RP-2014 White Collar Table with adjustments as appropriate for TRS
experience. The rates are used on a fully-generational basis using projection table MP-2014.
The actuarial assumptions for the years ended June 30, 2015 and 2014 were different. The actuarial
assumptions used in the June 30, 2015 valuation were based on the 2015 actuarial experience analysis. The
investment return assumption remained at 7.5 percent, salary increase assumptions were lowered, retirement
rates were increased, mortality updates were made, and other assumptions were lowered. The actuarial
assumptions used in the June 30, 2014 valuation were based on updates to economic assumptions adopted in
2014 which lowered the investment return assumption from 8.0 percent to 7.5 percent. The salary increase and
inflation assumptions were also lowered from their 2013 levels.
The long-term expected rate of return on pension plan investments was determined using a building-block
method in which best-estimate ranges of expected future real rates of return (expected returns, net of pension
plan investment expense and inflation) are developed for each major asset class. These ranges are combined to
produce the long-term expected rate of return by weighting the expected future real rates of return by the target
asset allocation percentage and by adding expected inflation. The target allocation and best estimates of
arithmetic real rates of return for each major asset class that were used by the actuary are summarized in the
following table:
-51-

Northfield Township High School District 225NOTES TO THE FINANCIAL STATEMENTS
June 30, 2016
1. Teachers' Retirement System of the State of Illinois (Continued)
Actuarial Assumptions (Continued)
Long-Term
Target Expected Real
Allocation Rate of Return
U.S. large cap 18 % 7.53 %
Global equity (excluding U.S.) 18 7.88
Aggregate bonds 16 1.57
U.S. TIPS 2 2.82
NCREIF 11 5.11
Opportunistic real estate 4 9.09
ARS 8 2.57
Risk parity 8 4.87
Diversified inflation strategy 1 3.26
Private equity 14 12.33
Total 100 %
NOTE G - PENSION LIABILITIES (Continued)
Asset Class
Discount Rate
At June 30, 2015, the discount rate used to measure the total pension liability was a blended rate of 7.47
percent, which was a change from the June 30, 2014 rate of 7.50 percent. The projection of cash flows used to
determine the discount rate assumed that employee contributions, employer contributions, and state
contributions will be made at the current statutorily-required rates.
Based on those assumptions, TRS’s fiduciary net position at June 30, 2015 was not projected to be available
to make all projected future benefit payments of current active and inactive members and all benefit recipients.
Tier I’s liability is partially-funded by Tier II members, as the Tier II member contribution is higher than the
cost of Tier II benefits. Due to this subsidy, contributions from future members in excess of the service cost
are also included in the determination of the discount rate. Despite the subsidy, all projected future payments
were not covered, so a slightly lower long-term expected rate of return on TRS investments was applied to all
periods of projected benefit payments to determine the total pension liability.
-52-

Northfield Township High School District 225NOTES TO THE FINANCIAL STATEMENTS
June 30, 2016
1. Teachers' Retirement System of the State of Illinois (Continued)
Sensitivity of the District’s Proportionate Share of the Net Pension Liability to Changes in the Discount Rate
Current
1% Decrease Discount 1% Increase
(6.47%) (7.47%) (8.47%)
$ 8,613,219 $ 6,970,006 $ 5,622,527
TRS Fiduciary Net Position
2.
NOTE G - PENSION LIABILITIES (Continued)
Discount Rate (Continued)
At June 30, 2014, the discount rate used to measure the total pension liability was 7.50 percent. The discount
rate was the same as the actuarially-assumed rate of return on investments that year because TRS's fiduciary
net position and the subsidy provided by Tier II were sufficient to cover all projected benefit payments.
The following presents the District’s proportionate share of the net pension liability calculated using the
discount rate of 7.47 percent, as well as what the District's proportionate share of the net pension liability
would be if it were calculated using a discount rate that is 1-percentage-point lower (6.47 percent) or 1-
percentage-point higher (8.47 percent) than the current rate:
Detailed information about the TRS’s fiduciary net position as of June 30, 2015 is available in the separately
issued TRS Comprehensive Annual Financial Report.
Illinois Municipal Retirement Fund
District's proportionate share of the net pension liability
Plan Description
The District's defined benefit pension plan for regular employees provides retirement and disability benefits,
postretirement increases, and death benefits to plan members and beneficiaries. The District's plan is managed
with the Illinois Municipal Retirement Fund (IMRF), the administrator of an agent multi-employer public
pension fund. A summary of IMRF's pension benefits is provided in the Benefits Provided section below.
Details of all benefits are available from IMRF. Benefit provisions are established by statute and may only be
changed by the General Assembly of the State of Illinois. IMRF issues a publicly available Comprehensive
Annual Financial Report that includes financial statements, detailed information about the pension plan's
fiduciary net position, and required supplementary information. That report is available for download at
www.imrf.org.
-53-

Northfield Township High School District 225NOTES TO THE FINANCIAL STATEMENTS
June 30, 2016
2.
As of December 31, 2015, the following employees were covered by the benefit terms:
Retirees and beneficiaries currently receiving benefits 332
Inactive plan members entitled to but not yet receiving benefits 357
Active plan members 327
Total 1,016
NOTE G - PENSION LIABILITIES (Continued)
Illinois Municipal Retirement Fund (Continued)
Benefits Provided
IMRF has three benefit plans. The vast majority of IMRF members participate in the Regular Plan (RP).
All three IMRF benefit plans have two tiers. Employees hired before January 1, 2011, are eligible for Tier 1
benefits. Tier 1 employees are vested for pension benefits when they have at least eight years of qualifying
service credit. Tier 1 employees who retire at age 55 (at reduced benefits) or after age 60 (at full benefits) with
eight years of service are entitled to an annual retirement benefit, payable monthly for life, in an amount equal
to 1-2/3% of the final rate of earnings for the first 15 years of service credit, plus 2% for each year of service
credit after 15 years to a maximum of 75% of their final rate of earnings. Final rate of earnings is the highest
total earnings during any consecutive 48 months within the last 10 years of service, divided by 48. Under Tier
1, the pension is increased by 3% of the original amount on January 1 every year after retirement.
Employees hired on or after January 1, 2011, are eligible for Tier 2 benefits. For Tier 2 employees, pension
benefits vest after ten years of service. Participating employees who retire at age 62 (at reduced benefits) or
after age 67 (at full benefits) with ten years of service are entitled to an annual retirement benefit, payable
monthly for life, in an amount equal to 1-2/3% of the final rate of earnings for the first 15 years of service
credit, plus 2% for each year of service credit after 15 years to a maximum of 75% of their final rate of
earnings. Final rate of earnings is the highest total earnings during any 96 consecutive months within the last
10 years of service, divided by 96. Under Tier 2, the pension is increased on January 1 every year after
retirement, upon reaching age 67, by the lesser of 3% of the original pension amount, or 1/2 of the increase in
the Consumer Price Index of the original pension amount.
Employees Covered by Benefit Terms
-54-

Northfield Township High School District 225NOTES TO THE FINANCIAL STATEMENTS
June 30, 2016
2.
Actuarial Assumptions
Actuarial Cost Method
Asset Valuation Method Market Value of Assets
Inflation Rate 2.75%
Salary Increases 3.75% to 14.5% including inflation
Investment Rate of Return 7.49%
Projected Retirement Age
Illinois Municipal Retirement Fund (Continued)
Contributions
As set by statute, the District’s Regular Plan Members are required to contribute 4.5% of their annual covered
salary. The statute requires employers to contribute the amount necessary, in addition to member
contributions, to finance the retirement coverage of its own employees. The District’s annual contribution rate
for calendar year 2015 was 10.57%. For the fiscal year ended June 30, 2016 the District contributed
$1,492,823 to the plan. The District also contributes for disability benefits, death benefits, and supplemental
retirement benefits, all of which are pooled at the IMRF level. Contribution rates for disability and death
benefits are set by IMRF’s Board of Trustees, while the supplemental retirement benefits rate is set by statute.
Net Pension Liability
The District’s net pension liability was measured as of December 31, 2015. The total pension liability used to
calculate the net pension liability was determined by an actuarial valuation as of that date.
The following are the methods and assumptions used to determine total pension liability at December 31, 2015:
Entry Age Normal
Experience-based table of rates, specific to the type of eligibility condition.
Last updated for the 2014 valuation pursuant to an experience study of the
period 2011-2013.
NOTE G - PENSION LIABILITIES (Continued)
-55-

Northfield Township High School District 225NOTES TO THE FINANCIAL STATEMENTS
June 30, 2016
2.
Actuarial Assumptions (Continued)
Mortality
Long-term Expected Rate of
Return
For non-disabled retirees, an IMRF specific mortality table was used with
fully generations projection scale MP-2014 (base year 2014). The IMRF
specific rates were developed from the RP-2014 Blue Collar Health
Annuitant Mortality Table with adjustments to match current IMRF
experience. For disabled retirees, an IMRF specific mortality table was
used with fully generational projection scale MP-2014 (base year 2014).
The IMRF specific rates were developed from the RP-2014 Disabled
Retirees Mortality Table applying the same adjustment that were applied
for non-disabled lives. For active members, an IMRF specific mortality
table was used with fully generation projection scale MP-2014 (base year
2014). The IMRF specific rates were developed from the RP-2014
Employee Mortality Table with adjustments to match current IMRF
experience.
The long-term expected rate of return on pension plan investments was
determined using a building-block method in which best-estimate ranges of
expected future real rates of return (expected returns, net of pension plan
investment expense, and inflation) are developed for each major asset class.
These ranges are combined to produce the long-term expected rate of
return by weighting the expected future real rates of return to the target
asset allocation percentage and adding expected inflation. The target
allocation and best estimates of geometric real rates of return for each
major asset class are summarized in the following table:
Illinois Municipal Retirement Fund (Continued)
NOTE G - PENSION LIABILITIES (Continued)
-56-

Northfield Township High School District 225NOTES TO THE FINANCIAL STATEMENTS
June 30, 2016
2.
Actuarial Assumptions (Continued)
38%
17%
27%
8%
9%
1%
100%
Single Discount Rate
a.
b.
Alternative Investments 2.75 - 8.15%
Cash Equivalents 2.25%
Total
A Single Discount Rate of 7.49% was used to measure the total pension liability. The projection of cash flow
used to determine this Single Discount Rate assumed that the plan members’ contributions will be made at the
current contribution rate, and that employer contributions will be made at rates equal to the difference between
actuarially determined contribution rates and the member rate. The Single Discount Rate reflects:
The long-term expected rate of return on pension plan investments (during the period in which the
fiduciary net position is projected to be sufficient to pay benefits), and
The tax-exempt municipal bond rate based on an index of 20-year general obligation bonds with an
average AA credit rating (which is published by the Federal Reserve) as of the measurement date (to the
extent that the contributions for use with the long-term expected rate of return are not met).
7.39%
International Equity 7.59%
Fixed Income 3.00%
Real Estate 6.00%
Portfolio
Target
Percentage
Long-Term
Expected Real
Rate of ReturnAsset Class
For the purpose of the most recent valuation, the expected rate of return on plan investments is 7.50%, the
municipal bond rate is 3.57%, and the resulting single discount rate is 7.49%.
Illinois Municipal Retirement Fund (Continued)
Domestic Equity
NOTE G - PENSION LIABILITIES (Continued)
-57-

Northfield Township High School District 225NOTES TO THE FINANCIAL STATEMENTS
June 30, 2016
2.
Changes in Net Pension Liability
Total Pension Plan Fiduciary Net Pension
Liability Net Position Liability
(A) (B) (A) - (B)
Balances at December 31, 2014 $ 69,570,082 $ 66,363,342 $ 3,206,740
Changes for the year:
Service cost 1,581,866 - 1,581,866
Interest on the total pension liability 5,142,729 - 5,142,729
Difference between expected and actual experience
of the total pension liability (196,828) - (196,828)
Changes of assumptions 84,885 - 84,885
Contributions - employer - 1,489,117 (1,489,117)
Contributions - employees - 639,874 (639,874)
Net investment income - 328,183 (328,183)
Benefit payments, including refunds of employee
contributions (3,582,595) (3,582,595) -
Other (net transfer) - 248,765 (248,765)
Net changes 3,030,057 (876,656) 3,906,713
Balances at December 31, 2015 $ 72,600,139 $ 65,486,686 $ 7,113,453
Sensitivity of the Net Pension Liability to Changes in the Discount Rate.
Current
1% Lower Discount 1% Higher
(6.49%) Rate (7.49%) (8.49%)
Net pension liability (asset) $ 16,290,933 $ 7,113,453 $ (444,105)
Illinois Municipal Retirement Fund (Continued)
The following table shows the components of the change in the District's net pension liability for the calendar
year ended December 31, 2015:
The following presents the plan’s net pension 1iability, calculated using a Single Discount Rate of 7.49%, as
well as what the plan's net pension liability would be if it were calculated using a Single Discount Rate that is
1% lower or 1% higher than the current rate:
NOTE G - PENSION LIABILITIES (Continued)
-58-

Northfield Township High School District 225NOTES TO THE FINANCIAL STATEMENTS
June 30, 2016
2.
Deferred Deferred
Deferred Amounts Related to Pensions Outflows of Inflows of
Resources Resources
Deferred Amounts to be Recognized in Pension
Expense in Future Periods
Differences between expected and actual experience $ 56,977 $ 137,576
Change of assumptions 1,131,479 -
Net difference between projected and actual earnings on pension plan
investments 4,214,053 -
Total deferred amounts to be recognized in pension expense in the
future periods 5,402,509 137,576
Pension contributions made subsequent to the measurement date 797,285 -
Total deferred amounts related to pensions $ 6,199,794 $ 137,576
Net Deferred
Outflows of
Resources
2016 $ 1,898,532
2017 1,358,712
2018 1,086,911
2019 920,778
-
-
$ 5,264,933
Illinois Municipal Retirement Fund (Continued)
Pension Expense and Deferred Outflows of Resources and Deferred Inflows of Resources Related to
Pensions
For the year ended June 30, 2016, the District recognized pension expense of $2,802,419. At June 30, 2016,
the District reported deferred inflows of resources related to pensions from the following sources:
The District reported $797,285 as deferred outflows of resources related to pensions resulting from District
contributions subsequent to the measurement date that will be recognized as a reduction of the net pension
liability in the reporting year ended June 30, 2017. Other amounts reported as deferred outflows of resources
related to pensions will be recognized in pension expense as follows:
Year Ended
June 30,
2020
Thereafter
Total
NOTE G - PENSION LIABILITIES (Continued)
-59-

Northfield Township High School District 225NOTES TO THE FINANCIAL STATEMENTS
June 30, 2016
3. Summary of Pension Items
Below is a summary of the various pension items at June 30, 2016:
TRS IMRF Total
Deferred outflows of resources:
Employer contributions $ 379,160 $ 797,285 $ 1,176,445
Experience 2,590 56,977 59,567
Assumptions 96,388 1,131,479 1,227,867
Proportionate share 319,951 - 319,951
Investments 138,036 4,214,053 4,352,089
$ 936,125 $ 6,199,794 $ 7,135,919
Net pension liability $ 6,970,006 $ 7,113,453 $ 14,083,459
Deferred inflows of resources:
Investments $ 244,066 $ 137,576 $ 381,642
Experience 7,640 - 7,640
Proportionate share 1,438,789 - 1,438,789
$ 1,690,495 $ 137,576 $ 1,828,071
4. Social Security/Medicare
Employees not qualifying for coverage under the Illinois Teachers' Retirement System or the Illinois Municipal
Retirement Fund are considered "nonparticipating employees". These employees and those qualifying for
coverage under the Illinois Municipal Retirement Fund are covered under Social Security/Medicare. The
District paid the total required contribution for the current fiscal year.
NOTE G - PENSION LIABILITIES (Continued)
-60-

Northfield Township High School District 225NOTES TO THE FINANCIAL STATEMENTS
June 30, 2016
NOTE H - OTHER POSTEMPLOYMENT BENEFITS
1.
On behalf contributions to the THIS Fund
District contributions to the THIS Fund
Further Information on the THIS Fund
Teachers' Health Insurance Security (THIS)
The District participates in the Teacher Health Insurance Security (THIS) Fund, a cost-sharing, multiple-
employer defined benefit post-employment healthcare plan that was established by the Illinois legislature for
the benefit of retired Illinois public school teachers employed outside the city of Chicago. The THIS Fund
provides medical, prescription, and behavioral health benefits, but it does not provide vision, dental, or life
insurance benefits to annuitants of the Teachers’ Retirement System (TRS). Annuitants not enrolled in
Medicare may participate in the state-administered participating provider option plan or choose from several
managed care options. Annuitants who are enrolled in Medicare Parts A and B may be eligible to enroll in a
Medicare Advantage plan.
The State Employees Group Insurance Act of 1971 (5 ILCS 375) outlines the benefit provisions of the THIS
Fund and amendments to the plan can be made only by legislative action with the Governor’s approval. The
plan is administered by the Illinois Department of Central Management Services (CMS) with the cooperation
of TRS. Section 6.6 of the State Employees Group Insurance Act of 1971 requires all active contributors to
TRS who are not employees of the state to make a contribution to the THIS Fund.
The percentage of employer required contributions in the future will not exceed 105 percent of the percentage
of salary actually required to be paid in the previous fiscal year.
The State of Illinois makes employer retiree health insurance contributions on behalf of the District. State
contributions are intended to match contributions to the THIS Fund from active members which were 1.07
percent of pay during the year ended June 30, 2016. State of Illinois contributions were $604,372 and the
District recognized revenue and expenditures of this amount during the year.
The District also makes contributions to the THIS Fund. The District THIS Fund contribution was 0.80
percent during the year ended June 30, 2016. For the year ended June 30, 2016, the District paid $451,867
to the THIS Fund, which was 100 percent of the required contribution.
The publicly available financial report of the THIS Fund may be found on the website of the Illinois
Auditor General: http://www.auditor.illinois.gov/Audit-Reports/ABC-List.asp. The current reports are
listed under “Central Management Services.” Prior reports are available under “Healthcare and Family
Services.”
-61-

Northfield Township High School District 225NOTES TO THE FINANCIAL STATEMENTS
June 30, 2016
NOTE H - OTHER POSTEMPLOYMENT BENEFITS (Continued)
2.
Actives fully eligible to retire 48
Actives not yet fully eligible to retire 760
Retirees 130
Total 938
Retirees have the option of choosing from an HMO or PPO plan through the District. The District contributes
a percentage of the health insurance premium in accordance with applicable board policy in force at the time of
retirement. For fiscal year 2016, the District contributed $1,405,399 toward the cost of the postemployment
benefits for retirees.
Annual OPEB Cost and Net OPEB Obligation
The District's annual other postemployment benefit (OPEB) cost (expense) is calculated based on the annual
required contribution of the employer (ARC), an amount actuarially determined in accordance with the
parameters of GASB Statement 45. The ARC represents a level of funding that, if paid on an ongoing basis,
is projected to cover normal cost each year and to amortize any unfunded actuarial liabilities (or funding
excess) over a period not to exceed thirty years. The following table shows the components of the District's
annual OPEB cost for the year, the amount actually contributed to the plan, and changes in the District's net
estimated OPEB obligation to the Retiree Health Plan:
Funding Policy
The District administers a single-employer defined benefit healthcare plan ("the Retiree Health Plan"). The
plan provides the ability for retirees and their spouses to access the District's group health insurance plan
during retirement, provided they are on the group health insurance plan at the time of retirement, until the age
of 65. Retirees may be responsible to contribute a portion of the premium toward the cost of their insurance.
Retirees may also access dental benefits on a "direct pay" basis.
As of June 30, 2015, the most recent information available, the following employees were covered by the
Retiree Health Plan
Plan Description
-62-

Northfield Township High School District 225NOTES TO THE FINANCIAL STATEMENTS
June 30, 2016
NOTE H - OTHER POSTEMPLOYMENT BENEFITS (Continued)
2.
June 30,
2016
$ 1,477,155
140,260
(116,883)
1,500,532
(1,405,399)
95,133
3,506,512
$ 3,601,645
Percentage
Actuarial Annual Annual OPEB
Valuation OPEB Cost Net OPEB
Date Cost Contributed Obligation
6/30/16* $ 1,500,532 101.6% $ 3,601,645
6/30/15 1,500,655 101.2% 3,506,512
6/30/14* 1,970,329 43.6% 3,525,000
*
Annual OPEB cost
The District's annual OPEB cost, the percentage of annual OPEB cost contributed to the plan, and the net
OPEB obligation for fiscal year 2016 and the two preceding fiscal years were as follows:
Net OPEB obligation, end of year
Contributions made
Increase in net OPEB obligation
Net OPEB obligation, beginning of year
Retiree Health Plan (Continued)
Annual required contribution
Adjustment to annual required contribution
Interest on net OPEB obligation
Annual OPEB cost estimated using ARC from most recent valuation information.
-63-

Northfield Township High School District 225NOTES TO THE FINANCIAL STATEMENTS
June 30, 2016
NOTE H - OTHER POSTEMPLOYMENT BENEFITS (Continued)
2.
Not applicable
0.00%
July 1, 2014
Entry age normal
30 years
Not applicable
Actuarial cost method
Amortization period Level percentage of projected payroll
Remaining amortization period
Asset valuation method
Retiree Health Plan (Continued)
Funding Status and Funding Progress
As of June 30, 2015, the date of the most recent actuarial valuation, the actuarial accrued liability for benefits
was $17,685,379, all of which was unfunded. The covered payroll (annual payroll of active employees
covered by the plan) and the ratio of the unfunded actuarial accrued liability to the covered payroll were not
available.
The projection of future benefit payments for an ongoing plan involved estimates of the value of reported
amounts and assumptions about the probability of occurrence of events far into the future. Examples include
assumptions about future employment, mortality, and the healthcare cost trend. Amounts determined
regarding the funded status of the plan and the annual required contributions of the employer are subject to
continual revision as actual results are compared with past expectations and new estimates are made about the
future.
Methods and Assumptions
Projections of benefits for financial reporting purposes are based on the substantive plan (the plan understood
by the employer and plan members) and include the types of benefits provided at the time of each valuation
and the historical pattern of sharing of benefit costs between the employer and plan members to that point.
The methods and assumptions used include techniques that are designed to reduce the effects of short-term
volatility in actuarial accrued liabilities and the actuarial value of assets, consistent with the long-term
perspective of the calculations.
The following simplifying assumptions were made:
Contribution rates:
District
Plan members
Actuarial valuation date
-64-

Northfield Township High School District 225NOTES TO THE FINANCIAL STATEMENTS
June 30, 2016
NOTE H - OTHER POSTEMPLOYMENT BENEFITS (Continued)
2.
4.00%
4.00%
NOTE I - RISK MANAGEMENT
Retiree Health Plan (Continued)
The District is exposed to various risks of loss related to employee health benefits, worker's compensation claims,
theft of, damage to, and destruction of assets, and natural disasters. To protect from the risk associated with
worker's compensation claims, property damage and liability exposure, the District participates in a public entity
risk pool: Secondary School Cooperative Risk Management Program (SSCRMP). The District pays annual
premiums to the pool for insurance coverage. The arrangements with the pool provide that it will be self-
sustaining through member premiums and will reinsure through commercial companies for claims in excess of
certain levels established by the pool. The District has purchased insurance from private insurance companies for
life insurance and long-term disability insurance that is provided to District personnel. Premiums have been
recorded as expenditures in the appropriate funds. There have been no significant reductions in insurance
coverage in any of the past four years. Complete financial statements for SSCRMP can be obtained from its
Treasurer, 3801 West Lake Avenue, Glenview, Illinois 60026.
The District is self-insured for medical coverage that is provided to District personnel and dependents. Blue
Cross/Blue Shield administers claims for a per person, per month fee. Expenditures are recorded as incurred in
the form of direct contributions from the District to Blue Cross/Blue Shield for payment of employment health
claims and administration fees. The District's liability will not exceed $250,000 per employee, in the PPO, or
$125,000 per employee, in the HMO plan, or $250,000 per employee, in the HSA plan, as provided by stop-loss
provisions incorporated in the respective plan. At June 30, 2016 total unpaid claims, including an estimate of
claims incurred but not reported to the administrative agent totaled $1,946,907. The estimate are developed based
on historical lag experience adjusted for current claims experience.
The General and Operations and Maintenance Funds are used to liquidate the liability for other
postemployment benefits.
Actuarial assumptions:
Investment rate of return
Projected salary increases
Healthcare inflation rate Various 5.00% - 7.50%, initial
5.50% ultimate
Mortality, Turnover, Disability, Retirement Ages Similar rates utilized for IMRF
Percentage of active employees assumed to elect 90% of future retirees are assumed to elect the
insurance option and 10% the cash severance benefit
-65-

Northfield Township High School District 225NOTES TO THE FINANCIAL STATEMENTS
June 30, 2016
NOTE I - RISK MANAGEMENT (Continued)
2016 2015
Unpaid claims, beginning of fiscal year $ 2,420,050 $ 1,157,285
Incurred claims (including those claims incurred but not reported (IBNRs)) 6,699,656 9,701,169
Claim payments (7,172,799) (8,438,404)
Unpaid claims, end of fiscal year $ 1,946,907 $ 2,420,050
NOTE J - INTERFUND TRANSFERS
NOTE K - JOINT AGREEMENTS
The District is a member of the North Suburban Special Education District (NSSED), a joint agreement that
provides certain special education services to residents of many school districts. The District believes that because
it does not control the selection of the governing authority, and because of the control over employment of
management personnel, operations, scope of public service, and special financing relationships exercised by the
joint agreement governing boards, these should not be included as component units of the District.
Balances of claims liabilities during the past two years are as follows:
The District is also self-insured for unemployment compensation. A third-party administrator administers the plan
for a fixed fee. Payments are made to the third-party administrator based on actual claims filed and approved.
The District transferred $2,900,000 from the Operations and Maintenance Fund and $350,000 from the General
(Educational) Fund to the Capital Projects Fund for payment of capital projects.
The District transferred $374,394 from the Operations and Maintenance Fund to the Debt Service Fund for
payment of principal and interest on lease certificates.
The District transferred $745,380 from the General (Educational) Fund to the Debt Service Fund for payment of
principal and interest on capital leases.
-66-

Northfield Township High School District 225NOTES TO THE FINANCIAL STATEMENTS
June 30, 2016
NOTE L - OPERATING LEASES
Year Ending
June 30, Total
2017 $ 253,518
2018 176,402
Total $ 429,920
NOTE M - CONTINGENCIES
1. Litigation
2. Grants
The District is a defendant in various tax objection lawsuits, the outcome of which is presently not
determinable. With regard to other pending matters, the eventual outcome and related liability, if any, is not
determinable at this time. No provision has been made in the accompanying financial statements for settlement
costs.
Amounts received or receivable from grantor agencies are subject to audit and adjustment by grantor agencies,
principally the federal government. Any disallowed claims, including amounts already collected, may
constitute a liability of the applicable funds. The amount, if any, of expenditures which may be disallowed by
the grantor cannot be determined at this time, although the District expects such amounts, if any, to be
immaterial.
In August 2012, the District entered into a five year lease for computer equipment. This lease has an annual cost
of $77,116, through August 2017.
In July 2013, the District entered into a four year lease for copiers and terminated the previous leases. This lease
has an annual cost of $176,402, through July 2017.
In July 2013, the District entered into two three-year leases for buses. This lease has an annual cost of $57,523,
through July 2016.
Total payments on these leases in fiscal year 2016 approximated $311,000. The future minimum lease payments
under these agreements are as follows:
-67-

Northfield Township High School District 225NOTES TO THE FINANCIAL STATEMENTS
June 30, 2016
NOTE N - CONSTRUCTION COMMITMENTS
NOTE O - SUBSEQUENT EVENTS
In August 2016, the District approved a resolution for the issuance of $46,875,000 of General Obligation
Refunding School Bonds, $5,100,000 of General Obligation Limited School Bonds, and $9,900,000 of General
Obligation Limited School Bonds. The proceeds from the bond issues will be used to refund certain outstanding
General Obligation bonds and for life safety projects, respectively. The $46,875,000 General Obligation
Refunding Bonds were issued in October 2016, the $5,100,000 General Obligation Limited School Bonds were
issued in October 2016, and the $9,900,000 General Obligation Limited School Bonds will be issued in February
2017.
Management has evaluated subsequent events through January 12, 2017, the date that these financial statements
were available to be issued. No events or transactions, other than the transaction noted below, have occurred
subsequent to the balance sheet date that require disclosure in the financial statements.
The District has certain contracts for construction projects which were in progress at June 30, 2016. Remaining
commitments under these contracts approximated $2,167,000.
-68-

REQUIRED SUPPLEMENTRY INFORMATION(Unaudited)

Calendar year ended December 31,
2015 2014
Total pension liability
Service cost $ 1,581,866 $ 1,629,789
Interest on the total pension liability 5,142,729 4,714,279
Difference between expected and actual experience of
the total pension liability (196,828) 141,193
Assumption changes 84,885 2,656,875
Benefit payments and refunds (3,582,595) (3,228,417)
Net change in total pension liability 3,030,057 5,913,719
Total pension liability, beginning 69,570,082 63,656,363
Total pension liability, ending $ 72,600,139 $ 69,570,082
Plan fiduciary net position
Contributions, employer $ 1,489,117 $ 1,474,629
Contributions, employee 639,874 624,628
Net investment income 328,183 3,843,654
Benefit payments, including refunds of employee contributions (3,582,595) (3,228,417)
Other (net transfer) 248,765 73,544
Net change in plan fiduciary net position (876,656) 2,788,038
Plan fiduciary net position, beginning 66,363,342 63,575,304
Plan fiduciary net position, ending $ 65,486,686 $ 66,363,342
Net pension liability $ 7,113,453 $ 3,206,740
Plan fiduciary net position as a percentage of the total pension liability 90.2 % 95.39 %
Covered Valuation Payroll $ 14,086,347 $ 13,846,282
Net pension liability as a percentage of covered valuation payroll 50.50 % 23.16 %
Note: The District implemented GASB 68 beginning with it's fiscal year ended June 30, 2015 therefore 10 years
of information is not available.
Northfield Township High School District 225
Illinois Municipal Retirement Fund
June 30, 2016
MULTIYEAR SCHEDULE OF CHANGES IN NET PENSION LIABILITY AND RELATED RATIOS
MOST RECENT CALANDAR YEARS
-69-

Calendar Year Actuarially Contribution Covered Actual Contribution
Ending Determined Actual Deficiency Valuation as a % of
December 31, Contribution Contribution (Excess) Payroll Covered Valuation Payroll
2015 $ 1,488,927 * $ 1,489,117 $ (190) $ 14,086,347 10.57 %
2014 1,474,629 1,474,629 - 13,846,282 10.65 %
*
Northfield Township High School District 225MULTIYEAR SCHEDULE OF CONTRIBUTIONS
Illinois Municipal Retirement Fund
June 30, 2016
Note: The District implemented GASB 68 beginning with it's fiscal year ended June 30, 2015 therefore 10 years of
information is not available.
Estimated based on contribution rate of 10.57% and covered valuation payroll of $14,086,347.
-70-

Fiscal year ended June 30,
2015 2014
District's proportion of the net
pension liability 0.0106395943 % 0.0100113316 %
District's proportionate share
of the net pension liability $ 6,970,006 $ 6,092,723
State's proportionate share of the net pension
liability associated with the District 332,308,931 325,713,078
Total $ 339,278,937 $ 331,805,801
District's covered-employee payroll $ 55,455,031 $ 52,795,056
District's proportionate share of the net pension
liability as a percentage of its
covered-employee payroll 12.57% 11.54%
Plan fiduciary net position as a percentage
of the total pension liability 41.50% 43.00%
Note 1: The amounts presented were determined as of the prior fiscal-year end.
Note 2: The District implemented GASB 68 beginning with it's fiscal year ended June 30, 2015 therefore 10 years
of information is not available.
Northfield Township High School District 225MULTIYEAR SCHEDULE OF THE DISTRICT'S PROPORTIONATE
SHARE OF THE NET PENSION LIABILITY
June 30, 2016
Teachers' Retirement System of the State of Illinois
-71-

Fiscal year ended June 30,
2015 2014
Contractually required contribution $ 368,043 $ 357,199
Contributions in relation to the contractually
required contribution (372,811) (357,199)
Contribution excess $ (4,768) $ -
District's covered-employee payroll $ 55,455,031 $ 52,795,056
Contributions as a percentage of
covered-employee payroll 0.67% 0.68%
Northfield Township High School District 225MULTIYEAR SCHEDULE OF DISTRICT CONTRIBUTIONS
Teachers' Retirement System of the State of Illinois
June 30, 2016
Note: The District implemented GASB 68 beginning with it's fiscal year ended June 30, 2015 therefore 10 years of
information is not available.
-72-

(6)
(2) (4) UAAL as a
Actuarial (3) Unfunded Percentage
Accrued Funded AAL (5) of Covered
Liability Ratio (UAAL) Covered Payroll
(AAL) (1) / (2) (2) - (1) Payroll [(2)-(1)]/(5)
$ $ 17,685,379 0.00 % $ 17,685,379 $ 62,970,771 28.0 %
17,685,379 0.00 17,685,379 62,970,771 28.0
18,419,653 0.00 18,419,653 NA NA
NA - not available
* Results from June 30, 2015 actuarial valuation.
06/30/2016* -
Northfield Township High School District 225SCHEDULE OF FUNDING PROGRESS
OTHER POSTEMPLOYMENT BENEFITS
June 30, 2016
(1)
Actuarial Actuarial
06/30/2015 -
06/30/2014 -
Valuation Value of
Date Assets
-73-

Original Variance
Final From 2015
Budget Actual Final Budget Actual
Revenues
Local sources
General levy 91,569,267$ 91,013,665$ (555,602)$ 89,063,828$
Summer school tuition from pupils or parents 400,000 324,234 (75,766) 427,333
Interest on investments 140,000 261,776 121,776 145,838
Admissions - athletic 13,000 12,951 (49) 12,785
Fees 865,200 471,607 (393,593) 594,731
Other district/school activity revenue 40,000 39,624 (376) 40,460
Sales - regular textbook - - - (235)
Rentals 300,000 845,704 545,704 742,489
Services provided other districts 40,000 39,808 (192) 49,371
Refund of prior years' expenditures - 59,989 59,989 -
Drivers' education fees 95,000 108,500 13,500 96,250
Proceeds from vendors' contracts 25,000 26,379 1,379 26,945
Local fees 10,000 75,574 65,574 18,650
Total local sources 93,497,467 93,279,811 (217,656) 91,218,445
State sources
General State Aid 1,150,000 1,648,367 498,367 1,153,612
Special Education - Private Facility Tuition 110,000 205,714 95,714 143,088
Special Education - Extraordinary 600,000 613,113 13,113 581,308
Special Education - Personnel 800,000 858,027 58,027 838,654
Special Education - Orphanage - Individual 40,000 15,963 (24,037) 62,483
Special Education -
Orphanage - Summer Individual 7,000 11,834 4,834 7,493
Special Education - Summer School 2,500 4,418 1,918 2,691
Secondary Program Improvement (CTEI) - 78,969 78,969 71,061
CTE - Agriculture Education - - - 430
(Continued)
2016
Northfield Township High School District 225General Fund - Budgetary Basis
SCHEDULE OF REVENUES, EXPENDITURES,
AND CHANGES IN FUND BALANCES - BUDGET AND ACTUAL
For the Year Ended June 30, 2016
With Comparative Actual Amounts for the Year Ended June 30, 2015
-74-

Original Variance
Final From 2015
Budget Actual Final Budget Actual
2016
Northfield Township High School District 225General Fund - Budgetary Basis
SCHEDULE OF REVENUES, EXPENDITURES,
AND CHANGES IN FUND BALANCES - BUDGET AND ACTUAL
For the Year Ended June 30, 2016
With Comparative Actual Amounts for the Year Ended June 30, 2015
State sources (Continued)
Bilingual Ed. - Downstate - T.P.I. and T.P.E. -$ 25,245$ 25,245$ 53,894$
Driver Education 100,000 75,738 (24,262) 88,538
Other state sources 15,000 2,959 (12,041) 22,088
Total state sources 2,824,500 3,540,347 715,847 3,025,340
Federal sources
Title I - Low Income - 387,876 387,876 366,766
Federal - Special Education -
I.D.E.A. - Flow Through 600,000 622,378 22,378 544,820
Federal - Special Education -
I.D.E.A. - Room and Board 900,000 1,949,854 1,049,854 1,166,362
CTE - Perkins - Title IIIE Technical Prep - 74,405 74,405 67,080
Title III - English Language Acquisition - 15,750 15,750 10,064
Title II - Teacher Quality - 55,000 55,000 60,858
Medicaid Matching Funds -
Administrative Outreach 100,000 28,796 (71,204) 55,098
Medicaid Matching Funds -
Fee-For-Service-Program 120,000 14,463 (105,537) 63,637
Other federal sources 20,000 76,462 56,462 20,504
Total federal sources 1,740,000 3,224,984 1,484,984 2,355,189
Total revenues 98,061,967 100,045,142 1,983,175 96,598,974
(Continued)
-75-

Original Variance
Final From 2015
Budget Actual Final Budget Actual
2016
Northfield Township High School District 225General Fund - Budgetary Basis
SCHEDULE OF REVENUES, EXPENDITURES,
AND CHANGES IN FUND BALANCES - BUDGET AND ACTUAL
For the Year Ended June 30, 2016
With Comparative Actual Amounts for the Year Ended June 30, 2015
Expenditures
Instruction
Regular programs
Salaries 30,686,128$ 29,426,689$ 1,259,439$ 29,176,708$
Employee benefits 7,250,536 6,564,610 685,926 6,409,540
Purchased services 873,864 626,333 247,531 845,524
Supplies and materials 592,104 237,132 354,972 294,120
Capital outlay 80,677 88,959 (8,282) 33,927
Other objects 51,500 9,162 42,338 47,060
Non-capitalized equipment 144,613 183,197 (38,584) 139,318
Total 39,679,422 37,136,082 2,543,340 36,946,197
Special education programs
Salaries 6,077,003 6,084,724 (7,721) 5,908,728
Employee benefits 1,177,439 1,053,917 123,522 981,562
Purchased services 1,463,050 1,910,086 (447,036) 1,628,141
Supplies and materials 64,190 31,809 32,381 40,899
Capital outlay 23,900 9,465 14,435 10,379
Other objects 15,000 - 15,000 10,183
Non-capitalized equipment - 991 (991) 2,475
Total 8,820,582 9,090,992 (270,410) 8,582,367
Remedial and Supplemental
programs K-12
Salaries 25,700 161,111 (135,411) 167,687
Employee benefits 355 60,787 (60,432) 58,268
Purchased services - 101,066 (101,066) 98,384
Supplies and materials - 207 (207) 3,153
Total 26,055 323,171 (297,116) 327,492
(Continued)
-76-

Original Variance
Final From 2015
Budget Actual Final Budget Actual
2016
Northfield Township High School District 225General Fund - Budgetary Basis
SCHEDULE OF REVENUES, EXPENDITURES,
AND CHANGES IN FUND BALANCES - BUDGET AND ACTUAL
For the Year Ended June 30, 2016
With Comparative Actual Amounts for the Year Ended June 30, 2015
CTE programs
Salaries 3,195,070$ 3,239,674$ (44,604)$ 3,035,905$
Employee benefits 450,879 429,138 21,741 380,794
Purchased services 36,875 34,095 2,780 36,626
Supplies and materials 76,893 128,065 (51,172) 123,976
Capital outlay - 33,444 (33,444) 25,126
Non-capitalized equipment 58,716 96,618 (37,902) 79,177
Total 3,818,433 3,961,034 (142,601) 3,681,604
Interscholastic programs
Salaries 4,784,577 5,052,910 (268,333) 4,609,116
Employee benefits 298,078 309,777 (11,699) 249,125
Purchased services 514,005 655,187 (141,182) 599,823
Supplies and materials 265,636 248,274 17,362 221,703
Capital outlay - 44,125 (44,125) 94,397
Other objects 36,000 98,492 (62,492) 35,387
Non-capitalized equipment 7,200 2,728 4,472 53,396
Total 5,905,496 6,411,493 (505,997) 5,862,947
Summer school programs
Salaries 405,432 485,835 (80,403) 386,043
Employee benefits 5,126 5,403 (277) 4,349
Purchased services - 663 (663) (13,375)
Supplies and materials 20,000 9,021 10,979 15,526
Other objects 11,000 11,002 (2) 10,571
Total 441,558 511,924 (70,366) 403,114
(Continued)
-77-

Original Variance
Final From 2015
Budget Actual Final Budget Actual
2016
Northfield Township High School District 225General Fund - Budgetary Basis
SCHEDULE OF REVENUES, EXPENDITURES,
AND CHANGES IN FUND BALANCES - BUDGET AND ACTUAL
For the Year Ended June 30, 2016
With Comparative Actual Amounts for the Year Ended June 30, 2015
Gifted programs
Salaries 552,311$ 552,256$ 55$ 543,844$
Employee benefits 80,171 63,975 16,196 67,327
Purchased services 1,000 455 545 774
Supplies and materials 5,000 4,670 330 4,495
Total 638,482 621,356 17,126 616,440
Drivers education programs
Salaries 690,583 695,897 (5,314) 641,358
Employee benefits 97,779 90,687 7,092 85,555
Purchased services 13,125 3,339 9,786 5,463
Supplies and materials 2,274 1,993 281 4,536
Capital outlay - - - 97,658
Total 803,761 791,916 11,845 834,570
Bilingual programs
Salaries 410,535 444,611 (34,076) 436,613
Employee benefits 49,746 65,594 (15,848) 42,594
Supplies and materials 1,000 975 25 1,350
Total 461,281 511,180 (49,899) 480,557
Truant's alternative and optional programs
optional programs
Other objects 35,000 34,281 719 114,655
Total 35,000 34,281 719 114,655
(Continued)
-78-

Original Variance
Final From 2015
Budget Actual Final Budget Actual
2016
Northfield Township High School District 225General Fund - Budgetary Basis
SCHEDULE OF REVENUES, EXPENDITURES,
AND CHANGES IN FUND BALANCES - BUDGET AND ACTUAL
For the Year Ended June 30, 2016
With Comparative Actual Amounts for the Year Ended June 30, 2015
Special education programs K-12 - private tuition 5,934,000$ 6,256,025$ (322,025)$ 5,867,989$
Total instruction 66,564,070 65,649,454 914,616 63,717,932
Support services
Pupils
Attendance and social work services
Salaries 1,745,281 1,693,321 51,960 2,001,563
Employee benefits 435,367 363,403 71,964 376,736
Purchased services 306,350 283,886 22,464 291,425
Supplies and materials 10,751 13,076 (2,325) 10,239
Non-capitalized equipment 15,356 8,314 7,042 18,632
Total 2,513,105 2,362,000 151,105 2,698,595
Guidance services
Salaries 4,458,150 4,406,726 51,424 4,445,534
Employee benefits 787,685 651,244 136,441 673,537
Purchased services 28,960 17,673 11,287 22,756
Supplies and materials 32,388 20,376 12,012 24,614
Non-capitalized equipment - 4,658 (4,658) 2,358
Total 5,307,183 5,100,677 206,506 5,168,799
Health services
Salaries 303,221 312,670 (9,449) 350,551
Employee benefits 86,243 61,951 24,292 70,466
Purchased services 19,825 7,551 12,274 18,247
Supplies and materials 10,002 6,581 3,421 5,931
Capital outlay - - - 1,826
Total 419,291 388,753 30,538 447,021
(Continued)
-79-

Original Variance
Final From 2015
Budget Actual Final Budget Actual
2016
Northfield Township High School District 225General Fund - Budgetary Basis
SCHEDULE OF REVENUES, EXPENDITURES,
AND CHANGES IN FUND BALANCES - BUDGET AND ACTUAL
For the Year Ended June 30, 2016
With Comparative Actual Amounts for the Year Ended June 30, 2015
Psychological services
Salaries 1,271,461$ 1,280,182$ (8,721)$ 1,081,909$
Employee benefits 143,295 142,435 860 118,529
Purchased services 10,000 90 9,910 9,878
Supplies and materials 34,500 10,816 23,684 10,860
Total 1,459,256 1,433,523 25,733 1,221,176
Speech pathology and
audiology services
Salaries 289,710 289,709 1 278,324
Employee benefits 48,049 44,098 3,951 40,081
Supplies and materials 4,000 2,013 1,987 1,883
Total 341,759 335,820 5,939 320,288
Other support services - pupils
Salaries 700,034 666,161 33,873 686,771
Employee benefits 300,545 253,272 47,273 251,779
Purchased services 5,000 3,623 1,377 2,477
Capital outlay - - - 35,302
Total 1,005,579 923,056 82,523 976,329
Total pupils 11,046,173 10,543,829 502,344 10,832,208
(Continued)
-80-
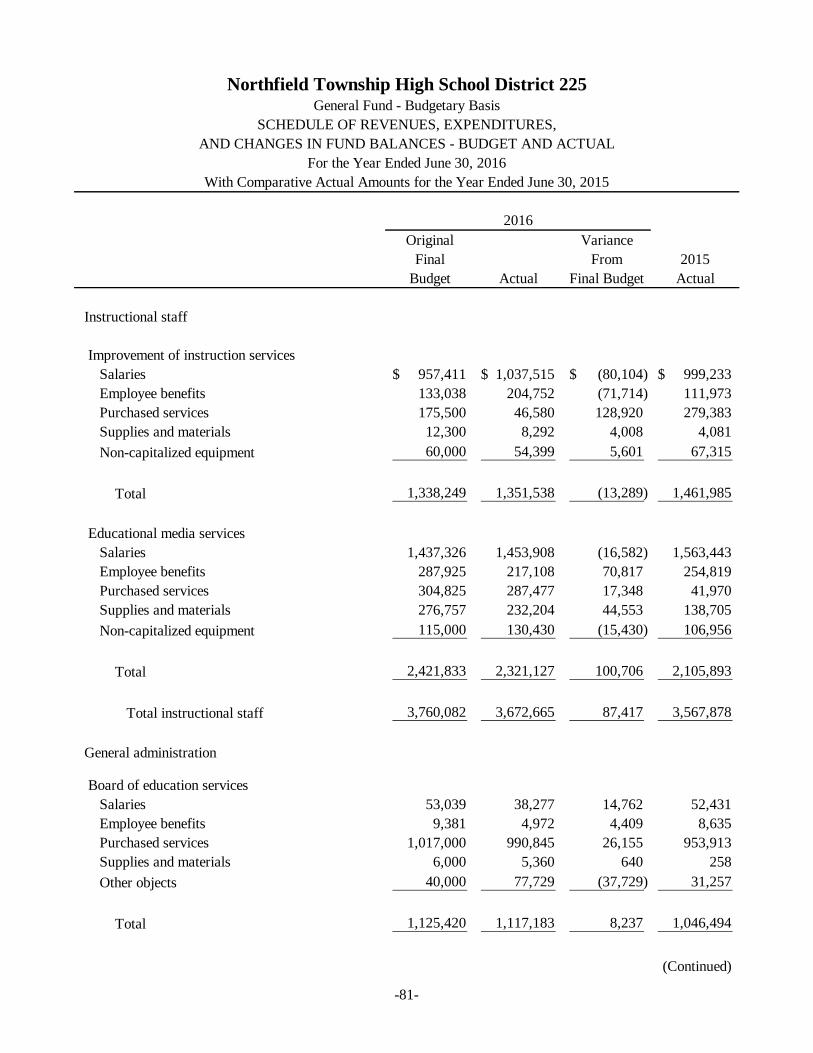
Original Variance
Final From 2015
Budget Actual Final Budget Actual
2016
Northfield Township High School District 225General Fund - Budgetary Basis
SCHEDULE OF REVENUES, EXPENDITURES,
AND CHANGES IN FUND BALANCES - BUDGET AND ACTUAL
For the Year Ended June 30, 2016
With Comparative Actual Amounts for the Year Ended June 30, 2015
Instructional staff
Improvement of instruction services
Salaries 957,411$ 1,037,515$ (80,104)$ 999,233$
Employee benefits 133,038 204,752 (71,714) 111,973
Purchased services 175,500 46,580 128,920 279,383
Supplies and materials 12,300 8,292 4,008 4,081
Non-capitalized equipment 60,000 54,399 5,601 67,315
Total 1,338,249 1,351,538 (13,289) 1,461,985
Educational media services
Salaries 1,437,326 1,453,908 (16,582) 1,563,443
Employee benefits 287,925 217,108 70,817 254,819
Purchased services 304,825 287,477 17,348 41,970
Supplies and materials 276,757 232,204 44,553 138,705
Non-capitalized equipment 115,000 130,430 (15,430) 106,956
Total 2,421,833 2,321,127 100,706 2,105,893
Total instructional staff 3,760,082 3,672,665 87,417 3,567,878
General administration
Board of education services
Salaries 53,039 38,277 14,762 52,431
Employee benefits 9,381 4,972 4,409 8,635
Purchased services 1,017,000 990,845 26,155 953,913
Supplies and materials 6,000 5,360 640 258
Other objects 40,000 77,729 (37,729) 31,257
Total 1,125,420 1,117,183 8,237 1,046,494
(Continued)
-81-

Original Variance
Final From 2015
Budget Actual Final Budget Actual
2016
Northfield Township High School District 225General Fund - Budgetary Basis
SCHEDULE OF REVENUES, EXPENDITURES,
AND CHANGES IN FUND BALANCES - BUDGET AND ACTUAL
For the Year Ended June 30, 2016
With Comparative Actual Amounts for the Year Ended June 30, 2015
Executive administration services
Salaries 545,773$ 556,333$ (10,560)$ 525,921$
Employee benefits 97,878 95,308 2,570 89,895
Purchased services 17,350 5,249 12,101 13,014
Supplies and materials 3,650 1,630 2,020 1,508
Other objects 4,525 20,473 (15,948) 4,194
Total 669,176 678,993 (9,817) 634,532
Special area administrative services
Salaries 785,604 779,289 6,315 731,276
Employee benefits 221,169 198,692 22,477 192,652
Purchased services 62,350 40,052 22,298 60,965
Supplies and materials 21,103 12,311 8,792 5,028
Non-capitalized equipment 2,656 1,905 751 1,145
Total 1,092,882 1,032,249 60,633 991,066
Total general administration 2,887,478 2,828,425 59,053 2,672,092
School administration
Office of the principal services
Salaries 1,613,689 1,598,471 15,218 1,599,182
Employee benefits 344,000 328,864 15,136 303,560
Purchased services 110,199 107,343 2,856 86,623
Supplies and materials 128,909 110,293 18,616 156,153
Capital outlay - - - 24,832
Non-capitalized equipment 8,556 2,391 6,165 1,325
Total 2,205,353 2,147,362 57,991 2,171,675
(Continued)
-82-

Original Variance
Final From 2015
Budget Actual Final Budget Actual
2016
Northfield Township High School District 225General Fund - Budgetary Basis
SCHEDULE OF REVENUES, EXPENDITURES,
AND CHANGES IN FUND BALANCES - BUDGET AND ACTUAL
For the Year Ended June 30, 2016
With Comparative Actual Amounts for the Year Ended June 30, 2015
Other support services -
school administration
Salaries 3,880,551$ 3,875,582$ 4,969$ 3,873,204$
Employee benefits 1,096,247 1,025,685 70,562 941,076
Total 4,976,798 4,901,267 75,531 4,814,280
Total school administration 7,182,151 7,048,629 133,522 6,985,955
Business
Direction of business support services
Salaries 326,192 326,355 (163) 306,309
Employee benefits 63,053 62,723 330 54,011
Purchased services 8,700 6,119 2,581 8,163
Supplies and materials 4,700 591 4,109 2,384
Total 402,645 395,788 6,857 370,867
Fiscal services
Salaries 580,827 546,756 34,071 508,170
Employee benefits 146,297 141,572 4,725 122,028
Purchased services 35,150 4,447 30,703 17,289
Supplies and materials 56,500 27,889 28,611 63,330
Capital outlay 2,500 - 2,500 -
Non-capitalized equipment - 1,147 (1,147) -
Total 821,274 721,811 99,463 710,817
(Continued)
-83-

Original Variance
Final From 2015
Budget Actual Final Budget Actual
2016
Northfield Township High School District 225General Fund - Budgetary Basis
SCHEDULE OF REVENUES, EXPENDITURES,
AND CHANGES IN FUND BALANCES - BUDGET AND ACTUAL
For the Year Ended June 30, 2016
With Comparative Actual Amounts for the Year Ended June 30, 2015
Operation and maintenance of
plant services
Purchased services 262,500$ 208,959$ 53,541$ 236,902$
Supplies and materials 1,545,500 1,519,078 26,422 1,510,221
Capital outlay - - - 405
Total 1,808,000 1,728,037 79,963 1,747,528
Pupil transportation services
Purchased services 55,585 48,902 6,683 41,830
Total 55,585 48,902 6,683 41,830
Food services
Purchased services 20,000 52,857 (32,857) 13,955
Supplies and materials 13,000 - 13,000 16,230
Other objects 500 275 225 275
Non-capitalized equipment 25,000 32,679 (7,679) 27,118
Total 58,500 85,811 (27,311) 57,578
Internal services
Purchased services 571,500 514,074 57,426 594,637
Supplies and materials 245,000 217,992 27,008 305,651
Other objects 32,500 39,715 (7,215) 34,039
Total 849,000 771,781 77,219 934,327
Total business 3,995,004 3,752,130 242,874 3,862,947
(Continued)
-84-

Original Variance
Final From 2015
Budget Actual Final Budget Actual
2016
Northfield Township High School District 225General Fund - Budgetary Basis
SCHEDULE OF REVENUES, EXPENDITURES,
AND CHANGES IN FUND BALANCES - BUDGET AND ACTUAL
For the Year Ended June 30, 2016
With Comparative Actual Amounts for the Year Ended June 30, 2015
Central
Direction of central support services
Salaries 34,449$ 32,449$ 2,000$ 30,728$
Employee benefits 11,072 9,946 1,126 8,841
Purchased services 127,000 143,079 (16,079) 124,961
Supplies and materials 30,000 24,616 5,384 44,344
Capital outlay 100,000 154,463 (54,463) 71,557
Other objects 1,000 1,002 (2) 799
Non-capitalized equipment 5,000 16,502 (11,502) 4,470
Total 308,521 382,057 (73,536) 285,700
Information services
Salaries 132,928 134,514 (1,586) 130,007
Employee benefits 34,286 35,407 (1,121) 28,804
Purchased services 16,900 18,714 (1,814) 6,585
Supplies and materials 3,200 3,736 (536) 2,468
Other objects 300 - 300 -
Total 187,614 192,371 (4,757) 167,864
Staff services
Salaries 459,246 446,961 12,285 366,737
Employee benefits 343,326 335,791 7,535 237,364
Purchased services 59,000 16,836 42,164 40,210
Supplies and materials 33,500 35,265 (1,765) 26,893
Other objects 1,500 - 1,500 540
Total 896,572 834,853 61,719 671,744
(Continued)
-85-

Original Variance
Final From 2015
Budget Actual Final Budget Actual
2016
Northfield Township High School District 225General Fund - Budgetary Basis
SCHEDULE OF REVENUES, EXPENDITURES,
AND CHANGES IN FUND BALANCES - BUDGET AND ACTUAL
For the Year Ended June 30, 2016
With Comparative Actual Amounts for the Year Ended June 30, 2015
Data processing services
Salaries 1,439,455$ 1,431,803$ 7,652$ 1,300,231$
Employee benefits 228,730 232,226 (3,496) 189,641
Purchased services 1,811,000 2,048,594 (237,594) 489,506
Supplies and materials 25,000 38,144 (13,144) 256,740
Capital outlay 300,000 141,479 158,521 2,166,780
Other objects 20,000 - 20,000 10,000
Non-capitalized equipment 50,000 372,570 (322,570) 62,709
Total 3,874,185 4,264,816 (390,631) 4,475,607
Total central 5,266,892 5,674,097 (407,205) 5,600,915
Total support services 34,137,780 33,519,775 618,005 33,521,995
Community services
Salaries 43,000 53,277 (10,277) 50,286
Employee benefits - 3,152 (3,152) 3,473
Purchased services - 35,703 (35,703) -
Supplies and materials - 325 (325) -
Other objects - 225 (225) -
Non-capitalized equipment - 2,810 (2,810) -
Total 43,000 95,492 (52,492) 53,759
Debt service
Provision for contingencies 500,000 - 500,000 -
Total expenditures 101,244,850 99,264,721 1,980,129 97,293,686
Excess (deficiency) of revenues over expenditures (3,182,883) 780,421 3,963,304 (694,712)
(Continued)
-86-

Original Variance
Final From 2015
Budget Actual Final Budget Actual
2016
Northfield Township High School District 225General Fund - Budgetary Basis
SCHEDULE OF REVENUES, EXPENDITURES,
AND CHANGES IN FUND BALANCES - BUDGET AND ACTUAL
For the Year Ended June 30, 2016
With Comparative Actual Amounts for the Year Ended June 30, 2015
Other financing sources (uses)
Proceeds from capital lease 60,000$ 460,330$ 400,330$ 1,765,326$
Transfer to Debt Service Fund to pay principal
and interest on capital leases (60,000) (745,380) (685,380) (1,244,469)
Transfer to Capital Projects Fund (350,000) (350,000) - -
Total other financing sources (uses) (350,000) (635,050) (285,050) 520,857
Net change in fund balance (3,532,883)$ 145,371 3,678,254$ (173,855)
Fund balance, beginning of year 61,224,470 61,398,325
Fund balance, end of year 61,369,841$ 61,224,470$
(Concluded)
-87-

Original Variance
Final From 2015
Budget Actual Final Budget Actual
Revenues
Local sources
General levy 2,965,390$ 2,945,018$ (20,372)$ 3,420,873$
Corporate personal property
replacement taxes 2,300,000 1,828,606 (471,394) 2,169,002
Other payments in lieu of taxes 5,900,000 5,900,000 - 3,800,000
Interest on investments 20,000 20,376 376 25,884
Fees 355,000 407,107 52,107 360,055
Rentals 135,000 81,998 (53,002) 174,246
Total local sources 11,675,390 11,183,105 (492,285) 9,950,060
Total revenues 11,675,390 11,183,105 (492,285) 9,950,060
Expenditures
Support services
Facilities acquisition and
construction services
Salaries 5,000 7,957 (2,957) 2,790
Purchased services 74,000 69,361 4,639 60,086
Supplies and materials 57,000 27,810 29,190 51,750
Capital outlay 29,000 20,072 8,928 38,727
Other objects 35,000 60,983 (25,983) 59,659
Non-capitalized equipment 11,000 15,626 (4,626) 8,412
Total 211,000 201,809 9,191 221,424
(Continued)
2016
Northfield Township High School District 225Operations and Maintenance Fund
SCHEDULE OF REVENUES, EXPENDITURES,
AND CHANGES IN FUND BALANCES - BUDGET AND ACTUAL
For the Year Ended June 30, 2016
With Comparative Actual Amounts for the Year Ended June 30, 2015
-88-

Original Variance
Final From 2015
Budget Actual Final Budget Actual
2016
Northfield Township High School District 225Operations and Maintenance Fund
SCHEDULE OF REVENUES, EXPENDITURES,
AND CHANGES IN FUND BALANCES - BUDGET AND ACTUAL
For the Year Ended June 30, 2016
With Comparative Actual Amounts for the Year Ended June 30, 2015
Operation and maintenance
of plant services
Salaries 4,371,962$ 4,361,569$ 10,393$ 4,318,585$
Employee benefits 1,197,904 1,053,929 143,975 998,458
Purchased services 1,182,500 1,240,939 (58,439) 1,286,150
Supplies and materials 567,850 603,566 (35,716) 591,704
Capital outlay 156,009 158,470 (2,461) 168,663
Other objects 20,000 29,414 (9,414) 15,525
Non-capitalized equipment 51,600 76,553 (24,953) 2,763
Total 7,547,825 7,524,440 23,385 7,381,848
Total support services 7,758,825 7,726,249 32,576 7,603,272
Provision for contingencies 50,000 - 50,000 -
Total expenditures 7,808,825 7,726,249 82,576 7,603,272
Excess of revenues over expenditures 3,866,565 3,456,856 (409,709) 2,346,788
Other financing uses
Transfer to Capital Projects Fund (2,900,000) (2,900,000) - (425,000)
Transfer to Debt Service Fund to pay
principal and interest of lease certificates (374,394) (374,394) - (373,427)
Total other financing uses (3,274,394) (3,274,394) - (798,427)
Net change in fund balance 592,171$ 182,462 (409,709)$ 1,548,361
Fund balance, beginning of year 11,846,560 10,298,199
Fund balance, end of year 12,029,022$ 11,846,560$
(Concluded)-89-

Original Variance
Final From 2015
Budget Actual Final Budget Actual
Revenues
Local sources
General levy 497,232$ 490,861$ (6,371)$ 374,295$
Regular transportation fees
from pupils or parents 615,000 660,266 45,266 628,843
Interest on investments 7,000 6,181 (819) 7,845
Total local sources 1,119,232 1,157,308 38,076 1,010,983
State sources
Transportation - Special Education 800,000 1,256,872 456,872 937,950
Total state sources 800,000 1,256,872 456,872 937,950
Total revenues 1,919,232 2,414,180 494,948 1,948,933
(Continued)
2016
Northfield Township High School District 225Transportation Fund
SCHEDULE OF REVENUES, EXPENDITURES,
AND CHANGES IN FUND BALANCES - BUDGET AND ACTUAL
For the Year Ended June 30, 2016
With Comparative Actual Amounts for the Year Ended June 30, 2015
-90-

Original Variance
Final From 2015
Budget Actual Final Budget Actual
2016
Northfield Township High School District 225Transportation Fund
SCHEDULE OF REVENUES, EXPENDITURES,
AND CHANGES IN FUND BALANCES - BUDGET AND ACTUAL
For the Year Ended June 30, 2016
With Comparative Actual Amounts for the Year Ended June 30, 2015
Expenditures
Support services
Pupil transportation services
Salaries 20,023$ 18,023$ 2,000$ 17,756$
Purchased services 2,831,000 2,857,772 (26,772) 2,780,422
Supplies and materials 2,800 7,054 (4,254) 1,407
Other objects 3,000 3,000 - 1,141
Non-capitalized equipment 1,000 - 1,000 -
Total 2,857,823 2,885,849 (28,026) 2,800,726
Total support services 2,857,823 2,885,849 (28,026) 2,800,726
Provision for contingencies 130,000 - 130,000 -
Total expenditures 2,987,823 2,885,849 101,974 2,800,726
Deficiency of revenues over expenditures (1,068,591)$ (471,669) 596,922$ (851,793)
Fund balance, beginning of year 2,254,655 3,106,448
Fund balance, end of year 1,782,986$ 2,254,655$
(Concluded)-91-

Original Variance
Final From 2015
Budget Actual Final Budget Actual
Revenues
Local sources
General levy 1,497,695$ 1,474,887$ (22,808)$ 1,235,821$
Social security/medicare only levy 1,795,234 1,767,260 (27,974) 1,768,747
Corporate personal property
replacement taxes 320,000 320,000 - 320,000
Interest on investments 3,000 - (3,000) 16,851
Total local sources 3,615,929 3,562,147 (53,782) 3,341,419
Total revenues 3,615,929 3,562,147 (53,782) 3,341,419
Expenditures
Instruction
Regular programs 590,421 590,815 (394) 551,233
Special education programs 317,269 301,852 15,417 300,433
Remedial and supplemental programs K-12 355 8,122 (7,767) 7,237
Vocational educational programs 69,656 67,155 2,501 64,922
Interscholastic programs 263,101 274,090 (10,989) 253,382
Summer school programs 11,470 13,717 (2,247) 11,655
Gifted programs 7,805 7,666 139 7,539
Drivers education programs 9,430 9,902 (472) 9,111
Bilingual programs 5,565 11,354 (5,789) 8,016
Total instruction 1,275,072 1,284,673 (9,601) 1,213,528
(Continued)
2016
Northfield Township High School District 225Municipal Retirement / Social Security Fund
SCHEDULE OF REVENUES, EXPENDITURES,
AND CHANGES IN FUND BALANCES - BUDGET AND ACTUAL
For the Year Ended June 30, 2016
With Comparative Actual Amounts for the Year Ended June 30, 2015
-92-

Original Variance
Final From 2015
Budget Actual Final Budget Actual
2016
Northfield Township High School District 225Municipal Retirement / Social Security Fund
SCHEDULE OF REVENUES, EXPENDITURES,
AND CHANGES IN FUND BALANCES - BUDGET AND ACTUAL
For the Year Ended June 30, 2016
With Comparative Actual Amounts for the Year Ended June 30, 2015
Support services
Pupils
Attendance and social work services 146,088$ 126,686$ 19,402$ 142,919$
Guidance services 172,950 160,078 12,872 178,226
Health services 34,427 37,296 (2,869) 33,123
Psychological services 17,095 20,488 (3,393) 16,507
Speech pathology and audiology services 3,970 3,981 (11) 3,835
Other support services -pupils 125,684 112,800 12,884 117,919
Total pupils 500,214 461,329 38,885 492,529
Instructional staff
Improvement of instruction services 13,280 14,570 (1,290) 12,927
Educational media services 143,085 104,271 38,814 129,669
Total instructional staff 156,365 118,841 37,524 142,596
General administration
Board of education services 4,271 1,557 2,714 4,143
Executive administration services 33,234 35,100 (1,866) 31,625
Special area administrative services 44,002 40,773 3,229 40,110
Total general administration 81,507 77,430 4,077 75,878
(Continued)
-93-

Original Variance
Final From 2015
Budget Actual Final Budget Actual
2016
Northfield Township High School District 225Municipal Retirement / Social Security Fund
SCHEDULE OF REVENUES, EXPENDITURES,
AND CHANGES IN FUND BALANCES - BUDGET AND ACTUAL
For the Year Ended June 30, 2016
With Comparative Actual Amounts for the Year Ended June 30, 2015
School administration
Office of the principal services 109,860$ 102,448$ 7,412$ 102,025$
Other support services - school administration 181,042 171,610 9,432 174,389
Total school administration 290,902 274,058 16,844 276,414
Business
Direction of business support services 22,217 23,946 (1,729) 25,878
Fiscal services 84,328 82,135 2,193 80,190
Facilities acquisition and construction services 729 1,428 (699) 450
Operation and maintenance of plant services 783,553 727,479 56,074 752,581
Pupil transportation services 3,526 3,207 319 3,226
Total business 894,353 838,195 56,158 862,325
Central
Direction of central support services 6,101 5,799 302 5,663
Information services 24,200 24,222 (22) 23,782
Staff services 32,962 43,960 (10,998) 31,197
Data processing services 209,080 251,407 (42,327) 226,572
Total central 272,343 325,388 (53,045) 287,214
Total support services 2,195,684 2,095,241 100,443 2,136,956
Community services 47,835 49,858 (2,023) 46,203
Provision for contingencies 50,000 - 50,000 -
Total expenditures 3,568,591 3,429,772 138,819 3,396,687
(Continued)
-94-

Original Variance
Final From 2015
Budget Actual Final Budget Actual
2016
Northfield Township High School District 225Municipal Retirement / Social Security Fund
SCHEDULE OF REVENUES, EXPENDITURES,
AND CHANGES IN FUND BALANCES - BUDGET AND ACTUAL
For the Year Ended June 30, 2016
With Comparative Actual Amounts for the Year Ended June 30, 2015
Excess (deficiency) of revenues over expenditures 47,338$ 132,375 85,037$ (55,268)
Fund balance, beginning of year 1,810,812 1,866,080
Fund balance, end of year 1,943,187$ 1,810,812$
(Concluded)
-95-

1. LEGAL COMPLIANCE AND ACCOUNTABILITY - BUDGETS
a)
b)
c)
d)
e)
f)
2. EXPENDITURES IN EXCESS OF BUDGET
The following funds had expenditures in excess of budget at June 30, 2016:
Variance
Debt Service $ 882,100
Northfield Township High School District 225
NOTES TO THE REQUIRED SUPPLEMENTARY INFORMATION
June 30, 2016
Budgets are adopted on a basis consistent with generally accepted accounting principles. Annual budgets are
adopted at the fund level for the governmental funds. The annual budget is legally enacted and provides for a
legal level of control at the fund level. All annual budgets lapse at fiscal year-end.
The Board of Education follows these procedures in establishing the budgetary data reflected in the financial
statements:
The Administration submits to the Board of Education a proposed operating budget for the fiscal year
commencing July 1. The operating budget includes proposed expenditures and the means of financing them.
Public hearings are conducted and the proposed budget is available for inspection to obtain comments.
By September 30, the budget is legally adopted through passage of a resolution. By the last Tuesday in
December each year, a tax levy ordinance is filed with the County Clerk to obtain tax revenues.
Formal budgetary integration is employed as a management control device during the year for the
governmental funds.
The budget amounts shown in the financial statements are as originally adopted by the Board of Education,
on September 28, 2015.
Management is authorized to transfer budget amounts, provided funds are transferred between the same
function and object codes. The Board of Education is authorized to transfer up to a legal level of 10% of
the total budget between functions within a fund; however, any revisions that alter the total expenditures of
any fund must be approved by the Board of Education after the public hearing process mandated by law.
-96-

Northfield Township High School District 225
NOTES TO THE REQUIRED SUPPLEMENTARY INFORMATION
June 30, 2016
3. BUDGET RECONCILIATION
Revenues Expenditures
General fund - budgetary basis $ 100,045,142 $ 99,264,721
To adjust for on-behalf payments received 27,829,922 -
To adjust for on-behalf payments made - 27,829,922
General fund - GAAP basis $ 127,875,064 $ 127,094,643
4. TEACHERS' RETIREMENT SYSTEM OF THE STATE OF ILLINOIS
Changes of Assumptions
5.
THE 2015 IMRF CONTRIBUTION RATE*
Valuation Date:
Notes
The Statement of Revenues, Expenditures, and Changes in Fund Balance - Governmental Funds (GAAP Basis)
includes "on-behalf" payments received and made from the amounts contributed by the state of Illinois for the
employer's share of the Teacher's Retirement System pension. The District does not budget for these amounts.
The difference between the budget and the GAAP basis are as follows:
Amounts reported in 2015 reflect an investment rate of return of 7.50 percent, an inflation rate of 3.00 percent
and real return of 4.50 percent, and salary increases that vary by service credit. In 2014, assumptions used
were an investment rate of return of 7.50 percent, an inflation rate of 3.00 percent and real return of 4.50
percent, and salary increases of 5.75 percent.
Actuarially determined contribution rates are calculated as of December 31
each year, which is 12 months prior to the beginning of the fiscal year in
which contributions are reported.
SUMMARY OF ACTUARIAL METHODS AND ASSUMPTIONS USED IN THE CALCULATION OF
-97-

Northfield Township High School District 225
NOTES TO THE REQUIRED SUPPLEMENTARY INFORMATION
June 30, 2016
5.
THE 2015 IMRF CONTRIBUTION RATE* (Continued)
Methods and Assumptions Used to Determine the 2015 Contribution Rate:
Actuarial Cost Method Aggregate Entry Age Normal
Amortization Method Level Percentage of Payroll, Closed
Remaining Amortization Period Non-Taxing bodies: 10-year rolling period.
Asset Valuation Method 5-year smoothed market; 20% corridor
Wage Growth 4.00%
Price Inflation
Salary Increases 4.40% to 16.00%, including inflation
Investment Rate of Return 7.50%
Retirement Age
Mortality
Other Information:
Notes There were no benefit changes during the year.
* Based on Valuation Assumptions used in the December 31, 2013 actuarial valuation.
RP-2000 Combined Healthy Mortality Table, adjusted for mortality
improvements to 2020 using projection scale AA. For men, 120% of the
table rates were used. For women, 92% of the table rates were used. For
disabled lives, the mortality rates are the rates applicable to non-disabled
lives set forward 10 years.
3.0% - approximate; no explicit price inflation assumption is used in this
valuation.
Taxing bodies (Regular, SLEP and ECO groups): 28-year closed period
until remaining period reaches 15 years (then 15-year rolling period).
Early Retirement Incentive Plan liabilities: a period up to 10 years selected
by the Employer upon adoption of ERI.
Experience-based table of rates that are specific to the type of eligibility
condition. Last updated for the 2011 calculation pursuant to an experience
study of the period 2008-2010.
SUMMARY OF ACTUARIAL METHODS AND ASSUMPTIONS USED IN THE CALCULATION OF
SLEP supplemental liabilities attributable to Public Act 94-712 were
financed over 23 years for most employers (two employers were financed
over 32 years).
-98-

SUPPLEMENTARY FINANCIAL INFORMATION

Educational Working Cash
Account Account Total
ASSETS
Cash and investments 42,169,228$ 20,393,095$ 62,562,323$
Receivables (net of allowance
for uncollectibles):
Interest 58,096 24,758 82,854
Property taxes 44,091,884 403,376 44,495,260
Accounts 54,605 - 54,605
Intergovernmental 1,805,891 - 1,805,891
Prepaid items 302,246 - 302,246
Total assets 88,481,950$ 20,821,229$ 109,303,179$
LIABILITIES, DEFERRED INFLOWS,
AND FUND BALANCES
LIABILITIES
Accounts payable 1,315,918$ -$ 1,315,918$
Salaries and wages payable 119,720 - 119,720
Claims payable 1,946,907 - 1,946,907
Other current liabilities 18,323 - 18,323
Unearned revenue 149,653 - 149,653
Total liabilities 3,550,521 - 3,550,521
DEFERRED INFLOWS
Property taxes levied for a future period 43,981,583 401,234 44,382,817
Total deferred inflows 43,981,583 401,234 44,382,817
FUND BALANCES
Nonspendable 302,246 - 302,246
Unassigned 40,647,600 20,419,995 61,067,595
Total fund balance 40,949,846 20,419,995 61,369,841
Total liabilities, deferred inflows,
and fund balance 88,481,950$ 20,821,229$ 109,303,179$
Northfield Township High School District 225General Fund
COMBINING BALANCE SHEET
June 30, 2016
-99-
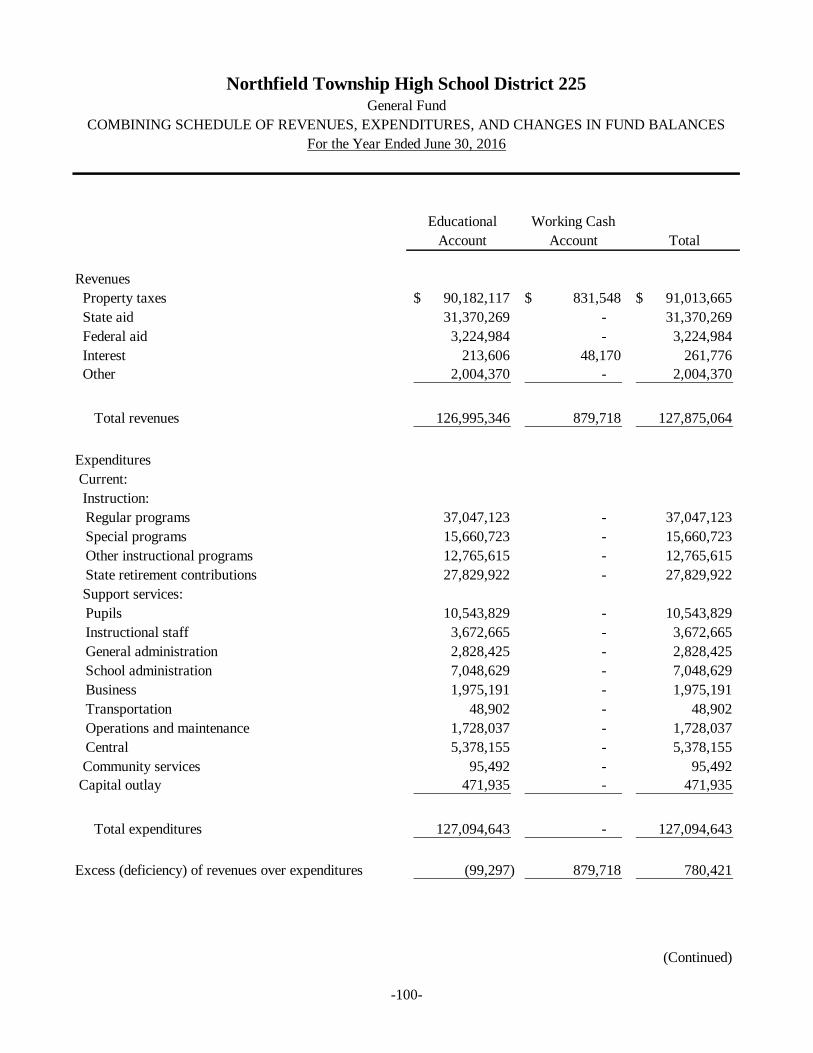
Educational Working Cash
Account Account Total
Revenues
Property taxes 90,182,117$ 831,548$ 91,013,665$
State aid 31,370,269 - 31,370,269
Federal aid 3,224,984 - 3,224,984
Interest 213,606 48,170 261,776
Other 2,004,370 - 2,004,370
Total revenues 126,995,346 879,718 127,875,064
Expenditures
Current:
Instruction:
Regular programs 37,047,123 - 37,047,123
Special programs 15,660,723 - 15,660,723
Other instructional programs 12,765,615 - 12,765,615
State retirement contributions 27,829,922 - 27,829,922
Support services:
Pupils 10,543,829 - 10,543,829
Instructional staff 3,672,665 - 3,672,665
General administration 2,828,425 - 2,828,425
School administration 7,048,629 - 7,048,629
Business 1,975,191 - 1,975,191
Transportation 48,902 - 48,902
Operations and maintenance 1,728,037 - 1,728,037
Central 5,378,155 - 5,378,155
Community services 95,492 - 95,492
Capital outlay 471,935 - 471,935
Total expenditures 127,094,643 - 127,094,643
Excess (deficiency) of revenues over expenditures (99,297) 879,718 780,421
(Continued)
Northfield Township High School District 225General Fund
COMBINING SCHEDULE OF REVENUES, EXPENDITURES, AND CHANGES IN FUND BALANCES
For the Year Ended June 30, 2016
-100-

Educational Working Cash
Account Account Total
Northfield Township High School District 225General Fund
COMBINING SCHEDULE OF REVENUES, EXPENDITURES, AND CHANGES IN FUND BALANCES
For the Year Ended June 30, 2016
Other financing sources (uses)
Transfers out (1,095,380)$ -$ (1,095,380)$
Proceeds from capital lease 460,330 - 460,330
Total other financing sources (uses) (635,050) - (635,050)
Net change in fund balance (734,347) 879,718 145,371
Fund balance, beginning of year 41,684,193 19,540,277 61,224,470
Fund balance, end of year 40,949,846$ 20,419,995$ 61,369,841$
(Concluded)
-101-

Original Variance
Final From 2015
Budget Actual Final Budget Actual
Revenues
Local sources
General levy 8,740,842$ 8,810,339$ 69,497$ 8,622,996$
Interest on investments 4,400 8,379 3,979 10,183
Total local sources 8,745,242 8,818,718 73,476 8,633,179
Federal sources
Build America Bonds Interest Reimbursement - 192,428 192,428 191,396
Total federal sources - 192,428 192,428 191,396
Total revenues 8,745,242 9,011,146 265,904 8,824,575
Expenditures
Debt services - interest
Bonds - interest 3,874,040 3,138,721 735,319 3,336,828
Total debt service - interest 3,874,040 3,138,721 735,319 3,336,828
Principal payments on long-term debt 4,992,368 6,664,463 (1,672,095) 6,774,760
Other debt service
Purchased services 10,500 5,824 4,676 5,867
Total 10,500 5,824 4,676 5,867
Total debt service 8,876,908 9,809,008 (932,100) 10,117,455
(Continued)
2016
Northfield Township High School District 225Debt Service Fund
SCHEDULE OF REVENUES, EXPENDITURES,
AND CHANGES IN FUND BALANCES - BUDGET AND ACTUAL
For the Year Ended June 30, 2016
With Comparative Actual Amounts for the Year Ended June 30, 2015
-102-

Original Variance
Final From 2015
Budget Actual Final Budget Actual
2016
Northfield Township High School District 225Debt Service Fund
SCHEDULE OF REVENUES, EXPENDITURES,
AND CHANGES IN FUND BALANCES - BUDGET AND ACTUAL
For the Year Ended June 30, 2016
With Comparative Actual Amounts for the Year Ended June 30, 2015
Provision for contingencies 50,000$ -$ 50,000$ -$
Total expenditures 8,926,908 9,809,008 (882,100) 10,117,455
Deficiency of revenues over expenditures (181,666) (797,862) (616,196) (1,292,880)
Other financing sources
Transfer to pay for capital leases - 745,380 745,380 1,244,469
Transfer to pay for interest on revenue bonds 3,250,000 - (3,250,000) -
Transfer to pay for lease certificates 374,394 374,394 - 373,427
Total other financing sources 3,624,394 1,119,774 (2,504,620) 1,617,896
Net change in fund balance 3,442,728$ 321,912 (3,120,816)$ 325,016
Fund balance, beginning of year 4,509,271 4,184,255
Fund balance, end of year 4,831,183$ 4,509,271$
(Concluded)
-103-

Original Variance
Final From 2015
Budget Actual Final Budget Actual
Revenues
Local sources
Corporate personal property
replacement taxes -$ -$ -$ 200,000$
Other payments in lieu of taxes 1,000,000 950,781 (49,219) 2,079,780
Interest on investments 4,000 - (4,000) 7,570
Contributions and donations from private sources - 243,617 243,617 159,079
Other - 604,000 604,000 -
Total local sources 1,004,000 1,798,398 794,398 2,446,429
Total revenues 1,004,000 1,798,398 794,398 2,446,429
Expenditures
Support services
Facilities acquisition and construction services
Capital outlay 4,750,000 4,574,018 175,982 4,965,155
Non-capitalized equipment - 600 (600) -
Total 4,750,000 4,574,618 175,382 4,965,155
Other support services
Other objects 100,000 - 100,000 -
Total 100,000 - 100,000 -
Total support services 4,850,000 4,574,618 275,382 4,965,155
Total expenditures 4,850,000 4,574,618 275,382 4,965,155
Deficiency of revenues over expenditures (3,846,000) (2,776,220) 1,069,780 (2,518,726)
(Continued)
2016
Northfield Township High School District 225Capital Projects Fund
SCHEDULE OF REVENUES, EXPENDITURES,
AND CHANGES IN FUND BALANCES (DEFICIT) - BUDGET AND ACTUAL
For the Year Ended June 30, 2016
With Comparative Actual Amounts for the Year Ended June 30, 2015
-104-

Original Variance
Final From 2015
Budget Actual Final Budget Actual
2016
Northfield Township High School District 225Capital Projects Fund
SCHEDULE OF REVENUES, EXPENDITURES,
AND CHANGES IN FUND BALANCES (DEFICIT) - BUDGET AND ACTUAL
For the Year Ended June 30, 2016
With Comparative Actual Amounts for the Year Ended June 30, 2015
Other financing sources
Transfers in from Operations and Maintenance Fund 3,250,000$ 3,250,000$ -$ 425,000$
Total other financing sources 3,250,000 3,250,000 - 425,000
Net change in fund balance (596,000)$ 473,780 1,069,780$ (2,093,726)
Fund balance (deficit), beginning of year (100,447) 1,993,279
Fund balance (deficit), end of year 373,333$ (100,447)$
(Concluded)
-105-

Balance Transfers / BalanceJuly 1, 2015 Additions Deletions Adjustments June 30, 2016
Assets Cash $ 1,872,503 $ 4,301,074 $ 4,628,146 $ - $ 1,545,431
Total Assets $ 1,872,503 $ 4,301,074 $ 4,628,146 $ - $ 1,545,431
Liabilities Due to activity fund accounts:
Central Activity
Academy $ (587) $ 2,354 $ 1,177 $ 590 $ - Accommodations - 995 995 - - Artificial Turf 613,043 155,001 641,500 - 126,544 Debate Tournament 12,040 243,972 255,810 - 202 Dual Credit Courses 888 2,100 2,050 - 938 Evening High School (343) 4,949 1,682 - 2,924
Evening High School Scholarship 8,100 1,069 1,500 - 7,669
Evening H.S. - Robert Watt Memorial 50 - - - 50 Glenbrook Techny Festival (340) 13,952 13,612 - - Glenbrook Education Foundation - 1,190 1,190 - - Glenbrook Symphony 200 - - - 200 Sunset on the Prairie 1,597 2,447 541 - 3,503 Dues & Fees 1,854 - - - 1,854 Glenbrook Musical 12,526 63,480 76,006 - - Peer Group Scholarship 5,161 - 2,000 - 3,161 Retirement 1,306 - - - 1,306 Scholarship and Trust 2,223 - 2,000 - 223 Johnson Scholarship 25,358 - - - 25,358 Township Articulation 5,340 - - - 5,340 Special Olympics 8,671 8,043 9,182 - 7,532 Student Activities (59,775) 63,204 4,019 (590) - District-TEAM 500 - - - 500 Transcript Fees (750) 1,500 750 - -
Interest earned 46,874 5,503 48,291 - 4,086
Total Central Activity 683,936 569,759 1,062,305 - 191,390
North Activity
Grad Nite - - 875 - (875) A Cappella 1,538 989 400 - 2,127 Activity Tickets 1,284 48,020 49,304 - - Advanced Placement 72,928 111,154 103,162 - 80,920
(Continued)
Northfield Township High School District 225STATEMENT OF CHANGES IN ASSETS AND LIABILITIES
AGENCY FUND - STUDENT ACTIVITY FUNDS
Year Ended June 30, 2016
-106-

Balance Transfers / BalanceJuly 1, 2015 Additions Deletions Adjustments June 30, 2016
Northfield Township High School District 225STATEMENT OF CHANGES IN ASSETS AND LIABILITIES
AGENCY FUND - STUDENT ACTIVITY FUNDS
Year Ended June 30, 2016
After School All Stars $ 1,085 $ 335 $ 546 $ - $ 874 Anime Club 177 - - - 177 Global Citizens 2,570 3,331 2,738 - 3,163 Art Supplies 2,490 700 670 - 2,520 Practical Horticulture Club (51) 2,505 1,935 - 519 Best Buddies 316 - - - 316 Breakfast Club 162 - - - 162 Bookstore (46,087) 99,907 53,820 - - Boy's P.E. Rental 5,932 1,921 1,654 - 6,199 Business Club 13,080 24,461 25,306 - 12,235 Cap and Gown - 13,615 13,438 - 177 Cheerleaders 42,149 56,033 47,372 - 50,810 Choose Health - 237 237 - - Choir Parents Organization - 2,750 2,270 - 480 Circle of Friends 197 - - - 197 Coffee & Tea Club - 116 126 - (10) Color Guard 66 4,317 4,055 - 328 Drama Productions 9,552 18,871 27,787 - 636 Duffy Memorial Scholarship 2,178 - 1,000 - 1,178 Earl Young Memorial Scholarship 1,280 1,250 - - 2,530 Engine Team 208 - - - 208 Environmental Awareness 225 - 124 - 101 Erika's Lighthouse 1,026 - 68 - 958 Field Trips 776 26,115 25,334 - 1,557 Friends & Comp 1,475 1,113 828 - 1,760 Future Educators 791 620 937 - 474 Gay Straight Alliance (GSA) 188 540 524 - 204
Guitar Club 1 - - - 1
GBN Fifty Year Anniversary 54 - - - 54
GBN Sports Tournaments 17,938 270,219 238,930 - 49,227
Helicon 16,191 4,101 7,920 - 12,372 Hellenic Club 626 305 338 - 593 Home Economics (HERO) 4,094 10,804 9,638 - 5,260 H W Schwaegerman Scholarship Fund 1,527 - - - 1,527 Hynda Gamze Educ Scholarship - 4,000 2,000 - 2,000 Illinois Science 865 - - - 865 In-HSE Grad 14,493 255 - - 14,748
(Continued)
-107-

Balance Transfers / BalanceJuly 1, 2015 Additions Deletions Adjustments June 30, 2016
Northfield Township High School District 225STATEMENT OF CHANGES IN ASSETS AND LIABILITIES
AGENCY FUND - STUDENT ACTIVITY FUNDS
Year Ended June 30, 2016
IL Athletic Directors Assoc. $ 364 $ 6,635 $ 6,994 $ - $ 5 Interact Club 8,891 1,750 472 - 10,169 Juggle & Magic - 125 73 - 52 Key Club 2,174 6,035 5,031 - 3,178 Korean Connection - 528 - - 528
Laconian 23,161 103,142 136,263 - (9,960)
Varsity Club 2,176 5,105 4,293 - 2,988
Library Account 2,221 327 323 - 2,225
Math Team 4,252 50 1,150 - 3,152 Mileage Monsters 3,792 - - - 3,792 Model U N Club 1,573 - - - 1,573 GBN MTAC Club 169 2,318 705 - 1,782 Music General 4,598 10,245 9,207 - 5,636 National Art Honor Society 382 795 902 - 275 National Forensic League-DEB 17,642 71,982 44,460 - 45,164
National Forensic League 663 8,642 7,889 - 1,416
National Honor Society 9,880 5,635 4,860 - 10,655 North Winds 406 100 328 - 178 North Suburban Science Supervisors 213 - - - 213 Orchesis 14,602 36,274 33,786 - 17,090 Pactech 329 645 645 - 329 Parents' Association - GBN 44,591 10,330 10,657 - 44,264 PAWS 2,234 308 297 - 2,245 Pom Pom Squad 39,117 26,692 45,113 - 20,696 GBN HR Herr Scholarship 4,065 - 135 - 3,930 PRASAD Science Award (1,000) 2,000 - - 1,000 PSAT/PACT Registration 13,137 3,535 916 - 15,756 Radio & Television 6,027 2,397 2,471 - 5,953 Recycle/Energy Initiative 329 - - - 329 Relay For Life Northbrook 2,443 2,910 3,746 - 1,607 Retirement Events 4 3,156 3,015 - 145 GBN Scholarship - Ha Vickery Med - 2,000 - - 2,000 Scholarship - Janna Sugar Memorial - 1,000 1,000 - - Scholarship - Bernard Memorial 19 - - - 19 Scholarship-Kelly Pedersen 50 500 500 - 50 Scholarship North - 4,750 4,750 - - Scholarship - Kiwanis Key Club 2,450 6,188 5,000 - 3,638 Scholarship Marian Rugless 13,848 - 1,500 - 12,348 Science Club 373 4,740 5,070 - 43 Scholastic Bowl - 104 53 - 51 Snowball 12,811 44,467 40,051 - 17,227
(Continued)
-108-

Balance Transfers / BalanceJuly 1, 2015 Additions Deletions Adjustments June 30, 2016
Northfield Township High School District 225STATEMENT OF CHANGES IN ASSETS AND LIABILITIES
AGENCY FUND - STUDENT ACTIVITY FUNDS
Year Ended June 30, 2016
Soundstage $ 842 $ - $ - $ - $ 842 Spartan Marching Band 14,128 43,672 42,136 - 15,664 Spartan Medical Club 648 197 435 - 410 Sports Banquets 293 - - - 293 Student Correspondence 145 - - - 145 Student Association 15,153 74,999 83,540 - 6,612 Test Prep Program 1,124 6,114 5,606 - 1,632 Theater Club 2,062 4,036 4,400 - 1,698 Theatre Arts Parent Org - TAPO - 2,200 2,200 - - Torch North 15,106 12,706 16,018 - 11,794 Towel Fees (36,157) 63,378 10,863 - 16,358 TRI-M 4,700 4,969 3,773 - 5,896 Variety Show 18,419 40,967 46,898 - 12,488 Welfare Memorial 763 2,060 1,270 - 1,553 William Simonsen Memorial - 20,000 20,000 - -
WGKB Radio 4,115 16,916 20,391 - 640 GBN World Lang Honor Society 6,211 2,631 1,821 - 7,021 ZAC Resiliency Award - 1,500 1,500 - - Interest Account 90 - 90 - - Class of 2015 10,761 24 4,842 - 5,943 Class of 2016 9,757 8,835 5,187 - 13,405 Class of 2017 3,300 53,300 29,829 - 26,771 Class of 2018 553 15,202 12,537 - 3,218 Class of 2019 - 3,071 2,916 - 155
Total North Activity 481,323 1,460,771 1,321,243 - 620,851
South Activity
Activity Tickets 560 75,236 74,711 - 1,085 Advanced Placement Testing 42,764 195,528 177,108 - 61,184 Auditorium LightBoardFund 500 - - - 500 Aid 1,795 3,000 3,054 - 1,741 Amnesty International 1,066 345 234 - 1,177 Anime 125 1,505 1,630 - - Art Supplies 545 - 545 - -
(Continued)
-109-

Balance Transfers / BalanceJuly 1, 2015 Additions Deletions Adjustments June 30, 2016
Northfield Township High School District 225STATEMENT OF CHANGES IN ASSETS AND LIABILITIES
AGENCY FUND - STUDENT ACTIVITY FUNDS
Year Ended June 30, 2016
Art Display $ 993 $ 900 $ 376 $ - $ 1,517 Baseball 10,225 28,007 25,114 - 13,118 Basketball 801 3,278 3,070 - 1,009 Bel Canto 6,575 4,510 5,862 - 5,223 Book Club 171 - - - 171 Bookstore (6) 17,450 14,766 - 2,678 Brick Program 12,921 - 786 - 12,135 Business Incubator Course - 10,500 - - 10,500 Titan Booster (50,820) 65,820 6,283 - 8,717 Pep Club - 2,852 493 - 2,359 Business Education 750 - 750 - - Business Professionals of America 4,151 15,323 16,941 - 2,533 Calliope (532) 7,592 7,060 - - Cap and Gown 22,158 30 18,938 - 3,250 Chamber Singers 4,462 2,546 3,695 - 3,313 Cheerleaders (22,975) 30,257 41,921 - (34,639) Choir Travel (4,992) 4,992 - - - Christopher Zimny Scholarship 1,006 2,072 2,500 - 578
Circle of Friends (467) 690 223 - - Ciao Club 505 - - - 505 Cooking Club 164 - 66 - 98 Concessions 11,061 39,927 43,524 - 7,464 Cross Country/Track (15,015) 19,078 19,063 (15,000) -
PSAT/PLAN Test 12,462 9,830 10,258 - 12,034 Cum Laude Society 1,190 1,600 1,870 - 920 David H Smith Scholarship 100 - 100 - - De La Cru 542 1,619 1,576 - 585 Debate Club 17,744 85,715 94,292 - 9,167 Desi Club 788 1,655 1,843 - 600 Douglas T. Kornelly Memorial Scholarship 3,640 - 3,640 - -
Drama Club 3,441 9,800 5,882 - 7,359
Drama Productions 460 37,268 37,728 - -
Engineering Club 996 2,638 3,016 - 618 English Dept. Activities 1,938 2,891 4,334 - 495 English Junior 1 - 1 - - Erika's Lighthouse 456 2,524 468 - 2,512 Etruscan 52,179 194,586 193,713 - 53,052 Etruscan-Yrbk Aid Fund 47,949 5,861 - - 53,810 Fencing Club 3,539 24,298 21,816 - 6,021 FCCLA 4,770 5,297 9,112 - 955 Field Hockey Boosters 8,730 11,331 10,075 - 9,986 Field Trips 2,610 9,443 9,775 - 2,278
(Continued)
-110-

Balance Transfers / BalanceJuly 1, 2015 Additions Deletions Adjustments June 30, 2016
Northfield Township High School District 225STATEMENT OF CHANGES IN ASSETS AND LIABILITIES
AGENCY FUND - STUDENT ACTIVITY FUNDS
Year Ended June 30, 2016
Fine Arts Community $ 993 $ - $ 993 $ - $ -
Forensics 2,375 645 673 - 2,347 French Club 2,522 - 40 - 2,482 French Exchange Program (6) 29,778 29,769 - 3 French Academy Seminar (35) 35 - - - German Club 1,400 1,047 992 - 1,455 German Exchange Program 457 130,724 124,263 - 6,918 Girls' Letter Club 4,550 10,549 11,738 - 3,361 GBS Sports Tournament 78,014 137,240 157,659 - 57,595 Glass 360 18,481 11,781 - 7,060 Glee Club Choir 5,331 4,520 4,774 - 5,077 Golf-Boys 9,333 1,640 2,305 - 8,668 Golf-Girls 3,382 1,465 1,553 - 3,294
Grad Night 27,876 48,842 45,458 - 31,260
Grid Account 5,505 60,009 55,468 - 10,046
Gymnastics-Boys (138) 1,509 1,371 - -
Helenic Club 1,626 1,419 716 - 2,329
High Schools Against Cancer 739 1,732 916 - 1,555 HOLA 456 997 761 - 692 In-House Grad Program 33,434 5,440 7,309 - 31,565 Interact Club 19,975 13,431 12,437 - 20,969 J. Kyle Braid 2,483 - 1,000 - 1,483 Jeffrey L Aaron Memorial Scholarship 388 - - - 388
Jewelry Club (7,749) 7,749 - - -
GBS Club KIVA 202 568 529 - 241 JE Hurlburt Athletic Scholarship 2,000 - 2,000 - - Key Club (7,654) 17,257 20,041 - (10,438)
Korean Club 181 302 239 - 244
Lacrosse-Boys 17,359 55,667 61,643 - 11,383 Lacrosse-Girls 1,322 48,958 34,197 - 16,083
Lamble-Schnell Scholarship (240) 240 - - - Late Exam Fees 1,120 - 1,120 - - Library Account 1,180 272 86 - 1,366 Master Singers 4,231 31,585 35,785 - 31 Mathletes 319 - 319 - - Model U N 6,508 61,406 60,028 - 7,886 Music Choir Scholarship Fund (2,033) 2,290 257 - - Music & Folder 132 - 132 - - GBS MTAC Club 5,835 2,071 1,440 - 6,466 Premier Chorus 4,257 6,858 7,826 - 3,289 National Forensics League 3,379 - - - 3,379
(Continued)
-111-

Balance Transfers / BalanceJuly 1, 2015 Additions Deletions Adjustments June 30, 2016
Northfield Township High School District 225STATEMENT OF CHANGES IN ASSETS AND LIABILITIES
AGENCY FUND - STUDENT ACTIVITY FUNDS
Year Ended June 30, 2016
National Honor Society $ (1,305) $ 1,415 $ 110 $ - $ -
NINE 806 2,186 2,991 - 1
Operation Safe Driving 7 - - - 7 Oracle 10,532 29,468 28,577 - 11,423 Orchesis 4,824 5,855 6,782 - 3,897 Paddle Club 2,282 1,100 1,563 - 1,819 Paradox - 193 193 - - Parents Association 10,972 28,351 36,411 - 2,912
Polish Club 232 460 220 - 472
Project Earth - 168 - - 168
Retirement Events (1,730) 17,460 15,244 - 486 SCAT THAT 522 716 664 - 574 Richard Goodspeed Memorial Scholarship 4,450 - 1,000 - 3,450 Scholarship - Skin of Steele 25,500 - 5,000 - 20,500 Scholarship - M. Sirvatka - 610 - - 610 Scholarship - South (4,618) 44,142 39,500 - 24 Scholarship - Japanese Omron 6,000 - 2,000 - 4,000 Scholarship - C. "MAMA" Glass 400 600 1,000 - - Scholarship - Will Hicks Memorial 3,599 3,363 3,000 - 3,962
Scholarship - Grace Kaskie Mem 11,000 - 1,000 - 10,000
Schlrshp-Randy Kolach (1,700) 1,700 - - - Craig Stifler 1,000 2,000 1,000 - 2,000
Schreiner Memorial Fund 17,308 - - - 17,308 Science Club 12,155 9,214 15,543 - 5,826 Science Olympiad 404 798 997 - 205 Science Summer Camps 31,339 17,330 29,060 - 19,609 Sign Language (781) 781 - - - Snowball 5,435 3,092 2,478 - 6,049 Soccer-Boys 1,756 9,048 10,069 - 735 Soccer-Girls 603 16,236 16,799 - 40 Social Planet 876 - 876 - - Social Studies Field Trips 1,732 15,194 16,264 - 662 Softball 1,369 11,474 11,706 - 1,137
Solace 203 792 995 - - Japanese Grant 9,883 7,600 7,057 - 10,426 Spanish Exchange 26 5,600 3,300 - 2,326 Special Events 18,691 8,393 20,785 - 6,299 Spirit Fund 4,024 1,473 2,082 - 3,415 Donations (331) 331 - - - Stand Against Genocide 4,007 13,304 14,435 - 2,876 GBS STEM Learning Community 582 - 121 - 461 Student Art 641 - 641 - -
(Continued)
-112-

Balance Transfers / BalanceJuly 1, 2015 Additions Deletions Adjustments June 30, 2016
Northfield Township High School District 225STATEMENT OF CHANGES IN ASSETS AND LIABILITIES
AGENCY FUND - STUDENT ACTIVITY FUNDS
Year Ended June 30, 2016
Student Council $ 1,315 $ 81,490 $ 64,450 $ - $ 18,355 Student-to-Student 14,017 18,432 17,652 - 14,797 Student I.D. Account 515 6,270 2,820 - 3,965 Student Teachers-General (1) 1 - - - Student Teachers-Math 96 - 96 - - Student Music Fees 1,270 1,890 2,432 - 728
Student Teachers-P.E. 3,734 11,871 11,855 - 3,750
Student Teachers-Social Studies 578 91 - - 669
Student Teachers-Special Ed 83 - 83 - - Swimming/Diving 1,031 3,847 3,666 - 1,212 Technology 377 - 377 - - Test Prep Programs 13,825 40,990 40,337 - 14,478 Titan Balloon Store 2,207 351 468 - 2,090 Titan Chorus 1,384 1,791 2,137 - 1,038 Titan Poms - 1,131 132 - 999
Towel Fees 33,278 30,923 32,323 - 31,878 Tutoring Project 498 592 1,090 - - Variety Show (20,426) 75,553 73,437 15,000 (33,310) Video Yearbook 1,757 5,573 2,915 - 4,415 Volleyball-Boys 731 3,547 4,036 - 242 Volleyball-Girls 2,605 5,248 7,485 - 368 Water Polo 35 5,231 3,494 - 1,772 Teachers' Welfare (3,155) 30 1,263 - (4,388)
WGBK 2,530 2,890 3,968 - 1,452 GBS World Cultures Celebration 728 1,620 1,325 - 1,023 Wrestling 937 2,272 1,976 - 1,233
Student Council-Interest Fund (191) 191 - - - J. Yordy Scholarship 9,384 - 1,000 - 8,384 GBS R. Bilger Scholarship (2,500) 5,000 2,500 - - Class of 1998 - 500 - - 500 Class of 2002 733 - 733 - - Class of 2007 785 - 785 - - Class of 2009 755 - 755 - -
Class of 2010 (11,109) - - (11,109) -
Class of 2011 4,014 - 4,014 - -
Class of 2012 1,535 - 1,535 - - Class of 2013 5,083 - 5,083 - - Class of 2014 11,109 - - 11,109 - Class of 2015 9,794 1,000 10,794 -
(Continued)
-113-

Balance Transfers / BalanceJuly 1, 2015 Additions Deletions Adjustments June 30, 2016
Northfield Township High School District 225STATEMENT OF CHANGES IN ASSETS AND LIABILITIES
AGENCY FUND - STUDENT ACTIVITY FUNDS
Year Ended June 30, 2016
Class of 2016 $ 9,403 $ 6,816 $ 13,278 $ - $ 2,941 Class of 2017 2,547 48,154 46,780 - 3,921
Class of 2018 821 968 1,000 - 789
Class of 2019 - 1,995 231 - 1,764 Amber Orchesis Scholarship 1,000 1,000 1,000 - 1,000 Student Activities 663 319 0 - 982 Student Activities Payable (2,621) - - - (2,621)
Total South Activity 707,244 2,270,544 2,244,598 - 733,190
Total Liabilities $ 1,872,503 $ 4,301,074 $ 4,628,146 $ - $ 1,545,431
(Concluded)
-114-

Maturity as follows
for the Year
Ended June 30 Principal Interest Total
2002B
Capital Appreciation 2017 $ 2,035,000 $ - $ 2,035,000
Refunding School Bonds, 2018 2,035,000 - 2,035,000
dated April 1, 2002, 2019 2,035,000 - 2,035,000
payable December 1 2020 2,035,000 - 2,035,000
2021 2,035,000 - 2,035,000
2022 2,035,000 - 2,035,000
Total $ 12,210,000 $ - $ 12,210,000
2007A
Dated January 1, 2007 2017 $ 3,960,000 $ 1,574,750 $ 5,534,750
(Interest at 4.00% to 5.00%, 2018 4,675,000 1,373,625 6,048,625
payable June 1 and 2019 5,075,000 1,139,625 6,214,625
December 1 and 2020 5,515,000 874,875 6,389,875
principal due December 1) 2021 7,190,000 557,250 7,747,250
2022 7,550,000 188,750 7,738,750
Total $ 33,965,000 $ 5,708,875 $ 39,673,875
2007B
General Obligation Capital
Appreciation School Bonds, 2023 $ 7,930,000 $ - $ 7,930,000
dated January 1, 2007, 2024 7,930,000 - 7,930,000
payable December 1 2025 6,720,000 - 6,720,000
Total $ 22,580,000 $ - $ 22,580,000
(Continued)
Northfield Township High School District 225
GENERAL LONG-TERM DEBT
SCHEDULE OF GENERAL OBLIGATION BONDS
Year Ended June 30, 2016
-115-

Northfield Township High School District 225
GENERAL LONG-TERM DEBT
SCHEDULE OF GENERAL OBLIGATION BONDS
Year Ended June 30, 2016
Maturity as follows
for the Year
Ended June 30 Principal Interest Total
2008
January 24, 2008, 2017 $ - $ 728,500 $ 728,500
(Interest at 5.00%, payable 2018 - 728,500 728,500
June 1 and Dec 1 and 2019 - 728,500 728,500
principal due December 1) 2020 - 728,500 728,500
2021 - 728,500 728,500
2022 - 728,500 728,500
2023 - 728,500 728,500
2024 - 728,500 728,500
2025 - 728,500 728,500
2026 4,345,000 619,875 4,964,875
2027 4,925,000 388,125 5,313,125
2028 5,300,000 132,500 5,432,500
Total $ 14,570,000 $ 7,697,000 $ 22,267,000
Principal Interest Total
2009
Dated May 1, 2009, 2017 $ 340,000 $ 34,697 $ 374,697
(Interest at 4.42%, payable 2018 355,000 19,338 374,338
June 1 and Dec 1 and 2019 260,000 5,746 265,746
principal due December 1)
Total $ 955,000 $ 59,781 $ 1,014,781
(Continued)
-116-

Northfield Township High School District 225
GENERAL LONG-TERM DEBT
SCHEDULE OF GENERAL OBLIGATION BONDS
Year Ended June 30, 2016
Maturity as follows
for the Year
Ended June 30 Principal Interest Total
2010
Dated July 7, 2010, 2017 $ - $ 589,910 $ 589,910
(Interest at 5.70-5.90%, 2018 - 589,910 589,910
payable June 1 and Dec 1 and 2019 - 589,910 589,910
principal due December 1) 2020 - 589,910 589,910
2021 - 589,910 589,910
2022 - 589,910 589,910
2023 - 589,910 589,910
2024 - 589,910 589,910
2025 845,000 565,828 1,410,828
2026 3,285,000 448,122 3,733,122
2027 3,040,000 266,340 3,306,340
2028 3,020,000 89,090 3,109,090
Total $ 10,190,000 $ 6,088,660 $ 16,278,660
$ 94,470,000 $ 19,554,316 $ 114,024,316
(Concluded)
Total General Obligation
Bonds Payable
-117-

STATISTICAL SECTION(Unaudited)

Contents Page
Financial Trends
119 - 130
Revenue Capacity
131 - 135
Debt Capacity
136 - 142
Demographic and Economic Information
143 - 145
Operating Information
146 - 157
These schedules contain information about the District's service and
resources to help the reader understand how the District's financial
information relates to the services the District provides and the
activities it performs.
SOURCES: Unless otherwise noted, the information in these schedules is derived from the audited financial
statements for the relevant year.
Statistical Section
This part of the District's comprehensive annual financial report presents detailed information as a context
for understanding what the information in the financial statements, note disclosures, and required
supplementary information says about the District.
These schedules contain trend information to help the reader
understand how the District's financial performance and well-being
have changed over time.
These schedules contain information to help the reader assess the
District's most significant local revenue source, the property tax.
These schedules present information to help the reader assess the
affordability of the District's current levels of outstanding debt and
the District's ability to issue additional debt in the future.
These schedules offer demographic and economic indicators to help
the reader understand the environment within which the District's
financial activities take place.
-118-

2016 2015 2014** 2013* 2012
Governmental Activities
Net investment in
capital assets $ 69,325,221 $ 66,726,008 $ 61,976,289 $ 72,714,451 $ 67,202,269
Restricted 20,707,159 20,153,278 14,243,444 19,416,172 10,801,506
Unrestricted 30,079,936 30,044,718 38,226,059 28,433,862 41,338,790
Total governmental activities
net position $ 120,112,316 $ 116,924,004 $ 114,445,792 $ 120,564,485 $ 119,342,565
* As restated, due to the implementation of GASB 65.
** As restated, due to the implementation of GASB 68 and GASB 71.
Northfield Township High School District 225NET POSITION BY COMPONENT
LAST TEN FISCAL YEARS
-119-

2011 2010 2009 2008 2007
$ 55,002,803 $ 57,581,152 $ 94,807,202 $ 95,561,629 $ 78,390,342
9,188,948 7,809,566 7,935,068 6,170,767 3,927,600
50,117,180 46,734,786 41,412,545 35,355,595 45,488,892
$ 114,308,931 $ 112,125,504 $ 144,154,815 $ 137,087,991 $ 127,806,834
-120-

2016 2015 2014* 2013
Expenses
Instruction $ 99,114,383 $ 95,782,160 $ 84,731,323 $ 77,692,875
Support services 47,073,332 45,068,176 42,631,380 41,388,236
Community services 149,853 102,416 120,026 86,339
Nonprogrammed charges - - - -
Interest and fees 4,245,124 4,471,147 4,635,508 4,947,127
Loss on disposal of assets - - 2,157,241 -
Unallocated depreciation 2,073,036 1,997,281 1,855,181 1,823,145
Total expenses 152,655,728 147,421,180 136,130,659 125,937,722
Program Revenues
Charges for Services
Instruction 1,331,097 1,453,779 1,113,555 858,500
Support services 1,446,053 1,404,958 1,288,843 1,402,939
Operating Grants and Contributions
Instruction 32,888,927 30,932,973 22,795,629 19,066,373
Support services 1,507,259 1,212,292 1,407,691 1,182,384
Capital grants
Support services - - - -
Total Program Revenues 37,173,336 35,004,002 26,605,718 22,510,196
Net (Expense)/Revenue (115,482,392) (112,417,178) (109,524,941) (103,427,526)
General Revenues
Taxes:
Real estate taxes, levied for
general purposes 91,013,665 89,069,898 86,587,174 86,276,961
Real estate taxes, levied for specific purposes 15,488,365 15,416,662 15,337,022 14,761,561
Personal property replacement taxes 2,148,606 2,689,002 2,501,353 2,472,665
Other 1,224,208 472,265 483,688 293,343
Other payments in lieu of taxes 6,850,781 5,879,780 4,091,793 -
State aid formula grants 1,648,367 1,153,612 1,153,977 1,118,871
Investment earnings 296,712 214,171 171,224 211,487
Total General Revenues 118,670,704 114,895,390 110,326,231 105,134,888
Change in Net Position $ 3,188,312 $ 2,478,212 $ 801,290 $ 1,707,362
*As originally reported.
Northfield Township High School District 225CHANGE IN NET POSITION
LAST TEN FISCAL YEARS
-121-

2012 2011 2010 2009 2008 2007
$ 73,543,875 $ 68,482,910 $ 65,916,504 $ 59,193,098 $ 53,621,707 $ 48,703,587
39,154,844 40,316,561 38,790,064 36,756,739 36,942,417 36,846,473
81,383 75,120 68,562 58,271 54,132 51,629
- - 1,570,475 - - -
5,290,792 5,082,130 4,832,195 4,820,973 4,567,257 3,150,262
- - - - - -
1,798,886 1,597,741 1,627,520 1,680,161 1,378,141 1,005,528
119,869,780 115,554,462 112,805,320 102,509,242 96,563,654 89,757,479
869,317 856,664 879,478 942,113 1,486,066 894,220
1,492,957 1,411,339 1,479,109 1,320,702 949,056 4,040,351
16,625,582 14,593,317 14,491,342 10,946,715 8,379,091 6,879,760
1,082,657 1,004,026 1,158,171 1,131,097 841,475 888,921
50,000 - - - - -
20,120,513 17,865,346 18,008,100 14,340,627 11,655,688 12,703,252
(99,749,267) (97,689,116) (94,797,220) (88,168,615) (84,907,966) (77,054,227)
82,759,740 77,618,479 86,230,269 80,062,282 77,176,862 72,015,204
17,497,657 17,515,230 10,202,887 6,783,498 6,644,732 3,897,766
2,420,029 2,630,663 2,028,552 2,481,945 2,866,473 2,706,082
342,846 212,692 2,718,685 2,193,754 1,611,242 1,737,286
- - - - - -
1,559,535 1,599,558 1,565,957 1,532,686 1,467,331 1,375,675
203,094 295,921 494,113 2,181,274 4,422,483 3,889,867
104,782,901 99,872,543 103,240,463 95,235,439 94,189,123 85,621,880
$ 5,033,634 $ 2,183,427 $ 8,443,243 $ 7,066,824 $ 9,281,157 $ 8,567,653
-122-

2016 2015 2014* 2013
General Fund
Reserved $ - $ - $ - $ -
Unreserved - - - -
Nonspendable 302,246 56,195 49,372 -
Restricted - - - -
Unassigned 61,067,595 61,168,275 61,348,953 59,151,242
Total General Fund $ 61,369,841 $ 61,224,470 $ 61,398,325 $ 59,151,242
All Other Governmental Funds
Unreserved, reported in:
*Special Revenue Funds $ - $ - $ - $ -
Debt Service Fund - - - -
Capital Projects Fund - - - -
Restricted, reported in:
**Special Revenue Funds 16,074,431 15,912,027 15,270,727 14,981,869
Debt Service Fund 4,831,183 4,509,271 4,184,255 3,802,700
Capital Projects Fund - (100,447) 1,993,279 2,626,662
Nonspendable, reported in:
Special Revenue Funds 54,097 - - -
Capital Projects Fund - - - -
Total All Other Governmental Funds $ 20,959,711 $ 20,320,851 $ 21,448,261 $ 21,411,231
*As originally reported.
**Note: GASB 54 was implemented in fiscal year 2011 which also required the restatement of 2010.
With this implementation, the Working Cash Fund was combined with the General Fund and
governmental funds report five components of fund balance: nonspendable, restricted,
committed, assigned, and unassigned.
For comparison purposes, the General Fund includes the Educational Fund. Beginning with 2010, the Working
Cash fund is also included. Special revenue funds include the Operations and Maintenance Fund, the
Transportation Fund, the Municipal Retirement/Social Security Fund, and the Working Cash Fund until 2010
when it moved to the General Fund.
Northfield Township High School District 225FUND BALANCES OF GOVERNMENTAL FUNDS
LAST TEN FISCAL YEARS
-123-

2012 2011** 2010** 2009 2008 2007
$ - $ - $ - $ 26,374 $ - $ -
- - - 39,774,406 38,260,563 32,860,059
- 45,873 - - - -
- - - - - -
56,721,576 53,811,223 54,412,028 - - -
$ 56,721,576 $ 53,857,096 $ 54,412,028 $ 39,800,780 $ 38,260,563 $ 32,860,059
$ - $ - $ - $ 19,098,718 $ 15,848,754 $ 14,152,673
- - - 2,565,673 2,673,814 3,040,692
- - - 6,113,691 30,744,650 45,220,676
18,129,066 15,387,062 12,240,017 - - -
3,671,564 3,491,920 3,287,268 - - -
3,043,427 12,020,288 3,759,709 - - -
- - - - - -
266,740 244,023 - - - -
$ 25,110,797 $ 31,143,293 $ 19,286,994 $ 27,778,082 $ 49,267,218 $ 62,414,041
-124-

2016 2015 2014 2013
Local Sources
Taxes $ 108,650,636 $ 107,175,562 $ 104,425,549 $ 99,556,406
Earnings on investments 296,712 214,171 171,224 211,487
Other local sources 10,852,139 9,210,782 6,977,879 6,509,563
Total local sources 119,799,487 116,600,515 111,574,652 106,277,456
State and Federal Sources 8,214,631 6,509,875 6,201,444 6,527,968
Total Direct Revenues 128,014,118 123,110,390 117,776,096 112,805,424
TRS On-Behalf Receipts 27,829,922 26,789,002 19,155,853 14,839,660
Other Financing Sources 4,830,104 3,808,222 2,815,384 5,606,918
Total $ 160,674,144 $ 153,707,614 $ 139,747,333 $ 133,252,002
Note: Governmental Funds Revenue includes all funds (except Fiduciary Funds).
Northfield Township High School District 225GOVERNMENTAL FUNDS REVENUE
LAST TEN FISCAL YEARS
-125-

2012 2011 2010 2009 2008 2007
$ 99,658,391 $ 94,964,627 $ 98,461,708 $ 89,327,725 $ 86,688,067 $ 78,619,052
203,094 295,921 494,113 2,181,274 4,422,483 3,889,867
5,620,294 5,278,687 4,991,839 4,361,341 4,046,364 6,671,857
105,481,779 100,539,235 103,947,660 95,870,340 95,156,914 89,180,776
6,707,988 5,731,428 6,120,569 5,681,036 4,780,797 5,196,631
112,189,767 106,270,663 110,068,229 101,551,376 99,937,711 94,377,407
12,713,647 11,467,226 11,180,334 8,024,690 5,907,100 3,947,725
- 11,759,253 2,374,865 4,952,173 15,699,963 68,900,383
$ 124,903,414 $ 129,497,142 $ 123,623,428 $ 114,528,239 $ 121,544,774 $ 167,225,515
-126-

2016 2015 2014 2013
Current
Instruction
Regular Programs $ 37,637,938 $ 37,463,503 $ 35,005,707 $ 34,053,525
Special Programs 15,970,697 15,075,139 13,612,081 12,865,346
Other Instructional Programs 13,149,499 12,228,989 11,535,585 11,205,179
Total Instruction 66,758,134 64,767,631 60,153,373 58,124,050
Supporting Services
Pupils 11,005,158 11,287,609 10,369,277 10,164,618
Instructional Staff 3,791,506 3,710,474 3,516,703 3,483,041
General Administration 2,905,855 2,747,970 2,678,249 2,104,931
School Administration 7,322,687 7,237,537 7,220,127 6,957,015
Business 2,256,463 2,361,392 2,480,758 2,195,541
Transportation 2,937,958 2,845,782 2,567,425 2,687,928
Operations and Maintenance 9,783,605 9,664,333 9,240,995 9,001,189
Central 5,749,998 3,699,760 3,882,717 3,900,680
Other supporting services - - 16,486 6,243
Total Supporting Services 45,753,230 43,554,857 41,972,737 40,501,186
Total Current 112,511,364 108,322,488 102,126,110 98,625,236
Other
Debt Service
Principal 6,664,463 6,774,760 5,657,652 4,788,819
Interest and Other Charges 3,144,545 3,342,695 3,504,948 3,722,428
Community Services 145,350 99,962 120,026 85,888
Nonprogrammed Charges - - - -
Capital Outlay 5,224,495 7,637,076 5,080,672 7,788,798
Total Other 15,178,853 17,854,493 14,363,298 16,385,933
Total Direct Expenditures 127,690,217 126,176,981 116,489,408 115,011,169
TRS On-Behalf Payment 27,829,922 26,789,002 19,155,853 14,839,660
Other Financing Uses 4,369,774 2,042,896 1,817,959 4,671,073.00
Total $ 159,889,913 $ 155,008,879 $ 137,463,220 $ 134,521,902
Net Change in Fund Balance $ 784,231 $ (1,301,265) $ 2,284,113 $ (1,269,900)
Debt Service as a Percentage
of Noncapital Expenditures 6.55% 6.94% 7.01% 6.95%
Northfield Township High School District 225GOVERNMENTAL FUNDS EXPENDITURES AND DEBT SERVICE RATIO
LAST TEN FISCAL YEARS
-127-

2012 2011 2010 2009 2008 2007
$ 33,488,614 $ 31,465,723 $ 30,349,284 $ 29,246,021 $ 27,585,015 $ 26,682,633
11,453,221 10,300,668 8,850,247 5,880,250 5,644,357 5,261,163
11,022,819 10,666,890 10,348,622 9,372,401 8,911,711 8,536,796
55,964,654 52,433,281 49,548,153 44,498,672 42,141,083 40,480,592
9,568,092 9,494,845 9,243,548 8,512,651 8,144,275 8,183,072
3,459,712 3,352,437 3,409,714 3,636,895 3,308,475 3,477,414
2,493,025 2,399,812 2,322,471 2,235,168 2,244,643 2,642,057
6,669,963 6,337,479 6,489,218 6,022,171 6,112,508 5,783,496
2,076,271 2,314,024 1,975,496 1,978,909 2,237,661 4,478,453
2,461,555 2,390,249 2,313,711 2,272,021 2,221,044 1,849,051
9,219,215 9,446,373 8,911,245 8,914,675 8,406,538 8,224,443
3,824,189 3,733,267 3,377,077 3,183,259 3,451,105 2,175,547
24,931 1,664.00 - - 153,420 -
39,796,953 39,470,150 38,042,480 36,755,749 36,279,669 36,813,533
95,761,607 91,903,431 87,590,633 81,254,421 78,420,752 77,294,125
4,550,000 3,925,000 3,610,000 3,065,000 3,506,443 1,960,000
4,037,148 3,997,637 3,837,115 3,914,494 3,603,196 2,285,957
81,383 75,120 68,562 58,271 54,132 51,629
- - 2,486,598 2,412,494 2,436,818 1,964,050
10,927,645 5,258,108 6,059,300 34,213,132 34,914,990 7,299,114
19,596,176 13,255,865 16,061,575 43,663,391 44,515,579 13,560,750
115,357,783 105,159,296 103,652,208 124,917,812 122,936,331 90,854,875
12,713,647 11,467,226 11,180,334 8,024,690 5,907,100 3,947,725
- 1,569,253 2,374,865 2,000,000.00 - 21,813,494
$ 128,071,430 $ 118,195,775 $ 117,207,407 $ 134,942,502 $ 128,843,431 $ 116,616,094
$ (3,168,016) $ 11,301,367 $ 6,416,021 $ (20,414,263) $ (7,298,657) $ 50,609,421
7.40% 7.09% 6.85% 7.07% 7.57% 4.85%
-128-

2016 2015 2014 2013
Program Revenue
Charges for services $ 2,777,150 $ 2,858,737 $ 2,402,398 $ 2,261,439
Operating grants 34,396,186 32,145,265 24,203,320 20,248,757
Capital grants - - - -
General Revenues
Taxes 108,650,636 107,175,562 104,425,549 103,511,187
Payments in lieu of taxes 6,850,781 5,879,780 4,091,793 -
Investment income 296,712 214,171 171,224 211,487
Miscellaneous 2,872,575 1,625,877 1,637,665 1,412,214
Total Revenues $ 155,844,040 $ 149,899,392 $ 136,931,949 $ 127,645,084
Northfield Township High School District 225GOVERNMENT-WIDE REVENUES
LAST TEN FISCAL YEARS
-129-

2012 2011 2010 2009 2008 2007
$ 2,362,274 $ 2,268,003 $ 2,358,587 $ 2,262,815 $ 2,435,122 $ 4,934,571
17,708,239 15,597,343 15,649,513 12,077,812 9,220,566 7,768,681
50,000 - - - - -
102,677,426 97,764,372 98,461,708 89,327,725 86,688,067 78,619,052
- - - - - -
203,094 295,921 494,113 2,181,274 4,422,483 3,889,867
1,902,381 1,812,250 4,284,642 3,726,440 3,078,573 3,112,961
$ 124,903,414 $ 117,737,889 $ 121,248,563 $ 109,576,066 $ 105,844,811 $ 98,325,132
-130-

2015 2014 2013 2012
Rates Extended
Educational 2.1114 2.0028 1.9713 1.7030
Operations and Maintenance 0.0683 0.0661 0.0892 0.0794
Transportation 0.0114 0.0110 0.0056 0.0099
Municipal Retirement/Social Security 0.0752 0.0726 0.0625 0.0556
Working Cash 0.0194 0.0187 0.0190 0.0169
Bond and Interest 0.2068 0.1951 0.1934 0.1624
Total rates extended 2.4925 2.3663 2.3410 2.0272
Levies Extended
Educational $ 92,702,146 $ 90,955,281 $ 88,369,820 $ 85,783,696
Operations and Maintenance 3,000,000 3,000,000 4,000,000 4,000,000
Transportation 500,000 500,000 250,000 500,000
Municipal Retirement/Social Security 3,300,000 3,300,000 2,800,000 2,800,000
Working Cash 850,000 850,000 850,000 850,000
Bond and Interest 9,079,663 8,859,813 8,672,248 8,182,786
Total levies extended $ 109,431,809 $ 107,465,094 $ 104,942,068 $ 102,116,482
Collections on levies extended
Current year $ 56,289,892 $ 54,598,735 $ 53,310,658 $ 50,420,779
Subsequent years - 50,591,114 49,669,394 49,564,934
Total Collections $ 56,289,892 $ 105,189,849 $ 102,980,052 $ 99,985,713
Percentage of extensions collected
Current year 51.44% 50.81% 50.80% 49.38%
Subsequent years 0.00% 47.08% 47.33% 48.54%
Total % of extensions collected 51.44% 97.88% 98.13% 97.91%
*Tax Rates are expressed in dollars per $100 of assessed valuation.
Source of information: Cook County - Agency Tax Rate Reports and Annual Financial Reports
Northfield Township High School District 225PROPERTY TAX RATES - LEVIES AND COLLECTIONS*
LAST TEN TAX LEVY YEARS
-131-
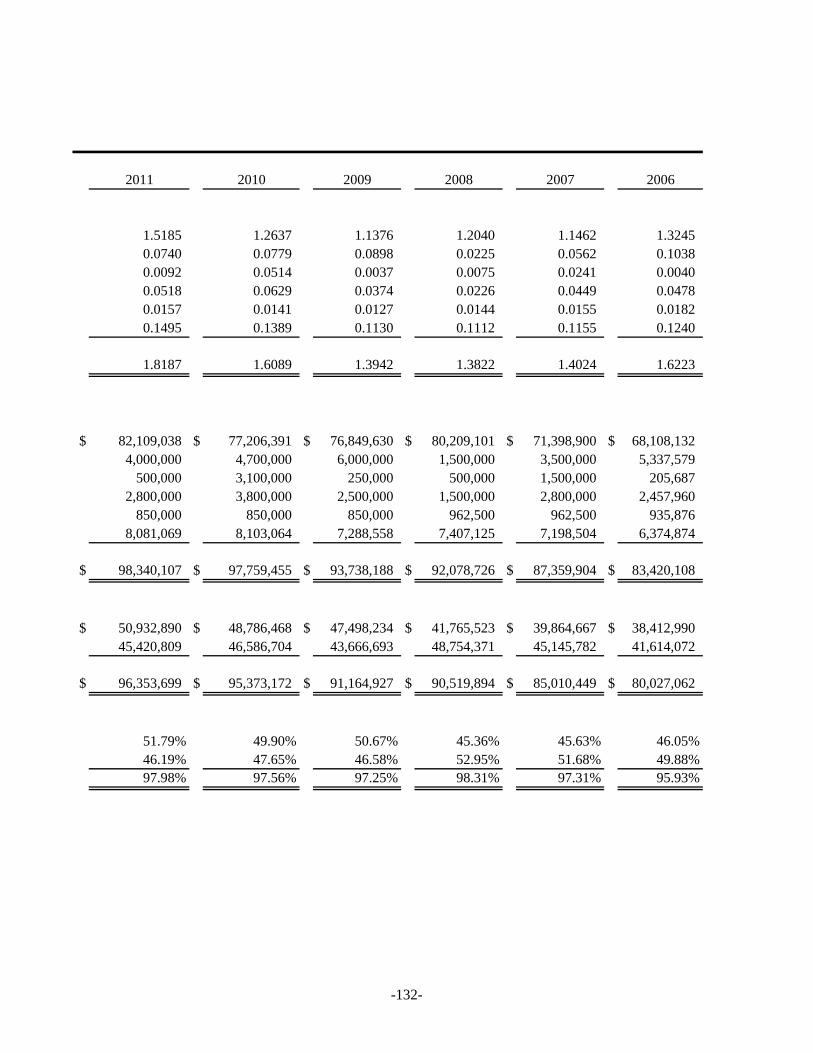
2011 2010 2009 2008 2007 2006
1.5185 1.2637 1.1376 1.2040 1.1462 1.3245
0.0740 0.0779 0.0898 0.0225 0.0562 0.1038
0.0092 0.0514 0.0037 0.0075 0.0241 0.0040
0.0518 0.0629 0.0374 0.0226 0.0449 0.0478
0.0157 0.0141 0.0127 0.0144 0.0155 0.0182
0.1495 0.1389 0.1130 0.1112 0.1155 0.1240
1.8187 1.6089 1.3942 1.3822 1.4024 1.6223
$ 82,109,038 $ 77,206,391 $ 76,849,630 $ 80,209,101 $ 71,398,900 $ 68,108,132
4,000,000 4,700,000 6,000,000 1,500,000 3,500,000 5,337,579
500,000 3,100,000 250,000 500,000 1,500,000 205,687
2,800,000 3,800,000 2,500,000 1,500,000 2,800,000 2,457,960
850,000 850,000 850,000 962,500 962,500 935,876
8,081,069 8,103,064 7,288,558 7,407,125 7,198,504 6,374,874
$ 98,340,107 $ 97,759,455 $ 93,738,188 $ 92,078,726 $ 87,359,904 $ 83,420,108
$ 50,932,890 $ 48,786,468 $ 47,498,234 $ 41,765,523 $ 39,864,667 $ 38,412,990
45,420,809 46,586,704 43,666,693 48,754,371 45,145,782 41,614,072
$ 96,353,699 $ 95,373,172 $ 91,164,927 $ 90,519,894 $ 85,010,449 $ 80,027,062
51.79% 49.90% 50.67% 45.36% 45.63% 46.05%
46.19% 47.65% 46.58% 52.95% 51.68% 49.88%
97.98% 97.56% 97.25% 98.31% 97.31% 95.93%
-132-

Amount of Percentage
Increase Increase
Equalized (Decrease) (Decrease) Actual
Tax Levy Assessed Over Previous Over Previous Total Direct Estimated
Year Valuation Year Year Rate Value
2015 $ 4,390,619,134 $ (150,888,570) -3.32% 2.493 $ 13,171,857,402
2014 4,541,507,704 58,596,565 1.31% 2.366 13,624,523,112
2013 4,482,911,139 (554,276,302) -11.00% 2.341 13,448,733,417
2012 5,037,187,441 (370,144,896) -6.85% 2.027 15,111,562,323
2011 5,407,332,337 (628,402,868) -10.41% 1.819 16,221,997,011
2010 6,035,735,205 (648,290,674) -9.70% 1.609 18,107,205,615
2009 6,684,025,879 22,084,531 0.33% 1.394 20,052,077,637
2008 6,661,941,348 432,665,724 6.95% 1.382 19,985,824,044
2007 6,229,275,624 1,087,098,798 21.14% 1.402 18,687,826,872
2006 5,142,176,826 19,884,117 17.86% 1.622 15,426,530,478
Northfield Township High School District 225EQUALIZED ASSESSED VALUATION AND ESTIMATED
ACTUAL VALUE OF TAXABLE PROPERTY
LAST TEN LEVY YEARS
Source of information: Cook County Levy, Rate, and Extension Reports for 2004 to 2013
-133-
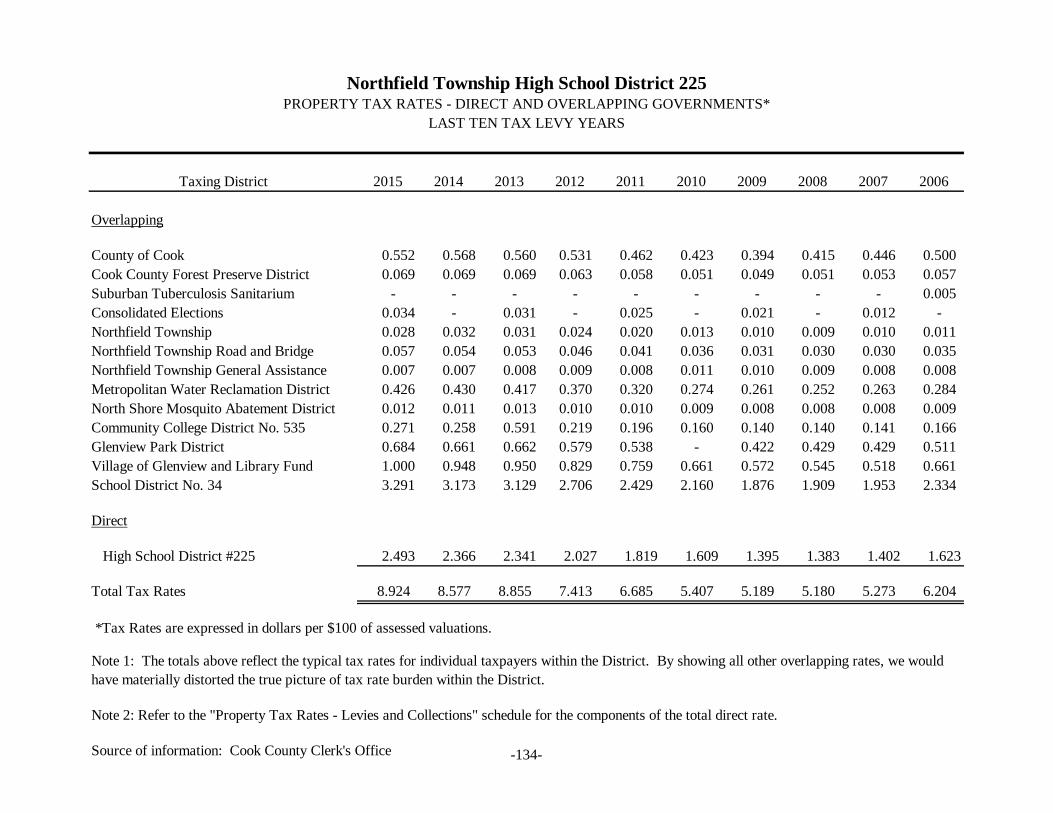
Taxing District 2015 2014 2013 2012 2011 2010 2009 2008 2007 2006
Overlapping
County of Cook 0.552 0.568 0.560 0.531 0.462 0.423 0.394 0.415 0.446 0.500
Cook County Forest Preserve District 0.069 0.069 0.069 0.063 0.058 0.051 0.049 0.051 0.053 0.057
Suburban Tuberculosis Sanitarium - - - - - - - - - 0.005
Consolidated Elections 0.034 - 0.031 - 0.025 - 0.021 - 0.012 -
Northfield Township 0.028 0.032 0.031 0.024 0.020 0.013 0.010 0.009 0.010 0.011
Northfield Township Road and Bridge 0.057 0.054 0.053 0.046 0.041 0.036 0.031 0.030 0.030 0.035
Northfield Township General Assistance 0.007 0.007 0.008 0.009 0.008 0.011 0.010 0.009 0.008 0.008
Metropolitan Water Reclamation District 0.426 0.430 0.417 0.370 0.320 0.274 0.261 0.252 0.263 0.284
North Shore Mosquito Abatement District 0.012 0.011 0.013 0.010 0.010 0.009 0.008 0.008 0.008 0.009
Community College District No. 535 0.271 0.258 0.591 0.219 0.196 0.160 0.140 0.140 0.141 0.166
Glenview Park District 0.684 0.661 0.662 0.579 0.538 - 0.422 0.429 0.429 0.511
Village of Glenview and Library Fund 1.000 0.948 0.950 0.829 0.759 0.661 0.572 0.545 0.518 0.661
School District No. 34 3.291 3.173 3.129 2.706 2.429 2.160 1.876 1.909 1.953 2.334
Direct
High School District #225 2.493 2.366 2.341 2.027 1.819 1.609 1.395 1.383 1.402 1.623
Total Tax Rates 8.924 8.577 8.855 7.413 6.685 5.407 5.189 5.180 5.273 6.204
*Tax Rates are expressed in dollars per $100 of assessed valuations.
Note 2: Refer to the "Property Tax Rates - Levies and Collections" schedule for the components of the total direct rate.
Source of information: Cook County Clerk's Office
Northfield Township High School District 225PROPERTY TAX RATES - DIRECT AND OVERLAPPING GOVERNMENTS*
LAST TEN TAX LEVY YEARS
Note 1: The totals above reflect the typical tax rates for individual taxpayers within the District. By showing all other overlapping rates, we would
have materially distorted the true picture of tax rate burden within the District.
-134-

2015 2014 2013 2012 2011 2010 2009 2008 2007 2006
Category Valuation Valuation Valuation Valuation Valuation Valuation Valuation Valuation Valuation Valuation
Industrial $ 296,538,708 $ 272,105,588 $ 482,846,272 $ 520,113,057 $ 560,017,835 $ 638,019,315 $ 647,964,721 $ 751,668,683 $ 715,793,682 $ 628,490,129
Residential 2,991,516,817 3,061,139,557 3,192,189,440 3,636,940,149 3,927,277,492 4,329,437,564 4,909,443,930 4,595,754,420 4,276,420,703 3,455,396,075
Commercial 1,099,941,610 1,206,076,671 805,924,983 878,560,970 918,619,999 1,066,957,877 1,125,578,009 1,313,655,194 1,236,286,327 1,057,643,681
Railroad 2,497,570 2,058,874 1,946,744 1,569,565 1,413,311 1,316,381 1,035,151 856,591 768,402 640,431
Farm 124,429 127,014 3,700 3,700 3,700 4,068 4,068 6,510 6,510 6,510
$ 4,390,619,134 $ 4,541,507,704 $ 4,482,911,139 $ 5,037,187,441 $ 5,407,332,337 $ 6,035,735,205 $ 6,684,025,879 $ 6,661,941,398 6,229,275,624 $ 5,142,176,826
Source of information: Cook County Clerk's Office
LAST TEN TAX LEVY YEARS
Northfield Township High School District 225
MAJOR CATEGORIES OF EQUALIZED ASSESSED VALUATION
-135-

Estimated
Outstanding Percentage Amount
Taxing Authority Bonds Applicable Applicable
Northfield Township High School District 225 86,122,192$ (3)
100.00% 86,122,192$
Cook County 3,337,536,750$
3.306% $110,353,238
Cook County Forest Preserve 112,720,000 3.306% 3,727,005
Metropolitan Water Reclamation District 2,371,305,742 (1)
3.368% 79,855,654
Village of Deerfield 58,190,000
9.770% 5,684,980
Village of Glenview 79,495,000
91.642% 72,851,148
Village of Golf 2,280,000
100.000% 2,280,000
Village of Northbrook 11,055,000
96.102% 10,624,038
Village of Northfield 0(2)
1.157% 0
City of Prospect Heights 12,405,000 4.361% 541,043
Deerfield Park District 2,875,000 (2)
3.794% 109,073
Glenview Park District 8,805,000 (2)
84.476% 7,438,076
Northbrook Park District 5,160,000
99.028% 5,109,854
School District #31 4,005,000
100.000% 4,005,000
School District #34 13,590,000 99.682% 13,546,792
Community College District No. 535 32,175,000 23.515% 7,566,077
$323,691,976
$409,814,168
(1) Includes IEPA Revolving Loan Fund Bonds.
(2) Excludes outstanding General Obligation Alternate Revenue Source Bonds which are
expected to be paid from sources other than general taxation. Also excludes
other self-supporting bonds.(3)
Includes accreted balance of outstanding Capital Appreciation Bonds
______
Source: Office of the Cook County Clerk
Northfield Township High School District 225
DIRECT AND OVERLAPPING GENERAL OBLIGATION BONDED DEBT
June 30, 2016
Total Overlapping General Obligation Bonded Debt
Total Direct Overlapping General Obligation Bonded Debt
-136-

2016 2015 2014 2013
Debt Limit $ 302,952,720 $ 313,364,032 $ 309,320,869 $ 347,565,933
Total Net Debt Applicable to Limit 95,642,869 101,847,002 106,856,437 98,641,772
Legal Debt Margin $ 207,309,851 $ 211,517,030 $ 202,464,432 $ 248,924,161
Total Net Debt Applicable to the Limit
as a Percentage of Debt Limit 32% 33% 35% 28%
2015 Equalized Assessed Valuation $ 4,390,619,134
Voted and Unvoted Debt Limit - 6.9% of
6.9% of Equalized Assessed Valuation $ 302,952,720
Total Debt Outstanding 95,642,869
Less: Exempted Debt -
Net Subject to 6.9% Limit 95,642,869
Total Legal Voted and
Unvoted Debt Margin $ 207,309,851
Northfield Township High School District 225LEGAL DEBT MARGIN
LAST TEN FISCAL YEARS
-137-

2012 2011 2010 2009 2008 2007
$ 373,105,931 $ 461,197,786 $ 461,197,786 $ 459,673,956 $ 459,662,515 $ 354,810,201
101,869,014 105,273,156 97,914,836 96,469,614 99,609,272 87,568,536
$ 271,236,917 $ 355,924,630 $ 363,282,950 $ 363,204,342 $ 360,053,243 $ 267,241,665
27% 23% 21% 21% 22% 25%
-138-
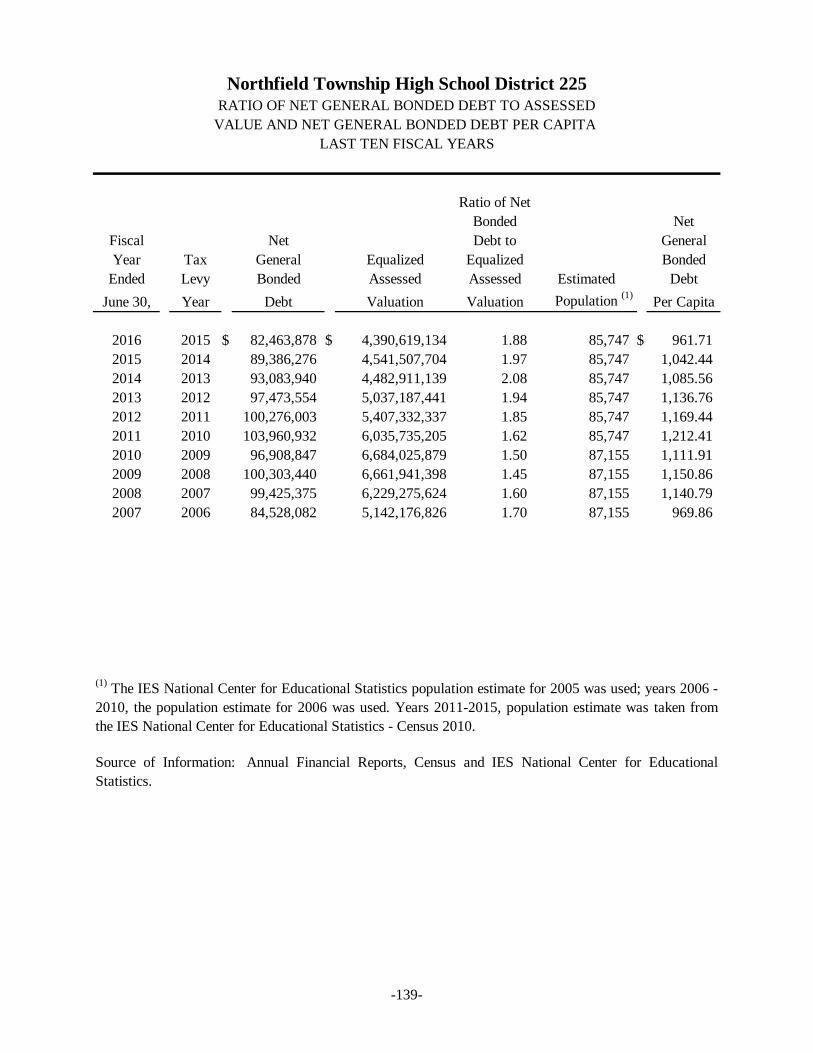
Ratio of Net
Bonded Net
Fiscal Net Debt to General
Year Tax General Equalized Equalized Bonded
Ended Levy Bonded Assessed Assessed Estimated Debt
June 30, Year Debt Valuation Valuation Population (1)
Per Capita
2016 2015 $ 82,463,878 $ 4,390,619,134 1.88 85,747 $ 961.71
2015 2014 89,386,276 4,541,507,704 1.97 85,747 1,042.44
2014 2013 93,083,940 4,482,911,139 2.08 85,747 1,085.56
2013 2012 97,473,554 5,037,187,441 1.94 85,747 1,136.76
2012 2011 100,276,003 5,407,332,337 1.85 85,747 1,169.44
2011 2010 103,960,932 6,035,735,205 1.62 85,747 1,212.41
2010 2009 96,908,847 6,684,025,879 1.50 87,155 1,111.91
2009 2008 100,303,440 6,661,941,398 1.45 87,155 1,150.86
2008 2007 99,425,375 6,229,275,624 1.60 87,155 1,140.79
2007 2006 84,528,082 5,142,176,826 1.70 87,155 969.86
Source of Information: Annual Financial Reports, Census and IES National Center for Educational
Statistics.
Northfield Township High School District 225RATIO OF NET GENERAL BONDED DEBT TO ASSESSED
VALUE AND NET GENERAL BONDED DEBT PER CAPITA
LAST TEN FISCAL YEARS
(1)The IES National Center for Educational Statistics population estimate for 2005 was used; years 2006 -
2010, the population estimate for 2006 was used. Years 2011-2015, population estimate was taken from
the IES National Center for Educational Statistics - Census 2010.
-139-

Total Debt Service
Tax General Fund
Fiscal Year Levy Expenditures Expenditures
Ended June 30, Year (A) (B)
2016 2015 $ 155,520,139 $ 9,809,008 6.31 %
2015 2014 152,965,983 10,117,455 6.61 %
2014 2013 135,645,261 9,162,600 6.75 %
2013 2012 133,505,467 12,165,885 9.11 %
2012 2011 128,071,430 8,587,148 6.70 %
2011 2010 118,195,775 7,922,637 6.70 %
2010 2009 117,503,268 2,531,229 2.15 %
2009 2008 134,477,158 6,979,494 5.19 %
2008 2007 129,291,093 7,083,196 5.48 %
2007 2006 94,802,600 4,245,957 4.48 %
(A) Includes expenditures of all Governmental Funds.
Northfield Township High School District 225
RATIO OF ANNUAL DEBT SERVICE EXPENDITURES FOR
GENERAL BONDED DEBT TO TOTAL GENERAL EXPENDITURES
LAST TEN FISCAL YEARS
(B) Debt Service Fund expenditures represent payment of principal, interest, and other charges on
long-term liabilities.
Percentage of
Annual Debt Service Fund
Expenditures to Total
General Expenditures
-140-
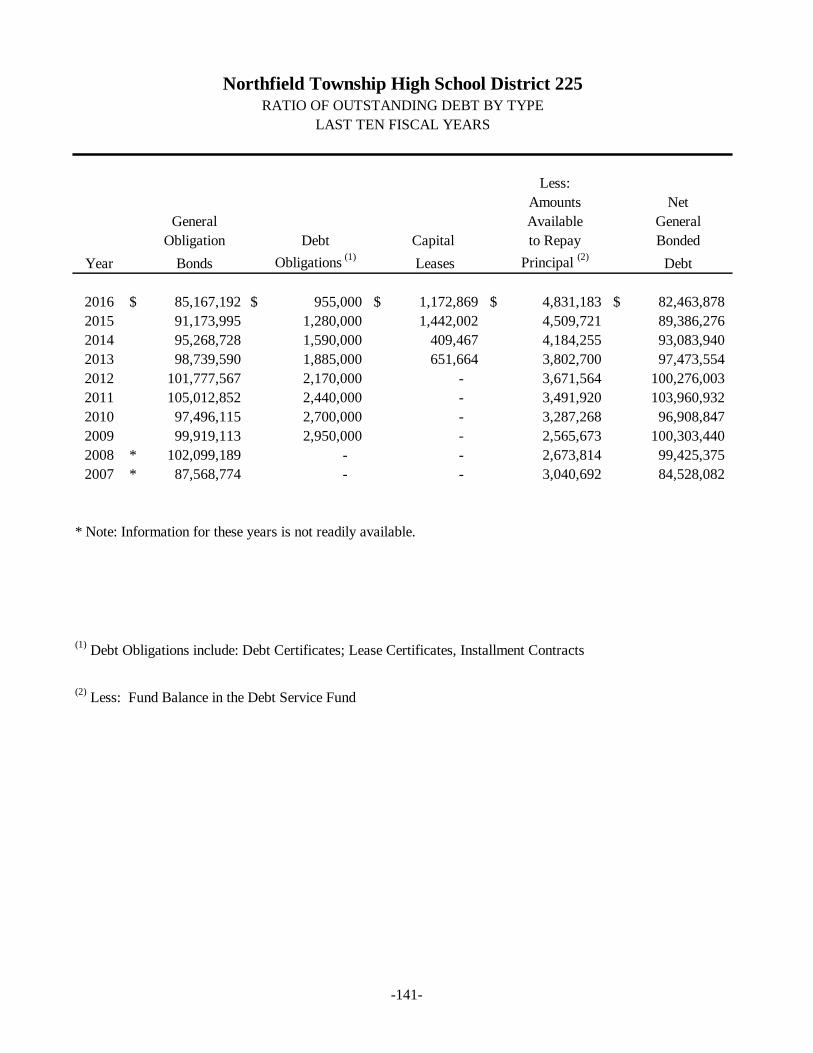
Less:
Amounts Net
General Available General
Obligation Debt Capital to Repay Bonded
Year Bonds Obligations (1)
Leases Principal (2)
Debt
2016 $ 85,167,192 $ 955,000 $ 1,172,869 $ 4,831,183 $ 82,463,878
2015 91,173,995 1,280,000 1,442,002 4,509,721 89,386,276
2014 95,268,728 1,590,000 409,467 4,184,255 93,083,940
2013 98,739,590 1,885,000 651,664 3,802,700 97,473,554
2012 101,777,567 2,170,000 - 3,671,564 100,276,003
2011 105,012,852 2,440,000 - 3,491,920 103,960,932
2010 97,496,115 2,700,000 - 3,287,268 96,908,847
2009 99,919,113 2,950,000 - 2,565,673 100,303,440
2008 * 102,099,189 - - 2,673,814 99,425,375
2007 * 87,568,774 - - 3,040,692 84,528,082
* Note: Information for these years is not readily available.
(2) Less: Fund Balance in the Debt Service Fund
(1) Debt Obligations include: Debt Certificates; Lease Certificates, Installment Contracts
Northfield Township High School District 225RATIO OF OUTSTANDING DEBT BY TYPE
LAST TEN FISCAL YEARS
-141-

Percentage Ratio of Total
of Equalized Outstanding Outstanding Debt
Assessed Debt Per Estimated Personal to Personal
Valuation Capita Population Income Income
1.88% $ 1,018 85,747 $ 4,421,372,561 1.95
1.94% 1,078 85,747 4,854,909,393 1.90
1.92% 1,130 85,747 4,383,215,146 2.21
1.72% 1,057 85,747 4,383,215,146 2.30
1.72% 1,130 85,747 4,383,215,146 2.37
1.58% 1,156 86,416 4,533,097,304 2.37
1.34% 1,153 86,348 4,533,097,304 2.21
1.45% 1,107 86,348 4,533,097,304 2.27
1.60% 1,143 86,348 4,533,097,304 2.25
1.70% 1,005 87,155 4,455,189,290 1.97
-142-

Percentage of
2015 Total 2015
Equalized Equalized
Assessed Assessed
Type of Business, Property Valuation Valuation
# 1 Allstate Insurance, Insurance Corporate Office $ 65,839,554 1.50%
# 2 Westcoast Estates, Shopping Center 54,959,965 1.25%
# 3 Mid America Asset Mgmt., Real Estate management 48,537,395 1.11%
# 4 Jones Lang LaSalle, Office Building 46,107,148 1.05%
# 5 Walgreen Company, Drug Store 36,173,414 0.82%
# 6 CLF 1000 Milwaukee Aveneu 27,512,833 0.63%
# 7 Oliver McMillan LLC, Commercial Units 24,584,585 0.56%
# 8 UL LLC, nonprofit testing & certification 22,480,800 0.51%
# 9 Northshore University Health 21,746,810 0.50%
# 10 Astellas US Holdings, Public Garage 18,967,365 0.43%
Total $ 366,909,869 8.36%
Source of information: Cook County Assessor's Office Percentage of
2006 Total 2006
Equalized Equalized
Assessed Assessed
Type of Business, Property Valuation Valuation
# 1 Allstate Insurance, Insurance Corporate Office $ 138,890,569 2.70%
# 2 Northbrook Court Shopping Center 92,001,351 1.79%
# 3 Grubb & Ellis Services 27,786,696 0.54%
# 4 Lake Cook Road & Midamerica 23,198,898 0.45%
# 5 Estate of James Campbell 22,743,843 0.44%
# 6 May Department Store 20,036,235 0.39%
# 7 Clarion Realty 19,588,186 0.38%
# 8 Underwriters Laboratories Inc. 17,704,972 0.34%
# 9 Jones Lang LaSalle 17,420,141 0.34%
# 10 North Suburban Development Corp 17,181,325 0.33%
Total $ 396,552,216 7.71%
Source of information: Cook County Assessor's Office; Years presented are the most recent available.
Northfield Township High School District 225PRINCIPAL TAXPAYERS IN THE DISTRICT
CURRENT TAX YEAR AND NINE YEARS AGO
Note: The 2015 Cook County multiplier of 2.6685 has been applied to the 2015 assessed valuations of these
taxpayers.
Note: The 2006 Cook County multiplier of 2.7076 has been applied to the 2006 assessed valuations of these
taxpayers.
-143-

Type of Business % of Total
Employer or Property Employees Employment
Allstate Insurance Co. Insurance corporate office 8,000 21.20%
Walgreen Co. Drug stores corporate office 2,500 6.63%
Baxter Healthcare Corp. (3 Divisions) Corporate headquarters and international – medical supplies, products,
devices and services
2,500 6.63%
Underwriters Laboratories, Inc. Company headquarters & independent nonprofit testing & certification 2,000 5.30%
CVS Caremark, Inc. Integrated health care services 1,400 3.71%
Takeda Pharmaceuticals North America,
Inc. Corporate headquarters – pharmaceuticals 1,400 3.71%
ABT Electronics Retail appliances and electronics 1,200 3.18%
Astellas Pharmacy US, Inc. Corporate headquarters – pharmaceuticals 1,150 3.05%
Anixter International, Inc. Corporate headquarters - voice, video, data 1,000 2.65%
Kraft Heinz Foods Co., Technology Ctr. Food products research, development and kitchen testing 1,000 2.65%
Glenbrook H.S.D. 225 Education 849 2.18%
Essendant
Company headquarters - wholesale office furniture, janitorial &
sanitation products; industrial & automotive products 800 2.12%
Total 23,799 63.01%
Type of Business % of Total
Employer or Property Employees Employment
Allstate Insurance Co Insurance corporate office 5,000 12.38%
Walgreen Co. Drug stores corporate office 2,500 6.19%
Baxter Healthcare Corp. (3 Divisions) Corporate headquarters – medical supplies 2,470 6.12%
Kraft Kitchens Innovation Center Food products research, development and kitchen testing 2,100 5.20%
Underwriters Laboratories, Inc. Independent non-profit testing and certification 1,600 3.96%
ABT Electronics Retail appliances and electronics 1,050 2.60%
United Stationers, Inc. Corporate headquarters – office furniture and sanitation products 800 1.98%
Glenbrook H.S.D. 225 Education 767 1.90%
CVS Caremark, Inc. Integrated health care services 750 1.86%
Anixter International, Inc. Corporate headquarters - voice, video, data 700 1.73%
Takeda Pharmaceuticals North America,
Inc. Corporate headquarters – pharmaceuticals 650 1.61%
Allstate Life Insurance Co. Life insurance 600 1.49%
Total 18,987 47.02%
Includes employers in Deerfield, Glenview, and Northbrook. District employee information provided by the District.
Illinois Department of Employment Security.
Source: 2016 & 2007 Illinois Manufacturers, 2016 & 2007 Services Directories and
Northfield Township High School District 225 PRINCIPAL EMPLOYERS
CURRENT YEAR AND NINE YEARS AGO
2016
2007
-144-
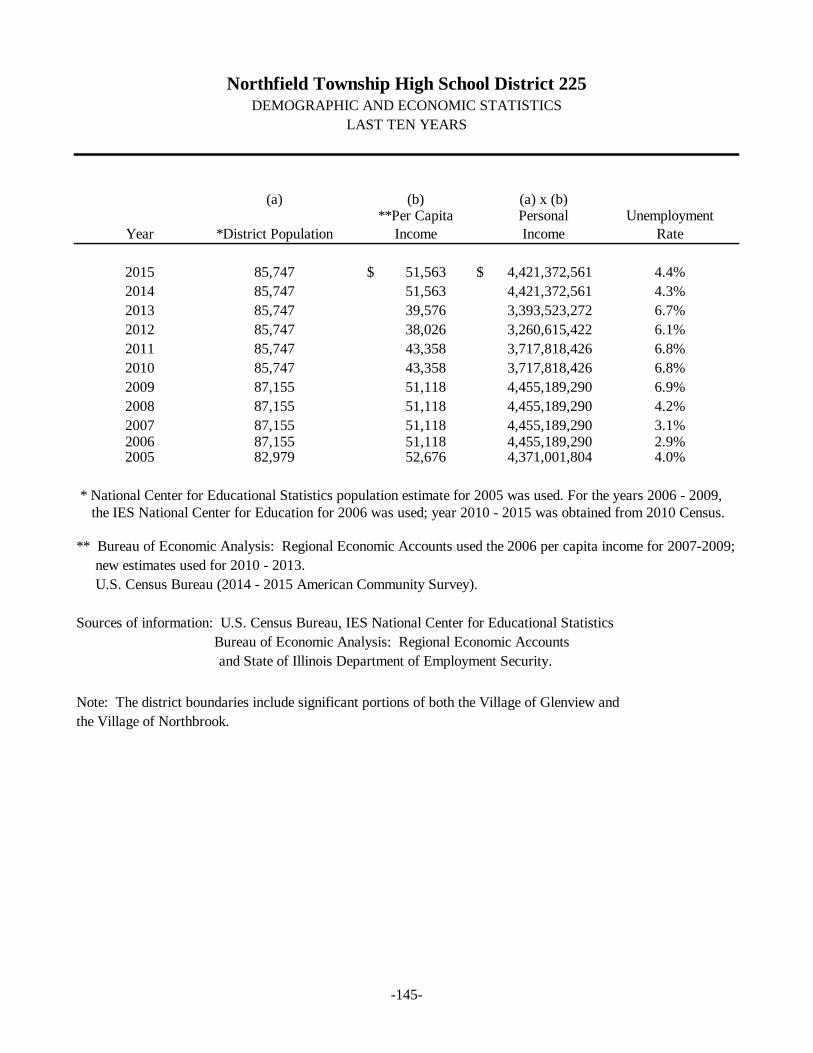
(a) (b) (a) x (b)**Per Capita Personal Unemployment
Year *District Population Income Income Rate
2015 85,747 $ 51,563 $ 4,421,372,561 4.4%
2014 85,747 51,563 4,421,372,561 4.3%
2013 85,747 39,576 3,393,523,272 6.7%
2012 85,747 38,026 3,260,615,422 6.1%
2011 85,747 43,358 3,717,818,426 6.8%
2010 85,747 43,358 3,717,818,426 6.8%
2009 87,155 51,118 4,455,189,290 6.9%
2008 87,155 51,118 4,455,189,290 4.2%
2007 87,155 51,118 4,455,189,290 3.1%2006 87,155 51,118 4,455,189,290 2.9%2005 82,979 52,676 4,371,001,804 4.0%
* National Center for Educational Statistics population estimate for 2005 was used. For the years 2006 - 2009,
the IES National Center for Education for 2006 was used; year 2010 - 2015 was obtained from 2010 Census.
** Bureau of Economic Analysis: Regional Economic Accounts used the 2006 per capita income for 2007-2009;
new estimates used for 2010 - 2013.
U.S. Census Bureau (2014 - 2015 American Community Survey).
Sources of information: U.S. Census Bureau, IES National Center for Educational Statistics
Bureau of Economic Analysis: Regional Economic Accounts
and State of Illinois Department of Employment Security.
Note: The district boundaries include significant portions of both the Village of Glenview and
the Village of Northbrook.
Northfield Township High School District 225DEMOGRAPHIC AND ECONOMIC STATISTICS
LAST TEN YEARS
-145-

2016 2015 2014 2013
Glenbrook North High School
Square Feet 580,000 580,000 580,000 580,000
Capacity (Students) 2,400 2,400 2,385 2,385
Enrollment 2,057 2,038 2,087 2,060
Glenbrook South High School
Square Feet 670,000 670,000 670,000 670,000
Capacity (Students) 3,100 3,100 2,753 2,753
Enrollment 3,002 2,895 2,736 2,747
Source of Information: Architect's Data and Sixth Day Enrollment Forms
Northfield Township High School District 225SCHOOL BUILDING INFORMATION
LAST TEN FISCAL YEARS
-146-

2012 2011 2010 2009 2008 2007
580,000 580,000 580,000 580,000 528,789 528,789
2,385 2,385 2,385 2,385 2,166 2,166
2,073 2,126 2,123 2,130 2,136 2,106
670,000 670,000 670,000 670,000 617,980 617,980
2,753 2,753 2,753 2,753 2,678 2,678
2,681 2,644 2,628 2,566 2,599 2,696
-147-

2016 2015 2014 2013
Administration:
Superintendent 1.0 1.0 1.0 1.0
District Administrators 9.0 7.0 7.0 7.0
Principals and assistants 13.0 13.0 13.0 13.0
Building Administrators 23.0 25.0 25.0 25.0
Total administration 46.0 46.0 46.0 46.0
Teachers:
Regular classroom teachers 332.0 344.0 342.0 326.0
Special education teachers 44.0 49.0 48.0 45.0
Guidance/Counselors 24.0 24.0 24.0 23.0
Psychologists 12.0 9.0 10.0 10.0
Librarians/Media Specialists 7.0 6.0 6.0 6.0
Social workers 10.0 8.0 11.0 9.0
Speech/Language Therapists 3.0 3.0 3.0 2.0
Certified Nurses 2.0 1.0 2.0 2.0
Total teachers 434.0 444.0 446.0 423.0
Coordinators/Supervisors 3.0 3.0 3.0 3.0
Other supporting staff:
Secretarial/Clerical/Instructional Assistants 215.0 187.0 196.0 194.0
Custodial/Maintenance/Security/Technology 151.0 142.0 139.0 132.0
Total support staff 366.0 329.0 335.0 326.0
Total staff 849.0 822.0 830.0 798.0
Note: Beginning with fiscal year 2003, certified school administrators (TRS employees) are listed under
"Administration" and non-certified school personnel (IMRF employees) are listed as
"Coordinators/Supervisors."
Source of information: District Personnel Records, District Seniority Lists and Teacher Service Records
Northfield Township High School District 225NUMBER OF EMPLOYEES BY FUNCTION
LAST TEN FISCAL YEARS
-148-

2012 2011 2010 2009 2008 2007
1.0 1.0 1.0 1.0 1.0 1.0
7.0 7.0 8.0 8.0 7.0 8.0
13.0 13.0 13.0 13.0 12.0 13.0
23.0 23.0 23.0 23.0 29.0 28.0
44.0 45.0 45.0 49.0 50.0 59.0
338.0 342.0 348.0 351.0 348.0 344.0
48.0 48.0 46.0 43.0 45.0 47.0
24.0 23.0 21.0 22.0 23.0 23.0
9.0 10.0 10.0 9.0 8.0 7.0
6.0 6.0 6.0 6.0 8.0 9.0
10.0 10.0 9.0 10.0 12.0 11.0
1.0 1.0 1.0 1.0 1.0 1.0
2.0 2.0 2.0 2.0 2.0 2.0
438.0 443.0 444.0 447.0 444.0 457.0
3.0 2.0 2.0 2.0 2.0 2.0
189.0 183.0 180.0 167.0 166.0 158.0
132.0 124.0 118.0 115.0 120.0 133.0
321.0 298.0 282.0 286.0 291.0 297.0
806.0 788.0 773.0 784.0 787.0 814.0
-149-

Function 2016
Instruction
Regular and Special student enrollment 5,059
Support Services
Pupil
Languages spoken by student population 47
Instructional Staff
Average ACT total score 24.7
School Administration
Average daily attendance 4,702
Fiscal
Purchase Orders Processed 1,153
Maintenance
District Square Footage Maintained by Custodians and Maintenance Staff 1,250,000
District Acreage Maintained by Grounds Staff 160
Transportation
Avg. number of regular pupils transported per year 986
Avg. number of regular bus runs to/from school 26
Extra Curricular Activities
Number of competitive sports 28
Number of student clubs 163
Northfield Township High School District 225OPERATING INDICATORS BY FUNCTION
June 30, 2016
Source for information: SIS System, Illinois District Report Card, District financial system, District's Risk
Management Consultant, and the General State Aid Report
-150-

1947 Northfield Township approves the formation of high school district 225
1952 Groundbreaking for Glenbrook North High School
1953 Glenbrook North opens its doors to 652 Northbrook students
1955 Chicago's O'Hare Field opening starts housing development boom
Construction begins on first additions to the school
1959 Voters approve land purchase for Glenbrook South High School
Allstate Insurance Company moves its headquarters to Northbrook
1961 Enrollment exceeds 2,000
1962 Groundbreaking for Glenbrook South High School
1971 Teachers strike delays opening of school
1974 Glenbrook wins state titles in baseball and football, national title in debate
1975 Glenbrook Evening High School is established as an alternative program
1976 Northbrook Court shopping center opens
1978 Glenbrook girl's swimming team wins state title
District sells it's third school site to the Northbrook Park District
1979 Glenbrook North Sheely Center for Performing Arts dedicated
1981 Glenbrook boy's tennis team wins state title
1982 First state title for Glenbrook North debate team
1983 Glenbrook boy's soccer team wins state title
1984 Glenbrook North and South receive national "Excellence in Education" award from the U.S.
Department of Education
1985 Ferris Bueller's Day Off is filmed at Glenbrook North
(Continued)
Northfield Township High School District 225
DISTRICT HISTORY
-151-

Northfield Township High School District 225
DISTRICT HISTORY
1988 Techny annexed to the Village of Northbrook
1990 Glenbrook North and South dedicate new field houses
1991 Dr. Jean McGrew named Illinois Superintendent of the Year
1993 Glenbrook boy's volleyball team wins state title
1995 Glenview Naval Air Station closes and The Glen development project begins
1997 President Bill Clinton visits the Glenbrook High Schools in honor of the District's success in
the First in the World Consortium
1999 Glenbrook boy's tennis team wins state title
Dr. Craig Schilling is awarded the Association of School Business Officials International
Eagle Award for professional service
2000 Board of Education authorizes major expansion projects for both schools
Glenbrook North named Top Debate School in the Last 1/2 of the 20th Century
2001 Glenbrook debate team wins 3rd straight national title
2002 Glenbrook North Aquatic Center dedicated
District receives "AAA" bond rating
2003 50th anniversary of Glenbrook North
2004 Glenbrook wins the "triple crown" in debate
2005 Glenbrook High Schools named to the Illinois Honor Roll for sustained high performance on
state assessments
Glenbrook North becomes the only class AA high school in Illinois to win the State
championship in each of the big 3 sports: football, basketball and baseball
District is awarded the Illinois Association of School Business Officials Lighthouse Award
and the Association of School Business Officials International Pinnacle of Achievement
Award for the "Shape Your Life" Health Promotion Program
(Continued)
-152-

Northfield Township High School District 225
DISTRICT HISTORY
2006 Voters approve building bond referendum for expansion/renovation projects
2007 Construction begins at both Glenbrook North and South
District's tax base tops $6 billion
2008 Glenbrook North named a Blue Ribbon High School by the U.S. Department of Education
Glenbrook South awarded the Grammy Signature School Award: 2008 Top Public High
School for Music Excellence
2009 Construction is completed at Glenbrook North and Glenbrook South
District enters into a Lease to Purchase Agreement of the 3801 W. Lake Ave Building for
relocation of the District Administration Center and Off-Campus Program
The Class of 2009 at both Glenbrook North and Glenbrook South achieve the highest average
composite ACT scores in each school's history
2010
2011
Both GBN and GBS students earned their highest average ACT composite scores in the
history of District 225. The District's average ACT composite score for the graduating class
of 2011 was 25.4
2012 Chicago Magazine ranks GBN and GBS among the top 4 best public high schools in Cook
County
(Continued)
GBN student newspaper, Torch, was awarded 1st
Place with Special Merit by the American
Scholastic Press Association. GBS Etruscan Yearbook and Oracle student newspaper were
each State Blue Ribbon Award winners
The District's Off Campus and Evening High School alternative educational programs
relocated to the renovated 1835 Landwehr Road Building for the start of second semester
Renovation of the 1835 Landwehr Road building, which formerly housed the District’s
central offices, began shortly after the close of the 2010 fiscal year. The renovated site will
serve as a permanent location for the District’s Off Campus and Evening High School
alternative education programs
District students earned national and state recognition, with 16 National Merit semifinalists
and 32 students commended, and a combined total of 308 students named Illinois State
Scholars
-153-

Northfield Township High School District 225
DISTRICT HISTORY
2012
(Continued)
GBS celebrates its 50th Anniversary with special events, a gala, and a telethon for Youth
Services of Glenview/Northbrook that raised more than $80,000
2013 Glenbrook High School District 225 named a 2013 recipient of the Bright Red Apple Award
for educational excellence. It is one of only 78 Illinois school districts to be honored with such
an award
Glenbrook High School District 225 earned the SchoolSearch 2012 Bright A+ Award for
academic excellence in education. It is one of only 59 Illinois school districts to earn such an
award
The Chicago Tribune named Glenbrook High School District 225 one of the "Top 100
Workplaces"
2014 After first opening its doors to 650 students on September 8, 1953, Glenbrook North
celebrated its 60 year anniversary with a 2014 enrollment of more than 2,100 students
The State Report Card reported Glenbrook South posting a 24.9, its highest ACT score in
history, above the state average of 20.6
2015 GBN and GBS students maintained their highest average ACT composite score at 25.4.
2016 Glenbrook High School District 225 was ranked at No. 3 in Illinois and No. 10 in the country
by the Niche Company
(Concluded)
-154-

Liability
A Policy Number SSCRMP-201507
B Insurer SSCRMP / Genesis Underwriting Managers
C Policy Period January 1, 2016 - January 1, 2017
D Premium $187,679
E Coverages General Liability, Auto Liability, School Board Errors and Omissions
F Limit $11,000,000 Each occurrence and aggregate per District
G District Deductible $0
Property
A Policy Number KTKCMB296T973-5-15
B Insurer Travelers
C Policy Period January 1, 2016 - January 1, 2017
D Premium $159,851
E Coverages Buildings, contents, autos
F Limit $350,000,000 Each Occurrence
G District Deductible $1,000 each claim
Excess Liability
A Policy Number 1130151
B Insurer Illinois National
C Policy Period January 1, 2016 - January 1, 2017
D Premium Included in Liability
E Coverages General Liability, Auto Liability, School Board Errors and Omissions
F Limit $20,000,000 Each Occurrence and Aggregate per District
G District Deductible $0
Workers Compensation
A Policy Number SP1Q16IL
B Insurer SSCRMP / Safety National
C Policy Period July 1, 2015 to July 1, 2016
D Premium $168,790
E Coverages Employee injuries
F Limit Coverage A: Statutory; Coverage B $1,000,000
G District Deductible $150,000 Each Claim
Northfield Township High School District 225SCHEDULE OF INSURANCE IN FORCE
(Continued)
-155-

Northfield Township High School District 225SCHEDULE OF INSURANCE IN FORCE
Boiler
A Policy Number M5J-BME1-339K9584-TIL-15
B Insurer Travelers
C Policy Period January 1, 2016 - January 1, 2017
D Premium Included in property
E Coverages Boiler & Equipment failure
F Limit $50,000,000 Each Occurrence
G District Deductible $1,000 each claim
Crime
A Policy Number 105538574
B Insurer Travelers
C Policy Period January 1, 2016 - January 1, 2017
D Premium Included in property
E Coverages Theft of property and money
F Limit $1,000,000 Each Occurrence
G District Deductible $1,000 each claim
Cyber Liability
A Policy Number G25606243001
B Insurer Chubb
C Policy Period January 1, 2016 - January 1, 2017
D Premium $8,459
E Coverages Information security & privacy
F Limit $1,000,000 Aggregate
G District Deductible $1,000 each claim
Pollution
A Policy Number 900700
B Insurer Ironshore
C Policy Period January 1, 2016 - January 1, 2017
D Premium Included in property
E Coverages Pollution liability and cleanup
F Limit $3,000,000 SSCRMP Pool Aggregate
G District Deductible $1,000 each claim
(Concluded)
-156-

2016 2015
OPERATING COST PER PUPIL
Average Daily Attendance (ADA): 4,702.14 4,583.28
Operating costs: Educational $ 99,264,721 $ 97,293,686 Operations and Maintenance 7,726,249 7,603,272 Debt Service 9,809,008 10,117,455 Transportation 2,885,849 2,800,726 Municipal Retirement/Social Security 3,429,772 3,396,687
Subtotal 123,115,599 121,211,826
Less Revenues/Expenditures of Nonregular Programs: Tuition 6,256,025 5,867,989 Summer school 525,641 414,769 Capital outlay 650,477 2,769,579 Debt principal retired 6,664,463 6,774,760 Community services 142,540 99,962 Non-capitalized equipment 1,003,518 577,569
Subtotal 15,242,664 16,504,628
Operating costs $ 107,872,935 $ 104,707,198
Operating costs per pupil - based on ADA $ 22,941 $ 22,845
TUITION CHARGE
Operating costs $ 107,872,935 $ 104,707,198 Less - revenues from specific programs, such as special education or lunch programs 9,125,329 7,959,008
Net operating costs 98,747,606 96,748,190
Depreciation allowance 7,561,353 7,246,059
Allowance tuition costs $ 106,308,959 $ 103,994,249
Tuition charge per pupil - based on ADA $ 22,609 $ 22,690
Northfield Township High School District 225OPERATING COSTS AND TUITION CHARGE
JUNE 30, 2016 AND 2015
-157-