Comprehensive Annual Financial Report - … Annual Financial Report — Introductory Section s DRS...
250
Comprehensive Annual Financial Report Funds of the State of Washington for the Year Ended June 30, 2016
Transcript of Comprehensive Annual Financial Report - … Annual Financial Report — Introductory Section s DRS...

ComprehensiveAnnual Financial ReportFunds of the State of Washington for the Year Ended June 30, 2016

Comprehensive Annual Financial Report
Funds of the State of Washington
for the Fiscal Year Ended June 30, 2016
Prepared by:
The Washington State Department of Retirement Systems
PO Box 48380
Olympia, WA 98504-8380
www.drs.wa.gov

ii DRS s Introductory Section — Comprehensive Annual Financial Report
INTRODUCTORY SECTION
3 Director’s Message 4 Washington State Department of Retirement Systems’ Organization 5 Pension System Roles and Responsibilities 8 Letter of Transmittal 11 Professional Award 12 2015 Washington State Legislative Actions
FINANCIAL SECTION
15 Independent Auditors’ Report 17 Management’s Discussion and Analysis
Basic Financial Statements (notes to the financial statements are an integral part of the basic financial statements) 20 Statement of Fiduciary Net Position — Pension Trust Funds by Plan 24 Statement of Changes in Fiduciary Net Position — Pension Trust Funds by Plan
Notes to the Financial Statements 28 Note 1: Summary of Significant Accounting Policies and Plan Asset Matters 45 Note 2: General Description of the Retirement Systems
Required Supplementary Information 80 Schedule of Changes in Net Pension Liability 86 Schedule of Net Pension Liability 89 Schedule of Employer Contributions 95 Schedule of Investment Returns 96 Notes to Required Supplementary Information
Supporting Schedules 97 Schedule of Administrative Expenses 98 Schedule of Investment Expenses — Pension Trust Funds 99 Schedule of Payments to Consultants
INVESTMENT SECTION
103 Report on Investment Activity 107 Summary of Investment Policies 109 Investment Professionals 111 Schedule of Investment Management Fees and Commissions 112 Schedule of Broker Volume and Equity Commissions Paid 117 Summary of Investments Owned — Pension Trust Funds
Table of Contents

Comprehensive Annual Financial Report — Introductory Section s DRS iii
Table of Contents (cont.)
ACTUARIAL SECTION
127 State Actuary’s Certification Letter 131 Summary of Plan Provisions 133 Summary of Actuarial Assumptions and Methods
Additional Actuarial Schedules 143 Schedule of Active Member Valuation Data 148 Schedule of Retirees and Beneficiaries Added to and Removed from Rolls 153 Solvency Tests 157 Analysis of Selected Experience 160 Schedules of Funding Progress 164 Funded Status and Funding Progress 166 Additional Information for the Defined Benefit Pension Plans 168 Required Contribution Rates
STATISTICAL SECTION
171 Statistical Section Table of Contents 172 Schedule of Changes in Fiduciary Net Position 188 Distribution of Membership by System and Plan 190 Principal Participating Employers by Plan 200 Employers Covered by DRS-Administered Retirement Systems 212 Schedule of Benefit Recipients by Type of Benefit 219 Schedule of Average Benefit Payments to Service Retirees in Year of Retirement 232 Schedule of Benefit Expenses and Refunds by Type
Deferred Compensation Program Status Report 240 Deferred Compensation Program Status Report 242 Deferred Compensation Program Performance

iv DRS s Introductory Section — Comprehensive Annual Financial Report
This page is intentionally blank.

2016 Highlights
DRS is a listening organization
To continuously improve, we know we must always listen to our customers, our partners, our stakeholders and our team members — and act on their feedback.
This emphasis on listening is a fundamental part of how we strengthen DRS services and operations and how we stay focused on the agency’s key goals: Elated Customers, Engaged Team Members, Vigilant Resource Steward, Best Practice Leader and Reliable Partner.
Introductory Section

Introductory Section

Comprehensive Annual Financial Report — Introductory Section s DRS 3
DRS is a listening organization. To continuously improve, we know we must always listen to our customers, our partners, our stakeholders and our team members — and act on their feedback.
This emphasis on listening is a fundamental part of how we strengthen DRS services and operations and how we stay focused on the agency’s key goals: Elated Customers, Engaged Team Members, Vigilant Resource Steward, Best Practice Leader and Reliable Partner.
In conversations with the many people who are connected to the state’s retirement systems, the themes we’ve heard are consistent and clear. A high demand exists for resources that help our members engage in retirement readiness throughout their careers. The expectation to facilitate online transactions continues to grow. And, as always, customers expect us to live up to the “3 R’s” — respectful, responsive and right.
During the past year, these themes have guided DRS in implementing and initiating a variety of improvements:
• Single record keeper for DCP and Plan 3: 2016 marked the culmination of two years of work in successfully transitioning to a single record keeper to serve the state’s Plan 3 retirement systems and the Deferred Compensation Program. The transition created immediate benefits for Plan 3 and DCP customers by providing “one-stop” access to their accounts and comprehensive retirement planning information, both online and on the phone. For the long term, the unified approach to recordkeeping services will bring a progression of products and enhancements that will provide personalized retirement readiness tools and services for all DRS customers.
• Automatic enrollment for DCP: Enacted by the Legislature in 2016, this program will
automatically enroll all new, full-time state employees in the Deferred Compensation Program starting in January 2017. (Enrollees will have the ability to opt out if they wish.) Patterned after successful programs in other states, auto-enrollment is expected to significantly boost the number of employees who are increasing their supplemental savings for retirement.
• Online transactions: During the past year, DRS established new ways for customers to process transactions through their secure online accounts. One new tool allows members to update their beneficiary designations (previously a labor-intensive, paper-based process); the other allows retirees to conveniently set up and update direct (electronic) deposit of their benefit payments to their bank or credit union.
• Employer reporting: Work began this year on the first stage of modernizing the legacy systems that support DRS’ core business functions. The first effort will replace the 20-year-old system used by government employers to report member account and financial information to DRS.
These are a few of the many improvements taking place at DRS, all guided by our commitment to seeking feedback and using what we learn to meet and exceed customer expectations.
Since this is the last introduction I will make for the DRS CAFR, I’d like to take the opportunity to say thank you to everyone involved in the operation of Washington’s retirement systems, which are consistently recognized among the best in the nation. I’d especially like to thank DRS members and retirees — the hundreds of thousands of men and women who have dedicated their careers to public service in support of the people of our state. You are very much appreciated.
Sincerely,
Marcie FrostDirector
Director’s Message

4 DRS s Introductory Section — Comprehensive Annual Financial Report
Washington State Department of Retirement Systems’ Organization
Leadership Team Member
Special Reporting Requirements to the Director
Director Tracy Guerin
effective 9/1/16
Human Resources & Office Services
Chris Greenwalt
Administrative Services
Mike Ricchio
Legal &Legislative Services
Jacob White
Retirement Services
Seth MillerInformation
ServicesRose Bossio
ProjectManagement
Shawn Merchant
RiskManagementGeorge Pickett
CommunicationsDavid Brine
Budget &PerformanceManagement
Mark Feldhausen
AppealsEllen
Anderson
InternalAudit
DebbieOcheltree
ExecutiveAssistant
Rubi Reaume

Comprehensive Annual Financial Report — Introductory Section s DRS 5
Pension System Roles and Responsibilities
Pension System Roles and Responsibilities — Page 1 of 3Organization and Contact Information Responsibility Membership/Executive
Department of Retirement SystemsPO Box 48380Olympia, WA 98504-8380
Phone: 360.664.7000 or 800.547.6657Website: www.drs.wa.gov
Collects and accounts for employer and employee contributions, maintains retirement records, pays benefits, communicates pension information, provides investment education, and administers the Deferred Compensation Program
Marcie Frost – Director (through 8/2016)Tracy Guerin – Director (effective 9/2016)
(The governor appoints the director of DRS.)
Washington State Investment BoardPO Box 40916Olympia, WA 98504-0916
Phone: 360.956.4600Website: www.sib.wa.gov
Invests and accounts for pension funds The board consists of 10 voting and five nonvoting members.
Voting membersJames L. McIntire – State Treasurer Rep. Timm Ormsby Sen. Mike HewittMarcie Frost (chair) – Director, Department of Retirement SystemsJoel Sacks – Director, Department of Labor and IndustriesGeorge Masten – Retired membersKelly Fox (vice chair) – LEOFF Arlista Holman – SERS Judy Kuschel – PERSStephen Miller – TRS
Nonvoting members – investment professionalsWilliam A. Longbrake Richard Muhlebach Robert S. Nakahara David Nierenberg Jeffrey T. Seely
Office of Financial ManagementPO Box 43113Olympia, WA 98504-3113
Phone: 360.902.0555Website: www.ofm.wa.gov
Advises the governor on pension and funding policies and issues
David Shumacher – Director
(The governor appoints the director of OFM.)
Office of the State ActuaryPO Box 40914Olympia, WA 98504-0914
Phone: 360.786.6140Website: osa.leg.wa.gov
Acts as an advisory agency to the Legislature and to the director of DRS; performs actuarial studies and reports on retirement bills; and creates factors used to compute benefit payment adjustments that are based on early retirement, Cost-of-Living Adjustments or long-term survivor benefits
Matt Smith – State Actuary
(The State Actuary Appointment Committee appoints the state actuary.)
Law Enforcement Officers’ and Fire Fighters’ Plan 2 Retirement BoardPO Box 40918Olympia, WA 98504-0918
Phone: 360.586.2320Website: www.leoff.wa.gov
Policy-making board that studies pension issues, acts as fiduciary of LEOFF Plan 2, sets contribution rates and recommends pension policy to the Legislature for LEOFF Plan 2 members
Fire fighter representativesKelly Fox (chair)Michael WhiteMark Johnston
Law enforcement representativesRep. Jeff Holy (retired)Wally LoucksJason Granneman
Employer representativesDavid ClineDave Upthegrove Paul Golnik
LegislatorsRep. Kevin Van De WegeSen. Judy Warnick

6 DRS s Introductory Section — Comprehensive Annual Financial Report
Pension System Roles and Responsibilities (cont.)
Pension System Roles and Responsibilities — Page 2 of 3Organization and Contact Information Responsibility Membership/Executive
Select Committee on Pension PolicyContact through the Office of the State Actuary
Studies pension issues and retirement finances, develops pension policies, and recommends pension legislation
LegislatorsRep. Timm Ormsby Rep. Bruce Chandler (vice chair)Rep. Matt ManwellerRep. Derek Stanford Sen. Barbara BaileySen. Steve Conway (chair)Sen. Steve HobbsSen. Mark Schoesler
Agency directorsDavid Schumacher – Office of Financial ManagementMarcie Frost – Department of Retirement Systems
Retiree representativesBev Hermanson – PERS Bob Thurston – WSPRS
Active member representativesRandy Davis – TRS Bob Keller – PERSJ. Pat Thompson – PERS David Westberg – SERS
Employer representativesJohn Boesenberg – PERS/Higher EducationAnnette Creekpaum – PERSBeverly Freeman – PERS
DRS Advisory CommitteeContact through DRS
Serves in an advisory role to the director of DRS
PERSBev Hermanson – RetiredMary L. Sherman – Active
SERSJacques Meddles – ActiveCheri Ingersoll – Retired
LEOFFMark J. Mears – Active Richard Warbrouck – Retired
TRSNancy Baldwin – Retired (chair) Darrell Heisler – Active
PSERSWilliam Copland – Active
WSPRSTravis Matheson – ActiveRick Jensen – Retired (vice chair)
JRSJudge Richard McDermott – Active
DCPKathy Whitlock – Participant
Defined contribution plan administrationDeirdre Walker – Weyerhaeuser

Comprehensive Annual Financial Report — Introductory Section s DRS 7
Pension System Roles and Responsibilities (cont.)
Pension System Roles and Responsibilities — Page 3 of 3Organization and Contact Information Responsibility Membership/Executive
Pension Funding CouncilContact through DRS
Adopts economic assumptions for pension funding and member and employer pension contribution rates for LEOFF Plan 1, PERS, PSERS, SERS, TRS and WSPRS
LegislatorsRep. Bruce Chandler – Ranking minority member, House Appropriations CommitteeRep. Timm Ormsby – Chair, House Appropriations CommitteeSen. Andy Hill – Chair, Senate Ways and Means CommitteeSen. Kevin Ranker – Ranking minority member, Senate Ways and Means Committee
Agency directorsDavid Schumacher (chair) – Office of Financial ManagementMarcie Frost – Department of Retirement Systems
Legislative Fiscal Committees
House Appropriations CommitteePO Box 40600Olympia, WA 98504-0600
Senate Ways and Means CommitteePO Box 40482Olympia, WA 98504-0482
Phone: 360.786.7155or 800.562.6000Website: www.leg.wa.gov
Reviews and reports on retirement bills to the full Legislature
The legislative fiscal committees are the House Appropriations Committee and the Senate Ways and Means Committee.

8 DRS s Introductory Section — Comprehensive Annual Financial Report
October 14, 2016
The Honorable Jay Inslee, GovernorMembers of the Sixty-Fourth LegislatureMembers of the Select Committee on Pension PolicyState of Washington Olympia, WA 98504
We are pleased to present our Comprehensive Annual Financial Report (CAFR) for the fiscal year ended June 30, 2016. This report is intended to provide complete and reliable information that can be used to make management decisions and evaluate responsible stewardship of the retirement systems’ funds.
This CAFR is also designed to comply with the requirements of RCW 41.50.050(4).
Responsibility for the accuracy of the data and the fairness and completeness of this presentation, including all disclosures, rests with the management of the Department of Retirement Systems (DRS). To the best of our knowledge, the enclosed information is accurate in all material respects and is reported in a manner designed to provide a fair representation of the financial position and results of the operations of the department.
CliftonLarsonAllen LLP, certified public accountants, have issued an unmodified (“clean”) opinion on DRS’ financial statements for the year ended June 30, 2016. The independent auditors’ report is located at the beginning of the Financial Section of this CAFR.
“Management’s Discussion and Analysis” (MD&A) immediately follows the independent auditors’ report and provides a narrative introduction, overview and analysis of the basic financial statements. The MD&A complements this letter of transmittal and should be read in conjunction with it.
Agency Description DRS was established to administer pension plans for state employees, teachers and classified educational employees, law enforcement officers and fire fighters, and other employees of participating political subdivisions. DRS was also given administrative responsibility for the state’s Deferred Compensation Program.
As of June 30, 2016, 1,336 employers were covered, 153 of which were component units of the state. They participate in the eight statewide retirement systems DRS administers. Those retirement systems are composed of 15 defined benefit plans, three of which include a defined contribution component.
Additionally, DRS is responsible for the accounting, reporting and collection of contributions for the Judicial Retirement Account (JRA), a defined contribution pension plan the Washington State Administrative Office of the Courts administers.
Departmental InitiativesDRS’ activities are highlighted in the “Director’s Message” on page 3 of this Introductory Section.
Financial Reporting and Internal ControlThis CAFR has been prepared to conform to the principles of accounting and reporting established by the Governmental Accounting Standards Board (GASB). The basic financial statements are presented in accordance with guidelines established by GASB Statement No. 67, Financial Reporting for Pension Plans, and other authoritative accounting criteria. Specific accounting policies are detailed in the “Notes to the Financial Statements.”
DRS’ management is responsible for establishing and
Letter of Transmittal
STATE OF WASHINGTON DEPARTMENT
OF RETIREMENT SYSTEMSPO Box 48380 • Olympia, WA 98504-8380

Comprehensive Annual Financial Report — Introductory Section s DRS 9
maintaining an internal control structure designed to protect the assets of the retirement systems from loss, theft and misuse and to compile reliable accounting data to allow for the preparation of financial statements in conformity with generally accepted accounting principles.
The internal control structure is designed to provide reasonable, but not absolute, assurance that these objectives are met. The concept of reasonable assurance recognizes that: (1) the cost of a control should not exceed the benefits likely to be derived and (2) the valuation of costs and benefits requires estimates and judgments.
FundingThe intent of public pension funding in Washington is to provide a dependable and systematic process for financing the benefits the retirement systems provide. Measurement of funding status indicates how well that goal is being met.
There are two standard indicators of funding status: the funding ratio and the existence of an unfunded liability. Both measure the benefit obligations, or liabilities, of a plan against its assets. If the funding level is adequate, the ratio of total accumulated assets to total liabilities will be larger and more funds will be available for investment purposes. Also, an adequate funding level gives members assurance that their pension benefits are secure.
The actuarial value of assets available as of the latest actuarial date for all systems is $71.5 billion. The accrued liability is $83.6 billion.
The accrued liability exceeds the net actuarial value of assets available for benefits by $12 billion. The ratio of assets to liabilities is 86%, compared to 87% last year. Current contribution rates remain in keeping with the goal of attaining a funding ratio of 100% by the amortization dates applicable to each plan, as required by Chapter 41.45 RCW. Valuations are performed for DRS-administered retirement systems on a yearly (July 1 through June 30) basis. The Office of the State Actuary prepares these calculations. Additional actuarial information is included in the Actuarial Section of this CAFR.
InvestmentsIn accordance with RCW 43.33A.110, the Washington State Investment Board (WSIB) manages the pension trust fund portfolio to maximize return at a prudent level of risk.
The WSIB establishes asset allocation targets that constitute the board’s view of a prudent and well-reasoned approach to the management of the entrusted funds. At any given time, the asset mix might deviate from the target; deviations greater than predetermined acceptable levels require rebalancing. The goal of rebalancing is to meet the target allocation within consideration of the other remaining asset classes.
Most pension funds are invested in the Commingled Trust Fund (CTF), a diversified pool of investments. For fiscal year 2016, the CTF investments provided a 2.7% rate of return. The annualized rate of return was 8.0% over the past three years and 7.5% over the past five years.
A listing of investment professionals who provide services to the WSIB begins on page 109 in the Investment Section of this CAFR. Further investment information is included in the Investment Section of this CAFR.
Professional AwardThe Government Finance Officers Association of the United States and Canada (GFOA) awarded a Certificate of Achievement for Excellence in Financial Reporting to DRS for its CAFR for the fiscal year ended June 30, 2015.
This was the 21st consecutive year DRS has earned this prestigious award. To be awarded a Certificate of Achievement, a government must publish an easily readable and efficiently organized report that satisfies both generally accepted accounting principles and applicable legal requirements.
A Certificate of Achievement is valid for a period of one year. We believe our current CAFR continues to meet the Certificate of Achievement program’s requirements, and we are submitting it to the GFOA to determine its eligibility.
Letter of Transmittal (cont.)
10 DRS s Introductory Section — Comprehensive Annual Financial Report
AcknowledgmentsThis report was made possible by the team members of DRS, based in part on information provided by the Office of Financial Management, the Office of the State Actuary, the Office of the State Treasurer and the Washington State Investment Board. We appreciate their assistance.
We would also like to take this opportunity to acknowledge Marcie Frost, who concluded her service with DRS in August. Marcie served in numerous roles at DRS over the past 15 years, including the last four years as agency director. Her leadership set DRS on
the path to high levels of customer satisfaction and team member engagement, a journey that continues today and into the future. Her service to DRS, public employees and the state of Washington is deeply appreciated.
Respectfully submitted,
Tracy Guerin Director
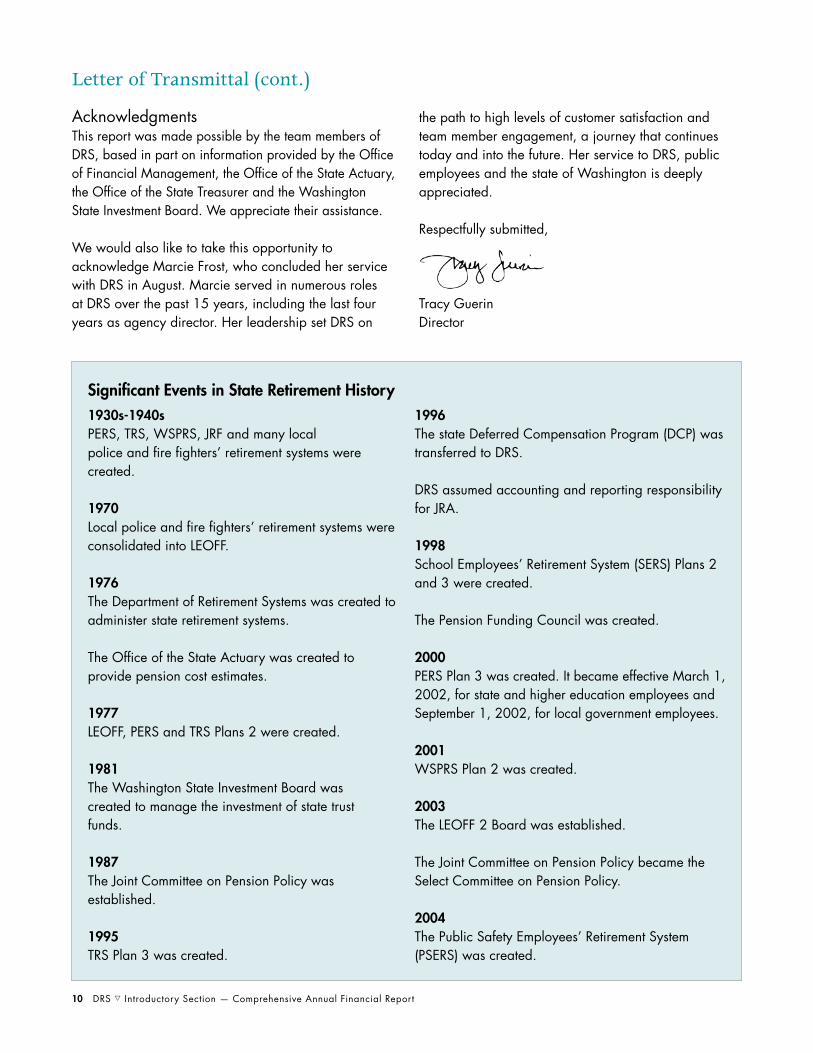
1930s-1940sPERS, TRS, WSPRS, JRF and many local police and fire fighters’ retirement systems were created.
1970Local police and fire fighters’ retirement systems were consolidated into LEOFF.
1976The Department of Retirement Systems was created to administer state retirement systems.
The Office of the State Actuary was created to provide pension cost estimates.
1977LEOFF, PERS and TRS Plans 2 were created.
1981The Washington State Investment Board was created to manage the investment of state trust funds.
1987The Joint Committee on Pension Policy was established.
1995TRS Plan 3 was created.
1996The state Deferred Compensation Program (DCP) was transferred to DRS.
DRS assumed accounting and reporting responsibility for JRA.
1998School Employees’ Retirement System (SERS) Plans 2 and 3 were created.
The Pension Funding Council was created.
2000PERS Plan 3 was created. It became effective March 1, 2002, for state and higher education employees and September 1, 2002, for local government employees.
2001WSPRS Plan 2 was created.
2003The LEOFF 2 Board was established.
The Joint Committee on Pension Policy became the Select Committee on Pension Policy.
2004The Public Safety Employees’ Retirement System (PSERS) was created.
Significant Events in State Retirement History
Letter of Transmittal (cont.)

Comprehensive Annual Financial Report — Introductory Section s DRS 11
Professional Award

12 DRS s Introductory Section — Comprehensive Annual Financial Report
All Pension SystemsSB 5435: This law allows the automatic enrollment of new state employees in the Washington State Deferred Compensation Program (DCP) with a default contribution rate of 3%. Employees will have the opportunity to opt out or set their own contribution rates. The law also gives DRS the option to offer a 401(a) money-purchase retirement savings plan.
SB 6091: This law clarifies the definition of “slayer” to include people found not guilty by reason of insanity. A slayer isn’t entitled to receive a retirement benefit from the person he or she killed.
PERSSB 6523: This law allows an employee providing emergency medical services to a consortium of local governments in Snohomish County to choose to establish service credit in PERS for service performed before July 23, 2003. The employee must pay both the employer and employee contributions, as DRS calculates, within five years of choosing to establish service credit.
TRSSB 6194: This law allows charter school employees to be members of the state retirement systems as long as DRS receives determination from the IRS that the inclusion of those employees won’t jeopardize the status of the systems as government plans.
SB 6455: This law allows TRS members who retired using the 2008 Early Retirement Factors (ERFs) to return to work as substitute teachers for up to 867 hours without suspending their benefits. This provision is in effect from June 9, 2016, through July 31, 2020.
LEOFFSB 5873: This law gives a LEOFF Plan 1 retiree a chance to name as survivor a spouse he or she married after retiring. To qualify, the marriage needs to have spanned at least two years before Sept. 1, 2015.
SB 6263: This law impacts LEOFF Plan 2 members who are called into eligible federal service to respond to natural disasters or other federal emergencies. It provides them with benefit protections similar to the ones provided to members of the National Guard or military reserves who are called during a time of war.
LEOFF/WSPRSSB 6264: This law allows retirees of LEOFF and WSPRS a six-month window to purchase annuities. The annuities may be purchased between January 1 and June 1, 2017.
2016 Washington State Legislative Actions
In 2016, the Washington state Legislature passed eight pension-related bills that Gov. Jay Inslee signed into law. These laws are described below.
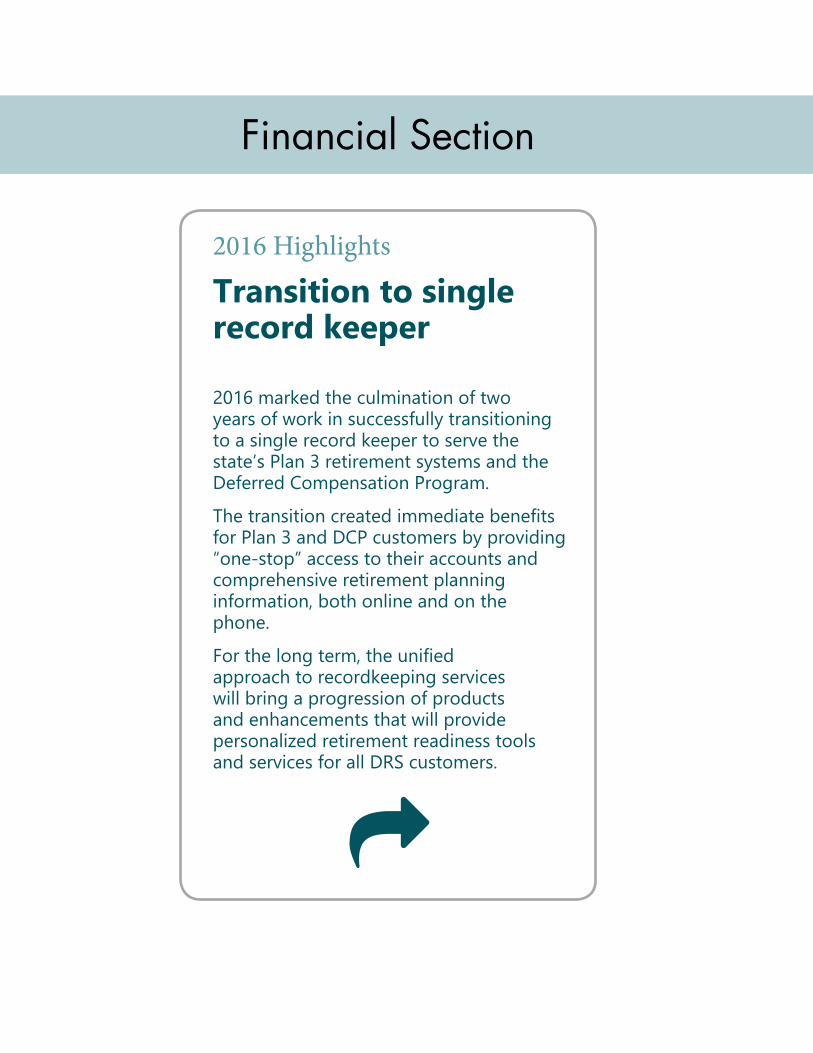
2016 Highlights
Transition to single record keeper
2016 marked the culmination of two years of work in successfully transitioning to a single record keeper to serve the state’s Plan 3 retirement systems and the Deferred Compensation Program.
The transition created immediate benefits for Plan 3 and DCP customers by providing “one-stop” access to their accounts and comprehensive retirement planning information, both online and on the phone.
For the long term, the unified approach to recordkeeping services will bring a progression of products and enhancements that will provide personalized retirement readiness tools and services for all DRS customers.
Financial Section

Financial Section

Comprehensive Annual Financial Report — Financial Section s DRS 15
INDEPENDENT AUDITORS' REPORT Ms. Tracy Guerin, Director Washington State Department of Retirement Systems Olympia, Washington Report on the Financial Statements We have audited the accompanying financial statements (including the individual fund financial statements) of the Washington State Department of Retirement Systems (DRS), which comprise the statement of fiduciary net position as of June 30, 2016, and the related statement of changes in fiduciary net position for the year then ended, and the related notes to the financial statements. Management’s Responsibility for the Financial Statements Management is responsible for the preparation and fair presentation of these financial statements in accordance with accounting principles generally accepted in the United States of America; this includes the design, implementation, and maintenance of internal control relevant to the preparation and fair presentation of financial statements that are free from material misstatement, whether due to fraud or error. Auditors’ Responsibility Our responsibility is to express an opinion on these financial statements based on our audit. We conducted our audit in accordance with auditing standards generally accepted in the United States of America. Those standards require that we plan and perform the audit to obtain reasonable assurance about whether the financial statements are free from material misstatement. An audit involves performing procedures to obtain audit evidence about the amounts and disclosures in the financial statements. The procedures selected depend on the auditors’ judgment, including the assessment of the risks of material misstatement of the financial statements, whether due to fraud or error. In making those risk assessments, the auditor considers internal control relevant to the entity’s preparation and fair presentation of the financial statements in order to design audit procedures that are appropriate in the circumstances, but not for the purpose of expressing an opinion on the effectiveness of the entity’s internal control. Accordingly, we express no such opinion. An audit also includes evaluating the appropriateness of accounting policies used and the reasonableness of significant accounting estimates made by management, as well as evaluating the overall presentation of the financial statements. We believe that the audit evidence we have obtained is sufficient and appropriate to provide a basis for our audit opinion. OpinionIn our opinion, the financial statements referred to above present fairly, in all material respects, DRS’ fiduciary net position as of June 30, 2016, and the changes in its fiduciary net position for the year then ended, in accordance with accounting principles generally accepted in the United States of America. Also, in our opinion, the financial statements present fairly in all material respects, the fiduciary net position of each of the individual funds of DRS as of June 30, 2016, and the changes in fiduciary net position of such funds for the year then ended, in accordance with accounting principles generally accepted in the United States of America.
CliftonLarsonAllen LLP www.CLAconnect.com
An independent member of Nexia International
Independent Auditors’ Report

16 DRS s Financial Section — Comprehensive Annual Financial Report
Independent Auditors’ Report (cont.)
Report on Summarized Comparative Information We have previously audited the DRS’ 2015 financial statements, and we expressed an unmodified audit opinion on those audited financial statements in our report dated October 15, 2015. In our opinion, the summarized comparative information presented herein as of and for the year ended June 30, 2015 is consistent, in all material respects, with the audited financial statements from which it has been derived. Other Matters Required Supplementary Information Accounting principles generally accepted in the United States of America require that the Management’s Discussion and Analysis, the Required Supplementary Schedules of Changes in Net Pension Liability, Net Pension Liability, Employer Contributions and Investment Returns and the related Notes to Required Supplementary Information, as listed in the table of contents, be presented to supplement the basic financial statements. Such information, although not a part of the basic financial statements, is required by the Governmental Accounting Standards Board, who considers it to be an essential part of financial reporting for placing the financial statements in an appropriate operational, economic, or historical context. We have applied certain limited procedures to the required supplementary information in accordance with auditing standards generally accepted in the United States of America, which consisted of inquiries of management about the methods of preparing the information and comparing the information for consistency with management’s responses to our inquiries, the basic financial statements, and other knowledge we obtained during our audit of the basic financial statements. We do not express an opinion or provide any assurance on the information because the limited procedures do not provide us with sufficient evidence to express an opinion or provide any assurance. Other Information Our audit was conducted for the purpose of forming an opinion on the financial statements that collectively comprise the DRS’ basic financial statements. The Schedules of Administrative Expenses, Investment Expenses – Pension Trust Funds and Payments to Consultants (Supporting Schedules), as listed in the table of contents, are presented for the purpose of additional analysis and are not a required part of the financial statements. The Supporting Schedules are the responsibility of management and were derived from and relate directly to the underlying accounting and other records used to prepare the financial statements. Such information has been subjected to the auditing procedures applied in the audit of the financial statements and certain additional procedures, including comparing and reconciling such information directly to the underlying accounting and other records used to prepare the financial statements or to the financial statements themselves, and other additional procedures in accordance with auditing standards generally accepted in the United States of America. In our opinion, the information is fairly stated, in all material respects, in relation to the financial statements as a whole. The Introductory, Investment, Actuarial and Statistical Sections, as listed in the table of contents, have not been subjected to the auditing procedures applied in the audit of the financial statements, and accordingly, we do not express an opinion or provide any assurance on them.
a CliftonLarsonAllen LLP
Baltimore, Maryland October 14, 2016

Comprehensive Annual Financial Report — Financial Section s DRS 17
This discussion and analysis provides an overview of financial activities of the Washington State Department of Retirement Systems (DRS) for the fiscal year ended June 30, 2016. Please read it in conjunction with the “Letter of Transmittal,” beginning on page 8, and the financial statements, beginning on page 20.
Financial Highlights• The overall financial position of DRS improved
during the year; the fiduciary net position of all the pension funds increased $1,018.0 million.
• The covered payroll requiring both employee and employer pension contributions reported during the year totaled $18,781.1 million, representing a 5.6% increase over the previous year.
• Employer contributions totaled $2,025.9 million, and member contributions (including restorations) totaled $1,342.6 million, representing increases of 26% and 17%, respectively, over the previous fiscal year.
• Net investment earnings (net appreciation/depreciation in the fair value of investments plus interest and dividend income less investment expenses) decreased $1,760.2 million to $1,967.2 million.
• Pension benefits paid to retirees and beneficiaries increased $204.8 million, bringing the total benefit payments to $3,856.5 million. Refunds of contributions paid to former retirement system members increased 1% to $740.3 million.
• Administrative expenses totaled $35.6 million and represented a 12% increase over the last fiscal year.
Overview of the Financial StatementsDRS’ financial statements consist of the following components: basic financial statements, notes to the financial statements, required supplementary information and other supporting schedules.
Basic Financial Statements: The basic financial statements are fund financial statements and include a “Statement of Fiduciary Net Position” and a “Statement of Changes in Fiduciary Net Position.” The fiduciary funds include defined benefit and defined contribution
pension trust funds and the Deferred Compensation Program trust fund.
The “Statement of Fiduciary Net Position” reports the assets, liabilities and resulting net position available for pension and other benefits as of June 30, 2016. The “Statement of Changes in Fiduciary Net Position” reports the additions to, deductions from and resulting change in fiduciary net position for the fiscal year.
Notes to the Financial Statements: The notes to the financial statements are an integral part of the financial statements and include additional information not readily evident in the statements. Note 1 provides a summary of significant accounting policies and plan asset matters. Note 2 provides a general description of each retirement plan and includes membership information, employer net pension liability and actuarial assumptions.
Required Supplementary InformationTwo years of financial statements alone might not provide sufficient information to properly evaluate the long-term financial position of the plans. The required supplementary information enhances that perspective and consists of four schedules built prospectively to present 10-year historical trends.
The “Schedule of Net Pension Liability” presents each pension plan’s net pension liability. The “Schedule of Changes in Net Pension Liability” include current fiscal year and prior fiscal year information about the changes in the net pension liability of each pension plan. The “Schedule of Investment Returns” presents the annual money-weighted rate of return, net of investment expense, for each pension plan. The “Schedule of Contributions” presents information about the annual required contributions of employers, the contributions made in relation to that requirement, covered employee payroll and the contributions as a percentage of covered payroll.
Supporting Schedules and Other Financial InformationThe supporting schedules provide additional detailed information that is useful in evaluating the condition of the plans DRS administers.
Management’s Discussion and Analysis

18 DRS s Financial Section — Comprehensive Annual Financial Report
These schedules include information on administrative expenses, investment expenses and payments to consultants.
Financial Analysis of DRS Funds
Analysis of Fiduciary Net PositionDollars in Millions
Fiduciary Net Position
Fiscal Year 2016
Fiscal Year 2015
Increase (Decrease)
Amount
Increase (Decrease) Percentage
Assets
Cash and Pooled Investments
$ 42.8 $ 40.8 $ 2.0 5.0%
Receivables 3,470.3 2,641.3 829.0 31.0%
Capital Assets, Net of Depreciation
0.2 0.2 – 0.0%
Investments, Noncurrent
90,648.2 90,284.2 364.0 0.4%
Other Assets 1.4 1.3 0.1 8.0%
Total Assets 94,162.9 92,967.8 1,195.1 1.0%
Liabilities
Obligations Under Securities Lending Agreements
683.1 843.1 (160.0) (19.0)%
Other Short-Term Liabilities
2,986.0 2,648.9 337.1 13.0%
Long-Term Obligations
1.4 1.4 – 0.0%
Total Liabilities 3,670.5 3,493.4 177.1 5.0%
Fiduciary Net Position $ 90,492.4 $ 89,474.4 $ 1,018.0 1.0%
The fiduciary net position increased by $1,018.0 million in fiscal year 2016 and totaled $90,492.4 million at fiscal year-end. The increase was mostly due to investment returns and an increase of employer and employee contributions during the fiscal year.
Total trust-fund assets as of June 30, 2016, were $94,162.9 million, representing an increase of $1,195.1 million, or 1% over the previous fiscal year. The trust-fund asset growth was primarily due to investment returns and the contribution rate increase during the fiscal year, which resulted in a substantial increase to receivables. Total investments increased by $364.0 million, or 0.4%. Total trust-fund liabilities as of June 30, 2016, were $3,670.5 million, representing an increase of $177.1 million, or 5%, over the previous year. The increase in liabilities is mostly attributable to
pending investment trades.
Analysis of Changes in Fiduciary Net PositionDollars in Millions
Changes in Fiduciary Net Position
Fiscal Year 2016
Fiscal Year 2015
Increase (Decrease)
Amount
Increase (Decrease) Percentage
Additions
Employer Contributions
$ 2,025.9 $ 1,611.1 $ 414.8 26.0%
Member Contributions
1,342.6 1,146.5 196.1 17.0%
State Contributions 70.4 68.9 1.5 2.0%
Participant Contributions
213.5 208.4 5.1 2.0%
Net Investment Income (Loss)
1,967.2 3,727.4 (1,760.2) (47.0)%
Charges for Services
36.8 34.4 2.4 7.0%
Transfers from Other Pension Plans
5.9 4.8 1.1 23.0%
Total Additions 5,662.3 6,801.5 (1,139.2) (17.0)%
Deductions
Benefits 3,856.5 3,651.7 204.8 6.0%
Refunds of Contributions
740.3 731.7 8.6 1.0%
Transfers to Other Pension Plans
5.9 4.8 1.1 23.0%
Transfers to Other Funds
6.0 – 6.0 100.0%
Administrative Expenses
35.6 31.7 3.9 12.0%
Total Deductions 4,644.3 4,419.9 224.4 5.0%
Net Increase/(Decrease )
1,018.0 2,381.6 (1,363.6) (57.0)%
Fiduciary Net Position: July 1
89,474.4 87,092.8 2,381.6 3.0%
Fiduciary Net Position: June 30
$ 90,492.4 $ 89,474.4 $ 1,018.0 1.0%
Additions to the retirement trust funds primarily consist of contributions from employers, active system members and the state and investment earnings. Additions to the deferred compensation trust fund consist of participant contributions and investment earnings.
Total trust-fund additions (excluding plan transfers) for fiscal year 2016 totaled $5,656.4 million, a decrease of $1,140.3 million from fiscal year 2015. This was primarily due to the $1,760.2 million decrease in net income from investment activities. The investment performance yielded a 2.7% total return for the retirement funds’ Commingled Trust Fund (CTF), compared to the 4.9% return of the previous year.
Management’s Discussion and Analysis (cont.)

Comprehensive Annual Financial Report — Financial Section s DRS 19
Employer contributions increased $414.8 million, or 26%, and totaled $2,025.9 million. This increase was the result of increased employment, salaries, and employer and employee contribution rates. Total covered payroll was $18,781.1 million and represented a 5.6% increase over the previous year.
Member contributions include both regular and restoration contributions as well as service credit purchases. Total contributions increased $196.1 million, or 17%, over the previous year and totaled $1,342.6 million for fiscal year 2016.
• Regular member contributions increased $186.9 million to $1,277.7 million and reflected increased employment, salaries and member contribution rates.
• Other contributions increased $9.3 million to $64.9 million during the current year.
State contributions increased $1.5 million to $70.4 million in fiscal year 2016. The increase was in state general-fund allocations for Plan 2 of the Law Enforcement Officers’ and Fire Fighters' Retirement System (LEOFF), which moved from $58.3 million to $60.4 million. State contributions to the Judicial Retirement System (JRS) decreased to $9.5 million, and the Judges’ Retirement Fund (JRF) received $0.5 million during the current year.
Participant contributions to the Deferred Compensation Program (DCP) increased 2% over the prior year and totaled $213.5 million in fiscal year 2016. As of June 30, 2016, the number of active and contributing DCP participants was 37,663 and represented an increase of 834, or 2% over the previous year.
Transfers from and to other pension plans was at $5.9 million in fiscal year 2016. Other additions increased by $0.01 million to $0.08 million in fiscal year 2016.
Deductions to the retirement trust funds consist of the payment of benefits to retirees and beneficiaries, the refund of contributions to former retirement system members, and the cost of administering the retirement systems. Benefit payments to members include both pension and annuity benefits.
Deductions to the deferred compensation trust fund consist of payments to plan participants and administrative expenses.
Expenses incurred by the Washington State Investment Board (WSIB) for the investment of trust funds are funded from earnings on investments.
Total trust fund deductions (excluding plan transfers) for fiscal year 2016 were $4,638.3 million, an increase of $218.4 million, or 5%, over fiscal year 2015. This growth resulted primarily from an increase in benefits paid to retirees and beneficiaries. Benefit payments increased $204.8 million, or 6%, due to an increase in the number of retirees during the year, the annual cost-of-living adjustments that increased benefit payouts and the higher salaries of those newly retired.
Total refunds for fiscal year 2016 were $740.3 million, representing an $8.6 million increase from the previous year. Of this increase, $18.5 million can be attributed to employees withdrawing their plan contributions upon terminating public employment and a $9.9 million decrease can be attributed to reduced distributions from DCP for mandatory distributions and other withdrawals from program participants.
Capital AssetsDRS’ investment in capital assets includes furnishings, equipment and improvements other than buildings. As of June 30, 2016, total investment was $2.5 million, with accumulated depreciation of $2.3 million, leaving a net book value of $0.2 million. Additional information can be found in Note 1 to the financial statements.
Other Long-Term ObligationsAt year-end, DRS had $1.4 million in outstanding general long-term obligations. These long-term obligations represent DRS’ liability for employees’ accumulated annual and sick leave. More information can be found in Note 1 to the financial statements.
Contacting DRS’ Financial ManagementThis CAFR is designed to provide a general overview of DRS’ finances. If you have questions about this report or need more information, contact DRS at PO Box 48380, Olympia, WA 98504-8380.
Management’s Discussion and Analysis (cont.)

20 DRS s Financial Section — Comprehensive Annual Financial Report
Statement of Fiduciary Net Position
Pension Trust Funds by Plan June 30, 2016, with Comparative Totals for June 30, 2015 — Page 1 of 4
Pension Trust
Dollars in ThousandsPERS
Plan 1PERS
Plan 2/3
PERS Plan 3Defined
ContributionSERS
Plan 2/3
SERS Plan 3 Defined
Contribution
Assets
Cash and Pooled Investments $ 3,072 $ 7,319 $ 308 $ 2,764 $ 1,147
Receivables
Due from Other Governments 3,560 72,336 5,525 14,956 5,833
Member Accounts Receivable (Net of Allowance) 588 261 – 15 –
Interest and Dividends 26,104 111,965 5,444 15,489 4,670
Investments Trades Pending Receivable — Short Term 243,085 1,044,125 50,756 144,394 43,547
Due from Pension Funds 43,940 2,071 – 558 –
Due from Other Washington State Agencies 3 3 – – –
Total Receivables 317,280 1,230,761 61,725 175,412 54,050
Capital Assets, Net of Depreciation 46 42 – 8 –
Investments
Equity in CTF 6,897,925 29,614,802 1,439,619 4,095,562 1,235,055
Liquidity 157,790 698,273 41,268 100,934 33,265
Other Noncurrent Investments – – 991,774 – 425,680
Collateral Held Under Securities Lending Agreements 59,004 251,928 12,224 34,922 10,487
Total Investments 7,114,719 30,565,003 2,484,885 4,231,418 1,704,487
Other Assets 333 310 – 56 –
Total Assets 7,435,450 31,803,435 2,546,918 4,409,658 1,759,684
Liabilities
Obligations Under Securities Lending Agreements 59,004 251,928 12,224 34,922 10,487
Accounts Payable 1,709 5,804 4,811 797 4,387
Investment Trades Pending Payable — Short Term 239,094 1,028,982 47,923 142,026 42,829
Due to Other Governments 5,963 3,516 – 752 –
Due to Pension Funds 7 27,233 1,545 16,566 463
Due to Washington State Agencies 106 102 – 13 –
Other Short-Term Liabilities – 9 – 15 –
Other Long-Term Obligations 333 310 – 56 –
Accrued Salaries 173 163 – 29 –
Unearned Revenues 56 336 – 1 –
Total Liabilities 306,445 1,318,383 66,503 195,177 58,166
Fiduciary Net Position
Pension Plans 7,129,005 30,485,052 2,480,415 4,214,481 1,701,518
DCP – – – – –
Total Fiduciary Net Position $ 7,129,005 $ 30,485,052 $ 2,480,415 $ 4,214,481 $ 1,701,518
The accompanying notes are an integral part of this statement.

Comprehensive Annual Financial Report — Financial Section s DRS 21
Statement of Fiduciary Net Position (cont.)
Pension Trust Funds by Plan June 30, 2016, with Comparative Totals for June 30, 2015 — Page 2 of 4
Pension Trust
Dollars in ThousandsPSERS Plan 2
TRSPlan 1
TRS Plan 2/3
TRS Plan 3 Defined
ContributionLEOFF Plan 1
Assets
Cash and Pooled Investments $ 568 $ 2,634 $ 4,231 $ 5,125 $ 1,856
Receivables
Due from Other Governments 2,443 1,089 40,796 26,201 411
Member Accounts Receivable (Net of Allowance) – 172 110 – 186
Interest and Dividends 1,456 20,238 39,861 16,681 19,771
Investments Trades Pending Receivable — Short Term 13,570 188,448 371,608 155,527 184,268
Due from Pension Funds 5 98,607 2,505 – 266
Due from Other Washington State Agencies – 2 1 – 1
Total Receivables 17,474 308,556 454,881 198,409 204,903
Capital Assets, Net of Depreciation – 40 23 – 22
Investments
Equity in CTF 388,300 5,349,038 10,539,999 4,411,245 5,228,445
Liquidity 8,809 122,325 269,330 124,737 119,611
Other Noncurrent Investments – – – 2,792,850 –
Collateral Held Under Securities Lending Agreements 3,288 45,731 89,837 37,455 44,528
Total Investments 400,397 5,517,094 10,899,166 7,366,287 5,392,584
Other Assets 3 288 170 – 157
Total Assets 418,442 5,828,612 11,358,471 7,569,821 5,599,522
Liabilities
Obligations Under Securities Lending Agreements 3,288 45,731 89,837 37,455 44,528
Accounts Payable 73 1,238 2,062 10,068 1,378
Investment Trades Pending Payable — Short Term 13,348 185,354 365,506 152,973 181,243
Due to Other Governments 2 6,011 1,516 – 1
Due to Pension Funds 983 5 98,838 2,216 4
Due to Washington State Agencies 2 66 41 – 37
Other Short-Term Liabilities – – 31 – –
Other Long-Term Obligations 3 288 170 – 157
Accrued Salaries 2 148 87 – 80
Unearned Revenues – 500 123 – –
Total Liabilities 17,701 239,341 558,211 202,712 227,428
Fiduciary Net Position
Pension Plans 400,741 5,589,271 10,800,260 7,367,109 5,372,094
DCP – – – – –
Total Fiduciary Net Position $ 400,741 $ 5,589,271 $ 10,800,260 $ 7,367,109 $ 5,372,094
The accompanying notes are an integral part of this statement.

22 DRS s Financial Section — Comprehensive Annual Financial Report
Statement of Fiduciary Net Position (cont.)
The accompanying notes are an integral part of this statement.
Pension Trust Funds by Plan June 30, 2016, with Comparative Totals for June 30, 2015 — Page 3 of 4
Pension Trust
Dollars in Thousands LEOFF Plan 2WSPRS
Plan 1/2 JRS JRF
Assets
Cash and Pooled Investments $ 2,104 $ 829 $ 6,807 $ 585
Receivables
Due from Other Governments 15,207 546 – –
Member Accounts Receivable (Net of Allowance) 72 1 2 –
Interest and Dividends 37,480 4,038 6 –
Investments Trades Pending Receivable — Short Term 349,500 37,635 – –
Due from Pension Funds 161 32 – –
Due from Other Washington State Agencies 1 – – –
Total Receivables 402,421 42,252 8 –
Capital Assets, Net of Depreciation 13 3 – –
Investments
Equity in CTF 9,927,219 1,068,266 – –
Liquidity 226,500 24,430 – –
Other Noncurrent Investments – – – –
Collateral Held Under Securities Lending Agreements 84,304 9,110 222 19
Total Investments 10,238,023 1,101,806 222 19
Other Assets 95 19 – –
Total Assets 10,642,656 1,144,909 7,037 604
Liabilities
Obligations Under Securities Lending Agreements 84,304 9,110 222 19
Accounts Payable 2,432 226 1 –
Investment Trades Pending Payable — Short Term 343,761 37,018 – –
Due to Other Governments 29 229 30 2
Due to Pension Funds 276 9 – –
Due to Washington State Agencies 33 5 – –
Other Short-Term Liabilities – – – –
Other Long-Term Obligations 95 19 – –
Accrued Salaries 53 10 – –
Unearned Revenues 313 8 – –
Total Liabilities 431,296 46,634 253 21
Fiduciary Net Position
Pension Plans 10,211,360 1,098,275 6,784 583
DCP – – – –
Total Fiduciary Net Position $ 10,211,360 $ 1,098,275 $ 6,784 $ 583

Comprehensive Annual Financial Report — Financial Section s DRS 23
Statement of Fiduciary Net Position (cont.)
The accompanying notes are an integral part of this statement.
Pension Trust Funds by Plan June 30, 2016, with Comparative Totals for June 30, 2015 — Page 4 of 4
Pension Trust Totals
Dollars in ThousandsJRA Defined Contribution
Deferred Compensation
Program June 30, 2016 June 30, 2015
Assets
Cash and Pooled Investments $ 9 $ 3,392 $ 42,750 $ 40,779
Receivables
Due from Other Governments – – 188,903 175,762
Member Accounts Receivable (Net of Allowance) 2 2,144 3,553 3,755
Interest and Dividends – 2 303,205 229,634
Investments Trades Pending Receivable — Short Term – – 2,826,463 2,178,827
Due from Pension Funds – – 148,145 53,192
Due from Other Washington State Agencies – – 11 157
Total Receivables 2 2,146 3,470,280 2,641,327
Capital Assets, Net of Depreciation – – 197 210
Investments
Equity in CTF – – 80,195,475 79,714,373
Liquidity – – 1,927,272 1,908,916
Other Noncurrent Investments 11,039 3,621,024 7,842,367 7,817,770
Collateral Held Under Securities Lending Agreements – 110 683,169 843,162
Total Investments 11,039 3,621,134 90,648,283 90,284,221
Other Assets – – 1,431 1,353
Total Assets 11,050 3,626,672 94,162,941 92,967,890
Liabilities
Obligations Under Securities Lending Agreements – 110 683,169 843,162
Accounts Payable – 567 35,553 32,358
Investment Trades Pending Payable — Short Term – – 2,780,057 2,542,543
Due to Other Governments – – 18,051 17,103
Due to Pension Funds – – 148,145 53,192
Due to Washington State Agencies – 11 416 541
Other Short-Term Liabilities – 1,546 1,601 1,435
Other Long-Term Obligations – – 1,431 1,353
Accrued Salaries – 47 792 724
Unearned Revenues – – 1,337 1,026
Total Liabilities – 2,281 3,670,552 3,493,437
Fiduciary Net Position
Pension Plans 11,050 – 86,867,998 85,860,530
DCP – 3,624,391 3,624,391 3,613,923
Total Fiduciary Net Position $ 11,050 $ 3,624,391 $ 90,492,389 $ 89,474,453

24 DRS s Financial Section — Comprehensive Annual Financial Report
Statement of Changes in Fiduciary Net Position
The accompanying notes are an integral part of this statement.
Pension Trust Funds by Plan June 30, 2016, with Comparative Totals for June 30, 2015 — Page 1 of 4
Pension Trust
Dollars in ThousandsPERS
Plan 1PERS
Plan 2/3
PERS Plan 3Defined
ContributionSERS
Plan 2/3
SERS Plan 3 Defined
Contribution
Additions
Retirement Contributions
Employer $ 595,982 $ 563,328 $ – $ 115,480 $ –
Plan Member 13,663 472,528 119,988 45,946 67,713
State – – – – –
Plan Member Restorations 4,794 24,745 – 1,209 –
Total Retirement Contributions 614,439 1,060,601 119,988 162,635 67,713
Participant Contributions – – – – –
Investment Income
Net Appreciation (Depreciation) in Fair Value of Investments 21,749 168,034 8,847 23,541 8,107
Interest and Other Investment Income 117,349 482,056 25,493 66,448 21,149
Dividends 46,465 192,607 9,340 26,580 8,061
Less: Investment Expenses (29,313) (120,667) (6,651) (16,834) (5,290)
Subtotal Net Investment Income/(Loss) 156,250 722,030 37,029 99,735 32,027
Securities Lending Income
Securities Lending Income 1,223 5,048 245 696 213
Less: Costs of Lending Securities (390) (1,602) (78) (220) (69)
Net Securities Lending Income 833 3,446 167 476 144
Total Net Investment Income/(Loss) 157,083 725,476 37,196 100,211 32,171
Charges for Services 2,830 12,702 375 2,019 330
Transfers from Other Pension Plans 117 360 2,165 27 1,102
Miscellaneous 6 30 – 5 –
Total Additions 774,475 1,799,169 159,724 264,897 101,316
Deductions
Benefits 1,198,836 776,213 – 112,753 –
Contribution Refunds 4,373 36,302 92,444 2,494 85,019
Annuity Payments – – 4,112 – 2,610
Transfers to Other Pension Plans 27 2,463 567 833 311
Transfers to Other Funds 493 2,277 – 409 –
Administrative Expenses 2,819 12,023 375 1,782 330
Total Deductions 1,206,548 829,278 97,498 118,271 88,270
Net Increase (Decrease) (432,073) 969,891 62,226 146,626 13,046
Fiduciary Net Position
Beginning of Year: July 1 7,561,078 29,515,161 2,418,189 4,067,855 1,688,472
End of Year: June 30 $ 7,129,005 $ 30,485,052 $ 2,480,415 $ 4,214,481 $ 1,701,518

Comprehensive Annual Financial Report — Financial Section s DRS 25
Statement of Changes in Fiduciary Net Position (cont.)
The accompanying notes are an integral part of this statement.
Pension Trust Funds by Plan June 30, 2016, with Comparative Totals for June 30, 2015 — Page 2 of 4
Pension Trust
Dollars in ThousandsPSERS Plan 2
TRSPlan 1
TRS Plan 2/3
TRS Plan 3 Defined
ContributionLEOFF Plan 1
Additions
Retirement Contributions
Employer $ 20,058 $ 315,934 $ 316,022 $ – $ –
Plan Member 21,134 5,059 64,263 309,813 –
State – – – – –
Plan Member Restorations 14 3,743 4,324 – 837
Total Retirement Contributions 41,206 324,736 384,609 309,813 837
Participant Contributions – – – – –
Investment Income
Net Appreciation (Depreciation) in Fair Value of Investments 3,108 11,783 63,006 39,620 19,273
Interest and Other Investment Income 6,028 92,454 171,196 75,414 88,086
Dividends 2,421 36,519 68,027 28,752 34,974
Less: Investment Expenses (1,504) (23,105) (43,337) (20,155) (22,008)
Subtotal Net Investment Income/(Loss) 10,053 117,651 258,892 123,631 120,325
Securities Lending Income
Securities Lending Income 63 962 638 1,897 920
Less: Costs of Lending Securities (19) (307) (566) (239) (293)
Net Securities Lending Income 44 655 72 1,658 627
Total Net Investment Income/(Loss) 10,097 118,306 258,964 125,289 120,952
Charges for Services 159 2,218 6,046 1,159 2,131
Transfers from Other Pension Plans 1 – 71 1,585 –
Miscellaneous – 5 16 – 5
Total Additions 51,463 445,265 649,706 437,846 123,925
Deductions
Benefits 630 912,055 218,011 – 360,484
Contribution Refunds 2,647 1,182 2,971 289,785 538
Annuity Payments – 12,322 – 10,034 –
Transfers to Other Pension Plans 62 – 679 938 –
Transfers to Other Funds 28 386 1,255 – 371
Administrative Expenses 150 2,015 5,321 1,158 1,938
Total Deductions 3,517 927,960 228,237 301,915 363,331
Net Increase (Decrease) 47,946 (482,695) 421,469 135,931 (239,406)
Fiduciary Net Position
Beginning of Year: July 1 352,795 6,071,966 10,378,791 7,231,178 5,611,500
End of Year: June 30 $ 400,741 $ 5,589,271 $ 10,800,260 $ 7,367,109 $ 5,372,094

26 DRS s Financial Section — Comprehensive Annual Financial Report
Statement of Changes in Fiduciary Net Position (cont.)
The accompanying notes are an integral part of this statement.
Pension Trust Funds by Plan June 30, 2016, with Comparative Totals for June 30, 2015 — Page 3 of 4
Pension Trust
Dollars in ThousandsLEOFF Plan 2
WSPRS Plan 1/2 JRS JRF
Additions
Retirement Contributions
Employer $ 92,049 $ 7,044 $ – $ –
Plan Member 151,659 5,895 – –
State 60,375 – 9,500 501
Plan Member Restorations 22,212 3,000 – –
Total Retirement Contributions 326,295 15,939 9,500 501
Participant Contributions – – – –
Investment Income
Net Appreciation (Depreciation) in Fair Value of Investments 57,610 4,864 30 3
Interest and Other Investment Income 161,133 17,735 48 4
Dividends 64,384 7,058 – –
Less: Investment Expenses (40,223) (4,429) – –
Subtotal Net Investment Income/(Loss) 242,904 25,228 78 7
Securities Lending Income
Securities Lending Income 1,685 185 – –
Less: Costs of Lending Securities (535) (59) – –
Net Securities Lending Income 1,150 126 – –
Total Net Investment Income/(Loss) 244,054 25,354 78 7
Charges for Services 4,052 436 3 –
Transfers from Other Pension Plans 23 429 – –
Miscellaneous 9 1 – –
Total Additions 574,433 42,159 9,581 508
Deductions
Benefits 184,067 53,651 9,131 440
Contribution Refunds 6,645 508 – –
Annuity Payments – – – –
Transfers to Other Pension Plans – – – –
Transfers to Other Funds 705 76 – –
Administrative Expenses 5,305 448 2 1
Total Deductions 196,722 54,683 9,133 441
Net Increase (Decrease) 377,711 (12,524) 448 67
Fiduciary Net Position
Beginning of Year: July 1 9,833,649 1,110,799 6,336 516
End of Year: June 30 $ 10,211,360 $ 1,098,275 $ 6,784 $ 583

Comprehensive Annual Financial Report — Financial Section s DRS 27
Statement of Changes in Fiduciary Net Position (cont.)
The accompanying notes are an integral part of this statement.
Pension Trust Funds by Plan June 30, 2016, with Comparative Totals for June 30, 2015 — Page 4 of 4
Pension Trust Totals
Dollars in ThousandsJRA Defined Contribution
Deferred Compensation
Program June 30, 2016 June 30, 2015
Additions
Retirement Contributions
Employer $ 21 $ – $ 2,025,918 $ 1,611,122
Plan Member 21 – 1,277,682 1,090,841
State – – 70,376 68,939
Plan Member Restorations – – 64,878 55,615
Total Retirement Contributions 42 – 3,438,854 2,826,517
Participant Contributions – 213,531 213,531 208,424
Investment Income
Net Appreciation (Depreciation) in Fair Value of Investments (45) 1,967 431,497 2,216,836
Interest and Other Investment Income 37 8,048 1,332,678 1,289,777
Dividends 18 7,174 532,380 526,304
Less: Investment Expenses (15) (5,181) (338,712) (312,736)
Subtotal Net Investment Income/(Loss) (5) 12,008 1,957,843 3,720,181
Securities Lending Income
Securities Lending Income – – 13,775 10,954
Less: Costs of Lending Securities – – (4,377) (3,720)
Net Securities Lending Income – – 9,398 7,234
Total Net Investment Income/(Loss) (5) 12,008 1,967,241 3,727,415
Charges for Services – 2,317 36,777 34,415
Transfers from Other Pension Plans – – 5,880 4,754
Miscellaneous – 3 80 67
Total Additions 37 227,859 5,662,363 6,801,592
Deductions
Benefits 1,231 – 3,827,502 3,628,379
Contribution Refunds – 215,450 740,358 731,693
Annuity Payments – – 29,078 23,365
Transfers to Other Pension Plans – – 5,880 4,754
Transfers to Other Funds – – 6,000 –
Administrative Expenses 1 1,941 35,609 31,754
Total Deductions 1,232 217,391 4,644,427 4,419,945
Net Increase (Decrease) (1,195) 10,468 1,017,936 2,381,647
Fiduciary Net Position
Beginning of Year: July 1 12,245 3,613,923 89,474,453 87,092,806
End of Year: June 30 $ 11,050 $ 3,624,391 $ 90,492,389 $ 89,474,453

28 DRS s Financial Section — Comprehensive Annual Financial Report
A. Reporting EntityThe state of Washington, through DRS, administers eight retirement systems for public employees of the state and political subdivisions:
• Public Employees’ Retirement System (PERS)• School Employees’ Retirement System (SERS)• Public Safety Employees’ Retirement System
(PSERS)• Teachers’ Retirement System (TRS)• Law Enforcement Officers’ and Fire Fighters’
Retirement System (LEOFF)• Washington State Patrol Retirement System
(WSPRS)• Judicial Retirement System (JRS)• Judges’ Retirement Fund (JRF)
DRS also administers the state’s Deferred Compensation Program (DCP).
Since DRS is part of the primary government of the state of Washington, it is considered part of the state’s financial reporting entity and is included in the state’s Comprehensive Annual Financial Report (CAFR).
The state of Washington’s CAFR can be obtained from the Office of Financial Management’s website at www.ofm.wa.gov/cafr.
B. Basic Financial StatementsThe financial statements provided in this report are fiduciary statements. Fiduciary funds report assets held for others in a trustee or agency capacity and, therefore, cannot be used to support the government’s own programs. DRS’ fiduciary funds are the retirement pension trust funds.
DRS’ financial statements have been prepared in conformity with generally accepted accounting principles (GAAP). The statements include a “Statement of Fiduciary Net Position” (SFNP) and a “Statement of Changes in Fiduciary Net Position” (SCFNP).
The SFNP includes information about the assets, liabilities and net fiduciary position for each plan. The SCFNP includes information about the additions
to, deductions from and net increase (or decrease) in fiduciary net position for each plan for the year. The statements provide a separate column for each retirement plan DRS administers.
C. Measurement Focus and Basis of AccountingThe retirement plans are accounted for in pension trust funds using the flow-of-economic-resources measurement focus and the accrual basis of accounting.
The members of the retirement systems, their employers and the state provide funding for the systems based on actuarial valuations. The Legislature establishes benefit levels and approves the actuarial assumptions used in determining contribution levels.
Plan member contributions are recognized as revenues in the period in which the contributions are earned. Employer contributions to each plan are recognized when due and the employer has made a formal commitment to provide the contributions. Benefits and refunds are recognized when due and payable in accordance with the terms of each plan.
DCP is accounted for in a pension trust fund using the flow-of-economic-resources measurement focus and the accrual basis of accounting. Participant contributions are recognized as revenues in the period in which the contributions are due. Refunds are recognized when due and payable in accordance with the terms of the plan.
DRS maintains an administrative fund to account for the revenues and operating expenditures incurred in administering DCP. Since these costs are incurred in the administration of the program, they have been reported within the program.
Notes to the Financial Statements
Note 1: Summary of Significant Accounting Policies and Plan Asset Matters

Comprehensive Annual Financial Report — Financial Section s DRS 29
D. Method Used to Value InvestmentsThe pension trust funds report investments at fair value and categorize fair value measurements within the hierarchy established by generally accepted accounting principles.
The table below presents fair value measurements as of June 30, 2016, for the retirement funds that the WSIB manages within the Commingled Trust Fund (CTF).
Notes to the Financial Statements (cont.)
Investments Measured at Fair ValueAs of June 30, 2016 — Dollars in Thousands
Investment Type Fair Value Level 1 Inputs Level 2 Inputs Level 3 Inputs
Debt Securities
Mortgage- and Other Asset-Backed Securities $ 1,075,525 $ – $ 1,075,525 $ –
Corporate Bonds 9,059,916 – 9,059,916 –
U.S. and Foreign Government and Agency Securities 7,609,073 – 7,609,073 –
Total Debt Securities 17,744,514 – 17,744,514 –
Equity Securities
Common and Preferred Stock 17,657,739 17,624,497 33,242 –
Depository Receipts and Other Miscellaneous 805,770 803,626 2,144 –
Mutual Funds and Exchange-Traded Funds 1,813 1,813 – –
Real Estate Investment Trusts 321,054 321,054 – –
Private Equity and Tangible Asset Funds 158,092 158,092 – –
Total Equity Securities 18,944,468 18,909,082 35,386 –
Total Return Swap Contracts (Investment Derivative) 22 – 22 –
Total Investments by Fair Value Level 36,689,004 18,909,082 17,779,922 –
Investments Measured at Net Asset Value
Private Equity 17,297,657 – – –
Real Estate 13,210,236 – – –
Tangible Assets 2,462,636 – – –
Collective Investment Trust Funds (Equity Securities) 10,463,890 – – –
Total Investments at Net Asset Value 43,434,419 – – –
Total Investments Measured at Fair Value $ 80,123,423 $ – $ – $ –
Other Assets at Fair Value
Collateral Held Under Securities Lending Agreements1 683,169 – 683,169 –
Net Foreign Exchange Contracts Receivable — Forward and Spot 10,303 – 10,303 –
Margin Variation Receivable — Futures Contracts 17,474 – 17,474 –
Total Other Assets Measured at Fair Value $ 710,946 $ – $ 710,946 $ –
1 This entry includes $2.5 million of collateral the OST holds under securities lending agreements. Collateral the OST holds under securities lending agreement is classified in Level 2 of the fair value hierarchy and is valued using observable inputs, including quoted prices for similar securities and interest rates.

30 DRS s Financial Section — Comprehensive Annual Financial Report
Cash and Cash Equivalents: Cash and cash equivalents include highly liquid investments, which include foreign currencies and short-term investment funds. The short-term investment funds are valued at cost. Accordingly, these investments are excluded from the fair value schedule. Cash and cash equivalents of $1.9 billion are reported as liquidity in the SFNP.
Investments Classified as Level 1: Investments classified as Level 1 in the table on the previous page are exchange-traded equity securities whose values are based on published market prices and quotations from national security exchanges as of the New York Stock Exchange’s close at the end of each reporting period.
Investments Classified as Level 2: Investments classified as Level 2 in the table on the previous page are primarily composed of publicly traded debt securities and exchange-traded stocks traded in inactive markets. Publicly traded debt securities are sourced from reputable pricing vendors using models that are market-based measurements representing their good faith opinion on the exit value of a security in an orderly transaction under current market conditions. Such models take into account quoted prices, nominal yield spreads, benchmark yield curves, prepayment speeds and other market-corroborated inputs.
Investments Measured at Net Asset Value (NAV): The fair value of investments that are organized as limited partnerships and have no readily ascertainable fair value is determined by using the net asset value per share (or its equivalent) of the pension trust fund’s ownership interest in partners’ capital. These values are based on the capital account balance the general partner reports at the closest available reporting period, adjusted by subsequent contributions, distributions, management fees, and changes in values of foreign currency and published market prices for certain securities.
Even though the limited partnerships’ annual financial statements are audited by independent auditors, due to the inherent uncertainties in estimating fair values, it is possible that the estimates will change in the near-term or the subsequent sale of assets will be different from the reported net asset value.
With the exception of two publicly traded funds, these investments can never be redeemed. Instead, the nature of these investments provides for distributions through the liquidation of the underlying assets or net operating cash flows. It is anticipated that the various investments within each asset class will be liquidated over the following periods:
Alternative Assets Expected Liquidation Periods
Liquidation Periods
Private Equity
Real Estate
Tangible Assets Total
% of Total
Publicly Traded, Level 1
99,640 – 58,452 158,092 0.5%
Fewer Than 3 years
124,200 168,081 40 292,321 0.9%
3 to 9 years 8,151,758 2,033,012 763,507 10,948,277 33.0%
10 or more years
9,021,699 11,009,143 1,699,090 21,729,932 65.6%
Total 17,397,297 13,210,236 2,521,089 33,128,622 100.0%
Private Equity: This includes 262 private equity limited liability partnerships that invest primarily in the United States, Europe and Asia in leveraged buyouts, venture capital, distressed debt and growth equity. The fair value of individual capital account balances is based on the valuation reported by private equity partnerships using the following methodologies to value the underlying portfolio companies:
• Valuations of publicly traded portfolio companies are based on active exchanges using quoted market prices as of the close of trading each month-end.
• When a portfolio company investment does not have a readily available market price but has a return that is determined by reference to an asset for which a market price is readily available, valuations are based on the closing market price of the reference asset on the valuation date, adjusted for unique factors that affect the fair value of the investment held.
• When portfolio company investments are private holdings and are not traded on active security exchanges, methodologies consist primarily of income and market approaches. The income approach involves a discounted cash-flow analysis based on portfolio companies’ projections. The market approach involves
Notes to the Financial Statements (cont.)

Comprehensive Annual Financial Report — Financial Section s DRS 31
Notes to the Financial Statements (cont.)
valuing a company at a multiple of a specified financial measure, generally earnings before interest, taxes, depreciation and amortization, based on multiples of comparable publicly traded companies.
Real Estate: This includes 31 real estate investments. Targeted investment structures within the real estate portfolio include real estate operating companies, limited liability companies, joint ventures, commingled funds and co-investments. Real estate partnerships provide quarterly valuations to the pension trust fund management. Individual properties are valued by the investment management at least annually and are adjusted as frequently as quarterly if material market or operational changes have occurred. Properties are generally externally appraised every one to five years, depending on the investment. Structured finance investments receive quarterly adjustments by the partners, generally applying the assumption that all such positions will be held to maturity. Annual audits of partnerships include a review of compliance with each partnership’s valuation policies.
Tangible Assets: This includes 29 limited liability structures and funds. The primary goals of the tangible asset portfolio are to generate a long-term sustainable and stable income stream as well as generate appreciation at least commensurate with inflation. Valuation practices of general partners and asset managers are consistent with private equity limited partnerships.
Collective Investment Trust Funds: The pension trust fund invests in three separate collective investment trust funds. Each fund determines a fair value by obtaining fair values of the underlying holdings using reputable pricing sources and computing an overall net asset value per share. The holdings within each fund are publicly traded equity securities.
Two funds are passively managed to approximate the capitalization weighted total rates of return of the MSCI U.S. Investable Market Index and the MSCI Emerging Markets Investable Market Index. Each fund has daily openings and contributions, and withdrawals can be made on any business day. The fund managers, at their
discretion, may require withdrawal proceeds be made partially or wholly in kind. In certain circumstances, the fund managers might choose to suspend valuation and/or the right to make contributions and withdrawals from the fund. Such circumstances include actual or anticipated closure, restriction, or suspension of trading activity in any markets or exchanges in which the fund investments are traded; when the purchase, sale or pricing of the fund’s investments would not be reasonably practicable or advisable; or when suspending contributions or withdrawals would be in the best interest of the fund or participants.
The third fund seeks to achieve long-term capital appreciation through active investment management in emerging market countries. The index against which the fund compares its performance is the MSCI Emerging Market Index. The pension trust fund may redeem some or all of its holdings on each monthly valuation date. The fund managers may delay redemption proceeds if they determine that doing so is reasonably necessary to prevent a material adverse impact on the fund or other investors. The fund managers, at their discretion, may require withdrawal proceeds be made partially or wholly in kind.
Other Assets and Liabilities Measured at Fair Value: Forward exchange contracts are valued by interpolating a value using the spot foreign exchange rate and forward points (based on the spot rate and currency interest rate differentials), which are all inputs that are observable in active markets (Level 2).
Cash collateral held and the offsetting obligations under securities lending agreements are valued by the pension trust fund lending agency. They are sourced from reputable pricing vendors using models that are market-based measurements representing their good faith opinion on the exit value of a security in an orderly transaction under current market conditions. Such models take into account quoted prices, nominal yield spreads, benchmark yield curves, prepayment speeds and other market-corroborated inputs.
Gains and losses on futures contracts are settled daily, based on a notional (underlying) principal value, and do not involve an actual transfer of the specific

32 DRS s Financial Section — Comprehensive Annual Financial Report
instrument. The margin variation represents the current gain or loss remaining to be settled from the prior day. The custodial bank provides quoted prices for these securities from a reputable pricing vendor.
DCP, JRA and Plan 3 Self-Directed Investments Valuation:
DCP, JRA and Plan 3 Self-Directed InvestmentsAs of June 30, 2016 — Dollars in Thousands
Fair Value
Investments Measured at Net Asset Value
Target Date Funds (Retirement Strategy Funds) $ 3,593,054
Equity Index Funds 1,949,231
Bond Funds 673,910
Short-Term Investment Funds 501,793
Balanced Fund 252,675
Subtotal 6,970,663
Investments Measured at Contract Value
Guaranteed Investment Contracts 871,704
Total $ 7,842,367
DCP, JRA and Plan 3 defined contribution Self plan assets have no unfunded commitments and can be redeemed daily with no notice period. Investments measured at fair value are daily valued funds. Funds are managed by the WSIB (Bond Fund), Alliance Bernstein (Target Date Funds), Walden Asset Management (Balanced Fund) and BlackRock (Equity Index Funds and Short-Term Investment Funds). All DCP and Plan 3 Self-Directed funds that are measured at fair value are measured at the NAV. The Guaranteed Investment Contracts the WSIB manages for DCP are reported at contract value.
Trading restrictions have been established to safeguard participants against the effects of excessive trading. If a participant in DCP or Plan 3 transfers more than $1,000 out of a fund, he or she will be required to wait 30 calendar days before transferring money back into that fund. The 30-day window is based on the last time the participant made a transfer out of the fund.
Bond Fund: The WSIB manages the Washington State Bond Fund. Investments in this fund are not available to the general public. The fund employs an active strategy that seeks to add incremental value over the index and normally invests in a diversified portfolio of investment-
grade corporate securities. The portfolio intends to earn additional returns through security selection, but is allowed to deviate from the index’s duration by plus or minus 15%. The Bond Fund staff determines a net asset value per share by obtaining fair values of the underlying holdings, using reputable pricing sources on a daily basis. The holdings within this fund are publicly traded debt securities and are actively managed to meet or exceed the return of the Barclays Capital Intermediate Credit Index. The fund may redeem some or all holdings daily without restriction.
Balanced Fund: Walden Asset Management actively manages the Walden Socially Responsible Investment Balanced Fund. The fund is a well-diversified portfolio of stocks, bonds and money market instruments. At least 30% of the fund’s assets are invested in fixed income securities and, at most, 70% of the fund’s assets are invested in foreign and domestic equity securities. The fund’s asset allocation will vary based on Walden’s assessment of global economic conditions, current valuations within capital markets, balancing risk and reward, and the relative attractiveness of stocks versus bonds. Equity investments will focus on an opportunity set of domestic and international companies Walden judges to be of higher quality than peers. The valuation methodologies the fund uses maximize the use of observable inputs and minimize the use of unobservable inputs in determining fair value. No restrictions on redemptions exist.
Equity Index Funds: BlackRock Institutional Trust Co. manages the Equity Index funds, which include the U.S. Large Cap, Global, U.S. Small Cap Value and Emerging Market Equity Index Funds. BlackRock uses a passive, or indexing, approach to achieve each fund’s investment objectives. It does not seek to outperform the index; rather, it seeks to track the index and does not seek temporary defensive positions when markets decline or appear overvalued.
The funds’ investments are valued at fair value each day the fund is open for contributions and redemptions and, for financial reporting purposes, as of the report date, if the reporting period ends on a day the fund is not open. The BlackRock Global Valuation Methodologies Committee (GVMC) provides oversight of the valuation
Notes to the Financial Statements (cont.)

Comprehensive Annual Financial Report — Financial Section s DRS 33
Notes to the Financial Statements (cont.)
of investments for the fund. The investments of the funds are valued pursuant to the policies and procedures the GVMC developed and BlackRock’s global valuation policy approved. Various inputs are used in determining the fair value of financial instruments and could be based on independent market data or be internally developed.
The U.S. Large Cap Equity Index Fund invests exclusively in the Equity Index Fund, which is an index fund that seeks investment results that correspond generally to the price and yield performance of a particular index. The fund is invested in a portfolio of equity securities. Its objective is to approximate the capitalization weighted total rate of return of the segment of the U.S. market for publicly traded equity securities the larger capitalized companies represent. The criterion for selection of investments is the S&P 500 Index.
The Global Equity Index Fund seeks investment results that correspond generally to the price and yield performance of a particular index. The fund is invested and reinvested primarily in equity securities. Its objective is to approximate the capitalization weighted total rate of return of the entire global market for publicly traded equity securities as captured by the MSCI ACWI IMI USA Net Dividend Index. In seeking its objective, the fund invests in the Russell 3000 Index Fund E and the BlackRock MSCI ACWI ex-U.S. IMI Index Fund E in target weights, subject to periodic rebalancing. Each fund is an index fund that seeks investment results that correspond generally to the price and yield performance of a particular index.
The U.S. Small Cap Equity Index Fund invests exclusively in Russell 2000 Value Fund F, which is an index fund that seeks investment results that correspond generally to the price and yield performance of a particular index. The fund is invested and reinvested in a portfolio of equity securities. Its objective is to approximate the capitalization weighted total rate of return of the segment of the U.S. market for publicly traded equity securities as the Russell 3000 Index represents, excluding the equity securities of the 1,000 largest capitalized companies. Of those 2,000 companies, the Russell 2000 Value Index represents
those with a less-than-median orientation toward growth. Companies in this index generally have low price-to-book and price-to-earnings ratios, higher dividend yields, and lower forecasted growth values than more growth-oriented securities.
The Emerging Market Equity Index Fund is invested and reinvested in a portfolio of international equity securities, depositary receipts, registered investment companies and derivatives. Its objective is to provide returns that approximate the capitalization weighted total rates of return of the markets in certain countries for equity securities traded outside the United States.
Target Date Funds: Target Date Funds (Retirement Strategy Funds) are diversified asset allocation portfolios. The asset mix of each fund is adjusted over time to the allocation deemed appropriate for the target retirement date. Each fund has a diversified portfolio of equities and bonds that become progressively more conservative over time as the fund approaches and passes through its target date for retirement.
The assets of these funds are aggregated and fair value is measured at the NAV. Alliance Bernstein is the fund manager of the Target Date Funds. The funds also include underlying funds that the WSIB and BlackRock manage, whose valuation methods are described within the Bond Fund (WSIB) and Equity Index Funds (BlackRock).
The fair value of debt instruments, such as bonds, and over-the-counter derivatives is generally based on market price quotations, recently executed market transactions, when observable, or industry-recognized modeling techniques.
When readily available market prices or relevant bid prices are not available for certain equity investments, such investments could be valued based on similar publicly traded investments, movements in relevant indices since last available prices, or underlying company fundamentals and comparable company data, such as multiples to earnings or other multiples to equity.

34 DRS s Financial Section — Comprehensive Annual Financial Report
Notes to the Financial Statements (cont.)
Options are valued using market-based inputs to models, broker or dealer quotations, or alternative pricing sources with reasonable levels of price transparency, when such inputs and models are available. Alternatively, the values might be obtained through unobservable management-determined inputs and/or management’s proprietary models. When models are used, the selection of a particular model to value an option depends on the contractual terms of, and specific risks inherent in, the option as well as the availability of pricing information in the market. Valuation models require a variety of inputs, including contractual terms, market prices, measures of volatility and correlations of such inputs.
Bank loan prices are provided by third-party pricing services and consist of a composite of the quotes the vendor receives, which creates a consensus price.
Pricing vendors’ valuations of mortgage-backed or other asset-backed securities are based on both proprietary and industry recognized models and discounted cash-flow techniques. Significant inputs to the valuation of these instruments are value of the collateral, the rates and timing of delinquencies, the rates and timing of prepayments, and default and loss expectations, which are driven in part by housing prices for residential mortgages. Significant inputs are determined based on relative value analyses, which incorporate comparisons to instruments with similar collateral and risk profiles, including relevant indices.
Other fixed income investments, including non-U.S. government and corporate debt, are generally valued using quoted market prices, if available, which are typically impacted by current interest rates, maturity dates and any perceived credit risk of the issuer. Additionally, in the absence of quoted market prices, pricing vendors use these inputs to derive a valuation based on industry or proprietary models that incorporate issuer-specific data with relevant yield/spread comparisons with more widely quoted bonds that have similar key characteristics.
E. Use of EstimatesThe preparation of financial statements in conformity with accounting principles generally accepted in the
United States requires management to make estimates and assumptions that affect certain reported amounts and disclosures. Actual results could differ from the estimated amounts.
F. Revenue RecognitionInterest and dividend income is recognized when earned. Capital gains and losses are recognized on a trade-date basis. Purchases and sales of investments are also recorded on a trade-date basis. Unrealized gains and losses are included in the SCFNP.
G. AllocationsDRS maintains a fund to account for the administrative additions and deductions incurred in administering the pension plans. These additions and deductions have been allocated to the pension plans.
DRS maintains a general capital assets fund to account for the capital assets used in administering the pension plans. These capital assets have been allocated to the pension plans based on asset balance. DRS also maintains a general long-term obligation fund to account for accumulated compensated absences incurred in administering the pension plans. These general long-term obligations have also been allocated to the pension plans based on asset balance.
H. Deposits, Investments and Securities LendingDeposits: The Office of the State Treasurer (OST) manages DRS’ deposits, which consist of securities AAA-rated issuers issue or deposits in financial institutions the Federal Deposit Insurance Corporation (FDIC) partially insures or the Washington Public Deposit Protection Commission (PDPC) collateralizes up to legal limitations. The PDPC constitutes a multiple financial institution collateral pool. The PDPC’s agent holds pledged securities under the pool in the name of the collateral pool.
State law (43.84.080 RCW) specifies that whenever a fund or cash balance in the state treasury is more than sufficient to meet the current expenditures, the OST may invest or reinvest such portion of the funds or balances as the OST deems expedient. Statute authorizes the OST to buy and sell the following types of instruments: U.S. government and agency securities, bankers’

Comprehensive Annual Financial Report — Financial Section s DRS 35
Notes to the Financial Statements (cont.)
acceptances, commercial paper and deposits with qualified public depositories.
Securities underlying repurchase and reverse repurchase agreements are limited to those same instruments. DRS receives its proportionate share of investment earnings from surplus balances in the state treasury based on its daily balance for the period. DRS’ deposits are separately displayed on the SFNP as cash and pooled investments.
Deposits — Custodial Credit Risk: “Custodial credit risk” is the risk that deposits might not be returned in the event of the failure of a financial institution. Statutes minimize custodial credit risk by restricting the OST to deposit funds in financial institutions that are physically located in Washington state unless otherwise expressly permitted by statute and authorized by the PDPC. As of June 30, 2016, the carrying amount of DRS’ cash and pooled investment deposits is $42.8 million, all of which is insured or collateralized.
Investments: The WSIB has been authorized by statute as having the investment management responsibility for retirement and DCP funds. The WSIB may invest as provided by statute (Chapter 43.33A RCW) and WSIB policy in the following: U.S. Treasury Bills; discount notes; repurchase agreements; reverse repurchase agreements; bankers’ acceptances; commercial paper; guaranteed investment contracts; U.S. government and agency (government-sponsored corporations eligible for collateral purposes at the Federal Reserve) securities; non-U.S. dollar bonds; investment grade corporate bonds; noninvestment grade corporate bonds; publicly traded mortgage-backed securities; privately placed mortgages; private placements of corporate debt; U.S. and foreign common stock; U.S. preferred stock; convertible securities; private equity, including but not limited to investment corporations, partnerships and limited liability companies for venture capital, leveraged buyouts, real estate and other tangible assets, or other forms of private equity; asset-backed securities; and derivative securities, including futures, options, options on futures, forward contracts and swap transactions.
There were no violations of these investment restrictions during fiscal year 2016.
Investments — Interest Rate Risk: “Interest rate risk” is the risk that changes in interest rates over time will adversely affect the fair value of an investment. This risk is managed within the portfolios using effective duration, which is the measure of a debt investment’s exposure to fair value changes arising from changes in interest rates. Increases in prevailing interest rates generally translate into decreases in the fair values of those investments.
The retirement funds’ fixed income investments are to be actively managed to meet or exceed the return of the Barclays Capital Universal Index, with volatility similar to or less than the index. As of June 30, 2016, the retirement funds’ duration was within the duration target of this index.
The schedule on page 36 provides information about the interest rate risks associated with the categorized investments in the Commingled Trust Fund (CTF) as of June 30, 2016. The schedule displays asset classes held by maturity in years and effective durations. Residential mortgage-backed, commercial mortgage-backed and asset-backed securities are reported using the average life within the portfolio.
“Average life” is a calculated estimate of the average time until maturity for these securities, taking into account possible prepayments of principal. All other categorized securities on this schedule are reported using the stated maturity date.
Investments — Credit Risk: “Credit risk” is the risk that an issuer or other counterparty to an investment will not fulfill its obligations. The WSIB’s investment policies for the retirement funds limit the fixed income securities to investment grade or higher at the time of purchase. Investment-grade securities are those fixed income securities with a Moody’s rating of Aaa to Baa or a Standard and Poor’s rating of AAA to BBB. The retirement funds’ rated debt investments as of June 30, 2016, were rated by Moody’s and/or an equivalent national rating organization.
Credit ratings for the retirement funds’ rated debt investments as of June 30, 2016, are presented in the schedule on page 36.

36 DRS s Financial Section — Comprehensive Annual Financial Report
Investment MaturitiesAs of June 30, 2016 — Dollars in Thousands
Maturity
Investment TypeTotal Fair
ValueLess Than
One Year 1-5 Years 6-10 YearsMore Than
10 YearsEffective Duration
Mortgage- and Other Asset-Backed Securities $ 1,075,525 $ 99,821 $ 942,448 $ 33,256 $ – 2.8
Corporate Bonds 9,059,916 545,196 3,695,920 3,463,220 1,355,580 6
U.S. Government and Agency Securities 6,291,884 1,009,773 2,756,616 1,730,337 795,158 6.2
Foreign Government and Agency Securities 1,317,189 119,441 436,992 474,919 285,837 5.6
Total Retirement Funds Investment Categorized $ 17,744,514 $ 1,774,231 $ 7,831,976 $ 5,701,732 $ 2,436,575 5.91
Investments Not Required to Be Categorized
Cash and Cash Equivalents 1,999,324
Equity Securities 29,250,266
Alternative Investments 33,128,621
Return Swap Contracts 22
Total Investments Not Categorized $ 64,378,233
DCP, JRA and Defined Contribution Self Plan Assets
Retirement Strategy Funds (Target Date Funds) 3,593,054
Equity Index Funds 1,949,231
Guaranteed Investment Contracts 871,704
Bond Funds 673,910
Short-Term Investment Funds 501,793
Balanced Fund 252,675
Total DCP, JRA and Defined Contribution Self Plan Assets
$ 7,842,367
Securities Under Lending Agreements 683,169
Total Investments as of June 30, 2016 $ 90,648,283
Investment Credit RatingsAs of June 30, 2016 — Dollars in Thousands
Moody’s Equivalent Rating Total Fair Value
Mortgage- and Other Asset-Backed
Securities Corporate BondsU.S. Government and
Agency Securities
Foreign Government and
Agency Securities
Aaa $ 7,964,150 $ 1,069,082 $ 455,439 $ 6,291,884 $ 147,745
Aa1 76,812 – 17,549 – 59,263
Aa2 190,569 389 95,469 – 94,711
Aa3 877,712 – 668,309 – 209,403
A1 737,437 – 737,437 – –
A2 455,817 – 455,817 – –
A3 1,178,755 – 1,106,334 – 72,421
Baa1 1,292,003 – 1,187,267 – 104,736
Baa2 1,204,009 – 1,050,247 – 153,762
Baa3 2,161,786 5,135 1,982,213 – 174,438
Ba1 or Lower 1,605,464 919 1,303,835 – 300,710
Total $ 17,744,514 $ 1,075,525 $ 9,059,916 $ 6,291,884 $ 1,317,189
1 Excludes cash balances in calculation
Notes to the Financial Statements (cont.)
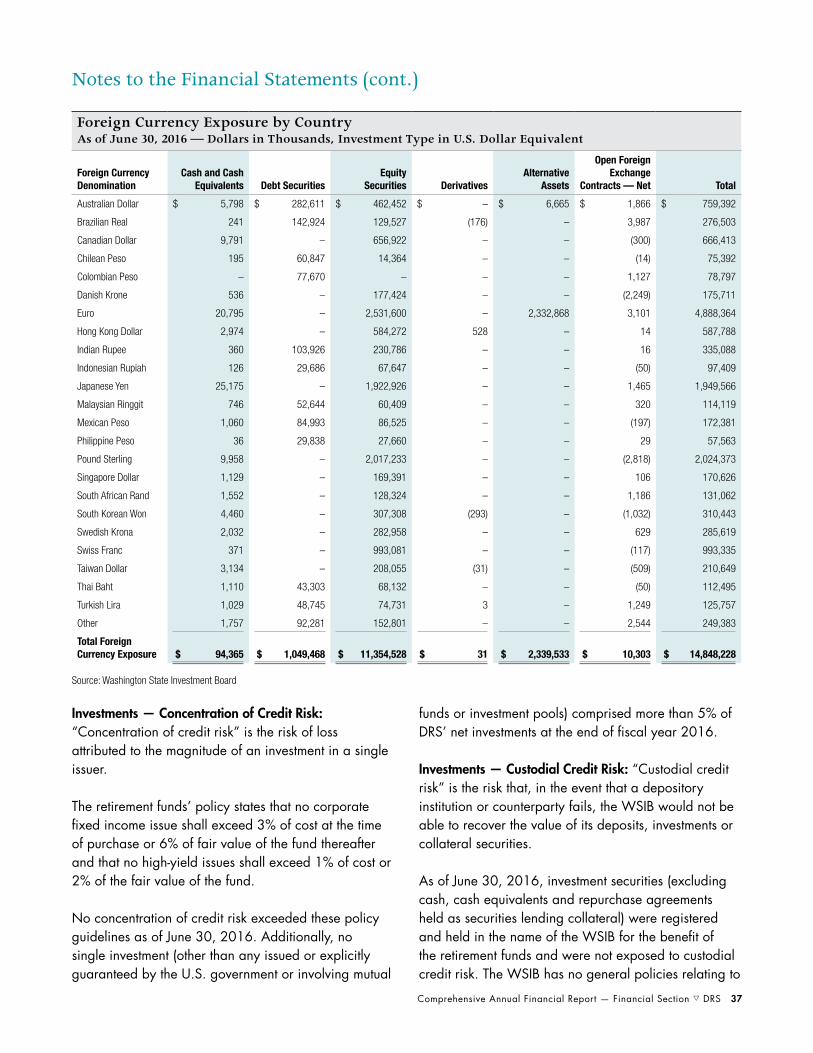
Comprehensive Annual Financial Report — Financial Section s DRS 37
Notes to the Financial Statements (cont.)
Investments — Concentration of Credit Risk: “Concentration of credit risk” is the risk of loss attributed to the magnitude of an investment in a single issuer.
The retirement funds’ policy states that no corporate fixed income issue shall exceed 3% of cost at the time of purchase or 6% of fair value of the fund thereafter and that no high-yield issues shall exceed 1% of cost or 2% of the fair value of the fund.
No concentration of credit risk exceeded these policy guidelines as of June 30, 2016. Additionally, no single investment (other than any issued or explicitly guaranteed by the U.S. government or involving mutual
funds or investment pools) comprised more than 5% of DRS’ net investments at the end of fiscal year 2016.
Investments — Custodial Credit Risk: “Custodial credit risk” is the risk that, in the event that a depository institution or counterparty fails, the WSIB would not be able to recover the value of its deposits, investments or collateral securities.
As of June 30, 2016, investment securities (excluding cash, cash equivalents and repurchase agreements held as securities lending collateral) were registered and held in the name of the WSIB for the benefit of the retirement funds and were not exposed to custodial credit risk. The WSIB has no general policies relating to
Foreign Currency Exposure by CountryAs of June 30, 2016 — Dollars in Thousands, Investment Type in U.S. Dollar Equivalent
Foreign Currency Denomination
Cash and Cash Equivalents Debt Securities
Equity Securities Derivatives
Alternative Assets
Open Foreign Exchange
Contracts — Net Total
Australian Dollar $ 5,798 $ 282,611 $ 462,452 $ – $ 6,665 $ 1,866 $ 759,392
Brazilian Real 241 142,924 129,527 (176) – 3,987 276,503
Canadian Dollar 9,791 – 656,922 – – (300) 666,413
Chilean Peso 195 60,847 14,364 – – (14) 75,392
Colombian Peso – 77,670 – – – 1,127 78,797
Danish Krone 536 – 177,424 – – (2,249) 175,711
Euro 20,795 – 2,531,600 – 2,332,868 3,101 4,888,364
Hong Kong Dollar 2,974 – 584,272 528 – 14 587,788
Indian Rupee 360 103,926 230,786 – – 16 335,088
Indonesian Rupiah 126 29,686 67,647 – – (50) 97,409
Japanese Yen 25,175 – 1,922,926 – – 1,465 1,949,566
Malaysian Ringgit 746 52,644 60,409 – – 320 114,119
Mexican Peso 1,060 84,993 86,525 – – (197) 172,381
Philippine Peso 36 29,838 27,660 – – 29 57,563
Pound Sterling 9,958 – 2,017,233 – – (2,818) 2,024,373
Singapore Dollar 1,129 – 169,391 – – 106 170,626
South African Rand 1,552 – 128,324 – – 1,186 131,062
South Korean Won 4,460 – 307,308 (293) – (1,032) 310,443
Swedish Krona 2,032 – 282,958 – – 629 285,619
Swiss Franc 371 – 993,081 – – (117) 993,335
Taiwan Dollar 3,134 – 208,055 (31) – (509) 210,649
Thai Baht 1,110 43,303 68,132 – – (50) 112,495
Turkish Lira 1,029 48,745 74,731 3 – 1,249 125,757
Other 1,757 92,281 152,801 – – 2,544 249,383
Total Foreign Currency Exposure $ 94,365 $ 1,049,468 $ 11,354,528 $ 31 $ 2,339,533 $ 10,303 $ 14,848,228
Source: Washington State Investment Board

38 DRS s Financial Section — Comprehensive Annual Financial Report
Notes to the Financial Statements (cont.)
custodial credit risk.
Investments — Foreign Currency Risk: “Foreign currency risk” is the risk that changes in exchange rates will adversely affect the fair value of an investment or a deposit. The WSIB does not have a formal policy to limit the retirement funds’ foreign currency risk.
The WSIB manages exposure to fair value loss by requiring its international securities investment managers to maintain diversified portfolios by sector and by issuer to limit foreign currency and security risk.
The retirement funds’ exposure to foreign currency risk as of June 30, 2016, is presented in the schedule on page 37. The schedule, stated in U.S. dollars, provides information on deposits and investments held in various foreign currencies. Private equity and real estate are presented according to the financial reporting currency of the individual funds and is not a presentation of currency exposure relating to the underlying holdings.
Securities Lending and Repurchase Agreements: Management responsibilities for securities lending and repurchase agreements are described in the following paragraphs.
WSIB: Washington state law and WSIB policy permit the WSIB to participate in securities lending transactions to augment the investment income of the retirement funds. The WSIB has entered into an agreement with State Street Corporation (SSC) to act as agent for the WSIB in securities lending transactions. Because SSC is the custodian bank for the WSIB, it is a counterparty to these transactions.
The fair value of the securities on loan as of June 30, 2016, was about $1.5 billion. The securities on loan remain in the SFNP in their respective categories. Cash collateral received totaling $683.1 million is reported as a securities lending obligation, and the fair value of the reinvested cash collateral totaling $683.1 million is reported as securities lending collateral in the SFNP. Collateral held under securities lending agreements and obligations under securities lending agreements reported in the SFNP include $2.5 million the OST managed. OST securities lending
is documented on page 39.
Securities received as collateral that the WSIB does not have the ability to pledge or sell unless the borrower defaults are not reported as assets and liabilities. Securities received as collateral as of June 30, 2016, totaled $900.0 million.
The WSIB’s agent loaned and collateralized debt and equity securities with cash and U.S. government or U.S. agency securities, including U.S. agency mortgage-backed securities (excluding letters of credit). When the loaned securities had collateral denominated in the same currency, the collateral requirement was 102% of the fair value, including accrued interest of the securities loaned. All other securities were required to be collateralized at 105% of the fair value, including accrued interest on the loaned securities.
The following table summarizes the securities held from reinvestment of cash collateral and securities received as collateral as of June 30, 2016:
Cash and Securities Held as CollateralAs of June 30, 2016 — Dollars in Millions
Mortgage-Backed Securities $ 461.8
Repurchase Agreements 270.4
Yankee CD 151.3
Commercial Paper 115.0
U.S. Treasuries 437.2
Cash Equivalents and Other 137.3
Total Collateral Held $ 1,573.0
During fiscal year 2016, securities lending transactions could be terminated on demand by either the WSIB or the borrower.
As of June 30, 2016, the collateral held had an average duration of 17.2 days and an average weighted final maturity of 73.4 days. Because the securities lending agreements were terminable at will, their duration did not generally match the duration of the investments made with the cash collateral. Non-cash collateral could not be pledged or sold, absent borrower default. A specific borrower could hold no more than 20% of the total-on-loan value. Collateral

Comprehensive Annual Financial Report — Financial Section s DRS 39
investment guidelines specifically prohibit European domiciled holdings. No restrictions exist on the amount of securities that can be lent.
Securities were lent with the agreement that they would be returned in the future for exchange of the collateral. SSC indemnified the WSIB by agreeing to purchase replacement securities or return the cash collateral in the event a borrower failed to return the loaned securities or pay distributions thereon. SSC’s responsibilities included performing appropriate borrower and collateral investment credit analyses, demanding adequate types and levels of collateral, and complying with applicable federal regulations concerning securities lending.
During fiscal year 2016, there were no significant violations of legal or contractual provisions or failures by any borrowers to return loaned securities or to pay distributions thereon. Further, the retirement funds incurred no losses during the fiscal year resulting from a default by either borrowers or securities lending agents.
Credit Risk: The WSIB mitigates credit risk in securities lending with a policy that strictly limits the types of collateral that may be used to secure these transactions.
OST: State statues permit the OST to lend its securities to broker-dealers and other entities with a simultaneous agreement to return the collateral for the same securities in the future. The OST, which has contracted with Citibank as lending agent, receives earnings for this activity.
The OST lending agent lends U.S. government and U.S. agency securities and receives collateral, which can be in the form of cash or other securities. The collateral, which must be valued at 102% of the fair market value of the loaned securities, is priced daily and, if necessary, action is taken to maintain the collateralization level at 102%.
The lending agent invests the cash in accordance with investment guidelines the OST approved. The custodian holds the securities held as collateral and the securities underlying the cash collateral. One option available to the lending agent is to invest cash collateral into an OST
account in the Local Government Investment Pool (LGIP).
The contract with the lending agent requires indemnification of the OST if a borrower fails to return the securities (or the securities’ collateral is inadequate to replace the securities lent) or a borrower fails to pay the OST for income distribution by the securities’ issuers while the securities are on loan. The OST cannot pledge or sell collateral securities received unless the borrower defaults. As of June 30, 2016, securities lent totaled $2.4 million. Collateral held under securities lending agreements and obligations under securities lending agreements each totaled $2.5 million, which was invested in the LGIP.
State law also permits the OST to enter into reverse repurchase agreements (that is, a sale of securities with a simultaneous agreement to repurchase them in the future at the same price plus a contract rate of interest). The fair value of the securities underlying reverse repurchase agreements normally exceeds the cash received, providing the dealers a margin against a decline in the fair value of the securities.
If the dealers default on their obligations to resell these securities to the OST or provide securities or cash of equal value, the retirement funds would suffer an economic loss equal to the difference between the fair value plus accrued interest of the underlying securities and the agreement obligation, including accrued interest.
During fiscal year 2016, the OST did not engage in reverse repurchase activity and it incurred no losses by default, nor recovered prior period losses, from these transactions. As of June 30, 2016, no obligations were under reverse repurchase agreements.
Credit Risk: The OST limits its credit risk with an investment policy that restricts the types of investments in which the OST can participate. Additionally, the OST investment policy requires that any securities on loan be made available by the lending agent for next day liquidity at the option of the OST. During fiscal year 2016, the OST had no credit-risk exposure to borrowers because the amounts owed to the borrowers exceeded the amounts the borrowers owed the OST.
Notes to the Financial Statements (cont.)
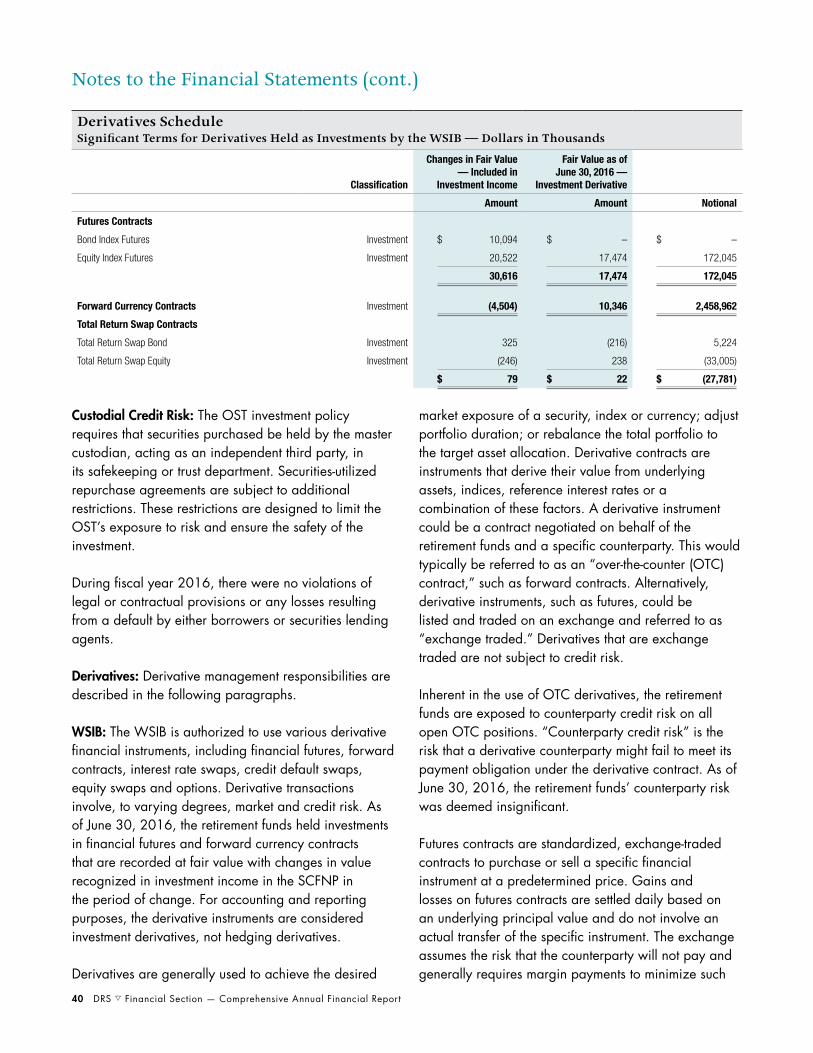
40 DRS s Financial Section — Comprehensive Annual Financial Report
Custodial Credit Risk: The OST investment policy requires that securities purchased be held by the master custodian, acting as an independent third party, in its safekeeping or trust department. Securities-utilized repurchase agreements are subject to additional restrictions. These restrictions are designed to limit the OST’s exposure to risk and ensure the safety of the investment.
During fiscal year 2016, there were no violations of legal or contractual provisions or any losses resulting from a default by either borrowers or securities lending agents.
Derivatives: Derivative management responsibilities are described in the following paragraphs.
WSIB: The WSIB is authorized to use various derivative financial instruments, including financial futures, forward contracts, interest rate swaps, credit default swaps, equity swaps and options. Derivative transactions involve, to varying degrees, market and credit risk. As of June 30, 2016, the retirement funds held investments in financial futures and forward currency contracts that are recorded at fair value with changes in value recognized in investment income in the SCFNP in the period of change. For accounting and reporting purposes, the derivative instruments are considered investment derivatives, not hedging derivatives.
Derivatives are generally used to achieve the desired
market exposure of a security, index or currency; adjust portfolio duration; or rebalance the total portfolio to the target asset allocation. Derivative contracts are instruments that derive their value from underlying assets, indices, reference interest rates or a combination of these factors. A derivative instrument could be a contract negotiated on behalf of the retirement funds and a specific counterparty. This would typically be referred to as an “over-the-counter (OTC) contract,” such as forward contracts. Alternatively, derivative instruments, such as futures, could be listed and traded on an exchange and referred to as “exchange traded.” Derivatives that are exchange traded are not subject to credit risk.
Inherent in the use of OTC derivatives, the retirement funds are exposed to counterparty credit risk on all open OTC positions. “Counterparty credit risk” is the risk that a derivative counterparty might fail to meet its payment obligation under the derivative contract. As of June 30, 2016, the retirement funds’ counterparty risk was deemed insignificant.
Futures contracts are standardized, exchange-traded contracts to purchase or sell a specific financial instrument at a predetermined price. Gains and losses on futures contracts are settled daily based on an underlying principal value and do not involve an actual transfer of the specific instrument. The exchange assumes the risk that the counterparty will not pay and generally requires margin payments to minimize such
Notes to the Financial Statements (cont.)
Derivatives ScheduleSignificant Terms for Derivatives Held as Investments by the WSIB — Dollars in Thousands
Classification
Changes in Fair Value — Included in
Investment Income
Fair Value as of June 30, 2016 —
Investment Derivative
Amount Amount Notional
Futures Contracts
Bond Index Futures Investment $ 10,094 $ – $ –
Equity Index Futures Investment 20,522 17,474 172,045
30,616 17,474 172,045
Forward Currency Contracts Investment (4,504) 10,346 2,458,962
Total Return Swap Contracts
Total Return Swap Bond Investment 325 (216) 5,224
Total Return Swap Equity Investment (246) 238 (33,005)
$ 79 $ 22 $ (27,781)

Comprehensive Annual Financial Report — Financial Section s DRS 41
risk. Futures are generally used to achieve the desired market exposure of a security or index or to rebalance the total portfolio.
Forward currency contracts are agreements to exchange the currency of one country for the currency of another country at an agreed-upon price and settlement date. These forward commitments are not standardized and carry credit risk due to the possible nonperformance of one of the counterparties. The maximum potential loss is the aggregate face value in U.S. dollars at the time the contract was opened; however, the likelihood of such a loss is remote.
As of June 30, 2016, the retirement funds had outstanding forward currency contracts with a net unrealized gain of $10.3 million, which is included in the accompanying SCFNP. The contracts have varying maturity dates ranging from July 1, 2016, through September 21, 2016.
As of June 30, 2016, the counterparties’ credit ratings for forward currency contracts that are subject to credit risk had a credit rating of no less than A3 using Moody’s rating scale.
As of June 30, 2016, the retirement funds’ fixed income portfolio held derivative securities consisting of collateralized mortgage obligations of $59.6 million. Domestic and foreign passive equity index fund managers may also use various derivative securities to manage exposure to risk and increase portfolio returns. Information on passive equity index fund managers’ use and holdings of derivative securities is unavailable.
The schedule on page 40 presents the significant terms for derivatives held as investments by the WSIB.
OST: The OST did not engage in derivative transactions during fiscal year 2016.
Deferred Compensation Program (DCP), Judicial Retirement Account (JRA) and Defined Contribution — Self Plan Assets: The assets within DCP, JRA and Self investments total $7.8 billion and represent less than 9% of the total investments DRS administers. Withdrawals from the options are restricted to those who have left employment (except in the case of hardship withdrawals from DCP). The participants/members own these assets, have full control over their investment choices and assume the responsibility for the results of those choices.
Notes to the Financial Statements (cont.)
Investment MaturitiesAs of June 30, 2016 — Dollars in Thousands
Maturity
Investment TypeTotal
Fair ValueLess Than
1 Year 1-5 Years 6-10 YearsMore Than
10 YearsEffective Duration
Corporate Bonds $ 613,258 $ 83,261 $ 280,990 $ 244,297 $ 4,710 4.50
Foreign Government and Agency Securities 60,652 7,176 20,439 33,037 – 5.20
Total $ 673,910 $ 90,437 $ 301,429 $ 277,334 $ 4,710
Credit Ratings (Moody’s Equivalent)As of June 30, 2016 — Dollars in Thousands
Moody’s Equivalent Credit Rating
Investment TypeFair
Value Aaa Aa1 Aa2 Aa3 A1 A2 A3 Baa1 Baa2 Baa3Ba1 or Lower
Corporate Bonds $ 613,258 $ 27,328 $ 1,661 $ 3,959 $ 46,392 $ 72,868 $ 82,902 $ 89,942 $ 86,164 $ 78,908 $ 90,048 $ 33,086
Foreign Government and Agency Securities
60,652 12,057 – 8,442 26,887 1,226 – – 4,133 2,121 4,119 1,669
Total $ 673,910 $ 39,385 $ 1,661 $ 12,400 $ 73,279 $ 74,094 $ 82,902 $ 89,942 $ 90,296 $ 81,028 $ 94,167 $ 34,755

42 DRS s Financial Section — Comprehensive Annual Financial Report
The composition of these assets is:• 46% Retirement Strategy Funds (Target Date
Funds)• 25% Equity Index Funds• 11% Guaranteed Investment Contracts (GIC)• 6% Short-Term Investment Fund• 3% U.S. Socially Responsible Fund• 9% Bond Fund
Refer to the tables on page 41 for the maturities, effective duration and credit ratings of its underlying securities.
Management Fees: The fees the WSIB paid are accounted for as a reduction of investment income or are netted directly from the asset value of the retirement funds’ investments. These fees include investment management fees and commissions, investment consultant fees, and legal fees.
As of June 30, 2016, total investment management fees paid were $343.1 million and total netted fees were $15.8 million. For a detailed disclosure, refer to the “Schedule of Investment Expenses” in the “Supporting Schedules” of the Financial Section of this report.
Unfunded Commitments: The WSIB has entered into agreements that commit the DRS pension funds, upon request, to make additional investment purchases up to a predetermined amount. As of June 30, 2016, the retirement funds had the following unfunded investment commitments:
Unfunded CommitmentsAs of June 30, 2016 — Dollars in Millions
Private Equity $ 12,940.5
Real Estate $ 7,762.1
Innovation Portfolio $ 21.9
Tangible Assets $ 3,155.1
I. ReservesMember Reserves: Member reserves reflect the total liability for all contributions members make. Employee contributions and interest earnings increase these reserves. Contribution refunds and transfers to the benefit reserves for current-year retirees decrease these
reserves. The member reserves are considered fully funded.
Because PERS Plan 3, SERS Plan 3 and TRS Plan 3 defined contribution plans each offer two separate investment programs to members, DRS maintains two separate member reserves for each defined contribution plan. The reserves the WSIB manages account for members who participate in the WSIB’s Total Allocation Portfolio (TAP). The reserves for Self account for members who participate in the self-directed investment offerings.
Member reserves as of June 30, 2016 and 2015, are as follows:
Member Reserves as of June 30, 2016 and 2015Dollars in Thousands
6/30/2016 6/30/2015
PERS Plan 1 $ 509,696 $ 592,792
PERS Plan 2/3 6,158,740 5,739,362
PERS Plan 3 — WSIB 1,484,245 1,431,839
PERS Plan 3 — Self 996,170 986,350
SERS Plan 2/3 481,862 444,825
SERS Plan 3 — WSIB 1,272,515 1,259,742
SERS Plan 3 — Self 429,003 428,729
PSERS Plan 2 171,872 146,187
TRS Plan 1 219,887 295,734
TRS Plan 2/3 675,956 623,425
TRS Plan 3 — WSIB 4,556,884 4,429,634
TRS Plan 3 — Self 2,810,225 2,801,545
LEOFF Plan 1 13,497 16,987
LEOFF Plan 2 2,521,679 2,411,042
WSPRS Plan 1/2 87,525 86,466
JRS – –
JRF – –
Total Member Reserves $ 22,389,756 $ 21,694,659
Benefit Reserves: The benefit reserves reflect the funded liability associated with all retired members of DRS-administered systems. These reserves are increased by employer contributions, state contributions, investment earnings and employee contributions that are attributable to current-year retirees. These reserves are decreased by the amounts of pensions actually paid in the current year, interest payments transferred to the member reserves and administrative expenses in support of the trust funds.
Notes to the Financial Statements (cont.)

Comprehensive Annual Financial Report — Financial Section s DRS 43
Notes to the Financial Statements (cont.)
Benefit reserves as of June 30, 2016 and 2015, are as follows:
Benefit Reserves as of June 30, 2016 and 2015Dollars in Thousands
6/30/2016 6/30/2015
PERS Plan 1 $ 6,616,706 $ 6,965,520
PERS Plan 2/3 24,323,885 23,772,597
SERS Plan 2/3 3,732,178 3,622,452
PSERS Plan 2 228,844 206,574
TRS Plan 1 5,367,134 5,773,853
TRS Plan 2/3 10,122,970 9,753,606
LEOFF Plan 1 5,357,372 5,593,163
LEOFF Plan 2 7,673,990 7,409,453
LEOFF Plan 2 — Medical 14,951 12,173
WSPRS Plan 1/2 1,010,521 1,024,084
WSPRS Plan 1/2 — Medical 82 76
JRS 6,776 6,333
JRF 581 514
Total Benefit Reserves $ 64,455,990 $ 64,140,398
The funded status of each of the benefit reserves is the same as the funded status of each of the respective pension plans, which is shown in the “Solvency Test” schedules in the Actuarial Section of this CAFR.
J. Capital AssetsAll capital assets with a unit cost (including ancillary costs) of $5,000 or greater are capitalized and reported in the accompanying financial statements. Capital leases with a net present value or fair market value, whichever is less, of $10,000 or more are capitalized and also included in these financial statements. All purchased capital assets are valued at cost when historical records exist. Donated capital assets are valued at their estimated fair market value on the date of donation. Where necessary, estimates of original cost and fair market value are derived by factoring price levels from the current period to the time of acquisition.
Capital asset costs include the purchase price or construction cost plus those costs necessary to place the asset in its intended location and condition for use. Normal maintenance and repair costs that do not materially add to the value or extend the life of the asset are not capitalized.
Depreciation is calculated using the Straight-Line Method with estimated useful lives of five to 50 years for buildings and three to 50 years for furnishings and equipment, other improvements, and miscellaneous capital assets.
The following is a summary of changes in capital assets for fiscal year 2016:
Changes in Capital AssetsFor Fiscal Year 2016 — Dollars in Thousands
AssetsBeginning
Balance
Acquisition/Increase
Depreciation DisposalEnding
Balance
Improvements Other Than Buildings
$ 645 $ – $ – $ 645
Furnishing and Equipment
1,851 66–
1,917
Accumulated Depreciation
(2,286) (79) – (2,365)
Total $ 210 $ (13) $ – $ 197
K. LeasesDRS leases office facilities and office and computer equipment. Lease terms vary. Leases are considered noncancelable for financial reporting purposes. All DRS leases are classified as operating leases with the lease payments recorded as expenditures or expenses during the life of the lease. Certain operating leases are renewable for specified periods. In most cases, management expects that the leases will be renewed or replaced by other leases.
The following schedule presents future minimum payments for operating leases as of June 30, 2016:
Future Minimum Payments for Operating LeasesAs of June 30, 2016 — Dollars in Thousands
Fiscal Year Payments
2016 $ 1,467
2017 1,512
2018 1,511
2019 1,085
2020 208
2021 and beyond 31
Total Future Minimum Payment $ 5,814
The total operating lease rental expenditure for fiscal year 2016 was $1.5 million.

44 DRS s Financial Section — Comprehensive Annual Financial Report
Notes to the Financial Statements (cont.)
L. Other Long-Term ObligationsAnnual Leave: DRS employees accrue annual leave at a variable rate based on years of service. In general, accrued annual leave cannot exceed 30 days at the employee’s anniversary date. The expense and accrued liability is recognized when the annual leave is earned. DRS’ liability for accumulated annual leave was $0.9 million as of June 30, 2016.
Sick Leave: Employees accrue sick leave at the rate of one day per month without limitation on the amount that can be accumulated. Sick leave is not vested (that is, the department does not pay employees for unused sick leave upon termination except in the event of the employee’s death or retirement; at such time, DRS is liable for 25% of the employee’s accumulated sick leave).
In addition, the state has a sick-leave buyout option. Each January, employees who have accumulated sick leave in excess of 60 days may redeem sick leave earned but not taken during the previous year at the rate of one day’s pay in exchange for four days of sick leave. The expense and accrued liability is recognized when the sick leave is earned. DRS’ liability for accumulated sick leave was $0.4 million as of June 30, 2016.
The following is a summary of changes in compensated absences for the fiduciary funds for fiscal year 2016:
Changes in Compensated AbsencesFor Fiscal Year 2016 — Dollars in Thousands
Compensated Absences
Beginning Balance Additions Deletions
Ending Balance
Annual Leave $ 933 $ 1,115 $ (1,050) $ 998
Sick Leave 420 158 (145) 433
Total $ 1,353 $ 1,273 $ (1,195) $ 1,431
M. TransfersTransfers from and to other pension plans, as reported in the financial statements, typically reflect routine transfers among the various trust funds resulting from plan membership changes and member-directed defined contribution plan selections. In fiscal year 2016, these transfers totaled $5.9 million and represented a $1.1 million increase from the previous year.
N. Contingencies — LitigationAs a state agency, DRS is party to legal proceedings that normally occur in governmental operations. Pending legal actions involving DRS exist. For each pending legal action, DRS has good defenses and will continue to bring a vigorous defense to each case.
O. Adoption of New Accounting StandardsGASB Statement No. 72, Fair Value Measurement and Application, became effective for financial statements for fiscal years beginning after June 15, 2015. The statement addresses accounting and reporting issues related to fair value measurements and requires disclosures be made about fair value measurements, the level of fair value hierarchy and valuation techniques. This report has been prepared to conform with this newly adopted GASB statement.

Comprehensive Annual Financial Report — Financial Section s DRS 45
A. GeneralThe state Legislature establishes and amends laws pertaining to the creation and administration of all public retirement systems. As established in the Revised Code of Washington (RCW) Chapter 41.50, the Department of Retirement Systems (DRS) administers eight retirement systems covering eligible employees of the state and local governments.
The governor appoints the director of DRS.
Administration of the retirement systems is funded by a current employer rate of 0.18% of reported compensation.
The retirement systems are composed of 12 defined benefit pension plans and three combination defined benefit plans that have defined contribution components.
They include:
Notes to the Financial Statements (cont.)
Note 2: General Description of the Retirement Systems
Cost-Sharing, Multiple-Employer Plans
Public Employees’ Retirement System (PERS) Plan 1: Defined benefitPlan 2: Defined benefitPlan 3: Defined benefit/defined contribution
School Employees’ Retirement System (SERS)Plan 2: Defined benefitPlan 3: Defined benefit/defined contribution
Public Safety Employees’ Retirement System (PSERS)
Plan 2: Defined benefit
Teachers’ Retirement System (TRS)Plan 1: Defined benefitPlan 2: Defined benefitPlan 3: Defined benefit/defined contribution
Law Enforcement Officers’ and Fire Fighters’ Retirement System (LEOFF)
Plan 1: Defined benefitPlan 2: Defined benefit
Single-Employer Plans
Washington State Patrol Retirement System (WSPRS)
Plan 1: Defined benefitPlan 2: Defined benefit
Judicial Retirement System (JRS)Defined benefit
Judges’ Retirement Fund (JRF)Defined benefit

46 DRS s Financial Section — Comprehensive Annual Financial Report
Number of Participating MembersAs of June 30, 2016
Plan
Retirees and Beneficiaries
Receiving Benefits
Terminated Members Entitled to But Not Yet
Receiving BenefitsActive Plan
Members VestedActive Plan
Members Nonvested Total
PERS Plan 1 49,417 827 3,021 209 53,474
PERS Plan 2 42,706 54,916 82,809 37,290 217,721
PERS Plan 3 3,693 5,238 13,871 19,052 41,854
SERS Plan 2 7,391 5,704 13,430 12,697 39,222
SERS Plan 3 6,715 7,899 19,470 12,939 47,023
PSERS Plan 2 108 400 3,091 2,390 5,989
TRS Plan 1 34,859 223 949 13 36,044
TRS Plan 2 4,700 2,443 7,449 10,163 24,755
TRS Plan 3 8,866 8,373 36,635 16,782 70,656
LEOFF Plan 1 7,431 1 62 – 7,494
LEOFF Plan 2 4,508 839 13,966 3,355 22,668
WSPRS Plan 1 1,078 76 498 – 1,652
WSPRS Plan 2 – 28 291 179 498
JRS 103 – – – 103
JRF 12 – – – 12
Notes to the Financial Statements (cont.)
Number of Participating EmployersAs of June 30, 2016
PlanComponent Units of the
State of Washington Counties/Municipalities School DistrictsOther Political
Subdivisions Total
PERS Plan 1 115 123 191 120 549
PERS Plan 2 153 278 – 515 946
PERS Plan 3 145 212 – 330 687
SERS Plan 2 – – 307 – 307
SERS Plan 3 – – 306 – 306
PSERS Plan 2 6 64 – 1 71
TRS Plan 1 31 – 189 – 220
TRS Plan 2 28 – 305 – 333
TRS Plan 3 40 – 310 – 350
LEOFF Plan 1 – 23 – 6 29
LEOFF Plan 2 8 204 – 164 376
WSPRS Plan 1 1 – – – 1
WSPRS Plan 2 1 – – – 1
JRS – – – – –
JRF – – – – –
Employers can participate in multiple systems and/or plans. The actual total number of participating employers as of June 30, 2016, is 1,336. Of that number, 153 are component units of the state. For a list of covered employers, refer to the Statistical Section of this report.

Comprehensive Annual Financial Report — Financial Section s DRS 47
B. System and Plan Descriptions
Public Employees’ Retirement System (PERS)Administration: PERS was established in 1947, and its retirement benefit provisions are contained in Chapters 41.34 and 41.40 RCW. PERS is a cost-sharing, multiple-employer retirement system composed of three separate pension plans for membership purposes. PERS Plan 1 and PERS Plan 2 are defined benefit plans, and PERS Plan 3 is a defined benefit plan with a defined contribution component.
PERS members include elected officials, state employees, employees of local governments and higher education employees not participating in higher education retirement programs (HERPs).
PERS is composed of and reported as three separate plans for accounting purposes: Plan 1, Plan 2/3 and Plan 3. Plan 1 accounts for the defined benefits of Plan 1 members. Plan 2/3 accounts for the defined benefits of Plan 2 members and the defined benefit portion of benefits for Plan 3 members. Plan 3 accounts for the defined contribution portion of benefits for Plan 3 members.
Although employees can only be a member of either Plan 2 or Plan 3, the defined benefits of Plan 2 and Plan 3 are accounted for in the same pension trust fund. All assets of Plan 2/3 may legally be used to pay the defined benefits of any of the Plan 2 or Plan 3 members or beneficiaries. Therefore, Plan 2/3 is considered a single plan for accounting purposes.
PERS Plan 1As of June 30, 2016, 435 employers and 703 nonemployer contributing entities were participating in PERS Plan 1. The plan is closed to new entrants.
Plan Membership: As of June 30, 2016, PERS Plan 1 membership consisted of the following:
PERS Plan 1
Inactive Plan Members or Beneficiaries Currently Receiving Benefits 49,417
Inactive Plan Members Entitled to But Not Yet Receiving Benefits 827
Active Plan Members 3,230
Total Membership 53,474
Vesting: PERS Plan 1 members became vested after the completion of five years of eligible service.
Benefits Provided: PERS Plan 1 provides retirement, disability and death benefits. Retirement benefits are calculated as 2% times the member’s Average Final Compensation (AFC) times the member’s years of service. AFC is the average of the member’s 24 consecutive highest-paid service credit months. Members are eligible for retirement from active status at any age with at least 30 years of service, at age 55 with at least 25 years of service or at age 60 with at least five years of service.
PERS Plan 1 retirement benefits are actuarially reduced if a survivor benefit is chosen. Members retiring from inactive status before the age of 65 may also receive actuarially reduced benefits. Other benefits include duty and nonduty disability payments, an optional Cost-of-Living Adjustment (COLA), and a duty-related death benefit, if determined eligible by the Washington State Department of Labor & Industries.
Contributions: The PERS Plan 1 member contribution rate is established by statute at 6%. The employer contribution rate is developed by the Office of the State Actuary (OSA) and includes an administrative expense component that is currently set at 0.18%.
The PERS Plan 1 required contribution rates (expressed as a percentage of covered payroll) at the close of fiscal year 2016 were as follows:
PERS Plan 1
Actual Contribution Rates Employer Employee
State Agencies 11.18% 6.00%
Local Governmental Units 11.18% 6.00%
InvestmentsInvestment Policy: The WSIB has been authorized by statute as having investment management responsibility for the pension funds. The WSIB manages retirement fund assets to maximize return at a prudent level of risk.
Retirement funds are invested in the Commingled Trust Fund (CTF). The CTF is a diversified pool of investments that invests in fixed income, public equity, private
Notes to the Financial Statements (cont.)

48 DRS s Financial Section — Comprehensive Annual Financial Report
equity, real estate and tangible assets. Investment decisions are made within the framework of a Strategic Asset Allocation Policy and a series of WSIB-adopted investment policies for the various asset classes.
General information about the retirement funds’ investments, valuation, classifications, concentrations and maturities can be found in “Note 1: Summary of Significant Accounting Policies and Plan Asset Matters.”
Rate of Return1: For the fiscal year ended June 30, 2016, the annual money-weighted rate of return on PERS Plan 1 pension investments, net of pension plan investment expense, was 2.19%. This money-weighted rate of return expresses investment performance, net of pension plan investment expense, and reflects both the size and timing of cash flows.
Net Pension Liability of Participating EmployersThe components of the net pension liability of PERS Plan 1 as of June 30, 2016, were as follows:
PERS Plan 1Dollars in Thousands
Total Pension Liability $ 12,496,872
Plan Fiduciary Net Position (7,126,401)
Participating Employers’ Net Pension Liability $ 5,370,471
Plan Fiduciary Net Position as a Percentage of the Total Pension Liability
57.03%
Actuarial Assumptions2: The total pension liability was determined by an actuarial valuation as of June 30, 2015, with the results rolled forward to June 30, 2016, using the following actuarial assumptions, applied to all prior periods included in the measurement:
PERS Plan 1
Inflation 3.0% total economic inflation, 3.75% salary inflation
Salary Increases
In addition to the base 3.75% salary inflation assumption, salaries are also expected to grow by promotions and longevity.
Investment Rate of Return
7.50%
Mortality rates were based on the RP-2000 report’s Combined Healthy Table and Combined Disabled
Table, which the Society of Actuaries published. The OSA applied offsets to the base table and recognized future improvements in mortality by projecting the mortality rates using 100% Scale BB. Mortality rates are applied on a generational basis, meaning members are assumed to receive additional mortality improvements in each future year throughout their lifetimes.
The actuarial assumptions used in the June 30, 2015, valuation were based on the results of the 2007-2012 Experience Study Report. Additional assumptions for subsequent events and law changes are current as of the 2015 actuarial valuation report.
The long-term expected rate of return on pension plan investments was determined using a building-block method in which the WSIB develops a best estimate of expected future rates of return (expected returns net of pension plan investment expense but including inflation) for each major asset class. Those expected returns make up one component of the WSIB’s Capital Market Assumptions (CMAs).
The CMAs contain three pieces of information for each class of assets the WSIB currently invests in:
• Expected annual return• Standard deviation of the annual return• Correlations between the annual returns of each
asset class with every other asset class
The WSIB uses the CMAs and their target asset allocation to simulate future investment returns over various time horizons.
The Office of the State Actuary (OSA) selected a 7.50% long-term expected rate of return on pension plan investments. In selecting this assumption, OSA reviewed the historical experience data, considered the historical conditions that produced past annual investment returns, and considered CMAs and simulated expected investment returns the WSIB provided. See the 2015 Report on Financial Condition and Economic Experience Study on the OSA website for additional
Notes to the Financial Statements (cont.)
¹ The Washington State Investment Board provided the money-weighted rates of return.
2 The Washington State Investment Board provided the CMAs and expected rates of return. The Office of the State Actuary relied on the CMAs in its selection of the long-term expected rate of return for purposes of GASB Statement No. 67.

Comprehensive Annual Financial Report — Financial Section s DRS 49
information on how this assumption was selected.
Best estimates of arithmetic real rates of return for each major asset class included in the pension plan’s target asset allocation as of June 30, 2016, are summarized in the following table:
PERS Plan 1
Asset Class Target AllocationLong-Term Expected Real Rate of Return
Fixed Income 20.00% 1.70%
Tangible Assets 5.00% 4.40%
Real Estate 15.00% 5.80%
Global Equity 37.00% 6.60%
Private Equity 23.00% 9.60%
The inflation component used to create the table above is 2.20% and represents the WSIB’s most recent long-term estimate of broad economic inflation.
Discount Rate: The discount rate used to measure the total pension liability was 7.50%. To determine the discount rate, an asset sufficiency test was completed to test whether the pension plan’s fiduciary net position was sufficient to make all projected future benefit payments of current plan members. Consistent with current law, the completed asset sufficiency test included an assumed 7.70% long-term discount rate to determine funding liabilities for calculating future contribution rate requirements. Consistent with the long-term expected rate of return, a 7.50% future investment rate of return on invested assets was assumed for the test.
Contributions from plan members and employers are assumed to continue to be made at contractually required rates (including PERS Plan 2/3, PSERS Plan 2 and SERS Plan 2/3 employers, whose rates include a component for the PERS Plan 1 liability). Based on those assumptions, the pension plan’s fiduciary net position was projected to be available to make all projected future benefit payments of current plan members. Therefore, the long-term expected rate of return of 7.50% on pension plan investments was applied to determine the total pension liability.
Sensitivity of the Net Pension Liability to Changes in the Discount Rate: The following table presents the net pension liability of the employers calculated using the
discount rate of 7.50% as well as what the employers’ net pension liability would be if it were calculated using a discount rate that is 1 percentage point lower (6.50%) or 1 percentage point higher (8.50%) than the current rate.
PERS Plan 1Dollars in Thousands
1% Decrease (6.50%)
Current Discount Rate (7.50%)
1% Increase (8.50%)
Employers’ Net Pension Liability
$ 6,476,248 $ 5,370,471 $ 4,418,882
PERS Plan 2/3As of June 30, 2016, 794 employers were participating in PERS Plan 2/3.
Plan Membership: As of June 30, 2016, PERS Plan 2/3 membership consisted of the following:
PERS Plan 2/3
Plan 2 Plan 3
Inactive Plan Members or Beneficiaries Currently Receiving Benefits
42,706 3,693
Inactive Plan Members Entitled to But Not Yet Receiving Benefits
54,916 5,238
Active Plan Members 120,099 32,923
Total Membership 217,721 41,854
Vesting: PERS Plan 2 members are vested after completing five years of eligible service. Plan 3 members are vested in the defined benefit portion of their plan after 10 years of service or after five years of service if 12 months of that service was earned after age 44.
Benefits Provided: PERS Plan 2/3 provides retirement, disability and death benefits. Retirement benefits for Plan 2 are calculated as 2% times the member’s Average Final Compensation (AFC) times the member’s years of service. Retirement defined benefits for Plan 3 are calculated using 1% times the member’s AFC times the member’s years of service. AFC is the monthly average of the member’s 60 consecutive highest-paid service credit months.
Members are eligible for retirement with a full benefit at 65 with at least five years of service credit. Retirement before age 65 is considered an early retirement. PERS
Notes to the Financial Statements (cont.)

50 DRS s Financial Section — Comprehensive Annual Financial Report
Plan 2/3 members who have at least 20 years of service credit and are 55 years of age or older are eligible for early retirement with a reduced benefit. The benefit is reduced by a factor that varies according to age for each year before age 65.
PERS Plan 2/3 retirement benefits are actuarially reduced if a survivor benefit is chosen.
Other PERS Plan 2/3 benefits include duty and nonduty disability payments; a Cost-of-Living Adjustment (COLA) based on the Consumer Price Index, capped at 3% annually; and a duty-related death benefit, if determined eligible by the Washington State Department of Labor & Industries.
Contributions: The PERS Plan 2/3 employer and employee contribution rates are developed by the Office of the State Actuary (OSA) to fully fund Plan 2 and the defined benefit portion of Plan 3. The Plan 2/3 employer rates include an administrative expense that is currently set at 0.18% and a component to address the PERS Plan 1 unfunded actuarial accrued liability.
The PERS Plan 2/3 required contribution rates (expressed as a percentage of covered payroll) at the close of fiscal year 2016 were as follows:
PERS Plan 2/3
Actual Contribution Rates EmployerEmployee
Plan 2Employee
Plan 3
State Agencies 11.18% 6.12% 0%
Local Governmental Units 11.18% 6.12% 0%
InvestmentsInvestment Policy: The WSIB has been authorized by statute as having investment management responsibility for the pension funds. The WSIB manages retirement fund assets to maximize return at a prudent level of risk.
Retirement funds are invested in the Commingled Trust Fund (CTF). The CTF is a diversified pool of investments that invests in fixed income, public equity, private
equity, real estate and tangible assets. Investment decisions are made within the framework of a Strategic Asset Allocation Policy and a series of WSIB-adopted investment policies for the various asset classes.
General information about the retirement funds’ investments, valuation, classifications, concentrations and maturities can be found in “Note 1: Summary of Significant Accounting Policies and Plan Asset Matters.”
Rate of Return1: For the fiscal year ended June 30, 2016, the annual money-weighted rate of return on PERS Plan 2/3 pension investments, net of pension plan investment expense, was 2.47%. This money-weighted rate of return expresses investment performance, net of pension plan investment expense, and reflects both the size and timing of cash flows.
Net Pension Liability of Participating EmployersThe components of the net pension liability of PERS Plan 2/3 as of June 30, 2016, were as follows:
PERS Plan 2/3Dollars in Thousands
Total Pension Liability $ 35,517,545
Plan Fiduciary Net Position (30,482,624)
Participating Employers’ Net Pension Liability $ 5,034,921
Plan Fiduciary Net Position as a Percentage of the Total Pension Liability
85.82%
Actuarial Assumptions2: The total pension liability was determined by an actuarial valuation as of June 30, 2015, with the results rolled forward to June 30, 2016, using the following actuarial assumptions, applied to all prior periods included in the measurement:
PERS Plan 2/3
Inflation 3.0% total economic inflation, 3.75% salary inflation
Salary Increases
In addition to the base 3.75% salary inflation assumption, salaries are also expected to grow by promotions and longevity.
Investment Rate of Return
7.50%
Notes to the Financial Statements (cont.)
¹ The Washington State Investment Board provided the money-weighted rates of return.
2 The Washington State Investment Board provided the CMAs and expected rates of return. The Office of the State Actuary relied on the CMAs in its selection of the long-term expected rate of return for purposes of GASB Statement No. 67.

Comprehensive Annual Financial Report — Financial Section s DRS 51
Mortality rates were based on the RP-2000 report’s Combined Healthy Table and Combined Disabled Table, which the Society of Actuaries published. The OSA applied offsets to the base table and recognized future improvements in mortality by projecting the mortality rates using 100% Scale BB. Mortality rates are applied on a generational basis, meaning members are assumed to receive additional mortality improvements in each future year throughout their lifetimes.
The actuarial assumptions used in the June 30, 2015, valuation were based on the results of the 2007-2012 Experience Study Report. Additional assumptions for subsequent events and law changes are current as of the 2015 actuarial valuation report.
The long-term expected rate of return on pension plan investments was determined using a building-block method in which the WSIB develops a best estimate of expected future rates of return (expected returns net of pension plan investment expense but including inflation) for each major asset class. Those expected returns make up one component of the WSIB’s Capital Market Assumptions (CMAs).
The CMAs contain three pieces of information for each class of assets the WSIB currently invests in:
• Expected annual return• Standard deviation of the annual return• Correlations between the annual returns of each
asset class with every other asset class
The WSIB uses the CMAs and their target asset allocation to simulate future investment returns over various time horizons.
The Office of the State Actuary (OSA) selected a 7.50% long-term expected rate of return on pension plan investments. In selecting this assumption, OSA reviewed the historical experience data, considered the historical conditions that produced past annual investment returns, and considered CMAs and simulated expected investment returns the WSIB provided. See the 2015 Report on Financial Condition and Economic Experience Study on the OSA website for additional information on how this assumption was selected.
Best estimates of arithmetic real rates of return for each major asset class included in the pension plan’s target asset allocation as of June 30, 2016, are summarized in the following table:
PERS Plan 2/3
Asset Class Target AllocationLong-Term Expected Real Rate of Return
Fixed Income 20.00% 1.70%
Tangible Assets 5.00% 4.40%
Real Estate 15.00% 5.80%
Global Equity 37.00% 6.60%
Private Equity 23.00% 9.60%
The inflation component used to create the table above is 2.20% and represents the WSIB’s most recent long-term estimate of broad economic inflation.
Discount Rate: The discount rate used to measure the total pension liability was 7.50%. To determine the discount rate, an asset sufficiency test was completed to test whether the pension plan’s fiduciary net position was sufficient to make all projected future benefit payments of current plan members. Consistent with current law, the completed asset sufficiency test included an assumed 7.70% long-term discount rate to determine funding liabilities for calculating future contribution rate requirements. Consistent with the long-term expected rate of return, a 7.50% future investment rate of return on invested assets was assumed for the test.
Contributions from plan members and employers are assumed to continue to be made at contractually required rates. Based on those assumptions, the pension plan’s fiduciary net position was projected to be available to make all projected future benefit payments of current plan members. Therefore, the long-term expected rate of return of 7.50% on pension plan investments was applied to determine the total pension liability.
Sensitivity of the Net Pension Liability to Changes in the Discount Rate: The table on the top of page 52 presents the net pension liability of the employers calculated using the discount rate of 7.50% as well as what the employers’ net pension liability would be if it were calculated using a discount rate that is 1 percentage
Notes to the Financial Statements (cont.)

52 DRS s Financial Section — Comprehensive Annual Financial Report
point lower (6.50%) or 1 percentage point higher (8.50%) than the current rate.
PERS Plan 2/3Dollars in Thousands
1% Decrease (6.50%)
Current Discount Rate (7.50%)
1% Increase (8.50%)
Employers’ Net Pension Liability
$ 9,270,195 $ 5,034,921 $ (2,620,967)
PERS Plan 3As of June 30, 2016, 543 employers were participating in PERS Plan 3.
Plan Membership: As of June 30, 2016, PERS Plan 3 membership consisted of the following:
PERS Plan 3
Inactive Plan Members or Beneficiaries Currently Receiving Benefits 3,693
Inactive Plan Members Entitled to But Not Yet Receiving Benefits 5,238
Active Plan Members 32,923
Total Membership 41,854
Vesting: PERS Plan 3 members are immediately vested in the defined contribution portion of their plan.
Benefits Provided: PERS Plan 3 defined contribution benefits are totally dependent on employee contributions and investment earnings on those contributions.
Contributions: PERS Plan 3 members choose their contribution rate when joining membership and can change rates only when changing employers. As established by Chapter 41.34 RCW, Plan 3 defined contribution rates are set at a minimum of 5% and a maximum of 15%; members have six rate options. Employers do not contribute to the defined contribution benefits.
School Employees’ Retirement System (SERS)Administration: The Legislature created SERS in 1998, and the plan became effective in 2000. SERS retirement benefit provisions are established in Chapters 41.34 and 41.35 RCW. SERS members include classified employees of school districts and educational service districts. SERS is a cost-sharing, multiple-employer retirement system composed of two separate plans for
membership purposes. SERS Plan 2 is a defined benefit plan, and SERS Plan 3 is a defined benefit plan with a defined contribution component.
Although employees can only be a member of either Plan 2 or Plan 3, the defined benefit portions of Plan 2 and Plan 3 are accounted for in the same pension trust fund. All assets of the Plan 2/3 defined benefit plan may legally be used to pay the defined benefits of any of the Plan 2 or Plan 3 members or beneficiaries. Therefore, Plan 2/3 is considered to be a single plan for accounting purposes. Plan 3 accounts for the defined contribution portion of benefits for Plan 3 members.
SERS Plan 2/3As of June 30, 2016, 307 employers were participating in SERS Plan 2/3.
Plan Membership: As of June 30, 2016, SERS Plan 2/3 membership consisted of the following:
SERS Plan 2/3
Plan 2 Plan 3
Inactive Plan Members or Beneficiaries Currently Receiving Benefits
7,391 6,715
Inactive Plan Members Entitled to But Not Yet Receiving Benefits
5,704 7,899
Active Plan Members 26,127 32,409
Total Membership 39,222 47,023
Vesting: SERS Plan 2 members are vested after completing five years of eligible service. SERS Plan 3 members are vested in the defined benefit portion of their plan after 10 years of service or after five years of service if 12 months of that service was earned after age 44.
Benefits Provided: SERS Plan 2/3 provides retirement, disability and death benefits. Retirement benefits for Plan 2 are calculated as 2% times the member’s Average Final Compensation (AFC) times the member’s years of service for Plan 2. Retirement benefits for Plan 3 are calculated using 1% times the member’s AFC times the member’s years of service. AFC is the monthly average of the member’s 60 consecutive highest-paid service credit months.
Members are eligible for retirement with a full benefit at
Notes to the Financial Statements (cont.)

Comprehensive Annual Financial Report — Financial Section s DRS 53
65 with at least five years of service credit. Retirement before age 65 is considered an early retirement. SERS members who have at least 20 years of service credit and are 55 years of age or older are eligible for early retirement with a reduced benefit. The benefit is reduced by a factor that varies according to age for each year before age 65.
SERS Plan 2/3 retirement benefits are actuarially reduced if a survivor benefit is chosen.
Other SERS Plan 2/3 benefits include duty and nonduty disability payments; a Cost-of-Living Adjustment (COLA) based on the Consumer Price Index, capped at 3% annually; and a duty-related death benefit, if determined eligible by the Washington State Department of Labor & Industries.
Contributions: The SERS Plan 2/3 employer and employee contribution rates are developed by the Office of the State Actuary (OSA) to fully fund the defined benefits of Plan 2/3. The employer rate includes an administrative expense currently set at 0.18% and a component to address the PERS Plan 1 unfunded actuarial accrued liability.
The SERS Plan 2/3 required defined benefit contribution rates (expressed as a percentage of covered payroll) at the close of fiscal year 2016 were as follows:
SERS Plan 2/3
Actual Contribution Rates EmployerEmployee
Plan 2Employee
Plan 3
State Agencies 11.58% 5.63% 0%
Local Governmental Units 11.58% 5.63% 0%
InvestmentsInvestment Policy: The WSIB has been authorized by statute as having investment management responsibility for the pension funds. The WSIB manages retirement fund assets to maximize return at a prudent level of risk.
Retirement funds are invested in the Commingled Trust
Fund (CTF). The CTF is a diversified pool of investments that invests in fixed income, public equity, private equity, real estate and tangible assets. Investment decisions are made within the framework of a Strategic Asset Allocation Policy and a series of WSIB-adopted investment policies for the various asset classes.
General information about the retirement funds’ investments, valuation, classifications, concentrations and maturities can be found in “Note 1: Summary of Significant Accounting Policies and Plan Asset Matters.”
Rate of Return1: For the fiscal year ended June 30, 2016, the annual money-weighted rate of return on SERS Plan 2/3 pension investments, net of pension plan investment expense, was 2.49%. This money-weighted rate of return expresses investment performance, net of pension plan investment expense, and reflects both the size and timing of cash flows.
Net Pension Liability of Participating EmployersThe components of the net pension liability of SERS Plan 2/3 as of June 30, 2016, were as follows:
SERS Plan 2/3Dollars in Thousands
Total Pension Liability $ 4,870,806
Plan Fiduciary Net Position (4,214,039)
Participating Employers’ Net Pension Liability $ 656,767
Plan Fiduciary Net Position as a Percentage of the Total Pension Liability
86.52%
Actuarial Assumptions2: The total pension liability was determined by an actuarial valuation as of June 30, 2015, with the results rolled forward to June 30, 2016, using the following actuarial assumptions, applied to all prior periods included in the measurement:
SERS Plan 2/3
Inflation 3.0% total economic inflation, 3.75% salary inflation
Salary Increases
In addition to the base 3.75% salary inflation assumption, salaries are also expected to grow by promotions and longevity.
Investment Rate of Return
7.50%
Notes to the Financial Statements (cont.)
1 The Washington State Investment Board provided the money-weighted rates of return.
2 The Washington State Investment Board provided the CMAs and expected rates of return. The Office of the State Actuary relied on the CMAs in its selection of the long-term expected rate of return for purposes of GASB Statement No. 67.

54 DRS s Financial Section — Comprehensive Annual Financial Report
Mortality rates were based on the RP-2000 report’s Combined Healthy Table and Combined Disabled Table, which the Society of Actuaries published. The OSA applied offsets to the base table and recognized future improvements in mortality by projecting the mortality rates using 100% Scale BB. Mortality rates are applied on a generational basis, meaning members are assumed to receive additional mortality improvements in each future year throughout their lifetimes.
The actuarial assumptions used in the June 30, 2015, valuation were based on the results of the 2007-2012 Experience Study Report. Additional assumptions for subsequent events and law changes are current as of the 2015 actuarial valuation report.
The long-term expected rate of return on pension plan investments was determined using a building-block method in which the WSIB develops a best estimate of expected future rates of return (expected returns net of pension plan investment expense but including inflation) for each major asset class. Those expected returns make up one component of the WSIB’s Capital Market Assumptions (CMAs).
The CMAs contain three pieces of information for each class of assets the WSIB currently invests in:
• Expected annual return• Standard deviation of the annual return• Correlations between the annual returns of each
asset class with every other asset class
The WSIB uses the CMAs and their target asset allocation to simulate future investment returns over various time horizons.
The Office of the State Actuary (OSA) selected a 7.50% long-term expected rate of return on pension plan investments. In selecting this assumption, OSA reviewed the historical experience data, considered the historical conditions that produced past annual investment returns, and considered CMAs and simulated expected investment returns the WSIB provided. See the 2015 Report on Financial Condition and Economic Experience Study on the OSA website for additional information on how this
assumption was selected.
Best estimates of arithmetic real rates of return for each major asset class included in the pension plan’s target asset allocation As of June 30, 2016, are summarized in the following table:
SERS Plan 2/3
Asset Class Target AllocationLong-Term Expected Real Rate of Return
Fixed Income 20.00% 1.70%
Tangible Assets 5.00% 4.40%
Real Estate 15.00% 5.80%
Global Equity 37.00% 6.60%
Private Equity 23.00% 9.60%
The inflation component used to create the table above is 2.20% and represents the WSIB’s most recent long-term estimate of broad economic inflation.
Discount Rate: The discount rate used to measure the total pension liability was 7.50%. To determine the discount rate, an asset sufficiency test was completed to test whether the pension plan’s fiduciary net position was sufficient to make all projected future benefit payments of current plan members. Consistent with current law, the completed asset sufficiency test included an assumed 7.70% long-term discount rate to determine funding liabilities for calculating future contribution rate requirements. Consistent with the long-term expected rate of return, a 7.50% future investment rate of return on invested assets was assumed for the test.
Contributions from members and employers are assumed to continue to be made at contractually required rates. Based on those assumptions, the pension plan’s fiduciary net position was projected to be available to make all projected future benefit payments of current plan members. Therefore, the long-term expected rate of return of 7.50% on pension plan investments was applied to determine the total pension liability.
Sensitivity of the Net Pension Liability to Changes in the Discount Rate: The table on the top of page 55 presents the net pension liability of the employers calculated using the discount rate of 7.50% as well as what the
Notes to the Financial Statements (cont.)

Comprehensive Annual Financial Report — Financial Section s DRS 55
employers’ net pension liability would be if it were calculated using a discount rate that is 1 percentage point lower (6.50%) or 1 percentage point higher (8.50%) than the current rate.
SERS Plan 2/3Dollars in Thousands
1% Decrease (6.50%)
Current Discount Rate (7.50%)
1% Increase (8.50%)
Employers’ Net Pension Liability
$ 1,600,655 $ 656,767 $ (75,324)
SERS Plan 3As of June 30, 2016, 306 employers were participating in SERS Plan 3.
Plan Membership: As of June 30, 2016, SERS Plan 3 membership consisted of the following:
SERS Plan 3
Inactive Plan Members or Beneficiaries Currently Receiving Benefits 6,715
Inactive Plan Members Entitled to But Not Yet Receiving Benefits 7,899
Active Plan Members 32,409
Total Membership 47,023
Vesting: SERS Plan 3 members are immediately vested in the defined contribution portion of their plan.
Benefits Provided: SERS Plan 3 defined contributions benefits are totally dependent on employee contributions and the investment earnings on those contributions.
Contributions: SERS Plan 3 members choose their contribution rate when joining membership and can change rates only when changing employers. As established by Chapter 41.34 RCW, Plan 3 defined contribution rates are set at a minimum of 5% and a maximum of 15%; members have six rate options. Employers do not contribute to the defined contribution benefits.
Public Safety Employees’ Retirement System (PSERS)Administration: The Legislature created PSERS in 2004, and the plan became effective July 1, 2006. PSERS retirement benefit provisions are established in Chapter 41.37 RCW. PSERS is a cost-sharing, multiple-employer
retirement system composed of a single defined benefit plan, PSERS Plan 2.
PSERS membership includes: • PERS Plans 2 and 3 employees hired before
July 1, 2006, who met the PSERS eligibility criteria and elected membership during the period of July 1, 2006, through September 30, 2006
• Employees hired on or after July 1, 2006, who meet PSERS eligibility criteria
• Covered employers of PSERS include: » Certain Washington state agencies (for
example, Department of Corrections, Department of Natural Resources, Gambling Commission, Liquor and Cannabis Board, Parks and Recreation Commission, and Washington State Patrol)
» Washington state counties » Washington state cities (except Seattle,
Spokane and Tacoma) » Correctional entities PSERS employers
form under the Interlocal Cooperation Act
To be eligible for PSERS, an employee must work full time and meet at least one of the following criteria:
• Have completed a certified criminal-justice training course with authority to arrest, conduct criminal investigations, enforce the criminal laws of Washington and carry a firearm as part of the job
• Have primary responsibility to ensure the custody and security of incarcerated or probationary individuals
• Function as a limited authority Washington peace officer, as defined in RCW 10.93.020
• Have primary responsibility to supervise eligible members who meet the above criteria
PSERS is composed of one plan for accounting purposes: Plan 2. Plan 2 accounts for the defined benefits of PSERS members.
Notes to the Financial Statements (cont.)

56 DRS s Financial Section — Comprehensive Annual Financial Report
PSERS Plan 2As of June 30, 2016, 66 employers were participating in PSERS Plan 2.
Plan Membership: As of June 30, 2016, PSERS Plan 2 membership consisted of the following:
PSERS Plan 2
Inactive Plan Members or Beneficiaries Currently Receiving Benefits 108
Inactive Plan Members Entitled to But Not Yet Receiving Benefits 400
Active Plan Members 5,481
Total Membership 5,989
Vesting: PSERS members are vested after completing five years of eligible service.
Benefits Provided: PSERS Plan 2 provides retirement, disability and death benefits. Retirement benefits are calculated using 2% times the member’s Average Final Compensation (AFC) times the member’s years of service. AFC is based on the member’s 60 consecutive highest-paid months of service credit.
Members are eligible for retirement at age 65 with five years of service, at age 60 with at least 10 years of PSERS service credit or at age 53 with 20 years of service. Benefits are actuarially reduced for each year the member’s age is less than 60 (with 10 or more service credit years in PSERS) or less than 65 (with fewer than 10 service credit years).
There is no cap on years of service credit. Retirement before age 60 is considered an early retirement, and PSERS members who retire before turning 60 receive reduced benefits. If retirement is at age 53 or older with at least 20 years of service, a 3% per year reduction for each year between age at retirement and age 60 applies. PSERS retirement benefits are actuarially reduced if a survivor benefit is chosen.
Other PSERS Plan 2 benefits include duty and nonduty disability payments, an optional Cost-of-Living Adjustment (COLA), and duty-related death benefit, if determined eligible by the Washington State Department of Labor & Industries.
Contributions: The PSERS Plan 2 employer and employee contribution rates are developed by the Office of the State Actuary (OSA) to fully fund Plan 2. The employer rate includes an administrative expense that is currently set at 0.18% and a component to address the PERS Plan 1 unfunded actuarial accrued liability.
The PSERS Plan 2 required contribution rates (expressed as a percentage of covered payroll) at the close of fiscal year 2016 were as follows:
PSERS Plan 2
Actual Contribution Rates Employer Employee
State Agencies 11.54% 6.59%
Local Governmental Units 11.54% 6.59%
InvestmentsInvestment Policy: The WSIB has been authorized by statute as having investment management responsibility for the pension funds. The WSIB manages retirement fund assets to maximize return at a prudent level of risk.
Retirement funds are invested in the Commingled Trust Fund (CTF). The CTF is a diversified pool of investments that invests in fixed income, public equity, private equity, real estate and tangible assets. Investment decisions are made within the framework of a Strategic Asset Allocation Policy and a series of WSIB-adopted investment policies for the various asset classes.
General information about the retirement funds’ investments, valuation, classifications, concentrations and maturities can be found in “Note 1: Summary of Significant Accounting Policies and Plan Asset Matters.”
Rate of Return1: For the fiscal year ended June 30, 2016, the annual money-weighted rate of return on PSERS Plan 2 pension investments, net of pension plan investment expense, was 2.75%. This money-weighted rate of return expresses investment performance, net of pension plan investment expense, and reflects both the size and timing of cash flows.
Notes to the Financial Statements (cont.)
1 The Washington State Investment Board provided the money-weighted rates of return.

Comprehensive Annual Financial Report — Financial Section s DRS 57
Net Pension Liability of Participating EmployersThe components of the net pension liability of PSERS Plan 2 as of June 30, 2016, were as follows:
PSERS Plan 2Dollars in Thousands
Total Pension Liability 443,214
Plan Fiduciary Net Position (400,716)
Participating Employers’ Net Pension Liability 42,498
Plan Fiduciary Net Position as a Percentage of the Total Pension Liability
90.41%
Actuarial Assumptions1: The total pension liability was determined by an actuarial valuation as of June 30, 2015, with the results rolled forward to June 30, 2016, using the following actuarial assumptions, applied to all prior periods included in the measurement:
PSERS Plan 2
Inflation 3.0% total economic inflation, 3.75% salary inflation
Salary Increases
In addition to the base 3.75% salary inflation assumption, salaries are also expected to grow by promotions and longevity.
Investment Rate of Return
7.50%
Mortality rates were based on the RP-2000 report’s Combined Healthy Table and Combined Disabled Table, which the Society of Actuaries published. The OSA applied offsets to the base table and recognized future improvements in mortality by projecting the mortality rates using 100% Scale BB. Mortality rates are applied on a generational basis, meaning members are assumed to receive additional mortality improvements in each future year throughout their lifetimes.
The actuarial assumptions used in the June 30, 2015, valuation were based on the results of the 2007-2012 Experience Study Report. Additional assumptions for subsequent events and law changes are current as of the 2015 actuarial valuation report.
The long-term expected rate of return on pension plan investments was determined using a building-block method in which the WSIB develops a best estimate of expected future rates of return (expected returns net of
pension plan investment expense but including inflation) for each major asset class. Those expected returns make up one component of the WSIB’s Capital Market Assumptions (CMAs).
The CMAs contain three pieces of information for each class of assets the WSIB currently invests in:
• Expected annual return• Standard deviation of the annual return• Correlations between the annual returns of each
asset class with every other asset class
The WSIB uses the CMAs and their target asset allocation to simulate future investment returns over various time horizons.
The Office of the State Actuary (OSA) selected a 7.50% long-term expected rate of return on pension plan investments. In selecting this assumption, OSA reviewed the historical experience data, considered the historical conditions that produced past annual investment returns, and considered CMAs and simulated expected investment returns the WSIB provided. See the 2015 Report on Financial Condition and Economic Experience Study on the OSA website for additional information on how this assumption was selected.
Best estimates of arithmetic real rates of return for each major asset class included in the pension plan’s target asset allocation as of June 30, 2016, are summarized in the following table:
PSERS Plan 2
Asset Class Target AllocationLong-Term Expected Real Rate of Return
Fixed Income 20.00% 1.70%
Tangible Assets 5.00% 4.40%
Real Estate 15.00% 5.80%
Global Equity 37.00% 6.60%
Private Equity 23.00% 9.60%
The inflation component used to create the table above is 2.20% and represents the WSIB’s most recent long-term estimate of broad economic inflation.
Notes to the Financial Statements (cont.)
1 The Washington State Investment Board provided the CMAs and expected rates of return. The Office of the State Actuary relied on the CMAs in its selection of the long-term expected rate of return for purposes of GASB Statement No. 67.

58 DRS s Financial Section — Comprehensive Annual Financial Report
Discount Rate: The discount rate used to measure the total pension liability was 7.50%. To determine the discount rate, an asset sufficiency test was completed to test whether the pension plan’s fiduciary net position was sufficient to make all projected future benefit payments of current plan members. Consistent with current law, the completed asset sufficiency test included an assumed 7.70% long-term discount rate to determine funding liabilities for calculating future contribution rate requirements. Consistent with the long-term expected rate of return, a 7.50% future investment rate of return on invested assets was assumed for the test.
Contributions from plan members and employers are assumed to continue to be made at contractually required rates (including PERS Plan 2/3, PSERS Plan 2 and SERS Plan 2/3 employers whose rates include a component for the PERS Plan 1 liability). Based on those assumptions, the pension plan’s fiduciary net position was projected to be available to make all projected future benefit payments of current plan members. Therefore, the long-term expected rate of return of 7.50% on pension plan investments was applied to determine the total pension liability.
Sensitivity of the Net Pension Liability to Changes in the Discount Rate: The table below presents the net pension liability of the employers calculated using the discount rate of 7.50% as well as what the employers’ net pension liability would be if it were calculated using a discount rate that is 1 percentage point lower (6.50%) or 1 percentage point higher (8.50%) than the current rate.
PSERS Plan 2Dollars in Thousands
1% Decrease (6.50%)
Current Discount Rate (7.50%)
1% Increase (8.50%)
Employers’ Net Pension Liability
$ 184,533 $ 42,498 $ (58,674)
Teachers’ Retirement System (TRS)Administration: TRS was established in 1938, and its retirement benefit provisions are contained in Chapters 41.32 and 41.34 RCW. TRS eligibility for membership requires service as a certificated public school employee working in an instructional, administrative or supervisory capacity. TRS is a cost-sharing,
multiple-employer retirement system composed of three separate plans for membership purposes: Plans 1 and 2 are defined benefit plans, and Plan 3 is a defined benefit plan with a defined contribution component.
TRS is composed of three separate plans for accounting purposes: Plan 1, Plan 2/3 and Plan 3. Plan 1 accounts for the defined benefits of Plan 1 members. Plan 2/3 accounts for the defined benefits of Plan 2 members and the defined benefit portion of benefits for Plan 3 members. Plan 3 accounts for the defined contribution portion of benefits for Plan 3 members.
Although members can only be a member of either Plan 2 or Plan 3, the defined benefit portions of Plan 2 and Plan 3 are accounted for in the same pension trust fund. All assets of the Plan 2/3 defined benefit plan may legally be used to pay the defined benefits of any of the Plan 2 or Plan 3 members or beneficiaries, as the terms of the plans define. Therefore, Plan 2/3 is considered a single plan for accounting purposes.
TRS Plan 1As of June 30, 2016, 190 employers and 119 nonemployer contributing entities were participating in TRS Plan 1. The plan is closed to new entrants.
Plan Membership: As of June 30, 2016, TRS Plan 1 membership consisted of the following:
TRS Plan 1
Inactive Plan Members or Beneficiaries Currently Receiving Benefits 34,859
Inactive Plan Members Entitled to But Not Yet Receiving Benefits 223
Active Plan Members 962
Total Membership 36,044
Vesting: TRS Plan 1 members became vested after the completion of five years of eligible service.
Benefits Provided: TRS Plan 1 provides retirement, disability and death benefits. Retirement benefits are calculated using 2% of the member’s Average Final Compensation (AFC) times the member’s years of service — up to a maximum of 60%. AFC is the average of the member’s 24 consecutive highest-paid service credit months.
Notes to the Financial Statements (cont.)

Comprehensive Annual Financial Report — Financial Section s DRS 59
Members are eligible for retirement at any age after 30 years of service, at age 60 with five years of service or at age 55 with 25 years of service. Other benefits include temporary and permanent disability payments, an optional Cost-of-Living Adjustment (COLA), and a one-time, duty-related death benefit, if found eligible by the Washington State Department of Labor & Industries.
Contributions: The TRS Plan 1 member contribution rate is set by statute at 6%. The employer contribution rate is developed by the Office of the State Actuary (OSA) and includes an administrative expense component currently set at 0.18%.
The TRS Plan 1 required contribution rates (expressed as a percentage of covered payroll) at the close of fiscal year 2016 were as follows:
TRS Plan 1
Actual Contribution Rates Employer Employee
State Agencies 13.13% 6.00%
Local Governmental Units 13.13% 6.00%
InvestmentsInvestment Policy: The WSIB has been authorized by statute as having investment management responsibility for the pension funds. The WSIB manages retirement fund assets to maximize return at a prudent level of risk.
Retirement funds are invested in the Commingled Trust Fund (CTF). The CTF is a diversified pool of investments that invests in fixed income, public equity, private equity, real estate and tangible assets. Investment decisions are made within the framework of a Strategic Asset Allocation Policy and a series of WSIB-adopted investment policies for the various asset classes.
General information about the retirement funds’ investments, valuation, classifications, concentrations and maturities can be found in “Note 1: Summary of Significant Accounting Policies and Plan Asset Matters.”
Rate of Return1: For the fiscal year ended June 30,
2016, the annual money-weighted rate of return on TRS Plan 1 pension investments, net of pension plan investment expense, was 2.09%. This money-weighted rate of return expresses investment performance, net of pension plan investment expense, and reflects both the size and timing of cash flows.
Net Pension Liability of Participating EmployersThe components of the net pension liability of TRS Plan 1 as of June 30, 2016, were as follows:
TRS Plan 1Dollars in Thousands
Total Pension Liability $ 9,001,257
Plan Fiduciary Net Position (5,587,020)
Participating Employers’ Net Pension Liability $ 3,414,237
Plan Fiduciary Net Position as a Percentage of the Total Pension Liability
62.07%
Actuarial Assumptions2: The total pension liability was determined by an actuarial valuation as of June 30, 2015, with the results rolled forward to June 30, 2016, using the following actuarial assumptions, applied to all prior periods included in the measurement:
TRS Plan 1
Inflation 3.0% total economic inflation, 3.75% salary inflation
Salary Increases
In addition to the base 3.75% salary inflation assumption, salaries are also expected to grow by promotions and longevity.
Investment Rate of Return
7.50%
Mortality rates were based on the RP-2000 report’s Combined Healthy Table and Combined Disabled Table, which the Society of Actuaries published. The OSA applied offsets to the base table and recognized future improvements in mortality by projecting the mortality rates using 100% Scale BB. Mortality rates are applied on a generational basis, meaning members are assumed to receive additional mortality improvements in each future year throughout their lifetimes.
The actuarial assumptions used in the June 30, 2015, valuation were based on the results of the 2007-2012 Experience Study Report. Additional assumptions for
Notes to the Financial Statements (cont.)
1 The Washington State Investment Board provided the money-weighted rates of return.
2 The Washington State Investment Board provided the CMAs and expected rates of return. The Office of the State Actuary relied on the CMAs in its selection of the long-term expected rate of return for purposes of GASB Statement No. 67.

60 DRS s Financial Section — Comprehensive Annual Financial Report
subsequent events and law changes are current as of the 2015 actuarial valuation report.
The long-term expected rate of return on pension plan investments was determined using a building-block method in which the WSIB develops a best estimate of expected future rates of return (expected returns net of pension plan investment expense but including inflation) for each major asset class. Those expected returns make up one component of the WSIB’s Capital Market Assumptions (CMAs).
The CMAs contain three pieces of information for each class of assets the WSIB currently invests in:
• Expected annual return• Standard deviation of the annual return• Correlations between the annual returns of each
asset class with every other asset class
The WSIB uses the CMAs and their target asset allocation to simulate future investment returns over various time horizons.
The Office of the State Actuary (OSA) selected a 7.50% long-term expected rate of return on pension plan investments. In selecting this assumption, OSA reviewed the historical experience data, considered the historical conditions that produced past annual investment returns, and considered CMAs and simulated expected investment returns the WSIB provided. See the 2015 Report on Financial Condition and Economic Experience Study on the OSA website for additional information on how this assumption was selected.
Best estimates of arithmetic real rates of return for each major asset class included in the pension plan’s target asset allocation as of June 30, 2016, are summarized in the following table:
TRS Plan 1
Asset Class Target AllocationLong-Term Expected Real Rate of Return
Fixed Income 20.00% 1.70%
Tangible Assets 5.00% 4.40%
Real Estate 15.00% 5.80%
Global Equity 37.00% 6.60%
Private Equity 23.00% 9.60%
The inflation component used to create the table above is 2.20% and represents the WSIB’s most recent long-term estimate of broad economic inflation.
Discount Rate: The discount rate used to measure the total pension liability was 7.50%. To determine the discount rate, an asset sufficiency test was completed to test whether the pension plan’s fiduciary net position was sufficient to make all projected future benefit payments of current plan members. Consistent with current law, the completed asset sufficiency test included an assumed 7.70% long-term discount rate to determine funding liabilities for calculating future contribution rate requirements. Consistent with the long-term expected rate of return, a 7.50% future investment rate of return on invested assets was assumed for the test.
Contributions from plan members and employers are assumed to continue to be made at contractually required rates (including TRS Plan 2/3 employers, whose rates include a component for the TRS Plan 1 liability). Based on those assumptions, the pension plan’s fiduciary net position was projected to be available to make all projected future benefit payments of current plan members. Therefore, the long-term expected rate of return of 7.50% on pension plan investments was applied to determine the total pension liability.
Sensitivity of the Net Pension Liability to Changes in the Discount Rate: The table below presents the net pension liability of the employers calculated using the discount rate of 7.50% as well as what the employers’ net pension liability would be if it were calculated using a discount rate that is 1 percentage point lower (6.50%) or 1 percentage point higher (8.50%) than the current rate.
TRS Plan 1Dollars in Thousands
1% Decrease (6.50%)
Current Discount Rate (7.50%)
1% Increase (8.50%)
Employers’ Net Pension Liability
$ 4,197,137 $ 3,414,237 $ 2,739,882
Notes to the Financial Statements (cont.)

Comprehensive Annual Financial Report — Financial Section s DRS 61
TRS Plan 2/3As of June 30, 2016, 306 employers were participating in TRS Plan 2/3.
Plan Membership: As of June 30, 2016, TRS Plan 2/3 membership consisted of the following:
TRS Plan 2/3
Plan 2 Plan 3
Inactive Plan Members or Beneficiaries Currently Receiving Benefits
4,700 8,866
Inactive Plan Members Entitled to But Not Yet Receiving Benefits
2,443 8,373
Active Plan Members 17,612 53,417
Total Membership 24,755 70,656
Vesting: TRS Plan 2 members are vested after completing five years of eligible service. TRS Plan 3 members are vested in the defined benefit portion of their plan after 10 years of service or after five years of service if 12 months of that service are earned after age 44.
Benefits Provided: TRS Plan 2/3 provides retirement, disability and death benefits. Retirement benefits for Plan 2 are calculated using 2% of the member’s Average Final Compensation (AFC) times the member’s years of service. Retirement defined benefits for Plan 3 are calculated using 1% of AFC times the member’s years of service. AFC is the monthly average of the member’s 60 consecutive highest-paid service credit months. TRS Plan 2/3 has no cap on years of service credit.
Members are eligible for retirement with a full benefit at 65 with at least five years of service credit. Retirement before age 65 is considered an early retirement. TRS Plan 2/3 members who have at least 20 years of service credit and are 55 years of age or older are eligible for early retirement with a reduced benefit. The benefit is reduced by a factor that varies according to age for each year before age 65. TRS Plan 2/3 retirement benefits are actuarially reduced to reflect the choice of a survivor benefit.
Other TRS Plan 2/3 benefits include duty and nonduty
disability payments; a Cost-of-Living Adjustment (COLA) based on the Consumer Price Index, capped at 3% annually; and a one-time, duty-related death benefit, if found eligible by the Washington State Department of Labor & Industries.
Contributions: The TRS Plan 2/3 member and employer contribution rates are developed by the Office of the State Actuary (OSA) to fully fund Plan 2 and the defined benefit portion of Plan 3. The Plan 2/3 employer rates include components to address the TRS Plan 1 unfunded actuarial accrued liability and an administrative expense that is currently set at 0.18%.
The TRS Plan 2/3 required contribution rates (expressed as a percentage of covered payroll) at the close of fiscal year 2016 were as follows:
TRS Plan 2/3
Actual Contribution Rates EmployerEmployee
Plan 2Employee
Plan 3
State Agencies 13.13% 5.95% 0%
Local Governmental Units 13.13% 5.95% 0%
InvestmentsInvestment Policy: The WSIB has been authorized by statute as having investment management responsibility for the pension funds. The WSIB manages retirement fund assets to maximize return at a prudent level of risk.
Retirement funds are invested in the Commingled Trust Fund (CTF). The CTF is a diversified pool of investments that invests in fixed income, public equity, private equity, real estate and tangible assets. Investment decisions are made within the framework of a Strategic Asset Allocation Policy and a series of WSIB-adopted investment policies for the various asset classes.
General information about the retirement funds’ investments, valuation, classifications, concentrations and maturities can be found in “Note 1: Summary of Significant Accounting Policies and Plan Asset Matters.”
Rate of Return1: For the fiscal year ended June 30, 2016, the annual money-weighted rate of return on
Notes to the Financial Statements (cont.)
1 The Washington State Investment Board provided the money-weighted rates of return.

62 DRS s Financial Section — Comprehensive Annual Financial Report
TRS Plan 2/3 pension investments, net of pension plan investment expense, was 2.51%. This money-weighted rate of return expresses investment performance, net of pension plan investment expense, and reflects both the size and timing of cash flows.
Net Pension Liability of Participating EmployersThe components of the net pension liability of TRS Plan 2/3 as of June 30, 2016, were as follows:
TRS Plan 2/3Dollars in Thousands
Total Pension Liability $ 12,172,222
Plan Fiduciary Net Position (10,798,925)
Participating Employers’ Net Pension Liability $ 1,373,297
Plan Fiduciary Net Position as a Percentage of the Total Pension Liability
88.72%
Actuarial Assumptions1: The total pension liability was determined by an actuarial valuation as of June 30, 2015, with the results rolled forward to June 30, 2016, using the following actuarial assumptions, applied to all prior periods included in the measurement:
TRS Plan 2/3
Inflation 3.0% total economic inflation, 3.75% salary inflation
Salary Increases
In addition to the base 3.75% salary inflation assumption, salaries are also expected to grow by promotions and longevity.
Investment Rate of Return
7.50%
Mortality rates were based on the RP-2000 report’s Combined Healthy Table and Combined Disabled Table, which the Society of Actuaries published. The OSA applied offsets to the base table and recognized future improvements in mortality by projecting the mortality rates using 100% Scale BB. Mortality rates are applied on a generational basis, meaning members are assumed to receive additional mortality improvements in each future year throughout their lifetimes.
The actuarial assumptions used in the June 30, 2015, valuation were based on the results of the 2007-2012 Experience Study Report. Additional assumptions for subsequent events and law changes are current as of the 2015 actuarial valuation report.
The long-term expected rate of return on pension plan investments was determined using a building-block method in which the WSIB develops a best estimate of expected future rates of return (expected returns net of pension plan investment expense but including inflation) for each major asset class. Those expected returns make up one component of the WSIB’s Capital Market Assumptions (CMAs).
The CMAs contain three pieces of information for each class of assets the WSIB currently invests in:
• Expected annual return• Standard deviation of the annual return• Correlations between the annual returns of each
asset class with every other asset class
The WSIB uses the CMAs and their target asset allocation to simulate future investment returns over various time horizons.
The Office of the State Actuary (OSA) selected a 7.50% long-term expected rate of return on pension plan investments. In selecting this assumption, OSA reviewed the historical experience data, considered the historical conditions that produced past annual investment returns, and considered CMAs and simulated expected investment returns the WSIB provided. See the 2015 Report on Financial Condition and Economic Experience Study on the OSA website for additional information on how this assumption was selected.
Best estimates of arithmetic real rates of return for each major asset class included in the pension plan’s target asset allocation as of June 30, 2016, are summarized in the following table:
TRS Plan 2/3
Asset Class Target AllocationLong-Term Expected Real Rate of Return
Fixed Income 20.00% 1.70%
Tangible Assets 5.00% 4.40%
Real Estate 15.00% 5.80%
Global Equity 37.00% 6.60%
Private Equity 23.00% 9.60%
Notes to the Financial Statements (cont.)
1 The Washington State Investment Board provided the CMAs and expected rates of return. The Office of the State Actuary relied on the CMAs in its selection of the long-term expected rate of return for purposes of GASB Statement No. 67.

Comprehensive Annual Financial Report — Financial Section s DRS 63
The inflation component used to create the table on page 62 is 2.20% and represents the WSIB’s most recent long-term estimate of broad economic inflation.
Discount Rate: The discount rate used to measure the total pension liability was 7.50%. To determine the discount rate, an asset sufficiency test was completed to test whether the pension plan’s fiduciary net position was sufficient to make all projected future benefit payments of current plan members. Consistent with current law, the completed asset sufficiency test included an assumed 7.70% long-term discount rate to determine funding liabilities for calculating future contribution rate requirements. Consistent with the long-term expected rate of return, a 7.50% future investment rate of return on invested assets was assumed for the test.
Contributions from plan members and employers are assumed to continue to be made at contractually required rates. Based on those assumptions, the pension plan’s fiduciary net position was projected to be available to make all projected future benefit payments of current plan members. Therefore, the long-term expected rate of return of 7.50% on pension plan investments was applied to determine the total pension liability.
Sensitivity of the Net Pension Liability to Changes in the Discount Rate: The table below presents the net pension liability of the employers calculated using the discount rate of 7.50% as well as what the employers’ net pension liability would be if it were calculated using a discount rate that is 1 percentage point lower (6.50%) or 1 percentage point higher (8.50%) than the current rate.
TRS Plan 2/3Dollars in Thousands
1% Decrease (6.50%)
Current Discount Rate (7.50%)
1% Increase (8.50%)
Employers’ Net Pension Liability
$ 3,107,958 $ 1,373,297 $ (1,595,357)
TRS Plan 3As of June 30, 2016, 311 employers were participating in TRS Plan 3.
Plan Membership: As of June 30, 2016, TRS Plan 3 membership consisted of the following:
TRS Plan 3
Inactive Plan Members or Beneficiaries Currently Receiving Benefits 8,866
Inactive Plan Members Entitled to But Not Yet Receiving Benefits 8,373
Active Plan Members 53,417
Total Membership 70,656
Vesting: TRS Plan 3 members are immediately vested in the defined contribution portion of their plan.
Benefits Provided: TRS Plan 3 defined contribution benefits are totally dependent on employee contributions and investment earnings on those contributions.
Contributions: TRS Plan 3 members choose their contribution rate when joining membership and can change rates only when changing employers. As established by Chapter 41.34 RCW, the Plan 3 defined contribution rates are set at a minimum of 5% and a maximum of 15%; members have six rate options to choose from. Employers do not contribute to the defined contribution benefits.
Law Enforcement Officers’ and Fire Fighters’ Retirement System (LEOFF)Administration: LEOFF was established in 1970, and its retirement benefit provisions are contained in Chapter 41.26 RCW. LEOFF membership includes all of the state’s full-time, fully compensated, local law enforcement commissioned officers, fire fighters and, as of July 24, 2005, emergency medical technicians.
LEOFF is a cost-sharing, multiple-employer retirement system composed of two separate pension plans for both membership and accounting purposes. Both LEOFF plans are defined benefit plans.
Notes to the Financial Statements (cont.)

64 DRS s Financial Section — Comprehensive Annual Financial Report
LEOFF Plan 1As of June 30, 2016, 29 employers were participating in LEOFF Plan 1. The plan is closed to new entrants.
Plan Membership: As of June 30, 2016, LEOFF Plan 1 membership consisted of the following:
LEOFF Plan 1
Inactive Plan Members or Beneficiaries Currently Receiving Benefits 7,431
Inactive Plan Members Entitled to But Not Yet Receiving Benefits 1
Active Plan Members 62
Total Membership 7,494
Vesting: LEOFF Plan 1 members became vested after the completion of five years of eligible service.
Benefits Provided: LEOFF Plan 1 provides retirement, disability and death benefits. Retirement benefits are determined per year of service and are calculated as a percent of Final Average Salary (FAS) as follows:
LEOFF Plan 1
Years of Service % of FAS
20+ 2%
10-19 1.5%
5-9 1.0%
FAS is the basic monthly salary received at the time of retirement, provided a member has held the same position or rank for 12 months preceding the date of retirement. Otherwise, it is the average of the consecutive highest-paid 24 months’ salary within the last 10 years of service. Members are eligible for retirement with five years of service at age 50.
Other benefits include duty and nonduty disability payments, a Cost-of-Living Adjustment (COLA), and a one-time duty-related death benefit, if found eligible by the Washington State Department of Labor & Industries.
Contributions: LEOFF Plan 1 had no required employer or employee contributions for fiscal year 2016. Employers paid only the administrative expense of 0.18% of covered payroll.
InvestmentsInvestment Policy: The WSIB has been authorized by statute as having investment management responsibility for the pension funds. The WSIB manages retirement fund assets to maximize return at a prudent level of risk.
Retirement funds are invested in the Commingled Trust Fund (CTF). The CTF is a diversified pool of investments that invests in fixed income, public equity, private equity, real estate and tangible assets. Investment decisions are made within the framework of a Strategic Asset Allocation Policy and a series of WSIB-adopted investment policies for the various asset classes.
General information about the retirement funds’ investments, valuation, classifications, concentrations and maturities can be found in “Note 1: Summary of Significant Accounting Policies and Plan Asset Matters.”
Rate of Return1: For the fiscal year ended June 30, 2016, the annual money-weighted rate of return on LEOFF Plan 1 pension investments, net of pension plan investment expense, was 2.25%. This money-weighted rate of return expresses investment performance, net of pension plan investment expense, and reflects both the size and timing of cash flows.
Net Pension Liability of Participating EmployersThe components of the net pension liability of LEOFF Plan 1 employers as of June 30, 2016, were as follows:
LEOFF Plan 1Dollars in Thousands
Total Pension Liability $ 4,340,582
Plan Fiduciary Net Position (5,370,868)
Participating Employers’ Net Pension Liability $ (1,030,286)
Plan Fiduciary Net Position as a Percentage of the Total Pension Liability
123.74%
Notes to the Financial Statements (cont.)
1 The Washington State Investment Board provided the money-weighted rates of return.

Comprehensive Annual Financial Report — Financial Section s DRS 65
Actuarial Assumptions1: The total pension liability was determined by an actuarial valuation as of June 30, 2015, with the results rolled forward to June 30, 2016, using the following actuarial assumptions, applied to all prior periods included in the measurement:
LEOFF Plan 1
Inflation 3.0% total economic inflation, 3.75% salary inflation
Salary Increases
In addition to the base 3.75% salary inflation assumption, salaries are also expected to grow by promotions and longevity.
Investment Rate of Return
7.50%
Mortality rates were based on the RP-2000 report’s Combined Healthy Table and Combined Disabled Table, which the Society of Actuaries published. The OSA applied offsets to the base table and recognized future improvements in mortality by projecting the mortality rates using 100% Scale BB. Mortality rates are applied on a generational basis, meaning members are assumed to receive additional mortality improvements in each future year throughout their lifetimes.
The actuarial assumptions used in the June 30, 2015, valuation were based on the results of the 2007-2012 Experience Study Report. Additional assumptions for subsequent events and law changes are current as of the 2015 actuarial valuation report.
The long-term expected rate of return on pension plan investments was determined using a building-block method in which the WSIB develops a best estimate of expected future rates of return (expected returns net of pension plan investment expense but including inflation) for each major asset class. Those expected returns make up one component of the WSIB’s Capital Market Assumptions (CMAs).
The CMAs contain three pieces of information for each class of assets the WSIB currently invests in:
• Expected annual return• Standard deviation of the annual return• Correlations between the annual returns of each
asset class with every other asset class
The WSIB uses the CMAs and their target asset allocation to simulate future investment returns over various time horizons.
The Office of the State Actuary (OSA) selected a 7.50% long-term expected rate of return on pension plan investments. In selecting this assumption, OSA reviewed the historical experience data, considered the historical conditions that produced past annual investment returns, and considered CMAs and simulated expected investment returns the WSIB provided. See the 2015 Report on Financial Condition and Economic Experience Study on the OSA website for additional information on how this assumption was selected.
Best estimates of arithmetic real rates of return for each major asset class included in the pension plan’s target asset allocation as of June 30, 2016, are summarized in the following table:
LEOFF Plan 1
Asset Class Target AllocationLong-Term Expected Real Rate of Return
Fixed Income 20.00% 1.70%
Tangible Assets 5.00% 4.40%
Real Estate 15.00% 5.80%
Global Equity 37.00% 6.60%
Private Equity 23.00% 9.60%
The inflation component used to create the table above is 2.20% and represents the WSIB’s most recent long-term estimate of broad economic inflation.
Discount Rate: The discount rate used to measure the total pension liability was 7.50%. To determine the discount rate, an asset sufficiency test was completed to test whether the pension plan’s fiduciary net position was sufficient to make all projected future benefit payments of current plan members. Consistent with current law, the completed asset sufficiency test included an assumed 7.70% long-term discount rate to determine funding liabilities for calculating future contribution rate requirements. Consistent with the long-term expected rate of return, a 7.50% future investment rate of return on invested assets was assumed for the test.
Notes to the Financial Statements (cont.)
1 The Washington State Investment Board provided the CMAs and expected rates of return. The Office of the State Actuary relied on the CMAs in its selection of the long-term expected rate of return for purposes of GASB Statement No. 67.

66 DRS s Financial Section — Comprehensive Annual Financial Report
Contributions from plan members and employers are assumed to continue to be made at contractually required rates. Based on those assumptions, the pension plan’s fiduciary net position was projected to be available to make all projected future benefit payments of current plan members. Therefore, the long-term expected rate of return of 7.50% on pension plan investments was applied to determine the total pension liability.
Sensitivity of the Net Pension Liability to Changes in the Discount Rate: The table below presents the net pension liability of the employers calculated using the discount rate of 7.50% as well as what the employers’ net pension liability would be if it were calculated using a discount rate that is 1 percentage point lower (6.50%) or 1 percentage point higher (8.50%) than the current rate.
LEOFF Plan 1Dollars in Thousands
1% Decrease (6.50%)
Current Discount Rate (7.50%)
1% Increase (8.50%)
Employers’ Net Pension Liability
$ (612,032) $ (1,030,286) $ (1,387,800)
LEOFF Plan 2As of June 30, 2016, 369 employers were participating in LEOFF Plan 2.
Plan Membership: As of June 30, 2016, LEOFF Plan 2 membership consisted of the following:
LEOFF Plan 2
Inactive Plan Members or Beneficiaries Currently Receiving Benefits 4,508
Inactive Plan Members Entitled to But Not Yet Receiving Benefits 839
Active Plan Members 17,321
Total Membership 22,668
Vesting: LEOFF Plan 2 members are vested after the completion of five years of eligible service.
Benefits Provided: LEOFF Plan 2 provides retirement, disability and death benefits. Retirement benefits are calculated using 2% of the member’s Final Average Salary (FAS) times the member’s years of service. FAS is the monthly average of the member’s 60 consecutive highest-paid service credit months. Members are
eligible for retirement with a full benefit at 53 with at least five years of service credit. Members who retire before age 53 receive reduced benefits. If the member has at least 20 years of service and is age 50 to 52, the reduction is 3% for each year before age 53. Otherwise, the benefits are actuarially reduced for each year before age 53. LEOFF Plan 2 retirement benefits are actuarially reduced to reflect the choice of a survivor benefit.
Other LEOFF Plan 2 benefits include duty and nonduty disability payments; a Cost-of-Living Allowance based on the Consumer Price Index, capped at 3% annually; and a one-time, duty-related death benefit, if found eligible by the Washington State Department of Labor & Industries.
Contributions: The LEOFF Plan 2 employer and employee contribution rates are developed by the Office of the State Actuary (OSA) to fully fund Plan 2. The employer rate includes an administrative expense component set at 0.18%.
The LEOFF Plan 2 required contribution rates (expressed as a percentage of covered payroll) at the close of fiscal year 2016 were as follows:
LEOFF Plan 2
Actual Contribution Rates Employer Employee
Local Governmental Units 5.23% 8.41%
Ports and Universities 8.59% 8.41%
InvestmentsInvestment Policy: The WSIB has been authorized by statute as having investment management responsibility for the pension funds. The WSIB manages retirement fund assets to maximize return at a prudent level of risk.
Retirement funds are invested in the Commingled Trust Fund (CTF). The CTF is a diversified pool of investments that invests in fixed income, public equity, private equity, real estate and tangible assets. Investment decisions are made within the framework of a Strategic Asset Allocation Policy and a series of WSIB-adopted investment policies for the various asset classes.
General information about the retirement funds’
Notes to the Financial Statements (cont.)

Comprehensive Annual Financial Report — Financial Section s DRS 67
investments, valuation, classifications, concentrations and maturities can be found in “Note 1: Summary of Significant Accounting Policies and Plan Asset Matters.”
Rate of Return1: For the fiscal year ended June 30, 2016, the annual money-weighted rate of return on LEOFF Plan 2 pension investments, net of pension plan investment expense, was 2.48%. This money-weighted rate of return expresses investment performance, net of pension plan investment expense, and reflects both the size and timing of cash flows.
Net Pension Liability of Participating EmployersThe components of the net pension liability of the participating LEOFF Plan 2 employers as of June 30, 2016, were as follows:
LEOFF Plan 2Dollars in Thousands
Total Pension Liability $ 9,628,990
Plan Fiduciary Net Position (10,210,620)
Participating Employers’ Net Pension Liability $ (581,630)
Plan Fiduciary Net Position as a Percentage of the Total Pension Liability
106.04%
Actuarial Assumptions2: The total pension liability was determined by an actuarial valuation as of June 30, 2015, with the results rolled forward to June 30, 2016, using the following actuarial assumptions, applied to all prior periods included in the measurement:
LEOFF Plan 2
Inflation 3.0% total economic inflation, 3.75% salary inflation
Salary Increases
In addition to the base 3.75% salary inflation assumption, salaries are also expected to grow by promotions and longevity.
Investment Rate of Return
7.50%
Mortality rates were based on the RP-2000 report’s Combined Healthy Table and Combined Disabled Table, which the Society of Actuaries published. The OSA applied offsets to the base table and recognized future improvements in mortality by projecting the mortality rates using 100% Scale BB. Mortality rates are
applied on a generational basis, meaning members are assumed to receive additional mortality improvements in each future year throughout their lifetimes.
The actuarial assumptions used in the June 30, 2015, valuation were based on the results of the 2007-2012 Experience Study Report. Additional assumptions for subsequent events and law changes are current as of the 2015 actuarial valuation report.
The long-term expected rate of return on pension plan investments was determined using a building-block method in which the WSIB develops a best estimate of expected future rates of return (expected returns net of pension plan investment expense but including inflation) for each major asset class. Those expected returns make up one component of the WSIB’s Capital Market Assumptions (CMAs).
The CMAs contain three pieces of information for each class of assets the WSIB currently invests in:
• Expected annual return• Standard deviation of the annual return• Correlations between the annual returns of each
asset class with every other asset class
The WSIB uses the CMAs and their target asset allocation to simulate future investment returns over various time horizons.
The Office of the State Actuary (OSA) selected a 7.50% long-term expected rate of return on pension plan investments. In selecting this assumption, OSA reviewed the historical experience data, considered the historical conditions that produced past annual investment returns, and considered CMAs and simulated expected investment returns the WSIB provided. See the 2015 Report on Financial Condition and Economic Experience Study on the OSA website for additional information on how this assumption was selected.
Best estimates of arithmetic real rates of return for each
Notes to the Financial Statements (cont.)
1 The Washington State Investment Board provided the money-weighted rates of return.
2 The Washington State Investment Board provided the CMAs and expected rates of return. The Office of the State Actuary relied on the CMAs in its selection of the long-term expected rate of return for purposes of GASB Statement No. 67.

68 DRS s Financial Section — Comprehensive Annual Financial Report
major asset class included in the pension plan’s target asset allocation as of June 30, 2016, are summarized in the following table:
LEOFF Plan 2
Asset Class Target AllocationLong-Term Expected Real Rate of Return
Fixed Income 20.00% 1.70%
Tangible Assets 5.00% 4.40%
Real Estate 15.00% 5.80%
Global Equity 37.00% 6.60%
Private Equity 23.00% 9.60%
The inflation component used to create the table above is 2.20% and represents the WSIB’s most recent long-term estimate of broad economic inflation.
Discount Rate: The discount rate used to measure the total pension liability was 7.50%. To determine the discount rate, an asset sufficiency test was completed to test whether the pension plan’s fiduciary net position was sufficient to make all projected future benefit payments of current plan members. Consistent with current law, the completed asset sufficiency test included an assumed 7.50% long-term discount rate to determine funding liabilities for calculating future contribution rate requirements. Consistent with the long-term expected rate of return, a 7.50% future investment rate of return on invested assets was assumed for the test.
Contributions from plan members and employers are assumed to continue to be made at contractually required rates. Based on those assumptions, the pension plan’s fiduciary net position was projected to be available to make all projected future benefit payments of current plan members. Therefore, the long-term expected rate of return of 7.50% on pension plan investments was applied to determine the total pension liability.
Sensitivity of the Net Pension Liability to Changes in the Discount Rate: The table below presents the net pension liability of the employers calculated using the discount rate of 7.50% as well as what the employers’ net pension liability would be if it were calculated using a discount rate that is 1 percentage point lower (6.50%) or 1 percentage point higher (8.50%) than the current rate.
LEOFF Plan 2Dollars in Thousands
1% Decrease (6.50%)
Current Discount Rate (7.50%)
1% Increase (8.50%)
Employers’ Net Pension Liability
$ 1,631,051 $ (581,630) $ (2,249,349)
Washington State Patrol Retirement System (WSPRS)Administration: WSPRS was established by the Legislature in 1947, and its retirement benefit provisions are contained in Chapter 43.43 RCW. WSPRS is a single-employer retirement system composed of two separate pension plans, and membership includes only commissioned employees of the Washington State Patrol.
WSPRS Plan 1 and WSPRS Plan 2 are defined benefit plans. The plans are reported together for financial reporting and investment purposes in the same pension fund. All assets of this combined Plan 1/2 may legally be used to pay the defined benefits of any WSPRS members or beneficiaries, as the terms of the plans define.
WSPRS Plan 1/2As of June 30, 2016, one employer was participating in WSPRS.
Plan Membership: As of June 30, 2016, membership consisted of the following:
WSPRS Plan 1/2
Plan 1 Plan 2
Inactive Plan Members or Beneficiaries Currently Receiving Benefits
1,078 0
Inactive Plan Members Entitled to But Not Yet Receiving Benefits
76 28
Active Plan Members 498 470
Total Membership 1,652 498
Vesting: Active WSPRS Plan 1 and Plan 2 members do not have to meet a vesting requirement. Inactive WSPRS members are vested after the completion of five years of eligible service.
Plan 1 is closed to new entrants. All new WSPRS members are enrolled in Plan 2.
Notes to the Financial Statements (cont.)

Comprehensive Annual Financial Report — Financial Section s DRS 69
1 The Washington State Investment Board provided the money-weighted rates of return.
2 The Washington State Investment Board provided the CMAs and expected rates of return. The Office of the State Actuary relied on the CMAs in its selection of the long-term expected rate of return for purposes of GASB Statement No. 67.
Benefits Provided: WSPRS Plans 1 and 2 provide retirement, disability and death benefits. Retirement benefits are calculated using 2% of the member’s Average Final Salary (AFS) times the member’s years of service, capped at 75%. For Plan 1 members, AFS is based on the average of the member’s 24 consecutive highest-paid service credit months. For Plan 2 members, AFS is based on the average of the member’s 60 consecutive highest-paid service credit months.
Active members are eligible for retirement at age 55 with no minimum required service credit or at any age with 25 years of service credit. Members must retire no later than the first of the month following the month they reach age 65, unless the member is chief of the Washington State Patrol. WSPRS retirement benefits are actuarially reduced to reflect the choice of a survivor benefit.
Other benefits include a Cost-of-Living Adjustment (COLA), death benefits and a one-time, duty-related death benefit, if found eligible by the Washington State Department of Labor & Industries.
Contributions: The WSPRS Plans 1 and 2 employer and employee contribution rates are developed by the Office of the State Actuary (OSA) to fully fund WSPRS. The employer rate includes an administrative expense component currently set a 0.18%.
The WSPRS required contribution rates (expressed as a percentage of covered payroll) at the close of fiscal year 2016 were as follows:
WSPRS Plan 1/2
Actual Contribution Rates Employer Employee
State Agencies 8.34% 6.84%
InvestmentsInvestment Policy: The WSIB has been authorized by statute as having investment management responsibility for the pension funds. The WSIB manages retirement fund assets to maximize return at a prudent level of risk.
Retirement funds are invested in the Commingled Trust Fund (CTF). The CTF is a diversified pool of investments that invests in fixed income, public equity, private equity, real estate and tangible assets. Investment decisions are made within the framework of a Strategic Asset Allocation Policy and a series of WSIB-adopted investment policies for the various asset classes.
General information about the retirement funds’ investments, valuation, classifications, concentrations and maturities can be found in “Note 1: Summary of Significant Accounting Policies and Plan Asset Matters.”
Rate of Return1: For the fiscal year ended June 30, 2016, the annual money-weighted rate of return on WSPRS Plan 1/2 pension investments, net of pension plan investment expense, was 2.34%. This money-weighted rate of return expresses investment performance, net of pension plan investment expense, and reflects both the size and timing of cash flows.
Net Pension Liability of Participating EmployersThe components of the net pension liability of WSPRS Plan 1/2 as of June 30, 2016, were as follows:
WSPRS Plan 1/2Dollars in Thousands
Total Pension Liability $ 1,167,443
Plan Fiduciary Net Position (1,098,127)
Participating Employers’ Net Pension Liability $ 69,316
Plan Fiduciary Net Position as a Percentage of the Total Pension Liability
94.06%
Actuarial Assumptions2: The total pension liability was determined by an actuarial valuation as of June 30, 2015, with the results rolled forward to June 30, 2016, using the following actuarial assumptions, applied to all prior periods included in the measurement:
WSPRS Plan 1/2
Inflation 3.0% total economic inflation, 3.75% salary inflation
Salary Increases
In addition to the base 3.75% salary inflation assumption, salaries are also expected to grow by promotions and longevity.
Investment Rate of Return
7.50%
Notes to the Financial Statements (cont.)

70 DRS s Financial Section — Comprehensive Annual Financial Report
Mortality rates were based on the RP-2000 report’s Combined Healthy Table and Combined Disabled Table, which the Society of Actuaries published. The OSA applied offsets to the base table and recognized future improvements in mortality by projecting the mortality rates using 100% Scale BB. Mortality rates are applied on a generational basis, meaning members are assumed to receive additional mortality improvements in each future year throughout their lifetimes.
The actuarial assumptions used in the June 30, 2015, valuation were based on the results of the 2007-2012 Experience Study Report. Additional assumptions for subsequent events and law changes are current as of the 2015 actuarial valuation report.
The long-term expected rate of return on pension plan investments was determined using a building-block method in which the WSIB develops a best estimate of expected future rates of return (expected returns net of pension plan investment expense but including inflation) for each major asset class. Those expected returns make up one component of the WSIB’s Capital Market Assumptions (CMAs).
The CMAs contain three pieces of information for each class of assets the WSIB currently invests in:
• Expected annual return• Standard deviation of the annual return• Correlations between the annual returns of each
asset class with every other asset class
The WSIB uses the CMAs and their target asset allocation to simulate future investment returns over various time horizons.
The Office of the State Actuary (OSA) selected a 7.50% long-term expected rate of return on pension plan investments. In selecting this assumption, OSA reviewed the historical experience data, considered the historical conditions that produced past annual investment returns, and considered CMAs and simulated expected investment returns the WSIB provided. See the 2015 Report on Financial Condition and Economic Experience Study on the OSA website for additional information on how this assumption was selected.
Best estimates of arithmetic real rates of return for each major asset class included in the pension plan’s target asset allocation as of June 30, 2016, are summarized in the following table:
WSPRS Plan 1/2
Asset Class Target AllocationLong-Term Expected Real Rate of Return
Fixed Income 20.00% 1.70%
Tangible Assets 5.00% 4.40%
Real Estate 15.00% 5.80%
Global Equity 37.00% 6.60%
Private Equity 23.00% 9.60%
The inflation component used to create the table above is 2.20% and represents the WSIB’s most recent long-term estimate of broad economic inflation.
Discount Rate: The discount rate used to measure the total pension liability was 7.50%. To determine the discount rate, an asset sufficiency test was completed to test whether the pension plan’s fiduciary net position was sufficient to make all projected future benefit payments of current plan members. Consistent with current law, the completed asset sufficiency test included an assumed 7.70% long-term discount rate to determine funding liabilities for calculating future contribution rate requirements. Consistent with the long-term expected rate of return, a 7.50% future investment rate of return on invested assets was assumed for the test.
Contributions from plan members and employers are assumed to continue to be made at contractually required rates. Based on those assumptions, the pension plan’s fiduciary net position was projected to be available to make all projected future benefit payments of current plan members. Therefore, the long-term expected rate of return of 7.50% on pension plan investments was applied to determine the total pension liability.
Sensitivity of the Net Pension Liability to Changes in the Discount Rate: The table at the top of page 71 presents the net pension liability of the employers calculated using the discount rate of 7.50% as well as what the employers’ net pension liability would be if it were calculated using a discount rate that is 1 percentage
Notes to the Financial Statements (cont.)

Comprehensive Annual Financial Report — Financial Section s DRS 71
point lower (6.50%) or 1 percentage point higher (8.50%) than the current rate.
WSPRS Plan 1/2Dollars in Thousands
1% Decrease (6.50%)
Current Discount Rate (7.50%)
1% Increase (8.50%)
Employers’ Net Pension Liability
$ 260,659 $ 69,316 $ (81,250)
Judicial Retirement System (JRS)Administration: JRS was established by the Legislature in 1971, and its retirement benefit provisions are contained in Chapter 2.10 RCW. JRS is a single-employer retirement system, and membership includes judges elected or appointed to the Supreme Court, Court of Appeals and superior courts on or after August 9, 1971.
JRS is composed of and reported as one plan for accounting purposes. JRS is closed to new entrants.
Plan Membership: As of June 30, 2016, JRS membership consisted of the following:
JRS
Inactive Plan Members or Beneficiaries Currently Receiving Benefits 103
Inactive Plan Members Entitled to But Not Yet Receiving Benefits 0
Active Plan Members 0
Total Membership 103
Vesting: JRS members became vested after the completion of 15 years of eligible service or 12 years if the member left office involuntarily.
Benefits Provided: JRS provides retirement, disability and death benefits. Retirement benefits are calculated using 3.5% of the member’s Final Average Salary (FAS) for members with 15 years of eligible service and 3% of FAS for members with 10 to 14 years of eligible service.
JRS members are eligible for retirement at age 60 with 15 years of service or with 12 years of service (if the member left office involuntarily and at least 15 years have passed from the beginning of judicial service).
Contributions: JRS had no active plan members during fiscal year 2016; therefore, no employer and employee contributions were required. JRS retirement benefits are financed on a pay-as-you-go basis from a combination of investment earnings and funding from the state.
InvestmentsThe Office of the State Treasurer (OST) manages all pension assets for JRS.
Investment Policy: The overall objective of the OST investment policy is to construct an investment portfolio that is optimal, or efficient. An optimal, or efficient, portfolio is one that provides the greatest expected return for a given expected level of risk, or the lowest expected risk for a given expected return.
Eligible investments are only those securities and deposits authorized by statute (Chapters 39.58, 39.59, 43.250 and 43.84.080 RCW) and include:
• Obligations of the U.S. government• Obligations of U.S. government agencies
or corporations wholly owned by the U.S. government
• Obligations of government-sponsored enterprises that are or might become eligible as collateral for advances to member banks as determined by the board of governors of the Federal Reserve
• Banker’s acceptances purchased on the secondary market rated with the highest short-term credit rating of any two Nationally Recognized Statistical Rating Organizations (NRSROs) at the time of purchase (if the banker’s acceptance is rated by more than two NRSROs, it must have the highest rating from all the organizations)
• Commercial paper, as long as the OST adheres to policies and procedures of the WSIB regarding commercial paper [RCW 43.84.080(7)]
• Certificates of deposit with financial institutions the Washington Public Deposit Protection Commission has qualified
• The Local Government Investment Pool• Obligations of Washington state or its political
subdivisions
Notes to the Financial Statements (cont.)

72 DRS s Financial Section — Comprehensive Annual Financial Report
General information about the retirement funds’ investments, valuation, classifications, concentrations and maturities can be found in “Note 1: Summary of Significant Accounting Policies and Plan Asset Matters.”
Rate of Return1: For the fiscal year ended June 30, 2016, the annual money-weighted rate of return on JRS pension investments, net of pension plan investment expense, was 0.62%. This money-weighted rate of return expresses investment performance, net of pension plan investment expense, and reflects both the size and timing of cash flows.
Net Pension Liability of Participating EmployersThe components of the net pension liability of JRS as of June 30, 2016, were as follows:
JRSDollars in Thousands
Total Pension Liability $ 104,642
Plan Fiduciary Net Position (6,775)
Participating Employers’ Net Pension Liability $ 97,867
Plan Fiduciary Net Position as a Percentage of the Total Pension Liability
6.47%
Actuarial Assumptions2: The total pension liability was determined by an actuarial valuation as of June 30, 2015, with the results rolled forward to June 30, 2016, using the following actuarial assumptions, applied to all prior periods included in the measurement:
JRS
Inflation 3.0% total economic inflation
Salary Increases None; only inactive participants
Investment Rate of Return
4.00%
For JRS, mortality rates were set equal to those used for PERS. Mortality rates were based on the RP-2000 report’s Combined Healthy Table and Combined Disabled Table, which the Society of Actuaries published. The OSA applied offsets to the base table and recognized future improvements in mortality by projecting the mortality rates using 100% Scale BB.
Mortality rates are applied on a generational basis, meaning members are assumed to receive additional mortality improvements in each future year throughout their lifetimes.
The actuarial assumptions used in the June 30, 2015, valuation were based on the results of the 2007-2012 Experience Study Report. Additional assumptions for subsequent events and law changes are current as of the 2015 actuarial valuation report.
Discount Rate: Contributions are made to JRS to ensure cash is available to make benefit payments. Since this plan is operated on a pay-as-you-go basis, the discount rate used to measure the total pension liability was set equal to the Bond Buyer General Obligation 20-Bond Municipal Bond Index, or 2.85% for the June 30, 2016, measurement date.
Sensitivity of the Net Pension Liability to Changes in the Discount Rate: The following presents the net pension liability of the employers calculated using the discount rate of 2.85% as well as what the employers’ net pension liability would be if it were calculated using a discount rate that is 1 percentage point lower (1.85%) or 1 percentage point higher (3.85%) than the current rate.
JRSDollars in Thousands
1% Decrease (1.85%)
Current Discount Rate (2.85%)
1% Increase (3.85%)
Employers’ Net Pension Liability
$ 108,084 $ 97,867 $ 89,146
Judges’ Retirement Fund (JRF)Administration: The Judges’ Retirement Fund (JRF) was established in 1937, and its retirement benefit provisions are contained in Chapter 2.12 RCW. JRF is a single-employer retirement system composed of a single defined benefit plan. Members include judges of the Supreme Court, Court of Appeals and superior courts of Washington state. JRF has been closed to new entrants since 1971.
Notes to the Financial Statements (cont.)
1 The Washington State Investment Board provided the money-weighted rates of return.
2 The Washington State Investment Board provided the CMAs and expected rates of return. The Office of the State Actuary relied on the CMAs in its selection of the long-term expected rate of return for purposes of GASB Statement No. 67.

Comprehensive Annual Financial Report — Financial Section s DRS 73
1 The Washington State Investment Board provided the money-weighted rates of return.
JRF is composed of and reported as one plan for accounting purposes.
Plan Membership: As of June 30, 2016, JRF membership consisted of the following:
JRF
Inactive Plan Members or Beneficiaries Currently Receiving Benefits 12
Inactive Plan Members Entitled to But Not Yet Receiving Benefits 0
Active Plan Members 0
Total Membership 12
Vesting: JRF members became vested after the completion of 18 years of eligible service at any age or 10 years of eligible service at age 70.
Benefits Provided: JRF provides disability and retirement benefits.
Contributions: No active plan members were in JRF during fiscal year 2016; therefore, no employer and employee contributions were required. JRF retirement benefits are financed on a pay-as-you-go basis from a combination of investment earnings and funding from the state.
InvestmentsOST manages all pension assets for JRF.
Investment Policy: The overall objective of the OST investment policy is to construct an investment portfolio that is optimal, or efficient. An optimal, or efficient, portfolio is one that provides the greatest expected return for a given expected level of risk, or the lowest expected risk for a given expected return.
Eligible investments are only those securities and deposits authorized by statute (Chapters 39.58, 39.59, 43.250 and 43.84.080 RCW) and include:
• Obligations of the U.S. government• Obligations of U.S. government agencies
or corporations wholly owned by the U.S. government
• Obligations of government-sponsored enterprises that are or might become eligible as collateral
for advances to member banks as determined by the board of governors of the Federal Reserve
• Banker’s acceptances purchased on the secondary market rated with the highest short-term credit rating of any two Nationally Recognized Statistical Rating Organizations (NRSROs) at the time of purchase (if the banker’s acceptance is rated by more than two NRSROs, it must have the highest rating from all the organizations)
• Commercial paper, as long as the OST adheres to policies and procedures of the WSIB regarding commercial paper [RCW 43.84.080(7)]
• Certificates of deposit with financial institutions the Washington Public Deposit Protection Commission has qualified
• The Local Government Investment Pool• Obligations of Washington state or its political
subdivisions
General information about the retirement funds’ investments, valuation, classifications, concentrations and maturities can be found in “Note 1: Summary of Significant Accounting Policies and Plan Asset Matters.”
Rate of Return1: For the fiscal year ended June 30, 2016, the annual money-weighted rate of return on JRF pension investments, net of pension plan investment expense, was 0.62%. This money-weighted rate of return expresses investment performance, net of pension plan investment expense, and reflects both the size and timing of cash flows.
Net Pension Liability of Participating EmployersThe components of the net pension liability of JRF as of June 30, 2016, were as follows:
JRFDollars in Thousands
Total Pension Liability 3,097
Plan Fiduciary Net Position (582)
Participating Employers’ Net Pension Liability 2,515
Plan Fiduciary Net Position as a Percentage of the Total Pension Liability
18.79%
Notes to the Financial Statements (cont.)

74 DRS s Financial Section — Comprehensive Annual Financial Report
Actuarial Assumptions1: The total pension liability was determined by an actuarial valuation as of June 30, 2015, with the results rolled forward to June 30, 2016, using the following actuarial assumptions, applied to all prior periods included in the measurement:
JRF
Inflation 3.0% total economic inflation
Salary Increases None; only inactive participants
Investment Rate of Return
4.00%
For JRF, mortality rates were set equal to those used for PERS. Mortality rates were based on the RP-2000 report’s Combined Healthy Table and Combined Disabled Table, which the Society of Actuaries published. The OSA applied offsets to the base table and recognized future improvements in mortality by projecting the mortality rates using 100% Scale BB. Mortality rates are applied on a generational basis, meaning members are assumed to receive additional mortality improvements in each future year throughout their lifetimes.
The actuarial assumptions used in the June 30, 2015, valuation were based on the results of the 2007-2012 Experience Study Report. Additional assumptions for subsequent events and law changes are current as of the 2015 actuarial valuation report.
Discount Rate: Contributions are made to JRF to ensure cash is available to make benefit payments. Since this plan is operated on a pay-as-you-go basis, the discount rate used to measure the total pension liability was set equal to the Bond Buyer General Obligation 20-Bond Municipal Bond Index, or 3.80% for the June 30, 2015, measurement date.
Sensitivity of the Net Pension Liability to Changes in the Discount Rate: The following table presents the net pension liability of the employers calculated using the discount rate of 2.85% as well as what the employers’ net pension liability would be if it were calculated using a discount rate that is 1 percentage point lower
(1.85%) or 1 percentage point higher (3.85%) than the current rate.
JRFDollars in Thousands
1% Decrease (1.85%)
Current Discount Rate (2.85%)
1% Increase (3.85%)
Employers’ Net Pension Liability
$ 2,650 $ 2,515 $ 2,390
Notes to the Financial Statements (cont.)
1 The Washington State Investment Board provided the CMAs and expected rates of return. The Office of the State Actuary relied on the CMAs in its selection of the long-term expected rate of return for purposes of GASB Statement No. 67.

Comprehensive Annual Financial Report — Financial Section s DRS 75
Notes to the Financial Statements (cont.)
Recent Legislation Affecting Pension Systems/PlansDRS-Administered During Fiscal Year 2016Arranged Chronologically by Effective Date — Page 1 of 2
Legal Reference Effective Date Systems/Plans Affected Description
Chapter 3, Laws of 2012 (ESSB 6239)
6/7/12 All systems and plans This law allows same-gender couples to marry and automatically converts certain domestic partnerships into marriages unless the couple marries or dissolves the partnership before June 30, 2014. Under the provisions of this law, survivor benefits could be available sooner to certain members of the state’s retirement systems.
Chapter 72, Laws of 2012 (ESB 5159)
6/7/12 WSPRS Current WSPRS members who have service credit earned as commercial vehicle enforcement officers within PERS 2 may transfer said credit into WSPRS. The member must pay the full actuarial cost of the transfer.
Chapter 236, Laws of 2012 (EHB 2771)
6/7/12 LEOFF, PERS, PSERS, SERS and TRS
This law amends the retirement statutes to clarify that governmental contractors are not employers under the system, unless otherwise qualifying, and that the determination of whether an employee/employer relationship has been established shall be based solely on the relationship between the contracted employee and the governmental employer.
Chapter 248, Laws of 2012 (SB 6134)
6/7/12 LEOFF 2 The initial timeline to transfer service credit under RCW 41.26.435 was moved from June 30, 2014, to June 30, 2012.
Chapter 22, Laws of 2013 (SB 5046)
7/28/13 PERS The mandatory retirement criteria for district court judges was changed to require retirement after the end of the term of office in which they turn age 75, instead of at the end of the calendar year in which they turn age 75.
Chapter 287, Laws of 2013 (SHB 1868)
7/28/13 LEOFF 2 This law allows catastrophically disabled LEOFF 2 members to be reimbursed for premiums of medical insurance other than those the employer, COBRA, or Medicare A and/or B provide. The reimbursement is limited to payments made after June 30, 2013, that do not exceed the premium reimbursement amounts COBRA authorized.
Chapter 95, Laws of 2014 (SB 6321)
6/12/14 PERS 3, SERS 3 and TRS 3
This law removes annual rate flexibility in Plans 3. A TRS 3 member no longer has the option to change contribution rates each year during the month of January. This bill amends RCW 41.34.040, removing the annual change option, and became effective after January 2015. Even though this statutory option applies to PERS 3 and SERS 3 members as well, it has never been implemented in those plans. This modification is deemed necessary by the Internal Revenue Service to ensure Plans 3 retain favorable tax qualification.
Chapter 145, Laws of 2014 (HB 2456)
6/12/14 LEOFF This law eliminates the expiration date on the statutory provision in the LEOFF definition of fire fighter that includes emergency medical technicians (EMTs). This correction allows EMTs continued eligibility for membership in LEOFF.
Chapter 91, Laws of 2014 (SB 6201)
6/12/14 LEOFF 2 This law allows LEOFF 2 members to use funds from certain tax-qualified plans to purchase life annuities from the LEOFF 2 trust fund at the time of retirement.
Chapter 172, Laws of 2014 (SB 6328)
6/12/14 Deferred Compensation Program
This law allows the state and other local government authorizing entities the option to allow employees participating in the employer-sponsored Deferred Compensation Program to purchase individual securities within the plan investment options. It does not require plans to make this option available; it only allows it.
Chapter 75,Laws of 2015(HB 1168)
7/24/15 PERS 2 and 3 ESHB 1981 of the 2011 session modified the return-to-work rules for PERS retirees. This law corrects some unintended consequences of those statute changes to ensure:
• PERS retirees who return to work in ineligible positions would not be subject to the 867-hour limitation
• PERS 2 and 3 retirees who return to work in eligible positions covered by other DRS-administered systems would be eligible to work up to 867 hours before their benefits are suspended
Chapter 111,Laws of 2015(SB 5210)
7/24/15 WSPRS This law allows WSPRS members to use funds from certain tax-qualified plans to purchase life annuities from the WSPRS trust fund at the time of retirement.

76 DRS s Financial Section — Comprehensive Annual Financial Report
Chapter 78,Laws of 2015(HB 1194)
7/24/15 LEOFF 2 and WSPRS A surviving spouse of a LEOFF 2 or WSPRS member who is killed in the line of duty is entitled to receive a monthly benefit of at least 60% of the member’s wages from the state workers’ compensation program. However, this benefit was terminated if the survivor remarries. This legislation allows the surviving spouse of a LEOFF 2 or WSPRS member killed in the course of employment to remarry and continue receiving a workers’ compensation survivor benefit.
Chapter 241, Laws of 2016(SB 6194)
4/3/16 TRS This law allows charter school employees to be members of the state retirement systems as long as DRS receives determination from the IRS that the inclusion of those employees won’t jeopardize the status of the systems as government plans.
Chapter 112, Laws of 2016(SB 5435)
6/9/16 All systems and plans This law provides for the automatic enrollment of new state employees in the Washington State Deferred Compensation Program (DCP) with a default contribution rate of 3%. Employees will have the opportunity to opt out or set their own contribution rates. The law also gives DRS the option to offer a 401(a) money-purchase retirement savings plan.
Chapter 211, Laws of 2016(SB 6091)
6/9/16 All systems and plans This law clarifies the definition of “slayer” to include people found not guilty by reason of insanity. A slayer isn’t entitled to receive a retirement benefit from the person he or she killed.
Chapter 236, Laws of 2016(SB 6523)
6/9/16 PERS This law allows an employee providing emergency medical services to a consortium of local governments in Snohomish County to choose to establish service credit in PERS for service performed before July 23, 2003. The employee must pay both the employer and employee contributions, as DRS calculates, within five years of choosing to establish service credit.
Chapter 233, Laws of 2016(SB 6455)
6/9/16 TRS 2 and 3 This law allows TRS members who retired using the 2008 Early Retirement Factors (ERFs) to return to work as substitute teachers for up to 867 hours without suspending their benefits. This provision is in effect from June 9, 2016, through July 31, 2020.
Chapter 120, Laws of 2016(SB 5873)
6/9/16 LEOFF 1 This law gives a LEOFF Plan 1 retiree a chance to name as survivor a spouse he or she married after retiring. To qualify, the marriage needs to have spanned at least two years before Sept. 1, 2015.
Chapter 115, Laws of 2016(SB 6263)
6/9/16 LEOFF 2 This law impacts LEOFF Plan 2 members who are called into eligible federal service to respond to natural disasters or other federal emergencies. It provides them with benefit protections similar to the ones provided to members of the National Guard or military reserves who are called during a time of war.
Chapter 222, Laws of 2016(SB 6264)
6/9/16 LEOFF and WSPRS This law allows retirees of LEOFF and WSPRS a six-month window to purchase annuities. The annuities may be purchased between January 1 and June 1, 2017.
Notes to the Financial Statements (cont.)
Recent Legislation Affecting Pension Systems/PlansDRS-Administered During Fiscal Year 2016Arranged Chronologically by Effective Date — Page 2 of 2
Legal Reference Effective Date Systems/Plans Affected Description

Comprehensive Annual Financial Report — Financial Section s DRS 77
Notes to the Financial Statements (cont.)
C. Funding PolicyAll employers are required to contribute at the level the Legislature established. Plan-specific tables presented in Note 2 Section B provide the required contribution rates for each plan at the close of fiscal year 2016.
PERS: Each biennium, the state Pension Funding Council adopts Plan 1 employer contribution rates, Plan 2 employer and employee contribution rates, and Plan 3 employer contribution rates, subject to revision by the Legislature. Employee contribution rates for Plan 1 are established by statute at 6%. The employer and employee contribution rates for Plan 2 and the employer contribution rate for Plan 3 are developed by the Office of the State Actuary to fully fund Plan 2 and the defined benefit portion of Plan 3. Under PERS Plan 3, employer contributions finance the defined benefit portion of the plan, and member contributions finance the defined contribution portion. The Plan 3 employee contribution rates range between 5% and 15%.
The methods used to determine PERS contribution requirements are established under state statute in accordance with Chapters 41.40 and 41.45 RCW.
SERS: Each biennium, the state Pension Funding Council adopts Plan 2 employer and employee contribution rates and Plan 3 employer contribution rates, subject to revision by the Legislature. The employer and employee contribution rates for Plan 2 and the employer contribution rate for Plan 3 are developed by the Office of the State Actuary to fully fund Plan 2 and the defined benefit portion of Plan 3. Under SERS Plan 3, employer contributions finance the defined benefit portion of the plan, and member contributions finance the defined contribution portion. The Plan 3 employee contribution rates range between 5% and 15%.
The methods used to determine SERS contribution requirements are established under state statute in accordance with Chapters 41.35 and 41.45 RCW.
PSERS: Each biennium, the state Pension Funding Council adopts Plan 2 employer and employee contribution rates, subject to revision by the Legislature. The employer and employee contribution rates for Plan 2 are developed by the Office of the State Actuary to fully fund Plan 2.
The methods used to determine PSERS contribution requirements are established under state statute in accordance with Chapters 41.37 and 41.45 RCW.
TRS: Each biennium, the state Pension Funding Council adopts Plan 1 employer contribution rates, Plan 2 employer and employee contribution rates, and Plan 3 employer contribution rates, subject to revision by the Legislature. Employee contribution rates for Plan 1 are established by statute at 6%. The employer and employee contribution rates for Plan 2 and the employer contribution rate for Plan 3 are developed by the Office of the State Actuary to fully fund Plan 2 and the defined benefit portion of Plan 3. Under TRS Plan 3, employer contributions finance the defined benefit portion of the plan and member contributions finance the defined contribution portion. The Plan 3 employee contribution rates range between 5% and 15%.
The methods used to determine the TRS contribution requirements are established under state statute in accordance with Chapters 41.32 and 41.45 RCW.
LEOFF: Employer and employee contribution rates are developed by the Office of the State Actuary to fully fund the plans. Since July 1, 2000, Plan 1 employers and employees contribute 0%, as long as the plan remains fully funded. Plan 2 employers and employees pay at the level the LEOFF Plan 2 Retirement Board adopts.
The Legislature, by means of a special funding arrangement, appropriates money from the state General Fund to supplement the current service liability and fund the prior service costs of Plan 2 in accordance with the recommendations of the Pension Funding Council and the LEOFF Plan 2 Retirement Board.
This special funding situation is not mandated by the state constitution and could be changed by statute. For fiscal year 2016, the state contributed $60.4 million to LEOFF Plan 2.
The methods used to determine the contribution requirements are established under state statute in accordance with Chapters 41.26 and 41.45 RCW.

78 DRS s Financial Section — Comprehensive Annual Financial Report
Notes to the Financial Statements (cont.)
WSPRS: Each biennium, the state Pension Funding Council adopts the employee and the state contribution rates, subject to revision by the Legislature. The employee and the state contribution rates are developed by the Office of the State Actuary to fully fund the plan.
The methods used to determine the contribution requirements are established under state statute in accordance with Chapters 43.43 and 41.45 RCW.
JRS: No active members are in the Judicial Retirement System. The state guarantees the solvency of JRS on a pay-as-you-go basis. Each biennium, the Legislature, through appropriations from the state General Fund, contributes amounts sufficient to meet benefit payment requirements. For fiscal year 2016, the state contributed $9.5 million.
JRF: No active members are in the Judges’ Retirement Fund. The state guarantees the solvency of JRF on a pay-as-you-go basis. Each biennium, the Legislature, through appropriations from the state General Fund, contributes amounts sufficient to meet benefit payment requirements. For fiscal year 2016, the state contributed $0.5 million.
D. Judicial Retirement AccountThe Judicial Retirement Account (JRA) was established by the Legislature in 1988 to provide supplemental retirement benefits. It is a defined contribution plan the state of Washington Administrative Office of the Courts (AOC) administers under the direction of the Board for Judicial Administration. Membership includes judges elected or appointed to the Supreme Court, Court of Appeals and superior courts who are members of PERS. Vesting is full and immediate.
Since January 1, 2007, any newly elected or appointed Supreme Court justice, Court of Appeals judge or superior court judge may no longer participate in JRA. As of June 30, 2016, five active members and 135 inactive members were in JRA. The state, through the AOC, is the sole participating employer in JRA.
JRA plan members are required to contribute 2.5% of
covered salary. The state, as employer, contributes an equal amount on a monthly basis. The employer and employee obligations to contribute are established in Chapter 2.14 RCW. Plan provisions and contribution requirements are established in state statute, and only the state Legislature can amend them.
A JRA member who separates from judicial service for any reason is entitled to receive a lump sum distribution of the accumulated contributions. The administrator of JRA may adopt rules establishing other payment options. If a member dies, the amount of accumulated contributions standing to the member’s credit at the time of the member’s death is to be paid to the member’s estate or such person or persons, trust, or organization as the member has nominated by written designation.
The administrator of JRA has entered into an agreement for services with DRS and with the Washington State Investment Board (WSIB). Under this agreement, DRS is responsible for all record keeping, accounting and reporting of member accounts and WSIB is granted the full power to establish investment policy, develop participant investment options and manage the investment funds for the JRA plan, consistent with the provisions of RCW 2.14.080 and 43.84.150.
E. Deferred Compensation ProgramThe Deferred Compensation Program (DCP) is established pursuant to RCW 41.50.770 and in accordance with Internal Revenue Code Section 457. Employees of the state of Washington and its political subdivisions that choose to join have the option of participating in the program. The deferred compensation is not available to employees until termination, retirement, disability, death or unforeseeable financial emergency. DRS administers the state Deferred Compensation Program.
The intent of the program is to provide additional income to participants upon retirement. By deferring part of their income, participants can reduce their taxable income each year. The investments remain tax-free until they are withdrawn. The program provides participants with a means to easily save money and help supplement their other retirement income.
Comprehensive Annual Financial Report — Financial Section s DRS 79
Notes to the Financial Statements (cont.)
Employees participating in DCP self-direct their investments through options the WSIB provides. The WSIB has the full power to invest monies in DCP in accordance with RCW 43.84.150, 43.33A.140 and 41.50.770.
The program offers two investment options: the One-Step Investing option and the Build and Monitor option.
The One-Step Investing option is designed for those who do not have the desire, comfort level and/or time to select, monitor and rebalance, as needed, their own allocation mix of funds. Each Retirement Strategy Fund is diversified and automatically rebalances, adjusting the participant’s allocation mix as the participant moves toward a retirement date and continuing for 15 years beyond the person’s target date.
The funds in this option include:• Retirement Maturity Strategy• 2005 Retirement Strategy• 2010 Retirement Strategy• 2015 Retirement Strategy• 2020 Retirement Strategy• 2025 Retirement Strategy• 2030 Retirement Strategy• 2035 Retirement Strategy• 2040 Retirement Strategy• 2045 Retirement Strategy• 2050 Retirement Strategy• 2055 Retirement Strategy• 2060 Retirement Strategy
The Build and Monitor option requires the participant to:• Select fund(s) from any or all of the following
funds: » Emerging Market Equity Index Fund » Global Equity Index Fund » Savings Pool » Socially Responsible Balanced Fund » U.S. Large Cap Equity Index Fund » U.S. Small Cap Value Equity Index Fund » Washington State Bond Fund
• Monitor account activity• Rebalance the allocation mix as necessary to
maintain desired investment objectives
DCP participants may adjust or suspend their participation in the program at any time. Upon separation from employment, DCP participants have the option of withdrawing some or all of the balance in their accounts or leaving their balances in place to continue to benefit from market fluctuations.
The IRS requires a DCP participant to start receiving mandatory account distributions at retirement or by April of the year after the participant turns 70½ years old, whichever comes later.
All amounts of compensation deferred through the program, all property and rights purchased with those amounts, and all income attributable to those amounts are held in trust by the WSIB, as set forth under RCW 43.33A.030, for the exclusive benefit of DCP participants and their beneficiaries. Neither a participant nor the participant’s beneficiary or beneficiaries, nor any other designee, has any right to commute, sell, assign, transfer or otherwise convey the right to receive any payments from the program. These payments and rights are nonassignable and nontransferable.

80
DRS s
Financial Section — C
omprehensive A
nnual Financial Report
Required Supplementary Information: Schedule of Changes in Net Pension Liability
1 Plan fiduciary net position does not include the administrative fund allocations to the trust funds noted in Note 1, Section G of the Financial Section.
This schedule will be built prospectively until it contains 10 years of data. Before 2015, interest on service cost was included in the service cost category.
PERS Plan 2/3Dollars in Thousands
6/30/2016 6/30/2015 6/30/2014
Total Pension Liability
Service Cost $ 893,404 $ 864,319 $ 934,401
Interest 2,506,824 2,302,453 2,057,556
Changes of Benefit Terms – – –
Differences Between Expected and Actual Experience (218,153) 491,528 –
Changes in Assumptions 62,968 7,450 –
Benefit Payments, Including Refunds of Member Contributions
(812,514) (700,905) (600,862)
Net Change in Total Pension Liability 2,432,529 2,964,846 2,391,094
Total Pension Liability — Beginning 33,085,016 30,120,170 27,729,076
Total Pension Liability — Ending (a) $ 35,517,545 $ 33,085,016 $ 30,120,170
Plan Fiduciary Net Position1
Contributions — Employer 563,328 446,127 430,345
Contributions — Member 497,273 374,825 368,251
Net Investment Income 725,439 1,295,301 4,444,930
Benefit Payments, Including Refunds of Member Contributions
(812,514) (700,905) (600,862)
Administrative Expense (758) (581) (617)
Other (2,103) (1,617) (2,299)
Net Change in Plan Fiduciary Net Position 970,665 1,413,150 4,639,748
Plan Fiduciary Net Position — Beginning 29,511,959 28,098,809 23,459,061
Plan Fiduciary Net Position — Ending (b) $ 30,482,624 $ 29,511,959 $ 28,098,809
Plan’s Net Pension Liability (Asset) — Ending (a) – (b) $ 5,034,921 $ 3,573,057 $ 2,021,361
PERS Plan 1Dollars in Thousands
6/30/2016 6/30/2015 6/30/2014
Total Pension Liability
Service Cost $ 28,936 $ 28,685 $ 37,503
Interest 914,606 933,977 945,296
Changes of Benefit Terms – – –
Differences Between Expected and Actual Experience 3,713 27,130 –
Changes in Assumptions (36,416) 23,339 –
Benefit Payments, Including Refunds of Member Contributions
(1,203,209) (1,202,994) (1,193,715)
Net Change in Total Pension Liability (292,370) (189,862) (210,915)
Total Pension Liability — Beginning 12,789,242 12,979,104 13,190,019
Total Pension Liability — Ending (a) $ 12,496,872 $ 12,789,242 $ 12,979,104
Plan Fiduciary Net Position1
Contributions — Employer 595,982 462,100 448,895
Contributions — Member 18,457 21,617 28,087
Net Investment Income 157,070 336,310 1,311,995
Benefit Payments, Including Refunds of Member Contributions
(1,203,209) (1,202,994) (1,193,715)
Administrative Expense (301) (269) (506)
Other 90 (9) 36
Net Change in Plan Fiduciary Net Position (431,911) (383,245) 594,792
Plan Fiduciary Net Position — Beginning 7,558,312 7,941,557 7,346,765
Plan Fiduciary Net Position — Ending (b) $ 7,126,401 $ 7,558,312 $ 7,941,557
Plan’s Net Pension Liability (Asset) — Ending (a) – (b) $ 5,370,471 $ 5,230,930 $ 5,037,547

Com
prehensive Annual Financial Report —
Financial Section s D
RS 81
Required Supplementary Information: Schedule of Changes in Net Pension Liability (cont.)
1 Plan fiduciary net position does not include the administrative fund allocations to the trust funds noted in Note 1, Section G of the Financial Section.
This schedule will be built prospectively until it contains 10 years of data. Before 2015, interest on service cost was included in the service cost category.
PSERS Plan 2Dollars in Thousands
6/30/2016 6/30/2015 6/30/2014
Total Pension Liability
Service Cost $ 44,090 $ 40,546 $ 42,679
Interest 31,038 24,553 17,264
Changes of Benefit Terms – – –
Differences Between Expected and Actual Experience 266 19,950 –
Changes in Assumptions 84 131 –
Benefit Payments, Including Refunds of Member Contributions
(3,277) (3,056) (2,450)
Net Change in Total Pension Liability 72,201 82,125 57,493
Total Pension Liability — Beginning 371,013 288,888 231,395
Total Pension Liability — Ending (a) $ 443,214 $ 371,013 $ 288,888
Plan Fiduciary Net Position1
Contributions — Employer 20,058 18,704 17,124
Contributions — Member 21,148 18,664 17,446
Net Investment Income 10,096 15,081 45,143
Benefit Payments, Including Refunds of Member Contributions
(3,277) (3,056) (2,450)
Administrative Expense (9) (2) (8)
Other (61) 1 5
Net Change in Plan Fiduciary Net Position 47,955 49,392 77,260
Plan Fiduciary Net Position — Beginning 352,761 303,369 226,109
Plan Fiduciary Net Position — Ending (b) $ 400,716 $ 352,761 $ 303,369
Plan’s Net Pension Liability (Asset) — Ending (a) – (b) $ 42,498 $ 18,252 $ (14,481)
SERS Plan 2/3Dollars in Thousands
6/30/2016 6/30/2015 6/30/2014
Total Pension Liability
Service Cost $ 139,744 $ 128,806 $ 138,228
Interest 343,917 311,044 277,012
Changes of Benefit Terms – – –
Differences Between Expected and Actual Experience 18,707 66,049 –
Changes in Assumptions 10,258 600 –
Benefit Payments, Including Refunds of Member Contributions
(115,247) (99,075) (83,948)
Net Change in Total Pension Liability 397,378 407,424 331,292
Total Pension Liability — Beginning 4,473,428 4,066,004 3,734,712
Total Pension Liability — Ending (a) $ 4,870,806 $ 4,473,428 $ 4,066,004
Plan Fiduciary Net Position1
Contributions — Employer 115,480 97,386 88,783
Contributions — Member 47,155 35,445 31,856
Net Investment Income 100,201 178,038 607,982
Benefit Payments, Including Refunds of Member Contributions
(115,247) (99,075) (83,948)
Administrative Expense (21) (20) (30)
Other (806) (580) (462)
Net Change in Plan Fiduciary Net Position 146,762 211,194 644,181
Plan Fiduciary Net Position — Beginning 4,067,277 3,856,083 3,211,902
Plan Fiduciary Net Position — Ending (b) $ 4,214,039 $ 4,067,277 $ 3,856,083
Plan’s Net Pension Liability (Asset) — Ending (a) – (b) $ 656,767 $ 406,151 $ 209,921

82 D
RS s Financial Section —
Com
prehensive Annual Financial Report
Required Supplementary Information: Schedule of Changes in Net Pension Liability (cont.)
1 Plan fiduciary net position does not include the administrative fund allocations to the trust funds noted in Note 1, Section G of the Financial Section.
This schedule will be built prospectively until it contains 10 years of data. Before 2015, interest on service cost was included in the service cost category.
TRS Plan 2/3Dollars in Thousands
6/30/2016 6/30/2015 6/30/2014
Total Pension Liability
Service Cost $ 373,617 $ 352,316 $ 374,257
Interest 857,073 776,944 684,861
Changes of Benefit Terms – – –
Differences Between Expected and Actual Experience (74,782) 163,251 –
Changes in Assumptions 16,463 896 –
Benefit Payments, Including Refunds of Member Contributions
(220,982) (186,052) (151,510)
Net Change in Total Pension Liability 951,389 1,107,354 907,609
Total Pension Liability — Beginning 11,220,833 10,113,479 9,205,870
Total Pension Liability — Ending (a) $ 12,172,222 $ 11,220,833 $ 10,113,479
Plan Fiduciary Net Position1
Contributions — Employer 316,022 267,038 249,342
Contributions — Member 68,587 52,713 44,012
Net Investment Income 258,942 453,524 1,539,895
Benefit Payments, Including Refunds of Member Contributions
(220,982) (186,052) (151,510)
Administrative Expense (67) (64) (76)
Other (608) (618) (401)
Net Change in Plan Fiduciary Net Position 421,894 586,541 1,681,262
Plan Fiduciary Net Position — Beginning 10,377,031 9,790,490 8,109,228
Plan Fiduciary Net Position — Ending (b) $ 10,798,925 $ 10,377,031 $ 9,790,490
Plan’s Net Pension Liability (Asset) — Ending (a) – (b) $ 1,373,297 $ 843,802 $ 322,989
TRS Plan 1Dollars in Thousands
6/30/2016 6/30/2015 6/30/2014
Total Pension Liability
Service Cost $ 12,608 $ 15,630 $ 21,932
Interest 660,865 676,915 690,297
Changes of Benefit Terms – – –
Differences Between Expected and Actual Experience 25,314 23,516 –
Changes in Assumptions (9,700) 6,552 –
Benefit Payments, Including Refunds of Member Contributions
(925,559) (928,571) (928,237)
Net Change in Total Pension Liability (236,473) (205,958) (216,007)
Total Pension Liability — Beginning 9,237,730 9,443,688 9,659,695
Total Pension Liability — Ending (a) $ 9,001,257 $ 9,237,730 $ 9,443,688
Plan Fiduciary Net Position1
Contributions — Employer 315,934 223,886 200,674
Contributions — Member 8,802 10,324 14,626
Net Investment Income 118,296 269,742 1,079,804
Benefit Payments, Including Refunds of Member Contributions
(925,559) (928,571) (928,237)
Administrative Expense (41) (28) (143)
Other – 1 51
Net Change in Plan Fiduciary Net Position (482,568) (424,646) 366,775
Plan Fiduciary Net Position — Beginning 6,069,588 6,494,234 6,127,459
Plan Fiduciary Net Position — Ending (b) $ 5,587,020 $ 6,069,588 $ 6,494,234
Plan’s Net Pension Liability (Asset) — Ending (a) – (b) $ 3,414,237 $ 3,168,142 $ 2,949,454

Com
prehensive Annual Financial Report —
Financial Section s D
RS 83
Required Supplementary Information: Schedule of Changes in Net Pension Liability (cont.)
1 Plan fiduciary net position does not include the administrative fund allocations to the trust funds noted in Note 1, Section G of the Financial Section.
This schedule will be built prospectively until it contains 10 years of data. Before 2015, interest on service cost was included in the service cost category.
LEOFF Plan 2Dollars in Thousands
6/30/2016 6/30/2015 6/30/2014
Total Pension Liability
Service Cost $ 302,652 $ 286,031 $ 301,625
Interest 678,563 609,818 536,534
Changes of Benefit Terms 25,205 34,746 –
Differences Between Expected and Actual Experience 8,409 107,309 –
Changes in Assumptions 4 3,232 –
Benefit Payments, Including Refunds of Member Contributions
(190,712) (160,027) (133,949)
Net Change in Total Pension Liability 824,121 881,110 704,210
Total Pension Liability — Beginning 8,804,869 7,923,759 7,219,549
Total Pension Liability — Ending (a) $ 9,628,990 $ 8,804,869 $ 7,923,759
Plan Fiduciary Net Position1
Contributions — Employer 92,049 89,122 85,532
Contributions — State 60,375 58,339 55,551
Contributions — Member 173,871 165,772 151,041
Net Investment Income 244,028 430,403 1,456,267
Benefit Payments, Including Refunds of Member Contributions
(190,712) (160,027) (133,949)
Administrative Expense (1,683) (1,504) (1,268)
Other 23 (238) 241
Net Change in Plan Fiduciary Net Position 377,951 581,867 1,613,415
Plan Fiduciary Net Position — Beginning 9,832,669 9,250,802 7,637,387
Plan Fiduciary Net Position — Ending (b) $ 10,210,620 $ 9,832,669 $ 9,250,802
Plan’s Net Pension Liability (Asset) — Ending (a) – (b) $ (581,630) $ (1,027,800) $ (1,327,043)
LEOFF Plan 1Dollars in Thousands
6/30/2016 6/30/2015 6/30/2014
Total Pension Liability
Service Cost $ 2,238 $ 3,269 $ 4,279
Interest 315,653 319,945 326,717
Changes of Benefit Terms – – –
Differences Between Expected and Actual Experience (21,215) (65,557) –
Changes in Assumptions – – –
Benefit Payments, Including Refunds of Member Contributions
(361,022) (358,745) (355,988)
Net Change in Total Pension Liability (64,346) (101,087) (24,992)
Total Pension Liability — Beginning 4,404,928 4,506,015 4,531,007
Total Pension Liability — Ending (a) $ 4,340,582 $ 4,404,928 $ 4,506,015
Plan Fiduciary Net Position1
Contributions — Employer – 60 98
Contributions — Member 837 1,016 844
Net Investment Income 120,945 248,793 934,123
Benefit Payments, Including Refunds of Member Contributions
(361,022) (358,745) (355,988)
Administrative Expense (41) (18) (44)
Other – 237 –
Net Change in Plan Fiduciary Net Position (239,281) (108,657) 579,033
Plan Fiduciary Net Position — Beginning 5,610,149 5,718,806 5,139,773
Plan Fiduciary Net Position — Ending (b) $ 5,370,868 $ 5,610,149 $ 5,718,806
Plan’s Net Pension Liability (Asset) — Ending (a) – (b) $ (1,030,286) $ (1,205,221) $ (1,212,791)

84
DRS s
Financial Section — C
omprehensive A
nnual Financial Report
Required Supplementary Information: Schedule of Changes in Net Pension Liability (cont.)
1 Plan fiduciary net position does not include the administrative fund allocations to the trust funds noted in Note 1, Section G of the Financial Section.
This schedule will be built prospectively until it contains 10 years of data. Before 2015, interest on service cost was included in the service cost category.
JRSDollars in Thousands
6/30/2016 6/30/2015 6/30/2014
Total Pension Liability
Service Cost $ – $ – $ –
Interest 3,704 4,382 4,319
Changes of Benefit Terms – – –
Differences Between Expected and Actual Experience 20 1,590 –
Changes in Assumptions 8,737 4,334 –
Benefit Payments, Including Refunds of Member Contributions
(9,131) (9,336) (9,480)
Net Change in Total Pension Liability 3,330 971 (5,161)
Total Pension Liability — Beginning 101,312 100,341 105,502
Total Pension Liability — Ending (a) $ 104,642 $ 101,312 $ 100,341
Plan Fiduciary Net Position1
Contributions — Employer – – –
Contributions — State 9,500 10,600 10,600
Contributions — Member – – –
Net Investment Income 74 38 25
Benefit Payments, Including Refunds of Member Contributions
(9,131) (9,336) (9,480)
Administrative Expense (1) – –
Other – – –
Net Change in Plan Fiduciary Net Position 442 1,302 1,145
Plan Fiduciary Net Position — Beginning 6,333 5,031 3,886
Plan Fiduciary Net Position — Ending (b) $ 6,775 $ 6,333 $ 5,031
Plan’s Net Pension Liability (Asset) — Ending (a) – (b) $ 97,867 $ 94,979 $ 95,310
WSPRS Plan 1/2Dollars in Thousands
6/30/2016 6/30/2015 6/30/2014
Total Pension Liability
Service Cost $ 16,534 $ 16,633 $ 18,041
Interest 83,373 80,037 75,249
Changes of Benefit Terms 1,947 2,258 –
Differences Between Expected and Actual Experience (10,430) 8,883 –
Changes in Assumptions 2 17 –
Benefit Payments, Including Refunds of Member Contributions
(54,159) (50,075) (47,510)
Net Change in Total Pension Liability 37,266 57,753 45,780
Total Pension Liability — Beginning 1,130,177 1,072,424 1,026,644
Total Pension Liability — Ending (a) $ 1,167,443 $ 1,130,177 $ 1,072,424
Plan Fiduciary Net Position1
Contributions — Employer 7,044 6,679 6,587
Contributions — Member 8,895 6,323 6,555
Net Investment Income 25,352 49,046 176,856
Benefit Payments, Including Refunds of Member Contributions
(54,159) (50,075) (47,510)
Administrative Expense (60) (67) (84)
Other 429 293 509
Net Change in Plan Fiduciary Net Position (12,499) 12,199 142,913
Plan Fiduciary Net Position — Beginning 1,110,626 1,098,427 955,514
Plan Fiduciary Net Position — Ending (b) $ 1,098,127 $ 1,110,626 $ 1,098,427
Plan’s Net Pension Liability (Asset) — Ending (a) – (b) $ 69,316 $ 19,551 $ (26,003)

Com
prehensive Annual Financial Report —
Financial Section s D
RS 85
Required Supplementary Information: Schedule of Changes in Net Pension Liability (cont.)
1 Plan fiduciary net position does not include the administrative fund allocations to the trust funds noted in Note 1, Section G of the Financial Section.
This schedule will be built prospectively until it contains 10 years of data. Before 2015, interest on service cost was included in the service cost category.
JRFDollars in Thousands
6/30/2016 6/30/2015 6/30/2014
Total Pension Liability
Service Cost $ – $ – $ –
Interest 116 138 137
Changes of Benefit Terms – – –
Differences Between Expected and Actual Experience 123 182 –
Changes in Assumptions 181 95 –
Benefit Payments, Including Refunds of Member Contributions
(440) (444) (444)
Net Change in Total Pension Liability (20) (29) (307)
Total Pension Liability — Beginning 3,117 3,146 3,453
Total Pension Liability — Ending (a) $ 3,097 $ 3,117 $ 3,146
Plan Fiduciary Net Position1
Contributions — Employer – – –
Contributions — State 501 – –
Contributions — Member – – –
Net Investment Income 6 4 7
Benefit Payments, Including Refunds of Member Contributions
(440) (444) (444)
Administrative Expense – – –
Other – – –
Net Change in Plan Fiduciary Net Position 67 (440) (437)
Plan Fiduciary Net Position — Beginning 515 955 1,392
Plan Fiduciary Net Position — Ending (b) $ 582 $ 515 $ 955
Plan’s Net Pension Liability (Asset) — Ending (a) – (b) $ 2,515 $ 2,602 $ 2,191

86 DRS s Financial Section — Comprehensive Annual Financial Report
Required Supplementary Information: Schedule of Net Pension Liability
PERS Plan 1Dollars in Thousands
6/30/2016 6/30/2015 6/30/2014
Total Pension Liability $ 12,496,872 $ 12,789,242 $ 12,979,104
Plan Fiduciary Net Position1 7,126,401 7,558,312 7,941,557
Plan Net Pension Liability (Asset) $ 5,370,471 $ 5,230,930 $ 5,037,547
Plan Fiduciary Net Position as a Percentage of the Total Pension Liability 57.03% 59.10% 61.19%
Covered-Employee Payroll $ 218,029 $ 260,894 $ 309,665
Plan Net Pension Liability (Asset) as a Percentage of Covered-Employee Payroll
2,463.19% 2,005.00% 1,626.77%
1 Plan Fiduciary Net Position does not include the administrative fund allocations to the trust funds noted in Note 1, Section G, of the Financial Section.
This schedule will be built prospectively until it contains 10 years of data.
PERS Plan 2/3Dollars in Thousands
6/30/2016 6/30/2015 6/30/2014
Total Pension Liability $ 35,517,545 $ 33,085,016 $ 30,120,170
Plan Fiduciary Net Position1 30,482,624 29,511,959 28,098,809
Plan Net Pension Liability (Asset) $ 5,034,921 $ 3,573,057 $ 2,021,361
Plan Fiduciary Net Position as a Percentage of the Total Pension Liability 85.82% 89.20% 93.29%
Covered-Employee Payroll $ 9,323,463 $ 8,876,898 $ 8,607,757
Plan Net Pension Liability (Asset) as a Percentage of Covered-Employee Payroll
54.00% 40.25% 23.48%
SERS Plan 2/3Dollars in Thousands
6/30/2016 6/30/2015 6/30/2014
Total Pension Liability $ 4,870,806 $ 4,473,428 $ 4,066,004
Plan Fiduciary Net Position1 4,214,039 4,067,277 3,856,083
Plan Net Pension Liability (Asset) $ 656,767 $ 406,151 $ 209,921
Plan Fiduciary Net Position as a Percentage of the Total Pension Liability 86.52% 90.92% 94.84%
Covered-Employee Payroll $ 1,877,907 $ 1,720,489 $ 1,616,447
Plan Net Pension Liability (Asset) as a Percentage of Covered-Employee Payroll
34.97% 23.61% 12.99%
PSERS Plan 2Dollars in Thousands
6/30/2016 6/30/2015 6/30/2014
Total Pension Liability $ 443,214 $ 371,013 $ 288,888
Plan Fiduciary Net Position1 400,716 352,761 303,369
Plan Net Pension Liability (Asset) $ 42,498 $ 18,252 $ (14,481)
Plan Fiduciary Net Position as a Percentage of the Total Pension Liability 90.41% 95.08% 105.01%
Covered-Employee Payroll $ 324,850 $ 293,007 $ 270,102
Plan Net Pension Liability (Asset) as a Percentage of Covered-Employee Payroll
13.08% 6.23% (5.36)%
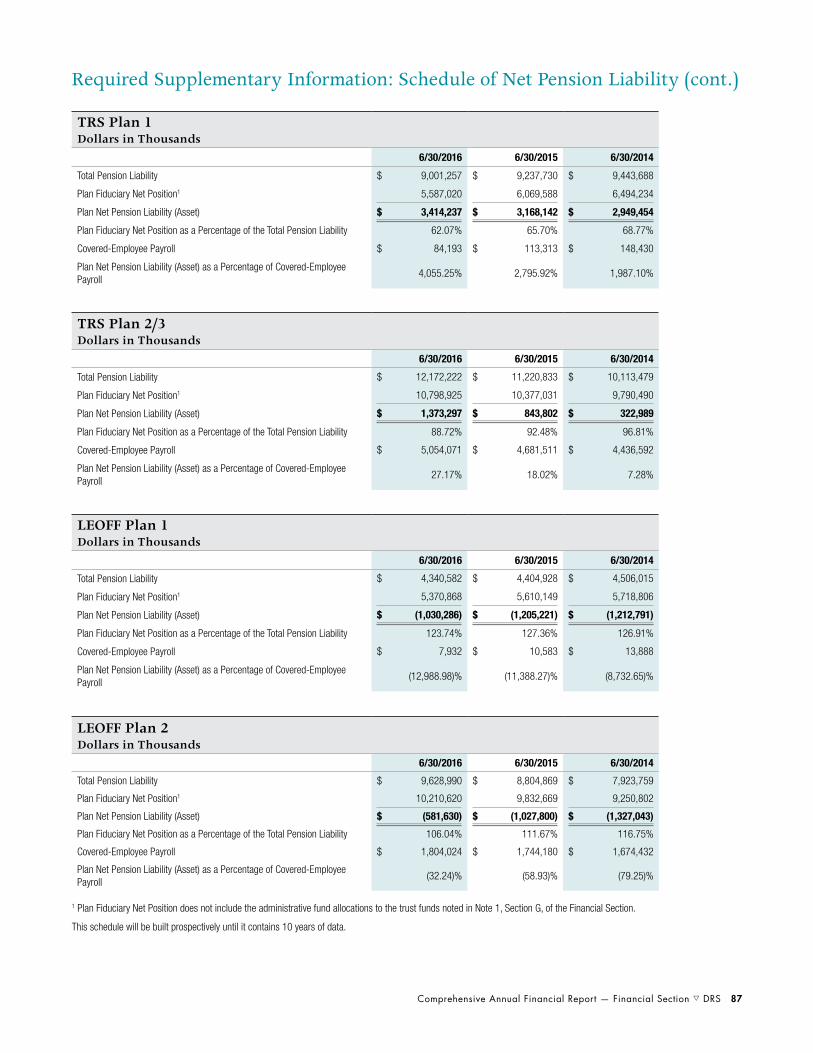
Comprehensive Annual Financial Report — Financial Section s DRS 87
TRS Plan 1Dollars in Thousands
6/30/2016 6/30/2015 6/30/2014
Total Pension Liability $ 9,001,257 $ 9,237,730 $ 9,443,688
Plan Fiduciary Net Position1 5,587,020 6,069,588 6,494,234
Plan Net Pension Liability (Asset) $ 3,414,237 $ 3,168,142 $ 2,949,454
Plan Fiduciary Net Position as a Percentage of the Total Pension Liability 62.07% 65.70% 68.77%
Covered-Employee Payroll $ 84,193 $ 113,313 $ 148,430
Plan Net Pension Liability (Asset) as a Percentage of Covered-Employee Payroll
4,055.25% 2,795.92% 1,987.10%
Required Supplementary Information: Schedule of Net Pension Liability (cont.)
1 Plan Fiduciary Net Position does not include the administrative fund allocations to the trust funds noted in Note 1, Section G, of the Financial Section.
This schedule will be built prospectively until it contains 10 years of data.
TRS Plan 2/3Dollars in Thousands
6/30/2016 6/30/2015 6/30/2014
Total Pension Liability $ 12,172,222 $ 11,220,833 $ 10,113,479
Plan Fiduciary Net Position1 10,798,925 10,377,031 9,790,490
Plan Net Pension Liability (Asset) $ 1,373,297 $ 843,802 $ 322,989
Plan Fiduciary Net Position as a Percentage of the Total Pension Liability 88.72% 92.48% 96.81%
Covered-Employee Payroll $ 5,054,071 $ 4,681,511 $ 4,436,592
Plan Net Pension Liability (Asset) as a Percentage of Covered-Employee Payroll
27.17% 18.02% 7.28%
LEOFF Plan 1Dollars in Thousands
6/30/2016 6/30/2015 6/30/2014
Total Pension Liability $ 4,340,582 $ 4,404,928 $ 4,506,015
Plan Fiduciary Net Position1 5,370,868 5,610,149 5,718,806
Plan Net Pension Liability (Asset) $ (1,030,286) $ (1,205,221) $ (1,212,791)
Plan Fiduciary Net Position as a Percentage of the Total Pension Liability 123.74% 127.36% 126.91%
Covered-Employee Payroll $ 7,932 $ 10,583 $ 13,888
Plan Net Pension Liability (Asset) as a Percentage of Covered-Employee Payroll
(12,988.98)% (11,388.27)% (8,732.65)%
LEOFF Plan 2Dollars in Thousands
6/30/2016 6/30/2015 6/30/2014
Total Pension Liability $ 9,628,990 $ 8,804,869 $ 7,923,759
Plan Fiduciary Net Position1 10,210,620 9,832,669 9,250,802
Plan Net Pension Liability (Asset) $ (581,630) $ (1,027,800) $ (1,327,043)
Plan Fiduciary Net Position as a Percentage of the Total Pension Liability 106.04% 111.67% 116.75%
Covered-Employee Payroll $ 1,804,024 $ 1,744,180 $ 1,674,432
Plan Net Pension Liability (Asset) as a Percentage of Covered-Employee Payroll
(32.24)% (58.93)% (79.25)%

88 DRS s Financial Section — Comprehensive Annual Financial Report
WSPRS Plan 1/2Dollars in Thousands
6/30/2016 6/30/2015 6/30/2014
Total Pension Liability $ 1,167,443 $ 1,130,177 $ 1,072,424
Plan Fiduciary Net Position1 1,098,127 1,110,626 1,098,427
Plan Net Pension Liability (Asset) $ 69,316 $ 19,551 $ (26,003)
Plan Fiduciary Net Position as a Percentage of the Total Pension Liability 94.06% 98.27% 102.42%
Covered-Employee Payroll $ 86,669 $ 84,379 $ 83,282
Plan Net Pension Liability (Asset) as a Percentage of Covered-Employee Payroll
79.98% 23.17% (31.22)%
Required Supplementary Information: Schedule of Net Pension Liability (cont.)
1 Plan Fiduciary Net Position does not include the administrative fund allocations to the trust funds noted in Note 1, Section G, of the Financial Section.
This schedule will be built prospectively until it contains 10 years of data.
JRSDollars in Thousands
6/30/2016 6/30/2015 6/30/2014
Total Pension Liability $ 104,642 $ 101,312 $ 100,341
Plan Fiduciary Net Position1 6,775 6,333 5,031
Plan Net Pension Liability (Asset) $ 97,867 $ 94,979 $ 95,310
Plan Fiduciary Net Position as a Percentage of the Total Pension Liability 6.47% 6.25% 5.01%
Covered-Employee Payroll $ – $ – $ –
Plan Net Pension Liability (Asset) as a Percentage of Covered-Employee Payroll
n/a n/a n/a
JRFDollars in Thousands
6/30/2016 6/30/2015 6/30/2014
Total Pension Liability $ 3,097 $ 3,117 $ 3,146
Plan Fiduciary Net Position1 582 515 955
Plan Net Pension Liability (Asset) $ 2,515 $ 2,602 $ 2,191
Plan Fiduciary Net Position as a Percentage of the Total Pension Liability 18.79% 16.52% 30.36%
Covered-Employee Payroll $ – $ – $ –
Plan Net Pension Liability (Asset) as a Percentage of Covered-Employee Payroll
n/a n/a n/a

Com
prehensive Annual Financial Report —
Financial Section s D
RS 89
Required Supplementary Information: Schedule of Employer Contributions
Portions of the above contributions were assessed on the covered payrolls of PERS Plan 2/3, SERS Plan 2/3 and PSERS Plan 2.
PERS Plan 1Dollars in Thousands
6/30/2016 6/30/2015 6/30/2014 6/30/2013 6/30/2012 6/30/2011 6/30/2010 6/30/2009 6/30/2008 6/30/2007
Contractually Required Contributions (CRC)1 $ 573,784 – – – – – – – – –
Actuarially Determined Contributions (ADC)2 623,404 454,010 439,067 534,200 508,000 439,300 627,800 620,200 453,100 397,300
Contributions in Relation to the Actuarially Determined Contributions
595,982 462,100 448,895 266,270 257,197 145,585 154,023 325,248 221,787 118,660
Contribution Deficiency (Excess) $ 27,422 $ (8,090) $ (9,828) $ 267,930 $ 250,803 $ 293,715 $ 473,777 $ 294,952 $ 231,313 $ 278,640
Covered-Employee Payroll3 218,029 260,894 309,665 352,909 399,564 493,559 571,969 654,711 713,421 761,800
Contributions as a Percentage of Covered-Employee Payroll
273.35% 177.12% 144.96% 75.45% 64.37% 29.50% 26.93% 49.68% 31.09% 15.58%
1 See the “Notes to Required Supplementary Information” on page 96 for an explanation of how the CRC and ADC were calculated. The CRC was the same as the ADC in years when no data for the CRC is displayed.
2 Prior to 2014, the annual required contribution (ARC) amounts were presented for the actuarially determined contributions. The ARC changes each year with the experience of the plans. Factors influencing the experience include changes in funding methods, assumptions, plan provisions, and economic and demographic gains and losses.
3 “Covered-employee payroll” includes employee compensation, as defined by statute, that employers reported to DRS. Employer-reported employee compensation is also used to calculate retirement contributions due to the retirement systems. Total salary or wages employers pay to employees eligible for retirement-system coverage might not be reportable to DRS.
PERS Plan 2/3Dollars in Thousands
6/30/2016 6/30/2015 6/30/2014 6/30/2013 6/30/2012 6/30/2011 6/30/2010 6/30/2009 6/30/2008 6/30/2007
Contractually Required Contributions (CRC)1 $ 580,852 – – – – – – – – –
Actuarially Determined Contributions (ADC)2 662,898 462,098 441,677 408,300 407,700 408,600 383,100 369,700 363,300 331,300
Contributions in Relation to the Actuarially Determined Contributions
563,328 446,127 430,345 389,020 385,253 328,258 327,460 439,744 318,740 242,544
Contribution Deficiency (Excess) $ 99,570 $ 15,971 $ 11,332 $ 19,280 $ 22,447 $ 80,342 $ 55,640 $ (70,044) $ 44,560 $ 88,756
Covered-Employee Payroll3 9,323,463 8,876,898 8,607,757 8,265,361 8,125,656 8,139,901 8,151,255 8,108,034 7,697,892 7,019,718
Contributions as a Percentage of Covered-Employee Payroll
6.04% 5.03% 5.00% 4.71% 4.74% 4.03% 4.02% 5.42% 4.14% 3.46%

90
DRS s
Financial Section — C
omprehensive A
nnual Financial Report
Required Supplementary Information: Schedule of Employer Contributions (cont.)
SERS Plan 2/3Dollars in Thousands
6/30/2016 6/30/2015 6/30/2014 6/30/2013 6/30/2012 6/30/2011 6/30/2010 6/30/2009 6/30/2008 6/30/2007
Contractually Required Contributions (CRC)1 $ 124,505 – – – – – – – – –
Actuarially Determined Contributions (ADC)2 144,599 94,736 90,064 86,600 85,200 88,600 82,300 71,500 75,800 71,500
Contributions in Relation to the Actuarially Determined Contributions
115,480 97,386 88,783 78,400 74,640 62,316 62,090 63,526 52,139 45,950
Contribution Deficiency (Excess) $ 29,119 $ (2,650) $ 1,281 $ 8,200 $ 10,560 $ 26,284 $ 20,210 $ 7,974 $ 23,661 $ 25,550
Covered-Employee Payroll3 1,877,908 1,720,489 1,616,447 1,549,224 1,638,675 1,650,375 1,619,245 1,585,931 1,515,966 1,407,307
Contributions as a Percentage of Covered-Employee Payroll
6.15% 5.66% 5.49% 5.06% 4.55% 3.78% 3.83% 4.01% 3.44% 3.27%
1 See the “Notes to Required Supplementary Information” on page 96 for an explanation of how the CRC and ADC were calculated. The CRC was the same as the ADC in years when no data for the CRC is displayed.
2 Prior to 2014, the annual required contribution (ARC) amounts were presented for the actuarially determined contributions. The ARC changes each year with the experience of the plans. Factors influencing the experience include changes in funding methods, assumptions, plan provisions, and economic and demographic gains and losses.
3 “Covered-employee payroll” includes employee compensation, as defined by statute, that employers reported to DRS. Employer-reported employee compensation is also used to calculate retirement contributions due to the retirement systems. Total salary or wages employers pay to employees eligible for retirement-system coverage might not be reportable to DRS.
PSERS Plan 2Dollars in Thousands
6/30/2016 6/30/2015 6/30/2014 6/30/2013 6/30/2012 6/30/2011 6/30/2010 6/30/2009 6/30/2008 6/30/2007
Contractually Required Contributions (CRC)1 $ 21,408 – – – – – – – – –
Actuarially Determined Contributions (ADC)2 22,382 18,545 17,053 15,100 14,700 14,700 14,800 14,300 12,400 7,100
Contributions in Relation to the Actuarially Determined Contributions
20,058 18,704 17,124 15,650 15,285 15,591 15,238 14,510 11,700 6,612
Contribution Deficiency (Excess) $ 2,324 $ (159) $ (71) $ (550) $ (585) $ (891) $ (438) $ (210) $ 700 $ 488
Covered-Employee Payroll3 324,850 293,007 270,102 249,022 236,495 232,044 232,826 222,044 178,767 101,789
Contributions as a Percentage of Covered-Employee Payroll
6.17% 6.38% 6.34% 6.28% 6.46% 6.72% 6.54% 6.53% 6.54% 6.50%

Com
prehensive Annual Financial Report —
Financial Section s D
RS 91
Required Supplementary Information: Schedule of Employer Contributions (cont.)
Portions of the above contributions were assessed on the covered payrolls of TRS Plan 2/3.
TRS Plan 1Dollars in Thousands
6/30/2016 6/30/2015 6/30/2014 6/30/2013 6/30/2012 6/30/2011 6/30/2010 6/30/2009 6/30/2008 6/30/2007
Contractually Required Contributions (CRC)1 $ 325,771 – – – – – – – – –
Actuarially Determined Contributions (ADC)2 361,481 218,542 208,119 275,400 254,000 205,900 406,100 391,000 294,700 249,800
Contributions in Relation to the Actuarially Determined Contributions
315,934 223,886 200,674 118,569 111,937 96,803 112,731 178,850 113,089 60,462
Contribution Deficiency (Excess) $ 45,547 $ (5,344) $ 7,445 $ 156,831 $ 142,063 $ 109,097 $ 293,369 $ 212,150 $ 181,611 $ 189,338
Covered-Employee Payroll3 84,192 113,313 148,430 192,532 280,366 349,660 418,353 480,118 525,223 586,394
Contributions as a Percentage of Covered-Employee Payroll
375.25% 197.58% 135.20% 61.58% 39.93% 27.68% 26.95% 37.25% 21.53% 10.31%
1 See the “Notes to Required Supplementary Information” on page 96 for an explanation of how the CRC and ADC were calculated. The CRC was the same as the ADC in years when no data for the CRC is displayed.
2 Prior to 2014, the annual required contribution (ARC) amounts were presented for the actuarially determined contributions. The ARC changes each year with the experience of the plans. Factors influencing the experience include changes in funding methods, assumptions, plan provisions, and economic and demographic gains and losses.
3 “Covered-employee payroll” includes employee compensation, as defined by statute, that employers reported to DRS. Employer-reported employee compensation is also used to calculate retirement contributions due to the retirement systems. Total salary or wages employers pay to employees eligible for retirement-system coverage might not be reportable to DRS.
TRS Plan 2/3Dollars in Thousands
6/30/2016 6/30/2015 6/30/2014 6/30/2013 6/30/2012 6/30/2011 6/30/2010 6/30/2009 6/30/2008 6/30/2007
Contractually Required Contributions (CRC)1 $ 339,634 – – – – – – – – –
Actuarially Determined Contributions (ADC)2 382,088 269,160 255,277 231,600 232,200 232,300 221,100 186,900 208,900 167,700
Contributions in Relation to the Actuarially Determined Contributions
316,022 267,038 249,341 228,974 213,852 168,264 164,959 160,793 109,523 102,180
Contribution Deficiency (Excess) $ 66,066 $ 2,122 $ 5,936 $ 2,626 $ 18,348 $ 64,036 $ 56,141 $ 26,107 $ 99,377 $ 65,520
Covered-Employee Payroll3 5,054,070 4,681,511 4,436,592 4,203,893 4,162,779 4,171,447 4,056,271 3,950,376 3,664,646 3,375,160
Contributions as a Percentage of Covered-Employee Payroll
6.25% 5.70% 5.62% 5.45% 5.14% 4.03% 4.07% 4.07% 2.99% 3.03%

92
DRS s
Financial Section — C
omprehensive A
nnual Financial Report
Required Supplementary Information: Schedule of Employer Contributions (cont.)
LEOFF Plan 1Dollars in Thousands
6/30/2016 6/30/2015 6/30/2014 6/30/2013 6/30/2012 6/30/2011 6/30/2010 6/30/2009 6/30/2008 6/30/2007
Contractually Required Contributions (CRC)1 – – – – – – – – – –
Actuarially Determined Contributions (ADC)2 $ – $ – $ – $ – $ – $ – $ – $ – $ – $ –
Contributions in Relation to the Actuarially Determined Contributions
– 60 98 555 2 3 49 216 8 56
Contribution Deficiency (Excess) $ – $ (60) $ (98) $ (555) $ (2) $ (3) $ (49) $ (216) $ (8) $ (56)
Covered-Employee Payroll3 7,932 10,583 13,888 16,521 21,456 27,171 32,110 41,040 41,384 46,327
Contributions as a Percentage of Covered-Employee Payroll
0.00% 0.57% 0.71% 3.36% 0.01% 0.01% 0.15% 0.53% 0.02% 0.12%
1 See the “Notes to Required Supplementary Information” on page 96 for an explanation of how the CRC and ADC were calculated. The CRC was the same as the ADC in years when no data for the CRC is displayed.
2 Prior to 2014, the annual required contribution (ARC) amounts were presented for the actuarially determined contributions. The ARC changes each year with the experience of the plans. Factors influencing the experience include changes in funding methods, assumptions, plan provisions, and economic and demographic gains and losses.
3 “Covered-employee payroll” includes employee compensation, as defined by statute, that employers reported to DRS. Employer-reported employee compensation is also used to calculate retirement contributions due to the retirement systems. Total salary or wages employers pay to employees eligible for retirement-system coverage might not be reportable to DRS.
LEOFF Plan 2Dollars in Thousands
6/30/2016 6/30/2015 6/30/2014 6/30/2013 6/30/2012 6/30/2011 6/30/2010 6/30/2009 6/30/2008 6/30/2007
Contractually Required Contributions (CRC)1 – – – – – – – – – –
Actuarially Determined Contributions (ADC)2 $ 151,718 $ 147,438 $ 141,696 $ 94,700 $ 97,300 $ 84,000 $ 112,200 $ 105,300 $ 102,100 $ 94,900
Contributions in Relation to the Actuarially Determined Contributions
152,424 147,461 141,082 136,643 133,250 131,757 128,374 128,986 119,290 96,119
Contribution Deficiency (Excess) $ (706) $ (23) $ 614 $ (41,943) $ (35,950) $ (47,757) $ (16,174) $ (23,686) $ (17,190) $ (1,219)
Covered-Employee Payroll3 1,804,024 1,744,180 1,674,432 1,605,364 1,569,051 1,542,269 1,515,925 1,455,623 1,343,558 1,221,223
Contributions as a Percentage of Covered-Employee Payroll
8.45% 8.45% 8.43% 8.51% 8.49% 8.54% 8.47% 8.86% 8.88% 7.87%

Com
prehensive Annual Financial Report —
Financial Section s D
RS 93
Required Supplementary Information: Schedule of Employer Contributions (cont.)
WSPRS Plan 1/2Dollars in Thousands
6/30/2016 6/30/2015 6/30/2014 6/30/2013 6/30/2012 6/30/2011 6/30/2010 6/30/2009 6/30/2008 6/30/2007
Contractually Required Contributions (CRC)1 – – – – – – – – – –
Actuarially Determined Contributions (ADC)2 $ 7,618 $ 6,810 $ 6,677 $ 2,500 $ 2,900 $ 2,300 $ 6,600 $ 5,000 $ 6,800 $ 5,300
Contributions in Relation to the Actuarially Determined Contributions
7,044 6,679 6,587 6,478 6,454 5,251 5,271 6,371 6,064 3,278
Contribution Deficiency (Excess) $ 574 $ 131 $ 90 $ (3,978) $ (3,554) $ (2,951) $ 1,329 $ (1,371) $ 736 $ 2,022
Covered-Employee Payroll3 86,669 84,379 83,282 81,895 81,578 81,882 82,764 82,719 78,781 72,688
Contributions as a Percentage of Covered-Employee Payroll
8.13% 7.92% 7.91% 7.91% 7.91% 6.41% 6.37% 7.70% 7.70% 4.51%
1 See the “Notes to Required Supplementary Information” on page 96 for an explanation of how the CRC and ADC were calculated. The CRC was the same as the ADC in years when no data for the CRC is displayed.
2 Prior to 2014, the annual required contribution (ARC) amounts were presented for the actuarially determined contributions. The ARC changes each year with the experience of the plans. Factors influencing the experience include changes in funding methods, assumptions, plan provisions, and economic and demographic gains and losses.
3 “Covered-employee payroll” includes employee compensation, as defined by statute, that employers reported to DRS. Employer-reported employee compensation is also used to calculate retirement contributions due to the retirement systems. Total salary or wages employers pay to employees eligible for retirement-system coverage might not be reportable to DRS.
JRSDollars in Thousands
6/30/2016 6/30/2015 6/30/2014 6/30/2013 6/30/2012 6/30/2011 6/30/2010 6/30/2009 6/30/2008 6/30/2007
Contractually Required Contributions (CRC)1 – – – – – – – – – –
Actuarially Determined Contributions (ADC)2 $ 8,999 $ 9,132 $ 9,205 $ 21,700 $ 22,600 $ 18,600 $ 20,400 $ 21,200 $ 26,600 $ 37,300
Contributions in Relation to the Actuarially Determined Contributions
9,500 10,600 10,600 10,112 8,131 10,906 11,649 10,305 9,712 9,650
Contribution Deficiency (Excess) $ (501) $ (1,468) $ (1,395) $ 11,588 $ 14,469 $ 7,694 $ 8,751 $ 10,895 $ 16,888 $ 27,650
Covered-Employee Payroll3 – – – 160 407 611 1,053 1,394 1,496 1,478
Contributions as a Percentage of Covered-Employee Payroll
n/a n/a n/a 6,320.00% 1,997.79% 1,784.94% 1,106.27% 739.24% 649.20% 652.91%

94 D
RS s Financial Section —
Com
prehensive Annual Financial Report
Required Supplementary Information: Schedule of Employer Contributions (cont.)
JRFDollars in Thousands
6/30/2016 6/30/2015 6/30/2014 6/30/2013 6/30/2012 6/30/2011 6/30/2010 6/30/2009 6/30/2008 6/30/2007
Contractually Required Contributions (CRC)1 – – – – – – – – – –
Actuarially Determined Contributions (ADC)2 $ 444 $ 539 $ 425 $ 400 $ 300 $ 100 $ – $ – $ – $ –
Contributions in Relation to the Actuarially Determined Contributions
501 – – – – – – – 300 300
Contribution Deficiency (Excess) $ (57) $ 539 $ 425 $ 400 $ 300 $ 100 $ – $ – $ (300) $ (300)
Covered-Employee Payroll3 – – – – – – – – – –
Contributions as a Percentage of Covered-Employee Payroll
n/a n/a n/a n/a n/a n/a n/a n/a n/a n/a
1 See the “Notes to Required Supplementary Information” on page 96 for an explanation of how the CRC and ADC were calculated. The CRC was the same as the ADC in years when no data for the CRC is displayed.
2 Prior to 2014, the annual required contribution (ARC) amounts were presented for the actuarially determined contributions. The ARC changes each year with the experience of the plans. Factors influencing the experience include changes in funding methods, assumptions, plan provisions, and economic and demographic gains and losses.
3 “Covered-employee payroll” includes employee compensation, as defined by statute, that employers reported to DRS. Employer-reported employee compensation is also used to calculate retirement contributions due to the retirement systems. Total salary or wages employers pay to employees eligible for retirement-system coverage might not be reportable to DRS.

Comprehensive Annual Financial Report — Financial Section s DRS 95
Required Supplementary Information: Schedule of Investment Returns
Annual Money-Weighted Rates of Return Net of Investment ExpensesPlan 6/30/2016 6/30/2015 6/30/2014
PERS Plan 1 2.19% 4.45% 18.76%
PERS Plan 2/3 2.47% 4.63% 18.94%
SERS Plan 2/3 2.49% 4.64% 18.96%
PSERS Plan 2 2.75% 4.76% 18.91%
TRS Plan 1 2.09% 4.41% 18.73%
TRS Plan 2/3 2.51% 4.65% 18.96%
LEOFF Plan 1 2.25% 4.51% 18.82%
LEOFF Plan 2 2.48% 4.64% 18.93%
WSPRS Plan 1/2 2.34% 4.56% 18.87%
JRS 0.62% 0.40% 0.16%
JRF 0.62% 0.40% 0.16%
This schedule will be built prospectively until it contains 10 years of data.

96 DRS s Financial Section — Comprehensive Annual Financial Report
Notes to Required Supplementary Information for the Year Ended June 30, 2016
Methods and Assumptions Used in Calculations of Actuarially Determined Contributions for PERS, PSERS, SERS, TRS, LEOFF and WSPRS: The Office of the State Actuary (OSA) calculates the actuarially determined contributions (ADC) based on the results of an actuarial valuation consistent with the state’s funding policy defined in Chapter 41.45 RCW.
Consistent with the state’s contribution-rate adoption process, the results of an actuarial valuation with an odd-numbered year valuation date determine the ADC for the biennium that ensues two years later. For example, the actuarial valuation with a June 30, 2015, valuation date, completed in the fall of 2016, determines the ADC for the period beginning July 1, 2017, and ending June 30, 2019.
Methods and Assumptions Used in Calculations of Actuarially Determined Contributions for JRS and JRF: OSA calculates the actuarially determined contributions (ADC) based on the results of an actuarial valuation and sets it equal to the expected benefit payments from the plan. Consistent with the state’s funding policy defined in Chapters 2.10.90 and 2.12.60 RCW, the Legislature makes biennial appropriations to ensure the fund is solvent so it can make the necessary benefit payments.
Additional Considerations on ADC for All Plans: OSA calculates the ADC consistent with the methods described above. Adopted contribution rates could be different pending the actions of the governing bodies. For instance, for the period beginning July 1, 2015, and ending June 30, 2017, the contribution rates the Pension Funding Council adopted, which the Legislature did not change, reflect a phasing in of the increase to contribution rates that resulted from a change to the mortality assumption. The increase is expected to be phased in over three biennia for PERS Plans 1, 2 and 3; TRS Plans 1, 2 and 3; SERS Plans 2 and 3; PSERS Plan 2; and WSPRS Plans 1 and 2.
CRC for All Cost-Sharing Plans (All Plans Other Than WSPRS Plan 1/2, JRS and JRF): For cost-sharing plans, OSA calculates the contractually required contributions (CRC) using the same assumptions and methods as the
ADC except the CRC reflect the adopted contribution rates for the time period shown, which might differ from the contribution rates produced for the ADC.
Additional plan-specific actuarial method and assumption information is located in Note 2, Section B, of the Financial Section.

Comprehensive Annual Financial Report — Financial Section s DRS 97
Supporting Schedules
Schedule of Administrative ExpensesFor the Year Ended June 30, 2016 — Dollars in Thousands
Retirement Pension
Trust Funds
Deferred Compensation
Pension Trust FundTotals
June 30, 2016Totals
June 30, 2015
Current Personnel
Salaries and Wages $ 13,067 $ 994 $ 14,061 $ $13,327
Employee Benefits 4,704 369 5,073 4,180
Personal Service Contracts 3,624 235 3,859 1,567
Total Personnel Expenses 21,395 1,598 22,993 19,074
Goods and Services
Actuary Services 1,739 – 1,739 1,610
Archives and Records Management 33 2 35 42
Attorney General Services 131 15 146 132
Audit Services 472 7 479 693
Bad Debts Expense 46 – 46 98
Collections 51 – 51 41
Communications 368 4 372 400
Data Processing Services 2,231 84 2,315 2,223
Employee Professional Development and Training 156 1 157 204
Facilities and Services 328 12 340 340
Insurance 10 1 11 8
Legal Fees 1,724 – 1,724 1,242
LEOFF 2 Board Governance 1,142 – 1,142 1,144
Medical Consultant Services 36 – 36 28
Other Contractual Services 926 14 940 703
Other Goods and Services 12 – 12 11
Personnel Services 41 3 44 44
Printing and Reproduction 181 6 187 199
Rental and Leases 1,394 97 1,491 1,522
Repairs and Alterations 130 8 138 138
Subscriptions 31 – 31 32
Supplies and Materials 44 2 46 58
Utilities 117 9 126 122
Total Goods and Services 11,343 265 11,608 11,034
Miscellaneous Expenses
Grants, Benefits and Client Services – – – –
Noncapitalized Equipment 665 40 705 1,312
Travel 120 38 158 156
Total Miscellaneous Expenses 785 78 863 1,468
Total Current Expenses 33,523 1,941 35,464 31,576
Capital Outlays
Furnishings, Equipment and Software 66 – 66 54
Improvements Other Than Buildings – – – –
Total Capital Outlays 66 – 66 54
Depreciation and Loss — Capital Assets 79 – 79 124
Total Administrative Expenses $ 33,668 $ 1,941 $ 35,609 $ 31,754

98 DRS s Financial Section — Comprehensive Annual Financial Report
Supporting Schedules (cont.)
Schedule of Investment Expenses — Pension Trust FundsFor the Year Ended June 30, 2016 — Dollars in Thousands
Fees Paid Netted Fees1
Total Fees and Expenses
Equity Securities
Public Equity Active Management $ 50,907 $ 319 $ 51,226
Public Equity Passive Management 2,195 810 3,005
Alternative Investments
Private Equity 177,935 10,060 187,995
Real Estate 27,113 4,608 31,721
Tangible Assets 48,170 – 48,170
Cash Management 2,166 – 2,166
Debt Securities – – –
Other Fees
Consultants and Accounting 1,270 – 1,270
Legal Fees 1,482 – 1,482
Research Services 2,241 – 2,241
Securities Lending Rebates and Fees 4,377 – 4,377
Miscellaneous Fees 154 – 154
DCP Management Fees 5,181 – 5,181
JRA Management Fees 15 – 15
PERS Plan 3 Management Fees 1,077 – 1,077
SERS Plan 3 Management Fees 462 – 462
TRS Plan 3 Management Fees 3,014 – 3,014
WSIB Operating Costs 15,330 – 15,330
Total Investment Expenses $ 343,089 $ 15,797 $ 358,886
1 Netted fees are included in unrealized gains (losses) in the accompanying financial statements.

Comprehensive Annual Financial Report — Financial Section s DRS 99
Supporting Schedules (cont.)
Schedule of Payments to ConsultantsFor the Year Ended June 30, 2016 — Dollars in Thousands
Commission/Fee
Computer/Technology
Aetea Information Technology Inc. $ 168
Bizagi 1,780
Martin Analysis & Programming Inc. 321
Software AG USA Inc. 43
Total Computer/Technology 2,312
Legal
Freimund Jackson Tardif & Benedict Garratt PLLC 283
Gallitono & O'Connor LLP 155
Ice Miller LLP 45
Total Legal 483
Management
Business Coaching & Consulting 4
CEM Benchmarking Inc. 45
Charles W. Cammack Associates Inc. 131
Christie O'Loughlin & Associates 12
CliftonLarsonAllen LLP 76
The Caughlin Group 3
Total Management 271
Recordkeeping
Great-West Life & Annuity 1,031
ICMA Retirement Corp. 833
Total Recordkeeping 1,864
Total Payments to Consultants $ 4,930
For fees paid to investment professionals, refer to the Investment Section of this report.

100 DRS s Financial Section — Comprehensive Annual Financial Report
This page is intentionally blank.

2016 Highlights
Employer Reporting Application
Work began this year on the first stage of modernizing the legacy systems that support DRS’ core business functions. The first effort will replace the 20-year-old system used by government employers to report member account and financial information to DRS.
The new Employer Reporting Application (ERA) is expected to be fully rolled out by mid-2018.
Investment Section

Investment Section

Comprehensive Annual Financial Report — Investment Section s DRS 103
• Participant Concentration: The DRS retirementfunds make up 99.7% of the CTF. Theirrespective concentrations are:
o PERS 1 (8.6%)o PERS 2/3 defined benefit (DB) and
defined contribution (DC) plans (38.6%)o SERS 2/3 DB and DC plans (6.6%)o PSERS 2 (0.5%)o TRS 1 (6.6%)o TRS 2/3 DB and DC plans (18.6%)o WSPRS 1/2 (1.4%)o LEOFF 1 (6.5%)o LEOFF 2 (12.3%)
• External Managers: The WSIB engages about140 partnerships and external managers to assistin the management of the CTF’s investments.
• Risk: The various risks of the CTF portfolioinclude interest rate risk, credit risk,concentration risk and foreign currency risk, asdescribed in Note 1 of the Financial Section ofthis report. The WSIB has not created a totalfund risk profile for the CTF.
• Leverage: The WSIB does not leverage the CTFportfolio as a whole. Individual securities withinthe CTF do have leverage; however, the WSIBdoes not capture this information on a totalbasis.
• Earnings: The CTF does not distribute earningsdirectly to the owner funds. The retirement fundplans are allowed to purchase or sell units in thepool, based on the fair value of the underlyingassets, on the first business day of each month.The net asset value includes interest and dividendincome, which is recognized on a trade-datebasis, and purchases and sales of investments,which are recorded on a trade-date basis.
• Expense: The CTF’s expense ratio for the yearended June 30, 2016, was 0.40465%.
• Yield: The CTF’s fixed income portfolio has ayield of 3.10%.
• Weighted Average Maturity: The CTF fixedincome portfolio has a weighted averagematurity of 7.8 years. Additional maturityinformation is available in Note 1 of theFinancial Section of this report.
Basis of Presentation of Investment DataInvestments are reported at fair value. Unrealized gains and losses are included as investment income.
The net assets of the retirement funds are valued on a monthly basis using publicly traded securities, limited partnerships, private equity limited partnerships and real estate limited partnerships.
Publicly Traded Securities (Corporate Stock, Commingled Funds, Investment Derivatives and Fixed Income): Fair values are based on published market prices, quotations from national security exchanges and security pricing services as of each month-end closing of the New York Stock Exchange.
Limited Partnerships: The fair value of investments that are organized as limited partnerships and have no readily ascertainable fair value (such as private equity, real estate and tangible assets) has been determined by management based on the individual investment’s capital account balance, reported at fair value by the general partner, at the closest available reporting period, adjusted for subsequent contributions, distributions, management fees, changes in value of foreign currency and published market prices for
Report on Investment Activity
Prepared by the Washington State Investment Board
OverviewThe Washington State Investment Board (WSIB) manages retirement fund assets to maximize return at a prudent level of risk (Chapter 43.33A.110 RCW). Investment decisions are made within the framework of a Strategic Asset Allocation Policy and a series of written WSIB-adopted investment policies for the various asset classes in which the WSIB invests.
The retirement funds, collectively called the Commingled Trust Fund (CTF), increased in value by $994 million to $82.7 billion during fiscal year 2016. The CTF return was 2.7% for the fiscal year.
Established on July 1, 1992, the CTF is a diversified pool of investments that invests in fixed income, public equity, private equity, real estate and tangible assets. Additional general information about the CTF includes:

104 DRS s Investment Section — Comprehensive Annual Financial Report
certain securities. Independent auditors audit the limited partnership’s annual financial statements.
Private Equity Limited Partnerships: The fair value of individual capital account balances is based on the valuations private equity partnerships report using the following methodologies to value the underlying portfolio companies:
• Valuations of publicly traded portfolio companies are based on active exchanges using quoted market prices as of the close of trading for each month-end.
• When a portfolio company investment does not have a readily available market price but has a return that is determined by reference to an asset for which a market price is readily available, valuations are based on the closing market price of the reference asset on the valuation date, adjusted for factors that affect the fair value of the investment held.
• When the portfolio company investments are private holdings and are not traded on active security exchanges, valuation methodologies used consist primarily of income and market approaches. The income approach involves a discounted cash-flow analysis based on portfolio companies’ projections. The market approach involves valuing a company at a multiple of a specified financial measure (generally EBITDA, or earnings before interest, taxes, depreciation and amortization) based on multiples at which comparable companies trade.
Real Estate Limited Partnerships: Real estate partnerships provide quarterly valuations, based on the most recent capital account balance, to WSIB management. Individual properties are valued by the partnerships at least annually and are adjusted as frequently as quarterly if material market or operational changes have occurred.
Properties are generally externally valued every one to five years, depending on the partnership. Structured finance investments receive quarterly value adjustments by the partners, generally applying the assumption that all such positions will be held to maturity.
Annual audits of most partnerships include a review of compliance with the partnership’s valuation policies.
Interest and dividend income is recognized when earned. Capital gains and losses are recognized on a trade-date basis. Purchases and sales of investments are also recorded on a trade-date basis. The investment results reported for these asset classes in the Investment Section reflect these practices.
PerformanceThe chart below shows the returns for the CTF on a total fund basis as well as by asset class. Appropriate benchmark returns are provided for comparison purposes.
Returns for the CTF Based on Total Fund and Asset Class — Periods Ending June 30, 2016
1-Year 3-Year 5-Year 10-Year
Total Fund 2.65% 8.03% 7.51% 6.18%
Passive Benchmark (0.51)% 5.90% 5.39% 5.11%
Fixed Income 4.77% 3.65% 3.44% 5.78%
Barclays Capital Universal 5.82% 4.20% 4.01% 5.30%
Tangible (0.77)% 2.59% 1.61% n/a
CPI Lagged One Quarter + 400 bp
4.87% 4.80% 5.30% n/a
Real Estate 40.43% 12.56% 12.79% 7.48%
8% Return Over Rolling 10 Years
n/a n/a n/a 8.00%
NCREIF Lagged One Quarter (for Comparison Purposes)
11.84% 11.91% 11.93% 7.61%
Public Equity (2.60)% 7.03% 6.36% 4.75%
Dow Jones Wilshire Global Index
(3.54)% 6.46% 5.76% 4.73%
Private Equity 4.67% 11.80% 10.81% 8.98%
Russell 3000 Lagged One Quarter + 300 bp
2.66% 14.15% 14.01% 9.90%
Innovation (4.80)% 5.81% 6.90% n/a
Custom Benchmark (3.57)% (0.64)% (2.49)% n/a
Cash 0.32% 0.18% 0.17% 1.18%
90-Day T-Bills 0.21% 0.11% 0.10% 1.08%
Performance information is compiled by the custodian, State Street Bank. Performance numbers are reported net of management fees and are prepared using a time-weighted rate of return based on the current market value.
Report on Investment Activity (cont.)

Comprehensive Annual Financial Report — Investment Section s DRS 105
Asset AllocationInvestment performance is a result of two primary factors: individual asset selection and the allocation of the portfolio among asset classes (for example, stocks, fixed income and real estate). Studies suggest that more than 90% of investment performance can be explained by asset allocation decisions.
Accordingly, the WSIB sets a specific, long-term target asset mix and adopts tight ranges around those targets to control the overall risk and return of the CTF. On a daily basis, the WSIB reviews the asset allocation in relation to the established ranges. Its staff shifts assets whenever the allocation range for an asset exceeds the approved range or when cash is needed elsewhere.
The WSIB reviews changes to the overall asset mix every three to four years.
The chart below shows the CTF’s asset allocation as of June 30, 2016, as well as the long-term target allocations.
Current Asset Allocation and Long-TermTarget Allocations — As of June 30, 2016
Asset Type Target Allocation Actual Allocation
Fixed Income 20.00% 22.04%
Tangible Assets 5.00% 2.94%
Real Estate 15.00% 15.78%
Public Equity 37.00% 37.95%
Private Equity 23.00% 20.96%
Innovation 0.00% 0.07%
Cash 0.00% 0.26%
Total 100.00% 100.00%
Public EquityThe public equity program uses a global benchmark, the Morgan Stanley All Country World with USA Gross Investable Market Index, reflecting the globalization of capital markets. In a world in which American companies like Coca-Cola get most of their revenue from overseas and many so-called foreign companies serve mainly the U.S., distinctions between “U.S. stocks” and “international stocks” have become increasingly blurred. The WSIB believes the future success of the program depends on investment managers finding the most attractive opportunities
wherever they are in the world.
Because U.S. equity markets are generally efficient and international equity markets are increasingly efficient, most of the WSIB’s public equity investments are in low-cost, broad-based passive index funds.
The WSIB employs both passive U.S. equity and passive international equity to maintain policy weights in both areas. All the global equity mandates in which investment firms can pick the most attractive stocks wherever they are in the world (U.S. or international) and all the emerging markets equity mandates are actively managed.
Retirement Funds’ 10 Largest Public EquitiesAs of June 30, 2016
Holdings Exposure by Country
Apple Inc. 1.19% United States 56.64%
Alphabet Inc. 0.99% United Kingdom 7.35%
Microsoft Corp. 0.97% Japan 6.21%
Exxon Mobil Corp. 0.82% Switzerland 3.21%
Nestle SA. 0.82% Germany 2.60%
Oracle Corp. 0.75% France 2.54%
Wells Fargo & Co.. 0.73% Canada 2.47%
Facebook Inc. 0.71% Australia 1.87%
Royal Dutch Shell PLC 0.70% China 1.52%
Novartis AG 0.69% Korea, Republic of 1.30%
U.S. EquityThe U.S. equity portfolio is structured to capture the returns of the broad U.S. equity market as measured by the Dow Jones Total Stock Market Index (TSMI). The index is composed of all U.S. domiciled common equities for which pricing information is readily available and currently represents about 5,000 companies. The portfolio is managed externally using a passive management strategy that tracks the index.
Non-U.S. EquityThe non-U.S. equity portfolio is benchmarked to a broad non-U.S. equity benchmark, currently the MSCI All Country World ex U.S. Investable Market Index. About 34% of the public equity portfolio is invested in non-U.S. markets, 74% of which is invested in developed markets with the remaining portion invested in the emerging markets.
Report on Investment Activity (cont.)
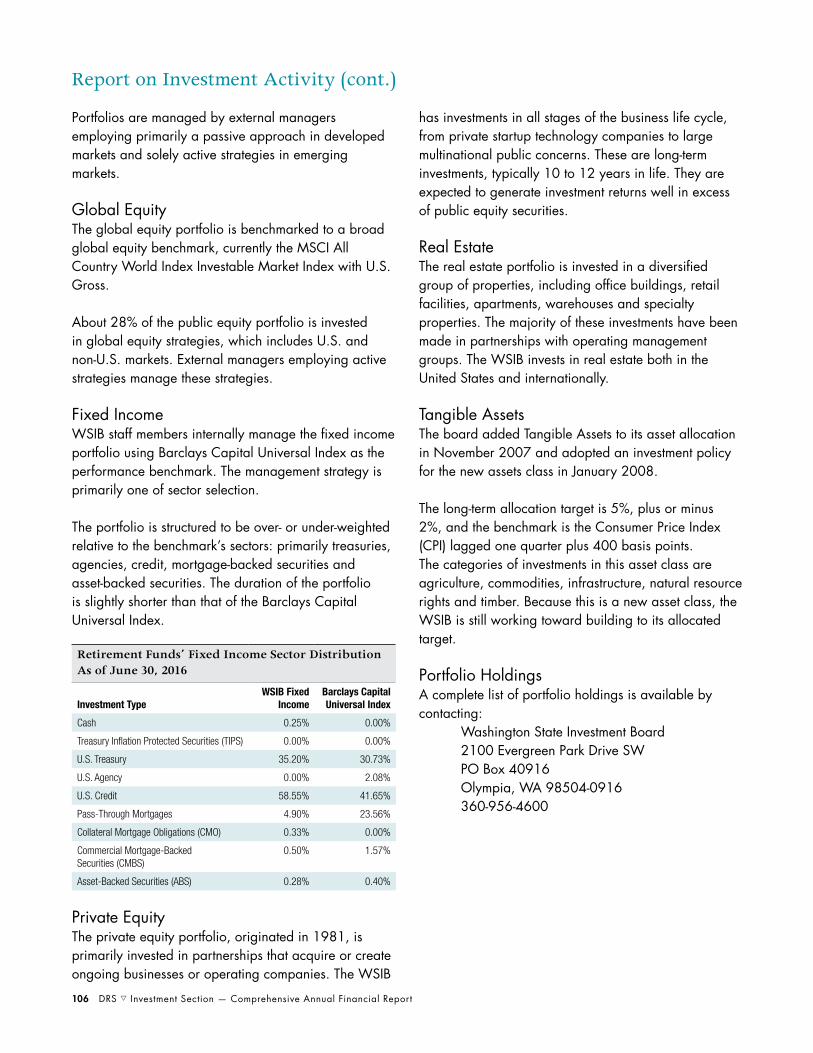
106 DRS s Investment Section — Comprehensive Annual Financial Report
Portfolios are managed by external managers employing primarily a passive approach in developed markets and solely active strategies in emerging markets.
Global EquityThe global equity portfolio is benchmarked to a broad global equity benchmark, currently the MSCI All Country World Index Investable Market Index with U.S. Gross.
About 28% of the public equity portfolio is invested in global equity strategies, which includes U.S. and non-U.S. markets. External managers employing active strategies manage these strategies.
Fixed IncomeWSIB staff members internally manage the fixed income portfolio using Barclays Capital Universal Index as the performance benchmark. The management strategy is primarily one of sector selection.
The portfolio is structured to be over- or under-weighted relative to the benchmark’s sectors: primarily treasuries, agencies, credit, mortgage-backed securities and asset-backed securities. The duration of the portfolio is slightly shorter than that of the Barclays Capital Universal Index.
Retirement Funds’ Fixed Income Sector DistributionAs of June 30, 2016
Investment TypeWSIB Fixed
IncomeBarclays Capital Universal Index
Cash 0.25% 0.00%
Treasury Inflation Protected Securities (TIPS) 0.00% 0.00%
U.S. Treasury 35.20% 30.73%
U.S. Agency 0.00% 2.08%
U.S. Credit 58.55% 41.65%
Pass-Through Mortgages 4.90% 23.56%
Collateral Mortgage Obligations (CMO) 0.33% 0.00%
Commercial Mortgage-Backed Securities (CMBS)
0.50% 1.57%
Asset-Backed Securities (ABS) 0.28% 0.40%
Private EquityThe private equity portfolio, originated in 1981, is primarily invested in partnerships that acquire or create ongoing businesses or operating companies. The WSIB
has investments in all stages of the business life cycle, from private startup technology companies to large multinational public concerns. These are long-term investments, typically 10 to 12 years in life. They are expected to generate investment returns well in excess of public equity securities.
Real EstateThe real estate portfolio is invested in a diversified group of properties, including office buildings, retail facilities, apartments, warehouses and specialty properties. The majority of these investments have been made in partnerships with operating management groups. The WSIB invests in real estate both in the United States and internationally.
Tangible AssetsThe board added Tangible Assets to its asset allocation in November 2007 and adopted an investment policy for the new assets class in January 2008.
The long-term allocation target is 5%, plus or minus 2%, and the benchmark is the Consumer Price Index (CPI) lagged one quarter plus 400 basis points. The categories of investments in this asset class are agriculture, commodities, infrastructure, natural resource rights and timber. Because this is a new asset class, the WSIB is still working toward building to its allocated target.
Portfolio HoldingsA complete list of portfolio holdings is available by contacting:
Washington State Investment Board 2100 Evergreen Park Drive SW PO Box 40916Olympia, WA 98504-0916 360-956-4600
Report on Investment Activity (cont.)

Comprehensive Annual Financial Report — Investment Section s DRS 107
Summary of Investment Policies
The Washington State Investment Board (WSIB), as authorized by statute, has the investment management responsibility for the pension funds. The WSIB manages retirement fund assets to maximize return at a prudent level of risk (RCW 43.33A.110).
Retirement Fund Asset AllocationThe WSIB establishes asset allocation targets that must be considered at all times when making investment decisions. The asset mix might deviate from the target.
Deviations greater than predetermined, acceptable levels require rebalancing back to the target. If an asset class exceeds its range, the goal of rebalancing is to meet the target allocation within consideration of the other remaining asset classes.
Retirement funds are invested in the Commingled Trust Fund (CTF). The CTF’s performance benchmark objective is to exceed the return of a policy benchmark consisting of public market indices weighted according to asset allocation targets. The asset allocation for the CTF is formally reviewed every three or four years.
The WSIB periodically reviews the asset allocation in relation to the established ranges.
Public Markets EquityThe Public Markets equity program seeks to:
• Achieve the highest return possible from active management with passive as the default consistent with prudent risk management and the desire for downside protection
• Maintain liquidity and transparency in public equity, given the WSIB’s allocation to illiquid markets and investment structures in other strategies and/or asset classes
• Provide diversification to the WSIB’s overall investment program
The public markets equity portion of the retirement funds invests in publicly traded equities globally, including equity securities in the U.S., developed non-U.S. and emerging markets. The program has a global benchmark, currently the MSCI All Country World Investable Market Index with U.S. Gross (MSCI ACWI IMI w/ U.S. Gross).
Fixed IncomeThe WSIB’s fixed income investments are actively managed with the goal of exceeding the return of the Barclays Capital Universal Index over the long term. The major permissible investments include U.S. Treasuries and government agencies, Treasury Inflation Protection Securities (TIPS), mortgage-backed securities, asset-backed securities, and credit bonds, both investment grade in quality and below investment grade.
Policy constrains the portfolio from investing more than 1% of the portfolio’s par holdings in any single issuer with a quality rating below investment grade and from having a duration (the sensitivity of the portfolio’s market value to changes in the level of interest rates) that is more than 20% different from the duration of the Universal Index. In addition, the major sector allocations are limited to the following ranges:
Range Limitations of Major Sector Allocations
U.S. Treasuries and Government Agencies 10-45%
Credit Bonds 10-80%
Asset-Backed Securities 0-10%
Commercial Mortgage-Backed Securities 0-10%
Mortgage-Backed Securities 5-45%
Private Equity InvestingThe WSIB can invest in any appropriate private equity investment opportunity that has the potential for returns superior to traditional investment opportunities and that is not prohibited by law or the WSIB’s policies.
These investment types are divided into venture capital investments, corporate finance (including leveraged, management and employee buyouts), distressed, international and mezzanine investments. Private equity investments are made through limited partnership vehicles.
To meet the return and plan objectives, the private equity portfolio has diversified investments in companies in a variety of stages of growth. The portfolio also includes a broad cross-section of opportunities in different industries and geographic regions.

108 DRS s Investment Section — Comprehensive Annual Financial Report
Summary of Investment Policies (cont.)
Real Estate ProgramThe WSIB’s real estate program is an externally managed pool of selected partnership investments, intended to provide alternative portfolio characteristics when compared to traditional stock and bond investments.
The majority of the WSIB’s partnerships invest in institutional-quality real estate assets that are leased to third parties. Income generated from bond-like lease payments coupled with the hard asset qualities of real estate combine to generate returns that are expected to fall between the return expectations for fixed income and equities.
The real estate portfolio is managed to deliver risk-adjusted returns that are consistent with the board’s long-term return expectations for the asset class. The WSIB’s real estate partnerships typically invest in private real estate assets that are held for long-term income and appreciation.
Many of the WSIB’s investment partnerships do not involve co-investment with other financial entities, thereby providing the WSIB with control provisions related to liquidation, acquisition and ongoing operational decisions for annual capital expenditures.
Volatility within the real estate portfolio is minimized through a combination of factors. First, the majority of the WSIB’s partners own real estate assets in a private investment form, which is not subject to public market volatility. Second, real estate capital is diversified among a host of partners with varying investment styles. Third, partnership assets are invested in numerous economic regions, including foreign markets, and in various property types. Fourth, the WSIB’s partners invest at different points within the properties’ capital structures and life cycles.
The WSIB’s current benchmark for real estate is an 8% return over a rolling 10 years. The National Council of Real Estate Investment Fiduciaries (NCREIF) property index lagged one quarter is still used for comparison purposes but is no longer the policy benchmark.
Tangible AssetsThe WSIB can invest in any tangible asset investment opportunity that demonstrates acceptable risk-adjusted returns as long as law and board policy do not prohibit such opportunities. The WSIB seeks a prudent and disciplined approach to achieving a well-diversified portfolio of tangible asset investments targeting appropriate risk-adjusted returns for the asset class. Staff members make best efforts to obtain significant co-investment from their investment partners to improve alignment of interests.
Staff members prudently seek to diversify the portfolio cognizant of each partner’s strategy and business plan. Investments are not made solely to achieve product type or geographic diversification.

Comprehensive Annual Financial Report — Investment Section s DRS 109
These investment professionals provided services for the retirement funds during fiscal year 2016:
Investment Professionals
For the Year Ended June 30, 2016 — Page 1 of 2
Private Equity Partners
Accel PartnersActisAdvent InternationalAffinity Equity PartnersAlta CommunicationsAmpersand VenturesApax PartnersApex Investment PartnersAustin VenturesAvenue Capital GroupBanc FundsBattery VenturesBC PartnersBlackstone GroupBoston VenturesBridgepoint CapitalButler Capital PartnersCanaan PartnersCapital Resource PartnersCDH InvestmentsCharterhouse Capital PartnersCinven Ltd.Clayton, Dubilier & RiceCode, Hennessy & SimmonsCollinson Howe & LennoxCypress GroupDenham CapitalDoughty Hanson & Co.Edgewater FundsEIG Global Energy PartnersEl Dorado VenturesElevation PartnersEndeavour CapitalEssex WoodlandsEvercore Capital PartnersFirst Reserve Corp.Evergreen Pacific PartnersFisher Lynch CapitalFortress Investment GroupFountainVest PartnersFrancisco Partners
Private Equity Partners (cont.)
Frazier & Co.Friedman Fleischer & LoweGGV CapitalGI PartnersGilbert Global Equity PartnersGreat Hill PartnersGryphon InvestorsGTCR H.I.G. VenturesHarbourVest PartnersHealthcare VenturesHellman & FriedmanInsight Venture PartnersIntersouth PartnersJMI EquityKohlberg Kravis Roberts & Co.KSL Capital PartnersLeonard Green & PartnersM/C Venture PartnersMadison Dearborn PartnersMatlinPatterson Global AdvisorsMenlo VenturesMobius Venture CapitalMorgan Stanley Venture PartnersNew Enterprise AssociatesNordic CapitalOaktree Capital ManagementOak Investment PartnersOVP Venture PartnersPAG Asia CapitalPalamon Capital PartnersPermiraPolaris Venture PartnersProvidence Equity PartnersRoark Capital GroupRhone CapitalSilver Lake PartnersSouthern Cross GroupSpark Management PartnersSprout Group
Private Equity Partners (cont.)
TA AssociatesTailwind Capital PartnersTechnology Crossover VenturesThe Riverside Co. Three Arch PartnersTowerBrook Capital PartnersTPG PartnersTrident Capital PartnersTriton PartnersU.S. Venture PartnersUnion Square VenturesUnitas CapitalVantagePoint Venture PartnersVestar Capital PartnersVision CapitalVivo VenturesWarburg Pincus Welsh, Carson, Anderson &
StoweWorldview Technology Partners
Real Estate Partners
Aevitas Property PartnersCalzada Capital PartnersCherokeeEmerging Markets Fund of FundsEvergreen Investment AdvisorsFillmore Capital PartnersGlobal Co-InvestmentHemisferio SulHudson AdvisorsMorgan StanleyPacific RealtyPrincipal Enterprise CapitalPropriumWarburg PincusWashington Holdings

110 DRS s Investment Section — Comprehensive Annual Financial Report
Investment Professionals (cont.)
For the Year Ended June 30, 2016 — Page 2 of 2
Tangible Partners
Agriculture Capital ManagementAlinda Capital PartnersEnerVest Ltd.Global Infrastructure PartnersHighstar CapitalInternational Farming Corp.Laguna Bay Pastoral Co.Lime Rock ResourceOrion Resource PartnersProstar CapitalReservoir Resource PartnersSheridan Production PartnersSilver Creek Advisory PartnersStonepeak Advisors UBS Farmland InvestorsWood Creek Capital
ManagementWarwick Management Co.
Public Equity Fund Managers
Aberdeen Asset Management PLCAQR Capital ManagementArrowstreet Capital, LPBlackRock Institutional Trust Co.Brandes Investment PartnersD.E. Shaw Investment
ManagementLazard Asset Management LLCLongviewMagellan Asset Management Ltd.Mondrian Investment Partners Ltd.State Street Global AdvisorsWilliam Blair & Co.
Overlay
State Street Global Advisors

Comprehensive Annual Financial Report — Investment Section s DRS 111
Schedule of Investment Management Fees and Commissions
For the Year Ended June 30, 2016Dollars in Thousands
Fees Paid Netted Fees1
Total Fees and Expenses
Net Assets Under Management
Equity Securities
Public Equity Active Management $ 50,907 $ 319 $ 51,226 $ 13,820,940
Public Equity Passive Management 2,195 810 3,005 15,946,343
Alternative Investments
Private Equity 177,935 10,060 187,995 17,496,857
Real Estate 27,113 4,608 31,721 13,213,294
Tangible Assets 48,170 – 48,170 2,522,495
Cash Management 2,166 – 2,166 1,517,426
Debt Securities – – – 17,939,910
Other Fees
Consultants and Accounting 1,270 – 1,270 n/a
Legal Fees 1,482 – 1,482 n/a
Research Services 2,241 – 2,241 n/a
Securities Lending Rebates and Fees 4,377 – 4,377 n/a
Miscellaneous Fees 154 – 154 n/a
DCP Management Fees 5,181 – 5,181 –
JRA Management Fees 15 – 15 –
PERS Plan 3 Management Fees 1,077 – 1,077 –
SERS Plan 3 Management Fees 462 – 462 –
TRS Plan 3 Management Fees 3,014 – 3,014 –
WSIB Operating Costs 15,330 – 15,330 –
Total Investment Expenses $ 343,089 $ 15,797 $ 358,886 $ 82,457,265
1 Netted fees are included in unrealized gains (losses) in the accompanying financial statements.

112 DRS s Investment Section — Comprehensive Annual Financial Report
Schedule of Broker Volume and Equity Commissions Paid
For the Year Ended June 30, 2016Dollars in Thousands — Page 1 of 5
Equity Fixed Income
BrokerVolume
Transacted Buy Cost Proceeds Commission
Long-Term Volume
Transacted
Short-Term Volume
Transacted
Agora Corde Titul E Val Mob $ 3,134 $ 8,180 $ 11,051 $ 12 $ – $ –
American Stock Transfer Co. 5,324 83,913 – – – –
Auerbach Grayson & Co. Inc. 50 – 547 1 – –
Australia & New Zealand Banking Group – – – – 299,157 –
Autonomous LLP 192 – 3,483 5 – –
Banco Itau SA 1,509 2,975 3,221 7 – –
Banco Pactual SA 662 80 3,736 3 – –
Banco Santander Central Hispano 1,643 866 6,667 5 – –
Banco Santander Central Hispano SA NY – – – – 18,947 –
Banco Santander Serfin SA – – – – 6,980 –
Bank of America Intl. NY United States – – – – 186,504 –
Bank of America Securities LLC – – – – 238,328 –
Bank of America/LaSalle Bank NA – – – – 3,989 –
Bank of New York – – – – 10,470 –
Bank of New York/Barclays London – – – – 323,137 –
Barclays Bank PLC – – – – 510,031 –
Barclays Bank PLC London Branch – – – – 49,859 –
Barclays Capital 3,397 13,816 39,741 66 – –
Barclays Capital Inc. – – – – 684,071 –
Barclays Capital Inc./LE 21,310 514,741 486,970 2 – –
Barclays Capital LE 2,200 57,172 892 6 – –
BBVA Bancomer SA 2,093,427 1,565 – – – –
BBVA Securities NY – – – – 22,935 –
BlackRock 10 165 – – – –
Bloomberg Tradebook Europe Ltd. 6,096 19,920 15,518 18 – –
BMO Capital Markets 83 3,043 6,137 3 – –
BMO Capital Markets Corp. Bonds – – – – 194,452 –
BNP Paribas Prime Brokerage Inc. 2,059 5,649 – 3 – –
BNP Paribas Securities Corp./Fixed Income – – – – 5,983 –
BNP Paribas Securities Services 502 2,099 1,725 4 – –
BNY ConvergeEx Execution Solutions LLC 14,939 97,122 143,040 72 – –
Bony/Toronto Dominion Securities Inc. – – – – 14,958 –
Bradesco SA CTVM 66 1,403 – 1 – –
BTG Capital Corp. 21 301 – 1 – –
BTIG LLC 21 – 108 – – –
Cantor Fitzgerald & Co. 407 – 7,613 14 4,986 –
Cantor Fitzgerald Europe 85 – 974 1 – –
Celfin Capital SA Corredores de Bolsa 3,848 3,326 308 7 – –
China Intl. Capital Co. 21,298 17,563 1,575 10 – –
CIBC World Markets Corp. – – – – 14,958 –
CIBC World Markets Inc. 102 – 4,250 3 – –
Citibank Mexico 741 – 3,006 2 – –
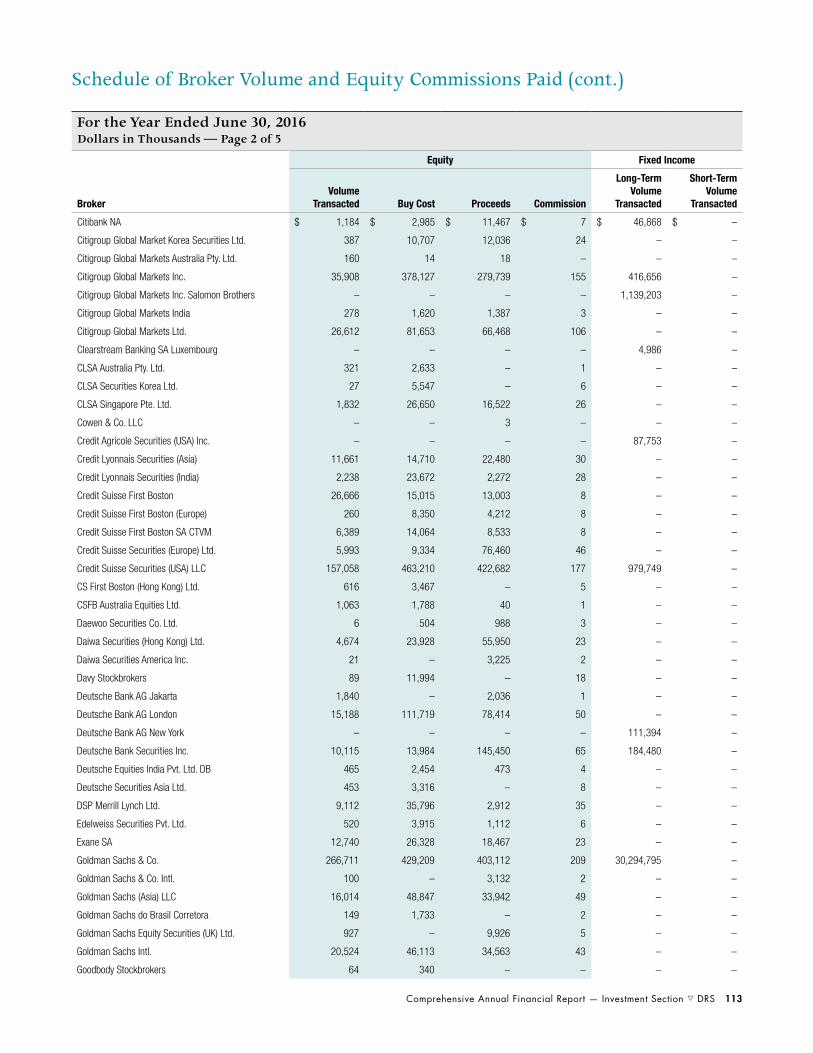
Comprehensive Annual Financial Report — Investment Section s DRS 113
Schedule of Broker Volume and Equity Commissions Paid (cont.)
For the Year Ended June 30, 2016Dollars in Thousands — Page 2 of 5
Equity Fixed Income
BrokerVolume
Transacted Buy Cost Proceeds Commission
Long-Term Volume
Transacted
Short-Term Volume
Transacted
Citibank NA $ 1,184 $ 2,985 $ 11,467 $ 7 $ 46,868 $ –
Citigroup Global Market Korea Securities Ltd. 387 10,707 12,036 24 – –
Citigroup Global Markets Australia Pty. Ltd. 160 14 18 – – –
Citigroup Global Markets Inc. 35,908 378,127 279,739 155 416,656 –
Citigroup Global Markets Inc. Salomon Brothers – – – – 1,139,203 –
Citigroup Global Markets India 278 1,620 1,387 3 – –
Citigroup Global Markets Ltd. 26,612 81,653 66,468 106 – –
Clearstream Banking SA Luxembourg – – – – 4,986 –
CLSA Australia Pty. Ltd. 321 2,633 – 1 – –
CLSA Securities Korea Ltd. 27 5,547 – 6 – –
CLSA Singapore Pte. Ltd. 1,832 26,650 16,522 26 – –
Cowen & Co. LLC – – 3 – – –
Credit Agricole Securities (USA) Inc. – – – – 87,753 –
Credit Lyonnais Securities (Asia) 11,661 14,710 22,480 30 – –
Credit Lyonnais Securities (India) 2,238 23,672 2,272 28 – –
Credit Suisse First Boston 26,666 15,015 13,003 8 – –
Credit Suisse First Boston (Europe) 260 8,350 4,212 8 – –
Credit Suisse First Boston SA CTVM 6,389 14,064 8,533 8 – –
Credit Suisse Securities (Europe) Ltd. 5,993 9,334 76,460 46 – –
Credit Suisse Securities (USA) LLC 157,058 463,210 422,682 177 979,749 –
CS First Boston (Hong Kong) Ltd. 616 3,467 – 5 – –
CSFB Australia Equities Ltd. 1,063 1,788 40 1 – –
Daewoo Securities Co. Ltd. 6 504 988 3 – –
Daiwa Securities (Hong Kong) Ltd. 4,674 23,928 55,950 23 – –
Daiwa Securities America Inc. 21 – 3,225 2 – –
Davy Stockbrokers 89 11,994 – 18 – –
Deutsche Bank AG Jakarta 1,840 – 2,036 1 – –
Deutsche Bank AG London 15,188 111,719 78,414 50 – –
Deutsche Bank AG New York – – – – 111,394 –
Deutsche Bank Securities Inc. 10,115 13,984 145,450 65 184,480 –
Deutsche Equities India Pvt. Ltd. DB 465 2,454 473 4 – –
Deutsche Securities Asia Ltd. 453 3,316 – 8 – –
DSP Merrill Lynch Ltd. 9,112 35,796 2,912 35 – –
Edelweiss Securities Pvt. Ltd. 520 3,915 1,112 6 – –
Exane SA 12,740 26,328 18,467 23 – –
Goldman Sachs & Co. 266,711 429,209 403,112 209 30,294,795 –
Goldman Sachs & Co. Intl. 100 – 3,132 2 – –
Goldman Sachs (Asia) LLC 16,014 48,847 33,942 49 – –
Goldman Sachs do Brasil Corretora 149 1,733 – 2 – –
Goldman Sachs Equity Securities (UK) Ltd. 927 – 9,926 5 – –
Goldman Sachs Intl. 20,524 46,113 34,563 43 – –
Goodbody Stockbrokers 64 340 – – – –

114 DRS s Investment Section — Comprehensive Annual Financial Report
Schedule of Broker Volume and Equity Commissions Paid (cont.)
For the Year Ended June 30, 2016Dollars in Thousands — Page 3 of 5
Equity Fixed Income
BrokerVolume
Transacted Buy Cost Proceeds Commission
Long-Term Volume
Transacted
Short-Term Volume
Transacted
Hanwha Securities Seoul $ 147 $ 11,253 $ 2,152 $ 8 $ – $ –
Hongkong & Shanghai Banking Corp. 6,409 9,323 641 5 – –
HSBC Bank Brasil SA Banco Multiplo 717 1,409 2,613 5 – –
HSBC Bank PLC 32,984 213,323 226,950 91 – –
HSBC Brokerage (USA) Inc. 123 522 – 1 – –
HSBC Securities (USA) Inc. 14,329 244,154 164,607 100 – –
HSBC Securities India Holdings 418 3,293 – 1 – –
ICICI Brokerage Services 1,722 10,160 – 10 – –
India Infoline Ltd. 333 2,633 – 3 – –
Instinet 1,708 34,564 18,466 3 – –
Instinet Australia Clearing Services Pty. Ltd. 2,151 9,196 7 3 – –
Instinet LLC 26,274 247,389 206,408 120 – –
Instinet Pacific Ltd. 223,838 131,352 115,808 112 – –
Instinet Singapore Services Pte. 163 1,159 – – – –
Instinet UK Ltd. 64,803 429,166 591,339 351 – –
Investment Technology Group Inc. 22,884 409,292 358,360 172 – –
Investment Technology Group Ltd. 39,515 341,729 365,663 229 – –
ITG Australia Ltd. 1,421 27,785 5,081 18 – –
ITG Canada 1,715 17,581 2,943 7 – –
ITG Inc. 256 694 6,342 4 – –
ITG Securities (HK) Ltd. 25,679 21,791 16,521 16 – –
Jefferies & Co. Inc. 1,203 3,652 19,281 23 56,092 –
Joh. Berenberg, Gossler & Co. 44 – 1,387 2 – –
JonesTrading Institutional Services LLC 41 – 1,586 2 – –
JPMorgan Chase Bank – – – – 1,274,499 –
JPMorgan Chase Bank NA London 373 1,911 – 1 – –
JPMorgan Chase Bank/Correspondent Lending – – – – 9,972 –
JPMorgan Chase Bank/HSBC SI – – – – 369,957 –
JPMorgan Chase Bank/RBS Securities Inc. – – – – 807,723 –
JPMorgan Chase/JPMorgan Intl. – – – – 83,764 –
JPMorgan Clearing Corp. 20,945 291,796 374,595 215 – –
JPMorgan Securities (Asia Pacific) Ltd. 107,331 61,404 29,982 37 – –
JPMorgan Securities (Far East) Ltd. Seoul 174 21,837 3,107 17 – –
JPMorgan Securities (Taiwan) Ltd. 1,749 2,295 – 3 – –
JPMorgan Securities Australia Ltd. 643 4,006 – 1 – –
JPMorgan Securities Inc. 26,331 55,827 19,996 62 – –
JPMorgan Securities Ltd. 66 2,912 53 3 314,114 –
JPMorgan Securities Ltd./Equities Lending 67 567 17 – – –
JPMorgan Securities PLC 36,179 259,681 158,515 146 – –
JPMorgan Securities Singapore 5,989 3,181 4,759 7 – –
KCG Americas LLC 1,149 – 9,950 14 – –
Kim Eng Securities (HK) Ltd. 427 1,291 – 3 – –

Comprehensive Annual Financial Report — Investment Section s DRS 115
Schedule of Broker Volume and Equity Commissions Paid (cont.)
For the Year Ended June 30, 2016Dollars in Thousands — Page 4 of 5
Equity Fixed Income
BrokerVolume
Transacted Buy Cost Proceeds Commission
Long-Term Volume
Transacted
Short-Term Volume
Transacted
Kim Eng Securities Pte. Ltd. Singapore $ 13 $ 18 $ – $ – $ – $ –
Knight Equity Markets LP 2 – 20 – – –
Knight Securities Intl. 1,520 14,604 – 4 – –
Leerink, Swann & Co. 22 – 349 1 – –
Liquidnet Canada Inc. 15 – 675 – – –
Liquidnet Inc. 2,254 122,329 71,036 56 – –
Loop Capital Markets 5,904 115,876 102,664 53 – –
Macquarie Bank Ltd. 8,122 84,316 53,521 34 – –
Macquarie Capital (Europe) Ltd. 30 453 – – – –
Macquarie Securities (India) Pvt. Ltd. 985 9,127 1,993 15 – –
Macquarie Securities (NZ) Ltd. 171 582 – 1 – –
Macquarie Securities (Singapore) 145 696 – – – –
Macquarie Securities (USA) Inc. 399 – 27,072 14 – –
Macquarie Securities Ltd. (Seoul) 2 – 1,657 2 – –
MainFirst Bank DE 62 14,397 – 22 – –
Merrill Lynch Canada Inc. 1,442 23,301 21,061 – – –
Merrill Lynch Intl. 224,472 278,170 266,493 248 – –
Merrill Lynch, Pierce, Fenner & Smith Inc. 41,394 332,848 412,914 244 – –
Mitsubishi UFJ Securities (USA) Inc. – – – – 1,994 –
Mizuho Securities USA Inc. 181 9 5,607 7 – –
Mizuho Securities USA/Fixed Income – – – – 4,986 –
Morgan Stanley & Co. Inc. 78,322 95,196 50,736 88 923,918 –
Morgan Stanley & Co. Intl. 6,960 119,664 57,252 44 – –
Morgan Stanley DW Inc. 676 – 10,341 26 – –
Morgan Stanley India Co. Pvt. Ltd. 19 73 760 1 – –
National Financial Services Corp. 289 493 10,937 11 54,845 –
Natixis Securities 35 5,043 – 8 – –
Nomura Securities/Fixed Income – – – – 20,941 –
Nordea Bank Finland PLC 868 – 8,926 11 – –
Numis Securities Inc. 238 1,957 3,505 6 – –
Panmure Gordon & Co. Ltd. 512 11,199 – 17 – –
Parel SA 965 3,104 9,069 18 – –
Pavilion Global Markets Ltd. 14,009 263,692 165,983 103 – –
Penserra Securities LLC 18,747 353,219 310,470 164 – –
Pershing LLC 768 25,326 3,811 6 1,994 –
Pershing Securities Ltd. 451 377 25 – – –
Piper, Jaffray & Hopwood 30 – 2,718 4 – –
Raymond James & Associates Inc. 32 – 3,287 4 – –
RBC Capital Markets LLC 228 14,897 2,600 5 139,532 –
RBC Dominion Securities Inc. 376 – 14,618 18 – –
Redburn Partners LLP 287 6,370 – 10 – –
Sanford C. Bernstein & Co. LLC 55,678 579,161 524,770 302 – –

116 DRS s Investment Section — Comprehensive Annual Financial Report
Schedule of Broker Volume and Equity Commissions Paid (cont.)
For the Year Ended June 30, 2016Dollars in Thousands — Page 5 of 5
Equity Fixed Income
BrokerVolume
Transacted Buy Cost Proceeds Commission
Long-Term Volume
Transacted
Short-Term Volume
Transacted
Sanford C. Bernstein Ltd. $ 71,216 $ 284,569 $ 211,762 $ 189 $ – $ –
Scotia Capital (USA) Inc. 6,899 2,322 3,673 3 24,930 –
Scotia Capital Markets 277 7,423 – 5 – –
SG Americas Securities LLC 20,847 432,769 315,536 159 – –
SG Asia Securities (India) Pvt. Ltd. 232 3,664 – 4 – –
SG Securities HK 24,132 54,947 59,258 41 – –
Sinopac Securities Corp. 585 1,402 – 1 – –
Skandinaviska Enskilda Banken 212 – 6,907 10 – –
Skandinaviska Enskilda Banken London 108 – 5,078 8 – –
Societe Generale London Branch 8,437 83,073 72,270 63 – –
Standard Bank London Ltd. 99 1,326 – 2 – –
Standard CT AIG – – – – 12,963 –
State Street Bank & Trust – – – – – 22,069,652
State Street Global Markets LLC 116 917 27 2 – –
Stifel, Nicolaus & Co. Inc. 1,370 17,872 – – – –
Susquehanna Financial Group LLP 1 85 – – – –
Svenska Handelsbanken 13 – 287 – – –
TD Securities (USA) LLC 153 11,105 7,494 6 – –
TD Waterhouse Canada 6 – 103 – – –
Tera Menkul Degerler AS 4,475 7,593 2,232 10 – –
UBS AG 7,966 101,547 47,991 41 – –
UBS Financial Services Inc. 25 521 – – – –
UBS Ltd. 28,050 204,479 213,562 205 – –
UBS Securities Asia Ltd. 35,186 49,360 45,250 35 – –
UBS Securities Canada Inc. 452 6,022 3,851 2 – –
UBS Securities LLC 16,998 369,023 362,291 156 169,522 –
UBS Securities Singapore Pte. 7,499 – 1,985 1 – –
UBS Warburg Australia Equities 808 2,444 2,540 1 – –
Warburg Dillon Read Securities Co. 4,990 – 3,978 2 – –
Weeden & Co. 17,273 296,469 330,240 155 – –
Wells Fargo Securities LLC 79 1,489 – – 107,344 –
William Blair & Co. LLC 75 – 6,025 5 – –
Woori Investment & Securities 57 5,455 3,918 6 – –
XP Investimentos CCTVM SA 223 1,450 – 1 – –
Total $ 4,217,275 $ 9,959,576 $ 9,029,843 $ 5,888 $ 40,234,719 $ 22,069,652

Comprehensive Annual Financial Report — Investment Section s DRS 117
Summary of Investments Owned — Pension Trust Funds
Schedule of Investments Owned as of June 30, 2016Dollars in Thousands — Page 1 of 7
Description Rate Maturity Market Value% of Total
Market Value
Asset-Backed Securities
Citibank Credit Card Issuance 1.02 2/22/2019 $ 49,911 0.06%
Total Asset-Backed Securities 49,911 0.06%
Residential Mortgage-Backed Securities
FNMA Pool AL5255 2.50 7/1/2028 72,890 0.08%
FNMA Pool AS6932 3.00 4/1/2046 50,924 0.06%
FNMA Pool AS6815 3.00 3/1/2046 50,365 0.06%
FNMA Pool AB8447 2.50 2/1/2028 45,675 0.05%
FNMA Pool AW8713 2.50 8/1/2029 43,630 0.05%
FED HM LN PC Pool G18540 2.50 2/1/2030 43,231 0.05%
FED HM LN PC Pool G18529 2.50 10/1/2029 40,170 0.04%
FNMA Pool AL5250 2.50 10/1/2028 38,713 0.04%
FED HM LN PC Pool E03033 3.00 2/1/2027 37,028 0.04%
FNMA Pool AL6736 2.00 4/1/2025 35,964 0.04%
Other – – 425,102 0.47%
Total Residential Mortgage-Backed Securities 883,692 0.98%
Commercial Mortgage-Backed Securities
Fannie Mae 2.50 7/25/2028 30,473 0.03%
Citigroup Commercial Mortgage 5.43 10/15/2049 21,037 0.02%
GS Mortgage Securities Trust 3.52 6/10/2047 16,076 0.02%
Freddie Mac 3.00 10/15/2040 15,363 0.02%
Citigroup Commercial Mortgage 2.79 3/10/2047 13,396 0.01%
Morgan Stanley BAML Trust 3.33 5/15/2049 12,224 0.01%
UBS Barclays Commercial Mortgage 3.09 8/10/2049 10,573 0.01%
Wells Fargo Commercial Mortgage 3.17 2/15/2048 10,459 0.01%
Master Asset Securitization Trust 5.25 9/25/2033 5,135 0.01%
GS Mortgage Securities Trust 3.68 8/10/2043 2,779 0.00%
Other – – 4,407 0.00%
Total Commercial Mortgage-Backed Securities 141,922 0.14%
Corporate Bonds — Domestic Dollar Denominated
Verizon Communications 5.15 9/15/2023 75,453 0.08%
Bank of America NA 1.13 11/14/2016 69,845 0.08%
Reliance Holdings USA 4.50 10/19/2020 59,368 0.07%
Anheuser Busch Inbev Worldwide 6.88 11/15/2019 58,450 0.06%
JPMorgan Chase & Co. 1.70 3/1/2018 50,099 0.06%
Bank of America Corp. 3.88 8/1/2025 47,628 0.05%
Bayer U.S. Finance LLC 3.38 10/8/2024 41,463 0.05%
Citigroup Inc. 4.00 8/5/2024 41,156 0.05%
HSBC USA Inc. 1.70 3/5/2018 39,794 0.04%
Wisconsin Public Service 4.75 11/1/2044 36,451 0.04%
Other – – 1,308,801 1.44%
Total Corporate Bonds — Domestic Dollar Denominated 1,828,508 2.02%
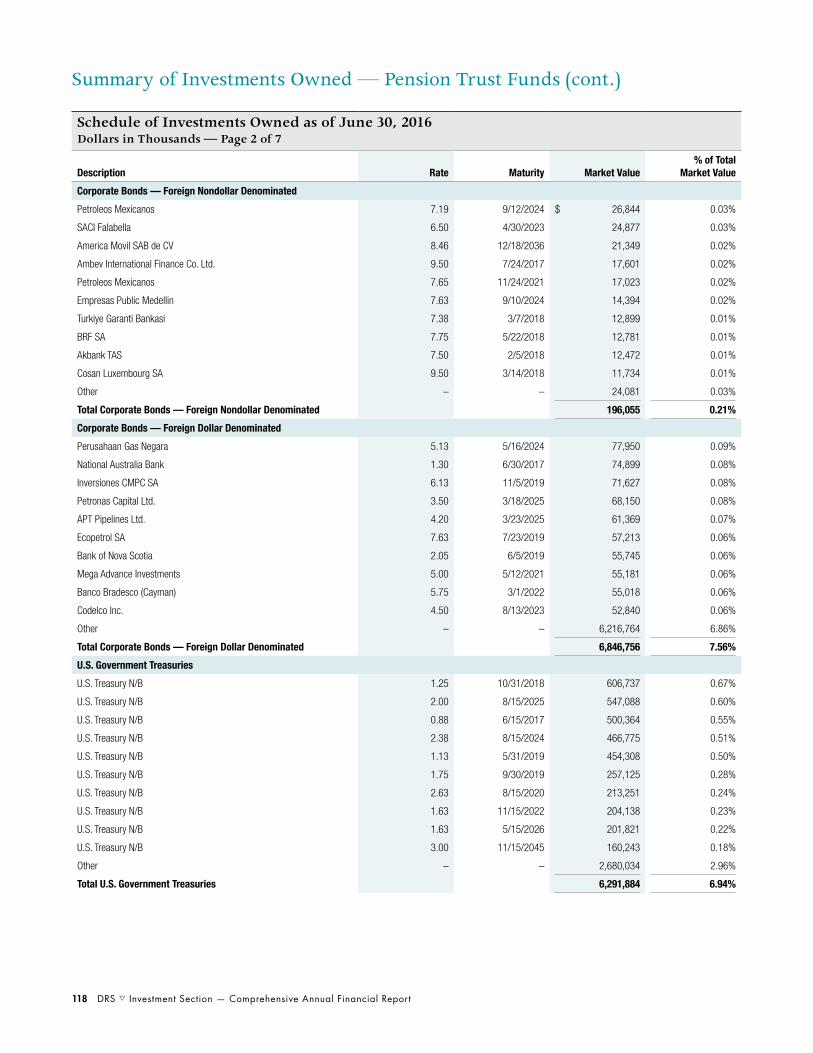
118 DRS s Investment Section — Comprehensive Annual Financial Report
Summary of Investments Owned — Pension Trust Funds (cont.)
Schedule of Investments Owned as of June 30, 2016Dollars in Thousands — Page 2 of 7
Description Rate Maturity Market Value% of Total
Market Value
Corporate Bonds — Foreign Nondollar Denominated
Petroleos Mexicanos 7.19 9/12/2024 $ 26,844 0.03%
SACI Falabella 6.50 4/30/2023 24,877 0.03%
America Movil SAB de CV 8.46 12/18/2036 21,349 0.02%
Ambev International Finance Co. Ltd. 9.50 7/24/2017 17,601 0.02%
Petroleos Mexicanos 7.65 11/24/2021 17,023 0.02%
Empresas Public Medellin 7.63 9/10/2024 14,394 0.02%
Turkiye Garanti Bankasi 7.38 3/7/2018 12,899 0.01%
BRF SA 7.75 5/22/2018 12,781 0.01%
Akbank TAS 7.50 2/5/2018 12,472 0.01%
Cosan Luxembourg SA 9.50 3/14/2018 11,734 0.01%
Other – – 24,081 0.03%
Total Corporate Bonds — Foreign Nondollar Denominated 196,055 0.21%
Corporate Bonds — Foreign Dollar Denominated
Perusahaan Gas Negara 5.13 5/16/2024 77,950 0.09%
National Australia Bank 1.30 6/30/2017 74,899 0.08%
Inversiones CMPC SA 6.13 11/5/2019 71,627 0.08%
Petronas Capital Ltd. 3.50 3/18/2025 68,150 0.08%
APT Pipelines Ltd. 4.20 3/23/2025 61,369 0.07%
Ecopetrol SA 7.63 7/23/2019 57,213 0.06%
Bank of Nova Scotia 2.05 6/5/2019 55,745 0.06%
Mega Advance Investments 5.00 5/12/2021 55,181 0.06%
Banco Bradesco (Cayman) 5.75 3/1/2022 55,018 0.06%
Codelco Inc. 4.50 8/13/2023 52,840 0.06%
Other – – 6,216,764 6.86%
Total Corporate Bonds — Foreign Dollar Denominated 6,846,756 7.56%
U.S. Government Treasuries
U.S. Treasury N/B 1.25 10/31/2018 606,737 0.67%
U.S. Treasury N/B 2.00 8/15/2025 547,088 0.60%
U.S. Treasury N/B 0.88 6/15/2017 500,364 0.55%
U.S. Treasury N/B 2.38 8/15/2024 466,775 0.51%
U.S. Treasury N/B 1.13 5/31/2019 454,308 0.50%
U.S. Treasury N/B 1.75 9/30/2019 257,125 0.28%
U.S. Treasury N/B 2.63 8/15/2020 213,251 0.24%
U.S. Treasury N/B 1.63 11/15/2022 204,138 0.23%
U.S. Treasury N/B 1.63 5/15/2026 201,821 0.22%
U.S. Treasury N/B 3.00 11/15/2045 160,243 0.18%
Other – – 2,680,034 2.96%
Total U.S. Government Treasuries 6,291,884 6.94%

Comprehensive Annual Financial Report — Investment Section s DRS 119
Summary of Investments Owned — Pension Trust Funds (cont.)
Schedule of Investments Owned as of June 30, 2016Dollars in Thousands — Page 3 of 7
Description Rate Maturity Market Value% of Total
Market Value
Foreign Government and Agencies — Dollar Denominated
Republic of Indonesia 5.38 10/17/2023 $ 56,107 0.06%
Province of Manitoba 2.13 6/22/2026 39,997 0.04%
Republic of Peru 4.13 8/25/2027 32,982 0.04%
Export Import Bank China 3.63 7/31/2024 31,913 0.04%
City of Buenos Aires 7.50 6/1/2027 31,187 0.03%
Republic of Colombia 5.00 6/15/2045 31,147 0.03%
Socialist Republic of Vietnam 4.80 11/19/2024 30,784 0.03%
Province of Ontario 2.00 1/30/2019 30,647 0.03%
Nacional Financiera SNC 3.38 11/5/2020 28,452 0.03%
State of Qatar 5.25 1/20/2020 27,656 0.03%
Other – – 311,501 0.34%
Total Foreign Government and Agencies — Dollar Denominated 652,373 0.70%
Foreign Government and Agencies — Nondollar Denominated
New S. Wales Treasury Corp. 5.50 3/1/2017 76,138 0.08%
Malaysian Government 4.01 9/15/2017 52,644 0.06%
Thailand Government Bond 3.25 6/16/2017 43,303 0.05%
Queensland Treasury Corp. 4.25 7/21/2023 41,958 0.05%
Queensland Treasury Corp. 6.00 9/14/2017 39,009 0.04%
Republica Orient Uruguay 4.38 12/15/2028 38,843 0.04%
Republic of Colombia 4.38 3/21/2023 36,542 0.04%
Republic of Chile 5.50 8/5/2020 35,971 0.04%
Federal Republic of Brazil 10.25 1/10/2028 32,184 0.04%
Nota do Tesouro Nacional 10.00 1/1/2023 28,483 0.03%
Other – – 239,741 0.26%
Total Foreign Government and Agencies — Nondollar Denominated
664,816 0.73%
Supranational — Nondollar Denominated
International Bank for Reconstruction & Development 5.75 10/21/2019 41,423 0.05%
International American Development Bank 6.50 8/20/2019 25,214 0.03%
International Finance Corp. 8.25 6/10/2021 23,618 0.03%
International Bank for Reconstruction & Development 13.63 5/9/2017 23,374 0.03%
International Finance Corp. 8.00 10/20/2019 22,809 0.03%
International Finance Corp. 7.75 12/3/2016 20,017 0.02%
International Bank for Reconstruction & Development 6.00 2/15/2017 19,011 0.02%
Asian Development Bank 2.85 10/21/2020 13,131 0.01%
Total Supranational — Nondollar Denominated 188,597 0.22%
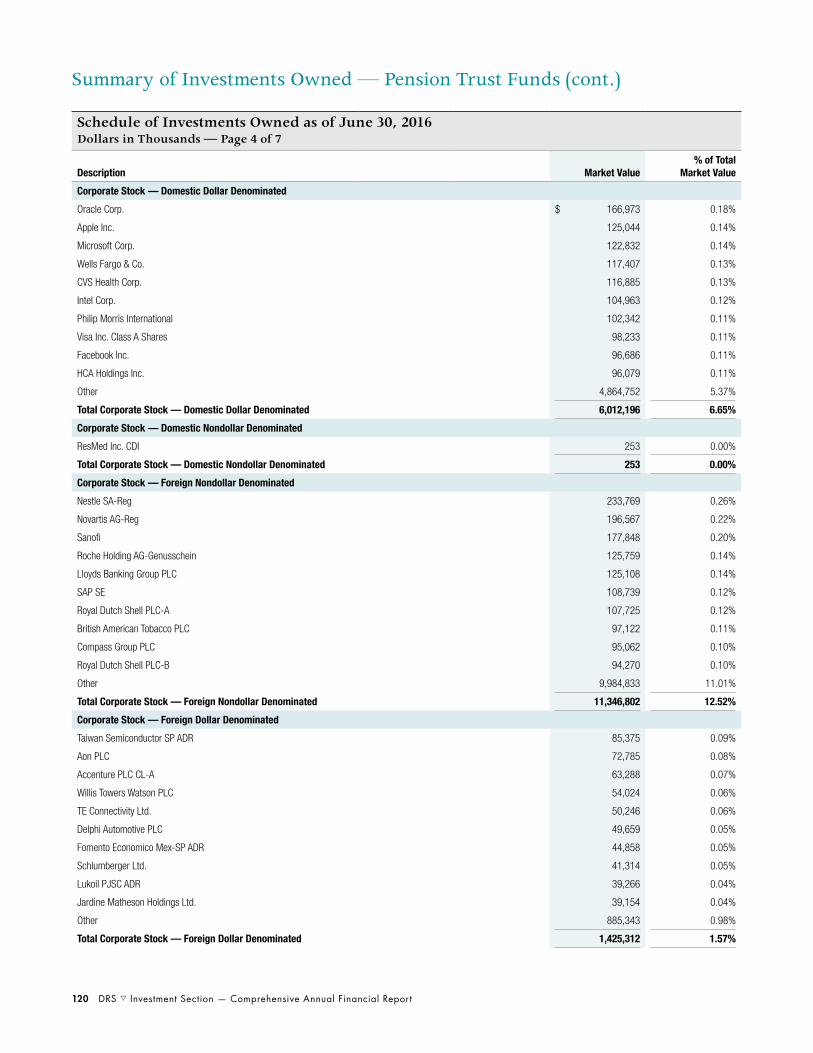
120 DRS s Investment Section — Comprehensive Annual Financial Report
Summary of Investments Owned — Pension Trust Funds (cont.)
Schedule of Investments Owned as of June 30, 2016Dollars in Thousands — Page 4 of 7
Description Market Value% of Total
Market Value
Corporate Stock — Domestic Dollar Denominated
Oracle Corp. $ 166,973 0.18%
Apple Inc. 125,044 0.14%
Microsoft Corp. 122,832 0.14%
Wells Fargo & Co. 117,407 0.13%
CVS Health Corp. 116,885 0.13%
Intel Corp. 104,963 0.12%
Philip Morris International 102,342 0.11%
Visa Inc. Class A Shares 98,233 0.11%
Facebook Inc. 96,686 0.11%
HCA Holdings Inc. 96,079 0.11%
Other 4,864,752 5.37%
Total Corporate Stock — Domestic Dollar Denominated 6,012,196 6.65%
Corporate Stock — Domestic Nondollar Denominated
ResMed Inc. CDI 253 0.00%
Total Corporate Stock — Domestic Nondollar Denominated 253 0.00%
Corporate Stock — Foreign Nondollar Denominated
Nestle SA-Reg 233,769 0.26%
Novartis AG-Reg 196,567 0.22%
Sanofi 177,848 0.20%
Roche Holding AG-Genusschein 125,759 0.14%
Lloyds Banking Group PLC 125,108 0.14%
SAP SE 108,739 0.12%
Royal Dutch Shell PLC-A 107,725 0.12%
British American Tobacco PLC 97,122 0.11%
Compass Group PLC 95,062 0.10%
Royal Dutch Shell PLC-B 94,270 0.10%
Other 9,984,833 11.01%
Total Corporate Stock — Foreign Nondollar Denominated 11,346,802 12.52%
Corporate Stock — Foreign Dollar Denominated
Taiwan Semiconductor SP ADR 85,375 0.09%
Aon PLC 72,785 0.08%
Accenture PLC CL-A 63,288 0.07%
Willis Towers Watson PLC 54,024 0.06%
TE Connectivity Ltd. 50,246 0.06%
Delphi Automotive PLC 49,659 0.05%
Fomento Economico Mex-SP ADR 44,858 0.05%
Schlumberger Ltd. 41,314 0.05%
Lukoil PJSC ADR 39,266 0.04%
Jardine Matheson Holdings Ltd. 39,154 0.04%
Other 885,343 0.98%
Total Corporate Stock — Foreign Dollar Denominated 1,425,312 1.57%

Comprehensive Annual Financial Report — Investment Section s DRS 121
Summary of Investments Owned — Pension Trust Funds (cont.)
Schedule of Investments Owned as of June 30, 2016Dollars in Thousands — Page 5 of 7
Description Market Value% of Total
Market Value
Commingled Index Funds — Domestic
BTC U.S. IMI Fund $ 10,069,766 11.11%
Total Commingled Index Funds — Domestic 10,069,766 11.11%
Commingled Index Funds — Foreign
Lazard Freres Capital Management 394,124 0.44%
SPDR S&P 500 ETF Trust 1,431 0.00%
P2P Global Investments PLC 382 0.00%
Total Commingled Index Funds — Foreign 395,937 0.44%
Cash and Money Market
State Street Bank & Trust 1,826,954 2.01%
U.S. Dollar 41,514 0.05%
BlackRock Liquidity Funds 36,491 0.04%
Total Cash and Money Market 1,904,959 2.10%
Private Equity
KKR 2006 Fund LP 896,465 0.99%
Warburg Pincus Private Equity XI LP 743,212 0.82%
TPG Partners VI LP 478,993 0.53%
KKR European Fund III LP — USD 468,965 0.52%
Hellman & Friedman Capital Partners VII LP 406,366 0.45%
Total Pathway 400,244 0.44%
Advent International GPE VII-B LP 397,993 0.44%
Fisher Lynch Co-Investment Partnership II LP 391,616 0.43%
KKR North America Fund XI LP 388,040 0.43%
Oaktree Opportunities Fund IX LP 382,916 0.42%
Other 12,442,486 13.72%
Total Private Equity 17,397,296 19.19%
Real Estate
Evergreen Real Estate Partners LP 3,536,503 3.90%
Principal Enterprise Capital Holdings 2,927,708 3.23%
Calzada Capital Partners LLC 2,745,545 3.03%
Fillmore Strategic Investors 1,053,838 1.16%
Union Square LP 564,688 0.62%
Aevitas Property Partners LLC 474,701 0.52%
PacTrust Realty Association 322,311 0.36%
Emerging Markets Fund of Funds 260,404 0.29%
Morgan Stanley Special Situations Fund III LP 193,818 0.21%
Washington Real Estate Holdings 158,359 0.17%
Other 972,361 1.07%
Total Real Estate 13,210,236 14.56%

122 DRS s Investment Section — Comprehensive Annual Financial Report
Summary of Investments Owned — Pension Trust Funds (cont.)
Schedule of Investments Owned as of June 30, 2016Dollars in Thousands — Page 6 of 7
Description Market Value% of Total
Market Value
Tangible Asset
Alinda Infrastructure Fund II LP $ 451,107 0.50%
Teays River Investments LLC 314,159 0.35%
Global Infrastructure Partners II LP 188,102 0.21%
Stonepeak Infrastructure Fund LP 187,874 0.21%
Twin Creeks Timber 179,767 0.20%
Alinda Infrastructure Fund I LP 134,812 0.15%
Orion Mine Finance Fund I 125,044 0.14%
Stonepeak Infrastructure Fund II LP 119,827 0.13%
Lime Rock Resources III-A LP 99,846 0.11%
EnerVest Fund XIV LP 91,970 0.10%
Other 628,581 0.69%
Total Tangible Assets 2,521,089 2.79%
Foreign Currency
Japanese Yen 25,175 0.03%
Euro 20,795 0.02%
Pound Sterling 9,958 0.01%
Canadian Dollar 9,791 0.01%
Australian Dollar 5,798 0.01%
South Korean Won 4,460 0.00%
New Taiwan Dollar 3,134 0.00%
Hong Kong Dollar 2,974 0.00%
Swedish Krona 2,032 0.00%
South African Rand 1,552 0.00%
Other 8,696 0.01%
Total Foreign Currency 94,365 0.09%
Return Swap Contracts
Total Return Swap Contracts 22 0.00%
Total Return Swap Contracts 22 0.00%
In Plan 3 Defined Contribution and Deferred Compensation Program: Retirement Strategy Funds (Target Date Funds)
Retirement Strategy 2020 834,788 0.92%
Retirement Strategy 2025 750,781 0.83%
Retirement Strategy 2015 509,769 0.56%
Retirement Strategy 2030 503,426 0.56%
Retirement Strategy 2035 343,179 0.38%
Retirement Strategy 2040 186,877 0.21%
Retirement Strategy 2010 168,832 0.19%
Retirement Strategy 2045 101,038 0.11%
Retirement Strategy 2005 56,616 0.06%
Other 137,748 0.15%
Total Retirement Strategy Funds (Target Date Funds) 3,593,054 3.97%

Comprehensive Annual Financial Report — Investment Section s DRS 123
Summary of Investments Owned — Pension Trust Funds (cont.)
Schedule of Investments Owned as of June 30, 2016Dollars in Thousands — Page 7 of 7
Description Market Value% of Total
Market Value
Equity Index Funds
U.S. Large Cap Equity Index $ 1,222,754 1.35%
U.S. Small Cap Value Equity Index 375,531 0.41%
Global Equity Index 246,092 0.27%
Emerging Market Index 104,854 0.12%
Total Equity Index Funds 1,949,231 2.15%
Guaranteed Investment Contracts
Savings Pool 871,704 0.97%
Total Guaranteed Investment Contracts 871,704 0.97%
Bond Funds
Washington State Bond Fund 673,910 0.74%
U.S. Socially Responsible Fund 252,675 0.28%
Total Bond Funds 926,585 1.02%
Short-Term Investment Funds (in Defined Contribution Plans)
Short-Term Contribution Interest Fund 171 0.00%
WSIB Short-Term Investment Fund 501,622 0.55%
Total Short-Term Investment Funds (in Defined Contribution Plans) 501,793 0.55%
Securities Under Lending Agreements
Collateral Held Under Securities Lending Agreements 683,169 0.76%
Total Securities Under Lending Agreements 683,169 0.76%
Total Investments $ 90,648,283 100.00%

124 DRS s Investment Section — Comprehensive Annual Financial Report
This page is intentionally blank.

2016 Highlights
Online transactions for customers
During the past year, DRS established new ways for customers to process transactions through their secure online accounts.
One new tool allows members to update their beneficiary designations (previously a labor-intensive, paper-based process); the other allows retirees to conveniently set up and update direct (electronic) deposit of their benefit payments to their bank or credit union.
Actuarial Section

Actuarial Section

Comprehensive Annual Financial Report — Actuarial Section s DRS 127
State Actuary’s Certification Letter
“Supporting financial security for generations.”
PO Box 40914 | Olympia, Washington 98504-0914 | [email protected] | osa.leg.wa.govPhone: 360.786.6140 | Fax: 360.586.8135 | TDD: 711
October 5, 2016
Ms. Tracy GuerinDirectorDepartment of Retirement SystemsPO Box 48380Olympia, Washington 98504-8380
SUBJECT: ACTUARIAL CERTIFICATION LETTER
Dear Ms. Guerin:
At your request, we prepared the following information for inclusion in the 2016Comprehensive Annual Financial Report (CAFR):
1. Introductory Section.
Financial Information – Funding Paragraph.
2. Financial Section.
Components for the Schedule of Changes in Net Pension Liability(NPL):
Service Cost; Interest; Changes of Benefit Terms; Differencesbetween Expected and Actual Experience; Changes inAssumptions.
Total Pension Liability (TPL) component for the Schedule of NPL.
Actuarially Determined Contributions and Contractually Required Contributions components for the Schedule of Contributions.
Note 2B: Actuarial components of the Governmental Accounting andStandards Board (GASB) 67 requirements.
Including the TPL component of the Sensitivity of the NPL to Changes in the Discount Rate.
GASB 67 Notes for Required Supplementary Information:
Methods and Assumptions.

128 DRS s Actuarial Section — Comprehensive Annual Financial Report
State Actuary’s Certification Letter (cont.)
Ms. Tracy GuerinPage 2 of 4
Office of the State Actuary October 5, 2016
3. Actuarial Section.
Funded Status and Funding Progress (one year).
Schedules of Funding Progress.
Additional Information for the Defined Benefit Plans.
Schedules of Active Member Valuation Data.
Schedules of Retirees and Beneficiaries Added to and Removed from Rolls.
Summary of Actuarial Assumptions and Methods.
Solvency Tests.
Analyses of Selected Experience.
4. Statistical Section.
Distribution of Membership.
Schedule of Benefit Recipients by Type of Benefit.
Schedule of Average Benefit Payments to Service Retirees in Year ofRetirement.
The primary purpose of this information is to satisfy the actuarial reporting requirements ofGASB and the Government Finance Officers Association (GFOA). Readers should not use thisinformation for other purposes. Please replace this information with more recent informationfrom next year’s CAFR when available.
We also prepare annual actuarial valuations for determining contribution requirements andfunding progress (a “funding” valuation) consistent with the state’s funding policy. Thefunding valuations serve a different purpose from accounting valuations or measurements,and the results of the funding valuations may not match these accounting disclosures.
We performed the most recent actuarial valuation in 2016 with a valuation date of June 30,2015. The TPL was calculated as of the valuation date and projected to the measurement date of June 30, 2016. Plan liabilities were rolled forward from June 30, 2015, to June 30, 2016, reflecting each plan’s service cost (using the Entry Age cost method), assumed interest, and actual benefit payments.
GASB 67 requires an “asset sufficiency test” to determine whether (or how long) we can usethe long-term expected rate of return on assets to measure the present value of accrued plan liabilities for accounting purposes. For this test, we made the following assumptions to determine projected employee and employer contributions:

Comprehensive Annual Financial Report — Actuarial Section s DRS 129
State Actuary’s Certification Letter (cont.)
Ms. Tracy GuerinPage 3 of 4
Office of the State Actuary October 5, 2016
A 7.7 percent long-term discount rate to determine funding liabilities consistent with current law for calculating future contribution rate requirements for all plans, except the Law Enforcement Officers’ and Fire Fighters’ Plan 2 which uses a 7.5 percent assumption.
o The Judicial Retirement System (JRS) and Judges are funded on a “pay-as-you-go” basis.
We reflected actual asset returns through June 30, 2016, and assumed a 7.5 percent rate of investment return on invested assets thereafter,consistent with the long-term expected rate of return (for all plans except JRS and Judges). Please see the 2015 Report on Financial Condition and Economic Experience Study on the Office of the State Actuary’s website for additional background on how we selected this assumption.
With the exception of determining future Plan 1 Unfunded ActuarialAccrued Liability (UAAL) contributions from employers of the Public Employees’ Retirement System (PERS), the Teachers’ Retirement System (TRS), the School Employees’ Retirement System (SERS), and the Public Safety Employees’ Retirement System (PSERS), we assumed no new entrants for purposes of the asset sufficiency test.
Consistent with current law, employers of PERS, TRS, SERS, andPSERS would continue to pay the minimum Plan 1 UAAL contribution rate until the applicable Plan 1 is fully funded.
The Legislature would continue the current contribution rate phase-in for the new mortality assumptions until the beginning of the 2019-21 Biennium.
For the asset sufficiency test, we also reviewed the resulting contribution projections forreasonability and found them to be reasonable for purposes of performing this test.
Otherwise, we used the same data, assumptions, and methods for the asset sufficiency test aswe disclosed in our 2015 Actuarial Valuation Report.
As of this measurement, all plans—with the exception of JRS and Judges (“pay-as-you-go”plans)—are expected to retain sufficient assets to pay all future benefits for current membersusing current assumptions, current plan provisions, and assuming the continuation of currentstate funding policy in Chapter 41.45 RCW (the actuarial funding chapter).
We relied on participant data provided by your department to perform the latest actuarialvaluation. The Washington State Investment Board, your department, and the Office of theState Treasurer provided financial and asset information. We reviewed the data and theassets for reasonableness as appropriate based on the purpose of the valuation. We relied onall the information provided as complete and accurate. In our opinion, this information isadequate and substantially complete for purposes of this valuation. Please see the Actuarial

130 DRS s Actuarial Section — Comprehensive Annual Financial Report
State Actuary’s Certification Letter (cont.)
Ms. Tracy GuerinPage 4 of 4
Office of the State Actuary October 5, 2016
Certification Letter in the 2015 Actuarial Valuation Report for additional information on the certification of the latest actuarial valuation results.
We prepared the required accounting disclosures in accordance with GASB Statement 67.Please see the Department of Retirement Systems’ 2016 Participating Employer Financial Information Report for our actuarial certification of disclosures that are unique to GASB 68.We relied on the same participant data, assumptions, and methods for the GASB 67 disclosures as we did for the GASB 68 disclosures.
At your request, we also prepared accounting disclosures under the prior GASB Statements25, 27, and 50. We prepared all items in accordance with generally accepted actuarialprinciples and actuarial standards of practice as of the date of this letter.
We certify, to the best of our knowledge, that the actuarial submissions in the 2016 CAFRmeet the GFOA standards for actuarial reporting.
The undersigned, with actuarial credentials, meet the Qualification Standards of the AmericanAcademy of Actuaries to render the actuarial opinions contained herein. We are available toprovide extra advice and explanations as needed.
Sincerely,
Matthew M. Smith, FCA, EA, MAAA Luke Masselink, ASA, EA, MAAAState Actuary Actuary
N:\MS\2016\2016.CAFR.Certification.Letter.docx

Comprehensive Annual Financial Report — Actuarial Section s DRS 131
Summary of Plan Provisions
A narrative summary of retirement plans DRS manages is provided in Section B of Note 2 in the Financial Section of this CAFR. A tabular summary of key plan provisions as of June 30, 2016, is provided below.
As of June 30, 2016 — Page 1 of 2Plan Membership Eligibility Vesting Retirement Eligibility Benefit
PERS Plan 1 State employees, elected officials, employees of local governments, legislative committee employees, community/technical college employees, classified employees of school districts, district/municipal court judges, and some employees of the Supreme Court, Court of Appeals and superior courts (by 9/30/1977)
After five years of eligible service
After 30 years of service, at age 60 with five years of service or at age 55 with 25 years of service
2% of Average Final Compensation (AFC) per year of service, capped at 60% of AFC
Judicial Benefit Multiplier (JBM) participants: 3.5% of AFC per year of service, capped at 75% of AFC
PERS Plan 2 New members who met the same employer membership eligibility requirements as PERS Plan 1 and were hired on or after 10/1/77, new state agency and higher education members hired on or after 3/1/2002 who chose Plan 2, and new members for all other employers hired on or after 9/1/2002 who chose Plan 2
PERS Plan 2 excludes classified employees of school districts.
After five years of eligible service
At age 65 with five years of service or an actuarially reduced benefit at age 55 with 20 years of service
2% of AFC per year of service
JBM participants: 3.5% of AFC per year of service, capped at 75% of AFC
PERS Plan 31 New members who met the same employer membership eligibility requirements as PERS Plan 2, new state agency and higher education members hired on or after 3/1/2002 who chose Plan 3, new members for all other employers hired on or after 9/1/2002 who chose Plan 3, and PERS Plan 2 members hired on or after 10/1/1977 who met transfer eligibility requirements and made a permanent choice to transfer to PERS Plan 3
Varies At age 65 if vested or an actuarially reduced benefit at age 55 with 10 years of service (defined benefit portion)
1% of AFC per year of service (defined benefit portion)
JBM participants: 1.6% of AFC per year of service, capped at 37.5% of AFC
The defined contribution portion depends on the member’s contribution level and on investment performance.
SERS Plan 2 All classified employees of school districts or educational service districts (by 8/31/2000 and employees on or after 7/1/2007 with no past PERS Plan 2 service who chose Plan 2)
After five years of eligible service
After age 65 with five years of service or an actuarially reduced benefit at age 55 with 20 years of service
2% of AFC per year of service
SERS Plan 31 All classified employees of school districts or educational service districts (on or after 9/1/2000 and employees on or after 7/1/2007 with no past PERS Plan 2 service who chose Plan 3)
Varies At age 65 if vested or an actuarially reduced benefit at age 55 with 10 years of service (defined benefit portion)
1% of AFC per year of service (defined benefit portion)
The defined contribution portion depends on the member’s contribution level and on investment performance.
PSERS Plan 2 All full-time public safety officers at select state agencies, counties and cities except the cities of Seattle, Spokane and Tacoma (on or after 7/1/2006)
After five years of eligible service
At age 65 with five years of service, at age 60 with 10 years of PSERS service or at age 53 with 20 years of service reduced 3% for each year younger than age 60
2% of AFC per year of service

132 DRS s Actuarial Section — Comprehensive Annual Financial Report
As of June 30, 2016 — Page 2 of 2Plan Membership Eligibility Vesting Retirement Eligibility Benefit
TRS Plan 1 All certificated public school employees who worked in an instructional, administrative or supervisory capacity (by 9/30/1977)
After five years of eligible service
Any age with 30 years of service, at age 60 with five years of service or at age 55 with 25 years of service
2% of AFC per year of service, capped at 60% of AFC
JBM participants: 3.5% of AFC per year of service, capped at 75% of AFC
TRS Plan 2 All certificated public school employees who worked in an instructional, administrative or supervisory capacity (on or after 10/1/1977 and by 6/30/1996 and employees on or after 7/1/2007 who chose Plan 2)
After five years of eligible service
At age 65 with five years of service or an actuarially reduced benefit at age 55 with 20 years of service
2% of AFC per year of service
TRS Plan 31 All certificated public school employees who worked in an instructional, administrative or supervisory capacity (on or after 7/1/1996 and employees on or after 7/1/2007 who chose Plan 3)
Varies At age 65 if vested or an actuarially reduced benefit at age 55 with 10 years of service (defined benefit portion)
1% of AFC per year of service (defined benefit portion)
The defined contribution portion depends on the member’s contribution level and on investment performance.
LEOFF Plan 1 All full-time, fully compensated law enforcement officers and fire fighters (by 9/30/1977)
After five years of eligible service
At age 50 with five years of service
20 or more years of service: 2% of Final Average Salary (FAS) per year of service
10-19 years of service: 1.5% of FAS per year of service
5-9 years of service: 1% of FAS per year of service
LEOFF Plan 2 All full-time, fully compensated law enforcement officers, fire fighters and emergency medical technicians (on or after 10/1/1977)
After five years of eligible service
At age 53 with five years of service or a benefit at age 50 with 20 years of service reduced 3% for each year younger than age 53
2% of FAS per year of service
WSPRS Plan 1 Commissioned employees of the Washington State Patrol (on or after 8/1/1947 and by 12/31/2002)
No requirement for active members; after five years of eligible service for inactive members
At age 55 or after 25 years of service
2% of Average Final Salary (AFS) per year of service, capped at 75% of AFS
WSPRS Plan 2 Commissioned employees of the Washington State Patrol (on or after 1/1/2003)
No requirement for active members; after five years of eligible service for inactive members
At age 55 or after 25 years of service
2% of AFS per year of service, capped at 75% of AFS
JRS Judges elected or appointed to the Supreme Court, Court of Appeals and superior courts (on or after 8/9/1971 and by 6/30/1988; new judges on or after 7/1/1988 join PERS)
After 15 years of service
At age 60 15 years of service: 3.5% of FAS per year of service, capped at 75% of FAS
10-14 years of service: 3% of FAS per year of service, capped at 75% of FAS
JRF Judges elected or appointed to the Supreme Court, Court of Appeals and superior courts (by 8/8/1971)
After 12 years of service
At age 70 with 10 years of service or any age with 18 years of service
Half the monthly salary
Summary of Plan Provisions (cont.)
1 Members who are eligible to choose PERS, SERS or TRS Plan 2 or Plan 3 who don’t make a plan choice within 90 days of hire default into PERS, SERS or TRS Plan 3.
Note: DRS publishes handbooks describing the rights and benefits for each system and plan, including disability and survivor benefits. They are available from DRS and are on the DRS website at drs.wa.gov.

Comprehensive Annual Financial Report — Actuarial Section s DRS 133
Summary of Actuarial Assumptions and Methods
RP-2000 Mortality Rates 100% Scale BBCombined Healthy Disabled
Age Male Female Male Female Male Female
20 0.0345% 0.0191% 2.2571% 0.7450% 0.3000% 0.3000%
25 0.0376% 0.0207% 2.2571% 0.7450% 0.3000% 0.3000%
30 0.0444% 0.0264% 2.2571% 0.7450% 0.3000% 0.3000%
35 0.0773% 0.0475% 2.2571% 0.7450% 0.3000% 0.3000%
40 0.1079% 0.0706% 2.2571% 0.7450% 0.3000% 0.3000%
45 0.1508% 0.1124% 2.2571% 0.7450% 0.3000% 0.3000%
50 0.2138% 0.1676% 2.8975% 1.1535% 0.3000% 0.3000%
55 0.3624% 0.2717% 3.5442% 1.6544% 0.3000% 0.5000%
60 0.6747% 0.5055% 4.2042% 2.1839% 0.7000% 1.0000%
65 1.2737% 0.9706% 5.0174% 2.8026% 1.2000% 1.2000%
70 2.2206% 1.6742% 6.2583% 3.7635% 1.5000% 1.2000%
75 3.7834% 2.8106% 8.2067% 5.2230% 1.5000% 1.2000%
80 6.4368% 4.5879% 10.9372% 7.2312% 1.5000% 1.2000%
85 11.0757% 7.7446% 14.1603% 10.0203% 1.5000% 1.2000%
90 18.3408% 13.1682% 18.3408% 14.0049% 1.1000% 1.1000%
95 26.7491% 19.4509% 26.7491% 19.4509% 0.6000% 0.6000%
100 34.4556% 23.7467% 34.4556% 23.7467% 0.3000% 0.3000%
105 39.7886% 29.3116% 39.7886% 29.3116% 0.0000% 0.0000%
110 40.0000% 36.4617% 40.0000% 36.4617% 0.0000% 0.0000%
115 40.0000% 40.0000% 40.0000% 40.0000% 0.0000% 0.0000%
120 100.0000% 100.0000% 100.0000% 100.0000% 0.0000% 0.0000%
1. Actuarial Assumptions and Methods SelectionEconomic Assumptions and Methods: These were developed in accordance with Washington state law and the Pension Funding Council.
Demographic Assumptions and Methods: They were derived from Washington’s Office of the State Actuary and are based on the 2007-2012 Experience Studies (adopted July 2014). Additional assumptions for subsequent events and law changes are current as of the 2015 actuarial valuation report.
2. Investment ReturnThe investment return is 7.7% per annum for all systems
except LEOFF 2 (7.5%) and JRS/JRF (4.0%).
3. Mortality TablesMortality rates are based on the RP-2000 report’s Combined Healthy Table and Combined Disabled Table (except LEOFF 1), which the Society of Actuaries publishes. JRS uses the PERS mortality rates.
The healthy and disabled mortality rates displayed by system have been projected to the valuation date for illustrative purposes only. We use the RP-2000 report’s mortality rates combined with 100% of Scale BB on a generational basis in the valuation.

134 DRS s Actuarial Section — Comprehensive Annual Financial Report
3. Mortality Tables (cont.)
Summary of Actuarial Assumptions and Methods (cont.)
Disabled Mortality Projected to 2015All Plans Except LEOFF Plan 1 LEOFF Plan 11
Offsets 0 0 2 2
Age Male Female Male Female
20 2.1641% 0.7143% 0.0351% 0.0186%
25 2.1641% 0.7143% 0.0366% 0.0214%
30 2.1641% 0.7143% 0.0539% 0.0336%
35 2.1641% 0.7143% 0.0867% 0.0531%
40 2.1641% 0.7143% 0.1165% 0.0817%
45 2.1641% 0.7143% 0.1663% 0.1271%
50 2.7781% 1.1060% 0.2557% 0.1935%
55 3.3982% 1.5423% 0.4500% 0.3242%
60 3.8104% 1.8973% 0.7937% 0.5783%
65 4.2372% 2.3668% 1.3575% 1.0272%
70 5.0648% 3.1783% 2.2078% 1.7451%
75 6.6416% 4.4108% 3.7961% 2.8802%
80 8.8514% 6.1067% 6.5137% 4.7540%
85 11.4599% 8.4621% 11.0099% 8.1356%
90 15.7096% 11.9958% 18.5531% 13.5006%
95 24.5877% 17.8792% 27.5624% 19.7848%
100 33.0363% 22.7686% 35.6375% 24.4015%
105 39.7886% 29.3116% 40.0000% 32.2725%
110 40.0000% 36.4617% 40.0000% 38.6015%
115 40.0000% 40.0000% 40.0000% 40.0000%
120 100.0000% 100.0000% 100.0000% 100.0000%
1 LEOFF 1 uses the RP-2000 healthy mortality table.
Healthy Mortality Projected to 2015PERS, SERS, PSERS Plans TRS Plans LEOFF, WSPRS Plans
Offsets -1 -1 -3 -2 -1 1
Age Male Female Male Female Male Female
20 0.0317% 0.0182% 0.0289% 0.0180% 0.0317% 0.0184%
25 0.0361% 0.0193% 0.0351% 0.0189% 0.0361% 0.0205%
30 0.0395% 0.0238% 0.0366% 0.0225% 0.0395% 0.0294%
35 0.0673% 0.0417% 0.0539% 0.0378% 0.0673% 0.0493%
40 0.0979% 0.0621% 0.0867% 0.0573% 0.0979% 0.0742%
45 0.1339% 0.0987% 0.1165% 0.0898% 0.1339% 0.1173%
50 0.1913% 0.1486% 0.1663% 0.1375% 0.1913% 0.1776%
55 0.3064% 0.2260% 0.2557% 0.2057% 0.3064% 0.2881%
60 0.5388% 0.3858% 0.4253% 0.3408% 0.5388% 0.5051%
65 0.9526% 0.7279% 0.7395% 0.6459% 0.9526% 0.9251%
70 1.6026% 1.2549% 1.3009% 1.1354% 1.6026% 1.5690%
75 2.7435% 2.1499% 2.2078% 1.9398% 2.7435% 2.6151%
80 4.6880% 3.5052% 3.7961% 3.1749% 4.6880% 4.2883%
85 8.0751% 5.8707% 6.5137% 5.2786% 8.0751% 7.2944%
90 14.2546% 10.2060% 11.6526% 9.1909% 14.2546% 12.3859%
95 23.0437% 16.8029% 19.9103% 15.6662% 23.0437% 18.8784%
100 31.6606% 22.1856% 28.7501% 21.4722% 31.6606% 23.4749%
105 39.2003% 27.9055% 37.1685% 26.6044% 39.2003% 30.7811%
110 40.0000% 35.1544% 40.0000% 33.7441% 40.0000% 37.6246%
115 40.0000% 39.8308% 40.0000% 39.3507% 40.0000% 40.0000%
120 100.0000% 100.0000% 100.0000% 100.0000% 100.0000% 100.0000%

Comprehensive Annual Financial Report — Actuarial Section s DRS 135
Summary of Actuarial Assumptions and Methods (cont.)
4. Retirement
Probability of Service Retirement — Members Hired Before May 1, 2013PERS Plan 1 PERS Plan 2/3 SERS Plan 2/3 PSERS Plan 2
Service Less Than 30 Years
Service Greater Than or Equal to
30 YearsService Less Than
30 Years
Service Greater Than or Equal to
30 Years
Age Male Female Male Female Male Female Male Female Male Female Male Female
45 0% 0% 0% 0% 0% 0% 0% 0% 0% 0% 0% 0%
46 0% 0% 0% 0% 0% 0% 0% 0% 0% 0% 0% 0%
47 46% 54% 0% 0% 0% 0% 0% 0% 0% 0% 0% 0%
48 55% 46% 0% 0% 0% 0% 0% 0% 0% 0% 0% 0%
49 50% 38% 0% 0% 0% 0% 0% 0% 0% 0% 0% 0%
50 45% 30% 0% 0% 0% 0% 0% 0% 0% 0% 0% 0%
51 40% 30% 0% 0% 0% 0% 0% 0% 0% 0% 0% 0%
52 40% 30% 0% 0% 0% 0% 0% 0% 0% 0% 0% 0%
53 40% 30% 0% 0% 0% 0% 0% 0% 0% 0% 2% 2%
54 40% 40% 0% 0% 0% 0% 0% 0% 0% 0% 2% 2%
55 17% 28% 2% 2% 12% 12% 1% 2% 12% 12% 2% 2%
56 17% 16% 3% 2% 12% 12% 2% 2% 12% 12% 5% 4%
57 17% 16% 4% 2% 12% 12% 3% 2% 12% 12% 8% 6%
58 17% 16% 5% 2% 12% 12% 4% 3% 12% 12% 11% 8%
59 20% 30% 6% 4% 16% 24% 5% 4% 16% 25% 14% 10%
60 16% 16% 7% 6% 12% 12% 6% 5% 12% 12% 30% 34%
61 23% 21% 8% 13% 20% 20% 15% 13% 21% 20% 26% 26%
62 30% 26% 24% 20% 28% 28% 24% 21% 30% 28% 30% 34%
63 22% 20% 22% 18% 26% 26% 22% 20% 28% 26% 50% 52%
64 28% 28% 56% 56% 56% 56% 56% 52% 57% 48% 70% 70%
65 34% 36% 40% 40% 40% 40% 39% 36% 39% 36% 50% 35%
66 30% 22% 24% 24% 24% 24% 22% 24% 22% 24% 30% 35%
67 26% 22% 24% 24% 24% 24% 22% 23% 22% 23% 30% 35%
68 22% 22% 24% 24% 24% 24% 22% 22% 22% 22% 30% 35%
69 22% 22% 24% 24% 24% 24% 22% 21% 22% 21% 30% 35%
70 22% 22% 24% 24% 24% 24% 22% 20% 22% 20% 100% 100%
71 22% 22% 24% 24% 24% 24% 20% 19% 20% 19% 100% 100%
72 22% 22% 24% 24% 24% 24% 18% 18% 18% 18% 100% 100%
73 22% 22% 24% 24% 24% 24% 16% 17% 16% 17% 100% 100%
74 22% 22% 24% 24% 24% 24% 16% 17% 16% 17% 100% 100%
75 22% 22% 24% 24% 24% 24% 16% 17% 16% 17% 100% 100%
76 22% 22% 24% 24% 24% 24% 16% 17% 16% 17% 100% 100%
77 22% 22% 24% 24% 24% 24% 16% 17% 16% 17% 100% 100%
78 22% 22% 24% 24% 24% 24% 16% 17% 16% 17% 100% 100%
79 22% 22% 24% 24% 24% 24% 16% 17% 16% 17% 100% 100%
80 100% 100% 100% 100% 100% 100% 100% 100% 100% 100% 100% 100%
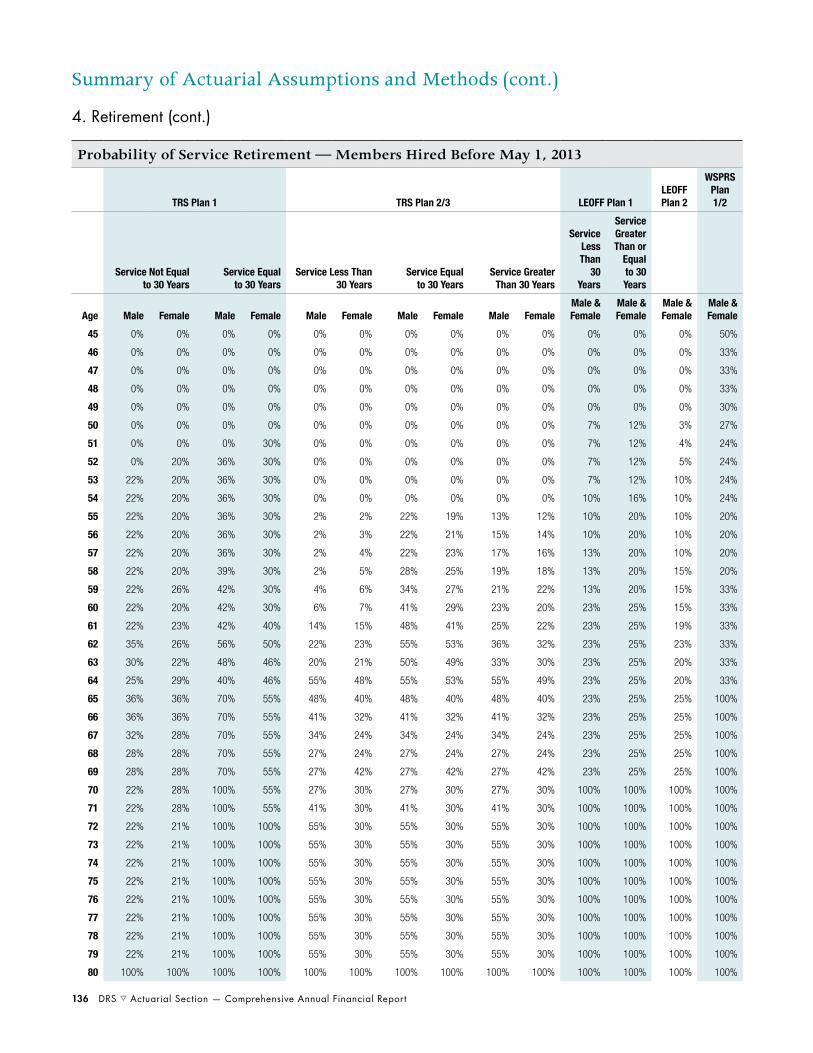
136 DRS s Actuarial Section — Comprehensive Annual Financial Report
Summary of Actuarial Assumptions and Methods (cont.)
4. Retirement (cont.)
Probability of Service Retirement — Members Hired Before May 1, 2013
TRS Plan 1 TRS Plan 2/3 LEOFF Plan 1LEOFF Plan 2
WSPRS Plan 1/2
Service Not Equal to 30 Years
Service Equal to 30 Years
Service Less Than 30 Years
Service Equal to 30 Years
Service Greater Than 30 Years
Service Less Than
30 Years
Service Greater Than or
Equal to 30 Years
Age Male Female Male Female Male Female Male Female Male FemaleMale & Female
Male & Female
Male & Female
Male & Female
45 0% 0% 0% 0% 0% 0% 0% 0% 0% 0% 0% 0% 0% 50%
46 0% 0% 0% 0% 0% 0% 0% 0% 0% 0% 0% 0% 0% 33%
47 0% 0% 0% 0% 0% 0% 0% 0% 0% 0% 0% 0% 0% 33%
48 0% 0% 0% 0% 0% 0% 0% 0% 0% 0% 0% 0% 0% 33%
49 0% 0% 0% 0% 0% 0% 0% 0% 0% 0% 0% 0% 0% 30%
50 0% 0% 0% 0% 0% 0% 0% 0% 0% 0% 7% 12% 3% 27%
51 0% 0% 0% 30% 0% 0% 0% 0% 0% 0% 7% 12% 4% 24%
52 0% 20% 36% 30% 0% 0% 0% 0% 0% 0% 7% 12% 5% 24%
53 22% 20% 36% 30% 0% 0% 0% 0% 0% 0% 7% 12% 10% 24%
54 22% 20% 36% 30% 0% 0% 0% 0% 0% 0% 10% 16% 10% 24%
55 22% 20% 36% 30% 2% 2% 22% 19% 13% 12% 10% 20% 10% 20%
56 22% 20% 36% 30% 2% 3% 22% 21% 15% 14% 10% 20% 10% 20%
57 22% 20% 36% 30% 2% 4% 22% 23% 17% 16% 13% 20% 10% 20%
58 22% 20% 39% 30% 2% 5% 28% 25% 19% 18% 13% 20% 15% 20%
59 22% 26% 42% 30% 4% 6% 34% 27% 21% 22% 13% 20% 15% 33%
60 22% 20% 42% 30% 6% 7% 41% 29% 23% 20% 23% 25% 15% 33%
61 22% 23% 42% 40% 14% 15% 48% 41% 25% 22% 23% 25% 19% 33%
62 35% 26% 56% 50% 22% 23% 55% 53% 36% 32% 23% 25% 23% 33%
63 30% 22% 48% 46% 20% 21% 50% 49% 33% 30% 23% 25% 20% 33%
64 25% 29% 40% 46% 55% 48% 55% 53% 55% 49% 23% 25% 20% 33%
65 36% 36% 70% 55% 48% 40% 48% 40% 48% 40% 23% 25% 25% 100%
66 36% 36% 70% 55% 41% 32% 41% 32% 41% 32% 23% 25% 25% 100%
67 32% 28% 70% 55% 34% 24% 34% 24% 34% 24% 23% 25% 25% 100%
68 28% 28% 70% 55% 27% 24% 27% 24% 27% 24% 23% 25% 25% 100%
69 28% 28% 70% 55% 27% 42% 27% 42% 27% 42% 23% 25% 25% 100%
70 22% 28% 100% 55% 27% 30% 27% 30% 27% 30% 100% 100% 100% 100%
71 22% 28% 100% 55% 41% 30% 41% 30% 41% 30% 100% 100% 100% 100%
72 22% 21% 100% 100% 55% 30% 55% 30% 55% 30% 100% 100% 100% 100%
73 22% 21% 100% 100% 55% 30% 55% 30% 55% 30% 100% 100% 100% 100%
74 22% 21% 100% 100% 55% 30% 55% 30% 55% 30% 100% 100% 100% 100%
75 22% 21% 100% 100% 55% 30% 55% 30% 55% 30% 100% 100% 100% 100%
76 22% 21% 100% 100% 55% 30% 55% 30% 55% 30% 100% 100% 100% 100%
77 22% 21% 100% 100% 55% 30% 55% 30% 55% 30% 100% 100% 100% 100%
78 22% 21% 100% 100% 55% 30% 55% 30% 55% 30% 100% 100% 100% 100%
79 22% 21% 100% 100% 55% 30% 55% 30% 55% 30% 100% 100% 100% 100%
80 100% 100% 100% 100% 100% 100% 100% 100% 100% 100% 100% 100% 100% 100%

Comprehensive Annual Financial Report — Actuarial Section s DRS 137
Summary of Actuarial Assumptions and Methods (cont.)
4. Retirement (cont.)
Probability of Service Retirement — Members Hired on or After May 1, 2013PERS Plan 2/3 SERS Plan 2/3 TRS Plan 2/3
Service Less Than 30 Years
Service Greater Than or Equal to
30 YearsService Less Than
30 Years
Service Greater Than or Equal to
30 YearsService Less Than
30 YearsService Equal
to 30 YearsService Greater
Than 30 Years
Age Male Female Male Female Male Female Male Female Male Female Male Female Male Female
45 0% 0% 0% 0% 0% 0% 0% 0% 0% 0% 0% 0% 0% 0%
46 0% 0% 0% 0% 0% 0% 0% 0% 0% 0% 0% 0% 0% 0%
47 0% 0% 0% 0% 0% 0% 0% 0% 0% 0% 0% 0% 0% 0%
48 0% 0% 0% 0% 0% 0% 0% 0% 0% 0% 0% 0% 0% 0%
49 0% 0% 0% 0% 0% 0% 0% 0% 0% 0% 0% 0% 0% 0%
50 0% 0% 0% 0% 0% 0% 0% 0% 0% 0% 0% 0% 0% 0%
51 0% 0% 0% 0% 0% 0% 0% 0% 0% 0% 0% 0% 0% 0%
52 0% 0% 0% 0% 0% 0% 0% 0% 0% 0% 0% 0% 0% 0%
53 0% 0% 0% 0% 0% 0% 0% 0% 0% 0% 0% 0% 0% 0%
54 0% 0% 0% 0% 0% 0% 0% 0% 0% 0% 0% 0% 0% 0%
55 2% 2% 9% 9% 1% 2% 8% 9% 2% 2% 16% 14% 9% 9%
56 3% 2% 9% 8% 2% 2% 8% 8% 2% 3% 15% 15% 10% 10%
57 4% 2% 9% 8% 3% 2% 9% 8% 2% 4% 14% 16% 11% 11%
58 5% 2% 9% 8% 4% 3% 9% 8% 2% 5% 17% 17% 12% 13%
59 6% 4% 12% 15% 5% 4% 11% 16% 4% 6% 21% 18% 14% 15%
60 7% 6% 10% 9% 6% 5% 9% 9% 6% 7% 25% 19% 15% 14%
61 8% 13% 15% 17% 15% 13% 18% 17% 14% 15% 33% 29% 20% 19%
62 24% 20% 26% 24% 24% 21% 27% 25% 22% 23% 40% 39% 30% 28%
63 22% 18% 24% 22% 22% 20% 25% 23% 20% 21% 35% 35% 27% 26%
64 56% 56% 56% 56% 56% 52% 56% 50% 55% 48% 55% 50% 55% 48%
65 40% 40% 40% 40% 39% 36% 39% 36% 48% 40% 48% 40% 48% 40%
66 24% 24% 24% 24% 22% 24% 22% 24% 41% 32% 41% 32% 41% 32%
67 24% 24% 24% 24% 22% 23% 22% 23% 34% 24% 34% 24% 34% 24%
68 24% 24% 24% 24% 22% 22% 22% 22% 27% 24% 27% 24% 27% 24%
69 24% 24% 24% 24% 22% 21% 22% 21% 27% 42% 27% 42% 27% 42%
70 24% 24% 24% 24% 22% 20% 22% 20% 27% 30% 27% 30% 27% 30%
71 24% 24% 24% 24% 20% 19% 20% 19% 41% 30% 41% 30% 41% 30%
72 24% 24% 24% 24% 18% 18% 18% 18% 55% 30% 55% 30% 55% 30%
73 24% 24% 24% 24% 16% 17% 16% 17% 55% 30% 55% 30% 55% 30%
74 24% 24% 24% 24% 16% 17% 16% 17% 55% 30% 55% 30% 55% 30%
75 24% 24% 24% 24% 16% 17% 16% 17% 55% 30% 55% 30% 55% 30%
76 24% 24% 24% 24% 16% 17% 16% 17% 55% 30% 55% 30% 55% 30%
77 24% 24% 24% 24% 16% 17% 16% 17% 55% 30% 55% 30% 55% 30%
78 24% 24% 24% 24% 16% 17% 16% 17% 55% 30% 55% 30% 55% 30%
79 24% 24% 24% 24% 16% 17% 16% 17% 55% 30% 55% 30% 55% 30%
80 100% 100% 100% 100% 100% 100% 100% 100% 100% 100% 100% 100% 100% 100%

138 DRS s Actuarial Section — Comprehensive Annual Financial Report
Summary of Actuarial Assumptions and Methods (cont.)
5. Disablement
Probability of Disablement — Table 1 of 2PERS Plan 11 PERS Plan 2/3 SERS Plan 2/3 PSERS Plan 2
Service Less Than 10 YearsService Greater Than
10 Years
Age Male Female Male Female Male Female Male Female Male Female
20 0.0000% 0.0000% 0.0000% 0.0000% 0.0000% 0.0000% 0.0000% 0.0000% 0.0000% 0.0000%
25 0.0000% 0.0000% 0.0052% 0.0000% 0.0000% 0.0000% 0.0052% 0.0000% 0.0052% 0.0000%
30 0.0000% 0.0000% 0.0115% 0.0056% 0.0000% 0.0048% 0.0115% 0.0056% 0.0115% 0.0056%
35 0.0310% 0.0319% 0.0156% 0.0194% 0.0081% 0.0176% 0.0156% 0.0194% 0.0158% 0.0197%
40 0.0762% 0.0710% 0.0235% 0.0275% 0.0258% 0.0164% 0.0235% 0.0275% 0.0298% 0.0348%
45 0.1481% 0.1431% 0.0476% 0.0467% 0.0528% 0.0214% 0.0476% 0.0467% 0.0607% 0.0596%
50 0.2542% 0.3023% 0.0922% 0.1003% 0.1213% 0.0611% 0.0922% 0.1003% 0.1182% 0.1285%
55 0.8240% 0.6411% 0.2630% 0.2782% 0.2787% 0.1742% 0.2630% 0.2782% 0.3409% 0.3606%
60 0.7541% 0.3458% 0.7863% 0.7681% 0.6404% 0.4971% 0.7863% 0.7681% 0.0000% 0.0000%
65 0.2204% 0.0386% 0.6146% 0.5257% 0.5928% 0.4121% 0.6146% 0.5257% 0.0000% 0.0000%
70 0.0644% 0.0043% 0.1358% 0.1315% 0.1271% 0.1816% 0.0000% 0.0000% 0.0000% 0.0000%
75 0.0188% 0.0005% 0.0300% 0.0329% 0.0272% 0.0800% 0.0000% 0.0000% 0.0000% 0.0000%
80 0.0000% 0.0000% 0.0000% 0.0000% 0.0000% 0.0000% 0.0000% 0.0000% 0.0000% 0.0000%
1 10% of all PERS Plan 1 disabilities are assumed to be duty related.
Probability of Disablement — Table 2 of 2
TRS Plan 1 TRS Plan 2/3LEOFF Plan 1
LEOFF Plan 2
WSPRS Plan 1/2
Age Male Female Male FemaleMale & Female
Male & Female
Male & Female
20 0.0013% 0.0014% 0.0003% 0.0003% 0.1000% 0.0074% 0.0052%
25 0.0091% 0.0092% 0.0024% 0.0019% 0.1000% 0.0191% 0.0094%
30 0.0187% 0.0190% 0.0048% 0.0040% 0.7968% 0.0467% 0.0169%
35 0.0321% 0.0326% 0.0083% 0.0068% 1.4888% 0.0807% 0.0306%
40 0.0428% 0.0434% 0.0111% 0.0091% 2.3471% 0.1360% 0.0551%
45 0.0944% 0.0957% 0.0244% 0.0201% 4.0000% 0.1796% 0.0995%
50 0.1634% 0.1656% 0.0422% 0.0347% 7.0000% 0.3236% 0.1794%
55 0.3347% 0.3393% 0.1118% 0.0750% 9.0000% 0.5534% 0.3237%
60 0.4686% 0.4750% 0.2500% 0.1875% 10.0000% 0.9462% 0.0560%
65 0.5633% 0.5681% 0.2362% 0.1552% 10.0000% 1.6180% 0.0000%
70 0.1485% 0.1486% 0.0334% 0.0283% 0.0000% 0.0000% 0.0000%
75 0.0391% 0.0389% 0.0047% 0.0052% 0.0000% 0.0000% 0.0000%
80 0.0000% 0.0000% 0.0000% 0.0000% 0.0000% 0.0000% 0.0000%
Rates have been rounded for display purposes.

Comprehensive Annual Financial Report — Actuarial Section s DRS 139
Summary of Actuarial Assumptions and Methods (cont.)
6. Other Terminations of Employment
Probability of TerminationPERS SERS PSERS TRS LEOFF WSPRS
Years of Service Male Female Male Female Male Female Male Female
Male & Female
Male & Female
0 26.2397% 26.2397% 24.4766% 19.9030% 26.2397% 26.2397% 11.1014% 11.1340% 10.7033% 4.2261%
1 15.4534% 16.7747% 15.8775% 13.1281% 15.4534% 16.7747% 9.0312% 9.4565% 4.8058% 2.0000%
2 10.0683% 11.7007% 11.6915% 10.2908% 10.0683% 11.7007% 5.9789% 7.1731% 2.4484% 2.0000%
3 7.5236% 9.2904% 9.9510% 7.8600% 7.5236% 9.2904% 4.5105% 6.1285% 1.9350% 2.0000%
4 6.3052% 7.6024% 8.1055% 6.7558% 6.3052% 7.6024% 4.1402% 5.3084% 1.8700% 2.0000%
5 5.4443% 6.6544% 6.6418% 6.2423% 5.4443% 6.6544% 3.6847% 4.7057% 1.8050% 2.0000%
6 4.4874% 5.7856% 6.0762% 5.5595% 4.4874% 5.7856% 2.9510% 4.0862% 1.7400% 1.9000%
7 4.1778% 5.3301% 5.5588% 5.2581% 4.1778% 5.3301% 2.7214% 3.6698% 1.6750% 1.7000%
8 3.8895% 4.9105% 5.0854% 4.9707% 3.8895% 4.9105% 2.5097% 3.2957% 1.6100% 1.6000%
9 3.6211% 4.5239% 4.6524% 4.7491% 3.6211% 4.5239% 2.3144% 2.9598% 1.5450% 1.5113%
10 3.3712% 4.1677% 4.2562% 4.5725% 3.3712% 4.1677% 2.1343% 2.6581% 1.4800% 1.3426%
11 3.1386% 3.8396% 3.8938% 4.4832% 3.1386% 3.8396% 1.9683% 2.3872% 1.4150% 1.2000%
12 2.9220% 3.5373% 3.5622% 4.4156% 2.9220% 3.5373% 1.8151% 2.1439% 1.3500% 1.0765%
13 2.7204% 3.2588% 3.2589% 4.4032% 2.7204% 3.2588% 1.6739% 1.9254% 1.2850% 0.9676%
14 2.5327% 3.0023% 2.9814% 4.2560% 2.5327% 3.0023% 1.5437% 1.7291% 1.2200% 0.8701%
15 2.3579% 2.7659% 2.7275% 4.2740% 2.3579% 2.7659% 1.4235% 1.6000% 1.1550% 0.7819%
16 2.1952% 2.5482% 2.4952% 3.9160% 2.1952% 2.5482% 1.3128% 1.5500% 1.0900% 0.7015%
17 2.0437% 2.3475% 2.4500% 3.6424% 2.0437% 2.3475% 1.2106% 1.5000% 1.0250% 0.6274%
18 1.9027% 2.1627% 2.4000% 3.4565% 1.9027% 2.1627% 1.1500% 1.4500% 0.9600% 0.5589%
19 1.7714% 1.9925% 2.3500% 3.2224% 1.7714% 1.9925% 1.1250% 1.4000% 0.8950% 0.4951%
20 1.5311% 1.8001% 2.3000% 3.0000% 1.5311% 1.8001% 1.0000% 1.3000% 0.8300% 0.4354%
21 1.3244% 1.5807% 2.2500% 2.8000% 1.3244% 1.5807% 0.9500% 1.2607% 0.7650% 0.3793%
22 1.1457% 1.3880% 2.2000% 2.7000% 1.1457% 1.3880% 0.9250% 1.1837% 0.7000% 0.3264%
23 0.9910% 1.2188% 2.0870% 2.6000% 0.9910% 1.2188% 0.9000% 1.1115% 0.6350% 0.2764%
24 0.8573% 1.0702% 1.8198% 2.4750% 0.8573% 1.0702% 0.8809% 1.0436% 0.5700% 0.2289%
25 0.7415% 0.9397% 1.5868% 2.2530% 0.7415% 0.9397% 0.8213% 0.9799% 0.5050% 0.0000%
26 0.6415% 0.8252% 1.3836% 2.0508% 0.6415% 0.8252% 0.7658% 0.9201% 0.4400% 0.0000%
27 0.5549% 0.7246% 1.2065% 1.8668% 0.5549% 0.7246% 0.7140% 0.8639% 0.3750% 0.0000%
28 0.4800% 0.6363% 1.0520% 1.6993% 0.4800% 0.6363% 0.6657% 0.8111% 0.3100% 0.0000%
29 0.4152% 0.5587% 0.9173% 1.5469% 0.4152% 0.5587% 0.6207% 0.7616% 0.2450% 0.0000%
30+ 0.3591% 0.4906% 0.7999% 1.4081% 0.3591% 0.4906% 0.5788% 0.7151% 0.1800% 0.0000%
Rates have been rounded for display purposes.
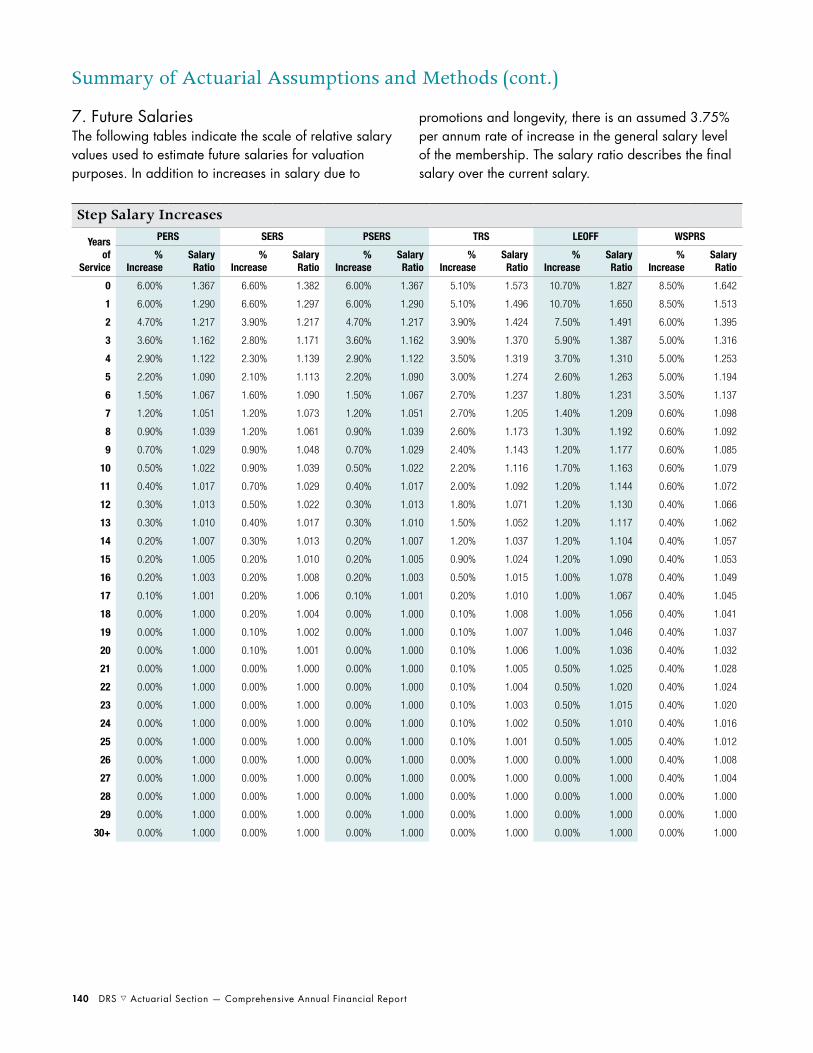
140 DRS s Actuarial Section — Comprehensive Annual Financial Report
Summary of Actuarial Assumptions and Methods (cont.)
7. Future SalariesThe following tables indicate the scale of relative salary values used to estimate future salaries for valuation purposes. In addition to increases in salary due to
promotions and longevity, there is an assumed 3.75% per annum rate of increase in the general salary level of the membership. The salary ratio describes the final salary over the current salary.
Step Salary Increases
Years of
Service
PERS SERS PSERS TRS LEOFF WSPRS
% Increase
Salary Ratio
% Increase
Salary Ratio
% Increase
Salary Ratio
% Increase
Salary Ratio
% Increase
Salary Ratio
% Increase
Salary Ratio
0 6.00% 1.367 6.60% 1.382 6.00% 1.367 5.10% 1.573 10.70% 1.827 8.50% 1.642
1 6.00% 1.290 6.60% 1.297 6.00% 1.290 5.10% 1.496 10.70% 1.650 8.50% 1.513
2 4.70% 1.217 3.90% 1.217 4.70% 1.217 3.90% 1.424 7.50% 1.491 6.00% 1.395
3 3.60% 1.162 2.80% 1.171 3.60% 1.162 3.90% 1.370 5.90% 1.387 5.00% 1.316
4 2.90% 1.122 2.30% 1.139 2.90% 1.122 3.50% 1.319 3.70% 1.310 5.00% 1.253
5 2.20% 1.090 2.10% 1.113 2.20% 1.090 3.00% 1.274 2.60% 1.263 5.00% 1.194
6 1.50% 1.067 1.60% 1.090 1.50% 1.067 2.70% 1.237 1.80% 1.231 3.50% 1.137
7 1.20% 1.051 1.20% 1.073 1.20% 1.051 2.70% 1.205 1.40% 1.209 0.60% 1.098
8 0.90% 1.039 1.20% 1.061 0.90% 1.039 2.60% 1.173 1.30% 1.192 0.60% 1.092
9 0.70% 1.029 0.90% 1.048 0.70% 1.029 2.40% 1.143 1.20% 1.177 0.60% 1.085
10 0.50% 1.022 0.90% 1.039 0.50% 1.022 2.20% 1.116 1.70% 1.163 0.60% 1.079
11 0.40% 1.017 0.70% 1.029 0.40% 1.017 2.00% 1.092 1.20% 1.144 0.60% 1.072
12 0.30% 1.013 0.50% 1.022 0.30% 1.013 1.80% 1.071 1.20% 1.130 0.40% 1.066
13 0.30% 1.010 0.40% 1.017 0.30% 1.010 1.50% 1.052 1.20% 1.117 0.40% 1.062
14 0.20% 1.007 0.30% 1.013 0.20% 1.007 1.20% 1.037 1.20% 1.104 0.40% 1.057
15 0.20% 1.005 0.20% 1.010 0.20% 1.005 0.90% 1.024 1.20% 1.090 0.40% 1.053
16 0.20% 1.003 0.20% 1.008 0.20% 1.003 0.50% 1.015 1.00% 1.078 0.40% 1.049
17 0.10% 1.001 0.20% 1.006 0.10% 1.001 0.20% 1.010 1.00% 1.067 0.40% 1.045
18 0.00% 1.000 0.20% 1.004 0.00% 1.000 0.10% 1.008 1.00% 1.056 0.40% 1.041
19 0.00% 1.000 0.10% 1.002 0.00% 1.000 0.10% 1.007 1.00% 1.046 0.40% 1.037
20 0.00% 1.000 0.10% 1.001 0.00% 1.000 0.10% 1.006 1.00% 1.036 0.40% 1.032
21 0.00% 1.000 0.00% 1.000 0.00% 1.000 0.10% 1.005 0.50% 1.025 0.40% 1.028
22 0.00% 1.000 0.00% 1.000 0.00% 1.000 0.10% 1.004 0.50% 1.020 0.40% 1.024
23 0.00% 1.000 0.00% 1.000 0.00% 1.000 0.10% 1.003 0.50% 1.015 0.40% 1.020
24 0.00% 1.000 0.00% 1.000 0.00% 1.000 0.10% 1.002 0.50% 1.010 0.40% 1.016
25 0.00% 1.000 0.00% 1.000 0.00% 1.000 0.10% 1.001 0.50% 1.005 0.40% 1.012
26 0.00% 1.000 0.00% 1.000 0.00% 1.000 0.00% 1.000 0.00% 1.000 0.40% 1.008
27 0.00% 1.000 0.00% 1.000 0.00% 1.000 0.00% 1.000 0.00% 1.000 0.40% 1.004
28 0.00% 1.000 0.00% 1.000 0.00% 1.000 0.00% 1.000 0.00% 1.000 0.00% 1.000
29 0.00% 1.000 0.00% 1.000 0.00% 1.000 0.00% 1.000 0.00% 1.000 0.00% 1.000
30+ 0.00% 1.000 0.00% 1.000 0.00% 1.000 0.00% 1.000 0.00% 1.000 0.00% 1.000

Comprehensive Annual Financial Report — Actuarial Section s DRS 141
Summary of Actuarial Assumptions and Methods (cont.)
7. Future Salaries (cont.)
Relative Salary ValuesPERS, SERS, PSERS TRS LEOFF WSPRS
Annual Percent Increase 4.74% 4.58% 5.05% 4.74%
Attributed to Growth in Active Group Size 0.95% 0.80% 1.25% 0.95%
Attributed to the Effects of Inflation on Salaries 3.75% 3.75% 3.75% 3.75%
8. Other Specific Assumptions That Have a Material Impact on Valuation ResultsMembers of the following plans increase their Average Final Compensation by an average stated below by cashing out sick leave or annual leave pay or by increasing overtime:
• PERS 1: Up to 4.0%• TRS 1: Up to 0.75%• LEOFF 1: Up to 4.5%• WSPRS 1: Up to 7.0%
Post-retirement Cost-of-Living Adjustments (COLAs) are assumed to be a 3.0% increase each year for all plans, including:
• LEOFF 1: 3.0%• Qualifying PERS 1 and TRS 1 members:
COLA on minimum benefit levels
LEOFF 2 members are assumed to become disabled or die due to duty-related injury or illness at a rate that varies with age. For more details, contact the Office of the State Actuary.
Other assumptions include the probability of a vested terminated member not withdrawing his or her contributions from the plan, being married, military service, a single-life annuity refund upon death and beneficiary age. More details on these and other assumptions can be obtained from the Office of the State Actuary.
9. Change in AssumptionsAssumption Changes: For all systems except LEOFF 2, we lowered the assumed valuation interest rate from 7.8% to 7.7%. We also updated the assumed administrative factors.
Method Changes: We corrected how our valuation software calculates nonduty disability benefits for LEOFF Plan 2 active members.
We added new LEOFF 2 and WSPRS benefit definitions within our valuation software to model legislation signed into law during the 2015 legislative session. The law now pays the Labor & Industries (L&I) duty-related death survivor benefit from each system’s respective trust fund upon remarriage of the survivor. Before this legislation, the L&I survivor benefit ended when the survivor of a duty-related death remarried.
We changed how we value the basic minimum COLA in PERS 1 and TRS 1. Calculation of this COLA is now included within our valuation software instead of using an external model.

142 DRS s Actuarial Section — Comprehensive Annual Financial Report
Summary of Actuarial Assumptions and Methods (cont.)
10. Actuarial Cost MethodValuation assets are at market value with annual gains and losses recognized on a graded scale over an eight-year period. Additionally, the actuarial value of assets may not exceed 130% nor drop below 70% of the market value of assets. JRS and JRF use the market value of assets for valuation assets.
PERS Plan 1, TRS Plan 1, LEOFF Plan 1, JRS and JRF Funding (Actual Contributions): A variation of the Entry Age Normal (EAN) Cost Method is used for PERS 1 and TRS 1. The contribution toward the unfunded actuarially accrued liability (UAAL) has been developed in the valuation as a level percentage of expected future covered payrolls, which will amortize the UAAL over a rolling 10-year period. PERS 1 amortizes the UAAL over all PERS, SERS and PSERS payroll, including projected system growth. TRS 1 amortizes the UAAL over all TRS payroll, including projected system growth. PERS 1 has a minimum UAAL rate of 3.50%, and TRS 1 has a minimum UAAL rate of 5.75%. No contributions are required when LEOFF 1 is fully funded. JRS and JRF are funded on a pay-as-you-go basis.
PERS Plan 2/3, SERS Plan 2/3, TRS Plan 2/3, PSERS Plan 2, LEOFF Plan 2 and WSPRS Plan 1/2: The Aggregate Actuarial Cost Method is used to calculate contribution rates. Under this method, the unfunded actuarial present value of fully projected benefits is amortized over the projected earnings of the active group. The entire contribution is normal cost, and no UAAL exists. All gains and losses are amortized over future salaries of current active members.
PERS 2/3, TRS 2/3, SERS 2/3 and PSERS 2 minimum contribution rates are based on 80% of the Entry Age Normal Cost Rate (EANC). WSPRS 1/2 minimum contribution rates are based on 70% of the EANC. Similarly, LEOFF 2 minimum contribution rates are based on 90% of the EANC.
11. Change in Funding PolicyNone.
12. Material Changes in Benefit Provisions and Contribution RatesThe contribution rates for the 2017-19 biennium are based on the actuarial valuations as of June 30, 2015.
No laws enacted in 2016 had an impact on the latest actuarial valuation (that is, legislation that produced supplemental contributions rate impacts).

Comprehensive Annual Financial Report — Actuarial Section s DRS 143
Schedule of Active Member Valuation Data
PERS Plan 1
Valuation Date Active Members Annual Payroll in Millions Average Annual PayAnnualized % Increase
in Average Pay
6/30/2015 3,927 $ 230.7 $ 58,748 1.5%
6/30/2014 4,782 276.8 57,884 3.0%
6/30/2013 5,653 317.8 56,224 0.6%
6/30/2012 6,635 370.8 55,878 0.1%
6/30/2011 7,733 431.8 55,842 (0.9)%
6/30/2010 9,007 507.3 56,324 0.5%
6/30/2009 10,354 580.2 56,034 2.4%
6/30/2008 11,663 638.5 54,743 5.0%
6/30/2007 12,975 676.4 52,130 2.1%
9/30/2006 14,213 725.5 51,042 3.6%
PERS Plan 2
Valuation Date Active Members Annual Payroll in Millions Average Annual PayAnnualized % Increase
in Average Pay
6/30/2015 117,768 $ 7,204.6 $ 61,176 1.9%
6/30/2014 116,985 7,023.3 60,036 2.8%
6/30/2013 115,751 6,758.5 58,388 1.2%
6/30/2012 115,877 6,688.2 57,718 1.2%
6/30/2011 117,096 6,679.4 57,042 1.3%
6/30/2010 119,826 6,748.3 56,317 2.0%
6/30/2009 121,800 6,723.9 55,204 4.1%
6/30/2008 123,285 6,537.5 53,028 6.5%
6/30/2007 120,625 6,004.6 49,779 2.9%
9/30/2006 118,341 5,726.6 48,391 4.3%
PERS Plan 3
Valuation Date Active Members Annual Payroll in Millions Average Annual PayAnnualized % Increase
in Average Pay
6/30/2015 31,602 $ 1,779.8 $ 56,320 2.0%
6/30/2014 30,694 1,695.4 55,235 2.4%
6/30/2013 29,302 1,580.8 53,948 0.7%
6/30/2012 28,078 1,504.4 53,579 0.6%
6/30/2011 27,588 1,468.9 53,245 1.1%
6/30/2010 27,693 1,458.0 52,647 1.2%
6/30/2009 27,081 1,408.4 52,006 4.3%
6/30/2008 26,720 1,331.7 49,840 5.7%
6/30/2007 24,422 1,152.0 47,172 1.5%
9/30/2006 22,473 1,043.9 46,452 3.6%

144 DRS s Actuarial Section — Comprehensive Annual Financial Report
Schedule of Active Member Valuation Data (cont.)
SERS Plan 2
Valuation Date Active Members Annual Payroll in Millions Average Annual PayAnnualized % Increase
in Average Pay
6/30/2015 24,479 $ 734.3 $ 29,998 2.8%
6/30/2014 22,950 670.0 29,195 2.0%
6/30/2013 21,760 622.8 28,620 0.4%
6/30/2012 20,846 594.0 28,494 0.1%
6/30/2011 20,784 591.4 28,453 0.6%
6/30/2010 20,358 576.0 28,293 0.8%
6/30/2009 20,197 567.0 28,072 3.5%
6/30/2008 19,264 522.4 27,118 2.2%
6/30/2007 17,767 471.4 26,531 4.3%
9/30/2006 18,464 469.5 25,426 3.8%
SERS Plan 3
Valuation Date Active Members Annual Payroll in Millions Average Annual PayAnnualized % Increase
in Average Pay
6/30/2015 31,326 $ 962.5 $ 30,725 2.9%
6/30/2014 30,832 920.7 29,861 2.3%
6/30/2013 30,535 891.5 29,195 1.3%
6/30/2012 30,712 884.8 28,810 1.1%
6/30/2011 31,548 898.6 28,483 1.3%
6/30/2010 31,981 899.0 28,110 0.9%
6/30/2009 32,277 899.5 27,869 5.7%
6/30/2008 32,510 857.1 26,364 7.4%
6/30/2007 33,058 811.4 24,544 2.7%
9/30/2006 32,354 773.4 23,905 1.9%
PSERS Plan 2
Valuation Date Active Members Annual Payroll in Millions Average Annual PayAnnualized % Increase
in Average Pay
6/30/2015 5,202 $ 302.3 $ 58,115 1.8%
6/30/2014 4,820 275.3 57,115 1.9%
6/30/2013 4,513 253.1 56,075 0.1%
6/30/2012 4,250 238.0 55,999 0.7%
6/30/2011 4,187 232.8 55,597 3.0%
6/30/2010 4,210 227.4 54,003 4.9%
6/30/2009 4,340 223.4 51,476 2.5%
6/30/2008 3,981 200.0 50,231 3.1%
6/30/2007 2,755 134.2 48,710 (2.0)%
9/30/2006 2,073 103.1 49,714 n/a

Comprehensive Annual Financial Report — Actuarial Section s DRS 145
Schedule of Active Member Valuation Data (cont.)
TRS Plan 1
Valuation Date Active Members Annual Payroll in Millions Average Annual PayAnnualized % Increase
in Average Pay
6/30/2015 1,353 $ 107.7 $ 79,603 1.3%
6/30/2014 1,824 143.3 78,549 2.6%
6/30/2013 2,393 183.2 76,549 1.1%
6/30/2012 3,019 228.5 75,681 (0.4)%
6/30/2011 3,740 284.2 75,994 1.4%
6/30/2010 4,591 344.0 74,930 0.3%
6/30/2009 5,204 388.8 74,707 4.7%
6/30/2008 6,061 432.4 71,340 6.0%
6/30/2007 6,331 426.1 67,310 3.9%
9/30/2006 7,382 478.3 64,796 2.0%
TRS Plan 2
Valuation Date Active Members Annual Payroll in Millions Average Annual PayAnnualized % Increase
in Average Pay
6/30/2015 15,342 $ 945.2 $ 61,610 0.1%
6/30/2014 13,632 838.9 61,538 0.4%
6/30/2013 12,071 740.2 61,320 (0.5)%
6/30/2012 10,849 668.8 61,648 (2.2)%
6/30/2011 10,285 648.2 63,025 (0.6)%
6/30/2010 9,442 598.8 63,423 (1.3)%
6/30/2009 9,174 589.3 64,239 1.9%
6/30/2008 8,103 510.8 63,043 1.3%
6/30/2007 6,752 420.1 62,213 5.2%
9/30/2006 7,205 413.1 59,164 3.1%
TRS Plan 3
Valuation Date Active Members Annual Payroll in Millions Average Annual PayAnnualized % Increase
in Average Pay
6/30/2015 52,125 $ 3,721.9 $ 71,403 2.5%
6/30/2014 51,837 3,611.5 69,670 3.0%
6/30/2013 51,471 3,482.7 67,664 2.2%
6/30/2012 51,489 3,408.1 66,191 0.5%
6/30/2011 52,178 3,436.7 65,866 2.3%
6/30/2010 52,292 3,366.7 64,382 1.3%
6/30/2009 53,010 3,367.9 63,534 6.9%
6/30/2008 52,360 3,110.6 59,408 6.3%
6/30/2007 51,856 2,897.6 55,879 6.1%
9/30/2006 53,371 2,812.0 52,689 2.5%

146 DRS s Actuarial Section — Comprehensive Annual Financial Report
Schedule of Active Member Valuation Data (cont.)
LEOFF Plan 1
Valuation Date Active Members Annual Payroll in Millions Average Annual PayAnnualized % Increase
in Average Pay
6/30/2015 82 $ 8.7 $ 106,683 1.2%
6/30/2014 120 12.6 105,385 2.0%
6/30/2013 143 14.8 103,362 2.5%
6/30/2012 186 18.8 100,828 2.8%
6/30/2011 250 24.5 98,078 1.4%
6/30/2010 301 29.1 96,686 3.2%
6/30/2009 356 33.3 93,679 6.4%
6/30/2008 421 37.1 88,070 5.8%
6/30/2007 513 42.7 83,262 3.3%
9/30/2006 596 48.1 80,630 4.5%
LEOFF Plan 2
Valuation Date Active Members Annual Payroll in Millions Average Annual PayAnnualized % Increase
in Average Pay
6/30/2015 17,019 $ 1,742.9 $ 102,411 3.4%
6/30/2014 16,773 1,661.3 99,048 3.5%
6/30/2013 16,687 1,596.8 95,694 2.6%
6/30/2012 16,720 1,560.1 93,308 2.2%
6/30/2011 16,805 1,534.7 91,322 2.8%
6/30/2010 16,775 1,490.1 88,828 4.4%
6/30/2009 16,951 1,442.5 85,097 5.2%
6/30/2008 16,626 1,344.9 80,889 5.6%
6/30/2007 16,099 1,233.7 76,632 2.8%
9/30/2006 15,718 1,172.0 74,562 3.5%
WSPRS Plan 1
Valuation Date Active Members Annual Payroll in Millions Average Annual PayAnnualized % Increase
in Average Pay
6/30/2015 560 $ 48.5 $ 86,535 2.0%
6/30/2014 609 51.6 84,804 4.1%
6/30/2013 657 53.5 81,465 1.5%
6/30/2012 712 57.1 80,263 0.4%
6/30/2011 767 61.3 79,983 (0.3)%
6/30/2010 806 64.6 80,197 0.1%
6/30/2009 830 66.5 80,115 4.4%
6/30/2008 851 65.3 76,751 6.7%
6/30/2007 885 63.6 71,907 3.3%
9/30/2006 906 63.1 69,606 6.7%

Comprehensive Annual Financial Report — Actuarial Section s DRS 147
Averages are based on actual amounts, not rounded amounts.
Source: Washington State Office of the State Actuary
Schedule of Active Member Valuation Data (cont.)
WSPRS Plan 2
Valuation Date Active Members Annual Payroll in Millions Average Annual PayAnnualized % Increase
in Average Pay
6/30/2015 475 $ 33.4 $ 70,238 1.5%
6/30/2014 435 30.1 69,226 6.4%
6/30/2013 409 2.6 65,058 (0.2)%
6/30/2012 354 23.1 65,165 1.7%
6/30/2011 315 20.2 64,103 0.7%
6/30/2010 281 17.9 63,660 1.7%
6/30/2009 264 16.5 62,583 9.3%
6/30/2008 234 13.4 57,233 5.7%
6/30/2007 152 8.2 54,162 3.6%
9/30/2006 116 6.1 52,278 8.3%
JRS
Valuation Date Active Members Annual Payroll in Millions Average Annual PayAnnualized % Increase
in Average Pay
6/30/2015 – $ – $ – n/a
6/30/2014 – – – n/a
6/30/2013 – – – (100.0)%
6/30/2012 2 0.3 148,832 (3.3)%
6/30/2011 3 0.5 153,962 1.4%
6/30/2010 5 0.8 151,908 0.7%
6/30/2009 9 1.4 150,870 6.0%
6/30/2008 10 1.4 142,328 5.9%
6/30/2007 11 1.5 134,386 2.2%
9/30/2006 11 1.4 131,436 3.0%

148 DRS s Actuarial Section — Comprehensive Annual Financial Report
Schedule of Retirees and Beneficiaries Added to and Removed from Rolls
PERS Plan 1Added to Rolls Removed from Rolls Rolls — End of Year
Year Ended Number
Annual Allowances Number
Annual Allowances Number
Annual Allowances
Average Annual
Allowance% Increase in
Annual Allowance
6/30/2015 1,427 $ 34,495,824 2,227 $ 36,970,754 50,270 $ 1,186,941,835 $ 23,611 0.3%
6/30/2014 1,446 36,218,524 2,236 36,578,459 51,070 1,183,089,117 23,166 0.5%
6/30/2013 1,596 40,451,809 2,408 38,081,771 51,860 1,177,115,047 22,698 0.7%
6/30/2012 1,643 42,344,185 2,235 33,066,677 52,672 1,169,187,194 22,198 1.5%
6/30/2011 1,829 49,678,585 2,307 31,131,283 53,264 1,151,599,650 21,621 3.6%
6/30/2010 1,891 48,714,779 2,296 30,635,880 53,742 1,112,108,596 20,693 3.5%
6/30/2009 1,824 47,679,971 2,258 28,065,463 54,147 1,073,997,138 19,835 3.7%
6/30/2008 2,138 54,916,521 2,243 27,122,179 54,581 1,035,876,249 18,979 4.6%
6/30/2007 1,555 41,444,329 1,703 19,287,556 54,686 989,949,533 18,102 2.5%
9/30/2006 2,345 58,991,956 2,306 25,314,598 54,834 966,044,139 17,618 5.3%
PERS Plan 2Added to Rolls Removed from Rolls Rolls — End of Year
Year Ended Number
Annual Allowances Number
Annual Allowances Number
Annual Allowances
Average Annual
Allowance% Increase in
Annual Allowance
6/30/2015 4,388 $ 96,222,376 837 $ 10,807,578 38,693 $ 666,289,799 $ 17,220 16.2%
6/30/2014 4,500 98,401,222 687 8,476,109 35,142 573,268,436 16,313 21.5%
6/30/2013 4,167 82,479,614 658 7,214,843 31,329 472,011,858 15,066 22.1%
6/30/2012 3,685 67,895,490 576 5,893,503 27,820 386,547,451 13,895 20.6%
6/30/2011 3,206 59,754,016 538 5,248,298 24,711 320,615,736 12,975 23.2%
6/30/2010 2,732 45,416,589 479 4,302,408 22,043 260,152,502 11,802 21.8%
6/30/2009 2,461 37,668,755 469 3,848,756 19,790 213,544,944 10,791 22.0%
6/30/2008 2,215 27,458,079 376 2,944,525 17,798 175,102,432 9,838 19.4%
6/30/2007 1,363 16,027,735 285 2,398,926 15,959 146,703,879 9,193 10.3%
9/30/2006 1,753 19,273,543 343 2,418,970 14,881 132,989,872 8,937 17.9%
PERS Plan 3Added to Rolls Removed from Rolls Rolls — End of Year
Year Ended Number
Annual Allowances Number
Annual Allowances Number
Annual Allowances
Average Annual
Allowance% Increase in
Annual Allowance
6/30/2015 581 $ 6,525,449 29 $ 179,408 3,186 $ 31,459,343 $ 9,874 26.8%
6/30/2014 527 5,973,884 32 179,191 2,634 24,801,688 9,416 33.6%
6/30/2013 414 4,231,693 25 175,440 2,139 18,566,461 8,680 31.1%
6/30/2012 377 3,768,015 15 95,645 1,750 14,165,571 8,095 36.6%
6/30/2011 289 2,750,573 15 115,610 1,388 10,366,918 7,469 36.8%
6/30/2010 211 1,847,618 17 105,335 1,114 7,575,590 6,800 33.1%
6/30/2009 188 1,431,296 11 68,324 920 5,691,504 6,186 34.6%
6/30/2008 153 973,585 9 39,824 743 4,227,474 5,690 31.2%
6/30/2007 120 767,458 7 36,995 599 3,222,482 5,380 29.4%
9/30/2006 149 788,987 6 28,021 486 2,490,907 5,125 48.2%

Comprehensive Annual Financial Report — Actuarial Section s DRS 149
Schedule of Retirees and Beneficiaries Added to and Removed from Rolls (cont.)
1 PSERS 2 became effective July 1, 2006.
SERS Plan 2Added to Rolls Removed from Rolls Rolls — End of Year
Year Ended Number
Annual Allowances Number
Annual Allowances Number
Annual Allowances
Average Annual
Allowance% Increase in
Annual Allowance
6/30/2015 865 $ 9,200,978 99 $ 851,704 6,562 $ 65,840,085 $ 10,034 16.1%
6/30/2014 796 8,658,343 84 710,331 5,796 56,703,435 9,783 19.2%
6/30/2013 729 7,922,612 82 669,493 5,084 47,586,513 9,360 21.1%
6/30/2012 685 7,196,654 71 556,280 4,437 39,304,032 8,858 22.0%
6/30/2011 560 5,481,726 48 331,627 3,823 32,224,861 8,429 21.8%
6/30/2010 482 4,325,732 41 339,774 3,311 26,455,961 7,990 20.9%
6/30/2009 454 3,836,380 32 197,969 2,870 21,890,772 7,627 23.0%
6/30/2008 450 3,526,561 28 186,696 2,448 17,799,193 7,271 26.1%
6/30/2007 231 1,721,633 20 112,108 2,026 14,110,609 6,965 13.0%
9/30/2006 410 2,890,809 21 120,279 1,815 12,492,085 6,883 32.2%
SERS Plan 3Added to Rolls Removed from Rolls Rolls — End of Year
Year Ended Number
Annual Allowances Number
Annual Allowances Number
Annual Allowances
Average Annual
Allowance% Increase in
Annual Allowance
6/30/2015 981 $ 6,027,951 56 $ 226,130 5,750 $ 31,328,571 $ 5,448 24.4%
6/30/2014 875 5,235,885 45 185,272 4,825 25,178,188 5,218 28.1%
6/30/2013 803 4,385,800 22 91,177 3,995 19,657,323 4,920 31.1%
6/30/2012 636 3,285,871 27 105,484 3,214 14,992,908 4,665 28.5%
6/30/2011 553 3,038,825 21 73,455 2,605 11,667,747 4,479 37.2%
6/30/2010 332 1,614,718 18 51,140 2,073 8,504,426 4,102 25.6%
6/30/2009 346 1,552,969 12 36,518 1,759 6,768,866 3,848 31.9%
6/30/2008 325 1,370,967 15 57,309 1,425 5,130,021 3,600 37.5%
6/30/2007 178 695,857 6 14,025 1,115 3,730,124 3,345 22.7%
9/30/2006 246 830,604 8 24,025 943 3,040,090 3,224 39.5%
PSERS Plan 21
Added to Rolls Removed from Rolls Rolls — End of Year
Year Ended Number
Annual Allowances Number
Annual Allowances Number
Annual Allowances
Average Annual
Allowance% Increase in
Annual Allowance
6/30/2015 19 $ 141,388 1 $ 4,020 80 $ 466,218 $ 5,828 43.2%
6/30/2014 19 137,777 – – 62 325,492 5,250 76.0%
6/30/2013 16 98,050 – – 43 184,938 4,301 116.0%
6/30/2012 12 46,142 – – 27 85,628 3,171 117.6%
6/30/2011 8 25,844 – – 15 39,355 2,624 192.3%
6/30/2010 5 10,383 – – 7 13,645 1,924 339.7%
6/30/2009 1 2,409 – – 2 3,062 1,531 368.9%
6/30/2008 1 653 – – 1 653 653 0.0%
6/30/2007 – – – – – – – n/a
9/30/2006 – – – – – – – n/a

150 DRS s Actuarial Section — Comprehensive Annual Financial Report
Schedule of Retirees and Beneficiaries Added to and Removed from Rolls (cont.)
TRS Plan 1Added to Rolls Removed from Rolls Rolls — End of Year
Year Ended Number
Annual Allowances Number
Annual Allowances Number
Annual Allowances
Average Annual
Allowance% Increase in
Annual Allowance
6/30/2015 745 $ 23,336,449 1,145 $ 22,271,095 35,239 $ 897,354,684 $ 25,465 0.3%
6/30/2014 834 27,345,364 1,107 21,680,225 35,639 894,749,810 25,106 0.8%
6/30/2013 889 28,516,769 1,031 19,814,149 35,912 887,718,032 24,719 1.2%
6/30/2012 1,007 32,011,915 1,071 19,959,639 36,054 877,408,017 24,336 1.6%
6/30/2011 1,161 37,444,310 1,058 18,622,578 36,118 863,605,633 23,911 4.0%
6/30/2010 947 27,363,548 964 16,376,709 36,015 829,998,363 23,046 3.2%
6/30/2009 1,193 33,860,034 1,040 16,463,852 36,032 804,572,786 22,329 3.9%
6/30/2008 1,564 43,927,319 1,069 16,443,154 35,879 774,340,924 21,582 5.2%
6/30/2007 370 6,636,490 731 11,088,213 35,384 735,750,464 20,793 (0.7)%
9/30/2006 1,522 41,976,669 1,041 15,570,734 35,745 740,789,520 20,724 5.1%
TRS Plan 2Added to Rolls Removed from Rolls Rolls — End of Year
Year Ended Number
Annual Allowances Number
Annual Allowances Number
Annual Allowances
Average Annual
Allowance% Increase in
Annual Allowance
6/30/2015 452 $ 11,891,498 41 $ 703,305 4,305 $ 92,291,775 $ 21,438 15.4%
6/30/2014 493 12,353,083 44 699,410 3,894 79,974,743 20,538 20.0%
6/30/2013 422 10,037,156 37 626,458 3,445 66,622,927 19,339 19.6%
6/30/2012 424 9,371,702 21 336,553 3,060 55,682,494 18,197 20.8%
6/30/2011 362 7,470,573 25 307,667 2,657 46,085,043 17,345 21.3%
6/30/2010 249 5,208,999 33 383,886 2,320 37,984,977 16,373 17.7%
6/30/2009 246 4,939,050 21 265,215 2,104 32,273,082 15,339 20.2%
6/30/2008 244 4,076,287 29 323,867 1,879 26,844,925 14,287 19.5%
6/30/2007 105 1,426,931 15 141,168 1,664 22,470,949 13,504 6.2%
9/30/2006 239 3,646,802 16 140,601 1,574 21,157,013 13,442 23.5%
TRS Plan 3Added to Rolls Removed from Rolls Rolls — End of Year
Year Ended Number
Annual Allowances Number
Annual Allowances Number
Annual Allowances
Average Annual
Allowance% Increase in
Annual Allowance
6/30/2015 1,411 $ 20,685,113 52 $ 518,497 7,453 $ 93,089,105 $ 12,490 29.4%
6/30/2014 1,271 18,346,307 40 361,104 6,094 71,957,258 11,808 36.5%
6/30/2013 1,083 13,777,247 24 234,999 4,863 52,704,816 10,838 38.0%
6/30/2012 896 10,668,293 26 207,788 3,804 38,191,899 10,040 39.3%
6/30/2011 714 8,168,048 15 132,216 2,934 27,425,422 9,347 44.5%
6/30/2010 454 4,632,283 10 73,282 2,235 18,983,833 8,494 34.9%
6/30/2009 408 4,058,520 9 60,319 1,791 14,073,479 7,858 43.2%
6/30/2008 360 3,056,652 11 78,741 1,392 9,828,264 7,061 47.1%
6/30/2007 115 826,838 5 17,533 1,043 6,680,207 6,405 13.9%
9/30/2006 233 1,707,380 6 34,323 933 5,863,113 6,284 44.0%

Comprehensive Annual Financial Report — Actuarial Section s DRS 151
Schedule of Retirees and Beneficiaries Added to and Removed from Rolls (cont.)
LEOFF Plan 1Added to Rolls Removed from Rolls Rolls — End of Year
Year Ended Number
Annual Allowances Number
Annual Allowances Number
Annual Allowances
Average Annual
Allowance% Increase in
Annual Allowance
6/30/2015 153 $ 8,756,563 251 $ 10,586,867 7,507 $ 361,094,205 $ 48,101 1.4%
6/30/2014 124 6,809,466 248 10,922,714 7,605 356,280,207 46,848 0.0%
6/30/2013 146 7,890,561 262 10,485,897 7,729 356,229,923 46,090 1.7%
6/30/2012 162 9,325,170 249 9,732,437 7,845 350,199,616 44,640 3.0%
6/30/2011 136 7,331,503 212 8,121,870 7,932 340,160,704 42,885 0.5%
6/30/2010 167 9,065,821 246 9,545,410 8,008 338,503,613 42,271 0.3%
6/30/2009 156 8,226,656 203 7,267,042 8,087 337,505,287 41,734 4.7%
6/30/2008 189 9,377,706 216 7,617,139 8,134 322,365,013 39,632 4.3%
6/30/2007 153 7,238,334 164 5,380,231 8,161 309,181,019 37,885 4.2%
9/30/2006 229 10,517,551 206 6,565,445 8,172 296,662,837 36,302 4.2%
LEOFF Plan 2Added to Rolls Removed from Rolls Rolls — End of Year
Year Ended Number
Annual Allowances Number
Annual Allowances Number
Annual Allowances
Average Annual
Allowance% Increase in
Annual Allowance
6/30/2015 497 $ 25,745,170 22 $ 891,857 3,710 $ 157,094,929 $ 42,344 20.4%
6/30/2014 478 23,448,749 25 779,746 3,235 130,428,517 40,318 24.0%
6/30/2013 457 21,512,439 19 571,580 2,782 105,193,996 37,812 28.5%
6/30/2012 355 16,447,618 26 705,284 2,344 81,874,896 34,930 25.1%
6/30/2011 389 15,718,562 13 333,059 2,015 65,459,659 32,486 33.8%
6/30/2010 285 10,278,954 13 332,332 1,639 48,926,257 29,851 29.2%
6/30/2009 243 8,478,268 10 216,179 1,367 37,876,404 27,708 31.0%
6/30/2008 227 6,985,801 17 279,908 1,134 28,904,921 25,489 33.7%
6/30/2007 153 4,353,299 8 144,930 924 21,611,590 23,389 24.3%
9/30/2006 211 5,655,854 6 89,270 779 17,388,315 22,321 51.4%
WSPRS Plan 1Added to Rolls Removed from Rolls Rolls — End of Year
Year Ended Number
Annual Allowances Number
Annual Allowances Number
Annual Allowances
Average Annual
Allowance% Increase in
Annual Allowance
6/30/2015 60 $ 2,780,816 23 $ 781,775 1,033 $ 50,674,128 $ 49,055 5.9%
6/30/2014 51 2,304,665 19 597,779 996 47,829,447 48,022 6.5%
6/30/2013 67 3,124,867 18 587,613 964 44,897,586 46,574 9.1%
6/30/2012 59 2,674,231 19 715,514 915 41,147,922 44,970 6.6%
6/30/2011 42 1,918,898 18 476,475 875 38,597,849 44,112 5.1%
6/30/2010 33 1,549,594 16 489,562 851 36,718,045 43,147 6.0%
6/30/2009 15 710,502 12 377,080 834 34,636,899 41,531 4.0%
6/30/2008 28 1,152,618 18 541,668 831 33,303,079 40,076 4.8%
6/30/2007 22 801,594 9 182,796 821 31,779,147 38,708 2.1%
9/30/2006 28 1,101,085 12 321,334 808 31,134,976 38,533 6.3%

152 DRS s Actuarial Section — Comprehensive Annual Financial Report
JRFAdded to Rolls Removed from Rolls Rolls — End of Year
Year Ended Number
Annual Allowances Number
Annual Allowances Number
Annual Allowances
Average Annual
Allowance% Increase in
Annual Allowance
6/30/2015 – $ – – $ – 12 $ 444,282 $ 37,024 0.0%
6/30/2014 – – – – 12 444,282 37,024 0.0%
6/30/2013 – – – – 12 444,282 37,024 (7.7)%
6/30/2012 – – 1 18,329 12 481,389 40,116 (3.7)%
6/30/2011 – – – – 13 499,719 38,440 0.0%
6/30/2010 – – – – 13 499,719 38,440 0.0%
6/30/2009 – – – – 13 499,719 38,440 0.0%
6/30/2008 – – 2 – 13 499,719 38,440 (13.6)%
6/30/2007 – – – 75,233 15 578,135 38,542 0.0%
9/30/2006 1 18,033 2 75,234 15 578,135 38,542 (9.0)%
Schedule of Retirees and Beneficiaries Added to and Removed from Rolls (cont.)
Source: Washington State Office of the State Actuary
JRSAdded to Rolls Removed from Rolls Rolls — End of Year
Year Ended Number
Annual Allowances Number
Annual Allowances Number
Annual Allowances
Average Annual
Allowance% Increase in
Annual Allowance
6/30/2015 3 $ 166,803 5 $ 414,930 106 $ 9,185,874 $ 86,659 (1.3)%
6/30/2014 – – 6 366,825 108 9,308,919 86,194 (1.4)%
6/30/2013 7 476,184 12 877,160 114 9,440,927 82,815 (1.5)%
6/30/2012 4 317,799 9 670,577 119 9,584,381 80,541 (1.7)%
6/30/2011 4 285,689 5 400,572 124 9,745,840 78,595 0.1%
6/30/2010 10 700,776 9 626,362 125 9,733,805 77,870 3.5%
6/30/2009 4 276,433 7 497,241 124 9,401,392 75,818 0.4%
6/30/2008 4 267,383 7 374,274 127 9,359,660 73,698 1.7%
6/30/2007 3 160,260 5 392,686 130 9,201,726 70,783 (2.5)%
9/30/2006 6 385,845 5 376,793 132 9,434,152 71,471 3.0%

Comprehensive Annual Financial Report — Actuarial Section s DRS 153
Solvency Tests
PERS Plan 1Dollars in Millions
Accrued Liabilities (Entry Age Cost Method) Portion of Accrued Liabilities Covered by Assets
Valuation Date
(1) Active Member
Contributions
(2) Inactive Member Liability
(3) Excess Accrued Liability
(1+2+3) Total Accrued
LiabilityValuation
Assets
(1) Active Member
Contributions
(2) Inactive Member Liability
(3) Excess Accrued Liability
6/30/2015 $ 513.7 $ 11,439.9 $ 599.9 $ 12,553.5 $ 7,314.9 100% 59% 0%
6/30/2014 589.2 11,387.8 743.3 12,720.4 7,761.5 100% 63% 0%
6/30/2013 662.6 11,371.1 613.4 12,647.1 8,053.1 100% 65% 0%
6/30/2012 740.8 10,685.6 707.0 12,133.4 8,520.6 100% 73% 0%
6/30/2011 818.7 10,677.5 852.1 12,348.4 8,883.4 100% 76% 0%
6/30/2010 912.6 10,232.0 1,096.0 12,240.7 9,293.0 100% 82% 0%
6/30/2009 989.9 11,269.4 1,703.2 13,962.6 9,775.6 100% 78% 0%
6/30/2008 1,055.8 10,963.4 1,881.7 13,901.0 9,852.9 100% 80% 0%
6/30/2007 1,120.4 10,575.9 2,044.2 13,740.5 9,715.5 100% 81% 0%
9/30/2006 1,186.4 9,473.0 2,470.1 13,129.4 9,591.0 100% 89% 0%
PERS Plan 2/3Dollars in Millions
Accrued Liabilities (Entry Age Cost Method) Portion of Accrued Liabilities Covered by Assets
Valuation Date
(1) Active Member
Contributions
(2) Inactive Member Liability
(3) Excess Accrued Liability
(1+2+3) Total Accrued
LiabilityValuation
Assets
(1) Active Member
Contributions
(2) Inactive Member Liability
(3) Excess Accrued Liability
6/30/2015 $ 4,596.6 $ 11,541.9 $ 12,153.8 $ 28,282.3 $ 28,292.3 100% 100% 100%
6/30/2014 4,357.1 9,925.2 12,104.0 26,386.3 26,386.3 100% 100% 100%
6/30/2013 4,121.6 8,388.8 11,824.2 24,334.6 24,334.6 100% 100% 100%
6/30/2012 3,878.2 6,710.3 12,064.0 22,652.6 22,652.6 100% 100% 100%
6/30/2011 3,605.7 5,756.8 11,634.2 20,996.7 20,996.7 100% 100% 100%
6/30/2010 3,388.0 4,753.4 11,332.7 19,474.1 19,474.1 100% 100% 100%
6/30/2009 3,132.0 4,038.0 11,090.4 18,260.4 18,260.4 100% 100% 100%
6/30/2008 2,760.9 3,447.1 10,484.7 16,692.7 16,692.7 100% 100% 100%
6/30/2007 2,464.6 2,966.5 9,456.7 14,887.9 14,887.9 100% 100% 100%
9/30/2006 2,294.7 2,470.0 8,764.2 13,528.9 13,528.9 100% 100% 100%
SERS Plan 2/3Dollars in Millions
Accrued Liabilities (Entry Age Cost Method) Portion of Accrued Liabilities Covered by Assets
Valuation Date
(1) Active Member
Contributions
(2) Inactive Member Liability
(3) Excess Accrued Liability
(1+2+3) Total Accrued
LiabilityValuation
Assets
(1) Active Member
Contributions
(2) Inactive Member Liability
(3) Excess Accrued Liability
6/30/2015 $ 347.4 $ 1,751.4 $ 1,801.8 $ 3,900.6 $ 3,900.6 100% 100% 100%
6/30/2014 328.0 1,492.9 1,803.0 3,623.8 3,623.8 100% 100% 100%
6/30/2013 309.2 1,267.1 1,758.3 3,334.6 3,334.6 100% 100% 100%
6/30/2012 295.3 1,018.0 1,787.0 3,100.3 3,100.3 100% 100% 100%
6/30/2011 279.8 862.1 1,730.3 2,872.1 2,872.1 100% 100% 100%
6/30/2010 266.2 713.8 1,684.1 2,664.1 2,664.1 100% 100% 100%
6/30/2009 251.5 613.7 1,637.9 2,503.2 2,503.2 100% 100% 100%
6/30/2008 226.5 523.7 1,552.4 2,302.6 2,302.6 100% 100% 100%
6/30/2007 207.1 431.4 1,494.9 2,133.4 2,133.4 100% 100% 100%
9/30/2006 188.7 350.1 1,395.5 1,934.3 1,934.3 100% 100% 100%

154 DRS s Actuarial Section — Comprehensive Annual Financial Report
Solvency Tests (cont.)
PSERS Plan 2Dollars in Millions
Accrued Liabilities (Entry Age Cost Method) Portion of Accrued Liabilities Covered by Assets
Valuation Date
(1) Active Member
Contributions
(2) Inactive Member Liability
(3) Excess Accrued Liability
(1+2+3) Total Accrued
LiabilityValuation
Assets
(1) Active Member
Contributions
(2) Inactive Member Liability
(3) Excess Accrued Liability
6/30/2015 $ 128.4 $ 29.5 $ 180.1 $ 337.9 $ 337.9 100% 100% 100%
6/30/2014 109.5 21.5 147.2 278.2 278.2 100% 100% 100%
6/30/2013 92.5 14.7 117.1 224.2 224.2 100% 100% 100%
6/30/2012 76.5 9.2 94.8 180.5 180.5 100% 100% 100%
6/30/2011 62.0 6.1 72.6 140.7 140.7 100% 100% 100%
6/30/2010 46.9 4.2 51.7 102.9 102.9 100% 100% 100%
6/30/2009 32.4 2.0 34.8 69.2 69.2 100% 100% 100%
6/30/2008 18.1 0.9 19.7 38.7 38.7 100% 100% 100%
6/30/2007 6.7 0.2 6.9 13.7 13.7 100% 100% 100%
9/30/2006 0.6 0.0 0.5 1.1 1.1 100% 100% 100%
TRS Plan 1Dollars in Millions
Accrued Liabilities (Entry Age Cost Method) Portion of Accrued Liabilities Covered by Assets
Valuation Date
(1) Active Member
Contributions
(2) Inactive Member Liability
(3) Excess Accrued Liability
(1+2+3) Total Accrued
LiabilityValuation
Assets
(1) Active Member
Contributions
(2) Inactive Member Liability
(3) Excess Accrued Liability
6/30/2015 $ 277.0 $ 8,562.6 $ 268.0 $ 9,107.5 $ 5,870.5 100% 65% 0%
6/30/2014 347.4 8,530.4 372.3 9,250.1 6,352.8 100% 70% 0%
6/30/2013 433.7 8,511.5 441.0 9,386.1 6,717.1 100% 74% 0%
6/30/2012 509.9 7,952.4 534.4 8,996.7 7,144.5 100% 83% 0%
6/30/2011 598.1 7,934.2 662.4 9,194.7 7,485.0 100% 87% 0%
6/30/2010 663.6 7,586.5 870.0 9,120.0 7,791.3 100% 94% 0%
6/30/2009 725.6 8,821.7 1,264.8 10,812.1 8,146.2 100% 84% 0%
6/30/2008 790.2 8,564.6 1,399.1 10,753.9 8,262.3 100% 87% 0%
6/30/2007 766.4 8,670.1 1,389.0 10,825.6 8,302.3 100% 87% 0%
9/30/2006 839.3 7,831.8 1,687.5 10,358.6 8,275.5 100% 95% 0%
TRS Plan 2/3Dollars in Millions
Accrued Liabilities (Entry Age Cost Method) Portion of Accrued Liabilities Covered by Assets
Valuation Date
(1) Active Member
Contributions
(2) Inactive Member Liability
(3) Excess Accrued Liability
(1+2+3) Total Accrued
LiabilityValuation
Assets
(1) Active Member
Contributions
(2) Inactive Member Liability
(3) Excess Accrued Liability
6/30/2015 $ 474.6 $ 3,443.8 $ 6,034.4 $ 9,952.8 $ 9,952.8 100% 100% 100%
6/30/2014 448.5 2,858.6 5,885.9 9,193.0 9,193.0 100% 100% 100%
6/30/2013 424.4 2,335.8 5,645.8 8,406.1 8,406.1 100% 100% 100%
6/30/2012 402.9 1,831.7 5,523.4 7,757.9 7,757.9 100% 100% 100%
6/30/2011 382.6 1,516.3 5,241.7 7,140.6 7,140.6 100% 100% 100%
6/30/2010 366.3 1,224.5 5,002.5 6,593.3 6,593.3 100% 100% 100%
6/30/2009 349.7 1,032.2 4,778.1 6,160.0 6,160.0 100% 100% 100%
6/30/2008 322.2 883.1 4,475.8 5,681.0 5,681.0 100% 100% 100%
6/30/2007 302.6 790.8 4,183.7 5,277.0 5,277.0 100% 100% 100%
9/30/2006 285.5 653.4 3,896.4 4,835.3 4,835.3 100% 100% 100%

Comprehensive Annual Financial Report — Actuarial Section s DRS 155
Solvency Tests (cont.)
LEOFF Plan 1Dollars in Millions
Accrued Liabilities (Entry Age Cost Method) Portion of Accrued Liabilities Covered by Assets
Valuation Date
(1) Active Member
Contributions
(2) Inactive Member Liability
(3) Excess Accrued Liability
(1+2+3) Total Accrued
LiabilityValuation
Assets
(1) Active Member
Contributions
(2) Inactive Member Liability
(3) Excess Accrued Liability
6/30/2015 $ 16.8 $ 4,212.1 $ 78.2 $ 4,307.1 $ 5,403.6 100% 100% 100%
6/30/2014 23.4 4,188.6 110.6 4,322.6 5,499.3 100% 100% 100%
6/30/2013 27.1 4,254.5 119.4 4,401.0 5,516.4 100% 100% 100%
6/30/2012 33.5 3,945.9 134.5 4,113.9 5,561.6 100% 100% 100%
6/30/2011 43.3 3,898.6 196.2 4,138.0 5,565.3 100% 100% 100%
6/30/2010 49.5 4,090.6 245.9 4,386.0 5,560.9 100% 100% 100%
6/30/2009 55.4 4,149.8 281.2 4,486.5 5,612.1 100% 100% 100%
6/30/2008 62.3 3,997.4 308.0 4,367.7 5,592.5 100% 100% 100%
6/30/2007 72.4 3,916.3 351.5 4,340.2 5,297.7 100% 100% 100%
9/30/2006 80.7 3,826.1 402.1 4,309.0 5,017.8 100% 100% 100%
LEOFF Plan 2Dollars in Millions
Accrued Liabilities (Entry Age Cost Method) Portion of Accrued Liabilities Covered by Assets
Valuation Date
(1) Active Member
Contributions
(2) Inactive Member Liability
(3) Excess Accrued Liability
(1+2+3) Total Accrued
LiabilityValuation
Assets
(1) Active Member
Contributions
(2) Inactive Member Liability
(3) Excess Accrued Liability
6/30/2015 $ 2,311.3 $ 2,746.8 $ 4,262.0 $ 9,320.2 $ 9,320.2 100% 100% 100%
6/30/2014 2,179.6 2,287.3 4,171.1 8,637.9 8,637.9 100% 100% 100%
6/30/2013 2,054.4 1,862.4 3,945.5 7,862.3 7,862.3 100% 100% 100%
6/30/2012 1,925.9 1,427.7 3,868.3 7,221.9 7,221.9 100% 100% 100%
6/30/2011 1,782.2 1,166.1 3,672.3 6,620.7 6,620.7 100% 100% 100%
6/30/2010 1,615.0 924.7 3,503.0 6,042.7 6,042.7 100% 100% 100%
6/30/2009 1,479.5 682..5 3,402.1 5,564.2 5,564.2 100% 100% 100%
6/30/2008 1,319.7 547.5 3,185.5 5,052.7 5,052.7 100% 100% 100%
6/30/2007 1,178.3 451.7 2,729.6 4,359.6 4,359.6 100% 100% 100%
9/30/2006 1,087.8 355.6 2,400.3 3,843.8 3,843.8 100% 100% 100%
WSPRS Plan 1/2Dollars in Millions
Accrued Liabilities (Entry Age Cost Method) Portion of Accrued Liabilities Covered by Assets
Valuation Date
(1) Active Member
Contributions
(2) Inactive Member Liability
(3) Excess Accrued Liability
(1+2+3) Total Accrued
LiabilityValuation
Assets
(1) Active Member
Contributions
(2) Inactive Member Liability
(3) Excess Accrued Liability
6/30/2015 $ 75.5 $ 752.0 $ 239.6 $ 1,067.1 $ 1,067.1 100% 100% 100%
6/30/2014 74.1 703.2 266.9 1,044.2 1,044.2 100% 100% 100%
6/30/2013 71.6 663.3 274.4 1,009.4 1,009.4 100% 100% 100%
6/30/2012 70.8 576.1 334.9 981.7 981.7 100% 100% 100%
6/30/2011 69.0 541.2 339.3 949.5 949.5 100% 100% 100%
6/30/2010 66.4 496.5 356.7 919.6 919.6 100% 100% 100%
6/30/2009 62.4 474.5 363.5 900.4 900.4 100% 100% 100%
6/30/2008 56.0 460.5 353.2 869.7 869.7 100% 100% 100%
6/30/2007 50.8 444.2 304.9 799.9 799.9 100% 100% 100%
9/30/2006 48.7 413.3 281.5 743.5 743.5 100% 100% 100%

156 DRS s Actuarial Section — Comprehensive Annual Financial Report
Solvency Tests (cont.)
1 JRS and JRF are financed on a pay-as-you-go basis from a combination of investment earnings and funding from the state.
Totals might not agree due to rounding, and percentages are based on actual, not rounded, totals.
PERS Plan 2/3, SERS Plan 2/3, PSERS Plan 2, TRS Plan 2/3, LEOFF Plan 2 and WSPRS Plan 1/2: The actuarial liability (AAL) presented in these charts reflects the actual actuarial valuation method (Aggregate Cost) used to calculate the annual required contributions for these plans. This Aggregate Actuarial Cost Method doesn’t separately amortize unfunded actuarial liabilities and, by definition, sets the accrued liabilities equal to the assets. Therefore, the funded status is always 100%. These AAL amounts differ from those presented in the schedules of funded status and funding progress included within the Actuarial Section, where a different valuation method (Entry Age) is used as a surrogate.
Source: Office of the State Actuary
JRS1
Dollars in Millions
Accrued Liabilities (Entry Age Cost Method) Portion of Accrued Liabilities Covered by Assets
Valuation Date
(1) Active Member
Contributions
(2) Inactive Member Liability
(3) Excess Accrued Liability
(1+2+3) Total Accrued
LiabilityValuation
Assets
(1) Active Member
Contributions
(2) Inactive Member Liability
(3) Excess Accrued Liability
6/30/2015 $ – $ 100.3 $ – $ 100.3 $ 6.3 n/a 6% n/a
6/30/2014 – 105.0 – 105.0 5.0 n/a 5% n/a
6/30/2013 – 108.2 – 108.2 3.9 n/a 4% n/a
6/30/2012 1.0 100.4 2.5 103.9 3.5 100% 2% 0%
6/30/2011 1.5 104.3 3.6 109.3 5.1 100% 3% 0%
6/30/2010 2.2 78.5 3.1 83.8 3.8 100% 2% 0%
6/30/2009 3.7 76.1 9.5 89.3 1.8 50% 0% 0%
6/30/2008 3.7 78.2 9.7 91.5 1.0 26% 0% 0%
6/30/2007 3.7 75.3 6.0 85.0 0.5 15% 0% 0%
9/30/2006 3.5 78.7 5.8 88.0 0.3 7% 0% 0%
JRF1
Dollars in Millions
Accrued Liabilities (Entry Age Cost Method) Portion of Accrued Liabilities Covered by Assets
Valuation Date
(1) Active Member
Contributions
(2) Inactive Member Liability
(3) Excess Accrued Liability
(1+2+3) Total Accrued
LiabilityValuation
Assets
(1) Active Member
Contributions
(2) Inactive Member Liability
(3) Excess Accrued Liability
6/30/2015 $ – $ 3.1 $ – $ 3.1 $ 0.5 n/a 16% n/a
6/30/2014 – 3.3 – 3.3 1.0 n/a 29% n/a
6/30/2013 – 3.5 – 3.5 1.4 n/a 40% n/a
6/30/2012 – 3.6 – 3.6 1.9 n/a 52% n/a
6/30/2011 – 3.9 – 3.9 2.3 n/a 61% n/a
6/30/2010 – 3.2 – 3.2 2.8 n/a 87% n/a
6/30/2009 – 3.4 – 3.4 3.3 n/a 97% n/a
6/30/2008 – 3.5 – 3.5 3.6 n/a 100% n/a
6/30/2007 – 3.9 – 3.9 4.0 n/a 100% n/a
9/30/2006 – 4.0 – 4.0 4.1 n/a 100% n/a

Comprehensive Annual Financial Report — Actuarial Section s DRS 157
Analysis of Selected Experience
PERS Plan 1: Selected Gains and Losses During Fiscal Years Ended June 30, 2006–2015Resulting from Differences Between Assumed Experience and Actual Experience — Dollars in Millions
$ Gain (or Loss) for Year
Type of Activity 2015 2014 2013 2012 2011 2010 2009 2008 2007 2006
Investment Gains1 $ (447.8) $ (308.7) $ (417.4) $ (340.4) $ (397.7) $ (668.0) $ (298.2) $ 151.6 $ 186.0 $ 5.6
Salary Gains 10.5 (1.4) 25.8 47.9 59.9 54.2 10.9 (59.2) 30.7 (7.6)
Termination of Employment
0.2 (0.3) 1.1 0.5 0.1 1.2 (0.2) (0.4) 7.2 6.1
Return to Work from Terminated Status
(2.6) (3.9) (2.8) (3.2) (6.4) (8.0) (9.7) (49.1) (14.4) (25.1)
Gain (or Loss) During Year from Selected Experience
$ (439.7) $ (314.3) $ (393.3) $ (295.2) $ (344.1) $ (620.6) $ (297.2) $ 42.9 $ 209.5 $ (21.0)
1 Actuarial value of assets
PERS Plan 2/3: Selected Gains and Losses During Fiscal Years Ended June 30, 2006–2015Resulting from Differences Between Assumed Experience and Actual Experience — Dollars in Millions
$ Gain (or Loss) for Year
Type of Activity 2015 2014 2013 2012 2011 2010 2009 2008 2007 2006
Investment Gains1 $ (591.8) $ (323.2) $ (302.6) $ (295.6) $ (404.3) $ (619.2) $ (134.3) $ 273.4 $ 327.6 $ 97.0
Salary Gains 331.5 60.7 481.1 663.9 731.7 577.8 185.9 (326.1) 124.2 12.1
Termination of Employment
192.2 116.6 131.8 129.3 118.3 18.0 21.1 47.8 131.1 155.5
Return to Work from Terminated Status
(68.1) (64.7) (66.3) (58.3) (44.1) (50.2) (47.8) (97.1) (86.8) (92.6)
Gain (or Loss) During Year from Selected Experience
$ (136.2) $ (210.6) $ 244.0 $ 439.3 $ 401.6 $ (73.6) $ 24.9 $ (102.0) $ 496.1 $ 172.0
SERS Plan 2/3: Selected Gains and Losses During Fiscal Years Ended June 30, 2006–2015Resulting from Differences Between Assumed Experience and Actual Experience — Dollars in Millions
$ Gain (or Loss) for Year
Type of Activity 2015 2014 2013 2012 2011 2010 2009 2008 2007 2006
Investment Gains1 $ (96.2) $ (64.0) $ (66.4) $ (69.6) $ (80.5) $ (115.1) $ (33.2) $ 39.1 $ 46.3 $ 11.3
Salary Gains (7.1) 9.1 53.1 94.1 75.1 84.5 (27.4) (27.5) 9.6 23.8
Termination of Employment
30.9 27.0 18.0 20.3 8.3 3.1 5.8 11.0 16.1 11.7
Return to Work from Terminated Status
(8.9) (6.5) (4.7) (3.5) (5.2) (5.5) (6.2) (8.4) (74.3) (27.1)
Gain (or Loss) During Year from Selected Experience
$ (81.3) $ (34.4) $ – $ 41.3 $ (2.3) $ (33.0) $ (61.0) $ 14.2 $ (2.3) $ 19.7

158 DRS s Actuarial Section — Comprehensive Annual Financial Report
Analysis of Selected Experience (cont.)
PSERS Plan 2: Selected Gains and Losses During Fiscal Years Ended June 30, 2006–2015Resulting from Differences Between Assumed Experience and Actual Experience — Dollars in Millions
$ Gain (or Loss) for Year
Type of Activity 2015 2014 2013 2012 2011 2010 2009 2008 2007 20062
Investment Gains1 $ 0.8 $ 1.3 $ 0.8 $ (0.4) $ 0.4 $ (1.2) $ 0.4 $ (0.3) $ – $ –
Salary Gains 5.3 6.1 14.1 17.7 14.9 10.3 8.5 (5.1) 1.3 –
Termination of Employment
9.8 6.9 3.7 7.7 4.2 4.7 (7.4) 0.4 (1.0) –
Return to Work from Terminated Status
(2.5) (0.5) (0.9) – – – – (0.9) – –
Gain (or Loss) During Year from Selected Experience
$ 13.4 $ 13.8 $ 17.7 $ 25.0 $ 19.5 $ 13.8 $ 1.5 $ (5.9) $ 0.3 $ –
1 Actuarial value of assets
TRS Plan 1: Selected Gains and Losses During Fiscal Years Ended June 30, 2006–2015Resulting from Differences Between Assumed Experience and Actual Experience — Dollars in Millions
$ Gain (or Loss) for Year
Type of Activity 2015 2014 2013 2012 2011 2010 2009 2008 2007 2006
Investment Gains1 $ (414.5) $ (311.3) $ (324.0) $ (262.3) $ (247.3) $ (502.1) $ (287.8) $ 26.1 $ 24.9 $ (111.7)
Salary Gains 11.4 4.4 20.6 45.5 36.5 60.7 (17.4) (28.9) 4.3 45.6
Termination of Employment
(0.3) (0.2) 0.3 (0.3) 0.2 0.9 1.5 0.7 (7.5) 0.8
Return to Work from Terminated Status
(1.0) (0.9) (1.6) (2.2) (4.4) (7.3) (6.0) (23.6) (6.8) (22.9)
Gain (or Loss) During Year from Selected Experience
$ (404.4) $ (308.0) $ (304.7) $ (219.3) $ (215.0) $ (447.8) $ (309.7) $ (25.7) $ 14.9 $ (88.2)
TRS Plan 2/3: Selected Gains and Losses During Fiscal Years Ended June 30, 2006–2015Resulting from Differences Between Assumed Experience and Actual Experience — Dollars in Millions
$ Gain (or Loss) for Year
Type of Activity 2015 2014 2013 2012 2011 2010 2009 2008 2007 2006
Investment Gains1 $ (200.8) $ (120.4) $ (122.3) $ (142.0) $ (180.6) $ (266.8) $ (120.1) $ 66.8 $ 88.5 $ (1.7)
Salary Gains 234.4 148.9 226.6 389.0 252.6 341.3 (67.3) (52.7) 20.6 70.1
Termination of Employment
201.4 152.6 120.7 130.0 85.5 92.9 71.7 54.8 56.5 33.6
Return to Work from Terminated Status
(94.3) (78.0) (56.5) (39.9) (43.7) (37.5) (63.0) (85.4) (139.7) (43.1)
Gain (or Loss) During Year from Selected Experience
$ 140.7 $ 103.1 $ 168.5 $ 337.1 $ 113.8 $ 129.9 $ (178.7) $ (16.5) $ 25.9 $ 58.9
2 PSERS Plan 2 became effective July 1, 2006.

Comprehensive Annual Financial Report — Actuarial Section s DRS 159
Analysis of Selected Experience (cont.)
LEOFF Plan 1: Selected Gains and Losses During Fiscal Years Ended June 30, 2006–2015Resulting from Differences Between Assumed Experience and Actual Experience — Dollars in Millions
$ Gain (or Loss) for Year
Type of Activity 2015 2014 2013 2012 2011 2010 2009 2008 2007 2006
Investment Gains1 $ (153.1) $ (75.9) $ (118.6) $ (86.9) $ (84.2) $ (144.8) $ (88.1) $ 196.4 $ 217.8 $ 134.2
Salary Gains 0.9 4.0 3.5 4.3 6.2 1.9 (4.5) (2.2) 4.8 2.3
Termination of Employment
– (0.2) (0.1) – (0.1) (0.1) 0.1 (0.1) (0.1) (0.7)
Return to Work from Terminated Status
0.3 (1.2) – – (0.2) 0.5 (4.3) (2.7) (1.0) –
Gain (or Loss) During Year from Selected Experience
$ (151.9) $ (73.3) $ (115.2) $ (82.6) $ (78.3) $ (142.5) $ (96.8) $ 191.4 $ 221.5 $ 135.8
1 Actuarial value of assets
Source: Office of the State Actuary
LEOFF Plan 2: Selected Gains and Losses During Fiscal Years Ended June 30, 2006–2015Resulting from Differences Between Assumed Experience and Actual Experience — Dollars in Millions
$ Gain (or Loss) for Year
Type of Activity 2015 2014 2013 2012 2011 2010 2009 2008 2007 2006
Investment Gains1 $ (43.6) $ 88.0 $ 16.7 $ (4.5) $ (1.9) $ (68.7) $ 19.4 $ 135.8 $ 159.7 $ 95.2
Salary Gains (2.2) 6.9 117.5 186.3 164.7 91.1 6.5 (29.7) 61.2 48.3
Termination of Employment
7.6 6.5 3.4 9.0 2.5 25.8 11.8 2.9 4.4 5.2
Return to Work from Terminated Status
(4.5) (5.4) (6.6) (4.5) (16.8) (12.6) (7.9) (22.6) (43.9) (25.8)
Gain (or Loss) During Year from Selected Experience
$ (42.7) $ 96.0 $ 131.0 $ 186.3 $ 148.5 $ 35.6 $ 29.8 $ 86.4 $ 181.4 $ 122.9
WSPRS Plan 1/2: Selected Gains and Losses During Fiscal Years Ended June 30, 2006–2015Resulting from Differences Between Assumed Experience and Actual Experience — Dollars in Millions
$ Gain (or Loss) for Year
Type of Activity 2015 2014 2013 2012 2011 2010 2009 2008 2007 2006
Investment Gains1 $ (23.3) $ (10.0) $ (10.2) $ (6.7) $ (8.5) $ (20.5) $ (6.2) $ 28.4 $ 32.0 $ 19.6
Salary Gains 7.2 (1.3) 8.6 12.5 18.8 19.0 (0.7) (5.9) 5.5 (1.9)
Termination of Employment
5.7 2.8 (0.3) 2.5 0.1 (1.0) 1.2 1.1 0.1 1.2
Return to Work from Terminated Status
(0.5) 0.0 (0.4) (0.3) (0.2) (0.5) (0.5) 0.0 (49.7) (0.7)
Gain (or Loss) During Year from Selected Experience
$ (10.9) $ (8.5) $ (2.3) $ 8.0 $ 10.2 $ (3.0) $ (6.2) $ 23.6 $ (12.1) $ 18.2
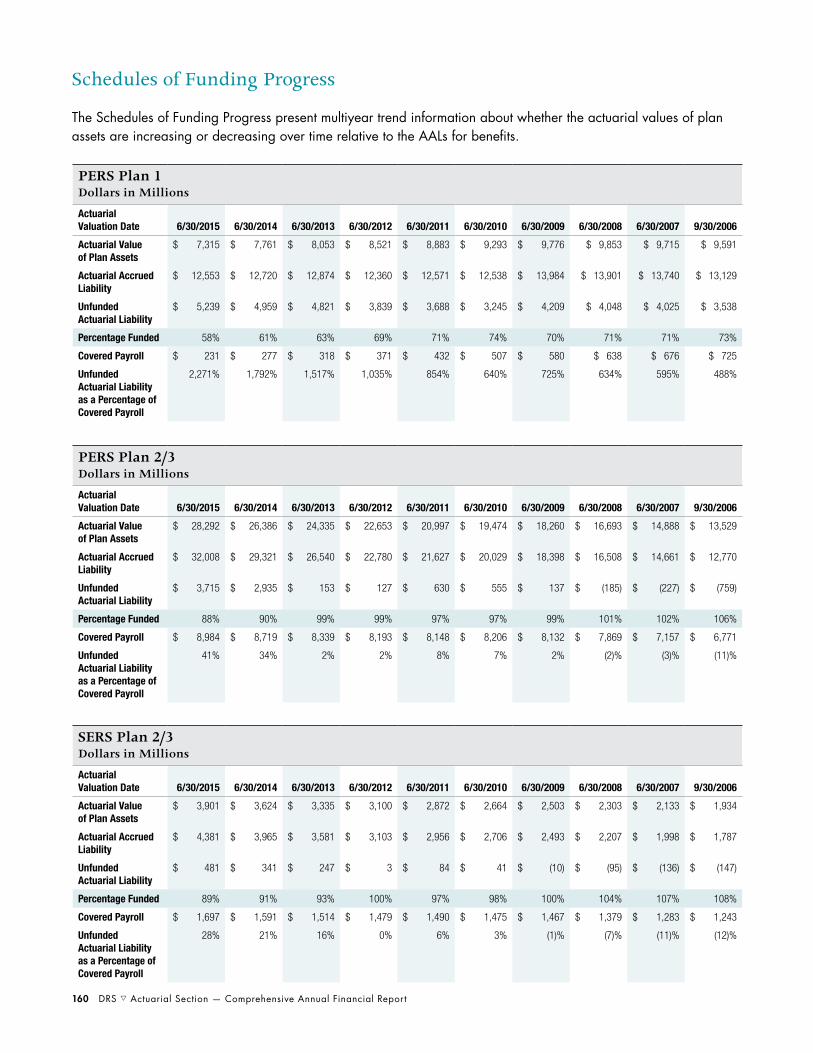
160 DRS s Actuarial Section — Comprehensive Annual Financial Report
Schedules of Funding Progress
PERS Plan 1Dollars in Millions
Actuarial Valuation Date 6/30/2015 6/30/2014 6/30/2013 6/30/2012 6/30/2011 6/30/2010 6/30/2009 6/30/2008 6/30/2007 9/30/2006
Actuarial Value of Plan Assets
$ 7,315 $ 7,761 $ 8,053 $ 8,521 $ 8,883 $ 9,293 $ 9,776 $ 9,853 $ 9,715 $ 9,591
Actuarial Accrued Liability
$ 12,553 $ 12,720 $ 12,874 $ 12,360 $ 12,571 $ 12,538 $ 13,984 $ 13,901 $ 13,740 $ 13,129
Unfunded Actuarial Liability
$ 5,239 $ 4,959 $ 4,821 $ 3,839 $ 3,688 $ 3,245 $ 4,209 $ 4,048 $ 4,025 $ 3,538
Percentage Funded 58% 61% 63% 69% 71% 74% 70% 71% 71% 73%
Covered Payroll $ 231 $ 277 $ 318 $ 371 $ 432 $ 507 $ 580 $ 638 $ 676 $ 725
Unfunded Actuarial Liability as a Percentage of Covered Payroll
2,271% 1,792% 1,517% 1,035% 854% 640% 725% 634% 595% 488%
SERS Plan 2/3Dollars in Millions
Actuarial Valuation Date 6/30/2015 6/30/2014 6/30/2013 6/30/2012 6/30/2011 6/30/2010 6/30/2009 6/30/2008 6/30/2007 9/30/2006
Actuarial Value of Plan Assets
$ 3,901 $ 3,624 $ 3,335 $ 3,100 $ 2,872 $ 2,664 $ 2,503 $ 2,303 $ 2,133 $ 1,934
Actuarial Accrued Liability
$ 4,381 $ 3,965 $ 3,581 $ 3,103 $ 2,956 $ 2,706 $ 2,493 $ 2,207 $ 1,998 $ 1,787
Unfunded Actuarial Liability
$ 481 $ 341 $ 247 $ 3 $ 84 $ 41 $ (10) $ (95) $ (136) $ (147)
Percentage Funded 89% 91% 93% 100% 97% 98% 100% 104% 107% 108%
Covered Payroll $ 1,697 $ 1,591 $ 1,514 $ 1,479 $ 1,490 $ 1,475 $ 1,467 $ 1,379 $ 1,283 $ 1,243
Unfunded Actuarial Liability as a Percentage of Covered Payroll
28% 21% 16% 0% 6% 3% (1)% (7)% (11)% (12)%
PERS Plan 2/3Dollars in Millions
Actuarial Valuation Date 6/30/2015 6/30/2014 6/30/2013 6/30/2012 6/30/2011 6/30/2010 6/30/2009 6/30/2008 6/30/2007 9/30/2006
Actuarial Value of Plan Assets
$ 28,292 $ 26,386 $ 24,335 $ 22,653 $ 20,997 $ 19,474 $ 18,260 $ 16,693 $ 14,888 $ 13,529
Actuarial Accrued Liability
$ 32,008 $ 29,321 $ 26,540 $ 22,780 $ 21,627 $ 20,029 $ 18,398 $ 16,508 $ 14,661 $ 12,770
Unfunded Actuarial Liability
$ 3,715 $ 2,935 $ 153 $ 127 $ 630 $ 555 $ 137 $ (185) $ (227) $ (759)
Percentage Funded 88% 90% 99% 99% 97% 97% 99% 101% 102% 106%
Covered Payroll $ 8,984 $ 8,719 $ 8,339 $ 8,193 $ 8,148 $ 8,206 $ 8,132 $ 7,869 $ 7,157 $ 6,771
Unfunded Actuarial Liability as a Percentage of Covered Payroll
41% 34% 2% 2% 8% 7% 2% (2)% (3)% (11)%
The Schedules of Funding Progress present multiyear trend information about whether the actuarial values of plan assets are increasing or decreasing over time relative to the AALs for benefits.

Comprehensive Annual Financial Report — Actuarial Section s DRS 161
Schedules of Funding Progress (cont.)
PSERS Plan 21
Dollars in Millions
Actuarial Valuation Date 6/30/2015 6/30/2014 6/30/2013 6/30/2012 6/30/2011 6/30/2010 6/30/2009 6/30/2008 6/30/2007 9/30/2006
Actuarial Value of Plan Assets
$ 338 $ 278 $ 224 $ 180 $ 141 $ 103 $ 69 $ 39 $ 14 –
Actuarial Accrued Liability
$ 357 $ 291 $ 218 $ 159 $ 126 $ 94 $ 64 $ 37 $ 19 –
Unfunded Actuarial Liability
$ 19 $ 13 $ (7) $ (22) $ (14) $ (9) $ (5) $ (2) $ 6 –
Percentage Funded 95% 96% 103% 114% 111% 109% 108% 106% 71% –
Covered Payroll $ 302 $ 275 $ 253 $ 238 $ 233 $ 227 $ 223 $ 200 $ 134 –
Unfunded Actuarial Liability as a Percentage of Covered Payroll
6% 5% (3)% (9)% (6)% (4)% (2)% (1)% 4% –
TRS Plan 2/3Dollars in Millions
Actuarial Valuation Date 6/30/2015 6/30/2014 6/30/2013 6/30/2012 6/30/2011 6/30/2010 6/30/2009 6/30/2008 6/30/2007 9/30/2006
Actuarial Value of Plan Assets
$ 9,953 $ 9,193 $ 8,406 $ 7,758 $ 7,141 $ 6,593 $ 6,160 $ 5,681 $ 5,277 $ 4,835
Actuarial Accrued Liability
$ 10,831 $ 9,819 $ 8,794 $ 7,478 $ 7,194 $ 6,558 $ 6,048 $ 5,264 $ 4,682 $ 4,030
Unfunded Actuarial Liability
$ 879 $ 626 $ 388 $ (280) $ 53 $ (36) $ (112) $ (417) $ (594) $ (806)
Percentage Funded 92% 94% 96% 104% 99% 101% 102% 108% 113% 120%
Covered Payroll $ 4,667 $ 4,450 $ 4,223 $ 4,077 $ 4,085 $ 3,966 $ 3,957 $ 3,621 $ 3,318 $ 3,225
Unfunded Actuarial Liability as a Percentage of Covered Payroll
19% 14% 9% (7)% 1% (1)% (3)% (12)% (18)% (25)%
TRS Plan 1Dollars in Millions
Actuarial Valuation Date 6/30/2015 6/30/2014 6/30/2013 6/30/2012 6/30/2011 6/30/2010 6/30/2009 6/30/2008 6/30/2007 9/30/2006
Actuarial Value of Plan Assets
$ 5,870 $ 6,353 $ 6,717 $ 7,145 $ 7,485 $ 7,791 $ 8,146 $ 8,262 $ 8,302 $ 8,275
Actuarial Accrued Liability
$ 9,107 $ 9,250 $ 9,429 $ 9,038 $ 9,232 $ 9,201 $ 10,820 $ 10,754 $ 10,826 $ 10,359
Unfunded Actuarial Liability
$ 3,237 $ 2,897 $ 2,712 $ 1,894 $ 1,747 $ 1,410 $ 2,674 $ 2,492 $ 2,524 $ 2,084
Percentage Funded 64% 69% 71% 79% 81% 85% 75% 77% 77% 80%
Covered Payroll $ 108 $ 143 $ 183 $ 228 $ 284 $ 344 $ 389 $ 432 $ 426 $ 478
Unfunded Actuarial Liability as a Percentage of Covered Payroll
3,006% 2,022% 1,481% 829% 615% 410% 688% 576% 592% 436%
1 PSERS Plan 2 became effective July 1, 2006.

162 DRS s Actuarial Section — Comprehensive Annual Financial Report
Schedules of Funding Progress (cont.)
LEOFF Plan 1Dollars in Millions
Actuarial Valuation Date 6/30/2015 6/30/2014 6/30/2013 6/30/2012 6/30/2011 6/30/2010 6/30/2009 6/30/2008 6/30/2007 9/30/2006
Actuarial Value of Plan Assets
$ 5,404 $ 5,499 $ 5,516 $ 5,562 $ 5,565 $ 5,561 $ 5,612 $ 5,592 $ 5,298 $ 5,018
Actuarial Accrued Liability
$ 4,307 $ 4,323 $ 4,409 $ 4,120 $ 4,145 $ 4,393 $ 4,492 $ 4,368 $ 4,340 $ 4,309
Unfunded Actuarial Liability
$ (1,097) $ (1,177) $ (1,108) $ (1,441) $ (1,421) $ (1,168) $ (1,120) $ (1,225) $ (958) $ (709)
Percentage Funded 125% 127% 125% 135% 134% 127% 125% 128% 122% 116%
Covered Payroll $ 9 $ 13 $ 15 $ 19 $ 25 $ 29 $ 33 $ 37 $ 43 $ 48
Unfunded Actuarial Liability as a Percentage of Covered Payroll
(12,535)% (9,304)% (7,496)% (7,685)% (5,794)% (4,012)% (3,360)% (3,303)% (2,243)% (1,475)%
WSPRS Plan 1/2Dollars in Millions
Actuarial Valuation Date 6/30/2015 6/30/2014 6/30/2013 6/30/2012 6/30/2011 6/30/2010 6/30/2009 6/30/2008 6/30/2007 9/30/2006
Actuarial Value of Plan Assets
$ 1,067 $ 1,044 $ 1,009 $ 982 $ 949 $ 920 $ 900 $ 870 $ 800 $ 743
Actuarial Accrued Liability
$ 1,093 $ 1,042 $ 987 $ 884 $ 859 $ 812 $ 790 $ 745 $ 702 $ 671
Unfunded Actuarial Liability
$ 26 $ (2) $ (22) $ (97) $ (90) $ (107) $ (110) $ (124) $ (98) $ (72)
Percentage Funded 98% 100% 102% 111% 110% 113% 114% 117% 114% 111%
Covered Payroll $ 82 $ 82 $ 80 $ 80 $ 82 $ 83 $ 83 $ 79 $ 72 $ 69
Unfunded Actuarial Liability as a Percentage of Covered Payroll
32% (3)% (28)% (121)% (111)% (130)% (133)% (158)% (136)% (105)%
LEOFF Plan 2Dollars in Millions
Actuarial Valuation Date 6/30/2015 6/30/2014 6/30/2013 6/30/2012 6/30/2011 6/30/2010 6/30/2009 6/30/2008 6/30/2007 9/30/2006
Actuarial Value of Plan Assets
$ 9,320 $ 8,638 $ 7,862 $ 7,222 $ 6,621 $ 6,043 $ 5,564 $ 5,053 $ 4,360 $ 3,844
Actuarial Accrued Liability
$ 8,838 $ 8,069 $ 7,220 $ 6,353 $ 5,941 $ 5,164 $ 4,641 $ 3,998 $ 3,626 $ 3,486
Unfunded Actuarial Liability
$ (482) $ (569) $ (643) $ (869) $ (679) $ (879) $ (923) $ (1,054) $ (734) $ (358)
Percentage Funded 105% 107% 109% 114% 111% 117% 120% 126% 120% 110%
Covered Payroll $ 1,743 $ 1,661 $ 1,597 $ 1,560 $ 1,535 $ 1,490 $ 1,442 $ 1,345 $ 1,234 $ 1,172
Unfunded Actuarial Liability as a Percentage of Covered Payroll
(28)% (34)% (40)% (56)% (44)% (59)% (64)% (78)% (59)% (31)%

Comprehensive Annual Financial Report — Actuarial Section s DRS 163
Schedules of Funding Progress (cont.)
Liability amounts and ratios/percentages are based on actual, not rounded, figures.
PERS Plan 2/3, SERS Plan 2/3, PSERS Plan 2, TRS Plan 2/3, LEOFF Plan 2 and WSPRS Plan 1/2: These plans all use the Aggregate Actuarial Cost Method, which does not identify or separately amortize unfunded actuarial accrued liabilities. For this reason, the information about funded status and funding progress shown above for these plans has been prepared using the Entry Age Actuarial Cost Method and is intended to serve as a surrogate for the funded status and funding progress information of these plans.
Source: Office of the State Actuary
Ten-year schedules of actuarially determined and actual contributions are included in the “Required Supplementary Information” pages within the Financial Section.
JRSDollars in Millions
Actuarial Valuation Date 6/30/2015 6/30/2014 6/30/2013 6/30/2012 6/30/2011 6/30/2010 6/30/2009 6/30/2008 6/30/2007 9/30/2006
Actuarial Value of Plan Assets
$ 6 $ 5 $ 4 $ 3 $ 5 $ 4 $ 2 $ 1 $ 1 $ –
Actuarial Accrued Liability
$ 100 $ 105 $ 108 $ 104 $ 109 $ 84 $ 89 $ 92 $ 85 $ 88
Unfunded Actuarial Liability
$ 94 $ 100 $ 104 $ 101 $ 104 $ 80 $ 87 $ 91 $ 85 $ 88
Percentage Funded 6% 5% 4% 3% 5% 5% 2% 1% 1% 0%
Covered Payroll $ – $ – $ – $ 0.3 $ 0.5 $ 0.7 $ 0.9 $ 1.3 $ 1.3 $ 1.4
Unfunded Actuarial Liability as a Percentage of Covered Payroll
n/a n/a n/a 33,779% 22,574% 11,565% 9,216% 7,141% 6,374% 6,071%
JRFDollars in Millions
Actuarial Valuation Date 6/30/2015 6/30/2014 6/30/2013 6/30/2012 6/30/2011 6/30/2010 6/30/2009 6/30/2008 6/30/2007 9/30/2006
Actuarial Value of Plan Assets
$ 0.5 $ 1.0 $ 1.4 $ 1.9 $ 2.3 $ 2.8 $ 3.3 $ 3.6 $ 4.0 $ 4.1
Actuarial Accrued Liability
$ 3.1 $ 3.3 $ 3.5 $ 3.6 $ 3.9 $ 3.2 $ 3.4 $ 3.5 $ 3.9 $ 4.0
Unfunded Actuarial Liability
$ 2.6 $ 2.3 $ 2.1 $ 1.7 $ 1.5 $ 0.4 $ 0.1 $ (0.1) $ (0.1) $ (0.1)
Percentage Funded 16% 29% 40% 52% 61% 87% 97% 104% 103% 103%
Covered Payroll $ – $ – $ – $ – $ – $ – $ – $ – $ – $ –
Unfunded Actuarial Liability as a Percentage of Covered Payroll
n/a n/a n/a n/a n/a n/a n/a n/a n/a n/a

164 DRS s Actuarial Section — Comprehensive Annual Financial Report
Funded Status and Funding Progress
Funded Status of Each Plan as of June 30, 2015, the Most Recent Actuarial Valuation DateDollars in Millions
PlanActuarial
Value of Assets (a)
Actuarial Accrued Liability (AAL) Entry Age
(b)
Unfunded AAL (UAAL)
(b-a)Funded Ratio
(a/b)Covered Payroll
(c)
UAAL as a % of Covered Payroll
[(b-a)/c]
PERS 1 $ 7,314.9 $ 12,553.5 $ 5,238.5 58% $ 230.7 2,271%
PERS 2/31 28,292.3 32,007.6 3,715.3 88% 8,984.4 41%
TRS 1 5,870.5 9,107.5 3,237.0 64% 107.7 3,006%
TRS 2/31 9,952.8 10,831.4 878.5 92% 4,667.1 19%
SERS 2/31 3,900.6 4,381.5 480.9 89% 1,696.8 28%
PSERS 21 337.9 356.9 19.0 95% 302.3 6%
LEOFF 1 5,403.6 4,307.1 (1,096.6) 125% 8.7 (12,535)%
LEOFF 21 9,320.2 8,838.5 (481.7) 105% 1,742.9 (28)%
WSPRS 1/21 1,067.1 1,093.0 25.9 98% 81.8 32%
JRS 6.3 100.3 94.0 6% – n/a
JRF 0.5 3.1 2.6 16% – n/a
Total $ 71,466.8 $ 83,580.3 $ 12,113.5 86% $ 17,822.6 68%
1 These plans use the Aggregate actuarial cost method which does not separately amortize an Unfunded Actuarial Accrued Liabilities (UAAL) outside of the normal cost. Instead, the Entry Age Normal actuarial cost method was used to determine the UAAL. This method is intended to serve as a surrogate for the funded status of these plans.
Totals might not agree due to rounding. Percentages are calculated using unrounded totals.
Source: Office of the State Actuary

Comprehensive Annual Financial Report — Actuarial Section s DRS 165
This page is intentionally blank.
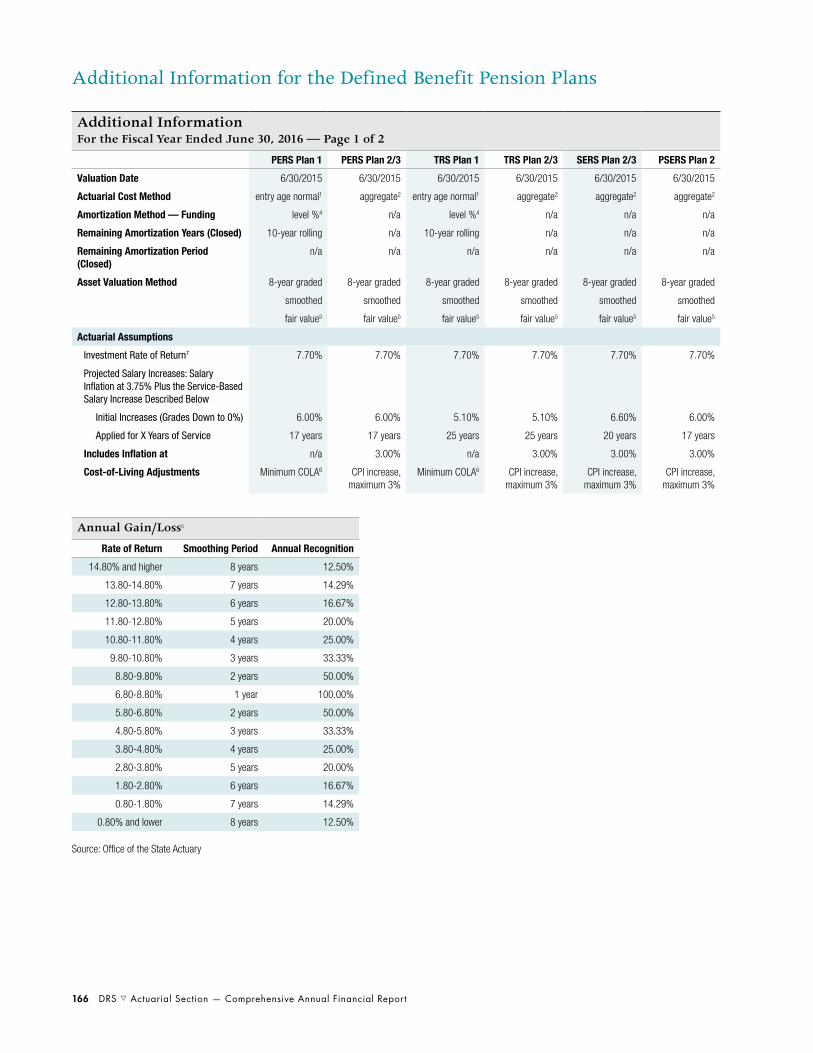
166 DRS s Actuarial Section — Comprehensive Annual Financial Report
Additional Information for the Defined Benefit Pension Plans
Additional InformationFor the Fiscal Year Ended June 30, 2016 — Page 1 of 2
PERS Plan 1 PERS Plan 2/3 TRS Plan 1 TRS Plan 2/3 SERS Plan 2/3 PSERS Plan 2
Valuation Date 6/30/2015 6/30/2015 6/30/2015 6/30/2015 6/30/2015 6/30/2015
Actuarial Cost Method entry age normal1 aggregate2 entry age normal1 aggregate2 aggregate2 aggregate2
Amortization Method — Funding level %4 n/a level %4 n/a n/a n/a
Remaining Amortization Years (Closed) 10-year rolling n/a 10-year rolling n/a n/a n/a
Remaining Amortization Period (Closed)
n/a n/a n/a n/a n/a n/a
Asset Valuation Method 8-year graded 8-year graded 8-year graded 8-year graded 8-year graded 8-year graded
smoothed smoothed smoothed smoothed smoothed smoothed
fair value5 fair value5 fair value5 fair value5 fair value5 fair value5
Actuarial Assumptions
Investment Rate of Return7 7.70% 7.70% 7.70% 7.70% 7.70% 7.70%
Projected Salary Increases: Salary Inflation at 3.75% Plus the Service-Based Salary Increase Described Below
Initial Increases (Grades Down to 0%) 6.00% 6.00% 5.10% 5.10% 6.60% 6.00%
Applied for X Years of Service 17 years 17 years 25 years 25 years 20 years 17 years
Includes Inflation at n/a 3.00% n/a 3.00% 3.00% 3.00%
Cost-of-Living Adjustments Minimum COLA6 CPI increase, maximum 3%
Minimum COLA6 CPI increase, maximum 3%
CPI increase, maximum 3%
CPI increase, maximum 3%
Annual Gain/Loss5
Rate of Return Smoothing Period Annual Recognition
14.80% and higher 8 years 12.50%
13.80-14.80% 7 years 14.29%
12.80-13.80% 6 years 16.67%
11.80-12.80% 5 years 20.00%
10.80-11.80% 4 years 25.00%
9.80-10.80% 3 years 33.33%
8.80-9.80% 2 years 50.00%
6.80-8.80% 1 year 100.00%
5.80-6.80% 2 years 50.00%
4.80-5.80% 3 years 33.33%
3.80-4.80% 4 years 25.00%
2.80-3.80% 5 years 20.00%
1.80-2.80% 6 years 16.67%
0.80-1.80% 7 years 14.29%
0.80% and lower 8 years 12.50%
Source: Office of the State Actuary

Comprehensive Annual Financial Report — Actuarial Section s DRS 167
Additional Information for the Defined Benefit Pension Plans (cont.)
Additional InformationFor the Fiscal Year Ended June 30, 2016 — Page 2 of 2
LEOFF Plan 1 LEOFF Plan 2WSPRS
Plan 1/2 JRS JRF
Valuation Date 6/30/2015 6/30/2015 6/30/2015 6/30/2015 6/30/2015
Actuarial Cost Method frozen initial liability1
aggregate2 aggregate2 entry age3 entry age3
Amortization Method — Funding level %4 n/a n/a n/a n/a
Remaining Amortization Years (Closed) 9.00 n/a n/a 5-year rolling 5-year rolling
Remaining Amortization Period (Closed)
6/30/2024 n/a n/a n/a n/a
Asset Valuation Method 8-year graded 8-year graded 8-year graded market market
smoothed smoothed smoothed
fair value5 fair value5 fair value5
Actuarial Assumptions
Investment Rate of Return7 7.70% 7.50% 7.70% 4.00% 4.00%
Projected Salary Increases (Salary Inflation at 3.75% Plus the Service-Based Salary Increase Described Below)
Initial Increases (Grades Down to 0%) 10.70% 10.70% 8.50% 0.00% 0.00%
Applied for X Years of Service 25 years 25 years 27 years n/a n/a
Includes Inflation at 3.00% 3.00% 3.00% 3.00% 3.00%
Cost-of-Living Adjustments CPI increase CPI increase, maximum 3%
CPI increase, maximum 3%
CPI increase, maximum 3%
none
1 PERS and TRS Plans 1 use a variation of the Entry Age Cost Method. LEOFF 1 uses a variation of the Frozen Initial Liability (FIL) Cost Method.
2 The Aggregate Actuarial Cost Method does not identify or separately amortize unfunded actuarial accrued liabilities.
3 Pay as You Go basis for funding
4 Level percent of the system’s payroll, including assumed system growth
5 Asset Valuation Method: Eight-year, smoothed, fair value
The actuarial value of assets is calculated using an adjusted market value method by starting with the market value of assets. For subsequent years, the actuarial value of assets is determined by adjusting the market value of assets to reflect the difference between the actual investment return and the expected investment return during each of the past eight years — or, if fewer, the completed years since adoption — at the rates per year (annual recognition) shown above. The LEOFF 2 Annual Gain/Loss is centered around its 7.50% expected rate of return instead of 7.70%.
6 The PERS 1 and TRS 1 COLA
Qualifying retirees receive an increase in their monthly benefit once a year. The COLA on minimum benefit levels is calculated as the last unrounded COLA amount increased by 3%, rounded to the nearest penny. Below are some historical monthly COLA amounts per year of service.
7 The Legislature prescribes the assumed rate of investment return for all plans except JRS and JRF.
Historical Monthly COLA Amounts per Year of Service6
Date COLA Type Amount
7/1/2016 Minimum $2.25
7/1/2015 Minimum $2.18
7/1/2014 Minimum $2.12
7/1/2013 Minimum $2.06
7/1/2012 Minimum $2.00
7/1/2011 Minimum $1.94
7/1/2010 Uniform $1.88
7/1/2009 Uniform $1.83

168 DRS s Actuarial Section — Comprehensive Annual Financial Report
Required Contribution Rates
Required Contribution Rates Expressed as a Percentage of Current-Year Covered Payroll at the Close of Fiscal Year 2016
Employer Actual Contribution Rates1 Employee Actual Contribution Rates
Plan 1 Plan 2 Plan 32 Plan 1 Plan 2 Plan 3
PERS
Members Not Participating in JBM
State Agencies 11.18% 11.18% 11.18% 6.00% 6.12% varies3
Local Governmental Units 11.18% 11.18% 11.18% 6.00% 6.12% varies3
State Government Elected Officials 16.68% 11.18% 11.18% 7.50% 6.12% varies3
Members Participating in JBM
State Agencies 13.68% 13.68% 13.68% 9.76% 12.80% 7.50%4
Local Governmental Units 11.18% 11.18% 11.18% 12.26% 15.30% 7.50%4
SERS
State Agencies n/a 11.58% 11.58% n/a 5.63% varies3
Local Governmental Units n/a 11.58% 11.58% n/a 5.63% varies3
PSERS
State Agencies n/a 11.54% n/a n/a 6.59% n/a
Local Governmental Units n/a 11.54% n/a n/a 6.59% n/a
TRS
Members Not Participating in JBM
State Agencies 13.13% 13.13% 13.13% 6.00% 5.95% varies3
Local Governmental Units 13.13% 13.13% 13.13% 6.00% 5.95% varies3
State Government Elected Officials 13.13% 13.13% 13.13% 7.50% 5.95% varies3
Members Participating in JBM
State Agencies 13.13% n/a n/a 9.76% n/a n/a
LEOFF
Local Governmental Units 0.18% 5.23% n/a n/a 8.41% n/a
Ports and Universities n/a 8.59% n/a n/a 8.41% n/a
State of Washington n/a 3.36% n/a n/a n/a n/a
WSPRS
State Agencies 8.34% 8.34% n/a 6.84% 6.84% n/a
1 Employer rates include an administrative expense rate of 0.18%.2 Plan 3 defined benefit portion only3 Variable from 5% to 15% based on rate the member selects4 Minimum rate

2016 Highlights
Automatic DCP enrollment
Enacted by the Legislature in 2016, this program will automatically enroll all new, full-time state employees in the Deferred Compensation Program starting in January 2017. (Enrollees will have the ability to opt out if they wish.)
Patterned after successful programs in other states, auto-enrollment is expected to significantly boost the number of employees who are increasing their supplemental savings for retirement.
Statistical Section

Statistical Section

Comprehensive Annual Financial Report — Statistical Section s DRS 171
Statistical Section Table of Contents
This section of the Department of Retirement Systems’ Comprehensive Annual Financial Report presents detailed information that expands on the financial statements, note disclosures and required supplementary information that speak to the overall financial health of DRS.
FINANCIAL TRENDS
172 These schedules contain trend information about how the financial performance and well-being of DRS have changed over time.
DEMOGRAPHIC INFORMATION
188 These schedules contain demographic and historical information regarding membership and employer participation in the pension plans DRS offers.
OPERATING INFORMATION
212 These schedules contain detailed payment information about the benefit services DRS provides.
DEFERRED COMPENSATION INFORMATION
240 These schedules contain comprehensive information about the state’s Deferred Compensation Program.
Sources: Unless otherwise noted, the information in this section’s schedules comes from the comprehensive annual financial reports for the years being discussed.

172 D
RS s Statistical Section —
Com
prehensive Annual Financial Report
Schedule of Changes in Fiduciary Net Position
PERS Plan 1Dollars in Thousands
6/30/2016 6/30/2015 6/30/2014 6/30/2013 6/30/2012 6/30/2011 6/30/2010 6/30/2009 6/30/2008 6/30/2007
Additions by Source
Employer Contributions $ 595,982 $ 462,100 $ 448,895 $ 266,270 $ 257,197 $ 145,585 $ 154,023 $ 325,248 $ 221,787 $ 118,660
Employee Contributions 13,663 15,806 18,797 21,362 24,317 28,767 33,152 37,791 41,925 44,775
Investment Income (Loss)1 157,083 336,316 1,312,000 863,182 86,377 1,523,415 980,360 (2,373,373) (114,595) 2,086,563
Transfers 117 22 36 38 97 90 1 1 343 519
Miscellaneous2 7,630 8,650 12,189 12,024 10,269 12,705 11,566 10,700 13,262 9,513
Total Additions 774,475 822,894 1,791,917 1,162,876 378,257 1,710,562 1,179,102 (1,999,633) 162,722 2,260,030
Deductions by Type
Benefits 1,198,836 1,198,965 1,189,496 1,181,380 1,173,683 1,149,522 1,111,386 1,070,929 1,027,934 978,995
Refunds 4,373 4,029 4,219 3,998 4,554 3,470 4,946 5,071 5,573 6,215
Transfers 520 30 – 710 265 362 140 2,021 159 31
Administrative Expenses 2,819 2,707 3,016 4,773 3,522 3,213 3,885 4,401 4,739 4,763
Total Deductions 1,206,548 1,205,731 1,196,731 1,190,861 1,182,024 1,156,567 1,120,357 1,082,422 1,038,405 990,004
Total Changes in Fiduciary Net Position $ (432,073) $ (382,837) $ 595,186 $ (27,985) $ (803,767) $ 553,995 $ 58,745 $ (3,082,055) $ (875,683) $ 1,270,026
Fiduciary Net Position
Beginning of Year 7,561,078 7,943,915 7,348,729 7,376,714 8,180,481 7,626,486 7,567,741 10,649,796 11,525,479 10,255,453
End of Year $ 7,129,005 $ 7,561,078 $ 7,943,915 $ 7,348,729 $ 7,376,714 $ 8,180,481 $ 7,626,486 $ 7,567,741 $ 10,649,796 $ 11,525,479
Employer Contributions: % of Covered Payroll 273.3% 177.1% 145.0% 75.5% 64.4% 29.5% 26.9% 49.7% 31.1% 15.6%
1 “Investment income” reflects dividends, interest, realized capital gains, and unrealized gains and losses.
2 “Miscellaneous additions” include restorations of employee contributions.

Com
prehensive Annual Financial Report —
Statistical Section s D
RS 173
Schedule of Changes in Fiduciary Net Position (cont.)
PERS Plan 2/3Dollars in Thousands
6/30/2016 6/30/2015 6/30/2014 6/30/2013 6/30/2012 6/30/2011 6/30/2010 6/30/2009 6/30/2008 6/30/2007
Additions by Source
Employer Contributions $ 563,328 $ 446,127 $ 430,345 $ 389,020 $ 385,253 $ 328,258 $ 327,460 $ 439,744 $ 318,740 $ 242,544
Employee Contributions 472,528 355,350 346,270 315,755 310,160 263,885 264,231 368,127 268,573 207,144
Investment Income (Loss)1 725,476 1,295,320 4,444,937 2,556,131 284,681 3,468,458 1,868,154 (4,058,631) (224,724) 3,054,707
Transfers 360 206 141 293 270 4,036 11,611 722 316 292
Miscellaneous2 37,477 31,176 32,830 29,922 24,765 26,818 15,749 14,157 17,245 11,825
Total Additions 1,799,169 2,128,179 5,254,523 3,291,121 1,005,129 4,091,455 2,487,205 (3,235,881) 380,150 3,516,512
Deductions by Type
Benefits 776,213 665,408 565,660 460,074 376,999 310,943 251,765 207,319 170,317 143,802
Refunds 36,302 35,497 35,202 35,679 35,716 33,686 31,425 26,442 26,574 26,465
Transfers 4,740 1,823 2,441 5,538 2,180 8,528 5,407 8,903 70,935 3,904
Administrative Expenses 12,023 10,591 9,977 10,560 9,082 8,325 8,643 8,277 9,889 7,344
Total Deductions 829,278 713,319 613,280 511,851 423,977 361,482 297,240 250,941 277,715 181,515
Total Changes in Fiduciary Net Position $ 969,891 $ 1,414,860 $ 4,641,243 $ 2,779,270 $ 581,152 $ 3,729,973 $ 2,189,965 $ (3,486,822) $ 102,435 $ 3,334,997
Fiduciary Net Position
Beginning of Year 29,515,161 28,100,301 23,459,058 20,679,788 20,098,636 16,368,663 14,178,698 17,665,520 17,563,085 14,228,088
End of Year $ 30,485,052 $ 29,515,161 $ 28,100,301 $ 23,459,058 $ 20,679,788 $ 20,098,636 $ 16,368,663 $ 14,178,698 $ 17,665,520 $ 17,563,085
Employer Contributions: % of Covered Payroll 6.0% 6.2% 6.1% 5.8% 5.8% 4.0% 4.0% 5.4% 4.1% 3.5%
1 “Investment income” reflects dividends, interest, realized capital gains, and unrealized gains and losses.
2 “Miscellaneous additions” include restorations of employee contributions.
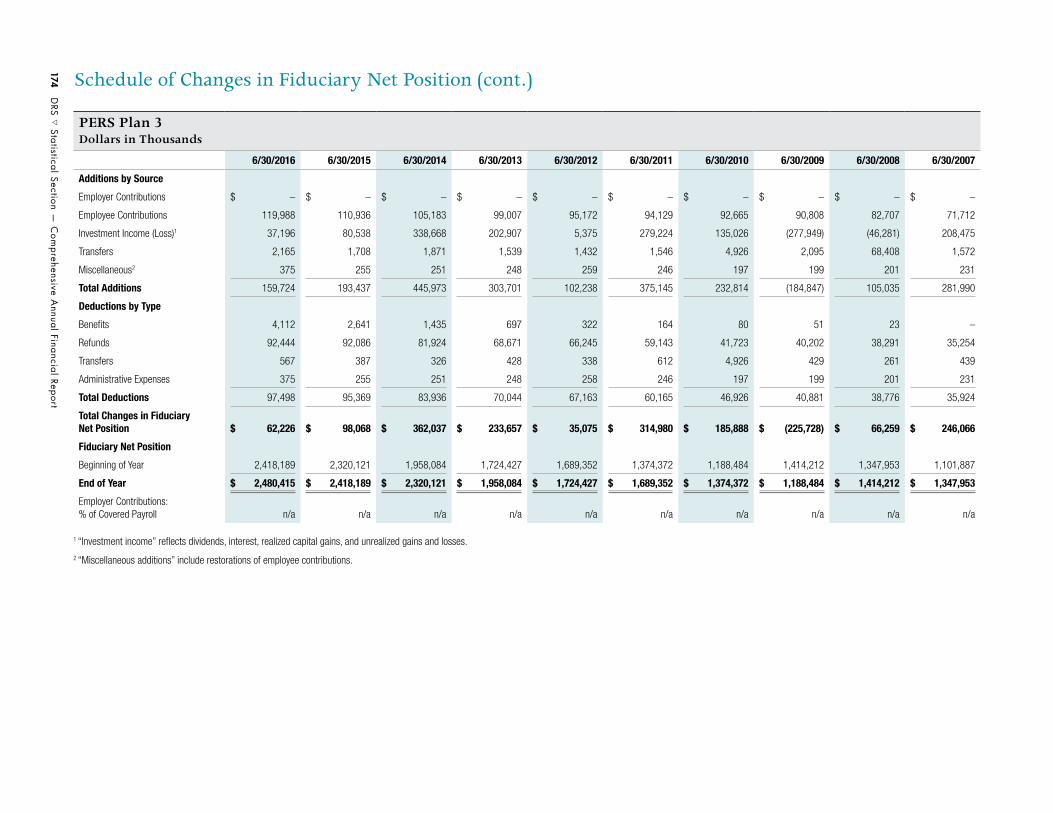
174 D
RS s Statistical Section —
Com
prehensive Annual Financial Report
Schedule of Changes in Fiduciary Net Position (cont.)
PERS Plan 3Dollars in Thousands
6/30/2016 6/30/2015 6/30/2014 6/30/2013 6/30/2012 6/30/2011 6/30/2010 6/30/2009 6/30/2008 6/30/2007
Additions by Source
Employer Contributions $ – $ – $ – $ – $ – $ – $ – $ – $ – $ –
Employee Contributions 119,988 110,936 105,183 99,007 95,172 94,129 92,665 90,808 82,707 71,712
Investment Income (Loss)1 37,196 80,538 338,668 202,907 5,375 279,224 135,026 (277,949) (46,281) 208,475
Transfers 2,165 1,708 1,871 1,539 1,432 1,546 4,926 2,095 68,408 1,572
Miscellaneous2 375 255 251 248 259 246 197 199 201 231
Total Additions 159,724 193,437 445,973 303,701 102,238 375,145 232,814 (184,847) 105,035 281,990
Deductions by Type
Benefits 4,112 2,641 1,435 697 322 164 80 51 23 –
Refunds 92,444 92,086 81,924 68,671 66,245 59,143 41,723 40,202 38,291 35,254
Transfers 567 387 326 428 338 612 4,926 429 261 439
Administrative Expenses 375 255 251 248 258 246 197 199 201 231
Total Deductions 97,498 95,369 83,936 70,044 67,163 60,165 46,926 40,881 38,776 35,924
Total Changes in Fiduciary Net Position $ 62,226 $ 98,068 $ 362,037 $ 233,657 $ 35,075 $ 314,980 $ 185,888 $ (225,728) $ 66,259 $ 246,066
Fiduciary Net Position
Beginning of Year 2,418,189 2,320,121 1,958,084 1,724,427 1,689,352 1,374,372 1,188,484 1,414,212 1,347,953 1,101,887
End of Year $ 2,480,415 $ 2,418,189 $ 2,320,121 $ 1,958,084 $ 1,724,427 $ 1,689,352 $ 1,374,372 $ 1,188,484 $ 1,414,212 $ 1,347,953
Employer Contributions: % of Covered Payroll n/a n/a n/a n/a n/a n/a n/a n/a n/a n/a
1 “Investment income” reflects dividends, interest, realized capital gains, and unrealized gains and losses.
2 “Miscellaneous additions” include restorations of employee contributions.

Com
prehensive Annual Financial Report —
Statistical Section s D
RS 175
Schedule of Changes in Fiduciary Net Position (cont.)
SERS Plan 2/3Dollars in Thousands
6/30/2016 6/30/2015 6/30/2014 6/30/2013 6/30/2012 6/30/2011 6/30/2010 6/30/2009 6/30/2008 6/30/2007
Additions by Source
Employer Contributions $ 115,480 $ 97,386 $ 88,783 $ 78,400 $ 74,640 $ 62,316 $ 62,090 $ 63,526 $ 52,139 $ 45,950
Employee Contributions 45,946 34,939 31,305 26,018 24,095 19,247 20,105 26,062 20,726 17,371
Investment Income (Loss)1 100,211 178,042 607,984 348,956 38,452 473,113 255,525 (560,165) (29,922) 435,696
Transfers 27 49 42 6 11 413 431 2,050 2,118 1,998
Miscellaneous2 3,233 2,435 2,334 782 1,635 1,719 1,521 1,517 1,398 1,301
Total Additions 264,897 312,851 730,448 454,162 138,833 556,808 339,672 (467,010) 46,459 502,316
Deductions by Type
Benefits 112,753 96,184 81,216 66,426 53,630 43,338 34,449 28,307 22,627 17,641
Refunds 2,494 2,891 2,732 2,655 2,516 2,492 2,125 2,125 2,045 2,516
Transfers 1,242 630 504 330 454 423 8,141 956 89,481 275
Administrative Expenses 1,782 1,644 1,543 137 1,403 1,484 1,384 1,327 1,267 1,124
Total Deductions 118,271 101,349 85,995 69,548 58,003 47,737 46,099 32,715 115,420 21,556
Total Changes in Fiduciary Net Position $ 146,626 $ 211,502 $ 644,453 $ 384,614 $ 80,830 $ 509,071 $ 293,573 $ (499,725) $ (68,961) $ 480,760
Fiduciary Net Position
Beginning of Year 4,067,855 3,856,353 3,211,900 2,827,286 2,746,456 2,237,385 1,943,812 2,443,537 2,512,498 2,031,738
End of Year $ 4,214,481 $ 4,067,855 $ 3,856,353 $ 3,211,900 $ 2,827,286 $ 2,746,456 $ 2,237,385 $ 1,943,812 $ 2,443,537 $ 2,512,498
Employer Contributions: % of Covered Payroll 6.1% 5.7% 5.5% 5.1% 4.6% 3.8% 3.8% 4.0% 3.4% 3.3%
1 “Investment income” reflects dividends, interest, realized capital gains, and unrealized gains and losses.
2 “Miscellaneous additions” include restorations of employee contributions.

176 D
RS s Statistical Section —
Com
prehensive Annual Financial Report
Schedule of Changes in Fiduciary Net Position (cont.)
SERS Plan 3Dollars in Thousands
6/30/2016 6/30/2015 6/30/2014 6/30/2013 6/30/2012 6/30/2011 6/30/2010 6/30/2009 6/30/2008 6/30/2007
Additions by Source
Employer Contributions $ – $ – $ – $ – $ – $ – $ – $ – $ – $ –
Employee Contributions 67,713 62,645 60,766 59,257 59,021 60,313 60,328 59,422 58,381 54,175
Investment Income (Loss)1 32,171 62,821 245,336 147,193 10,372 209,367 108,480 (230,415) (27,970) 169,969
Transfers 1,102 825 682 466 407 500 445 455 89,449 239
Miscellaneous2 330 224 227 230 245 238 193 196 202 225
Total Additions 101,316 126,515 307,011 207,146 70,045 270,418 169,446 (170,342) 120,062 224,608
Deductions by Type
Benefits 2,610 1,526 854 463 302 182 91 62 8 –
Refunds 85,019 86,293 73,826 65,643 60,929 53,242 33,916 42,041 39,815 32,077
Transfers 311 270 302 190 163 597 416 520 183 289
Administrative Expenses 330 224 227 230 245 237 193 195 202 225
Total Deductions 88,270 88,313 75,209 66,526 61,639 54,258 34,616 42,818 40,208 32,591
Total Changes in Fiduciary Net Position $ 13,046 $ 38,202 $ 231,802 $ 140,620 $ 8,406 $ 216,160 $ 134,830 $ (213,160) $ 79,854 $ 192,017
Fiduciary Net Position
Beginning of Year 1,688,472 1,650,270 1,418,468 1,277,848 1,269,442 1,053,282 918,452 1,131,612 1,051,758 859,741
End of Year $ 1,701,518 $ 1,688,472 $ 1,650,270 $ 1,418,468 $ 1,277,848 $ 1,269,442 $ 1,053,282 $ 918,452 $ 1,131,612 $ 1,051,758
Employer Contributions: % of Covered Payroll n/a n/a n/a n/a n/a n/a n/a n/a n/a n/a
1 “Investment income” reflects dividends, interest, realized capital gains, and unrealized gains and losses.
2 “Miscellaneous additions” include restorations of employee contributions.

Com
prehensive Annual Financial Report —
Statistical Section s D
RS 177
Schedule of Changes in Fiduciary Net Position (cont.)
PSERS Plan 2Dollars in Thousands
6/30/2016 6/30/2015 6/30/2014 6/30/2013 6/30/2012 6/30/2011 6/30/2010 6/30/2009 6/30/2008 6/30/2007
Additions by Source
Employer Contributions $ 20,058 $ 18,704 $ 17,124 $ 15,650 $ 15,285 $ 15,591 $ 15,238 $ 14,510 $ 11,700 $ 6,612
Employee Contributions 21,134 18,650 17,344 15,798 15,228 15,353 15,213 14,557 11,740 6,664
Investment Income (Loss)1 10,097 15,082 45,144 22,468 2,778 21,255 7,358 (9,383) (765) 813
Transfers 1 1 5 4 8 5 32 – 3 –
Miscellaneous2 173 146 212 81 141 124 45 30 14 6
Total Additions 51,463 52,583 79,829 54,001 33,440 52,328 37,886 19,714 22,692 14,095
Deductions by Type
Benefits 630 444 256 148 70 35 17 5 – –
Refunds 2,647 2,612 2,194 2,186 1,921 1,780 928 466 152 23
Transfers 90 – – 4 6 3 2 3 2 –
Administrative Expenses 150 116 104 1 70 82 50 40 26 27
Total Deductions 3,517 3,172 2,554 2,339 2,067 1,900 997 514 180 50
Total Changes in Fiduciary Net Position $ 47,946 $ 49,411 $ 77,275 $ 51,662 $ 31,373 $ 50,428 $ 36,889 $ 19,200 $ 22,512 $ 14,045
Fiduciary Net Position
Beginning of Year 352,795 303,384 226,109 174,447 143,074 92,646 55,757 36,557 14,045 –
End of Year $ 400,741 $ 352,795 $ 303,384 $ 226,109 $ 174,447 $ 143,074 $ 92,646 $ 55,757 $ 36,557 $ 14,045
Employer Contributions: % of Covered Payroll 6.2% 6.4% 6.3% 6.3% 6.5% 6.7% 6.5% 6.5% 6.5% 6.5%
1 “Investment income” reflects dividends, interest, realized capital gains, and unrealized gains and losses.
2 “Miscellaneous additions” include restorations of employee contributions.

178 D
RS s Statistical Section —
Com
prehensive Annual Financial Report
Schedule of Changes in Fiduciary Net Position (cont.)
TRS Plan 1Dollars in Thousands
6/30/2016 6/30/2015 6/30/2014 6/30/2013 6/30/2012 6/30/2011 6/30/2010 6/30/2009 6/30/2008 6/30/2007
Additions by Source
Employer Contributions $ 315,934 $ 223,886 $ 200,674 $ 118,569 $ 111,937 $ 96,803 $ 112,731 $ 178,850 $ 113,089 $ 60,462
Employee Contributions 5,059 6,846 9,039 11,369 14,098 17,631 20,930 23,810 26,480 29,995
Investment Income (Loss)1 118,306 269,746 1,079,807 720,704 73,203 1,279,513 813,504 (1,979,081) (93,982) 1,762,480
Transfers – – 51 – 38 1 5 27 5 84
Miscellaneous2 5,966 5,758 7,956 8,207 6,228 10,792 6,827 7,011 7,870 8,546
Total Additions 445,265 506,236 1,297,527 858,849 205,504 1,404,740 953,997 (1,769,383) 53,462 1,861,567
Deductions by Type
Benefits 924,377 927,015 925,975 914,610 913,864 899,819 859,250 850,262 844,986 802,344
Refunds 1,182 1,555 2,262 1,989 1,552 1,820 1,504 1,260 1,000 1,878
Transfers 386 – – 578 223 159 118 1,449 82 3
Administrative Expenses 2,015 1,985 2,195 3,965 2,699 2,686 3,125 3,266 3,646 3,752
Total Deductions 927,960 930,555 930,432 921,142 918,338 904,484 863,997 856,237 849,714 807,977
Total Changes in Fiduciary Net Position $ (482,695) $ (424,319) $ 367,095 $ (62,293) $ (712,834) $ 500,256 $ 90,000 $ (2,625,620) $ (796,252) $ 1,053,590
Fiduciary Net Position
Beginning of Year 6,071,966 6,496,285 6,129,190 6,191,483 6,904,317 6,404,061 6,314,061 8,939,681 9,735,933 8,682,343
End of Year $ 5,589,271 $ 6,071,966 $ 6,496,285 $ 6,129,190 $ 6,191,483 $ 6,904,317 $ 6,404,061 $ 6,314,061 $ 8,939,681 $ 9,735,933
Employer Contributions: % of Covered Payroll 375.3% 197.6% 135.2% 61.6% 47.7% 27.7% 26.9% 37.3% 21.5% 10.3%
1 “Investment income” reflects dividends, interest, realized capital gains, and unrealized gains and losses.
2 “Miscellaneous additions” include restorations of employee contributions.

Com
prehensive Annual Financial Report —
Statistical Section s D
RS 179
Schedule of Changes in Fiduciary Net Position (cont.)
TRS Plan 2/3Dollars in Thousands
6/30/2016 6/30/2015 6/30/2014 6/30/2013 6/30/2012 6/30/2011 6/30/2010 6/30/2009 6/30/2008 6/30/2007
Additions by Source
Employer Contributions $ 316,022 $ 267,038 $ 249,342 $ 228,974 $ 213,852 $ 168,264 $ 164,959 $ 160,793 $ 109,523 $ 102,180
Employee Contributions 64,263 47,206 41,081 34,494 29,829 21,881 21,126 23,277 14,739 12,227
Investment Income (Loss)1 258,964 453,535 1,539,901 877,562 96,411 1,175,293 629,396 (1,383,054) (73,457) 1,078,134
Transfers 71 41 45 34 16 850 724 547 339 201
Miscellaneous2 10,386 11,278 8,260 4,178 5,476 5,416 4,551 4,429 4,432 3,951
Total Additions 649,706 779,098 1,838,629 1,145,242 345,584 1,371,704 820,756 (1,194,008) 55,576 1,196,693
Deductions by Type
Benefits 218,011 183,212 149,522 116,662 91,400 72,138 55,654 44,795 36,016 28,534
Refunds 2,971 2,840 1,988 2,914 2,169 2,281 2,868 2,189 2,190 2,726
Transfers 1,934 659 445 858 652 390 369 2,670 168,866 440
Administrative Expenses 5,321 4,909 4,585 2,830 4,020 4,273 3,932 3,824 3,629 3,067
Total Deductions 228,237 191,620 156,540 123,264 98,241 79,082 62,823 53,478 210,701 34,767
Total Changes in Fiduciary Net Position $ 421,469 $ 587,478 $ 1,682,089 $ 1,021,978 $ 247,343 $ 1,292,622 $ 757,933 $ (1,247,486) $ (155,125) $ 1,161,926
Fiduciary Net Position
Beginning of Year 10,378,791 9,791,313 8,109,224 7,087,246 6,839,903 5,547,281 4,789,348 6,036,834 6,191,959 5,030,033
End of Year $ 10,800,260 $ 10,378,791 $ 9,791,313 $ 8,109,224 $ 7,087,246 $ 6,839,903 $ 5,547,281 $ 4,789,348 $ 6,036,834 $ 6,191,959
Employer Contributions: % of Covered Payroll 6.3% 5.7% 5.6% 5.4% 5.1% 4.0% 4.1% 4.1% 3.0% 3.0%
1 “Investment income” reflects dividends, interest, realized capital gains, and unrealized gains and losses.
2 “Miscellaneous additions” include restorations of employee contributions.

180
DRS s
Statistical Section — C
omprehensive A
nnual Financial Report
Schedule of Changes in Fiduciary Net Position (cont.)
TRS Plan 3Dollars in Thousands
6/30/2016 6/30/2015 6/30/2014 6/30/2013 6/30/2012 6/30/2011 6/30/2010 6/30/2009 6/30/2008 6/30/2007
Additions by Source
Employer Contributions $ – $ – $ – $ – $ – $ – $ – $ – $ – $ –
Employee Contributions 309,813 286,156 273,656 262,293 255,867 257,718 254,197 247,891 234,661 213,878
Investment Income (Loss)1 125,289 256,717 1,044,040 627,742 34,065 866,178 424,811 (864,630) (177,645) 630,495
Transfers 1,585 1,372 1,115 839 618 650 598 971 168,817 581
Miscellaneous2 1,159 789 784 775 811 767 610 605 597 712
Total Additions 437,846 545,034 1,319,595 891,649 291,361 1,125,313 680,216 (615,163) 226,430 845,666
Deductions by Type
Benefits 10,034 5,924 3,084 1,569 1,149 542 257 128 45 18
Refunds 289,785 269,378 235,635 176,052 150,404 115,571 71,665 76,166 84,776 62,810
Transfers 938 717 721 522 520 1,368 1,084 550 512 254
Administrative Expenses 1,158 788 784 775 811 767 610 605 597 712
Total Deductions 301,915 276,807 240,224 178,918 152,884 118,248 73,616 77,449 85,930 63,794
Total Changes in Fiduciary Net Position $ 135,931 $ 268,227 $ 1,079,371 $ 712,731 $ 138,477 $ 1,007,065 $ 606,600 $ (692,612) $ 140,500 $ 781,872
Fiduciary Net Position
Beginning of Year 7,231,178 6,962,951 5,883,580 5,170,849 5,032,372 4,025,307 3,418,707 4,111,319 3,970,819 3,188,947
End of Year $ 7,367,109 $ 7,231,178 $ 6,962,951 $ 5,883,580 $ 5,170,849 $ 5,032,372 $ 4,025,307 $ 3,418,707 $ 4,111,319 $ 3,970,819
Employer Contributions: % of Covered Payroll n/a n/a n/a n/a n/a n/a n/a n/a n/a n/a
1 “Investment income” reflects dividends, interest, realized capital gains, and unrealized gains and losses.
2 “Miscellaneous additions” include restorations of employee contributions.
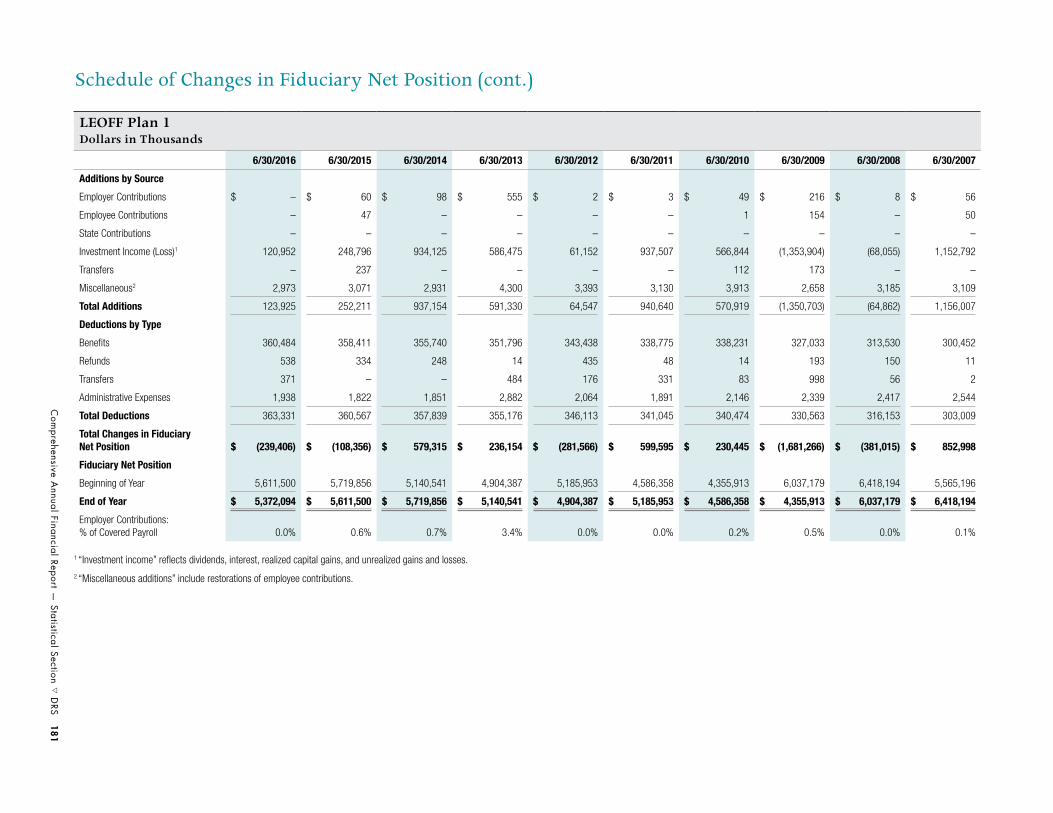
Com
prehensive Annual Financial Report —
Statistical Section s D
RS 181
Schedule of Changes in Fiduciary Net Position (cont.)
LEOFF Plan 1Dollars in Thousands
6/30/2016 6/30/2015 6/30/2014 6/30/2013 6/30/2012 6/30/2011 6/30/2010 6/30/2009 6/30/2008 6/30/2007
Additions by Source
Employer Contributions $ – $ 60 $ 98 $ 555 $ 2 $ 3 $ 49 $ 216 $ 8 $ 56
Employee Contributions – 47 – – – – 1 154 – 50
State Contributions – – – – – – – – – –
Investment Income (Loss)1 120,952 248,796 934,125 586,475 61,152 937,507 566,844 (1,353,904) (68,055) 1,152,792
Transfers – 237 – – – – 112 173 – –
Miscellaneous2 2,973 3,071 2,931 4,300 3,393 3,130 3,913 2,658 3,185 3,109
Total Additions 123,925 252,211 937,154 591,330 64,547 940,640 570,919 (1,350,703) (64,862) 1,156,007
Deductions by Type
Benefits 360,484 358,411 355,740 351,796 343,438 338,775 338,231 327,033 313,530 300,452
Refunds 538 334 248 14 435 48 14 193 150 11
Transfers 371 – – 484 176 331 83 998 56 2
Administrative Expenses 1,938 1,822 1,851 2,882 2,064 1,891 2,146 2,339 2,417 2,544
Total Deductions 363,331 360,567 357,839 355,176 346,113 341,045 340,474 330,563 316,153 303,009
Total Changes in Fiduciary Net Position $ (239,406) $ (108,356) $ 579,315 $ 236,154 $ (281,566) $ 599,595 $ 230,445 $ (1,681,266) $ (381,015) $ 852,998
Fiduciary Net Position
Beginning of Year 5,611,500 5,719,856 5,140,541 4,904,387 5,185,953 4,586,358 4,355,913 6,037,179 6,418,194 5,565,196
End of Year $ 5,372,094 $ 5,611,500 $ 5,719,856 $ 5,140,541 $ 4,904,387 $ 5,185,953 $ 4,586,358 $ 4,355,913 $ 6,037,179 $ 6,418,194
Employer Contributions: % of Covered Payroll 0.0% 0.6% 0.7% 3.4% 0.0% 0.0% 0.2% 0.5% 0.0% 0.1%
1 “Investment income” reflects dividends, interest, realized capital gains, and unrealized gains and losses.
2 “Miscellaneous additions” include restorations of employee contributions.

182 D
RS s Statistical Section —
Com
prehensive Annual Financial Report
Schedule of Changes in Fiduciary Net Position (cont.)
LEOFF Plan 2Dollars in Thousands
6/30/2016 6/30/2015 6/30/2014 6/30/2013 6/30/2012 6/30/2011 6/30/2010 6/30/2009 6/30/2008 6/30/2007
Additions by Source
Employer Contributions $ 92,049 $ 89,122 $ 85,532 $ 82,397 $ 80,480 $ 79,733 $ 76,998 $ 77,849 $ 73,364 $ 58,191
Employee Contributions 151,659 146,679 140,921 135,797 132,584 131,252 128,154 128,206 115,567 95,552
State Contributions 60,375 58,339 55,551 54,246 52,770 52,024 51,376 51,137 45,926 37,928
Investment Income (Loss)1 244,054 430,410 1,456,269 825,071 92,867 1,084,240 568,518 (1,223,154) (70,257) 892,480
Transfers 23 – 265 1,833 10 2,936 1,010 1,218 117 –
Miscellaneous2 26,273 22,776 13,496 9,351 9,220 7,754 7,447 4,466 2,987 3,905
Total Additions 574,433 747,326 1,752,034 1,108,695 367,931 1,357,939 833,503 (960,278) 167,704 1,088,056
Deductions by Type
Benefits 184,067 151,486 124,921 100,532 78,153 61,876 46,158 36,615 27,505 20,813
Refunds 6,645 8,541 9,028 8,677 11,214 8,181 10,947 7,223 7,639 7,995
Transfers 705 238 24 226 282 147 205 1,146 49 32
Administrative Expenses 5,305 4,668 4,192 2,566 3,672 3,309 3,416 2,288 2,298 2,073
Total Deductions 196,722 164,933 138,165 112,001 93,321 73,513 60,726 47,272 37,491 30,913
Total Changes in Fiduciary Net Position $ 377,711 $ 582,393 $ 1,613,869 $ 996,694 $ 274,610 $ 1,284,426 $ 772,777 $ (1,007,550) $ 130,213 $ 1,057,143
Fiduciary Net Position
Beginning of Year 9,833,649 9,251,256 7,637,387 6,640,693 6,366,083 5,081,657 4,308,880 5,316,430 5,186,217 4,129,074
End of Year $ 10,211,360 $ 9,833,649 $ 9,251,256 $ 7,637,387 $ 6,640,693 $ 6,366,083 $ 5,081,657 $ 4,308,880 $ 5,316,430 $ 5,186,217
Employer Contributions: % of Covered Payroll 5.1% 5.1% 5.1% 5.1% 5.1% 5.2% 5.1% 5.3% 5.5% 4.8%
1 “Investment income” reflects dividends, interest, realized capital gains, and unrealized gains and losses.
2 “Miscellaneous additions” include restorations of employee contributions.

Com
prehensive Annual Financial Report —
Statistical Section s D
RS 183
Schedule of Changes in Fiduciary Net Position (cont.)
WSPRS Plan 1/2Dollars in Thousands
6/30/2016 6/30/2015 6/30/2014 6/30/2013 6/30/2012 6/30/2011 6/30/2010 6/30/2009 6/30/2008 6/30/2007
Additions by Source
Employer Contributions $ 7,044 $ 6,679 $ 6,587 $ 6,478 $ 6,454 $ 5,251 $ 5,271 $ 6,371 $ 6,064 $ 3,278
Employee Contributions 5,895 5,561 5,489 5,396 5,376 4,166 4,173 5,501 5,239 3,278
Investment Income (Loss)1 25,354 49,046 176,856 106,664 11,481 158,571 91,335 (210,676) (10,992) 171,393
Transfers 429 293 510 574 54 415 10 331 89 163
Miscellaneous2 3,437 1,179 1,467 1,692 2,010 1,385 1,399 500 478 385
Total Additions 42,159 62,758 190,909 120,804 25,375 169,788 102,188 (197,973) 878 178,497
Deductions by Type
Benefits 53,651 49,772 47,143 43,521 40,368 38,387 36,116 34,522 32,963 31,393
Refunds 508 303 367 304 262 315 127 211 269 291
Transfers 76 – – 88 32 22 14 160 8 –
Administrative Expenses 448 425 431 538 392 356 364 354 391 381
Total Deductions 54,683 50,500 47,941 44,451 41,054 39,080 36,621 35,247 33,631 32,065
Total Changes in Fiduciary Net Position $ (12,524) $ 12,258 $ 142,968 $ 76,353 $ (15,679) $ 130,708 $ 65,567 $ (233,220) $ (32,753) $ 146,432
Fiduciary Net Position
Beginning of Year 1,110,799 1,098,541 955,573 879,220 894,899 764,191 698,624 931,844 964,597 818,165
End of Year $ 1,098,275 $ 1,110,799 $ 1,098,541 $ 955,573 $ 879,220 $ 894,899 $ 764,191 $ 698,624 $ 931,844 $ 964,597
Employer Contributions: % of Covered Payroll 8.1% 7.9% 7.9% 7.9% 7.9% 6.4% 6.4% 7.7% 7.7% 4.5%
1 “Investment income” reflects dividends, interest, realized capital gains, and unrealized gains and losses.
2 “Miscellaneous additions” include restorations of employee contributions.

184
DRS s
Statistical Section — C
omprehensive A
nnual Financial Report
Schedule of Changes in Fiduciary Net Position (cont.)
JRSDollars in Thousands
6/30/2016 6/30/2015 6/30/2014 6/30/2013 6/30/2012 6/30/2011 6/30/2010 6/30/2009 6/30/2008 6/30/2007
Additions by Source
Employer Contributions $ – $ – $ – $ 12 $ 31 $ 46 $ 79 $ 105 $ 112 $ 111
Employee Contributions – – – 12 31 46 79 104 112 111
State Contributions 9,500 10,600 10,600 10,100 8,100 10,860 11,570 10,200 9,600 9,539
Investment Income (Loss)1 78 39 26 (11) 13 8 11 48 98 139
Transfers – – – – – – – – – –
Miscellaneous2 3 2 2 2 1 2 2 1 1 –
Total Additions 9,581 10,641 10,628 10,115 8,176 10,962 11,741 10,458 9,923 9,900
Deductions by Type
Benefits 9,131 9,336 9,480 9,697 9,764 9,738 9,723 9,583 9,514 9,356
Refunds – – – – – – – 7 – –
Transfers – – – – – – – – – –
Administrative Expenses 2 2 2 2 2 2 2 1 – –
Total Deductions 9,133 9,338 9,482 9,699 9,766 9,740 9,725 9,591 9,514 9,356
Total Changes in Fiduciary Net Position $ 448 $ 1,303 $ 1,146 $ 416 $ (1,590) $ 1,222 $ 2,016 $ 867 $ 409 $ 544
Fiduciary Net Position
Beginning of Year 6,336 5,033 3,887 3,471 5,061 3,839 1,823 956 547 3
End of Year $ 6,784 $ 6,336 $ 5,033 $ 3,887 $ 3,471 $ 5,061 $ 3,839 $ 1,823 $ 956 $ 547
Employer Contributions: % of Covered Payroll n/a n/a n/a 7.5% 7.5% 7.5% 7.5% 7.5% 7.5% 7.5%
1 “Investment income” reflects dividends, interest, realized capital gains, and unrealized gains and losses.
2 “Miscellaneous additions” include restorations of employee contributions.

Com
prehensive Annual Financial Report —
Statistical Section s D
RS 185
Schedule of Changes in Fiduciary Net Position (cont.)
JRFDollars in Thousands
6/30/2016 6/30/2015 6/30/2014 6/30/2013 6/30/2012 6/30/2011 6/30/2010 6/30/2009 6/30/2008 6/30/2007
Additions by Source
Employer Contributions $ – $ – $ – $ – $ – $ – $ – $ – $ – $ –
Employee Contributions – – – – – – – – – –
State Contributions 501 – – – – – – – – 300
Investment Income (Loss)1 7 4 8 (5) 19 11 48 141 179 184
Transfers – – – – – – – – – –
Miscellaneous2 – – – – 1 1 1 2 1 2
Total Additions 508 4 8 (5) 20 12 49 143 180 486
Deductions by Type
Benefits 440 444 444 474 482 499 500 501 545 581
Refunds – – – – – – – – – –
Transfers – – – – – – – 1 – –
Administrative Expenses 1 – – 1 1 1 1 1 2 1
Total Deductions 441 444 444 475 483 500 501 503 547 582
Total Changes in Fiduciary Net Position $ 67 $ (440) $ (436) $ (480) $ (463) $ (488) $ (452) $ (360) $ (367) $ (96)
Fiduciary Net Position
Beginning of Year 516 956 1,392 1,872 2,335 2,823 3,275 3,635 4,002 4,098
End of Year $ 583 $ 516 $ 956 $ 1,392 $ 1,872 $ 2,335 $ 2,823 $ 3,275 $ 3,635 $ 4,002
Employer Contributions: % of Covered Payroll n/a n/a n/a n/a n/a n/a n/a n/a n/a n/a
1 “Investment income” reflects dividends, interest, realized capital gains, and unrealized gains and losses.
2 “Miscellaneous additions” include restorations of employee contributions.
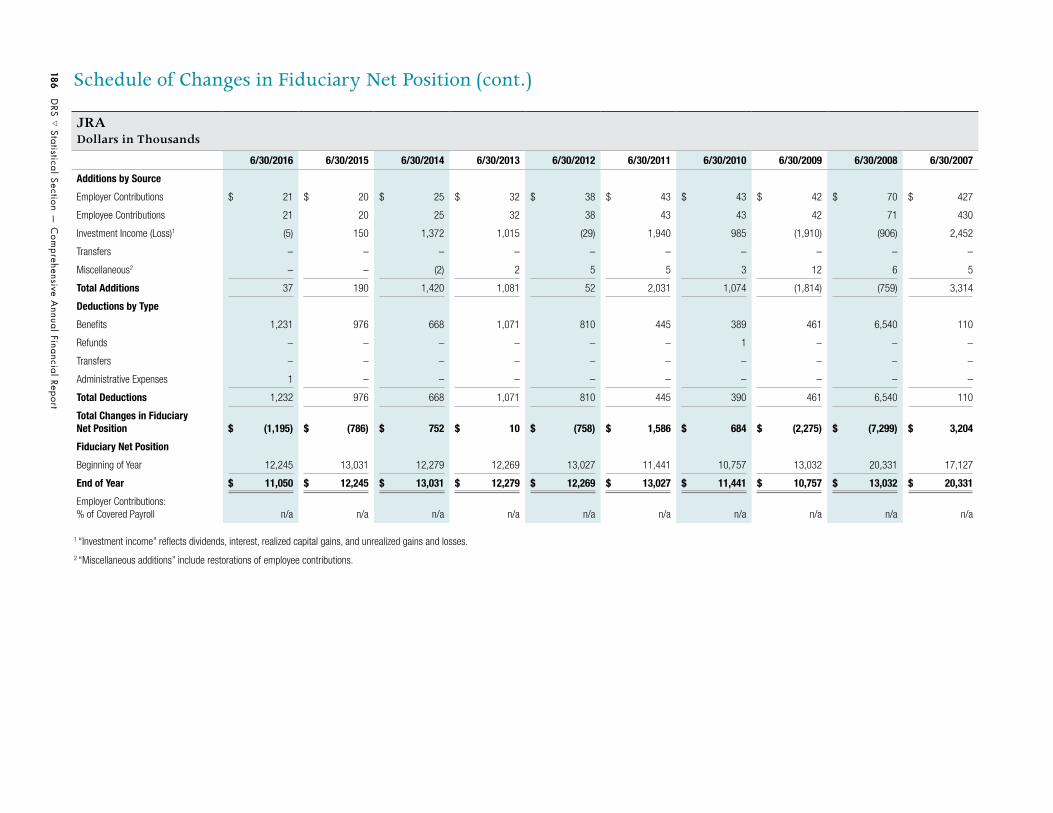
186 D
RS s Statistical Section —
Com
prehensive Annual Financial Report
Schedule of Changes in Fiduciary Net Position (cont.)
JRADollars in Thousands
6/30/2016 6/30/2015 6/30/2014 6/30/2013 6/30/2012 6/30/2011 6/30/2010 6/30/2009 6/30/2008 6/30/2007
Additions by Source
Employer Contributions $ 21 $ 20 $ 25 $ 32 $ 38 $ 43 $ 43 $ 42 $ 70 $ 427
Employee Contributions 21 20 25 32 38 43 43 42 71 430
Investment Income (Loss)1 (5) 150 1,372 1,015 (29) 1,940 985 (1,910) (906) 2,452
Transfers – – – – – – – – – –
Miscellaneous2 – – (2) 2 5 5 3 12 6 5
Total Additions 37 190 1,420 1,081 52 2,031 1,074 (1,814) (759) 3,314
Deductions by Type
Benefits 1,231 976 668 1,071 810 445 389 461 6,540 110
Refunds – – – – – – 1 – – –
Transfers – – – – – – – – – –
Administrative Expenses 1 – – – – – – – – –
Total Deductions 1,232 976 668 1,071 810 445 390 461 6,540 110
Total Changes in Fiduciary Net Position $ (1,195) $ (786) $ 752 $ 10 $ (758) $ 1,586 $ 684 $ (2,275) $ (7,299) $ 3,204
Fiduciary Net Position
Beginning of Year 12,245 13,031 12,279 12,269 13,027 11,441 10,757 13,032 20,331 17,127
End of Year $ 11,050 $ 12,245 $ 13,031 $ 12,279 $ 12,269 $ 13,027 $ 11,441 $ 10,757 $ 13,032 $ 20,331
Employer Contributions: % of Covered Payroll n/a n/a n/a n/a n/a n/a n/a n/a n/a n/a
1 “Investment income” reflects dividends, interest, realized capital gains, and unrealized gains and losses.
2 “Miscellaneous additions” include restorations of employee contributions.

Com
prehensive Annual Financial Report —
Statistical Section s D
RS 187
1 “Investment income” reflects dividends, interest, realized capital gains, and unrealized gains and losses.
Schedule of Changes in Fiduciary Net Position (cont.)
DCPDollars in Thousands
6/30/2016 6/30/2015 6/30/2014 6/30/2013 6/30/2012 6/30/2011 6/30/2010 6/30/2009 6/30/2008 6/30/2007
Additions by Source
Participant Contributions $ 213,531 $ 208,424 $ 190,538 $ 182,305 $ 178,449 $ 186,734 $ 185,120 $ 184,544 $ 188,735 $ 175,055
Investment Income (Loss)1 12,008 51,431 397,083 263,381 (12,292) 451,033 203,075 (344,592) (169,322) 314,273
Charges for Services 2,317 2,347 1,949 1,566 1,677 1,610 1,780 1,405 838 689
Transfers – – – – – – – – – –
Miscellaneous 3 11 314 527 794 1,461 1,145 690 833 854
Total Additions 227,859 262,213 589,884 447,779 168,628 640,838 391,120 (157,953) 21,084 490,871
Deductions by Type
Refunds 215,450 225,334 212,298 178,638 171,741 149,010 108,578 106,645 135,877 127,198
Transfers – – – – – – – 2 – 3
Administrative Expenses 1,941 2,196 1,651 1,568 1,594 1,735 1,512 1,468 1,488 1,445
Total Deductions 217,391 227,530 213,949 180,206 173,335 150,745 110,090 108,115 137,365 128,646
Total Changes in Fiduciary Net Position $ 10,468 $ 34,683 $ 375,935 $ 267,573 $ (4,707) $ 490,093 $ 281,030 $ (266,068) $ (116,281) $ 362,225
Fiduciary Net Position
Beginning of Year 3,613,923 3,579,240 3,203,305 2,935,732 2,940,439 2,450,346 2,169,316 2,435,384 2,551,665 2,189,440
End of Year $ 3,624,391 $ 3,613,923 $ 3,579,240 $ 3,203,305 $ 2,935,732 $ 2,940,439 $ 2,450,346 $ 2,169,316 $ 2,435,384 $ 2,551,665
Employer Contributions: % of Covered Payroll n/a n/a n/a n/a n/a n/a n/a n/a n/a n/a

188 DRS s Statistical Section — Comprehensive Annual Financial Report
Distribution of Membership by System and Plan
Active MembersFor the Years Ended June 30, 2008–2015, and September 30, 2006–2007
Plan 2015 2014 2013 2012 2011 2010 2009 2008 2007 2006
PERS 1 % 1.30% 1.61% 1.94% 2.29% 2.64% 3.03% 3.43% 3.86% 4.41% 4.85%
Individuals 3,927 4,782 5,653 6,635 7,733 9,007 10,354 11,663 12,975 14,213
Avg. Age 64 63 62 61 61 60 59 59 58 57
PERS 2 % 39.09% 39.47% 39.73% 40.00% 39.92% 40.27% 40.35% 40.81% 41.00% 40.39%
Individuals 117,768 116,985 115,751 115,877 117,096 119,826 121,800 123,285 120,625 118,341
Avg. Age 48 48 48 48 48 48 47 47 46 46
PERS 3 % 10.49% 10.36% 10.06% 9.69% 9.41% 9.31% 8.97% 8.85% 8.30% 7.67%
Individuals 31,602 30,694 29,302 28,078 27,588 27,693 27,081 26,720 24,422 22,473
Avg. Age 43 43 44 44 43 43 42 42 42 42
SERS 2 % 8.12% 7.75% 7.47% 7.20% 7.09% 6.84% 6.69% 6.38% 6.04% 6.30%
Individuals 24,479 22,950 21,760 20,846 20,784 20,358 20,197 19,264 17,767 18,464
Avg. Age 50 51 51 51 51 51 51 51 51 51
SERS 3 % 10.40% 10.40% 10.48% 10.60% 10.76% 10.75% 10.69% 10.76% 11.24% 11.04%
Individuals 31,326 30,832 30,535 30,712 31,548 31,981 32,277 32,510 33,058 32,354
Avg. Age 50 51 51 50 50 49 49 48 47 47
PSERS 2 % 1.73% 1.63% 1.55% 1.47% 1.43% 1.42% 1.44% 1.32% 0.94% 0.71%
Individuals 5,202 4,820 4,513 4,250 4,187 4,210 4,340 3,981 2,755 2,073
Avg. Age 40 40 40 40 40 39 38 37 38 39
TRS 1 % 0.45% 0.62% 0.82% 1.04% 1.27% 1.54% 1.72% 2.01% 2.15% 2.52%
Individuals 1,353 1,824 2,393 3,019 3,740 4,591 5,204 6,061 6,331 7,382
Avg. Age 65 64 63 62 62 61 60 59 58 58
TRS 2 % 5.09% 4.60% 4.14% 3.74% 3.51% 3.17% 3.04% 2.68% 2.30% 2.38%
Individuals 15,342 13,632 12,071 10,849 10,285 9,442 9,174 8,103 6,752 6,983
Avg. Age 42 43 44 46 46 48 48 49 52 51
TRS 3 % 17.30% 17.50% 17.67% 17.77% 17.79% 17.57% 17.56% 17.33% 17.63% 18.22%
Individuals 52,125 51,837 51,471 51,489 52,178 52,292 53,010 52,360 51,856 53,371
Avg. Age 46 46 46 46 45 45 44 43 43 42
LEOFF 1 % 0.03% 0.04% 0.05% 0.06% 0.08% 0.10% 0.12% 0.14% 0.17% 0.20%
Individuals 82 120 143 186 250 301 356 421 513 596
Avg. Age 64 63 62 61 60 60 59 58 57 56
LEOFF 2 % 5.65% 5.66% 5.73% 5.77% 5.73% 5.64% 5.62% 5.50% 5.47% 5.37%
Individuals 17,019 16,773 16,687 16,720 16,805 16,775 16,951 16,626 16,099 15,718
Avg. Age 44 44 44 43 43 42 42 41 41 41
WSPRS 1 % 0.19% 0.21% 0.22% 0.25% 0.26% 0.27% 0.28% 0.28% 0.30% 0.31%
Individuals 560 609 657 712 767 806 830 851 885 906
Avg. Age 47 46 46 45 45 44 43 42 41 41
WSPRS 2 % 0.16% 0.15% 0.14% 0.12% 0.11% 0.09% 0.09% 0.08% 0.05% 0.04%
Individuals 475 435 409 354 315 281 264 234 152 116
Avg. Age 33 33 33 32 32 32 31 30 31 30
JRS % 0.00% 0.00% 0.00% 0.00% 0.00% 0.00% 0.00% 0.00% 0.00% 0.00%
Individuals – – – 2 3 5 9 10 11 11
Avg. Age n/a n/a n/a 66 69 69 69 67 66 66
JRF % 0.00% 0.00% 0.00% 0.00% 0.00% 0.00% 0.00% 0.00% 0.00% 0.00%
Individuals – – – – – – – – – –
Avg. Age n/a n/a n/a n/a n/a n/a n/a n/a n/a n/a
Totals % 100.00% 100.00% 100.00% 100.00% 100.00% 100.00% 100.00% 100.00% 100.00% 100.00%
Individuals 301,260 296,293 291,345 289,729 293,279 297,568 301,847 302,089 294,201 293,001

Comprehensive Annual Financial Report — Statistical Section s DRS 189
Distribution of Membership by System and Plan (cont.)
Source: Office of the State Actuary
Figures are as of the latest valuation date for each year.
Inactive and Retired MembersFor the Years Ended June 30, 2008–2015, and September 30, 2006–2007
Plan 2015 2014 2013 2012 2011 2010 2009 2008 2007 2006
PERS 1 % 23.10% 24.57% 26.14% 27.70% 29.18% 30.63% 31.87% 33.11% 34.34% 35.47%
Individuals 51,269 52,248 53,244 54,266 55,053 55,721 56,272 56,852 57,342 57,509
Avg. Age 75 75 74 74 74 74 73 73 73 73
PERS 2 % 29.52% 28.73% 27.84% 26.93% 26.06% 25.04% 24.14% 23.23% 22.34% 21.88%
Individuals 65,523 61,105 56,712 52,773 49,167 45,556 42,614 39,890 37,302 35,485
Avg. Age 64 63 63 62 62 61 60 60 59 59
PERS 3 % 3.67% 3.39% 3.15% 2.92% 2.69% 2.46% 2.29% 2.12% 1.91% 1.74%
Individuals 8,147 7,209 6,419 5,718 5,068 4,482 4,045 3,647 3,183 2,817
Avg. Age 60 59 58 57 56 55 54 53 52 51
SERS 2 % 5.47% 5.25% 5.04% 4.81% 4.61% 4.44% 4.26% 3.99% 3.61% 3.36%
Individuals 12,134 11,153 10,274 9,429 8,697 8,069 7,514 6,845 6,019 5,442
Avg. Age 64 63 62 62 61 60 58 58 57 56
SERS 3 % 5.97% 5.55% 5.10% 4.67% 4.24% 3.86% 3.57% 3.28% 2.87% 2.60%
Individuals 13,241 11,788 10,393 9,142 7,993 7,015 6,308 5,628 4,796 4,210
Avg. Age 62 62 61 60 60 59 58 57 56 56
PSERS 2 % 0.17% 0.13% 0.08% 0.04% 0.01% 0.01% 0.00% 0.00% – –
Individuals 374 275 162 87 16 7 2 1 – –
Avg. Age 47 46 47 48 59 58 63 66 – –
TRS 1 % 16.00% 16.92% 17.82% 18.65% 19.45% 20.18% 20.88% 21.45% 22.41% 22.80%
Individuals 35,506 35,962 36,303 36,531 36,699 36,716 36,875 36,839 37,420 36,969
Avg. Age 75 74 74 73 73 72 72 71 71 71
TRS 2 % 3.03% 2.94% 2.84% 2.76% 2.69% 2.63% 2.59% 2.57% 2.57% 2.54%
Individuals 6,733 6,251 5,775 5,408 5,080 4,787 4,576 4,418 4,288 4,116
Avg. Age 66 65 65 64 63 62 61 60 59 58
TRS 3 % 7.08% 6.47% 5.88% 5.37% 4.84% 4.41% 4.04% 3.84% 3.48% 3.07%
Individuals 15,712 13,749 11,965 10,524 9,134 8,017 7,136 6,592 5,811 4,978
Avg. Age 61 61 60 59 58 58 57 56 55 54
LEOFF 1 % 3.38% 3.58% 3.80% 4.00% 4.20% 4.40% 4.58% 4.74% 4.89% 5.04%
Individuals 7,507 7,607 7,730 7,845 7,933 8,009 8,089 8,135 8,165 8,177
Avg. Age 73 72 72 71 70 70 69 68 68 67
LEOFF 2 % 2.02% 1.87% 1.71% 1.55% 1.42% 1.33% 1.16% 1.04% 0.93% 0.85%
Individuals 4,495 3,984 3,480 3,033 2,670 2,420 2,039 1,783 1,553 1,376
Avg. Age 59 58 58 57 56 55 54 54 53 52
WSPRS 1 % 0.52% 0.53% 0.53% 0.53% 0.53% 0.53% 0.54% 0.55% 0.56% 0.56%
Individuals 1,156 1,120 1,083 1,035 992 970 956 947 933 918
Avg. Age 66 66 66 66 65 65 65 64 64 64
WSPRS 2 % 0.01% 0.01% 0.00% 0.00% 0.00% 0.00% 0.00% 0.00% 0.00% –
Individuals 20 15 10 8 6 6 4 2 1 –
Avg. Age 38 38 36 36 37 35 33 32 29 –
JRS % 0.05% 0.05% 0.06% 0.06% 0.07% 0.07% 0.07% 0.07% 0.08% 0.08%
Individuals 106 108 114 119 124 125 124 128 131 133
Avg. Age 81 80 80 80 80 79 79 79 78 77
JRF % 0.01% 0.01% 0.01% 0.01% 0.01% 0.01% 0.01% 0.01% 0.01% 0.01%
Individuals 12 12 12 12 13 13 13 13 15 15
Avg. Age 85 84 83 83 83 82 81 80 79 79
Totals % 100.00% 100.00% 100.00% 100.00% 100.00% 100.00% 100.00% 100.00% 100.00% 100.00%
Individuals 221,935 212,586 203,676 195,930 188,645 181,913 176,567 171,720 166,959 162,145

190 DRS s Statistical Section — Comprehensive Annual Financial Report
Principal Participating Employers by Plan
PERS Plan 1Current Year and Nine Years Prior
For Fiscal Year Ended June 30, 2016 2007 (calendar year statistics)
EmployerCovered
Employees Rank% of
Total Plan EmployerCovered
Employees Rank% of
Total Plan
State of Washington1 1,446 1 44.1% State of Washington 6,715 1 49.3%
King County 193 2 5.9% KC Metro 383 2 2.8%
Seattle SD 001 74 3 2.3% King County 382 3 2.8%
Snohomish County 39 4 1.2% Seattle SD 001 201 4 1.5%
Pierce County 38 5 1.2% Pierce County 160 5 1.2%
Spokane Public Schools 24 6 0.7% Snohomish County 145 6 1.1%
City of Everett 20 7 0.6% Spokane County 98 7 0.7%
Spokane County 20 8 0.6% Thurston County 92 8 0.7%
Tacoma SD 010 20 9 0.6% Spokane Public Schools 86 9 0.6%
Kent SD 415 18 10 0.5% Tacoma SD 010 86 10 0.6%
All Other Employers2 1,390 42.3% All Other Employers 5,283 38.7%
Total (435 Employers) 3,282 100.0% Total (650 Employers) 13,631 100.0%
1 Includes 115 component units of the state
2 In 2016, “all other employers” consisted of the employers at left.All Other Employers Number Employees
State of Washington – –
School Districts 187 735
Counties/Municipalities 118 382
Other Political Subdivisions 120 273
Total 425 1,390
1 Includes 153 component units of the state
2 In 2016, “all other employers” consisted of the employers at left.
PERS Plan 2Current Year and Nine Years Prior
For Fiscal Year Ended June 30, 2016 2007 (calendar year statistics)
EmployerCovered
Employees Rank% of
Total Plan EmployerCovered
Employees Rank% of
Total Plan
State of Washington1 63,186 1 51.8% State of Washington 68,131 1 53.1%
King County 10,131 2 8.3% King County 4,746 2 3.7%
Pierce County 2,018 3 1.7% KC Metro 4,453 3 3.5%
Snohomish County 1,861 4 1.5% Pierce County 2,578 4 2.0%
Spokane County 1,331 5 1.1% Snohomish County 2,330 5 1.8%
Clark County 1,129 6 0.9% Spokane County 1,536 6 1.2%
Snohomish County PUD 01 903 7 0.7% Clark County 1,366 7 1.0%
Port of Seattle 879 8 0.7% King County Public Health Dept. 1,177 8 0.9%
City of Bellevue 821 9 0.7% City of Bellevue 908 9 0.7%
Energy Northwest 813 10 0.7% Kitsap County 896 10 0.7%
All Other Employers2 38,865 31.9% All Other Employers 40,260 31.4%
Total (794 Employers) 121,937 100.0% Total (733 Employers) 128,381 100.0%
All Other Employers Number Employees
State of Washington – –
School Districts – –
Counties/Municipalities 272 21,104
Other Political Subdivisions 512 17,761
Total 784 38,865

Comprehensive Annual Financial Report — Statistical Section s DRS 191
Principal Participating Employers by Plan (cont.)
1 Includes 145 component units of the state
2 In 2016, “all other employers” consisted of the employers at left.
PERS Plan 3Current Year and Nine Years Prior
For Fiscal Year Ended June 30, 2016 2007 (calendar year statistics)
EmployerCovered
Employees Rank% of
Total Plan EmployerCovered
Employees Rank% of
Total Plan
State of Washington1 20,864 1 63.7% State of Washington 16,870 1 63.4%
King County 1,961 2 6.0% King County 758 2 2.8%
Metropolitan Park Dist. of Tacoma 461 3 1.4% KC Metro 598 3 2.2%
Pierce County 452 4 1.4% Pierce County 448 4 1.7%
Snohomish County 345 5 1.1% Energy Northwest 337 5 1.3%
Energy Northwest 330 6 1.0% Snohomish County 319 6 1.2%
Spokane County 243 7 0.7% King County Public Health Dept. 269 7 1.0%
Clark County 230 8 0.7% Yakima County 217 8 0.8%
Port of Seattle 209 9 0.6% Spokane County 216 9 0.8%
Kitsap County 200 10 0.6% Clark County 207 10 0.8%
All Other Employers2 7,461 22.8% All Other Employers 6,378 24.0%
Total (543 Employers) 32,756 100.0% Total (447 Employers) 26,617 100.0%
All Other Employers Number Employees
State of Washington – –
School Districts – –
Counties/Municipalities 206 4,171
Other Political Subdivisions 327 3,290
Total 533 7,461
SERS Plan 2Current Year and Nine Years Prior
For Fiscal Year Ended June 30, 2016 2007 (calendar year statistics)
EmployerCovered
Employees Rank% of
Total Plan EmployerCovered
Employees Rank% of
Total Plan
Seattle SD 001 1,264 1 4.5% Seattle SD 001 945 1 5.0%
Tacoma SD 010 686 2 2.4% Tacoma SD 010 689 2 3.6%
Highline SD 401 620 3 2.2% Spokane Public Schools 507 3 2.6%
Spokane Public Schools 569 4 2.0% Vancouver SD 037 470 4 2.5%
Kent SD 415 547 5 2.0% Kent SD 415 453 5 2.4%
Vancouver SD 037 547 6 2.0% Highline SD 401 446 6 2.3%
Bellevue SD 405 511 7 1.8% Federal Way SD 210 368 7 1.9%
Evergreen SD 114 500 8 1.8% Edmonds SD 015 356 8 1.9%
Puyallup SD 003 479 9 1.7% Lake Washington SD 414 321 9 1.7%
Lake Washington SD 414 463 10 1.7% Northshore SD 417 318 10 1.7%
All Other Employers1 21,750 77.9% All Other Employers 14,172 74.4%
Total (307 Employers) 27,936 100.0% Total (303 Employers) 19,045 100.0%
All Other Employers Number Employees
State of Washington – –
School Districts 297 21,750
Counties/Municipalities – –
Other Political Subdivisions – –
Total 297 21,750
1 In 2016, “all other employers” consisted of the employers at left.
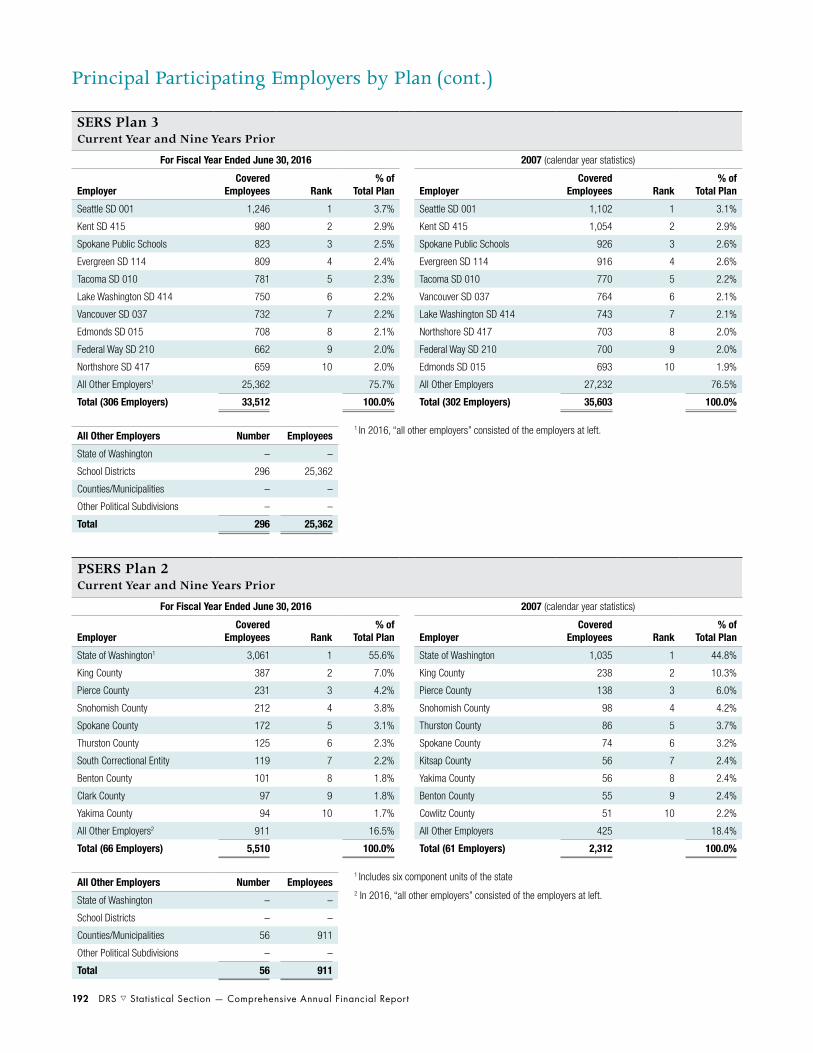
192 DRS s Statistical Section — Comprehensive Annual Financial Report
Principal Participating Employers by Plan (cont.)
1 In 2016, “all other employers” consisted of the employers at left.
1 Includes six component units of the state
2 In 2016, “all other employers” consisted of the employers at left.
SERS Plan 3Current Year and Nine Years Prior
For Fiscal Year Ended June 30, 2016 2007 (calendar year statistics)
EmployerCovered
Employees Rank% of
Total Plan EmployerCovered
Employees Rank% of
Total Plan
Seattle SD 001 1,246 1 3.7% Seattle SD 001 1,102 1 3.1%
Kent SD 415 980 2 2.9% Kent SD 415 1,054 2 2.9%
Spokane Public Schools 823 3 2.5% Spokane Public Schools 926 3 2.6%
Evergreen SD 114 809 4 2.4% Evergreen SD 114 916 4 2.6%
Tacoma SD 010 781 5 2.3% Tacoma SD 010 770 5 2.2%
Lake Washington SD 414 750 6 2.2% Vancouver SD 037 764 6 2.1%
Vancouver SD 037 732 7 2.2% Lake Washington SD 414 743 7 2.1%
Edmonds SD 015 708 8 2.1% Northshore SD 417 703 8 2.0%
Federal Way SD 210 662 9 2.0% Federal Way SD 210 700 9 2.0%
Northshore SD 417 659 10 2.0% Edmonds SD 015 693 10 1.9%
All Other Employers1 25,362 75.7% All Other Employers 27,232 76.5%
Total (306 Employers) 33,512 100.0% Total (302 Employers) 35,603 100.0%
All Other Employers Number Employees
State of Washington – –
School Districts 296 25,362
Counties/Municipalities – –
Other Political Subdivisions – –
Total 296 25,362
PSERS Plan 2Current Year and Nine Years Prior
For Fiscal Year Ended June 30, 2016 2007 (calendar year statistics)
EmployerCovered
Employees Rank% of
Total Plan EmployerCovered
Employees Rank% of
Total Plan
State of Washington1 3,061 1 55.6% State of Washington 1,035 1 44.8%
King County 387 2 7.0% King County 238 2 10.3%
Pierce County 231 3 4.2% Pierce County 138 3 6.0%
Snohomish County 212 4 3.8% Snohomish County 98 4 4.2%
Spokane County 172 5 3.1% Thurston County 86 5 3.7%
Thurston County 125 6 2.3% Spokane County 74 6 3.2%
South Correctional Entity 119 7 2.2% Kitsap County 56 7 2.4%
Benton County 101 8 1.8% Yakima County 56 8 2.4%
Clark County 97 9 1.8% Benton County 55 9 2.4%
Yakima County 94 10 1.7% Cowlitz County 51 10 2.2%
All Other Employers2 911 16.5% All Other Employers 425 18.4%
Total (66 Employers) 5,510 100.0% Total (61 Employers) 2,312 100.0%
All Other Employers Number Employees
State of Washington – –
School Districts – –
Counties/Municipalities 56 911
Other Political Subdivisions – –
Total 56 911

Comprehensive Annual Financial Report — Statistical Section s DRS 193
Principal Participating Employers by Plan (cont.)
1 Includes 31 component units of the state
2 In 2016, “all other employers” consisted of the employers at left.
1 In 2016, “all other employers” consisted of the employers at left.
2 Includes 28 component units of the state
TRS Plan 1Current Year and Nine Years Prior
For Fiscal Year Ended June 30, 2016 2007 (calendar year statistics)
EmployerCovered
Employees Rank% of
Total Plan EmployerCovered
Employees Rank% of
Total Plan
Seattle SD 001 54 1 5.5% Seattle SD 001 420 1 5.7%
State of Washington1 52 2 5.3% State of Washington 407 2 5.6%
Tacoma SD 010 37 3 3.8% Tacoma SD 010 273 3 3.7%
Lake Washington SD 414 27 4 2.7% Spokane Public Schools 216 4 3.0%
Northshore SD 417 26 5 2.6% Lake Washington SD 414 183 5 2.5%
Spokane Public Schools 25 6 2.5% Northshore SD 417 183 6 2.5%
Evergreen SD 114 20 7 2.0% Evergreen SD 114 144 7 2.0%
Everett SD 002 18 8 1.8% Vancouver SD 037 137 8 1.9%
Highline SD 401 17 9 1.7% Kent SD 415 135 9 1.8%
Olympia SD 111 17 10 1.7% Edmonds SD 015 124 10 1.7%
All Other Employers2 696 70.4% All Other Employers 5,093 69.6%
Total (190 Employers) 989 100.0% Total (289 Employers) 7,315 100.0%
All Other Employers Number Employees
State of Washington – –
School Districts 180 696
Counties/Municipalities – –
Other Political Subdivisions – –
Total 180 696
TRS Plan 2Current Year and Nine Years Prior
For Fiscal Year Ended June 30, 2016 2007 (calendar year statistics)
EmployerCovered
Employees Rank% of
Total Plan EmployerCovered
Employees Rank% of
Total Plan
Seattle SD 001 1,363 1 7.2% Seattle SD 001 527 1 6.0%
Tacoma SD 010 552 2 2.9% Tacoma SD 010 387 2 4.4%
Kent SD 415 473 3 2.5% Spokane Public Schools 303 3 3.4%
Lake Washington SD 414 467 4 2.5% Vancouver SD 037 204 4 2.3%
Highline SD 401 463 5 2.5% Bellevue SD 405 200 5 2.3%
Spokane Public Schools 461 6 2.4% Evergreen SD 114 194 6 2.2%
Evergreen SD 114 454 7 2.4% Kent SD 415 191 7 2.2%
Vancouver SD 037 435 8 2.3% Bethel SD 403 174 8 2.0%
Federal Way SD 210 409 9 2.2% Everett SD 002 171 9 2.0%
Bellevue SD 405 387 10 2.1% Issaquah SD 411 171 10 2.0%
All Other Employers1 13,356 71.0% All Other Employers 6,235 71.2%
Total (306 Employers) 18,820 100.0% Total (279 Employers) 8,757 100.0%
All Other Employers Number Employees
State of Washington2 1 85
School Districts 295 13,271
Counties/Municipalities – –
Other Political Subdivisions – –
Total 296 13,356

194 DRS s Statistical Section — Comprehensive Annual Financial Report
Principal Participating Employers by Plan (cont.)
1 In 2016, “all other employers” consisted of the employers at left.
2 Includes 48 component units of the state
1 In 2016, “all other employers” consisted of the employers at left.
TRS Plan 3Current Year and Nine Years Prior
For Fiscal Year Ended June 30, 2016 2007 (calendar year statistics)
EmployerCovered
Employees Rank% of
Total Plan EmployerCovered
Employees Rank% of
Total Plan
Seattle SD 001 2,640 1 4.7% Seattle SD 001 2,541 1 4.6%
Spokane Public Schools 1,853 2 3.3% Spokane Public Schools 1,762 2 3.2%
Tacoma SD 010 1,616 3 2.9% Tacoma SD 010 1,542 3 2.8%
Kent SD 415 1,496 4 2.7% Evergreen SD 114 1,527 4 2.7%
Lake Washington SD 414 1,473 5 2.6% Kent SD 415 1,453 5 2.6%
Evergreen SD 114 1,421 6 2.5% Lake Washington SD 414 1,301 6 2.4%
Vancouver SD 037 1,217 7 2.2% Federal Way SD 210 1,277 7 2.3%
Federal Way SD 210 1,203 8 2.2% Vancouver SD 037 1,185 8 2.1%
Bellevue SD 405 1,114 9 2.0% Edmonds SD 015 1,136 9 2.1%
Edmonds SD 015 1,107 10 2.0% Bellevue SD 405 1,114 10 2.0%
All Other Employers1 40,768 72.9% All Other Employers 40,462 73.2%
Total (311 Employers) 55,908 100.0% Total (304 Employers) 55,300 100.0%
All Other Employers Number Employees
State of Washington2 1 704
School Districts 300 40,064
Counties/Municipalities – –
Other Political Subdivisions – –
Total 301 40,768
LEOFF Plan 1Current Year and Nine Years Prior
For Fiscal Year Ended June 30, 2016 2007 (calendar year statistics)
EmployerCovered
Employees Rank% of
Total Plan EmployerCovered
Employees Rank% of
Total Plan
City of Seattle 24 1 37.5% City of Seattle 134 1 23.9%
City of Bellevue 3 2 4.7% City of Tacoma 40 2 7.1%
South King Fire & Rescue 3 3 4.7% City of Spokane 38 3 6.8%
Snohomish County FPD 01 3 4 4.7% City of Bellevue 25 4 4.5%
City of Everett 2 5 3.1% City of Bellingham 22 5 3.9%
King County 2 6 3.1% City of Everett 17 6 3.0%
City of Olympia 2 7 3.1% King County 16 7 2.9%
City of Pasco 2 8 3.1% Pierce County FPD 02 13 8 2.3%
City of Spokane 2 9 3.1% City of Renton 12 9 2.1%
Pierce County FPD 03 2 10 3.1% Spokane County 12 10 2.1%
All Other Employers1 19 29.8% All Other Employers 232 41.4%
Total (29 Employers) 64 100.0% Total (95 Employers) 561 100.0%
All Other Employers Number Employees
State of Washington – –
School Districts – –
Counties/Municipalities 16 16
Other Political Subdivisions 3 3
Total 19 19

Comprehensive Annual Financial Report — Statistical Section s DRS 195
Principal Participating Employers by Plan (cont.)
1 In 2016, “all other employers” consisted of the employers at left.
2 Includes eight component units of the state
LEOFF Plan 2Current Year and Nine Years Prior
For Fiscal Year Ended June 30, 2016 2007 (calendar year statistics)
EmployerCovered
Employees Rank% of
Total Plan EmployerCovered
Employees Rank% of
Total Plan
City of Seattle 2,346 1 13.4% City of Seattle 2,172 1 13.5%
King County 764 2 4.4% King County 755 2 4.7%
City of Tacoma 694 3 4.0% City of Tacoma 744 3 4.6%
City of Spokane 598 4 3.4% City of Spokane 520 4 3.3%
City of Bellevue 389 5 2.2% City of Vancouver 373 5 2.3%
City of Vancouver 373 6 2.1% City of Bellevue 339 6 2.1%
City of Everett 346 7 2.0% City of Everett 333 7 2.1%
Pierce County 307 8 1.8% Pierce County 323 8 2.0%
Snohomish County 277 9 1.6% City of Kent 270 9 1.7%
City of Renton 254 10 1.4% Snohomish County 260 10 1.6%
All Other Employers1 11,122 63.7% All Other Employers 9,965 62.1%
Total (369 Employers) 17,470 100.0% Total (375 Employers) 16,054 100.0%
All Other Employers Number Employees
State of Washington2 1 247
School Districts – –
Counties/Municipalities 194 6,646
Other Political Subdivisions 164 4,229
Total 359 11,122
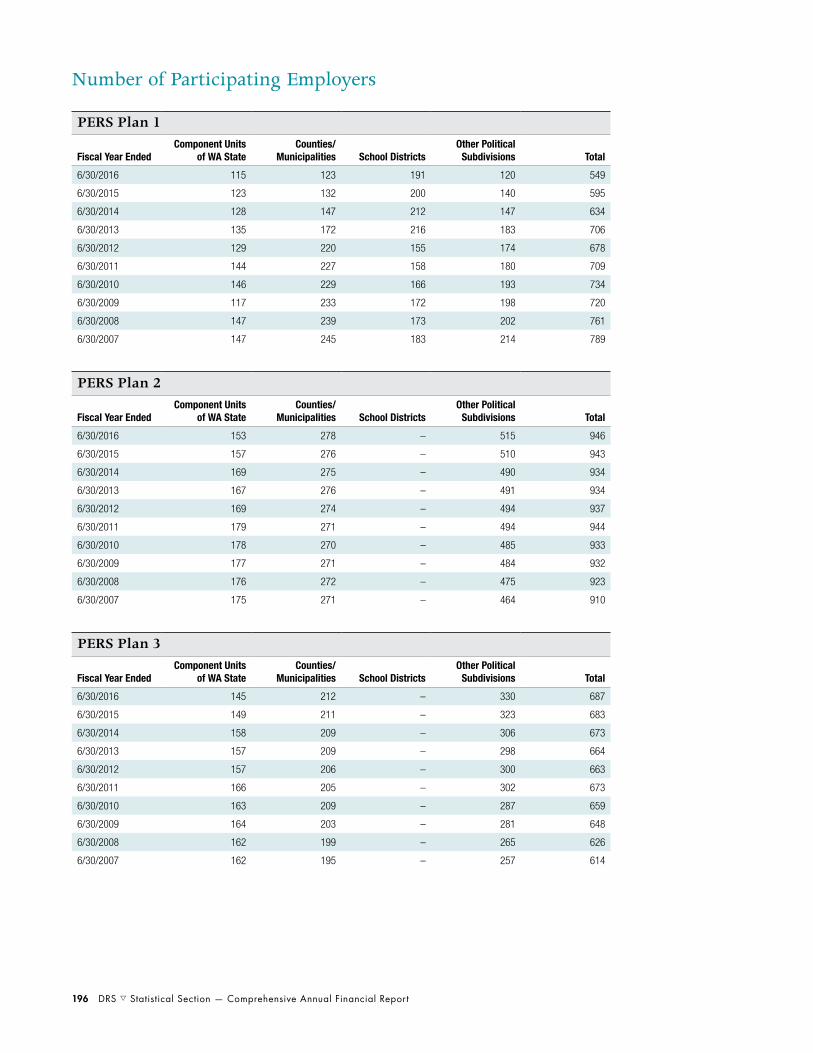
196 DRS s Statistical Section — Comprehensive Annual Financial Report
Number of Participating Employers
PERS Plan 1
Fiscal Year EndedComponent Units
of WA StateCounties/
Municipalities School DistrictsOther Political
Subdivisions Total
6/30/2016 115 123 191 120 549
6/30/2015 123 132 200 140 595
6/30/2014 128 147 212 147 634
6/30/2013 135 172 216 183 706
6/30/2012 129 220 155 174 678
6/30/2011 144 227 158 180 709
6/30/2010 146 229 166 193 734
6/30/2009 117 233 172 198 720
6/30/2008 147 239 173 202 761
6/30/2007 147 245 183 214 789
PERS Plan 2
Fiscal Year EndedComponent Units
of WA StateCounties/
Municipalities School DistrictsOther Political
Subdivisions Total
6/30/2016 153 278 – 515 946
6/30/2015 157 276 – 510 943
6/30/2014 169 275 – 490 934
6/30/2013 167 276 – 491 934
6/30/2012 169 274 – 494 937
6/30/2011 179 271 – 494 944
6/30/2010 178 270 – 485 933
6/30/2009 177 271 – 484 932
6/30/2008 176 272 – 475 923
6/30/2007 175 271 – 464 910
PERS Plan 3
Fiscal Year EndedComponent Units
of WA StateCounties/
Municipalities School DistrictsOther Political
Subdivisions Total
6/30/2016 145 212 – 330 687
6/30/2015 149 211 – 323 683
6/30/2014 158 209 – 306 673
6/30/2013 157 209 – 298 664
6/30/2012 157 206 – 300 663
6/30/2011 166 205 – 302 673
6/30/2010 163 209 – 287 659
6/30/2009 164 203 – 281 648
6/30/2008 162 199 – 265 626
6/30/2007 162 195 – 257 614

Comprehensive Annual Financial Report — Statistical Section s DRS 197
Number of Participating Employers (cont.)
SERS Plan 2
Fiscal Year EndedComponent Units
of WA StateCounties/
Municipalities School DistrictsOther Political
Subdivisions Total
6/30/2016 – – 307 – 307
6/30/2015 – – 302 – 302
6/30/2014 – – 303 – 303
6/30/2013 – – 302 – 302
6/30/2012 – – 299 – 299
6/30/2011 – – 299 – 299
6/30/2010 – – 298 – 298
6/30/2009 – – 298 – 298
6/30/2008 – – 299 – 299
6/30/2007 – – 292 – 292
SERS Plan 3
Fiscal Year EndedComponent Units
of WA StateCounties/
Municipalities School DistrictsOther Political
Subdivisions Total
6/30/2016 – – 306 – 306
6/30/2015 – – 300 – 300
6/30/2014 – – 300 – 300
6/30/2013 – – 301 – 301
6/30/2012 – – 301 – 301
6/30/2011 – – 300 – 300
6/30/2010 1 – 300 – 301
6/30/2009 1 – 301 – 302
6/30/2008 1 – 303 – 304
6/30/2007 – – 294 – 294
PSERS Plan 2
Fiscal Year EndedComponent Units
of WA StateCounties/
Municipalities School DistrictsOther Political
Subdivisions Total
6/30/2016 6 64 – 1 71
6/30/2015 9 65 – 1 75
6/30/2014 9 65 – 1 75
6/30/2013 9 65 – 1 75
6/30/2012 10 65 – 1 76
6/30/2011 11 65 – 1 77
6/30/2010 10 63 – – 73
6/30/2009 10 63 – – 73
6/30/2008 9 62 – – 71
6/30/2007 8 61 – – 69

198 DRS s Statistical Section — Comprehensive Annual Financial Report
Number of Participating Employers (cont.)
TRS Plan 1
Fiscal Year EndedComponent Units
of WA StateCounties/
Municipalities School DistrictsOther Political
Subdivisions Total
6/30/2016 31 – 189 – 220
6/30/2015 34 – 217 – 251
6/30/2014 36 – 228 – 264
6/30/2013 49 – 295 – 344
6/30/2012 47 – 257 – 304
6/30/2011 49 – 263 – 312
6/30/2010 54 – 271 – 325
6/30/2009 62 – 274 – 336
6/30/2008 63 – 276 – 339
6/30/2007 67 – 286 – 353
TRS Plan 2
Fiscal Year EndedComponent Units
of WA StateCounties/
Municipalities School DistrictsOther Political
Subdivisions Total
6/30/2016 28 – 305 – 333
6/30/2015 26 – 295 – 321
6/30/2014 22 – 295 – 317
6/30/2013 36 – 304 – 340
6/30/2012 24 – 295 – 319
6/30/2011 25 – 288 – 313
6/30/2010 23 – 283 – 306
6/30/2009 21 – 282 – 303
6/30/2008 22 – 277 – 299
6/30/2007 22 – 275 – 297
TRS Plan 3
Fiscal Year EndedComponent Units
of WA StateCounties/
Municipalities School DistrictsOther Political
Subdivisions Total
6/30/2016 40 – 310 – 350
6/30/2015 41 – 303 – 344
6/30/2014 39 – 302 – 341
6/30/2013 38 – 303 – 341
6/30/2012 35 – 302 – 337
6/30/2011 28 – 302 – 330
6/30/2010 31 – 302 – 333
6/30/2009 31 – 303 – 334
6/30/2008 30 – 302 – 332
6/30/2007 30 – 303 – 333

Comprehensive Annual Financial Report — Statistical Section s DRS 199
Number of Participating Employers (cont.)
LEOFF Plan 1
Fiscal Year EndedComponent Units
of WA StateCounties/
Municipalities School DistrictsOther Political
Subdivisions Total
6/30/2016 – 23 – 6 29
6/30/2015 – 27 – 6 33
6/30/2014 – 36 – 9 45
6/30/2013 – 41 – 10 51
6/30/2012 – 42 – 12 54
6/30/2011 – 48 – 14 62
6/30/2010 – 54 – 15 69
6/30/2009 – 60 – 16 76
6/30/2008 – 71 – 16 87
6/30/2007 – 74 – 18 92
LEOFF Plan 2
Fiscal Year EndedComponent Units
of WA StateCounties/
Municipalities School DistrictsOther Political
Subdivisions Total
6/30/2016 8 204 – 164 376
6/30/2015 8 205 – 157 370
6/30/2014 8 204 – 157 369
6/30/2013 8 212 – 154 374
6/30/2012 8 212 – 153 373
6/30/2011 8 214 – 152 374
6/30/2010 8 215 – 149 372
6/30/2009 8 217 – 150 375
6/30/2008 7 219 – 148 374
6/30/2007 7 219 – 153 379

200 DRS s Statistical Section — Comprehensive Annual Financial Report
Employers Covered by DRS-Administered Retirement Systems
As of June 30, 2016 — Page 1 of 12
Air Quality Agencies
Benton Clean Air AgencyNW Clean Air AgencyOlympic Region Clean Air
AgencyPuget Sound Clean Air AgencySpokane Regional Clean Air
AgencySW Clean Air AgencyYakima Regional Clean Air
Agency
Airports, Airport Boards
Pangborn Memorial AirportSnohomish Co. AirportSpokane International AirportWalla Walla Regional Airport
Area Agencies on Aging
Aging & Long-Term Care of Eastern WA
Olympic Area Agency on AgingSE WA Aging & Long-Term Care
Associations, Unions
Inlandboatmen's Union of the Pacific
King Co. Directors' AssociationSound Cities AssociationWA Federation of State
Employees
Cemetery Districts
Cowlitz Co. Cemetery Dist. 1, 2 & 5
Pend Oreille Cemetery Dist. 1Skagit Co. Cemetery Dist. 2
Charter Schools
Excel Public Charter SchoolGreen Dot Public SchoolsPRIDE Prep SchoolsRainier PrepSOAR AcademySpokane International AcademySummit Public Schools
Cities and Towns
AberdeenAirway HeightsAlgonaAnacortesArlingtonAsotinAuburnBainbridge IslandBattle GroundBeaux Arts VillageBellevueBellinghamBenton CityBingenBlack DiamondBlaineBonney LakeBothellBremertonBrewsterBridgeportBrierBuckleyBurienBurlingtonCamasCarbonado (Town of)CarnationCashmereCastle RockCathlamet (Town of)Centralia
Cities and Towns (cont.)
ChehalisChelanCheneyChewelahClarkstonCle ElumClyde HillColfaxCollege PlaceColton (Town of)ColvilleConconully (Town of)Concrete (Town of)ConnellCosmopolisCoulee City (Town of)Coulee Dam (Town of)Coupeville (Town of)Creston (Town of)Cusick (Town of)Darrington (Town of)DavenportDaytonDeer ParkDes MoinesDuPontDuvallEast WenatcheeEatonville (Town of)EdgewoodEdmondsElectric City EllensburgElmaElmer City (Town of)EntiatEnumclawEphrataEverettEversonFederal WayFerndale

Comprehensive Annual Financial Report — Statistical Section s DRS 201
Employers Covered by DRS-Administered Retirement Systems (cont.)
As of June 30, 2016 — Page 2 of 12
Cities and Towns (cont.)
FifeFircrestForksFriday Harbor (Town of)Garfield (Town of)GeorgeGig HarborGold BarGoldendaleGrand CouleeGrandviewGranger (Town of)Granite Falls Hamilton (Town of)Harrington (Town of)HoquiamHunts Point (Town of)IlwacoIssaquahKalamaKelsoKenmoreKennewickKentKettle FallsKirklandKittitasLa CenterLa Conner (Town of)LaCrosse (Town of)LaceyLake Forest ParkLake StevensLakewoodLangleyLeavenworthLiberty LakeLind (Town of)Long BeachLongviewLyndenLynnwood
Cities and Towns (cont.)
MabtonMansfield (Town of)Maple ValleyMarysvilleMattawa (City of)McClearyMedical LakeMedinaMercer IslandMetaline Falls (Town of)Mill CreekMillwood (Town of)MiltonMonroeMontesanoMortonMoses LakeMossyrockMount VernonMountlake TerraceMoxeeMukilteoNaches (Town of)NapavineNewcastleNewportNooksackNormandy ParkNorth BendNorth BonnevilleNorthport (Town of)Oak HarborOakesdale (Town of)OakvilleOcean ShoresOdessa (Town of)OkanoganOlympiaOmakOrovilleOrtingOthello
Cities and Towns (cont.)
PacificPalousePascoPaterosPe Ell (Town of)Port AngelesPort OrchardPort TownsendPoulsboProsserPullmanPuyallupQuincyRainierRaymondReardan (Town of)RedmondRentonRepublicRichlandRidgefieldRitzvilleRiverside (Town of)Rock IslandRosalia (Town of)RoslynRoyRoyal CityRuston (Town of)SammamishSeaTacSeattleSedro-WoolleySelahSequimSheltonShorelineSkykomish (Town of)SnohomishSnoqualmieSoap LakeSouth Bend

202 DRS s Statistical Section — Comprehensive Annual Financial Report
Employers Covered by DRS-Administered Retirement Systems (cont.)
As of June 30, 2016 — Page 3 of 12
Cities and Towns (cont.)
South Cle Elum (Town of)Spangle (Town of)SpokaneSpokane ValleySpragueSpringdale (Town of)StanwoodSteilacoom (Town of)StevensonSultanSumasSumnerSunnysideTacomaTekoaTeninoTietonToledoTonasketToppenishTukwilaTumwaterTwisp (Town of)Union GapUniontown (Town of)University PlaceVancouverWaitsburgWalla WallaWapatoWardenWashougalWashtucna (Town of)Waterville (Town of)WenatcheeWest RichlandWestportWhite Salmon Wilbur (Town of) WinlockWinthrop (Town of)Woodinville
Cities and Towns (cont.)
WoodlandWoodway (Town of)Yacolt (Town of)YakimaYarrow Point (Town of)YelmZillah
Conservation Districts
CascadiaClallamColumbiaCowlitzGrays HarborKingKittitasOkanoganPacificSnohomishSpokane Co.Stevens Co.ThurstonWahkiakum
Councils
Columbia River Council of Governments
Cowlitz-Wahkiakum Council of Governments
Grays Harbor Council of Governments
Lewis, Mason, Thurston Council of Governments
Northwest Regional CouncilPacific Mountain Workforce
Development CouncilPuget Sound Regional CouncilSkagit Council of GovernmentsSouth Central Workforce
Council
Councils (cont.)
Spokane Area Workforce Development Council
SW WA Council Government on Aging and Disability
Thurston Regional Planning Council
Whatcom Council of Governments
Counties
AdamsAsotinBentonChelanClallamClarkColumbiaCowlitzDouglasFerryFranklinGarfieldGrantGrays HarborIslandJeffersonKingKitsap KittitasKlickitatLewisLincolnMasonOkanoganPacificPend OreillePierceSan JuanSkagitSkamaniaSnohomish

Comprehensive Annual Financial Report — Statistical Section s DRS 203
Employers Covered by DRS-Administered Retirement Systems (cont.)
As of June 30, 2016 — Page 4 of 12
Counties (cont.)
SpokaneStevens ThurstonWahkiakumWalla WallaWhatcomWhitmanYakima
Development Authorities/Districts
Cultural Development Auth. of King Co.
North Bonneville Public Development Auth.
Seattle Southside Regional Tourism Auth.
Tricounty Economic Development Dist.
Walla Walla Valley Metro Planning Org.
Educational Service Districts
ESD 105ESD 112ESD 113ESD 123North Central WA ESD 171Northeast WA ESD 101Northwest Regional ESD 189Olympic ESD 114Puget Sound ESD 121
Emergency Services and Communications Districts
Franklin Co. Emergency Management
Grays Harbor Communications
Emergency Services and Communications Districts (cont.)
Island Co. Emergency Services Communication Ctr.
Jefferson Co. 911 Communications
KITTCOMMason Co. Emergency
CommunicationsMulti Agency Communications
CenterNORCOM 911North Country Emergency
Medical ServiceRIVERCOMSan Juan Island Emergency
Medical ServiceSkagit 911 (SECOM)SNOCOM 911Snohomish Co. Emergency Radio
SystemSouth Beach Ambulance ServiceSouth Sound 911Thurston 911 CommunicationsValley Communication Center
Fire Protection Districts
Adams Co. FPD 5Asotin Co. FPD 1Bainbridge Island Fire Dept.Benton Co. FPDs 1, 2, 4 & 6Central Kitsap Fire & RescueCentral Whidbey Island Fire &
RescueChelan Co. FPDs 1, 3, 5, 6,
7 & 9Clallam Co. FPDs 1, 2, 3 & 5Clark Co. Fire & RescueClark Co. FPDs 3, 5, 6, 10 & 13Columbia Co. FPD 3Cowlitz Co. FPDs 1, 2, 3, 5 & 6
Fire Protection Districts (cont.)
Cowlitz-Skamania Co. FPD 7Douglas Co. FPD 2 Douglas-Okanogan Co. FPD 15East County Fire & RescueEast Pierce Co. Fire & RescueFranklin Co. FPD 3Garfield Co. FPD 1Grant Co. FPDs 3, 5, 8 & 10Grays Harbor Co. FPDs 2 & 5Island Co. FPD 1Jefferson Co. FPDs 1, 2, 3 & 4Kent Fire Dept. Regional Fire
Auth.King Co. FPDs 2, 10, 16, 20, 27,
28, 34, 40, 43, 44, 45 & 50Kitsap Co. FPD 18Kittitas Co. FPDs 1, 2 & 7 Klickitat Co. FPDs 3 & 7Lake Stevens FireLewis Co. FPDs 2, 3, 5, 6, 10,
14 & 15Mason Co. FPDs 3, 4, 5, 6, 11,
13 & 16North County Regional Fire Auth.North Highline Fire Dist.North Kitsap Fire & RescueNorth Mason Regional Fire Auth.North Whidbey Fire & RescueOkanogan Co. FPD 6Pacific Co. FPD 1Pend Oreille FPDs 2 & 4Pierce Co. FPDs 3, 5, 6, 10, 13,
14, 16, 17, 18, 21, 23 & 27Riverside Fire Auth.San Juan Co. FPDs 2, 3 & 4 Shoreline Fire Dept.Skagit Co. FPDs 6, 8 & 13Snohomish Co. FPDs 1, 3, 4, 5,
7, 12, 15, 17, 19, 21, 22, 26 & 28
Snoqualmie Pass Fire & Rescue

204 DRS s Statistical Section — Comprehensive Annual Financial Report
Employers Covered by DRS-Administered Retirement Systems (cont.)
As of June 30, 2016 — Page 5 of 12
Fire Protection Districts (cont.)
Southeast Thurston Fire Auth.South King Fire & Rescue South
Kitsap Fire & RescueSouth Pend Oreille Fire & RescueSouth Whatcom Fire Auth.South Whidbey Fire & EMSSpokane Co. FPDs 3, 4, 8, 9,
10 & 13Spokane Valley Fire Dept.Stevens Co. FPD 1Thurston Co. FPDs 3, 5, 6, 8, 9,
12, 13 & 17Valley Regional Fire Auth.Vashon Island Fire & RescueWalla Walla Co. FPDs 4 & 5West Benton Regional Fire Auth.West Thurston Regional Fire Auth.Whatcom Co. FPDs 1, 7, 8, 11,
14, 17 & 21Woodinville Fire & RescueYakima Co. FPDs 4, 5, 6 & 12
Housing Authorities
AnacortesAsotin Co.BellinghamBremertonChelan Co./WenatcheeEverettGrant Co.Grays Harbor Co.Island Co.Joint Republic Ferry Co.KelsoKennewickKing Co.Kitsap Co. ConsolidatedKittitas Co.LongviewOkanogan Co.
Housing Authorities (cont.)
OthelloPasco/Franklin Co. PeninsulaPierce Co.RentonSeattle Skagit Co.Snohomish Co.SpokaneTacomaThurston Co.VancouverWalla Walla
Insurance Authorities
Enduris WashingtonHealth Benefit ExchangeTransit Insurance Pool of WAWA Cities Insurance Auth.WA Counties Insurance FundWA Counties Risk PoolWater & Sewer Insurance Pool
Irrigation, Sewer and Water Districts
Agnew Irrigation Dist.Ahtanum Irrigation Dist.Alderwood Water Dist.Beacon Hill Water & Sewer Dist.Belfair Water Dist.Benton Irrigation Dist.Birch Bay Water & Sewer Dist.Brewster Flat Irrigation Dist.Cascade Irrigation Dist.Cedar River Water & Sewer Dist.Chinook Water Dist.Clark Regional Wastewater Dist.Clinton Water Dist.Coal Creek Utility Dist.Coalition for Clean Water
Irrigation, Sewer and Water Districts (cont.)
Columbia Irrigation Dist.Columbia Valley Water
Dist. Consolidated Diking Improvement Dist. 1 & 2
Consolidated Irrigation Dist. 19Covington Water Dist.Cross Valley Water Dist.Dallesport Water Dist.Diamond Lake Water & Sewer
Dist.Douglas Co. Sewer Dist. 1East Columbia Basin Irrigation
Dist.East Spokane Water Dist. 1East Wenatchee Water Dist.Eastsound Sewer & Water Dist.Fall City Water Dist.Franklin Co. Irrigation Dist. 1Gardena Farms Dist. 13Glacier Water Dist.Grays Harbor Co. Water Dist. 1Greater Wenatchee Irrigation
Dist.Highland Irrigation Dist.Highline Water Dist. Holmes Harbor Sewer Dist.Icicle Irrigation Dist.Irvin Water Dist. 6Kennewick Irrigation Dist.King Co. Water Dist. 19, 20, 45,
49, 54, 90, 111, 119 & 125Kiona Irrigation Dist.Kittitas Reclamation Dist.Lake Chelan Reclamation Dist.Lake Forest Park Water Dist.Lake Stevens Sewer Dist.Lake Whatcom Water & Sewer
Dist.Lakehaven Utility Dist.Lakewood Water Dist.Loon Lake Sewer Dist. 4

Comprehensive Annual Financial Report — Statistical Section s DRS 205
Employers Covered by DRS-Administered Retirement Systems (cont.)
As of June 30, 2016 — Page 6 of 12
Irrigation, Sewer and Water Districts (cont.)
Lopez Solid Waste Disposal Dist.LOTT Clean Water Alliance Malaga Water Dist.Manchester Water Dist.Midway Sewer Dist.Moab Irrigation Dist. 20Model Irrigation Dist. 18Moses Lake Irrigation &
Rehabilitation Dist.Mukilteo Water & Wastewater
Dist.Naches-Selah Irrigation Dist.NE Sammamish Sewer & Water
Dist.North City Water Dist.North Beach Water Dist.North Perry Ave. Water Dist.North Spokane Irrigation Dist. 8Northshore Utility Dist.Okanogan Irrigation Dist.Olympic View Water Dist.Orchard Ave. Irrigation Dist.Oroville-Tonasket Irrigation Dist.Pasadena Park Irrigation Dist. 17Point Roberts Water Dist. 4Quincy-Columbia Basin Irrigation
Dist.Ronald Wastewater Dist.Roza Irrigation Dist.Samish Water Dist.Sammamish Plateau Water &
Sewer Dist.Seaview Sewer Dist.Selah-Moxee Irrigation Dist.Silver Lake Water Dist. Silverdale Water Dist. 16Skyway Water & Sewer Dist.Snoqualmie Pass Utility Dist.Soos Creek Water & Sewer Dist.South Columbia Basin Irrigation
Dist.
Irrigation, Sewer and Water Districts (cont.)
Spokane Co. Water Dist. 3Stemilt Irrigation Dist. Stevens
Pass Sewer Dist.Sunland Water Dist.Sunnyside Valley Irrigation Dist.SW Suburban Sewer Dist.Terrace Heights Sewer Dist.Three Rivers Regional Wastewater
Auth.Trentwood Irrigation Dist. 3Valley View Sewer Dist.Valley Water Dist.Vera Water & PowerWalla Walla Watershed
ManagementWenatchee Reclamation Dist.Whatcom Co. Water Dist. 2 & 7Whitestone Reclamation Dist.Whitworth Water Dist. 2Willapa Valley Water Dist.Woodinville Water Dist.Yakima-Tieton Irrigation Dist.
Libraries, Library Districts
Central Skagit Rural Library Dist.Columbia Co. Rural Library Dist.Fort Vancouver Regional LibraryJefferson Co. Rural Library Dist.King Co. Law LibraryKing Co. Rural Library Dist.Kitsap Regional LibraryLa Conner Regional LibraryLopez Island Library Dist.Mid-Columbia Regional LibraryNorth Central Regional LibraryNorth Olympic Library SystemOrcas Island Library Dist.Pend Oreille LibraryPierce Co. Law LibraryPierce Co. Rural Library Dist.
Libraries, Library Districts (cont.)
San Juan Island Co. LibrarySno-Isle Regional Library Spokane
Co. Law LibrarySpokane Co. Library Dist.Stevens Co. Rural LibraryTimberland Regional LibraryUpper Skagit Library Dist.Walla Walla Co. Rural Library
Dist.Whatcom Co. Public LibraryWhitman Co. Rural LibraryYakima Valley Regional Library
Mosquito Districts
Adams Co. Mosquito Dist.Benton Co. Mosquito Control Dist.Columbia Mosquito Control Dist.Franklin Co. Mosquito Control
Dist.Yakima Co. Mosquito Control
Parks and Recreation Districts
Bainbridge Island Metro Parks & Recreation Dist.
Eastmont Metropolitan Parks Dist.Fidalgo Pool & Fitness CenterKey Peninsula Metro Park Dist.Manson Parks & Recreation Dist.Metropolitan Park Dist. of TacomaPeninsula Metropolitan Park Dist.San Juan Island Park &
Recreational Dist.Si View Metropolitan Park Dist.South Whidbey Parks &
Recreation Dist.

206 DRS s Statistical Section — Comprehensive Annual Financial Report
Employers Covered by DRS-Administered Retirement Systems (cont.)
As of June 30, 2016 — Page 7 of 12
Ports
AllynAnacortesBellinghamBentonBremertonBrownsvilleCamas-WashougalCentraliaChehalisChelan Co. ClarkstonColumbiaDouglas Co. EdmondsEverettFriday HarborGrant Co. 1 & 9Grays HarborIlwacoKalamaKennewickKingstonKlickitatLongviewMattawaMoses LakeOlympiaOrcasOthelloPascoPeninsulaPort AngelesPort TownsendRidgefieldRoyal SlopeSeattleSheltonSkagit Co.Skamania Co.SunnysideTacomaVancouver
Ports (cont.)
Walla WallaWahkiakum Co. 1Whitman Co.Willapa HarborWoodland
Public Facility Districts
Asotin Co. Public Facilities Dist.Edmonds Public Facilities Dist.Lynnwood Public Facilities Dist.Spokane Public Facility Dist.
Public Health
Asotin Co. Health Dist.Benton-Franklin Health Dist.Chelan-Douglas Health Dist.Garfield Co. Health Dist.Grant Co. Health Dist.Great Rivers Behavioral Health
OrganizationGreater Columbia Behavioral
HealthKittitas Co. Public Hospital Dist. 2Kitsap Public Health Dist.NE Tricounty Health Dist.North Sound Regional Support
NetworkSnohomish Health Dist.Spokane Regional Health Dist.SW Washington Behavioral
Health Regional Support Network
Yakima Co. Health Dist.
Public Utility Districts
Asotin Co. PUD 1Benton Co. PUD 1Chelan Co. PUD 1Clallam Co. PUD 1Clark Co. PUD Columbia Basin HydropowerCowlitz Co. PUD 1Douglas Co. PUD 1Energy NorthwestFerry Co. PUD 1Franklin Co. Public Works 1Franklin Co. PUD 1Grant Co. Public WorksGrant Co. PUD 2Grays Harbor Co. PUD 1Jefferson Co. PUD 1Kitsap Co. PUD 1Kittitas Co. PUD 1Klickitat Co. PUD 1Lewis Co. PUD 1Mason Co. PUD 1 & 3Okanogan Co. PUD 1Pacific Co. PUD 2Pend Oreille Co. PUD 1Skagit Co. PUD 1Skamania Co. PUD 1Snohomish Co. PUD 1Stevens Co. PUD Thurston Co. PUD 1Wahkiakum Co. PUD 1West Sound Utility Dist.
Road Departments
Chelan Co. RoadsLincoln Co. Highway Dept.

Comprehensive Annual Financial Report — Statistical Section s DRS 207
Employers Covered by DRS-Administered Retirement Systems (cont.)
As of June 30, 2016 — Page 8 of 12
School Districts
AberdeenAdna AlmiraAnacortesArlingtonAsotin AnatoneAuburnBainbridge IslandBattle GroundBellevueBellinghamBengeBethelBickletonBlaineBoistfortBremertonBrewsterBridgeportBrinnonBurlington-EdisonCamasCape FlatteryCarbonado HistoricalCascadeCashmereCastle RockCentervilleCentral KitsapCentral ValleyCentraliaChehalisCheneyChewelahChimacumClarkstonCle Elum-RoslynClover ParkColfaxCollege PlaceColtonColumbia (Stevens Co.)
School Districts (cont.)
Columbia (Walla Walla Co.)ColvilleConcreteConwayCosmopolisCoulee HartlineCoupevilleCrescentCrestonCurlewCusickDammanDarringtonDavenportDaytonDeer ParkDieringerDixieEast Valley (Spokane Co.)East Valley (Yakima Co.)EastmontEastonEatonvilleEdmondsEllensburgElmaEndicottEntiatEnumclawEphrataEvalineEverettEvergreen (Clark Co.)Evergreen (Stevens Co.)Federal WayFerndaleFifeFinleyFranklin PierceFreemanGarfieldGlenwood
School Districts (cont.)
GoldendaleGrand Coulee DamGrandviewGrangerGranite FallsGrapeviewGreat NorthernGreen MountainGriffinHarringtonHighlandHighlineHockinsonHood CanalHoquiamIncheliumIndexIssaquahKahlotusKalamaKellerKelsoKennewickKentKettle FallsKiona-Benton CityKittitasKlickitatLa CenterLa ConnerLaCrosseLake ChelanLake StevensLake WashingtonLakewoodLamontLibertyLindLongviewLoon LakeLopezLyle

208 DRS s Statistical Section — Comprehensive Annual Financial Report
Employers Covered by DRS-Administered Retirement Systems (cont.)
As of June 30, 2016 — Page 9 of 12
School Districts (cont.)
LyndenMabtonMansfieldMansonMary M. KnightMary WalkerMarysvilleMcClearyMeadMedical LakeMercer IslandMeridianMethow ValleyMill AMonroeMontesanoMortonMoses LakeMossyrockMount AdamsMount BakerMount PleasantMount VernonMukilteoNaches ValleyNapavineNaselle-Grays River ValleyNespelemNewportNine Mile FallsNooksack ValleyNorth BeachNorth FranklinNorth KitsapNorth RiverNorth ThurstonNorthportNorthshoreOak HarborOakesdaleOakvilleOcean Beach
School Districts (cont.)
OcostaOdessaOkanoganOlympiaOmakOnalaskaOnion CreekOrcas IslandOrchard PrairieOrientOrondoOrovilleOrtingOthelloPalisadesPalousePascoPaterosPatersonPe EllPeninsulaPioneerPomeroyPort AngelesPort TownsendPrescottProsserPullmanPuyallupQueets-ClearwaterQuilceneQuillayuteQuinault LakeQuincyRainierRaymondReardan-EdwallRentonRepublicRichlandRidgefieldRitzville
School Districts (cont.)
RiversideRiverviewRochesterRooseveltRosaliaRoyalSaint JohnSan Juan IslandSatsopSeattleSedro-WoolleySelahSelkirkSequimShaw IslandSheltonShorelineSkamaniaSkykomishSnohomishSnoqualmie ValleySoap LakeSouth BendSouth KitsapSouth WhidbeySouthsideSpokane Public SchoolsSpragueStanwood-CamanoStarStarbuckStehekinSteilacoom HistoricalSteptoeStevenson-CarsonSultanSummitSumnerSunnysideTacomaTaholahTahoma

Comprehensive Annual Financial Report — Statistical Section s DRS 209
Employers Covered by DRS-Administered Retirement Systems (cont.)
As of June 30, 2016 — Page 10 of 12
School Districts (cont.)
TeninoThorpToledoTonasketToppenishTouchetToutle LakeTrout LakeTukwilaTumwaterUnion GapUniversity PlaceValleyVancouverVashon IslandWahkiakumWahlukeWaitsburgWalla WallaWapatoWarden Jr. ConsolidatedWashougalWashtucnaWatervilleWellpinitWenatcheeWest Valley (Spokane Co.)West Valley (Yakima Co.)White PassWhite RiverWhite SalmonWilburWillapa ValleyWilson CreekWinlockWishkah ValleyWishramWoodlandYakimaYelm Zillah
Transportation Authorities, Transportation Districts
Asotin Co.Ben Franklin TransitChelan-Douglas P.T.B.A.Chelan-Douglas Transportation
CouncilClallam Transit SystemClark Co. P.T.B.A.Columbia Co. Public
TransportationGrant Transit Auth.Grays Harbor Transportation
Auth.Intercity TransitIsland TransitJefferson Transit Auth.Kitsap TransitLewis P.T.B.A.Mason Co. P.T.B.A.Okanogan Co. Transit Auth.Pacific Transit SystemPierce Co. P.T.B.A.Snohomish Co. P.T.B.A.Spokane Regional Transportation
CouncilSpokane Transit Auth.SW WA Regional Transportation
CouncilValley TransitWhatcom Transportation Auth.
Weed Control Districts
Benton Co. Noxious Weed Control Board
Grant Co. Noxious Weed BoardGrant Co. Weed Dist. 1 & 3Pierce Co. Noxious Weed BoardSpokane Co. Noxious Weed
Control Board
Other
Other Government Entities
Lower Columbia Fish Recovery Board
Public Stadium Auth. Snohomish Co. Police Staff
AuxiliarySouth Correctional EntityTacoma-Pierce Co. Employment &
Training ConsortiumWA School Information
Processing CooperativeYakima Valley Conference of
Governments
State Entities
State Agencies
Administrative Office of the Courts
Archaeology-Historic PreservationBoard for Volunteer FirefightersBoard of Industrial Insurance
AppealsBoard of Tax AppealsChild Study & Treatment CenterCivil Legal Aid Office ofConsolidated Support ServicesConsolidated Technology ServicesCounty Road Administration
BoardCourt of AppealsDept. of AgricultureDept. of CommerceDept. of CorrectionsDept. of Early LearningDept. of EcologyDept. of Employment SecurityDept. of Enterprise ServicesDept. of Financial InstitutionsDept. of Fish & WildlifeDept. of Health

210 DRS s Statistical Section — Comprehensive Annual Financial Report
Employers Covered by DRS-Administered Retirement Systems (cont.)
As of June 30, 2016 — Page 11 of 12
State Agencies (cont.)
Dept. of Labor & IndustriesDept. of Licensing Dept. of Natural Resources Dept. of Retirement SystemsDept. of Revenue Dept. of Services for the BlindDept. of Social & Health
Services (8)Dept. of TransportationDept. of Veterans AffairsEastern State HospitalEastern WA State Historical
SocietyEcho Glen Children’s CenterEconomic Development Finance
Auth.Environmental & Land Use
Hearings OfficeFircrest School Green Hill SchoolHealth Care Facilities Auth.House of RepresentativesIndian Advisory CouncilInnovate WashingtonJoint Legislative Audit & Review
CommitteeJoint Legislative Systems
CommitteeJoint Transportation CommitteeLakeland VillageLaw LibraryLEAP CommitteeLEOFF Plan 2 Retirement BoardLiquor & Cannabis BoardMilitary Dept.Naselle Youth CampOffice of Administrative HearingsOffice of Financial ManagementOffice of Minority & Women’s
Business EnterprisesOffice of Public DefenseOffice of the Attorney General
State Agencies (cont.)
Office of Forecast CouncilOffice of the Governor Office of the Insurance
Commissioner Office of Legislative Support
ServicesOffice of the Lieutenant
GovernorOffice of the Secretary of StateOffice of the State ActuaryOffice of the State AuditorOffice of the State TreasurerPuget Sound PartnershipRainier SchoolRecreation & Conservation OfficeSenateSpecial Commitment CenterState Board for Community &
Technical CollegesState Board of AccountancyStatute Law CommitteeStudent Achievement CouncilSuperintendent of Public
InstructionSupreme CourtTransportation Improvement
BoardVeterans Home – SpokaneWA Pollution Liability Insurance
AgencyWA Soldiers Home & ColonyWA State Bar AssociationWA State Caseload Forecast
CouncilWA State FerriesWA State Health Care Auth.WA State Historical SocietyWA State Investment BoardWA State PatrolWA State School Directors'
AssociationWA State School for the Blind
State Agencies (cont.)
WA State School for the DeafWA Veterans Home Western State HospitalWorkforce Training & Education
Coordinating BoardYakima Valley School
State Commissions
African-American AffairsAppleArtsAsian Pacific American AffairsBeefCharter SchoolColumbia River GorgeConservationCriminal Justice TrainingDairy ProductsFruitGamblingGrainHispanic AffairsHopHorse RacingHousing FinanceHuman RightsJudicial ConductLotteryParks & RecreationPotatoPublic DisclosurePublic Employment RelationsPuget Sound PilotageSalaries for Elected OfficialsTraffic SafetyTree Fruit ResearchUtilities & TransportationWine

Comprehensive Annual Financial Report — Statistical Section s DRS 211
Employers Covered by DRS-Administered Retirement Systems (cont.)
As of June 30, 2016 — Page 12 of 12
Technical Colleges, Community Colleges
Bates Technical CollegeBellevue Community CollegeBellingham Technical CollegeBig Bend Community CollegeCascadia CollegeCentralia CollegeClark Community CollegeClover Park Technical CollegeColumbia Basin Community
CollegeEdmonds Community CollegeEverett Community CollegeGrays Harbor CollegeGreen River CollegeHighline Community CollegeLake Washington Institute of
TechnologyLower Columbia Community
CollegeOlympic College Peninsula CollegePierce CollegeRenton Technical CollegeSeattle Community CollegeShoreline Community
CollegeSkagit Valley CollegeSouth Puget Sound Community
CollegeSpokane Community CollegeTacoma Community CollegeWalla Walla Community
CollegeWenatchee Valley CollegeWhatcom Community CollegeYakima Valley College
Universities
Central Washington UniversityEastern Washington UniversityEvergreen State CollegeUniversity of WashingtonWashington State UniversityWestern Washington University

212 DRS s Statistical Section — Comprehensive Annual Financial Report
Schedule of Benefit Recipients by Type of Benefit
PERS Plan 1For the 12 Months Ended June 30, 2015
Retirement Type Option Selected1
Monthly Benefit
AmountNumber of
Retirees ServiceDuty
DisabilityNonduty
DisabilitySurvivor Payment
1Life
2100%
350%
466%
$ 0-5002 3,758 2,809 5 203 741 2,490 843 387 38
501-1,000 8,110 5,734 3 368 2,005 5,040 1,660 1,271 139
1,001-1,500 8,020 6,255 2 245 1,518 4,888 1,816 1,123 193
1,501-2,000 9,455 8,620 – 130 705 6,624 1,560 998 273
2,001-2,500 7,057 6,673 – 26 358 4,717 1,155 858 327
2,501-3,000 5,122 4,928 – 12 182 3,371 798 667 286
3,001-3,500 3,343 3,252 – 4 87 2,236 433 422 252
3,501-4,000 2,145 2,104 – – 41 1,373 344 269 159
Over 4,000 3,260 3,208 – 1 51 1,904 487 501 368
Totals 50,270 43,583 10 989 5,688 32,643 9,096 6,496 2,035
1 1 (Life): Retiree’s lifetime; 2 (100%): Beneficiary receives same monthly benefit for life; 3 (50%): Beneficiary receives half the monthly benefit for life; or 4 (66%): Beneficiary receives two-thirds the monthly benefit for life
2 Includes L&I holdoffs
1 1 (Life): Retiree’s lifetime; 2 (100%): Beneficiary receives same monthly benefit for life; 3 (50%): Beneficiary receives half the monthly benefit for life; or 4 (66%): Beneficiary receives two-thirds the monthly benefit for life
PERS Plan 2For the 12 Months Ended June 30, 2015
Retirement Type Option Selected1
Monthly Benefit
AmountNumber of
Retirees ServiceDuty
DisabilityNonduty
DisabilitySurvivor Payment
1Life
2100%
350%
466%
$ 0-500 8,013 5,945 – 1,107 961 5,380 1,999 455 179
501-1,000 9,193 7,717 – 580 896 5,921 2,219 706 347
1,001-1,500 7,440 6,887 – 169 384 4,875 1,489 740 336
1,501-2,000 4,974 4,777 – 30 167 3,344 777 587 266
2,001-2,500 3,169 3,096 – 9 64 2,011 463 474 221
2,501-3,000 2,125 2,087 – 3 35 1,375 283 322 145
3,001-3,500 1,365 1,342 – 1 22 844 171 231 119
3,501-4,000 814 806 – 1 7 538 86 125 65
Over 4,000 1,600 1,590 – 2 8 1,001 158 276 165
Totals 38,693 34,247 – 1,902 2,544 25,289 7,645 3,916 1,843
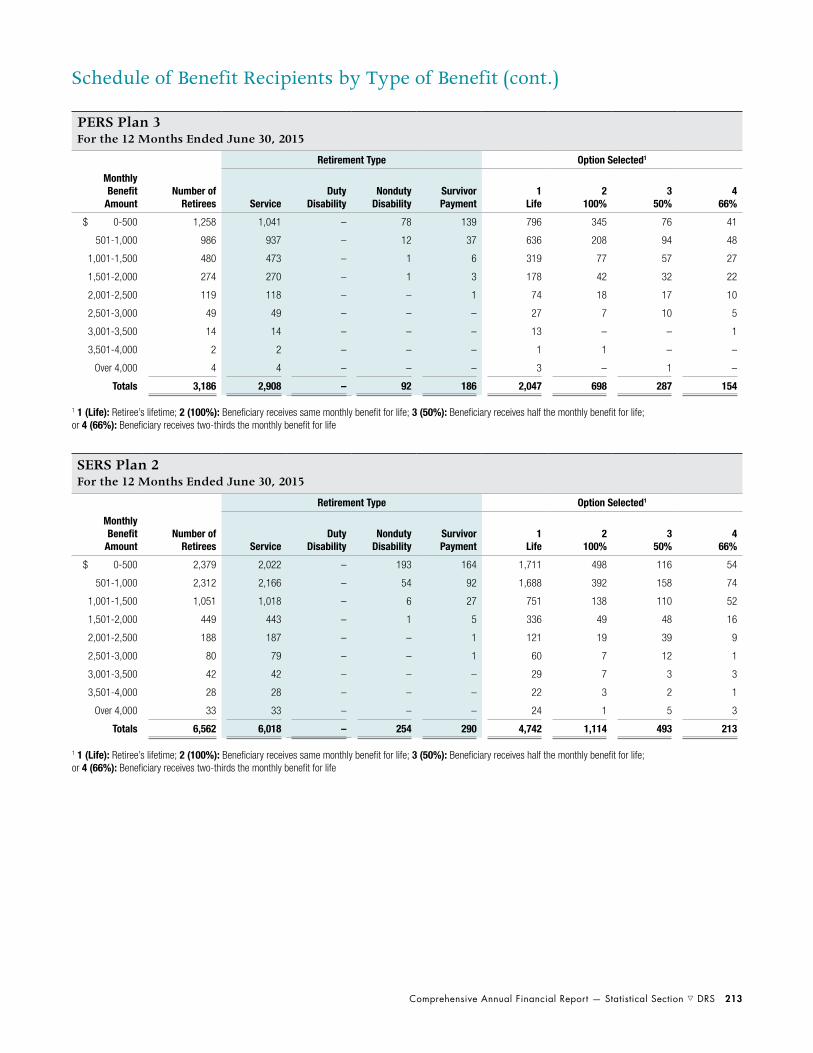
Comprehensive Annual Financial Report — Statistical Section s DRS 213
Schedule of Benefit Recipients by Type of Benefit (cont.)
1 1 (Life): Retiree’s lifetime; 2 (100%): Beneficiary receives same monthly benefit for life; 3 (50%): Beneficiary receives half the monthly benefit for life; or 4 (66%): Beneficiary receives two-thirds the monthly benefit for life
1 1 (Life): Retiree’s lifetime; 2 (100%): Beneficiary receives same monthly benefit for life; 3 (50%): Beneficiary receives half the monthly benefit for life; or 4 (66%): Beneficiary receives two-thirds the monthly benefit for life
PERS Plan 3For the 12 Months Ended June 30, 2015
Retirement Type Option Selected1
Monthly Benefit
AmountNumber of
Retirees ServiceDuty
DisabilityNonduty
DisabilitySurvivor Payment
1Life
2100%
350%
466%
$ 0-500 1,258 1,041 – 78 139 796 345 76 41
501-1,000 986 937 – 12 37 636 208 94 48
1,001-1,500 480 473 – 1 6 319 77 57 27
1,501-2,000 274 270 – 1 3 178 42 32 22
2,001-2,500 119 118 – – 1 74 18 17 10
2,501-3,000 49 49 – – – 27 7 10 5
3,001-3,500 14 14 – – – 13 – – 1
3,501-4,000 2 2 – – – 1 1 – –
Over 4,000 4 4 – – – 3 – 1 –
Totals 3,186 2,908 – 92 186 2,047 698 287 154
SERS Plan 2For the 12 Months Ended June 30, 2015
Retirement Type Option Selected1
Monthly Benefit
AmountNumber of
Retirees ServiceDuty
DisabilityNonduty
DisabilitySurvivor Payment
1Life
2100%
350%
466%
$ 0-500 2,379 2,022 – 193 164 1,711 498 116 54
501-1,000 2,312 2,166 – 54 92 1,688 392 158 74
1,001-1,500 1,051 1,018 – 6 27 751 138 110 52
1,501-2,000 449 443 – 1 5 336 49 48 16
2,001-2,500 188 187 – – 1 121 19 39 9
2,501-3,000 80 79 – – 1 60 7 12 1
3,001-3,500 42 42 – – – 29 7 3 3
3,501-4,000 28 28 – – – 22 3 2 1
Over 4,000 33 33 – – – 24 1 5 3
Totals 6,562 6,018 – 254 290 4,742 1,114 493 213

214 DRS s Statistical Section — Comprehensive Annual Financial Report
Schedule of Benefit Recipients by Type of Benefit (cont.)
1 1 (Life): Retiree’s lifetime; 2 (100%): Beneficiary receives same monthly benefit for life; 3 (50%): Beneficiary receives half the monthly benefit for life; or 4 (66%): Beneficiary receives two-thirds the monthly benefit for life
1 1 (Life): Retiree’s lifetime; 2 (100%): Beneficiary receives same monthly benefit for life; 3 (50%): Beneficiary receives half the monthly benefit for life; or 4 (66%): Beneficiary receives two-thirds the monthly benefit for life
SERS Plan 3For the 12 Months Ended June 30, 2015
Retirement Type Option Selected1
Monthly Benefit
AmountNumber of
Retirees ServiceDuty
DisabilityNonduty
DisabilitySurvivor Payment
1Life
2100%
350%
466%
$ 0-500 3,922 3,674 – 79 169 2,825 830 179 88
501-1,000 1,432 1,404 – 6 22 1,052 196 134 50
1,001-1,500 282 280 – 1 1 208 26 35 13
1,501-2,000 83 83 – – – 64 8 7 4
2,001-2,500 21 21 – – – 17 4 – –
2,501-3,000 4 4 – – – 2 2 – –
3,001-3,500 5 5 – – – 4 – 1 –
3,501-4,000 – – – – – – – – –
Over 4,000 1 1 – – – 1 – – –
Totals 5,750 5,472 – 86 192 4,173 1,066 356 155
PSERS Plan 2For the 12 Months Ended June 30, 2015
Retirement Type Option Selected1
Monthly Benefit
AmountNumber of
Retirees ServiceDuty
DisabilityNonduty
DisabilitySurvivor Payment
1Life
2100%
350%
466%
$ 0-500 44 33 – 6 5 28 11 1 4
501-1,000 33 32 – – 1 26 5 2 –
1,001-1,500 3 3 – – – 3 – – –
1,501-2,000 – – – – – – – – –
2,001-2,500 – – – – – – – – –
2,501-3,000 – – – – – – – – –
3,001-3,500 – – – – – – – – –
3,501-4,000 – – – – – – – – –
Over 4,000 – – – – – – – – –
Totals 80 68 – 6 6 57 16 3 4

Comprehensive Annual Financial Report — Statistical Section s DRS 215
Schedule of Benefit Recipients by Type of Benefit (cont.)
1 1 (Life): Retiree’s lifetime; 2 (100%): Beneficiary receives same monthly benefit for life; 3 (50%): Beneficiary receives half the monthly benefit for life; or 4 (66%): Beneficiary receives two-thirds the monthly benefit for life
1 1 (Life): Retiree’s lifetime; 2 (100%): Beneficiary receives same monthly benefit for life; 3 (50%): Beneficiary receives half the monthly benefit for life; or 4 (66%): Beneficiary receives two-thirds the monthly benefit for life
TRS Plan 1For the 12 Months Ended June 30, 2015
Retirement Type Option Selected1
Monthly Benefit
AmountNumber of
Retirees ServiceDuty
DisabilityNonduty
DisabilitySurvivor Payment
1Life
2100%
350%
466%
$ 0-500 1,407 1,209 – 35 163 965 336 89 17
501-1,000 2,832 1,865 – 130 837 1,533 593 658 48
1,001-1,500 3,863 2,887 – 123 853 1,946 1,107 687 123
1,501-2,000 9,457 8,725 – 186 546 6,350 1,870 929 308
2,001-2,500 7,456 7,158 – 58 240 5,078 1,267 813 298
2,501-3,000 4,458 4,330 – 21 107 2,716 911 556 275
3,001-3,500 2,831 2,790 – 2 39 1,722 572 334 203
3,501-4,000 1,481 1,456 – 2 23 888 296 191 106
Over 4,000 1,454 1,432 – 3 19 838 280 203 133
Totals 35,239 31,852 – 560 2,827 22,036 7,232 4,460 1,511
TRS Plan 2For the 12 Months Ended June 30, 2015
Retirement Type Option Selected1
Monthly Benefit
AmountNumber of
Retirees ServiceDuty
DisabilityNonduty
DisabilitySurvivor Payment
1Life
2100%
350%
466%
$ 0-500 460 399 – 29 32 321 108 23 8
501-1,000 737 626 – 36 75 470 170 55 42
1,001-1,500 696 655 – 12 29 461 137 59 39
1,501-2,000 715 687 – 5 23 466 136 63 50
2,001-2,500 680 675 – 1 4 454 96 84 46
2,501-3,000 437 433 – 1 3 309 67 44 17
3,001-3,500 279 273 – – 6 191 31 34 23
3,501-4,000 164 163 – – 1 130 7 14 13
Over 4,000 137 136 – – 1 102 14 14 7
Totals 4,305 4,047 – 84 174 2,904 766 390 245

216 DRS s Statistical Section — Comprehensive Annual Financial Report
Schedule of Benefit Recipients by Type of Benefit (cont.)
1 1 (Life): Retiree’s lifetime; 2 (100%): Beneficiary receives same monthly benefit for life; 3 (50%): Beneficiary receives half the monthly benefit for life; or 4 (66%): Beneficiary receives two-thirds the monthly benefit for life
1 1 (Life): Retiree’s lifetime; 2 (100%): Beneficiary receives same monthly benefit for life; 3 (50%): Beneficiary receives half the monthly benefit for life; 4 (66%): Beneficiary receives two-thirds the monthly benefit for life; or A (Standard): Standard option, 100% joint and survivor, with additional benefits to eligible children
2 Joint and survivor options are available for post-retirement marriages.
TRS Plan 3For the 12 Months Ended June 30, 2015
Retirement Type Option Selected1
Monthly Benefit
AmountNumber of
Retirees ServiceDuty
DisabilityNonduty
DisabilitySurvivor Payment
1Life
2100%
350%
466%
$ 0-500 1,737 1,471 – 69 197 1,118 494 74 51
501-1,000 2,170 2,066 – 10 94 1,488 422 170 90
1,001-1,500 1,768 1,739 – 2 27 1,109 354 193 112
1,501-2,000 1,284 1,274 – 1 9 899 163 148 74
2,001-2,500 359 357 – – 2 276 30 36 17
2,501-3,000 97 96 – – 1 66 12 14 5
3,001-3,500 23 23 – – – 17 – 4 2
3,501-4,000 10 10 – – – 9 1 – –
Over 4,000 5 5 – – – 3 1 1 –
Totals 7,453 7,041 – 82 330 4,985 1,477 640 351
LEOFF Plan 1For the 12 Months Ended June 30, 2015
Retirement Type Option Selected1
Monthly Benefit
AmountNumber of
Retirees ServiceDuty
DisabilityNonduty
DisabilitySurvivor Payment
1Life
22
100%32
50%42
66%A
(Standard)
$ 0-500 19 15 – – 4 – 1 1 – 17
501-1,000 54 40 – – 14 1 2 1 – 50
1,001-1,500 52 27 1 – 24 – 5 3 – 44
1,501-2,000 82 25 14 12 31 – 9 5 2 66
2,001-2,500 327 58 115 58 96 2 60 5 9 251
2,501-3,000 952 136 422 129 265 11 153 8 9 771
3,001-3,500 1,678 265 846 158 409 6 154 16 24 1,478
3,501-4,000 1,552 357 811 53 331 24 53 6 10 1,459
Over 4,000 2,791 1,634 735 11 411 9 51 13 15 2,703
Totals 7,507 2,557 2,944 421 1,585 53 488 58 69 6,839

Comprehensive Annual Financial Report — Statistical Section s DRS 217
Schedule of Benefit Recipients by Type of Benefit (cont.)
1 1 (Life): Retiree’s lifetime; 2 (100%): Beneficiary receives same monthly benefit for life; 3 (50%): Beneficiary receives half the monthly benefit for life; or 4 (66%): Beneficiary receives two-thirds the monthly benefit for life
2 Joint and survivor options are available for post-retirement marriages.
1 A: 100% joint and survivor, with initial pension equal to the lesser of 50% AFC and 100% member’s accrued benefit; B: 100% joint and survivor, with initial pension being the actuarial equivalent of the single-life annuity — this option is available for post-retirement marriages; or Life: Single-life annuity, joint annuitant removed post-retirement
LEOFF Plan 2For the 12 Months Ended June 30, 2015
Retirement Type Option Selected1
Monthly Benefit
AmountNumber of
Retirees ServiceDuty
DisabilityNonduty
DisabilitySurvivor Payment
1Life
22
100%32
50%42
66%
$ 0-500 105 64 11 4 26 49 46 9 1
501-1,000 212 148 23 3 38 89 101 12 10
1,001-1,500 246 187 30 7 22 103 102 22 19
1,501-2,000 264 192 35 8 29 103 115 26 20
2,001-2,500 302 255 24 6 17 109 129 40 24
2,501-3,000 342 290 28 2 22 133 132 48 29
3,001-3,500 424 371 34 10 9 198 139 51 36
3,501-4,000 377 336 29 2 10 154 119 57 47
Over 4,000 1,438 1,328 79 7 24 653 341 229 215
Totals 3,710 3,171 293 49 197 1,591 1,224 494 401
WSPRS Plan 1For the 12 Months Ended June 30, 2015
Retirement Type Option Selected1
Monthly Benefit
AmountNumber of
Retirees ServiceDuty
DisabilityNonduty
DisabilitySurvivor Payment A B Life
$ 0-500 4 4 – – – 2 2 –
501-1,000 13 3 – – 10 10 3 –
1,001-1,500 26 9 – – 17 22 4 –
1,501-2,000 29 6 – – 23 28 1 –
2,001-2,500 34 12 – – 22 26 8 –
2,501-3,000 55 26 – – 29 37 17 1
3,001-3,500 131 104 – – 27 45 86 –
3,501-4,000 189 176 – – 13 81 106 2
Over 4,000 552 537 – – 15 237 305 10
Totals 1,033 877 – – 156 488 532 13

218 DRS s Statistical Section — Comprehensive Annual Financial Report
Schedule of Benefit Recipients by Type of Benefit (cont.)
1 1 (Life): Retiree’s lifetime; 2 (100%): Beneficiary receives same monthly benefit for life; 3 (50%): Beneficiary receives half the monthly benefit for life; 4 (66%): Beneficiary receives two-thirds the monthly benefit for life; or A (Standard): Standard option, 50% joint and survivor, for eligible spouses
2 Joint and survivor options are available for post-retirement marriages.
Source: Office of the State Actuary
JRSFor the 12 Months Ended June 30, 2015
Retirement Type Option Selected1
Monthly Benefit
AmountNumber of
Retirees ServiceDuty
DisabilityNonduty
DisabilitySurvivor Payment
1Life
22
100%32
50%42
66%A
(Standard)
$ 0-500 – – – – – – – – – –
501-1,000 – – – – – – – – – –
1,001-1,500 – – – – – – – – – –
1,501-2,000 – – – – – – – – – –
2,001-2,500 1 – – – 1 – – – – 1
2,501-3,000 1 – – – 1 – – – – 1
3,001-3,500 2 – – – 2 – – – – 2
3,501-4,000 7 – – – 7 – – – – 7
Over 4,000 95 67 – – 28 – 6 – 1 88
Totals 106 67 – – 39 – 6 – 1 99

Comprehensive Annual Financial Report — Statistical Section s DRS 219
Schedule of Average Benefit Payments to Service Retirees
PERS Plan 1
Retirement Effective Dates1
Years of Credited Service
5-10 11-15 16 -20 21-25 26 -30 31+
Period 7/1/2014 to 6/30/2015
Average Monthly Benefit $ 479.68 $ 1,087.93 $ 1,596.68 $ 2,134.72 $ 2,739.83 $ 3,555.06
Average Final Salary (Monthly) $ 3,853.94 $ 4,104.79 $ 4,283.15 $ 4,644.25 $ 4,975.68 $ 5,707.66
Number of Active Retirees 175 121 137 156 143 343
Period 7/1/2013 to 6/30/2014
Average Monthly Benefit $ 528.85 $ 1,112.60 $ 1,690.84 $ 2,097.07 $ 2,838.69 $ 3,414.25
Average Final Salary (Monthly) $ 4,065.76 $ 3,942.11 $ 4,645.48 $ 4,592.51 $ 5,163.22 $ 5,511.91
Number of Active Retirees 163 98 127 173 165 377
Period 7/1/2012 to 6/30/2013
Average Monthly Benefit $ 517.46 $ 1,039.77 $ 1,830.73 $ 2,210.82 $ 2,944.52 $ 3,496.40
Average Final Salary (Monthly) $ 4,096.87 $ 4,051.23 $ 4,622.29 $ 4,716.57 $ 5,296.58 $ 5,653.00
Number of Active Retirees 188 113 139 169 180 420
Period 7/1/2011 to 6/30/2012
Average Monthly Benefit $ 542.78 $ 1,027.23 $ 1,523.69 $ 2,158.86 $ 3,070.71 $ 3,387.70
Average Final Salary (Monthly) $ 4,003.50 $ 3,927.11 $ 4,023.64 $ 4,625.35 $ 5,559.31 $ 5,635.18
Number of Active Retirees 160 145 125 187 198 474
Period 7/1/2010 to 6/30/2011
Average Monthly Benefit $ 437.37 $ 1,018.91 $ 1,636.44 $ 2,316.51 $ 3,120.62 $ 3,438.97
Average Final Salary (Monthly) $ 3,781.19 $ 3,960.69 $ 4,554.22 $ 5,012.80 $ 5,735.43 $ 5,673.74
Number of Active Retirees 162 111 143 188 261 585
Period 7/1/2009 to 6/30/2010
Average Monthly Benefit $ 456.42 $ 1,100.41 $ 1,426.42 $ 2,003.96 $ 2,931.01 $ 3,388.27
Average Final Salary (Monthly) $ 3,755.10 $ 4,211.26 $ 4,053.07 $ 4,439.81 $ 5,328.15 $ 5,679.56
Number of Active Retirees 158 126 169 215 228 596
Period 7/1/2008 to 6/30/2009
Average Monthly Benefit $ 496.59 $ 943.47 $ 1,430.86 $ 2,171.94 $ 2,965.90 $ 3,381.04
Average Final Salary (Monthly) $ 3,983.17 $ 3,711.90 $ 4,081.31 $ 4,766.33 $ 5,372.21 $ 5,660.85
Number of Active Retirees 143 122 160 182 263 590
Period 7/1/2007 to 6/30/2008
Average Monthly Benefit $ 429.94 $ 909.29 $ 1,433.77 $ 1,964.39 $ 2,841.80 $ 3,106.71
Average Final Salary (Monthly) $ 3,765.12 $ 3,592.11 $ 4,037.55 $ 4,346.86 $ 5,062.40 $ 5,346.47
Number of Active Retirees 153 123 169 200 459 653
Period 10/1/2006 to 6/30/2007
Average Monthly Benefit $ 440.05 $ 826.24 $ 1,377.09 $ 2,026.97 $ 2,968.26 $ 3,044.75
Average Final Salary (Monthly) $ 3,734.14 $ 3,282.95 $ 3,951.49 $ 4,478.61 $ 5,257.35 $ 5,270.50
Number of Active Retirees 73 78 105 122 456 420
Period 10/1/2005 to 9/30/2006
Average Monthly Benefit $ 393.64 $ 855.83 $ 1,297.98 $ 1,792.25 $ 2,753.99 $ 2,916.86
Average Final Salary (Monthly) $ 3,495.56 $ 3,576.91 $ 3,776.29 $ 4,016.80 $ 4,933.84 $ 5,003.15
Number of Active Retirees 150 104 171 173 770 587
1 Average monthly benefit and average final salary (monthly) figures include members at retirement who might not be audited. Retirees with missing or invalid data elements were excluded.
Source: Office of the State Actuary

220 DRS s Statistical Section — Comprehensive Annual Financial Report
Schedule of Average Benefit Payments to Service Retirees (cont.)
1 Average monthly benefit and average final salary (monthly) figures include members at retirement who might not be audited. Retirees with missing or invalid data elements were excluded.
Source: Office of the State Actuary
PERS Plan 2
Retirement Effective Dates1
Years of Credited Service
5-10 11-15 16 -20 21-25 26 -30 31+
Period 7/1/2014 to 6/30/2015
Average Monthly Benefit $ 541.28 $ 1,150.56 $ 1,673.61 $ 2,133.07 $ 2,844.06 $ 3,591.82
Average Final Salary (Monthly) $ 4,267.06 $ 4,470.17 $ 5,015.36 $ 5,360.33 $ 5,626.32 $ 5,940.62
Number of Active Retirees 795 612 572 746 695 557
Period 7/1/2013 to 6/30/2014
Average Monthly Benefit $ 506.78 $ 1,079.98 $ 1,589.12 $ 1,966.73 $ 2,823.53 $ 3,690.55
Average Final Salary (Monthly) $ 3,952.36 $ 4,301.58 $ 4,735.08 $ 5,044.72 $ 5,602.89 $ 6,184.80
Number of Active Retirees 852 592 527 777 710 655
Period 7/1/2012 to 6/30/2013
Average Monthly Benefit $ 486.05 $ 1,082.39 $ 1,525.94 $ 1,947.79 $ 2,681.87 $ 3,529.08
Average Final Salary (Monthly) $ 3,934.94 $ 4,373.18 $ 4,574.85 $ 4,996.22 $ 5,328.35 $ 5,938.56
Number of Active Retirees 823 653 544 724 546 492
Period 7/1/2011 to 6/30/2012
Average Monthly Benefit $ 480.30 $ 1,074.08 $ 1,491.74 $ 1,869.00 $ 2,561.98 $ 3,266.37
Average Final Salary (Monthly) $ 3,701.65 $ 4,256.13 $ 4,532.75 $ 4,857.44 $ 5,227.28 $ 5,651.05
Number of Active Retirees 735 556 526 679 446 372
Period 7/1/2010 to 6/30/2011
Average Monthly Benefit $ 462.97 $ 957.39 $ 1,570.18 $ 1,779.72 $ 2,645.09 $ 3,149.46
Average Final Salary (Monthly) $ 3,651.50 $ 3,916.39 $ 4,754.82 $ 4,662.49 $ 5,270.42 $ 5,560.87
Number of Active Retirees 606 420 478 545 523 305
Period 7/1/2009 to 6/30/2010
Average Monthly Benefit $ 476.80 $ 891.24 $ 1,407.69 $ 1,646.55 $ 2,529.93 $ 3,002.36
Average Final Salary (Monthly) $ 3,592.08 $ 3,644.54 $ 4,246.31 $ 4,405.77 $ 5,011.27 $ 5,291.83
Number of Active Retirees 461 403 489 430 435 157
Period 7/1/2008 to 6/30/2009
Average Monthly Benefit $ 424.97 $ 952.70 $ 1,323.26 $ 1,620.48 $ 2,440.27 $ 2,885.16
Average Final Salary (Monthly) $ 3,322.80 $ 3,831.80 $ 4,055.40 $ 4,246.60 $ 4,820.87 $ 5,267.21
Number of Active Retirees 510 331 408 414 409 73
Period 7/1/2007 to 6/30/2008
Average Monthly Benefit $ 428.50 $ 867.23 $ 1,264.67 $ 1,531.82 $ 2,071.13 $ 2,835.47
Average Final Salary (Monthly) $ 3,337.39 $ 3,555.64 $ 3,875.64 $ 4,225.02 $ 4,490.65 $ 6,197.09
Number of Active Retirees 538 347 432 362 235 1
Period 10/1/2006 to 6/30/2007
Average Monthly Benefit $ 429.68 $ 817.10 $ 1,261.88 $ 1,561.89 $ 1,850.45 $ –
Average Final Salary (Monthly) $ 3,251.50 $ 3,407.38 $ 3,902.20 $ 4,152.54 $ 4,176.21 $ –
Number of Active Retirees 303 225 239 223 131 –
Period 10/1/2005 to 9/30/2006
Average Monthly Benefit $ 381.31 $ 840.64 $ 1,153.19 $ 1,443.59 $ 1,861.25 $ –
Average Final Salary (Monthly) $ 3,096.35 $ 3,495.45 $ 3,599.48 $ 4,014.82 $ 4,159.12 $ –
Number of Active Retirees 397 289 318 308 130 –

Comprehensive Annual Financial Report — Statistical Section s DRS 221
Schedule of Average Benefit Payments to Service Retirees (cont.)
1 Average monthly benefit and average final salary (monthly) figures include members at retirement who might not be audited. Retirees with missing or invalid data elements were excluded.
Source: Office of the State Actuary
PERS Plan 3
Retirement Effective Dates1
Years of Credited Service
5-10 11-15 16 -20 21-25 26 -30 31+
Period 7/1/2014 to 6/30/2015
Average Monthly Benefit $ 353.70 $ 479.36 $ 768.60 $ 1,074.86 $ 1,548.70 $ 1,788.16
Average Final Salary (Monthly) $ 4,664.91 $ 4,706.12 $ 4,964.99 $ 5,480.57 $ 6,169.68 $ 6,006.73
Number of Active Retirees 99 96 67 102 96 74
Period 7/1/2013 to 6/30/2014
Average Monthly Benefit $ 326.31 $ 506.34 $ 796.50 $ 1,123.54 $ 1,383.54 $ 1,690.94
Average Final Salary (Monthly) $ 4,499.32 $ 4,640.98 $ 5,090.91 $ 5,678.77 $ 5,511.32 $ 5,758.12
Number of Active Retirees 93 65 69 97 90 78
Period 7/1/2012 to 6/30/2013
Average Monthly Benefit $ 349.56 $ 464.15 $ 732.71 $ 1,079.98 $ 1,456.36 $ 1,701.71
Average Final Salary (Monthly) $ 4,695.89 $ 4,418.39 $ 4,744.94 $ 5,710.41 $ 5,865.60 $ 5,987.62
Number of Active Retirees 84 56 68 67 48 52
Period 7/1/2011 to 6/30/2012
Average Monthly Benefit $ 287.76 $ 435.93 $ 704.13 $ 940.02 $ 1,415.65 $ 1,796.37
Average Final Salary (Monthly) $ 4,436.89 $ 4,220.74 $ 4,816.97 $ 5,293.55 $ 5,929.81 $ 6,378.63
Number of Active Retirees 58 60 61 70 61 37
Period 7/1/2010 to 6/30/2011
Average Monthly Benefit $ 241.09 $ 404.62 $ 682.89 $ 935.99 $ 1,393.48 $ 1,664.84
Average Final Salary (Monthly) $ 4,045.67 $ 3,928.43 $ 4,681.79 $ 4,828.04 $ 5,589.99 $ 6,199.43
Number of Active Retirees 30 45 64 56 49 18
Period 7/1/2009 to 6/30/2010
Average Monthly Benefit $ 206.96 $ 372.48 $ 650.80 $ 898.92 $ 1,237.32 $ 1,399.82
Average Final Salary (Monthly) $ 3,977.34 $ 3,840.32 $ 4,624.96 $ 4,778.36 $ 5,284.05 $ 5,238.95
Number of Active Retirees 14 41 50 40 30 17
Period 7/1/2008 to 6/30/2009
Average Monthly Benefit $ 203.00 $ 370.16 $ 590.03 $ 868.92 $ 1,140.46 $ 959.19
Average Final Salary (Monthly) $ 3,144.81 $ 3,813.15 $ 4,340.40 $ 5,186.33 $ 5,312.97 $ 3,803.49
Number of Active Retirees 22 39 40 38 32 1
Period 7/1/2007 to 6/30/2008
Average Monthly Benefit $ 221.06 $ 345.57 $ 542.98 $ 800.74 $ 1,220.33 $ –
Average Final Salary (Monthly) $ 3,288.42 $ 4,204.58 $ 4,249.64 $ 4,623.07 $ 5,530.27 $ –
Number of Active Retirees 23 32 44 22 15 –
Period 10/1/2006 to 6/30/2007
Average Monthly Benefit $ 248.25 $ 355.02 $ 492.07 $ 825.20 $ 1,066.43 $ –
Average Final Salary (Monthly) $ 3,227.02 $ 4,094.89 $ 3,994.40 $ 4,749.23 $ 5,518.83 $ –
Number of Active Retirees 9 24 34 25 11 –
Period 10/1/2005 to 9/30/2006
Average Monthly Benefit $ 250.54 $ 330.93 $ 430.38 $ 781.75 $ 848.25 $ –
Average Final Salary (Monthly) $ 4,241.98 $ 3,707.32 $ 4,000.23 $ 4,518.98 $ 4,933.97 $ –
Number of Active Retirees 12 34 51 21 10 –

222 DRS s Statistical Section — Comprehensive Annual Financial Report
Schedule of Average Benefit Payments to Service Retirees (cont.)
1 Average monthly benefit and average final salary (monthly) figures include members at retirement who might not be audited. Retirees with missing or invalid data elements were excluded.
Source: Office of the State Actuary
SERS Plan 2
Retirement Effective Dates1
Years of Credited Service
5-10 11-15 16 -20 21-25 26 -30 31+
Period 7/1/2014 to 6/30/2015
Average Monthly Benefit $ 264.55 $ 561.61 $ 847.17 $ 1,037.71 $ 1,567.41 $ 2,214.59
Average Final Salary (Monthly) $ 2,307.13 $ 2,212.53 $ 2,542.82 $ 2,655.90 $ 3,162.58 $ 3,633.35
Number of Active Retirees 138 147 191 185 95 52
Period 7/1/2013 to 6/30/2014
Average Monthly Benefit $ 268.86 $ 551.46 $ 859.70 $ 1,074.79 $ 1,574.79 $ 2,109.51
Average Final Salary (Monthly) $ 2,311.08 $ 2,199.65 $ 2,605.06 $ 2,729.61 $ 3,057.53 $ 3,485.55
Number of Active Retirees 119 142 159 164 97 55
Period 7/1/2012 to 6/30/2013
Average Monthly Benefit $ 295.83 $ 547.42 $ 867.06 $ 984.72 $ 1,587.72 $ 2,455.16
Average Final Salary (Monthly) $ 2,552.68 $ 2,277.65 $ 2,634.94 $ 2,549.87 $ 3,178.29 $ 4,042.17
Number of Active Retirees 109 137 132 151 97 43
Period 7/1/2011 to 6/30/2012
Average Monthly Benefit $ 277.30 $ 561.49 $ 773.26 $ 1,081.18 $ 1,519.44 $ 2,026.86
Average Final Salary (Monthly) $ 2,044.49 $ 2,295.27 $ 2,292.04 $ 2,755.05 $ 3,061.83 $ 3,424.90
Number of Active Retirees 77 141 143 145 79 42
Period 7/1/2010 to 6/30/2011
Average Monthly Benefit $ 325.48 $ 534.80 $ 792.65 $ 980.32 $ 1,455.60 $ 2,150.54
Average Final Salary (Monthly) $ 2,239.23 $ 2,126.03 $ 2,341.99 $ 2,488.89 $ 2,963.79 $ 3,471.57
Number of Active Retirees 83 105 135 95 75 22
Period 7/1/2009 to 6/30/2010
Average Monthly Benefit $ 329.64 $ 499.38 $ 697.76 $ 959.01 $ 1,466.33 $ 1,877.92
Average Final Salary (Monthly) $ 2,325.81 $ 2,018.06 $ 2,147.60 $ 2,636.97 $ 2,910.30 $ 3,246.34
Number of Active Retirees 76 102 94 86 56 18
Period 7/1/2008 to 6/30/2009
Average Monthly Benefit $ 306.14 $ 490.36 $ 717.17 $ 982.85 $ 1,597.73 $ 2,427.76
Average Final Salary (Monthly) $ 1,974.14 $ 2,020.86 $ 2,133.43 $ 2,542.47 $ 3,044.62 $ 3,936.89
Number of Active Retirees 97 91 86 89 47 1
Period 7/1/2007 to 6/30/2008
Average Monthly Benefit $ 264.20 $ 507.62 $ 746.45 $ 894.39 $ 1,357.45 $ –
Average Final Salary (Monthly) $ 1,758.78 $ 2,124.83 $ 2,279.37 $ 2,301.53 $ 2,921.83 $ –
Number of Active Retirees 93 86 98 99 39 –
Period 10/1/2006 to 6/30/2007
Average Monthly Benefit $ 235.84 $ 463.48 $ 688.93 $ 1,068.36 $ 1,199.69 $ –
Average Final Salary (Monthly) $ 1,673.42 $ 1,807.94 $ 2,101.47 $ 2,811.31 $ 2,836.34 $ –
Number of Active Retirees 43 52 43 43 18 –
Period 10/1/2005 to 9/30/2006
Average Monthly Benefit $ 227.30 $ 481.10 $ 700.31 $ 807.10 $ 1,220.00 $ –
Average Final Salary (Monthly) $ 1,624.78 $ 1,907.18 $ 2,240.95 $ 2,255.18 $ 3,008.47 $ –
Number of Active Retirees 84 84 93 81 32 –

Comprehensive Annual Financial Report — Statistical Section s DRS 223
Schedule of Average Benefit Payments to Service Retirees (cont.)
1 Average monthly benefit and average final salary (monthly) figures include members at retirement who might not be audited. Retirees with missing or invalid data elements were excluded.
Source: Office of the State Actuary
SERS Plan 3
Retirement Effective Dates1
Years of Credited Service
5-10 11-15 16 -20 21-25 26 -30 31+
Period 7/1/2014 to 6/30/2015
Average Monthly Benefit $ 207.81 $ 289.89 $ 424.98 $ 590.73 $ 836.68 $ 1,157.83
Average Final Salary (Monthly) $ 2,725.94 $ 2,583.33 $ 2,691.20 $ 2,915.61 $ 3,323.25 $ 3,749.84
Number of Active Retirees 136 182 153 241 147 69
Period 7/1/2013 to 6/30/2014
Average Monthly Benefit $ 195.52 $ 292.50 $ 434.43 $ 565.35 $ 758.22 $ 1,115.16
Average Final Salary (Monthly) $ 2,650.92 $ 2,682.89 $ 2,755.34 $ 2,798.40 $ 3,080.10 $ 3,628.01
Number of Active Retirees 126 161 143 200 122 71
Period 7/1/2012 to 6/30/2013
Average Monthly Benefit $ 177.27 $ 265.79 $ 355.84 $ 568.30 $ 814.29 $ 1,043.69
Average Final Salary (Monthly) $ 2,488.97 $ 2,326.54 $ 2,309.34 $ 2,813.97 $ 3,255.70 $ 3,449.99
Number of Active Retirees 132 138 162 184 106 48
Period 7/1/2011 to 6/30/2012
Average Monthly Benefit $ 162.22 $ 264.03 $ 350.01 $ 557.10 $ 748.97 $ 946.98
Average Final Salary (Monthly) $ 2,333.34 $ 2,426.20 $ 2,244.00 $ 2,853.50 $ 2,945.74 $ 3,105.56
Number of Active Retirees 107 81 150 160 78 31
Period 7/1/2010 to 6/30/2011
Average Monthly Benefit $ 199.62 $ 265.46 $ 347.98 $ 527.52 $ 801.12 $ 970.47
Average Final Salary (Monthly) $ 2,644.80 $ 2,303.44 $ 2,351.06 $ 2,730.05 $ 3,289.12 $ 3,223.70
Number of Active Retirees 76 81 133 131 86 28
Period 7/1/2009 to 6/30/2010
Average Monthly Benefit $ 179.29 $ 250.79 $ 345.57 $ 504.72 $ 737.83 $ 1,141.89
Average Final Salary (Monthly) $ 2,441.66 $ 2,254.72 $ 2,330.69 $ 2,659.54 $ 2,888.18 $ 4,035.92
Number of Active Retirees 41 46 77 92 39 5
Period 7/1/2008 to 6/30/2009
Average Monthly Benefit $ 142.97 $ 253.20 $ 325.52 $ 458.37 $ 660.37 $ 851.43
Average Final Salary (Monthly) $ 2,070.97 $ 2,338.58 $ 2,190.72 $ 2,412.90 $ 2,879.59 $ 2,972.85
Number of Active Retirees 43 50 106 88 47 3
Period 7/1/2007 to 6/30/2008
Average Monthly Benefit $ 179.78 $ 222.28 $ 309.46 $ 448.52 $ 688.02 $ –
Average Final Salary (Monthly) $ 2,549.16 $ 2,011.46 $ 2,321.32 $ 2,566.71 $ 3,084.89 $ –
Number of Active Retirees 25 62 100 80 35 –
Period 10/1/2006 to 6/30/2007
Average Monthly Benefit $ 120.59 $ 215.61 $ 327.88 $ 370.12 $ 803.06 $ –
Average Final Salary (Monthly) $ 2,141.06 $ 2,086.67 $ 2,413.29 $ 2,203.55 $ 3,744.44 $ –
Number of Active Retirees 12 37 56 42 15 –
Period 10/1/2005 to 9/30/2006
Average Monthly Benefit $ 158.83 $ 209.91 $ 294.67 $ 345.13 $ 533.98 $ –
Average Final Salary (Monthly) $ 2,050.86 $ 2,042.36 $ 2,119.57 $ 2,091.65 $ 2,833.81 $ –
Number of Active Retirees 18 56 74 57 16 –

224 DRS s Statistical Section — Comprehensive Annual Financial Report
Schedule of Average Benefit Payments to Service Retirees (cont.)
1 PSERS Plan 2 became effective July 1, 2006.
2 Average monthly benefit and average final salary (monthly) figures include members at retirement who might not be audited. Retirees with missing or invalid data elements were excluded.
Source: Office of the State Actuary
PSERS Plan 21
Retirement Effective Dates1
Years of Credited Service
5-10 11-15 16 -20 21-25 26 -30 31+
Period 7/1/2014 to 6/30/2015
Average Monthly Benefit $ 668.47 $ – $ – $ – $ – $ –
Average Final Salary (Monthly) $ 5,087.53 $ – $ – $ – $ – $ –
Number of Active Retirees 17 – – – – –
Period 7/1/2013 to 6/30/2014
Average Monthly Benefit $ 666.76 $ – $ – $ – $ – $ –
Average Final Salary (Monthly) $ 5,168.06 $ – $ – $ – $ – $ –
Number of Active Retirees 15 – – – – –
Period 7/1/2012 to 6/30/2013
Average Monthly Benefit $ 510.68 $ – $ – $ – $ – $ –
Average Final Salary (Monthly) $ 5,261.25 $ – $ – $ – $ – $ –
Number of Active Retirees 16 – – – – –
Period 7/1/2011 to 6/30/2012
Average Monthly Benefit $ 339.82 $ – $ – $ – $ – $ –
Average Final Salary (Monthly) $ 4,376.32 $ – $ – $ – $ – $ –
Number of Active Retirees 9 – – – – –
Period 7/1/2010 to 6/30/2011
Average Monthly Benefit $ 324.12 $ – $ – $ – $ – $ –
Average Final Salary (Monthly) $ 4,822.01 $ – $ – $ – $ – $ –
Number of Active Retirees 6 – – – – –
Period 7/1/2009 to 6/30/2010
Average Monthly Benefit $ 271.60 $ – $ – $ – $ – $ –
Average Final Salary (Monthly) $ 5,230.39 $ – $ – $ – $ – $ –
Number of Active Retirees 3 – – – – –

Comprehensive Annual Financial Report — Statistical Section s DRS 225
Schedule of Average Benefit Payments to Service Retirees (cont.)
1 Average monthly benefit and average final salary (monthly) figures include members at retirement who might not be audited. Retirees with missing or invalid data elements were excluded.
Source: Office of the State Actuary
TRS Plan 1
Retirement Effective Dates1
Years of Credited Service
5-10 11-15 16 -20 21-25 26 -30 31+
Period 7/1/2014 to 6/30/2015
Average Monthly Benefit $ 647.12 $ 1,092.42 $ 1,893.48 $ 2,623.54 $ 3,228.70 $ 3,801.44
Average Final Salary (Monthly) $ 3,099.63 $ 3,884.19 $ 5,272.62 $ 6,078.62 $ 6,375.43 $ 6,776.52
Number of Active Retirees 38 28 41 76 67 286
Period 7/1/2013 to 6/30/2014
Average Monthly Benefit $ 509.01 $ 1,156.89 $ 1,984.68 $ 2,661.17 $ 3,231.48 $ 3,794.79
Average Final Salary (Monthly) $ 3,485.83 $ 4,498.77 $ 5,693.54 $ 6,148.49 $ 6,303.26 $ 6,705.36
Number of Active Retirees 38 36 37 89 125 317
Period 7/1/2012 to 6/30/2013
Average Monthly Benefit $ 470.00 $ 1,123.24 $ 1,894.30 $ 2,644.85 $ 3,539.29 $ 3,775.79
Average Final Salary (Monthly) $ 3,065.75 $ 4,277.86 $ 5,538.86 $ 6,107.19 $ 6,783.63 $ 6,667.23
Number of Active Retirees 59 51 61 94 102 350
Period 7/1/2011 to 6/30/2012
Average Monthly Benefit $ 536.53 $ 1,127.71 $ 1,649.43 $ 2,643.64 $ 3,191.03 $ 3,629.98
Average Final Salary (Monthly) $ 3,395.33 $ 4,447.26 $ 5,174.59 $ 5,944.53 $ 6,243.29 $ 6,622.17
Number of Active Retirees 60 50 69 122 134 406
Period 7/1/2010 to 6/30/2011
Average Monthly Benefit $ 438.41 $ 977.55 $ 1,754.50 $ 2,556.44 $ 3,356.41 $ 3,665.13
Average Final Salary (Monthly) $ 2,703.33 $ 3,893.89 $ 5,064.15 $ 5,972.05 $ 6,503.81 $ 6,557.94
Number of Active Retirees 63 63 82 143 165 475
Period 7/1/2009 to 6/30/2010
Average Monthly Benefit $ 438.54 $ 989.00 $ 1,631.06 $ 2,361.44 $ 3,124.49 $ 3,493.23
Average Final Salary (Monthly) $ 3,228.12 $ 3,923.42 $ 4,939.54 $ 5,582.54 $ 6,092.38 $ 6,401.14
Number of Active Retirees 74 56 72 128 132 330
Period 7/1/2008 to 6/30/2009
Average Monthly Benefit $ 453.06 $ 1,006.59 $ 1,618.97 $ 2,354.28 $ 2,904.77 $ 3,314.77
Average Final Salary (Monthly) $ 3,243.52 $ 4,073.33 $ 5,030.12 $ 5,709.31 $ 5,870.41 $ 6,261.55
Number of Active Retirees 66 69 90 164 176 443
Period 7/1/2007 to 6/30/2008
Average Monthly Benefit $ 418.90 $ 1,013.91 $ 1,591.61 $ 2,227.52 $ 2,928.20 $ 2,893.41
Average Final Salary (Monthly) $ 2,808.31 $ 4,134.13 $ 4,821.23 $ 5,317.30 $ 5,904.30 $ 5,809.84
Number of Active Retirees 66 57 114 192 408 531
Period 10/1/2006 to 6/30/2007
Average Monthly Benefit $ 348.74 $ 839.10 $ 1,321.85 $ 1,820.11 $ 2,848.13 $ 2,588.78
Average Final Salary (Monthly) $ 2,641.07 $ 3,364.49 $ 4,122.54 $ 4,444.75 $ 5,736.18 $ 5,917.60
Number of Active Retirees 39 35 45 40 55 24
Period 10/1/2005 to 9/30/2006
Average Monthly Benefit $ 367.34 $ 1,011.54 $ 1,519.99 $ 2,017.00 $ 2,817.52 $ 2,880.89
Average Final Salary (Monthly) $ 2,936.42 $ 4,174.56 $ 4,765.76 $ 5,018.16 $ 5,632.88 $ 5,640.67
Number of Active Retirees 61 58 100 157 486 465

226 DRS s Statistical Section — Comprehensive Annual Financial Report
Schedule of Average Benefit Payments to Service Retirees (cont.)
1 Average monthly benefit and average final salary (monthly) figures include members at retirement who might not be audited. Retirees with missing or invalid data elements were excluded.
Source: Office of the State Actuary
TRS Plan 2
Retirement Effective Dates1
Years of Credited Service
5-10 11-15 16 -20 21-25 26 -30 31+
Period 7/1/2014 to 6/30/2015
Average Monthly Benefit $ 508.94 $ 1,177.99 $ 2,034.14 $ 2,514.55 $ 3,094.29 $ 4,103.13
Average Final Salary (Monthly) $ 4,167.38 $ 4,573.45 $ 5,878.92 $ 6,226.79 $ 6,168.76 $ 6,449.36
Number of Active Retirees 63 44 84 133 55 50
Period 7/1/2013 to 6/30/2014
Average Monthly Benefit $ 484.37 $ 1,142.52 $ 1,850.92 $ 2,509.87 $ 3,200.19 $ 3,986.80
Average Final Salary (Monthly) $ 3,682.29 $ 4,621.38 $ 5,436.82 $ 6,290.13 $ 6,282.34 $ 6,753.01
Number of Active Retirees 88 50 88 126 65 53
Period 7/1/2012 to 6/30/2013
Average Monthly Benefit $ 483.41 $ 1,029.99 $ 1,904.03 $ 2,302.44 $ 2,928.52 $ 3,588.57
Average Final Salary (Monthly) $ 3,666.26 $ 4,265.74 $ 5,590.87 $ 5,843.14 $ 5,920.89 $ 6,298.04
Number of Active Retirees 53 40 129 97 53 37
Period 7/1/2011 to 6/30/2012
Average Monthly Benefit $ 469.38 $ 1,098.85 $ 1,815.96 $ 2,256.40 $ 2,970.89 $ 3,762.08
Average Final Salary (Monthly) $ 3,553.53 $ 4,411.40 $ 5,558.73 $ 5,771.40 $ 6,059.92 $ 6,219.80
Number of Active Retirees 79 54 98 97 48 33
Period 7/1/2010 to 6/30/2011
Average Monthly Benefit $ 417.71 $ 1,147.78 $ 1,783.60 $ 2,052.93 $ 3,094.93 $ 3,559.00
Average Final Salary (Monthly) $ 3,507.78 $ 4,578.42 $ 5,406.28 $ 5,582.93 $ 6,034.27 $ 6,283.35
Number of Active Retirees 59 66 92 54 52 19
Period 7/1/2009 to 6/30/2010
Average Monthly Benefit $ 511.71 $ 1,228.38 $ 1,902.99 $ 2,012.05 $ 3,025.53 $ 3,167.60
Average Final Salary (Monthly) $ 3,830.95 $ 4,964.28 $ 5,759.54 $ 5,413.19 $ 5,762.55 $ 5,520.72
Number of Active Retirees 42 47 47 42 41 13
Period 7/1/2008 to 6/30/2009
Average Monthly Benefit $ 520.28 $ 1,146.03 $ 1,602.18 $ 2,141.67 $ 2,938.41 $ 3,665.93
Average Final Salary (Monthly) $ 3,516.21 $ 4,585.47 $ 5,136.98 $ 5,467.87 $ 5,809.95 $ 6,295.83
Number of Active Retirees 35 44 62 46 43 2
Period 7/1/2007 to 6/30/2008
Average Monthly Benefit $ 537.82 $ 1,086.65 $ 1,606.56 $ 1,966.69 $ 2,706.92 $ –
Average Final Salary (Monthly) $ 3,638.09 $ 4,523.98 $ 5,073.16 $ 5,226.25 $ 5,376.41 $ –
Number of Active Retirees 37 52 67 42 20 –
Period 10/1/2006 to 6/30/2007
Average Monthly Benefit $ 375.95 $ 970.16 $ 1,585.44 $ 1,911.48 $ 2,622.91 $ –
Average Final Salary (Monthly) $ 3,634.96 $ 4,054.58 $ 4,891.30 $ 5,337.42 $ 5,601.05 $ –
Number of Active Retirees 24 28 20 16 5 –
Period 10/1/2005 to 9/30/2006
Average Monthly Benefit $ 515.76 $ 1,042.26 $ 1,516.39 $ 1,875.65 $ 2,282.00 $ –
Average Final Salary (Monthly) $ 3,562.09 $ 4,270.10 $ 4,672.24 $ 4,924.09 $ 4,870.42 $ –
Number of Active Retirees 47 49 48 53 18 –

Comprehensive Annual Financial Report — Statistical Section s DRS 227
Schedule of Average Benefit Payments to Service Retirees (cont.)
1 Average monthly benefit and average final salary (monthly) figures include members at retirement who might not be audited. Retirees with missing or invalid data elements were excluded.
Source: Office of the State Actuary
TRS Plan 3
Retirement Effective Dates1
Years of Credited Service
5-10 11-15 16 -20 21-25 26 -30 31+
Period 7/1/2014 to 6/30/2015
Average Monthly Benefit $ 356.11 $ 631.90 $ 961.06 $ 1,318.54 $ 1,675.09 $ 2,007.23
Average Final Salary (Monthly) $ 4,799.72 $ 5,380.43 $ 5,918.12 $ 6,307.98 $ 6,508.21 $ 6,580.13
Number of Active Retirees 137 214 224 264 216 289
Period 7/1/2013 to 6/30/2014
Average Monthly Benefit $ 354.31 $ 628.17 $ 946.36 $ 1,274.12 $ 1,661.82 $ 1,944.26
Average Final Salary (Monthly) $ 4,564.18 $ 5,273.10 $ 5,799.82 $ 6,236.91 $ 6,569.09 $ 6,484.91
Number of Active Retirees 130 198 208 231 193 269
Period 7/1/2012 to 6/30/2013
Average Monthly Benefit $ 345.92 $ 593.34 $ 961.44 $ 1,242.35 $ 1,572.79 $ 1,909.04
Average Final Salary (Monthly) $ 4,553.37 $ 5,264.59 $ 5,891.15 $ 6,152.65 $ 6,282.97 $ 6,453.23
Number of Active Retirees 150 179 165 227 167 140
Period 7/1/2011 to 6/30/2012
Average Monthly Benefit $ 331.43 $ 570.43 $ 863.21 $ 1,139.55 $ 1,610.39 $ 1,737.76
Average Final Salary (Monthly) $ 4,727.90 $ 5,068.13 $ 5,473.33 $ 5,966.01 $ 6,235.28 $ 6,143.64
Number of Active Retirees 108 164 151 184 131 105
Period 7/1/2010 to 6/30/2011
Average Monthly Benefit $ 336.03 $ 545.30 $ 831.33 $ 1,125.89 $ 1,568.81 $ 1,686.38
Average Final Salary (Monthly) $ 4,553.15 $ 4,830.15 $ 5,435.01 $ 5,780.35 $ 6,160.69 $ 6,065.22
Number of Active Retirees 106 113 122 136 120 68
Period 7/1/2009 to 6/30/2010
Average Monthly Benefit $ 319.39 $ 545.45 $ 786.31 $ 1,078.33 $ 1,453.56 $ 1,699.32
Average Final Salary (Monthly) $ 4,468.37 $ 4,766.92 $ 5,254.99 $ 5,634.96 $ 5,839.55 $ 5,992.94
Number of Active Retirees 79 73 91 75 79 22
Period 7/1/2008 to 6/30/2009
Average Monthly Benefit $ 303.61 $ 547.01 $ 796.81 $ 993.91 $ 1,500.99 $ 1,419.21
Average Final Salary (Monthly) $ 4,534.11 $ 5,211.68 $ 5,389.18 $ 5,394.30 $ 5,833.52 $ 5,397.36
Number of Active Retirees 76 53 84 77 83 5
Period 7/1/2007 to 6/30/2008
Average Monthly Benefit $ 267.19 $ 514.88 $ 753.87 $ 923.79 $ 1,207.54 $ –
Average Final Salary (Monthly) $ 3,949.74 $ 4,680.85 $ 5,313.06 $ 5,444.54 $ 5,366.59 $ –
Number of Active Retirees 62 60 89 78 48 –
Period 10/1/2006 to 6/30/2007
Average Monthly Benefit $ 254.63 $ 452.49 $ 712.80 $ 1,061.00 $ 1,243.51 $ –
Average Final Salary (Monthly) $ 4,146.59 $ 4,575.87 $ 4,909.18 $ 5,447.02 $ 5,750.52 $ –
Number of Active Retirees 19 22 24 22 4 –
Period 10/1/2005 to 9/30/2006
Average Monthly Benefit $ 297.95 $ 448.22 $ 666.82 $ 869.07 $ 1,101.94 $ –
Average Final Salary (Monthly) $ 4,392.04 $ 4,659.35 $ 4,950.00 $ 5,187.16 $ 5,239.94 $ –
Number of Active Retirees 32 45 73 41 20 –

228 DRS s Statistical Section — Comprehensive Annual Financial Report
Schedule of Average Benefit Payments to Service Retirees (cont.)
1 Average monthly benefit and average final salary (monthly) figures include members at retirement who might not be audited. Retirees with missing or invalid data elements were excluded.
Source: Office of the State Actuary
LEOFF Plan 1
Retirement Effective Dates1
Years of Credited Service
5-10 11-15 16 -20 21-25 26 -30 31+
Period 7/1/2014 to 6/30/2015
Average Monthly Benefit $ – $ – $ – $ – $ 3,891 $ 8,081.82
Average Final Salary (Monthly) $ – $ – $ – $ – $ 6,708 $ 9,859.16
Number of Active Retirees – – – – 1 40
Period 7/1/2013 to 6/30/2014
Average Monthly Benefit $ – $ – $ – $ – $ 3,690 $ 7,788.21
Average Final Salary (Monthly) $ – $ – $ – $ – $ 6,220 $ 9,665.96
Number of Active Retirees – – – – 1 23
Period 7/1/2012 to 6/30/2013
Average Monthly Benefit $ – $ – $ – $ – $ – $ 7,105.97
Average Final Salary (Monthly) $ – $ – $ – $ – $ – $ 9,171.69
Number of Active Retirees – – – – – 42
Period 7/1/2011 to 6/30/2012
Average Monthly Benefit $ – $ – $ – $ – $ – $ 6,776.58
Average Final Salary (Monthly) $ – $ – $ – $ – $ – $ 8,906.14
Number of Active Retirees – – – – – 63
Period 7/1/2010 to 6/30/2011
Average Monthly Benefit $ – $ 2,608.42 $ – $ – $ 3,770.38 $ 6,799.27
Average Final Salary (Monthly) $ – $ 12,347.54 $ – $ – $ 6,693.02 $ 9,117.73
Number of Active Retirees – 1 – – 1 49
Period 7/1/2009 to 6/30/2010
Average Monthly Benefit $ – $ – $ – $ – $ 5,846.14 $ 6,727.58
Average Final Salary (Monthly) $ – $ – $ – $ – $ 9,964.96 $ 9,156.08
Number of Active Retirees – – – – 1 56
Period 7/1/2008 to 6/30/2009
Average Monthly Benefit $ – $ – $ – $ – $ 8,876.88 $ 5,773.59
Average Final Salary (Monthly) $ – $ – $ – $ – $ 13,656.74 $ 8,293.04
Number of Active Retirees – – – – 1 67
Period 7/1/2007 to 6/30/2008
Average Monthly Benefit $ – $ 737.71 $ – $ 4,083.42 $ 3,717.62 $ 5,275.22
Average Final Salary (Monthly) $ – $ 2,147.00 $ – $ 8,695 $ 6,687.05 $ 7,715.25
Number of Active Retirees – 1 – 2 9 85
Period 10/1/2006 to 6/30/2007
Average Monthly Benefit $ – $ 1,086 $ – $ – $ 3,785.27 $ 5,086.57
Average Final Salary (Monthly) $ – $ 5,204 $ – $ – $ 6,727.37 $ 7,548.05
Number of Active Retirees – 1 – – 20 63
Period 10/1/2005 to 9/30/2006
Average Monthly Benefit $ 3,628 $ – $ – $ 3,307.40 $ 3,999.96 $ 4,870.88
Average Final Salary (Monthly) $ 6,596 $ – $ – $ 6,549.30 $ 7,104.56 $ 7,484.82
Number of Active Retirees 1 – – 1 47 80
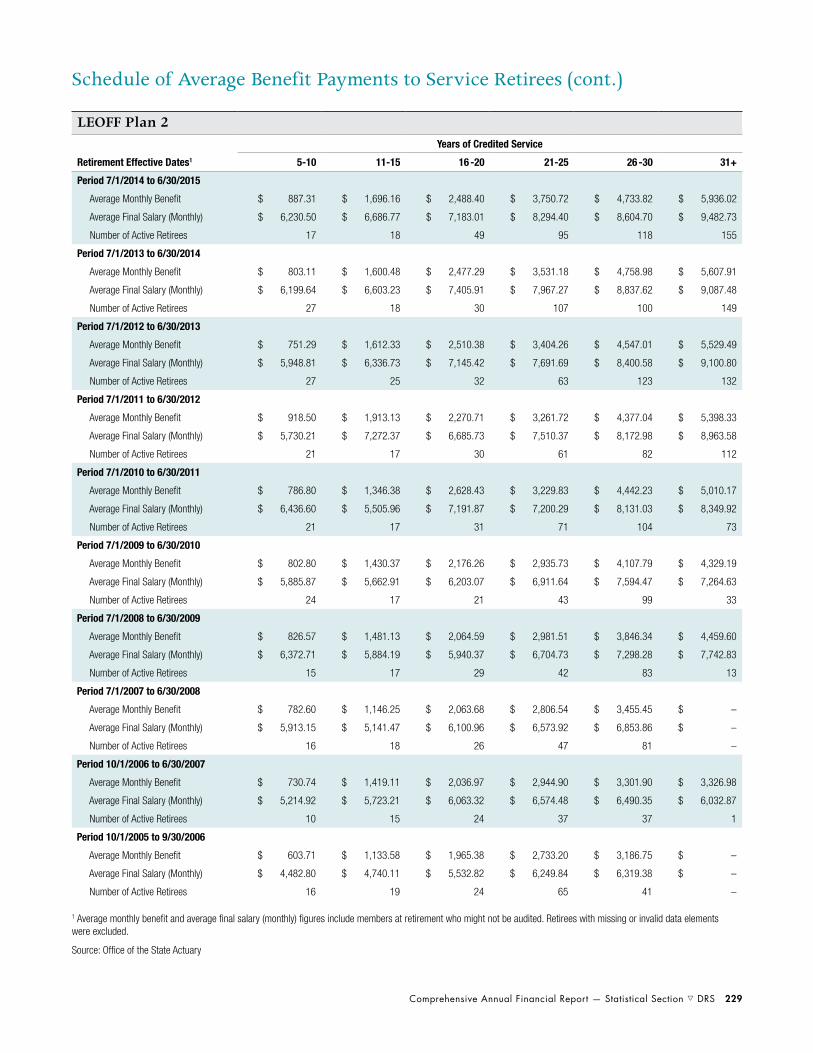
Comprehensive Annual Financial Report — Statistical Section s DRS 229
Schedule of Average Benefit Payments to Service Retirees (cont.)
1 Average monthly benefit and average final salary (monthly) figures include members at retirement who might not be audited. Retirees with missing or invalid data elements were excluded.
Source: Office of the State Actuary
LEOFF Plan 2
Retirement Effective Dates1
Years of Credited Service
5-10 11-15 16 -20 21-25 26 -30 31+
Period 7/1/2014 to 6/30/2015
Average Monthly Benefit $ 887.31 $ 1,696.16 $ 2,488.40 $ 3,750.72 $ 4,733.82 $ 5,936.02
Average Final Salary (Monthly) $ 6,230.50 $ 6,686.77 $ 7,183.01 $ 8,294.40 $ 8,604.70 $ 9,482.73
Number of Active Retirees 17 18 49 95 118 155
Period 7/1/2013 to 6/30/2014
Average Monthly Benefit $ 803.11 $ 1,600.48 $ 2,477.29 $ 3,531.18 $ 4,758.98 $ 5,607.91
Average Final Salary (Monthly) $ 6,199.64 $ 6,603.23 $ 7,405.91 $ 7,967.27 $ 8,837.62 $ 9,087.48
Number of Active Retirees 27 18 30 107 100 149
Period 7/1/2012 to 6/30/2013
Average Monthly Benefit $ 751.29 $ 1,612.33 $ 2,510.38 $ 3,404.26 $ 4,547.01 $ 5,529.49
Average Final Salary (Monthly) $ 5,948.81 $ 6,336.73 $ 7,145.42 $ 7,691.69 $ 8,400.58 $ 9,100.80
Number of Active Retirees 27 25 32 63 123 132
Period 7/1/2011 to 6/30/2012
Average Monthly Benefit $ 918.50 $ 1,913.13 $ 2,270.71 $ 3,261.72 $ 4,377.04 $ 5,398.33
Average Final Salary (Monthly) $ 5,730.21 $ 7,272.37 $ 6,685.73 $ 7,510.37 $ 8,172.98 $ 8,963.58
Number of Active Retirees 21 17 30 61 82 112
Period 7/1/2010 to 6/30/2011
Average Monthly Benefit $ 786.80 $ 1,346.38 $ 2,628.43 $ 3,229.83 $ 4,442.23 $ 5,010.17
Average Final Salary (Monthly) $ 6,436.60 $ 5,505.96 $ 7,191.87 $ 7,200.29 $ 8,131.03 $ 8,349.92
Number of Active Retirees 21 17 31 71 104 73
Period 7/1/2009 to 6/30/2010
Average Monthly Benefit $ 802.80 $ 1,430.37 $ 2,176.26 $ 2,935.73 $ 4,107.79 $ 4,329.19
Average Final Salary (Monthly) $ 5,885.87 $ 5,662.91 $ 6,203.07 $ 6,911.64 $ 7,594.47 $ 7,264.63
Number of Active Retirees 24 17 21 43 99 33
Period 7/1/2008 to 6/30/2009
Average Monthly Benefit $ 826.57 $ 1,481.13 $ 2,064.59 $ 2,981.51 $ 3,846.34 $ 4,459.60
Average Final Salary (Monthly) $ 6,372.71 $ 5,884.19 $ 5,940.37 $ 6,704.73 $ 7,298.28 $ 7,742.83
Number of Active Retirees 15 17 29 42 83 13
Period 7/1/2007 to 6/30/2008
Average Monthly Benefit $ 782.60 $ 1,146.25 $ 2,063.68 $ 2,806.54 $ 3,455.45 $ –
Average Final Salary (Monthly) $ 5,913.15 $ 5,141.47 $ 6,100.96 $ 6,573.92 $ 6,853.86 $ –
Number of Active Retirees 16 18 26 47 81 –
Period 10/1/2006 to 6/30/2007
Average Monthly Benefit $ 730.74 $ 1,419.11 $ 2,036.97 $ 2,944.90 $ 3,301.90 $ 3,326.98
Average Final Salary (Monthly) $ 5,214.92 $ 5,723.21 $ 6,063.32 $ 6,574.48 $ 6,490.35 $ 6,032.87
Number of Active Retirees 10 15 24 37 37 1
Period 10/1/2005 to 9/30/2006
Average Monthly Benefit $ 603.71 $ 1,133.58 $ 1,965.38 $ 2,733.20 $ 3,186.75 $ –
Average Final Salary (Monthly) $ 4,482.80 $ 4,740.11 $ 5,532.82 $ 6,249.84 $ 6,319.38 $ –
Number of Active Retirees 16 19 24 65 41 –

230 DRS s Statistical Section — Comprehensive Annual Financial Report
Schedule of Average Benefit Payments to Service Retirees (cont.)
1 Average monthly benefit and average final salary (monthly) figures include members at retirement who might not be audited. Retirees with missing or invalid data elements were excluded.
Source: Office of the State Actuary
WSPRS Plan 1
Retirement Effective Dates1
Years of Credited Service
5-10 11-15 16 -20 21-25 26 -30 31+
Period 7/1/2014 to 6/30/2015
Average Monthly Benefit $ 515.10 $ 1,616.68 $ 3,108.68 $ 4,153.86 $ 4,386.37 $ 4,883.71
Average Final Salary (Monthly) $ 6,961.40 $ 6,969.05 $ 7,161.79 $ 8,328.60 $ 8,007.96 $ 7,820.79
Number of Active Retirees 1 2 2 16 24 3
Period 7/1/2013 to 6/30/2014
Average Monthly Benefit $ – $ 2,075.14 $ 2,290.15 $ 3,490.49 $ 4,335.50 $ 4,441.61
Average Final Salary (Monthly) $ – $ 5,791.02 $ 4,655.27 $ 7,110.57 $ 7,755.76 $ 7,017.09
Number of Active Retirees – 1 1 14 20 4
Period 7/1/2012 to 6/30/2013
Average Monthly Benefit $ – $ 1,946.46 $ 3,228.52 $ 3,916.57 $ 4,033.93 $ 5,808.61
Average Final Salary (Monthly) $ – $ 7,447.17 $ 9,971.82 $ 8,046.79 $ 7,561.30 $ 8,363.83
Number of Active Retirees – 2 2 12 30 9
Period 7/1/2011 to 6/30/2012
Average Monthly Benefit $ 332.19 $ 1,371.65 $ 1,641.71 $ 4,047.82 $ 4,524.91 $ 3,944.59
Average Final Salary (Monthly) $ 4,280.74 $ 5,911.76 $ 5,475.29 $ 7,926.38 $ 8,487.26 $ 6,294.76
Number of Active Retirees 1 2 2 19 20 3
Period 7/1/2010 to 6/30/2011
Average Monthly Benefit $ – $ – $ 1,300.91 $ 3,981.43 $ 4,307.44 $ 3,807.43
Average Final Salary (Monthly) $ – $ – $ 5,279.73 $ 7,767.77 $ 7,696.70 $ 6,534.53
Number of Active Retirees – – 1 14 20 1
Period 7/1/2009 to 6/30/2010
Average Monthly Benefit $ – $ – $ – $ 3,603.10 $ 5,653.44 $ 5,437.71
Average Final Salary (Monthly) $ – $ – $ – $ 7,241.18 $ 9,302.30 $ 8,000.30
Number of Active Retirees – – – 9 10 3
Period 7/1/2008 to 6/30/2009
Average Monthly Benefit $ – $ – $ – $ 3,205.87 $ 3,984.48 $ 5,748.34
Average Final Salary (Monthly) $ – $ – $ – $ 6,495.52 $ 7,139.94 $ 8,014.31
Number of Active Retirees – – – 2 7 3
Period 7/1/2007 to 6/30/2008
Average Monthly Benefit $ 395.27 $ – $ – $ 3,166.53 $ 4,129.05 $ 4,313.40
Average Final Salary (Monthly) $ 5,784.65 $ – $ – $ 6,685.85 $ 7,573.82 $ 6,621.25
Number of Active Retirees 1 – – 5 6 6
Period 10/1/2006 to 6/30/2007
Average Monthly Benefit $ – $ 1,385.52 $ 2,000.54 $ – $ 3,887.12 $ 4,422.67
Average Final Salary (Monthly) $ – $ 5,980.57 $ 5,755.62 $ – $ 7,254.30 $ 6,698.61
Number of Active Retirees – 1 1 – 5 6
Period 10/1/2005 to 9/30/2006
Average Monthly Benefit $ – $ – $ – $ – $ 3,488.08 $ 3,996.14
Average Final Salary (Monthly) $ – $ – $ – $ – $ 6,559.78 $ 6,112.68
Number of Active Retirees – – – – 15 7

Comprehensive Annual Financial Report — Statistical Section s DRS 231
Schedule of Average Benefit Payments to Service Retirees (cont.)
1 Average monthly benefit and average final salary (monthly) figures include members at retirement who might not be audited. Retirees with missing or invalid data elements were excluded.
Source: Office of the State Actuary
JRS
Retirement Effective Dates1
Years of Credited Service
5-10 11-15 16 -20 21-25 26 -30 31+
Period 7/1/2014 to 6/30/2015
Average Monthly Benefit $ – $ – $ – $ – $ – $ –
Average Final Salary (Monthly) $ – $ – $ – $ – $ – $ –
Number of Active Retirees – – – – – –
Period 7/1/2013 to 6/30/2014
Average Monthly Benefit $ – $ – $ – $ – $ – $ –
Average Final Salary (Monthly) $ – $ – $ – $ – $ – $ –
Number of Active Retirees – – – – – –
Period 7/1/2012 to 6/30/2013
Average Monthly Benefit $ – $ – $ – $ – $ 9,302.01 $ –
Average Final Salary (Monthly) $ – $ – $ – $ – $ 12,402.68 $ –
Number of Active Retirees – – – – 2 –
Period 7/1/2011 to 6/30/2012
Average Monthly Benefit $ – $ – $ – $ – $ – $ 10,263.81
Average Final Salary (Monthly) $ – $ – $ – $ – $ – $ 13,685.08
Number of Active Retirees – – – – – 1
Period 7/1/2010 to 6/30/2011
Average Monthly Benefit $ – $ – $ – $ – $ 7,376.49 $ 9,302.01
Average Final Salary (Monthly) $ – $ – $ – $ – $ 12,402.68 $ 12,402.68
Number of Active Retirees – – – – 1 1
Period 7/1/2009 to 6/30/2010
Average Monthly Benefit $ – $ – $ – $ 7,904.34 $ 8,292.69 $ 9,770.51
Average Final Salary (Monthly) $ – $ – $ – $ 13,027.34 $ 12,402.60 $ 13,027.34
Number of Active Retirees – – – 1 2 1
Period 7/1/2008 to 6/30/2009
Average Monthly Benefit $ – $ – $ 5,286.59 $ 9,301.95 $ – $ –
Average Final Salary (Monthly) $ – $ – $ 10,367.60 $ 12,402.60 $ – $ –
Number of Active Retirees – – 1 1 – –
Period 7/1/2007 to 6/30/2008
Average Monthly Benefit $ – $ – $ – $ – $ – $ 9,255.00
Average Final Salary (Monthly) $ – $ – $ – $ – $ – $ 12,340.00
Number of Active Retirees – – – – – 1
Period 10/1/2006 to 6/30/2007
Average Monthly Benefit $ – $ – $ – $ – $ – $ –
Average Final Salary (Monthly) $ – $ – $ – $ – $ – $ –
Number of Active Retirees – – – – – –
Period 10/1/2005 to 9/30/2006
Average Monthly Benefit $ – $ – $ 6,242.30 $ – $ 8,412.38 $ –
Average Final Salary (Monthly) $ – $ – $ 9,987.16 $ – $ 11,216.50 $ –
Number of Active Retirees – – 2 – 1 –
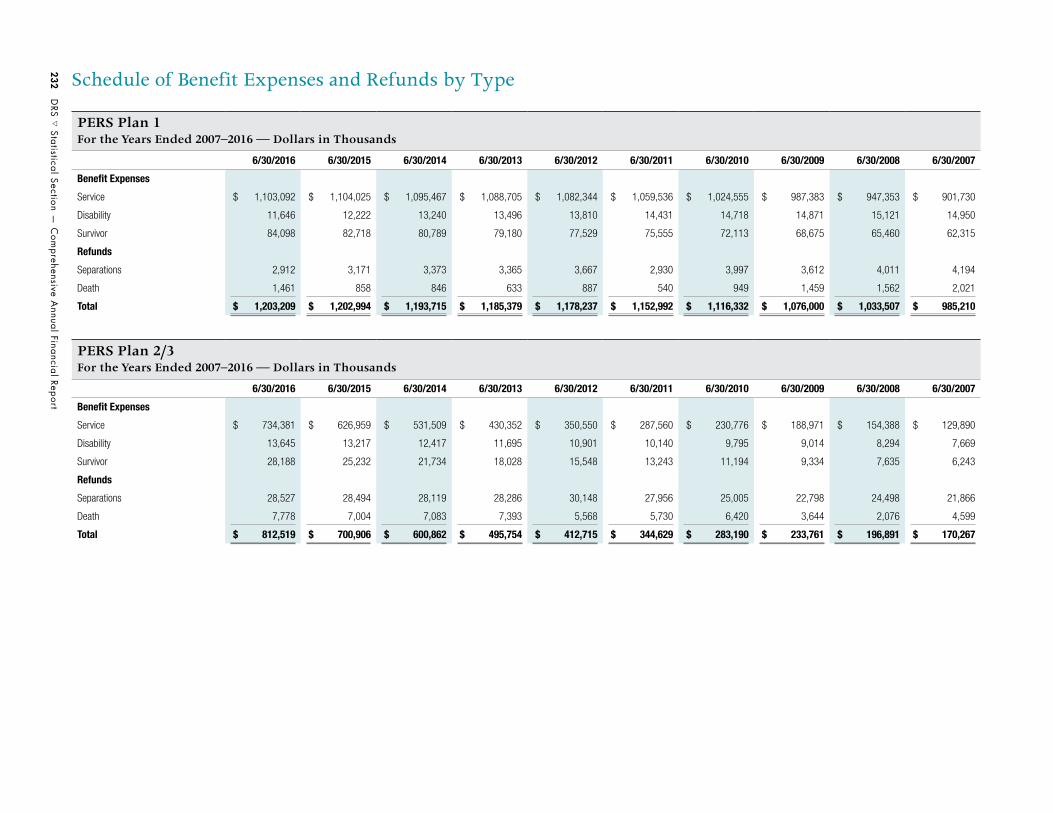
232 D
RS s Statistical Section —
Com
prehensive Annual Financial Report
Schedule of Benefit Expenses and Refunds by Type
PERS Plan 1For the Years Ended 2007–2016 — Dollars in Thousands
6/30/2016 6/30/2015 6/30/2014 6/30/2013 6/30/2012 6/30/2011 6/30/2010 6/30/2009 6/30/2008 6/30/2007
Benefit Expenses
Service $ 1,103,092 $ 1,104,025 $ 1,095,467 $ 1,088,705 $ 1,082,344 $ 1,059,536 $ 1,024,555 $ 987,383 $ 947,353 $ 901,730
Disability 11,646 12,222 13,240 13,496 13,810 14,431 14,718 14,871 15,121 14,950
Survivor 84,098 82,718 80,789 79,180 77,529 75,555 72,113 68,675 65,460 62,315
Refunds
Separations 2,912 3,171 3,373 3,365 3,667 2,930 3,997 3,612 4,011 4,194
Death 1,461 858 846 633 887 540 949 1,459 1,562 2,021
Total $ 1,203,209 $ 1,202,994 $ 1,193,715 $ 1,185,379 $ 1,178,237 $ 1,152,992 $ 1,116,332 $ 1,076,000 $ 1,033,507 $ 985,210
PERS Plan 2/3For the Years Ended 2007–2016 — Dollars in Thousands
6/30/2016 6/30/2015 6/30/2014 6/30/2013 6/30/2012 6/30/2011 6/30/2010 6/30/2009 6/30/2008 6/30/2007
Benefit Expenses
Service $ 734,381 $ 626,959 $ 531,509 $ 430,352 $ 350,550 $ 287,560 $ 230,776 $ 188,971 $ 154,388 $ 129,890
Disability 13,645 13,217 12,417 11,695 10,901 10,140 9,795 9,014 8,294 7,669
Survivor 28,188 25,232 21,734 18,028 15,548 13,243 11,194 9,334 7,635 6,243
Refunds
Separations 28,527 28,494 28,119 28,286 30,148 27,956 25,005 22,798 24,498 21,866
Death 7,778 7,004 7,083 7,393 5,568 5,730 6,420 3,644 2,076 4,599
Total $ 812,519 $ 700,906 $ 600,862 $ 495,754 $ 412,715 $ 344,629 $ 283,190 $ 233,761 $ 196,891 $ 170,267

Com
prehensive Annual Financial Report —
Statistical Section s D
RS 233
Schedule of Benefit Expenses and Refunds by Type (cont.)
PERS Plan 3For the Years Ended 2007–2016 — Dollars in Thousands
6/30/2016 6/30/2015 6/30/2014 6/30/2013 6/30/2012 6/30/2011 6/30/2010 6/30/2009 6/30/2008 6/30/2007
Benefit Expenses
Service $ 3,731 $ 2,640 $ 1,435 $ 697 $ 322 $ 164 $ 80 $ 51 $ 23 $ –
Disability – – – – – – – – – –
Survivor – – – – – – – – – –
Refunds
Separations 84,734 $ 89,446 $ 80,489 68,671 66,095 56,974 40,215 38,856 35,702 33,724
Death – – – – 150 2,169 1,508 1,346 2,589 1,530
Total $ 88,465 $ 92,086 $ 81,924 $ 69,368 $ 66,567 $ 59,307 $ 41,803 $ 40,253 $ 38,314 $ 35,254
SERS Plan 2/3For the Years Ended 2007–2016 — Dollars in Thousands
6/30/2016 6/30/2015 6/30/2014 6/30/2013 6/30/2012 6/30/2011 6/30/2010 6/30/2009 6/30/2008 6/30/2007
Benefit Expenses
Service $ 107,962 $ 91,986 $ 77,320 $ 63,134 $ 50,597 $ 40,753 $ 32,202 $ 26,468 $ 20,944 $ 16,230
Disability 1,604 1,549 1,553 1,457 1,387 1,198 1,068 1,037 928 781
Survivor 3,187 2,649 2,343 1,835 1,646 1,387 1,179 802 755 630
Refunds
Separations 1,932 2,084 2,076 1,984 1,947 1,916 1,779 1,693 1,752 2,148
Death 562 807 656 671 569 576 346 432 293 368
Total $ 115,247 $ 99,075 $ 83,948 $ 69,081 $ 56,146 $ 45,830 $ 36,574 $ 30,432 $ 24,672 $ 20,157

234
DRS s
Statistical Section — C
omprehensive A
nnual Financial Report
Schedule of Benefit Expenses and Refunds by Type (cont.)
1 PSERS Plan 2 became effective July 1, 2006.
SERS Plan 3For the Years Ended 2007–2016 — Dollars in Thousands
6/30/2016 6/30/2015 6/30/2014 6/30/2013 6/30/2012 6/30/2011 6/30/2010 6/30/2009 6/30/2008 6/30/2007
Benefit Expenses
Service $ 2,354 $ 1,526 $ 854 $ 464 $ 302 $ 182 $ 91 $ 62 $ 8 $ –
Disability – – – – – – – – – –
Survivor – – – – – – – – – –
Refunds
Separations 78,843 84,767 72,972 65,643 60,929 51,431 31,383 40,501 39,438 30,539
Death – – – – – 1,811 2,533 1,540 377 1,538
Total $ 81,197 $ 86,293 $ 73,826 $ 66,107 $ 61,231 $ 53,424 $ 34,007 $ 42,103 $ 39,823 $ 32,077
PSERS Plan 21
For the Years Ended 2007–2016 — Dollars in Thousands
6/30/2016 6/30/2015 6/30/2014 6/30/2013 6/30/2012 6/30/2011 6/30/2010 6/30/2009 6/30/2008 6/30/2007
Benefit Expenses
Service $ 593 $ 411 $ 237 $ 129 $ 63 $ 30 $ 14 $ 1 $ – $ –
Disability 13 12 12 17 5 4 3 4 – –
Survivor 24 21 7 2 2 1 – – – –
Refunds
Separations 2,630 2,520 2,107 2,142 1,868 1,747 895 450 151 22
Death 17 92 87 44 53 33 33 16 1 1
Total $ 3,277 $ 3,056 $ 2,450 $ 2,334 $ 1,991 $ 1,815 $ 945 $ 471 $ 152 $ 23
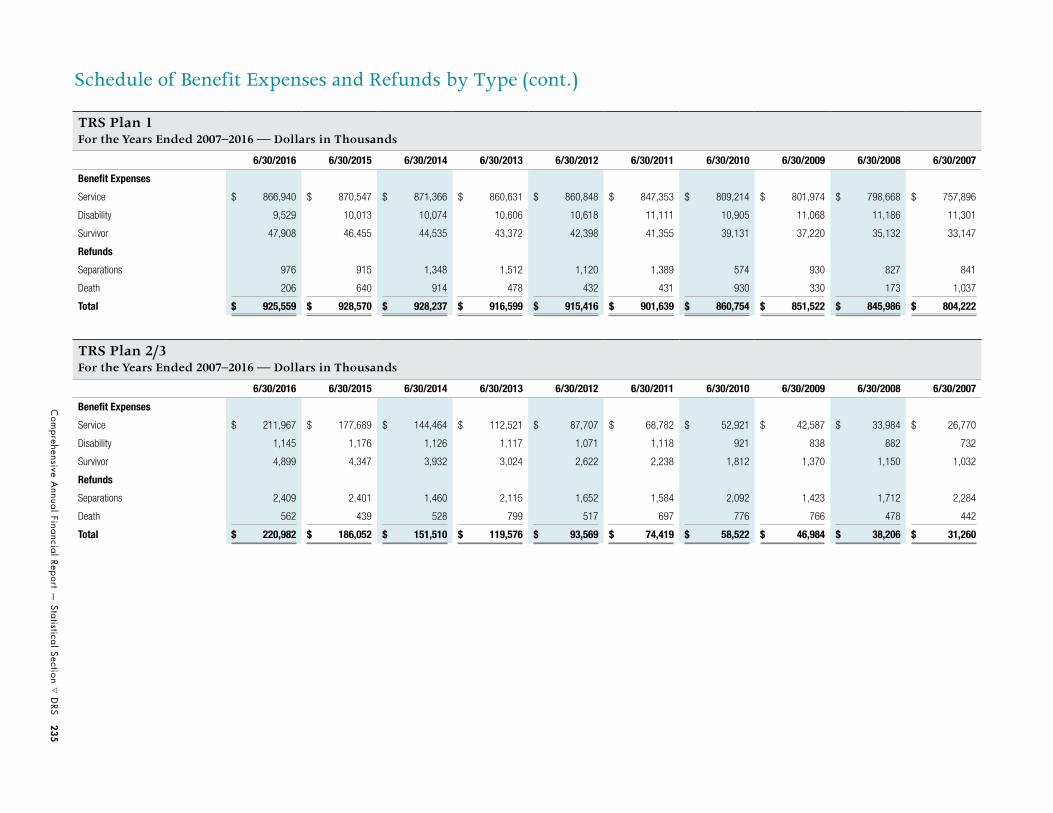
Com
prehensive Annual Financial Report —
Statistical Section s D
RS 235
Schedule of Benefit Expenses and Refunds by Type (cont.)
TRS Plan 1For the Years Ended 2007–2016 — Dollars in Thousands
6/30/2016 6/30/2015 6/30/2014 6/30/2013 6/30/2012 6/30/2011 6/30/2010 6/30/2009 6/30/2008 6/30/2007
Benefit Expenses
Service $ 866,940 $ 870,547 $ 871,366 $ 860,631 $ 860,848 $ 847,353 $ 809,214 $ 801,974 $ 798,668 $ 757,896
Disability 9,529 10,013 10,074 10,606 10,618 11,111 10,905 11,068 11,186 11,301
Survivor 47,908 46,455 44,535 43,372 42,398 41,355 39,131 37,220 35,132 33,147
Refunds
Separations 976 915 1,348 1,512 1,120 1,389 574 930 827 841
Death 206 640 914 478 432 431 930 330 173 1,037
Total $ 925,559 $ 928,570 $ 928,237 $ 916,599 $ 915,416 $ 901,639 $ 860,754 $ 851,522 $ 845,986 $ 804,222
TRS Plan 2/3For the Years Ended 2007–2016 — Dollars in Thousands
6/30/2016 6/30/2015 6/30/2014 6/30/2013 6/30/2012 6/30/2011 6/30/2010 6/30/2009 6/30/2008 6/30/2007
Benefit Expenses
Service $ 211,967 $ 177,689 $ 144,464 $ 112,521 $ 87,707 $ 68,782 $ 52,921 $ 42,587 $ 33,984 $ 26,770
Disability 1,145 1,176 1,126 1,117 1,071 1,118 921 838 882 732
Survivor 4,899 4,347 3,932 3,024 2,622 2,238 1,812 1,370 1,150 1,032
Refunds
Separations 2,409 2,401 1,460 2,115 1,652 1,584 2,092 1,423 1,712 2,284
Death 562 439 528 799 517 697 776 766 478 442
Total $ 220,982 $ 186,052 $ 151,510 $ 119,576 $ 93,569 $ 74,419 $ 58,522 $ 46,984 $ 38,206 $ 31,260
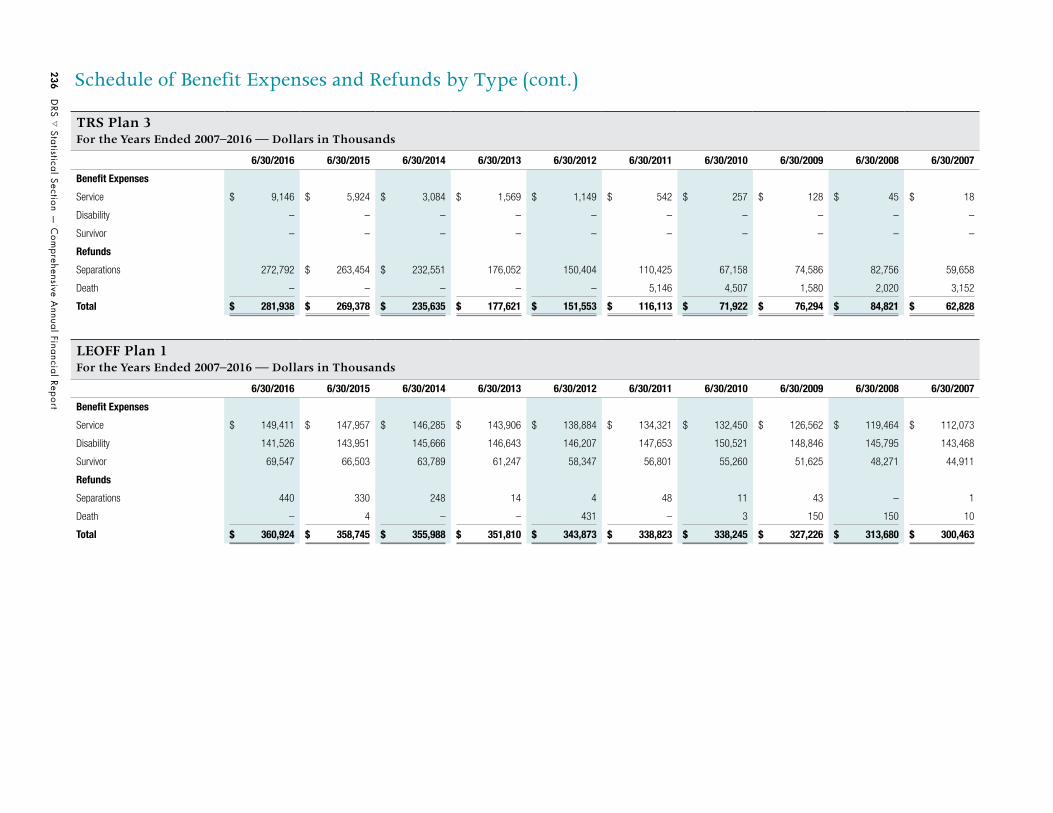
236 D
RS s Statistical Section —
Com
prehensive Annual Financial Report
Schedule of Benefit Expenses and Refunds by Type (cont.)
TRS Plan 3For the Years Ended 2007–2016 — Dollars in Thousands
6/30/2016 6/30/2015 6/30/2014 6/30/2013 6/30/2012 6/30/2011 6/30/2010 6/30/2009 6/30/2008 6/30/2007
Benefit Expenses
Service $ 9,146 $ 5,924 $ 3,084 $ 1,569 $ 1,149 $ 542 $ 257 $ 128 $ 45 $ 18
Disability – – – – – – – – – –
Survivor – – – – – – – – – –
Refunds
Separations 272,792 $ 263,454 $ 232,551 176,052 150,404 110,425 67,158 74,586 82,756 59,658
Death – – – – – 5,146 4,507 1,580 2,020 3,152
Total $ 281,938 $ 269,378 $ 235,635 $ 177,621 $ 151,553 $ 116,113 $ 71,922 $ 76,294 $ 84,821 $ 62,828
LEOFF Plan 1For the Years Ended 2007–2016 — Dollars in Thousands
6/30/2016 6/30/2015 6/30/2014 6/30/2013 6/30/2012 6/30/2011 6/30/2010 6/30/2009 6/30/2008 6/30/2007
Benefit Expenses
Service $ 149,411 $ 147,957 $ 146,285 $ 143,906 $ 138,884 $ 134,321 $ 132,450 $ 126,562 $ 119,464 $ 112,073
Disability 141,526 143,951 145,666 146,643 146,207 147,653 150,521 148,846 145,795 143,468
Survivor 69,547 66,503 63,789 61,247 58,347 56,801 55,260 51,625 48,271 44,911
Refunds
Separations 440 330 248 14 4 48 11 43 – 1
Death – 4 – – 431 – 3 150 150 10
Total $ 360,924 $ 358,745 $ 355,988 $ 351,810 $ 343,873 $ 338,823 $ 338,245 $ 327,226 $ 313,680 $ 300,463

Com
prehensive Annual Financial Report —
Statistical Section s D
RS 237
Schedule of Benefit Expenses and Refunds by Type (cont.)
LEOFF Plan 2For the Years Ended 2007–2016 — Dollars in Thousands
6/30/2016 6/30/2015 6/30/2014 6/30/2013 6/30/2012 6/30/2011 6/30/2010 6/30/2009 6/30/2008 6/30/2007
Benefit Expenses
Service $ 163,879 $ 134,364 $ 110,170 $ 87,232 $ 67,331 $ 52,547 $ 39,100 $ 30,694 $ 23,096 $ 16,889
Disability 14,266 12,340 10,599 9,693 7,318 6,710 5,356 4,632 3,480 3,204
Survivor 5,922 4,782 4,152 3,607 3,504 2,619 1,702 1,289 929 720
Refunds
Separations 6,287 6,798 7,730 8,117 9,774 7,155 6,739 6,112 6,350 7,557
Death 358 1,743 1,298 560 1,440 1,026 4,208 1,111 1,289 438
Total $ 190,712 $ 160,027 $ 133,949 $ 109,209 $ 89,367 $ 70,057 $ 57,105 $ 43,838 $ 35,144 $ 28,808
WSPRS Plan 1For the Years Ended 2007–2016 — Dollars in Thousands
6/30/2016 6/30/2015 6/30/2014 6/30/2013 6/30/2012 6/30/2011 6/30/2010 6/30/2009 6/30/2008 6/30/2007
Benefit Expenses
Service $ 48,540 $ 45,034 $ 42,805 $ 39,537 $ 36,687 $ 35,073 $ 33,015 $ 31,643 $ 30,293 $ 29,048
Disability – – – – – – – – – –
Survivor 5,111 4,738 4,338 3,984 3,681 3,314 3,101 2,879 2,670 2,345
Refunds
Separations 476 119 344 98 46 148 97 68 269 291
Death 15 – – 88 216 99 – 138 – –
Total $ 54,142 $ 49,891 $ 47,487 $ 43,707 $ 40,630 $ 38,634 $ 36,213 $ 34,728 $ 33,232 $ 31,684

238 D
RS s Statistical Section —
Com
prehensive Annual Financial Report
Schedule of Benefit Expenses and Refunds by Type (cont.)
WSPRS Plan 2For the Years Ended 2007–2016 — Dollars in Thousands
6/30/2016 6/30/2015 6/30/2014 6/30/2013 6/30/2012 6/30/2011 6/30/2010 6/30/2009 6/30/2008 6/30/2007
Benefit Expenses
Service $ – $ – $ – $ – $ – $ – $ – $ – $ – $ –
Disability – – – – – – – – – –
Survivor – – – – – – – – – –
Refunds
Separations 7 184 23 118 – 63 30 5 – –
Death 10 – – – – 5 – – – –
Total $ 17 $ 184 $ 23 $ 118 $ – $ 68 $ 30 $ 5 $ – $ –
JRSFor the Years Ended 2007–2016 — Dollars in Thousands
6/30/2016 6/30/2015 6/30/2014 6/30/2013 6/30/2012 6/30/2011 6/30/2010 6/30/2009 6/30/2008 6/30/2007
Benefit Expenses
Service $ 6,821 $ 7,178 $ 7,388 $ 7,504 $ 7,569 $ 7,678 $ 7,704 $ 7,811 $ 7,719 $ 7,696
Disability – – – – – – – – – –
Survivor 2,310 2,158 2,092 2,193 2,195 2,060 2,019 1,772 1,795 1,660
Refunds
Separations – – – – – – – – – –
Death – – – – – – – 7 – –
Total $ 9,131 $ 9,336 $ 9,480 $ 9,697 $ 9,764 $ 9,738 $ 9,723 $ 9,590 $ 9,514 $ 9,356

Com
prehensive Annual Financial Report —
Statistical Section s D
RS 239
Schedule of Benefit Expenses and Refunds by Type (cont.)
JRFFor the Years Ended 2007–2016 — Dollars in Thousands
6/30/2016 6/30/2015 6/30/2014 6/30/2013 6/30/2012 6/30/2011 6/30/2010 6/30/2009 6/30/2008 6/30/2007
Benefit Expenses
Service $ 347 $ 346 $ 346 $ 402 $ 421 $ 420 $ 421 $ 422 $ 466 $ 483
Disability – – – 72 – – – – – –
Survivor 93 98 98 – 61 79 79 79 79 98
Refunds
Separations – – – – – – – – – –
Death – – – – – – – – – –
Total $ 440 $ 444 $ 444 $ 474 $ 482 $ 499 $ 500 $ 501 $ 545 $ 581
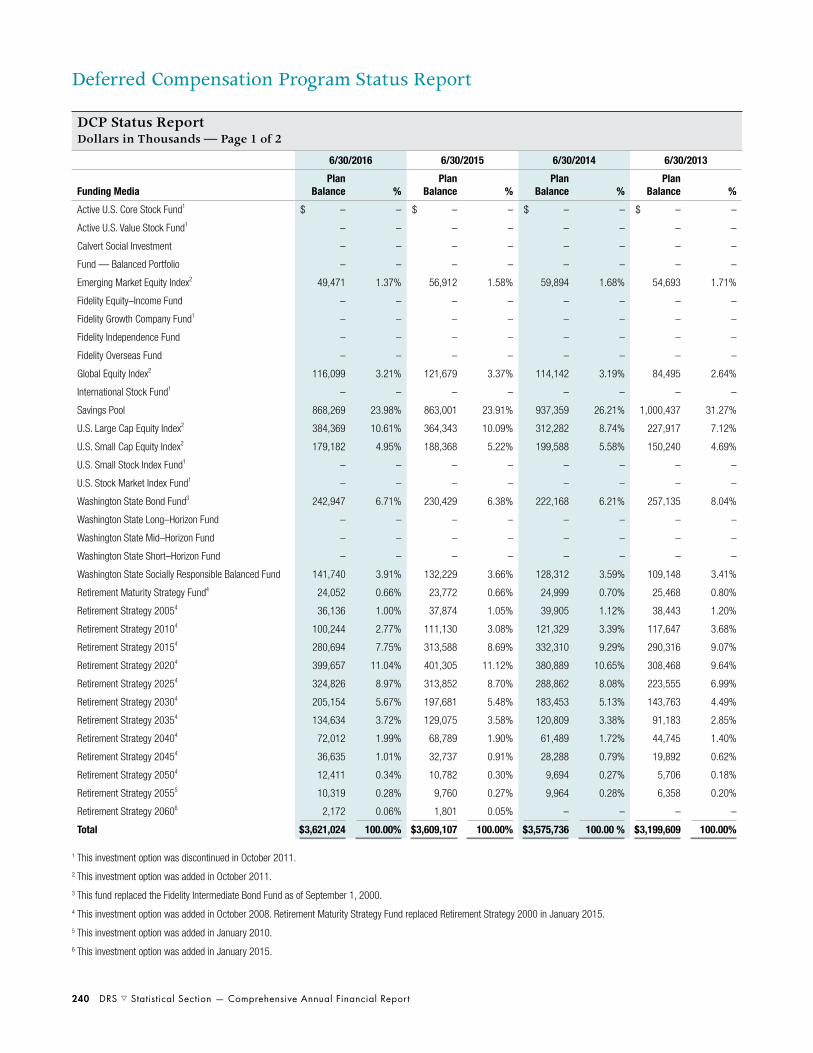
240 DRS s Statistical Section — Comprehensive Annual Financial Report
Deferred Compensation Program Status Report
DCP Status ReportDollars in Thousands — Page 1 of 2
6/30/2016 6/30/2015 6/30/2014 6/30/2013
Funding MediaPlan
Balance % Plan
Balance % Plan
Balance % Plan
Balance %
Active U.S. Core Stock Fund1 $ – – $ – – $ – – $ – –
Active U.S. Value Stock Fund1 – – – – – – – –
Calvert Social Investment – – – – – – – –
Fund — Balanced Portfolio – – – – – – – –
Emerging Market Equity Index2 49,471 1.37% 56,912 1.58% 59,894 1.68% 54,693 1.71%
Fidelity Equity–Income Fund – – – – – – – –
Fidelity Growth Company Fund1 – – – – – – – –
Fidelity Independence Fund – – – – – – – –
Fidelity Overseas Fund – – – – – – – –
Global Equity Index2 116,099 3.21% 121,679 3.37% 114,142 3.19% 84,495 2.64%
International Stock Fund1 – – – – – – – –
Savings Pool 868,269 23.98% 863,001 23.91% 937,359 26.21% 1,000,437 31.27%
U.S. Large Cap Equity Index2 384,369 10.61% 364,343 10.09% 312,282 8.74% 227,917 7.12%
U.S. Small Cap Equity Index2 179,182 4.95% 188,368 5.22% 199,588 5.58% 150,240 4.69%
U.S. Small Stock Index Fund1 – – – – – – – –
U.S. Stock Market Index Fund1 – – – – – – – –
Washington State Bond Fund3 242,947 6.71% 230,429 6.38% 222,168 6.21% 257,135 8.04%
Washington State Long–Horizon Fund – – – – – – – –
Washington State Mid–Horizon Fund – – – – – – – –
Washington State Short–Horizon Fund – – – – – – – –
Washington State Socially Responsible Balanced Fund 141,740 3.91% 132,229 3.66% 128,312 3.59% 109,148 3.41%
Retirement Maturity Strategy Fund4 24,052 0.66% 23,772 0.66% 24,999 0.70% 25,468 0.80%
Retirement Strategy 20054 36,136 1.00% 37,874 1.05% 39,905 1.12% 38,443 1.20%
Retirement Strategy 20104 100,244 2.77% 111,130 3.08% 121,329 3.39% 117,647 3.68%
Retirement Strategy 20154 280,694 7.75% 313,588 8.69% 332,310 9.29% 290,316 9.07%
Retirement Strategy 20204 399,657 11.04% 401,305 11.12% 380,889 10.65% 308,468 9.64%
Retirement Strategy 20254 324,826 8.97% 313,852 8.70% 288,862 8.08% 223,555 6.99%
Retirement Strategy 20304 205,154 5.67% 197,681 5.48% 183,453 5.13% 143,763 4.49%
Retirement Strategy 20354 134,634 3.72% 129,075 3.58% 120,809 3.38% 91,183 2.85%
Retirement Strategy 20404 72,012 1.99% 68,789 1.90% 61,489 1.72% 44,745 1.40%
Retirement Strategy 20454 36,635 1.01% 32,737 0.91% 28,288 0.79% 19,892 0.62%
Retirement Strategy 20504 12,411 0.34% 10,782 0.30% 9,694 0.27% 5,706 0.18%
Retirement Strategy 20555 10,319 0.28% 9,760 0.27% 9,964 0.28% 6,358 0.20%
Retirement Strategy 20606 2,172 0.06% 1,801 0.05% – – – –
Total $ 3,621,024 100.00% $ 3,609,107 100.00% $ 3,575,736 100.00 % $ 3,199,609 100.00%
1 This investment option was discontinued in October 2011.
2 This investment option was added in October 2011.
3 This fund replaced the Fidelity Intermediate Bond Fund as of September 1, 2000.
4 This investment option was added in October 2008. Retirement Maturity Strategy Fund replaced Retirement Strategy 2000 in January 2015.
5 This investment option was added in January 2010.
6 This investment option was added in January 2015.

Comprehensive Annual Financial Report — Statistical Section s DRS 241
Deferred Compensation Program Status Report (cont.)
DCP Status ReportDollars in Thousands — Page 2 of 2
6/30/2012 6/30/2011 6/30/2010 6/30/2009 6/30/2008 6/30/2007
Plan Balance %
Plan Balance %
Plan Balance %
Plan Balance %
Plan Balance %
Plan Balance %
$ – – $ 238,087 8.11% $ 192,558 7.87% $ 180,558 8.34% $ 267,879 11.02% $ 352,142 13.82%
– – 299,662 10.20% 245,272 10.03% 213,669 9.87% 326,400 13.43% 500,501 19.65%
– – – – – – – – – – – –
– – – – – – – – – – – –
52,542 1.79% – – – – – – – – – –
– – – – – – – – – – – –
– – 366,490 12.48% 268,855 10.99% 224,090 10.35% 315,284 12.97% 279,402 10.97%
– – – – – – – – – – – –
– – – – – – – – – – – –
65,500 2.23% – – – – – – – – – –
– – 123,184 4.20% 97,897 4.00% 89,981 4.16% 140,526 5.78% 167,724 6.58%
1,045,569 35.66% 1,013,313 34.51% 959,255 39.21% 954,969 44.10 % 819,272 33.71% 723,624 28.41%
178,250 6.08% – – – – – – – – – –
109,915 3.75% – – – – – – – – – –
– – 116,776 3.98% 77,248 3.16% 52,854 2.44% 64,641 2.66% 87,907 3.45%
– – 163,011 5.55% 124,866 5.10% 102,935 4.75% 134,940 5.55% 152,066 5.97%
267,316 9.12% 179,032 6.10% 178,187 7.28% 134,101 6.19% 132,298 5.44% 87,000 3.42%
– – – – – – – – 64,478 2.65% 62,784 2.46%
– – – – – – – – 72,182 2.97% 61,143 2.40%
– – – – – – – – 34,602 1.42% 24,892 0.98%
101,014 3.45% 73,021 2.49% 58,828 2.41% 49,115 2.27% 58,317 2.40% 48,082 1.89%
24,435 0.83% 6,312 0.21% 3,973 0.16% 3,458 0.16% – – – –
35,891 1.22% 11,313 0.39% 9,269 0.38% 6,919 0.32% – – – –
115,133 3.93% 48,294 1.64% 38,435 1.57% 29,057 1.34% – – – –
253,859 8.66% 100,846 3.43% 69,852 2.86% 44,406 2.05% – – – –
256,143 8.74% 81,120 2.76% 51,674 2.11% 34,220 1.58% – – – –
179,951 6.14% 50,278 1.71% 30,265 1.24% 19,402 0.90% – – – –
114,916 3.92% 29,300 1.00% 17,133 0.70% 10,986 0.51% – – – –
73,173 2.50% 17,332 0.59% 10,869 0.44% 7,444 0.34% – – – –
35,038 1.19% 10,251 0.35% 6,417 0.26% 4,163 0.19% – – – –
14,996 0.51% 5,554 0.19% 3,301 0.14% 2,215 0.10% – – – –
4,355 0.15% 2,228 0.08% 1,491 0.06% 882 0.04% – – – –
3,868 0.13% 1,023 0.03% 769 0.03% – – – – – –
– – – – – – – – – – – –
$ 2,931,864 100.00% $ 2,936,427 100.00% $ 2,446,414 100.00% $ 2,165,424 100.00% $ 2,430,819 100.00% $ 2,547,267 100.00%
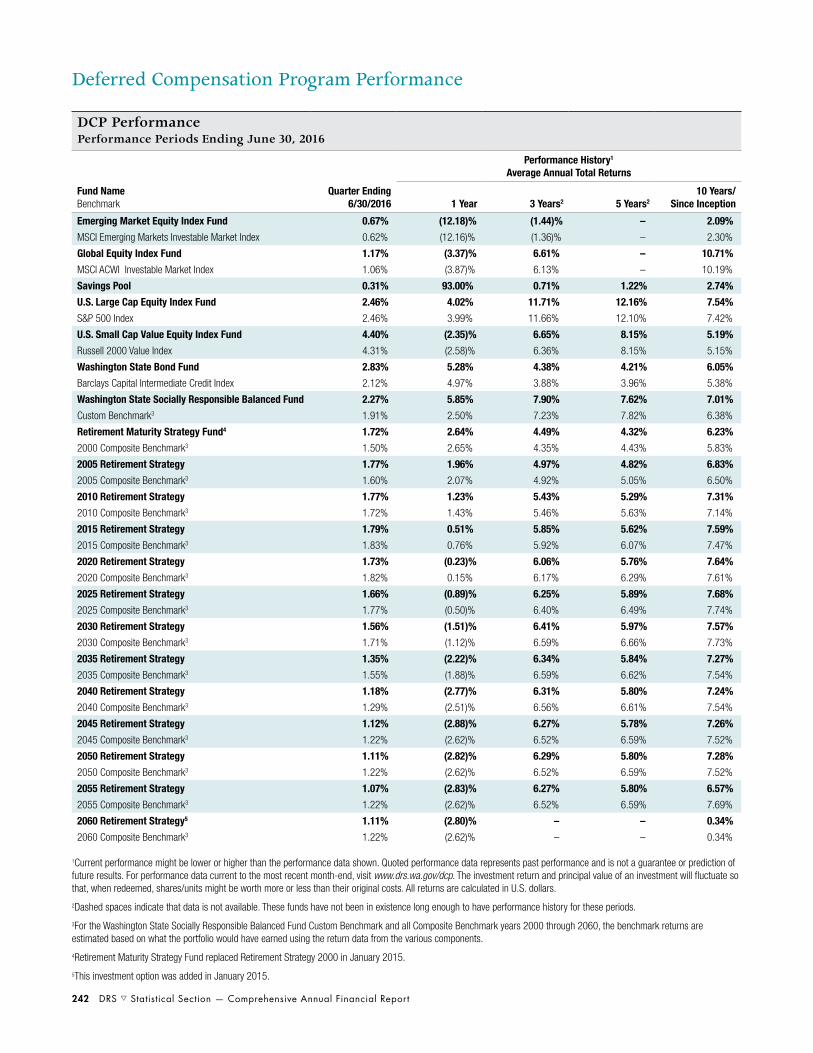
242 DRS s Statistical Section — Comprehensive Annual Financial Report
Deferred Compensation Program Performance
DCP PerformancePerformance Periods Ending June 30, 2016
Performance History1
Average Annual Total Returns
Fund NameBenchmark
Quarter Ending 6/30/2016 1 Year 3 Years2 5 Years2
10 Years/ Since Inception
Emerging Market Equity Index Fund 0.67% (12.18)% (1.44)% – 2.09%
MSCI Emerging Markets Investable Market Index 0.62% (12.16)% (1.36)% – 2.30%
Global Equity Index Fund 1.17% (3.37)% 6.61% – 10.71%
MSCI ACWI Investable Market Index 1.06% (3.87)% 6.13% – 10.19%
Savings Pool 0.31% 93.00% 0.71% 1.22% 2.74%
U.S. Large Cap Equity Index Fund 2.46% 4.02% 11.71% 12.16% 7.54%
S&P 500 Index 2.46% 3.99% 11.66% 12.10% 7.42%
U.S. Small Cap Value Equity Index Fund 4.40% (2.35)% 6.65% 8.15% 5.19%
Russell 2000 Value Index 4.31% (2.58)% 6.36% 8.15% 5.15%
Washington State Bond Fund 2.83% 5.28% 4.38% 4.21% 6.05%
Barclays Capital Intermediate Credit Index 2.12% 4.97% 3.88% 3.96% 5.38%
Washington State Socially Responsible Balanced Fund 2.27% 5.85% 7.90% 7.62% 7.01%
Custom Benchmark3 1.91% 2.50% 7.23% 7.82% 6.38%
Retirement Maturity Strategy Fund4 1.72% 2.64% 4.49% 4.32% 6.23%
2000 Composite Benchmark3 1.50% 2.65% 4.35% 4.43% 5.83%
2005 Retirement Strategy 1.77% 1.96% 4.97% 4.82% 6.83%
2005 Composite Benchmark3 1.60% 2.07% 4.92% 5.05% 6.50%
2010 Retirement Strategy 1.77% 1.23% 5.43% 5.29% 7.31%
2010 Composite Benchmark3 1.72% 1.43% 5.46% 5.63% 7.14%
2015 Retirement Strategy 1.79% 0.51% 5.85% 5.62% 7.59%
2015 Composite Benchmark3 1.83% 0.76% 5.92% 6.07% 7.47%
2020 Retirement Strategy 1.73% (0.23)% 6.06% 5.76% 7.64%
2020 Composite Benchmark3 1.82% 0.15% 6.17% 6.29% 7.61%
2025 Retirement Strategy 1.66% (0.89)% 6.25% 5.89% 7.68%
2025 Composite Benchmark3 1.77% (0.50)% 6.40% 6.49% 7.74%
2030 Retirement Strategy 1.56% (1.51)% 6.41% 5.97% 7.57%
2030 Composite Benchmark3 1.71% (1.12)% 6.59% 6.66% 7.73%
2035 Retirement Strategy 1.35% (2.22)% 6.34% 5.84% 7.27%
2035 Composite Benchmark3 1.55% (1.88)% 6.59% 6.62% 7.54%
2040 Retirement Strategy 1.18% (2.77)% 6.31% 5.80% 7.24%
2040 Composite Benchmark3 1.29% (2.51)% 6.56% 6.61% 7.54%
2045 Retirement Strategy 1.12% (2.88)% 6.27% 5.78% 7.26%
2045 Composite Benchmark3 1.22% (2.62)% 6.52% 6.59% 7.52%
2050 Retirement Strategy 1.11% (2.82)% 6.29% 5.80% 7.28%
2050 Composite Benchmark3 1.22% (2.62)% 6.52% 6.59% 7.52%
2055 Retirement Strategy 1.07% (2.83)% 6.27% 5.80% 6.57%
2055 Composite Benchmark3 1.22% (2.62)% 6.52% 6.59% 7.69%
2060 Retirement Strategy5 1.11% (2.80)% – – 0.34%
2060 Composite Benchmark3 1.22% (2.62)% – – 0.34%
1Current performance might be lower or higher than the performance data shown. Quoted performance data represents past performance and is not a guarantee or prediction of future results. For performance data current to the most recent month-end, visit www.drs.wa.gov/dcp. The investment return and principal value of an investment will fluctuate so that, when redeemed, shares/units might be worth more or less than their original costs. All returns are calculated in U.S. dollars.
2Dashed spaces indicate that data is not available. These funds have not been in existence long enough to have performance history for these periods.
3For the Washington State Socially Responsible Balanced Fund Custom Benchmark and all Composite Benchmark years 2000 through 2060, the benchmark returns are estimated based on what the portfolio would have earned using the return data from the various components.
4Retirement Maturity Strategy Fund replaced Retirement Strategy 2000 in January 2015.
5This investment option was added in January 2015.

Comprehensive Annual Financial Report — Statistical Section s DRS 243
30,000
35,000
40,000
45,000
50,000
55,000
60,000
2007 2008 2009 2010 2011 2012 2013 2014 2015 2016
Total Participants Active Contributing Participants
51,12852,582
53,283 53,708 53,60352,759 52,736 53,309
54,32155,851
33,448 34,11333,398 33,193 32,762
31,728 31,571
36,364 36,82937,663
Deferred Compensation Program Performance (cont.)
DCP ParticipationFor the Fiscal Years Ended June 30, 2007-2016
500
$1,000
$1,500
$2,000
$2,500
$3,000
$3,500
$4,000
2007 2008 2009 2010 2011 2012 2013 2014 2015 2016
Net Investment Assets Savings Pool Assets
$2,547$2,431
$2,165
$2,446
$2,936 $2,932
$3,200
$3,576 $3,609 $3,620
$724$819
$955 $959 $1,013 $1,045 $1,000 $937 $863 $868
DCP Net Investment Asset GrowthFor the Fiscal Years Ended June 30, 2007-2016 — Dollars in Millions

244 DRS s Statistical Section — Comprehensive Annual Financial Report
This page is intentionally blank.

www.drs.wa.gov