Comprehensive Annual Financial Report · Comprehensive Annual Financial Report of the ... excellent...
286
Transcript of Comprehensive Annual Financial Report · Comprehensive Annual Financial Report of the ... excellent...
Comprehensive Annual
Financial Report of the
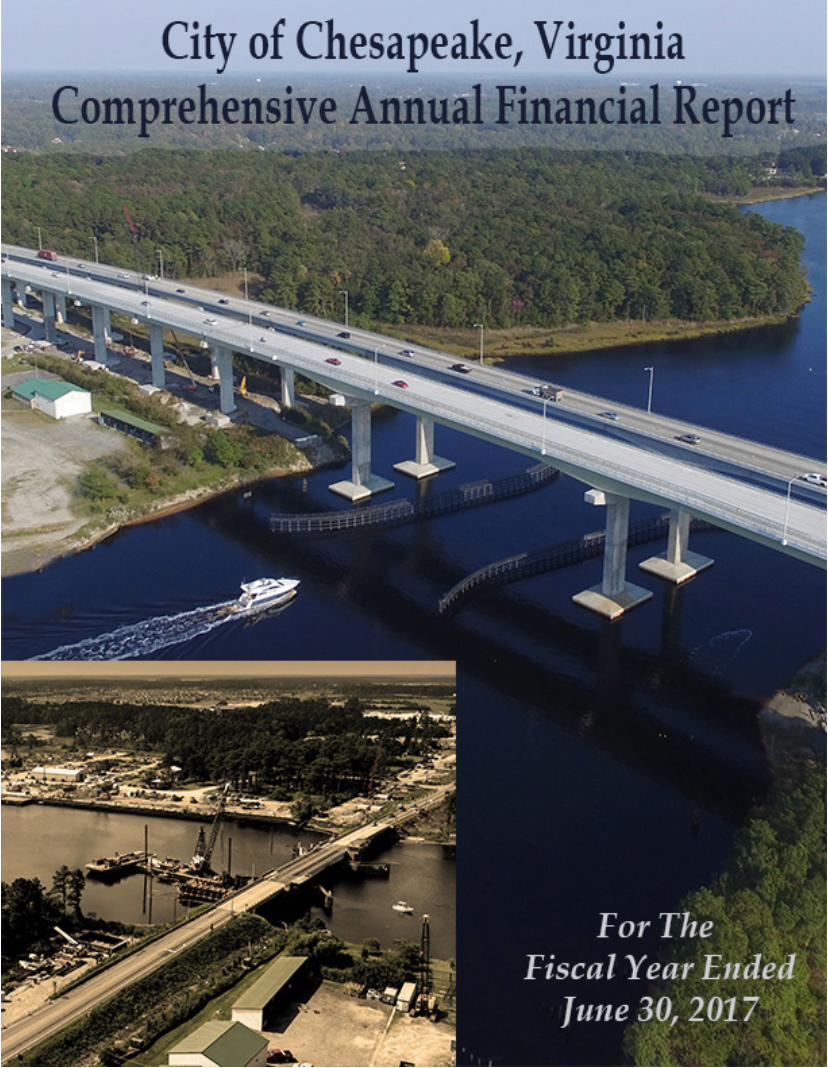
City of Chesapeake, Virginia for Fiscal Year Ended
June 30, 2017
Prepared by the Chesapeake Department of Finance
Nancy C. Tracy, Director
City of Chesapeake, Virginia
Mission
The employees of the City of Chesapeake are committed to providing quality service to all Citizens equitably, in a responsive and caring manner.
Code of Ethics
We, the employees of the City of Chesapeake, are committed to the highest standards of ethical conduct that reflect:
Responsibility, Honesty, Respect, Fairness, Compassion, Integrity and Loyalty
Acknowledgments… The preparation of this report has been accomplished by the efficient and dedicated services of the staff of the Department of Finance and various departments who have been assisted by the independent auditors, Cherry Bekaert LLP. The contributions of all are invaluable and sincerely appreciated and clearly reflect the high standards which have been set by the City of Chesapeake. The following Finance employees were instrumental in the preparation of this report: Kristen Bailey Faith Baker Lorra Calvert Megan Craig Jennifer Cummins
Pamela Hardesty Linda Mathis Lisa Morris Kelley Peroe Nancy Randall
Nancy Tracy Subhashree Venkatasubramanian Tamara Walters Katherine Williams
It is also appropriate to thank the City Manager, Mayor and Members of City Council for making possible the excellent financial position of the City through their interest and support in planning and conducting the financial affairs of the City.
Please visit us at: www.cityofchesapeake.net
CITY OF CHESAPEAKE, VIRGINIA
Table of Contents
PageNumber
INTRODUCTORY SECTION:
IVIII
IXXI
FINANCIAL SECTION:
17
Basic Financial Statements:Government-Wide Financial Statements:
A 26B 27
Fund Financial Statements:Governmental Fund Financial Statements:
C 32D 34
Proprietary Fund Financial Statements:E 38F 39G 40
Fiduciary Fund Financial Statements:H 42I 43
Other Discretely Presented Component Units:J-1 46J-2 47K 50
1. 502. 603. 654. 685. 756. 777. 878. 889. 9010. 9011. 10912. 11813. 12114. 12115. 122
Statement of Revenues, Expenditures and Changes in Fund Balances............................
Statement of Net Position..................................................................................................Statement of Revenues, Expenses and Changes in Net Position......................................Statement of Cash Flows...................................................................................................
.................Summary of Significant Accounting Policies......................................................................................................
June 30, 2017
Schedule
.................
.................
.................
Advances and On Behalf Of Payments................................................................................................................Interfund Balances and Transfers.........................................................................................................................Leases....................................................................................................................................................................Retirement Plans...................................................................................................................................................Other Postemployment Benefits...........................................................................................................................
Deposits and Investments.....................................................................................................................................Accounts Receivable and Payable........................................................................................................................Capital Assets.......................................................................................................................................................Deferred Outflows and Inflows of Resources......................................................................................................Long-Term Obligations........................................................................................................................................
Organization Chart ........................................................................................................................................................................Letter of Transmittal .....................................................................................................................................................................
City Officials..................................................................................................................................................................................GFOA Certificate of Achievement ...............................................................................................................................................
Report of Independent Auditor......................................................................................................................................................Management’s Discussion and Analysis (MD&A).......................................................................................................................
Statement of Net Position..........................................................................................................Statement of Activities...............................................................................................................
.................
.................
Combining Statement of Net Position.......................................................................................Combining Statement of Activities............................................................................................
Notes to Basic Financial Statements:.................................................................................................
Statement of Changes in Fiduciary Net Position..............................................................Statement of Fiduciary Net Position.................................................................................
Balance Sheet ................................................................................................................... ..................................
.................
.................
.................
.................
Joint Venture.........................................................................................................................................................
Fund Balances ......................................................................................................................................................Deferred Compensation Plan................................................................................................................................Commitments........................................................................................................................................................
i
CITY OF CHESAPEAKE, VIRGINIA
Table of Contents, Continued
PageNumber
FINANCIAL SECTION (Continued):
Notes to Basic Financial Statements (Continued):16. 12317. 12918. 129
Required Supplementary Information Other Than MD&A:Schedule of Revenues, Expenditures and Changes in Fund
L-1 132L-2 133L-3 134L-4 135L-5 136L-6 137L-7 138L-8 139L-9 140L-10 141
Other Supplementary Information: Combining and Individual Fund Schedules:
Governmental Funds:Major Governmental Funds:
General Fund:Schedule of Revenues and Other Financing
M-1 146Schedule of Expenditures, Encumbrances and
M-2 150Debt Service Fund:
Schedule of Revenues, Expenditures and ChangesN 155
Capital Projects Funds:General Capital Projects Fund:
Schedule of Expenditures and Encumbrances –O-1 159
Public Utilities Capital Projects Fund:Schedule of Expenditures and Encumbrances –
O-2 166Chesapeake Transportation System Capital Projects Fund:
Schedule of Expenditures and Encumbrances –O-3 169
Stormwater Management Capital Projects Fund:Schedule of Expenditures and Encumbrances –
O-4 170
in Fund Balance – Budget and Actual..................................................... .................
June 30, 2017
.................
New Pronouncements...........................................................................................................................................
.................
.................
Contingent Liabilities...........................................................................................................................................Fund Deficits........................................................................................................................................................
Schedule
.................
.................
.................
Balances – Budget and Actual – General Fund........................................................................Schedule of Employer Contributions – Virginia Retirement System................................................Schedules of Changes in the Net Pension Liability and Related Ratios – City.................................Schedules of Changes in the Net Pension Liability and Related Ratios – Schools...........................Schedule of Employer’s Share of Net Pension Liability...................................................................Schedules of Funding Progress – Other Postemployment Benefits...................................................Schedules of Employer Contributions – Other Postemployment Benefits........................................
Notes to Required Supplementary Information.................................................................................
Sources – Budget and Actual ..................................................................
Other Financing Uses – Budget and Actual ...........................................
Budget and Actual...........................................................................
Budget and Actual...........................................................................
.................
.................
.................
.................
.................
.................
.................
.................Schedule of Changes in the Net OPEB Liability and Related Ratios – City....................................
Budget and Actual...........................................................................
Budget and Actual...........................................................................
Schedule of Changes in the Net OPEB Liability and Related Ratios – Schools............................... ..................................
ii
CITY OF CHESAPEAKE, VIRGINIA
Table of Contents, Continued
PageNumber
FINANCIAL SECTION (Continued):
Nonmajor Governmental Funds:Special Revenue and Permanent Funds:
P-1 174Combining Statement of Revenues, Expenditures
P-2 178Tax Increment Financing Greenbrier Fund:
Schedule of Revenues, Expenditures and OtherP-3 182
Tax Increment Financing South Norfolk Fund:Schedule of Revenues, Expenditures and Other
P-4 183Virginia Public Assistance Fund:
Schedule of Revenues, Expenditures and OtherP-5 184
Integrated Behavioral Healthcare Fund:Schedule of Revenues, Expenditures and Other
P-6 185Conference Center Fund:
Schedule of Revenues, Expenditures and OtherP-7 186
Juvenile Services Fund:Schedule of Revenues, Expenditures and Other
P-8 187Interagency Consortium Fund:
Schedule of Revenues, Expenditures and OtherP-9 188
E-911 Operations Fund:Schedule of Revenues, Expenditures and Other
P-10 189Fee Supported Activities Fund:
Schedule of Revenues, Expenditures and OtherP-11 190
Internal Service Funds:Q-1 192Q-2 193Q-3 194
Fiduciary Fund:Agency Fund:
Special Welfare Fund:R 197
June 30, 2017
.................
Financing Sources (Uses) – Budget and Actual..............................
.................
.................
.................
.................
.................
.................
.................
.................
.................
.................
.................
.................
.................
.................
Schedule
Statement of Net Position.........................................................................................Statement of Revenues, Expenses and Changes in Net Position..............................Statement of Cash Flows..........................................................................................
Financing Sources (Uses) – Budget and Actual..............................
Combining Balance Sheet................................................................................
and Changes in Fund Balances................................................................
Financing Sources (Uses) – Budget and Actual..............................
Financing Sources (Uses) – Budget and Actual..............................
Financing Sources (Uses) – Budget and Actual..............................
Financing Sources (Uses) – Budget and Actual..............................
Financing Sources (Uses) – Budget and Actual..............................
Financing Sources (Uses) – Budget and Actual..............................
Financing Sources (Uses) – Budget and Actual..............................
Statement of Changes in Assets and Liabilities.......................................
iii

CITY OF CHESAPEAKE, VIRGINIA
Table of Contents, Continued
PageNumber
FINANCIAL SECTION (Continued):
Chesapeake Public Schools Component Unit:Governmental Funds:
S-1 201Schedule of Revenues, Expenditures and Changes
S-2 202Fiduciary Fund Financial Statements:
S-3 204S-3A 205
Schedule of Revenues, Expenditures and Changes inS-4 206
Schedule of Revenues, Expenditures and Changes inS-5 207
Schedule of Revenues, Expenditures and Changes inS-6 208
Other Component Units:T-1 210
Statement of Revenues, Expenditures and Changes inT-2 211
Statement of Revenues, Expenditures and Changes inT-3 212T-4 213
STATISTICAL SECTION:
Financial Trends Information:Table 1 216Table 2 218Table 3 225Table 4 226
Revenue Capacity Information:Table 5 228Table 6 229Table 7 230Table 8 231Table 9 233
Debt Capacity Information:Table 10 234Table 11 236Table 12 237
Ratio of Annual Debt Expenditures for General ObligationTable 13 238Table 14 239
June 30, 2017
.................
.................
.................
.................
.................
.................
.................
.................
Schedule
Balance Sheet...................................................................................................
in Fund Balance.......................................................................................
Statement of Fiduciary Net Position................................................................Statement of Changes in Fiduciary Net Position.............................................
Fund Balance – Budget and Actual – Schools General Fund.........................
Fund Balance – Budget and Actual – Schools Food Services Fund...............
Fund Balance – Budget and Actual – Schools Textbooks Fund.....................
.................
.................
.................
.................
.................
.................
.................
.................
.................
.................
Fund Balance – Chesapeake Mosquito Control Commission..........................
Net Position – Chesapeake Port Authority.......................................................
Changes in Net Position............................................................................................................Fund Balances, Governmental Funds........................................................................................Statement of Changes in Fund Balances, Governmental Funds...............................................
Assessed and Estimated Actual Value of Taxable Property.....................................................Direct and Overlapping Property Tax Rates.............................................................................
Combining Balance Sheet and Statement of Net Position.......................................
Statement of Cash Flows – Chesapeake Port Authority ..........................................
Net Position by Component.......................................................................................................
.................
.................
.................
.................
.................
Principal Property Taxpayers....................................................................................................Property Tax Levies...................................................................................................................Property Tax Levies and Collections.........................................................................................
Ratio of Bonded Debt Expenditures to Local Revenues...........................................................
Ratios of Outstanding Debt by Type.........................................................................................Ratios of Outstanding General Bonded Debt............................................................................Debt Affordability Indicators....................................................................................................
Bonded Debt to Total General Governmental Expenditures............................................ ..................................
iv
CITY OF CHESAPEAKE, VIRGINIA
Table of Contents, Continued
PageNumber
STATISTICAL SECTION (Continued):
Debt Capacity Information (Continued):Table 15 240
Revenue Bond CoverageTable 16 241
Demographic and Economic Information:Table 17 242Table 18 243
Operating Information:Table 19 244
Authorized Full-time Equivalent City Government Table 20 245Table 21 247Table 22 248
COMPLIANCE SECTION:
U-1 251U-2 254
Report of Independent Auditor on Internal Control Over Financial Reporting and on Compliance and Other Matters Based on an Audit of Financial
255Report of Independent Auditor on Compliance for each Major Federal Program and
257259
June 30, 2017
Legal Debt Margin Information.................................................................................................
Schedule
.................
Schedule of Findings and Questioned Costs.........................................................................................................................Internal Control over Compliance Required by the Uniform Guidance.......................................................................
Statements Performed in Accordance with Government Auditing Standards..............................................................
Notes to Schedule of Expenditures of Federal Awards.....................................................................Schedule of Expenditures of Federal Awards....................................................................................
Capital Asset Statistics by Function/Program...........................................................................
Water and Sewer Systems and Chesapeake Transportation System.................................
Demographic and Economic Statistics......................................................................................Principal Employers...................................................................................................................
Municipal Employment Statistics..............................................................................................
Operating Indicators by Function/Program...............................................................................
.................
.................
.................Employee Positions by Department..................................................................................
.................
.................
.................
.................
.................
.................
v

This page intentionally left blank

INTRODUCTORY SECTION
I
Office of the City Manager
306 Cedar Road Chesapeake, Virginia 23322-5225
Office: (757) 382-6166 Fax: (757) 382-6507
November 28, 2017 To the Citizens of Chesapeake, Virginia: The Comprehensive Annual Financial Report of the City of Chesapeake, Virginia (the City) for the fiscal year ended June 30, 2017 is hereby submitted. The financial statements included in this report conform to generally accepted accounting principles as established by the Governmental Accounting Standards Board (GASB). Responsibility for both accuracy of the data and the completeness and fairness of the presentation, including all disclosures, rests with the City. To the best of our knowledge and belief, the enclosed data is accurate in all material respects and is reported in a manner designed to present fairly the financial position and results of operations of the City and its component units. All disclosures necessary to enable the reader to gain an understanding of the City's financial activities have been included. Management’s Discussion and Analysis (MD&A) immediately follows the Report of Independent Auditor and provides a narrative introduction, overview and analysis to accompany the basic financial statements. This letter of transmittal is designed to complement the MD&A and should be read in conjunction with it. The Reporting Entity and Its Services The present City of Chesapeake was formed on January 1, 1963 by the merger of Norfolk County and the City of South Norfolk. This merger created the second largest city in the Commonwealth with 353 square miles, surrounded by the cities of Norfolk, Portsmouth, Virginia Beach, Suffolk and the North Carolina state line. The City of Chesapeake derives its governing authority from a charter granted by the Virginia General Assembly. The City is organized under the Council-Manager form of government. The City Council is the legislative body of the City government with the Mayor as the presiding officer. The Mayor is elected on an at-large basis as are the eight remaining City Council members. The City Manager is appointed by the City Council and is responsible for the day to day administration of the City. In accordance with the requirements of GASB, the financial reporting entity consists of the Primary Government (the City of Chesapeake), as well as its component units, which are legally separate organizations for which the City Council is financially accountable. Financial accountability is determined on the basis of the City Council's selection of governing authority, designation of management, ability to influence operations and accountability for fiscal matters. Component units are discretely presented and are reported in separate columns in the government-wide financial statements to emphasize that they are legally separate from the Primary Government and to differentiate their financial position and results of operations from those of the Primary Government. Discretely presented component units qualifying for inclusion in this report are Chesapeake Public Schools, Chesapeake Mosquito Control Commission, Economic Development Authority of the City of Chesapeake (the EDA, formerly known as the Industrial Development Authority), Chesapeake Port Authority, Chesapeake Airport Authority and Elizabeth River Properties of Chesapeake, Inc. The activities of one component unit, CSB of Chesapeake, Inc. (CSBC, Inc.), are considered to be so intertwined with the City’s activities that they are in substance part of the City’s operations. Therefore, CSBC, Inc. is blended with the City’s governmental activities. The Other Postemployment Benefits (OPEB) Trust Fund is where the City accounts for the costs of future benefits that are promised to City employees after retirement primarily in the form of retiree health insurance benefits. This fiduciary-type component unit is included within the fiduciary fund financial statements.
II
The City provides a full range of general governmental services for its citizens. These services include law enforcement, emergency medical response, fire protection, collection and disposal of solid waste, water and sewer utility services, stormwater utility services, parks, recreation, tourism, libraries and the construction and maintenance of highways, streets and other infrastructure. Other services provided include public education in grades pre-kindergarten through twelfth, public health and social services, planning and zoning, mental health assistance, agricultural services, judicial activities and general administrative services. Cities in Virginia have jurisdiction over the entire area within their boundaries and operate independently. There are no overlapping jurisdictions and, consequently, citizens of Virginia cities are not subject to overlapping debt or taxation. Economic Condition and Outlook This is the seventh consecutive calendar year of sales tax revenue growth for the City. The City’s taxable sales as reported to the Virginia Department of Taxation for calendar year 2016 increased $82.9 million or 2.5% from $3.3 billion in 2015 to $3.4 billion. Unemployment for the City and the Commonwealth remains below the national rate. For the fiscal year ended June 30, 2017, the average unemployment rates were 4.2% for Chesapeake (a decline from the prior year’s average unemployment rate of 4.3%), 4.5% for the Hampton Roads region and 4.0% for the Commonwealth, compared to 4.7% for the United States. The Chesapeake Economic Development Department’s 2017 Annual Report (highlighting 2016 business announcements and job creation) noted the following accomplishments:
Investment in Chesapeake totaled $289.3 million during 2016 (a 61.6% increase from 2015) resulting in the creation of 1,255 new jobs.
After the acquisition of Family Dollar Stores, Inc., Dollar Tree, Inc. committed to invest $110.0 million
for the development of its corporate headquarters in the City of Chesapeake. The expansion project is expected to retain 825 jobs and create 600 new jobs over the next six years with an additional annual payroll at the facility of at least $70.0 million. On the 2017 Fortune 500 List, Dollar Tree, Inc. increased its ranking from 180 to 136 with revenues of $20.7 billion, up 33.7% over the prior year.
UVA’s Weldon Cooper Center for Public Service projects Chesapeake will be the second most populous
city in Virginia by 2020.
INIT Inc. held a ribbon cutting ceremony on August 3, 2017 celebrating its expanding operations in Chesapeake by building a new 67,000 square foot manufacturing facility, investing nearly $13.0 million and establishing Chesapeake as its North American Headquarters with more than 90 employees.
Hoffman Beverage held a ribbon cutting ceremony on August 23, 2017 celebrating its expanded
operations in Chesapeake with a 253,000 square foot corporate headquarters, distribution and warehouse facility and investing $18.4 million with more than 180 employees.
Chesapeake Regional Healthcare Center, with more than 2000 employees and real estate assets across the city, celebrated its fortieth anniversary and serves as the City’s independently owned hospital.
Sentara Healthcare opened a new medical center in southern Chesapeake in March of 2017. Sentara
Edinburgh is a roughly $16.0 million, 60,000 square foot building housing a mini YMCA, physical and occupational therapy clinic and on-site family medicine and pediatric providers.
III
Smith/Packett is constructing a new 181 unit independent, assisted living and memory care community—The Crossings at Oakbrooke. It is located just one mile from Chesapeake Regional Healthcare Center and several physician and medical service providers. The 188,000 square foot community has a total project cost of nearly $30.0 million.
A new retail center opened on Battlefield Boulevard with a Kroger Marketplace, Dick’s Sporting Goods,
Field and Stream, Home Goods, Tuesday Morning and Five Below expanding the shopping offerings available in Chesapeake.
WalletHub named Chesapeake the tenth hardest working city in America. Chesapeake was also ranked the thirteenth most adventurous city in America and thirtieth best city for fit and happy men by Men’s Health Magazine.
WalletHub named Chesapeake the twelfth Best Place for Hispanic Entrepreneurs and ninth Best Place
for Hispanic Purchasing Power. Chesapeake’s General Obligation bonds continue to hold a AAA rating, the highest bond rating available, from Fitch Ratings and Standard & Poor’s Ratings Services and a Aa1 rating from Moody’s Investors Service. Major Initiatives For the Fiscal Year. The City Council serves the citizens by striving to provide efficient City services, quality education, and balanced and planned development while maintaining a fiscally sound government. The City Council and management continue to work proactively to effectively manage resources and costs. During fiscal year 2017, the City achieved the following accomplishments:
Strong financial performance resulted from continued cost containment and the careful management of resources. Specifically, General Fund expenditures, encumbrances and other financing uses of $541,076,421 were $28,487,916 or 5.0% below the revised budget. Total General Fund revenues and other financing sources of $556,490,993 exceeded budget by $8,362,432 or 1.5%.
The City’s Operating and Capital budgets adopted by the City Council preserved core services, funded
strategic initiatives and selected services and included no tax increases.
The City completed construction of the Dominion Boulevard Improvement Project including the Dominion Boulevard Veterans Bridge (Veterans Bridge). The project is the largest locally administered project in the Commonwealth’s history and was completed approximately $20.0 million under budget and five months before its contractual completion date. The 95-foot-high Veterans Bridge replaced the Steel Bridge and includes two new vehicular travel lanes and a dedicated 10-foot pedestrian and bicycle path separated from vehicular traffic. The Veterans Bridge eliminates drawbridges and stoplights, reduces congestion, provides an improved hurricane evacuation route and faster public safety response times.
The City has identified the Dominion Boulevard Corridor (U.S. Route 17 South) as a key strategic area for Chesapeake. In light of emerging development demand associated with the Dominion Boulevard Bridge Replacement and Roadway Improvement Project, the City enlisted Design Workshop in February 2014 to prepare a physical development plan, as well as a strategy to maximize the economic potential of the study area. It has been recognized for several years that this corridor has tremendous future growth potential, particularly as a regional commercial destination and employment center. This is due partly to the mixed-use land classifications established under the 2026 Land Use Plan in 2005, but also because of the widened Dominion Boulevard and Veterans Bridge. The opening of Grassfield High School, creation of the Dominion Commerce Park and Dominion Commons shopping center, new residential developments and expansion of Tidewater Community College’s Chesapeake Campus in recent years is setting the stage for this area to emulate the success of Greenbrier, one of the largest commercial hubs

IV
in the region. The study is the first market-based economic development strategic land use plan for the City of Chesapeake. The market analysis stated that the Dominion Corridor Area could be a regional economic development core if developed correctly. During the study process, staff interviewed key local, regional and Commonwealth stakeholders and held three rounds of public meetings. As the process moved forward, staff also analyzed the draft recommendations to confirm it is fiscally positive for the City. The plan was approved by the Planning Commission on October 28, 2015 and adopted by the City Council on November 15, 2016.
The City established the Naval Auxiliary Landing Field (NALF) Fentress Encroachment Protection Acquisition Program (FEPAP) in 2014. This program was created to prevent incompatible land uses from encroachment within the Fentress Airfield Overlay District and is being funded by both the Commonwealth of Virginia and the City of Chesapeake. Under FEPAP, the City acquires properties fee-simple to ensure compatible public or private use of the land. To date, the City has acquired four properties for a total of 107.5 acres. In June 2017 the City entered into a sales agreement for the purchase of an additional 163 acres and is preparing to sell restrictive easements over the four acquired properties to the U.S. Navy. FEPAP receives funding assistance from the Commonwealth of Virginia’s Federal Action Contingency Trust (FACT).
The City continues its mission of protecting and preserving Chesapeake’s unique environmental assets
for future generations through the Open Space and Agriculture Preservation (OSAP) Program, as well as its partnership with the U.S. Navy under the Readiness and Environmental Protection Initiative (REPI). The City applied for and was awarded $0.1 million of matching grant funds from the Virginia Department of Agriculture in fiscal year 2016 for Purchase of Development Rights activities. The City anticipates utilizing these funds during a fifth round of the OSAP Program.
The City receives Community Development Block Grant (CDBG) and HOME Investment Partnership
Program (HOME) entitlement funds annually to carry out community development activities including residential rehabilitation, affordable housing development, code enforcement, public facility improvements, public services, employment training and youth development. The combined 2017 allocation was $1.4 million.
The Planning Department continues to administer the City’s Neighborhood Stabilization Program (NSP). Twelve single family homes have been purchased, rehabbed and transferred under NSP. A portion of the $0.6 million in NSP program income has been used to acquire and rehab two single family homes bringing the total to fourteen. The balance will be used to transfer those two homes to eligible first time homebuyers and to acquire, rehab and transfer two additional homes during fiscal year 2018.
For the Future:
Chesapeake’s future as a desirable community in which to live and work continues to show promise and opportunity. Its central location, availability of land and good transportation network will continue to contribute to Chesapeake’s attractiveness as a well-balanced commercial center. The City’s close port proximity and strong employee pool continue to encourage a strong international business presence. As a result of these qualities, the Chesapeake civilian labor force has grown from 97,963 in 2000 to 116,459 in 2016 per the Virginia Employment Commission, an increase of 18.9% over the period. Median household income has risen from $50,743 in 2000 to $70,176 in 2015, per the U.S. Census Bureau.
The City continues its efforts to manage growth to achieve a balance between employment opportunities,
an expanding tax base, housing that meets the needs of a diverse population and a healthy natural environment. The City plans to continue to make the best use of land resources and infrastructure so that growth will include revitalization and redevelopment, as well as development of new areas in a manner that will preserve rural, historic and environmental assets. Such efforts have helped to better manage the City’s annual growth rate from an average of 3.2% between 1985 and 1995, to an average annual growth rate of roughly 1.0% since 2001. According to projections from the Hampton Roads Planning District Commission, Chesapeake’s total population in 2040 will be approximately 314,600.
V
Additionally, total households are projected to be 114,300, while total employment will be 167,000. This yields 1.46 jobs per household, which is considered to be a sustainable balance.
City staff continues to plan for and implement key catalyst activities for revitalization in South Norfolk,
including reallocating Tax Increment Financing (TIF) Funds authorized for use in the South Norfolk TIF District. In fiscal year 2016, the City Council authorized $125,000 for Phase I of the Municipal Facilities Study and Development Strategy. In fiscal year 2017, the City Council approved an additional $132,000 in TIF Funds to conduct Phase II and III of the Study. The City Council further specified that funds could be used for acquisition of legal, non-conforming residential properties in the South Hill neighborhood, as well as authorizing transition assistance for affected residents. An internal City staff steering committee is working to acquire properties on a voluntary basis.
The City continued its partnership with the U.S. Navy to acquire property interests under multi-year
encroachment protection agreements for the NALF Fentress and Naval Support Activity Norfolk Northwest Annex. Under these agreements, the Navy agrees to reimburse the City half of the purchase price of the property in exchange for a conservation easement. These purchases bolster the City’s support of each installation’s mission and furthers its commitment to environmental stewardship. Acquisition of properties in these areas also adds to the network of conservation lands in southern Chesapeake. The City is conducting an application round for its land conservations programs with a view to continue acquiring properties on a voluntary basis in order to meeting program goals.
Construction continues on several of the Planned Unit Developments in the City, including the
residential component of the Gateway at SoNo, Culpepper Landing and Edinburgh as well as commercial construction at Edinburgh. During calendar years 2016 and 2017 several large residential developments were proposed that included single family homes, condominiums and apartments. The City projects a continued upward trend in the number of development proposals being submitted for review.
Financial Information Financial Information and Significant Financial Policies The keystone to the City’s ability to maintain its fiscal responsibility is the continuing dedication of the City Council, which is evidenced by the City Council’s adoption of sound financial policies that are contained in City publications such as the Annual Operating Budget and Five Year Capital Improvement Plan documents. These policies relate primarily to the integration of capital planning, debt capacity and planning, cash management and operational efficiencies as a means of ensuring prudent and responsible allocation of the City’s resources. From time to time, the City Council evaluates these policies and makes amendments as needed to address the changing economic conditions and management practices. In addition, the City Council annually adopts tenets for budgetary developments which serve to guide the City in adhering to a fiscally conservative budget preparation methodology. Minimum Fund Balance Policy. The City Council adopted a resolution effective July 1, 2014, to maintain an Unassigned Fund Balance in the General Fund at a minimum of 10.0% of the General Fund Revenues and Tax Revenues Committed to Special Revenue Funds, including Tax Increment Financing Funds. The City Council budgets 12.0% year-end Unassigned Fund Balance to ensure compliance. In the event that the Unassigned Fund Balance shall fall below 10.0% due to unexpected operating emergencies or emergency event response, the City shall develop a plan to replenish the balance to 10.0% within three years. Funds in excess of 10.0% may be retained in the Unassigned General Fund Balance, may be designated as Committed for capital projects or other non-recurring expenditure requirements or high priority needs. This policy is in addition to the 6.0% of General Fund revenue restricted for cash flow emergencies that will remain in force.
VI
Debt Policy. In February 2007, the City Council adopted debt affordability policies that limit the overall net debt to 3.5% of assessed value of taxable real property and $3,000 per capita. On May 10, 2015, to further limit the amount of revenues that are consumed by fixed debt service costs, the City Council approved a resolution amending the debt policy to include limiting the City’s tax-supported debt service to 10.0% of budgeted general governmental revenues, effective July 1, 2015. Internal Controls. City management is responsible for establishing and maintaining an internal control structure designed to ensure that the assets of the City are protected from loss, theft, or misuse and to ensure that adequate accounting data is compiled to allow for the preparation of financial statements in conformity with accounting principles generally accepted in the United States of America. Because the cost of internal controls should not outweigh their benefits, the City’s comprehensive framework of internal controls has been designed to provide reasonable rather than absolute assurance that the financial statements will be free from material misstatement. Budgetary Controls. Budgetary controls are maintained to ensure compliance with legal provisions embodied in the annual appropriated budget approved by the City Council. Activities of the General Fund, certain Special Revenue Funds, Debt Service Fund, Enterprise Funds, Chesapeake Mosquito Control Commission – Component Unit and Public Schools – Component Unit are included in the annual appropriated budget. Project-length financial plans are adopted for the Capital Projects Funds, including the Public Schools – Component Unit Construction Fund, Grants Fund, Community Development Fund and certain other Special Revenue Funds. The legal level of budgetary control (level at which expenditures cannot exceed the appropriated amount) takes place at the fund level. The City Council may authorize supplemental appropriations based on the availability of financial resources. Any revisions that alter total appropriations must be approved by the City Council. The City also maintains an encumbrance accounting system as one technique of accomplishing budgetary control. Although encumbered amounts lapse at year-end, the outstanding encumbrances are reviewed and are generally re-appropriated as part of the following year's budget provided there is availability of funding at year-end. The City Council approves transfers of $250,000 or greater and transfers between funds. The City Manager has been delegated authority to approve transfers less than $250,000 with the exception of transfers between the capital and operating budgets and between capital projects. Other Information Single Audit. As a recipient of federal and state financial assistance, the City is also responsible for establishing and maintaining an adequate internal control structure to ensure and document compliance with applicable laws and regulations related to those programs. The internal control structure is subject to periodic evaluation by management and the City Auditor. As part of the City’s Single Audit, tests are performed to determine the adequacy of internal controls and of its compliance with applicable laws and regulations, including that portion related to federal awards. The testing of major federal award programs for the fiscal year ended June 30, 2017 disclosed no internal control material weaknesses or material violations of applicable laws and regulations. Independent Audit. The City's Charter, SEC 11.06, Annual Audit, requires an audit by independent certified public accountants. The accounting firm of Cherry Bekaert LLP was selected by the City's Audit Selection Committee and approved by the City Council. In addition to meeting the requirements set forth in the City's Charter, the audit is also designed to meet the requirements of the Single Audit Act Amendment of 1996, OMB Circular A-133 Audits of States, Local Governments, and Non-Profit Organizations and Title 2 U.S. Code of Federal Regulations (“CFR”) Part 200, Uniform Administrative Requirements, Cost Principles, and Audit Requirements for Federal Awards (“Uniform Guidance” or “UG”). The Report of Independent Auditor on the Basic Financial Statements is included in the Financial Section of this report. The Reports of Independent Auditor on internal controls and compliance can be found in the Compliance Section of this report. Awards. The Government Finance Officers Association of the United States and Canada (GFOA) awarded a Certificate of Achievement for Excellence in Financial Reporting to the City for its Comprehensive Annual Financial Report for the fiscal year ended June 30, 2016. This was the thirty-fifth consecutive year that the City has received this prestigious award. In order to be awarded a Certificate of Achievement, the City published an easily readable and efficiently organized comprehensive annual financial report. This report satisfied both generally accepted accounting principles and applicable legal requirements. The GFOA also presented the
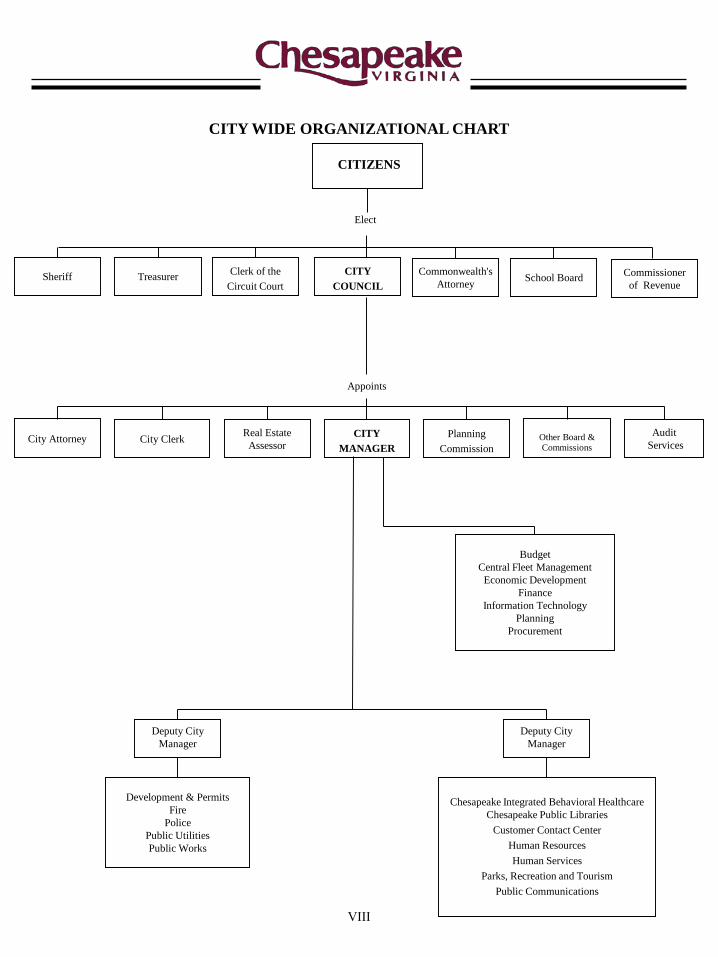
Budget
Central Fleet Management
Economic Development
Finance
Information Technology
Planning
Procurement
Appoints
Elect
Sheriff TreasurerClerk of the
Circuit Court
CITY
COUNCIL
Commonwealth's
AttorneySchool Board
Commissioner
of Revenue
CITIZENS
Development & Permits
Fire
Police
Public Utilities
Public Works
Deputy City
Manager
Chesapeake Integrated Behavioral Healthcare
Chesapeake Public Libraries
Customer Contact Center
Human Resources
Human Services
Parks, Recreation and Tourism
Public Communications
City Attorney City ClerkReal Estate
AssessorCITY
MANAGER
Planning
CommissionOther Board &Commissions
Audit
Services
CITY WIDE ORGANIZATIONAL CHART
Deputy City
Manager
VIII
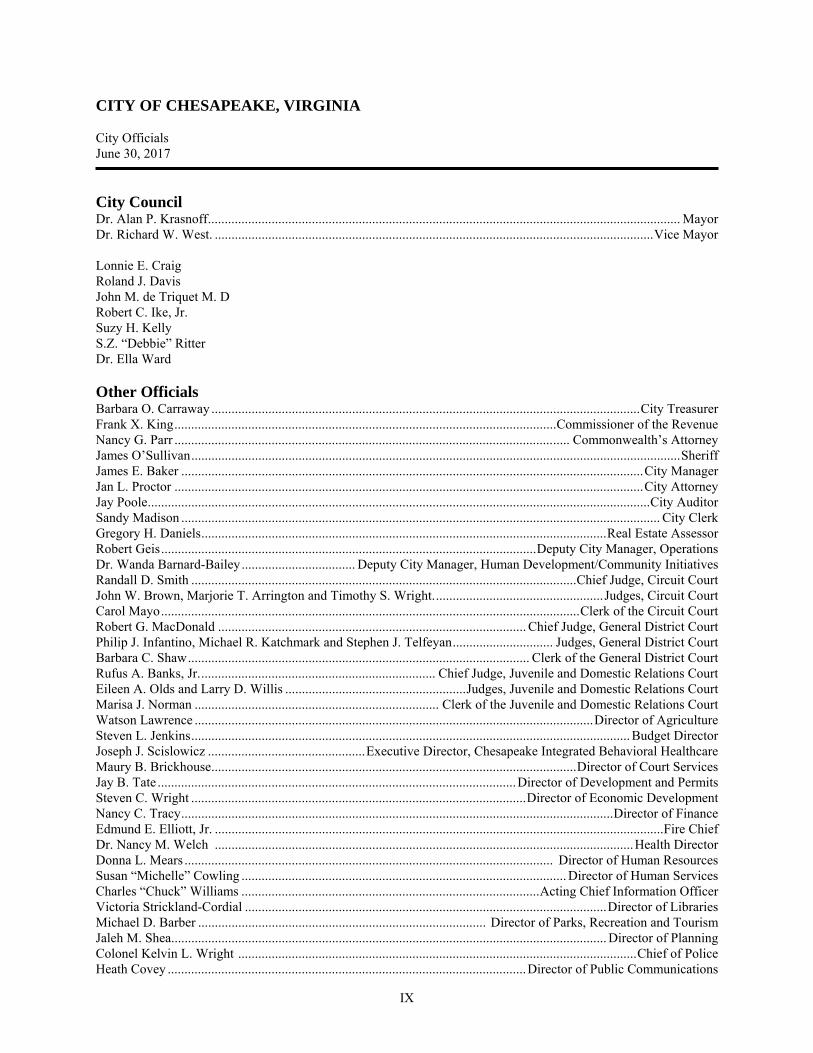
CITY OF CHESAPEAKE, VIRGINIA City Officials June 30, 2017
IX
City Council Dr. Alan P. Krasnoff ............................................................................................................................................. Mayor Dr. Richard W. West. ................................................................................................................................... Vice Mayor Lonnie E. Craig Roland J. Davis John M. de Triquet M. D Robert C. Ike, Jr. Suzy H. Kelly S.Z. “Debbie” Ritter Dr. Ella Ward Other Officials Barbara O. Carraway ................................................................................................................................ City Treasurer Frank X. King .................................................................................................................. Commissioner of the Revenue Nancy G. Parr ...................................................................................................................... Commonwealth’s Attorney James O’Sullivan .................................................................................................................................................. Sheriff James E. Baker .......................................................................................................................................... City Manager Jan L. Proctor ............................................................................................................................................ City Attorney Jay Poole ...................................................................................................................................................... City Auditor Sandy Madison ............................................................................................................................................... City Clerk Gregory H. Daniels ......................................................................................................................... Real Estate Assessor Robert Geis ................................................................................................................ Deputy City Manager, Operations Dr. Wanda Barnard-Bailey .................................. Deputy City Manager, Human Development/Community Initiatives Randall D. Smith ................................................................................................................... Chief Judge, Circuit Court John W. Brown, Marjorie T. Arrington and Timothy S. Wright. .................................................. Judges, Circuit Court Carol Mayo ............................................................................................................................. Clerk of the Circuit Court Robert G. MacDonald ............................................................................................ Chief Judge, General District Court Philip J. Infantino, Michael R. Katchmark and Stephen J. Telfeyan .............................. Judges, General District Court Barbara C. Shaw ...................................................................................................... Clerk of the General District Court Rufus A. Banks, Jr. ...................................................................... Chief Judge, Juvenile and Domestic Relations Court Eileen A. Olds and Larry D. Willis ...................................................... Judges, Juvenile and Domestic Relations Court Marisa J. Norman ......................................................................... Clerk of the Juvenile and Domestic Relations Court Watson Lawrence ....................................................................................................................... Director of Agriculture Steven L. Jenkins ................................................................................................................................... Budget Director Joseph J. Scislowicz ............................................... Executive Director, Chesapeake Integrated Behavioral Healthcare Maury B. Brickhouse ............................................................................................................. Director of Court Services Jay B. Tate ........................................................................................................... Director of Development and Permits Steven C. Wright .................................................................................................... Director of Economic Development Nancy C. Tracy ................................................................................................................................. Director of Finance Edmund E. Elliott, Jr. ...................................................................................................................................... Fire Chief Dr. Nancy M. Welch ............................................................................................................................. Health Director Donna L. Mears .............................................................................................................. Director of Human Resources Susan “Michelle” Cowling ................................................................................................. Director of Human Services Charles “Chuck” Williams ......................................................................................... Acting Chief Information Officer Victoria Strickland-Cordial ............................................................................................................ Director of Libraries Michael D. Barber ...................................................................................... Director of Parks, Recreation and Tourism Jaleh M. Shea.................................................................................................................................. Director of Planning Colonel Kelvin L. Wright ....................................................................................................................... Chief of Police Heath Covey ........................................................................................................... Director of Public Communications
CITY OF CHESAPEAKE, VIRGINIA City Officials June 30, 2017
X
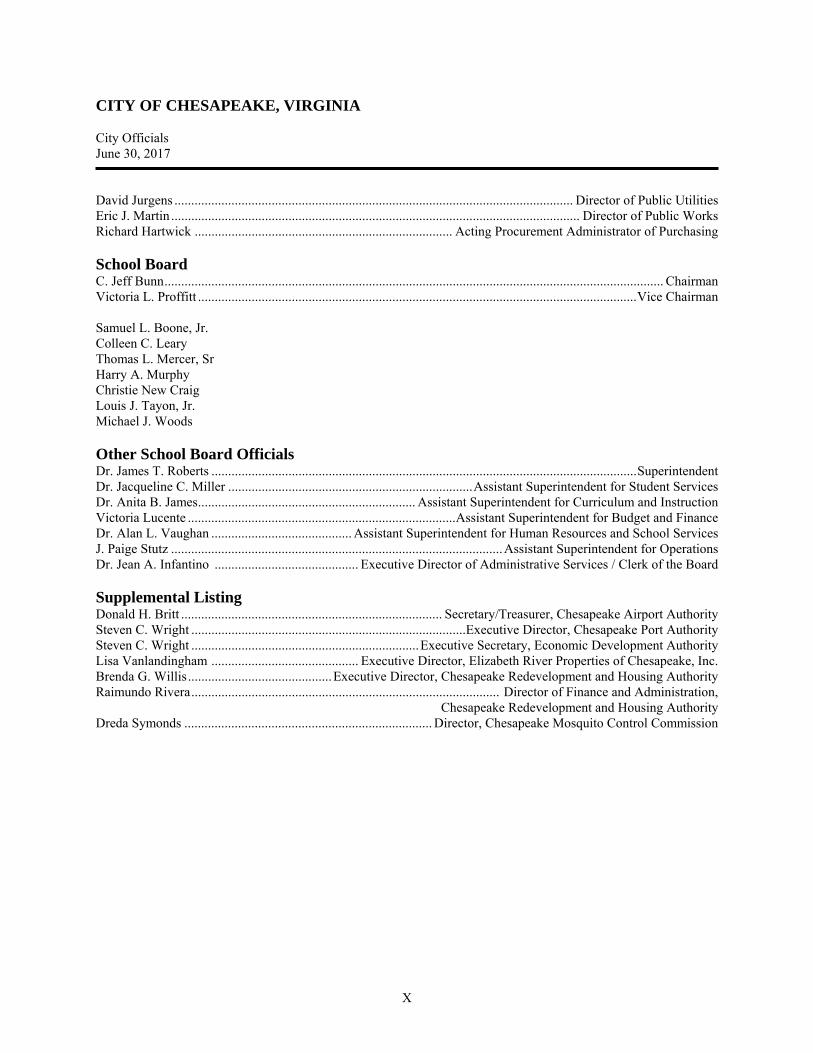
David Jurgens ....................................................................................................................... Director of Public Utilities Eric J. Martin .......................................................................................................................... Director of Public Works Richard Hartwick ............................................................................. Acting Procurement Administrator of Purchasing School Board C. Jeff Bunn ..................................................................................................................................................... Chairman Victoria L. Proffitt ................................................................................................................................... Vice Chairman Samuel L. Boone, Jr. Colleen C. Leary Thomas L. Mercer, Sr Harry A. Murphy Christie New Craig Louis J. Tayon, Jr. Michael J. Woods Other School Board Officials Dr. James T. Roberts ............................................................................................................................... Superintendent Dr. Jacqueline C. Miller ......................................................................... Assistant Superintendent for Student Services Dr. Anita B. James ................................................................. Assistant Superintendent for Curriculum and Instruction Victoria Lucente ................................................................................ Assistant Superintendent for Budget and Finance Dr. Alan L. Vaughan .......................................... Assistant Superintendent for Human Resources and School Services J. Paige Stutz ................................................................................................... Assistant Superintendent for Operations Dr. Jean A. Infantino ........................................... Executive Director of Administrative Services / Clerk of the Board Supplemental Listing Donald H. Britt .............................................................................. Secretary/Treasurer, Chesapeake Airport Authority Steven C. Wright ..................................................................................Executive Director, Chesapeake Port Authority Steven C. Wright .................................................................... Executive Secretary, Economic Development Authority Lisa Vanlandingham ............................................ Executive Director, Elizabeth River Properties of Chesapeake, Inc. Brenda G. Willis ........................................... Executive Director, Chesapeake Redevelopment and Housing Authority Raimundo Rivera ............................................................................................ Director of Finance and Administration,
Chesapeake Redevelopment and Housing Authority Dreda Symonds .......................................................................... Director, Chesapeake Mosquito Control Commission
XI

FINANCIAL SECTION

This page intentionally left blank
Report of Independent Auditor The Honorable Members of the City Council City of Chesapeake, Virginia Report on Financial Statements We have audited the accompanying financial statements of the governmental activities, the business-type activities, the aggregate discretely presented component units, each major fund, and the aggregate remaining fund information of the City of Chesapeake, Virginia, (the “City”), as of and for the year ended June 30, 2017, and the related notes to the financial statements, which collectively comprise the City’s basic financial statements as listed in the table of contents. Management’s Responsibility for the Financial Statements Management is responsible for the preparation and fair presentation of these financial statements in accordance with accounting principles generally accepted in the United States of America; this includes the design, implementation, and maintenance of internal control relevant to the preparation and fair presentation of financial statements that are free from material misstatement, whether due to fraud or error. Auditor’s Responsibility Our responsibility is to express opinions on these financial statements based on our audit. We did not audit the financial statements of the Chesapeake Airport Authority and the Elizabeth River Properties of Chesapeake, Inc., which represent 3.21%, 2.78%, and 0.64%, respectively, of the assets, net position, and revenues of the aggregate discretely presented component units. Those financial statements were audited by other auditors whose reports thereon have been furnished to us, and our opinion, insofar as it relates to the amounts included for the Chesapeake Airport Authority and the Elizabeth River Properties of Chesapeake, Inc. are based solely on the reports of the other auditors. We conducted our audit in accordance with auditing standards generally accepted in the United States of America, the standards applicable to financial audits contained in Government Auditing Standards, issued by the Comptroller General of the United States, and the Specifications for Audits of Counties, Cities, and Towns, issued by the Auditor of Public Accounts of the Commonwealth of Virginia. The financial statements of the Elizabeth River Properties of Chesapeake, Inc., were not audited in accordance with Government Auditing Standards. Those standards and specifications require that we plan and perform the audit to obtain reasonable assurance about whether the financial statements are free of material misstatement. An audit involves performing procedures to obtain audit evidence about the amounts and disclosures in the financial statements. The procedures selected depend on the auditor’s judgment, including the assessment of the risks of material misstatement of the financial statements, whether due to fraud or error. In making those risk assessments, the auditor considers internal control relevant to the entity’s preparation and fair presentation of the financial statements in order to design audit procedures that are appropriate in the circumstances, but not for the purpose of expressing an opinion on the effectiveness of the entity’s internal control. Accordingly, we express no such opinion. An audit also includes evaluating the appropriateness of accounting policies used and the reasonableness of significant accounting estimates made by management, as well as evaluating the overall presentation of the financial statements. We believe that the audit evidence we have obtained is sufficient and appropriate to provide a basis for our audit opinions.
1
Opinions In our opinion, based on our audit and the reports of other auditors, the financial statements referred to above present fairly, in all material respects, the respective financial position of the governmental activities, the business-type activities, the aggregate discretely presented component units, each major fund, and the aggregate remaining fund information of the City, as of June 30, 2017, and the respective changes in financial position, and, where applicable, cash flows thereof for the year then ended in conformity with accounting principles generally accepted in the United States of America. Other Matters Required Supplementary Information Accounting principles generally accepted in the United States of America require that the Management’s Discussion and Analysis (“MD&A”) and required supplementary information other than MD&A, as listed on the table of contents, be presented to supplement the basic financial statements. Such information, although not a part of the basic financial statements, is required by the Governmental Accounting Standards Board who considers it to be an essential part of financial reporting for placing the basic financial statements in an appropriate operational, economic, or historical context. We have applied certain limited procedures to the required supplementary information in accordance with auditing standards generally accepted in the United States of America, which consisted of inquiries of management about the methods of preparing the information and comparing the information for consistency with management’s responses to our inquiries, the basic financial statements, and other knowledge we obtained during our audit of the basic financial statements. We do not express an opinion or provide any assurance on the information because the limited procedures do not provide us with sufficient evidence to express an opinion or provide any assurance. Other Information Our audit was conducted for the purpose of forming opinions on the financial statements that collectively comprise the City’s basic financial statements. The introductory section, other supplementary information, and statistical section, as listed on the table of contents, are presented for purposes of additional analysis and are not a required part of the basic financial statements. The accompanying schedule of expenditures of federal awards is presented for the purpose of additional analysis as required by Title 2 U.S. Code of Federal Regulations Part 200, Uniform Administrative Requirements, Cost Principles, and Audit Requirements for Federal Awards, and is also not a required part of the basic financial statements. The other supplementary information and schedule of expenditures of federal awards are the responsibility of management and were derived from and relate directly to the underlying accounting and other records used to prepare the basic financial statements. Such information has been subjected to the auditing procedures applied in the audit of the basic financial statements and certain additional procedures, including comparing and reconciling such information directly to the underlying accounting and other records used to prepare the basic financial statements or to the basic financial statements themselves, and other additional procedures in accordance with auditing standards generally accepted in the United States of America. In our opinion, this information is fairly stated in all material respects in relation to the basic financial statements as a whole. The introductory and statistical sections have not been subjected to the auditing procedures applied in the audit of the basic financial statements and, accordingly, we express no opinion or provide any assurance on them.
2
Other Reporting Required by Government Auditing Standards In accordance with Government Auditing Standards, we have also issued our report dated November 28, 2017, on our consideration of the City’s internal control over financial reporting and on our tests of its compliance with certain provisions of laws, regulations, contracts, and grant agreements and other matters. The purpose of that report is to describe the scope of our testing of internal control over financial reporting and compliance and the results of that testing, and not to provide an opinion on the internal control over financial reporting or on compliance. That report is an integral part of an audit performed in accordance with Government Auditing Standards in considering the City’s internal control over financial reporting and compliance.
Virginia Beach, Virginia November 28, 2017
3

This page intentionally left blank
Management’s Discussion and Analysis - (MD&A)
This page intentionally left blank
CITY OF CHESAPEAKE, VIRGINIA Management’s Discussion and Analysis Year Ended June 30, 2017
The discussion and analysis of the financial performance of the City of Chesapeake (the City) provides an overall review of the City’s financial activities for the fiscal year ended June 30, 2017. The intent of this discussion and analysis is to look at the City’s financial performance as a whole; readers should also review the basic financial statements to enhance their understanding of the City’s financial performance.
FINANCIAL HIGHLIGHTS FOR FISCAL YEAR 2017
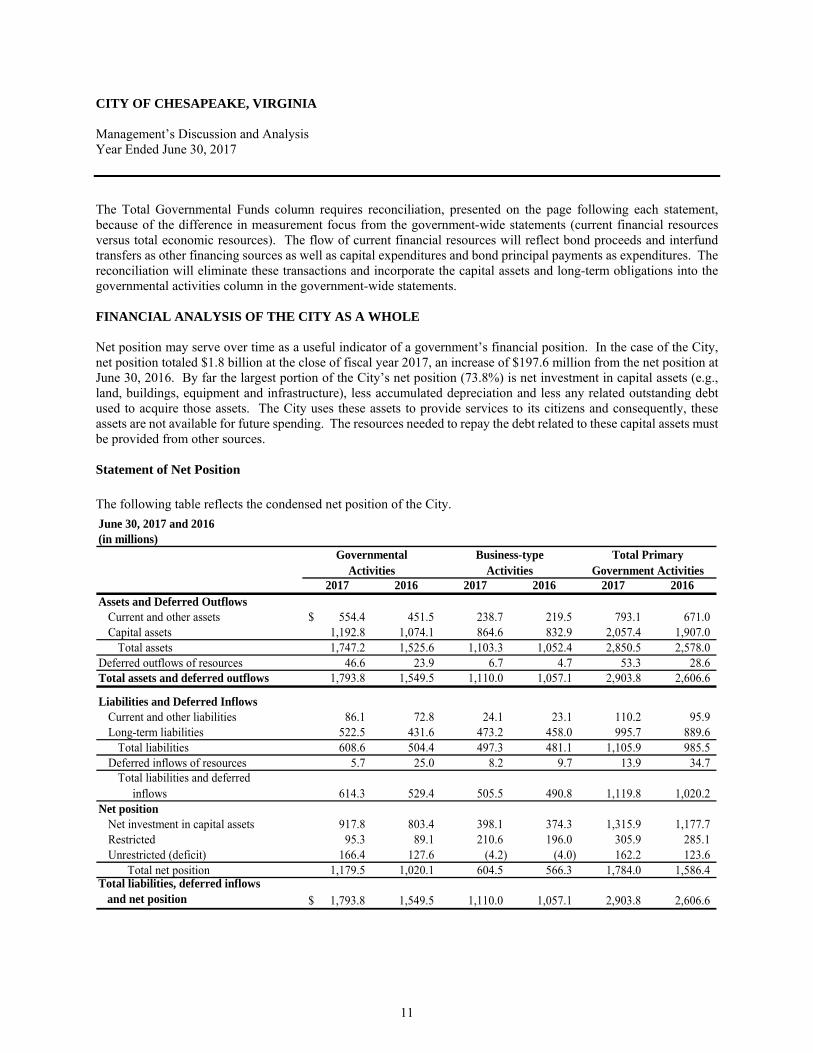
For the fiscal year ended June 30, 2017, the total net position of the City on a government-wide basis, excluding component units, was $1.8 billion. Of this amount, $162.2 million was unrestricted.
The City’s total net position increased by $197.6 million from the prior year. The governmental activities’ net position increased by $159.4 million and business-type net position increased by $38.2 million.
At the close of the current fiscal year, the City’s governmental funds reported combined ending fund balances of $439.3 million, an increase of $93.6 million from the prior year. Approximately $350.5 million or 79.8% of this amount was unrestricted (committed, assigned or unassigned).
The General Fund, on a current financial resources basis, reported a net increase in fund balance of $19.0 million. The original budget projected a deficit of $10.2 million. The final amended budget resulted in a revised deficit projection of $21.4 million. A combination of strong revenue performance of $8.0 million or 1.5% greater than the amended budget and expenditures, exclusive of payments to Chesapeake Public Schools (CPS), of $23.9 million or 8.1% lower than the amended budget resulted in the increase in fund balance. The expenditure performance resulted from management focus on operational efficiency and cost containment efforts coupled with recruitment challenges for some job classes.
At the end of the current fiscal year, the unassigned fund balance of the General Fund was $67.6 million or 14.4% of total General Fund expenditures (including payments to CPS).
The total fund balance of the General Fund of $206.7 million increased $19.0 million from the prior year. Fund balance composition at year end was 0.6% nonspendable, 18.6% restricted, 45.5% committed, 2.6% assigned and 32.7% unassigned.
The City’s total bonded debt increased by $60.4 million from fiscal year 2016 (approximately 9.5%).
As part of the City’s ongoing initiative to improve accuracy and develop efficiencies, the City converted the semi-monthly payroll processing cycle from paying current to paying nine days in arrears during fiscal year 2017. The weekly payroll for the City continues to be paid five days in arrears. Paying in arrears is a recognized payroll best practice. The implementation plan included an estimated amount in the original budget of $4.0 million to cover a one-time pay advance to employees for the nine days arrears to facilitate a smooth transition. The pay advance is repaid through employee service.
7
CITY OF CHESAPEAKE, VIRGINIA Management’s Discussion and Analysis Year Ended June 30, 2017
OVERVIEW OF THE FINANCIAL STATEMENTS This discussion and analysis is intended to serve as an introduction to the City’s basic financial statements. The City’s basic financial statements comprise three components: government-wide financial statements, fund financial statements and notes to basic financial statements. This report also contains other supplementary information in addition to the basic financial statements themselves. The basic financial statements include statements that present different views of the City:
The first two statements presented are government-wide financial statements that provide both long-term and short-term information about the City’s overall financial status.
The next statements are fund financial statements that focus on individual parts of the City’s government, reporting the City’s operations in more detail than the government-wide statements. - The governmental fund statements tell how general government services such as public safety are
financed in the short-term as well as what amounts remain for future spending. - The proprietary fund statements offer short- and long-term financial information about the activities the
government operates like businesses, such as the public utilities (water and sewer) system. Also presented are internal services funds which are primarily supported through charges to other funds in order to allocate the cost of services provided.
- The fiduciary fund statements provide information about the financial relationships in which the City acts solely as a trustee or agent for the benefit of others to whom the resources in question belong. The City’s fiduciary funds consist of an Agency Fund (Special Welfare) and an Other Postemployment Benefit (OPEB) Trust Fund. Fiduciary funds are not reflected in the government-wide financial statements because the resources of those funds are not available to support the City’s operations.
The remaining statements are other discretely presented component units’ financial statements that provide financial information about the Chesapeake Public Schools and the City’s other discretely presented component units, which are aggregated on the government-wide financial statements.
The financial statements also include Notes to Basic Financial Statements that explain some of the information in the financial statements and provide more detailed data. The statements are followed by a section titled Required Supplementary Information that further explains and supports the information in the financial statements. The following graphic shows how the required parts of this Management’s Discussion and Analysis and the City’s basic financial statements are arranged and relate to one another.
8
CITY OF CHESAPEAKE, VIRGINIA Management’s Discussion and Analysis Year Ended June 30, 2017
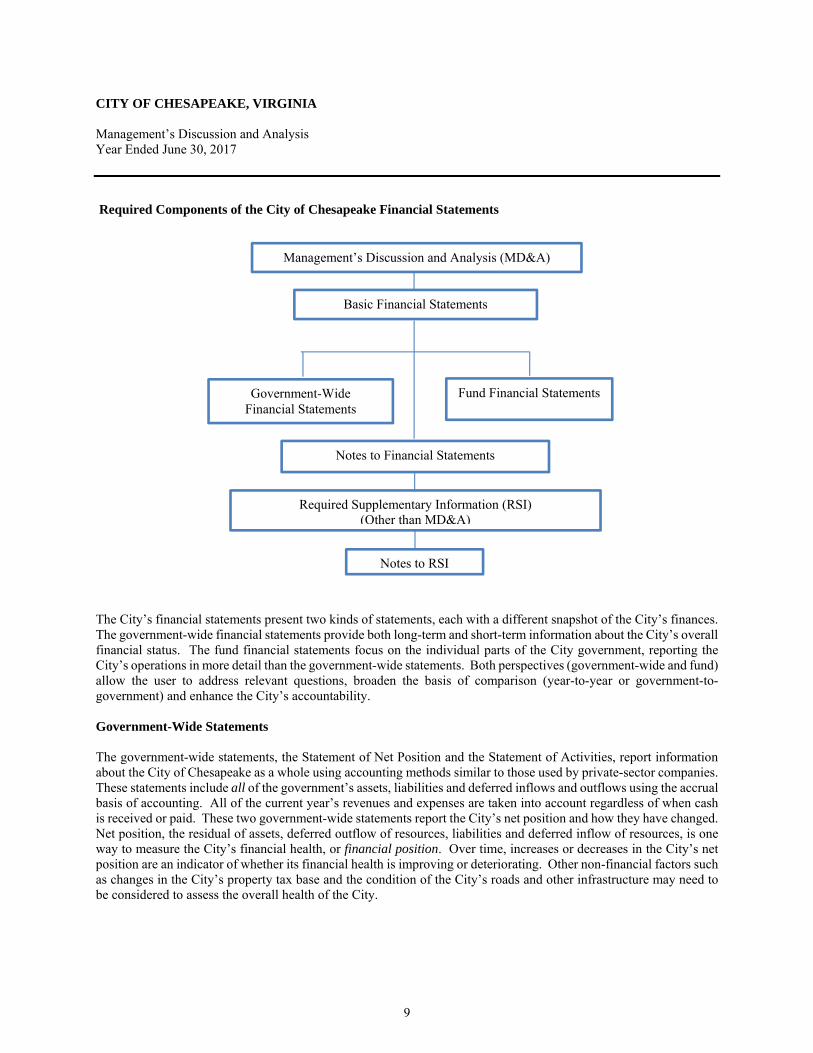
Required Components of the City of Chesapeake Financial Statements
The City’s financial statements present two kinds of statements, each with a different snapshot of the City’s finances. The government-wide financial statements provide both long-term and short-term information about the City’s overall financial status. The fund financial statements focus on the individual parts of the City government, reporting the City’s operations in more detail than the government-wide statements. Both perspectives (government-wide and fund) allow the user to address relevant questions, broaden the basis of comparison (year-to-year or government-to-government) and enhance the City’s accountability. Government-Wide Statements The government-wide statements, the Statement of Net Position and the Statement of Activities, report information about the City of Chesapeake as a whole using accounting methods similar to those used by private-sector companies. These statements include all of the government’s assets, liabilities and deferred inflows and outflows using the accrual basis of accounting. All of the current year’s revenues and expenses are taken into account regardless of when cash is received or paid. These two government-wide statements report the City’s net position and how they have changed. Net position, the residual of assets, deferred outflow of resources, liabilities and deferred inflow of resources, is one way to measure the City’s financial health, or financial position. Over time, increases or decreases in the City’s net position are an indicator of whether its financial health is improving or deteriorating. Other non-financial factors such as changes in the City’s property tax base and the condition of the City’s roads and other infrastructure may need to be considered to assess the overall health of the City.
Basic Financial Statements
Government-Wide Financial Statements
Fund Financial Statements
Notes to Financial Statements
Required Supplementary Information (RSI) (Other than MD&A)
Management’s Discussion and Analysis (MD&A)
Notes to RSI
9
CITY OF CHESAPEAKE, VIRGINIA Management’s Discussion and Analysis Year Ended June 30, 2017
In the Statement of Net Position and the Statement of Activities, the City is divided into three categories:
Governmental activities – Most of the City’s basic services are included here, such as the police, fire, public works, public welfare, parks and recreation activities and general administration. Property taxes, other taxes and state and federal grants finance most of these activities.
Business-type activities – The City charges fees to customers to help it cover the costs of certain services it provides. The City’s water and sewer system, Chesapeake Transportation System and stormwater system are included in this category.
Component units – The City includes six discretely presented component units, separate legal entities, in its report – the Chesapeake Public Schools, the Chesapeake Mosquito Control Commission, the Economic Development Authority of the City of Chesapeake, the Chesapeake Port Authority, the Chesapeake Airport Authority and Elizabeth River Properties of Chesapeake, Inc. Although legally separate, these component units are important because the City is financially accountable for them and provides operating funding.
Fund Financial Statements The fund financial statements provide more detailed information about the City’s most significant funds – not the City as a whole. Funds are accounting mechanisms that the City uses to keep track of specific sources of funding and spending for particular purposes. Some funds are required by State law and or by bond covenants; City Council establishes other funds to control and manage money for particular purposes or to show that it is properly using certain taxes and grants. The City has three kinds of funds:
Governmental funds – Most of the City’s basic services are included in governmental funds, which focus on (1) how cash and other financial assets that can readily be converted to cash flow in and out and (2) the balances remaining at year-end that are available for spending. Consequently, the governmental fund statements provide a detailed short-term view that helps the reader determine whether there are more or fewer financial resources that can be spent in the near future to finance the City’s programs. Because this information does not encompass the additional long-term focus of the government-wide statements, additional information is provided on a subsequent page that explains the relationship (or differences) between the government-wide and fund statements. The City includes in its governmental fund statements a blended component unit, CSB of Chesapeake, Inc., because it provides services entirely for the benefit of the City.
Proprietary funds – The City’s proprietary funds consist of enterprise funds and internal service funds. Proprietary funds, like the government-wide statements, provide both short and long-term financial information. Enterprise funds are used to account for operations that are financed and operated in a manner similar to private sector entities in which costs are recovered mainly through user fees. The City’s internal service funds are the same as its business-type activities, with the exception of the allocation of the funds’ gains or losses. The internal service funds are used to report activities that provide supplies and services for the City’s other programs and activities – such as the City Garage Fund and the Information Technology Fund.
Fiduciary funds – The City is the trustee, or fiduciary, for certain donated funds. It is also responsible for other assets that, because of a trust arrangement, can be used only for the trust beneficiaries. The City is responsible for ensuring that the assets reported in these funds are used for their intended purposes. These activities are reported in a separate Statement of Fiduciary Net Position. The City excludes these activities from its government-wide financial statements because the City cannot use these assets to finance its operations. The City includes in its fiduciary fund statements the City of Chesapeake Other Postemployment Benefits Trust Fund (OPEB Trust Fund).
10
CITY OF CHESAPEAKE, VIRGINIA Management’s Discussion and Analysis Year Ended June 30, 2017
The Total Governmental Funds column requires reconciliation, presented on the page following each statement, because of the difference in measurement focus from the government-wide statements (current financial resources versus total economic resources). The flow of current financial resources will reflect bond proceeds and interfund transfers as other financing sources as well as capital expenditures and bond principal payments as expenditures. The reconciliation will eliminate these transactions and incorporate the capital assets and long-term obligations into the governmental activities column in the government-wide statements. FINANCIAL ANALYSIS OF THE CITY AS A WHOLE Net position may serve over time as a useful indicator of a government’s financial position. In the case of the City, net position totaled $1.8 billion at the close of fiscal year 2017, an increase of $197.6 million from the net position at June 30, 2016. By far the largest portion of the City’s net position (73.8%) is net investment in capital assets (e.g., land, buildings, equipment and infrastructure), less accumulated depreciation and less any related outstanding debt used to acquire those assets. The City uses these assets to provide services to its citizens and consequently, these assets are not available for future spending. The resources needed to repay the debt related to these capital assets must be provided from other sources. Statement of Net Position The following table reflects the condensed net position of the City. June 30, 2017 and 2016(in millions)
2017 2016 2017 2016 2017 2016Assets and Deferred Outflows
Current and other assets 554.4$ 451.5 238.7 219.5 793.1 671.0 Capital assets 1,192.8 1,074.1 864.6 832.9 2,057.4 1,907.0
Total assets 1,747.2 1,525.6 1,103.3 1,052.4 2,850.5 2,578.0 Deferred outflows of resources 46.6 23.9 6.7 4.7 53.3 28.6 Total assets and deferred outflows 1,793.8 1,549.5 1,110.0 1,057.1 2,903.8 2,606.6
Liabilities and Deferred InflowsCurrent and other liabilities 86.1 72.8 24.1 23.1 110.2 95.9 Long-term liabilities 522.5 431.6 473.2 458.0 995.7 889.6
Total liabilities 608.6 504.4 497.3 481.1 1,105.9 985.5 Deferred inflows of resources 5.7 25.0 8.2 9.7 13.9 34.7
Total liabilities and deferred inflows 614.3 529.4 505.5 490.8 1,119.8 1,020.2
Net positionNet investment in capital assets 917.8 803.4 398.1 374.3 1,315.9 1,177.7 Restricted 95.3 89.1 210.6 196.0 305.9 285.1 Unrestricted (deficit) 166.4 127.6 (4.2) (4.0) 162.2 123.6
Total net position 1,179.5 1,020.1 604.5 566.3 1,784.0 1,586.4 Total liabilities, deferred inflows and net position 1,793.8$ 1,549.5 1,110.0 1,057.1 2,903.8 2,606.6
Governmental Business-type Total PrimaryActivities Activities Government Activities
11
CITY OF CHESAPEAKE, VIRGINIA Management’s Discussion and Analysis Year Ended June 30, 2017
Approximately 17.1% of the City’s net position is subject to external restrictions. The remaining balance of unrestricted net position ($162.2 million or 9.1%) may be used to meet the City’s ongoing obligations to citizens and creditors. At the end of the current fiscal year, the City reported positive balances in all three categories of net position for the Primary Government as a whole. In addition, all categories of net position for its separate governmental and business-type activities are positive balances except for the unrestricted deficit for business-type activities of $12.4 million. Total unrestricted net position increased by $30.4 million or 24.6% from the prior year. Total restricted net position increased $29.0 million or 10.2%, largely due to unspent incremental tax revenues generated in designated commercial areas of the City to fund improvements in those areas and restricted business-type activities. Lastly, net investment in capital assets increased $138.2 million or 11.7%. The City’s total net position increased by $197.6 million or 12.5% during the fiscal year. Governmental Activities The increase in net position from the prior fiscal year was $159.4 million, as shown on the Statement of Activities. This increase is attributable to the excess of revenues over expenses of $161.2 million net of $1.8 million of transfers. Revenues for the City’s governmental activities were $745.7 million, representing an increase of $101.0 million over fiscal year 2016. The net increase was primarily due to a combination of increases of $87.4 million in grants and contributions, $14.0 million in taxes and $0.3 million in charges for services. Total donated land and infrastructure assets, including roads, of $104.7 million were reported in the public works function versus $20.6 million in the prior fiscal year. General revenues increased $13.3 million over the prior year. Real and personal property taxes, the largest source of the City revenues, showed an increase of $12.1 million or 3.9%. This increase is mainly due to an increase in assessments of 3.3% in real estate coupled with other property taxes increasing $1.9 million or 1.5%. Expenses increased by $25.4 million or 4.5%. Major increases are in the following functional areas: $20.2 million in general government, $6.0 million in public works, $2.7 million in public welfare and $2.2 million in public safety. These were offset by decreases in the following functional areas: $5.0 million in parks and recreation and $1.1 million in education. Business-type Activities The increase in net position from the prior fiscal year was $38.2 million. These resources cannot be used to offset any net deficit in governmental activities. The City generally can only use this net position to finance the continuing operations of its enterprise operations, which include Public Utilities, Chesapeake Transportation System and Stormwater Management. Increases in capital assets were mainly attributable to construction in progress, the capitalization of the Dominion Boulevard Veterans Bridge in the Chesapeake Transportation System and $10.6 million of deeded and donated assets from developers reported in the Public Utilities Fund. Total revenues increased $17.1 million or 15.0% for business-type activities primarily due to increases in charges for services and capital grants and contributions.
12
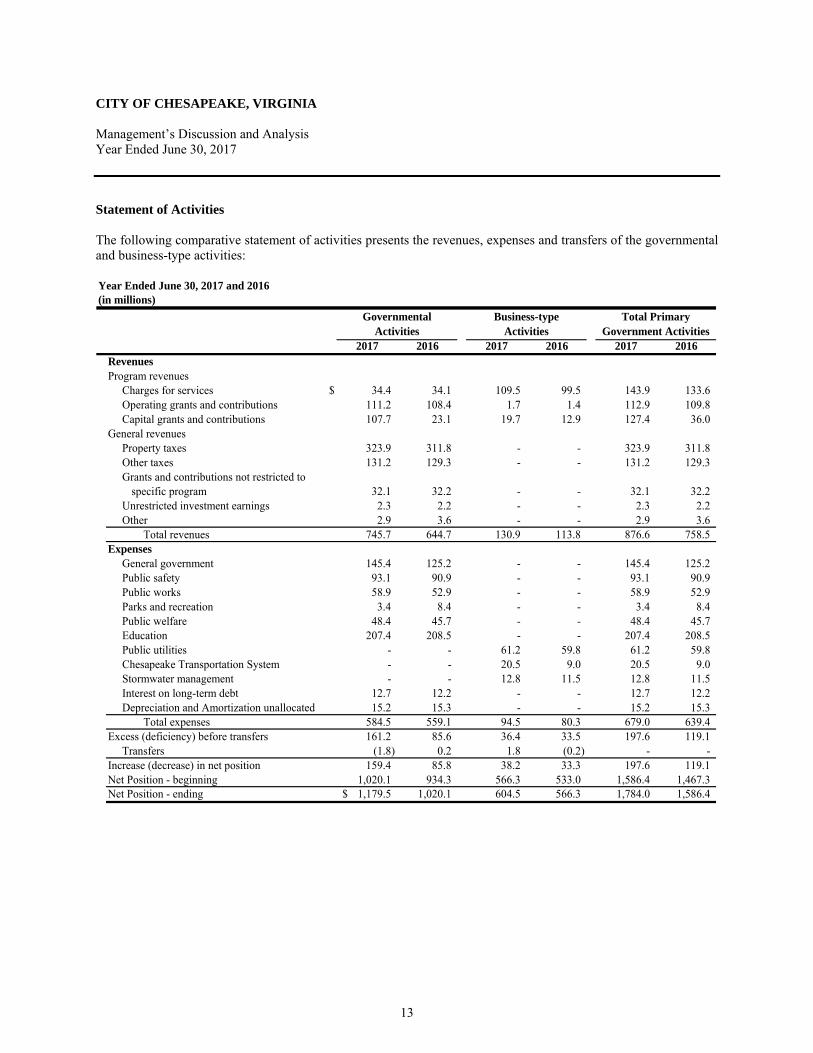
CITY OF CHESAPEAKE, VIRGINIA Management’s Discussion and Analysis Year Ended June 30, 2017
Statement of Activities The following comparative statement of activities presents the revenues, expenses and transfers of the governmental and business-type activities: Year Ended June 30, 2017 and 2016(in millions)
2017 2016 2017 2016 2017 2016RevenuesProgram revenues
Charges for services $ 34.4 34.1 109.5 99.5 143.9 133.6 Operating grants and contributions 111.2 108.4 1.7 1.4 112.9 109.8 Capital grants and contributions 107.7 23.1 19.7 12.9 127.4 36.0
General revenuesProperty taxes 323.9 311.8 - - 323.9 311.8 Other taxes 131.2 129.3 - - 131.2 129.3
32.1 32.2 - - 32.1 32.2 Unrestricted investment earnings 2.3 2.2 - - 2.3 2.2 Other 2.9 3.6 - - 2.9 3.6
Total revenues 745.7 644.7 130.9 113.8 876.6 758.5 Expenses
General government 145.4 125.2 - - 145.4 125.2 Public safety 93.1 90.9 - - 93.1 90.9 Public works 58.9 52.9 - - 58.9 52.9 Parks and recreation 3.4 8.4 - - 3.4 8.4 Public welfare 48.4 45.7 - - 48.4 45.7 Education 207.4 208.5 - - 207.4 208.5 Public utilities - - 61.2 59.8 61.2 59.8 Chesapeake Transportation System - - 20.5 9.0 20.5 9.0 Stormwater management - - 12.8 11.5 12.8 11.5 Interest on long-term debt 12.7 12.2 - - 12.7 12.2 Depreciation and Amortization unallocated 15.2 15.3 - - 15.2 15.3
Total expenses 584.5 559.1 94.5 80.3 679.0 639.4 Excess (deficiency) before transfers 161.2 85.6 36.4 33.5 197.6 119.1
Transfers (1.8) 0.2 1.8 (0.2) - - Increase (decrease) in net position 159.4 85.8 38.2 33.3 197.6 119.1 Net Position - beginning 1,020.1 934.3 566.3 533.0 1,586.4 1,467.3 Net Position - ending 1,179.5$ 1,020.1 604.5 566.3 1,784.0 1,586.4
Grants and contributions not restricted tospecific program
Governmental Activities
Business-type Activities
Total Primary Government Activities
13
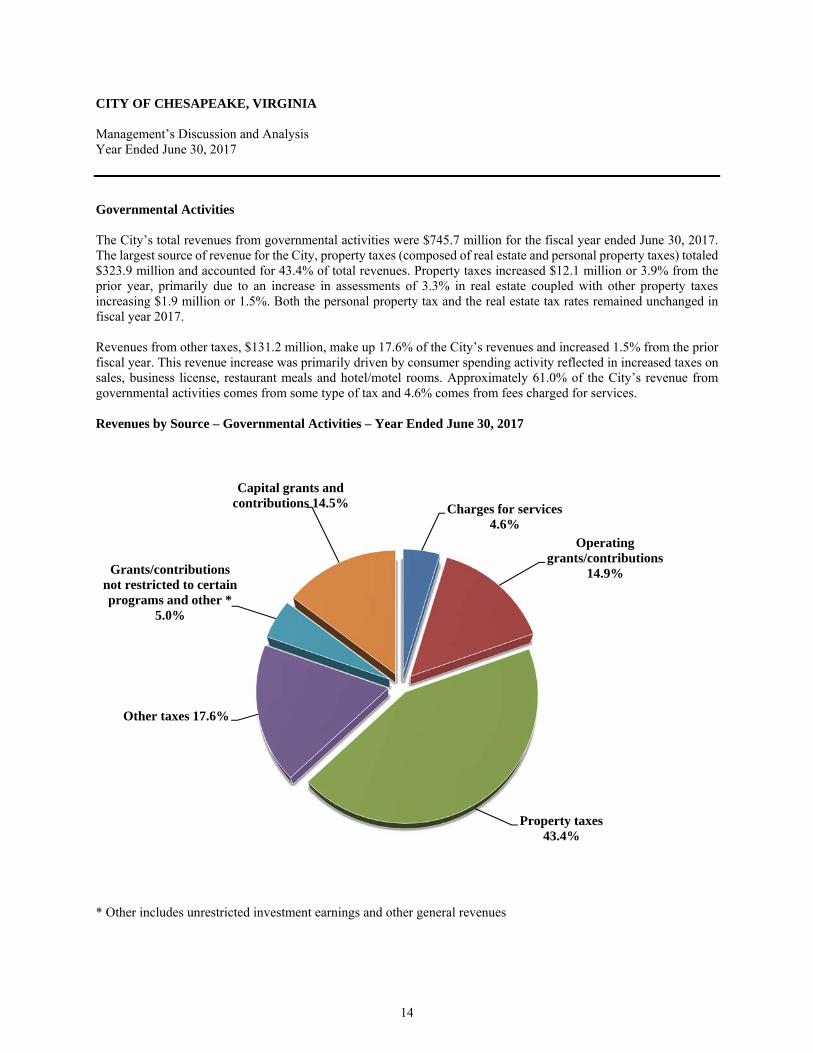
CITY OF CHESAPEAKE, VIRGINIA Management’s Discussion and Analysis Year Ended June 30, 2017
Governmental Activities The City’s total revenues from governmental activities were $745.7 million for the fiscal year ended June 30, 2017. The largest source of revenue for the City, property taxes (composed of real estate and personal property taxes) totaled $323.9 million and accounted for 43.4% of total revenues. Property taxes increased $12.1 million or 3.9% from the prior year, primarily due to an increase in assessments of 3.3% in real estate coupled with other property taxes increasing $1.9 million or 1.5%. Both the personal property tax and the real estate tax rates remained unchanged in fiscal year 2017. Revenues from other taxes, $131.2 million, make up 17.6% of the City’s revenues and increased 1.5% from the prior fiscal year. This revenue increase was primarily driven by consumer spending activity reflected in increased taxes on sales, business license, restaurant meals and hotel/motel rooms. Approximately 61.0% of the City’s revenue from governmental activities comes from some type of tax and 4.6% comes from fees charged for services. Revenues by Source – Governmental Activities – Year Ended June 30, 2017
* Other includes unrestricted investment earnings and other general revenues
Charges for services4.6%
Operating grants/contributions
14.9%
Property taxes43.4%
Other taxes 17.6%
Grants/contributions not restricted to certain programs and other *
5.0%
Capital grants and contributions 14.5%
14
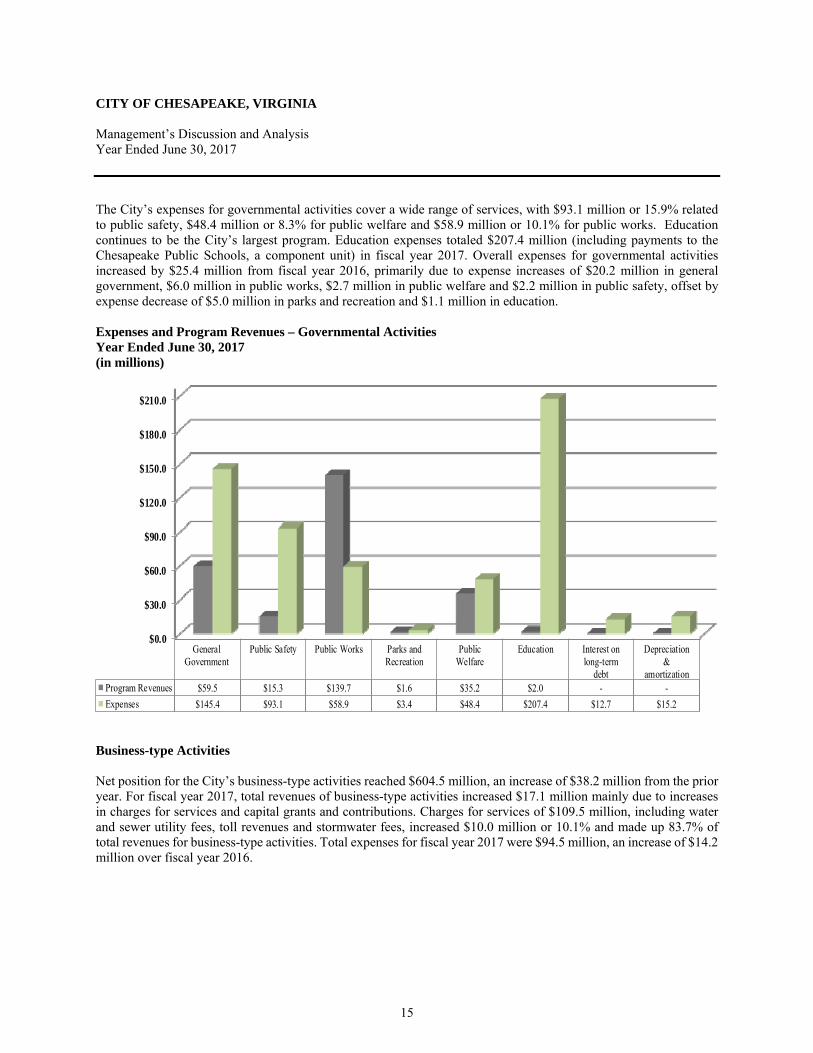
CITY OF CHESAPEAKE, VIRGINIA Management’s Discussion and Analysis Year Ended June 30, 2017
The City’s expenses for governmental activities cover a wide range of services, with $93.1 million or 15.9% related to public safety, $48.4 million or 8.3% for public welfare and $58.9 million or 10.1% for public works. Education continues to be the City’s largest program. Education expenses totaled $207.4 million (including payments to the Chesapeake Public Schools, a component unit) in fiscal year 2017. Overall expenses for governmental activities increased by $25.4 million from fiscal year 2016, primarily due to expense increases of $20.2 million in general government, $6.0 million in public works, $2.7 million in public welfare and $2.2 million in public safety, offset by expense decrease of $5.0 million in parks and recreation and $1.1 million in education. Expenses and Program Revenues – Governmental Activities Year Ended June 30, 2017 (in millions)
$0.0
$30.0
$60.0
$90.0
$120.0
$150.0
$180.0
$210.0
GeneralGovernment
Public Safety Public Works Parks andRecreation
PublicWelfare
Education Interest onlong-term
debt
Depreciation&
amortizationProgram Revenues $59.5 $15.3 $139.7 $1.6 $35.2 $2.0 - -Expenses $145.4 $93.1 $58.9 $3.4 $48.4 $207.4 $12.7 $15.2
Business-type Activities Net position for the City’s business-type activities reached $604.5 million, an increase of $38.2 million from the prior year. For fiscal year 2017, total revenues of business-type activities increased $17.1 million mainly due to increases in charges for services and capital grants and contributions. Charges for services of $109.5 million, including water and sewer utility fees, toll revenues and stormwater fees, increased $10.0 million or 10.1% and made up 83.7% of total revenues for business-type activities. Total expenses for fiscal year 2017 were $94.5 million, an increase of $14.2 million over fiscal year 2016.
15
CITY OF CHESAPEAKE, VIRGINIA Management’s Discussion and Analysis Year Ended June 30, 2017
FINANCIAL ANALYSIS OF THE CITY’S FUNDS The City uses fund accounting to ensure and demonstrate compliance with finance-related legal requirements. Governmental Funds The focus of the City’s governmental funds is to provide information on near-term inflows, outflows and balances of spendable resources. In particular, unassigned fund balance may serve as a useful measure of net resources available at the end of a fiscal year. For the fiscal year ended June 30, 2017, the governmental funds reported combined ending fund balances of $439.3 million, an increase of $93.6 million from the prior year. Included in this increase are the following major transactions in governmental funds for the year ended June 30, 2017:
$199.2 million contributed from the City’s General Fund to finance the Public School operations $85.6 million in proceeds from the issuance of general obligation bonds and premiums to fund capital items $51.6 million spent in the Capital Projects Fund to fund capital items $11.3 million of tax revenues generated by incremental increases in property values within the City’s
Greenbrier and South Norfolk Tax Increment Financing Districts
The City’s Other Postemployment Benefits Trust Fund, established in 2008, committed to fund the fiscal year 2017 current premiums portion of the pay-go, $3.4 million, by recognizing $3.1 million as a payment in lieu of receiving the annual required contribution and recording a payable to the City at June 30, 2017 for the net of the two amounts.
Approximately $350.5 million of the combined total fund balances constitute unrestricted fund balance, which is comprised of funds committed at the discretion of City Council, as well as assigned and unassigned funds. The $166.9 million unrestricted funds in the General Fund represent 35.5% of total General Fund expenditures and provide some measure of the General Fund’s liquidity. Committed and assigned portions of the unrestricted governmental funds balances at June 30, 2017 were as follows:
$56.3 million committed for one time projects $46.7 million committed for current capital projects $21.8 million committed for future capital projects $20.3 million committed for various programs and projects $92.5 million assigned for future capital projects $16.1 million assigned for debt service $29.3 million assigned for various other purposes
The remainder of the unrestricted fund balance at June 30, 2017, the unassigned fund balance, includes $67.6 million in the General Fund, the City’s chief operating fund, and is in compliance with the City’s fund balance policy. The restricted fund balance totals $87.3 million at year end and includes $33.8 million for General Fund cash flow emergencies (6.0% of revenue as required by City Charter). Total fund balance of the General Fund increased by $19.0 million during fiscal year 2017, primarily due to the following increases: $10.6 million or 3.5% in property taxes revenues, $5.0 million or 5.7% in revenues from the Commonwealth of Virginia, $1.8 million or 1.5% in other local taxes and $1.4 million or 12.0% in charges for services. Total expenditures increased by $22.1 million or 4.9% from the prior fiscal year. The major contributing factors are increases in payments to Schools of $12.6 million or 6.7% and expenditure increases of $5.0 million or 4.9% for general government and $4.8 million or 5.6% for public safety.
16
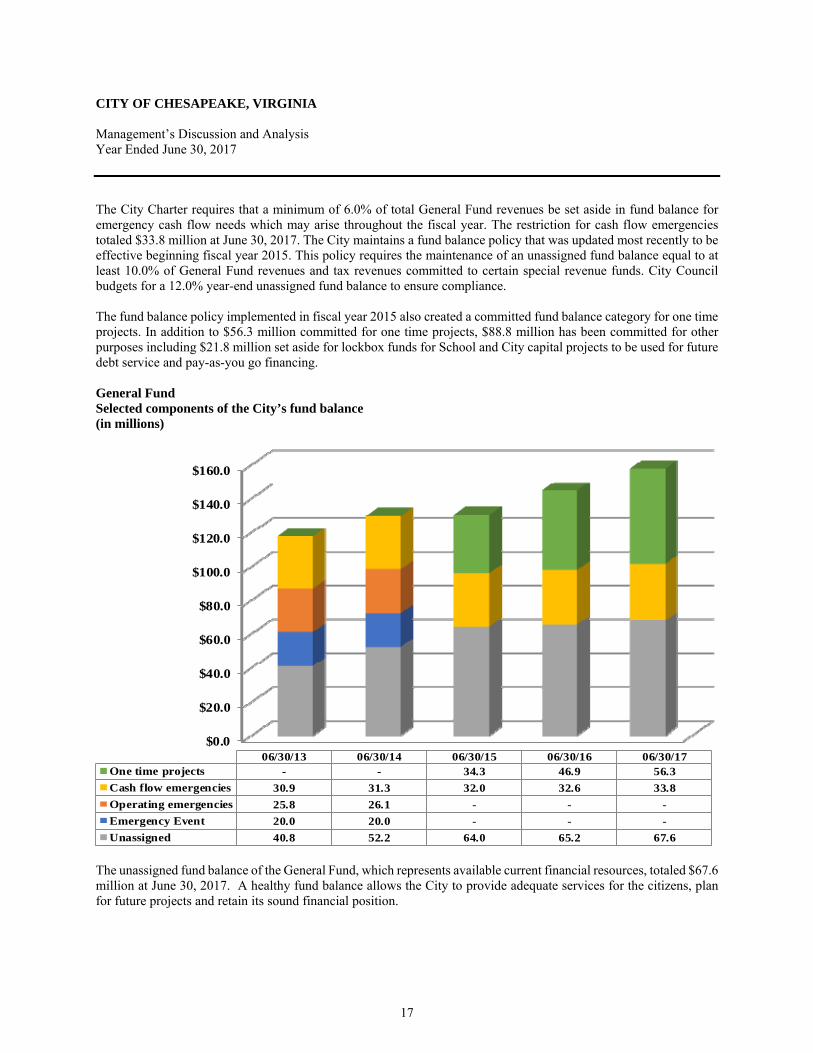
CITY OF CHESAPEAKE, VIRGINIA Management’s Discussion and Analysis Year Ended June 30, 2017
The City Charter requires that a minimum of 6.0% of total General Fund revenues be set aside in fund balance for emergency cash flow needs which may arise throughout the fiscal year. The restriction for cash flow emergencies totaled $33.8 million at June 30, 2017. The City maintains a fund balance policy that was updated most recently to be effective beginning fiscal year 2015. This policy requires the maintenance of an unassigned fund balance equal to at least 10.0% of General Fund revenues and tax revenues committed to certain special revenue funds. City Council budgets for a 12.0% year-end unassigned fund balance to ensure compliance. The fund balance policy implemented in fiscal year 2015 also created a committed fund balance category for one time projects. In addition to $56.3 million committed for one time projects, $88.8 million has been committed for other purposes including $21.8 million set aside for lockbox funds for School and City capital projects to be used for future debt service and pay-as-you go financing. General Fund Selected components of the City’s fund balance (in millions)
$0.0
$20.0
$40.0
$60.0
$80.0
$100.0
$120.0
$140.0
$160.0
06/30/13 06/30/14 06/30/15 06/30/16 06/30/17One time projects - - 34.3 46.9 56.3Cash flow emergencies 30.9 31.3 32.0 32.6 33.8Operating emergencies 25.8 26.1 - - -Emergency Event 20.0 20.0 - - -Unassigned 40.8 52.2 64.0 65.2 67.6
The unassigned fund balance of the General Fund, which represents available current financial resources, totaled $67.6 million at June 30, 2017. A healthy fund balance allows the City to provide adequate services for the citizens, plan for future projects and retain its sound financial position.
17
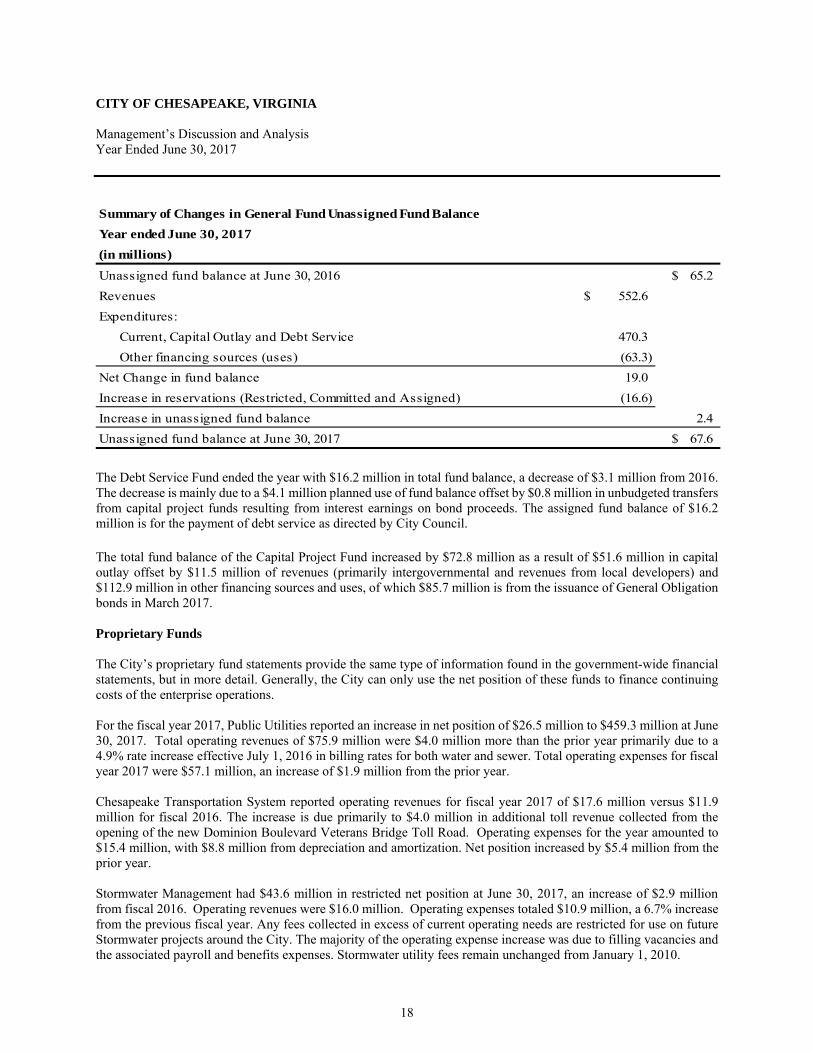
CITY OF CHESAPEAKE, VIRGINIA Management’s Discussion and Analysis Year Ended June 30, 2017
Year ended June 30, 2017
Unassigned fund balance at June 30, 2016 65.2$ Revenues 552.6$ Expenditures:
Current, Capital Outlay and Debt Service 470.3 Other financing sources (uses) (63.3)
Net Change in fund balance 19.0 Increase in reservations (Restricted, Committed and Assigned) (16.6) Increase in unassigned fund balance 2.4 Unassigned fund balance at June 30, 2017 67.6$
Summary of Changes in General Fund Unassigned Fund Balance
(in millions)
The Debt Service Fund ended the year with $16.2 million in total fund balance, a decrease of $3.1 million from 2016. The decrease is mainly due to a $4.1 million planned use of fund balance offset by $0.8 million in unbudgeted transfers from capital project funds resulting from interest earnings on bond proceeds. The assigned fund balance of $16.2 million is for the payment of debt service as directed by City Council. The total fund balance of the Capital Project Fund increased by $72.8 million as a result of $51.6 million in capital outlay offset by $11.5 million of revenues (primarily intergovernmental and revenues from local developers) and $112.9 million in other financing sources and uses, of which $85.7 million is from the issuance of General Obligation bonds in March 2017. Proprietary Funds The City’s proprietary fund statements provide the same type of information found in the government-wide financial statements, but in more detail. Generally, the City can only use the net position of these funds to finance continuing costs of the enterprise operations. For the fiscal year 2017, Public Utilities reported an increase in net position of $26.5 million to $459.3 million at June 30, 2017. Total operating revenues of $75.9 million were $4.0 million more than the prior year primarily due to a 4.9% rate increase effective July 1, 2016 in billing rates for both water and sewer. Total operating expenses for fiscal year 2017 were $57.1 million, an increase of $1.9 million from the prior year. Chesapeake Transportation System reported operating revenues for fiscal year 2017 of $17.6 million versus $11.9 million for fiscal 2016. The increase is due primarily to $4.0 million in additional toll revenue collected from the opening of the new Dominion Boulevard Veterans Bridge Toll Road. Operating expenses for the year amounted to $15.4 million, with $8.8 million from depreciation and amortization. Net position increased by $5.4 million from the prior year. Stormwater Management had $43.6 million in restricted net position at June 30, 2017, an increase of $2.9 million from fiscal 2016. Operating revenues were $16.0 million. Operating expenses totaled $10.9 million, a 6.7% increase from the previous fiscal year. Any fees collected in excess of current operating needs are restricted for use on future Stormwater projects around the City. The majority of the operating expense increase was due to filling vacancies and the associated payroll and benefits expenses. Stormwater utility fees remain unchanged from January 1, 2010.
18
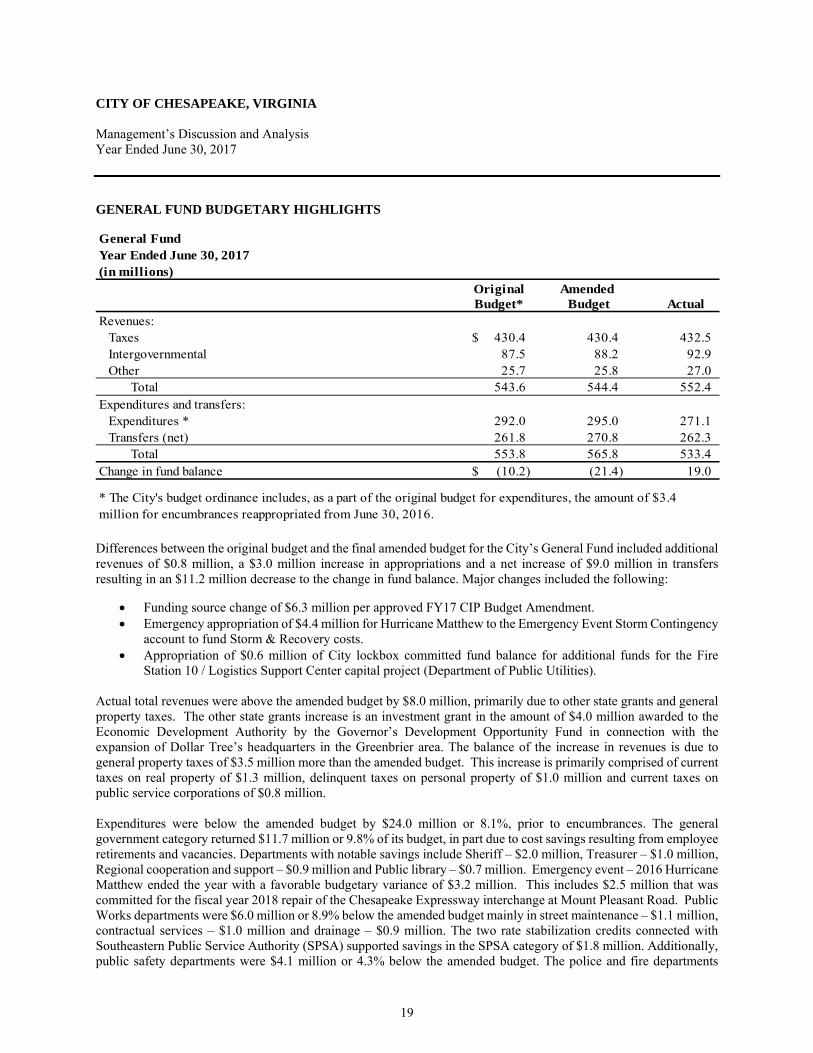
CITY OF CHESAPEAKE, VIRGINIA Management’s Discussion and Analysis Year Ended June 30, 2017
GENERAL FUND BUDGETARY HIGHLIGHTS General FundYear Ended June 30, 2017(in millions)
Original Amended Budget* Budget Actual
Revenues: Taxes 430.4$ 430.4 432.5 Intergovernmental 87.5 88.2 92.9 Other 25.7 25.8 27.0 Total 543.6 544.4 552.4 Expenditures and transfers: Expenditures * 292.0 295.0 271.1 Transfers (net) 261.8 270.8 262.3 Total 553.8 565.8 533.4 Change in fund balance (10.2)$ (21.4) 19.0
* The City's budget ordinance includes, as a part of the original budget for expenditures, the amount of $3.4 million for encumbrances reappropriated from June 30, 2016. Differences between the original budget and the final amended budget for the City’s General Fund included additional revenues of $0.8 million, a $3.0 million increase in appropriations and a net increase of $9.0 million in transfers resulting in an $11.2 million decrease to the change in fund balance. Major changes included the following:
Funding source change of $6.3 million per approved FY17 CIP Budget Amendment. Emergency appropriation of $4.4 million for Hurricane Matthew to the Emergency Event Storm Contingency
account to fund Storm & Recovery costs. Appropriation of $0.6 million of City lockbox committed fund balance for additional funds for the Fire
Station 10 / Logistics Support Center capital project (Department of Public Utilities).
Actual total revenues were above the amended budget by $8.0 million, primarily due to other state grants and general property taxes. The other state grants increase is an investment grant in the amount of $4.0 million awarded to the Economic Development Authority by the Governor’s Development Opportunity Fund in connection with the expansion of Dollar Tree’s headquarters in the Greenbrier area. The balance of the increase in revenues is due to general property taxes of $3.5 million more than the amended budget. This increase is primarily comprised of current taxes on real property of $1.3 million, delinquent taxes on personal property of $1.0 million and current taxes on public service corporations of $0.8 million. Expenditures were below the amended budget by $24.0 million or 8.1%, prior to encumbrances. The general government category returned $11.7 million or 9.8% of its budget, in part due to cost savings resulting from employee retirements and vacancies. Departments with notable savings include Sheriff – $2.0 million, Treasurer – $1.0 million, Regional cooperation and support – $0.9 million and Public library – $0.7 million. Emergency event – 2016 Hurricane Matthew ended the year with a favorable budgetary variance of $3.2 million. This includes $2.5 million that was committed for the fiscal year 2018 repair of the Chesapeake Expressway interchange at Mount Pleasant Road. Public Works departments were $6.0 million or 8.9% below the amended budget mainly in street maintenance – $1.1 million, contractual services – $1.0 million and drainage – $0.9 million. The two rate stabilization credits connected with Southeastern Public Service Authority (SPSA) supported savings in the SPSA category of $1.8 million. Additionally, public safety departments were $4.1 million or 4.3% below the amended budget. The police and fire departments
19
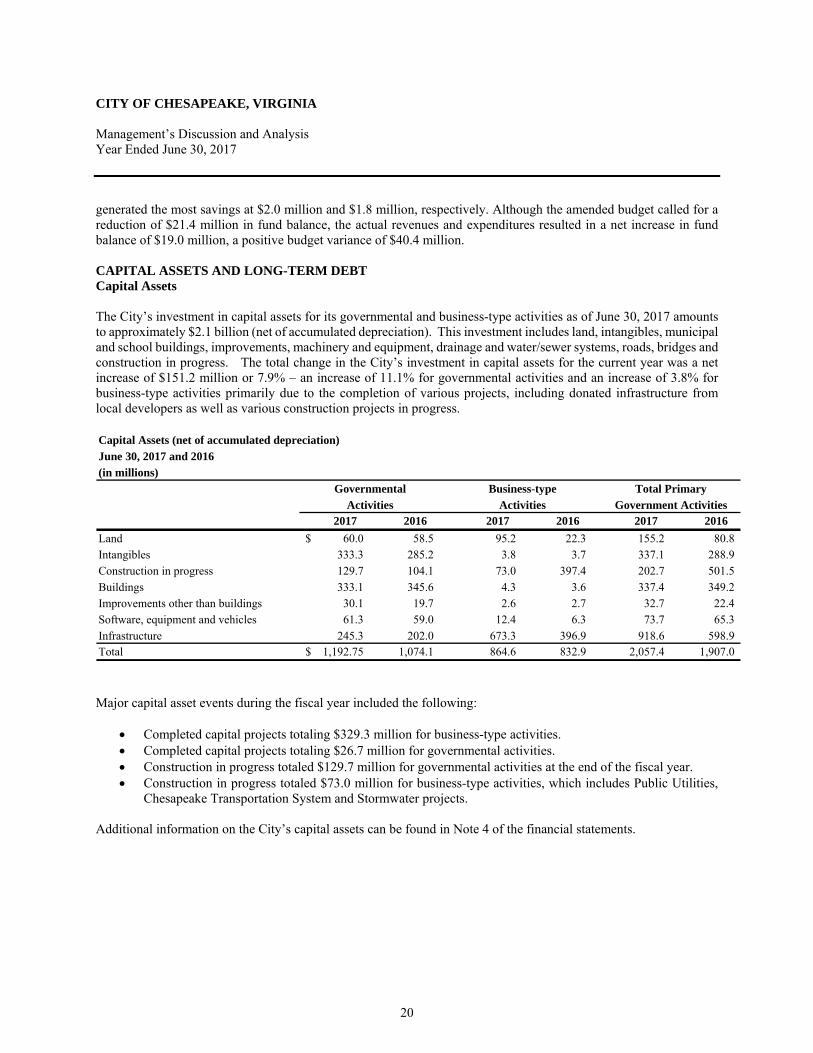
CITY OF CHESAPEAKE, VIRGINIA Management’s Discussion and Analysis Year Ended June 30, 2017
generated the most savings at $2.0 million and $1.8 million, respectively. Although the amended budget called for a reduction of $21.4 million in fund balance, the actual revenues and expenditures resulted in a net increase in fund balance of $19.0 million, a positive budget variance of $40.4 million. CAPITAL ASSETS AND LONG-TERM DEBT Capital Assets The City’s investment in capital assets for its governmental and business-type activities as of June 30, 2017 amounts to approximately $2.1 billion (net of accumulated depreciation). This investment includes land, intangibles, municipal and school buildings, improvements, machinery and equipment, drainage and water/sewer systems, roads, bridges and construction in progress. The total change in the City’s investment in capital assets for the current year was a net increase of $151.2 million or 7.9% – an increase of 11.1% for governmental activities and an increase of 3.8% for business-type activities primarily due to the completion of various projects, including donated infrastructure from local developers as well as various construction projects in progress. Capital Assets (net of accumulated depreciation)June 30, 2017 and 2016(in millions)
2017 2016 2017 2016 2017 2016Land 60.0$ 58.5 95.2 22.3 155.2 80.8 Intangibles 333.3 285.2 3.8 3.7 337.1 288.9 Construction in progress 129.7 104.1 73.0 397.4 202.7 501.5 Buildings 333.1 345.6 4.3 3.6 337.4 349.2 Improvements other than buildings 30.1 19.7 2.6 2.7 32.7 22.4 Software, equipment and vehicles 61.3 59.0 12.4 6.3 73.7 65.3 Infrastructure 245.3 202.0 673.3 396.9 918.6 598.9 Total 1,192.75$ 1,074.1 864.6 832.9 2,057.4 1,907.0
Total PrimaryGovernmental Business-typeActivities Activities Government Activities
Major capital asset events during the fiscal year included the following:
Completed capital projects totaling $329.3 million for business-type activities. Completed capital projects totaling $26.7 million for governmental activities. Construction in progress totaled $129.7 million for governmental activities at the end of the fiscal year. Construction in progress totaled $73.0 million for business-type activities, which includes Public Utilities,
Chesapeake Transportation System and Stormwater projects. Additional information on the City’s capital assets can be found in Note 4 of the financial statements.
20
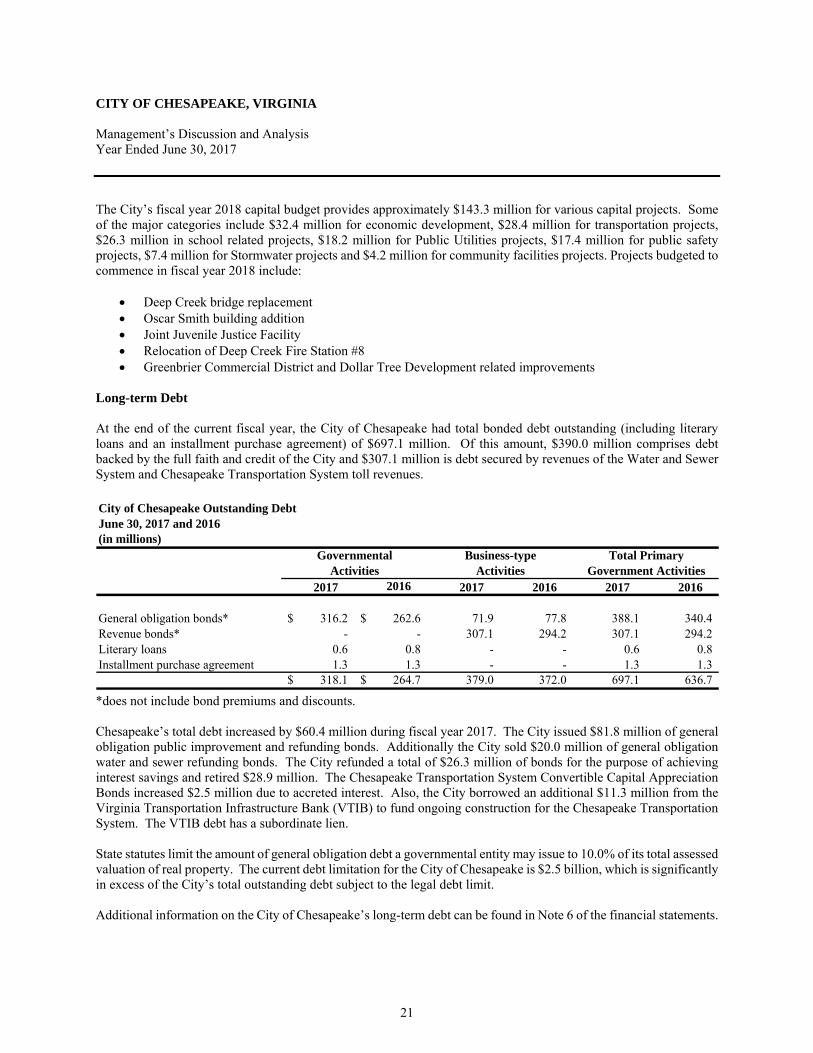
CITY OF CHESAPEAKE, VIRGINIA Management’s Discussion and Analysis Year Ended June 30, 2017
The City’s fiscal year 2018 capital budget provides approximately $143.3 million for various capital projects. Some of the major categories include $32.4 million for economic development, $28.4 million for transportation projects, $26.3 million in school related projects, $18.2 million for Public Utilities projects, $17.4 million for public safety projects, $7.4 million for Stormwater projects and $4.2 million for community facilities projects. Projects budgeted to commence in fiscal year 2018 include:
Deep Creek bridge replacement Oscar Smith building addition Joint Juvenile Justice Facility Relocation of Deep Creek Fire Station #8 Greenbrier Commercial District and Dollar Tree Development related improvements
Long-term Debt
At the end of the current fiscal year, the City of Chesapeake had total bonded debt outstanding (including literary loans and an installment purchase agreement) of $697.1 million. Of this amount, $390.0 million comprises debt backed by the full faith and credit of the City and $307.1 million is debt secured by revenues of the Water and Sewer System and Chesapeake Transportation System toll revenues. City of Chesapeake Outstanding DebtJune 30, 2017 and 2016(in millions)
2017 2016 2017 2016 2017 2016
General obligation bonds* 316.2$ 262.6$ 71.9 77.8 388.1 340.4 Revenue bonds* - - 307.1 294.2 307.1 294.2 Literary loans 0.6 0.8 - - 0.6 0.8 Installment purchase agreement 1.3 1.3 - - 1.3 1.3
318.1$ 264.7$ 379.0 372.0 697.1 636.7
Government ActivitiesGovernmental
ActivitiesBusiness-type
ActivitiesTotal Primary
*does not include bond premiums and discounts. Chesapeake’s total debt increased by $60.4 million during fiscal year 2017. The City issued $81.8 million of general obligation public improvement and refunding bonds. Additionally the City sold $20.0 million of general obligation water and sewer refunding bonds. The City refunded a total of $26.3 million of bonds for the purpose of achieving interest savings and retired $28.9 million. The Chesapeake Transportation System Convertible Capital Appreciation Bonds increased $2.5 million due to accreted interest. Also, the City borrowed an additional $11.3 million from the Virginia Transportation Infrastructure Bank (VTIB) to fund ongoing construction for the Chesapeake Transportation System. The VTIB debt has a subordinate lien. State statutes limit the amount of general obligation debt a governmental entity may issue to 10.0% of its total assessed valuation of real property. The current debt limitation for the City of Chesapeake is $2.5 billion, which is significantly in excess of the City’s total outstanding debt subject to the legal debt limit. Additional information on the City of Chesapeake’s long-term debt can be found in Note 6 of the financial statements.
21
CITY OF CHESAPEAKE, VIRGINIA Management’s Discussion and Analysis Year Ended June 30, 2017
ECONOMIC FACTORS AND NEXT YEAR’S BUDGETS AND RATES
The average unemployment rate for fiscal year 2017 for the City of Chesapeake was 4.2%, a slight decline from the 2016 rate of 4.3%. This compares to the average unemployment rates of 4.5% for the region, 4.0% for Virginia and 4.7% nationally for the same time period.
The Hampton Roads Planning District Commission projects Chesapeake’s total population for 2040 will be approximately 314,600.
The City’s real estate tax base increased by $803.8 million or 3.3% from the prior year. Personal property taxes experienced a $0.6 million or 0.8% increase from fiscal year 2016 to fiscal year 2017.
Taxable retail sales for calendar year 2016 increased by $82.9 million or 2.4%. As a result of the issuance of Virginia Public School Authority’s 2016 refunding bonds, the City will be
receiving approximately $0.9 million in savings that will be allocated over the remaining amortization period for the City’s bonds, whose original purpose finances School assets, which have a final maturity date of 2031. The savings commenced during fiscal year 2017. The Virginia Public School Authority also refunded bonds in 2017 and the City will be receiving approximately $0.4 million in savings that will be allocated over the remaining amortization period for the City’s bonds which have a final maturity of 2031. The savings will begin during fiscal year 2018.
The City will continue to focus on core service delivery for the next three to five years. To help address the identified City and School capital requirements, funds continue to be assigned to provide resources for future debt service and cash funding for projects.
All of these factors will be considered in preparing the City’s budget for fiscal year 2019. Additionally, the City budget process includes detailed three-year resource requirements in order to improve projections, to further support strategic planning and to maintain the City’s fiscal stability and strong financial position. CONTACTING THE CITY’S FINANCIAL MANAGEMENT This financial report is designed to provide citizens, taxpayers, customers, investors and creditors with a general overview of the City’s finances and to demonstrate the City’s accountability for the funds it receives. Questions concerning any of the information provided in this report or requests for additional information should be addressed to the Director of Finance, 306 Cedar Road, Chesapeake, Virginia 23322.
22

Basic Financial Statements

This page intentionally left blank

Government-Wide Financial Statements
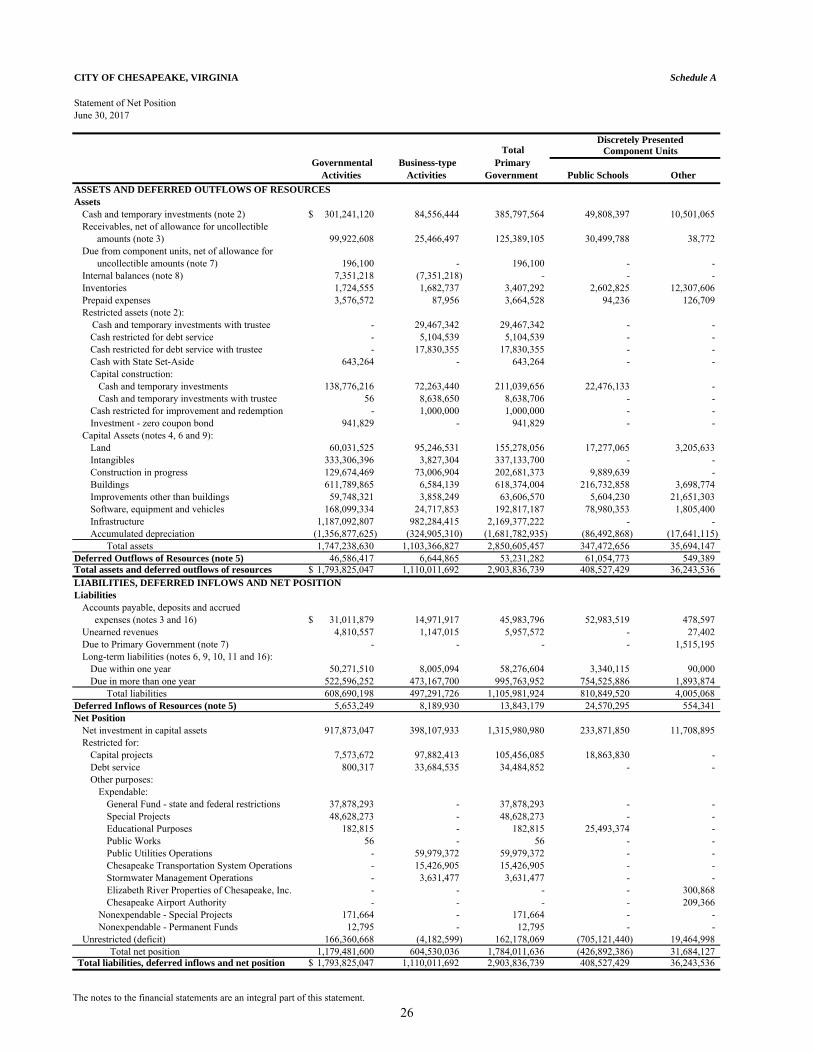
CITY OF CHESAPEAKE, VIRGINIA Schedule A
Statement of Net PositionJune 30, 2017
Total Governmental
Activities Business-type
Activities Primary
Government Public Schools Other ASSETS AND DEFERRED OUTFLOWS OF RESOURCESAssets
Cash and temporary investments (note 2) 301,241,120$ 84,556,444 385,797,564 49,808,397 10,501,065 Receivables, net of allowance for uncollectible amounts (note 3) 99,922,608 25,466,497 125,389,105 30,499,788 38,772 Due from component units, net of allowance for uncollectible amounts (note 7) 196,100 - 196,100 - - Internal balances (note 8) 7,351,218 (7,351,218) - - - Inventories 1,724,555 1,682,737 3,407,292 2,602,825 12,307,606 Prepaid expenses 3,576,572 87,956 3,664,528 94,236 126,709 Restricted assets (note 2): Cash and temporary investments with trustee - 29,467,342 29,467,342 - -
Cash restricted for debt service - 5,104,539 5,104,539 - - Cash restricted for debt service with trustee - 17,830,355 17,830,355 - - Cash with State Set-Aside 643,264 - 643,264 - - Capital construction:
Cash and temporary investments 138,776,216 72,263,440 211,039,656 22,476,133 - Cash and temporary investments with trustee 56 8,638,650 8,638,706 - -
Cash restricted for improvement and redemption - 1,000,000 1,000,000 - - Investment - zero coupon bond 941,829 - 941,829 - -
Capital Assets (notes 4, 6 and 9):Land 60,031,525 95,246,531 155,278,056 17,277,065 3,205,633 Intangibles 333,306,396 3,827,304 337,133,700 - - Construction in progress 129,674,469 73,006,904 202,681,373 9,889,639 - Buildings 611,789,865 6,584,139 618,374,004 216,732,858 3,698,774 Improvements other than buildings 59,748,321 3,858,249 63,606,570 5,604,230 21,651,303 Software, equipment and vehicles 168,099,334 24,717,853 192,817,187 78,980,353 1,805,400 Infrastructure 1,187,092,807 982,284,415 2,169,377,222 - - Accumulated depreciation (1,356,877,625) (324,905,310) (1,681,782,935) (86,492,868) (17,641,115)
Total assets 1,747,238,630 1,103,366,827 2,850,605,457 347,472,656 35,694,147 Deferred Outflows of Resources (note 5) 46,586,417 6,644,865 53,231,282 61,054,773 549,389 Total assets and deferred outflows of resources 1,793,825,047$ 1,110,011,692 2,903,836,739 408,527,429 36,243,536 LIABILITIES, DEFERRED INFLOWS AND NET POSITIONLiabilities
Accounts payable, deposits and accrued expenses (notes 3 and 16) 31,011,879$ 14,971,917 45,983,796 52,983,519 478,597 Unearned revenues 4,810,557 1,147,015 5,957,572 - 27,402 Due to Primary Government (note 7) - - - - 1,515,195 Long-term liabilities (notes 6, 9, 10, 11 and 16):
Due within one year 50,271,510 8,005,094 58,276,604 3,340,115 90,000 Due in more than one year 522,596,252 473,167,700 995,763,952 754,525,886 1,893,874
Total liabilities 608,690,198 497,291,726 1,105,981,924 810,849,520 4,005,068 Deferred Inflows of Resources (note 5) 5,653,249 8,189,930 13,843,179 24,570,295 554,341 Net Position
Net investment in capital assets 917,873,047 398,107,933 1,315,980,980 233,871,850 11,708,895 Restricted for:
Capital projects 7,573,672 97,882,413 105,456,085 18,863,830 - Debt service 800,317 33,684,535 34,484,852 - - Other purposes:
Expendable:General Fund - state and federal restrictions 37,878,293 - 37,878,293 - - Special Projects 48,628,273 - 48,628,273 - - Educational Purposes 182,815 - 182,815 25,493,374 - Public Works 56 - 56 - - Public Utilities Operations - 59,979,372 59,979,372 - - Chesapeake Transportation System Operations - 15,426,905 15,426,905 - - Stormwater Management Operations - 3,631,477 3,631,477 - - Elizabeth River Properties of Chesapeake, Inc. - - - - 300,868 Chesapeake Airport Authority - - - - 209,366
Nonexpendable - Special Projects 171,664 - 171,664 - - Nonexpendable - Permanent Funds 12,795 - 12,795 - -
Unrestricted (deficit) 166,360,668 (4,182,599) 162,178,069 (705,121,440) 19,464,998 Total net position 1,179,481,600 604,530,036 1,784,011,636 (426,892,386) 31,684,127
Total liabilities, deferred inflows and net position 1,793,825,047$ 1,110,011,692 2,903,836,739 408,527,429 36,243,536
Component Units Discretely Presented
The notes to the financial statements are an integral part of this statement.26
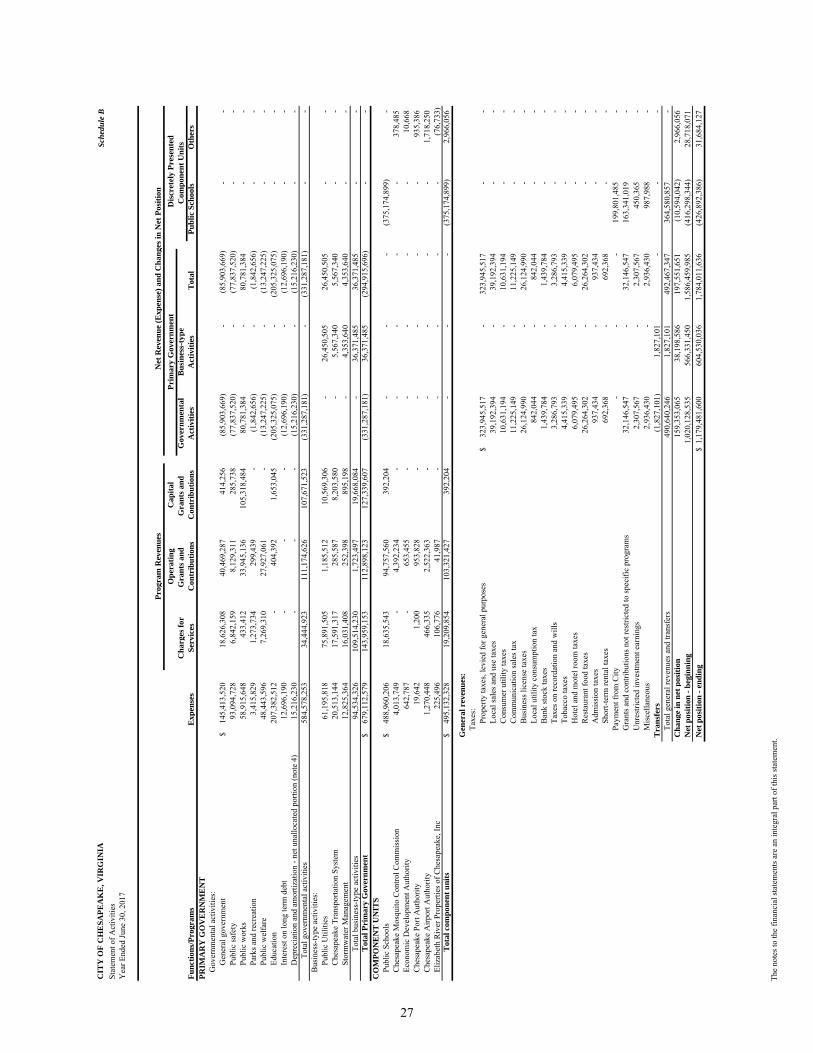
CIT
Y O
F C
HE
SAPE
AK
E, V
IRG
INIA
Sche
dule
BSt
atem
ent o
f Act
iviti
esY
ear E
nded
June
30,
201
7
Ope
ratin
gC
apita
lC
har g
es fo
rG
rant
s and
G
rant
s and
G
over
nmen
tal
Bus
ines
s-ty
peFu
nctio
ns/P
rogr
ams
Exp
ense
sSe
rvic
esC
ontr
ibut
ions
Con
trib
utio
nsA
ctiv
ities
Act
iviti
esT
otal
Publ
ic S
choo
lsO
ther
sPR
IMA
RY
GO
VE
RN
ME
NT
Gov
ernm
enta
l act
iviti
es:
Gen
eral
gov
ernm
ent
145,
413,
520
$
18
,626
,308
40
,469
,287
41
4,25
6
(85,
903,
669)
-
(8
5,90
3,66
9)
-
-
Publ
ic sa
fety
93,0
94,7
28
6,84
2,15
9
8,
129,
311
285,
738
(7
7,83
7,52
0)
-
(77,
837,
520)
-
-
Pu
blic
wor
ks58
,915
,648
43
3,41
2
33,9
45,1
36
105,
318,
484
80
,781
,384
-
80
,781
,384
-
-
Pa
rks a
nd re
crea
tion
3,41
5,82
9
1,
273,
734
299,
439
-
(1
,842
,656
)
-
(1
,842
,656
)
-
-
Pu
blic
wel
fare
48,4
43,5
96
7,26
9,31
0
27
,927
,061
-
(1
3,24
7,22
5)
-
(13,
247,
225)
-
-
Ed
ucat
ion
207,
382,
512
-
40
4,39
2
1,65
3,04
5
(2
05,3
25,0
75)
-
(205
,325
,075
)
-
-
In
tere
st o
n lo
ng te
rm d
ebt
12,6
96,1
90
-
-
-
(12,
696,
190)
-
(1
2,69
6,19
0)
-
-
Dep
reci
atio
n an
d am
ortiz
atio
n - n
et u
nallo
cate
d po
rtion
(not
e 4)
15,2
16,2
30
-
-
-
(15,
216,
230)
-
(1
5,21
6,23
0)
-
-
Tota
l gov
ernm
enta
l act
iviti
es58
4,57
8,25
3
34,4
44,9
23
111,
174,
626
10
7,67
1,52
3
(331
,287
,181
)
-
(3
31,2
87,1
81)
-
-
Bus
ines
s-ty
pe a
ctiv
ities
:Pu
blic
Util
ities
61,1
95,8
18
75,8
91,5
05
1,18
5,51
2
10
,569
,306
-
26
,450
,505
26
,450
,505
-
-
C
hesa
peak
e Tr
ansp
orta
tion
Syst
em20
,513
,144
17
,591
,317
28
5,58
7
8,20
3,58
0
-
5,
567,
340
5,56
7,34
0
-
-
St
orm
wat
er M
anag
emen
t12
,825
,364
16
,031
,408
25
2,39
8
895,
198
-
4,
353,
640
4,35
3,64
0
-
-
To
tal b
usin
ess-
type
act
iviti
es94
,534
,326
10
9,51
4,23
0
1,72
3,49
7
19
,668
,084
-
36
,371
,485
36
,371
,485
-
-
T
otal
Pri
mar
y G
over
nmen
t67
9,11
2,57
9$
14
3,95
9,15
3
11
2,89
8,12
3
12
7,33
9,60
7
(3
31,2
87,1
81)
36,3
71,4
85
(294
,915
,696
)
-
-
C
OM
PON
EN
T U
NIT
SPu
blic
Sch
ools
488,
960,
206
$
18
,635
,543
94
,757
,560
39
2,20
4
-
-
-
(375
,174
,899
)
-
C
hesa
peak
e M
osqu
ito C
ontro
l Com
mis
sion
4,01
3,74
9
-
4,
392,
234
-
-
-
-
-
378,
485
Ec
onom
ic D
evel
opm
ent A
utho
rity
642,
787
-
65
3,45
5
-
-
-
-
-
10,6
68
C
hesa
peak
e Po
rt A
utho
rity
19,6
42
1,
200
953,
828
-
-
-
-
-
93
5,38
6
Che
sape
ake
Airp
ort A
utho
rity
1,27
0,44
8
46
6,33
5
2,52
2,36
3
-
-
-
-
-
1,
718,
250
Eliz
abet
h R
iver
Pro
perti
es o
f Che
sape
ake,
Inc
225,
496
10
6,77
6
41,9
87
-
-
-
-
-
(7
6,73
3)
Tot
al c
ompo
nent
uni
ts49
5,13
2,32
8$
19
,209
,854
10
3,32
1,42
7
39
2,20
4
-
-
-
(3
75,1
74,8
99)
2,96
6,05
6
Gen
eral
rev
enue
s:Ta
xes:
Prop
erty
taxe
s, le
vied
for g
ener
al p
urpo
ses
323,
945,
517
$
-
32
3,94
5,51
7
-
-
Loca
l sal
es a
nd u
se ta
xes
39,1
92,3
94
-
39,1
92,3
94
-
-
Con
sum
er u
tility
taxe
s10
,631
,194
-
10
,631
,194
-
-
C
omm
unic
atio
n sa
les t
ax11
,225
,149
-
11
,225
,149
-
-
B
usin
ess l
icen
se ta
xes
26,1
24,9
90
-
26,1
24,9
90
-
-
Loca
l util
ity c
onsu
mpt
ion
tax
842,
044
-
84
2,04
4
-
-
Ban
k st
ock
taxe
s1,
439,
784
-
1,43
9,78
4
-
-
Ta
xes o
n re
cord
atio
n an
d w
ills
3,28
6,79
3
-
3,
286,
793
-
-
Toba
cco
taxe
s4,
415,
339
-
4,41
5,33
9
-
-
H
otel
and
mot
el ro
om ta
xes
6,07
9,49
5
-
6,
079,
495
-
-
Res
taur
ant f
ood
taxe
s26
,264
,302
-
26
,264
,302
-
-
A
dmis
sion
taxe
s93
7,43
4
-
937,
434
-
-
Sh
ort-t
erm
rent
al ta
xes
692,
368
-
69
2,36
8
-
-
Paym
ent f
rom
City
-
-
-
199,
801,
485
-
G
rant
s and
con
tribu
tions
not
rest
ricte
d to
spec
ific
prog
ram
s32
,146
,547
-
32
,146
,547
16
3,34
1,01
9
-
Unr
estri
cted
inve
stm
ent e
arni
ngs
2,30
7,56
7
-
2,
307,
567
450,
365
-
M
isce
llane
ous
2,93
6,43
0
-
2,
936,
430
987,
988
-
T
rans
fers
(1,8
27,1
01)
1,82
7,10
1
-
-
-
To
tal g
ener
al re
venu
es a
nd tr
ansf
ers
490,
640,
246
1,
827,
101
492,
467,
347
36
4,58
0,85
7
-
Cha
nge
in n
et p
ositi
on15
9,35
3,06
5
38,1
98,5
86
197,
551,
651
(1
0,59
4,04
2)
2,96
6,05
6
N
et p
ositi
on -
begi
nnin
g1,
020,
128,
535
566,
331,
450
1,
586,
459,
985
(416
,298
,344
)
28
,718
,071
N
et p
ositi
on -
endi
ng1,
179,
481,
600
$
604,
530,
036
1,
784,
011,
636
(426
,892
,386
)
31
,684
,127
Com
pone
nt U
nits
Pro g
ram
Rev
enue
sPr
imar
y G
over
nmen
tN
et R
even
ue (E
xpen
se) a
nd C
hang
es in
Net
Pos
ition
Dis
cret
ely
Pres
ente
d
The
note
s to
the
finan
cial
stat
emen
ts a
re a
n in
tegr
al p
art o
f thi
s sta
tem
ent.
27

This page intentionally left blank

Fund Financial Statements

This page intentionally left blank

Governmental Fund Financial Statements
Major Governmental Funds – Include General, Debt Service and Capital Projects Funds. Other Governmental Funds – Include Special Revenue and Permanent Funds.
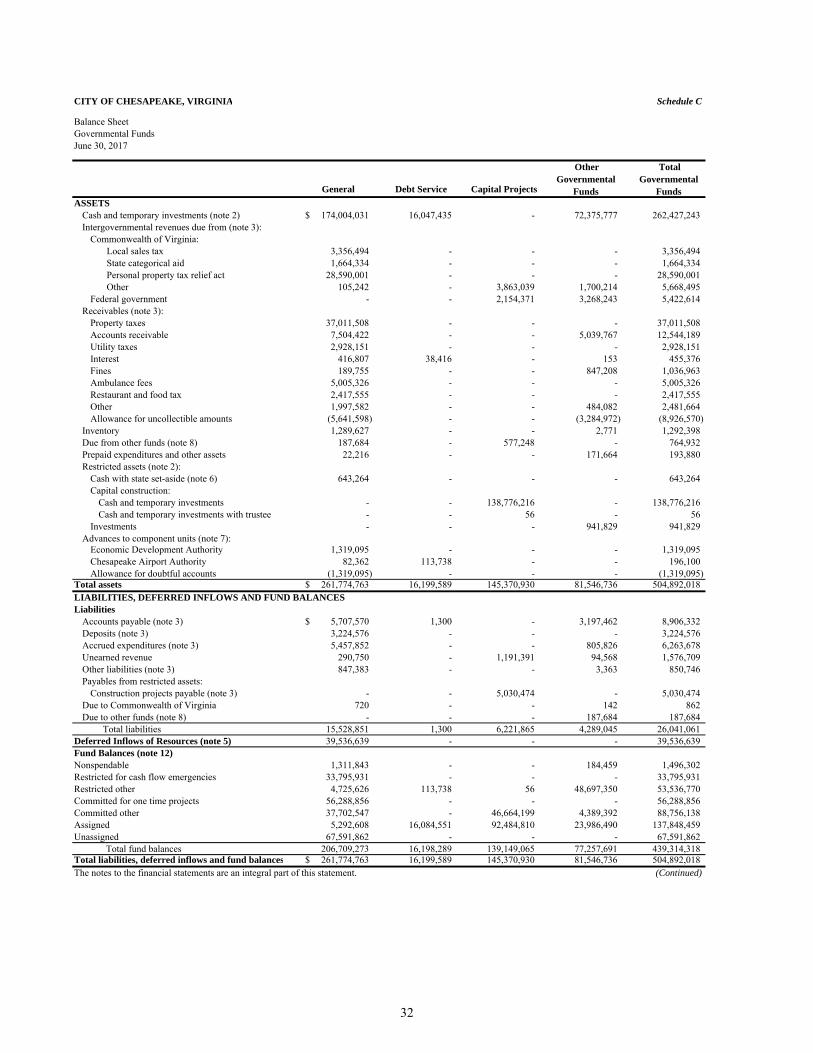
CITY OF CHESAPEAKE, VIRGINIA Schedule C
Balance SheetGovernmental FundsJune 30, 2017
General Debt Service Capital Projects
Other Governmental
Funds
Total Governmental
Funds ASSETS
Cash and temporary investments (note 2) 174,004,031$ 16,047,435 - 72,375,777 262,427,243 Intergovernmental revenues due from (note 3):
Commonwealth of Virginia:Local sales tax 3,356,494 - - - 3,356,494 State categorical aid 1,664,334 - - - 1,664,334 Personal property tax relief act 28,590,001 - - - 28,590,001 Other 105,242 - 3,863,039 1,700,214 5,668,495
Federal government - - 2,154,371 3,268,243 5,422,614 Receivables (note 3):
Property taxes 37,011,508 - - - 37,011,508 Accounts receivable 7,504,422 - - 5,039,767 12,544,189 Utility taxes 2,928,151 - - - 2,928,151 Interest 416,807 38,416 - 153 455,376 Fines 189,755 - - 847,208 1,036,963 Ambulance fees 5,005,326 - - - 5,005,326 Restaurant and food tax 2,417,555 - - - 2,417,555 Other 1,997,582 - - 484,082 2,481,664 Allowance for uncollectible amounts (5,641,598) - - (3,284,972) (8,926,570)
Inventory 1,289,627 - - 2,771 1,292,398 Due from other funds (note 8) 187,684 - 577,248 - 764,932 Prepaid expenditures and other assets 22,216 - - 171,664 193,880 Restricted assets (note 2):
Cash with state set-aside (note 6) 643,264 - - - 643,264 Capital construction:
Cash and temporary investments - - 138,776,216 - 138,776,216 Cash and temporary investments with trustee - - 56 - 56
Investments - - - 941,829 941,829 Advances to component units (note 7):
Economic Development Authority 1,319,095 - - - 1,319,095 Chesapeake Airport Authority 82,362 113,738 - - 196,100 Allowance for doubtful accounts (1,319,095) - - - (1,319,095)
Total assets 261,774,763$ 16,199,589 145,370,930 81,546,736 504,892,018 LIABILITIES, DEFERRED INFLOWS AND FUND BALANCESLiabilities
Accounts payable (note 3) 5,707,570$ 1,300 - 3,197,462 8,906,332 Deposits (note 3) 3,224,576 - - - 3,224,576 Accrued expenditures (note 3) 5,457,852 - - 805,826 6,263,678 Unearned revenue 290,750 - 1,191,391 94,568 1,576,709 Other liabilities (note 3) 847,383 - - 3,363 850,746 Payables from restricted assets:
Construction projects payable (note 3) - - 5,030,474 - 5,030,474 Due to Commonwealth of Virginia 720 - - 142 862 Due to other funds (note 8) - - - 187,684 187,684
Total liabilities 15,528,851 1,300 6,221,865 4,289,045 26,041,061 Deferred Inflows of Resources (note 5) 39,536,639 - - - 39,536,639 Fund Balances (note 12)Nonspendable 1,311,843 - - 184,459 1,496,302 Restricted for cash flow emergencies 33,795,931 - - - 33,795,931 Restricted other 4,725,626 113,738 56 48,697,350 53,536,770 Committed for one time projects 56,288,856 - - - 56,288,856 Committed other 37,702,547 - 46,664,199 4,389,392 88,756,138 Assigned 5,292,608 16,084,551 92,484,810 23,986,490 137,848,459 Unassigned 67,591,862 - - - 67,591,862 Total fund balances 206,709,273 16,198,289 139,149,065 77,257,691 439,314,318
Total liabilities, deferred inflows and fund balances 261,774,763$ 16,199,589 145,370,930 81,546,736 504,892,018 The notes to the financial statements are an integral part of this statement. (Continued)
32
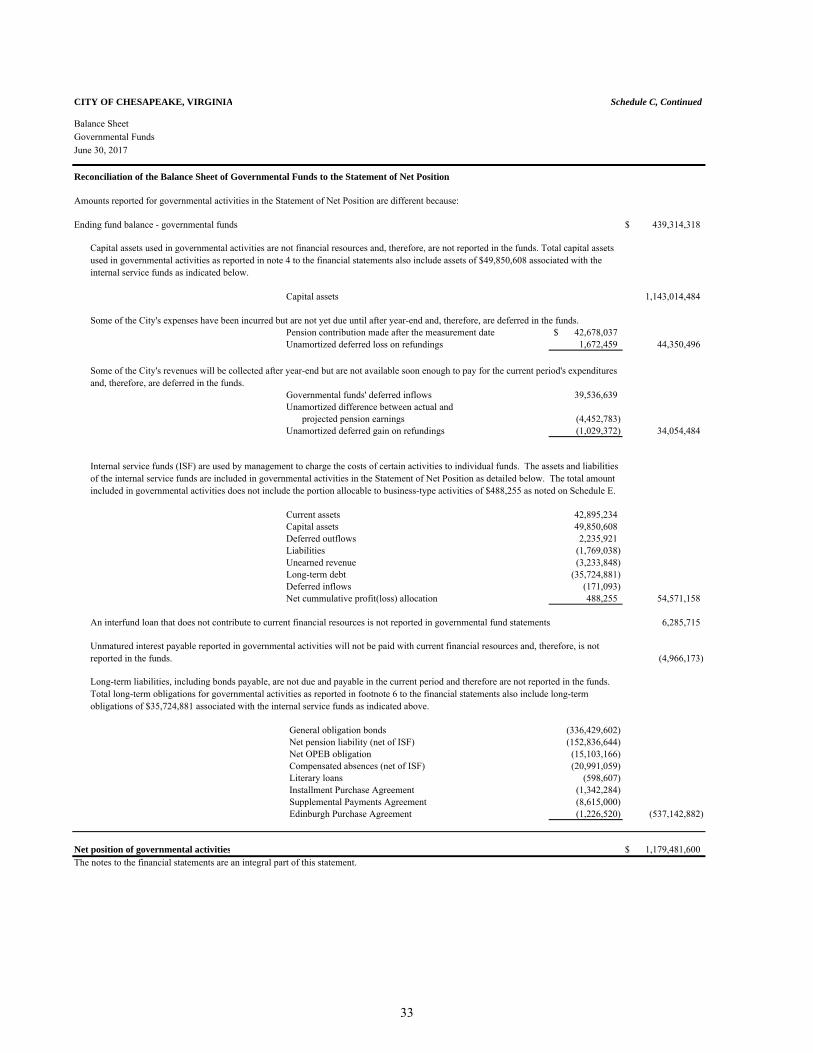
CITY OF CHESAPEAKE, VIRGINIA Schedule C, Continued
Balance SheetGovernmental FundsJune 30, 2017
Amounts reported for governmental activities in the Statement of Net Position are different because:
Ending fund balance - governmental funds $ 439,314,318
Capital assets 1,143,014,484
Pension contribution made after the measurement date 42,678,037$ Unamortized deferred loss on refundings 1,672,459 44,350,496
Governmental funds' deferred inflows 39,536,639 Unamortized difference between actual and
projected pension earnings (4,452,783) Unamortized deferred gain on refundings (1,029,372) 34,054,484
Current assets 42,895,234 Capital assets 49,850,608 Deferred outflows 2,235,921 Liabilities (1,769,038) Unearned revenue (3,233,848) Long-term debt (35,724,881) Deferred inflows (171,093) Net cummulative profit(loss) allocation 488,255 54,571,158
An interfund loan that does not contribute to current financial resources is not reported in governmental fund statements 6,285,715
(4,966,173)
General obligation bonds (336,429,602) Net pension liability (net of ISF) (152,836,644) Net OPEB obligation (15,103,166) Compensated absences (net of ISF) (20,991,059) Literary loans (598,607) Installment Purchase Agreement (1,342,284) Supplemental Payments Agreement (8,615,000) Edinburgh Purchase Agreement (1,226,520) (537,142,882)
Net position of governmental activities $ 1,179,481,600 The notes to the financial statements are an integral part of this statement.
Unmatured interest payable reported in governmental activities will not be paid with current financial resources and, therefore, is not reported in the funds.
Long-term liabilities, including bonds payable, are not due and payable in the current period and therefore are not reported in the funds. Total long-term obligations for governmental activities as reported in footnote 6 to the financial statements also include long-term obligations of $35,724,881 associated with the internal service funds as indicated above.
Reconciliation of the Balance Sheet of Governmental Funds to the Statement of Net Position
Capital assets used in governmental activities are not financial resources and, therefore, are not reported in the funds. Total capital assets used in governmental activities as reported in note 4 to the financial statements also include assets of $49,850,608 associated with the internal service funds as indicated below.
Some of the City's revenues will be collected after year-end but are not available soon enough to pay for the current period's expenditures and, therefore, are deferred in the funds.
Internal service funds (ISF) are used by management to charge the costs of certain activities to individual funds. The assets and liabilities of the internal service funds are included in governmental activities in the Statement of Net Position as detailed below. The total amount included in governmental activities does not include the portion allocable to business-type activities of $488,255 as noted on Schedule E.
Some of the City's expenses have been incurred but are not yet due until after year-end and, therefore, are deferred in the funds.
33
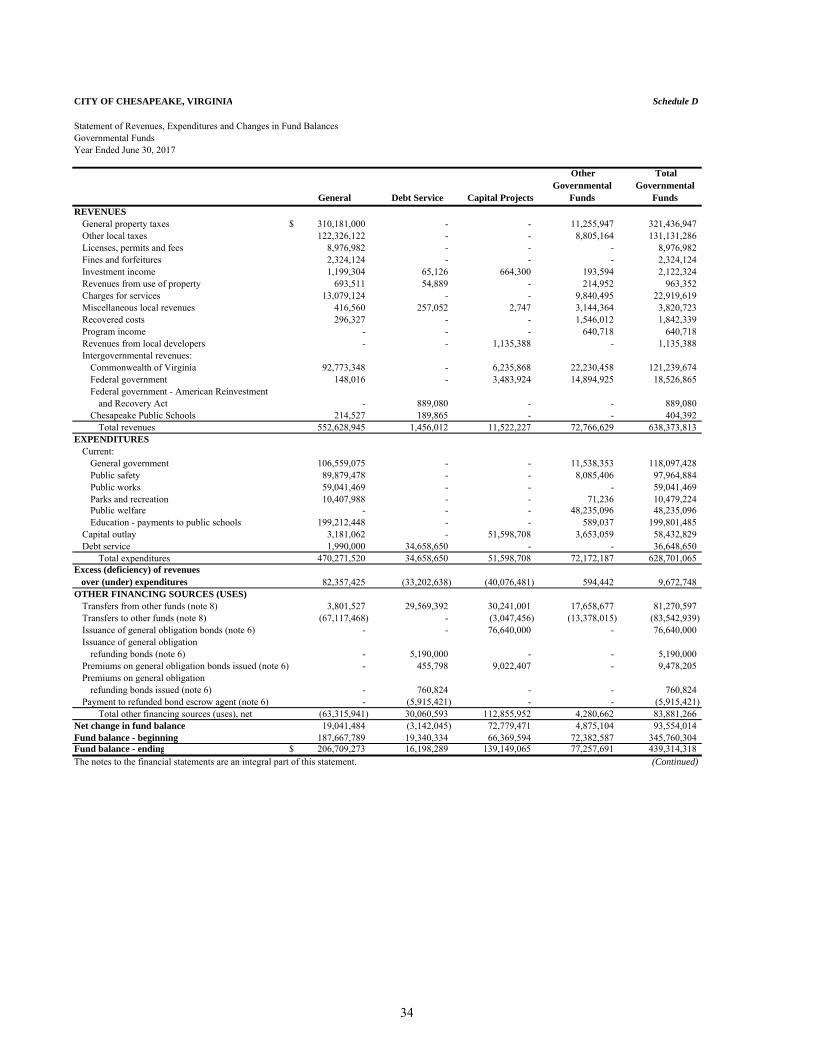
CITY OF CHESAPEAKE, VIRGINIA Schedule D
Statement of Revenues, Expenditures and Changes in Fund BalancesGovernmental FundsYear Ended June 30, 2017
General Debt Service Capital Projects
Other Governmental
Funds
Total Governmental
Funds REVENUES
General property taxes $ 310,181,000 - - 11,255,947 321,436,947 Other local taxes 122,326,122 - - 8,805,164 131,131,286 Licenses, permits and fees 8,976,982 - - - 8,976,982 Fines and forfeitures 2,324,124 - - - 2,324,124 Investment income 1,199,304 65,126 664,300 193,594 2,122,324 Revenues from use of property 693,511 54,889 - 214,952 963,352 Charges for services 13,079,124 - - 9,840,495 22,919,619 Miscellaneous local revenues 416,560 257,052 2,747 3,144,364 3,820,723 Recovered costs 296,327 - - 1,546,012 1,842,339 Program income - - - 640,718 640,718 Revenues from local developers - - 1,135,388 - 1,135,388 Intergovernmental revenues:
Commonwealth of Virginia 92,773,348 - 6,235,868 22,230,458 121,239,674 Federal government 148,016 - 3,483,924 14,894,925 18,526,865 Federal government - American Reinvestment
and Recovery Act - 889,080 - - 889,080 Chesapeake Public Schools 214,527 189,865 - - 404,392
Total revenues 552,628,945 1,456,012 11,522,227 72,766,629 638,373,813 EXPENDITURES
Current:General government 106,559,075 - - 11,538,353 118,097,428 Public safety 89,879,478 - - 8,085,406 97,964,884 Public works 59,041,469 - - - 59,041,469 Parks and recreation 10,407,988 - - 71,236 10,479,224 Public welfare - - - 48,235,096 48,235,096 Education - payments to public schools 199,212,448 - - 589,037 199,801,485
Capital outlay 3,181,062 - 51,598,708 3,653,059 58,432,829 Debt service 1,990,000 34,658,650 - - 36,648,650
Total expenditures 470,271,520 34,658,650 51,598,708 72,172,187 628,701,065 Excess (deficiency) of revenues over (under) expenditures 82,357,425 (33,202,638) (40,076,481) 594,442 9,672,748 OTHER FINANCING SOURCES (USES)
Transfers from other funds (note 8) 3,801,527 29,569,392 30,241,001 17,658,677 81,270,597 Transfers to other funds (note 8) (67,117,468) - (3,047,456) (13,378,015) (83,542,939) Issuance of general obligation bonds (note 6) - - 76,640,000 - 76,640,000 Issuance of general obligation
refunding bonds (note 6) - 5,190,000 - - 5,190,000 Premiums on general obligation bonds issued (note 6) - 455,798 9,022,407 - 9,478,205 Premiums on general obligation
refunding bonds issued (note 6) - 760,824 - - 760,824 Payment to refunded bond escrow agent (note 6) - (5,915,421) - - (5,915,421)
Total other financing sources (uses), net (63,315,941) 30,060,593 112,855,952 4,280,662 83,881,266 Net change in fund balance 19,041,484 (3,142,045) 72,779,471 4,875,104 93,554,014 Fund balance - beginning 187,667,789 19,340,334 66,369,594 72,382,587 345,760,304 Fund balance - ending $ 206,709,273 16,198,289 139,149,065 77,257,691 439,314,318 The notes to the financial statements are an integral part of this statement. (Continued)
34
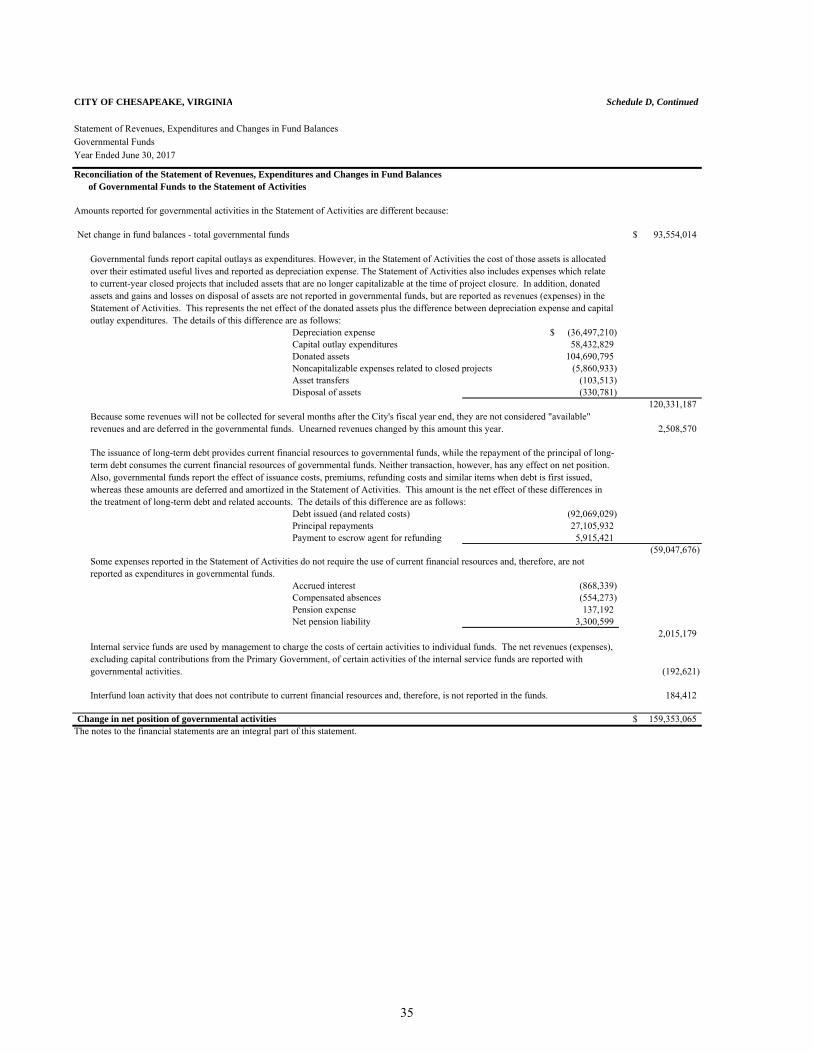
CITY OF CHESAPEAKE, VIRGINIA Schedule D, Continued
Statement of Revenues, Expenditures and Changes in Fund BalancesGovernmental FundsYear Ended June 30, 2017
Amounts reported for governmental activities in the Statement of Activities are different because:
Net change in fund balances - total governmental funds 93,554,014$
Depreciation expense (36,497,210)$ Capital outlay expenditures 66,246,561 58,432,829 Donated assets 104,690,795 Noncapitalizable expenses related to closed projects (5,860,933) Asset transfers (103,513) Disposal of assets (330,781)
120,331,187
2,508,570 - -
Debt issued (and related costs) (92,069,029) Principal repayments 27,105,932 Payment to escrow agent for refunding 5,915,421
(59,047,676)
Accrued interest (7,663,832) (8,506,205) (868,339) Compensated absences (23,016,872) (554,273) Pension expense (173,770,638) 137,192 Net pension liability 3,300,599
2,015,179
(192,621)
Interfund loan activity that does not contribute to current financial resources and, therefore, is not reported in the funds. 184,412
Change in net position of governmental activities 159,353,065$ The notes to the financial statements are an integral part of this statement.
Reconciliation of the Statement of Revenues, Expenditures and Changes in Fund Balances of Governmental Funds to the Statement of Activities
Internal service funds are used by management to charge the costs of certain activities to individual funds. The net revenues (expenses), excluding capital contributions from the Primary Government, of certain activities of the internal service funds are reported with governmental activities.
Because some revenues will not be collected for several months after the City's fiscal year end, they are not considered "available" revenues and are deferred in the governmental funds. Unearned revenues changed by this amount this year.
The issuance of long-term debt provides current financial resources to governmental funds, while the repayment of the principal of long-term debt consumes the current financial resources of governmental funds. Neither transaction, however, has any effect on net position. Also, governmental funds report the effect of issuance costs, premiums, refunding costs and similar items when debt is first issued, whereas these amounts are deferred and amortized in the Statement of Activities. This amount is the net effect of these differences in the treatment of long-term debt and related accounts. The details of this difference are as follows:
Some expenses reported in the Statement of Activities do not require the use of current financial resources and, therefore, are not reported as expenditures in governmental funds.
Governmental funds report capital outlays as expenditures. However, in the Statement of Activities the cost of those assets is allocated over their estimated useful lives and reported as depreciation expense. The Statement of Activities also includes expenses which relate to current-year closed projects that included assets that are no longer capitalizable at the time of project closure. In addition, donated assets and gains and losses on disposal of assets are not reported in governmental funds, but are reported as revenues (expenses) in the Statement of Activities. This represents the net effect of the donated assets plus the difference between depreciation expense and capital outlay expenditures. The details of this difference are as follows:
35

This page intentionally left blank
Proprietary Fund Financial Statements
Major Enterprise Funds:
Public Utilities – To account for the City’s water and sewer operations.
Chesapeake Transportation System – To account for the operations of the Chesapeake Expressway and Dominion Boulevard toll roads.
Stormwater Management – To account for the operation of the City’s stormwater utility and to fund the required improvements to stormwater quality.
Internal Service Funds – Include Information Technology, City Garage, Self-Insurance and Self-Funded Health Funds.
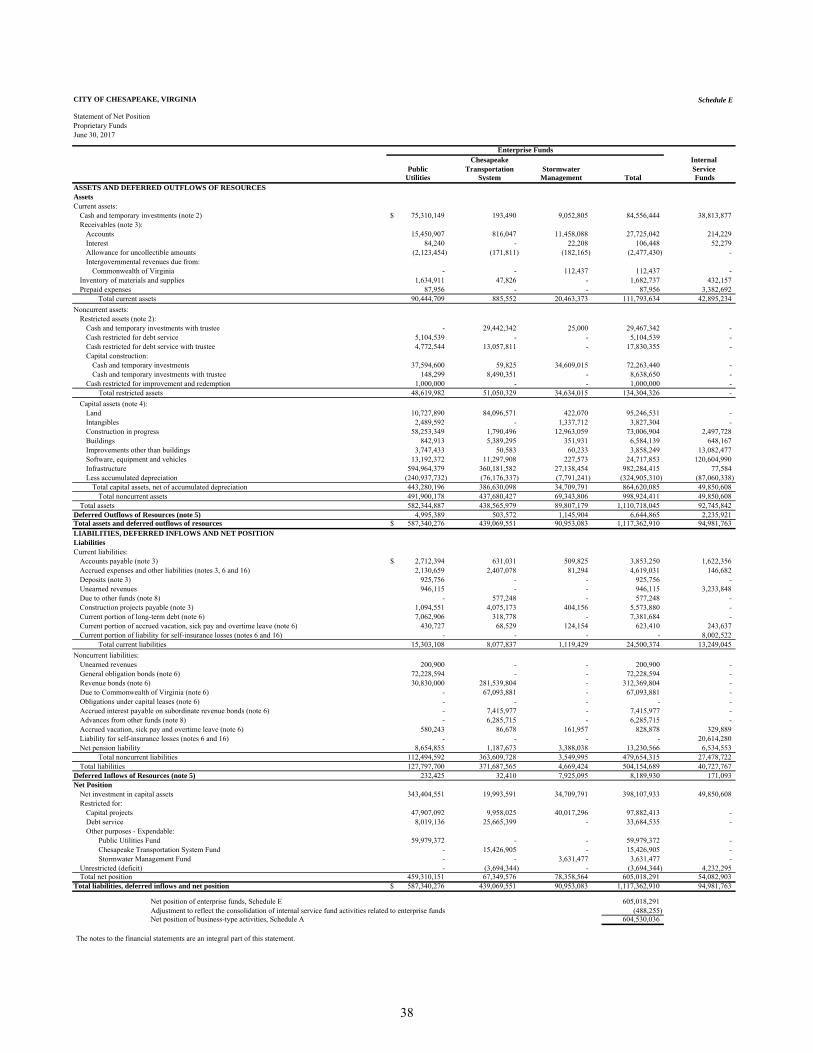
CITY OF CHESAPEAKE, VIRGINIA Schedule E
Statement of Net PositionProprietary FundsJune 30, 2017
Enterprise FundsChesapeake Internal
Public Transportation Stormwater Service Utilities System Management Total Funds
ASSETS AND DEFERRED OUTFLOWS OF RESOURCESAssets Current assets:
Cash and temporary investments (note 2) 75,310,149$ 193,490 9,052,805 84,556,444 38,813,877 Receivables (note 3):
Accounts 15,450,907 816,047 11,458,088 27,725,042 214,229 Interest 84,240 - 22,208 106,448 52,279 Allowance for uncollectible amounts (2,123,454) (171,811) (182,165) (2,477,430) - Intergovernmental revenues due from:
Commonwealth of Virginia - - 112,437 112,437 - Inventory of materials and supplies 1,634,911 47,826 - 1,682,737 432,157 Prepaid expenses 87,956 - - 87,956 3,382,692
Total current assets 90,444,709 885,552 20,463,373 111,793,634 42,895,234 Noncurrent assets:
Restricted assets (note 2):Cash and temporary investments with trustee - 29,442,342 25,000 29,467,342 - Cash restricted for debt service 5,104,539 - - 5,104,539 - Cash restricted for debt service with trustee 4,772,544 13,057,811 - 17,830,355 - Capital construction:
Cash and temporary investments 37,594,600 59,825 34,609,015 72,263,440 - Cash and temporary investments with trustee 148,299 8,490,351 - 8,638,650 -
Cash restricted for improvement and redemption 1,000,000 - - 1,000,000 - Total restricted assets 48,619,982 51,050,329 34,634,015 134,304,326 -
Capital assets (note 4):Land 10,727,890 84,096,571 422,070 95,246,531 - Intangibles 2,489,592 - 1,337,712 3,827,304 - Construction in progress 58,253,349 1,790,496 12,963,059 73,006,904 2,497,728 Buildings 842,913 5,389,295 351,931 6,584,139 648,167 Improvements other than buildings 3,747,433 50,583 60,233 3,858,249 13,082,477 Software, equipment and vehicles 13,192,372 11,297,908 227,573 24,717,853 120,604,990 Infrastructure 594,964,379 360,181,582 27,138,454 982,284,415 77,584 Less accumulated depreciation (240,937,732) (76,176,337) (7,791,241) (324,905,310) (87,060,338)
Total capital assets, net of accumulated depreciation 443,280,196 386,630,098 34,709,791 864,620,085 49,850,608 Total noncurrent assets 491,900,178 437,680,427 69,343,806 998,924,411 49,850,608
Total assets 582,344,887 438,565,979 89,807,179 1,110,718,045 92,745,842 Deferred Outflows of Resources (note 5) 4,995,389 503,572 1,145,904 6,644,865 2,235,921 Total assets and deferred outflows of resources 587,340,276$ 439,069,551 90,953,083 1,117,362,910 94,981,763 LIABILITIES, DEFERRED INFLOWS AND NET POSITIONLiabilities Current liabilities:
Accounts payable (note 3) 2,712,394$ 631,031 509,825 3,853,250 1,622,356 Accrued expenses and other liabilities (notes 3, 6 and 16) 2,130,659 2,407,078 81,294 4,619,031 146,682 Deposits (note 3) 925,756 - - 925,756 - Unearned revenues 946,115 - - 946,115 3,233,848 Due to other funds (note 8) - 577,248 - 577,248 - Construction projects payable (note 3) 1,094,551 4,075,173 404,156 5,573,880 - Current portion of long-term debt (note 6) 7,062,906 318,778 - 7,381,684 - Current portion of accrued vacation, sick pay and overtime leave (note 6) 430,727 68,529 124,154 623,410 243,637 Current portion of liability for self-insurance losses (notes 6 and 16) - - - - 8,002,522
Total current liabilities 15,303,108 8,077,837 1,119,429 24,500,374 13,249,045 Noncurrent liabilities:
Unearned revenues 200,900 - - 200,900 - General obligation bonds (note 6) 72,228,594 - - 72,228,594 - Revenue bonds (note 6) 30,830,000 281,539,804 - 312,369,804 - Due to Commonwealth of Virginia (note 6) - 67,093,881 - 67,093,881 - Obligations under capital leases (note 6) - - - - - Accrued interest payable on subordinate revenue bonds (note 6) - 7,415,977 - 7,415,977 - Advances from other funds (note 8) - 6,285,715 - 6,285,715 - Accrued vacation, sick pay and overtime leave (note 6) 580,243 86,678 161,957 828,878 329,889 Liability for self-insurance losses (notes 6 and 16) - - - - 20,614,280 Net pension liability 8,654,855 1,187,673 3,388,038 13,230,566 6,534,553
Total noncurrent liabilities 112,494,592 363,609,728 3,549,995 479,654,315 27,478,722 Total liabilities 127,797,700 371,687,565 4,669,424 504,154,689 40,727,767
Deferred Inflows of Resources (note 5) 232,425 32,410 7,925,095 8,189,930 171,093 Net Position
Net investment in capital assets 343,404,551 19,993,591 34,709,791 398,107,933 49,850,608 Restricted for:
Capital projects 47,907,092 9,958,025 40,017,296 97,882,413 - Debt service 8,019,136 25,665,399 - 33,684,535 - Other purposes - Expendable:
Public Utilities Fund 59,979,372 - - 59,979,372 - Chesapeake Transportation System Fund - 15,426,905 - 15,426,905 - Stormwater Management Fund - - 3,631,477 3,631,477 -
Unrestricted (deficit) - (3,694,344) - (3,694,344) 4,232,295 Total net position 459,310,151 67,349,576 78,358,564 605,018,291 54,082,903
Total liabilities, deferred inflows and net position 587,340,276$ 439,069,551 90,953,083 1,117,362,910 94,981,763
Net position of enterprise funds, Schedule E 605,018,291 Adjustment to reflect the consolidation of internal service fund activities related to enterprise funds (488,255) Net position of business-type activities, Schedule A 604,530,036
The notes to the financial statements are an integral part of this statement.
38
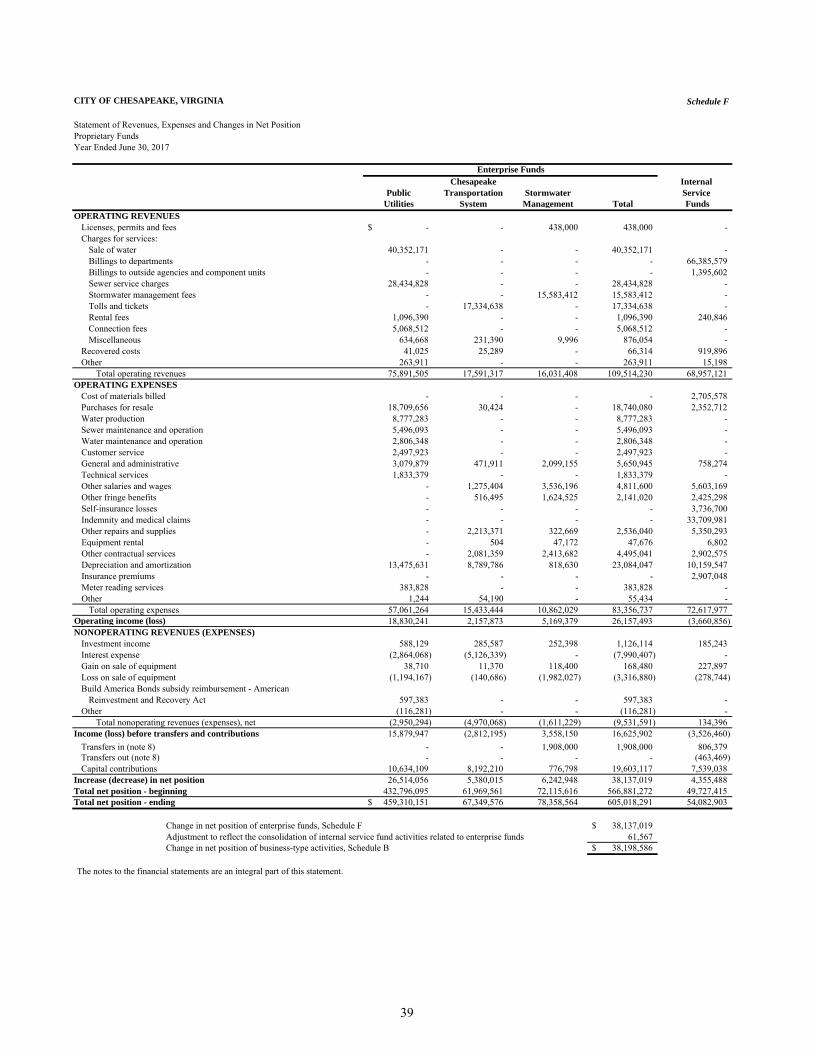
CITY OF CHESAPEAKE, VIRGINIA Schedule F
Statement of Revenues, Expenses and Changes in Net PositionProprietary FundsYear Ended June 30, 2017
Enterprise FundsChesapeake Internal
Public Transportation Stormwater Service Utilities System Management Total Funds
OPERATING REVENUESLicenses, permits and fees -$ - 438,000 438,000 - Charges for services:
Sale of water 40,352,171 - - 40,352,171 - Billings to departments - - - - 66,385,579 Billings to outside agencies and component units - - - - 1,395,602 Sewer service charges 28,434,828 - - 28,434,828 - Stormwater management fees - - 15,583,412 15,583,412 - Tolls and tickets - 17,334,638 - 17,334,638 - Rental fees 1,096,390 - - 1,096,390 240,846 Connection fees 5,068,512 - - 5,068,512 - Miscellaneous 634,668 231,390 9,996 876,054 -
Recovered costs 41,025 25,289 - 66,314 919,896 Other 263,911 - - 263,911 15,198
Total operating revenues 75,891,505 17,591,317 16,031,408 109,514,230 68,957,121 OPERATING EXPENSES
Cost of materials billed - - - - 2,705,578 Purchases for resale 18,709,656 30,424 - 18,740,080 2,352,712 Water production 8,777,283 - - 8,777,283 - Sewer maintenance and operation 5,496,093 - - 5,496,093 - Water maintenance and operation 2,806,348 - - 2,806,348 - Customer service 2,497,923 - - 2,497,923 - General and administrative 3,079,879 471,911 2,099,155 5,650,945 758,274 Technical services 1,833,379 - - 1,833,379 - Other salaries and wages - 1,275,404 3,536,196 4,811,600 5,603,169 Other fringe benefits - 516,495 1,624,525 2,141,020 2,425,298 Self-insurance losses - - - - 3,736,700 Indemnity and medical claims - - - - 33,709,981 Other repairs and supplies - 2,213,371 322,669 2,536,040 5,350,293 Equipment rental - 504 47,172 47,676 6,802 Other contractual services - 2,081,359 2,413,682 4,495,041 2,902,575 Depreciation and amortization 13,475,631 8,789,786 818,630 23,084,047 10,159,547 Insurance premiums - - - - 2,907,048 Meter reading services 383,828 - - 383,828 - Other 1,244 54,190 - 55,434 -
Total operating expenses 57,061,264 15,433,444 10,862,029 83,356,737 72,617,977 Operating income (loss) 18,830,241 2,157,873 5,169,379 26,157,493 (3,660,856) NONOPERATING REVENUES (EXPENSES)
Investment income 588,129 285,587 252,398 1,126,114 185,243 Interest expense (2,864,068) (5,126,339) - (7,990,407) - Gain on sale of equipment 38,710 11,370 118,400 168,480 227,897 Loss on sale of equipment (1,194,167) (140,686) (1,982,027) (3,316,880) (278,744) Build America Bonds subsidy reimbursement - American
Reinvestment and Recovery Act 597,383 - - 597,383 - Other (116,281) - - (116,281) -
Total nonoperating revenues (expenses), net (2,950,294) (4,970,068) (1,611,229) (9,531,591) 134,396 Income (loss) before transfers and contributions 15,879,947 (2,812,195) 3,558,150 16,625,902 (3,526,460)
Transfers in (note 8) - - 1,908,000 1,908,000 806,379 Transfers out (note 8) - - - - (463,469) Capital contributions 10,634,109 8,192,210 776,798 19,603,117 7,539,038
Increase (decrease) in net position 26,514,056 5,380,015 6,242,948 38,137,019 4,355,488 Total net position - beginning 432,796,095 61,969,561 72,115,616 566,881,272 49,727,415 Total net position - ending 459,310,151$ 67,349,576 78,358,564 605,018,291 54,082,903
Change in net position of enterprise funds, Schedule F 38,137,019$ Adjustment to reflect the consolidation of internal service fund activities related to enterprise funds 61,567 Change in net position of business-type activities, Schedule B 38,198,586$
The notes to the financial statements are an integral part of this statement.
39
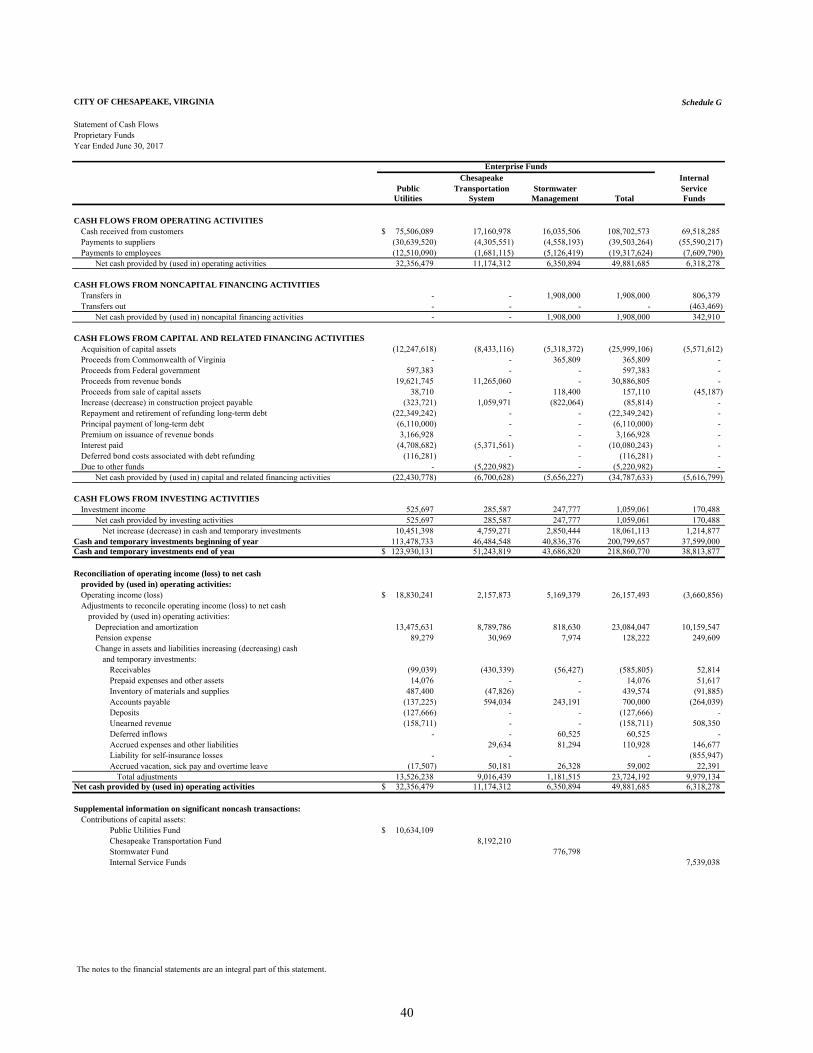
CITY OF CHESAPEAKE, VIRGINIA Schedule G
Statement of Cash FlowsProprietary FundsYear Ended June 30, 2017
Chesapeake InternalPublic Transportation Stormwater Service
Utilities System Management Total Funds
CASH FLOWS FROM OPERATING ACTIVITIES Cash received from customers 75,506,089$ 17,160,978 16,035,506 108,702,573 69,518,285 Payments to suppliers (30,639,520) (4,305,551) (4,558,193) (39,503,264) (55,590,217) Payments to employees (12,510,090) (1,681,115) (5,126,419) (19,317,624) (7,609,790)
Net cash provided by (used in) operating activities 32,356,479 11,174,312 6,350,894 49,881,685 6,318,278
CASH FLOWS FROM NONCAPITAL FINANCING ACTIVITIESTransfers in - - 1,908,000 1,908,000 806,379 Transfers out - - - - (463,469)
Net cash provided by (used in) noncapital financing activities - - 1,908,000 1,908,000 342,910
CASH FLOWS FROM CAPITAL AND RELATED FINANCING ACTIVITIESAcquisition of capital assets (12,247,618) (8,433,116) (5,318,372) (25,999,106) (5,571,612) Proceeds from Commonwealth of Virginia - - 365,809 365,809 - Proceeds from Federal government 597,383 - - 597,383 - Proceeds from revenue bonds 19,621,745 11,265,060 - 30,886,805 - Proceeds from sale of capital assets 38,710 - 118,400 157,110 (45,187) Increase (decrease) in construction project payable (323,721) 1,059,971 (822,064) (85,814) - Repayment and retirement of refunding long-term debt (22,349,242) - - (22,349,242) - Principal payment of long-term debt (6,110,000) - - (6,110,000) - Premium on issuance of revenue bonds 3,166,928 - - 3,166,928 - Interest paid (4,708,682) (5,371,561) - (10,080,243) - Deferred bond costs associated with debt refunding (116,281) - - (116,281) - Due to other funds - (5,220,982) - (5,220,982) -
Net cash provided by (used in) capital and related financing activities (22,430,778) (6,700,628) (5,656,227) (34,787,633) (5,616,799)
CASH FLOWS FROM INVESTING ACTIVITIESInvestment income 525,697 285,587 247,777 1,059,061 170,488
Net cash provided by investing activities 525,697 285,587 247,777 1,059,061 170,488 Net increase (decrease) in cash and temporary investments 10,451,398 4,759,271 2,850,444 18,061,113 1,214,877
Cash and temporary investments beginning of year 113,478,733 46,484,548 40,836,376 200,799,657 37,599,000 Cash and temporary investments end of year 123,930,131$ 51,243,819 43,686,820 218,860,770 38,813,877
Reconciliation of operating income (loss) to net cashprovided by (used in) operating activities:Operating income (loss) 18,830,241$ 2,157,873 5,169,379 26,157,493 (3,660,856) Adjustments to reconcile operating income (loss) to net cash
provided by (used in) operating activities:Depreciation and amortization 13,475,631 8,789,786 818,630 23,084,047 10,159,547 Pension expense 89,279 30,969 7,974 128,222 249,609 Change in assets and liabilities increasing (decreasing) cash
and temporary investments:Receivables (99,039) (430,339) (56,427) (585,805) 52,814 Prepaid expenses and other assets 14,076 - - 14,076 51,617 Inventory of materials and supplies 487,400 (47,826) - 439,574 (91,885) Accounts payable (137,225) 594,034 243,191 700,000 (264,039) Deposits (127,666) - - (127,666) - Unearned revenue (158,711) - - (158,711) 508,350 Deferred inflows - - 60,525 60,525 - Accrued expenses and other liabilities 29,634 81,294 110,928 146,677 Liability for self-insurance losses - - - (855,947) Accrued vacation, sick pay and overtime leave (17,507) 50,181 26,328 59,002 22,391
Total adjustments 13,526,238 9,016,439 1,181,515 23,724,192 9,979,134 Net cash provided by (used in) operating activities 32,356,479$ 11,174,312 6,350,894 49,881,685 6,318,278
Supplemental information on significant noncash transactions:Contributions of capital assets:
Public Utilities Fund 10,634,109$ Chesapeake Transportation Fund 8,192,210 Stormwater Fund 776,798 Internal Service Funds 7,539,038
The notes to the financial statements are an integral part of this statement.
Enterprise Funds
40
Fiduciary Fund Financial Statements
Agency Fund – Includes Special Welfare Fund. Trust Fund – Includes Other Postemployment Benefits Fund.
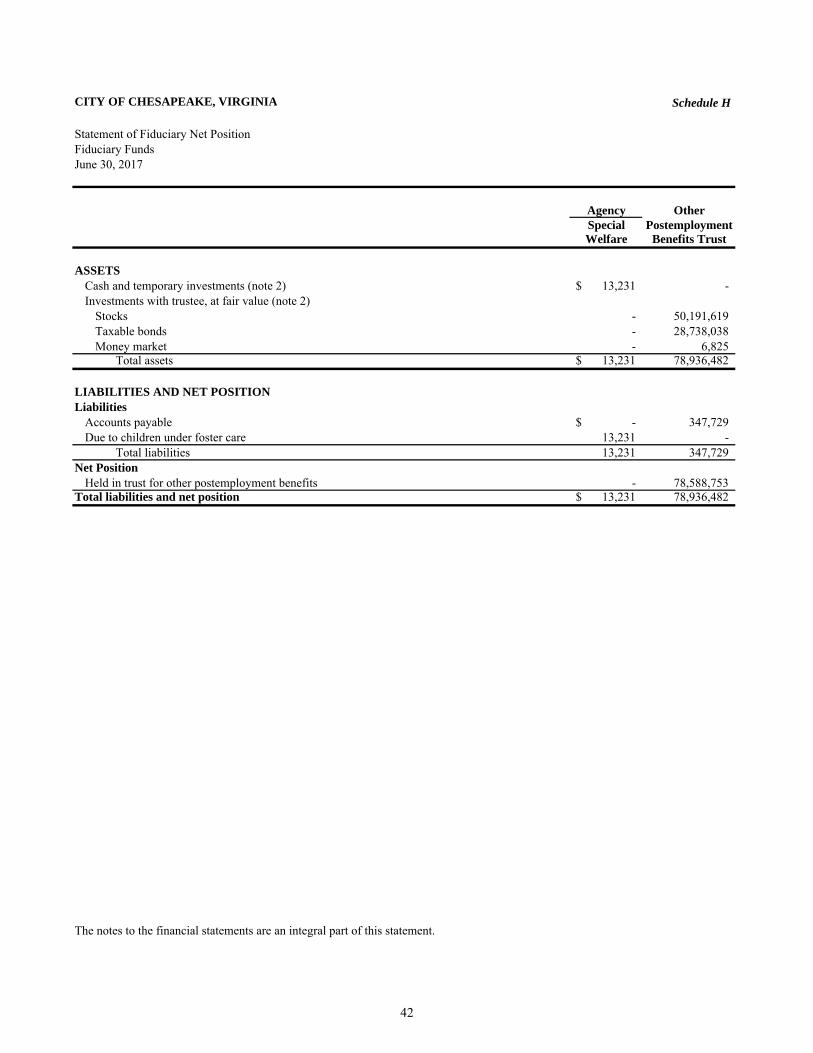
CITY OF CHESAPEAKE, VIRGINIA Schedule H
Statement of Fiduciary Net PositionFiduciary FundsJune 30, 2017
Agency OtherSpecial PostemploymentWelfare Benefits Trust
ASSETSCash and temporary investments (note 2) 13,231$ - Investments with trustee, at fair value (note 2)
Stocks - 50,191,619 Taxable bonds - 28,738,038 Money market - 6,825
Total assets 13,231$ 78,936,482
LIABILITIES AND NET POSITIONLiabilities
Accounts payable -$ 347,729 Due to children under foster care 13,231 -
Total liabilities 13,231 347,729 Net Position
Held in trust for other postemployment benefits - 78,588,753 Total liabilities and net position 13,231$ 78,936,482
The notes to the financial statements are an integral part of this statement.
42
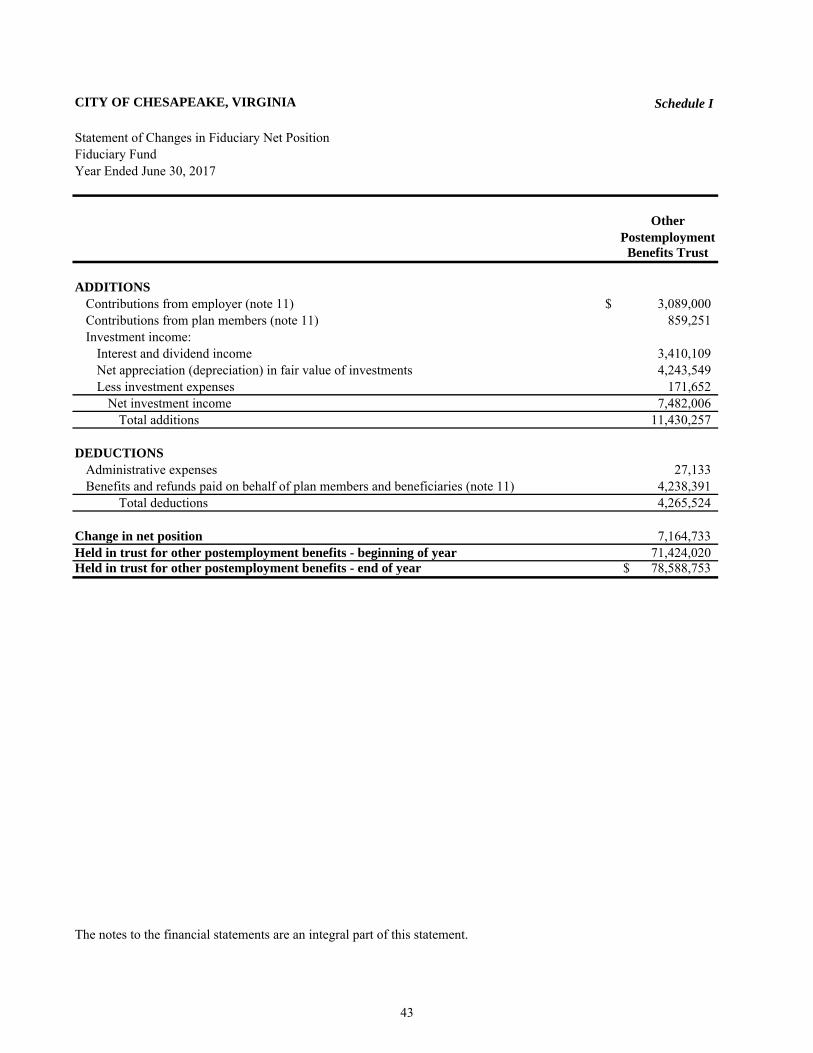
CITY OF CHESAPEAKE, VIRGINIA Schedule I
Statement of Changes in Fiduciary Net PositionFiduciary FundYear Ended June 30, 2017
OtherPostemployment
Benefits Trust
ADDITIONSContributions from employer (note 11) $ 3,089,000 Contributions from plan members (note 11) 859,251 Investment income:
Interest and dividend income 3,410,109 Net appreciation (depreciation) in fair value of investments 4,243,549 Less investment expenses 171,652
Net investment income 7,482,006 Total additions 11,430,257
DEDUCTIONSAdministrative expenses 27,133 Benefits and refunds paid on behalf of plan members and beneficiaries (note 11) 4,238,391
Total deductions 4,265,524
Change in net position 7,164,733 Held in trust for other postemployment benefits - beginning of year 71,424,020 Held in trust for other postemployment benefits - end of year 78,588,753$
The notes to the financial statements are an integral part of this statement.
43

This page intentionally left blank
Other Discretely Presented Component Units
Chesapeake Mosquito Control Commission – To account for the operation of the City’s Mosquito Control Commission.
Economic Development Authority (EDA) – To account for the operation of the EDA, which is responsible for promoting industry and developing trade.
Chesapeake Port Authority – To account for the operation of the City’s Port Authority. Chesapeake Airport Authority – To account for the operation of the Chesapeake Airport and its ancillary activities. Elizabeth River Properties of Chesapeake, Inc. (ERPC) – To account for the operation of ERPC which assists the City's Community Services Department with residential services.
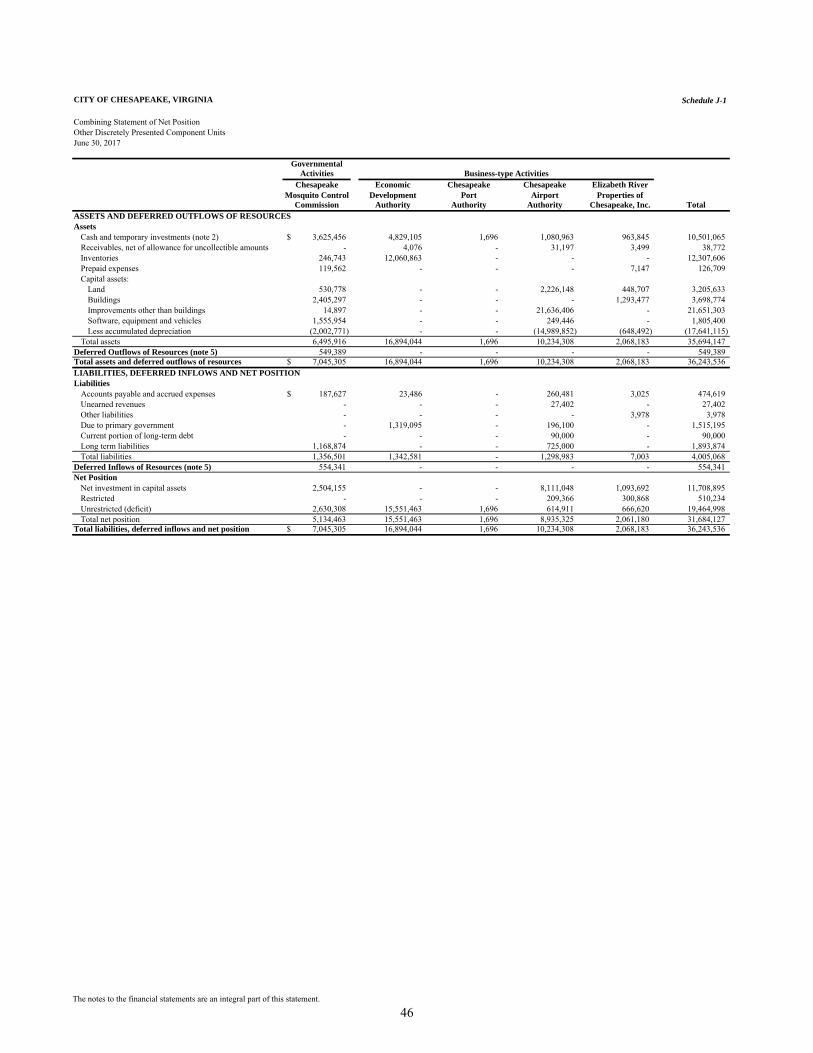
CITY OF CHESAPEAKE, VIRGINIA Schedule J-1
Combining Statement of Net PositionOther Discretely Presented Component UnitsJune 30, 2017
GovernmentalActivities
Chesapeake Economic Chesapeake Chesapeake Elizabeth RiverMosquito Control Development Port Airport Properties of
Commission Authority Authority Authority Chesapeake, Inc. TotalASSETS AND DEFERRED OUTFLOWS OF RESOURCESAssets
Cash and temporary investments (note 2) 3,625,456$ 4,829,105 1,696 1,080,963 963,845 10,501,065 Receivables, net of allowance for uncollectible amounts - 4,076 - 31,197 3,499 38,772 Inventories 246,743 12,060,863 - - - 12,307,606 Prepaid expenses 119,562 - - - 7,147 126,709 Capital assets:
Land 530,778 - - 2,226,148 448,707 3,205,633 Buildings 2,405,297 - - - 1,293,477 3,698,774 Improvements other than buildings 14,897 - - 21,636,406 - 21,651,303 Software, equipment and vehicles 1,555,954 - - 249,446 - 1,805,400 Less accumulated depreciation (2,002,771) - - (14,989,852) (648,492) (17,641,115)
Total assets 6,495,916 16,894,044 1,696 10,234,308 2,068,183 35,694,147 Deferred Outflows of Resources (note 5) 549,389 - - - - 549,389 Total assets and deferred outflows of resources 7,045,305$ 16,894,044 1,696 10,234,308 2,068,183 36,243,536 LIABILITIES, DEFERRED INFLOWS AND NET POSITIONLiabilities
Accounts payable and accrued expenses 187,627$ 23,486 - 260,481 3,025 474,619 Unearned revenues - - - 27,402 - 27,402 Other liabilities - - - - 3,978 3,978 Due to primary government - 1,319,095 - 196,100 - 1,515,195 Current portion of long-term debt - - - 90,000 - 90,000 Long term liabilities 1,168,874 - - 725,000 - 1,893,874 Total liabilities 1,356,501 1,342,581 - 1,298,983 7,003 4,005,068
Deferred Inflows of Resources (note 5) 554,341 - - - - 554,341 Net Position
Net investment in capital assets 2,504,155 - - 8,111,048 1,093,692 11,708,895 Restricted - - - 209,366 300,868 510,234 Unrestricted (deficit) 2,630,308 15,551,463 1,696 614,911 666,620 19,464,998 Total net position 5,134,463 15,551,463 1,696 8,935,325 2,061,180 31,684,127
Total liabilities, deferred inflows and net position 7,045,305$ 16,894,044 1,696 10,234,308 2,068,183 36,243,536
Business-type Activities
The notes to the financial statements are an integral part of this statement.
46
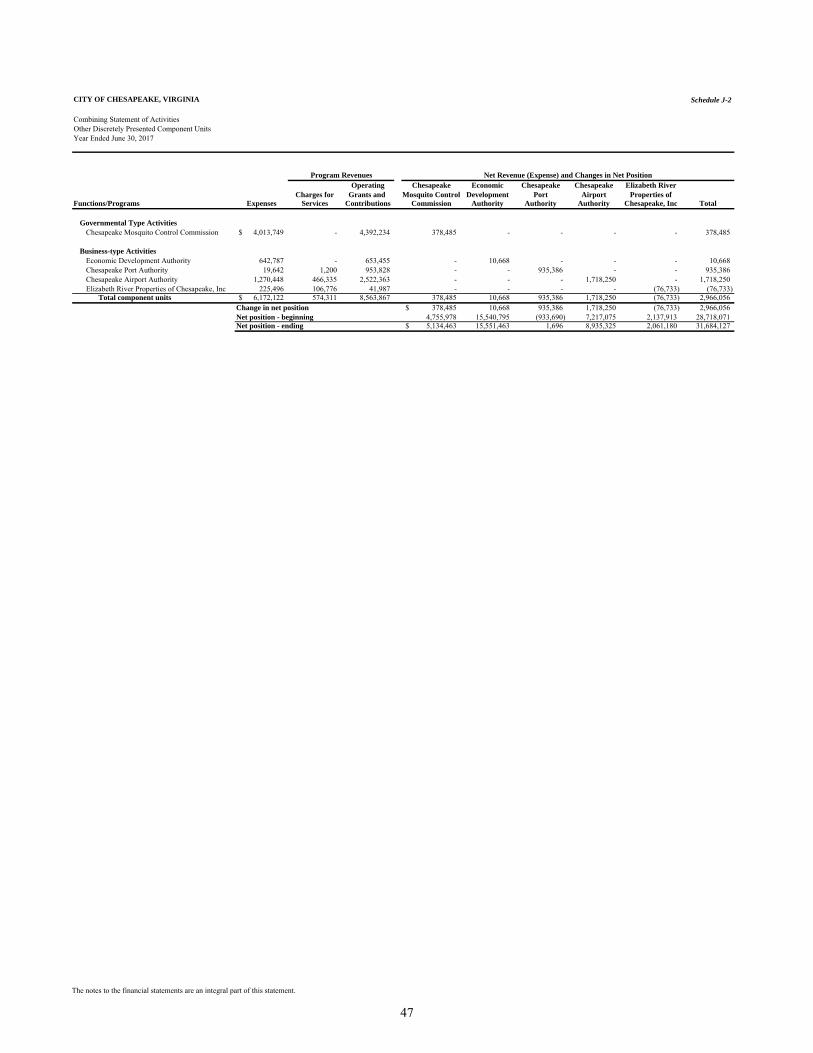
CITY OF CHESAPEAKE, VIRGINIA Schedule J-2
Combining Statement of Activities
Year Ended June 30, 2017
Operating Chesapeake Economic Chesapeake Chesapeake Elizabeth RiverCharges for Grants and Mosquito Control Development Port Airport Properties of
Functions/Programs Expenses Services Contributions Commission Authority Authority Authority Chesapeake, Inc Total
Governmental Type ActivitiesChesapeake Mosquito Control Commission 4,013,749$ - 4,392,234 378,485 - - - - 378,485
Business-type ActivitiesEconomic Development Authority 642,787 - 653,455 - 10,668 - - - 10,668 Chesapeake Port Authority 19,642 1,200 953,828 - - 935,386 - - 935,386 Chesapeake Airport Authority 1,270,448 466,335 2,522,363 - - - 1,718,250 - 1,718,250 Elizabeth River Properties of Chesapeake, Inc 225,496 106,776 41,987 - - - - (76,733) (76,733)
Total component units 6,172,122$ 574,311 8,563,867 378,485 10,668 935,386 1,718,250 (76,733) 2,966,056 Change in net position 378,485$ 10,668 935,386 1,718,250 (76,733) 2,966,056 Net position - beginning 4,755,978 15,540,795 (933,690) 7,217,075 2,137,913 28,718,071 Net position - ending 5,134,463$ 15,551,463 1,696 8,935,325 2,061,180 31,684,127
Program Revenues Net Revenue (Expense) and Changes in Net Position
Other Discretely Presented Component Units
The notes to the financial statements are an integral part of this statement.
47

This page intentionally left blank
Notes to Basic Financial Statements
CITY OF CHESAPEAKE, VIRGINIA Schedule K, Continued Notes to Basic Financial Statements June 30, 2017
(1) Summary of Significant Accounting Policies
The Reporting Entity The City of Chesapeake, Virginia (the City) was formed on January 1, 1963, under the provision of Chapter 211 of the Acts of Assembly of 1962, by the merger of the former City of South Norfolk and the County of Norfolk. The City is comprised of six boroughs; one borough representing the former City of South Norfolk and five boroughs representing the five magisterial districts of the former County of Norfolk. The City’s reporting entity consists of the Primary Government, as well as its component units, which are legally separate organizations for which the elected officials of the Primary Government are financially accountable. Financial accountability is defined as appointment of a voting majority of the component unit’s board and either (a) the ability to impose will by the Primary Government or (b) the possibility that the component unit will provide a financial benefit or impose a financial burden on the Primary Government. The accompanying financial statements present the City (the Primary Government) and its component units. The financial data of the component units are included in the City’s reporting entity because of the significance of their operational or financial relationships with the City. All of the City’s component units are discretely presented except the CSB of Chesapeake, Inc. (CSBC, Inc.) which is blended with the City’s governmental activities and the City of Chesapeake Other Postemployment Benefits Trust Fund (OPEB Trust Fund), which is a fiduciary-type component unit. Discretely presented component units are entities that are legally separate from the City, but for which the City is financially accountable or whose relationships with the City are such that exclusion would cause the City’s financial statements to be misleading. These component units are reported in separate columns to emphasize that they are legally separate from the City. All of the City’s component units have a fiscal year end of June 30. The following component units are discretely presented in the City’s financial statements: The Chesapeake Public Schools (the Schools) are responsible for elementary and secondary education
within the City. All nine members of the School Board are elected. The City Council approves the annual budget of the Schools, levies the necessary taxes to finance the Schools’ operations and approves the borrowing of money and the issuance of bonds. Separate audited financial statements are available from the Chesapeake Public Schools at 312 Cedar Road, Chesapeake, Virginia 23322.
The Economic Development Authority of the City of Chesapeake (the EDA) was established under
the Industrial Development and Revenue Bond Act, Code of Virginia. The EDA is responsible for promoting industry and developing trade by inducing manufacturing, industrial and commercial enterprises to locate or to remain in the City. The City Council appoints the members of the Board of the EDA. The EDA issued lease revenue bonds for two major construction projects for which the City is the lessor. The City also appropriates funds annually to pay the administrative expenses of the EDA. Separate audited financial statements for the EDA are available through the City’s Department of Economic Development at 676 Independence Parkway, Suite 200, Chesapeake, Virginia 23320.
50
CITY OF CHESAPEAKE, VIRGINIA Schedule K, Continued Notes to Basic Financial Statements June 30, 2017
(1) Continued The Chesapeake Airport Authority (the Airport Authority) was established by action of the General
Assembly to operate the Chesapeake Airport and its ancillary operations. The City Council appoints the members of the Board of the Airport Authority, appropriates funds annually to pay administrative expenses of the Authority and funds operating deficits as necessary. The City has also provided the Airport Authority with a loan which is still outstanding. In addition, the Airport Authority issued revenue bonds for which the City has a non-binding obligation to appropriate sufficient funds if a deficit exists in the debt service reserve account for these bonds. Separate audited financial statements are available from the Chesapeake Airport Authority at 1777 West Road, Chesapeake, Virginia 23323.
The Chesapeake Port Authority (the Port Authority) was established by action of the General
Assembly to promote trade and commerce in the City and the Commonwealth and to develop adequate, modern and efficient seaports and harbors. The City Council appoints the members of the Board of the Port Authority and appropriates funds annually to pay administrative expenses of the Port Authority. The Port Authority does not issue separate audited financial statements. On May 23, 2017, the City Council approved an ordinance dissolving the Port Authority and transferring all rights, powers, privileges, assets and/or obligations to the Economic Development Authority of the City of Chesapeake effective July 1, 2017.
The Chesapeake Mosquito Control Commission (the Commission) manages the City’s insecticide
program. The Commission has seven appointed commissioners. The City finances the operations of the Commission through incremental property taxes of $.01 per $100 of assessed value for real estate properties and $.08 per $100 of assessed value for personal property. Although it is legally separate, the Commission is fiscally dependent on the City. The Commission does not issue separate audited financial statements.
Elizabeth River Properties of Chesapeake, Inc. (ERPC) is a not-for-profit corporation organized under
Section 501 (c)(3) of the Internal Revenue Code. ERPC provides housing for individuals served by Chesapeake Integrated Behavioral Healthcare (CIBH). The Board of Directors of CSBC, Inc., whose members are appointed by City Council, appoints the members of the Board of ERPC and appropriates funds annually to provide rental assistance to individuals served by CIBH. The CSBC, Inc. Board has also transferred funds to ERPC to be used for the purchase of additional residences for its use. Separate audited financial statements are available through the CIBH at 224 Great Bridge Boulevard, Chesapeake, Virginia 23320.
Blended component units are entities that are legally separate from the City, but which provide services entirely, or almost entirely, to the City or otherwise exclusively benefit the City. Activities of blended component units are considered to be so intertwined with the City’s that they are, in substance, part of the City’s operations. CSBC, Inc. is considered to be a blended component unit in the City’s financial statements. CSBC, Inc. was organized for the purpose of owning and financing a building to be used as a community services building by the City. CSBC, Inc. issued lease revenue bonds backed by the City’s general obligation pledge. The holding bank had the option to require prepayment in 2014 so, as a result, the City issued general obligation bonds prior to that time to retire the remainder of the original bonds. The City Council appoints the members of the Board of Directors and appropriates funds annually to pay rent on the building which CSBC, Inc. then uses to pay debt service on the bonds. No distinction is made between the activities of CSBC, Inc. and the City. As a result, CSBC, Inc. is reported as a special revenue fund in the City’s financial statements. It does not issue separate audited financial statements.
51
CITY OF CHESAPEAKE, VIRGINIA Schedule K, Continued Notes to Basic Financial Statements June 30, 2017
(1) Continued
Fiduciary-type component units are entities that are legally separate from the City, but are included within the fiduciary fund financial statements, where no distinction is made between component units and fiduciary funds of the City. The OPEB Trust Fund is a fiduciary-type component unit of the City established for the purpose of accumulating and investing assets to fund other postemployment benefits obligations. The City Council appoints the members of the OPEB Trust Fund Finance Board and appropriates funds annually to pay current retiree health insurance premiums and prefund future benefits. The OPEB Trust Fund is included as a fiduciary fund in the City’s financial statements. Government-wide and Fund Financial Statements
The government-wide financial statements report information on all of the nonfiduciary activities of the
Primary Government and its component units. For the most part, the effect of interfund activity has been removed from these statements. Governmental activities, which normally are supported by taxes and intergovernmental revenues, are reported separately from business-type activities, which rely to a significant extent on fees and charges for services. Likewise, the Primary Government is reported separately from certain legally separate discretely presented component units for which the Primary Government is financially accountable.
Separate government-wide financial statements are also provided for the Chesapeake Public Schools and
other discretely presented component units which are aggregated in the government-wide financial statements.
The Statement of Activities demonstrates the degree to which the direct expenses of a given function or
activity is offset by program revenues. Direct expenses are those that are clearly identifiable with a specific function. Included in direct expenses are certain indirect costs that have been allocated to the various programs. Program revenues include 1) charges to customers or applicants who purchase, use or directly benefit from goods, services or privileges provided by a given function and 2) grants and contributions that are restricted to meeting the operational or capital requirements of a particular function. Taxes and other items not properly included among program revenues are reported as general revenues.
Separate fund financial statements are provided for governmental funds, proprietary funds and fiduciary
funds, even though the latter is excluded from the government-wide financial statements. Major individual governmental funds and major individual enterprise funds are reported as separate columns in the fund financial statements.
Measurement Focus, Basis of Accounting and Financial Statement Presentation The government-wide and proprietary fund financial statements are reported using the economic resources
measurement focus and the accrual basis of accounting. Revenues are recorded when earned and expenses are recorded when a liability is incurred, regardless of the timing of related cash flows. Property taxes are recognized as revenues in the year for which they are levied. Grants and similar items are recognized as revenue as soon as all eligibility requirements imposed by the provider have been met. The fiduciary fund financial statements are custodial in nature, do not involve the measurement of results of operations and use the accrual basis of accounting.
52
CITY OF CHESAPEAKE, VIRGINIA Schedule K, Continued Notes to Basic Financial Statements June 30, 2017
(1) Continued Governmental fund financial statements are reported using the current financial resources measurement focus
and the modified accrual basis of accounting. Revenues are recognized when they are susceptible to accrual (i.e. both measurable and available). Revenues are considered to be available when they are collectible within the current period or soon enough thereafter to pay liabilities of the current period, usually within 45 days after year end. Expenditures, other than interest on long-term debt which is recorded when due, are recorded when the related fund liability is incurred.
In applying the susceptible to accrual concept to intergovernmental revenues, the legal and contractual requirements of the numerous individual programs are used as guidance. There are, however, essentially two types of these revenues. In one, monies must be expended on the specific purpose or project before any amounts will be paid to the City; therefore, revenues are recognized based upon the expenditures recorded. In the other, monies are virtually unrestricted as to purpose of expenditure and are usually revocable only for failure to comply with prescribed compliance requirements. These resources are reflected as revenues at the time of receipt or earlier if the accrual criteria are met. In the fund financial statements, real and personal property taxes are recorded as revenues and receivables when levied and billed, net of allowances for uncollectible amounts. Property tax receivables not collected within 45 days after year end are reflected as deferred inflows of resources. Sales and utility taxes, which are collected by the Commonwealth of Virginia or utility companies by year end and subsequently remitted to the City, are recognized as revenues and receivables upon collection by the Commonwealth of Virginia or utility company, which is generally in the month preceding receipt by the City. Licenses and permits, fines and forfeitures, charges for services and miscellaneous revenues (except interest on temporary investments) are recorded as revenues when received in cash because they are generally not measurable until actually received.
The City reports the following major governmental funds:
The General Fund is the City’s primary operating fund. It is used to account for all financial resources except those required to be accounted for in another fund. The Debt Service Fund accounts for the accumulation of resources for the payment of principal, interest and related costs on long-term debt of governmental funds. The Capital Projects Fund is used to account for financial resources to be used for the acquisition or construction of most major capital facilities other than those financed by proprietary funds.
53
CITY OF CHESAPEAKE, VIRGINIA Schedule K, Continued Notes to Basic Financial Statements June 30, 2017
(1) Continued The City reports the following proprietary funds:
The Public Utilities Fund accounts for the operation of the City’s water and sewer departments. The Chesapeake Transportation System Fund accounts for the operation of the Chesapeake Expressway and Dominion Boulevard Veterans Bridge toll roads and related construction projects. The Stormwater Management Fund accounts for the operation of the City’s stormwater utility and to fund the required improvements to stormwater quality. The Internal Service Funds account for central computer and information technology services, central fleet management services for City-owned vehicles and the services of the City’s self-insurance programs provided to other departments, agencies or component units of the City on a cost-reimbursement basis. Operations of the proprietary funds are designed to be primarily self-supporting through user charges. These funds service their own debt and construction projects and record the acquisition of their depreciable assets and land.
Additionally, the City reports the following fund types:
Nonmajor governmental funds:
Special Revenue Funds account for revenues and expenditures related to programs that are restricted in nature for specific purposes. Examples include providing services to mental health, mental retardation and substance abuse programs, juvenile detention services, emergency call center services, activities of the Community Development Block Grant Program, individual grant programs, tax increment financing districts, accounting for cash proffers provided by developers for specific purposes and rendering economic aid to certain qualifying citizens under several different programs.
Permanent Funds account for the investment of funds donated to the City whose principal must be maintained in perpetuity.
Fiduciary funds:
The Special Welfare Agency Fund accounts for the transfer of funds provided by the Virginia Public Assistance Fund for aid to dependent children. The City acts in an agent capacity for these individual dependent children. The Other Postemployment Benefits (OPEB) Trust Fund accounts for assets accumulated to fund other postemployment benefit obligations of the City. The component unit acts in a trustee capacity for retirees and beneficiaries receiving these benefits.
54
CITY OF CHESAPEAKE, VIRGINIA Schedule K, Continued Notes to Basic Financial Statements June 30, 2017
(1) Continued As a general rule, the effect of interfund activity has been eliminated from the government-wide financial statements. Exceptions to this general rule are payments-in-lieu of taxes and other charges between the City’s public utility function and various other functions of the City. Elimination of these charges would distort the direct costs and program revenues reported for the various functions concerned. Proprietary funds distinguish operating revenues and expenses from nonoperating items. Operating revenues and expenses generally result from providing services and producing and delivering goods in connection with a proprietary fund’s principal ongoing operations. The principal operating revenues of the City’s proprietary funds are charges to customers for sales and services. The Public Utilities Enterprise Fund also recognizes certain rental fees as operating revenue. Operating expenses for proprietary funds include the cost of sales and services, administrative expenses and depreciation on capital assets. All revenues and expenses not meeting this definition are reported as nonoperating revenues and expenses.
Cash and Temporary Investments The City maintains a cash and investment pool that is available for use by all funds. Each fund type’s portion of this pool is displayed on the Statement of Net Position or Balance Sheet as “Cash and temporary investments.” In addition, the City has restricted deposits held by trustees for future retirements of bonds at the appropriate call date and for construction projects. Cash and temporary investments are stated at fair value, which is based on quoted market prices. For U.S. Government securities with maturity dates of less than one year, the investments are valued at amortized cost. Because the City uses the pooled cash investment method, individual fund overdrafts are reclassified as due to/due from other funds or internal balances for financial statement purposes. Income from the investment of pooled cash is allocated to the various funds based on the percentage of cash and temporary investments of each fund to the total pooled cash and temporary investments. For purposes of the Statement of Cash Flows, all highly liquid debt instruments and certificates of deposit, with original maturities of three months or less from the date of purchase, are grouped into cash and temporary investments. The cash and investment pool discussed above is considered cash since it has the same characteristics as a demand deposit account.
Receivables and Payables
Activities between funds that are representative of lending/borrowing arrangements outstanding at the end of the fiscal year are referred to as either “due to/from other funds” or “advances to/from other funds” in the fund statements. All residual balances outstanding between the governmental activities and business-type activities are reported in the government-wide financial statements as “internal balances.”
In the fund statements, long-term interfund advances and advances to component units are recorded as receivables with corresponding nonspendable classification of fund balance by the advancing fund. Provisions for uncollectible advances to component units are based upon the terms of the notes, which are non-interest bearing, unsecured with the City.
55
CITY OF CHESAPEAKE, VIRGINIA Schedule K, Continued Notes to Basic Financial Statements June 30, 2017
(1) Continued Provisions for uncollectible water, sewer, stormwater, Chesapeake Integrated Behavioral Healthcare client fees, emergency medical bills and miscellaneous invoices are based upon a historical analysis of uncollected accounts and are applied as a percentage of delinquent/terminated accounts in the year end accounts receivable balance.
Provision for uncollectible property taxes is based upon a historical percentage of accounts written off applied to the total levies of all years carried in taxes receivable. The two major sources of property taxes are described below as reported in the fund financial statements:
Real Estate Each year as of July 1, the City levies real estate taxes on all real estate within its boundaries, except that exempted by statute. Real estate taxes are levied on the estimated market value of the property and become a lien on real property the first day of the levy year. The City follows the practice of reassessing all property annually.
Real estate taxes are collected in quarterly payments due September 30, December 30, March 30 and June 5. During the fiscal year, the current year real estate taxes reported as revenue are the levies on assessed valuation on July 1, 2016, less an allowance for uncollectible amounts and taxes not collected within 45 days after year end. The tax rate for 2017 was $1.04 per $100 of assessed value with an additional $.01 per $100 of assessed value for mosquito control services. Personal Property The City levies personal property taxes on motor vehicles and tangible personal business property. These levies are made each year as of January 1 with payment due the following June 5. The current year personal property taxes reported as revenue are the levies on assessed valuation at January 1, 2017 less an allowance for uncollectible amounts and taxes not collected within 45 days after year end. The tax rate for 2017 was $4.00 per $100 of assessed value with an additional $.08 per $100 of assessed value for mosquito control services.
Inventories and Prepaids
Inventory consists of expendable materials and supplies held for future consumption and are valued using the weighted average cost method. All inventories of governmental funds and proprietary funds are recorded under the consumption method as expenditures or expenses when consumed, rather than when purchased. Certain payments to vendors reflect costs applicable to future accounting periods and are recorded as prepaid items in both government-wide and fund financial statements.
56
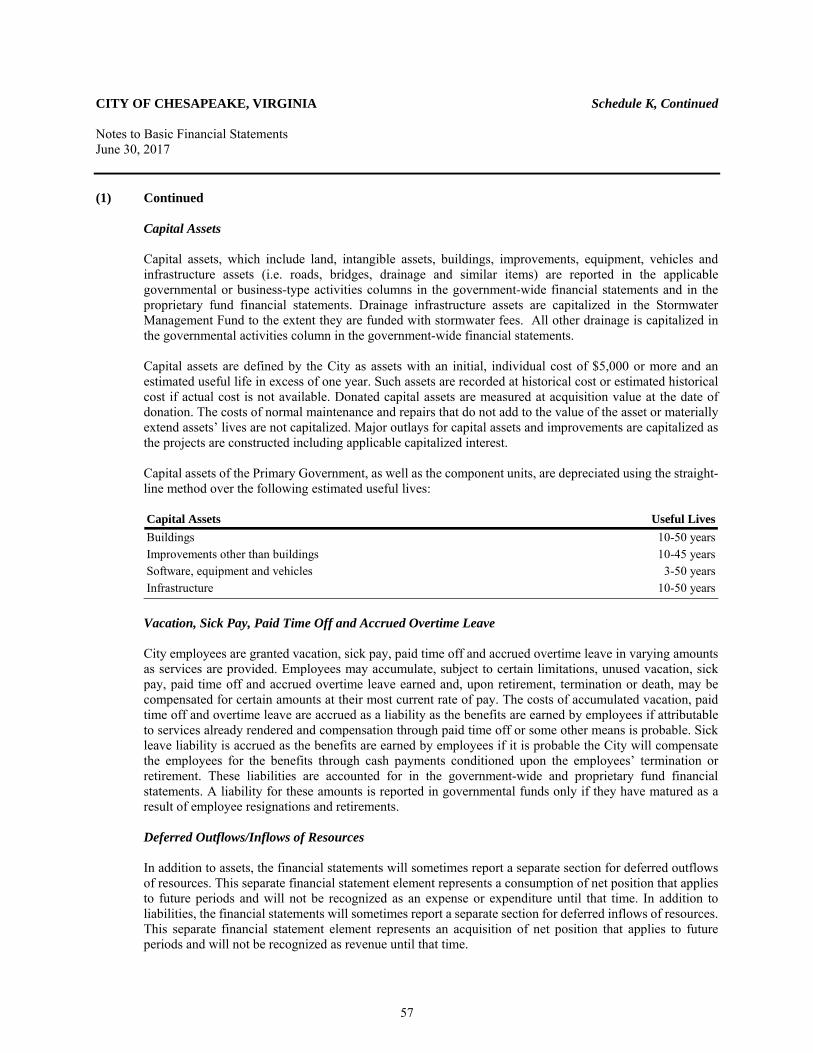
CITY OF CHESAPEAKE, VIRGINIA Schedule K, Continued Notes to Basic Financial Statements June 30, 2017
(1) Continued Capital Assets
Capital assets, which include land, intangible assets, buildings, improvements, equipment, vehicles and infrastructure assets (i.e. roads, bridges, drainage and similar items) are reported in the applicable governmental or business-type activities columns in the government-wide financial statements and in the proprietary fund financial statements. Drainage infrastructure assets are capitalized in the Stormwater Management Fund to the extent they are funded with stormwater fees. All other drainage is capitalized in the governmental activities column in the government-wide financial statements.
Capital assets are defined by the City as assets with an initial, individual cost of $5,000 or more and an estimated useful life in excess of one year. Such assets are recorded at historical cost or estimated historical cost if actual cost is not available. Donated capital assets are measured at acquisition value at the date of donation. The costs of normal maintenance and repairs that do not add to the value of the asset or materially extend assets’ lives are not capitalized. Major outlays for capital assets and improvements are capitalized as the projects are constructed including applicable capitalized interest. Capital assets of the Primary Government, as well as the component units, are depreciated using the straight-line method over the following estimated useful lives: Capital Assets Useful LivesBuildings 10-50 yearsImprovements other than buildings 10-45 yearsSoftware, equipment and vehicles 3-50 yearsInfrastructure 10-50 years Vacation, Sick Pay, Paid Time Off and Accrued Overtime Leave City employees are granted vacation, sick pay, paid time off and accrued overtime leave in varying amounts as services are provided. Employees may accumulate, subject to certain limitations, unused vacation, sick pay, paid time off and accrued overtime leave earned and, upon retirement, termination or death, may be compensated for certain amounts at their most current rate of pay. The costs of accumulated vacation, paid time off and overtime leave are accrued as a liability as the benefits are earned by employees if attributable to services already rendered and compensation through paid time off or some other means is probable. Sick leave liability is accrued as the benefits are earned by employees if it is probable the City will compensate the employees for the benefits through cash payments conditioned upon the employees’ termination or retirement. These liabilities are accounted for in the government-wide and proprietary fund financial statements. A liability for these amounts is reported in governmental funds only if they have matured as a result of employee resignations and retirements. Deferred Outflows/Inflows of Resources In addition to assets, the financial statements will sometimes report a separate section for deferred outflows of resources. This separate financial statement element represents a consumption of net position that applies to future periods and will not be recognized as an expense or expenditure until that time. In addition to liabilities, the financial statements will sometimes report a separate section for deferred inflows of resources. This separate financial statement element represents an acquisition of net position that applies to future periods and will not be recognized as revenue until that time.
57
CITY OF CHESAPEAKE, VIRGINIA Schedule K, Continued Notes to Basic Financial Statements June 30, 2017
(1) Continued Long-term Obligations In the government-wide financial statements and proprietary fund financial statements, long-term debt and other long-term obligations are reported as liabilities in the applicable Statement of Net Position. Bond premiums and discounts, as well as gains or losses on refunding, are deferred and amortized over the life of the bonds using the straight-line method. Beginning with the 2007B Series of bonds issued, the effective interest method is applied to that and all subsequent bond premiums and discounts for all issuances where the straight line method is materially different than the effective interest method. Bonds payable are reported net of the applicable bond premium or discount. Gains or losses on bond refundings are reported as deferred outflows or inflows, respectively. In the fund financial statements, governmental fund types recognize bond premiums and discounts, as well as bond refunding costs, during the current period. The face amount of debt issued is reported as other financing sources. Amortization of the premiums received on debt issuances are reported as other financing sources while discounts on debt issuances are reported as other financing uses. Issuance costs, whether or not withheld from the actual debt proceeds received, are reported as debt service expenditures in the year incurred. Encumbrances Encumbrances outstanding at year end represent the estimated amount of the expenditures required to complete contracts, purchase orders and other commitments in process of completion at fiscal year end. Encumbrances outstanding at year end do not constitute expenditures or liabilities because the commitments will be reappropriated and honored during the subsequent year. Fund balances in the fund financial statements at year end reflect the encumbrances as commitments.
Net Position The government-wide and business-type fund financial statements utilize a net position presentation. Net position is categorized as net investment in capital assets, restricted and unrestricted. Fund Balances Fund balance is divided into five classifications based primarily on the extent to which the City is bound to observe constraints imposed upon the use of the resources in the governmental funds. The classifications are as follows: Nonspendable - The nonspendable fund balance category includes amounts that cannot be spent because they are either (a) not in spendable form or (b) legally or contractually required to be maintained intact. The “not in spendable form” criterion includes items that are not expected to be converted to cash.
58
CITY OF CHESAPEAKE, VIRGINIA Schedule K, Continued Notes to Basic Financial Statements June 30, 2017
(1) Continued
Restricted - Fund balance is reported as restricted when constraints placed on the use of resources are either externally imposed by creditors (such as through debt covenants), grantors, contributors or laws or regulations of other governments or is imposed by law through constitutional provisions or enabling legislation (City charter). Enabling legislation authorizes the City to assess, levy, charge or otherwise mandate payment of resources (from external resource providers) and includes a legally enforceable requirement that those resources be used only for the specific purposes stipulated in the legislation. Legal enforceability means that the City can be compelled by an external party such as citizens, public interest groups or the judiciary to use resources created by enabling legislation only for the purposes specified by the legislation.
Committed - The committed fund balance classification includes amounts that can be used only for the specific purposes imposed by formal action (ordinance) of City Council, the highest level of decision making authority for the City. Those committed amounts cannot be used for any other purpose unless City Council removes or changes the specified use by taking the same type of action (such as an ordinance) it employed to previously commit those amounts. Committed fund balance also incorporates contractual obligations to the extent that existing resources in the fund have been specifically committed for use in satisfying those contractual requirements.
Assigned - Amounts in the assigned fund balance classification are intended to be used by the City for specific purposes that are neither considered restricted nor committed. These amounts can be assigned either by any action of the governing board or by designees with authority to assign. Amounts can be unassigned by the same process. Per the City’s policy, the City Manager (or his designee) has the authority to assign amounts of a fund balance to promote sound financial operations of the City or to meet future obligations. In governmental funds other than the General Fund, assigned fund balance represents the remaining amounts (except for negative balances) that are not classified as nonspendable and are neither restricted nor committed. Unassigned - Unassigned fund balance is the residual classification for the General Fund and includes all spendable amounts not contained in the other classifications. The General Fund is the only fund that reports a positive unassigned fund balance amount. In other governmental funds, the unassigned classification is used only to report a deficit balance resulting from overspending for specific purposes for which amounts had been restricted, committed or assigned.
The City applies restricted resources first when expenditures are incurred for purposes for which either restricted or unrestricted (committed, assigned and unassigned) amounts are available. Similarly, within unrestricted fund balance, committed amounts are reduced first followed by assigned and then unassigned amounts when expenditures are incurred for purposes for which amounts in any of the unrestricted fund balance classifications could be used. Minimum Fund Balance Policy The City Charter requires that a minimum of 6% of specified revenues of the General Fund and Special Revenue funds be restricted for emergency use and cash flow needs, which may occur throughout the fiscal year. In addition, the City shall budget for 12% of these same revenues as unassigned fund balance in the General Fund in order to maintain the policy requirement of a minimum 10% as adopted by resolution of City Council on June 10, 2014.
59
CITY OF CHESAPEAKE, VIRGINIA Schedule K, Continued Notes to Basic Financial Statements June 30, 2017
(2) Deposits and Investments Deposits
Deposits with banks are covered by the Federal Deposit Insurance Corporation (FDIC) and collateralized in accordance with the Virginia Security for Public Deposits Act (the Act) Section 2.2-4400 et. seq. of the Code of Virginia. Under the Act, banks and savings institutions holding public deposits in excess of the amount insured by the FDIC must pledge collateral to the Commonwealth of Virginia Treasury Board. Financial Institutions may choose between two collateralization methodologies and depending upon that choice, will pledge collateral that ranges in the amounts from 50.0% to 130.0% of excess deposits. Accordingly, all deposits are considered fully collateralized. The carrying value of pooled deposits, as of June 30, 2017 is $153,105,651 including petty cash of $46,760 and cash in the special welfare fiduciary fund of $13,231. Cash of $643,264 is being held by the Commonwealth of Virginia.
Investments Statutes, as well as the City’s investment policy, authorize the City to invest in obligations of the United States or agencies thereof; “prime quality” commercial paper and certain corporate notes, bankers’ acceptances, repurchase agreements, certain certificates of deposit and time deposits and the State Treasurer’s Local Government Investment Pool (LGIP). Money market accounts and mutual funds with underlying securities which are within the parameters described above are also allowable as well as investment of funds in deposits. Though not authorized by the City’s investment policy, statutes do allow the following investments: obligations of the Commonwealth of Virginia or political subdivisions thereof, obligations of the International Bank for Reconstruction and Development (World Bank), the Asian Development Bank, the African Development Bank, obligations of any state of the United States, obligations of any city, county, town or district situated in any one of the states of the United States and certificates representing ownership of either treasury bond principal at maturity or its coupons for accrued periods.
Fair Value Measurements: The City categorizes its investments (non-restricted) by fair value measurements within the fair value hierarchy established by the accounting principles generally accepted in the United States of America (GAAP). These principles recognize a three-tiered fair value hierarchy, as follows:
Level 1: Investments reflect prices quoted in active markets for identical assets. Level 2: Investments reflect prices that are based on a similar observable asset either directly or
indirectly, which may include inputs that are not considered to be active; and, Level 3: Investments reflect prices based upon unobservable sources.
Investments with a maturity of one year or less are measured at amortized cost and investments with a maturity of one year or more are measured at fair value.
60
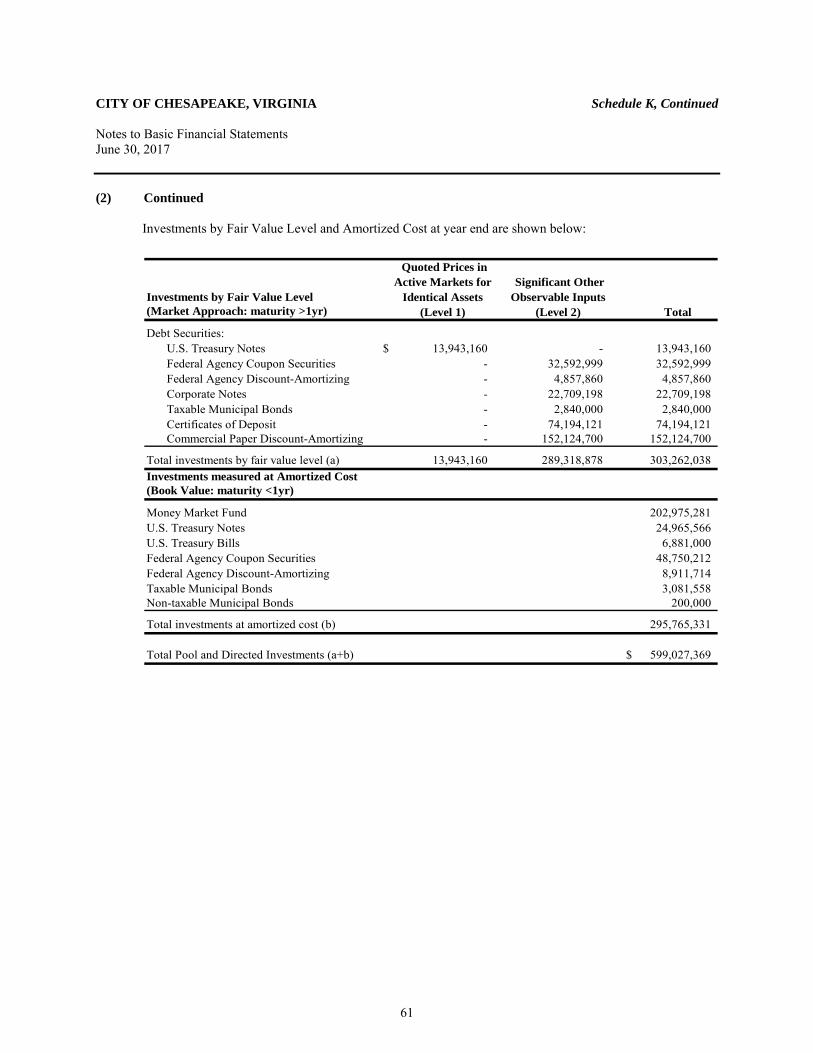
CITY OF CHESAPEAKE, VIRGINIA Schedule K, Continued Notes to Basic Financial Statements June 30, 2017
(2) Continued
Investments by Fair Value Level and Amortized Cost at year end are shown below:
Investments by Fair Value Level(Market Approach: maturity >1yr)
Debt Securities:U.S. Treasury Notes $ 13,943,160 - 13,943,160 Federal Agency Coupon Securities - 32,592,999 32,592,999 Federal Agency Discount-Amortizing - 4,857,860 4,857,860 Corporate Notes - 22,709,198 22,709,198 Taxable Municipal Bonds - 2,840,000 2,840,000 Certificates of Deposit - 74,194,121 74,194,121 Commercial Paper Discount-Amortizing - 152,124,700 152,124,700
Total investments by fair value level (a) 13,943,160 289,318,878 303,262,038 Investments measured at Amortized Cost(Book Value: maturity <1yr)
Money Market Fund 202,975,281 U.S. Treasury Notes 24,965,566 U.S. Treasury Bills 6,881,000 Federal Agency Coupon Securities 48,750,212 Federal Agency Discount-Amortizing 8,911,714 Taxable Municipal Bonds 3,081,558 Non-taxable Municipal Bonds 200,000
Total investments at amortized cost (b) 295,765,331
Total Pool and Directed Investments (a+b) $ 599,027,369
Quoted Prices in Active Markets for
Identical Assets (Level 1)
Significant Other Observable Inputs
(Level 2) Total
61
CITY OF CHESAPEAKE, VIRGINIA Schedule K, Continued Notes to Basic Financial Statements June 30, 2017
(2) Continued
Credit Risk
Generally credit risk is the risk that an issuer of an investment will not fulfill its obligation to the holder of the investment. This is measured by the assignment of a rating by nationally recognized statistical rating organizations. Presented at the end of this footnote are the specifically identified investment ratings as of June 30, 2017.
Custodial Credit Risk – Deposits
Custodial credit risk is the risk that, in the event of the failure of a depository financial institution, a government will not be able to recover its deposits or will not be able to recover collateral securities that are in the possession of an outside party. All deposits of the City are maintained in accounts collateralized in accordance with the Virginia Security for Public Deposits Act, Section 2.2-400 et. seq. of the Code of Virginia or covered by the Federal Deposit Insurance Corporation (FDIC).
Custodial Credit Risk – Investments Investment custodial credit risk is the risk that in the event of the failure of the counterparty, the City will not be able to recover the value of its investments. The City’s investment policy requires securities be purchased only from brokerage firms/institutions with offices that are under the Commonwealth of Virginia’s supervision and located in the Commonwealth of Virginia. The City holds no investments that are at risk. Concentration of Credit Risk The City’s investment policy requires that its portfolio be diversified with not more than 5.0% of the value of the portfolio invested in securities of any single issuer, excluding securities of the U.S. Government or agency thereof, government-sponsored corporation securities, or fully insured and/or collateralized certificates of deposit. At June 30, 2017, the City was holding certificates of deposit in TowneBank of $74,194,121, which represented 11.2% of the City’s total investments. The City held no other investments by any one issuer that represented over 5.0% of the City’s total investments other than U.S. Treasury securities, mutual funds and external investment pools.
Interest Rate Risk As a means of limiting its exposure to fair value losses arising from rising interest rates, the City’s investment policy limits U.S. Treasury and U.S. Agency securities to maturities of less than five years; guaranteed investment contracts to maturities of less than 30 years; bankers’ acceptances to maturities of less than 180 days; commercial paper to maturities of less than 270 days; and corporate notes to maturities of less than five years.
Investments of debt proceeds held by bond trustees are governed by provisions of the debt agreements. These debt agreements limit U.S. Agency securities to maturities of less than five years and guaranteed investment contracts to maturities of less than 30 years.
62
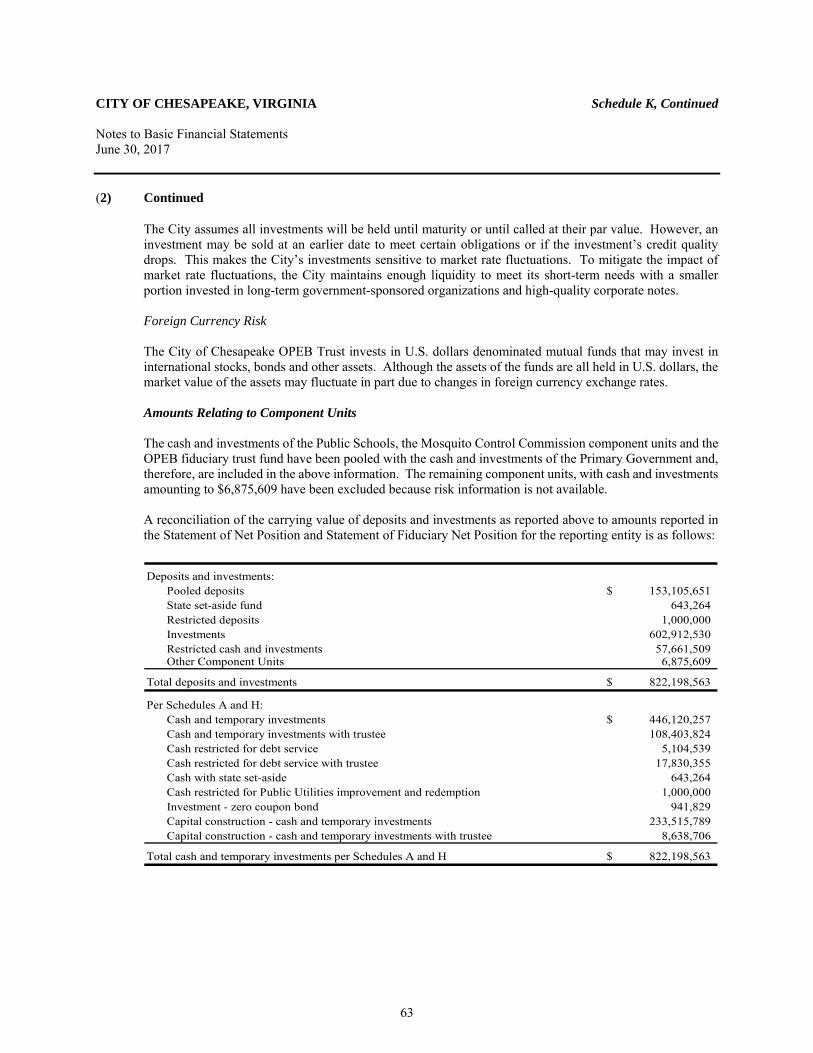
CITY OF CHESAPEAKE, VIRGINIA Schedule K, Continued Notes to Basic Financial Statements June 30, 2017
(2) Continued
The City assumes all investments will be held until maturity or until called at their par value. However, an investment may be sold at an earlier date to meet certain obligations or if the investment’s credit quality drops. This makes the City’s investments sensitive to market rate fluctuations. To mitigate the impact of market rate fluctuations, the City maintains enough liquidity to meet its short-term needs with a smaller portion invested in long-term government-sponsored organizations and high-quality corporate notes. Foreign Currency Risk The City of Chesapeake OPEB Trust invests in U.S. dollars denominated mutual funds that may invest in international stocks, bonds and other assets. Although the assets of the funds are all held in U.S. dollars, the market value of the assets may fluctuate in part due to changes in foreign currency exchange rates.
Amounts Relating to Component Units
The cash and investments of the Public Schools, the Mosquito Control Commission component units and the OPEB fiduciary trust fund have been pooled with the cash and investments of the Primary Government and, therefore, are included in the above information. The remaining component units, with cash and investments amounting to $6,875,609 have been excluded because risk information is not available.
A reconciliation of the carrying value of deposits and investments as reported above to amounts reported in the Statement of Net Position and Statement of Fiduciary Net Position for the reporting entity is as follows:
Deposits and investments:Pooled deposits $ 153,105,651 State set-aside fund 643,264 Restricted deposits 1,000,000 Investments 602,912,530 Restricted cash and investments 57,661,509 Other Component Units 6,875,609
Total deposits and investments $ 822,198,563
Per Schedules A and H: Cash and temporary investments $ 446,120,257 Cash and temporary investments with trustee 108,403,824 Cash restricted for debt service 5,104,539 Cash restricted for debt service with trustee 17,830,355 Cash with state set-aside 643,264 Cash restricted for Public Utilities improvement and redemption 1,000,000 Investment - zero coupon bond 941,829 Capital construction - cash and temporary investments 233,515,789 Capital construction - cash and temporary investments with trustee 8,638,706
Total cash and temporary investments per Schedules A and H $ 822,198,563
63
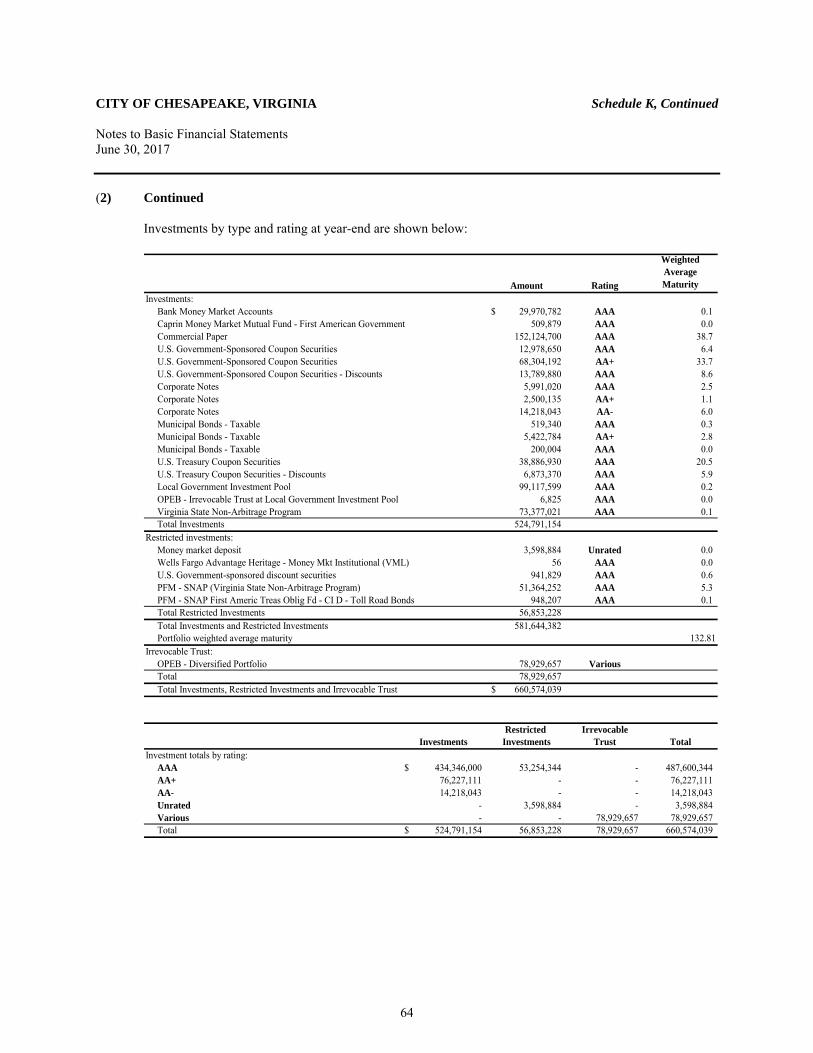
CITY OF CHESAPEAKE, VIRGINIA Schedule K, Continued Notes to Basic Financial Statements June 30, 2017
(2) Continued
Investments by type and rating at year-end are shown below:
Amount Rating
Weighted Average Maturity
Investments:Bank Money Market Accounts 29,970,782$ AAA 0.1 Caprin Money Market Mutual Fund - First American Government 509,879 AAA 0.0 Commercial Paper 152,124,700 AAA 38.7 U.S. Government-Sponsored Coupon Securities 12,978,650 AAA 6.4 U.S. Government-Sponsored Coupon Securities 68,304,192 AA+ 33.7 U.S. Government-Sponsored Coupon Securities - Discounts 13,789,880 AAA 8.6 Corporate Notes 5,991,020 AAA 2.5 Corporate Notes 2,500,135 AA+ 1.1 Corporate Notes 14,218,043 AA- 6.0 Municipal Bonds - Taxable 519,340 AAA 0.3 Municipal Bonds - Taxable 5,422,784 AA+ 2.8 Municipal Bonds - Taxable 200,004 AAA 0.0 U.S. Treasury Coupon Securities 38,886,930 AAA 20.5 U.S. Treasury Coupon Securities - Discounts 6,873,370 AAA 5.9 Local Government Investment Pool 99,117,599 AAA 0.2 OPEB - Irrevocable Trust at Local Government Investment Pool 6,825 AAA 0.0 Virginia State Non-Arbitrage Program 73,377,021 AAA 0.1 Total Investments 524,791,154
Restricted investments:Money market deposit 3,598,884 Unrated 0.0 Wells Fargo Advantage Heritage - Money Mkt Institutional (VML) 56 AAA 0.0 U.S. Government-sponsored discount securities 941,829 AAA 0.6 PFM - SNAP (Virginia State Non-Arbitrage Program) 51,364,252 AAA 5.3 PFM - SNAP First Americ Treas Oblig Fd - CI D - Toll Road Bonds 948,207 AAA 0.1 Total Restricted Investments 56,853,228 Total Investments and Restricted Investments 581,644,382 Portfolio weighted average maturity 132.81
Irrevocable Trust:OPEB - Diversified Portfolio 78,929,657 VariousTotal 78,929,657 Total Investments, Restricted Investments and Irrevocable Trust 660,574,039$
Restricted IrrevocableInvestments Investments Trust Total
Investment totals by rating:AAA 434,346,000$ 53,254,344 - 487,600,344 AA+ 76,227,111 - - 76,227,111 AA- 14,218,043 - - 14,218,043 Unrated - 3,598,884 - 3,598,884 Various - - 78,929,657 78,929,657 Total 524,791,154$ 56,853,228 78,929,657 660,574,039
64
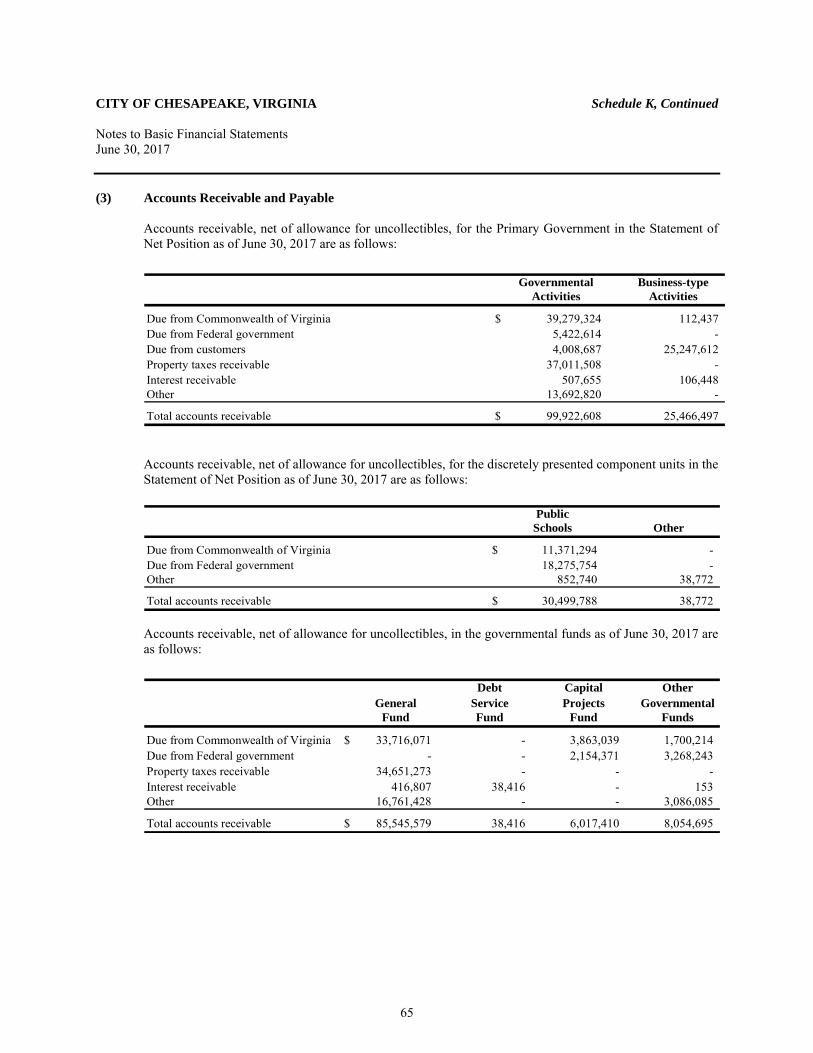
CITY OF CHESAPEAKE, VIRGINIA Schedule K, Continued Notes to Basic Financial Statements June 30, 2017
(3) Accounts Receivable and Payable Accounts receivable, net of allowance for uncollectibles, for the Primary Government in the Statement of Net Position as of June 30, 2017 are as follows:
Governmental Business-typeActivities Activities
Due from Commonwealth of Virginia $ 39,279,324 112,437 Due from Federal government 5,422,614 - Due from customers 4,008,687 25,247,612 Property taxes receivable 37,011,508 - Interest receivable 507,655 106,448 Other 13,692,820 -
Total accounts receivable $ 99,922,608 25,466,497
Accounts receivable, net of allowance for uncollectibles, for the discretely presented component units in the Statement of Net Position as of June 30, 2017 are as follows:
PublicSchools Other
Due from Commonwealth of Virginia $ 11,371,294 - Due from Federal government 18,275,754 - Other 852,740 38,772
Total accounts receivable $ 30,499,788 38,772
Accounts receivable, net of allowance for uncollectibles, in the governmental funds as of June 30, 2017 are as follows:
Debt Capital OtherGeneral Service Projects Governmental
Fund Fund Fund Funds
Due from Commonwealth of Virginia $ 33,716,071 - 3,863,039 1,700,214 Due from Federal government - - 2,154,371 3,268,243 Property taxes receivable 34,651,273 - - - Interest receivable 416,807 38,416 - 153 Other 16,761,428 - - 3,086,085
Total accounts receivable $ 85,545,579 38,416 6,017,410 8,054,695
65
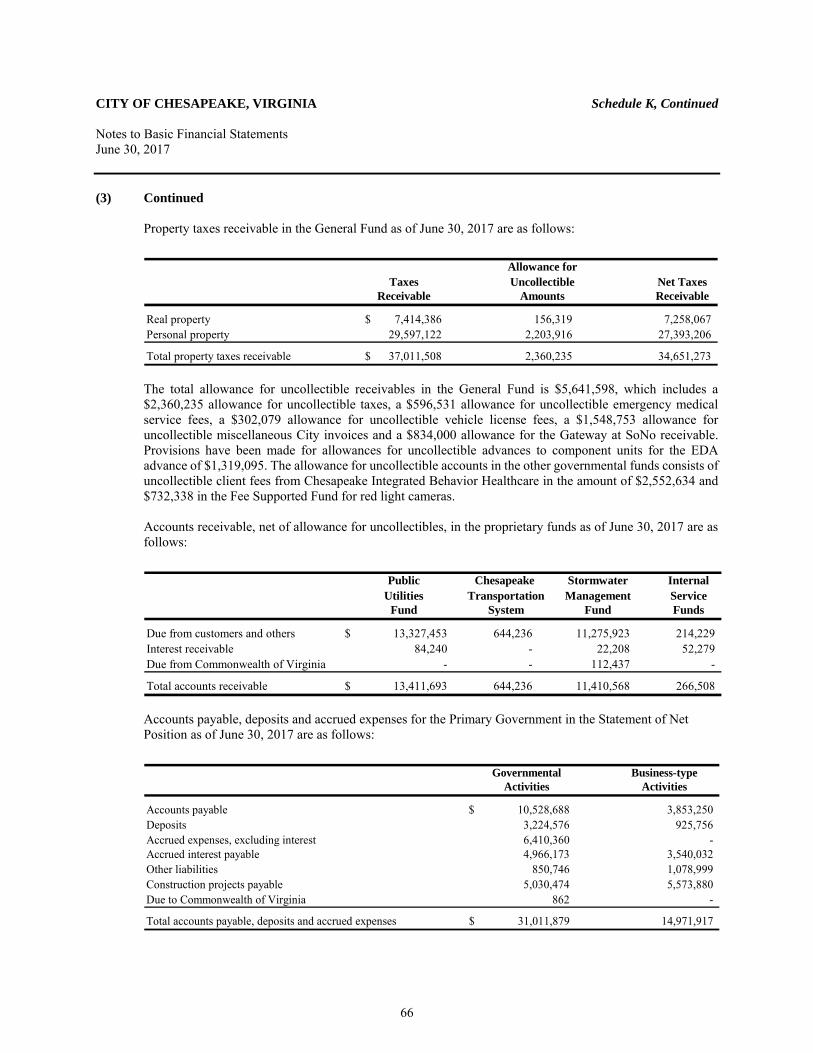
CITY OF CHESAPEAKE, VIRGINIA Schedule K, Continued Notes to Basic Financial Statements June 30, 2017
(3) Continued Property taxes receivable in the General Fund as of June 30, 2017 are as follows:
Allowance forTaxes Uncollectible Net Taxes
Receivable Amounts Receivable
Real property 7,414,386$ 156,319 7,258,067 Personal property 29,597,122 2,203,916 27,393,206
Total property taxes receivable 37,011,508$ 2,360,235 34,651,273 The total allowance for uncollectible receivables in the General Fund is $5,641,598, which includes a $2,360,235 allowance for uncollectible taxes, a $596,531 allowance for uncollectible emergency medical service fees, a $302,079 allowance for uncollectible vehicle license fees, a $1,548,753 allowance for uncollectible miscellaneous City invoices and a $834,000 allowance for the Gateway at SoNo receivable. Provisions have been made for allowances for uncollectible advances to component units for the EDA advance of $1,319,095. The allowance for uncollectible accounts in the other governmental funds consists of uncollectible client fees from Chesapeake Integrated Behavior Healthcare in the amount of $2,552,634 and $732,338 in the Fee Supported Fund for red light cameras. Accounts receivable, net of allowance for uncollectibles, in the proprietary funds as of June 30, 2017 are as follows:
Public Chesapeake Stormwater InternalUtilities Transportation Management Service
Fund System Fund Funds
Due from customers and others $ 13,327,453 644,236 11,275,923 214,229 Interest receivable 84,240 - 22,208 52,279 Due from Commonwealth of Virginia - - 112,437 -
Total accounts receivable $ 13,411,693 644,236 11,410,568 266,508
Accounts payable, deposits and accrued expenses for the Primary Government in the Statement of Net Position as of June 30, 2017 are as follows:
Governmental Business-typeActivities Activities
Accounts payable $ 10,528,688 3,853,250 Deposits 3,224,576 925,756 Accrued expenses, excluding interest 6,410,360 - Accrued interest payable 4,966,173 3,540,032 Other liabilities 850,746 1,078,999 Construction projects payable 5,030,474 5,573,880 Due to Commonwealth of Virginia 862 -
Total accounts payable, deposits and accrued expenses $ 31,011,879 14,971,917
66
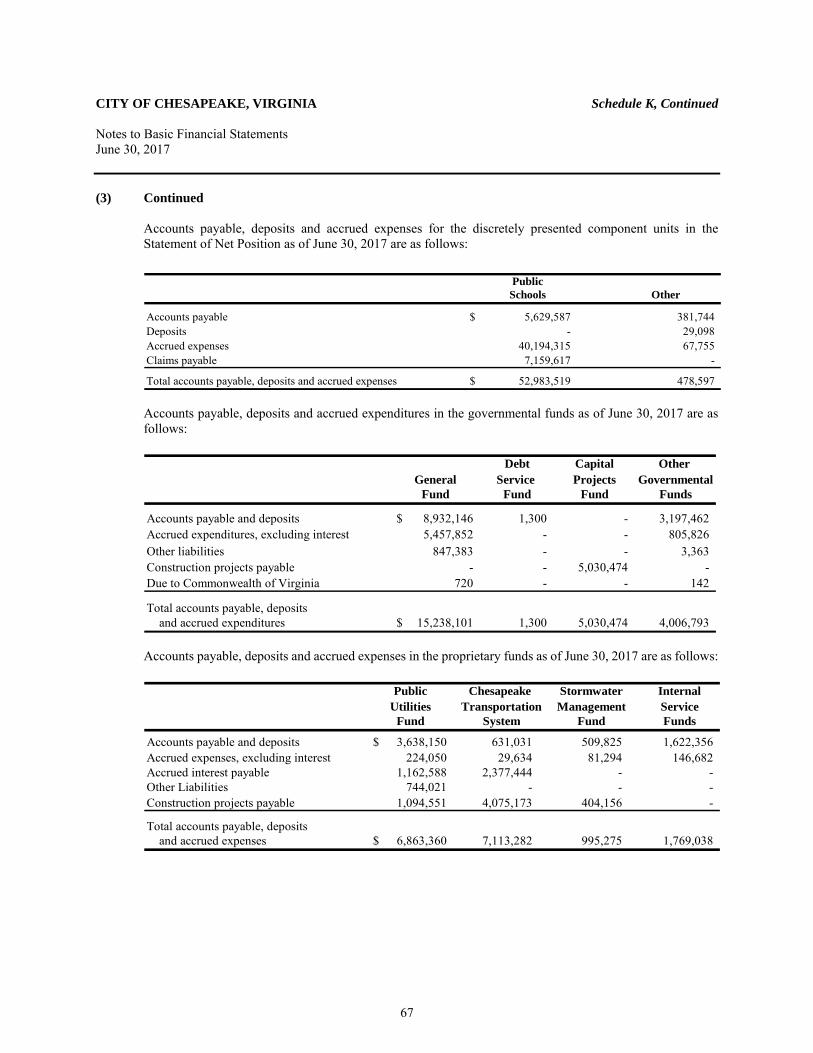
CITY OF CHESAPEAKE, VIRGINIA Schedule K, Continued Notes to Basic Financial Statements June 30, 2017
(3) Continued Accounts payable, deposits and accrued expenses for the discretely presented component units in the Statement of Net Position as of June 30, 2017 are as follows:
PublicSchools Other
Accounts payable $ 5,629,587 381,744 Deposits - 29,098 Accrued expenses 40,194,315 67,755 Claims payable 7,159,617 -
Total accounts payable, deposits and accrued expenses $ 52,983,519 478,597 Accounts payable, deposits and accrued expenditures in the governmental funds as of June 30, 2017 are as follows:
Debt Capital Other General Service Projects Governmental
Fund Fund Fund Funds
Accounts payable and deposits 8,932,146$ 1,300 - 3,197,462 Accrued expenditures, excluding interest 5,457,852 - - 805,826 Other liabilities 847,383 - - 3,363 Construction projects payable - - 5,030,474 - Due to Commonwealth of Virginia 720 - - 142
Total accounts payable, deposits and accrued expenditures 15,238,101$ 1,300 5,030,474 4,006,793 Accounts payable, deposits and accrued expenses in the proprietary funds as of June 30, 2017 are as follows:
Public Chesapeake Stormwater InternalUtilities Transportation Management Service
Fund System Fund Funds
Accounts payable and deposits 3,638,150$ 631,031 509,825 1,622,356 Accrued expenses, excluding interest 224,050 29,634 81,294 146,682 Accrued interest payable 1,162,588 2,377,444 - - Other Liabilities 744,021 - - - Construction projects payable 1,094,551 4,075,173 404,156 -
Total accounts payable, deposits and accrued expenses 6,863,360$ 7,113,282 995,275 1,769,038
67
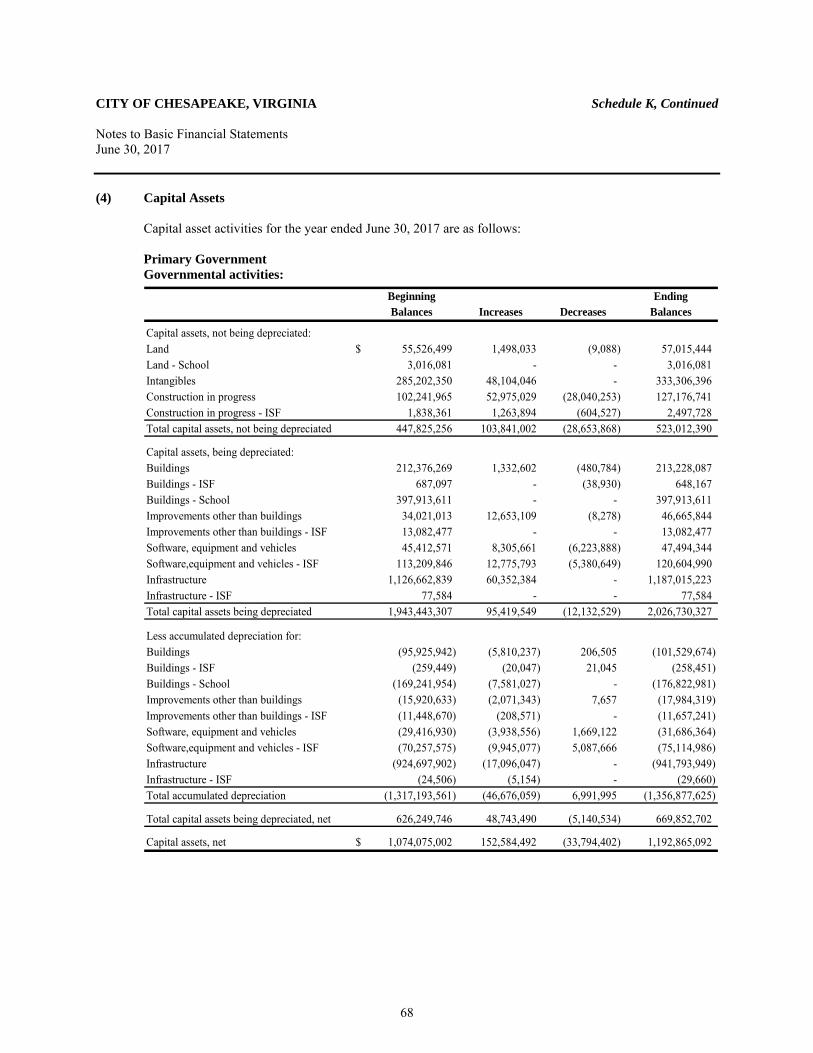
CITY OF CHESAPEAKE, VIRGINIA Schedule K, Continued Notes to Basic Financial Statements June 30, 2017
(4) Capital Assets Capital asset activities for the year ended June 30, 2017 are as follows: Primary Government Governmental activities:
Beginning EndingBalances Increases Decreases Balances
Capital assets, not being depreciated:Land $ 55,526,499 1,498,033 (9,088) 57,015,444 Land - School 3,016,081 - - 3,016,081 Intangibles 285,202,350 48,104,046 - 333,306,396 Construction in progress 102,241,965 52,975,029 (28,040,253) 127,176,741 Construction in progress - ISF 1,838,361 1,263,894 (604,527) 2,497,728 Total capital assets, not being depreciated 447,825,256 103,841,002 (28,653,868) 523,012,390
Capital assets, being depreciated:Buildings 212,376,269 1,332,602 (480,784) 213,228,087 Buildings - ISF 687,097 - (38,930) 648,167 Buildings - School 397,913,611 - - 397,913,611 Improvements other than buildings 34,021,013 12,653,109 (8,278) 46,665,844 Improvements other than buildings - ISF 13,082,477 - - 13,082,477 Software, equipment and vehicles 45,412,571 8,305,661 (6,223,888) 47,494,344 Software,equipment and vehicles - ISF 113,209,846 12,775,793 (5,380,649) 120,604,990 Infrastructure 1,126,662,839 60,352,384 - 1,187,015,223 Infrastructure - ISF 77,584 - - 77,584 Total capital assets being depreciated 1,943,443,307 95,419,549 (12,132,529) 2,026,730,327
Less accumulated depreciation for:Buildings (95,925,942) (5,810,237) 206,505 (101,529,674) Buildings - ISF (259,449) (20,047) 21,045 (258,451) Buildings - School (169,241,954) (7,581,027) - (176,822,981) Improvements other than buildings (15,920,633) (2,071,343) 7,657 (17,984,319) Improvements other than buildings - ISF (11,448,670) (208,571) - (11,657,241) Software, equipment and vehicles (29,416,930) (3,938,556) 1,669,122 (31,686,364) Software,equipment and vehicles - ISF (70,257,575) (9,945,077) 5,087,666 (75,114,986) Infrastructure (924,697,902) (17,096,047) - (941,793,949) Infrastructure - ISF (24,506) (5,154) - (29,660) Total accumulated depreciation (1,317,193,561) (46,676,059) 6,991,995 (1,356,877,625)
Total capital assets being depreciated, net 626,249,746 48,743,490 (5,140,534) 669,852,702
Capital assets, net $ 1,074,075,002 152,584,492 (33,794,402) 1,192,865,092
68
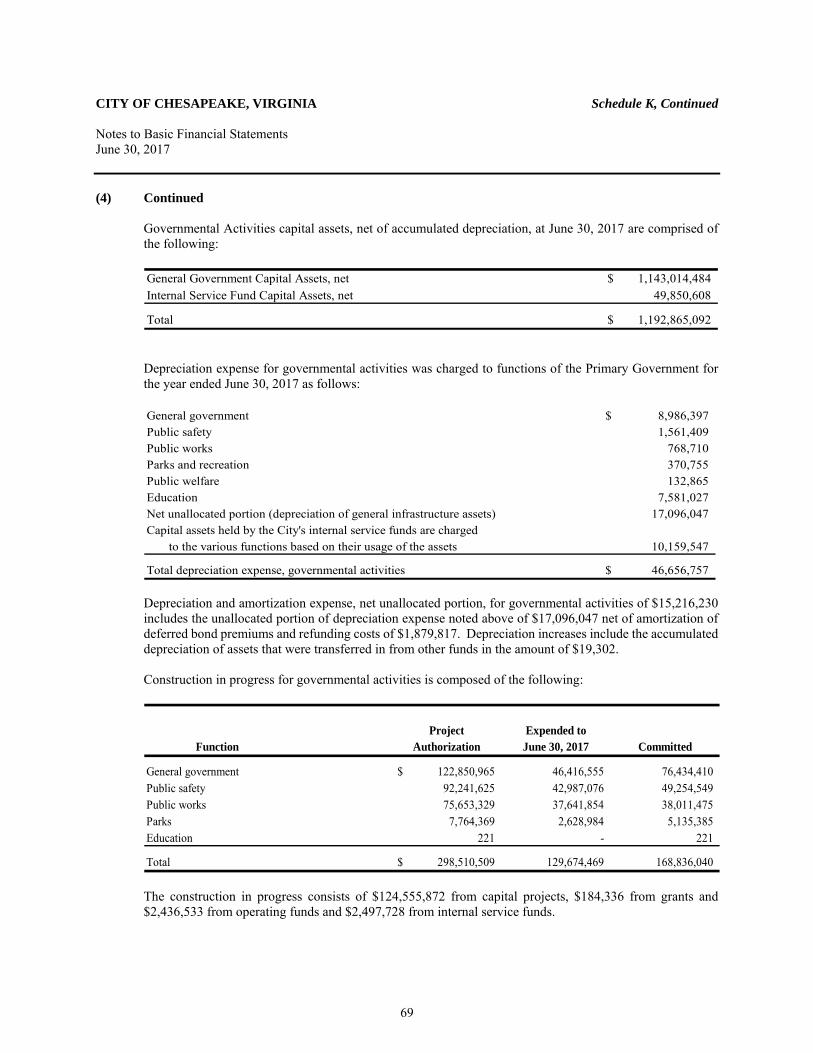
CITY OF CHESAPEAKE, VIRGINIA Schedule K, Continued Notes to Basic Financial Statements June 30, 2017
(4) Continued Governmental Activities capital assets, net of accumulated depreciation, at June 30, 2017 are comprised of the following:
General Government Capital Assets, net 1,143,014,484$ Internal Service Fund Capital Assets, net 49,850,608
Total 1,192,865,092$ Depreciation expense for governmental activities was charged to functions of the Primary Government for the year ended June 30, 2017 as follows:
General government 8,986,397$ Public safety 1,561,409 Public works 768,710 Parks and recreation 370,755 Public welfare 132,865 Education 7,581,027 Net unallocated portion (depreciation of general infrastructure assets) 17,096,047 Capital assets held by the City's internal service funds are charged to the various functions based on their usage of the assets 10,159,547
Total depreciation expense, governmental activities 46,656,757$ Depreciation and amortization expense, net unallocated portion, for governmental activities of $15,216,230 includes the unallocated portion of depreciation expense noted above of $17,096,047 net of amortization of deferred bond premiums and refunding costs of $1,879,817. Depreciation increases include the accumulated depreciation of assets that were transferred in from other funds in the amount of $19,302. Construction in progress for governmental activities is composed of the following:
Project Expended toFunction Authorization June 30, 2017 Committed
General government 122,850,965$ 46,416,555 76,434,410 Public safety 92,241,625 42,987,076 49,254,549 Public works 75,653,329 37,641,854 38,011,475 Parks 7,764,369 2,628,984 5,135,385 Education 221 - 221
Total 298,510,509$ 129,674,469 168,836,040
The construction in progress consists of $124,555,872 from capital projects, $184,336 from grants and $2,436,533 from operating funds and $2,497,728 from internal service funds.
69
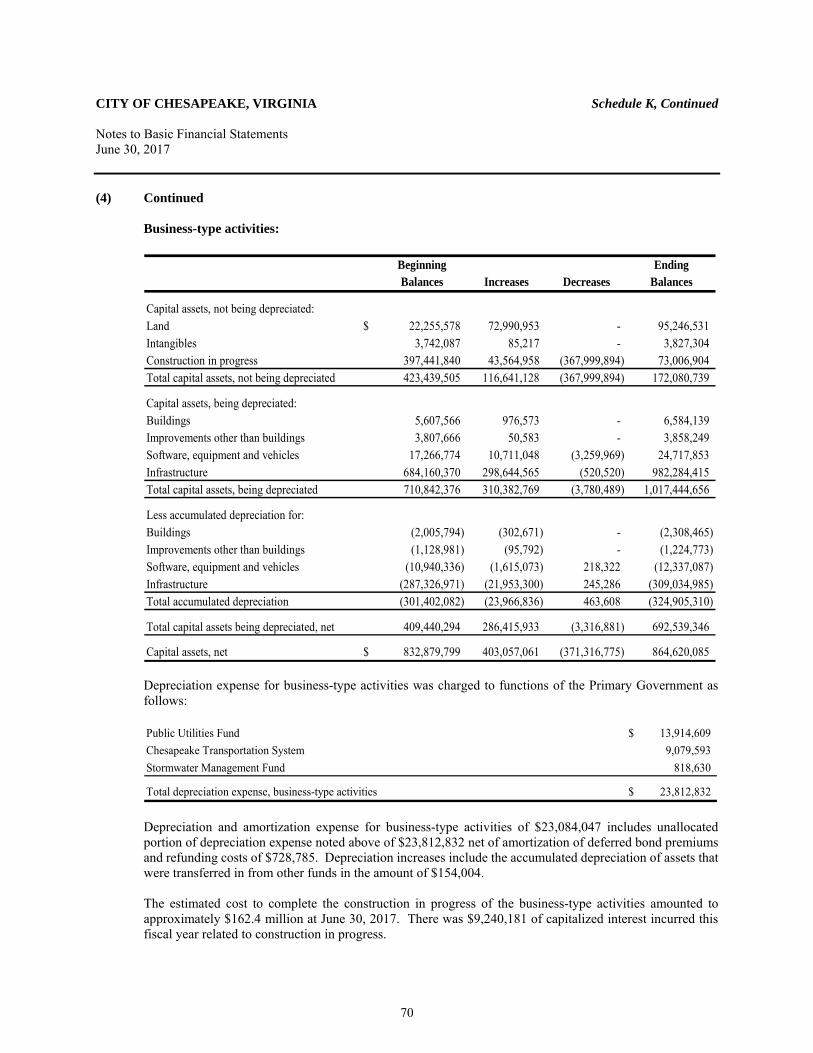
CITY OF CHESAPEAKE, VIRGINIA Schedule K, Continued Notes to Basic Financial Statements June 30, 2017
(4) Continued
Business-type activities:
Beginning EndingBalances Increases Decreases Balances
Capital assets, not being depreciated: Land $ 22,255,578 72,990,953 - 95,246,531 Intangibles 3,742,087 85,217 - 3,827,304 Construction in progress 397,441,840 43,564,958 (367,999,894) 73,006,904 Total capital assets, not being depreciated 423,439,505 116,641,128 (367,999,894) 172,080,739
Capital assets, being depreciated: Buildings 5,607,566 976,573 - 6,584,139 Improvements other than buildings 3,807,666 50,583 - 3,858,249 Software, equipment and vehicles 17,266,774 10,711,048 (3,259,969) 24,717,853 Infrastructure 684,160,370 298,644,565 (520,520) 982,284,415 Total capital assets, being depreciated 710,842,376 310,382,769 (3,780,489) 1,017,444,656
Less accumulated depreciation for: Buildings (2,005,794) (302,671) - (2,308,465) Improvements other than buildings (1,128,981) (95,792) - (1,224,773) Software, equipment and vehicles (10,940,336) (1,615,073) 218,322 (12,337,087) Infrastructure (287,326,971) (21,953,300) 245,286 (309,034,985) Total accumulated depreciation (301,402,082) (23,966,836) 463,608 (324,905,310)
Total capital assets being depreciated, net 409,440,294 286,415,933 (3,316,881) 692,539,346
Capital assets, net $ 832,879,799 403,057,061 (371,316,775) 864,620,085 Depreciation expense for business-type activities was charged to functions of the Primary Government as follows:
Public Utilities Fund 13,914,609$ Chesapeake Transportation System 9,079,593 Stormwater Management Fund 818,630
Total depreciation expense, business-type activities 23,812,832$
Depreciation and amortization expense for business-type activities of $23,084,047 includes unallocated portion of depreciation expense noted above of $23,812,832 net of amortization of deferred bond premiums and refunding costs of $728,785. Depreciation increases include the accumulated depreciation of assets that were transferred in from other funds in the amount of $154,004. The estimated cost to complete the construction in progress of the business-type activities amounted to approximately $162.4 million at June 30, 2017. There was $9,240,181 of capitalized interest incurred this fiscal year related to construction in progress.
70
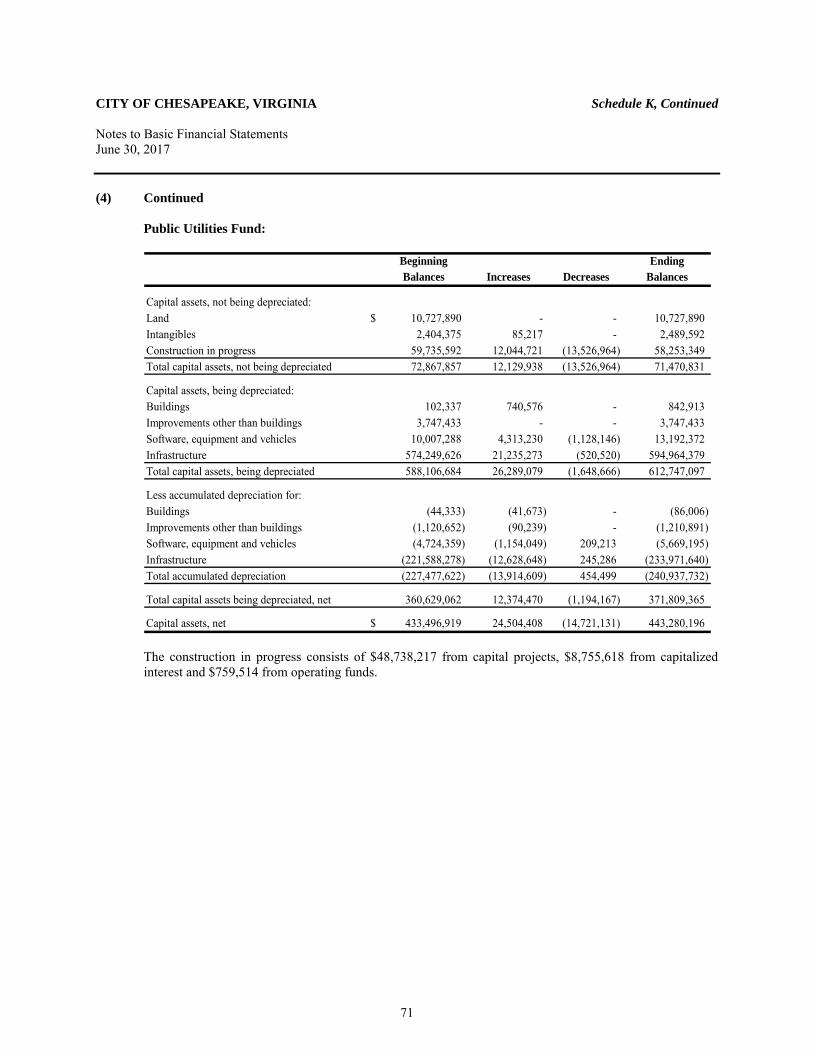
CITY OF CHESAPEAKE, VIRGINIA Schedule K, Continued Notes to Basic Financial Statements June 30, 2017
(4) Continued Public Utilities Fund:
Beginning EndingBalances Increases Decreases Balances
Capital assets, not being depreciated: Land $ 10,727,890 - - 10,727,890 Intangibles 2,404,375 85,217 - 2,489,592 Construction in progress 59,735,592 12,044,721 (13,526,964) 58,253,349 Total capital assets, not being depreciated 72,867,857 12,129,938 (13,526,964) 71,470,831
Capital assets, being depreciated: Buildings 102,337 740,576 - 842,913 Improvements other than buildings 3,747,433 - - 3,747,433 Software, equipment and vehicles 10,007,288 4,313,230 (1,128,146) 13,192,372 Infrastructure 574,249,626 21,235,273 (520,520) 594,964,379 Total capital assets, being depreciated 588,106,684 26,289,079 (1,648,666) 612,747,097
Less accumulated depreciation for: Buildings (44,333) (41,673) - (86,006) Improvements other than buildings (1,120,652) (90,239) - (1,210,891) Software, equipment and vehicles (4,724,359) (1,154,049) 209,213 (5,669,195) Infrastructure (221,588,278) (12,628,648) 245,286 (233,971,640) Total accumulated depreciation (227,477,622) (13,914,609) 454,499 (240,937,732)
Total capital assets being depreciated, net 360,629,062 12,374,470 (1,194,167) 371,809,365
Capital assets, net $ 433,496,919 24,504,408 (14,721,131) 443,280,196
The construction in progress consists of $48,738,217 from capital projects, $8,755,618 from capitalized
interest and $759,514 from operating funds.
71
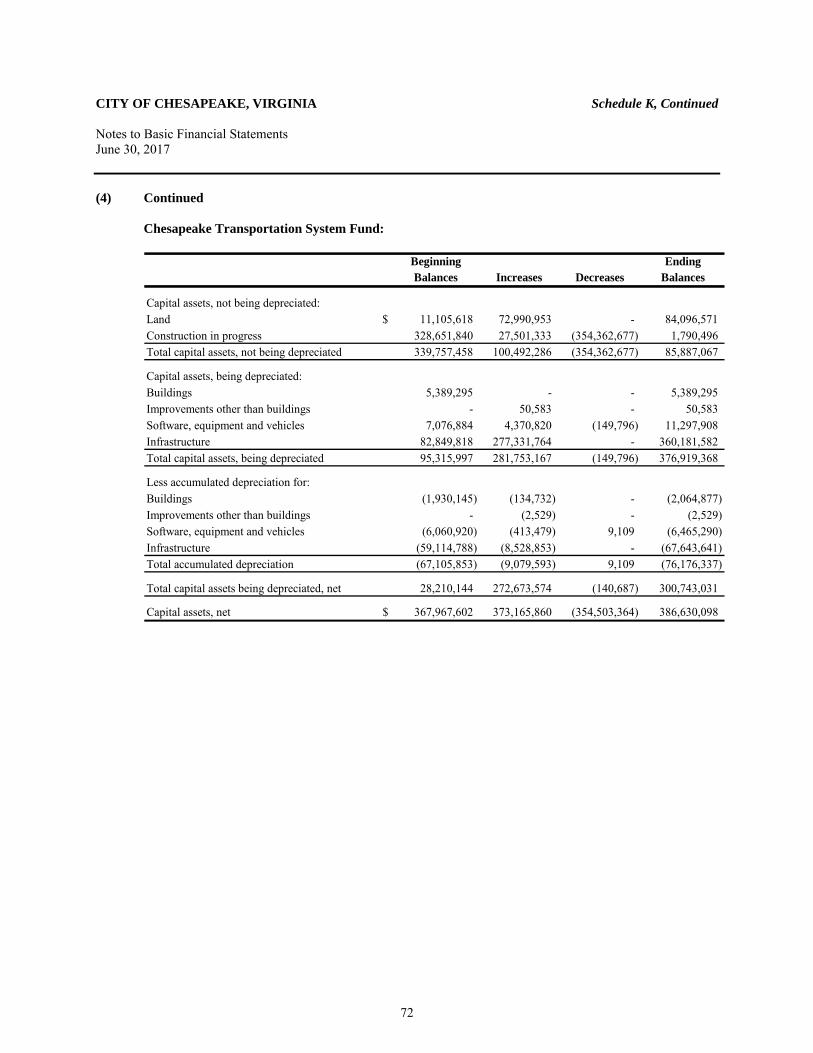
CITY OF CHESAPEAKE, VIRGINIA Schedule K, Continued Notes to Basic Financial Statements June 30, 2017
(4) Continued Chesapeake Transportation System Fund:
Beginning EndingBalances Increases Decreases Balances
Capital assets, not being depreciated: Land $ 11,105,618 72,990,953 - 84,096,571 Construction in progress 328,651,840 27,501,333 (354,362,677) 1,790,496 Total capital assets, not being depreciated 339,757,458 100,492,286 (354,362,677) 85,887,067
Capital assets, being depreciated: Buildings 5,389,295 - - 5,389,295 Improvements other than buildings - 50,583 - 50,583 Software, equipment and vehicles 7,076,884 4,370,820 (149,796) 11,297,908 Infrastructure 82,849,818 277,331,764 - 360,181,582 Total capital assets, being depreciated 95,315,997 281,753,167 (149,796) 376,919,368
Less accumulated depreciation for: Buildings (1,930,145) (134,732) - (2,064,877) Improvements other than buildings - (2,529) - (2,529) Software, equipment and vehicles (6,060,920) (413,479) 9,109 (6,465,290) Infrastructure (59,114,788) (8,528,853) - (67,643,641) Total accumulated depreciation (67,105,853) (9,079,593) 9,109 (76,176,337)
Total capital assets being depreciated, net 28,210,144 272,673,574 (140,687) 300,743,031
Capital assets, net $ 367,967,602 373,165,860 (354,503,364) 386,630,098
72
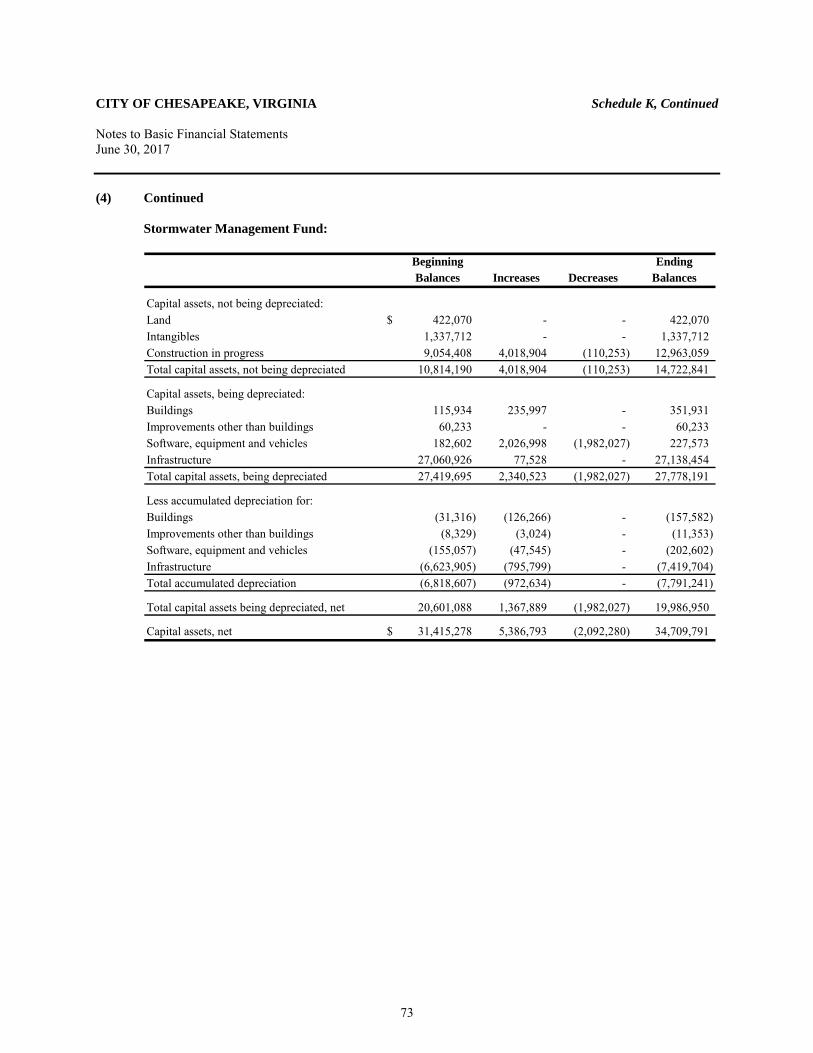
CITY OF CHESAPEAKE, VIRGINIA Schedule K, Continued Notes to Basic Financial Statements June 30, 2017
(4) Continued Stormwater Management Fund:
Beginning EndingBalances Increases Decreases Balances
Capital assets, not being depreciated: Land $ 422,070 - - 422,070 Intangibles 1,337,712 - - 1,337,712 Construction in progress 9,054,408 4,018,904 (110,253) 12,963,059 Total capital assets, not being depreciated 10,814,190 4,018,904 (110,253) 14,722,841
Capital assets, being depreciated: Buildings 115,934 235,997 - 351,931 Improvements other than buildings 60,233 - - 60,233 Software, equipment and vehicles 182,602 2,026,998 (1,982,027) 227,573 Infrastructure 27,060,926 77,528 - 27,138,454 Total capital assets, being depreciated 27,419,695 2,340,523 (1,982,027) 27,778,191
Less accumulated depreciation for: Buildings (31,316) (126,266) - (157,582) Improvements other than buildings (8,329) (3,024) - (11,353) Software, equipment and vehicles (155,057) (47,545) - (202,602) Infrastructure (6,623,905) (795,799) - (7,419,704) Total accumulated depreciation (6,818,607) (972,634) - (7,791,241)
Total capital assets being depreciated, net 20,601,088 1,367,889 (1,982,027) 19,986,950
Capital assets, net $ 31,415,278 5,386,793 (2,092,280) 34,709,791
73
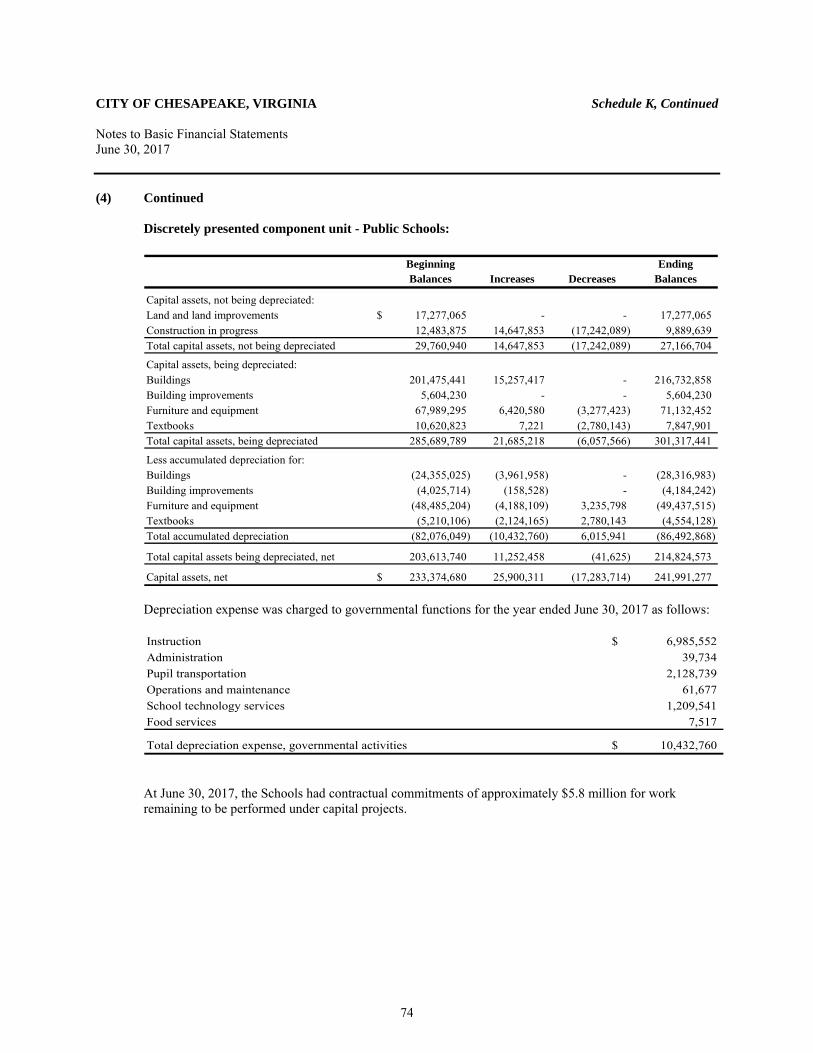
CITY OF CHESAPEAKE, VIRGINIA Schedule K, Continued Notes to Basic Financial Statements June 30, 2017
(4) Continued
Discretely presented component unit - Public Schools:
Beginning EndingBalances Increases Decreases Balances
Capital assets, not being depreciated: Land and land improvements $ 17,277,065 - - 17,277,065 Construction in progress 12,483,875 14,647,853 (17,242,089) 9,889,639 Total capital assets, not being depreciated 29,760,940 14,647,853 (17,242,089) 27,166,704
Capital assets, being depreciated: Buildings 201,475,441 15,257,417 - 216,732,858 Building improvements 5,604,230 - - 5,604,230 Furniture and equipment 67,989,295 6,420,580 (3,277,423) 71,132,452 Textbooks 10,620,823 7,221 (2,780,143) 7,847,901 Total capital assets, being depreciated 285,689,789 21,685,218 (6,057,566) 301,317,441
Less accumulated depreciation for: Buildings (24,355,025) (3,961,958) - (28,316,983) Building improvements (4,025,714) (158,528) - (4,184,242) Furniture and equipment (48,485,204) (4,188,109) 3,235,798 (49,437,515) Textbooks (5,210,106) (2,124,165) 2,780,143 (4,554,128) Total accumulated depreciation (82,076,049) (10,432,760) 6,015,941 (86,492,868)
Total capital assets being depreciated, net 203,613,740 11,252,458 (41,625) 214,824,573
Capital assets, net $ 233,374,680 25,900,311 (17,283,714) 241,991,277 Depreciation expense was charged to governmental functions for the year ended June 30, 2017 as follows:
Instruction 6,985,552$ Administration 39,734 Pupil transportation 2,128,739 Operations and maintenance 61,677 School technology services 1,209,541 Food services 7,517
Total depreciation expense, governmental activities 10,432,760$
At June 30, 2017, the Schools had contractual commitments of approximately $5.8 million for work remaining to be performed under capital projects.
74
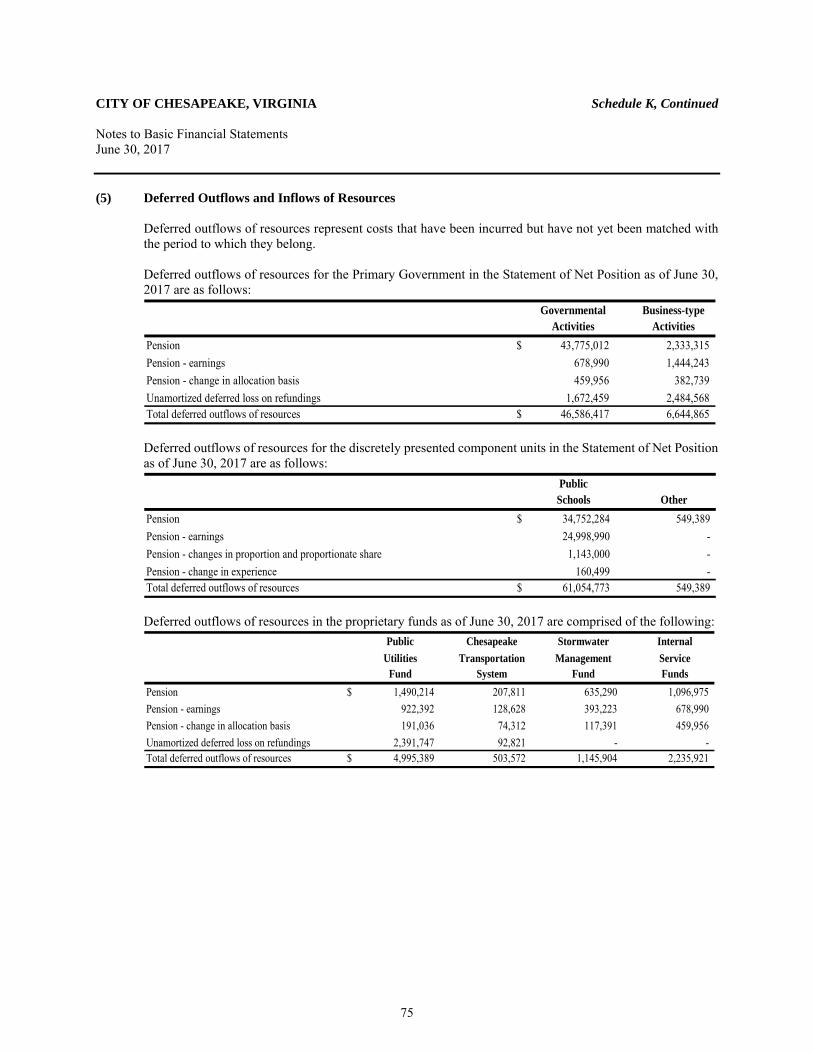
CITY OF CHESAPEAKE, VIRGINIA Schedule K, Continued Notes to Basic Financial Statements June 30, 2017
(5) Deferred Outflows and Inflows of Resources Deferred outflows of resources represent costs that have been incurred but have not yet been matched with the period to which they belong. Deferred outflows of resources for the Primary Government in the Statement of Net Position as of June 30, 2017 are as follows:
Governmental Business-typeActivities Activities
Pension $ 43,775,012 2,333,315 Pension - earnings 678,990 1,444,243 Pension - change in allocation basis 459,956 382,739 Unamortized deferred loss on refundings 1,672,459 2,484,568 Total deferred outflows of resources $ 46,586,417 6,644,865 Deferred outflows of resources for the discretely presented component units in the Statement of Net Position as of June 30, 2017 are as follows:
PublicSchools Other
Pension $ 34,752,284 549,389 Pension - earnings 24,998,990 - Pension - changes in proportion and proportionate share 1,143,000 - Pension - change in experience 160,499 - Total deferred outflows of resources $ 61,054,773 549,389 Deferred outflows of resources in the proprietary funds as of June 30, 2017 are comprised of the following:
Public Chesapeake Stormwater InternalUtilities Transportation Management Service
Fund System Fund FundsPension $ 1,490,214 207,811 635,290 1,096,975 Pension - earnings 922,392 128,628 393,223 678,990 Pension - change in allocation basis 191,036 74,312 117,391 459,956 Unamortized deferred loss on refundings 2,391,747 92,821 - - Total deferred outflows of resources $ 4,995,389 503,572 1,145,904 2,235,921
75
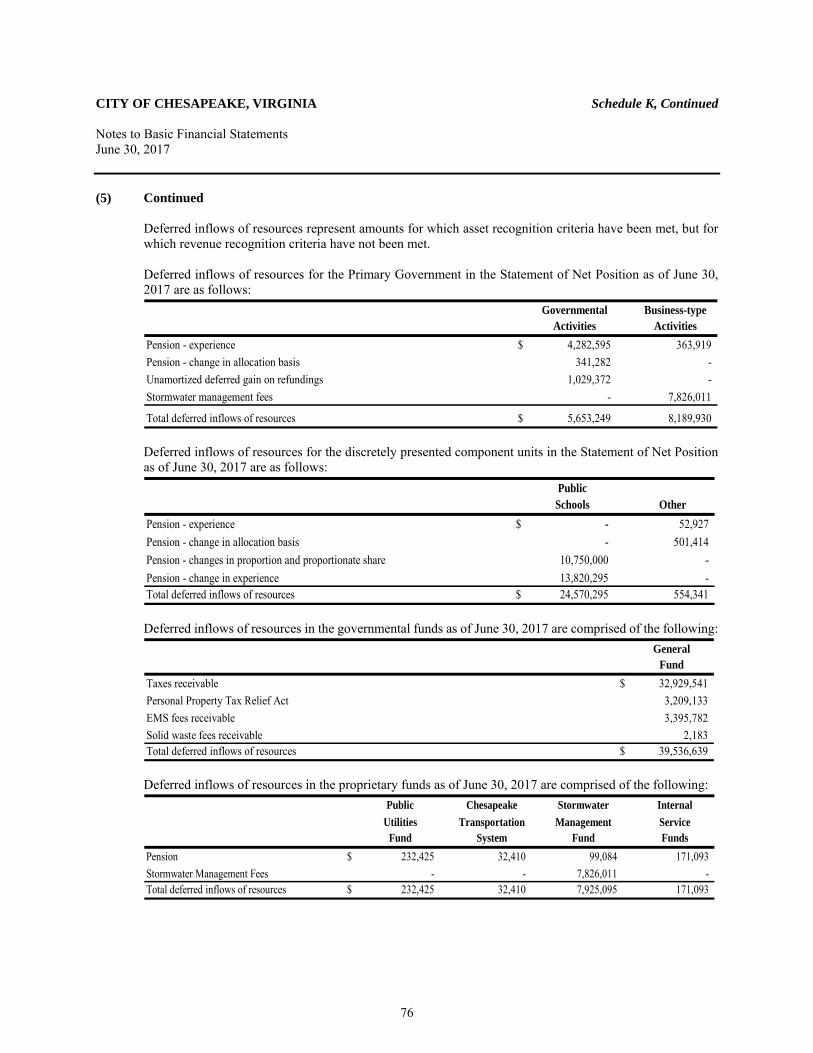
CITY OF CHESAPEAKE, VIRGINIA Schedule K, Continued Notes to Basic Financial Statements June 30, 2017
(5) Continued
Deferred inflows of resources represent amounts for which asset recognition criteria have been met, but for which revenue recognition criteria have not been met. Deferred inflows of resources for the Primary Government in the Statement of Net Position as of June 30, 2017 are as follows:
Governmental Business-typeActivities Activities
Pension - experience $ 4,282,595 363,919 Pension - change in allocation basis 341,282 - Unamortized deferred gain on refundings 1,029,372 - Stormwater management fees - 7,826,011
Total deferred inflows of resources $ 5,653,249 8,189,930 Deferred inflows of resources for the discretely presented component units in the Statement of Net Position as of June 30, 2017 are as follows:
PublicSchools Other
Pension - experience $ - 52,927 Pension - change in allocation basis - 501,414 Pension - changes in proportion and proportionate share 10,750,000 - Pension - change in experience 13,820,295 - Total deferred inflows of resources $ 24,570,295 554,341 Deferred inflows of resources in the governmental funds as of June 30, 2017 are comprised of the following:
GeneralFund
Taxes receivable $ 32,929,541 Personal Property Tax Relief Act 3,209,133 EMS fees receivable 3,395,782 Solid waste fees receivable 2,183 Total deferred inflows of resources $ 39,536,639 Deferred inflows of resources in the proprietary funds as of June 30, 2017 are comprised of the following:
Public Chesapeake Stormwater InternalUtilities Transportation Management Service
Fund System Fund FundsPension $ 232,425 32,410 99,084 171,093 Stormwater Management Fees - - 7,826,011 - Total deferred inflows of resources $ 232,425 32,410 7,925,095 171,093
76
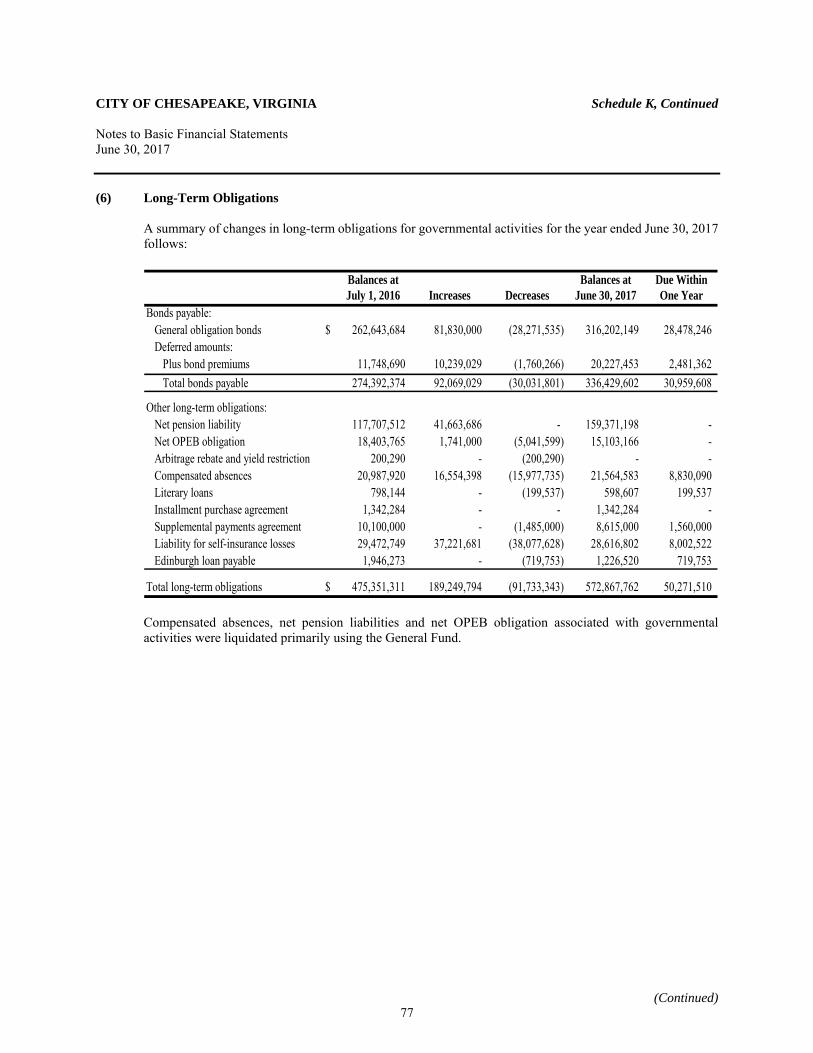
CITY OF CHESAPEAKE, VIRGINIA Schedule K, Continued Notes to Basic Financial Statements June 30, 2017
(Continued)
(6) Long-Term Obligations A summary of changes in long-term obligations for governmental activities for the year ended June 30, 2017 follows:
Balances at Balances at Due WithinJuly 1, 2016 Increases Decreases June 30, 2017 One Year
Bonds payable:General obligation bonds $ 262,643,684 81,830,000 (28,271,535) 316,202,149 28,478,246 Deferred amounts:
Plus bond premiums 11,748,690 10,239,029 (1,760,266) 20,227,453 2,481,362 Total bonds payable 274,392,374 92,069,029 (30,031,801) 336,429,602 30,959,608
Other long-term obligations:Net pension liability 117,707,512 41,663,686 - 159,371,198 - Net OPEB obligation 18,403,765 1,741,000 (5,041,599) 15,103,166 - Arbitrage rebate and yield restriction 200,290 - (200,290) - - Compensated absences 20,987,920 16,554,398 (15,977,735) 21,564,583 8,830,090 Literary loans 798,144 - (199,537) 598,607 199,537 Installment purchase agreement 1,342,284 - - 1,342,284 - Supplemental payments agreement 10,100,000 - (1,485,000) 8,615,000 1,560,000 Liability for self-insurance losses 29,472,749 37,221,681 (38,077,628) 28,616,802 8,002,522 Edinburgh loan payable 1,946,273 - (719,753) 1,226,520 719,753
Total long-term obligations $ 475,351,311 189,249,794 (91,733,343) 572,867,762 50,271,510
Compensated absences, net pension liabilities and net OPEB obligation associated with governmental activities were liquidated primarily using the General Fund.
77
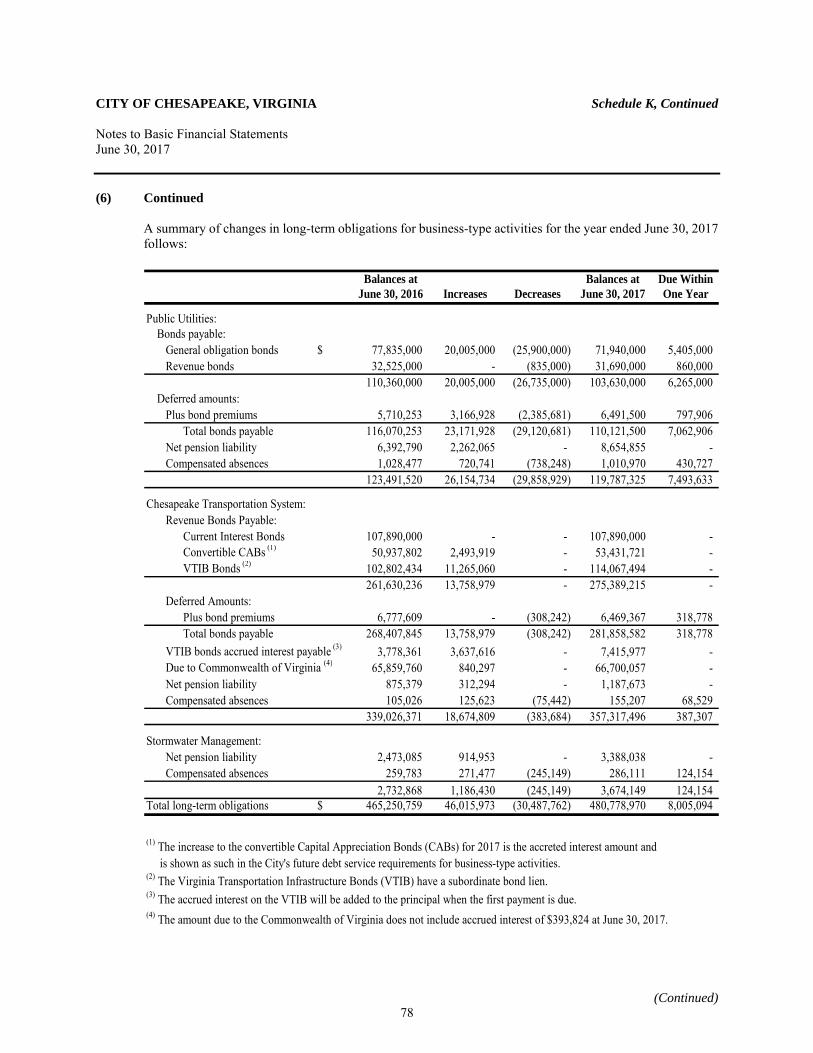
CITY OF CHESAPEAKE, VIRGINIA Schedule K, Continued Notes to Basic Financial Statements June 30, 2017
(Continued)
(6) Continued
A summary of changes in long-term obligations for business-type activities for the year ended June 30, 2017 follows:
Balances at Balances at Due WithinJune 30, 2016 Increases Decreases June 30, 2017 One Year
Public Utilities:Bonds payable:
General obligation bonds $ 77,835,000 20,005,000 (25,900,000) 71,940,000 5,405,000 Revenue bonds 32,525,000 - (835,000) 31,690,000 860,000
110,360,000 20,005,000 (26,735,000) 103,630,000 6,265,000 Deferred amounts:
Plus bond premiums 5,710,253 3,166,928 (2,385,681) 6,491,500 797,906 Total bonds payable 116,070,253 23,171,928 (29,120,681) 110,121,500 7,062,906
Net pension liability 6,392,790 2,262,065 - 8,654,855 - Compensated absences 1,028,477 720,741 (738,248) 1,010,970 430,727
123,491,520 26,154,734 (29,858,929) 119,787,325 7,493,633
Chesapeake Transportation System:Revenue Bonds Payable:
Current Interest Bonds 107,890,000 - - 107,890,000 - Convertible CABs (1) 50,937,802 2,493,919 - 53,431,721 - VTIB Bonds (2) 102,802,434 11,265,060 - 114,067,494 -
261,630,236 13,758,979 - 275,389,215 - Deferred Amounts:
Plus bond premiums 6,777,609 - (308,242) 6,469,367 318,778 Total bonds payable 268,407,845 13,758,979 (308,242) 281,858,582 318,778
VTIB bonds accrued interest payable (3) 3,778,361 3,637,616 - 7,415,977 - Due to Commonwealth of Virginia (4) 65,859,760 840,297 - 66,700,057 - Net pension liability 875,379 312,294 - 1,187,673 - Compensated absences 105,026 125,623 (75,442) 155,207 68,529
339,026,371 18,674,809 (383,684) 357,317,496 387,307
Stormwater Management:Net pension liability 2,473,085 914,953 - 3,388,038 - Compensated absences 259,783 271,477 (245,149) 286,111 124,154
2,732,868 1,186,430 (245,149) 3,674,149 124,154 Total long-term obligations $ 465,250,759 46,015,973 (30,487,762) 480,778,970 8,005,094
(1) The increase to the convertible Capital Appreciation Bonds (CABs) for 2017 is the accreted interest amount and is shown as such in the City's future debt service requirements for business-type activities.
(2) The Virginia Transportation Infrastructure Bonds (VTIB) have a subordinate bond lien.(3) The accrued interest on the VTIB will be added to the principal when the first payment is due.(4) The amount due to the Commonwealth of Virginia does not include accrued interest of $393,824 at June 30, 2017.
78
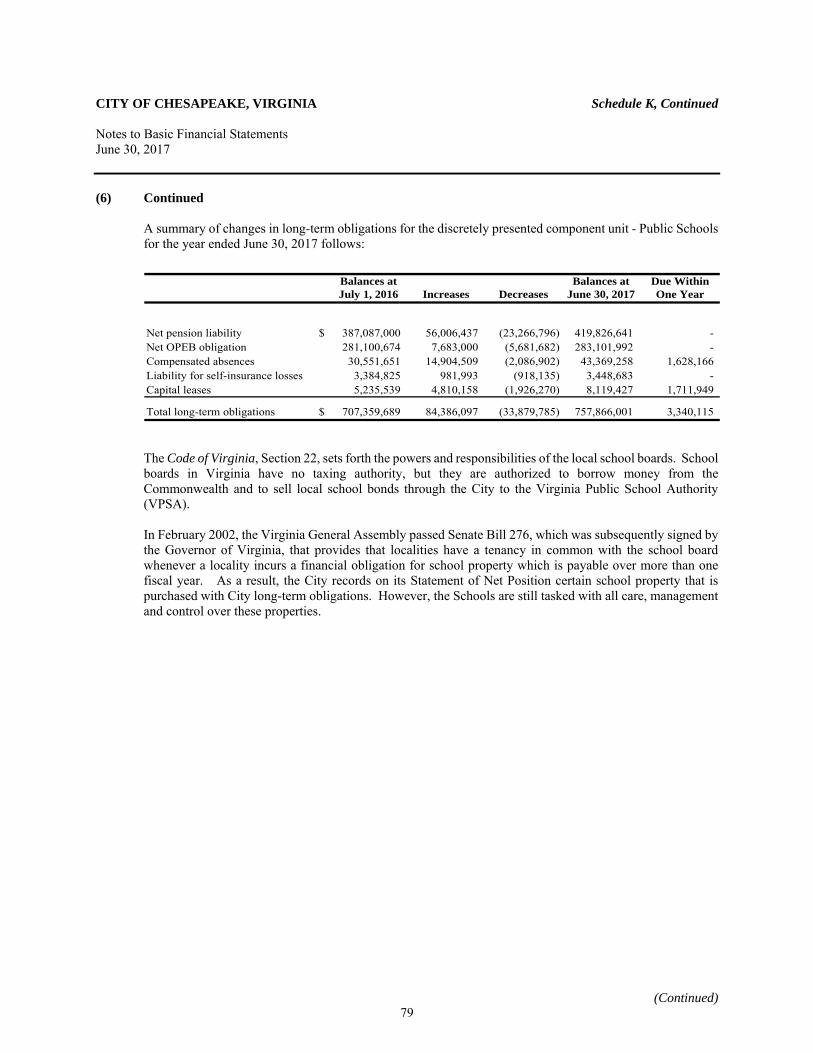
CITY OF CHESAPEAKE, VIRGINIA Schedule K, Continued Notes to Basic Financial Statements June 30, 2017
(Continued)
(6) Continued
A summary of changes in long-term obligations for the discretely presented component unit - Public Schools for the year ended June 30, 2017 follows:
Balances at Balances at Due WithinJuly 1, 2016 Increases Decreases June 30, 2017 One Year
Net pension liability $ 387,087,000 56,006,437 (23,266,796) 419,826,641 - Net OPEB obligation 281,100,674 7,683,000 (5,681,682) 283,101,992 - Compensated absences 30,551,651 14,904,509 (2,086,902) 43,369,258 1,628,166 Liability for self-insurance losses 3,384,825 981,993 (918,135) 3,448,683 - Capital leases 5,235,539 4,810,158 (1,926,270) 8,119,427 1,711,949
Total long-term obligations $ 707,359,689 84,386,097 (33,879,785) 757,866,001 3,340,115
The Code of Virginia, Section 22, sets forth the powers and responsibilities of the local school boards. School boards in Virginia have no taxing authority, but they are authorized to borrow money from the Commonwealth and to sell local school bonds through the City to the Virginia Public School Authority (VPSA). In February 2002, the Virginia General Assembly passed Senate Bill 276, which was subsequently signed by the Governor of Virginia, that provides that localities have a tenancy in common with the school board whenever a locality incurs a financial obligation for school property which is payable over more than one fiscal year. As a result, the City records on its Statement of Net Position certain school property that is purchased with City long-term obligations. However, the Schools are still tasked with all care, management and control over these properties.
79
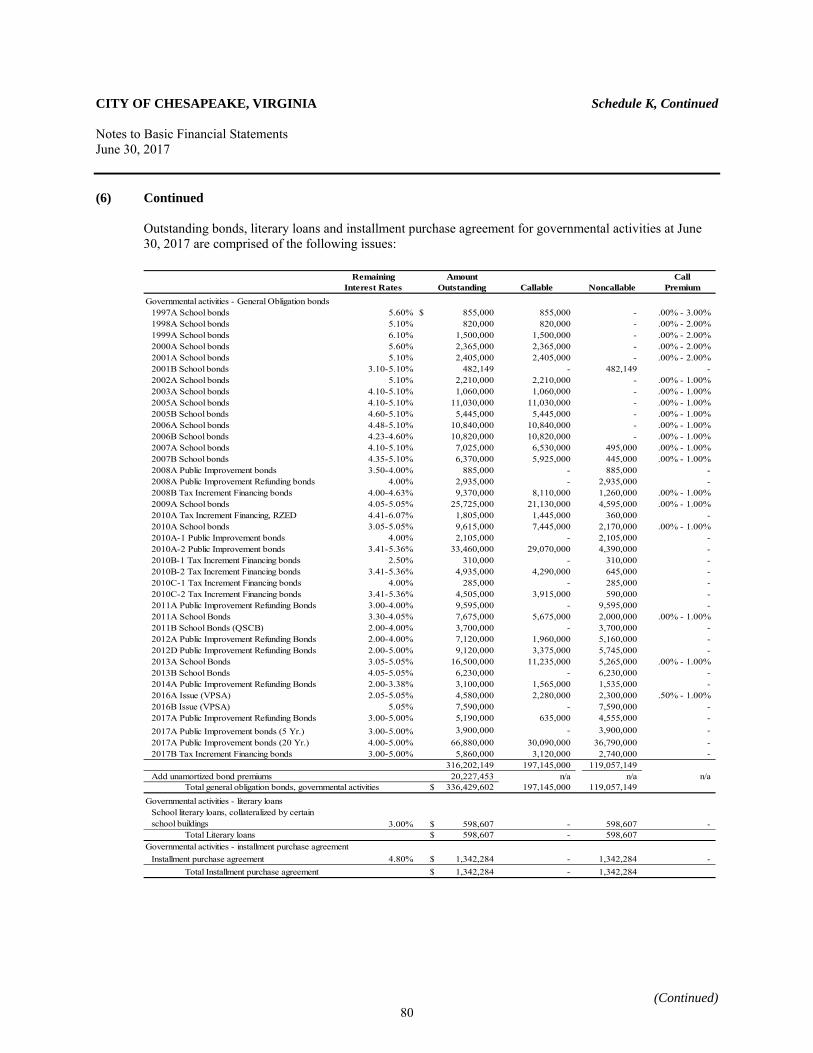
CITY OF CHESAPEAKE, VIRGINIA Schedule K, Continued Notes to Basic Financial Statements June 30, 2017
(Continued)
(6) Continued Outstanding bonds, literary loans and installment purchase agreement for governmental activities at June
30, 2017 are comprised of the following issues:
Remaining Amount CallInterest Rates Outstanding Callable Noncallable Premium
Governmental activities - General Obligation bonds1997A School bonds 5.60% $ 855,000 855,000 - .00% - 3.00%1998A School bonds 5.10% 820,000 820,000 - .00% - 2.00%1999A School bonds 6.10% 1,500,000 1,500,000 - .00% - 2.00%2000A School bonds 5.60% 2,365,000 2,365,000 - .00% - 2.00%2001A School bonds 5.10% 2,405,000 2,405,000 - .00% - 2.00%2001B School bonds 3.10-5.10% 482,149 - 482,149 - 2002A School bonds 5.10% 2,210,000 2,210,000 - .00% - 1.00%2003A School bonds 4.10-5.10% 1,060,000 1,060,000 - .00% - 1.00%2005A School bonds 4.10-5.10% 11,030,000 11,030,000 - .00% - 1.00%2005B School bonds 4.60-5.10% 5,445,000 5,445,000 - .00% - 1.00%2006A School bonds 4.48-5.10% 10,840,000 10,840,000 - .00% - 1.00%2006B School bonds 4.23-4.60% 10,820,000 10,820,000 - .00% - 1.00%2007A School bonds 4.10-5.10% 7,025,000 6,530,000 495,000 .00% - 1.00%2007B School bonds 4.35-5.10% 6,370,000 5,925,000 445,000 .00% - 1.00%2008A Public Improvement bonds 3.50-4.00% 885,000 - 885,000 - 2008A Public Improvement Refunding bonds 4.00% 2,935,000 - 2,935,000 - 2008B Tax Increment Financing bonds 4.00-4.63% 9,370,000 8,110,000 1,260,000 .00% - 1.00%2009A School bonds 4.05-5.05% 25,725,000 21,130,000 4,595,000 .00% - 1.00%
4.41-6.07% 1,805,000 1,445,000 360,000 - 2010A School bonds 3.05-5.05% 9,615,000 7,445,000 2,170,000 .00% - 1.00%2010A-1 Public Improvement bonds 4.00% 2,105,000 - 2,105,000 -
3.41-5.36% 33,460,000 29,070,000 4,390,000 - 2010B-1 Tax Increment Financing bonds 2.50% 310,000 - 310,000 -
3.41-5.36% 4,935,000 4,290,000 645,000 - 2010C-1 Tax Increment Financing bonds 4.00% 285,000 - 285,000 -
3.41-5.36% 4,505,000 3,915,000 590,000 - 2011A Public Improvement Refunding Bonds 3.00-4.00% 9,595,000 - 9,595,000 - 2011A School Bonds 3.30-4.05% 7,675,000 5,675,000 2,000,000 .00% - 1.00%2011B School Bonds (QSCB) 2.00-4.00% 3,700,000 - 3,700,000 - 2012A Public Improvement Refunding Bonds 2.00-4.00% 7,120,000 1,960,000 5,160,000 - 2012D Public Improvement Refunding Bonds 2.00-5.00% 9,120,000 3,375,000 5,745,000 - 2013A School Bonds 3.05-5.05% 16,500,000 11,235,000 5,265,000 .00% - 1.00%2013B School Bonds 4.05-5.05% 6,230,000 - 6,230,000 - 2014A Public Improvement Refunding Bonds 2.00-3.38% 3,100,000 1,565,000 1,535,000 - 2016A Issue (VPSA) 2.05-5.05% 4,580,000 2,280,000 2,300,000 .50% - 1.00%2016B Issue (VPSA) 5.05% 7,590,000 - 7,590,000 - 2017A Public Improvement Refunding Bonds 3.00-5.00% 5,190,000 635,000 4,555,000 - 2017A Public Improvement bonds (5 Yr.) 3.00-5.00% 3,900,000 - 3,900,000 - 2017A Public Improvement bonds (20 Yr.) 4.00-5.00% 66,880,000 30,090,000 36,790,000 - 2017B Tax Increment Financing bonds 3.00-5.00% 5,860,000 3,120,000 2,740,000 -
316,202,149 197,145,000 119,057,149Add unamortized bond premiums 20,227,453 n/a n/a n/a
Total general obligation bonds, governmental activities 336,429,602$ 197,145,000 119,057,149Governmental activities - literary loans
3.00% 598,607$ - 598,607 - Total Literary loans 598,607$ - 598,607
Governmental activities - installment purchase agreementInstallment purchase agreement 4.80% 1,342,284$ - 1,342,284 -
Total Installment purchase agreement 1,342,284$ - 1,342,284
2010A Tax Increment Financing, RZED
School literary loans, collateralized by certain school buildings
2010C-2 Tax Increment Financing bonds
2010B-2 Tax Increment Financing bonds
2010A-2 Public Improvement bonds
80
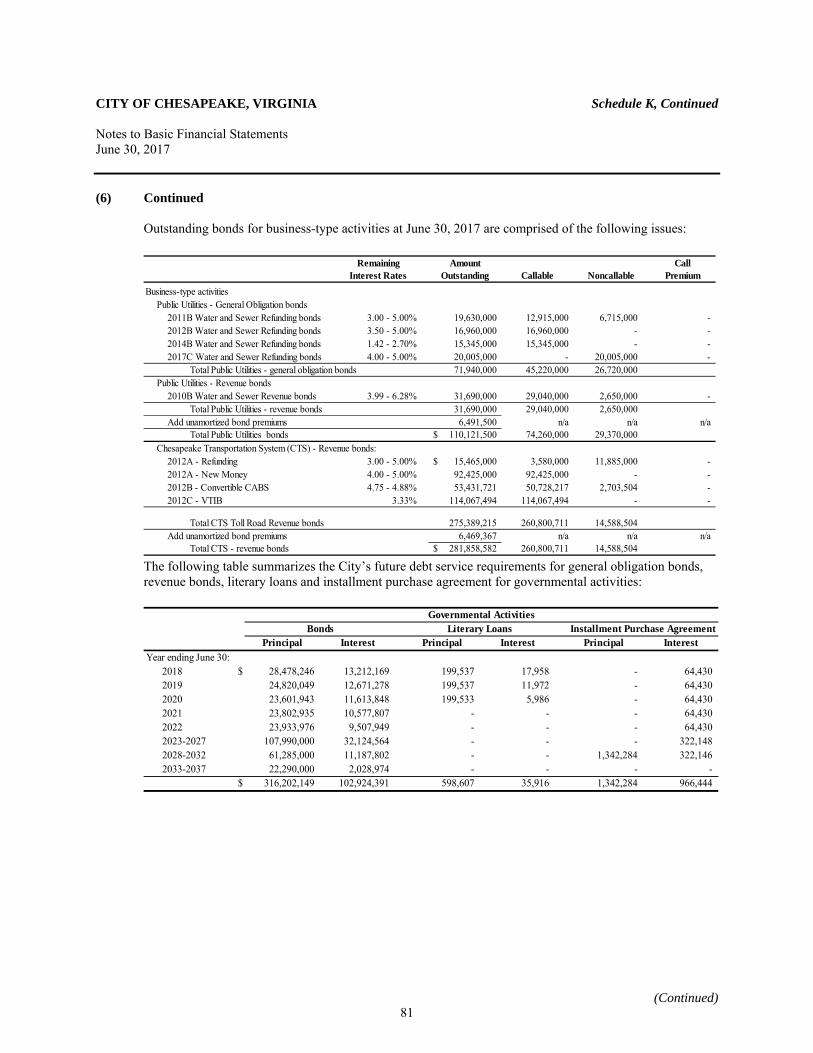
CITY OF CHESAPEAKE, VIRGINIA Schedule K, Continued Notes to Basic Financial Statements June 30, 2017
(Continued)
(6) Continued Outstanding bonds for business-type activities at June 30, 2017 are comprised of the following issues:
Remaining Amount CallInterest Rates Outstanding Callable Noncallable Premium
Business-type activitiesPublic Utilities - General Obligation bonds
2011B Water and Sewer Refunding bonds 3.00 - 5.00% 19,630,000 12,915,000 6,715,000 - 2012B Water and Sewer Refunding bonds 3.50 - 5.00% 16,960,000 16,960,000 - - 2014B Water and Sewer Refunding bonds 1.42 - 2.70% 15,345,000 15,345,000 - - 2017C Water and Sewer Refunding bonds 4.00 - 5.00% 20,005,000 - 20,005,000 -
Total Public Utilities - general obligation bonds 71,940,000 45,220,000 26,720,000 Public Utilities - Revenue bonds
2010B Water and Sewer Revenue bonds 3.99 - 6.28% 31,690,000 29,040,000 2,650,000 - Total Public Utilities - revenue bonds 31,690,000 29,040,000 2,650,000
Add unamortized bond premiums 6,491,500 n/a n/a n/aTotal Public Utilities bonds 110,121,500$ 74,260,000 29,370,000
Chesapeake Transportation System (CTS) - Revenue bonds:2012A - Refunding 3.00 - 5.00% 15,465,000$ 3,580,000 11,885,000 - 2012A - New Money 4.00 - 5.00% 92,425,000 92,425,000 - - 2012B - Convertible CABS 4.75 - 4.88% 53,431,721 50,728,217 2,703,504 - 2012C - VTIB 3.33% 114,067,494 114,067,494 - -
Total CTS Toll Road Revenue bonds 275,389,215 260,800,711 14,588,504Add unamortized bond premiums 6,469,367 n/a n/a n/a
Total CTS - revenue bonds 281,858,582$ 260,800,711 14,588,504 The following table summarizes the City’s future debt service requirements for general obligation bonds, revenue bonds, literary loans and installment purchase agreement for governmental activities:
Installment Purchase AgreementPrincipal Interest Principal Interest Principal Interest
Year ending June 30:2018 $ 28,478,246 13,212,169 199,537 17,958 - 64,430 2019 24,820,049 12,671,278 199,537 11,972 - 64,430 2020 23,601,943 11,613,848 199,533 5,986 - 64,430 2021 23,802,935 10,577,807 - - - 64,430 2022 23,933,976 9,507,949 - - - 64,430 2023-2027 107,990,000 32,124,564 - - - 322,148 2028-2032 61,285,000 11,187,802 - - 1,342,284 322,146 2033-2037 22,290,000 2,028,974 - - - -
$ 316,202,149 102,924,391 598,607 35,916 1,342,284 966,444
Governmental ActivitiesBonds Literary Loans
81
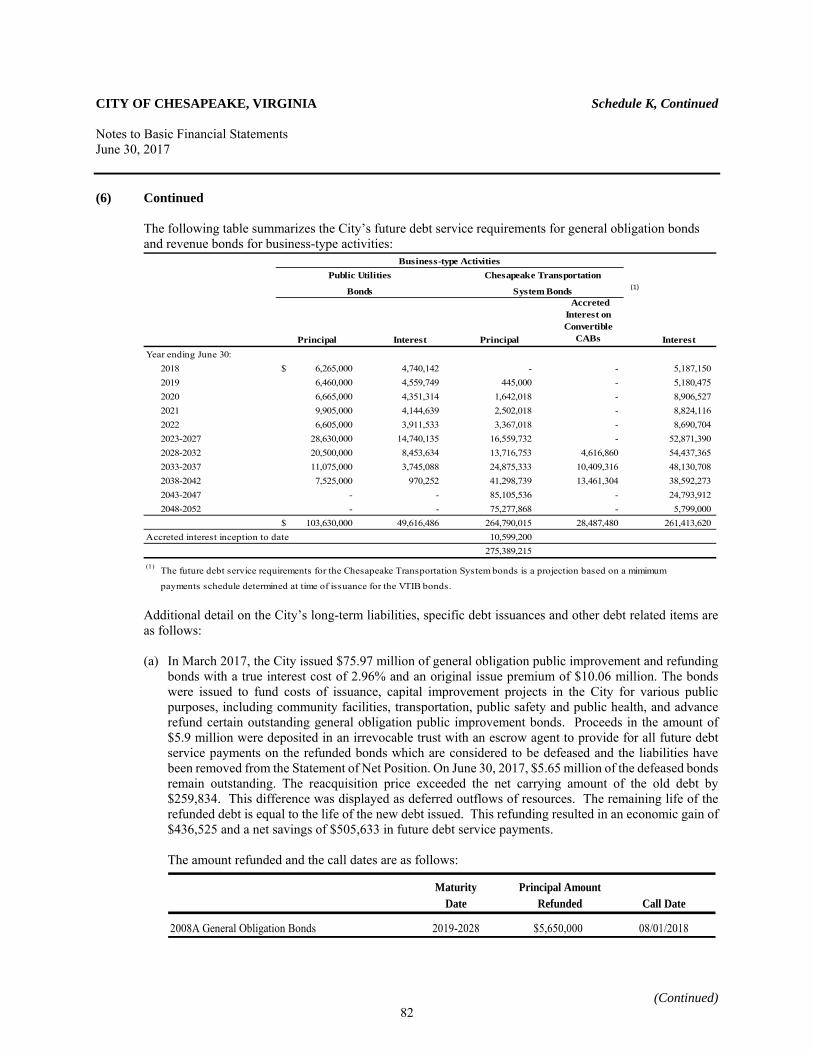
CITY OF CHESAPEAKE, VIRGINIA Schedule K, Continued Notes to Basic Financial Statements June 30, 2017
(Continued)
(6) Continued The following table summarizes the City’s future debt service requirements for general obligation bonds
and revenue bonds for business-type activities:
(1)
Principal Interest Principal
Accreted Interest on Convertible
CABs InterestYear ending June 30:
2018 6,265,000$ 4,740,142 - - 5,187,150 2019 6,460,000 4,559,749 445,000 - 5,180,475 2020 6,665,000 4,351,314 1,642,018 - 8,906,527 2021 9,905,000 4,144,639 2,502,018 - 8,824,116 2022 6,605,000 3,911,533 3,367,018 - 8,690,704 2023-2027 28,630,000 14,740,135 16,559,732 - 52,871,390 2028-2032 20,500,000 8,453,634 13,716,753 4,616,860 54,437,365 2033-2037 11,075,000 3,745,088 24,875,333 10,409,316 48,130,708 2038-2042 7,525,000 970,252 41,298,739 13,461,304 38,592,273 2043-2047 - - 85,105,536 - 24,793,912 2048-2052 - - 75,277,868 - 5,799,000
103,630,000$ 49,616,486 264,790,015 28,487,480 261,413,620 Accreted interest inception to date 10,599,200
275,389,215 (1) The future debt service requirements for the Chesapeake Transportation System bonds is a projection based on a mimimum
payments schedule determined at time of issuance for the VTIB bonds.
Business-type ActivitiesPublic Utilities Chesapeake Transportation
Bonds System Bonds
Additional detail on the City’s long-term liabilities, specific debt issuances and other debt related items are as follows:
(a) In March 2017, the City issued $75.97 million of general obligation public improvement and refunding
bonds with a true interest cost of 2.96% and an original issue premium of $10.06 million. The bonds were issued to fund costs of issuance, capital improvement projects in the City for various public purposes, including community facilities, transportation, public safety and public health, and advance refund certain outstanding general obligation public improvement bonds. Proceeds in the amount of $5.9 million were deposited in an irrevocable trust with an escrow agent to provide for all future debt service payments on the refunded bonds which are considered to be defeased and the liabilities have been removed from the Statement of Net Position. On June 30, 2017, $5.65 million of the defeased bonds remain outstanding. The reacquisition price exceeded the net carrying amount of the old debt by $259,834. This difference was displayed as deferred outflows of resources. The remaining life of the refunded debt is equal to the life of the new debt issued. This refunding resulted in an economic gain of $436,525 and a net savings of $505,633 in future debt service payments.
The amount refunded and the call dates are as follows:
Maturity Principal AmountDate Refunded Call Date
2008A General Obligation Bonds 2019-2028 $5,650,000 08/01/2018
82
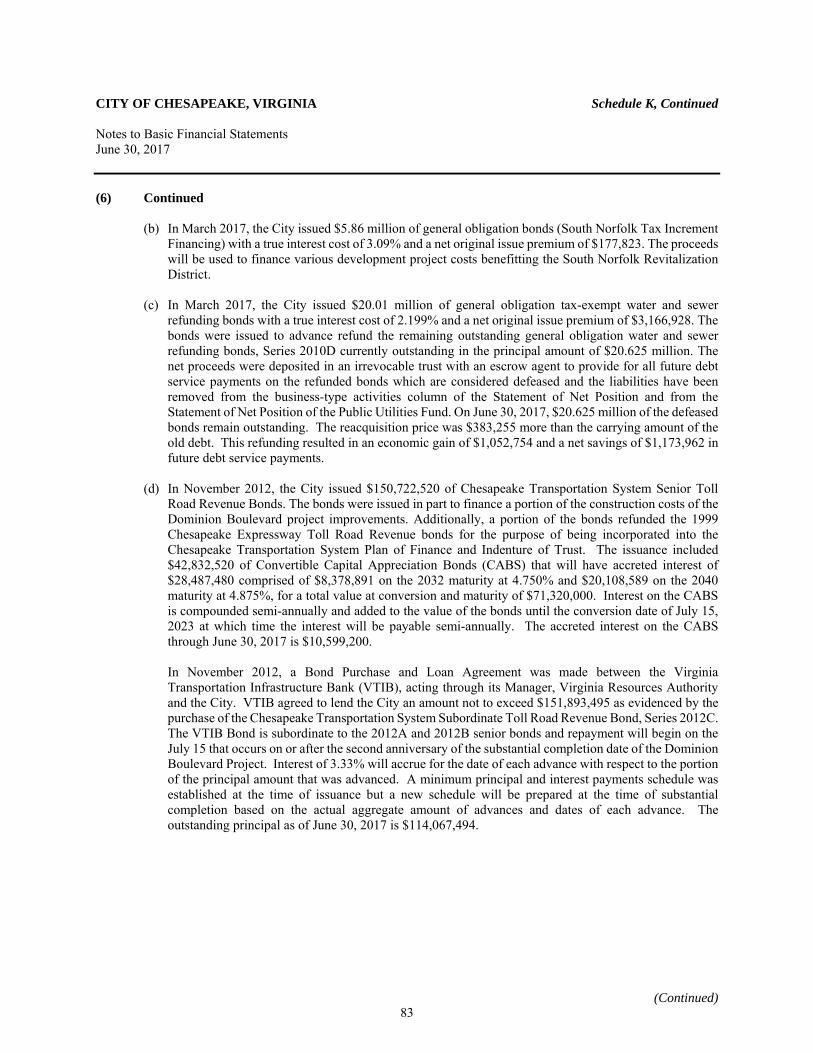
CITY OF CHESAPEAKE, VIRGINIA Schedule K, Continued Notes to Basic Financial Statements June 30, 2017
(Continued)
(6) Continued
(b) In March 2017, the City issued $5.86 million of general obligation bonds (South Norfolk Tax Increment Financing) with a true interest cost of 3.09% and a net original issue premium of $177,823. The proceeds will be used to finance various development project costs benefitting the South Norfolk Revitalization District.
(c) In March 2017, the City issued $20.01 million of general obligation tax-exempt water and sewer
refunding bonds with a true interest cost of 2.199% and a net original issue premium of $3,166,928. The bonds were issued to advance refund the remaining outstanding general obligation water and sewer refunding bonds, Series 2010D currently outstanding in the principal amount of $20.625 million. The net proceeds were deposited in an irrevocable trust with an escrow agent to provide for all future debt service payments on the refunded bonds which are considered defeased and the liabilities have been removed from the business-type activities column of the Statement of Net Position and from the Statement of Net Position of the Public Utilities Fund. On June 30, 2017, $20.625 million of the defeased bonds remain outstanding. The reacquisition price was $383,255 more than the carrying amount of the old debt. This refunding resulted in an economic gain of $1,052,754 and a net savings of $1,173,962 in future debt service payments.
(d) In November 2012, the City issued $150,722,520 of Chesapeake Transportation System Senior Toll
Road Revenue Bonds. The bonds were issued in part to finance a portion of the construction costs of the Dominion Boulevard project improvements. Additionally, a portion of the bonds refunded the 1999 Chesapeake Expressway Toll Road Revenue bonds for the purpose of being incorporated into the Chesapeake Transportation System Plan of Finance and Indenture of Trust. The issuance included $42,832,520 of Convertible Capital Appreciation Bonds (CABS) that will have accreted interest of $28,487,480 comprised of $8,378,891 on the 2032 maturity at 4.750% and $20,108,589 on the 2040 maturity at 4.875%, for a total value at conversion and maturity of $71,320,000. Interest on the CABS is compounded semi-annually and added to the value of the bonds until the conversion date of July 15, 2023 at which time the interest will be payable semi-annually. The accreted interest on the CABS through June 30, 2017 is $10,599,200.
In November 2012, a Bond Purchase and Loan Agreement was made between the Virginia Transportation Infrastructure Bank (VTIB), acting through its Manager, Virginia Resources Authority and the City. VTIB agreed to lend the City an amount not to exceed $151,893,495 as evidenced by the purchase of the Chesapeake Transportation System Subordinate Toll Road Revenue Bond, Series 2012C. The VTIB Bond is subordinate to the 2012A and 2012B senior bonds and repayment will begin on the July 15 that occurs on or after the second anniversary of the substantial completion date of the Dominion Boulevard Project. Interest of 3.33% will accrue for the date of each advance with respect to the portion of the principal amount that was advanced. A minimum principal and interest payments schedule was established at the time of issuance but a new schedule will be prepared at the time of substantial completion based on the actual aggregate amount of advances and dates of each advance. The outstanding principal as of June 30, 2017 is $114,067,494.
83
CITY OF CHESAPEAKE, VIRGINIA Schedule K, Continued Notes to Basic Financial Statements June 30, 2017
(Continued)
(6) Continued
In November 2012, an amended and restated “City-State Agreement” between the City and the Commonwealth of Virginia, Department of Transportation (VDOT) was executed. No repayments with respect to the 1999 Toll Facilities Revolving Account (TFRA) Payments, the Urban Allocation Payments or the City contribution shall be made until the VTIB loan has been paid in full. The 1999 TFRA payment and the City contribution shall accrue interest at a rate of 3% per year, compounded semi-annually on each interest payment date. The Urban Allocation payments to be replenished as provided in the 2012 Indenture shall not accrue interest. State contributions to be repaid as of June 30, 2017 are $66,700,057, which is comprised of $28,641,711 to TFRA and $38,058,346 to Urban Allocation.
(e) In addition to the full faith and credit of the City, the City has pledged certain incremental tax revenues
derived from the Greenbrier District and the South Norfolk District to pay principal and interest on Tax Incremental Financing bonds.
Water and Sewer Revenue Bonds are obligations of the City, payable solely from pledged revenues of the System, subject to the prior application thereof to the payment of Operating Expenses. The City will fix, charge, collect and revise its fees, rates and other charges for the use of and the services furnished by the System so as to produce revenues sufficient to meet its cash requirements and debt covenants detailed in its Agreement of Trust. Additionally, revenues from the System shall also be pledged on a subordinate lien basis for all general obligation bonds issued for the purpose of the System.
Chesapeake Transportation System Toll Road Revenue bonds and other obligations of the System are payable solely from net toll revenues as defined in its Indenture.
(f) In August 2011, the City purchased the completed transportation facilities and incidental right-of-way
improvements in the Edinburgh Planned Unit Development for $3,759,307. The funds for this purchase are to be derived solely from ½ of the real estate tax and ½ of 1% in sales tax that the City collects from the adjacent commercial area and is contingent on the City’s receipt of these taxes. The agreement provides for principal payments to be made in January and July of each calendar year. These payments are expected to take place over a five year period but this projection is not guaranteed and may involve a longer (or shorter) period of time. This debt has a 0% interest rate. At June 30, 2017, $1,226,520 was outstanding.
(g) On February 26, 2003, City Council adopted an ordinance establishing the Open Space and Agricultural
Preservation Program (OSAP). The purpose of the program is to encourage and promote the conservation of open space and agricultural land to preserve the rural character of Chesapeake. In January 2007, the City entered into its initial Installment Purchase Agreement in the amount of $1,342,284 for the acquisition of development rights through the purchase of preservation easements on land meeting the eligibility criteria. The agreement provides for the payment of the principal balance in a single installment due in 2032, with interest on the unpaid balance payable semi-annually until that date. This obligation represents general obligation debt that will be repaid from maturing zero coupon Treasury securities.
84
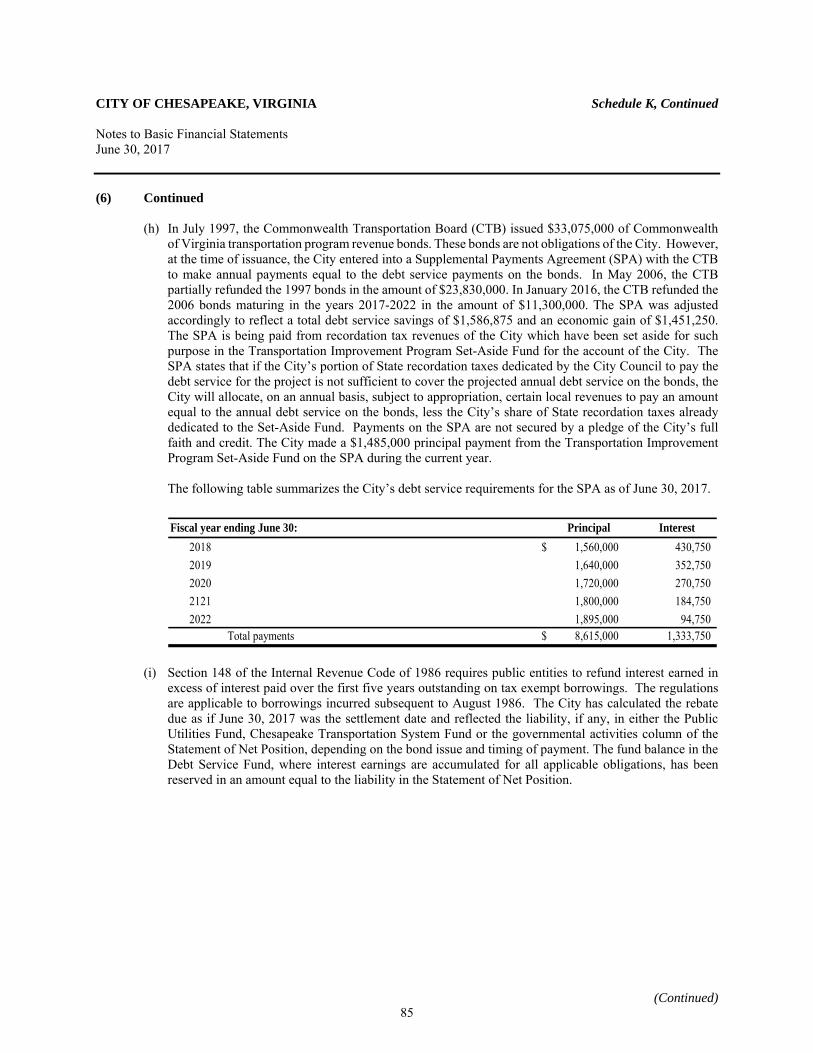
CITY OF CHESAPEAKE, VIRGINIA Schedule K, Continued Notes to Basic Financial Statements June 30, 2017
(Continued)
(6) Continued (h) In July 1997, the Commonwealth Transportation Board (CTB) issued $33,075,000 of Commonwealth
of Virginia transportation program revenue bonds. These bonds are not obligations of the City. However, at the time of issuance, the City entered into a Supplemental Payments Agreement (SPA) with the CTB to make annual payments equal to the debt service payments on the bonds. In May 2006, the CTB partially refunded the 1997 bonds in the amount of $23,830,000. In January 2016, the CTB refunded the 2006 bonds maturing in the years 2017-2022 in the amount of $11,300,000. The SPA was adjusted accordingly to reflect a total debt service savings of $1,586,875 and an economic gain of $1,451,250. The SPA is being paid from recordation tax revenues of the City which have been set aside for such purpose in the Transportation Improvement Program Set-Aside Fund for the account of the City. The SPA states that if the City’s portion of State recordation taxes dedicated by the City Council to pay the debt service for the project is not sufficient to cover the projected annual debt service on the bonds, the City will allocate, on an annual basis, subject to appropriation, certain local revenues to pay an amount equal to the annual debt service on the bonds, less the City’s share of State recordation taxes already dedicated to the Set-Aside Fund. Payments on the SPA are not secured by a pledge of the City’s full faith and credit. The City made a $1,485,000 principal payment from the Transportation Improvement Program Set-Aside Fund on the SPA during the current year.
The following table summarizes the City’s debt service requirements for the SPA as of June 30, 2017.
Fiscal year ending June 30: Principal Interest$ 1,560,000 430,750
1,640,000 352,750 1,720,000 270,750 1,800,000 184,750 1,895,000 94,750
Total payments $ 8,615,000 1,333,750
20182019202021212022
(i) Section 148 of the Internal Revenue Code of 1986 requires public entities to refund interest earned in
excess of interest paid over the first five years outstanding on tax exempt borrowings. The regulations are applicable to borrowings incurred subsequent to August 1986. The City has calculated the rebate due as if June 30, 2017 was the settlement date and reflected the liability, if any, in either the Public Utilities Fund, Chesapeake Transportation System Fund or the governmental activities column of the Statement of Net Position, depending on the bond issue and timing of payment. The fund balance in the Debt Service Fund, where interest earnings are accumulated for all applicable obligations, has been reserved in an amount equal to the liability in the Statement of Net Position.
85
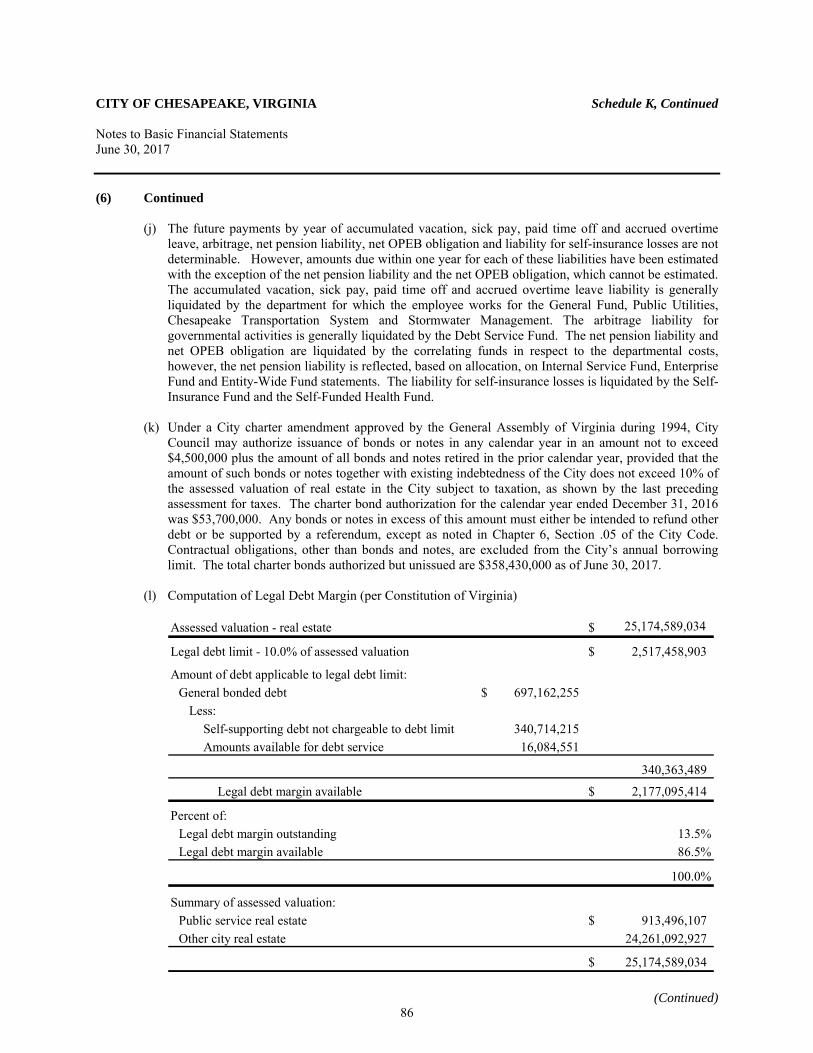
CITY OF CHESAPEAKE, VIRGINIA Schedule K, Continued Notes to Basic Financial Statements June 30, 2017
(Continued)
(6) Continued (j) The future payments by year of accumulated vacation, sick pay, paid time off and accrued overtime
leave, arbitrage, net pension liability, net OPEB obligation and liability for self-insurance losses are not determinable. However, amounts due within one year for each of these liabilities have been estimated with the exception of the net pension liability and the net OPEB obligation, which cannot be estimated. The accumulated vacation, sick pay, paid time off and accrued overtime leave liability is generally liquidated by the department for which the employee works for the General Fund, Public Utilities, Chesapeake Transportation System and Stormwater Management. The arbitrage liability for governmental activities is generally liquidated by the Debt Service Fund. The net pension liability and net OPEB obligation are liquidated by the correlating funds in respect to the departmental costs, however, the net pension liability is reflected, based on allocation, on Internal Service Fund, Enterprise Fund and Entity-Wide Fund statements. The liability for self-insurance losses is liquidated by the Self-Insurance Fund and the Self-Funded Health Fund.
(k) Under a City charter amendment approved by the General Assembly of Virginia during 1994, City
Council may authorize issuance of bonds or notes in any calendar year in an amount not to exceed $4,500,000 plus the amount of all bonds and notes retired in the prior calendar year, provided that the amount of such bonds or notes together with existing indebtedness of the City does not exceed 10% of the assessed valuation of real estate in the City subject to taxation, as shown by the last preceding assessment for taxes. The charter bond authorization for the calendar year ended December 31, 2016 was $53,700,000. Any bonds or notes in excess of this amount must either be intended to refund other debt or be supported by a referendum, except as noted in Chapter 6, Section .05 of the City Code. Contractual obligations, other than bonds and notes, are excluded from the City’s annual borrowing limit. The total charter bonds authorized but unissued are $358,430,000 as of June 30, 2017.
(l) Computation of Legal Debt Margin (per Constitution of Virginia)
Assessed valuation - real estate $ 25,174,589,034
Legal debt limit - 10.0% of assessed valuation $ 2,517,458,903
Amount of debt applicable to legal debt limit:General bonded debt $ 697,162,255
Less: Self-supporting debt not chargeable to debt limit 340,714,215 Amounts available for debt service 16,084,551
340,363,489
Legal debt margin available $ 2,177,095,414
Percent of:Legal debt margin outstanding 13.5%Legal debt margin available 86.5%
100.0%
Summary of assessed valuation:Public service real estate $ 913,496,107Other city real estate 24,261,092,927
$ 25,174,589,034
86
CITY OF CHESAPEAKE, VIRGINIA Schedule K, Continued Notes to Basic Financial Statements June 30, 2017
(Continued)
(6) Continued
The City Council adopted affordability policies that further restrict the amount that can be borrowed including a ceiling of $3,000 of overall net debt per capita and a threshold of 3.5% of overall net debt to assessed value of taxable real property. Effective July 1, 2015, the City Council amended the policies to include limiting the City’s tax-supported debt service to 10.0% of budgeted general governmental revenues. For fiscal year 2017, management believes the City is in compliance with these policies.
(m) Management believes the City is in compliance, in all material respects, with all significant financial
covenants contained in the bond indentures.
(n) In November 2011, the Airport Authority sold its $1,220,000 revenue refunding bonds to the Virginia Resources Authority as administrator of the Virginia Airports Revolving Fund. The purpose of the 2011 bonds was to refund the outstanding 1999 bonds to achieve debt service savings as well as restructuring the debt repayment by extending full maturity by five years. As part of this transaction, the City Council approved a new support agreement for the 2011 bonds, which pledges the City’s moral obligation with respect to the debt service reserve in substitution for the 1999 Agreement. At June 30, 2017, $815,000 of the bonds remain outstanding, all of which are callable.
(7) Advances and On Behalf Of Payments
The City has made the following advances and on behalf of payments:
Component Unit – Chesapeake Airport Authority
In September 2008, the City Council authorized the restructuring of two previous advances made to the Airport Authority with different repayment terms. The restructuring allowed both note terms to run simultaneously, with a 15-year repayment. The remaining balances of the two notes were cancelled and a new note for $439,100 was executed. Semi-annual payments of $13,500 began in fiscal year 2009 with a final balloon payment of $47,600 on June 15, 2023. A restricted classification of fund balance has been made in the General Fund for $82,362 and in the Debt Service Fund for $113,738 for the balance outstanding at June 30, 2017 of $196,100. The General Fund also budgeted and made payments of $315,630 on behalf of the Airport Authority during fiscal year 2017. The City does not intend to collect these payments from the Airport Authority, as they were not part of a note or loan. Component Unit – Chesapeake Port Authority The General Fund had advanced $944,407 to the Port Authority to provide working capital. The City had recorded a valuation allowance of an equal amount because the timing and certainty of collection was unknown. This balance was still outstanding on December 20, 2016 when City Council approved a resolution to forgive these loans. It was determined that the loan was deemed to be satisfied due to the offset by real estate tax revenues that have been received and are pending from the Port Authority’s sale of real property. In addition, the General Fund made payments of $9,696 on behalf of the Port Authority during fiscal year 2017.
87
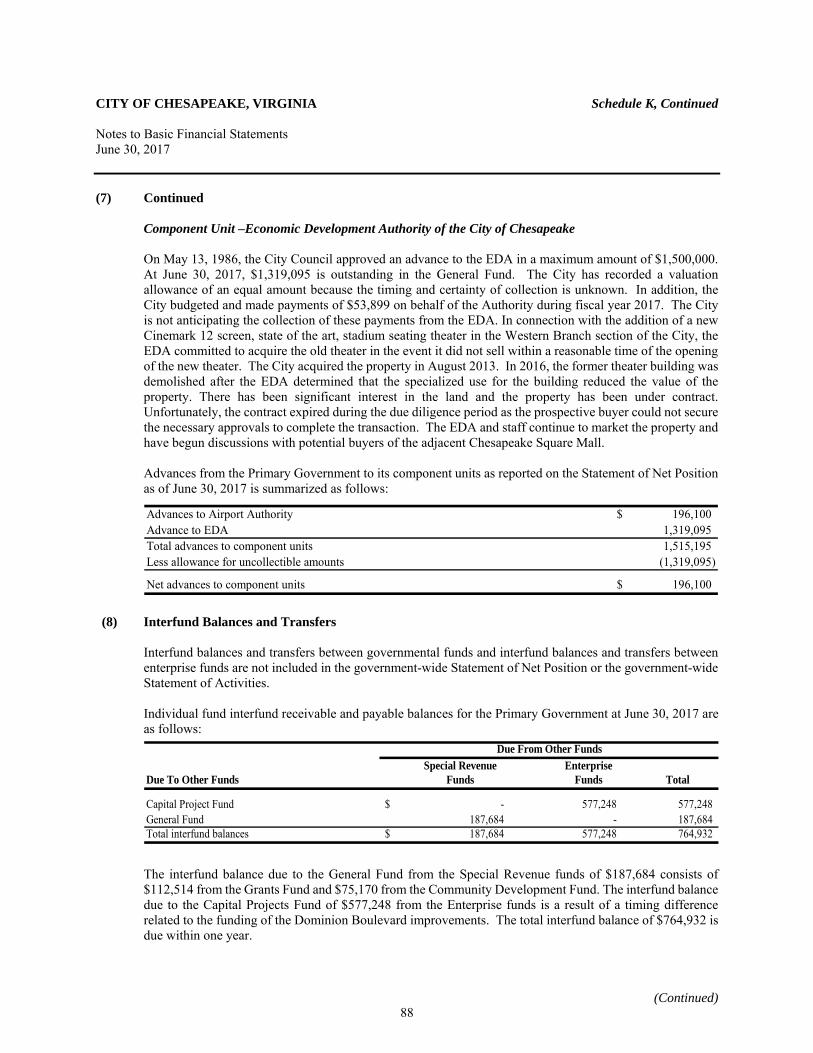
CITY OF CHESAPEAKE, VIRGINIA Schedule K, Continued Notes to Basic Financial Statements June 30, 2017
(Continued)
(7) Continued Component Unit –Economic Development Authority of the City of Chesapeake
On May 13, 1986, the City Council approved an advance to the EDA in a maximum amount of $1,500,000. At June 30, 2017, $1,319,095 is outstanding in the General Fund. The City has recorded a valuation allowance of an equal amount because the timing and certainty of collection is unknown. In addition, the City budgeted and made payments of $53,899 on behalf of the Authority during fiscal year 2017. The City is not anticipating the collection of these payments from the EDA. In connection with the addition of a new Cinemark 12 screen, state of the art, stadium seating theater in the Western Branch section of the City, the EDA committed to acquire the old theater in the event it did not sell within a reasonable time of the opening of the new theater. The City acquired the property in August 2013. In 2016, the former theater building was demolished after the EDA determined that the specialized use for the building reduced the value of the property. There has been significant interest in the land and the property has been under contract. Unfortunately, the contract expired during the due diligence period as the prospective buyer could not secure the necessary approvals to complete the transaction. The EDA and staff continue to market the property and have begun discussions with potential buyers of the adjacent Chesapeake Square Mall. Advances from the Primary Government to its component units as reported on the Statement of Net Position as of June 30, 2017 is summarized as follows:
Advances to Airport Authority $ 196,100Advance to EDA 1,319,095Total advances to component units 1,515,195Less allowance for uncollectible amounts (1,319,095)
Net advances to component units $ 196,100
(8) Interfund Balances and Transfers
Interfund balances and transfers between governmental funds and interfund balances and transfers between enterprise funds are not included in the government-wide Statement of Net Position or the government-wide Statement of Activities. Individual fund interfund receivable and payable balances for the Primary Government at June 30, 2017 are as follows:
Due To Other Funds Total
Capital Project Fund -$ 577,248 577,248 General Fund 187,684 - 187,684 Total interfund balances 187,684$ 577,248 764,932
Due From Other FundsSpecial Revenue
FundsEnterprise
Funds
The interfund balance due to the General Fund from the Special Revenue funds of $187,684 consists of $112,514 from the Grants Fund and $75,170 from the Community Development Fund. The interfund balance due to the Capital Projects Fund of $577,248 from the Enterprise funds is a result of a timing difference related to the funding of the Dominion Boulevard improvements. The total interfund balance of $764,932 is due within one year.
88
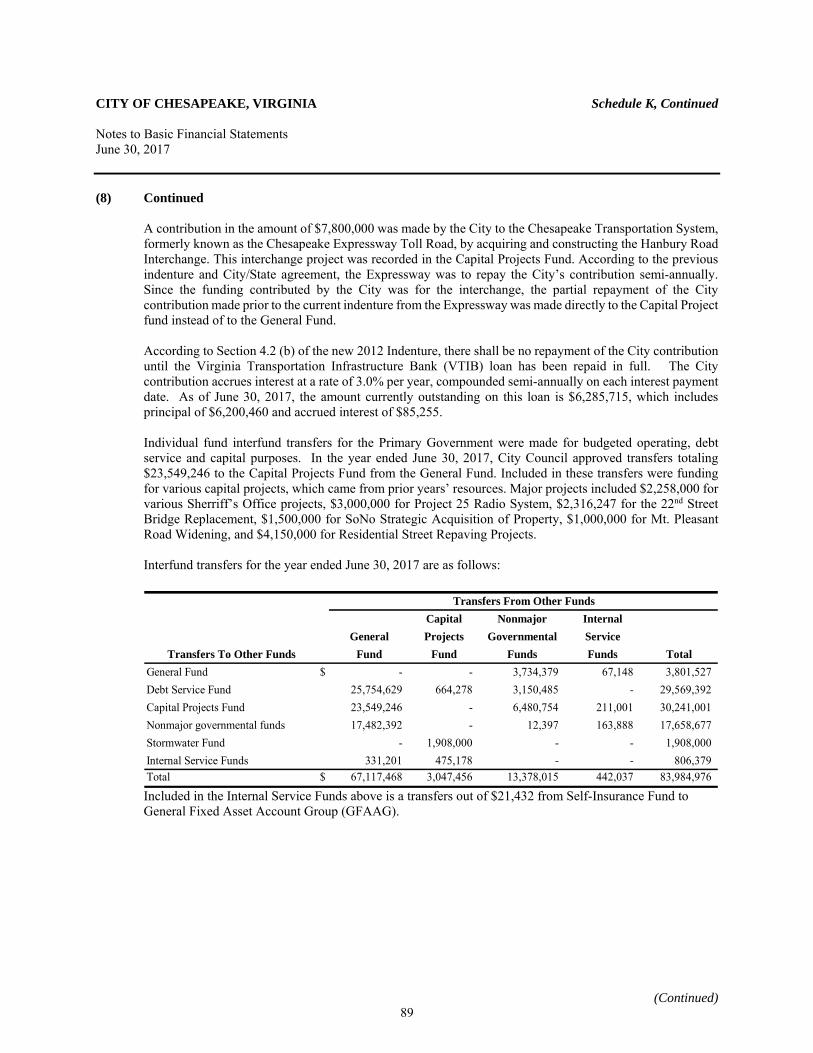
CITY OF CHESAPEAKE, VIRGINIA Schedule K, Continued Notes to Basic Financial Statements June 30, 2017
(Continued)
(8) Continued
A contribution in the amount of $7,800,000 was made by the City to the Chesapeake Transportation System, formerly known as the Chesapeake Expressway Toll Road, by acquiring and constructing the Hanbury Road Interchange. This interchange project was recorded in the Capital Projects Fund. According to the previous indenture and City/State agreement, the Expressway was to repay the City’s contribution semi-annually. Since the funding contributed by the City was for the interchange, the partial repayment of the City contribution made prior to the current indenture from the Expressway was made directly to the Capital Project fund instead of to the General Fund. According to Section 4.2 (b) of the new 2012 Indenture, there shall be no repayment of the City contribution until the Virginia Transportation Infrastructure Bank (VTIB) loan has been repaid in full. The City contribution accrues interest at a rate of 3.0% per year, compounded semi-annually on each interest payment date. As of June 30, 2017, the amount currently outstanding on this loan is $6,285,715, which includes principal of $6,200,460 and accrued interest of $85,255. Individual fund interfund transfers for the Primary Government were made for budgeted operating, debt service and capital purposes. In the year ended June 30, 2017, City Council approved transfers totaling $23,549,246 to the Capital Projects Fund from the General Fund. Included in these transfers were funding for various capital projects, which came from prior years’ resources. Major projects included $2,258,000 for various Sherriff’s Office projects, $3,000,000 for Project 25 Radio System, $2,316,247 for the 22nd Street Bridge Replacement, $1,500,000 for SoNo Strategic Acquisition of Property, $1,000,000 for Mt. Pleasant Road Widening, and $4,150,000 for Residential Street Repaving Projects.
Interfund transfers for the year ended June 30, 2017 are as follows:
Capital Nonmajor InternalGeneral Projects Governmental Service
Transfers To Other Funds Fund Fund Funds Funds TotalGeneral Fund $ - - 3,734,379 67,148 3,801,527 Debt Service Fund 25,754,629 664,278 3,150,485 - 29,569,392 Capital Projects Fund 23,549,246 - 6,480,754 211,001 30,241,001 Nonmajor governmental funds 17,482,392 - 12,397 163,888 17,658,677 Stormwater Fund - 1,908,000 - - 1,908,000 Internal Service Funds 331,201 475,178 - - 806,379 Total $ 67,117,468 3,047,456 13,378,015 442,037 83,984,976
Transfers From Other Funds
Included in the Internal Service Funds above is a transfers out of $21,432 from Self-Insurance Fund to General Fixed Asset Account Group (GFAAG).
89
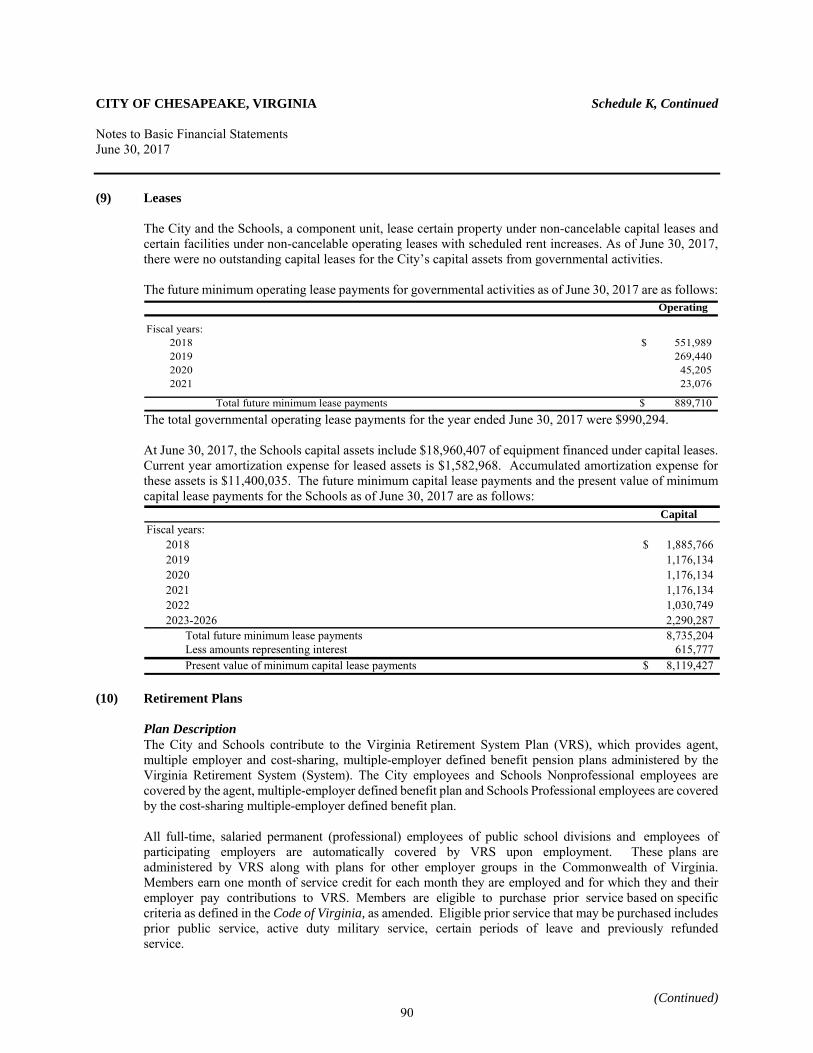
CITY OF CHESAPEAKE, VIRGINIA Schedule K, Continued Notes to Basic Financial Statements June 30, 2017
(Continued)
(9) Leases
The City and the Schools, a component unit, lease certain property under non-cancelable capital leases and certain facilities under non-cancelable operating leases with scheduled rent increases. As of June 30, 2017, there were no outstanding capital leases for the City’s capital assets from governmental activities. The future minimum operating lease payments for governmental activities as of June 30, 2017 are as follows:
Operating
Fiscal years:2018 $ 551,989 2019 269,440 2020 45,205 2021 23,076
Total future minimum lease payments $ 889,710
The total governmental operating lease payments for the year ended June 30, 2017 were $990,294. At June 30, 2017, the Schools capital assets include $18,960,407 of equipment financed under capital leases. Current year amortization expense for leased assets is $1,582,968. Accumulated amortization expense for these assets is $11,400,035. The future minimum capital lease payments and the present value of minimum capital lease payments for the Schools as of June 30, 2017 are as follows:
CapitalFiscal years:
2018 1,885,766$ 2019 1,176,1342020 1,176,1342021 1,176,1342022 1,030,7492023-2026 2,290,287
Total future minimum lease payments 8,735,204Less amounts representing interest 615,777Present value of minimum capital lease payments 8,119,427$
(10) Retirement Plans
Plan Description The City and Schools contribute to the Virginia Retirement System Plan (VRS), which provides agent, multiple employer and cost-sharing, multiple-employer defined benefit pension plans administered by the Virginia Retirement System (System). The City employees and Schools Nonprofessional employees are covered by the agent, multiple-employer defined benefit plan and Schools Professional employees are covered by the cost-sharing multiple-employer defined benefit plan.
All full-time, salaried permanent (professional) employees of public school divisions and employees of participating employers are automatically covered by VRS upon employment. These plans are administered by VRS along with plans for other employer groups in the Commonwealth of Virginia. Members earn one month of service credit for each month they are employed and for which they and their employer pay contributions to VRS. Members are eligible to purchase prior service based on specific criteria as defined in the Code of Virginia, as amended. Eligible prior service that may be purchased includes prior public service, active duty military service, certain periods of leave and previously refunded service.
90
CITY OF CHESAPEAKE, VIRGINIA Schedule K, Continued Notes to Basic Financial Statements June 30, 2017
(Continued)
(10) Continued Within the VRS Plan, the System administers three different benefit structures for covered employees – Plan 1, Plan 2 and Hybrid. Each of these benefit structures has a different eligibility criteria. The specific information for each plan and eligibility for covered groups within each plan are set out below:
VRS PLAN 1 About VRS Plan 1 VRS Plan 1 is a defined benefit plan. The retirement benefit is based on a member’s age, creditable service and average final compensation at retirement using a formula. Employees are eligible for VRS Plan 1 if their membership date is before July 1, 2010 and they were vested as of January 1, 2013. Eligible Members Employees are in VRS Plan 1 if their membership date is before July 1, 2010 and they were vested as of January 1, 2013. Hybrid Opt-In Election VRS non-hazardous duty covered Plan 1 members were allowed to make an irrevocable decision to opt into the Hybrid Retirement Plan during a special election window held January 1 through April 30, 2014. The Hybrid Retirement Plan’s effective date for eligible VRS Plan 1 members who opted in was July 1, 2014. If eligible deferred members returned to work during the election window, they were also eligible to opt into the Hybrid Retirement Plan. Members who were eligible for an optional retirement plan (ORP) and had prior service under VRS Plan 1 were not eligible to elect the Hybrid Retirement Plan and remain as VRS Plan 1 or ORP. Retirement Contributions Members contribute 5% of their compensation each month to their member contribution account through a pre-tax salary reduction. Member contributions are tax-deferred until they are withdrawn as part of a retirement benefit or as a refund. The employer makes a separate actuarially determined contribution to VRS for all covered employees. VRS invests both member and employer contributions to provide funding for the future benefit payment. Creditable Service Creditable service includes active service. Members earn creditable service for each month they are employed in a covered position. It also may include credit for prior service the member has purchased or additional creditable service the member was granted. A member’s total creditable service is one of the factors used to determine their eligibility for retirement and to calculate their retirement benefit. It also may count toward eligibility for the health insurance credit in retirement, if the employer offers the health insurance credit. Vesting Vesting is the minimum length of service a member needs to qualify for a future retirement benefit. Members become vested when they have at least five years (60 months) of creditable service. Vesting means members are eligible to qualify for retirement if they meet the age and service requirements for their plan. Members also must be vested to receive a full refund of their member contribution account balance if they leave employment and request a refund. Members are always 100% vested in the contributions that they make.
91
CITY OF CHESAPEAKE, VIRGINIA Schedule K, Continued Notes to Basic Financial Statements June 30, 2017
(Continued)
(10) Continued Calculating the Benefit The Basic Benefit is calculated based on a formula using the member’s average final compensation, a retirement multiplier and total service credit at retirement. It is one of the benefit payout options available to a member at retirement. An early retirement reduction factor is applied to the Basic Benefit if the member retires with a reduced retirement benefit or selects a benefit payout option other than the Basic Benefit. Average Final Compensation A member’s average final compensation is the average of the 36 consecutive months of highest compensation as a covered employee.
Service Retirement Multiplier The retirement multiplier is a factor used in the formula to determine a final retirement benefit. The retirement multiplier for non-hazardous duty members is 1.70%. The retirement multiplier for sheriffs and regional jail superintendents is 1.85%. The retirement multiplier of eligible political subdivision hazardous duty employees other than sheriffs and regional jail superintendents is 1.70% or 1.85% as elected by the employer. Retirement Age Normal retirement: Age 65. Political subdivision hazardous duty employees: Age 60. Earliest Unreduced Retirement Eligibility Members who are not in hazardous duty positions are eligible for an unreduced retirement benefit at age 65 with at least five years (60 months) of creditable service or at age 50 with at least 30 years of creditable service. Hazardous duty members are eligible for an unreduced retirement benefit at age 60 with at least five years (60 months) of creditable service or age 50 with at least 25 years of creditable service. Earliest Reduced Retirement Eligibility Members may retire with a reduced benefit as early as age 55 with at least five years (60 months) of creditable service or age 50 with at least 10 years of creditable service. Political subdivision hazardous duty employees may retire with a reduced benefit as early as age 55 with at least five years of creditable service. Cost-of-Living Adjustment (COLA) in Retirement The COLA matches the first 3% increase in the Consumer Price Index for all Urban Consumers (CPI-U) and half of any additional increase (up to 4%) up to a maximum COLA of 5%. For members who retire with an unreduced benefit or with a reduced benefit with at least 20 years of creditable service, the COLA will go into effect on July 1 after one full calendar year from the retirement date.
92
CITY OF CHESAPEAKE, VIRGINIA Schedule K, Continued Notes to Basic Financial Statements June 30, 2017
(Continued)
(10) Continued For members who retire with a reduced benefit and who have less than 20 years of creditable service, the COLA will go into effect on July 1 after one calendar year following the unreduced retirement eligibility date. Exceptions to COLA Effective Dates: The COLA is effective July 1 following one full calendar year (January 1 to December 31) under any of the following circumstances: The member is within five years of qualifying for an unreduced retirement benefit as of January 1,
2013. The member retires on disability. The member retires directly from short-term or long-term disability under the Virginia Sickness and
Disability Program (VSDP). The member is involuntarily separated from employment for causes other than job performance or
misconduct and is eligible to retire under the Workforce Transition Act or the Transitional Benefits Program.
The member dies in service and the member’s survivor or beneficiary is eligible for a monthly death-in-service benefit. The COLA will go into effect on July 1 following one full calendar year (January 1 to December 31) from the date the monthly benefit begins.
Disability Coverage Members who are eligible to be considered for disability retirement and retire on disability, the retirement multiplier is 1.70% on all service, regardless of when it was earned, purchased or granted. VSDP members are subject to a one-year waiting period before becoming eligible for non-work related disability benefits. Purchase of Prior Service Members may be eligible to purchase service from previous public employment, active duty military service, an eligible period of leave or VRS refunded service as creditable service in their plan. Prior creditable service counts toward vesting, eligibility for retirement and the health insurance credit. Only active members are eligible to purchase prior service. When buying service, members must purchase their most recent period of service first. Members also may be eligible to purchase periods of leave without pay.
VRS PLAN 2 About VRS Plan 2 VRS Plan 2 is a defined benefit plan. The retirement benefit is based on a member’s age, creditable service and average final compensation at retirement using a formula. Employees are eligible for VRS Plan 2 if their membership date is on or after July 1, 2010, or their membership date is before July 1, 2010 and they were not vested as of January 1, 2013. Eligible Members Employees are in VRS Plan 2 if their membership date is on or after July 1, 2010, or their membership date is before July 1, 2010 and they were not vested as of January 1, 2013. Hybrid Opt-In Election Eligible VRS Plan 2 members were allowed to make an irrevocable decision to opt into the Hybrid Retirement Plan during a special election window held January 1 through April 30, 2014.
93
CITY OF CHESAPEAKE, VIRGINIA Schedule K, Continued Notes to Basic Financial Statements June 30, 2017
(Continued)
(10) Continued The Hybrid Retirement Plan’s effective date for eligible VRS Plan 2 members who opted in was July 1, 2014. If eligible deferred members returned to work during the election window, they were also eligible to opt into the Hybrid Retirement Plan. Members who were eligible for an ORP and have prior service under VRS Plan 2 were not eligible to elect the Hybrid Retirement Plan and remain as VRS Plan 2 or ORP. Retirement Contributions Same as VRS Plan 1. Creditable Service Same as VRS Plan 1. Vesting Same as VRS Plan 1. Calculating the Benefit See definition under VRS Plan 1. Average Final Compensation A member’s average final compensation is the average of their 60 consecutive months of highest compensation as a covered employee. Service Retirement Multiplier Same as VRS Plan 1 for service earned, purchased or granted prior to January 1, 2013. For non-hazardous duty members the retirement multiplier is 1.65% for creditable service earned, purchased or granted on or after January 1, 2013. Sheriffs, regional jail superintendents and political subdivision hazardous duty employees: Same as Plan 1. Normal Retirement Age Normal Social Security retirement age. Political subdivision hazardous duty employees: Same as VRS Plan 1. Earliest Unreduced Retirement Eligibility Members who are not in hazardous duty positions are eligible for an unreduced retirement benefit when they reach normal Social Security retirement age and have at least five years (60 months) of creditable service or when their age and service equal 90. Political subdivision hazardous duty employees: Same as VRS Plan 1. Earliest Reduced Retirement Eligibility Members may retire with a reduced benefit as early as age 60 with at least five years (60 months) of creditable service. Political subdivision hazardous duty employees: Same as VRS Plan 1.
94
CITY OF CHESAPEAKE, VIRGINIA Schedule K, Continued Notes to Basic Financial Statements June 30, 2017
(Continued)
(10) Continued COLA in Retirement The COLA matches the first 2% increase in the CPI-U and half of any additional increase (up to 2%), for a maximum COLA of 3%. Eligibility: Same as VRS Plan 1. Exceptions to COLA Effective Dates: Same as VRS Plan 1.
Disability Coverage Members who are eligible to be considered for disability retirement and retire on disability, the retirement multiplier is 1.65% on all service, regardless of when it was earned, purchased or granted. VSDP members are subject to a one-year waiting period before becoming eligible for non-work related disability benefits. Purchase of Prior Service Same as VRS Plan 1.
VRS HYBRID RETIREMENT PLAN
About VRS Hybrid Retirement Plan The Hybrid Retirement Plan combines the features of a defined benefit plan and a defined contribution plan. Most members hired on or after January 1, 2014 are in this plan, as well as VRS Plan 1 and VRS Plan 2 members who were eligible and opted into the plan during a special election window. (See “Eligible Members”)
The defined benefit is based on a member’s age, creditable service and average final compensation at retirement using a formula. The benefit from the defined contribution component of the plan depends on the member and employer contributions made to the plan and the investment performance of those contributions. In addition to the monthly benefit payment payable from the defined benefit plan at retirement, a member may start receiving distributions from the balance in the defined contribution account, reflecting the contributions, investment gains or losses and any required fees. Eligible Members Employees are in the Hybrid Retirement Plan if their membership date is on or after January 1, 2014. This includes: • Political subdivision employees* • School division employees • Members in VRS Plan 1 or VRS Plan 2 who elected to opt into the plan during the election window
held January 1-April 30, 2014; the plan’s effective date for opt-in members was July 1, 2014 *Non-Eligible Members – Some employees are not eligible to participate in the Hybrid Retirement Plan. They include political subdivision employees who are covered by enhanced benefits for hazardous duty employees.
Those employees eligible for an ORP must elect the ORP plan or the Hybrid Retirement Plan. If these members have prior service under VRS Plan 1 or VRS Plan 2, they are not eligible to elect the Hybrid Retirement Plan and must select VRS Plan 1 or VRS Plan 2 (as applicable) or ORP.
95
CITY OF CHESAPEAKE, VIRGINIA Schedule K, Continued Notes to Basic Financial Statements June 30, 2017
(Continued)
(10) Continued Retirement Contributions A member’s retirement benefit is funded through mandatory and voluntary contributions made by the member and the employer to both the defined benefit and the defined contribution components of the plan. Mandatory contributions are based on a percentage of the employee’s creditable compensation and are required from both the member and the employer. Additionally, members may choose to make voluntary contributions to the defined contribution component of the plan and the employer is required to match those voluntary contributions according to specified percentages. Creditable Service Defined Benefit Component: Under the defined benefit component of the plan, creditable service includes active service. Members earn creditable service for each month they are employed in a covered position. It also may include credit for prior service the member has purchased or additional creditable service the member was granted. A member’s total creditable service is one of the factors used to determine their eligibility for retirement and to calculate their retirement benefit. It also may count toward eligibility for the health insurance credit in retirement, if the employer offers the health insurance credit. Defined Contributions Component: Under the defined contribution component, creditable service is used to determine vesting for the employer contribution portion of the plan. Vesting Defined Benefit Component: Defined benefit vesting is the minimum length of service a member needs to qualify for a future retirement benefit. Members are vested under the defined benefit component of the Hybrid Retirement Plan when they reach five years (60 months) of creditable service. VRS Plan 1 or VRS Plan 2 members with at least five years (60 months) of creditable service who opted into the Hybrid Retirement Plan remain vested in the defined benefit component. Defined Contributions Component: Defined contribution vesting refers to the minimum length of service a member needs to be eligible to withdraw the employer contributions from the defined contribution component of the plan. Members are always 100% vested in the contributions that they make. Upon retirement or leaving covered employment, a member is eligible to withdraw a percentage of employer contributions to the defined contribution component of the plan, based on service. • After two years, a member is 50% vested and may withdraw 50% of employer contributions. • After three years, a member is 75% vested and may withdraw 75% of employer contributions. • After four or more years, a member is 100% vested and may withdraw 100% of employer
contributions. Distribution is not required by law until age 70½.
96
CITY OF CHESAPEAKE, VIRGINIA Schedule K, Continued Notes to Basic Financial Statements June 30, 2017
(Continued)
(10) Continued Calculating the Benefit Defined Benefit Component: See definition under VRS Plan 1. Defined Contribution Component: The benefit is based on contributions made by the member and any matching contributions made by the employer, plus net investment earnings on those contributions. Average Final Compensation Same as VRS Plan 2. It is used in the retirement formula for the defined benefit component of the plan. Service Retirement Multiplier Defined Benefit Component: The retirement multiplier for the defined benefit component is 1.0%. For members that opted into the Hybrid Retirement Plan from VRS Plan 1 or VRS Plan 2, the applicable multipliers for those plans will be used to calculate the retirement benefit for service credited in those plans. Defined Contribution Component: Not applicable. Normal Retirement Age Defined Benefit Component: Same as VRS Plan 2. Defined Contribution Component: Members are eligible to receive distributions upon leaving employment, subject to restrictions. Earliest Unreduced Retirement Eligibility Defined Benefit Component: Members are eligible for an unreduced retirement benefit when they reach normal Social Security retirement age and have at least five years (60 months) of creditable service or when their age and service equal 90. Defined Contribution Component: Members are eligible to receive distributions upon leaving employment, subject to restrictions. Earliest Reduced Retirement Eligibility Defined Benefit Component: Members may retire with a reduced benefit as early as age 60 with at least five years (60 months) of creditable service. Defined Contribution Component: Members are eligible to receive distributions upon leaving employment, subject to restrictions. COLA in Retirement Defined Benefit Component: Same as VRS Plan 2.
97
CITY OF CHESAPEAKE, VIRGINIA Schedule K, Continued Notes to Basic Financial Statements June 30, 2017
(Continued)
(10) Continued Defined Contribution Component: Not applicable. Eligibility: Same as VRS Plan 1 and VRS Plan 2. Exceptions to COLA Effective Dates: Same as VRS Plan 1 and VRS Plan 2. Disability Coverage Eligible political subdivision and school division (including VRS Plan 1 and VRS Plan 2 opt-ins) participate in the Virginia Local Disability Program (VLDP) unless their local governing body provides an employer-paid comparable program for its members. Hybrid members (including VRS Plan 1 and VRS Plan 2 opt-ins) covered under VLDP are subject to a one-year waiting period before becoming eligible for non-work related disability benefits. Purchase of Prior Service Defined Benefit Component: Same as VRS Plan 1, with the following exceptions:
Hybrid Retirement Plan members are ineligible for ported service. The cost of purchasing refunded service is the higher of 4% of creditable compensation or average
final compensation. Plan members have one year from their date of hire or return from leave to purchase all but refunded
prior service at approximate normal cost. After that one year period, the rate for most categories of service will change to actuarial cost.
Defined Contribution Component: Not applicable. Employees Covered by Benefit Terms As of the June 30, 2015 actuarial valuation, the following employees were covered by the benefit terms of the pension plan:
Inactive members or their beneficiaries currently receiving benefits 1,938 634 Inactive members not currently receiving benefits:
Vested inactive members 417 95 Non-vested inactive members 712 211 Active elsewhere in VRS 732 142
Total inactive members not currently receiving benefits 1,861 448 Active members 3,080 1,069
Total covered employees 6,879 2,151
City
SchoolsNonprofessional
Employees
98
CITY OF CHESAPEAKE, VIRGINIA Schedule K, Continued Notes to Basic Financial Statements June 30, 2017
(Continued)
(10) Continued Contributions The contribution requirement for active employees is governed by §51.1-145 of the Code of Virginia, as amended, but may be impacted as a result of funding options provided to political subdivisions by the Virginia General Assembly or as a result of funding provided to school divisions by the Virginia General Assembly. Employees are required to contribute 5.00% of their compensation toward their retirement. Prior to July 1, 2012, all or part of the 5.00% member contribution may have been assumed by the employer. Beginning July 1, 2012 new employees were required to pay the 5.00% member contribution. In addition, for existing employees, employers were required to begin making the employee pay the 5.00% member contribution. This could be phased in over a period of up to 5 years and the employer is required to provide a salary increase equal to the amount of the increase in the employee-paid member contribution. The City’s contractually required contribution rate for the year ended June 30, 2017 was 13.71% of covered employee compensation. This rate was based on an actuarially determined rate from an actuarial valuation as of June 30, 2015. This rate, when combined with employee contributions, was expected to finance the costs of benefits earned by employees during the year, with an additional amount to finance any unfunded accrued liability. Contributions to the pension plan from the City were $21,204,323 and $23,530,469 for the years ended June 30, 2017 and June 30, 2016, respectively.
The Schools’ nonprofessional contractually required contribution rate for the year ended June 30, 2017 was
9.10% of covered employee compensation. This rate was based on an actuarially determined rate from an actuarial valuation as of June 30, 2015. This rate, when combined with employee contributions, was expected to finance the costs of benefits earned by employees during the year, with an additional amount to finance any unfunded accrued liability. Contributions to the pension plan from Schools were $1,936,293 and $2,290,138 for the years ended June 30, 2017 and June 30, 2016, respectively.
Each school division’s contractually required contribution rate for teachers for the year ended June 30, 2017 was 14.66% of covered employee compensation. This rate was based on an actuarially determined rate from an actuarial valuation as of June 30, 2015 and reflects the transfer of $192,884,000 as an accelerated payback of the deferred contribution in the 2010-12 biennium. The actuarial rate for the Teacher Retirement Plan was 16.32%. The actuarially determined rate, when combined with employee contributions, was expected to finance the costs of benefits earned by employees during the year, with an additional amount to finance any unfunded accrued liability. Based on the provisions of §51.1-145 of the Code of Virginia, as amended, the contributions were funded at 89.84% of the actuarial rate for the year ended June 30, 2017. Contributions to the pension plan from the school division were $32,815,991 and $30,557,558 for the years ended June 30, 2017 and June 30, 2016, respectively. Net Pension Liability The City’s and Schools’ nonprofessional net pension liabilities were measured as of June 30, 2016. The total pension liability used to calculate the net pension liability was determined by an actuarial valuation performed as of June 30, 2015, using updated actuarial assumptions, applied to all periods included in the measurement and rolled forward to the measurement date of June 30, 2016.
At June 30, 2017 Schools reported a liability of $400,913,000 for its proportionate share of the net pension liability of the Teacher Retirement Plan. The net pension liability was measured as of June 30, 2016 and the total pension liability used to calculate the net pension liability was determined by an actuarial valuation as of that date. The Schools proportion of the net pension liability was based on Schools’ actuarially determined employer contributions to the pension plan for the year ended June 30, 2016 relative to the total of actuarially determined employer contributions for all participating employers. As of June 30, 2016, the Schools’ proportion was 2.86078% as compared to 2.94792% at June 30, 2015.
99
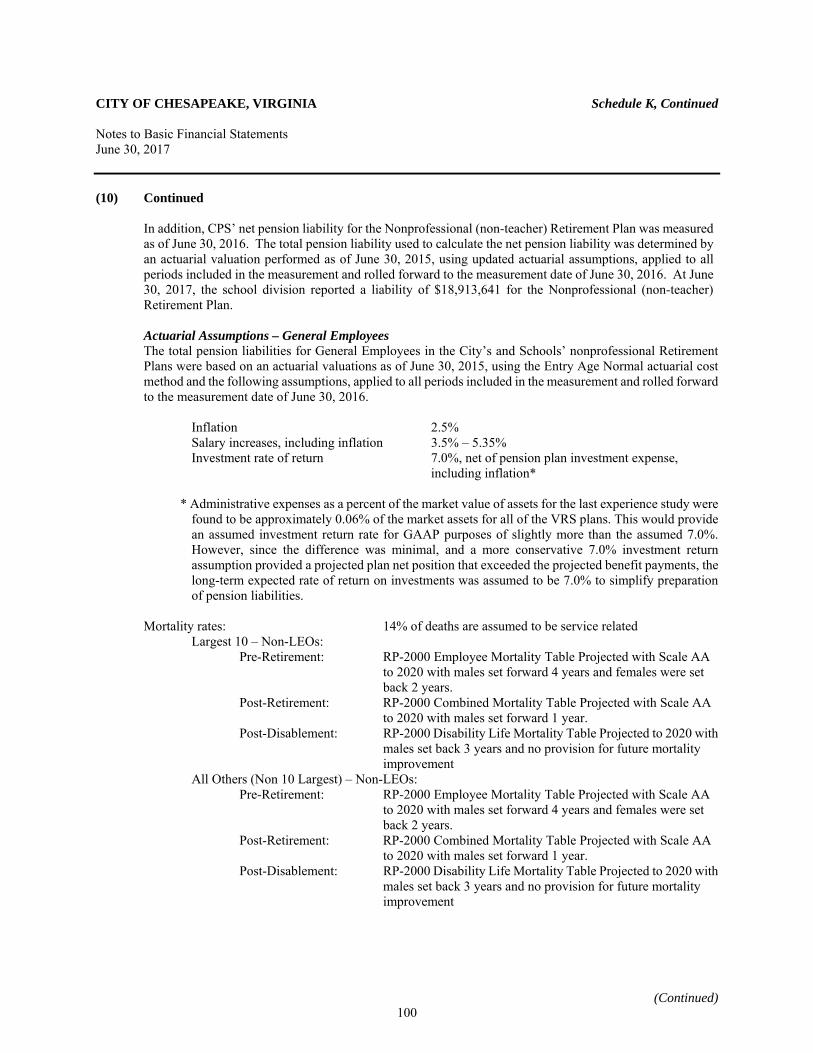
CITY OF CHESAPEAKE, VIRGINIA Schedule K, Continued Notes to Basic Financial Statements June 30, 2017
(Continued)
(10) Continued
In addition, CPS’ net pension liability for the Nonprofessional (non-teacher) Retirement Plan was measured as of June 30, 2016. The total pension liability used to calculate the net pension liability was determined by an actuarial valuation performed as of June 30, 2015, using updated actuarial assumptions, applied to all periods included in the measurement and rolled forward to the measurement date of June 30, 2016. At June 30, 2017, the school division reported a liability of $18,913,641 for the Nonprofessional (non-teacher) Retirement Plan.
Actuarial Assumptions – General Employees The total pension liabilities for General Employees in the City’s and Schools’ nonprofessional Retirement Plans were based on an actuarial valuations as of June 30, 2015, using the Entry Age Normal actuarial cost method and the following assumptions, applied to all periods included in the measurement and rolled forward to the measurement date of June 30, 2016. Inflation 2.5% Salary increases, including inflation 3.5% – 5.35% Investment rate of return 7.0%, net of pension plan investment expense,
including inflation* * Administrative expenses as a percent of the market value of assets for the last experience study were
found to be approximately 0.06% of the market assets for all of the VRS plans. This would provide an assumed investment return rate for GAAP purposes of slightly more than the assumed 7.0%. However, since the difference was minimal, and a more conservative 7.0% investment return assumption provided a projected plan net position that exceeded the projected benefit payments, the long-term expected rate of return on investments was assumed to be 7.0% to simplify preparation of pension liabilities.
Mortality rates: 14% of deaths are assumed to be service related
Largest 10 – Non-LEOs: Pre-Retirement: RP-2000 Employee Mortality Table Projected with Scale AA
to 2020 with males set forward 4 years and females were set back 2 years.
Post-Retirement: RP-2000 Combined Mortality Table Projected with Scale AA to 2020 with males set forward 1 year.
Post-Disablement: RP-2000 Disability Life Mortality Table Projected to 2020 with males set back 3 years and no provision for future mortality improvement
All Others (Non 10 Largest) – Non-LEOs: Pre-Retirement: RP-2000 Employee Mortality Table Projected with Scale AA
to 2020 with males set forward 4 years and females were set back 2 years.
Post-Retirement: RP-2000 Combined Mortality Table Projected with Scale AA to 2020 with males set forward 1 year.
Post-Disablement: RP-2000 Disability Life Mortality Table Projected to 2020 with males set back 3 years and no provision for future mortality improvement
100
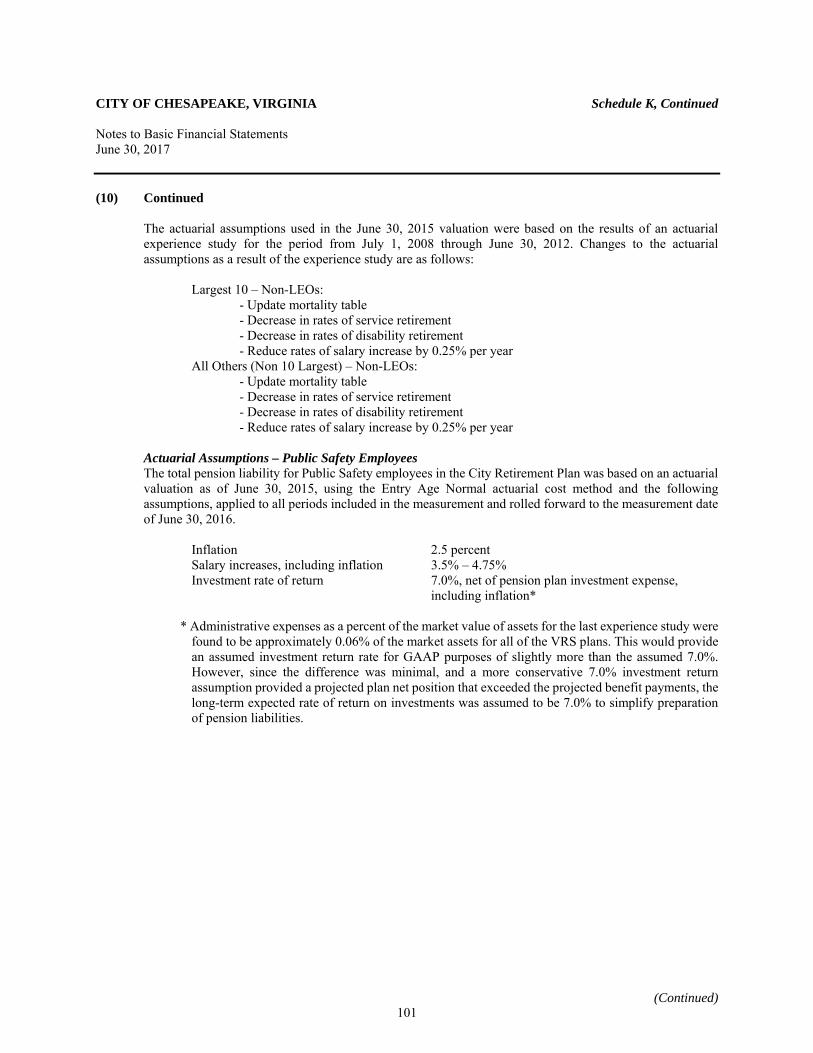
CITY OF CHESAPEAKE, VIRGINIA Schedule K, Continued Notes to Basic Financial Statements June 30, 2017
(Continued)
(10) Continued
The actuarial assumptions used in the June 30, 2015 valuation were based on the results of an actuarial experience study for the period from July 1, 2008 through June 30, 2012. Changes to the actuarial assumptions as a result of the experience study are as follows: Largest 10 – Non-LEOs: - Update mortality table - Decrease in rates of service retirement - Decrease in rates of disability retirement - Reduce rates of salary increase by 0.25% per year All Others (Non 10 Largest) – Non-LEOs: - Update mortality table - Decrease in rates of service retirement - Decrease in rates of disability retirement - Reduce rates of salary increase by 0.25% per year
Actuarial Assumptions – Public Safety Employees The total pension liability for Public Safety employees in the City Retirement Plan was based on an actuarial valuation as of June 30, 2015, using the Entry Age Normal actuarial cost method and the following assumptions, applied to all periods included in the measurement and rolled forward to the measurement date of June 30, 2016. Inflation 2.5 percent Salary increases, including inflation 3.5% – 4.75% Investment rate of return 7.0%, net of pension plan investment expense,
including inflation* * Administrative expenses as a percent of the market value of assets for the last experience study were
found to be approximately 0.06% of the market assets for all of the VRS plans. This would provide an assumed investment return rate for GAAP purposes of slightly more than the assumed 7.0%. However, since the difference was minimal, and a more conservative 7.0% investment return assumption provided a projected plan net position that exceeded the projected benefit payments, the long-term expected rate of return on investments was assumed to be 7.0% to simplify preparation of pension liabilities.
101
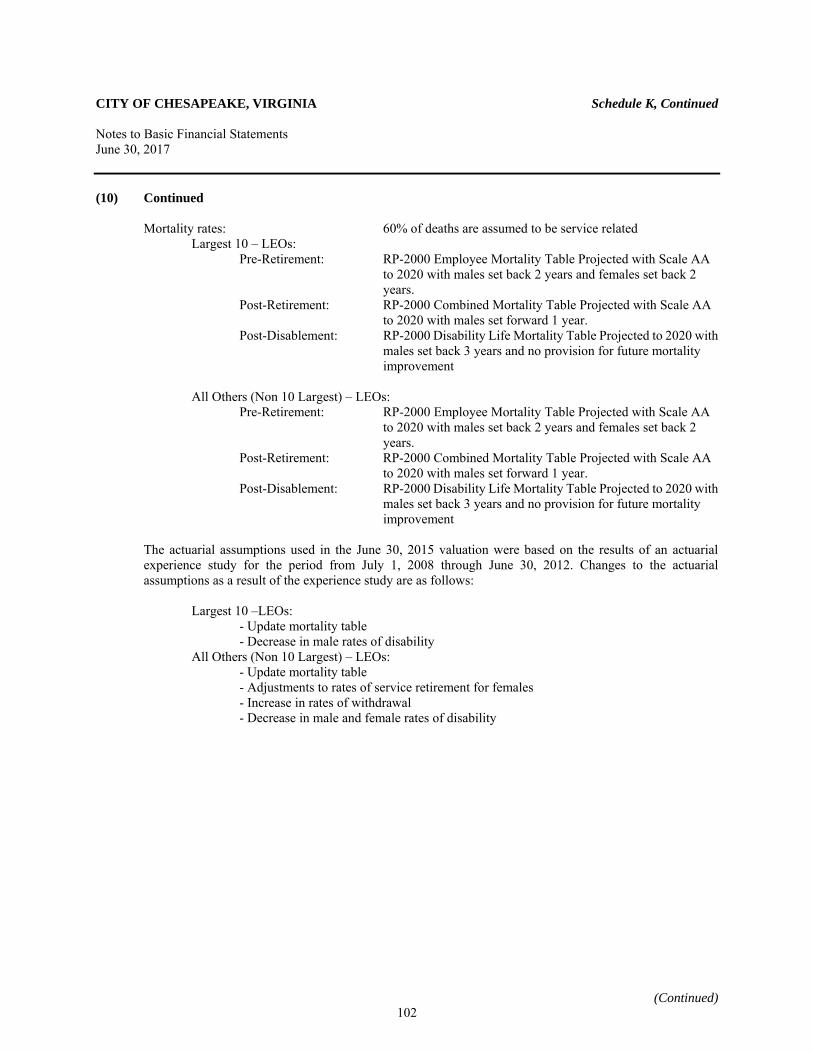
CITY OF CHESAPEAKE, VIRGINIA Schedule K, Continued Notes to Basic Financial Statements June 30, 2017
(Continued)
(10) Continued
Mortality rates: 60% of deaths are assumed to be service related Largest 10 – LEOs: Pre-Retirement: RP-2000 Employee Mortality Table Projected with Scale AA
to 2020 with males set back 2 years and females set back 2 years.
Post-Retirement: RP-2000 Combined Mortality Table Projected with Scale AA to 2020 with males set forward 1 year.
Post-Disablement: RP-2000 Disability Life Mortality Table Projected to 2020 with males set back 3 years and no provision for future mortality improvement
All Others (Non 10 Largest) – LEOs: Pre-Retirement: RP-2000 Employee Mortality Table Projected with Scale AA
to 2020 with males set back 2 years and females set back 2 years.
Post-Retirement: RP-2000 Combined Mortality Table Projected with Scale AA to 2020 with males set forward 1 year.
Post-Disablement: RP-2000 Disability Life Mortality Table Projected to 2020 with males set back 3 years and no provision for future mortality improvement
The actuarial assumptions used in the June 30, 2015 valuation were based on the results of an actuarial experience study for the period from July 1, 2008 through June 30, 2012. Changes to the actuarial assumptions as a result of the experience study are as follows: Largest 10 –LEOs: - Update mortality table - Decrease in male rates of disability All Others (Non 10 Largest) – LEOs: - Update mortality table - Adjustments to rates of service retirement for females - Increase in rates of withdrawal - Decrease in male and female rates of disability
102
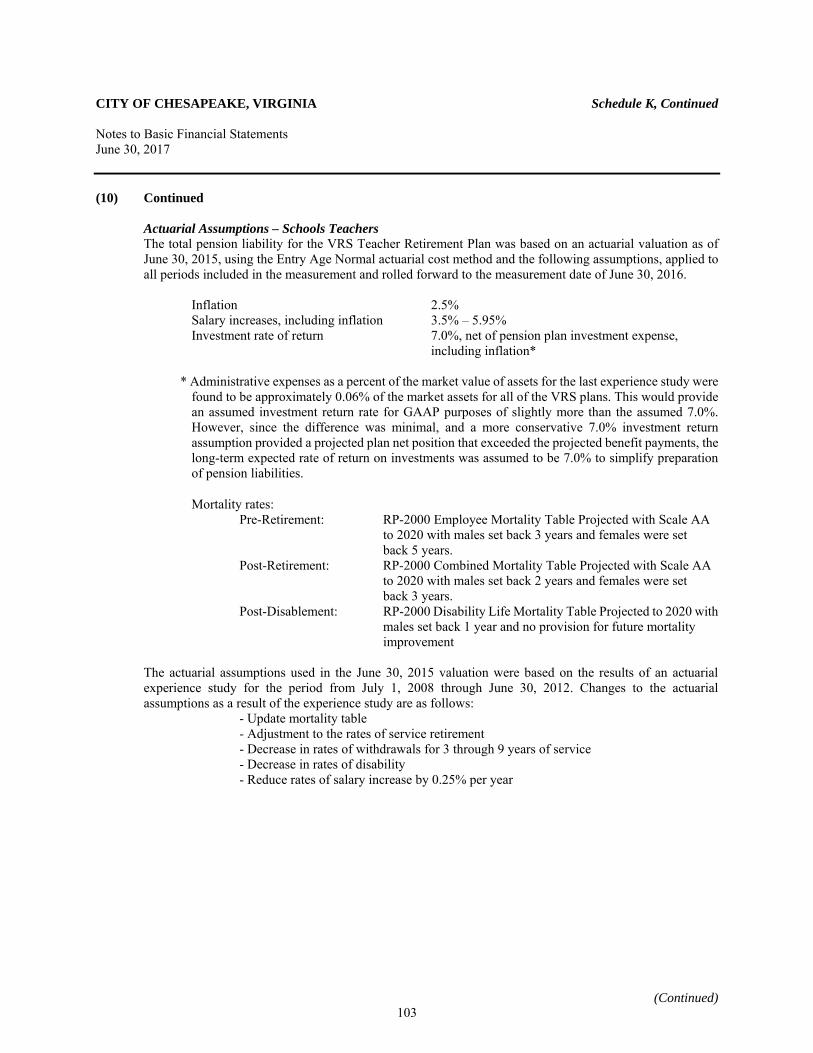
CITY OF CHESAPEAKE, VIRGINIA Schedule K, Continued Notes to Basic Financial Statements June 30, 2017
(Continued)
(10) Continued Actuarial Assumptions – Schools Teachers The total pension liability for the VRS Teacher Retirement Plan was based on an actuarial valuation as of June 30, 2015, using the Entry Age Normal actuarial cost method and the following assumptions, applied to all periods included in the measurement and rolled forward to the measurement date of June 30, 2016. Inflation 2.5% Salary increases, including inflation 3.5% – 5.95% Investment rate of return 7.0%, net of pension plan investment expense,
including inflation* * Administrative expenses as a percent of the market value of assets for the last experience study were
found to be approximately 0.06% of the market assets for all of the VRS plans. This would provide an assumed investment return rate for GAAP purposes of slightly more than the assumed 7.0%. However, since the difference was minimal, and a more conservative 7.0% investment return assumption provided a projected plan net position that exceeded the projected benefit payments, the long-term expected rate of return on investments was assumed to be 7.0% to simplify preparation of pension liabilities.
Mortality rates: Pre-Retirement: RP-2000 Employee Mortality Table Projected with Scale AA
to 2020 with males set back 3 years and females were set back 5 years.
Post-Retirement: RP-2000 Combined Mortality Table Projected with Scale AA to 2020 with males set back 2 years and females were set back 3 years.
Post-Disablement: RP-2000 Disability Life Mortality Table Projected to 2020 with males set back 1 year and no provision for future mortality improvement
The actuarial assumptions used in the June 30, 2015 valuation were based on the results of an actuarial experience study for the period from July 1, 2008 through June 30, 2012. Changes to the actuarial assumptions as a result of the experience study are as follows: - Update mortality table - Adjustment to the rates of service retirement - Decrease in rates of withdrawals for 3 through 9 years of service - Decrease in rates of disability - Reduce rates of salary increase by 0.25% per year
103
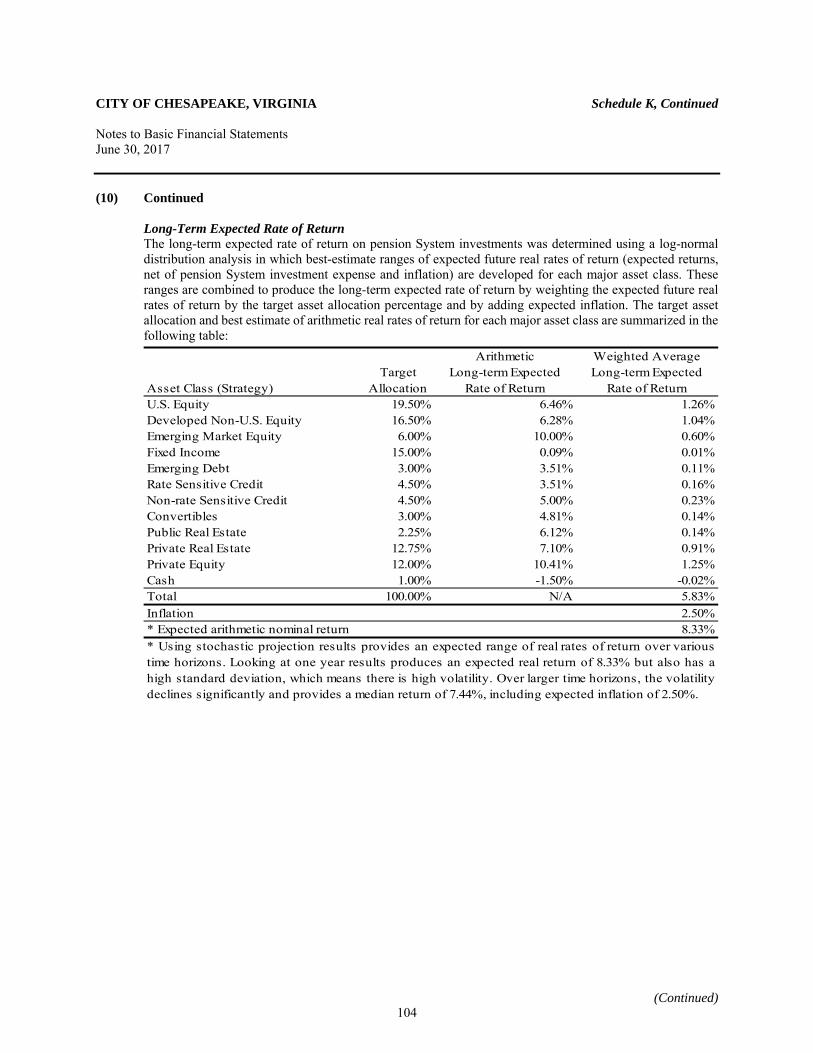
CITY OF CHESAPEAKE, VIRGINIA Schedule K, Continued Notes to Basic Financial Statements June 30, 2017
(Continued)
(10) Continued Long-Term Expected Rate of Return The long-term expected rate of return on pension System investments was determined using a log-normal distribution analysis in which best-estimate ranges of expected future real rates of return (expected returns, net of pension System investment expense and inflation) are developed for each major asset class. These ranges are combined to produce the long-term expected rate of return by weighting the expected future real rates of return by the target asset allocation percentage and by adding expected inflation. The target asset allocation and best estimate of arithmetic real rates of return for each major asset class are summarized in the following table:
Asset Class (Strategy)Target
Allocation
Arithmetic Long-term Expected
Rate of Return
Weighted Average Long-term Expected
Rate of ReturnU.S. Equity 19.50% 6.46% 1.26%Developed Non-U.S. Equity 16.50% 6.28% 1.04%Emerging Market Equity 6.00% 10.00% 0.60%Fixed Income 15.00% 0.09% 0.01%Emerging Debt 3.00% 3.51% 0.11%Rate Sensitive Credit 4.50% 3.51% 0.16%Non-rate Sensitive Credit 4.50% 5.00% 0.23%Convertibles 3.00% 4.81% 0.14%Public Real Estate 2.25% 6.12% 0.14%Private Real Estate 12.75% 7.10% 0.91%Private Equity 12.00% 10.41% 1.25%Cash 1.00% -1.50% -0.02%Total 100.00% N/A 5.83%Inflation 2.50%* Expected arithmetic nominal return 8.33%* Using stochastic projection results provides an expected range of real rates of return over varioustime horizons. Looking at one year results produces an expected real return of 8.33% but also has ahigh standard deviation, which means there is high volatility. Over larger time horizons, the volatilitydeclines significantly and provides a median return of 7.44%, including expected inflation of 2.50%.
104
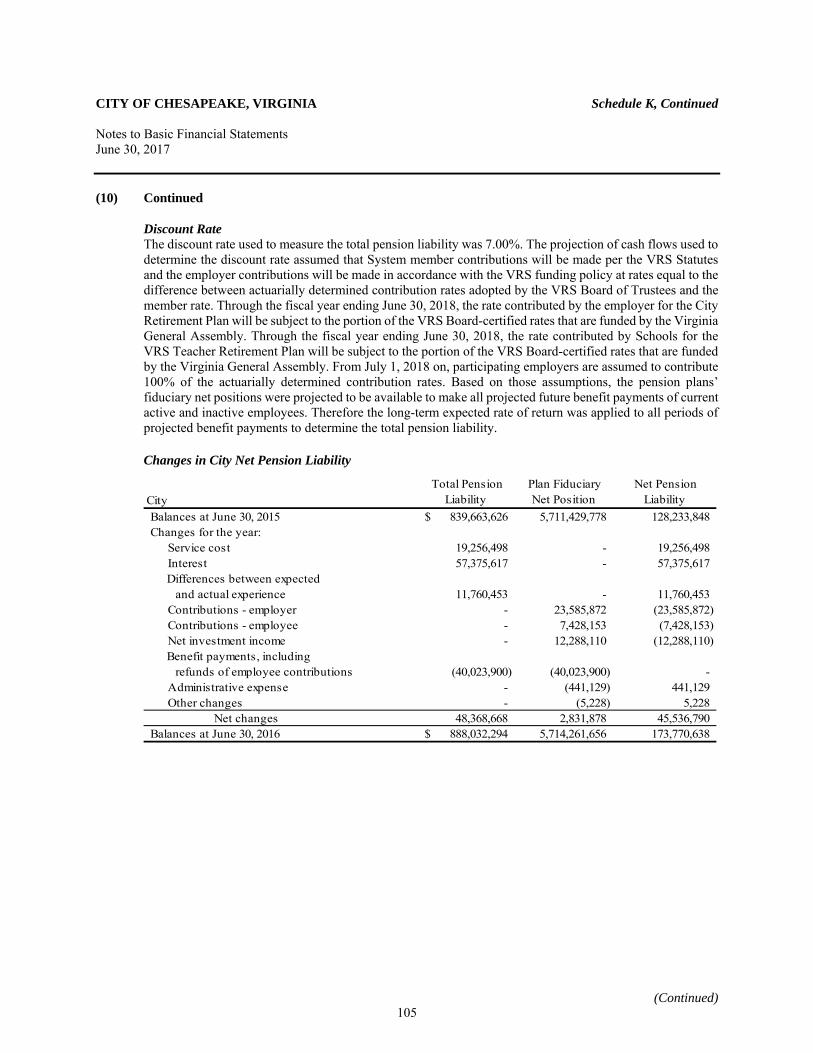
CITY OF CHESAPEAKE, VIRGINIA Schedule K, Continued Notes to Basic Financial Statements June 30, 2017
(Continued)
(10) Continued Discount Rate The discount rate used to measure the total pension liability was 7.00%. The projection of cash flows used to determine the discount rate assumed that System member contributions will be made per the VRS Statutes and the employer contributions will be made in accordance with the VRS funding policy at rates equal to the difference between actuarially determined contribution rates adopted by the VRS Board of Trustees and the member rate. Through the fiscal year ending June 30, 2018, the rate contributed by the employer for the City Retirement Plan will be subject to the portion of the VRS Board-certified rates that are funded by the Virginia General Assembly. Through the fiscal year ending June 30, 2018, the rate contributed by Schools for the VRS Teacher Retirement Plan will be subject to the portion of the VRS Board-certified rates that are funded by the Virginia General Assembly. From July 1, 2018 on, participating employers are assumed to contribute 100% of the actuarially determined contribution rates. Based on those assumptions, the pension plans’ fiduciary net positions were projected to be available to make all projected future benefit payments of current active and inactive employees. Therefore the long-term expected rate of return was applied to all periods of projected benefit payments to determine the total pension liability. Changes in City Net Pension Liability
City Total Pension
Liability Plan Fiduciary
Net Position Net Pension
Liability Balances at June 30, 2015 839,663,626$ 5,711,429,778 128,233,848 Changes for the year:
Service cost 19,256,498 - 19,256,498 Interest 57,375,617 - 57,375,617
Differences between expected and actual experience 11,760,453 - 11,760,453 Contributions - employer - 23,585,872 (23,585,872) Contributions - employee - 7,428,153 (7,428,153) Net investment income - 12,288,110 (12,288,110)
Benefit payments, including refunds of employee contributions (40,023,900) (40,023,900) - Administrative expense - (441,129) 441,129 Other changes - (5,228) 5,228 Net changes 48,368,668 2,831,878 45,536,790
Balances at June 30, 2016 888,032,294$ 5,714,261,656 173,770,638
105
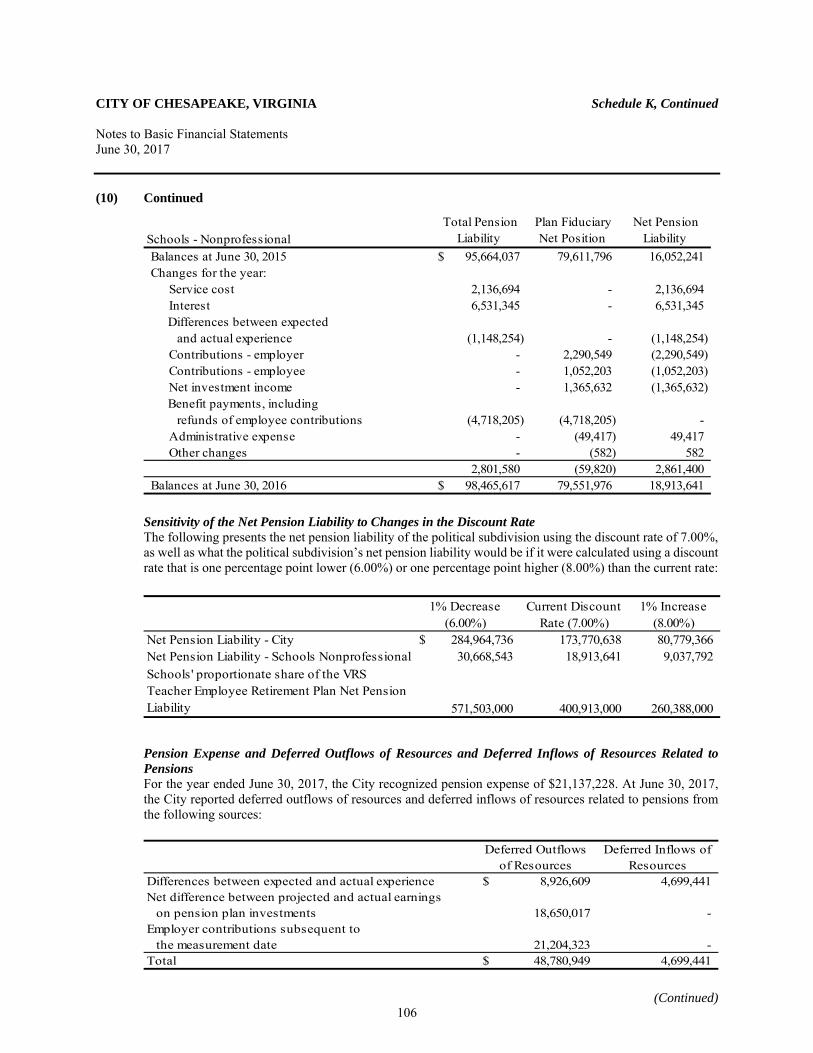
CITY OF CHESAPEAKE, VIRGINIA Schedule K, Continued Notes to Basic Financial Statements June 30, 2017
(Continued)
(10) Continued
Schools - Nonprofessional Total Pension
Liability Plan Fiduciary
Net Position Net Pension
Liability Balances at June 30, 2015 95,664,037$ 79,611,796 16,052,241 Changes for the year:
Service cost 2,136,694 - 2,136,694 Interest 6,531,345 - 6,531,345
Differences between expected and actual experience (1,148,254) - (1,148,254) Contributions - employer - 2,290,549 (2,290,549) Contributions - employee - 1,052,203 (1,052,203) Net investment income - 1,365,632 (1,365,632)
Benefit payments, including refunds of employee contributions (4,718,205) (4,718,205) - Administrative expense - (49,417) 49,417 Other changes - (582) 582
2,801,580 (59,820) 2,861,400 Balances at June 30, 2016 98,465,617$ 79,551,976 18,913,641
Sensitivity of the Net Pension Liability to Changes in the Discount Rate The following presents the net pension liability of the political subdivision using the discount rate of 7.00%, as well as what the political subdivision’s net pension liability would be if it were calculated using a discount rate that is one percentage point lower (6.00%) or one percentage point higher (8.00%) than the current rate:
1% Decrease (6.00%)
Current Discount Rate (7.00%)
1% Increase (8.00%)
Net Pension Liability - City 284,964,736$ 173,770,638 80,779,366 Net Pension Liability - Schools Nonprofessional 30,668,543 18,913,641 9,037,792 Schools' proportionate share of the VRS Teacher Employee Retirement Plan Net Pension Liability 571,503,000 400,913,000 260,388,000
Pension Expense and Deferred Outflows of Resources and Deferred Inflows of Resources Related to Pensions For the year ended June 30, 2017, the City recognized pension expense of $21,137,228. At June 30, 2017, the City reported deferred outflows of resources and deferred inflows of resources related to pensions from the following sources:
Deferred Outflows of Resources
Deferred Inflows of Resources
Differences between expected and actual experience 8,926,609$ 4,699,441 Net difference between projected and actual earnings
on pension plan investments 18,650,017 - Employer contributions subsequent to
the measurement date 21,204,323 - Total 48,780,949$ 4,699,441
106
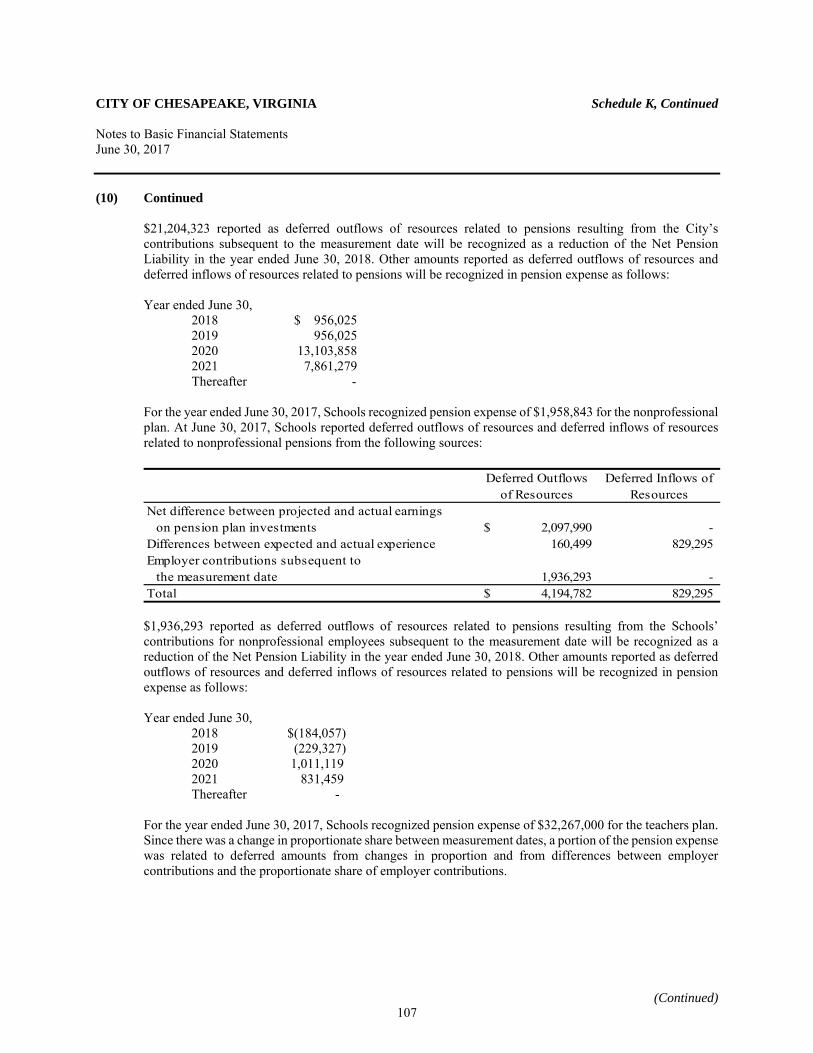
CITY OF CHESAPEAKE, VIRGINIA Schedule K, Continued Notes to Basic Financial Statements June 30, 2017
(Continued)
(10) Continued $21,204,323 reported as deferred outflows of resources related to pensions resulting from the City’s contributions subsequent to the measurement date will be recognized as a reduction of the Net Pension Liability in the year ended June 30, 2018. Other amounts reported as deferred outflows of resources and deferred inflows of resources related to pensions will be recognized in pension expense as follows: Year ended June 30, 2018 $ 956,025
2019 956,025 2020 13,103,858 2021 7,861,279 Thereafter -
For the year ended June 30, 2017, Schools recognized pension expense of $1,958,843 for the nonprofessional plan. At June 30, 2017, Schools reported deferred outflows of resources and deferred inflows of resources related to nonprofessional pensions from the following sources:
Deferred Outflows of Resources
Deferred Inflows of Resources
Net difference between projected and actual earningson pension plan investments 2,097,990$ -
Differences between expected and actual experience 160,499 829,295 Employer contributions subsequent to
the measurement date 1,936,293 - Total 4,194,782$ 829,295 $1,936,293 reported as deferred outflows of resources related to pensions resulting from the Schools’ contributions for nonprofessional employees subsequent to the measurement date will be recognized as a reduction of the Net Pension Liability in the year ended June 30, 2018. Other amounts reported as deferred outflows of resources and deferred inflows of resources related to pensions will be recognized in pension expense as follows: Year ended June 30, 2018 $(184,057) 2019 (229,327) 2020 1,011,119 2021 831,459 Thereafter - For the year ended June 30, 2017, Schools recognized pension expense of $32,267,000 for the teachers plan. Since there was a change in proportionate share between measurement dates, a portion of the pension expense was related to deferred amounts from changes in proportion and from differences between employer contributions and the proportionate share of employer contributions.
107
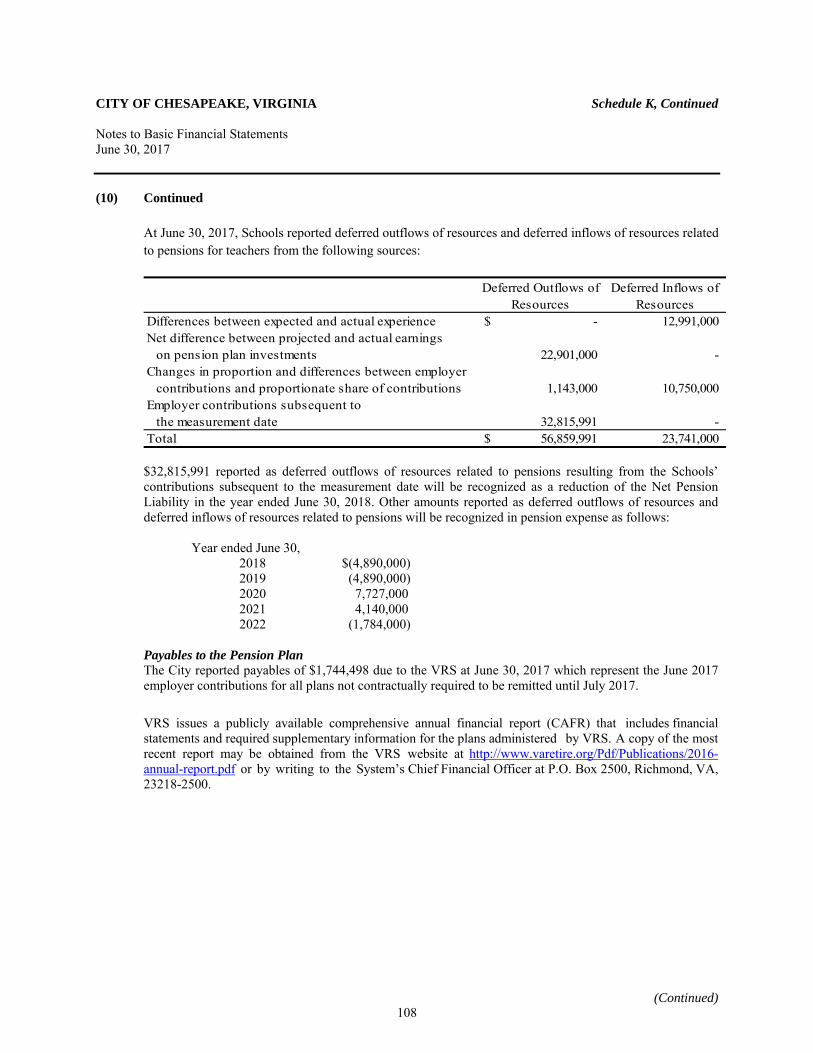
CITY OF CHESAPEAKE, VIRGINIA Schedule K, Continued Notes to Basic Financial Statements June 30, 2017
(Continued)
(10) Continued At June 30, 2017, Schools reported deferred outflows of resources and deferred inflows of resources related
to pensions for teachers from the following sources:
Deferred Inflows of Resources
Differences between expected and actual experience $ - 12,991,000 Net difference between projected and actual earnings
on pension plan investments 22,901,000 - Changes in proportion and differences between employer
contributions and proportionate share of contributions 1,143,000 10,750,000 Employer contributions subsequent to
the measurement date 32,815,991 - Total $ 56,859,991 23,741,000
Deferred Outflows of Resources
$32,815,991 reported as deferred outflows of resources related to pensions resulting from the Schools’ contributions subsequent to the measurement date will be recognized as a reduction of the Net Pension Liability in the year ended June 30, 2018. Other amounts reported as deferred outflows of resources and deferred inflows of resources related to pensions will be recognized in pension expense as follows:
Year ended June 30, 2018 $(4,890,000) 2019 (4,890,000) 2020 7,727,000 2021 4,140,000 2022 (1,784,000)
Payables to the Pension Plan The City reported payables of $1,744,498 due to the VRS at June 30, 2017 which represent the June 2017 employer contributions for all plans not contractually required to be remitted until July 2017. VRS issues a publicly available comprehensive annual financial report (CAFR) that includes financial statements and required supplementary information for the plans administered by VRS. A copy of the most recent report may be obtained from the VRS website at http://www.varetire.org/Pdf/Publications/2016-annual-report.pdf or by writing to the System’s Chief Financial Officer at P.O. Box 2500, Richmond, VA, 23218-2500.
108
CITY OF CHESAPEAKE, VIRGINIA Schedule K, Continued Notes to Basic Financial Statements June 30, 2017
(Continued)
(11) Other Postemployment Benefits Plan Description
The City’s Other Postemployment Benefit Plan (OPEB Plan) is a single-employer, defined benefit plan that provides access to medical and dental insurance benefits to eligible Pre-Medicare retirees and their dependents. (Effective January 1, 2016, the existing post-Medicare supplemental plan offered to retirees was discontinued per City Council’s approval on September 15, 2015).
OPEB Plan membership as of June 30, 2017, consisted of 2,831 active service participants and 377 retirees and beneficiaries currently receiving benefits. There are no retirees entitled to benefits but not currently receiving them, because if they do not choose to continue coverage at the time of retirement, then they are no longer eligible to participate. The City’s administrative regulations outline the benefits provided and criteria for eligibility. City Ordinance established the City of Chesapeake Other Postemployment Benefits (OPEB) Trust for the purpose of accumulating and investing assets to fund other postemployment benefits obligations. Management of the City’s OPEB Trust is vested in the Chesapeake OPEB Finance Board of Trustees, which consists of five members appointed by City Council.
Amounts contributed to the Trust by the City are irrevocable and must be used solely to discharge the City’s obligations for other postemployment benefits and pay for reasonable expenses of the Trust. The OPEB Trust is included as a fiduciary fund in the City’s financial statements. The contribution requirements of plan members and the City are established and may be amended by the City’s administrative regulations. The required contribution is based on projected pay-as-you-go financing requirements, with an additional amount to prefund benefits as determined annually by the City Council-approved Operating Budget. These amounts are offset by any amounts determined to be funded by the OPEB Trust. For fiscal year 2017, the City contributed $5,041,599 to the plan, including $3,379,089 for current premiums (79.7% of total premiums), and $1,662,510 actuarially estimated implicit subsidy. The OPEB Trust reimbursed the City for the current premiums portion of the pay-go in the amount of $3,089,000 by recognizing that amount as a payment in lieu of receiving the annual required contribution (ARC) and at June 30, 2017 has recorded a payable to the City for the net of the two amounts.
Plan members contribute based either the active employee contribution rate or the entire premium based on their years of services at retirement, greater than 19 years or 15 to 19 years, respectively. Plan members receiving benefits contributed $859,251, or 20.3% of the total premiums, through their required monthly contributions. Member contributions are 0.6% of covered payroll. Costs to administer current benefits are paid from the General Fund. For the year ended June 30, 2017, the City’s average contribution rate was 3.3% of covered employee payroll. Investments The investment policy of the OPEB Plan in regard to the allocation of invested assets is established and may be amended by the Chesapeake OPEB Finance Board of Trustees by a majority vote of its members. It is the policy of the Chesapeake OPEB Finance Board of the Trust to pursue an investment strategy that reduces risk through the prudent diversification of the portfolio across a broad selection of asset classes. The investment policy discourages the use of cash equivalents, except for liquidity purposes and aims to refrain from dramatically shifting asset class allocations over short time spans.
109
CITY OF CHESAPEAKE, VIRGINIA Schedule K, Continued Notes to Basic Financial Statements June 30, 2017
(Continued)
(11) Continued The adopted asset allocation policy as of June 30, 2017 was as follows: Asset Class Target AllocationDomestic equity 33.0%International equity 21.0%Fixed income 40.0%Real estate 6.0%Cash 0.0%
Total 100.0% For the year ended June 30, 2017, the annual money-weighted rate of return on investments, net of investment expense, was 10.5%. The money-weighted rate of return expresses investment performance, net of investment expense, adjusted for the amounts actually invested. Net OPEB Liability of the City The components of the net OPEB liability of the City at June 30, 2017 were as follows:
Total OPEB liability 81,783,807$ Plan fiduciary net position 78,646,342
City's net OPEB liability 3,137,465 Plan fiduciary net position as a percentage of the total OPEB liability 96.2% Actuarial Assumptions The total OPEB liability was determined by an actuarial valuation as of June 30, 2017, using the following actuarial assumptions, applied to all periods included in the measurement, unless otherwise specified: Inflation 2.5% Investment rate of return 7.0% Health care trend rates 6.1-7.1% initially, graded to a rate of 5.8 – 6.8% after eleven years. Mortality rates were based on RP-2000 Healthy and Disabled Combined Annuitant Mortality Tables with adjustments for mortality improvement based on Scale AA. The actuarial assumptions used in the June 30, 2017 valuation were based on the results of an actuarial experience study for the period July 1, 2016 through June 30, 2017. In the actuarial valuation for fiscal year ending June 30, 2017 (dated October 31, 2017), the projected unit credit actuarial cost method was used to determine the ARC. GAAP required disclosures use the Entry Age Normal method for the OPEB Plan valuation. The City’s unfunded actuarial accrued liabilities (UAAL) are being amortized as a level dollar amount. There were no additional postemployment benefit increases assumed. The amortization period is closed and equals 14 years as of June 30, 2017.
110
CITY OF CHESAPEAKE, VIRGINIA Schedule K, Continued Notes to Basic Financial Statements June 30, 2017
(Continued)
(11) Continued Discount rate The discount rate used to measure the total OPEB liability was 7.0%. The projection of cash flows used to determine the discount rate assumed City contributions will be made at rates equal to the actuarially determined contribution rates. Based on those assumptions, the OPEB plan’s fiduciary net position was projected to be available to make all projected future benefit payments of current plan members. Therefore, the long-term expected rate of return on OPEB plan investments was applied to all periods of projected benefit payments to determine the total OPEB liability. Sensitivity of the net OPEB liability to changes in the discount rate The following presents the net OPEB liability of the City, as well as what the City’s net OPEB liability would be if it were calculated using a discount rate that is one percentage point lower (6.0%) or one percentage point higher (8.0%) than the current discount rate:
1% Decrease (6.0%)
Discount Rate (7.0%)
1% Increase (8.0%)
Net OPEB liability (asset) 10,296,886$ 3,137,465 (3,287,526)
Sensitivity of the net OPEB liability to changes in healthcare cost trend rates The following presents the net OPEB liability to the City, as well as what the City’s net OPEB liability would be if it were calculated using healthcare cost trend rates that were one percentage point lower (rate in 2075 of 3.2%) or one percentage point higher (rate in 2075 of 5.2%) than the current healthcare cost trend rates:
Rate in 2075 of1% Decrease
(3.2%)Discount Rate
(4.2%)1% Increase
(5.2%)Net OPEB liability (asset) (4,351,403)$ 3,137,465 11,813,133 Significant Accounting Policies The OPEB Trust is a fiduciary-type component unit of the City. Fiduciary funds use the flow of economic resources measurement focus and the accrual basis of accounting. Contributions are recognized in the period in which amounts are due and the benefits and refunds are recognized when due and payable in accordance with the terms of the plan. Investments are reported at fair value using a variety of methods, including quoted market prices, net asset value, or third party assessment. Funding Policy
The City’s annual OPEB cost (expense) is calculated based on the ARC of the employer, an amount actuarially determined in accordance with the parameters of GAAP. The ARC represents a level of funding that, if paid on an ongoing basis, is projected to cover normal cost each year and amortize any unfunded actuarial liabilities using level dollar amortization. The amortization period is closed and equals 14 years as of June 30, 2017.
111
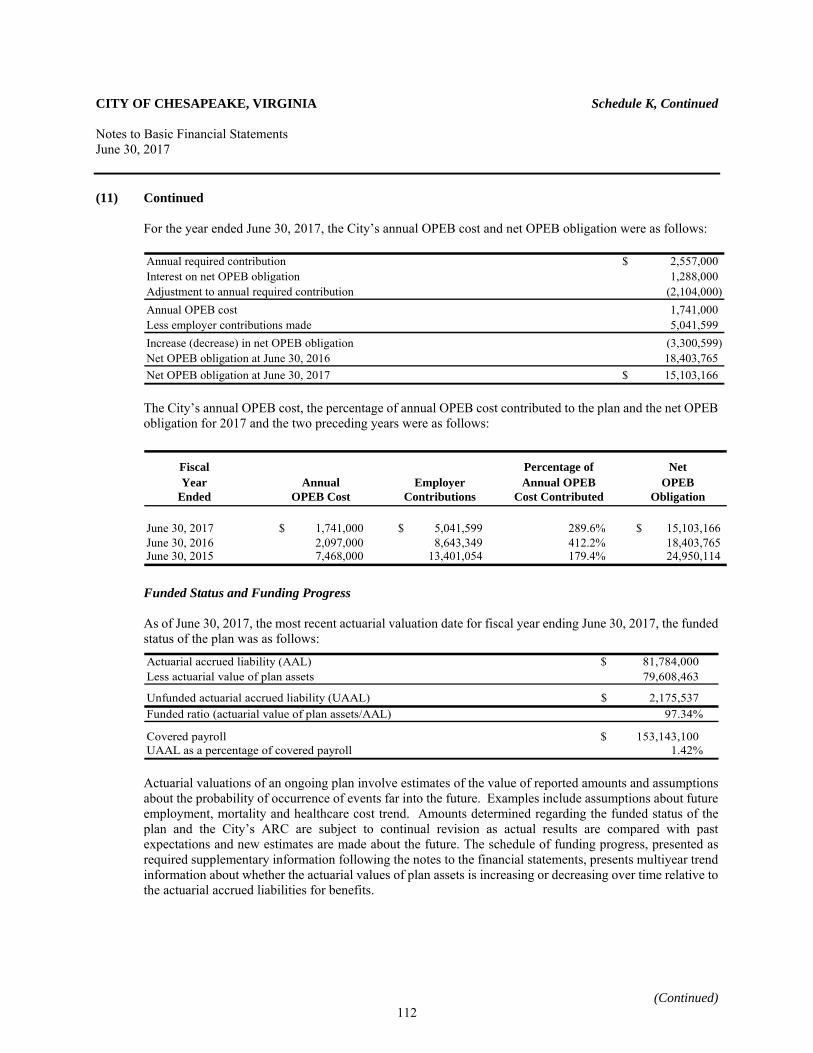
CITY OF CHESAPEAKE, VIRGINIA Schedule K, Continued Notes to Basic Financial Statements June 30, 2017
(Continued)
(11) Continued For the year ended June 30, 2017, the City’s annual OPEB cost and net OPEB obligation were as follows: Annual required contribution $ 2,557,000 Interest on net OPEB obligation 1,288,000 Adjustment to annual required contribution (2,104,000) Annual OPEB cost 1,741,000 Less employer contributions made 5,041,599 Increase (decrease) in net OPEB obligation (3,300,599) Net OPEB obligation at June 30, 2016 18,403,765 Net OPEB obligation at June 30, 2017 $ 15,103,166
The City’s annual OPEB cost, the percentage of annual OPEB cost contributed to the plan and the net OPEB obligation for 2017 and the two preceding years were as follows:
Fiscal Percentage of NetYear Annual Employer Annual OPEB OPEB
Ended OPEB Cost Contributions Cost Contributed Obligation
June 30, 2017 1,741,000$ 5,041,599$ 289.6% 15,103,166$ June 30, 2016 2,097,000 8,643,349 412.2% 18,403,765 June 30, 2015 7,468,000 13,401,054 179.4% 24,950,114
Funded Status and Funding Progress As of June 30, 2017, the most recent actuarial valuation date for fiscal year ending June 30, 2017, the funded status of the plan was as follows:
Actuarial accrued liability (AAL) $ 81,784,000 Less actuarial value of plan assets 79,608,463
Unfunded actuarial accrued liability (UAAL) $ 2,175,537 Funded ratio (actuarial value of plan assets/AAL) 97.34%
Covered payroll $ 153,143,100 UAAL as a percentage of covered payroll 1.42% Actuarial valuations of an ongoing plan involve estimates of the value of reported amounts and assumptions about the probability of occurrence of events far into the future. Examples include assumptions about future employment, mortality and healthcare cost trend. Amounts determined regarding the funded status of the plan and the City’s ARC are subject to continual revision as actual results are compared with past expectations and new estimates are made about the future. The schedule of funding progress, presented as required supplementary information following the notes to the financial statements, presents multiyear trend information about whether the actuarial values of plan assets is increasing or decreasing over time relative to the actuarial accrued liabilities for benefits.
112
CITY OF CHESAPEAKE, VIRGINIA Schedule K, Continued Notes to Basic Financial Statements June 30, 2017
(Continued)
(11) Continued Actuarial Method and Assumptions Projections of benefits for financial reporting purposes are based on the substantive plan (the plan as understood by the employer and the plan members) and include the types of benefits provided at the time of each valuation and the historical pattern of sharing of benefit costs between the employer and plan members to that point. Actuarial calculations reflect a long-term perspective. In the actuarial valuation for fiscal year ending June 30, 2017 (dated October 31, 2017), the projected unit credit actuarial cost method was used. The actuarial assumptions included a 7.0% investment rate of return (discount rate) and an annual healthcare cost trend rate of 6.1-7.1% initially, graded to a rate of 5.8 – 6.8% after eleven years. A general inflation rate of 2.5% was incorporated in the actuarial valuation. The City’s UAAL are being amortized as a level dollar amount. There were no additional postemployment benefit increases assumed. The amortization period is closed and equals 14 years as of June 30, 2017. Discretely presented component unit - Public Schools:
Plan Description The Schools’ Pre-Medicare and Post-Medicare Medical Plans are single-employer defined benefit plans that provide medical and dental insurance benefits to eligible retirees and their dependents. Plan membership as of July 1, 2016, consisted of 5,325 active service participants and 1,010 retirees and beneficiaries currently receiving benefits. The Schools’ administrative policies and regulations outline the benefits provided and criteria for eligibility. City Ordinance established the CPS Other Postemployment Benefits (OPEB) Trust for the purpose of accumulating and investing assets to fund other postemployment benefits obligations. The School Board, in accordance with this election, has agreed to become part of the Virginia Pooled OPEB Trust Fund (the Trust). Amounts contributed to the Trust by the Schools are irrevocable and must be used solely to discharge the Schools’ obligations for other postemployment benefits and pay for reasonable expenses of the Trust. The OPEB Trust is included as a fiduciary fund in the Schools’ financial statements.
Investments The Trust’s Board of Trustees has the responsibility for managing the investment process. In fulfilling this
responsibility, the Board will establish and maintain investment policies and objectives. Within this framework, the Board will monitor and evaluate investment managers, bank custodian, and other parties to monitor whether operations conform to the guidelines and actual results meet objectives. If necessary, the Board is responsible for making changes to achieve this. The investment objective of the Fund is to maximize total long-term rate of return with reasonable risk by seeking capital appreciation and secondarily, principal protection.
113
CITY OF CHESAPEAKE, VIRGINIA Schedule K, Continued Notes to Basic Financial Statements June 30, 2017
(Continued)
(11) Continued The adopted asset policy as of June 30, 2017 was as follows:
Asset Class Target AllocationDomestic equity 36.0%International equity 13.0%Emerging markets equity 5.0%Private equity 5.0%Fixed income 21.0%Diversified hedge funds 10.0%Real estate 10.0%
Total 100.0% For the year ended June 30, 2017, the annual money-weighted rate of return on investments, net of investment expense was 13.04%. The money-weighted rate of return expresses investment performance, net of investment expense, adjusted for the changing amounts actually invested.
Net OPEB Liability of the Schools The components of the net OPEB Liability of the Schools at June 30, 2017, were as follows:
Total OPEB liability 157,027,523$ Plan fiduciary net position 3,140,867
City's net OPEB liability 153,886,656 Plan fiduciary net position as a percentage of the total OPEB liability 2.0%
Actuarial Method and Assumptions The total OPEB liability was determined by an actuarial valuation as of June 30, 2017, using the following
actuarial assumptions, applied to all periods included in the measurement, unless otherwise specified: Inflation 2.5% Investment rate of return 3.58% Mortality rates were based on the RP 2014 Total Dataset Mortality Table, Fully Generational, projected using
Scale MP-2014. The actuarial assumptions used in the June 30, 2017 valuation were based on the results of an actuarial
experience study for the period July 1, 2016 through June 30, 2017. In the actuarial valuation for the fiscal year ending June 30, 2017 (dated November 13, 2017), the projected
unit credit actuarial cost method was used to determine the ARC. GASB 74 required disclosures use the Entry Age Normal method for OPEB plan valuation. The Schools’ UAAL are being amortized as a level dollar amount. There were not additional postemployment increases assumed. The amortization period is closed and equal to 29 years as of June 30, 2017.
114
CITY OF CHESAPEAKE, VIRGINIA Schedule K, Continued Notes to Basic Financial Statements June 30, 2017
(Continued)
(11) Continued Discount Rate The discount rate used to measure the total OPEB liability was 3.58%. The projection of cash flows used to
determine the discount rate assumed the Schools’ contribution will be made on a pay-as-you-go basis. Based on those assumptions, the OPEB plan’s fiduciary net position was projected to be available to make all projected future benefit payments of current plan members. Therefore, the long-term expected rate of return on OPEB plan investments was applied to all period of projected benefit payments to determine the total OPEB liability.
Sensitivity of the net OPEB liability to changes in the discount rate The following presents the net OPEB liability of the Schools, as well as what the Schools’ net OPEB liability
would be if it were calculated using a discount rate that is one percentage point lower (2.58%) or one percentage point higher (4.58%) than the current discount rate.
Net OPEB liability (asset) 172,813,559$ 153,886,656 138,007,901
Discount Rate (3.58%)
1% Decrease (2.58%)
1% Increase (4.58%)
In fiscal year 2014, CPS changed its OPEB policy to incorporate flat dollar employer contributions and those
amounts will not be increased in the future. Therefore, no annual healthcare cost trend rates were used in the July 30, 2017 actuarial valuation. Significant Accounting Policies
The OPEB Trust is a fiduciary-type component unit of the Schools. Fiduciary funds use the flow of economic resources measurement focus and the accrual basis of accounting. Contributions are recognized in the period in which amounts are due, and benefits and refunds are recognized when due and payable in accordance with the terms of the plan. Investments are reported at fair value based on quoted market prices. Funding Policy
The contribution requirements of plan members and the Schools are established and may be amended by the School Board. The required contribution is based on projected pay-as-you-go financing requirements, with an additional amount to prefund benefits as determined annually by the School Board. For fiscal year 2017, the Schools contributed $5,681,682 to the plan to pay for current premiums (59% of total premiums). Plan members receiving benefits contributed $3,887,479, or 41% of the total premiums, through their required monthly contributions. Costs to administer current benefits are paid from the Schools’ General Fund.
115
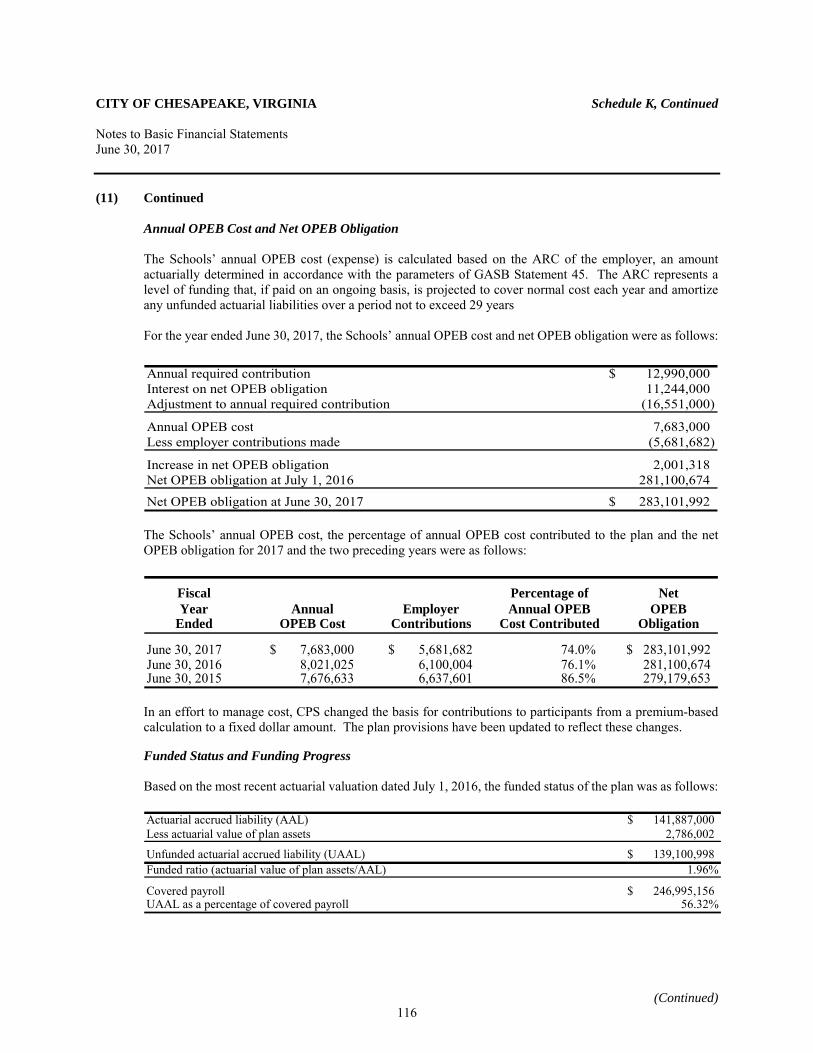
CITY OF CHESAPEAKE, VIRGINIA Schedule K, Continued Notes to Basic Financial Statements June 30, 2017
(Continued)
(11) Continued Annual OPEB Cost and Net OPEB Obligation The Schools’ annual OPEB cost (expense) is calculated based on the ARC of the employer, an amount actuarially determined in accordance with the parameters of GASB Statement 45. The ARC represents a level of funding that, if paid on an ongoing basis, is projected to cover normal cost each year and amortize any unfunded actuarial liabilities over a period not to exceed 29 years For the year ended June 30, 2017, the Schools’ annual OPEB cost and net OPEB obligation were as follows:
Annual required contribution $ 12,990,000 Interest on net OPEB obligation 11,244,000 Adjustment to annual required contribution (16,551,000)
Annual OPEB cost 7,683,000 Less employer contributions made (5,681,682)
Increase in net OPEB obligation 2,001,318 Net OPEB obligation at July 1, 2016 281,100,674
Net OPEB obligation at June 30, 2017 $ 283,101,992 The Schools’ annual OPEB cost, the percentage of annual OPEB cost contributed to the plan and the net OPEB obligation for 2017 and the two preceding years were as follows:
Fiscal Percentage of NetYear Annual Employer Annual OPEB OPEB
Ended OPEB Cost Contributions Cost Contributed Obligation
June 30, 2017 7,683,000$ 5,681,682$ 74.0% 283,101,992$ June 30, 2016 8,021,025 6,100,004 76.1% 281,100,674 June 30, 2015 7,676,633 6,637,601 86.5% 279,179,653
In an effort to manage cost, CPS changed the basis for contributions to participants from a premium-based calculation to a fixed dollar amount. The plan provisions have been updated to reflect these changes.
Funded Status and Funding Progress Based on the most recent actuarial valuation dated July 1, 2016, the funded status of the plan was as follows: Actuarial accrued liability (AAL) $ 141,887,000 Less actuarial value of plan assets 2,786,002
Unfunded actuarial accrued liability (UAAL) $ 139,100,998 Funded ratio (actuarial value of plan assets/AAL) 1.96%
Covered payroll $ 246,995,156 UAAL as a percentage of covered payroll 56.32%
116
CITY OF CHESAPEAKE, VIRGINIA Schedule K, Continued Notes to Basic Financial Statements June 30, 2017
(Continued)
(11) Continued Actuarial valuations of an ongoing plan involve estimates of the value of reported amounts and assumptions about the probability of occurrence of events far into the future. Examples include assumptions about future employment, mortality, and healthcare cost trend. Amounts determined regarding the funded status of the plan and the Schools’ ARC are subject to continual revision as actual results are compared with past expectations and new estimates are made about the future. The schedule of funding progress, presented as required supplementary information following the notes to the financial statements, presents information as of June 30, 2016, the ninth year after implementation. The schedule provides multiyear trend information about whether the actuarial values of plan assets is increasing or decreasing over time relative to the actuarial accrued liabilities for benefits. Actuarial Method and Assumptions Projections of benefits for financial reporting purposes are based on the substantive plan (the plan as understood by the employer and the plan members) and include the types of benefits provided at the time of each valuation and the historical pattern of sharing of benefit costs between the employer and plan members to that point. Actuarial calculations reflect a long-term perspective. In the July 1, 2014 actuarial valuation, the projected unit credit actuarial cost method was used. In fiscal year 2014, the Schools changed its OPEB policy to incorporate flat dollar employer contributions and those amounts will not be increased in the future. Therefore, no annual healthcare cost trend rates were used in the July 1, 2014 actuarial valuation. The Schools’ UAAL are being amortized as a level dollar amount on an open basis within a period of 30 years.
117
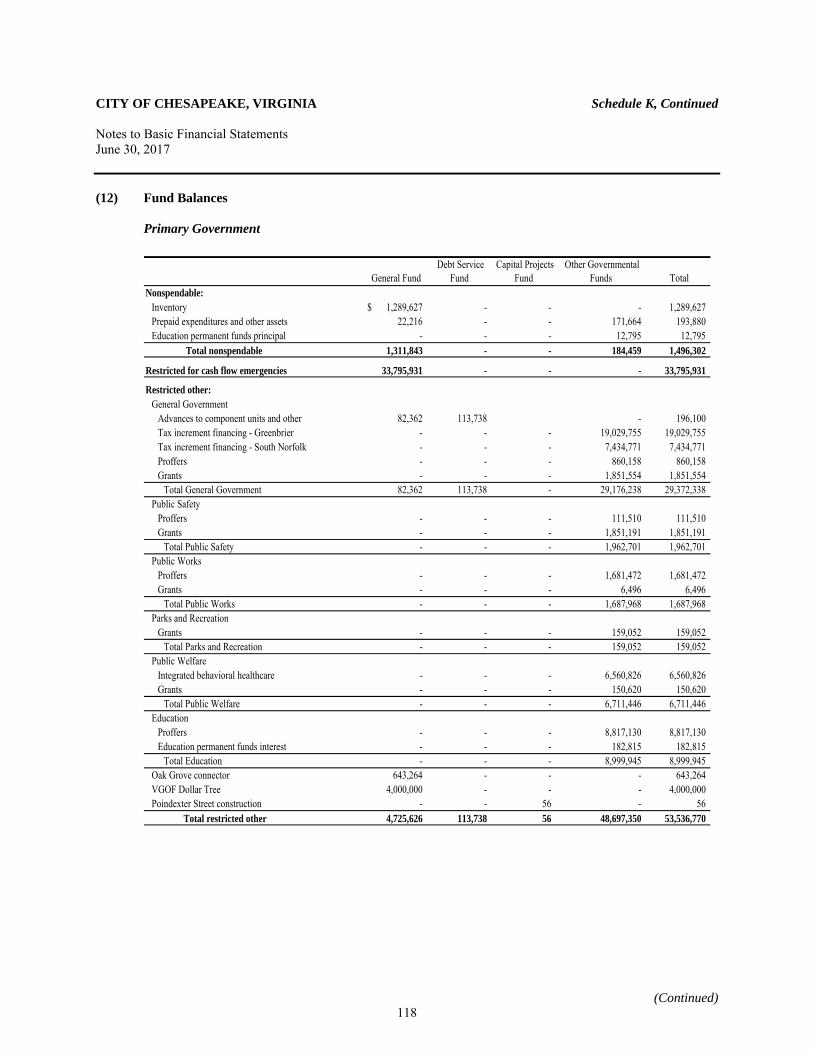
CITY OF CHESAPEAKE, VIRGINIA Schedule K, Continued Notes to Basic Financial Statements June 30, 2017
(Continued)
(12) Fund Balances Primary Government
General Fund Debt Service
Fund Capital Projects
Fund Other Governmental
Funds Total Nonspendable:
Inventory 1,289,627$ - - - 1,289,627 Prepaid expenditures and other assets 22,216 - - 171,664 193,880 Education permanent funds principal - - - 12,795 12,795
Total nonspendable 1,311,843 - - 184,459 1,496,302
Restricted for cash flow emergencies 33,795,931 - - - 33,795,931
Restricted other:General Government
Advances to component units and other 82,362 113,738 - 196,100 Tax increment financing - Greenbrier - - - 19,029,755 19,029,755 Tax increment financing - South Norfolk - - - 7,434,771 7,434,771 Proffers - - - 860,158 860,158 Grants - - - 1,851,554 1,851,554
Total General Government 82,362 113,738 - 29,176,238 29,372,338 Public Safety
Proffers - - - 111,510 111,510 Grants - - - 1,851,191 1,851,191
Total Public Safety - - - 1,962,701 1,962,701 Public Works
Proffers - - - 1,681,472 1,681,472 Grants - - - 6,496 6,496
Total Public Works - - - 1,687,968 1,687,968 Parks and Recreation
Grants - - - 159,052 159,052 Total Parks and Recreation - - - 159,052 159,052
Public WelfareIntegrated behavioral healthcare - - - 6,560,826 6,560,826 Grants - - - 150,620 150,620
Total Public Welfare - - - 6,711,446 6,711,446 Education
Proffers - - - 8,817,130 8,817,130 Education permanent funds interest - - - 182,815 182,815
Total Education - - - 8,999,945 8,999,945 Oak Grove connector 643,264 - - - 643,264 VGOF Dollar Tree 4,000,000 - - - 4,000,000 Poindexter Street construction - - 56 - 56
Total restricted other 4,725,626 113,738 56 48,697,350 53,536,770
118
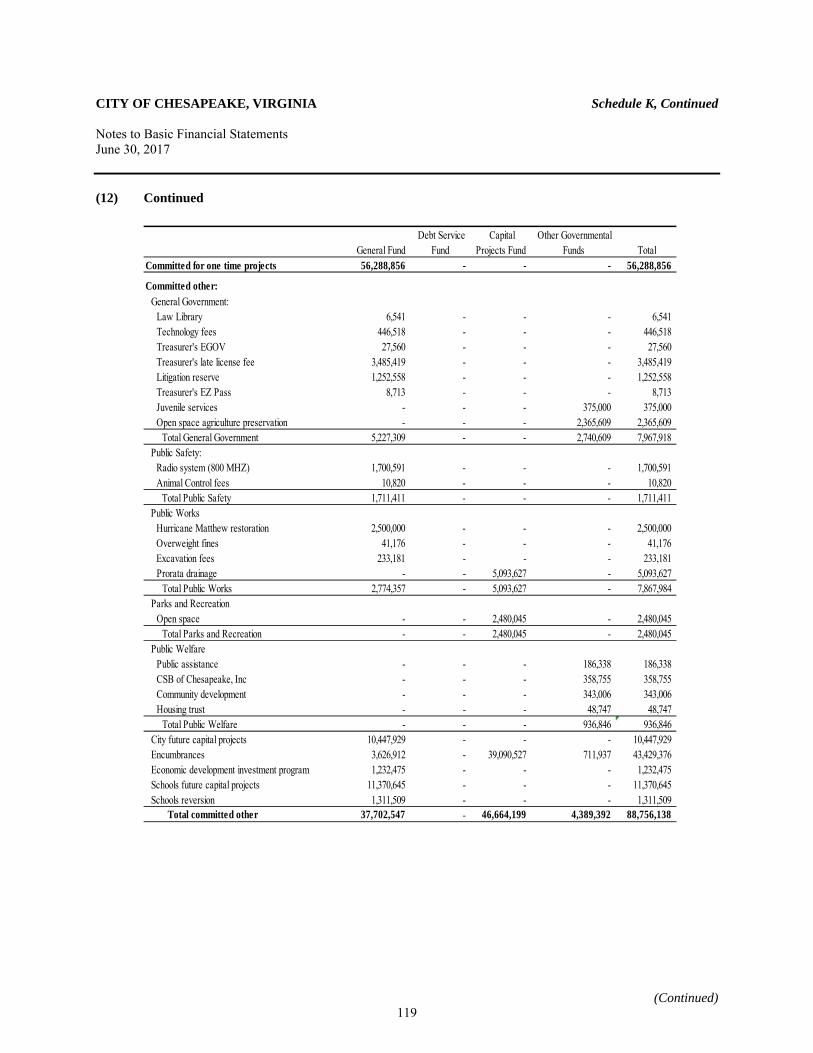
CITY OF CHESAPEAKE, VIRGINIA Schedule K, Continued Notes to Basic Financial Statements June 30, 2017
(Continued)
(12) Continued
General Fund Debt Service
Fund Capital
Projects Fund Other Governmental
Funds Total Committed for one time projects 56,288,856 - - - 56,288,856
Committed other:General Government:
Law Library 6,541 - - - 6,541 Technology fees 446,518 - - - 446,518 Treasurer's EGOV 27,560 - - - 27,560 Treasurer's late license fee 3,485,419 - - - 3,485,419 Litigation reserve 1,252,558 - - - 1,252,558 Treasurer's EZ Pass 8,713 - - - 8,713 Juvenile services - - - 375,000 375,000 Open space agriculture preservation - - - 2,365,609 2,365,609
Total General Government 5,227,309 - - 2,740,609 7,967,918 Public Safety:
Radio system (800 MHZ) 1,700,591 - - - 1,700,591 Animal Control fees 10,820 - - - 10,820
Total Public Safety 1,711,411 - - - 1,711,411 Public Works
Hurricane Matthew restoration 2,500,000 - - - 2,500,000 Overweight fines 41,176 - - - 41,176 Excavation fees 233,181 - - - 233,181 Prorata drainage - - 5,093,627 - 5,093,627
Total Public Works 2,774,357 - 5,093,627 - 7,867,984 Parks and Recreation
Open space - - 2,480,045 - 2,480,045 Total Parks and Recreation - - 2,480,045 - 2,480,045
Public WelfarePublic assistance - - - 186,338 186,338 CSB of Chesapeake, Inc - - - 358,755 358,755 Community development - - - 343,006 343,006 Housing trust - - - 48,747 48,747
Total Public Welfare - - - 936,846 936,846 City future capital projects 10,447,929 - - - 10,447,929 Encumbrances 3,626,912 - 39,090,527 711,937 43,429,376 Economic development investment program 1,232,475 - - - 1,232,475 Schools future capital projects 11,370,645 - - - 11,370,645 Schools reversion 1,311,509 - - - 1,311,509
Total committed other 37,702,547 - 46,664,199 4,389,392 88,756,138
119
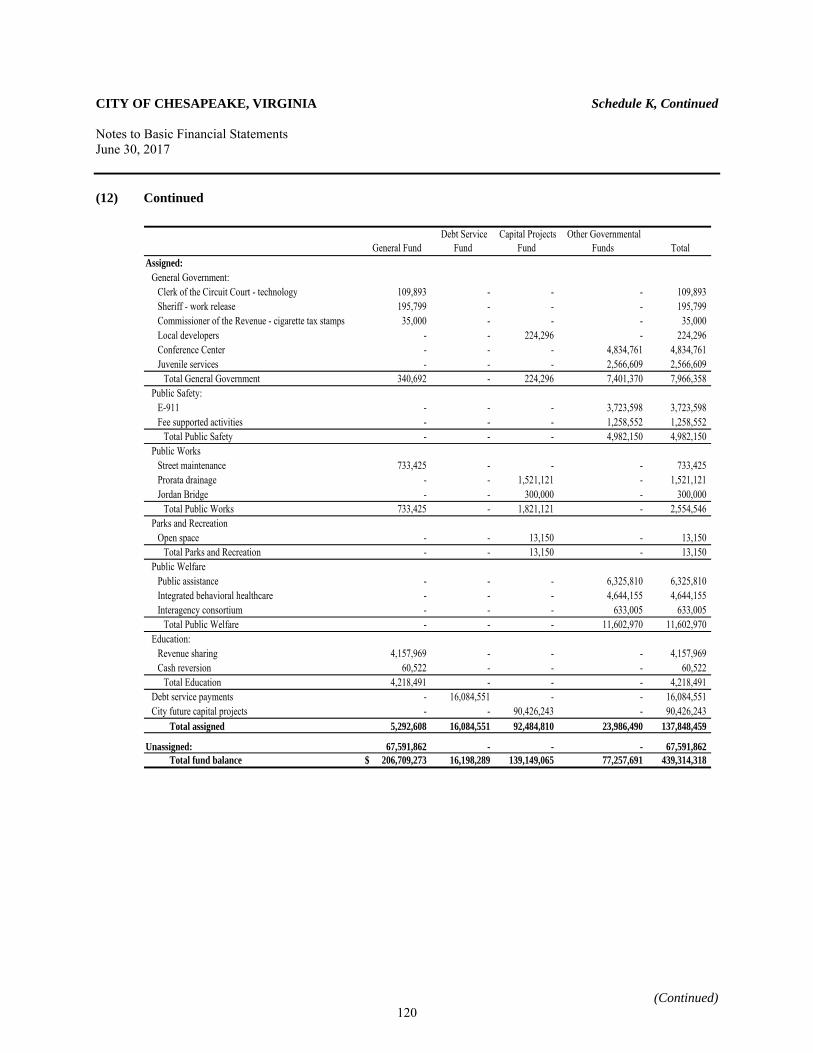
CITY OF CHESAPEAKE, VIRGINIA Schedule K, Continued Notes to Basic Financial Statements June 30, 2017
(Continued)
(12) Continued
General Fund Debt Service
Fund Capital Projects
Fund Other Governmental
Funds Total Assigned:
General Government:Clerk of the Circuit Court - technology 109,893 - - - 109,893 Sheriff - work release 195,799 - - - 195,799 Commissioner of the Revenue - cigarette tax stamps 35,000 - - - 35,000 Local developers - - 224,296 - 224,296 Conference Center - - - 4,834,761 4,834,761 Juvenile services - - - 2,566,609 2,566,609
Total General Government 340,692 - 224,296 7,401,370 7,966,358 Public Safety:
E-911 - - - 3,723,598 3,723,598 Fee supported activities - - - 1,258,552 1,258,552
Total Public Safety - - - 4,982,150 4,982,150 Public Works
Street maintenance 733,425 - - - 733,425 Prorata drainage - - 1,521,121 - 1,521,121 Jordan Bridge - - 300,000 - 300,000
Total Public Works 733,425 - 1,821,121 - 2,554,546 Parks and Recreation
Open space - - 13,150 - 13,150 Total Parks and Recreation - - 13,150 - 13,150
Public WelfarePublic assistance - - - 6,325,810 6,325,810 Integrated behavioral healthcare - - - 4,644,155 4,644,155 Interagency consortium - - - 633,005 633,005
Total Public Welfare - - - 11,602,970 11,602,970 Education:
Revenue sharing 4,157,969 - - - 4,157,969 Cash reversion 60,522 - - - 60,522
Total Education 4,218,491 - - - 4,218,491 Debt service payments - 16,084,551 - - 16,084,551 City future capital projects - - 90,426,243 - 90,426,243
Total assigned 5,292,608 16,084,551 92,484,810 23,986,490 137,848,459
Unassigned: 67,591,862 - - - 67,591,862 Total fund balance 206,709,273$ 16,198,289 139,149,065 77,257,691 439,314,318
120
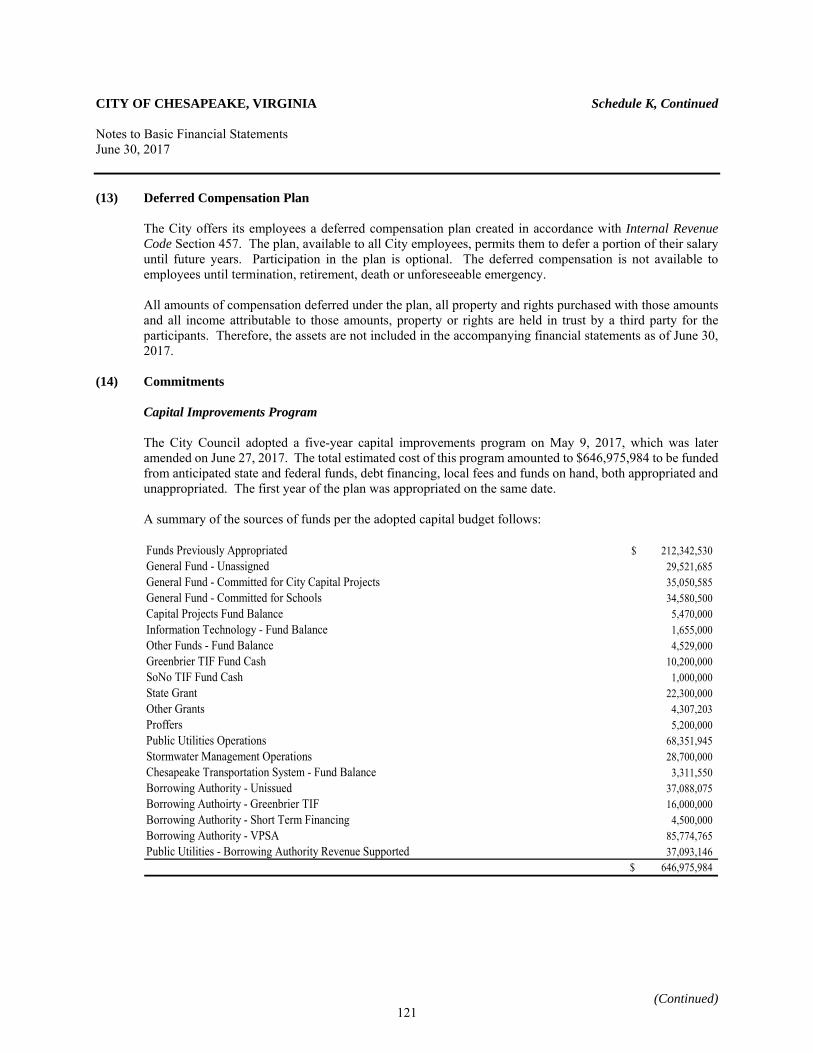
CITY OF CHESAPEAKE, VIRGINIA Schedule K, Continued Notes to Basic Financial Statements June 30, 2017
(Continued)
(13) Deferred Compensation Plan
The City offers its employees a deferred compensation plan created in accordance with Internal Revenue Code Section 457. The plan, available to all City employees, permits them to defer a portion of their salary until future years. Participation in the plan is optional. The deferred compensation is not available to employees until termination, retirement, death or unforeseeable emergency. All amounts of compensation deferred under the plan, all property and rights purchased with those amounts and all income attributable to those amounts, property or rights are held in trust by a third party for the participants. Therefore, the assets are not included in the accompanying financial statements as of June 30, 2017.
(14) Commitments
Capital Improvements Program The City Council adopted a five-year capital improvements program on May 9, 2017, which was later amended on June 27, 2017. The total estimated cost of this program amounted to $646,975,984 to be funded from anticipated state and federal funds, debt financing, local fees and funds on hand, both appropriated and unappropriated. The first year of the plan was appropriated on the same date.
A summary of the sources of funds per the adopted capital budget follows: Funds Previously Appropriated $ 212,342,530 General Fund - Unassigned 29,521,685 General Fund - Committed for City Capital Projects 35,050,585 General Fund - Committed for Schools 34,580,500 Capital Projects Fund Balance 5,470,000 Information Technology - Fund Balance 1,655,000 Other Funds - Fund Balance 4,529,000 Greenbrier TIF Fund Cash 10,200,000 SoNo TIF Fund Cash 1,000,000 State Grant 22,300,000 Other Grants 4,307,203 Proffers 5,200,000 Public Utilities Operations 68,351,945 Stormwater Management Operations 28,700,000 Chesapeake Transportation System - Fund Balance 3,311,550 Borrowing Authority - Unissued 37,088,075 Borrowing Authoirty - Greenbrier TIF 16,000,000 Borrowing Authority - Short Term Financing 4,500,000 Borrowing Authority - VPSA 85,774,765 Public Utilities - Borrowing Authority Revenue Supported 37,093,146
$ 646,975,984
121
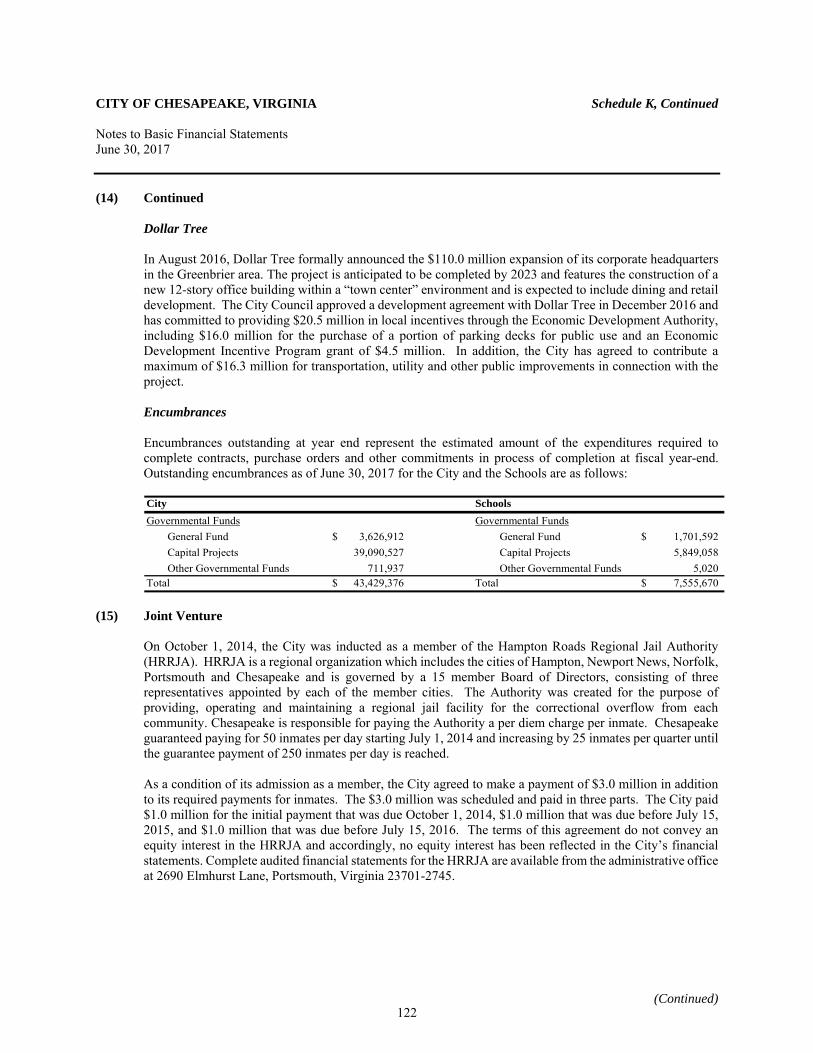
CITY OF CHESAPEAKE, VIRGINIA Schedule K, Continued Notes to Basic Financial Statements June 30, 2017
(Continued)
(14) Continued Dollar Tree
In August 2016, Dollar Tree formally announced the $110.0 million expansion of its corporate headquarters in the Greenbrier area. The project is anticipated to be completed by 2023 and features the construction of a new 12-story office building within a “town center” environment and is expected to include dining and retail development. The City Council approved a development agreement with Dollar Tree in December 2016 and has committed to providing $20.5 million in local incentives through the Economic Development Authority, including $16.0 million for the purchase of a portion of parking decks for public use and an Economic Development Incentive Program grant of $4.5 million. In addition, the City has agreed to contribute a maximum of $16.3 million for transportation, utility and other public improvements in connection with the project. Encumbrances Encumbrances outstanding at year end represent the estimated amount of the expenditures required to complete contracts, purchase orders and other commitments in process of completion at fiscal year-end. Outstanding encumbrances as of June 30, 2017 for the City and the Schools are as follows: City SchoolsGovernmental Funds Governmental Funds
General Fund 3,626,912$ General Fund 1,701,592$ Capital Projects 39,090,527 Capital Projects 5,849,058 Other Governmental Funds 711,937 Other Governmental Funds 5,020
Total 43,429,376$ Total 7,555,670$
(15) Joint Venture
On October 1, 2014, the City was inducted as a member of the Hampton Roads Regional Jail Authority (HRRJA). HRRJA is a regional organization which includes the cities of Hampton, Newport News, Norfolk, Portsmouth and Chesapeake and is governed by a 15 member Board of Directors, consisting of three representatives appointed by each of the member cities. The Authority was created for the purpose of providing, operating and maintaining a regional jail facility for the correctional overflow from each community. Chesapeake is responsible for paying the Authority a per diem charge per inmate. Chesapeake guaranteed paying for 50 inmates per day starting July 1, 2014 and increasing by 25 inmates per quarter until the guarantee payment of 250 inmates per day is reached. As a condition of its admission as a member, the City agreed to make a payment of $3.0 million in addition to its required payments for inmates. The $3.0 million was scheduled and paid in three parts. The City paid $1.0 million for the initial payment that was due October 1, 2014, $1.0 million that was due before July 15, 2015, and $1.0 million that was due before July 15, 2016. The terms of this agreement do not convey an equity interest in the HRRJA and accordingly, no equity interest has been reflected in the City’s financial statements. Complete audited financial statements for the HRRJA are available from the administrative office at 2690 Elmhurst Lane, Portsmouth, Virginia 23701-2745.
122
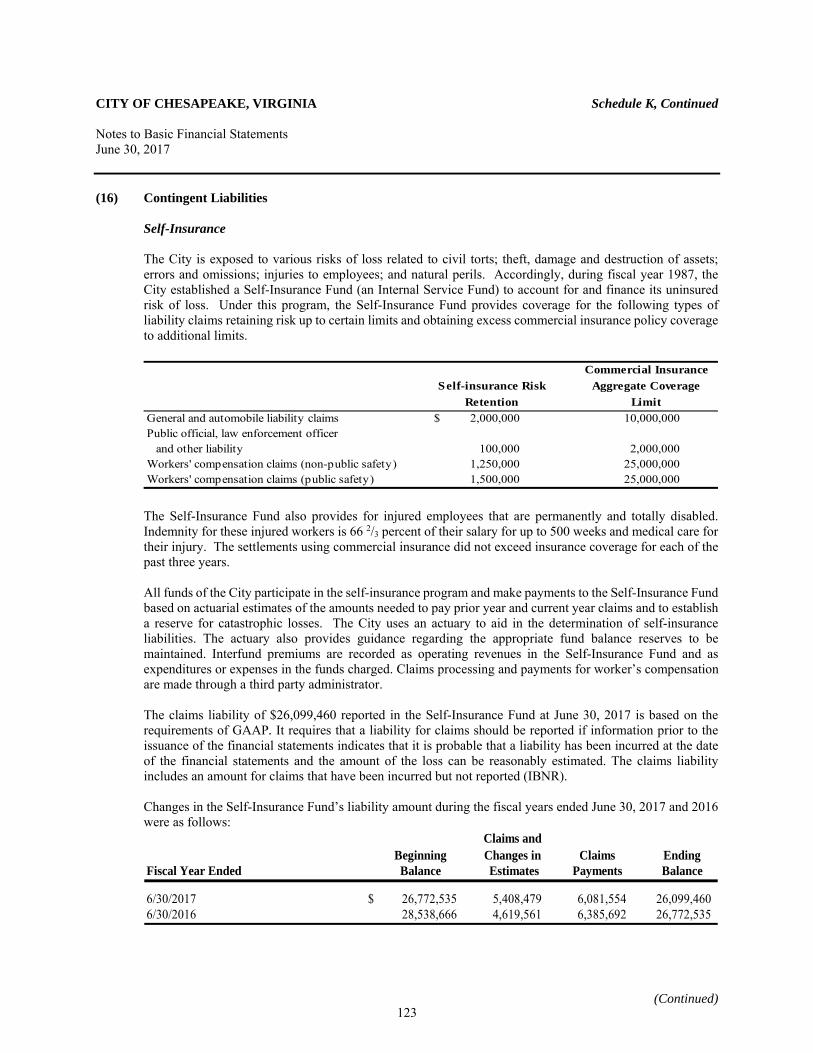
CITY OF CHESAPEAKE, VIRGINIA Schedule K, Continued Notes to Basic Financial Statements June 30, 2017
(Continued)
(16) Contingent Liabilities Self-Insurance The City is exposed to various risks of loss related to civil torts; theft, damage and destruction of assets; errors and omissions; injuries to employees; and natural perils. Accordingly, during fiscal year 1987, the City established a Self-Insurance Fund (an Internal Service Fund) to account for and finance its uninsured risk of loss. Under this program, the Self-Insurance Fund provides coverage for the following types of liability claims retaining risk up to certain limits and obtaining excess commercial insurance policy coverage to additional limits.
General and automobile liability claims $ 2,000,000 10,000,000Public official, law enforcement officer
and other liability 100,000 2,000,000Workers' compensation claims (non-public safety) 1,250,000 25,000,000Workers' compensation claims (public safety) 1,500,000 25,000,000
Commercial InsuranceAggregate Coverage
LimitSelf-insurance Risk
Retention
The Self-Insurance Fund also provides for injured employees that are permanently and totally disabled. Indemnity for these injured workers is 66 2/3 percent of their salary for up to 500 weeks and medical care for their injury. The settlements using commercial insurance did not exceed insurance coverage for each of the past three years. All funds of the City participate in the self-insurance program and make payments to the Self-Insurance Fund based on actuarial estimates of the amounts needed to pay prior year and current year claims and to establish a reserve for catastrophic losses. The City uses an actuary to aid in the determination of self-insurance liabilities. The actuary also provides guidance regarding the appropriate fund balance reserves to be maintained. Interfund premiums are recorded as operating revenues in the Self-Insurance Fund and as expenditures or expenses in the funds charged. Claims processing and payments for worker’s compensation are made through a third party administrator.
The claims liability of $26,099,460 reported in the Self-Insurance Fund at June 30, 2017 is based on the requirements of GAAP. It requires that a liability for claims should be reported if information prior to the issuance of the financial statements indicates that it is probable that a liability has been incurred at the date of the financial statements and the amount of the loss can be reasonably estimated. The claims liability includes an amount for claims that have been incurred but not reported (IBNR). Changes in the Self-Insurance Fund’s liability amount during the fiscal years ended June 30, 2017 and 2016 were as follows:
Claims andBeginning Changes in Claims Ending
Fiscal Year Ended Balance Estimates Payments Balance
6/30/2017 $ 26,772,535 5,408,479 6,081,554 26,099,4606/30/2016 28,538,666 4,619,561 6,385,692 26,772,535
123
CITY OF CHESAPEAKE, VIRGINIA Schedule K, Continued Notes to Basic Financial Statements June 30, 2017
(Continued)
(16) Continued Effective January 1, 2016 the City began self-funding health insurance coverage for its participating employees and retirees and established the Self-Funded Health Fund for reporting of these activities. The City provided health insurance has a specific stop loss limit of $300,000 per member covering both medical and drug expenses and aggregate coverage is capped at 120% of expected claims as determined during the annual rate setting process in consultation with the City’s third party administrator and health benefits consultant. The City purchases commercial insurance coverages for excess amounts. Claims processing and payments for self-funded health claims are made through a third-party administrator. Amounts due as of June 30, 2017 are recognized as current portion of a long-term liability in the statement of net position. The City uses information provided by the third-party administrator and health benefits consultant to aid in the determination of self-funded health insurance liabilities. The total computed liability as of June 30, 2017 is $2,517,342. Other health related insurance coverages (dental and vision) are provided on a fully insured basis. The Schools, a component unit, is self-insured for its workers’ compensation, health and dental insurance. Workers’ compensation has an $800,000 limit per claim. Health insurance has a specific stop loss limit of $300,000 per member covering both medical and drug expenses. Dental care has a cap at 120% of expected claims as calculated by the third-party administrator. Commercial insurance is purchased to cover other types of losses. The insurance coverage is substantially the same as in prior fiscal years. Claims processing and payments for workers’ compensation, medical and dental claims are made through a third-party administrator. The settlements using commercial insurance did not exceed insurance coverage for each of the past three years. Amounts due in future years on claims as of June 30, 2017 are recognized as a long-term liability in the statement of net position. The Schools use the information provided by the third-party administrator to aid in the determination of self-insurance liabilities. The total computed liability as of June 30, 2017 is $10,608,300. Changes in the Schools’ self-insurance program liability amount during the fiscal years ended June 30, 2017 and 2016 were as follows:
Beginning Changes in Claims EndingFiscal Year Ended Balance Estimates Payments Balance
6/30/2017 10,331,953$ 69,122,686 68,846,339 10,608,3006/30/2016 10,371,633 67,971,416 68,011,096 10,331,953 The liability at June 30, 2017 is comprised of $3,448,683 in long-term liabilities and $7,159,617 in accounts payable and accrued expenses related to medical and dental claims.
Federal Award Programs The City and the Schools participate in a number of federal award programs. Although they have been audited in accordance with the provisions of the Uniform Guidance, these programs are still subject to financial and compliance audits by the grantors or their representatives. Such audits could lead to requests for reimbursements to the grantor agency for expenditures disallowed under terms of the grant. Based on prior experience, management believes such disallowances, if any, will not be significant.
124
CITY OF CHESAPEAKE, VIRGINIA Schedule K, Continued Notes to Basic Financial Statements June 30, 2017
(Continued)
(16) Continued Public Utilities Pro-Rata The City’s Pro-Rata Program (program), administered by the Department of Public Utilities (Public Utilities), allows developers or entities that construct utility assets that will serve an area greater than its subdivision or development (the initial developers) to receive a reimbursement as a proportionate share of its construction costs from other individuals or entities that will utilize the installed utility assets (subsequent developers). Upon acceptance, the utility assets are dedicated to the City and accepted into the Public Utility water and sewer system. The City’s Department of Public Utilities has responsibility for the operation and maintenance of the dedicated utility assets. The program’s Pro Rata Policy (policy) requires each initial developer to satisfy five conditions before it is eligible to receive reimbursements under the program. Among these five conditions is a requirement that the initial developer submit appropriate documentation to Public Utilities that verifies the initial developer’s total cost expenditures for the installed utility asset. In addition, initial developers must execute an agreement with the City that quantifies its proportional share of the construction costs (i.e., what that developer would have paid if the utility asset served only its development) and also an approximation of estimated subsequent developer reimbursements (i.e., what subsequent developers will likely owe to the initial developer when or if they utilize or benefit from the initial developer installed utility assets). The initial developer, once it receives the agreement, has twenty-one days to elect a method of reimbursement. It can elect a traditional pro rata reimbursement, which is a reimbursement of payments that the City receives from each subsequent developer (and is based upon the estimated benefit that the subsequent developer receives by utilizing the installed utility assets), or it can elect to receive connection fees, which are generally paid by home builders that purchase properties within the initial developer’s subdivision. Connection fees are a standardized City-wide service fee paid by citizens or entities that utilize City water and sewer assets. The total connection fee reimbursement that an initial developer can receive is contractually limited to the estimated pro rata reimbursement figure contained in its initial developer agreement with the City. If no method of reimbursement is elected within the twenty-one days, the initial developer forfeits its right to connection fee reimbursement and elects, by default, traditional pro rata reimbursement. The initial developer is not eligible for a reimbursement where a subsequent developer has not yet paid its pro rata share of costs to Public Utilities. Public Utilities staff continuously evaluates this program for revisions and improvements as well as to identify reimbursements due to initial developers. At June 30, 2017, a liability of $0.7 million has been recorded for amounts received, but not yet reimbursed, to initial developers who signed an agreement with the City and have met all five required conditions for pro rata reimbursement under the program. It is important to note that each service area under the Pro Rata Program may take years to complete. This is so because, at inception, it is difficult to determine how many subsequent developers will utilize the installed utility assets, or the extent of such usage. In addition, the original engineering calculation, which determines the initial developer’s pro rata reimbursement estimate, may change over time depending upon a number of factors, including actual subsequent developments that benefit from the installed assets, the actual cost of the installed assets, future environmental restrictions (i.e., wetlands) and the ultimate delineation of pump station service areas. Furthermore, it is neither estimable nor is it determinable exactly when a subsequent developer will make a payment to the City, which, in turn, obligates the City to remit a reimbursement to an initial developer if all conditions under the policy have been met. Of note, reimbursable connection fees or subsequent developer payments may have been received and recorded as revenue prior to the initial developer executing an agreement, completing an election to receive reimbursement or providing documents to Public Utilities that meet the total-cost-expenditure substantiation requirements contained in the policy. As a complicating factor, the City cannot anticipate, and has no way of knowing in advance, the
125
CITY OF CHESAPEAKE, VIRGINIA Schedule K, Continued Notes to Basic Financial Statements June 30, 2017
(Continued)
(16) Continued initial developer’s method-of-reimbursement election, and connection fees are recorded as revenue and are not eligible to be recorded as liabilities until such time as the initial developer executes the agreement, provides the appropriate approved documents and receipts that allow verification of utility improvement costs and makes its method-of-reimbursement election and cash is received from a reimbursable source. The amount payable to initial developers for whom the City has not yet received cash from subsequent developers but with whom the City has executed agreements is approximated herein as a contingent liability and is roughly estimated as approximately up to $5.3 million. If the five conditions for reimbursement have been satisfied, upon receiving cash, these payments will be made and the contingent liability reduced. The estimated contingent liability for reimbursements that are due to initial developers wherein payments have already been received from subsequent developers, but that have not been paid by the City as a result of the five conditions not yet having been met, total a contingent liability of approximately up to $5.8 million. Nevertheless, these amounts will be reimbursed by the City if and when all five conditions required under the policy have been met. The method-of-reimbursement election for payments due under these scenarios are unknown since no election has been made. The calculation of the liabilities contained in this paragraph has focused specifically on pro rata projects that have taken place within the last ten years, as the likelihood of projects older than ten years meeting all five conditions was deemed to be remote. Additionally, certain subsequent developer payments have been and will continue to be received by the City under circumstances where the City cannot remit reimbursement to the initial developer because the initial developer has not satisfied all of the conditions to qualify for reimbursement. These funds will be retained by the City. As a caveat, ongoing administration of the Pro-Rata Program (which originated in 1982) requires the assessment of records that were contained on certain recordkeeping systems, software or hardware systems that are no longer available, or technologically inaccessible, and thus it is not possible to know with certainty if all amounts have been identified; but the available information has been reviewed and identified to the best of the City’s ability.
Southeastern Public Service Authority (SPSA)
Southeastern Public Service Authority (SPSA) is a joint venture of the cities of Chesapeake, Franklin, Norfolk, Portsmouth, Suffolk and Virginia Beach and the counties of Isle of Wight and Southampton, created for the purpose of providing, operating and maintaining a regional system for the collection, transfer, processing and disposal of solid waste refuse. On April 29, 2010, the City executed a new guaranty agreement with SPSA, along with all of its other member communities. Under the new agreement, these cities and counties agree to guarantee the remainder of SPSA’s debt not to exceed $50,000,000 in the aggregate. The City’s applicable percentage is 22.49%. Any amounts expended by the City to pay debt service on behalf of SPSA will be required to be repaid by SPSA. The change in the City’s guaranty agreement resulted in part from the sale of SPSA’s Waste-to-Energy facilities to Wheelabrator Technologies, Inc. on April 29, 2010, allowing the principal amount of SPSA’s outstanding indebtedness to be reduced to $75.0 million from $218.0 million. At June 30, 2017, SPSA’s outstanding indebtedness totaled $9.9 million. The City’s current contract with SPSA terminates on January 24, 2018; however, on April 26, 2016, the City Council approved a new contract with SPSA for post-2018 service. Complete audited financial statements for SPSA are available from the administrative office at 723 Woodlake Drive, Chesapeake, Virginia 23320.
126
CITY OF CHESAPEAKE, VIRGINIA Schedule K, Continued Notes to Basic Financial Statements June 30, 2017
(Continued)
(16) Continued SPSA Lease Extension On April 26, 2016 the City Council voted to extend an existing lease agreement between SPSA and the City dated June 12, 1984 for the use of property located at 901 Hollowell Lane in the Washington Borough of the City. The prior lease was to expire on May 31, 2016 and the lease extension agreement will extend the term of the lease until January 24, 2018 when the current Use and Support Agreements with SPSA will expire. This property is utilized by SPSA as a waste transfer station and the City uses this transfer station for 87% of its waste disposal tonnages with the remainder divided among the Wheelabrator plant in Portsmouth, the Norfolk transfer station and the Suffolk transfer stations. Litigation Hampton Roads Regional Jail Authority Litigations The Hampton Roads Regional Jail Authority (HRRJA), of which the City is a member has answered two wrongful death complaints. The litigation is ongoing. The Virginia Risk Management (VARISK) program has the authority to, and is, representing HRRJA in these lawsuits, in which they plan to mount a vigorous defense. The outcome is unknown at this time. Courtney Dixon v. City of Chesapeake Filed on October 21, 2014, Plaintiff brings this suit against the City alleging negligence in maintaining the Campostella overpass which resulted in an accident on March 4, 2014 that the plaintiff claims caused personal injuries. The complaint alleges $5,000,000 in compensatory damages and costs. This matter was dismissed on July 13, 2017, by Order entered in the Chesapeake Circuit Court. The Plaintiff has petitioned the Virginia Supreme Court for an appeal. The Court has not yet ruled on Plaintiff’s petition. The City is unable to predict the outcome of this matter. Jupiter Dennell Wilson, Sr. v City of Chesapeake Plaintiff pro se is a City of Chesapeake firefighter who has filed three lawsuits against the City pursuant to Title VII of the Civil Rights Act of 1964, as amended, and the Age Discrimination in Employment Act of 1967, as amended. The lawsuits alleges race and age discrimination and retaliation. Plaintiff seeks $5 million, $10 million, and $20 million, respectively, to include compensatory and punitive damages and attorney’s fees. Plaintiff previously filed a similar lawsuit against the City in 2014; the District Court dismissed this lawsuit and the dismissal was upheld by the Court of Appeals for the Fourth Circuit on Plaintiff’s appeal. A jury trial is scheduled for January 23-26, 2018. The City is unable to predict the outcome of this matter.
127
CITY OF CHESAPEAKE, VIRGINIA Schedule K, Continued Notes to Basic Financial Statements June 30, 2017
(Continued)
(16) Continued Wade B. Satterfield v. City of Chesapeake Plaintiff is a Chesapeake Police Officer who has filed a lawsuit against the City, one former and three current City employees, pursuant to Title VII of the Civil Rights Act of 1964, as amended, and the Civil Rights Act of 1966, as amended by the Civil Rights Restoration Act of 1991, 42 U.S.C. § 1981. Filed on November 17, 2016, the lawsuit alleges race discrimination, retaliation, and hostile work environment. Plaintiff seeks compensatory and punitive damages in a yet to be determined amount, and attorney’s fees. The City filed a Motion to Dismiss on June 14, 2017 for lack of subject matter jurisdiction and failure to state a claim. The Court granted in part, and denied in part, the City’s Motion to Dismiss, so that the only claims surviving are Plaintiff’s Title VII retaliation claim against the City, and Section 1981 retaliation claim against the individual defendants. A jury trial is scheduled for April 10-11, 2018. This case is in the beginning of the discovery phase of litigation. The City is unable to predict the outcome of this matter. John W. Profit v. City of Chesapeake, et al.
On April 10, 2017, the City was served with a lawsuit filed in the Portsmouth Circuit Court on March 31, 2017, naming the City of Chesapeake, the Hampton Roads Regional Jail Authority, and the Hampton Roads Regional Jail as defendants in the wrongful death of Ronnie Lee Proffitt. Mr. Proffitt died while in the custody of the Hampton Roads Regional Jail (HRRJ) on April 27, 2016. Mr. Proffitt was arrested by Chesapeake police officers on March 31, 2016 for a violation of probation and was held in the Chesapeake City Jail until April 14, 2016. Mr. Proffitt was an inmate at HRRJ from April 15, 2016 until the time of his death, which was allegedly caused by the neglect of Mr. Proffitt’s physical health and denial of required medication and medical equipment for Mr. Proffitt’s heart condition during his time at HRRJ. The lawsuit alleges that Mr. Proffitt was denied access to medications and medical care at the time of his arrest, during his detention at the Chesapeake City Jail, and at the HRRJ. The Plaintiff is seeking $2,000,000 in compensatory damages, and $350,000 in punitive damages. The City has filed a Demurrer, Special Plea of Sovereign Immunity, and an Answer. At present, there is no hearing date or a trial date set. The City is unable to predict the outcome of this matter. Pollution Remediation The City of Chesapeake is under a Commonwealth of Virginia Department of Environmental Quality Consent Order Dated December 19, 2014, relating to sanitary sewer overflows. This order applies to 14 localities in the Hampton Roads Area. The Consent Order reflects a February, 2014 Memorandum of Agreement (MOA) between all of the Localities and the Hampton Roads Sanitation District (HRSD) and assigns responsibilities to each party. HRSD assumes responsibility for all wet weather and capacity based on sanitary sewer overflows and their associated repairs. The City of Chesapeake assumes responsibility for dry weather, maintenance and operations based sanitary overflows and their associated remediation and repair. The HRSD is also subject to a USEPA Consent Decree relating to the same issue, which also identifies responsibilities per the February, 2014 MOA. Per this Consent Decree, HRSD is developing a Regional Wet Weather Management Plan that will identify what work tasks need to be completed when HRSD and localities’ sewer systems relating to capacity. Once this plan is completed, each locality, including the City of Chesapeake, will be able to complete development of their own plan identifying what work needs to be completed in order to comply with the DEQ Consent Order.
128
CITY OF CHESAPEAKE, VIRGINIA Schedule K, Continued Notes to Basic Financial Statements June 30, 2017
(Continued)
(17) Fund Deficits The Self-Insurance Fund and Self-Funded Health Fund, both Internal Service Funds, had net position deficits of $2,306,397 and $1,099,432 respectively at June 30, 2017. These deficits will be funded by future internal billings to other funds of the City.
The Chesapeake Public Schools, a component unit, had a net position deficit of $426,892,386 at June 30, 2017. The deficit is primarily due to a steady increase of Schools’ net other postemployment benefits (OPEB) obligation and net pension liability. At June 30, 2017, the School’s net OPEB obligation and net pension liability were $283,101,992 and $419,826,641 respectively.
(18) New Accounting Pronouncements
The GASB has issued the following pronouncements prior to June 30, 2017, which have effective dates that may impact future presentations. GASB Statement No. 75, Accounting and Financial Reporting for Postemployment Benefits Other Than Pensions. GASB Statement No. 75 will be effective for the City beginning with year ending June 30, 2018. GASB Statement No. 81, Irrevocable Split-Interest Agreements. GASB Statement No. 81 will be effective for the City beginning with year ending June 30, 2018. GASB Statement No. 82, Pension Issues – an amendment of GASB statements No. 67, No. 68, and No. 73. GASB Statement No. 82 will be effective for the City beginning with year ending June 30, 2018. GASB Statement No. 83, Certain Asset Retirement Obligations. GASB Statement No. 83 will be effective for the City beginning with year ending June 30, 2019. GASB Statement No. 84, Fiduciary Activities. GASB Statement No. 84 will be effective for the City beginning with year ending June 30, 2020. GASB Statement No. 85, Omnibus 2017. GASB Statement No. 85 will be effective for the City beginning with year ending June 30, 2018.
GASB Statement No. 86, Certain Debt Extinguishment Issues. GASB Statement No. 86 will be effective for the City beginning with year ending June 30, 2018. GASB Statement No. 87, Leases. GASB Statement No. 87 will be effective for the City beginning with year ending June 30, 2021. Management has not currently determined what impact the implementation of the above statements may have on the financial statements of the City.
129

This page intentionally left blank
Required Supplementary Information
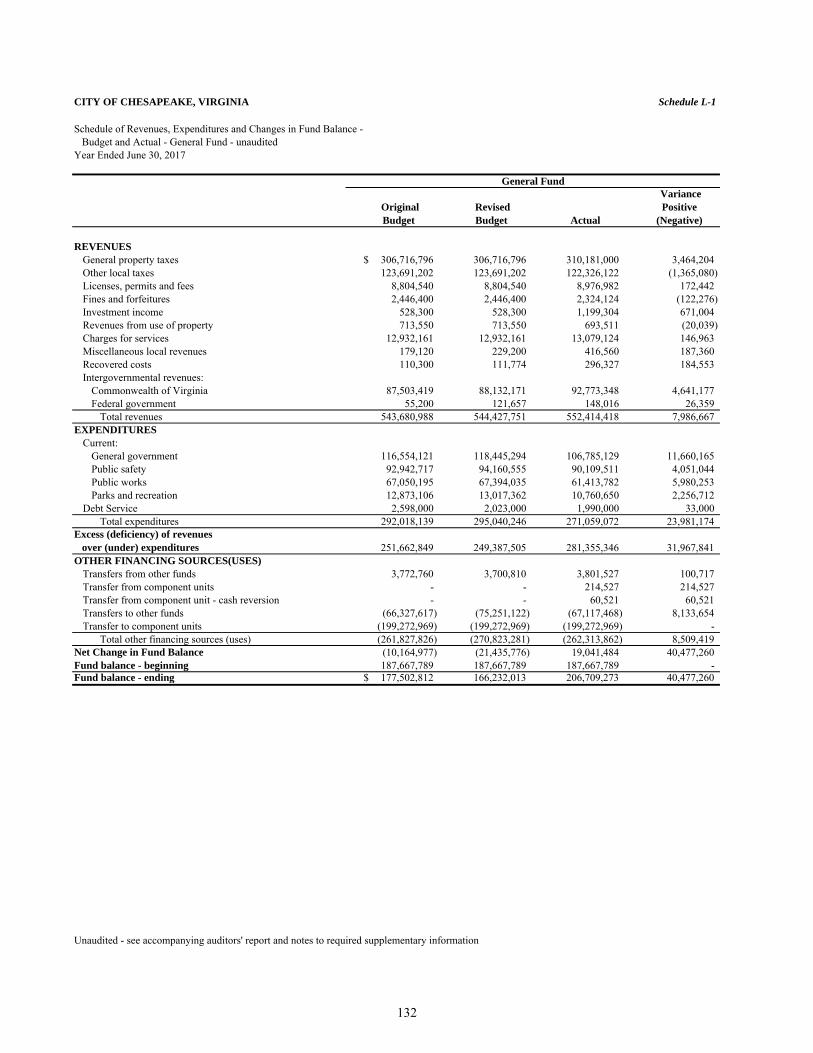
CITY OF CHESAPEAKE, VIRGINIA Schedule L-1
Schedule of Revenues, Expenditures and Changes in Fund Balance - Budget and Actual - General Fund - unauditedYear Ended June 30, 2017
OriginalBudget
RevisedBudget Actual
VariancePositive
(Negative)
REVENUESGeneral property taxes 306,716,796$ 306,716,796 310,181,000 3,464,204 Other local taxes 123,691,202 123,691,202 122,326,122 (1,365,080) Licenses, permits and fees 8,804,540 8,804,540 8,976,982 172,442 Fines and forfeitures 2,446,400 2,446,400 2,324,124 (122,276) Investment income 528,300 528,300 1,199,304 671,004 Revenues from use of property 713,550 713,550 693,511 (20,039) Charges for services 12,932,161 12,932,161 13,079,124 146,963 Miscellaneous local revenues 179,120 229,200 416,560 187,360 Recovered costs 110,300 111,774 296,327 184,553 Intergovernmental revenues:
Commonwealth of Virginia 87,503,419 88,132,171 92,773,348 4,641,177 Federal government 55,200 121,657 148,016 26,359
Total revenues 543,680,988 544,427,751 552,414,418 7,986,667 EXPENDITURES
Current:General government 116,554,121 118,445,294 106,785,129 11,660,165 Public safety 92,942,717 94,160,555 90,109,511 4,051,044 Public works 67,050,195 67,394,035 61,413,782 5,980,253 Parks and recreation 12,873,106 13,017,362 10,760,650 2,256,712
Debt Service 2,598,000 2,023,000 1,990,000 33,000 Total expenditures 292,018,139 295,040,246 271,059,072 23,981,174
Excess (deficiency) of revenues over (under) expenditures 251,662,849 249,387,505 281,355,346 31,967,841 OTHER FINANCING SOURCES(USES)
Transfers from other funds 3,772,760 3,700,810 3,801,527 100,717 Transfer from component units - - 214,527 214,527 Transfer from component unit - cash reversion - - 60,521 60,521 Transfers to other funds (66,327,617) (75,251,122) (67,117,468) 8,133,654 Transfer to component units (199,272,969) (199,272,969) (199,272,969) -
Total other financing sources (uses) (261,827,826) (270,823,281) (262,313,862) 8,509,419 Net Change in Fund Balance (10,164,977) (21,435,776) 19,041,484 40,477,260 Fund balance - beginning 187,667,789 187,667,789 187,667,789 - Fund balance - ending 177,502,812$ 166,232,013 206,709,273 40,477,260
Unaudited - see accompanying auditors' report and notes to required supplementary information
General Fund
132
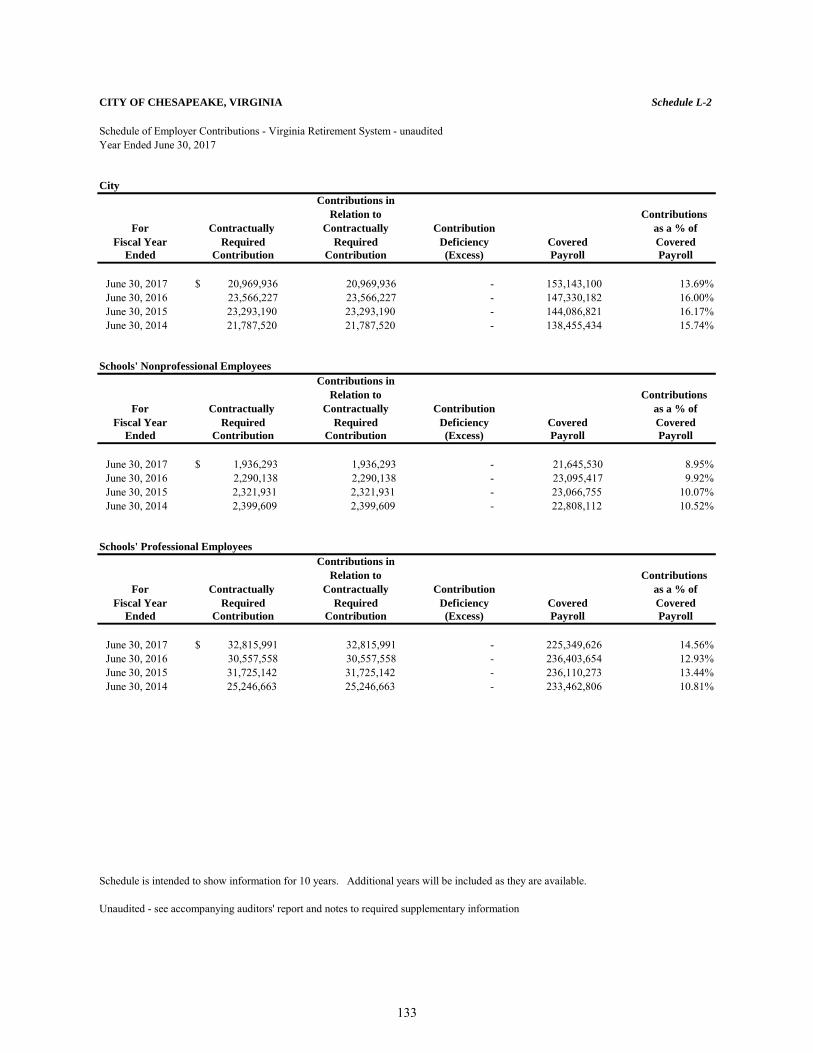
CITY OF CHESAPEAKE, VIRGINIA Schedule L-2
Schedule of Employer Contributions - Virginia Retirement System - unauditedYear Ended June 30, 2017
CityContributions in
Relation to Contributions For Contractually Contractually Contribution as a % of
Fiscal Year Required Required Deficiency Covered CoveredEnded Contribution Contribution (Excess) Payroll Payroll
June 30, 2017 $ 20,969,936 20,969,936 - 153,143,100 13.69%June 30, 2016 23,566,227 23,566,227 - 147,330,182 16.00%June 30, 2015 23,293,190 23,293,190 - 144,086,821 16.17%June 30, 2014 21,787,520 21,787,520 - 138,455,434 15.74%
Schools' Nonprofessional EmployeesContributions in
Relation to Contributions For Contractually Contractually Contribution as a % of
Fiscal Year Required Required Deficiency Covered CoveredEnded Contribution Contribution (Excess) Payroll Payroll
June 30, 2017 $ 1,936,293 1,936,293 - 21,645,530 8.95%June 30, 2016 2,290,138 2,290,138 - 23,095,417 9.92%June 30, 2015 2,321,931 2,321,931 - 23,066,755 10.07%June 30, 2014 2,399,609 2,399,609 - 22,808,112 10.52%
Schools' Professional EmployeesContributions in
Relation to Contributions For Contractually Contractually Contribution as a % of
Fiscal Year Required Required Deficiency Covered CoveredEnded Contribution Contribution (Excess) Payroll Payroll
June 30, 2017 $ 32,815,991 32,815,991 - 225,349,626 14.56%June 30, 2016 30,557,558 30,557,558 - 236,403,654 12.93%June 30, 2015 31,725,142 31,725,142 - 236,110,273 13.44%June 30, 2014 25,246,663 25,246,663 - 233,462,806 10.81%
Schedule is intended to show information for 10 years. Additional years will be included as they are available.
Unaudited - see accompanying auditors' report and notes to required supplementary information
133
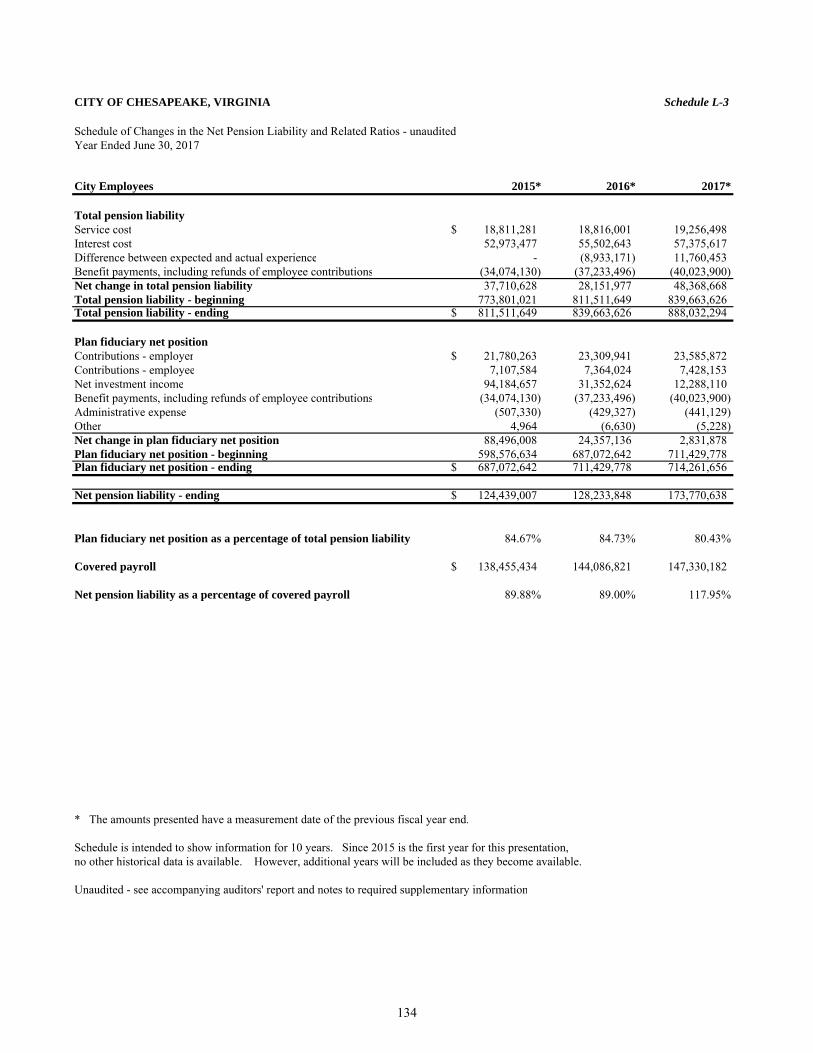
CITY OF CHESAPEAKE, VIRGINIA Schedule L-3
Schedule of Changes in the Net Pension Liability and Related Ratios - unauditedYear Ended June 30, 2017
City Employees 2015* 2016* 2017*
Total pension liabilityService cost $ 18,811,281 18,816,001 19,256,498Interest cost 52,973,477 55,502,643 57,375,617Difference between expected and actual experience - (8,933,171) 11,760,453Benefit payments, including refunds of employee contributions (34,074,130) (37,233,496) (40,023,900)Net change in total pension liability 37,710,628 28,151,977 48,368,668 Total pension liability - beginning 773,801,021 811,511,649 839,663,626Total pension liability - ending $ 811,511,649 839,663,626 888,032,294
Plan fiduciary net positionContributions - employer $ 21,780,263 23,309,941 23,585,872Contributions - employee 7,107,584 7,364,024 7,428,153Net investment income 94,184,657 31,352,624 12,288,110Benefit payments, including refunds of employee contributions (34,074,130) (37,233,496) (40,023,900)Administrative expense (507,330) (429,327) (441,129)Other 4,964 (6,630) (5,228)Net change in plan fiduciary net position 88,496,008 24,357,136 2,831,878 Plan fiduciary net position - beginning 598,576,634 687,072,642 711,429,778Plan fiduciary net position - ending $ 687,072,642 711,429,778 714,261,656
Net pension liability - ending $ 124,439,007 128,233,848 173,770,638
Plan fiduciary net position as a percentage of total pension liability 84.67% 84.73% 80.43%
Covered payroll $ 138,455,434 144,086,821 147,330,182
Net pension liability as a percentage of covered payroll 89.88% 89.00% 117.95%
* The amounts presented have a measurement date of the previous fiscal year end.
Schedule is intended to show information for 10 years. Since 2015 is the first year for this presentation,no other historical data is available. However, additional years will be included as they become available.
Unaudited - see accompanying auditors' report and notes to required supplementary information
134
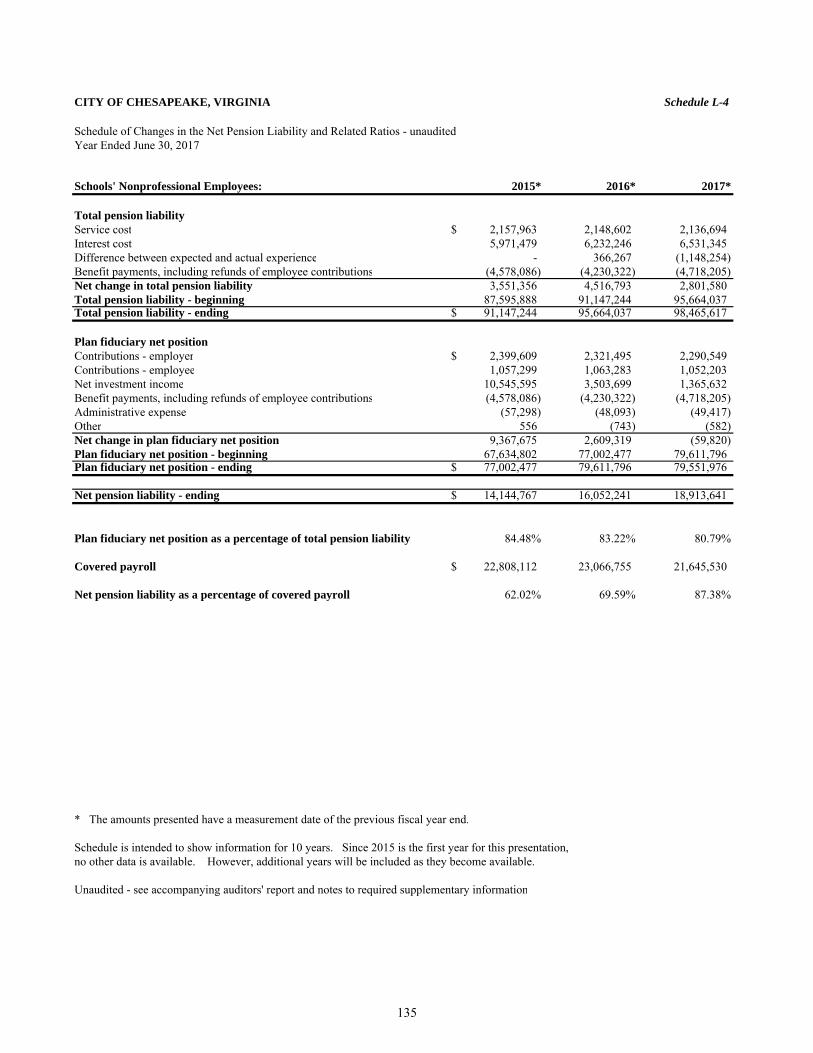
CITY OF CHESAPEAKE, VIRGINIA Schedule L-4
Schedule of Changes in the Net Pension Liability and Related Ratios - unauditedYear Ended June 30, 2017
Schools' Nonprofessional Employees: 2015* 2016* 2017*
Total pension liabilityService cost $ 2,157,963 2,148,602 2,136,694Interest cost 5,971,479 6,232,246 6,531,345Difference between expected and actual experience - 366,267 (1,148,254)Benefit payments, including refunds of employee contributions (4,578,086) (4,230,322) (4,718,205)Net change in total pension liability 3,551,356 4,516,793 2,801,580Total pension liability - beginning 87,595,888 91,147,244 95,664,037Total pension liability - ending $ 91,147,244 95,664,037 98,465,617
Plan fiduciary net positionContributions - employer $ 2,399,609 2,321,495 2,290,549Contributions - employee 1,057,299 1,063,283 1,052,203Net investment income 10,545,595 3,503,699 1,365,632Benefit payments, including refunds of employee contributions (4,578,086) (4,230,322) (4,718,205)Administrative expense (57,298) (48,093) (49,417)Other 556 (743) (582)Net change in plan fiduciary net position 9,367,675 2,609,319 (59,820)Plan fiduciary net position - beginning 67,634,802 77,002,477 79,611,796Plan fiduciary net position - ending $ 77,002,477 79,611,796 79,551,976
Net pension liability - ending $ 14,144,767 16,052,241 18,913,641
Plan fiduciary net position as a percentage of total pension liability 84.48% 83.22% 80.79%
Covered payroll $ 22,808,112 23,066,755 21,645,530
Net pension liability as a percentage of covered payroll 62.02% 69.59% 87.38%
* The amounts presented have a measurement date of the previous fiscal year end.
Schedule is intended to show information for 10 years. Since 2015 is the first year for this presentation,no other data is available. However, additional years will be included as they become available.
Unaudited - see accompanying auditors' report and notes to required supplementary information
135
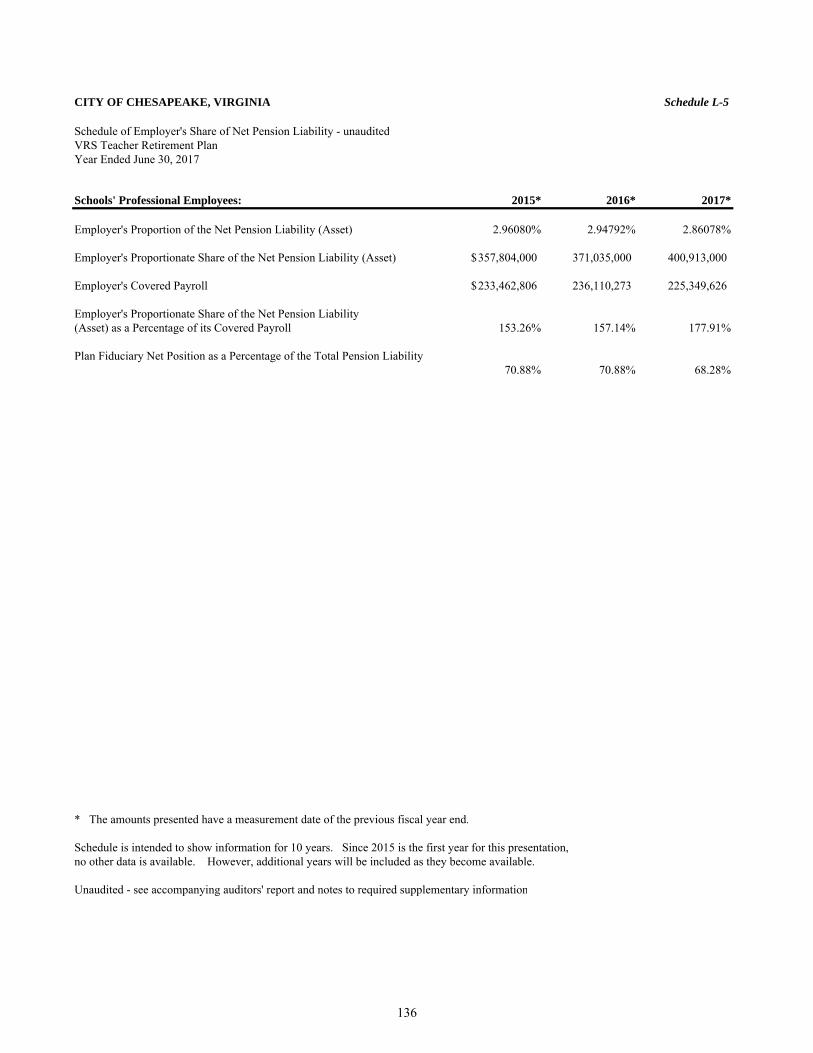
CITY OF CHESAPEAKE, VIRGINIA Schedule L-5
Schedule of Employer's Share of Net Pension Liability - unauditedVRS Teacher Retirement PlanYear Ended June 30, 2017
Schools' Professional Employees: 2015* 2016* 2017*
Employer's Proportion of the Net Pension Liability (Asset) 2.96080% 2.94792% 2.86078%
Employer's Proportionate Share of the Net Pension Liability (Asset) 357,804,000$ 371,035,000 400,913,000
Employer's Covered Payroll 233,462,806$ 236,110,273 225,349,626
Employer's Proportionate Share of the Net Pension Liability (Asset) as a Percentage of its Covered Payroll 153.26% 157.14% 177.91%
Plan Fiduciary Net Position as a Percentage of the Total Pension Liability 70.88% 70.88% 68.28%
* The amounts presented have a measurement date of the previous fiscal year end.
Schedule is intended to show information for 10 years. Since 2015 is the first year for this presentation,no other data is available. However, additional years will be included as they become available.
Unaudited - see accompanying auditors' report and notes to required supplementary information
136
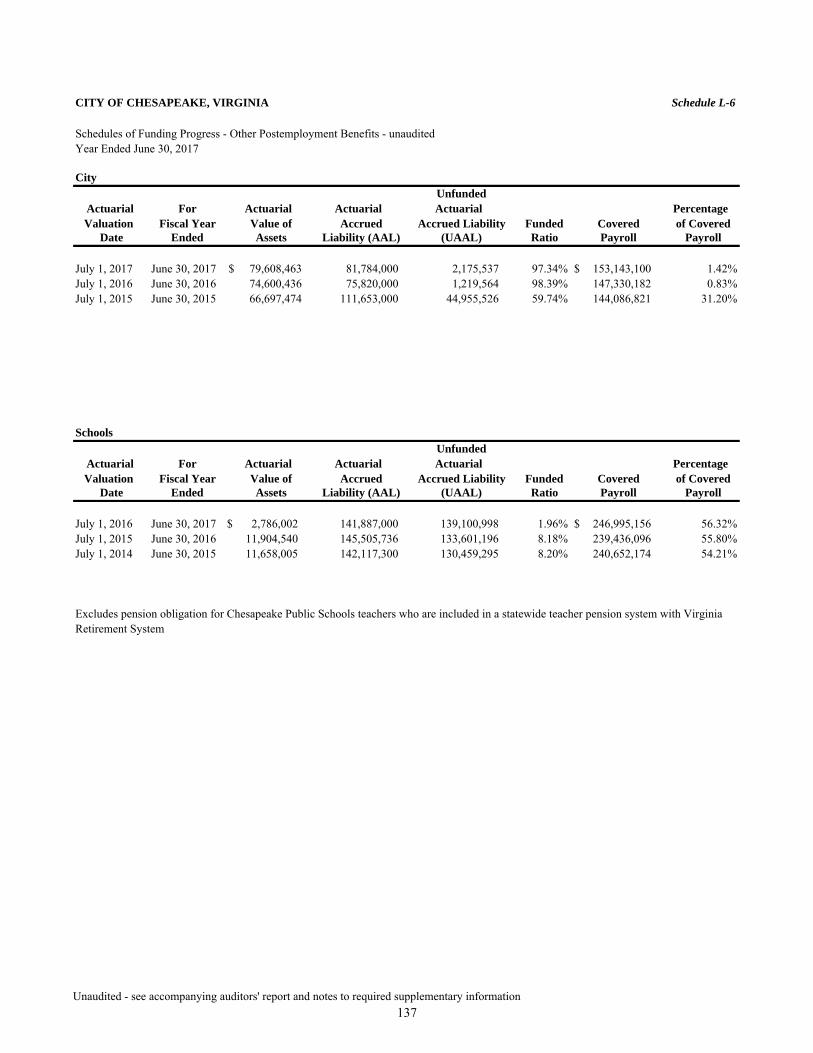
CITY OF CHESAPEAKE, VIRGINIA Schedule L-6
Schedules of Funding Progress - Other Postemployment Benefits - unauditedYear Ended June 30, 2017
CityUnfunded
Actuarial For Actuarial Actuarial Actuarial Percentage Valuation Fiscal Year Value of Accrued Accrued Liability Funded Covered of Covered
Date Ended Assets Liability (AAL) (UAAL) Ratio Payroll Payroll
July 1, 2017 June 30, 2017 $ 79,608,463 81,784,000 2,175,537 97.34% $ 153,143,100 1.42%July 1, 2016 June 30, 2016 74,600,436 75,820,000 1,219,564 98.39% 147,330,182 0.83%July 1, 2015 June 30, 2015 66,697,474 111,653,000 44,955,526 59.74% 144,086,821 31.20%
SchoolsUnfunded
Actuarial For Actuarial Actuarial Actuarial Percentage Valuation Fiscal Year Value of Accrued Accrued Liability Funded Covered of Covered
Date Ended Assets Liability (AAL) (UAAL) Ratio Payroll Payroll
July 1, 2016 June 30, 2017 $ 2,786,002 141,887,000 139,100,998 1.96% $ 246,995,156 56.32%July 1, 2015 June 30, 2016 11,904,540 145,505,736 133,601,196 8.18% 239,436,096 55.80%July 1, 2014 June 30, 2015 11,658,005 142,117,300 130,459,295 8.20% 240,652,174 54.21%
Retirement SystemExcludes pension obligation for Chesapeake Public Schools teachers who are included in a statewide teacher pension system with Virginia
Unaudited - see accompanying auditors' report and notes to required supplementary information137
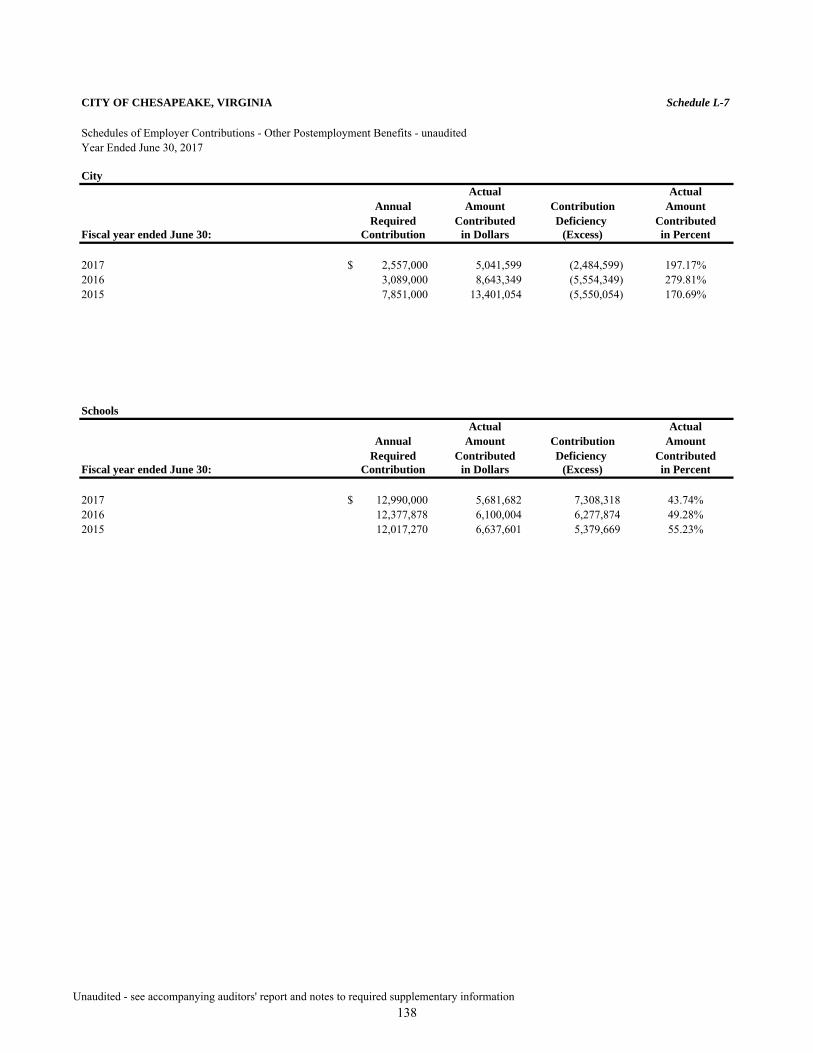
CITY OF CHESAPEAKE, VIRGINIA Schedule L-7
Schedules of Employer Contributions - Other Postemployment Benefits - unauditedYear Ended June 30, 2017
CityActual Actual
Annual Amount Contribution AmountRequired Contributed Deficiency Contributed
Fiscal year ended June 30: Contribution in Dollars (Excess) in Percent
2017 $ 2,557,000 5,041,599 (2,484,599) 197.17%2016 3,089,000 8,643,349 (5,554,349) 279.81%2015 7,851,000 13,401,054 (5,550,054) 170.69%
SchoolsActual Actual
Annual Amount Contribution AmountRequired Contributed Deficiency Contributed
Fiscal year ended June 30: Contribution in Dollars (Excess) in Percent
2017 $ 12,990,000 5,681,682 7,308,318 43.74%2016 12,377,878 6,100,004 6,277,874 49.28%2015 12,017,270 6,637,601 5,379,669 55.23%
Unaudited - see accompanying auditors' report and notes to required supplementary information138
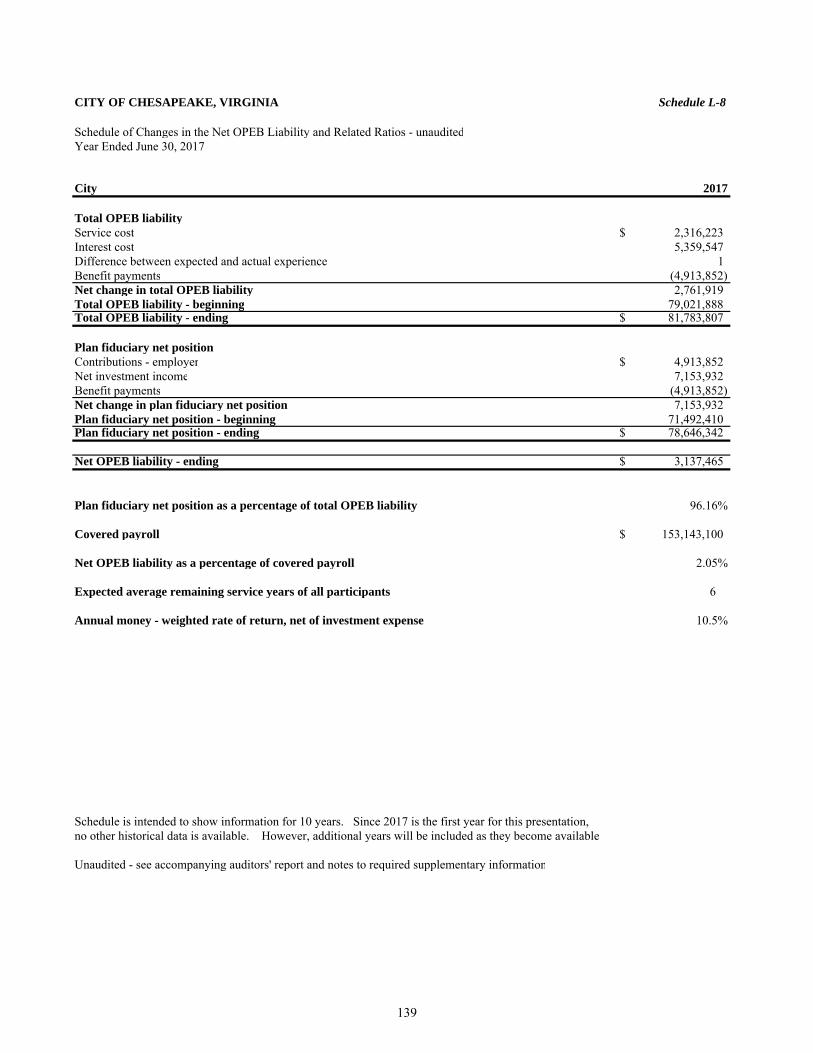
CITY OF CHESAPEAKE, VIRGINIA Schedule L-8
Schedule of Changes in the Net OPEB Liability and Related Ratios - unauditedYear Ended June 30, 2017
City 2017
Total OPEB liabilityService cost $ 2,316,223Interest cost 5,359,547Difference between expected and actual experience 1Benefit payments (4,913,852)Net change in total OPEB liability 2,761,919 Total OPEB liability - beginning 79,021,888Total OPEB liability - ending $ 81,783,807
Plan fiduciary net positionContributions - employer $ 4,913,852Net investment income 7,153,932Benefit payments (4,913,852)Net change in plan fiduciary net position 7,153,932 Plan fiduciary net position - beginning 71,492,410Plan fiduciary net position - ending $ 78,646,342
Net OPEB liability - ending $ 3,137,465
Plan fiduciary net position as a percentage of total OPEB liability 96.16%
Covered payroll $ 153,143,100
Net OPEB liability as a percentage of covered payroll 2.05%
Expected average remaining service years of all participants 6
Annual money - weighted rate of return, net of investment expense 10.5%
Schedule is intended to show information for 10 years. Since 2017 is the first year for this presentation,no other historical data is available. However, additional years will be included as they become available
Unaudited - see accompanying auditors' report and notes to required supplementary information
139
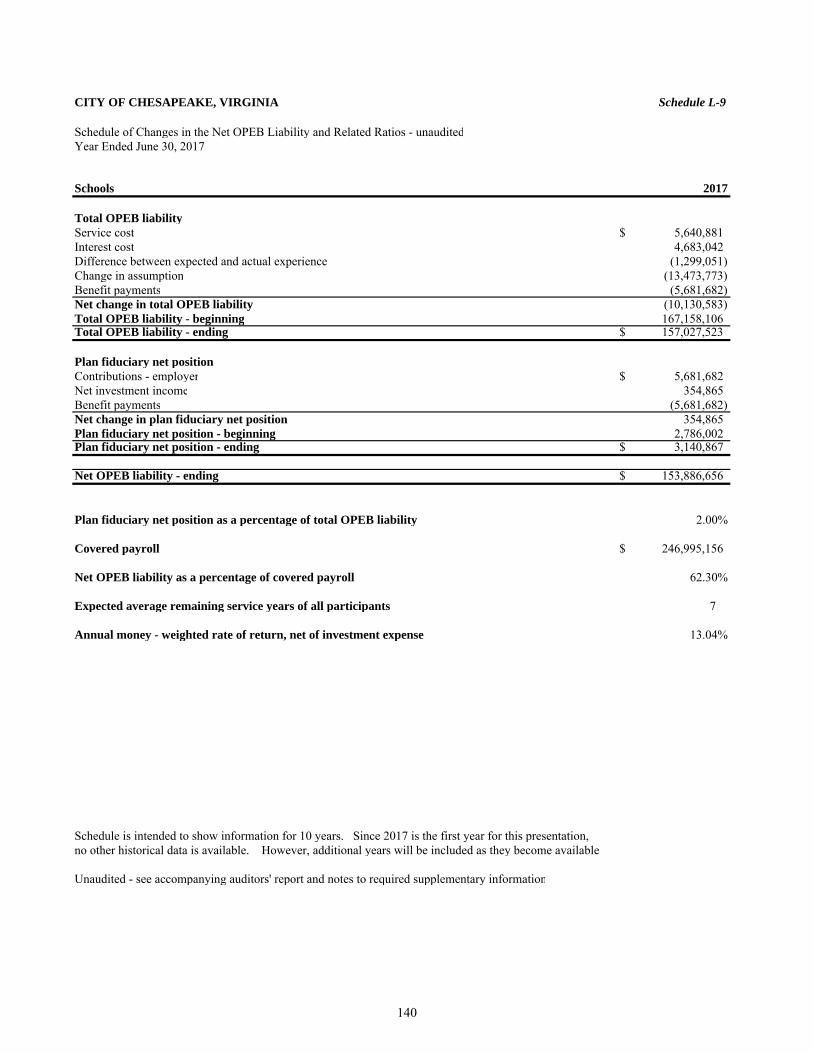
CITY OF CHESAPEAKE, VIRGINIA Schedule L-9
Schedule of Changes in the Net OPEB Liability and Related Ratios - unauditedYear Ended June 30, 2017
Schools 2017
Total OPEB liabilityService cost $ 5,640,881Interest cost 4,683,042Difference between expected and actual experience (1,299,051)Change in assumption (13,473,773)Benefit payments (5,681,682)Net change in total OPEB liability (10,130,583) Total OPEB liability - beginning 167,158,106Total OPEB liability - ending $ 157,027,523
Plan fiduciary net positionContributions - employer $ 5,681,682Net investment income 354,865Benefit payments (5,681,682)Net change in plan fiduciary net position 354,865 Plan fiduciary net position - beginning 2,786,002Plan fiduciary net position - ending $ 3,140,867
Net OPEB liability - ending $ 153,886,656
Plan fiduciary net position as a percentage of total OPEB liability 2.00%
Covered payroll $ 246,995,156
Net OPEB liability as a percentage of covered payroll 62.30%
Expected average remaining service years of all participants 7
Annual money - weighted rate of return, net of investment expense 13.04%
Schedule is intended to show information for 10 years. Since 2017 is the first year for this presentation,no other historical data is available. However, additional years will be included as they become available
Unaudited - see accompanying auditors' report and notes to required supplementary information
140
CITY OF CHESAPEAKE, VIRGINIA Schedule L-10 Notes to Required Supplementary Information June 30, 2017
Unaudited – see accompanying auditors’ report
(1) Budgets and Budgetary Accounting The City follows these procedures in establishing the budgetary data reflected in the financial statements: Annual budget requests of the General Fund, Special Revenue Funds (except the Community Development Fund, Grants Fund, Open Space Agriculture Preservation Fund and CSB of Chesapeake, Inc., a blended component unit), Debt Service Fund and Enterprise Funds (excluding construction funds) for the ensuing fiscal year are submitted to the City Manager by department or agency heads during the second quarter of the fiscal year. The City Manager reviews the requests and meets with department heads to discuss the requests. The Capital Projects Funds, Public Utilities Construction Funds, Chesapeake Transportation System Construction Fund, Stormwater Management Construction Fund, Grants Fund, Open Space Agriculture Preservation Fund and the Community Development Fund utilize project budgets in lieu of legally adopted annual budgets. The City Council does not adopt a budget for CSB of Chesapeake, Inc. Section 5.02 of the City Charter states that “the City Manager shall submit to the Council an operating budget and a budget message at least 90 days prior to the beginning of each fiscal year”. This budget includes the Public Schools budget request as adopted by the School Board which is by law a separate and autonomous “body politic”. The City Manager can recommend a revision only in the total estimated resources and requirements in the School Board budget request. The City Council makes an annual appropriation to the Public Schools but is prohibited from exercising any control over specific expenditures of the Public Schools operating funds.
The budget is required to be adopted at the fund level by a majority vote of the City Council at least 47 days prior to the end of the current fiscal year. After work sessions and public hearings, the City Manager’s recommended budget may be amended as necessary by the City Council and an appropriations ordinance, tax levy and other revenue enhancements as may be necessary to balance the budget are adopted. Tax rates are established prior to the beginning of the fiscal year. The City Council may authorize supplemental appropriations during the fiscal year based on the availability of financial resources. Effective with budget year beginning July 1, 2016, the City Manager is authorized by City Council to make transfers of funds between funds, departments and programs up to $250,000 and is required to notify City Council. For any budget transfers are greater than $250,000, cross capital projects or cross between operating and capital budgets, the requests must be authorized by City Council. Any revisions that alter total appropriations must be approved by City Council. The legal level of budgetary control rests at the fund level. Each appropriation in a legally adopted annual budget lapses at the close of the fiscal year to the extent that it has not been expended or encumbered. Because encumbrances outstanding at year end are reappropriated under the following year’s budget adoption process, encumbrances are considered expenditures (for budgetary purposes) in the year that the expenditure is incurred. Appropriations for funds utilizing capital or project budgets do not lapse at year end but are multi-year and continue until the purpose of the appropriation has been fulfilled or abandoned. Appropriations under the capital improvement program are considered abandoned if three years pass without any disbursement or encumbrance of the appropriation. The level of budgetary control is on a project basis with additional controls being exercised administratively, as reasonable and necessary.
141
CITY OF CHESAPEAKE, VIRGINIA Schedule L-10, Continued Notes to Required Supplementary Information June 30, 2016
Unaudited – see accompanying auditors’ report
The General Fund budget is adopted on a modified accrual basis consistent with accounting principles generally accepted in the United States of America. The original budget includes the adjustments necessary to bring forward the reappropriated encumbrances as authorized in the annual budget resolution.
(2) Retirement Plans
Changes of benefit terms – All Plans There have been no significant changes to the Virginia Retirement System (VRS) benefit provisions since the prior actuarial valuation. A hybrid plan with changes to the defined benefit plan structure and a new defined contribution component were adopted in 2012. The hybrid plan applies to most new employees hired on or after January 1, 2014 and not covered by enhanced hazardous duty benefits. The liabilities presented do not reflect the hybrid plan since it covers new members joining the System after the valuation date of June 30, 2013 and the impact on the liabilities as of the measurement date of June 30, 2014 are minimal.
Changes of assumptions – The following changes in actuarial assumptions were made effective June 30, 2013 based on the most recent experience study of the VRS for the four year period ending June 30, 2012:
Schools Professional Employees
- Update mortality table - Adjustment to the rates of service retirement - Decrease in rates of withdrawals for 3 through 9 years of service - Decrease in rates of disability - Reduce rates of salary increase by 0.25% per year
City Employees and Schools Nonprofessional Employees
Largest 10 – Non-LEOs: - Update mortality table - Decrease in rates of service retirement - Decrease in rates of disability retirement
- Reduce rates of salary increase by 0.25% per year Largest 10 – LEOs: - Update mortality table - Decrease in male rates of disability All Others (Non 10 Largest) – Non-LEOs: - Update mortality table - Decrease in rates of service retirement - Decrease in rates of disability retirement - Reduce rates of salary increase by 0.25% per year All Others (Non 10 Largest) – LEOs: - Update mortality table - Adjustment to the rates of service retirement for females - Increase in rates of withdrawal - Decrease in male and female rates of disability
142

Other Supplementary Information - Combining and Individual Fund
Schedules

This page intentionally left blank
General Fund
General Fund – To account for all revenues and expenditures of the City which are not accounted for in other funds. Revenues are primarily derived from general property taxes, other local taxes, charges for services and revenue from state and federal grants.
A significant part of the General Fund’s revenue is transferred to component units and other funds, principally to fund operations of the Chesapeake Public Schools, the Virginia Public Assistance Fund, the Community Services Fund, debt service requirements for the City and Public Schools and to fund construction projects.
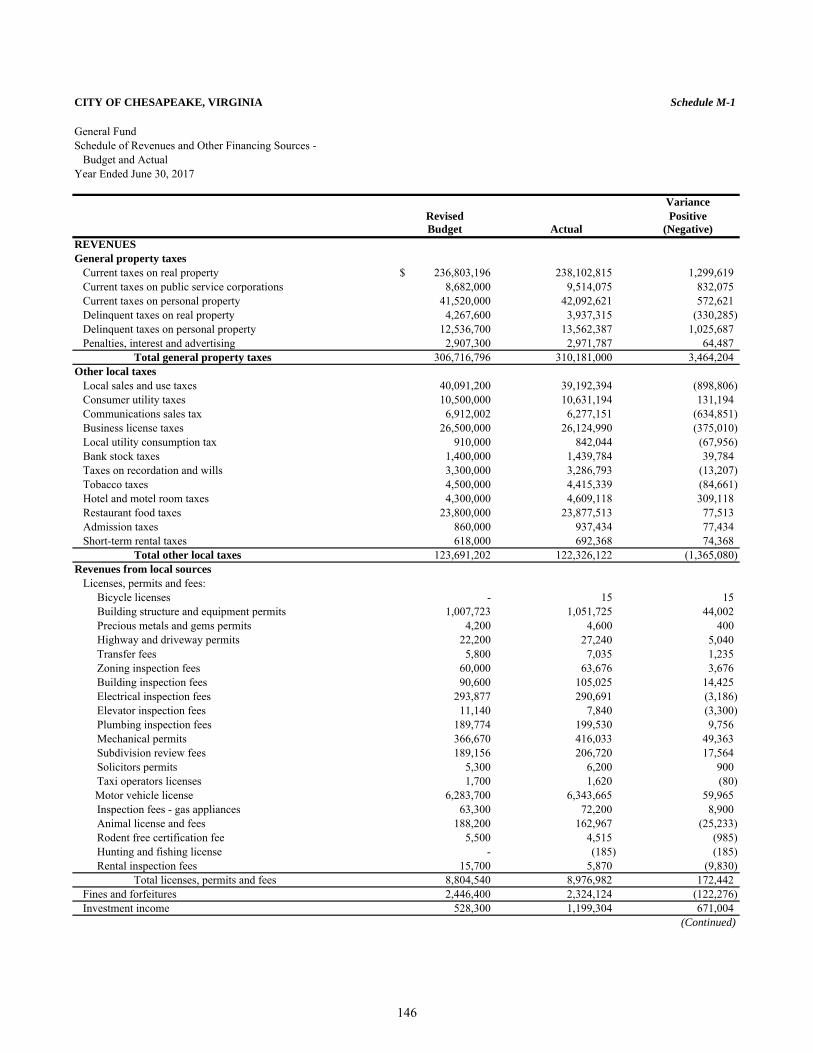
CITY OF CHESAPEAKE, VIRGINIA Schedule M-1
General FundSchedule of Revenues and Other Financing Sources - Budget and ActualYear Ended June 30, 2017
VarianceRevised PositiveBudget Actual (Negative)
REVENUESGeneral property taxes Current taxes on real property 236,803,196$ 238,102,815 1,299,619 Current taxes on public service corporations 8,682,000 9,514,075 832,075 Current taxes on personal property 41,520,000 42,092,621 572,621 Delinquent taxes on real property 4,267,600 3,937,315 (330,285) Delinquent taxes on personal property 12,536,700 13,562,387 1,025,687 Penalties, interest and advertising 2,907,300 2,971,787 64,487 Total general property taxes 306,716,796 310,181,000 3,464,204 Other local taxes Local sales and use taxes 40,091,200 39,192,394 (898,806) Consumer utility taxes 10,500,000 10,631,194 131,194 Communications sales tax 6,912,002 6,277,151 (634,851) Business license taxes 26,500,000 26,124,990 (375,010) Local utility consumption tax 910,000 842,044 (67,956) Bank stock taxes 1,400,000 1,439,784 39,784 Taxes on recordation and wills 3,300,000 3,286,793 (13,207) Tobacco taxes 4,500,000 4,415,339 (84,661) Hotel and motel room taxes 4,300,000 4,609,118 309,118 Restaurant food taxes 23,800,000 23,877,513 77,513 Admission taxes 860,000 937,434 77,434 Short-term rental taxes 618,000 692,368 74,368 Total other local taxes 123,691,202 122,326,122 (1,365,080) Revenues from local sources Licenses, permits and fees: Bicycle licenses - 15 15 Building structure and equipment permits 1,007,723 1,051,725 44,002 Precious metals and gems permits 4,200 4,600 400 Highway and driveway permits 22,200 27,240 5,040 Transfer fees 5,800 7,035 1,235 Zoning inspection fees 60,000 63,676 3,676 Building inspection fees 90,600 105,025 14,425 Electrical inspection fees 293,877 290,691 (3,186) Elevator inspection fees 11,140 7,840 (3,300) Plumbing inspection fees 189,774 199,530 9,756 Mechanical permits 366,670 416,033 49,363 Subdivision review fees 189,156 206,720 17,564 Solicitors permits 5,300 6,200 900 Taxi operators licenses 1,700 1,620 (80)
Motor vehicle license 6,283,700 6,343,665 59,965 Inspection fees - gas appliances 63,300 72,200 8,900 Animal license and fees 188,200 162,967 (25,233) Rodent free certification fee 5,500 4,515 (985) Hunting and fishing license - (185) (185) Rental inspection fees 15,700 5,870 (9,830) Total licenses, permits and fees 8,804,540 8,976,982 172,442 Fines and forfeitures 2,446,400 2,324,124 (122,276) Investment income 528,300 1,199,304 671,004
(Continued)
146
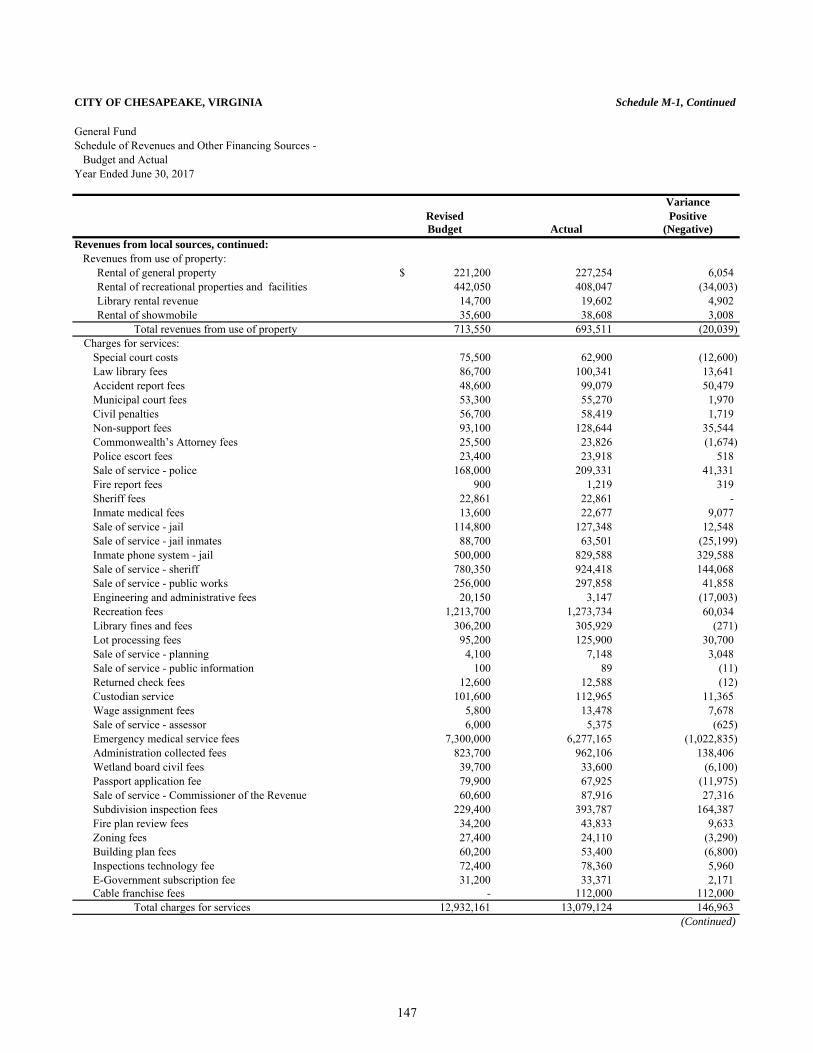
CITY OF CHESAPEAKE, VIRGINIA Schedule M-1, Continued
General FundSchedule of Revenues and Other Financing Sources - Budget and ActualYear Ended June 30, 2017
VarianceRevised PositiveBudget Actual (Negative)
Revenues from local sources, continued: Revenues from use of property: Rental of general property 221,200$ 227,254 6,054 Rental of recreational properties and facilities 442,050 408,047 (34,003) Library rental revenue 14,700 19,602 4,902 Rental of showmobile 35,600 38,608 3,008 Total revenues from use of property 713,550 693,511 (20,039)
Charges for services:Special court costs 75,500 62,900 (12,600) Law library fees 86,700 100,341 13,641 Accident report fees 48,600 99,079 50,479 Municipal court fees 53,300 55,270 1,970 Civil penalties 56,700 58,419 1,719 Non-support fees 93,100 128,644 35,544 Commonwealth’s Attorney fees 25,500 23,826 (1,674) Police escort fees 23,400 23,918 518 Sale of service - police 168,000 209,331 41,331 Fire report fees 900 1,219 319 Sheriff fees 22,861 22,861 - Inmate medical fees 13,600 22,677 9,077 Sale of service - jail 114,800 127,348 12,548 Sale of service - jail inmates 88,700 63,501 (25,199) Inmate phone system - jail 500,000 829,588 329,588 Sale of service - sheriff 780,350 924,418 144,068 Sale of service - public works 256,000 297,858 41,858 Engineering and administrative fees 20,150 3,147 (17,003) Recreation fees 1,213,700 1,273,734 60,034 Library fines and fees 306,200 305,929 (271) Lot processing fees 95,200 125,900 30,700 Sale of service - planning 4,100 7,148 3,048 Sale of service - public information 100 89 (11) Returned check fees 12,600 12,588 (12) Custodian service 101,600 112,965 11,365 Wage assignment fees 5,800 13,478 7,678 Sale of service - assessor 6,000 5,375 (625) Emergency medical service fees 7,300,000 6,277,165 (1,022,835) Administration collected fees 823,700 962,106 138,406 Wetland board civil fees 39,700 33,600 (6,100) Passport application fee 79,900 67,925 (11,975) Sale of service - Commissioner of the Revenue 60,600 87,916 27,316 Subdivision inspection fees 229,400 393,787 164,387 Fire plan review fees 34,200 43,833 9,633 Zoning fees 27,400 24,110 (3,290) Building plan fees 60,200 53,400 (6,800) Inspections technology fee 72,400 78,360 5,960 E-Government subscription fee 31,200 33,371 2,171 Cable franchise fees - 112,000 112,000
Total charges for services 12,932,161 13,079,124 146,963 (Continued)
147
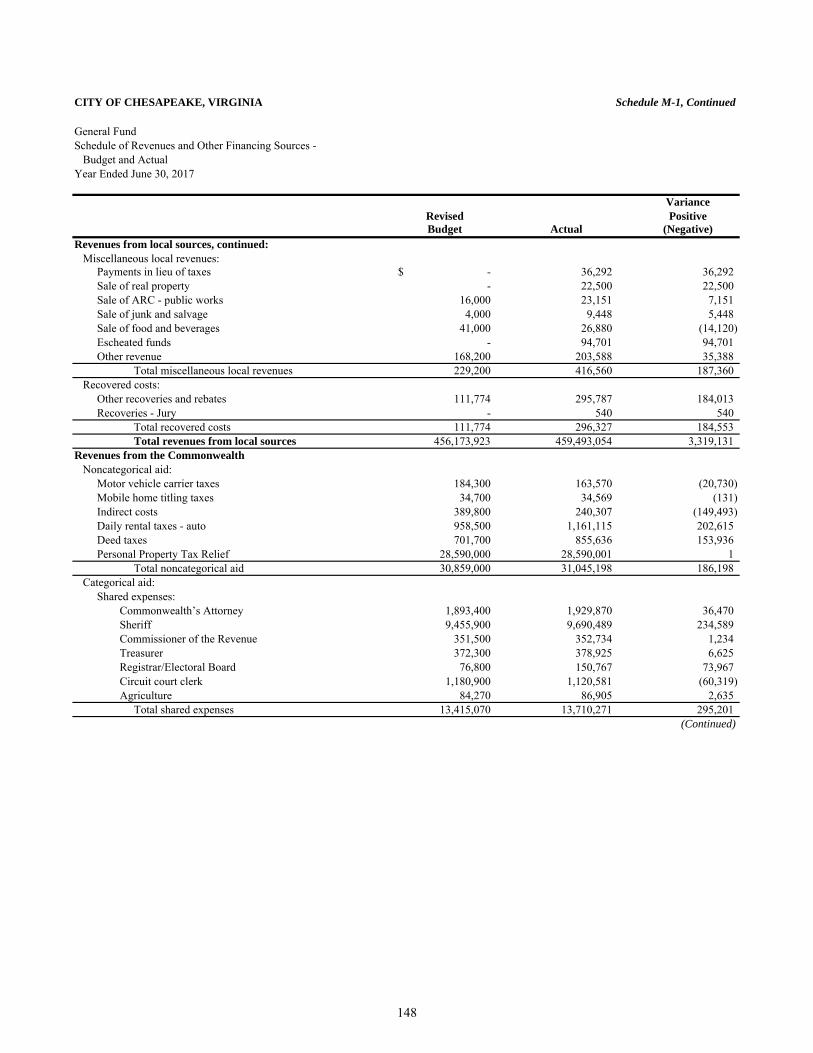
CITY OF CHESAPEAKE, VIRGINIA Schedule M-1, Continued
General FundSchedule of Revenues and Other Financing Sources - Budget and ActualYear Ended June 30, 2017
VarianceRevised PositiveBudget Actual (Negative)
Revenues from local sources, continued: Miscellaneous local revenues: Payments in lieu of taxes -$ 36,292 36,292 Sale of real property - 22,500 22,500 Sale of ARC - public works 16,000 23,151 7,151 Sale of junk and salvage 4,000 9,448 5,448 Sale of food and beverages 41,000 26,880 (14,120) Escheated funds - 94,701 94,701 Other revenue 168,200 203,588 35,388 Total miscellaneous local revenues 229,200 416,560 187,360 Recovered costs: Other recoveries and rebates 111,774 295,787 184,013 Recoveries - Jury - 540 540 Total recovered costs 111,774 296,327 184,553 Total revenues from local sources 456,173,923 459,493,054 3,319,131 Revenues from the Commonwealth Noncategorical aid: Motor vehicle carrier taxes 184,300 163,570 (20,730) Mobile home titling taxes 34,700 34,569 (131) Indirect costs 389,800 240,307 (149,493) Daily rental taxes - auto 958,500 1,161,115 202,615 Deed taxes 701,700 855,636 153,936 Personal Property Tax Relief 28,590,000 28,590,001 1 Total noncategorical aid 30,859,000 31,045,198 186,198 Categorical aid: Shared expenses: Commonwealth’s Attorney 1,893,400 1,929,870 36,470 Sheriff 9,455,900 9,690,489 234,589 Commissioner of the Revenue 351,500 352,734 1,234 Treasurer 372,300 378,925 6,625 Registrar/Electoral Board 76,800 150,767 73,967 Circuit court clerk 1,180,900 1,120,581 (60,319) Agriculture 84,270 86,905 2,635 Total shared expenses 13,415,070 13,710,271 295,201
(Continued)
148
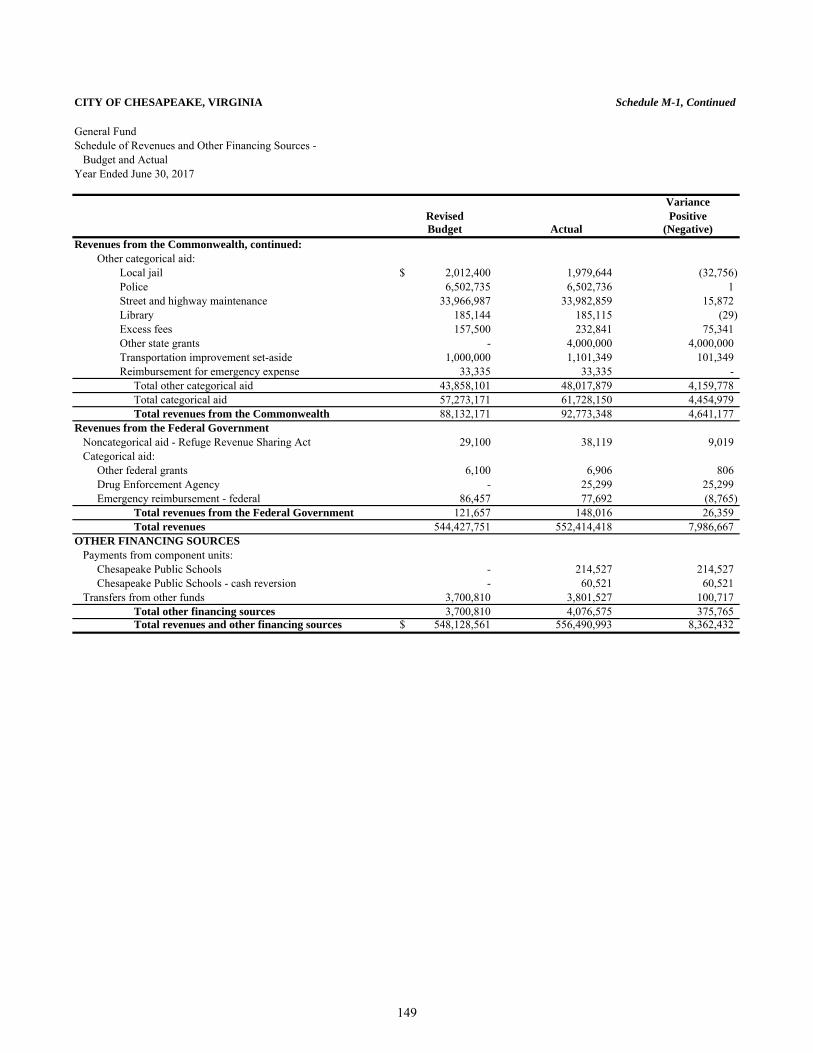
CITY OF CHESAPEAKE, VIRGINIA Schedule M-1, Continued
General FundSchedule of Revenues and Other Financing Sources - Budget and ActualYear Ended June 30, 2017
VarianceRevised PositiveBudget Actual (Negative)
Revenues from the Commonwealth, continued: Other categorical aid: Local jail 2,012,400$ 1,979,644 (32,756) Police 6,502,735 6,502,736 1 Street and highway maintenance 33,966,987 33,982,859 15,872 Library 185,144 185,115 (29) Excess fees 157,500 232,841 75,341 Other state grants - 4,000,000 4,000,000 Transportation improvement set-aside 1,000,000 1,101,349 101,349 Reimbursement for emergency expense 33,335 33,335 - Total other categorical aid 43,858,101 48,017,879 4,159,778 Total categorical aid 57,273,171 61,728,150 4,454,979 Total revenues from the Commonwealth 88,132,171 92,773,348 4,641,177 Revenues from the Federal Government Noncategorical aid - Refuge Revenue Sharing Act 29,100 38,119 9,019 Categorical aid: Other federal grants 6,100 6,906 806 Drug Enforcement Agency - 25,299 25,299 Emergency reimbursement - federal 86,457 77,692 (8,765) Total revenues from the Federal Government 121,657 148,016 26,359 Total revenues 544,427,751 552,414,418 7,986,667 OTHER FINANCING SOURCES Payments from component units: Chesapeake Public Schools - 214,527 214,527 Chesapeake Public Schools - cash reversion - 60,521 60,521 Transfers from other funds 3,700,810 3,801,527 100,717 Total other financing sources 3,700,810 4,076,575 375,765 Total revenues and other financing sources 548,128,561$ 556,490,993 8,362,432
149
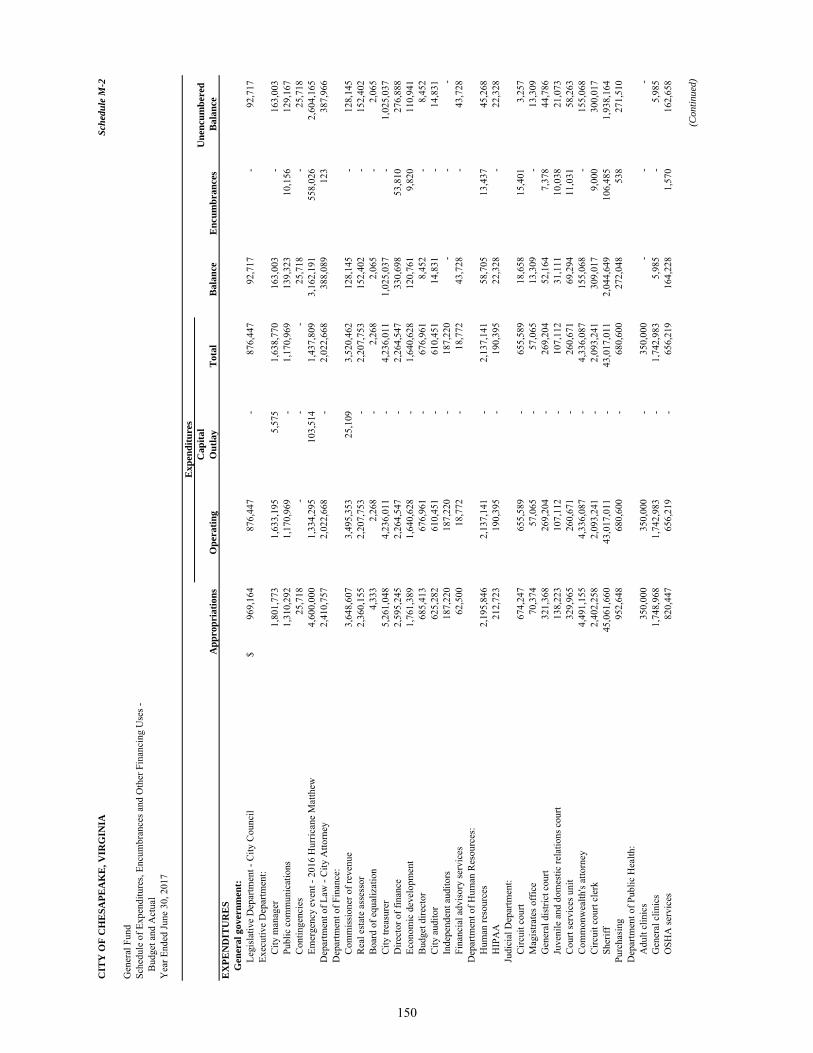
CIT
Y O
F C
HE
SAPE
AK
E, V
IRG
INIA
Sche
dule
M-2
Gen
eral
Fun
dSc
hedu
le o
f Exp
endi
ture
s, En
cum
bran
ces a
nd O
ther
Fin
anci
ng U
ses -
B
udge
t and
Act
ual
Yea
r End
ed Ju
ne 3
0, 2
017
Cap
ital
U
nenc
umbe
red
App
ropr
iatio
ns O
pera
ting
Out
lay
Tot
al
Bal
ance
E
ncum
bran
ces
Bal
ance
E
XPE
ND
ITU
RE
SG
ener
al g
over
nmen
t:Le
gisl
ativ
e D
epar
tmen
t - C
ity C
ounc
il96
9,16
4$
876,
447
-
876,
447
92
,717
-
92,7
17
Ex
ecut
ive
Dep
artm
ent:
City
man
ager
1,80
1,77
3
1,
633,
195
5,57
5
1,63
8,77
0
16
3,00
3
-
163,
003
Pu
blic
com
mun
icat
ions
1,31
0,29
2
1,
170,
969
-
1,
170,
969
139,
323
10,1
56
12
9,16
7
Con
tinge
ncie
s25
,718
-
-
-
25
,718
-
25,7
18
Em
erge
ncy
even
t - 2
016
Hur
rican
e M
atth
ew4,
600,
000
1,33
4,29
5
10
3,51
4
1,43
7,80
9
3,
162,
191
55
8,02
6
2,60
4,16
5
D
epar
tmen
t of L
aw -
City
Atto
rney
2,41
0,75
7
2,
022,
668
-
2,
022,
668
388,
089
123
387,
966
D
epar
tmen
t of F
inan
ce:
Com
mis
sion
er o
f rev
enue
3,64
8,60
7
3,
495,
353
25,1
09
3,
520,
462
128,
145
-
12
8,14
5
Rea
l est
ate
asse
ssor
2,36
0,15
5
2,
207,
753
-
2,
207,
753
152,
402
-
15
2,40
2
Boa
rd o
f equ
aliz
atio
n4,
333
2,
268
-
2,26
8
2,06
5
-
2,06
5
City
trea
sure
r5,
261,
048
4,23
6,01
1
-
4,23
6,01
1
1,
025,
037
-
1,02
5,03
7
D
irect
or o
f fin
ance
2,59
5,24
5
2,
264,
547
-
2,
264,
547
330,
698
53,8
10
27
6,88
8
Econ
omic
dev
elop
men
t1,
761,
389
1,64
0,62
8
-
1,64
0,62
8
12
0,76
1
9,
820
11
0,94
1
Bud
get d
irect
or68
5,41
3
676,
961
-
676,
961
8,
452
-
8,
452
C
ity a
udito
r62
5,28
2
610,
451
-
610,
451
14
,831
-
14,8
31
In
depe
nden
t aud
itors
187,
220
18
7,22
0
-
18
7,22
0
-
-
-
Fi
nanc
ial a
dvis
ory
serv
ices
62,5
00
18
,772
-
18
,772
43,7
28
-
43
,728
Dep
artm
ent o
f Hum
an R
esou
rces
:H
uman
reso
urce
s2,
195,
846
2,13
7,14
1
-
2,13
7,14
1
58
,705
13
,437
45,2
68
H
IPA
A21
2,72
3
190,
395
-
190,
395
22
,328
-
22,3
28
Ju
dici
al D
epar
tmen
t:C
ircui
t cou
rt67
4,24
7
655,
589
-
655,
589
18
,658
15
,401
3,25
7
Mag
istra
tes o
ffic
e70
,374
57,0
65
-
57,0
65
13
,309
-
13,3
09
G
ener
al d
istri
ct c
ourt
321,
368
26
9,20
4
-
26
9,20
4
52,1
64
7,37
8
44,7
86
Ju
veni
le a
nd d
omes
tic re
latio
ns c
ourt
138,
223
10
7,11
2
-
10
7,11
2
31,1
11
10,0
38
21
,073
Cou
rt se
rvic
es u
nit
329,
965
26
0,67
1
-
26
0,67
1
69,2
94
11,0
31
58
,263
Com
mon
wea
lth's
atto
rney
4,49
1,15
5
4,
336,
087
-
4,
336,
087
155,
068
-
15
5,06
8
Circ
uit c
ourt
cler
k2,
402,
258
2,09
3,24
1
-
2,09
3,24
1
30
9,01
7
9,
000
30
0,01
7
Sher
iff45
,061
,660
43,0
17,0
11
-
43,0
17,0
11
2,
044,
649
10
6,48
5
1,93
8,16
4
Pu
rcha
sing
952,
648
68
0,60
0
-
68
0,60
0
272,
048
538
271,
510
D
epar
tmen
t of P
ublic
Hea
lth:
Adu
lt cl
inic
s35
0,00
0
350,
000
-
350,
000
-
-
-
Gen
eral
clin
ics
1,74
8,96
8
1,
742,
983
-
1,
742,
983
5,98
5
-
5,98
5
OSH
A se
rvic
es82
0,44
7
656,
219
-
656,
219
16
4,22
8
1,
570
16
2,65
8
(Con
tinue
d)
Exp
endi
ture
s
150
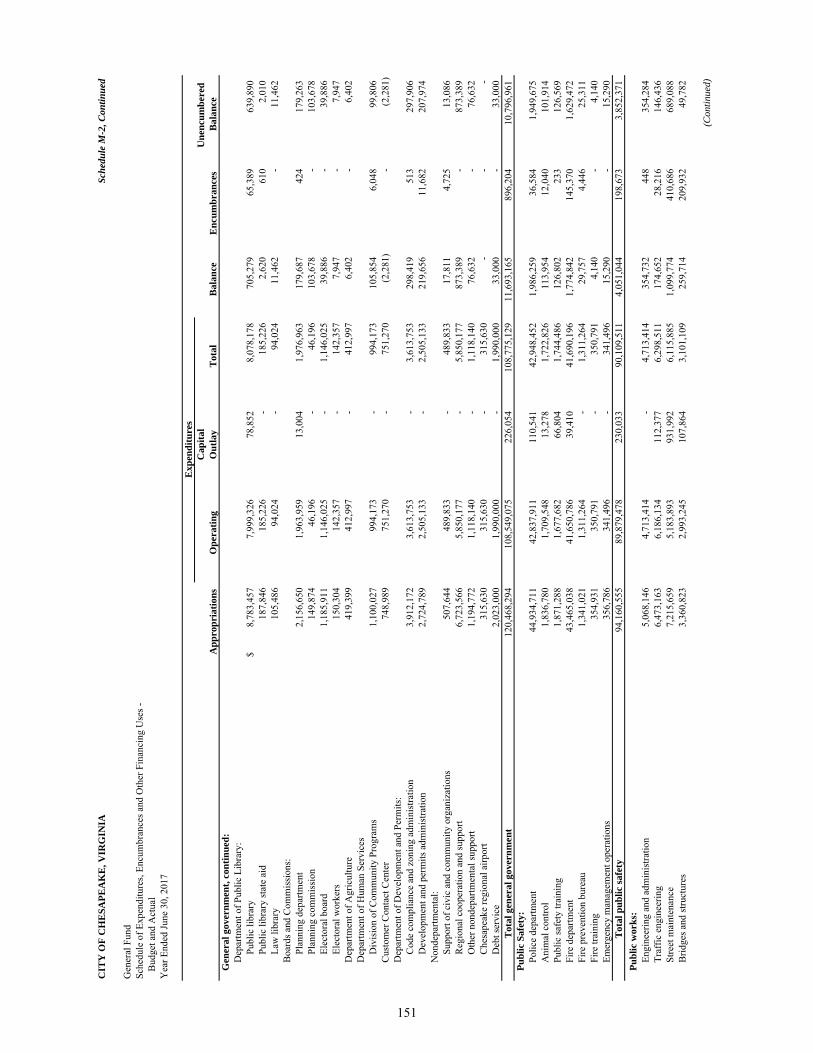
CIT
Y O
F C
HE
SAPE
AK
E, V
IRG
INIA
Sche
dule
M-2
, Con
tinue
d
Gen
eral
Fun
dSc
hedu
le o
f Exp
endi
ture
s, En
cum
bran
ces a
nd O
ther
Fin
anci
ng U
ses -
B
udge
t and
Act
ual
Yea
r End
ed Ju
ne 3
0, 2
017
Cap
ital
U
nenc
umbe
red
App
ropr
iatio
ns O
pera
ting
Out
lay
Tot
al
Bal
ance
E
ncum
bran
ces
Bal
ance
G
ener
al g
over
nmen
t, co
ntin
ued:
Dep
artm
ent o
f Pub
lic L
ibra
ry:
Publ
ic li
brar
y8,
783,
457
$
7,99
9,32
6
78
,852
8,07
8,17
8
70
5,27
9
65
,389
639,
890
Pu
blic
libr
ary
stat
e ai
d18
7,84
6
185,
226
-
185,
226
2,
620
610
2,01
0
Law
libr
ary
105,
486
94
,024
-
94
,024
11,4
62
-
11
,462
Boa
rds a
nd C
omm
issi
ons:
Plan
ning
dep
artm
ent
2,15
6,65
0
1,
963,
959
13,0
04
1,
976,
963
179,
687
424
179,
263
Pl
anni
ng c
omm
issi
on14
9,87
4
46,1
96
-
46,1
96
10
3,67
8
-
103,
678
El
ecto
ral b
oard
1,18
5,91
1
1,
146,
025
-
1,
146,
025
39,8
86
-
39
,886
Elec
tora
l wor
kers
150,
304
14
2,35
7
-
14
2,35
7
7,94
7
-
7,94
7
Dep
artm
ent o
f Agr
icul
ture
419,
399
41
2,99
7
-
41
2,99
7
6,40
2
-
6,40
2
Dep
artm
ent o
f Hum
an S
ervi
ces
Div
isio
n of
Com
mun
ity P
rogr
ams
1,10
0,02
7
99
4,17
3
-
99
4,17
3
105,
854
6,04
8
99,8
06
C
usto
mer
Con
tact
Cen
ter
748,
989
75
1,27
0
-
75
1,27
0
(2,2
81)
-
(2,2
81)
Dep
artm
ent o
f Dev
elop
men
t and
Per
mits
:C
ode
com
plia
nce
and
zoni
ng a
dmin
istra
tion
3,91
2,17
2
3,
613,
753
-
3,
613,
753
298,
419
513
297,
906
D
evel
opm
ent a
nd p
erm
its a
dmin
istra
tion
2,72
4,78
9
2,
505,
133
-
2,
505,
133
219,
656
11,6
82
20
7,97
4
Non
depa
rtmen
tal:
Supp
ort o
f civ
ic a
nd c
omm
unity
org
aniz
atio
ns50
7,64
4
489,
833
-
489,
833
17
,811
4,
725
13
,086
Reg
iona
l coo
pera
tion
and
supp
ort
6,72
3,56
6
5,
850,
177
-
5,
850,
177
873,
389
-
87
3,38
9
Oth
er n
onde
partm
enta
l sup
port
1,19
4,77
2
1,
118,
140
-
1,
118,
140
76,6
32
-
76
,632
Che
sape
ake
regi
onal
airp
ort
315,
630
31
5,63
0
-
31
5,63
0
-
-
-
D
ebt s
ervi
ce2,
023,
000
1,99
0,00
0
-
1,99
0,00
0
33
,000
-
33,0
00
T
otal
gen
eral
gov
ernm
ent
120,
468,
294
10
8,54
9,07
5
226,
054
10
8,77
5,12
9
11,6
93,1
65
896,
204
10
,796
,961
Publ
ic S
afet
y:Po
lice
depa
rtmen
t44
,934
,711
42,8
37,9
11
11
0,54
1
42,9
48,4
52
1,
986,
259
36
,584
1,94
9,67
5
A
nim
al c
ontro
l1,
836,
780
1,70
9,54
8
13
,278
1,72
2,82
6
11
3,95
4
12
,040
101,
914
Pu
blic
safe
ty tr
aini
ng1,
871,
288
1,67
7,68
2
66
,804
1,74
4,48
6
12
6,80
2
23
3
12
6,56
9
Fire
dep
artm
ent
43,4
65,0
38
41
,650
,786
39,4
10
41
,690
,196
1,77
4,84
2
145,
370
1,
629,
472
Fire
pre
vent
ion
bure
au1,
341,
021
1,31
1,26
4
-
1,31
1,26
4
29
,757
4,
446
25
,311
Fire
trai
ning
354,
931
35
0,79
1
-
35
0,79
1
4,14
0
-
4,14
0
Emer
genc
y m
anag
emen
t ope
ratio
ns35
6,78
6
341,
496
-
341,
496
15
,290
-
15,2
90
T
otal
pub
lic sa
fety
94,1
60,5
55
89
,879
,478
230,
033
90
,109
,511
4,05
1,04
4
198,
673
3,
852,
371
Publ
ic w
orks
:En
gine
erin
g an
d ad
min
istra
tion
5,06
8,14
6
4,
713,
414
-
4,
713,
414
354,
732
448
354,
284
Tr
affic
eng
inee
ring
6,47
3,16
3
6,
186,
134
112,
377
6,
298,
511
174,
652
28,2
16
14
6,43
6
Stre
et m
aint
enan
ce7,
215,
659
5,18
3,89
3
93
1,99
2
6,11
5,88
5
1,
099,
774
41
0,68
6
689,
088
B
ridge
s and
stru
ctur
es3,
360,
823
2,99
3,24
5
10
7,86
4
3,10
1,10
9
25
9,71
4
20
9,93
2
49,7
82
(Con
tinue
d)
Exp
endi
ture
s
151
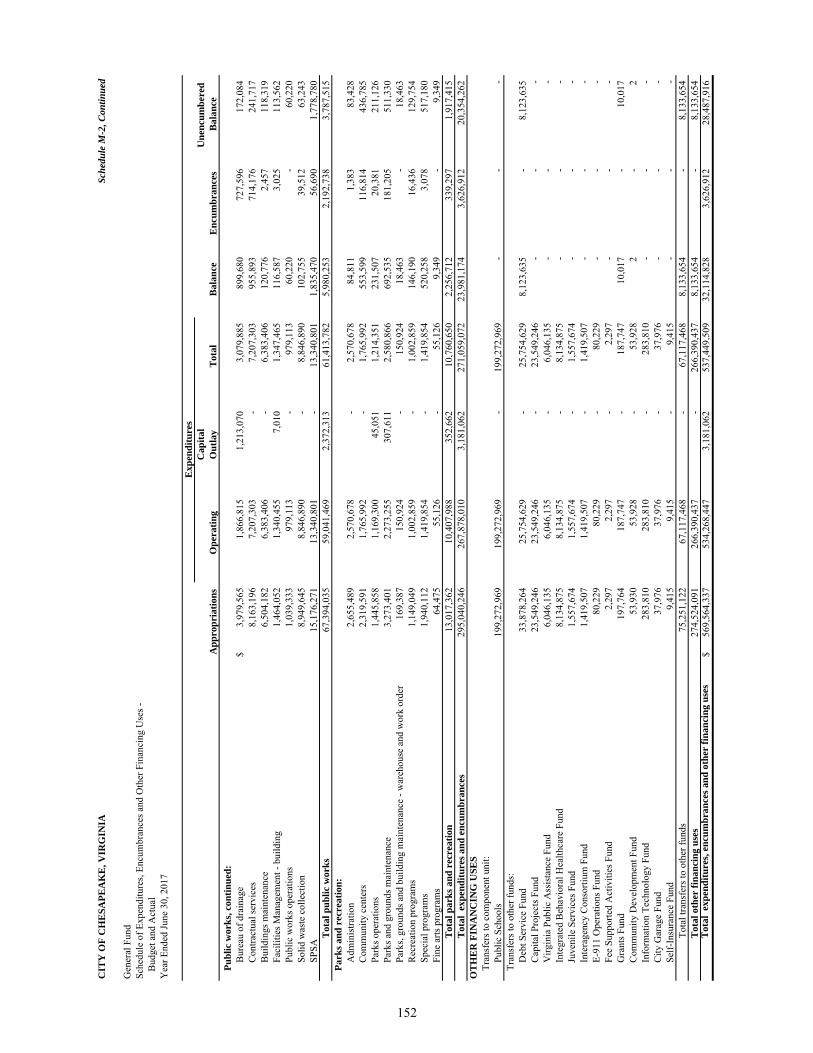
CIT
Y O
F C
HE
SAPE
AK
E, V
IRG
INIA
Sche
dule
M-2
, Con
tinue
d
Gen
eral
Fun
dSc
hedu
le o
f Exp
endi
ture
s, En
cum
bran
ces a
nd O
ther
Fin
anci
ng U
ses -
B
udge
t and
Act
ual
Yea
r End
ed Ju
ne 3
0, 2
017
Cap
ital
U
nenc
umbe
red
App
ropr
iatio
ns O
pera
ting
Out
lay
Tot
al
Bal
ance
E
ncum
bran
ces
Bal
ance
Pu
blic
wor
ks, c
ontin
ued:
Bur
eau
of d
rain
age
3,97
9,56
5$
1,
866,
815
1,21
3,07
0
3,
079,
885
899,
680
727,
596
17
2,08
4
Con
tract
ual s
ervi
ces
8,16
3,19
6
7,
207,
303
-
7,
207,
303
955,
893
714,
176
24
1,71
7
Bui
ldin
gs m
aint
enan
ce6,
504,
182
6,38
3,40
6
-
6,38
3,40
6
12
0,77
6
2,
457
11
8,31
9
Faci
litie
s Man
agem
ent -
bui
ldin
g1,
464,
052
1,34
0,45
5
7,
010
1,
347,
465
116,
587
3,02
5
113,
562
Pu
blic
wor
ks o
pera
tions
1,03
9,33
3
97
9,11
3
-
97
9,11
3
60,2
20
-
60
,220
Solid
was
te c
olle
ctio
n8,
949,
645
8,84
6,89
0
-
8,84
6,89
0
10
2,75
5
39
,512
63,2
43
SP
SA15
,176
,271
13,3
40,8
01
-
13,3
40,8
01
1,
835,
470
56
,690
1,77
8,78
0
T
otal
pub
lic w
orks
67,3
94,0
35
59
,041
,469
2,37
2,31
3
61
,413
,782
5,98
0,25
3
2,19
2,73
8
3,
787,
515
Park
s and
rec
reat
ion:
Adm
inis
tratio
n2,
655,
489
2,57
0,67
8
-
2,57
0,67
8
84
,811
1,
383
83
,428
Com
mun
ity c
ente
rs2,
319,
591
1,76
5,99
2
-
1,76
5,99
2
55
3,59
9
11
6,81
4
436,
785
Pa
rks o
pera
tions
1,44
5,85
8
1,
169,
300
45,0
51
1,
214,
351
231,
507
20,3
81
21
1,12
6
Park
s and
gro
unds
mai
nten
ance
3,27
3,40
1
2,
273,
255
307,
611
2,
580,
866
692,
535
181,
205
51
1,33
0
Park
s, gr
ound
s and
bui
ldin
g m
aint
enan
ce -
war
ehou
se a
nd w
ork
orde
r16
9,38
7
150,
924
-
150,
924
18
,463
-
18,4
63
R
ecre
atio
n pr
ogra
ms
1,14
9,04
9
1,
002,
859
-
1,
002,
859
146,
190
16,4
36
12
9,75
4
Spec
ial p
rogr
ams
1,94
0,11
2
1,
419,
854
-
1,
419,
854
520,
258
3,07
8
517,
180
Fi
ne a
rts p
rogr
ams
64,4
75
55
,126
-
55
,126
9,34
9
-
9,34
9
Tot
al p
arks
and
rec
reat
ion
13,0
17,3
62
10
,407
,988
352,
662
10
,760
,650
2,25
6,71
2
339,
297
1,
917,
415
Tot
al e
xpen
ditu
res a
nd e
ncum
bran
ces
295,
040,
246
26
7,87
8,01
0
3,18
1,06
2
27
1,05
9,07
2
23,9
81,1
74
3,62
6,91
2
20
,354
,262
OT
HE
R F
INA
NC
ING
USE
STr
ansf
ers t
o co
mpo
nent
uni
t:Pu
blic
Sch
ools
199,
272,
969
19
9,27
2,96
9
-
19
9,27
2,96
9
-
-
-
Tr
ansf
ers t
o ot
her f
unds
:D
ebt S
ervi
ce F
und
33,8
78,2
64
25
,754
,629
-
25
,754
,629
8,12
3,63
5
-
8,
123,
635
Cap
ital P
roje
cts F
und
23,5
49,2
46
23
,549
,246
-
23
,549
,246
-
-
-
V
irgin
ia P
ublic
Ass
ista
nce
Fund
6,04
6,13
5
6,
046,
135
-
6,
046,
135
-
-
-
In
tegr
ated
Beh
avio
ral H
ealth
care
Fun
d8,
134,
875
8,13
4,87
5
-
8,13
4,87
5
-
-
-
Juve
nile
Ser
vice
s Fun
d1,
557,
674
1,55
7,67
4
-
1,55
7,67
4
-
-
-
Inte
rage
ncy
Con
sorti
um F
und
1,41
9,50
7
1,
419,
507
-
1,
419,
507
-
-
-
E-
911
Ope
ratio
ns F
und
80,2
29
80
,229
-
80
,229
-
-
-
Fe
e Su
ppor
ted
Act
iviti
es F
und
2,29
7
2,29
7
-
2,
297
-
-
-
Gra
nts F
und
197,
764
18
7,74
7
-
18
7,74
7
10,0
17
-
10
,017
Com
mun
ity D
evel
opm
ent F
und
53,9
30
53
,928
-
53
,928
2
-
2
Info
rmat
ion
Tech
nolo
gy F
und
283,
810
28
3,81
0
-
28
3,81
0
-
-
-
C
ity G
arag
e Fu
nd37
,976
37,9
76
-
37,9
76
-
-
-
Self-
Insu
ranc
e Fu
nd9,
415
9,
415
-
9,41
5
-
-
-
To
tal t
rans
fers
to o
ther
fund
s75
,251
,122
67,1
17,4
68
-
67,1
17,4
68
8,
133,
654
-
8,13
3,65
4
T
otal
oth
er fi
nanc
ing
uses
274,
524,
091
26
6,39
0,43
7
-
26
6,39
0,43
7
8,13
3,65
4
-
8,
133,
654
Tot
al e
xpen
ditu
res,
encu
mbr
ance
s and
oth
er fi
nanc
ing
uses
569,
564,
337
$
53
4,26
8,44
7
3,
181,
062
537,
449,
509
32,1
14,8
283,
626,
912
28,4
87,9
16
Exp
endi
ture
s
152
Debt Service Fund
Debt Service Fund – To account for the accumulation of resources for the payment of principal, interest and related costs on long-term financial obligations of governmental funds.

This page intentionally left blank
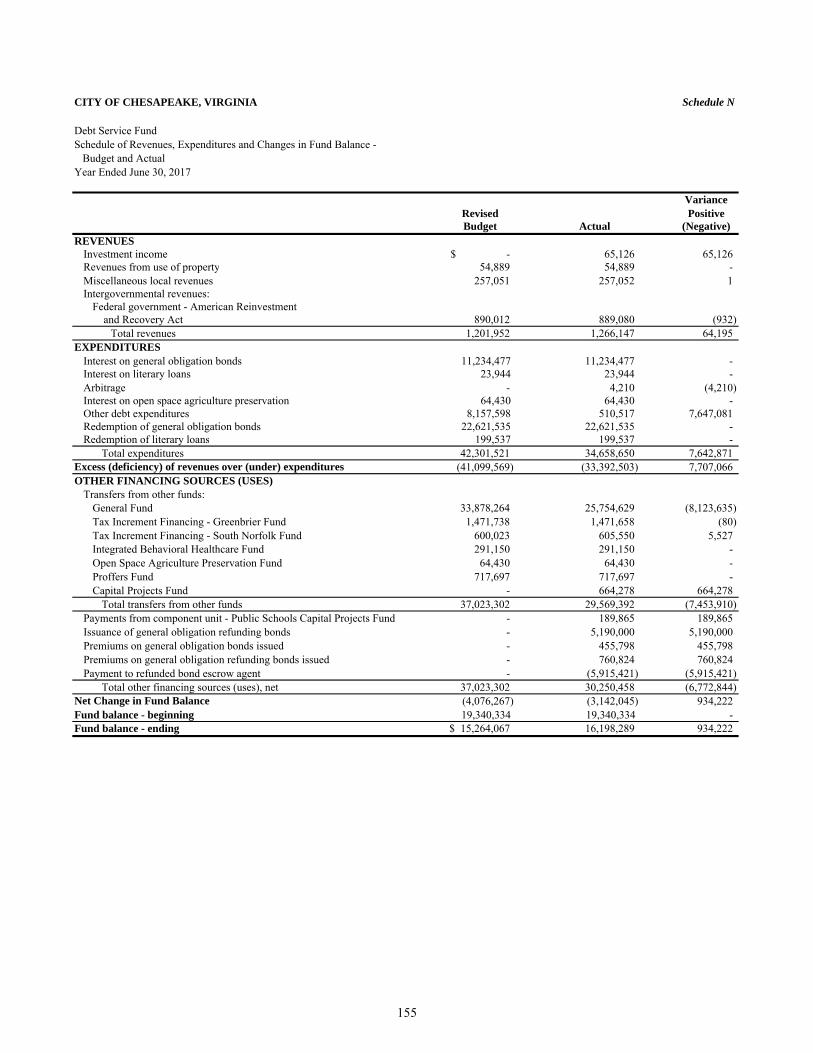
CITY OF CHESAPEAKE, VIRGINIA Schedule N
Debt Service FundSchedule of Revenues, Expenditures and Changes in Fund Balance - Budget and ActualYear Ended June 30, 2017
VarianceRevised PositiveBudget Actual (Negative)
REVENUESInvestment income -$ 65,126 65,126 Revenues from use of property 54,889 54,889 - Miscellaneous local revenues 257,051 257,052 1 Intergovernmental revenues:
Federal government - American Reinvestment and Recovery Act 890,012 889,080 (932)
Total revenues 1,201,952 1,266,147 64,195 EXPENDITURES
Interest on general obligation bonds 11,234,477 11,234,477 - Interest on literary loans 23,944 23,944 - Arbitrage - 4,210 (4,210) Interest on open space agriculture preservation 64,430 64,430 - Other debt expenditures 8,157,598 510,517 7,647,081 Redemption of general obligation bonds 22,621,535 22,621,535 - Redemption of literary loans 199,537 199,537 -
Total expenditures 42,301,521 34,658,650 7,642,871 Excess (deficiency) of revenues over (under) expenditures (41,099,569) (33,392,503) 7,707,066 OTHER FINANCING SOURCES (USES)
Transfers from other funds:General Fund 33,878,264 25,754,629 (8,123,635) Tax Increment Financing - Greenbrier Fund 1,471,738 1,471,658 (80) Tax Increment Financing - South Norfolk Fund 600,023 605,550 5,527 Integrated Behavioral Healthcare Fund 291,150 291,150 - Open Space Agriculture Preservation Fund 64,430 64,430 - Proffers Fund 717,697 717,697 - Capital Projects Fund - 664,278 664,278
Total transfers from other funds 37,023,302 29,569,392 (7,453,910) Payments from component unit - Public Schools Capital Projects Fund - 189,865 189,865 Issuance of general obligation refunding bonds - 5,190,000 5,190,000 Premiums on general obligation bonds issued - 455,798 455,798 Premiums on general obligation refunding bonds issued - 760,824 760,824 Payment to refunded bond escrow agent - (5,915,421) (5,915,421)
Total other financing sources (uses), net 37,023,302 30,250,458 (6,772,844) Net Change in Fund Balance (4,076,267) (3,142,045) 934,222 Fund balance - beginning 19,340,334 19,340,334 - Fund balance - ending 15,264,067$ 16,198,289 934,222
155

This page intentionally left blank
Capital Projects Funds General Capital Projects Fund – To account for financial resources to be used for the acquisition or construction of most major capital facilities other than those financed by proprietary funds. Public Utilities Capital Projects Fund – To account for financial resources to be used for the acquisition or construction of most major capital facilities or infrastructure for Public Utilities. Chesapeake Transportation System Capital Projects Fund – To account for financial resources to be used for the acquisition or construction of most major capital facilities or infrastructure for the Chesapeake Transportation System. Stormwater Management Capital Projects Fund – To account for financial resources to be used for the acquisition or construction of most major capital facilities or infrastructure for Stormwater Management.

This page intentionally left blank
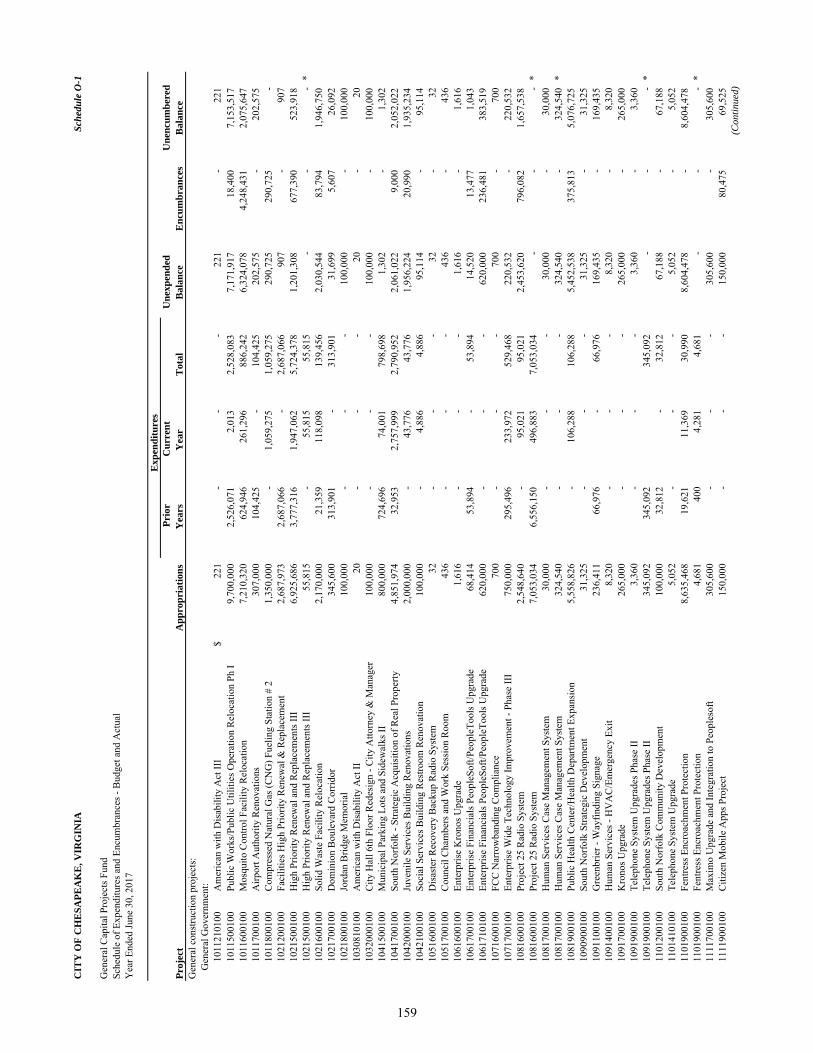
CIT
Y O
F C
HE
SAPE
AK
E, V
IRG
INIA
Sche
dule
O-1
Gen
eral
Cap
ital P
roje
cts F
und
Sche
dule
of E
xpen
ditu
res a
nd E
ncum
bran
ces -
Bud
get a
nd A
ctua
lY
ear E
nded
June
30,
201
7
Proj
ect
App
ropr
iatio
ns
Prio
rY
ears
C
urre
ntY
ear
Tot
alU
nexp
ende
d B
alan
ceE
ncum
bran
ces
Une
ncum
bere
d B
alan
ceG
ener
al c
onst
ruct
ion
proj
ects
:G
ener
al G
over
nmen
t:10
1121
0100
Am
eric
an w
ith D
isab
ility
Act
III
$22
1
-
-
-
221
-
22
1
10
1150
0100
Publ
ic W
orks
/Pub
lic U
tiliti
es O
pera
tion
Rel
ocat
ion
Ph I
9,70
0,00
0
2,52
6,07
1
2,01
3
2,52
8,08
3
7,17
1,91
7
18,4
00
7,15
3,51
7
1011
6001
00M
osqu
ito C
ontro
l Fac
ility
Rel
ocat
ion
7,21
0,32
0
624,
946
261,
296
886,
242
6,32
4,07
8
4,24
8,43
1
2,07
5,64
7
1011
7001
00A
irpor
t Aut
horit
y R
enov
atio
ns30
7,00
0
10
4,42
5
-
104,
425
202,
575
-
20
2,57
5
10
1180
0100
Com
pres
sed
Nat
ural
Gas
(CN
G) F
uelin
g St
atio
n #
21,
350,
000
-
1,05
9,27
5
1,05
9,27
5
290,
725
290,
725
-
10
2120
0100
Faci
litie
s Hig
h Pr
iorit
y R
enew
al &
Rep
lace
men
t2,
687,
973
2,
687,
066
-
2,68
7,06
6
907
-
90
7
10
2150
0100
Hig
h Pr
iorit
y R
enew
al a
nd R
epla
cem
ents
III
6,92
5,68
6
3,77
7,31
6
1,94
7,06
2
5,72
4,37
8
1,20
1,30
8
677,
390
523,
918
1021
5001
00H
igh
Prio
rity
Ren
ewal
and
Rep
lace
men
ts II
I55
,815
-
55
,815
55
,815
-
-
-
*10
2160
0100
Solid
Was
te F
acili
ty R
eloc
atio
n2,
170,
000
21
,359
11
8,09
8
13
9,45
6
2,
030,
544
83
,794
1,
946,
750
10
2170
0100
Dom
inio
n B
oule
vard
Cor
ridor
345,
600
313,
901
-
31
3,90
1
31
,699
5,
607
26
,092
10
2180
0100
Jord
an B
ridge
Mem
oria
l10
0,00
0
-
-
-
100,
000
-
10
0,00
0
10
3081
0100
Am
eric
an w
ith D
isab
ility
Act
II
20
-
-
-
20
-
20
1032
0001
00C
ity H
all 6
th F
loor
Red
esig
n - C
ity A
ttorn
ey &
Man
ager
100,
000
-
-
-
10
0,00
0
-
100,
000
1041
5001
00M
unic
ipal
Par
king
Lot
s and
Sid
ewal
ks II
800,
000
724,
696
74,0
01
798,
698
1,30
2
-
1,
302
10
4170
0100
Sout
h N
orfo
lk -
Stra
tegi
c A
cqui
sitio
n of
Rea
l Pro
perty
4,85
1,97
4
32,9
53
2,75
7,99
9
2,79
0,95
2
2,06
1,02
2
9,00
0
2,05
2,02
2
1042
0001
00Ju
veni
le S
ervi
ces B
uild
ing
Ren
ovat
ions
2,00
0,00
0
-
43
,776
43
,776
1,
956,
224
20
,990
1,
935,
234
10
4210
0100
Soci
al S
ervi
ces B
uild
ing
Res
troom
Ren
ovat
ion
100,
000
-
4,
886
4,
886
95
,114
-
95,1
14
1051
6001
00D
isas
ter R
ecov
ery
Bac
kup
Rad
io S
yste
m32
-
-
-
32
-
32
10
5170
0100
Cou
ncil
Cha
mbe
rs a
nd W
ork
Sess
ion
Roo
m43
6
-
-
-
436
-
43
6
10
6160
0100
Ente
rpris
e K
rono
s Upg
rade
1,61
6
-
-
-
1,
616
-
1,61
6
1061
7001
00En
terp
rise
Fina
ncia
ls P
eopl
eSof
t/Peo
pleT
ools
Upg
rade
68,4
14
53
,894
-
53,8
94
14,5
20
13,4
77
1,04
3
1061
7101
00En
terp
rise
Fina
ncia
ls P
eopl
eSof
t/Peo
pleT
ools
Upg
rade
620,
000
-
-
-
62
0,00
0
23
6,48
1
38
3,51
9
10
7160
0100
FCC
Nar
row
band
ing
Com
plia
nce
700
-
-
-
70
0
-
700
1071
7001
00En
terp
rise
Wid
e Te
chno
logy
Impr
ovem
ent -
Pha
se II
I75
0,00
0
29
5,49
6
23
3,97
2
52
9,46
8
22
0,53
2
-
220,
532
1081
6001
00Pr
ojec
t 25
Rad
io S
yste
m2,
548,
640
-
95,0
21
95,0
21
2,45
3,62
0
796,
082
1,65
7,53
8
1081
6001
00Pr
ojec
t 25
Rad
io S
yste
m7,
053,
034
6,
556,
150
49
6,88
3
7,
053,
034
-
-
-
*10
8170
0100
Hum
an S
ervi
ces C
ase
Man
agem
ent S
yste
m30
,000
-
-
-
30
,000
-
30,0
00
1081
7001
00H
uman
Ser
vice
s Cas
e M
anag
emen
t Sys
tem
324,
540
-
-
-
32
4,54
0
-
324,
540
*10
8190
0100
Publ
ic H
ealth
Cen
ter/H
ealth
Dep
artm
ent E
xpan
sion
5,55
8,82
6
-
10
6,28
8
10
6,28
8
5,
452,
538
37
5,81
3
5,
076,
725
10
9090
0100
Sout
h N
orfo
lk S
trate
gic
Dev
elop
men
t31
,325
-
-
-
31
,325
-
31,3
25
1091
1001
00G
reen
brie
r - W
ayfin
ding
Sig
nage
236,
411
66,9
76
-
66
,976
16
9,43
5
-
169,
435
1091
4001
00H
uman
Ser
vice
s - H
VA
C/E
mer
genc
y Ex
it8,
320
-
-
-
8,32
0
-
8,
320
10
9170
0100
Kro
nos U
pgra
de26
5,00
0
-
-
-
265,
000
-
26
5,00
0
10
9190
0100
Tele
phon
e Sy
stem
Upg
rade
s Pha
se II
3,36
0
-
-
-
3,
360
-
3,36
0
1091
9001
00Te
leph
one
Syst
em U
pgra
des P
hase
II34
5,09
2
34
5,09
2
34
5,09
2
-
-
-
*11
0120
0100
Sout
h N
orfo
lk C
omm
unity
Dev
elop
men
t10
0,00
0
32
,812
-
32,8
12
67,1
88
-
67
,188
11
0141
0100
Tele
phon
e Sy
stem
Upg
rade
5,05
2
-
-
-
5,
052
-
5,05
2
1101
9001
00Fe
ntre
ss E
ncro
achm
ent P
rote
ctio
n8,
635,
468
19
,621
11
,369
30
,990
8,
604,
478
-
8,60
4,47
8
1101
9001
00Fe
ntre
ss E
ncro
achm
ent P
rote
ctio
n4,
681
40
0
4,
281
4,
681
-
-
-
*11
1170
0100
Max
imo
Upg
rade
and
Inte
grat
ion
to P
eopl
esof
t30
5,60
0
-
-
-
305,
600
-
30
5,60
0
11
1190
0100
Citi
zen
Mob
ile A
pps P
roje
ct15
0,00
0
-
-
-
150,
000
80,4
75
69,5
25
(Con
tinue
d)
Exp
endi
ture
s
159
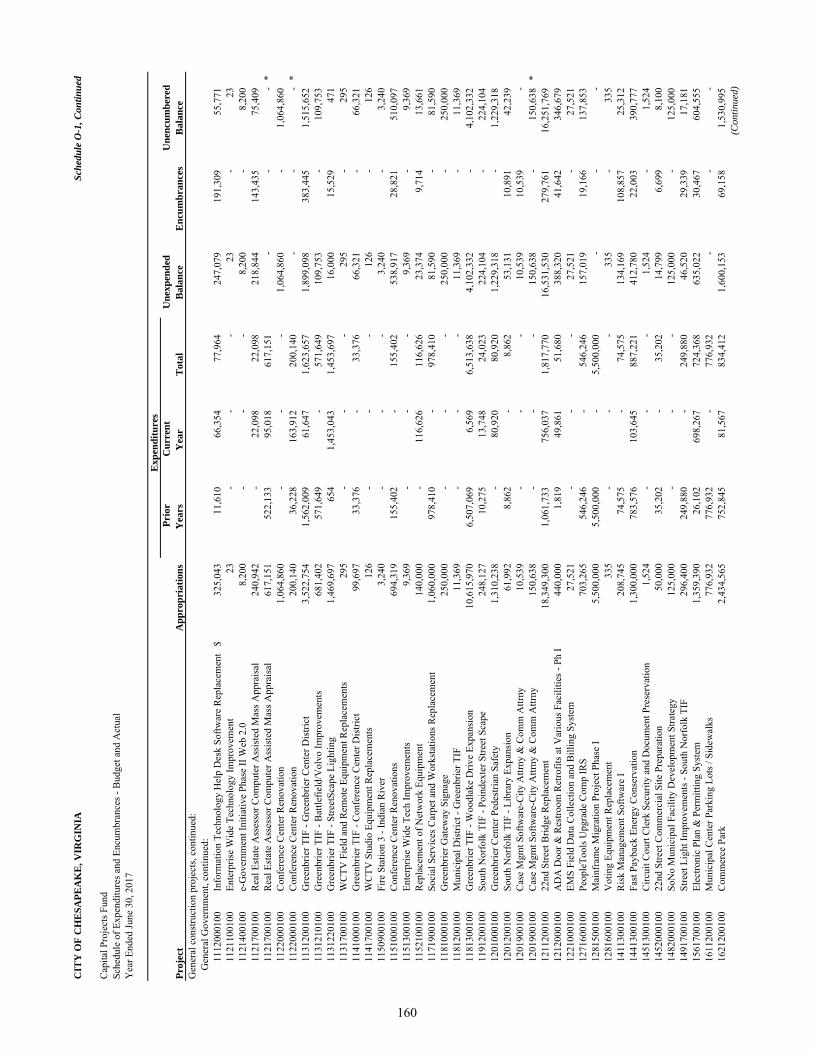
CIT
Y O
F C
HE
SAPE
AK
E, V
IRG
INIA
Sche
dule
O-1
, Con
tinue
d
Cap
ital P
roje
cts F
und
Sche
dule
of E
xpen
ditu
res a
nd E
ncum
bran
ces -
Bud
get a
nd A
ctua
lY
ear E
nded
June
30,
201
7
Proj
ect
App
ropr
iatio
ns
Prio
rY
ears
C
urre
ntY
ear
Tot
alU
nexp
ende
d B
alan
ceE
ncum
bran
ces
Une
ncum
bere
d B
alan
ceG
ener
al c
onst
ruct
ion
proj
ects
, con
tinue
d:G
ener
al G
over
nmen
t, co
ntin
ued:
1112
0001
00In
form
atio
n Te
chno
logy
Hel
p D
esk
Softw
are
Rep
lace
men
t$
325,
043
11,6
10
66,3
54
77,9
64
247,
079
191,
309
55,7
71
1121
1001
00En
terp
rise
Wid
e Te
chno
logy
Impr
ovem
ent
23
-
-
-
23
-
23
1121
4001
00e-
Gov
ernm
ent I
nitia
tive
Phas
e II
Web
2.0
8,20
0
-
-
-
8,
200
-
8,20
0
1121
7001
00R
eal E
stat
e A
sses
sor C
ompu
ter A
ssis
ted
Mas
s App
rais
al24
0,94
2
-
22,0
98
22,0
98
218,
844
143,
435
75,4
09
1121
7001
00R
eal E
stat
e A
sses
sor C
ompu
ter A
ssis
ted
Mas
s App
rais
al61
7,15
1
52
2,13
3
95
,018
61
7,15
1
-
-
-
*11
2200
0100
Con
fere
nce
Cen
ter R
enov
atio
n1,
064,
860
-
-
-
1,06
4,86
0
-
1,
064,
860
11
2200
0100
Con
fere
nce
Cen
ter R
enov
atio
n20
0,14
0
36
,228
16
3,91
2
20
0,14
0
-
-
-
*11
3120
0100
Gre
enbr
ier T
IF -
Gre
enbr
ier C
ente
r Dis
trict
3,52
2,75
4
1,56
2,00
9
61,6
47
1,62
3,65
7
1,89
9,09
8
383,
445
1,51
5,65
2
1131
2101
00G
reen
brie
r TIF
- B
attle
field
/Vol
vo Im
prov
emen
ts68
1,40
2
57
1,64
9
-
571,
649
109,
753
-
10
9,75
3
11
3122
0100
Gre
enbr
ier T
IF -
Stre
etSc
ape
Ligh
ting
1,46
9,69
7
654
1,45
3,04
3
1,45
3,69
7
16,0
00
15,5
29
471
1131
7001
00W
CTV
Fie
ld a
nd R
emot
e Eq
uipm
ent R
epla
cem
ents
295
-
-
-
29
5
-
295
1141
0001
00G
reen
brie
r TIF
- C
onfe
renc
e C
ente
r Dis
trict
99,6
97
33
,376
-
33,3
76
66,3
21
-
66
,321
11
4170
0100
WC
TV S
tudi
o Eq
uipm
ent R
epla
cem
ents
126
-
-
-
12
6
-
126
1150
9001
00Fi
re S
tatio
n 3
- Ind
ian
Riv
er3,
240
-
-
-
3,24
0
-
3,
240
11
5100
0100
Con
fere
nce
Cen
ter R
enov
atio
ns69
4,31
9
15
5,40
2
-
155,
402
538,
917
28,8
21
510,
097
1151
3001
00En
terp
rise
Wid
e Te
ch Im
prov
emen
ts9,
369
-
-
-
9,36
9
-
9,
369
11
5210
0100
Rep
lace
men
t of N
etw
ork
Equi
pmen
t14
0,00
0
-
116,
626
116,
626
23,3
74
9,71
4
13,6
61
1171
9001
00So
cial
Ser
vice
s Car
pet a
nd W
orks
tatio
ns R
epla
cem
ent
1,06
0,00
0
978,
410
-
97
8,41
0
81
,590
-
81,5
90
1181
0001
00G
reen
brie
r Gat
eway
Sig
nage
250,
000
-
-
-
25
0,00
0
-
250,
000
1181
2001
00M
unic
ipal
Dis
trict
- G
reen
brie
r TIF
11,3
69
-
-
-
11,3
69
-
11
,369
11
8130
0100
Gre
enbr
ier T
IF -
Woo
dlak
e D
rive
Expa
nsio
n10
,615
,970
6,50
7,06
9
6,56
9
6,51
3,63
8
4,10
2,33
2
-
4,
102,
332
11
9120
0100
Sout
h N
orfo
lk T
IF -
Poin
dext
er S
treet
Sca
pe24
8,12
7
10
,275
13
,748
24
,023
22
4,10
4
-
224,
104
1201
0001
00G
reen
brie
r Cen
ter P
edes
trian
Saf
ety
1,31
0,23
8
-
80
,920
80
,920
1,
229,
318
-
1,22
9,31
8
1201
2001
00So
uth
Nor
folk
TIF
- Li
brar
y Ex
pans
ion
61,9
92
8,
862
-
8,86
2
53,1
31
10,8
91
42,2
39
1201
9001
00C
ase
Mgm
t Sof
twar
e-C
ity A
ttrny
& C
omm
Attr
ny10
,539
-
-
-
10
,539
10
,539
-
1201
9001
00C
ase
Mgm
t Sof
twar
e-C
ity A
ttrny
& C
omm
Attr
ny15
0,63
8
-
-
-
150,
638
-
15
0,63
8
*
1211
2001
0022
nd S
treet
Brid
ge R
epla
cem
ent
18,3
49,3
00
1,
061,
733
75
6,03
7
1,
817,
770
16
,531
,530
279,
761
16,2
51,7
69
12
1200
0100
AD
A D
oor &
Res
troom
Ret
rofit
s at V
ario
us F
acili
ties -
Ph
I44
0,00
0
1,
819
49
,861
51
,680
38
8,32
0
41
,642
34
6,67
9
12
2100
0100
EMS
Fiel
d D
ata
Col
lect
ion
and
Bill
ing
Syst
em27
,521
-
-
-
27
,521
-
27,5
21
1271
6001
00Pe
ople
Tool
s Upg
rade
Com
p IR
S70
3,26
5
54
6,24
6
-
546,
246
157,
019
19,1
66
137,
853
1281
5001
00M
ainf
ram
e M
igra
tion
Proj
ect P
hase
I5,
500,
000
5,
500,
000
-
5,50
0,00
0
-
-
-
12
8160
0100
Vot
ing
Equi
pmen
t Rep
lace
men
t33
5
-
-
-
335
-
33
5
14
1130
0100
Ris
k M
anag
emen
t Sof
twar
e I
208,
745
74,5
75
-
74
,575
13
4,16
9
10
8,85
7
25
,312
14
4130
0100
Fast
Pay
back
Ene
rgy
Con
serv
atio
n1,
300,
000
78
3,57
6
10
3,64
5
88
7,22
1
41
2,78
0
22
,003
39
0,77
7
14
5130
0100
Circ
uit C
ourt
Cle
rk S
ecur
ity a
nd D
ocum
ent P
rese
rvat
ion
1,52
4
-
-
-
1,
524
-
1,52
4
1452
0001
0022
nd S
treet
Com
mer
cial
Site
Pre
para
tion
50,0
00
35
,202
-
35,2
02
14,7
99
6,69
9
8,10
0
1482
0001
00So
No
Mun
icip
al F
acili
ty D
evel
opm
ent S
trate
gy12
5,00
0
-
-
-
125,
000
-
12
5,00
0
14
9170
0100
Stre
et L
ight
Impr
ovem
ents
- So
uth
Nor
folk
TIF
296,
400
249,
880
-
24
9,88
0
46
,520
29
,339
17
,181
15
6170
0100
Elec
troni
c Pl
an &
Per
mitt
ing
Syst
em1,
359,
390
26
,102
69
8,26
7
72
4,36
8
63
5,02
2
30
,467
60
4,55
5
16
1120
0100
Mun
icip
al C
ente
r Par
king
Lot
s / S
idew
alks
776,
932
776,
932
-
77
6,93
2
-
-
-
1621
2001
00C
omm
erce
Par
k2,
434,
565
75
2,84
5
81
,567
83
4,41
2
1,
600,
153
69
,158
1,
530,
995
(Con
tinue
d)
Exp
endi
ture
s
160
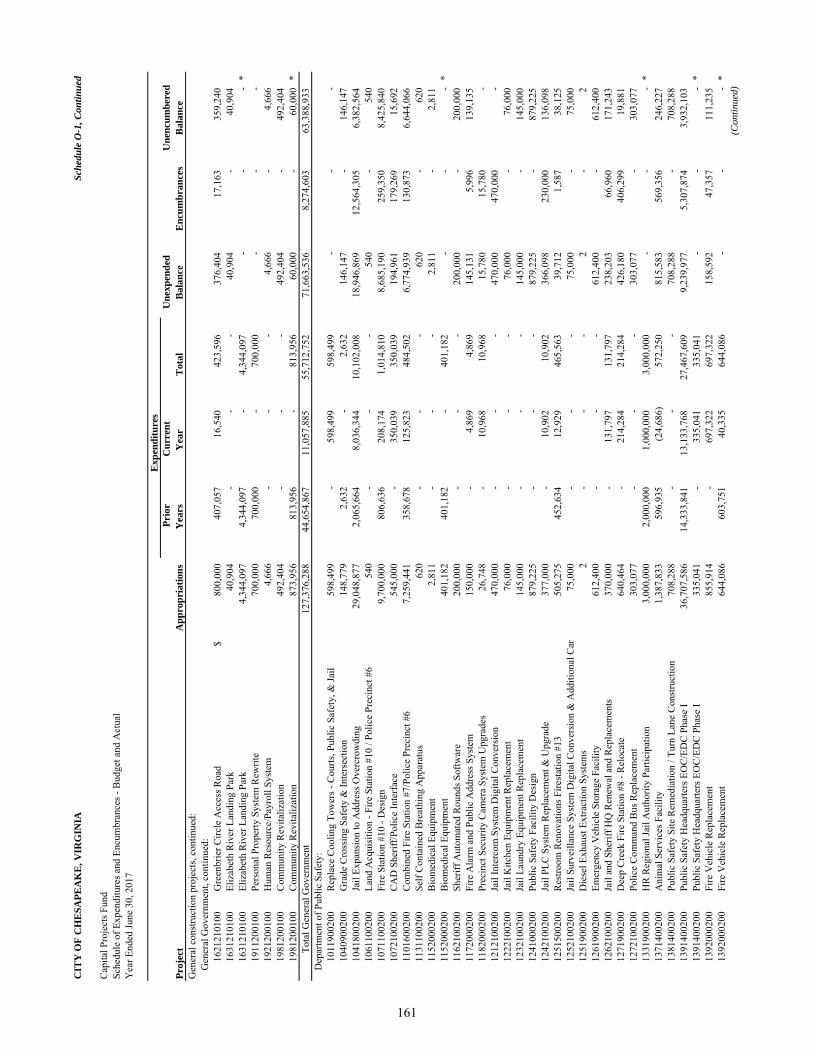
CIT
Y O
F C
HE
SAPE
AK
E, V
IRG
INIA
Sche
dule
O-1
, Con
tinue
d
Cap
ital P
roje
cts F
und
Sche
dule
of E
xpen
ditu
res a
nd E
ncum
bran
ces -
Bud
get a
nd A
ctua
lY
ear E
nded
June
30,
201
7
Proj
ect
App
ropr
iatio
ns
Prio
rY
ears
C
urre
ntY
ear
Tot
alU
nexp
ende
d B
alan
ceE
ncum
bran
ces
Une
ncum
bere
d B
alan
ceG
ener
al c
onst
ruct
ion
proj
ects
, con
tinue
d:G
ener
al G
over
nmen
t, co
ntin
ued:
1621
2101
00G
reen
brie
r Circ
le A
cces
s Roa
d$
800,
000
407,
057
16,5
40
423,
596
376,
404
17,1
63
359,
240
1631
2101
00El
izab
eth
Riv
er L
andi
ng P
ark
40,9
04
-
-
-
40,9
04
-
40
,904
16
3121
0100
Eliz
abet
h R
iver
Lan
ding
Par
k4,
344,
097
4,
344,
097
-
4,34
4,09
7
-
-
-
*
1911
2001
00Pe
rson
al P
rope
rty S
yste
m R
ewrit
e70
0,00
0
70
0,00
0
-
700,
000
-
-
-
19
2120
0100
Hum
an R
esou
rce/
Payr
oll S
yste
m4,
666
-
-
-
4,66
6
-
4,
666
19
8120
0100
Com
mun
ity R
evita
lizat
ion
492,
404
-
-
-
49
2,40
4
-
492,
404
1981
2001
00C
omm
unity
Rev
italiz
atio
n87
3,95
6
81
3,95
6
-
813,
956
60,0
00
-
60
,000
*
Tota
l Gen
eral
Gov
ernm
ent
127,
376,
288
44
,654
,867
11,0
57,8
85
55
,712
,752
71,6
63,5
36
8,
274,
603
63
,388
,933
Dep
artm
ent o
f Pub
lic S
afet
y:10
1190
0200
Rep
lace
Coo
ling
Tow
ers -
Cou
rts, P
ublic
Saf
ety,
& Ja
il59
8,49
9
-
598,
499
598,
499
-
-
-
10
4090
0200
Gra
de C
ross
ing
Safe
ty &
Inte
rsec
tion
148,
779
2,63
2
-
2,
632
14
6,14
7
-
146,
147
1041
8002
00Ja
il Ex
pans
ion
to A
ddre
ss O
verc
row
ding
29,0
48,8
77
2,
065,
664
8,
036,
344
10
,102
,008
18,9
46,8
69
12
,564
,305
6,38
2,56
4
1061
1002
00La
nd A
cqui
sitio
n - F
ire S
tatio
n #1
0 / P
olic
e Pr
ecin
ct #
654
0
-
-
-
540
-
54
0
10
7110
0200
Fire
Sta
tion
#10
- Des
ign
9,70
0,00
0
806,
636
208,
174
1,01
4,81
0
8,68
5,19
0
259,
350
8,42
5,84
0
1072
1002
00C
AD
She
riff/P
olic
e In
terf
ace
545,
000
-
35
0,03
9
35
0,03
9
19
4,96
1
17
9,26
9
15
,692
11
0160
0200
Com
bine
d Fi
re S
tatio
n #7
/Pol
ice
Prec
inct
#6
7,25
9,44
1
358,
678
125,
823
484,
502
6,77
4,93
9
130,
873
6,64
4,06
6
1131
1002
00Se
lf C
onta
ined
Bre
athi
ng A
ppar
atus
620
-
-
-
62
0
-
620
1152
0002
00B
iom
edic
al E
quip
men
t2,
811
-
-
-
2,81
1
-
2,
811
11
5200
0200
Bio
med
ical
Equ
ipm
ent
401,
182
401,
182
-
40
1,18
2
-
-
-
*11
6210
0200
Sher
iff A
utom
ated
Rou
nds S
oftw
are
200,
000
-
-
-
20
0,00
0
-
200,
000
1172
0002
00Fi
re A
larm
and
Pub
lic A
ddre
ss S
yste
m15
0,00
0
-
4,86
9
4,86
9
145,
131
5,99
6
139,
135
1182
0002
00Pr
ecin
ct S
ecur
ity C
amer
a Sy
stem
Upg
rade
s26
,748
-
10
,968
10
,968
15
,780
15
,780
-
1212
1002
00Ja
il In
terc
om S
yste
m D
igita
l Con
vers
ion
470,
000
-
-
-
47
0,00
0
47
0,00
0
-
1222
1002
00Ja
il K
itche
n Eq
uipm
ent R
epla
cem
ent
76,0
00
-
-
-
76,0
00
-
76
,000
12
3210
0200
Jail
Laun
dry
Equi
pmen
t Rep
lace
men
t14
5,00
0
-
-
-
145,
000
-
14
5,00
0
12
4100
0200
Publ
ic S
afet
y Fa
cilit
y D
esig
n87
9,22
5
-
-
-
879,
225
-
87
9,22
5
12
4210
0200
Jail
PLC
Sys
tem
Rep
lace
men
t & U
pgra
de37
7,00
0
-
10,9
02
10,9
02
366,
098
230,
000
136,
098
1251
5002
00R
estro
om R
enov
atio
ns F
irest
atio
n #1
350
5,27
5
45
2,63
4
12
,929
46
5,56
3
39
,712
1,
587
38
,125
12
5210
0200
Jail
Surv
eilla
nce
Syst
em D
igita
l Con
vers
ion
& A
dditi
onal
Cam
75,0
00
-
-
-
75,0
00
-
75
,000
12
5190
0200
Die
sel E
xhau
st E
xtra
ctio
n Sy
stem
s2
-
-
-
2
-
2
12
6190
0200
Emer
genc
y V
ehic
le S
tora
ge F
acili
ty61
2,40
0
-
-
-
612,
400
-
61
2,40
0
12
6210
0200
Jail
and
Sher
iff H
Q R
enew
al a
nd R
epla
cem
ents
370,
000
-
13
1,79
7
13
1,79
7
23
8,20
3
66
,960
17
1,24
3
12
7190
0200
Dee
p C
reek
Fire
Sta
tion
#8 -
Rel
ocat
e64
0,46
4
-
214,
284
214,
284
426,
180
406,
299
19,8
81
1272
1002
00Po
lice
Com
man
d B
us R
epla
cem
ent
303,
077
-
-
-
30
3,07
7
-
303,
077
1331
9002
00H
R R
egio
nal J
ail A
utho
rity
Parti
cipa
tion
3,00
0,00
0
2,00
0,00
0
1,00
0,00
0
3,00
0,00
0
-
-
-
*
1371
4002
00A
nim
al S
ervi
ces F
acili
ty1,
387,
833
59
6,93
5
(2
4,68
6)
57
2,25
0
81
5,58
3
56
9,35
6
24
6,22
7
13
8140
0200
Publ
ic S
afet
y Si
te R
emed
iatio
n / T
urn
Lane
Con
stru
ctio
n70
8,28
8
-
-
-
708,
288
-
70
8,28
8
13
9140
0200
Publ
ic S
afet
y H
eadq
uarte
rs E
OC
/ED
C P
hase
I36
,707
,586
14,3
33,8
41
13
,133
,768
27,4
67,6
09
9,
239,
977
5,
307,
874
3,
932,
103
13
9140
0200
Publ
ic S
afet
y H
eadq
uarte
rs E
OC
/ED
C P
hase
I33
5,04
1
-
335,
041
335,
041
-
-
-
*
1392
0002
00Fi
re V
ehic
le R
epla
cem
ent
855,
914
-
69
7,32
2
69
7,32
2
15
8,59
2
47
,357
11
1,23
5
13
9200
0200
Fire
Veh
icle
Rep
lace
men
t64
4,08
6
60
3,75
1
40
,335
64
4,08
6
-
-
-
*(C
ontin
ued)
Exp
endi
ture
s
161
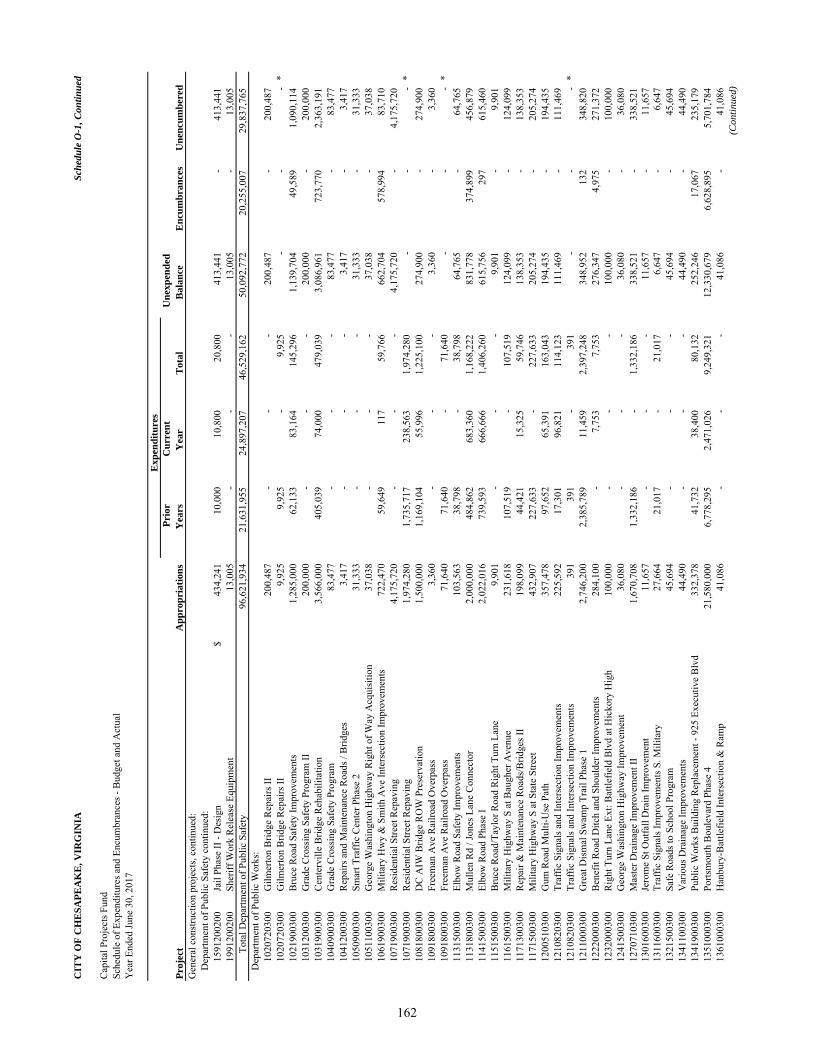
CIT
Y O
F C
HE
SAPE
AK
E, V
IRG
INIA
Sche
dule
O-1
, Con
tinue
d
Cap
ital P
roje
cts F
und
Sche
dule
of E
xpen
ditu
res a
nd E
ncum
bran
ces -
Bud
get a
nd A
ctua
lY
ear E
nded
June
30,
201
7
Proj
ect
App
ropr
iatio
ns
Prio
rY
ears
C
urre
ntY
ear
Tot
al
Une
xpen
ded
Bal
ance
E
ncum
bran
ces
Une
ncum
bere
d G
ener
al c
onst
ruct
ion
proj
ects
, con
tinue
d:D
epar
tmen
t of P
ublic
Saf
ety
cont
inue
d:15
9120
0200
Jail
Phas
e II
- D
esig
n$
434,
241
10,0
00
10,8
00
20,8
00
413,
441
-
41
3,44
1
19
9120
0200
Sher
iff W
ork
Rel
ease
Equ
ipm
ent
13,0
05
-
-
-
13,0
05
-
13
,005
To
tal D
epar
tmen
t of P
ublic
Saf
ety
96,6
21,9
34
21
,631
,955
24,8
97,2
07
46
,529
,162
50,0
92,7
72
20
,255
,007
29,8
37,7
65
D
epar
tmen
t of P
ublic
Wor
ks:
1020
7203
00G
ilmer
ton
Brid
ge R
epai
rs II
200,
487
-
-
-
20
0,48
7
-
200,
487
1020
7203
00G
ilmer
ton
Brid
ge R
epai
rs II
9,92
5
9,92
5
-
9,
925
-
-
-
*10
2190
0300
Bru
ce R
oad
Safe
ty Im
prov
emen
ts1,
285,
000
62
,133
83
,164
14
5,29
6
1,
139,
704
49
,589
1,
090,
114
10
3120
0300
Gra
de C
ross
ing
Safe
ty P
rogr
am II
200,
000
-
-
-
20
0,00
0
-
200,
000
1031
9003
00C
ente
rvill
e B
ridge
Reh
abili
tatio
n3,
566,
000
40
5,03
9
74
,000
47
9,03
9
3,
086,
961
72
3,77
0
2,
363,
191
10
4090
0300
Gra
de C
ross
ing
Safe
ty P
rogr
am83
,477
-
-
-
83
,477
-
83,4
77
1041
2003
00R
epai
rs a
nd M
aint
enan
ce R
oads
/ B
ridge
s3,
417
-
-
-
3,41
7
-
3,
417
10
5090
0300
Smar
t Tra
ffic
Cen
ter P
hase
231
,333
-
-
-
31
,333
-
31,3
33
1051
1003
00G
eorg
e W
ashi
ngto
n H
ighw
ay R
ight
of W
ay A
cqui
sitio
n37
,038
-
-
-
37
,038
-
37,0
38
1061
9003
00M
ilita
ry H
wy
& S
mith
Ave
Inte
rsec
tion
Impr
ovem
ents
722,
470
59,6
49
117
59,7
66
662,
704
578,
994
83,7
10
1071
9003
00R
esid
entia
l Stre
et R
epav
ing
4,17
5,72
0
-
-
-
4,
175,
720
-
4,17
5,72
0
1071
9003
00R
esid
entia
l Stre
et R
epav
ing
1,97
4,28
0
1,73
5,71
7
238,
563
1,97
4,28
0
-
-
-
*
1081
8003
00D
C A
IW B
ridge
RO
W P
rese
rvat
ion
1,50
0,00
0
1,16
9,10
4
55,9
96
1,22
5,10
0
274,
900
-
27
4,90
0
10
9180
0300
Free
man
Ave
Rai
lroad
Ove
rpas
s3,
360
-
-
-
3,36
0
-
3,
360
10
9180
0300
Free
man
Ave
Rai
lroad
Ove
rpas
s71
,640
71,6
40
-
71
,640
-
-
-
*11
3150
0300
Elbo
w R
oad
Safe
ty Im
prov
emen
ts10
3,56
3
38
,798
-
38,7
98
64,7
65
-
64
,765
11
3180
0300
Mul
len
Rd
/ Jon
es L
ane
Con
nect
or2,
000,
000
48
4,86
2
68
3,36
0
1,
168,
222
83
1,77
8
37
4,89
9
45
6,87
9
11
4150
0300
Elbo
w R
oad
Phas
e I
2,02
2,01
6
739,
593
666,
666
1,40
6,26
0
615,
756
297
615,
460
1151
5003
00B
ruce
Roa
d/Ta
ylor
Roa
d R
ight
Tur
n La
ne9,
901
-
-
-
9,90
1
-
9,
901
11
6150
0300
Mili
tary
Hig
hway
S a
t Bau
gher
Ave
nue
231,
618
107,
519
-
10
7,51
9
12
4,09
9
-
124,
099
1171
3003
00R
epai
r & M
aint
enan
ce R
oads
/Brid
ges I
I19
8,09
9
44
,421
15
,325
59
,746
13
8,35
3
-
138,
353
1171
5003
00M
ilita
ry H
ighw
ay S
at S
tate
Stre
et43
2,90
7
22
7,63
3
-
227,
633
205,
274
-
20
5,27
4
12
0051
0300
Gum
Roa
d M
ulti-
Use
Pat
h35
7,47
8
97
,652
65
,391
16
3,04
3
19
4,43
5
-
194,
435
1210
8203
00Tr
affic
Sig
nals
and
Inte
rsec
tion
Impr
ovem
ents
225,
592
17,3
01
96,8
21
114,
123
111,
469
-
11
1,46
9
12
1082
0300
Traf
fic S
igna
ls a
nd In
ters
ectio
n Im
prov
emen
ts39
1
39
1
-
391
-
-
-
*
1211
0003
00G
reat
Dis
mal
Sw
amp
Trai
l Pha
se 1
2,74
6,20
0
2,38
5,78
9
11,4
59
2,39
7,24
8
348,
952
132
348,
820
1222
0003
00B
enef
it R
oad
Ditc
h an
d Sh
ould
er Im
prov
emen
ts28
4,10
0
-
7,75
3
7,75
3
276,
347
4,97
5
271,
372
1232
0003
00R
ight
Tur
n La
ne E
xt: B
attle
field
Blv
d at
Hic
kory
Hig
h10
0,00
0
-
-
-
100,
000
-
10
0,00
0
12
4150
0300
Geo
rge
Was
hing
ton
Hig
hway
Impr
ovem
ent
36,0
80
-
-
-
36,0
80
-
36
,080
12
7071
0300
Mas
ter D
rain
age
Impr
ovem
ent I
I1,
670,
708
1,
332,
186
-
1,33
2,18
6
338,
521
-
33
8,52
1
13
0160
0300
Jero
me
St O
utfa
ll D
rain
Impr
ovem
ent
11,6
57
-
-
-
11,6
57
-
11
,657
1311
6003
00Tr
affic
Sig
nals
Impr
ovem
ents
S. M
ilita
ry27
,664
21,0
17
-
21,0
17
6,
647
-
6,
647
13
2150
0300
Safe
Roa
ds to
Sch
ool P
rogr
am45
,694
-
-
-
45
,694
-
45,6
94
1341
1003
00V
ario
us D
rain
age
Impr
ovem
ents
44,4
90
-
-
-
44,4
90
-
44
,490
13
4190
0300
Publ
ic W
orks
Bui
ldin
g R
epla
cem
ent -
925
Exe
cutiv
e B
lvd
332,
378
41,7
32
38,4
00
80,1
32
252,
246
17,0
67
235,
179
1351
0003
00Po
rtsm
outh
Bou
leva
rd P
hase
421
,580
,000
6,77
8,29
5
2,47
1,02
6
9,24
9,32
1
12,3
30,6
79
6,
628,
895
5,
701,
784
13
6100
0300
Han
bury
-Bat
tlefie
ld In
ters
ectio
n &
Ram
p41
,086
-
-
-
41
,086
-
41,0
86
(Con
tinue
d)
Exp
endi
ture
s
162
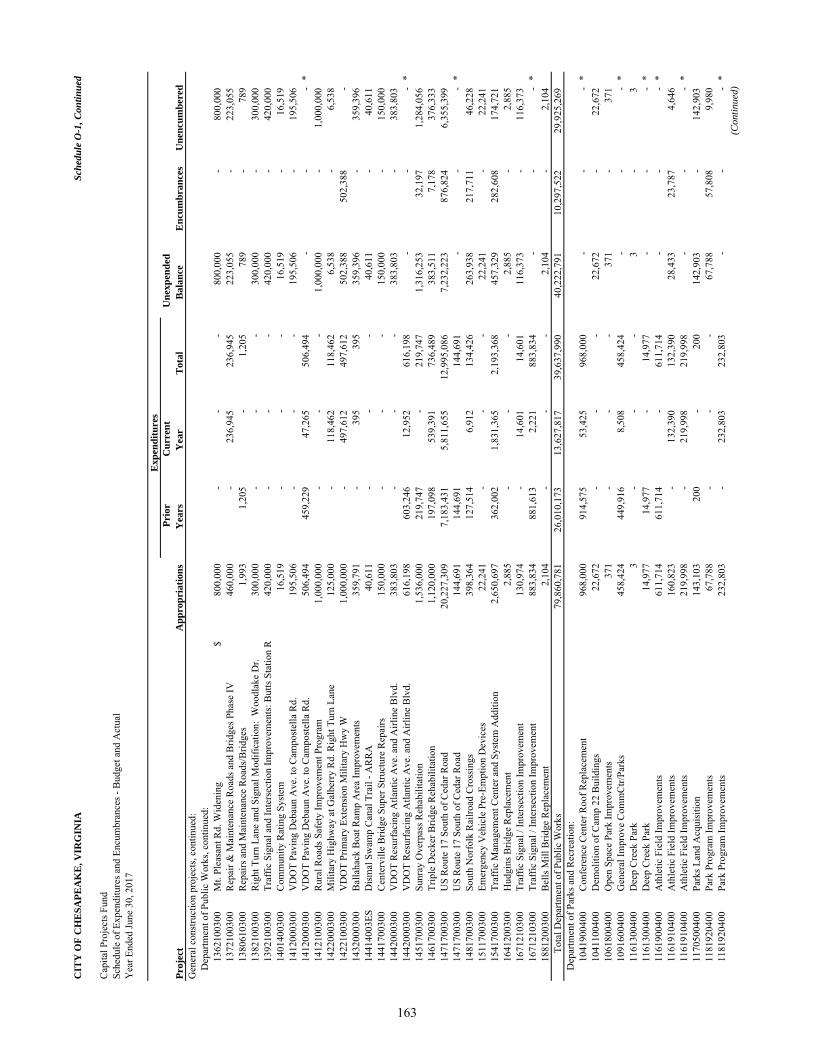
CIT
Y O
F C
HE
SAPE
AK
E, V
IRG
INIA
Sche
dule
O-1
, Con
tinue
d
Cap
ital P
roje
cts F
und
Sche
dule
of E
xpen
ditu
res a
nd E
ncum
bran
ces -
Bud
get a
nd A
ctua
lY
ear E
nded
June
30,
201
7
Proj
ect
App
ropr
iatio
ns
Prio
rY
ears
C
urre
ntY
ear
Tot
al
Une
xpen
ded
Bal
ance
E
ncum
bran
ces
Une
ncum
bere
d G
ener
al c
onst
ruct
ion
proj
ects
, con
tinue
d:D
epar
tmen
t of P
ublic
Wor
ks, c
ontin
ued:
1362
1003
00M
t. Pl
easa
nt R
d. W
iden
ing
$80
0,00
0
-
-
-
800,
000
-
80
0,00
0
13
7210
0300
Rep
air &
Mai
nten
ance
Roa
ds a
nd B
ridge
s Pha
se IV
460,
000
-
23
6,94
5
23
6,94
5
22
3,05
5
-
223,
055
1380
6103
00R
epai
rs a
nd M
aint
enan
ce R
oads
/Brid
ges
1,99
3
1,20
5
-
1,
205
78
9
-
789
1382
1003
00R
ight
Tur
n La
ne a
nd S
igna
l Mod
ifica
tion:
Woo
dlak
e D
r.30
0,00
0
-
-
-
300,
000
-
30
0,00
0
13
9210
0300
Traf
fic S
igna
l and
Inte
rsec
tion
Impr
ovem
ents
: But
ts S
tatio
n R
420,
000
-
-
-
42
0,00
0
-
420,
000
1401
4003
00C
omm
unity
Rat
ing
Syst
em16
,519
-
-
-
16
,519
-
16,5
19
1412
0003
00V
DO
T Pa
ving
Deb
aun
Ave
. to
Cam
post
ella
Rd.
19
5,50
6
-
-
-
195,
506
-
19
5,50
6
14
1200
0300
VD
OT
Pavi
ng D
ebau
n A
ve. t
o C
ampo
stel
la R
d.
506,
494
459,
229
47,2
65
506,
494
-
-
-
*
1412
1003
00R
ural
Roa
ds S
afet
y Im
prov
emen
t Pro
gram
1,00
0,00
0
-
-
-
1,
000,
000
-
1,00
0,00
0
1422
0003
00M
ilita
ry H
ighw
ay a
t Gal
berr
y R
d. R
ight
Tur
n La
ne
125,
000
-
11
8,46
2
11
8,46
2
6,
538
-
6,53
8
1422
1003
00V
DO
T Pr
imar
y Ex
tens
ion
Mili
tary
Hw
y W
1,00
0,00
0
-
49
7,61
2
49
7,61
2
50
2,38
8
50
2,38
8
-
1432
0003
00B
alla
hack
Boa
t Ram
p A
rea
Impr
ovem
ents
359,
791
-
39
5
39
5
35
9,39
6
-
359,
396
1441
4003
ESD
ism
al S
wam
p C
anal
Tra
il - A
RR
A40
,611
-
-
-
40
,611
-
40,6
11
1441
7003
00C
ente
rvill
e B
ridge
Sup
er S
truct
ure
Rep
airs
150,
000
-
-
-
15
0,00
0
-
150,
000
1442
0003
00V
DO
T R
esur
faci
ng A
tlant
ic A
ve. a
nd A
irlin
e B
lvd.
383,
803
-
-
-
38
3,80
3
-
383,
803
1442
0003
00V
DO
T R
esur
faci
ng A
tlant
ic A
ve. a
nd A
irlin
e B
lvd.
616,
198
603,
246
12,9
52
616,
198
-
-
-
*
1451
7003
00Su
nray
Ove
rpas
s Reh
abili
tatio
n1,
536,
000
21
9,74
7
-
219,
747
1,31
6,25
3
32,1
97
1,28
4,05
6
1461
7003
00Tr
iple
Dec
ker B
ridge
Reh
abili
tatio
n1,
120,
000
19
7,09
8
53
9,39
1
73
6,48
9
38
3,51
1
7,
178
37
6,33
3
14
7170
0300
US
Rou
te 1
7 So
uth
of C
edar
Roa
d20
,227
,309
7,18
3,43
1
5,81
1,65
5
12,9
95,0
86
7,
232,
223
87
6,82
4
6,
355,
399
14
7170
0300
US
Rou
te 1
7 So
uth
of C
edar
Roa
d14
4,69
1
14
4,69
1
14
4,69
1
-
-
-
*14
8170
0300
Sout
h N
orfo
lk R
ailro
ad C
ross
ings
398,
364
127,
514
6,91
2
134,
426
263,
938
217,
711
46,2
28
1511
7003
00Em
erge
ncy
Veh
icle
Pre
-Em
ptio
n D
evic
es22
,241
-
-
-
22
,241
-
22,2
41
1541
7003
00Tr
affic
Man
agem
ent C
ente
r and
Sys
tem
Add
ition
2,65
0,69
7
362,
002
1,83
1,36
5
2,19
3,36
8
457,
329
282,
608
174,
721
1641
2003
00H
udgi
ns B
ridge
Rep
lace
men
t2,
885
-
-
-
2,88
5
-
2,
885
16
7121
0300
Traf
fic S
igna
l / In
ters
ectio
n Im
prov
emen
t13
0,97
4
-
14,6
01
14,6
01
116,
373
-
11
6,37
3
16
7121
0300
Traf
fic S
igna
l / In
ters
ectio
n Im
prov
emen
t88
3,83
4
88
1,61
3
2,
221
88
3,83
4
-
-
-
*18
8120
0300
Bel
ls M
ill B
ridge
Rep
lace
men
t2,
104
-
-
-
2,10
4
-
2,
104
To
tal D
epar
tmen
t of P
ublic
Wor
ks79
,860
,781
26,0
10,1
73
13
,627
,817
39,6
37,9
90
40
,222
,791
10,2
97,5
22
29
,925
,269
Dep
artm
ent o
f Par
ks a
nd R
ecre
atio
n:10
4190
0400
Con
fere
nce
Cen
ter R
oof R
epla
cem
ent
968,
000
914,
575
53,4
25
968,
000
-
-
-
*
1041
1004
00D
emol
ition
of C
amp
22 B
uild
ings
22,6
72
-
-
-
22,6
72
-
22
,672
10
6180
0400
Ope
n Sp
ace
Park
Impr
ovem
ents
371
-
-
-
37
1
-
371
1091
6004
00G
ener
al Im
prov
e C
omm
Ctr/
Park
s45
8,42
4
44
9,91
6
8,
508
45
8,42
4
-
-
-
*11
6130
0400
Dee
p C
reek
Par
k3
-
-
-
3
-
3
11
6130
0400
Dee
p C
reek
Par
k14
,977
14,9
77
-
14
,977
-
-
-
*11
6190
0400
Ath
letic
Fie
ld Im
prov
emen
ts61
1,71
4
61
1,71
4
-
611,
714
-
-
-
*
1161
9104
00A
thle
tic F
ield
Impr
ovem
ents
160,
823
-
13
2,39
0
13
2,39
0
28
,433
23
,787
4,
646
11
6191
0400
Ath
letic
Fie
ld Im
prov
emen
ts21
9,99
8
-
219,
998
219,
998
-
-
-
*
1170
5004
00Pa
rks L
and
Acq
uisi
tion
143,
103
200
-
20
0
14
2,90
3
-
142,
903
1181
9204
00Pa
rk P
rogr
am Im
prov
emen
ts67
,788
-
-
-
67
,788
57
,808
9,
980
11
8192
0400
Park
Pro
gram
Impr
ovem
ents
232,
803
-
23
2,80
3
23
2,80
3
-
-
-
*(C
ontin
ued)
Exp
endi
ture
s
163
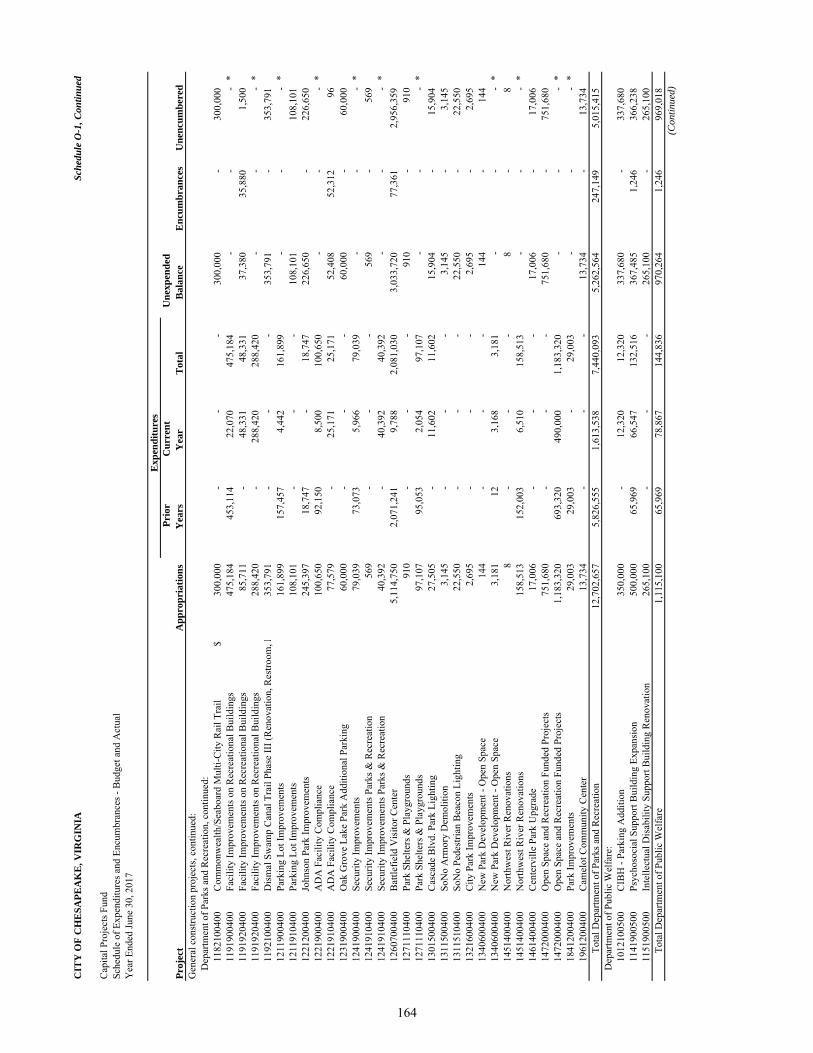
CIT
Y O
F C
HE
SAPE
AK
E, V
IRG
INIA
Sche
dule
O-1
, Con
tinue
d
Cap
ital P
roje
cts F
und
Sche
dule
of E
xpen
ditu
res a
nd E
ncum
bran
ces -
Bud
get a
nd A
ctua
lY
ear E
nded
June
30,
201
7
Proj
ect
App
ropr
iatio
ns
Prio
rY
ears
C
urre
ntY
ear
Tot
al
Une
xpen
ded
Bal
ance
E
ncum
bran
ces
Une
ncum
bere
d G
ener
al c
onst
ruct
ion
proj
ects
, con
tinue
d:D
epar
tmen
t of P
arks
and
Rec
reat
ion,
con
tinue
d:11
8210
0400
Com
mon
wea
lth/S
eabo
ard
Mul
ti-C
ity R
ail T
rail
$30
0,00
0
-
-
-
300,
000
-
30
0,00
0
11
9190
0400
Faci
lity
Impr
ovem
ents
on
Rec
reat
iona
l Bui
ldin
gs47
5,18
4
45
3,11
4
22
,070
47
5,18
4
-
-
-
*11
9192
0400
Faci
lity
Impr
ovem
ents
on
Rec
reat
iona
l Bui
ldin
gs85
,711
-
48
,331
48
,331
37
,380
35
,880
1,
500
11
9192
0400
Faci
lity
Impr
ovem
ents
on
Rec
reat
iona
l Bui
ldin
gs28
8,42
0
-
288,
420
288,
420
-
-
-
*
1192
1004
00D
ism
al S
wam
p C
anal
Tra
il Ph
ase
III (
Ren
ovat
ion,
Res
troom
, P35
3,79
1
-
-
-
353,
791
-
35
3,79
1
12
1190
0400
Park
ing
Lot I
mpr
ovem
ents
161,
899
157,
457
4,44
2
161,
899
-
-
-
*
1211
9104
00Pa
rkin
g Lo
t Im
prov
emen
ts10
8,10
1
-
-
-
108,
101
108,
101
1221
2004
00Jo
hnso
n Pa
rk Im
prov
emen
ts24
5,39
7
18
,747
-
18,7
47
226,
650
-
22
6,65
0
12
2190
0400
AD
A F
acili
ty C
ompl
ianc
e10
0,65
0
92
,150
8,
500
10
0,65
0
-
-
-
*12
2191
0400
AD
A F
acili
ty C
ompl
ianc
e77
,579
-
25
,171
25
,171
52
,408
52
,312
96
12
3190
0400
Oak
Gro
ve L
ake
Park
Add
ition
al P
arki
ng60
,000
-
-
-
60
,000
-
60,0
00
1241
9004
00Se
curit
y Im
prov
emen
ts79
,039
73,0
73
5,96
6
79,0
39
-
-
-
*
1241
9104
00Se
curit
y Im
prov
emen
ts P
arks
& R
ecre
atio
n56
9
-
-
-
569
-
56
9
12
4191
0400
Secu
rity
Impr
ovem
ents
Par
ks &
Rec
reat
ion
40,3
92
-
40,3
92
40,3
92
-
-
-
*
1260
7004
00B
attle
field
Vis
itor C
ente
r5,
114,
750
2,
071,
241
9,
788
2,
081,
030
3,
033,
720
77
,361
2,
956,
359
12
7111
0400
Park
She
lters
& P
layg
roun
ds91
0
-
-
-
910
-
91
0
12
7111
0400
Park
She
lters
& P
layg
roun
ds97
,107
95,0
53
2,05
4
97,1
07
-
-
-
*
1301
5004
00C
asca
de B
lvd.
Par
k Li
ghtin
g27
,505
-
11
,602
11
,602
15
,904
-
15,9
04
1311
5004
00So
No
Arm
ory
Dem
oliti
on3,
145
-
-
-
3,14
5
-
3,
145
13
1151
0400
SoN
o Pe
dest
rian
Bea
con
Ligh
ting
22,5
50
-
-
-
22,5
50
-
22
,550
13
2160
0400
City
Par
k Im
prov
emen
ts2,
695
-
-
-
2,69
5
-
2,
695
13
4060
0400
New
Par
k D
evel
opm
ent -
Ope
n Sp
ace
144
-
-
-
14
4
-
144
1340
6004
00N
ew P
ark
Dev
elop
men
t - O
pen
Spac
e3,
181
12
3,
168
3,
181
-
-
-
*14
5140
0400
Nor
thw
est R
iver
Ren
ovat
ions
8
-
-
-
8
-
8
1451
4004
00N
orth
wes
t Riv
er R
enov
atio
ns15
8,51
3
15
2,00
3
6,
510
15
8,51
3
-
-
-
*14
6140
0400
Cen
terv
ille
Park
Upg
rade
17,0
06
-
-
-
17,0
06
-
17
,006
14
7200
0400
Ope
n Sp
ace
and
Rec
reat
ion
Fund
ed P
roje
cts
751,
680
-
-
-
75
1,68
0
-
751,
680
1472
0004
00O
pen
Spac
e an
d R
ecre
atio
n Fu
nded
Pro
ject
s1,
183,
320
69
3,32
0
49
0,00
0
1,
183,
320
-
-
-
*18
4120
0400
Park
Impr
ovem
ents
29
,003
29,0
03
-
29
,003
-
-
-
*19
6120
0400
Cam
elot
Com
mun
ity C
ente
r13
,734
-
-
-
13
,734
-
13,7
34
Tota
l Dep
artm
ent o
f Par
ks a
nd R
ecre
atio
n12
,702
,657
5,82
6,55
5
1,61
3,53
8
7,44
0,09
3
5,26
2,56
4
247,
149
5,01
5,41
5
Dep
artm
ent o
f Pub
lic W
elfa
re:
1012
1005
00C
IBH
- Pa
rkin
g A
dditi
on
350,
000
-
12
,320
12
,320
33
7,68
0
-
337,
680
1141
9005
00Ps
ycho
soci
al S
uppo
rt B
uild
ing
Expa
nsio
n50
0,00
0
65
,969
66
,547
13
2,51
6
36
7,48
5
1,
246
36
6,23
8
11
5190
0500
Inte
llect
ual D
isab
ility
Sup
port
Bui
ldin
g R
enov
atio
n26
5,10
0
-
-
-
265,
100
-
26
5,10
0
To
tal D
epar
tmen
t of P
ublic
Wel
fare
1,11
5,10
0
65,9
69
78,8
67
144,
836
970,
264
1,24
6
969,
018
(Con
tinue
d)
Exp
endi
ture
s
164
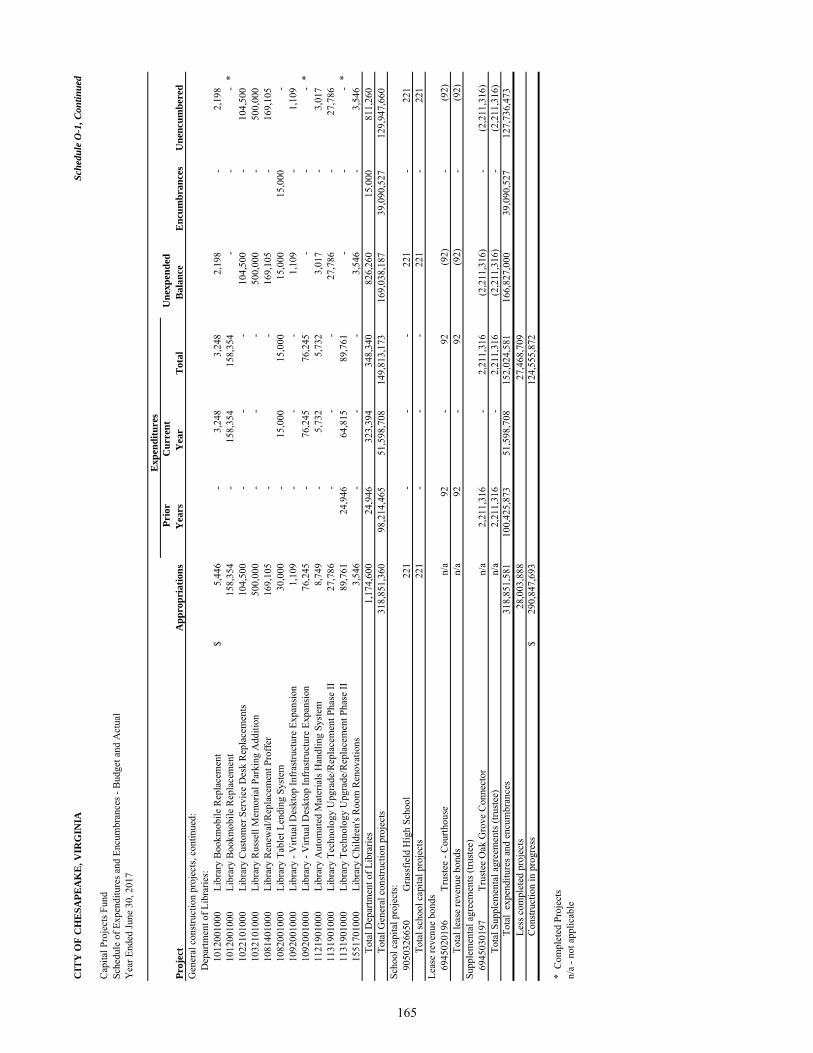
CIT
Y O
F C
HE
SAPE
AK
E, V
IRG
INIA
Sche
dule
O-1
, Con
tinue
d
Cap
ital P
roje
cts F
und
Sche
dule
of E
xpen
ditu
res a
nd E
ncum
bran
ces -
Bud
get a
nd A
ctua
lY
ear E
nded
June
30,
201
7
Proj
ect
App
ropr
iatio
ns
Prio
rY
ears
C
urre
ntY
ear
Tot
al
Une
xpen
ded
Bal
ance
E
ncum
bran
ces
Une
ncum
bere
d G
ener
al c
onst
ruct
ion
proj
ects
, con
tinue
d:D
epar
tmen
t of L
ibra
ries:
1012
0010
00Li
brar
y B
ookm
obile
Rep
lace
men
t$
5,44
6
-
3,
248
3,
248
2,
198
-
2,19
8
1012
0010
00Li
brar
y B
ookm
obile
Rep
lace
men
t15
8,35
4
-
158,
354
158,
354
-
-
-
*
1022
1010
00Li
brar
y C
usto
mer
Ser
vice
Des
k R
epla
cem
ents
104,
500
-
-
-
10
4,50
0
-
104,
500
1032
1010
00Li
brar
y R
usse
ll M
emor
ial P
arki
ng A
dditi
on50
0,00
0
-
-
-
500,
000
-
50
0,00
0
10
8140
1000
Libr
ary
Ren
ewal
/Rep
lace
men
t Pro
ffer
169,
105
-
-
169,
105
-
16
9,10
5
10
8200
1000
Libr
ary
Tabl
et L
endi
ng S
yste
m30
,000
-
15
,000
15
,000
15
,000
15
,000
-
1092
0010
00Li
brar
y - V
irtua
l Des
ktop
Infr
astru
ctur
e Ex
pans
ion
1,10
9
-
-
-
1,
109
-
1,10
9
1092
0010
00Li
brar
y - V
irtua
l Des
ktop
Infr
astru
ctur
e Ex
pans
ion
76,2
45
-
76,2
45
76,2
45
-
-
-
*
1121
9010
00Li
brar
y A
utom
ated
Mat
eria
ls H
andl
ing
Syst
em8,
749
-
5,73
2
5,73
2
3,01
7
-
3,
017
11
3190
1000
Libr
ary
Tech
nolo
gy U
pgra
de/R
epla
cem
ent P
hase
II27
,786
-
-
-
27
,786
-
27,7
86
1131
9010
00Li
brar
y Te
chno
logy
Upg
rade
/Rep
lace
men
t Pha
se II
89,7
61
24
,946
64
,815
89
,761
-
-
-
*15
5170
1000
Libr
ary
Chi
ldre
n's R
oom
Ren
ovat
ions
3,54
6
-
-
-
3,
546
-
3,54
6
Tota
l Dep
artm
ent o
f Lib
rarie
s1,
174,
600
24
,946
32
3,39
4
34
8,34
0
82
6,26
0
15
,000
81
1,26
0
To
tal G
ener
al c
onst
ruct
ion
proj
ects
318,
851,
360
98
,214
,465
51,5
98,7
08
14
9,81
3,17
3
16
9,03
8,18
7
39
,090
,527
129,
947,
660
Scho
ol c
apita
l pro
ject
s:90
5032
6650
Gra
ssfie
ld H
igh
Scho
ol
221
-
-
-
22
1
-
221
Tota
l sch
ool c
apita
l pro
ject
s22
1
-
-
-
221
-
22
1
Le
ase
reve
nue
bond
s69
4502
0196
Trus
tee
- Cou
rthou
se
n/
a92
-
92
(92)
-
(92)
To
tal l
ease
reve
nue
bond
sn/
a92
-
92
(92)
-
(92)
Su
pple
men
tal a
gree
men
ts (t
rust
ee)
6945
0301
97
Tr
uste
e O
ak G
rove
Con
nect
or
n/a
2,21
1,31
6
-
2,
211,
316
(2
,211
,316
)
-
(2
,211
,316
)
Tota
l Sup
plem
enta
l agr
eem
ents
(tru
stee
)n/
a2,
211,
316
-
2,21
1,31
6
(2,2
11,3
16)
-
(2,2
11,3
16)
To
tal
expe
nditu
res a
nd e
ncum
bran
ces
318,
851,
581
10
0,42
5,87
3
51,5
98,7
08
15
2,02
4,58
1
166,
827,
000
39
,090
,527
127,
736,
473
Le
ss c
ompl
eted
pro
ject
s28
,003
,888
27,4
68,7
09
C
onst
ruct
ion
in p
rogr
ess
$29
0,84
7,69
3
124,
555,
872
* C
ompl
eted
Pro
ject
sn/
a - n
ot a
pplic
able
Exp
endi
ture
s
165
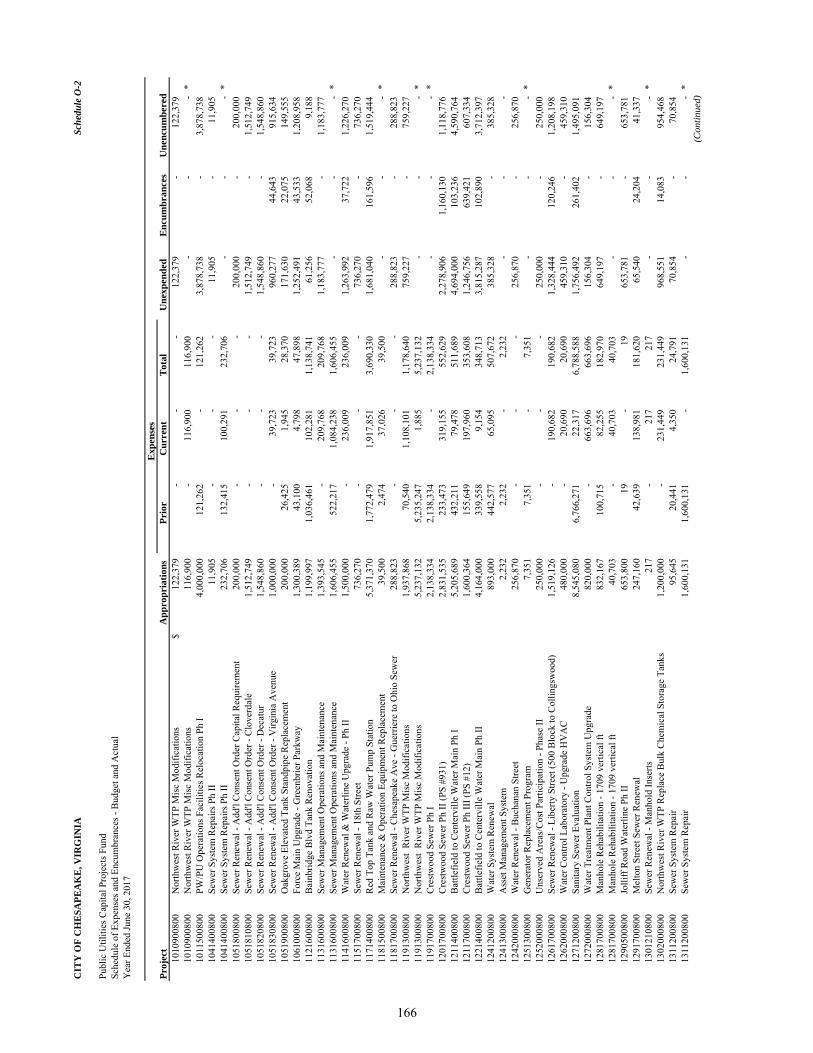
CIT
Y O
F C
HE
SAPE
AK
E, V
IRG
INIA
Sche
dule
O-2
Publ
ic U
tiliti
es C
apita
l Pro
ject
s Fun
dSc
hedu
le o
f Exp
ense
s and
Enc
umbr
ance
s - B
udge
t and
Act
ual
Yea
r End
ed Ju
ne 3
0, 2
017
Proj
ect
App
ropr
iatio
nsPr
ior
Cur
rent
Tot
alU
nexp
ende
d E
ncum
bran
ces
Une
ncum
bere
d 10
1090
0800
Nor
thw
est R
iver
WTP
Mis
c M
odifi
catio
ns$
122,
379
-
-
-
12
2,37
9
-
122,
379
1010
9008
00N
orth
wes
t Riv
er W
TP M
isc
Mod
ifica
tions
116,
900
-
11
6,90
0
11
6,90
0
-
-
-
*10
1150
0800
PW/P
U O
pera
tions
Fac
ilitie
s Rel
ocat
ion
Ph I
4,00
0,00
0
121,
262
-
12
1,26
2
3,
878,
738
-
3,87
8,73
8
1041
4008
00Se
wer
Sys
tem
Rep
airs
Ph
II11
,905
-
-
-
11
,905
-
11,9
05
1041
4008
00Se
wer
Sys
tem
Rep
airs
Ph
II23
2,70
6
13
2,41
5
10
0,29
1
23
2,70
6
-
-
-
*10
5180
0800
Sew
er R
enew
al -
Add
'l C
onse
nt O
rder
Cap
ital R
equi
rem
ent
200,
000
-
-
-
20
0,00
0
-
200,
000
1051
8108
00Se
wer
Ren
ewal
- A
dd'l
Con
sent
Ord
er -
Clo
verd
ale
1,51
2,74
9
-
-
-
1,
512,
749
-
1,51
2,74
9
1051
8208
00Se
wer
Ren
ewal
- A
dd'l
Con
sent
Ord
er -
Dec
atur
1,54
8,86
0
-
-
-
1,
548,
860
-
1,54
8,86
0
1051
8308
00Se
wer
Ren
ewal
- A
dd'l
Con
sent
Ord
er -
Virg
inia
Ave
nue
1,00
0,00
0
-
39
,723
39
,723
96
0,27
7
44
,643
91
5,63
4
10
5190
0800
Oak
grov
e El
evat
ed T
ank
Stan
dpip
e R
epla
cem
ent
200,
000
26,4
25
1,94
5
28
,370
17
1,63
0
22
,075
14
9,55
5
10
6100
0800
Forc
e M
ain
Upg
rade
- G
reen
brie
r Par
kway
1,30
0,38
9
43,1
00
4,79
8
47
,898
1,
252,
491
43
,533
1,
208,
958
11
2160
0800
Bai
nbrid
ge B
lvd
Tank
Ren
ovat
ion
1,19
9,99
7
1,03
6,46
1
102,
281
1,13
8,74
1
61,2
56
52,0
68
9,18
8
11
3160
0800
Sew
er M
anag
emen
t Ope
ratio
ns a
nd M
aint
enan
ce1,
393,
545
-
209,
768
209,
768
1,18
3,77
7
-
1,
183,
777
11
3160
0800
Sew
er M
anag
emen
t Ope
ratio
ns a
nd M
aint
enan
ce1,
606,
455
52
2,21
7
1,
084,
238
1,
606,
455
-
-
-
*11
4160
0800
Wat
er R
enew
al &
Wat
erlin
e U
pgra
de -
Ph II
1,50
0,00
0
-
23
6,00
9
23
6,00
9
1,
263,
992
37
,722
1,
226,
270
11
5170
0800
Sew
er R
enew
al -
18th
Stre
et73
6,27
0
-
-
-
736,
270
-
73
6,27
0
11
7140
0800
Red
Top
Tan
k an
d R
aw W
ater
Pum
p St
atio
n5,
371,
370
1,
772,
479
1,
917,
851
3,
690,
330
1,
681,
040
16
1,59
6
1,
519,
444
11
8150
0800
Mai
nten
ance
& O
pera
tion
Equi
pmen
t Rep
lace
men
t39
,500
2,47
4
37
,026
39
,500
-
-
-
*11
8170
0800
Sew
er R
enew
al -
Che
sape
ake
Ave
- G
uerr
iere
to O
hio
Sew
er28
8,82
3
-
-
-
288,
823
-
28
8,82
3
11
9130
0800
Nor
thw
est
Riv
er W
TP M
isc
Mod
ifica
tions
1,93
7,86
8
70,5
40
1,10
8,10
1
1,17
8,64
0
759,
227
-
75
9,22
7
11
9130
0800
Nor
thw
est
Riv
er W
TP M
isc
Mod
ifica
tions
5,23
7,13
2
5,23
5,24
7
1,88
5
5,
237,
132
-
-
-
*11
9170
0800
Cre
stw
ood
Sew
er P
h I
2,13
8,33
4
2,13
8,33
4
-
2,
138,
334
-
-
-
*12
0170
0800
Cre
stw
ood
Sew
er P
h II
(PS
#931
)2,
831,
535
23
3,47
3
31
9,15
5
55
2,62
9
2,
278,
906
1,
160,
130
1,
118,
776
12
1140
0800
Bat
tlefie
ld to
Cen
terv
ille
Wat
er M
ain
Ph I
5,20
5,68
9
432,
211
79,4
78
511,
689
4,69
4,00
0
103,
236
4,59
0,76
4
1211
7008
00C
rest
woo
d Se
wer
Ph
III (
PS #
12)
1,60
0,36
4
155,
649
197,
960
353,
608
1,24
6,75
6
639,
421
607,
334
1221
4008
00B
attle
field
to C
ente
rvill
e W
ater
Mai
n Ph
II4,
164,
000
33
9,55
8
9,
154
348,
713
3,81
5,28
7
102,
890
3,71
2,39
7
1241
2008
00W
ater
Sys
tem
Ren
ewal
893,
000
442,
577
65,0
95
507,
672
385,
328
-
38
5,32
8
12
4130
0800
Ass
et M
anag
emen
t Sys
tem
2,23
2
2,23
2
-
2,23
2
-
-
-
1242
0008
00W
ater
Ren
ewal
- B
ucha
nan
Stre
et25
6,87
0
-
-
-
256,
870
-
25
6,87
0
12
5130
0800
Gen
erat
or R
epla
cem
ent P
rogr
am7,
351
7,
351
-
7,
351
-
-
-
*
1252
0008
00U
nser
ved
Are
as/C
ost P
artic
ipat
ion
- Pha
se II
250,
000
-
-
-
25
0,00
0
-
250,
000
1261
7008
00Se
wer
Ren
ewal
- Li
berty
Stre
et (5
00 B
lock
to C
ollin
gsw
ood)
1,51
9,12
6
-
19
0,68
2
19
0,68
2
1,
328,
444
12
0,24
6
1,
208,
198
12
6200
0800
Wat
er C
ontro
l Lab
orat
ory
- Upg
rade
HV
AC
480,
000
-
20
,690
20
,690
45
9,31
0
-
459,
310
1271
2008
00Sa
nita
ry S
ewer
Eva
luat
ion
8,54
5,08
0
6,76
6,27
1
22,3
17
6,78
8,58
8
1,75
6,49
2
261,
402
1,49
5,09
1
1272
0008
00W
ater
Tre
atm
ent P
lant
Con
trol S
yste
m U
pgra
de82
0,00
0
-
663,
696
663,
696
156,
304
-
15
6,30
4
12
8170
0800
Man
hole
Reh
abili
tatio
n - 1
709
verti
cal f
t83
2,16
7
10
0,71
5
82
,255
18
2,97
0
64
9,19
7
-
649,
197
1281
7008
00M
anho
le R
ehab
ilita
tion
- 170
9 ve
rtica
l ft
40,7
03
-
40,7
03
40,7
03
-
-
-
*
1290
5008
00Jo
lliff
Roa
d W
ater
line
Ph II
65
3,80
0
19
-
19
653,
781
-
65
3,78
1
12
9170
0800
Mel
ton
Stre
et S
ewer
Ren
ewal
247,
160
42,6
39
138,
981
181,
620
65,5
40
24,2
04
41,3
37
1301
2108
00Se
wer
Ren
ewal
- M
anho
ld In
serts
217
-
21
7
217
-
-
-
*13
0200
0800
Nor
thw
est R
iver
WTP
Rep
lace
Bul
k C
hem
ical
Sto
rage
Tan
ks1,
200,
000
-
231,
449
231,
449
968,
551
14,0
83
954,
468
1311
2008
00Se
wer
Sys
tem
Rep
air
95,6
45
20
,441
4,
350
24,7
91
70,8
54
-
70
,854
13
1120
0800
Sew
er S
yste
m R
epai
r1,
600,
131
1,
600,
131
-
1,60
0,13
1
-
-
-
*
(Con
tinue
d)
Exp
ense
s
166
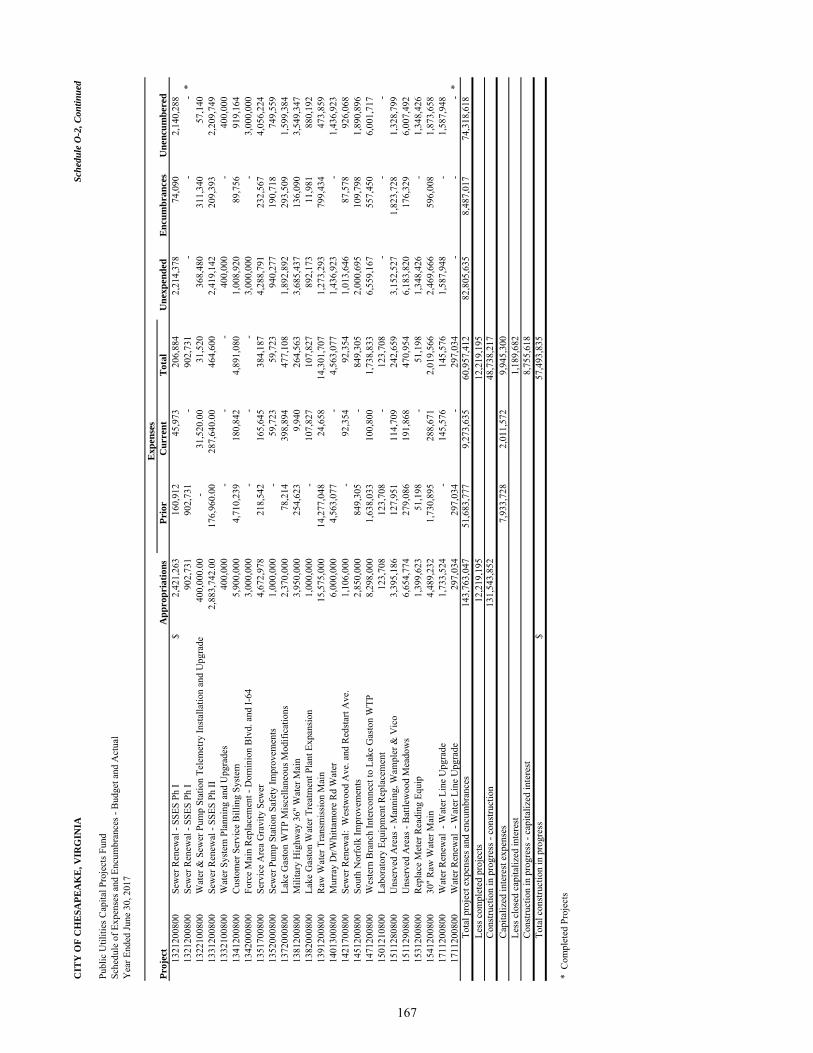
CIT
Y O
F C
HE
SAPE
AK
E, V
IRG
INIA
Sche
dule
O-2
, Con
tinue
d
Publ
ic U
tiliti
es C
apita
l Pro
ject
s Fun
dSc
hedu
le o
f Exp
ense
s and
Enc
umbr
ance
s - B
udge
t and
Act
ual
Yea
r End
ed Ju
ne 3
0, 2
017
Proj
ect
App
ropr
iatio
nsPr
ior
Cur
rent
Tot
alU
nexp
ende
d E
ncum
bran
ces
Une
ncum
bere
d 13
2120
0800
Sew
er R
enew
al -
SSES
Ph
I$
2,42
1,26
3
160,
912
45,9
73
206,
884
2,21
4,37
8
74,0
90
2,14
0,28
8
1321
2008
00Se
wer
Ren
ewal
- SS
ES P
h I
902,
731
902,
731
-
90
2,73
1
-
-
-
*13
2210
0800
Wat
er &
Sew
er P
ump
Stat
ion
Tele
met
ry In
stal
latio
n an
d U
pgra
de40
0,00
0.00
-
31,5
20.0
0
31,5
20
368,
480
311,
340
57,1
40
1331
2008
00Se
wer
Ren
ewal
- SS
ES P
h II
2,88
3,74
2.00
17
6,96
0.00
28
7,64
0.00
46
4,60
0
2,
419,
142
20
9,39
3
2,
209,
749
13
3210
0800
Wat
er S
yste
m P
lann
ing
and
Upg
rade
s40
0,00
0
-
-
-
400,
000
-
40
0,00
0
13
4120
0800
Cus
tom
er S
ervi
ce B
illin
g Sy
stem
5,90
0,00
0
4,71
0,23
9
180,
842
4,89
1,08
0
1,00
8,92
0
89,7
56
919,
164
1342
0008
00Fo
rce
Mai
n R
epla
cem
ent -
Dom
inio
n B
lvd.
and
I-64
3,00
0,00
0
-
-
-
3,
000,
000
-
3,00
0,00
0
1351
7008
00Se
rvic
e A
rea
Gra
vity
Sew
er4,
672,
978
21
8,54
2
16
5,64
5
38
4,18
7
4,
288,
791
23
2,56
7
4,
056,
224
13
5200
0800
Sew
er P
ump
Stat
ion
Safe
ty Im
prov
emen
ts1,
000,
000
-
59,7
23
59,7
23
940,
277
190,
718
749,
559
1372
0008
00La
ke G
asto
n W
TP M
isce
llane
ous M
odifi
catio
ns2,
370,
000
78
,214
39
8,89
4
47
7,10
8
1,
892,
892
29
3,50
9
1,
599,
384
13
8120
0800
Mili
tary
Hig
hway
36"
Wat
er M
ain
3,95
0,00
0
254,
623
9,94
0
26
4,56
3
3,
685,
437
13
6,09
0
3,
549,
347
13
8200
0800
Lake
Gas
ton
Wat
er T
reat
men
t Pla
nt E
xpan
sion
1,00
0,00
0
-
10
7,82
7
10
7,82
7
89
2,17
3
11
,981
88
0,19
2
13
9120
0800
Raw
Wat
er T
rans
mis
sion
Mai
n15
,575
,000
14,2
77,0
48
24,6
58
14,3
01,7
07
1,27
3,29
3
799,
434
473,
859
1401
3008
00M
urra
y D
r/Whi
ttam
ore
Rd
Wat
er6,
000,
000
4,
563,
077
-
4,56
3,07
7
1,43
6,92
3
-
1,
436,
923
14
2170
0800
Sew
er R
enew
al:
Wes
twoo
d A
ve. a
nd R
edst
art A
ve.
1,10
6,00
0
-
92
,354
92
,354
1,
013,
646
87
,578
92
6,06
8
14
5120
0800
Sout
h N
orfo
lk Im
prov
emen
ts2,
850,
000
84
9,30
5
-
849,
305
2,00
0,69
5
109,
798
1,89
0,89
6
1471
2008
00W
este
rn B
ranc
h In
terc
onne
ct to
Lak
e G
asto
n W
TP8,
298,
000
1,
638,
033
10
0,80
0
1,
738,
833
6,
559,
167
55
7,45
0
6,
001,
717
15
0121
0800
Labo
rato
ry E
quip
men
t Rep
lace
men
t12
3,70
8
12
3,70
8
-
123,
708
-
-
-
15
1128
0800
Uns
erve
d A
reas
- M
anni
ng, W
ampl
er &
Vic
o3,
395,
186
12
7,95
1
11
4,70
9
24
2,65
9
3,
152,
527
1,
823,
728
1,
328,
799
15
1129
0800
Uns
erve
d A
reas
- B
attle
woo
d M
eado
ws
6,65
4,77
4
279,
086
191,
868
470,
954
6,18
3,82
0
176,
329
6,00
7,49
2
1531
2008
00R
epla
ce M
eter
Rea
ding
Equ
ip
1,39
9,62
3
51,1
98
-
51
,198
1,
348,
426
-
1,34
8,42
6
1541
2008
0030
" R
aw W
ater
Mai
n4,
489,
232
1,
730,
895
28
8,67
1
2,
019,
566
2,
469,
666
59
6,00
8
1,
873,
658
17
1120
0800
Wat
er R
enew
al -
Wat
er L
ine
Upg
rade
1,73
3,52
4
-
14
5,57
6
14
5,57
6
1,
587,
948
-
1,58
7,94
8
1711
2008
00W
ater
Ren
ewal
- W
ater
Lin
e U
pgra
de29
7,03
4
29
7,03
4
-
297,
034
-
-
-
*
Tota
l pro
ject
exp
ense
s and
enc
umbr
ance
s14
3,76
3,04
7
51,6
83,7
77
9,
273,
635
60
,957
,412
82,8
05,6
35
8,
487,
017
74
,318
,618
Less
com
plet
ed p
roje
cts
12,2
19,1
95
12
,219
,195
C
onst
ruct
ion
in p
rogr
ess -
con
stru
ctio
n13
1,54
3,85
2
48,7
38,2
17
C
apita
lized
inte
rest
exp
ense
s7,
933,
728
2,
011,
572
9,
945,
300
Le
ss c
lose
d ca
pita
lized
inte
rest
1,18
9,68
2
Con
stru
ctio
n in
pro
gres
s - c
apita
lized
inte
rest
8,75
5,61
8
Tota
l con
stru
ctio
n in
pro
gres
s$
57,4
93,8
35
* C
ompl
eted
Pro
ject
s
Exp
ense
s
167

This page intentionally left blank
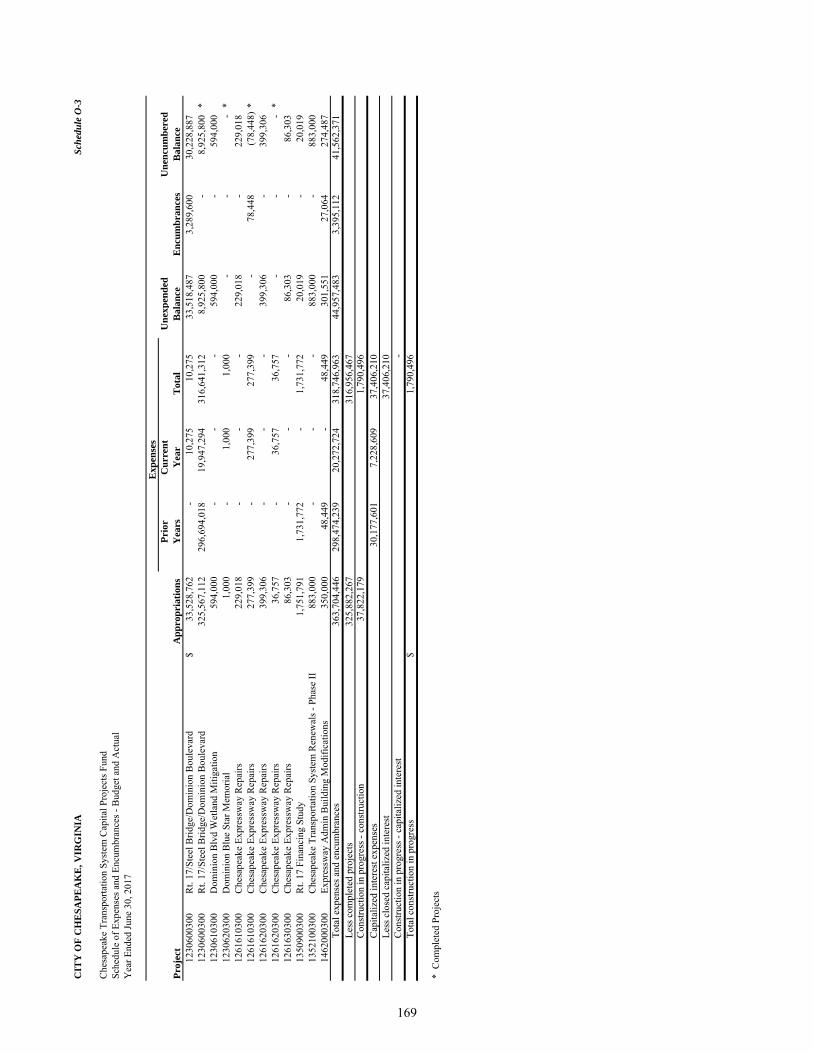
CIT
Y O
F C
HE
SAPE
AK
E, V
IRG
INIA
Sche
dule
O-3
Che
sape
ake
Tran
spor
tatio
n Sy
stem
Cap
ital P
roje
cts F
und
Sche
dule
of E
xpen
ses a
nd E
ncum
bran
ces -
Bud
get a
nd A
ctua
lY
ear E
nded
June
30,
201
7
Proj
ect
App
ropr
iatio
nsPr
ior
Yea
rsC
urre
ntY
ear
Tot
alU
nexp
ende
d B
alan
ceE
ncum
bran
ces
Une
ncum
bere
d B
alan
ce12
3060
0300
Rt.
17/S
teel
Brid
ge/D
omin
ion
Bou
leva
rd$
33,5
28,7
62
-
10,2
75
10,2
75
33,5
18,4
87
3,
289,
600
30
,228
,887
1230
6003
00R
t. 17
/Ste
el B
ridge
/Dom
inio
n B
oule
vard
325,
567,
112
29
6,69
4,01
8
19
,947
,294
316,
641,
312
8,92
5,80
0
-
8,
925,
800
*
1230
6103
00D
omin
ion
Blv
d W
etla
nd M
itiga
tion
594,
000
-
-
-
594,
000
-
59
4,00
0
12
3062
0300
Dom
inio
n B
lue
Star
Mem
oria
l1,
000
-
1,00
0
1,00
0
-
-
-
*
1261
6103
00C
hesa
peak
e Ex
pres
sway
Rep
airs
229,
018
-
-
-
229,
018
-
22
9,01
8
12
6161
0300
Che
sape
ake
Expr
essw
ay R
epai
rs27
7,39
9
-
27
7,39
9
27
7,39
9
-
78,4
48
(78,
448)
*12
6162
0300
Che
sape
ake
Expr
essw
ay R
epai
rs39
9,30
6
-
-
-
39
9,30
6
-
399,
306
1261
6203
00C
hesa
peak
e Ex
pres
sway
Rep
airs
36,7
57
-
36,7
57
36,7
57
-
-
-
*
1261
6303
00C
hesa
peak
e Ex
pres
sway
Rep
airs
86,3
03
-
-
-
86,3
03
-
86
,303
13
5090
0300
Rt.
17 F
inan
cing
Stu
dy1,
751,
791
1,73
1,77
2
-
1,
731,
772
20
,019
-
20,0
19
1352
1003
00C
hesa
peak
e Tr
ansp
orta
tion
Syst
em R
enew
als -
Pha
se II
883,
000
-
-
-
883,
000
-
88
3,00
0
14
6200
0300
Expr
essw
ay A
dmin
Bui
ldin
g M
odifi
catio
ns35
0,00
0
48,4
49
-
48
,449
30
1,55
1
27
,064
27
4,48
7
To
tal e
xpen
ses a
nd e
ncum
bran
ces
363,
704,
446
298,
474,
239
20
,272
,724
318,
746,
963
44,9
57,4
83
3,
395,
112
41,5
62,3
71
Le
ss c
ompl
eted
pro
ject
s32
5,88
2,26
7
316,
956,
467
Con
stru
ctio
n in
pro
gres
s - c
onst
ruct
ion
37,8
22,1
79
1,79
0,49
6
Cap
italiz
ed in
tere
st e
xpen
ses
30,1
77,6
01
7,
228,
609
37
,406
,210
Less
clo
sed
capi
taliz
ed in
tere
st37
,406
,210
Con
stru
ctio
n in
pro
gres
s - c
apita
lized
inte
rest
-
To
tal c
onst
ruct
ion
in p
rogr
ess
$1,
790,
496
* C
ompl
eted
Pro
ject
s
Exp
ense
s
169
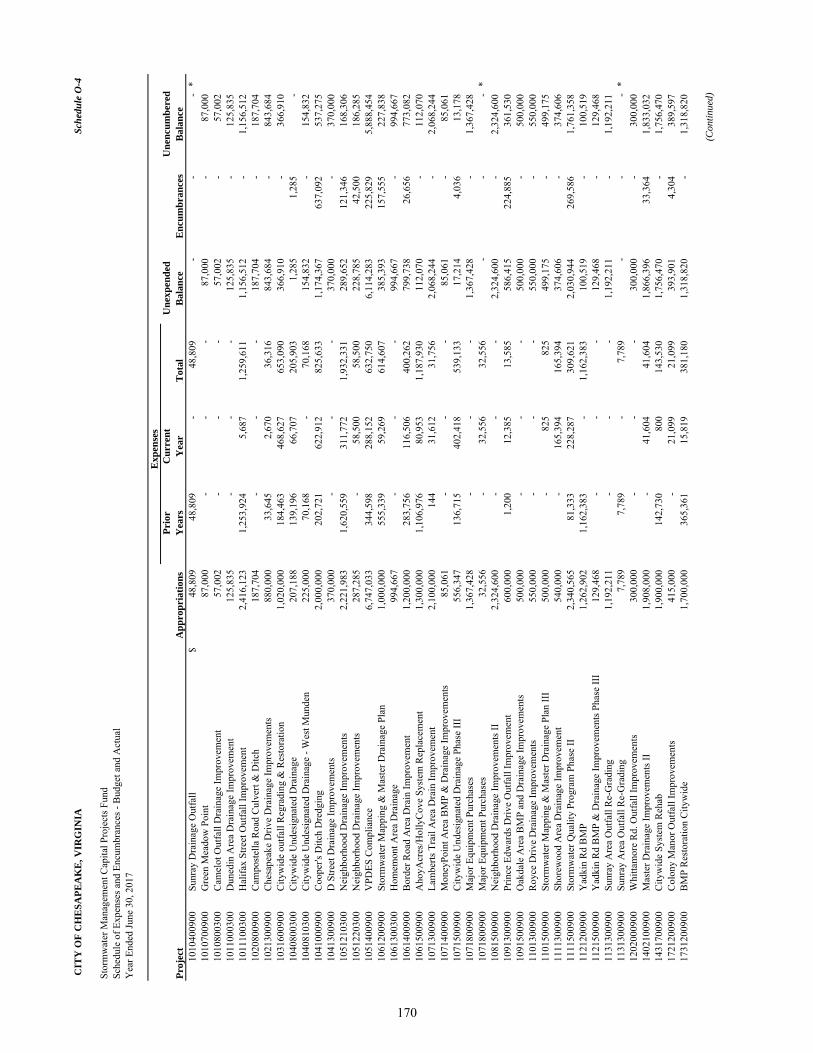
CIT
Y O
F C
HE
SAPE
AK
E, V
IRG
INIA
Sche
dule
O-4
Stor
mw
ater
Man
agem
ent C
apita
l Pro
ject
s Fun
dSc
hedu
le o
f Exp
ense
s and
Enc
umbr
ance
s - B
udge
t and
Act
ual
Yea
r End
ed Ju
ne 3
0, 2
017
Proj
ect
App
ropr
iatio
nsPr
ior
Yea
rsC
urre
ntY
ear
Tot
alU
nexp
ende
d B
alan
ceE
ncum
bran
ces
Une
ncum
bere
d B
alan
ce10
1040
0900
Sunr
ay D
rain
age
Out
fall
$48
,809
48,8
09
-
48
,809
-
-
-
*10
1070
0900
Gre
en M
eado
w P
oint
87,0
00
-
-
-
87,0
00
-
87
,000
10
1080
0300
Cam
elot
Out
fall
Dra
inag
e Im
prov
emen
t57
,002
-
-
-
57
,002
-
57,0
02
1011
0003
00D
uned
in A
rea
Dra
inag
e Im
prov
emen
t12
5,83
5
-
-
-
125,
835
-
12
5,83
5
10
1110
0300
Hal
ifax
Stre
et O
utfa
ll Im
prov
emen
t2,
416,
123
1,
253,
924
5,
687
1,
259,
611
1,
156,
512
-
1,15
6,51
2
1020
8009
00C
ampo
stel
la R
oad
Cul
vert
& D
itch
187,
704
-
-
-
18
7,70
4
-
187,
704
1021
3009
00C
hesa
peak
e D
rive
Dra
inag
e Im
prov
emen
ts88
0,00
0
33
,645
2,
670
36
,316
84
3,68
4
-
843,
684
1031
6009
00C
ityw
ide
outfa
ll R
egra
ding
& R
esto
ratio
n1,
020,
000
18
4,46
3
46
8,62
7
65
3,09
0
36
6,91
0
-
366,
910
1040
8003
00C
ityw
ide
Und
esig
nate
d D
rain
age
207,
188
139,
196
66,7
07
205,
903
1,28
5
1,28
5
-
10
4081
0300
City
wid
e U
ndes
igna
ted
Dra
inag
e - W
est M
unde
n22
5,00
0
70
,168
-
70,1
68
154,
832
-
15
4,83
2
10
4100
0900
Coo
per's
Ditc
h D
redg
ing
2,00
0,00
0
202,
721
622,
912
825,
633
1,17
4,36
7
637,
092
537,
275
1041
3009
00D
Stre
et D
rain
age
Impr
ovem
ents
370,
000
-
-
-
37
0,00
0
-
370,
000
1051
2103
00N
eigh
borh
ood
Dra
inag
e Im
prov
emen
ts2,
221,
983
1,
620,
559
31
1,77
2
1,
932,
331
28
9,65
2
12
1,34
6
16
8,30
6
10
5122
0300
Nei
ghbo
rhoo
d D
rain
age
Impr
ovem
ents
287,
285
-
58
,500
58
,500
22
8,78
5
42
,500
18
6,28
5
10
5140
0900
VPD
ES C
ompl
ianc
e6,
747,
033
34
4,59
8
28
8,15
2
63
2,75
0
6,
114,
283
22
5,82
9
5,
888,
454
10
6120
0900
Stor
mw
ater
Map
ping
& M
aste
r Dra
inag
e Pl
an1,
000,
000
55
5,33
9
59
,269
61
4,60
7
38
5,39
3
15
7,55
5
22
7,83
8
10
6130
0300
Hom
emon
t Are
a D
rain
age
994,
667
-
-
-
99
4,66
7
-
994,
667
1061
4009
00B
orde
r Roa
d A
rea
Dra
in Im
prov
emen
t1,
200,
000
28
3,75
6
11
6,50
6
40
0,26
2
79
9,73
8
26
,656
77
3,08
2
10
6150
0900
Aho
yAcr
es/H
olly
Cov
e Sy
stem
Rep
lace
men
t1,
300,
000
1,
106,
976
80
,953
1,
187,
930
11
2,07
0
-
112,
070
1071
3009
00La
mbe
rts T
rail
Are
a D
rain
Impr
ovem
ent
2,10
0,00
0
144
31,6
12
31,7
56
2,06
8,24
4
-
2,
068,
244
10
7140
0900
Mon
eyPo
int A
rea
BM
P &
Dra
inag
e Im
prov
emen
ts85
,061
-
-
-
85
,061
-
85,0
61
1071
5009
00C
ityw
ide
Und
esig
nate
d D
rain
age
Phas
e II
I55
6,34
7
13
6,71
5
40
2,41
8
53
9,13
3
17
,214
4,
036
13
,178
10
7180
0900
Maj
or E
quip
men
t Pur
chas
es1,
367,
428
-
-
-
1,36
7,42
8
-
1,
367,
428
10
7180
0900
Maj
or E
quip
men
t Pur
chas
es32
,556
-
32
,556
32
,556
-
-
-
*10
8150
0900
Nei
ghbo
rhoo
d D
rain
age
Impr
ovem
ents
II2,
324,
600
-
-
-
2,32
4,60
0
-
2,
324,
600
10
9130
0900
Prin
ce E
dwar
ds D
rive
Out
fall
Impr
ovem
ent
600,
000
1,20
0
12,3
85
13,5
85
586,
415
224,
885
361,
530
1091
5009
00O
akda
le A
rea
BM
P an
d D
rain
age
Impr
ovem
ents
500,
000
-
-
-
50
0,00
0
-
500,
000
1101
3009
00R
oyce
Driv
e D
rain
age
Impr
ovem
ents
550,
000
-
-
-
55
0,00
0
-
550,
000
1101
5009
00St
orm
wat
er M
appi
ng &
Mas
ter D
rain
age
Plan
III
500,
000
-
82
5
82
5
49
9,17
5
-
499,
175
1111
3009
00Sh
orew
ood
Are
a D
rain
age
Impr
ovem
ent
540,
000
-
16
5,39
4
16
5,39
4
37
4,60
6
-
374,
606
1111
5009
00St
orm
wat
er Q
ualit
y Pr
ogra
m P
hase
II2,
340,
565
81
,333
22
8,28
7
30
9,62
1
2,
030,
944
26
9,58
6
1,
761,
358
11
2120
0900
Yad
kin
Rd
BM
P1,
262,
902
1,
162,
383
-
1,16
2,38
3
100,
519
-
10
0,51
9
11
2150
0900
Yad
kin
Rd
BM
P &
Dra
inag
e Im
prov
emen
ts P
hase
III
129,
468
-
-
-
12
9,46
8
-
129,
468
1131
3009
00Su
nray
Are
a O
utfa
ll R
e-G
radi
ng1,
192,
211
-
-
-
1,19
2,21
1
-
1,
192,
211
11
3130
0900
Sunr
ay A
rea
Out
fall
Re-
Gra
ding
7,78
9
7,78
9
-
7,
789
-
-
-
*12
0200
0900
Whi
ttam
ore
Rd.
Out
fall
Impr
ovem
ents
300,
000
-
-
-
30
0,00
0
-
300,
000
1402
1009
00M
aste
r Dra
inag
e Im
prov
emen
ts II
1,90
8,00
0
-
41
,604
41
,604
1,
866,
396
33
,364
1,
833,
032
14
3170
0900
City
wid
e Sy
stem
Reh
ab1,
900,
000
14
2,73
0
80
0
14
3,53
0
1,
756,
470
-
1,75
6,47
0
1721
2009
00C
olon
y M
anor
Out
fall
Impr
ovem
ents
415,
000
-
21
,099
21
,099
39
3,90
1
4,
304
38
9,59
7
17
3120
0900
BM
P R
esto
ratio
n C
ityw
ide
1,70
0,00
0
365,
361
15,8
19
381,
180
1,31
8,82
0
-
1,
318,
820
(Con
tinue
d)
Exp
ense
s
170
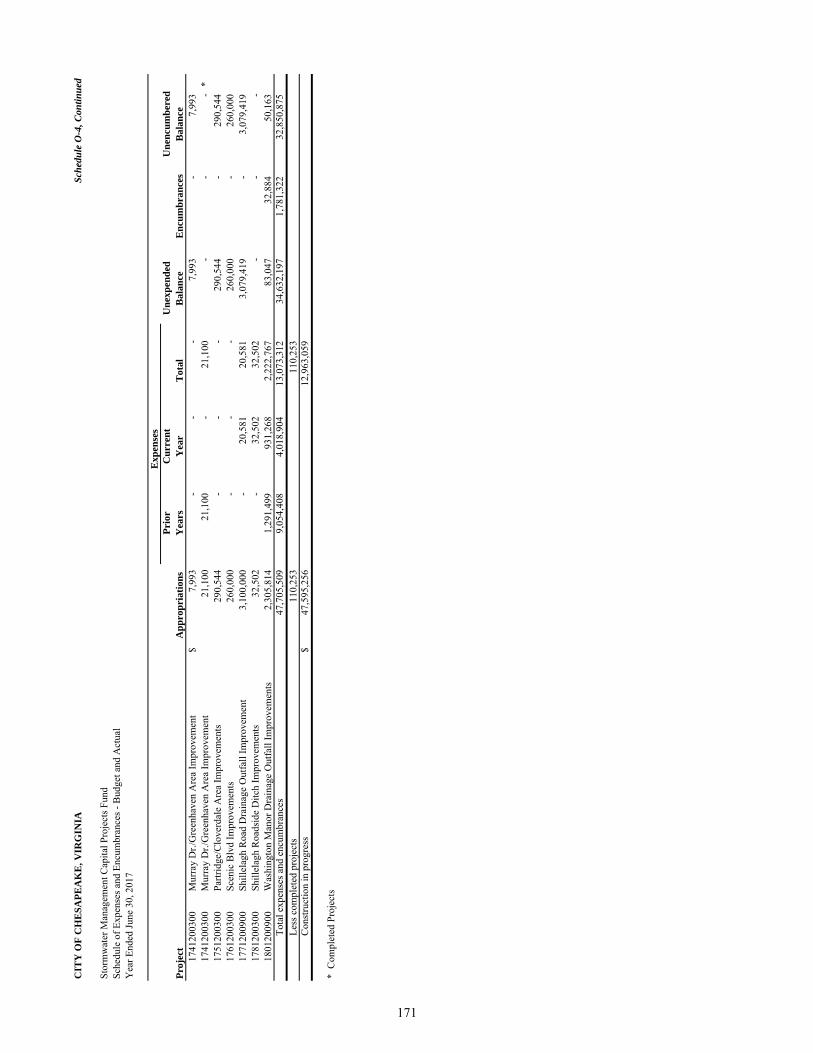
CIT
Y O
F C
HE
SAPE
AK
E, V
IRG
INIA
Sche
dule
O-4
, Con
tinue
d
Stor
mw
ater
Man
agem
ent C
apita
l Pro
ject
s Fun
dSc
hedu
le o
f Exp
ense
s and
Enc
umbr
ance
s - B
udge
t and
Act
ual
Yea
r End
ed Ju
ne 3
0, 2
017
Proj
ect
App
ropr
iatio
nsPr
ior
Yea
rsC
urre
ntY
ear
Tot
alU
nexp
ende
d B
alan
ceE
ncum
bran
ces
Une
ncum
bere
d B
alan
ce17
4120
0300
Mur
ray
Dr./
Gre
enha
ven
Are
a Im
prov
emen
t$
7,99
3
-
-
-
7,
993
-
7,99
3
1741
2003
00M
urra
y D
r./G
reen
have
n A
rea
Impr
ovem
ent
21,1
00
21
,100
-
21,1
00
-
-
-
*
1751
2003
00Pa
rtrid
ge/C
love
rdal
e A
rea
Impr
ovem
ents
290,
544
-
-
-
29
0,54
4
-
290,
544
1761
2003
00Sc
enic
Blv
d Im
prov
emen
ts26
0,00
0
-
-
-
260,
000
-
26
0,00
0
17
7120
0900
Shill
elag
h R
oad
Dra
inag
e O
utfa
ll Im
prov
emen
t3,
100,
000
-
20,5
81
20,5
81
3,07
9,41
9
-
3,
079,
419
17
8120
0300
Shill
elag
h R
oads
ide
Ditc
h Im
prov
emen
ts32
,502
-
32
,502
32
,502
-
-
-
1801
2009
00W
ashi
ngto
n M
anor
Dra
inag
e O
utfa
ll Im
prov
emen
ts2,
305,
814
1,
291,
499
93
1,26
8
2,
222,
767
83
,047
32
,884
50
,163
To
tal e
xpen
ses a
nd e
ncum
bran
ces
47,7
05,5
09
9,05
4,40
8
4,
018,
904
13,0
73,3
12
34
,632
,197
1,78
1,32
2
32
,850
,875
Less
com
plet
ed p
roje
cts
110,
253
110,
253
Con
stru
ctio
n in
pro
gres
s$
47,5
95,2
56
12,9
63,0
59
* C
ompl
eted
Pro
ject
s
Exp
ense
s
171

This page intentionally left blank
Special Revenue and Permanent Funds Special Revenue Funds:
Tax Increment Financing Funds – To account for incremental tax revenues generated in designated commercial areas of the City, Greenbrier and South Norfolk, and to fund improvements in the relevant areas through the use of those revenues.
Virginia Public Assistance Fund – To account for the rendering of economic aid to qualifying citizens.
Integrated Behavioral Healthcare Fund – To account for revenues and expenditures to provide services for mental health, intellectual disability and substance abuse programs.
Conference Center Fund – To account for the operation of the City’s Conference Center and the City’s Conventions and Tourism programs.
Juvenile Services Fund – To account for revenues and expenditures related to the operation of a regional detention facility.
Interagency Consortium Fund – To account for revenues and expenditures of the delivery system for severely emotionally and/or behaviorally disturbed children. E-911 Operations Fund – To account for revenues and expenditures related to the emergency call center. Fee Supported Activities Fund – To account for revenues and expenditures related to fee supported activities. Grants Fund – To account for revenues and expenditures related to specific grant activities.
Community Development Fund – To account for revenues and expenditures under the Community Development Block Grant Program. Open Space Agriculture Preservation Fund – To account for the revenues and expenditures related to the purchase of development rights from willing sellers who own qualified agriculture land or open space. Proffers Fund – To account for cash proffers provided to the City from developers for specific purposes.
Housing Trust Fund – To account for revenues and expenditures to provide services for temporary and permanent housing. CSB of Chesapeake, Inc. – To account for the issuance of debt and the rental of a community services facility for the Community Services Board.
Permanent Funds:
Poor Fund and Carney Fund – To account for the investment of funds donated to the City. The expenditures of the income earned by these endowments are to be used for education.
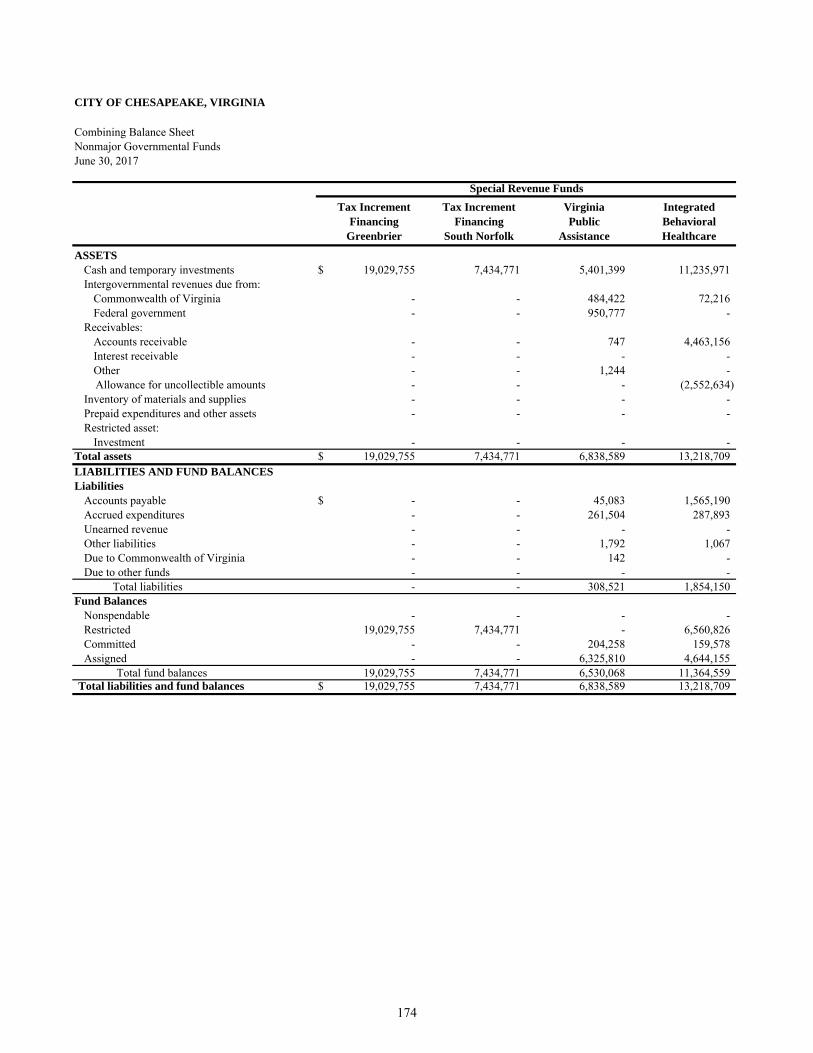
CITY OF CHESAPEAKE, VIRGINIA
Combining Balance SheetNonmajor Governmental FundsJune 30, 2017
Tax Increment Financing
Greenbrier
Tax Increment Financing
South Norfolk
Virginia Public
Assistance
Integrated Behavioral Healthcare
ASSETSCash and temporary investments $ 19,029,755 7,434,771 5,401,399 11,235,971 Intergovernmental revenues due from:
Commonwealth of Virginia - - 484,422 72,216 Federal government - - 950,777 -
Receivables:Accounts receivable - - 747 4,463,156 Interest receivable - - - - Other - - 1,244 -
Allowance for uncollectible amounts - - - (2,552,634) Inventory of materials and supplies - - - - Prepaid expenditures and other assets - - - - Restricted asset:
Investment - - - - Total assets $ 19,029,755 7,434,771 6,838,589 13,218,709 LIABILITIES AND FUND BALANCESLiabilities
Accounts payable $ - - 45,083 1,565,190 Accrued expenditures - - 261,504 287,893 Unearned revenue - - - - Other liabilities - - 1,792 1,067 Due to Commonwealth of Virginia - - 142 - Due to other funds - - - -
Total liabilities - - 308,521 1,854,150 Fund Balances
Nonspendable - - - - Restricted 19,029,755 7,434,771 - 6,560,826 Committed - - 204,258 159,578 Assigned - - 6,325,810 4,644,155
Total fund balances 19,029,755 7,434,771 6,530,068 11,364,559 Total liabilities and fund balances $ 19,029,755 7,434,771 6,838,589 13,218,709
Special Revenue Funds
174
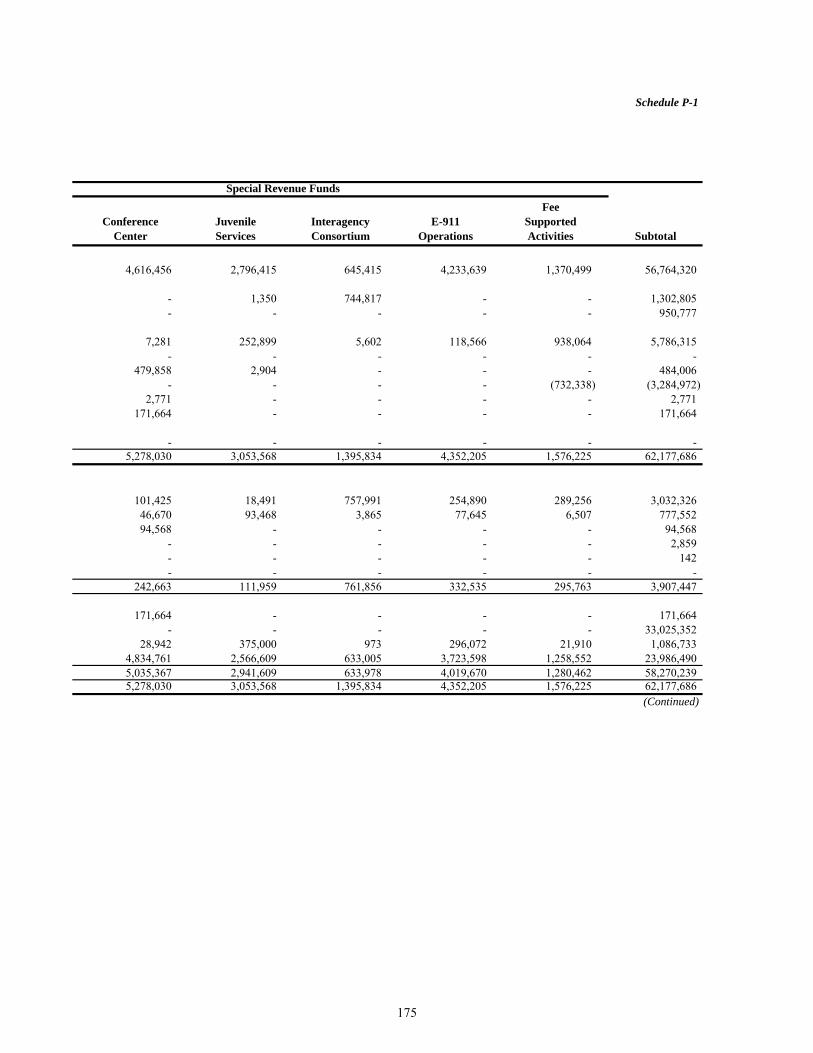
Schedule P-1
Conference Center
JuvenileServices
Interagency Consortium
E-911Operations
Fee Supported Activities Subtotal
4,616,456 2,796,415 645,415 4,233,639 1,370,499 56,764,320
- 1,350 744,817 - - 1,302,805 - - - - - 950,777
7,281 252,899 5,602 118,566 938,064 5,786,315 - - - - - -
479,858 2,904 - - - 484,006 - - - - (732,338) (3,284,972)
2,771 - - - - 2,771 171,664 - - - - 171,664
- - - - - - 5,278,030 3,053,568 1,395,834 4,352,205 1,576,225 62,177,686
101,425 18,491 757,991 254,890 289,256 3,032,326 46,670 93,468 3,865 77,645 6,507 777,552 94,568 - - - - 94,568
- - - - - 2,859 - - - - - 142 - - - - - -
242,663 111,959 761,856 332,535 295,763 3,907,447
171,664 - - - - 171,664 - - - - - 33,025,352
28,942 375,000 973 296,072 21,910 1,086,733 4,834,761 2,566,609 633,005 3,723,598 1,258,552 23,986,490 5,035,367 2,941,609 633,978 4,019,670 1,280,462 58,270,239 5,278,030 3,053,568 1,395,834 4,352,205 1,576,225 62,177,686
(Continued)
Special Revenue Funds
175
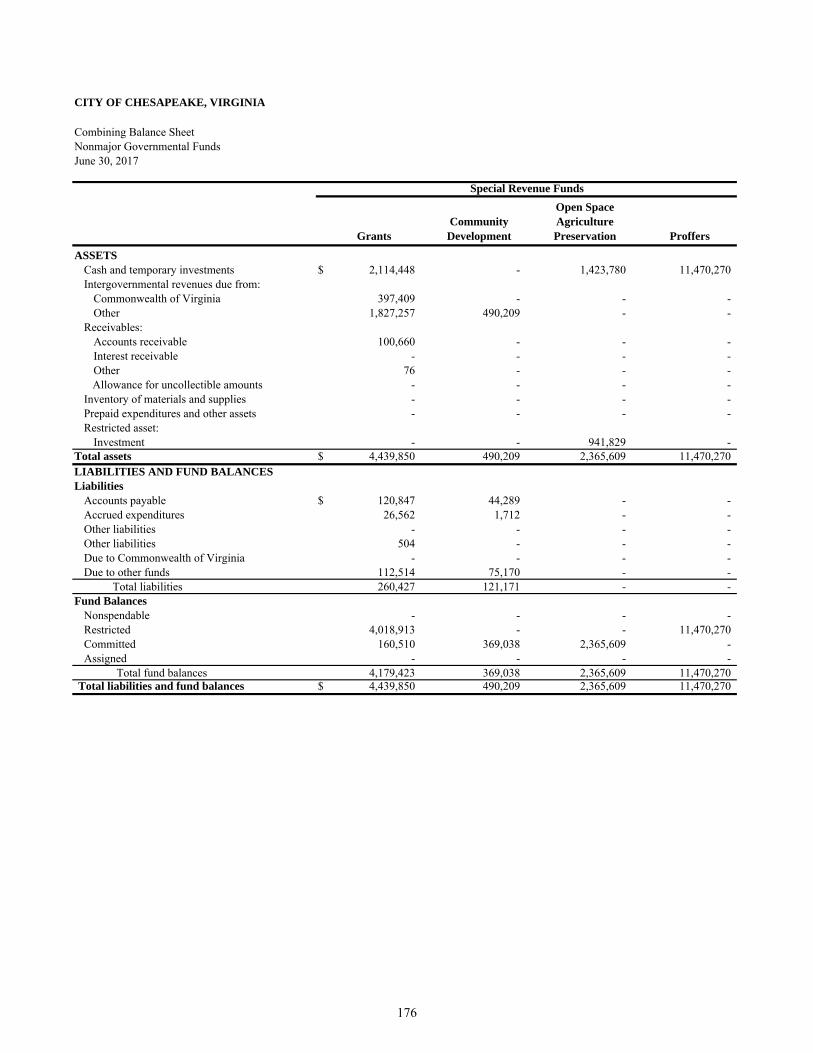
CITY OF CHESAPEAKE, VIRGINIA
Combining Balance SheetNonmajor Governmental FundsJune 30, 2017
GrantsCommunity
Development
Open Space Agriculture Preservation Proffers
ASSETSCash and temporary investments $ 2,114,448 - 1,423,780 11,470,270 Intergovernmental revenues due from:
Commonwealth of Virginia 397,409 - - - Other 1,827,257 490,209 - -
Receivables:Accounts receivable 100,660 - - - Interest receivable - - - - Other 76 - - -
Allowance for uncollectible amounts - - - - Inventory of materials and supplies - - - - Prepaid expenditures and other assets - - - - Restricted asset:
Investment - - 941,829 - Total assets $ 4,439,850 490,209 2,365,609 11,470,270 LIABILITIES AND FUND BALANCESLiabilities
Accounts payable $ 120,847 44,289 - - Accrued expenditures 26,562 1,712 - - Other liabilities - - - - Other liabilities 504 - - - Due to Commonwealth of Virginia - - - - Due to other funds 112,514 75,170 - -
Total liabilities 260,427 121,171 - - Fund Balances
Nonspendable - - - - Restricted 4,018,913 - - 11,470,270 Committed 160,510 369,038 2,365,609 - Assigned - - - -
Total fund balances 4,179,423 369,038 2,365,609 11,470,270 Total liabilities and fund balances $ 4,439,850 490,209 2,365,609 11,470,270
Special Revenue Funds
176
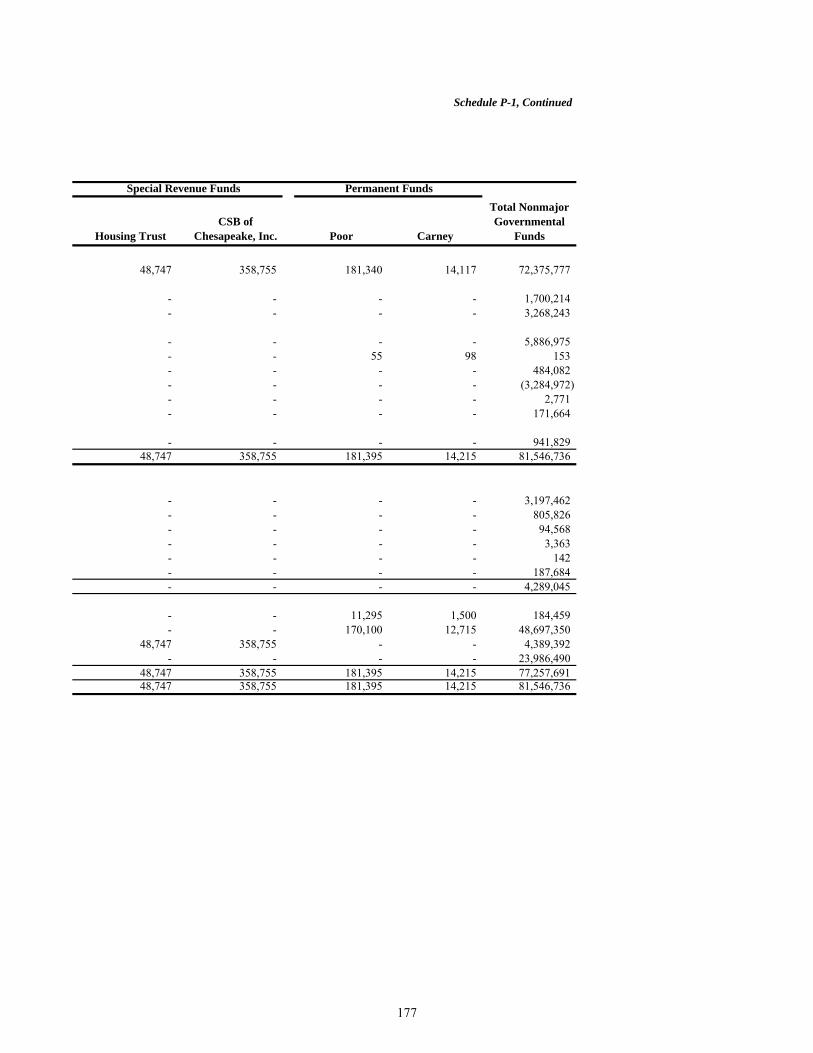
Schedule P-1, Continued
Housing Trust CSB of
Chesapeake, Inc. Poor Carney
Total Nonmajor Governmental
Funds
48,747 358,755 181,340 14,117 72,375,777
- - - - 1,700,214 - - - - 3,268,243
- - - - 5,886,975 - - 55 98 153 - - - - 484,082 - - - - (3,284,972) - - - - 2,771 - - - - 171,664
- - - - 941,829 48,747 358,755 181,395 14,215 81,546,736
- - - - 3,197,462 - - - - 805,826 - - - - 94,568 - - - - 3,363 - - - - 142 - - - - 187,684 - - - - 4,289,045
- - 11,295 1,500 184,459 - - 170,100 12,715 48,697,350
48,747 358,755 - - 4,389,392 - - - - 23,986,490
48,747 358,755 181,395 14,215 77,257,691 48,747 358,755 181,395 14,215 81,546,736
Permanent FundsSpecial Revenue Funds
177
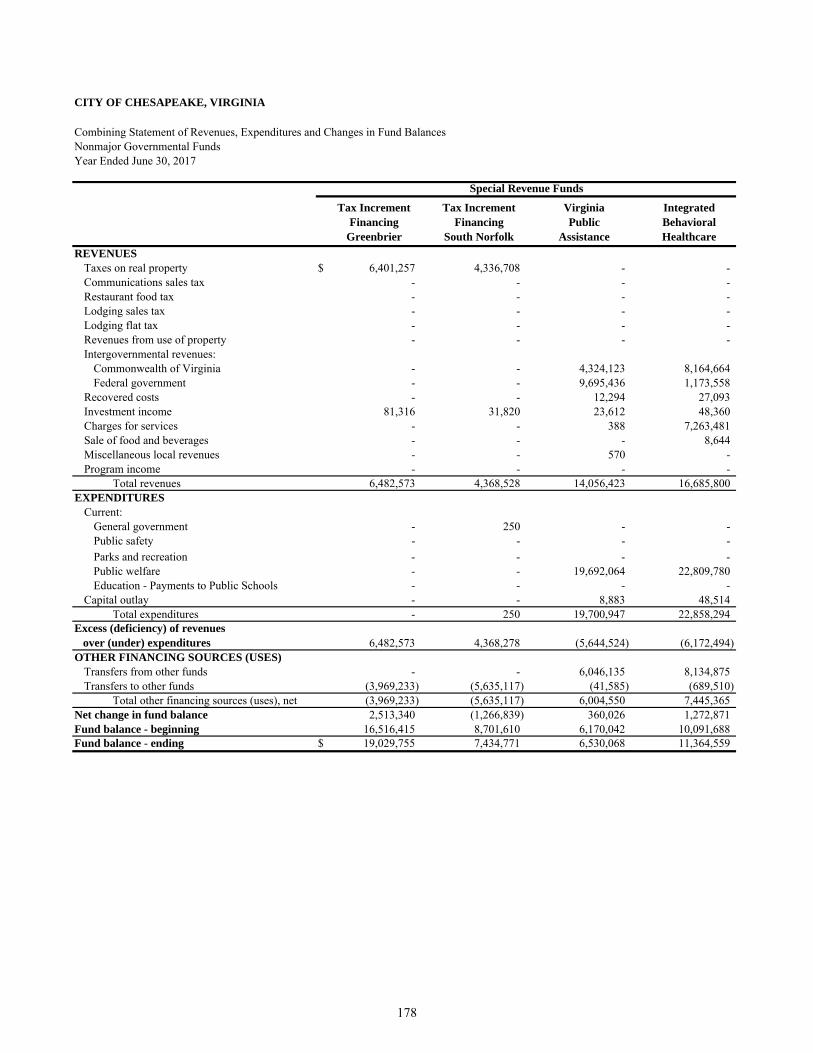
CITY OF CHESAPEAKE, VIRGINIA
Combining Statement of Revenues, Expenditures and Changes in Fund BalancesNonmajor Governmental FundsYear Ended June 30, 2017
Tax Increment Financing
Greenbrier
Tax Increment Financing
South Norfolk
Virginia Public
Assistance
Integrated Behavioral Healthcare
REVENUESTaxes on real property $ 6,401,257 4,336,708 - - Communications sales tax - - - - Restaurant food tax - - - - Lodging sales tax - - - - Lodging flat tax - - - - Revenues from use of property - - - - Intergovernmental revenues:
Commonwealth of Virginia - - 4,324,123 8,164,664 Federal government - - 9,695,436 1,173,558
Recovered costs - - 12,294 27,093 Investment income 81,316 31,820 23,612 48,360 Charges for services - - 388 7,263,481 Sale of food and beverages - - - 8,644 Miscellaneous local revenues - - 570 - Program income - - - -
Total revenues 6,482,573 4,368,528 14,056,423 16,685,800 EXPENDITURES
Current:General government - 250 - - Public safety - - - - Parks and recreation - - - - Public welfare - - 19,692,064 22,809,780 Education - Payments to Public Schools - - - -
Capital outlay - - 8,883 48,514 Total expenditures - 250 19,700,947 22,858,294
Excess (deficiency) of revenues over (under) expenditures 6,482,573 4,368,278 (5,644,524) (6,172,494) OTHER FINANCING SOURCES (USES)
Transfers from other funds - - 6,046,135 8,134,875 Transfers to other funds (3,969,233) (5,635,117) (41,585) (689,510)
Total other financing sources (uses), net (3,969,233) (5,635,117) 6,004,550 7,445,365 Net change in fund balance 2,513,340 (1,266,839) 360,026 1,272,871 Fund balance - beginning 16,516,415 8,701,610 6,170,042 10,091,688 Fund balance - ending $ 19,029,755 7,434,771 6,530,068 11,364,559
Special Revenue Funds
178
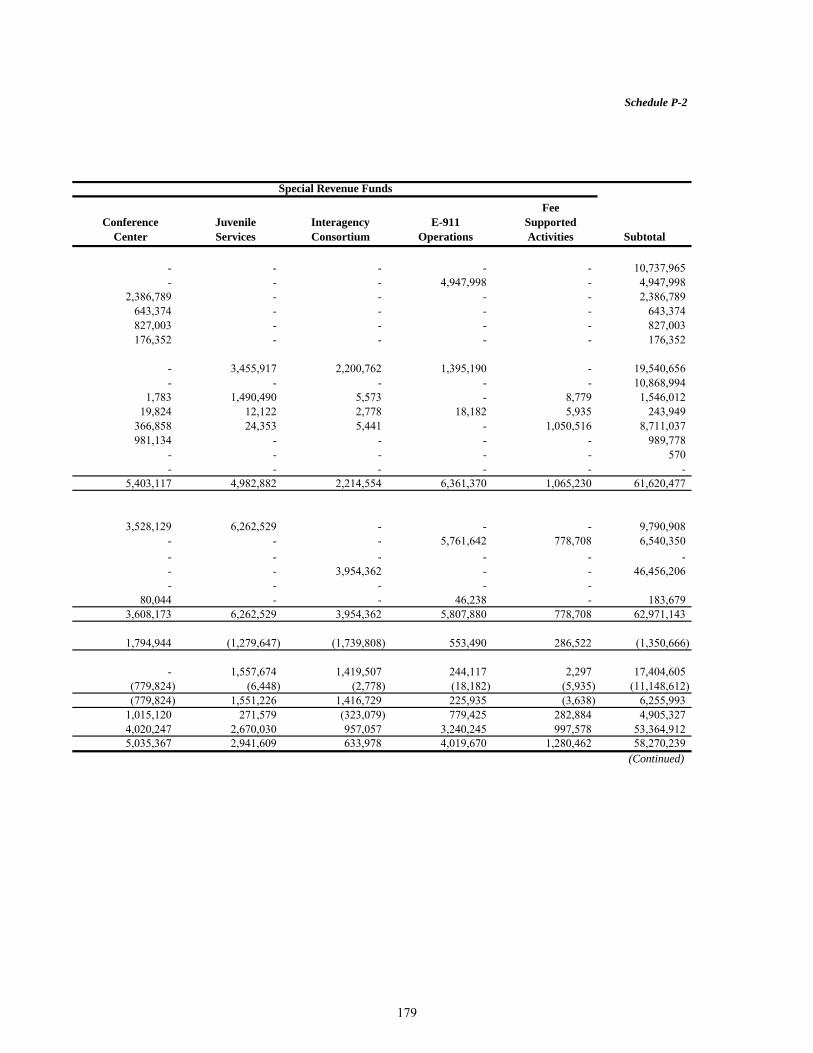
Schedule P-2
Conference Center
JuvenileServices
Interagency Consortium
E-911Operations
Fee Supported Activities Subtotal
- - - - - 10,737,965 - - - 4,947,998 - 4,947,998
2,386,789 - - - - 2,386,789 643,374 - - - - 643,374 827,003 - - - - 827,003 176,352 - - - - 176,352
- 3,455,917 2,200,762 1,395,190 - 19,540,656 - - - - - 10,868,994
1,783 1,490,490 5,573 - 8,779 1,546,012 19,824 12,122 2,778 18,182 5,935 243,949
366,858 24,353 5,441 - 1,050,516 8,711,037 981,134 - - - - 989,778
- - - - - 570 - - - - - -
5,403,117 4,982,882 2,214,554 6,361,370 1,065,230 61,620,477
3,528,129 6,262,529 - - - 9,790,908 - - - 5,761,642 778,708 6,540,350 - - - - - - - - 3,954,362 - - 46,456,206 - - - - -
80,044 - - 46,238 - 183,679 3,608,173 6,262,529 3,954,362 5,807,880 778,708 62,971,143
1,794,944 (1,279,647) (1,739,808) 553,490 286,522 (1,350,666)
- 1,557,674 1,419,507 244,117 2,297 17,404,605 (779,824) (6,448) (2,778) (18,182) (5,935) (11,148,612) (779,824) 1,551,226 1,416,729 225,935 (3,638) 6,255,993
1,015,120 271,579 (323,079) 779,425 282,884 4,905,327 4,020,247 2,670,030 957,057 3,240,245 997,578 53,364,912 5,035,367 2,941,609 633,978 4,019,670 1,280,462 58,270,239
(Continued)
Special Revenue Funds
179
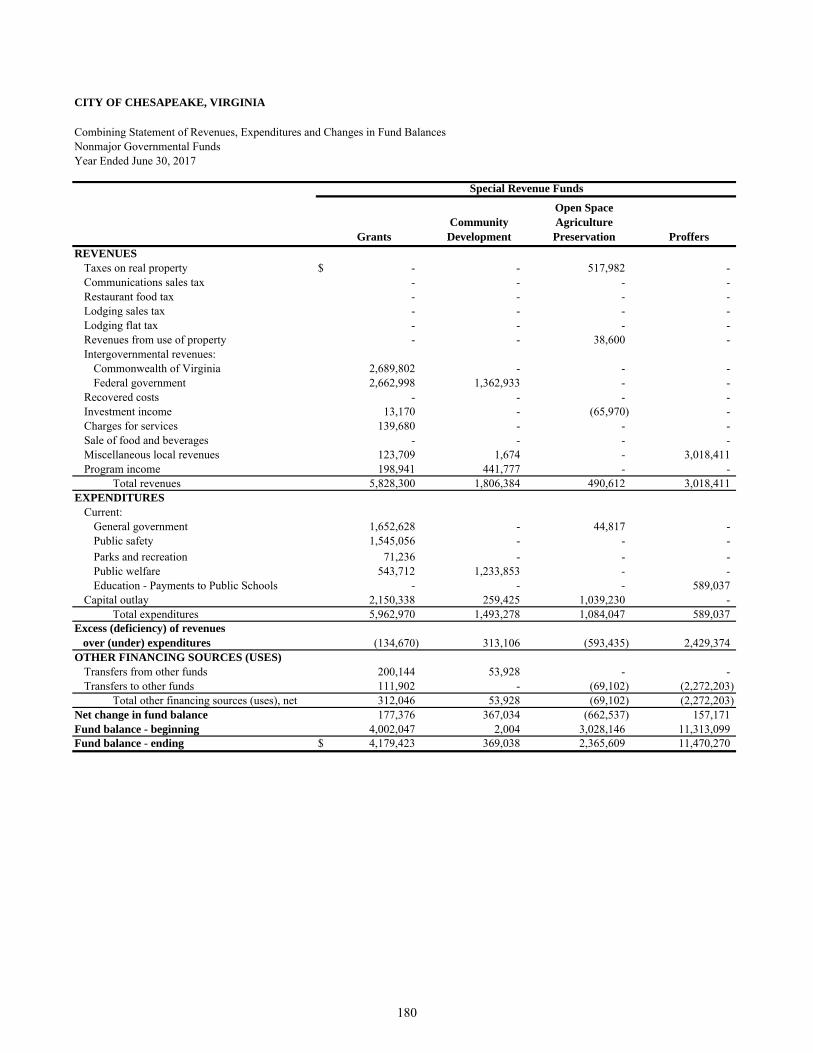
CITY OF CHESAPEAKE, VIRGINIA
Combining Statement of Revenues, Expenditures and Changes in Fund BalancesNonmajor Governmental FundsYear Ended June 30, 2017
GrantsCommunity
Development
Open Space Agriculture Preservation Proffers
REVENUESTaxes on real property $ - - 517,982 - Communications sales tax - - - - Restaurant food tax - - - - Lodging sales tax - - - - Lodging flat tax - - - - Revenues from use of property - - 38,600 - Intergovernmental revenues:
Commonwealth of Virginia 2,689,802 - - - Federal government 2,662,998 1,362,933 - -
Recovered costs - - - - Investment income 13,170 - (65,970) - Charges for services 139,680 - - - Sale of food and beverages - - - - Miscellaneous local revenues 123,709 1,674 - 3,018,411 Program income 198,941 441,777 - -
Total revenues 5,828,300 1,806,384 490,612 3,018,411 EXPENDITURES
Current:General government 1,652,628 - 44,817 - Public safety 1,545,056 - - - Parks and recreation 71,236 - - - Public welfare 543,712 1,233,853 - - Education - Payments to Public Schools - - - 589,037
Capital outlay 2,150,338 259,425 1,039,230 - Total expenditures 5,962,970 1,493,278 1,084,047 589,037
Excess (deficiency) of revenues over (under) expenditures (134,670) 313,106 (593,435) 2,429,374 OTHER FINANCING SOURCES (USES)
Transfers from other funds 200,144 53,928 - - Transfers to other funds 111,902 - (69,102) (2,272,203)
Total other financing sources (uses), net 312,046 53,928 (69,102) (2,272,203) Net change in fund balance 177,376 367,034 (662,537) 157,171 Fund balance - beginning 4,002,047 2,004 3,028,146 11,313,099 Fund balance - ending $ 4,179,423 369,038 2,365,609 11,470,270
Special Revenue Funds
180
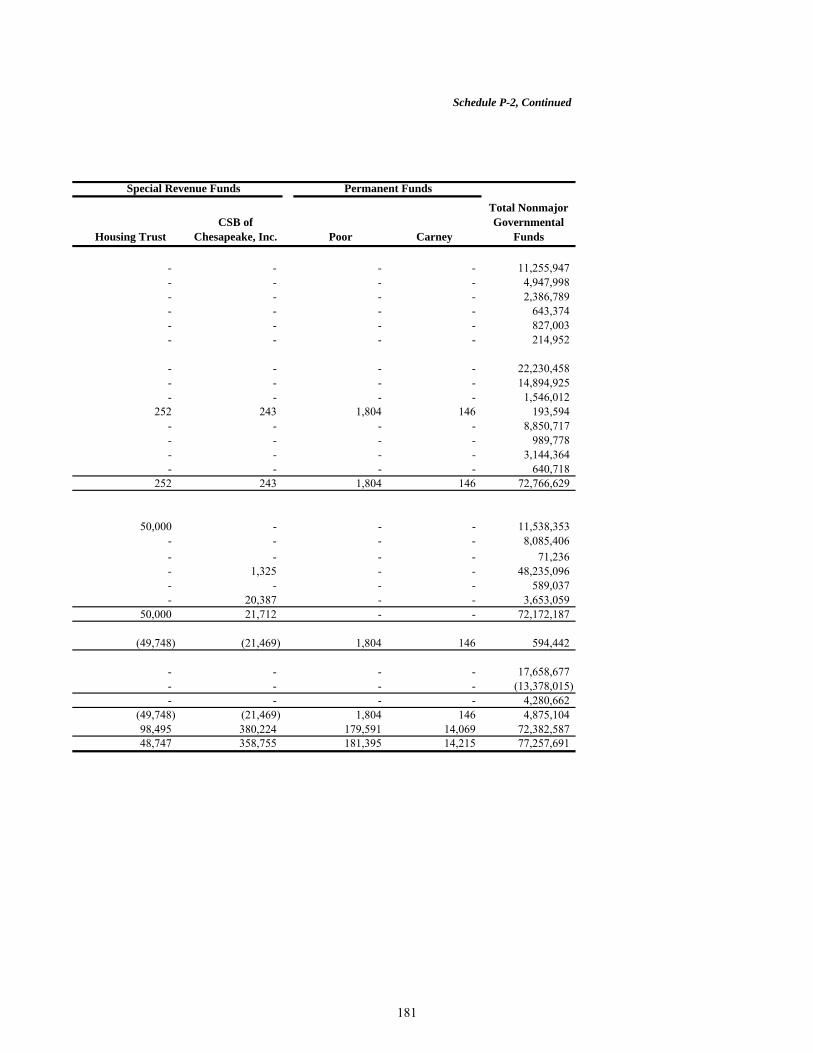
Schedule P-2, Continued
Housing Trust CSB of
Chesapeake, Inc. Poor Carney
Total Nonmajor Governmental
Funds
- - - - 11,255,947 - - - - 4,947,998 - - - - 2,386,789 - - - - 643,374 - - - - 827,003 - - - - 214,952
- - - - 22,230,458 - - - - 14,894,925 - - - - 1,546,012
252 243 1,804 146 193,594 - - - - 8,850,717 - - - - 989,778 - - - - 3,144,364 - - - - 640,718
252 243 1,804 146 72,766,629
50,000 - - - 11,538,353 - - - - 8,085,406 - - - - 71,236 - 1,325 - - 48,235,096 - - - - 589,037 - 20,387 - - 3,653,059
50,000 21,712 - - 72,172,187
(49,748) (21,469) 1,804 146 594,442
- - - - 17,658,677 - - - - (13,378,015) - - - - 4,280,662
(49,748) (21,469) 1,804 146 4,875,104 98,495 380,224 179,591 14,069 72,382,587 48,747 358,755 181,395 14,215 77,257,691
Permanent FundsSpecial Revenue Funds
181
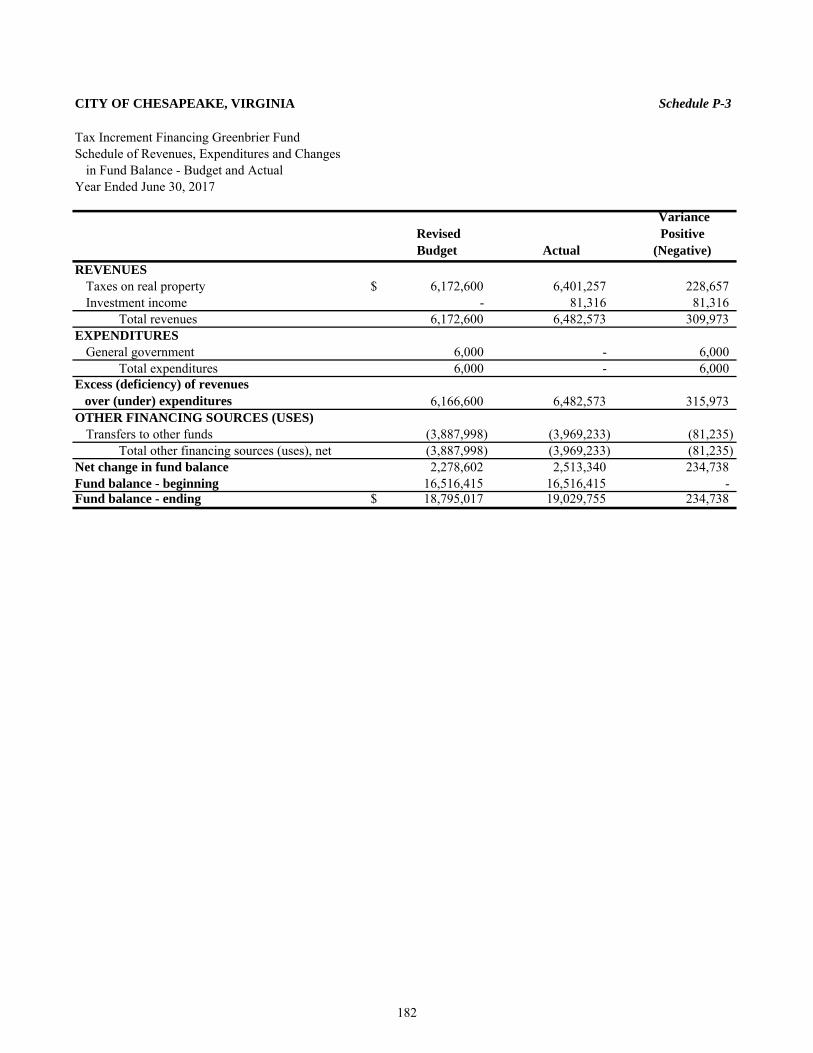
CITY OF CHESAPEAKE, VIRGINIA Schedule P-3
Tax Increment Financing Greenbrier FundSchedule of Revenues, Expenditures and Changes
in Fund Balance - Budget and ActualYear Ended June 30, 2017
RevisedBudget Actual
VariancePositive
(Negative) REVENUES
Taxes on real property $ 6,172,600 6,401,257 228,657 Investment income - 81,316 81,316
Total revenues 6,172,600 6,482,573 309,973 EXPENDITURES
General government 6,000 - 6,000 Total expenditures 6,000 - 6,000
Excess (deficiency) of revenues over (under) expenditures 6,166,600 6,482,573 315,973 OTHER FINANCING SOURCES (USES)
Transfers to other funds (3,887,998) (3,969,233) (81,235) Total other financing sources (uses), net (3,887,998) (3,969,233) (81,235)
Net change in fund balance 2,278,602 2,513,340 234,738 Fund balance - beginning 16,516,415 16,516,415 - Fund balance - ending $ 18,795,017 19,029,755 234,738
182

CITY OF CHESAPEAKE, VIRGINIA Schedule P-4
Tax Increment Financing South Norfolk FundSchedule of Revenues, Expenditures and Changes
in Fund Balance - Budget and ActualYear Ended June 30, 2017
RevisedBudget Actual
VariancePositive
(Negative) REVENUES
Taxes on real property $ 4,323,000 4,336,708 13,708 Investment income - 31,820 31,820
Total revenues 4,323,000 4,368,528 45,528 EXPENDITURES
General government 50,000 250 49,750 Total expenditures 50,000 250 49,750
Excess (deficiency) of revenues over (under) expenditures 4,273,000 4,368,278 95,278 OTHER FINANCING SOURCES (USES)
Transfers to other funds (5,597,770) (5,635,117) (37,347) Total other financing sources (uses), net (5,597,770) (5,635,117) (37,347)
Net change in fund balance (1,324,770) (1,266,839) 57,931 Fund balance - beginning 8,701,610 8,701,610 - Fund balance - ending $ 7,376,840 7,434,771 57,931
183
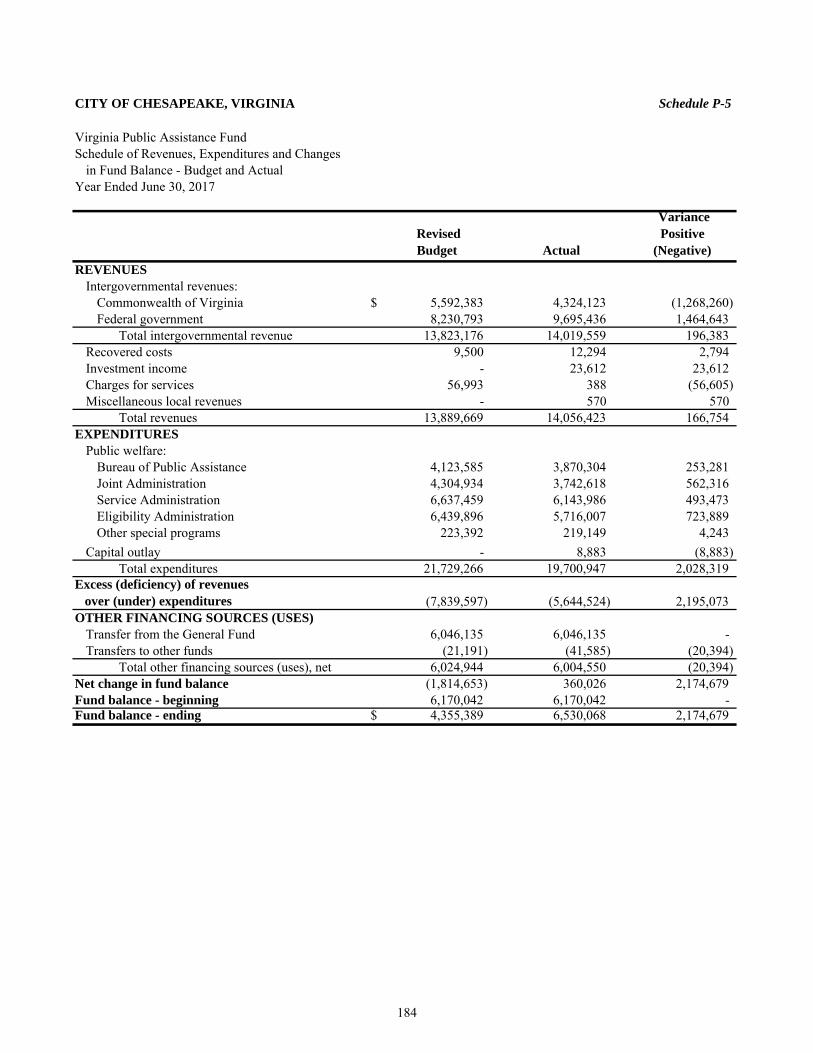
CITY OF CHESAPEAKE, VIRGINIA Schedule P-5
Virginia Public Assistance FundSchedule of Revenues, Expenditures and Changes
in Fund Balance - Budget and ActualYear Ended June 30, 2017
RevisedBudget Actual
VariancePositive
(Negative) REVENUES
Intergovernmental revenues:Commonwealth of Virginia $ 5,592,383 4,324,123 (1,268,260) Federal government 8,230,793 9,695,436 1,464,643
Total intergovernmental revenue 13,823,176 14,019,559 196,383 Recovered costs 9,500 12,294 2,794 Investment income - 23,612 23,612 Charges for services 56,993 388 (56,605) Miscellaneous local revenues - 570 570
Total revenues 13,889,669 14,056,423 166,754 EXPENDITURES
Public welfare:Bureau of Public Assistance 4,123,585 3,870,304 253,281 Joint Administration 4,304,934 3,742,618 562,316 Service Administration 6,637,459 6,143,986 493,473 Eligibility Administration 6,439,896 5,716,007 723,889 Other special programs 223,392 219,149 4,243
Capital outlay - 8,883 (8,883) Total expenditures 21,729,266 19,700,947 2,028,319
Excess (deficiency) of revenues over (under) expenditures (7,839,597) (5,644,524) 2,195,073 OTHER FINANCING SOURCES (USES)
Transfer from the General Fund 6,046,135 6,046,135 - Transfers to other funds (21,191) (41,585) (20,394)
Total other financing sources (uses), net 6,024,944 6,004,550 (20,394) Net change in fund balance (1,814,653) 360,026 2,174,679 Fund balance - beginning 6,170,042 6,170,042 - Fund balance - ending $ 4,355,389 6,530,068 2,174,679
184
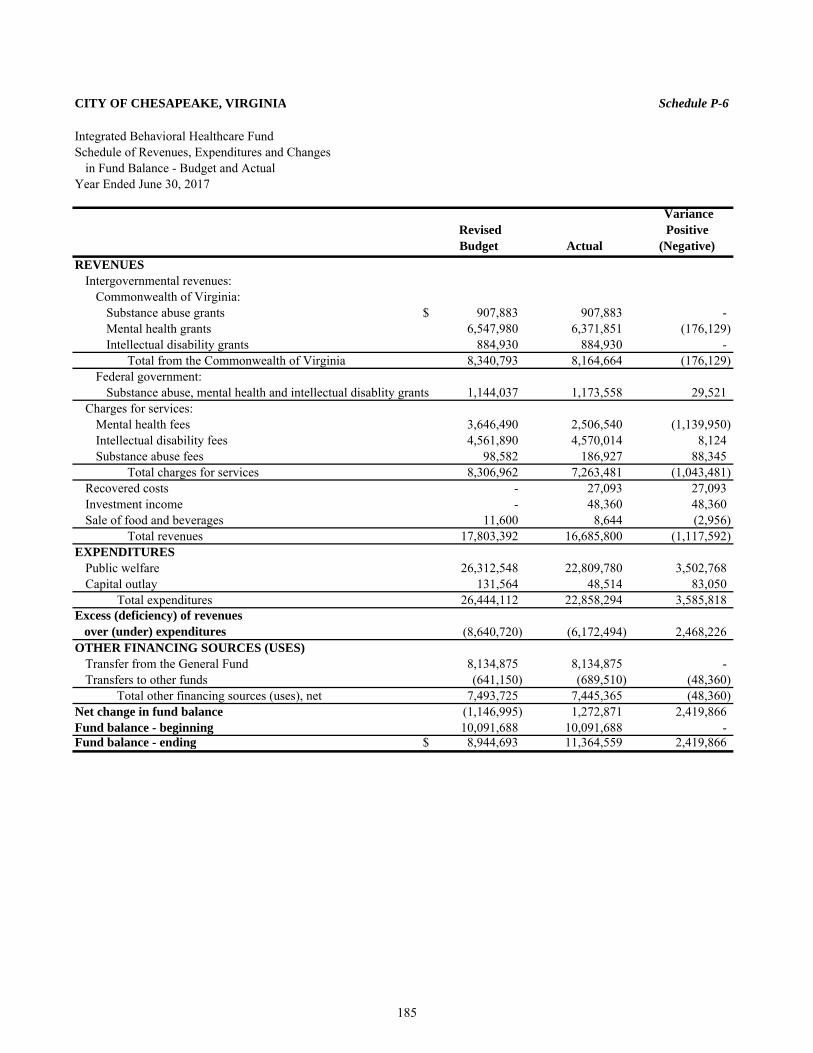
CITY OF CHESAPEAKE, VIRGINIA Schedule P-6
Integrated Behavioral Healthcare FundSchedule of Revenues, Expenditures and Changes
in Fund Balance - Budget and ActualYear Ended June 30, 2017
RevisedBudget Actual
VariancePositive
(Negative) REVENUES
Intergovernmental revenues:Commonwealth of Virginia:
Substance abuse grants $ 907,883 907,883 - Mental health grants 6,547,980 6,371,851 (176,129) Intellectual disability grants 884,930 884,930 -
Total from the Commonwealth of Virginia 8,340,793 8,164,664 (176,129) Federal government:
Substance abuse, mental health and intellectual disablity grants 1,144,037 1,173,558 29,521 Charges for services:
Mental health fees 3,646,490 2,506,540 (1,139,950) Intellectual disability fees 4,561,890 4,570,014 8,124 Substance abuse fees 98,582 186,927 88,345
Total charges for services 8,306,962 7,263,481 (1,043,481) Recovered costs - 27,093 27,093 Investment income - 48,360 48,360 Sale of food and beverages 11,600 8,644 (2,956)
Total revenues 17,803,392 16,685,800 (1,117,592) EXPENDITURES
Public welfare 26,312,548 22,809,780 3,502,768 Capital outlay 131,564 48,514 83,050
Total expenditures 26,444,112 22,858,294 3,585,818 Excess (deficiency) of revenues over (under) expenditures (8,640,720) (6,172,494) 2,468,226 OTHER FINANCING SOURCES (USES)
Transfer from the General Fund 8,134,875 8,134,875 - Transfers to other funds (641,150) (689,510) (48,360)
Total other financing sources (uses), net 7,493,725 7,445,365 (48,360) Net change in fund balance (1,146,995) 1,272,871 2,419,866 Fund balance - beginning 10,091,688 10,091,688 - Fund balance - ending $ 8,944,693 11,364,559 2,419,866
185
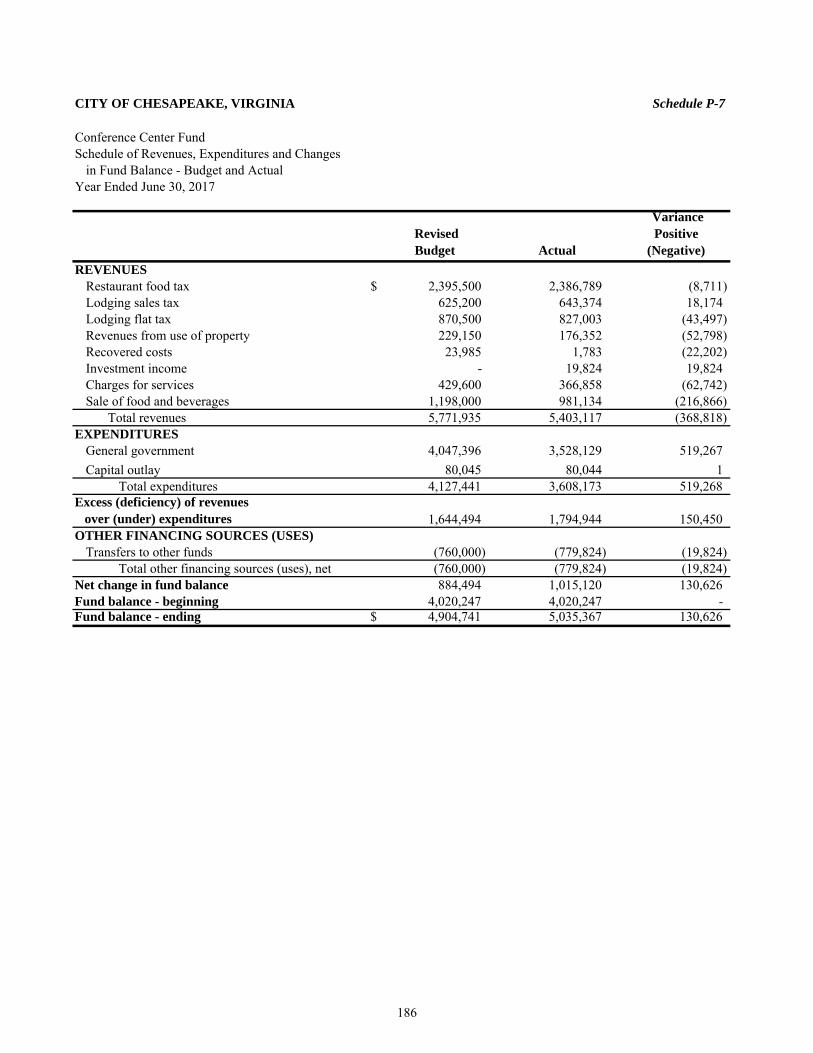
CITY OF CHESAPEAKE, VIRGINIA Schedule P-7
Conference Center FundSchedule of Revenues, Expenditures and Changes
in Fund Balance - Budget and ActualYear Ended June 30, 2017
RevisedBudget Actual
VariancePositive
(Negative) REVENUES
Restaurant food tax $ 2,395,500 2,386,789 (8,711) Lodging sales tax 625,200 643,374 18,174 Lodging flat tax 870,500 827,003 (43,497) Revenues from use of property 229,150 176,352 (52,798) Recovered costs 23,985 1,783 (22,202) Investment income - 19,824 19,824 Charges for services 429,600 366,858 (62,742) Sale of food and beverages 1,198,000 981,134 (216,866)
Total revenues 5,771,935 5,403,117 (368,818) EXPENDITURES
General government 4,047,396 3,528,129 519,267 Capital outlay 80,045 80,044 1
Total expenditures 4,127,441 3,608,173 519,268 Excess (deficiency) of revenues over (under) expenditures 1,644,494 1,794,944 150,450 OTHER FINANCING SOURCES (USES)
Transfers to other funds (760,000) (779,824) (19,824) Total other financing sources (uses), net (760,000) (779,824) (19,824)
Net change in fund balance 884,494 1,015,120 130,626 Fund balance - beginning 4,020,247 4,020,247 - Fund balance - ending $ 4,904,741 5,035,367 130,626
186
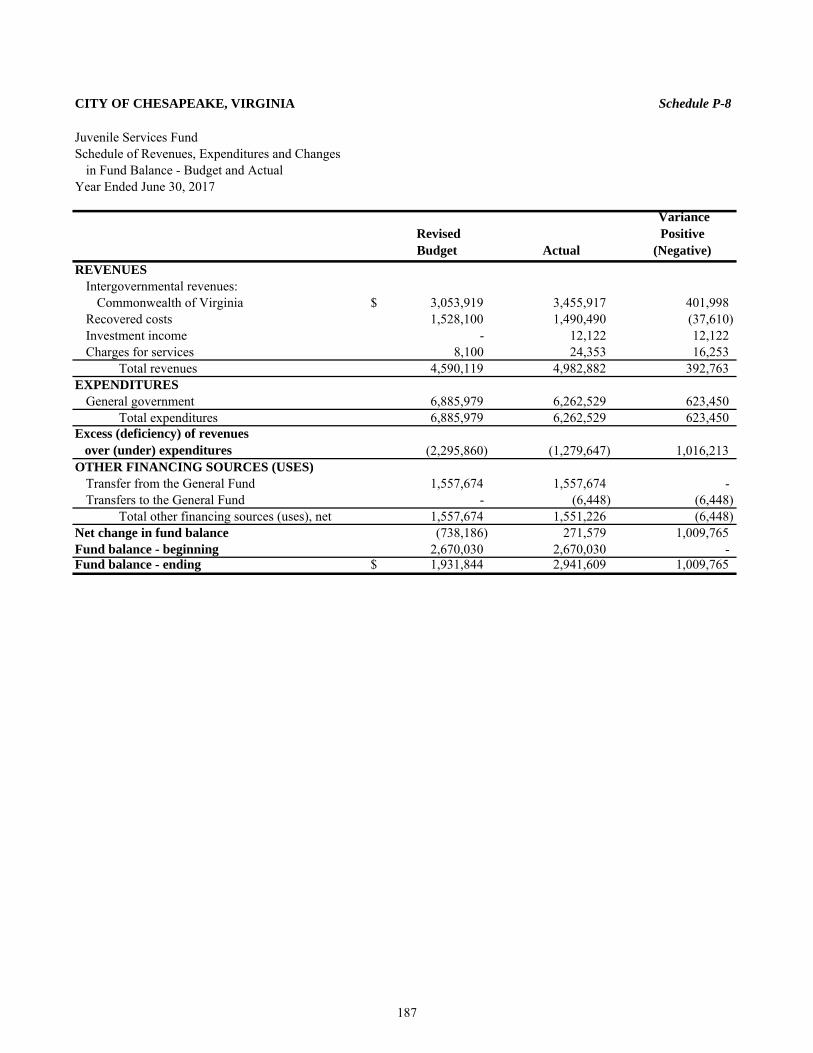
CITY OF CHESAPEAKE, VIRGINIA Schedule P-8
Juvenile Services FundSchedule of Revenues, Expenditures and Changes
in Fund Balance - Budget and ActualYear Ended June 30, 2017
RevisedBudget Actual
VariancePositive
(Negative) REVENUES
Intergovernmental revenues:Commonwealth of Virginia $ 3,053,919 3,455,917 401,998
Recovered costs 1,528,100 1,490,490 (37,610) Investment income - 12,122 12,122 Charges for services 8,100 24,353 16,253
Total revenues 4,590,119 4,982,882 392,763 EXPENDITURES
General government 6,885,979 6,262,529 623,450 Total expenditures 6,885,979 6,262,529 623,450
Excess (deficiency) of revenues over (under) expenditures (2,295,860) (1,279,647) 1,016,213 OTHER FINANCING SOURCES (USES)
Transfer from the General Fund 1,557,674 1,557,674 - Transfers to the General Fund - (6,448) (6,448)
Total other financing sources (uses), net 1,557,674 1,551,226 (6,448) Net change in fund balance (738,186) 271,579 1,009,765 Fund balance - beginning 2,670,030 2,670,030 - Fund balance - ending $ 1,931,844 2,941,609 1,009,765
187
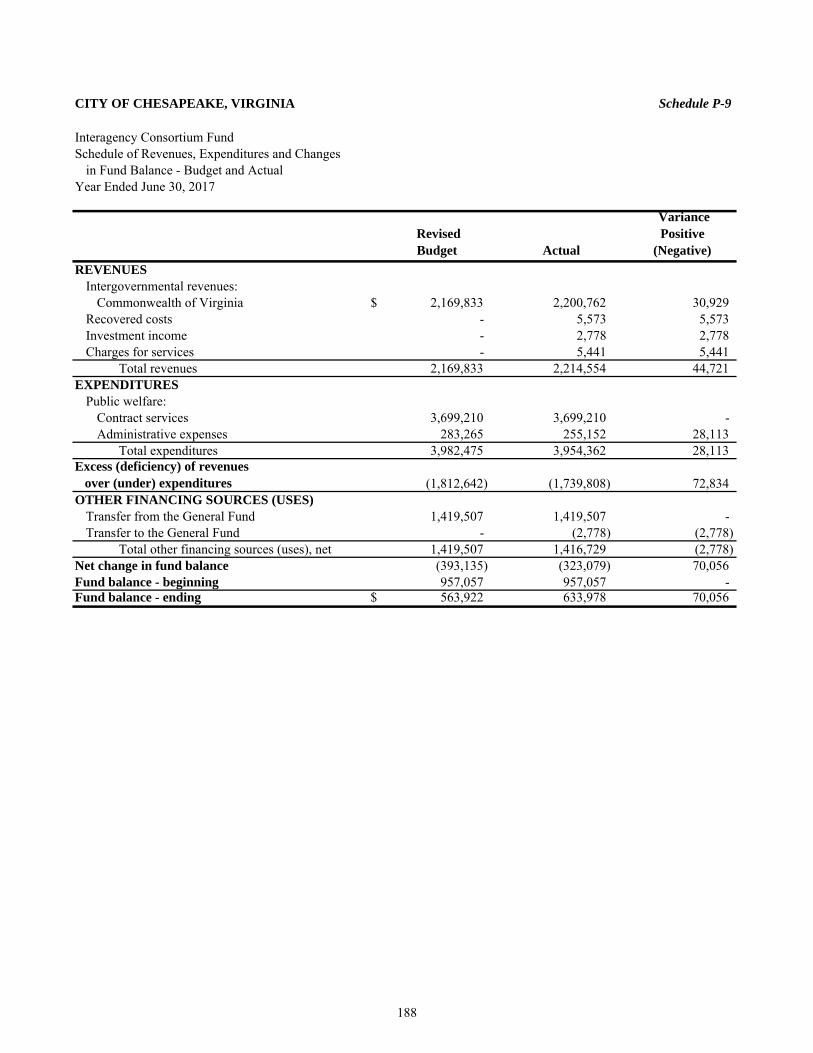
CITY OF CHESAPEAKE, VIRGINIA Schedule P-9
Interagency Consortium FundSchedule of Revenues, Expenditures and Changes
in Fund Balance - Budget and ActualYear Ended June 30, 2017
RevisedBudget Actual
VariancePositive
(Negative) REVENUES
Intergovernmental revenues:Commonwealth of Virginia $ 2,169,833 2,200,762 30,929
Recovered costs - 5,573 5,573 Investment income - 2,778 2,778 Charges for services - 5,441 5,441
Total revenues 2,169,833 2,214,554 44,721 EXPENDITURES
Public welfare:Contract services 3,699,210 3,699,210 - Administrative expenses 283,265 255,152 28,113
Total expenditures 3,982,475 3,954,362 28,113 Excess (deficiency) of revenues over (under) expenditures (1,812,642) (1,739,808) 72,834 OTHER FINANCING SOURCES (USES)
Transfer from the General Fund 1,419,507 1,419,507 - Transfer to the General Fund - (2,778) (2,778)
Total other financing sources (uses), net 1,419,507 1,416,729 (2,778) Net change in fund balance (393,135) (323,079) 70,056 Fund balance - beginning 957,057 957,057 - Fund balance - ending $ 563,922 633,978 70,056
188
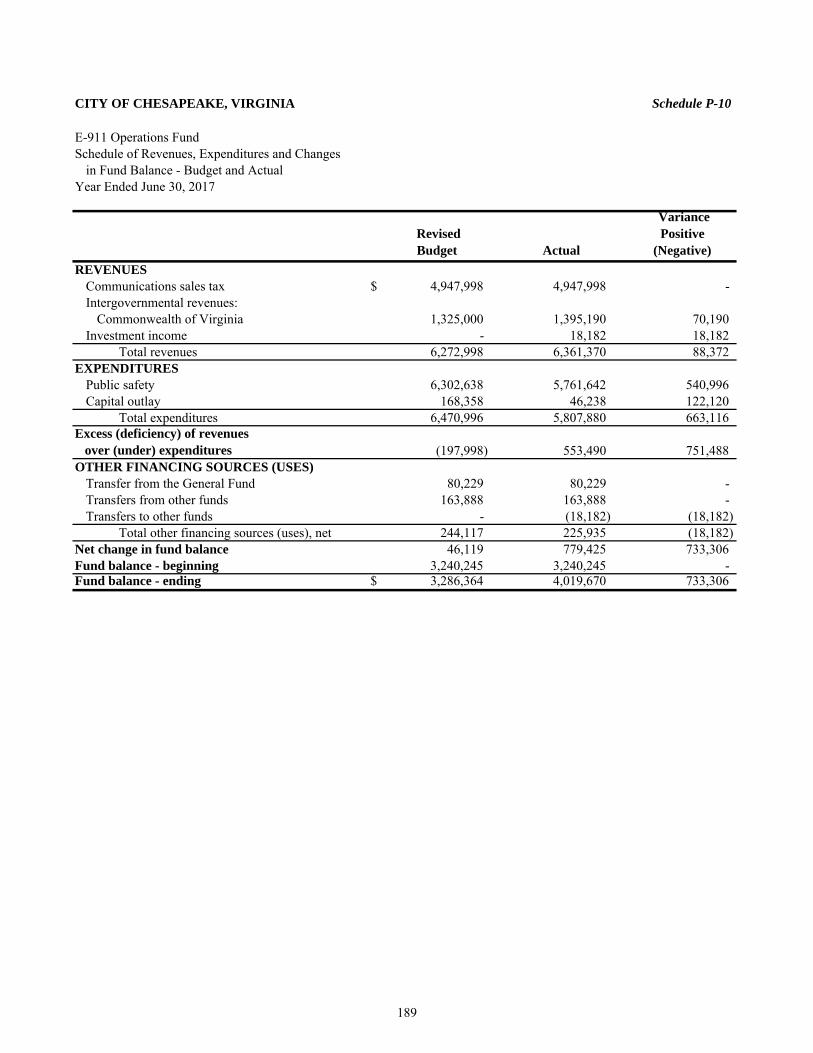
CITY OF CHESAPEAKE, VIRGINIA Schedule P-10
E-911 Operations FundSchedule of Revenues, Expenditures and Changes
in Fund Balance - Budget and ActualYear Ended June 30, 2017
RevisedBudget Actual
VariancePositive
(Negative) REVENUES
Communications sales tax $ 4,947,998 4,947,998 - Intergovernmental revenues:
Commonwealth of Virginia 1,325,000 1,395,190 70,190 Investment income - 18,182 18,182
Total revenues 6,272,998 6,361,370 88,372 EXPENDITURES
Public safety 6,302,638 5,761,642 540,996 Capital outlay 168,358 46,238 122,120
Total expenditures 6,470,996 5,807,880 663,116 Excess (deficiency) of revenues over (under) expenditures (197,998) 553,490 751,488 OTHER FINANCING SOURCES (USES)
Transfer from the General Fund 80,229 80,229 - Transfers from other funds 163,888 163,888 - Transfers to other funds - (18,182) (18,182)
Total other financing sources (uses), net 244,117 225,935 (18,182) Net change in fund balance 46,119 779,425 733,306 Fund balance - beginning 3,240,245 3,240,245 - Fund balance - ending $ 3,286,364 4,019,670 733,306
189
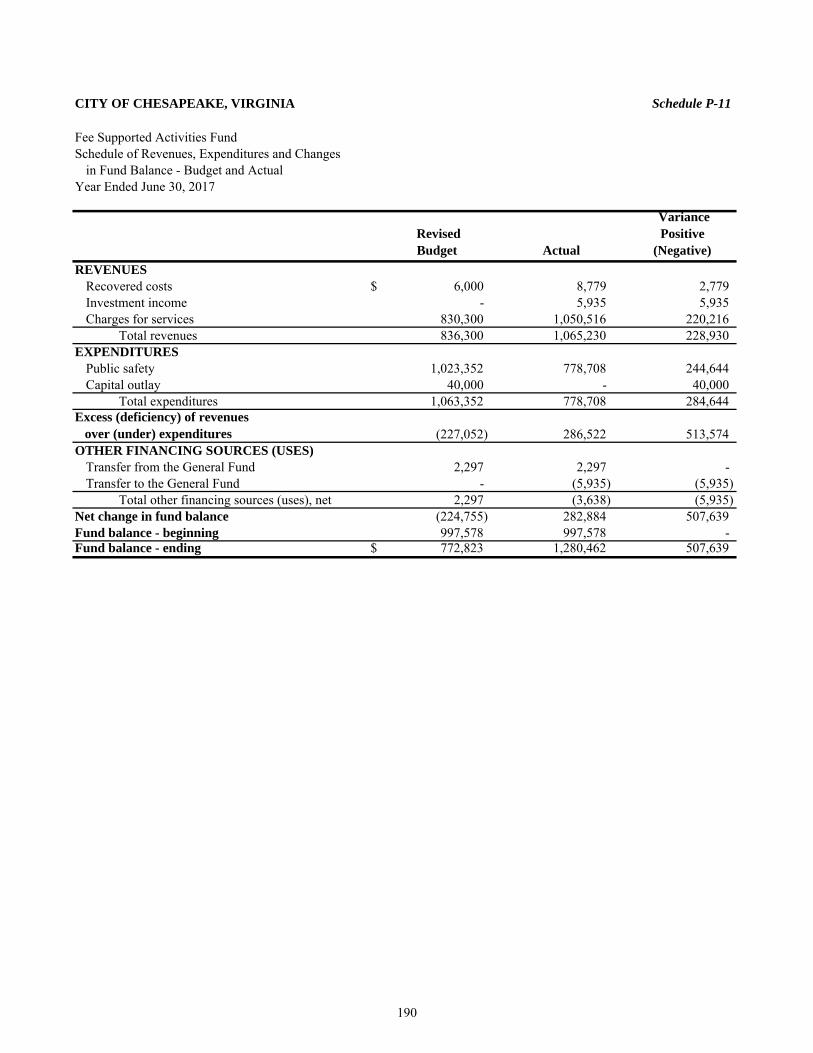
CITY OF CHESAPEAKE, VIRGINIA Schedule P-11
Fee Supported Activities FundSchedule of Revenues, Expenditures and Changes
in Fund Balance - Budget and ActualYear Ended June 30, 2017
RevisedBudget Actual
VariancePositive
(Negative) REVENUES
Recovered costs $ 6,000 8,779 2,779 Investment income - 5,935 5,935 Charges for services 830,300 1,050,516 220,216
Total revenues 836,300 1,065,230 228,930 EXPENDITURES
Public safety 1,023,352 778,708 244,644 Capital outlay 40,000 - 40,000
Total expenditures 1,063,352 778,708 284,644 Excess (deficiency) of revenues over (under) expenditures (227,052) 286,522 513,574 OTHER FINANCING SOURCES (USES)
Transfer from the General Fund 2,297 2,297 - Transfer to the General Fund - (5,935) (5,935)
Total other financing sources (uses), net 2,297 (3,638) (5,935) Net change in fund balance (224,755) 282,884 507,639 Fund balance - beginning 997,578 997,578 - Fund balance - ending $ 772,823 1,280,462 507,639
190
Internal Service Funds
Information Technology Fund – To account for the operation of the City’s central information technology, including technology development and support, and radio and communications operations. City Garage Fund – To account for the maintenance and repair of City-owned vehicles. Self-Insurance Fund – To account for the City’s self-insurance program. Self-Funded Health Fund – To account for the City’s self-funded health insurance program.
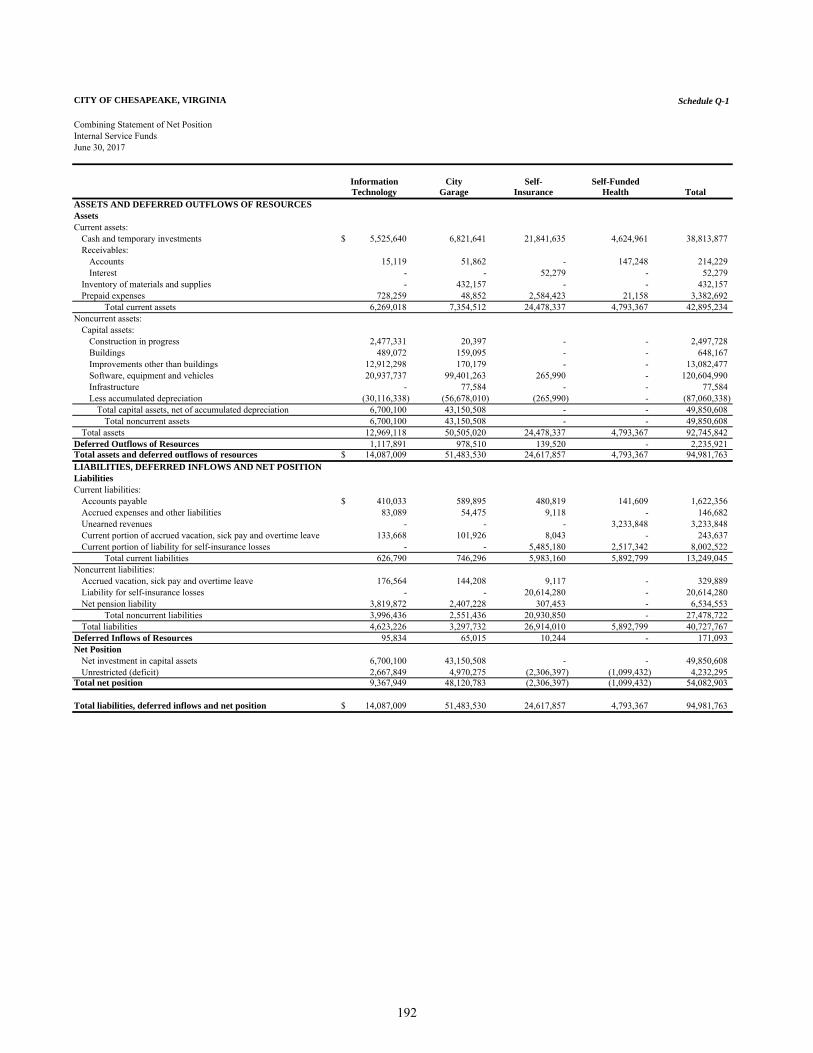
CITY OF CHESAPEAKE, VIRGINIA Schedule Q-1
Combining Statement of Net PositionInternal Service FundsJune 30, 2017
Information City Self- Self-FundedTechnology Garage Insurance Health Total
ASSETS AND DEFERRED OUTFLOWS OF RESOURCESAssetsCurrent assets:
Cash and temporary investments 5,525,640$ 6,821,641 21,841,635 4,624,961 38,813,877 Receivables:
Accounts 15,119 51,862 - 147,248 214,229 Interest - - 52,279 - 52,279
Inventory of materials and supplies - 432,157 - - 432,157 Prepaid expenses 728,259 48,852 2,584,423 21,158 3,382,692
Total current assets 6,269,018 7,354,512 24,478,337 4,793,367 42,895,234 Noncurrent assets:
Capital assets:Construction in progress 2,477,331 20,397 - - 2,497,728 Buildings 489,072 159,095 - - 648,167 Improvements other than buildings 12,912,298 170,179 - - 13,082,477 Software, equipment and vehicles 20,937,737 99,401,263 265,990 - 120,604,990 Infrastructure - 77,584 - - 77,584 Less accumulated depreciation (30,116,338) (56,678,010) (265,990) - (87,060,338)
Total capital assets, net of accumulated depreciation 6,700,100 43,150,508 - - 49,850,608 Total noncurrent assets 6,700,100 43,150,508 - - 49,850,608
Total assets 12,969,118 50,505,020 24,478,337 4,793,367 92,745,842 Deferred Outflows of Resources 1,117,891 978,510 139,520 - 2,235,921 Total assets and deferred outflows of resources 14,087,009$ 51,483,530 24,617,857 4,793,367 94,981,763 LIABILITIES, DEFERRED INFLOWS AND NET POSITIONLiabilitiesCurrent liabilities:
Accounts payable 410,033$ 589,895 480,819 141,609 1,622,356 Accrued expenses and other liabilities 83,089 54,475 9,118 - 146,682 Unearned revenues - - - 3,233,848 3,233,848 Current portion of accrued vacation, sick pay and overtime leave 133,668 101,926 8,043 - 243,637 Current portion of liability for self-insurance losses - - 5,485,180 2,517,342 8,002,522
Total current liabilities 626,790 746,296 5,983,160 5,892,799 13,249,045 Noncurrent liabilities:
Accrued vacation, sick pay and overtime leave 176,564 144,208 9,117 - 329,889 Liability for self-insurance losses - - 20,614,280 - 20,614,280 Net pension liability 3,819,872 2,407,228 307,453 - 6,534,553
Total noncurrent liabilities 3,996,436 2,551,436 20,930,850 - 27,478,722 Total liabilities 4,623,226 3,297,732 26,914,010 5,892,799 40,727,767
Deferred Inflows of Resources 95,834 65,015 10,244 - 171,093 Net Position
Net investment in capital assets 6,700,100 43,150,508 - - 49,850,608 Unrestricted (deficit) 2,667,849 4,970,275 (2,306,397) (1,099,432) 4,232,295
Total net position 9,367,949 48,120,783 (2,306,397) (1,099,432) 54,082,903
Total liabilities, deferred inflows and net position 14,087,009$ 51,483,530 24,617,857 4,793,367 94,981,763
192
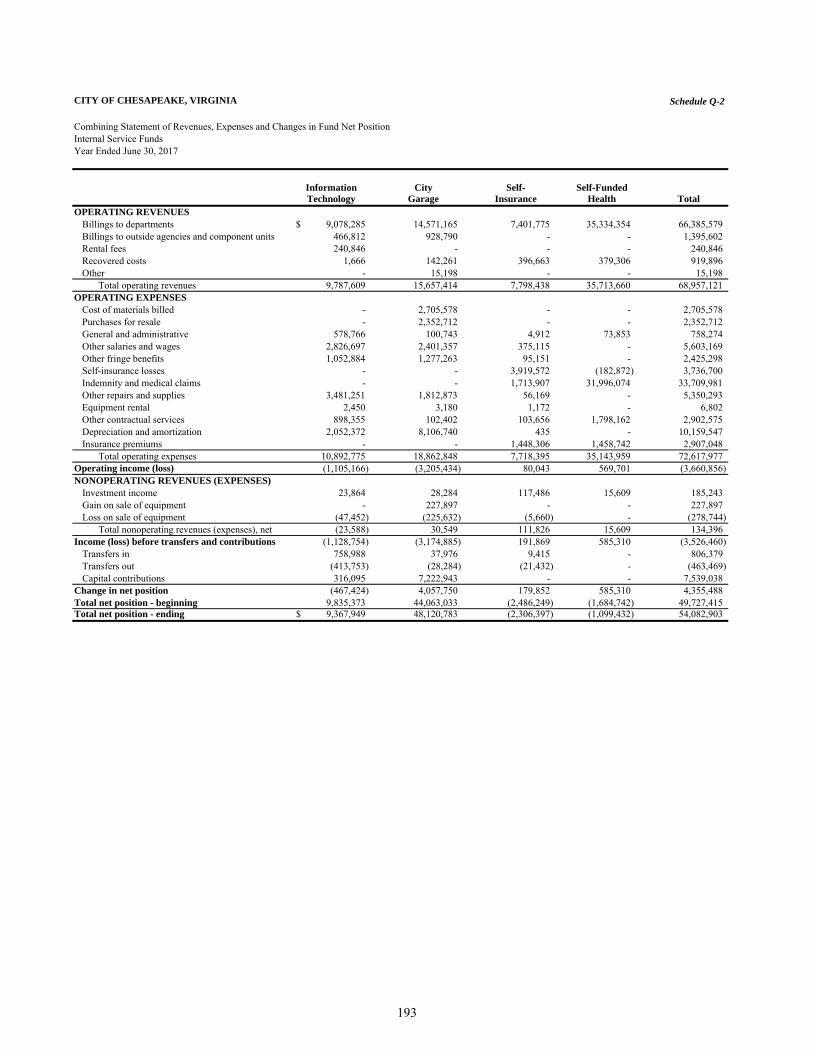
CITY OF CHESAPEAKE, VIRGINIA Schedule Q-2
Combining Statement of Revenues, Expenses and Changes in Fund Net PositionInternal Service FundsYear Ended June 30, 2017
Information City Self- Self-FundedTechnology Garage Insurance Health Total
OPERATING REVENUESBillings to departments 9,078,285$ 14,571,165 7,401,775 35,334,354 66,385,579 Billings to outside agencies and component units 466,812 928,790 - - 1,395,602 Rental fees 240,846 - - - 240,846 Recovered costs 1,666 142,261 396,663 379,306 919,896 Other - 15,198 - - 15,198
Total operating revenues 9,787,609 15,657,414 7,798,438 35,713,660 68,957,121 OPERATING EXPENSES
Cost of materials billed - 2,705,578 - - 2,705,578 Purchases for resale - 2,352,712 - - 2,352,712 General and administrative 578,766 100,743 4,912 73,853 758,274 Other salaries and wages 2,826,697 2,401,357 375,115 - 5,603,169 Other fringe benefits 1,052,884 1,277,263 95,151 - 2,425,298 Self-insurance losses - - 3,919,572 (182,872) 3,736,700 Indemnity and medical claims - - 1,713,907 31,996,074 33,709,981 Other repairs and supplies 3,481,251 1,812,873 56,169 - 5,350,293 Equipment rental 2,450 3,180 1,172 - 6,802 Other contractual services 898,355 102,402 103,656 1,798,162 2,902,575 Depreciation and amortization 2,052,372 8,106,740 435 - 10,159,547 Insurance premiums - - 1,448,306 1,458,742 2,907,048
Total operating expenses 10,892,775 18,862,848 7,718,395 35,143,959 72,617,977 Operating income (loss) (1,105,166) (3,205,434) 80,043 569,701 (3,660,856) NONOPERATING REVENUES (EXPENSES)
Investment income 23,864 28,284 117,486 15,609 185,243 Gain on sale of equipment - 227,897 - - 227,897 Loss on sale of equipment (47,452) (225,632) (5,660) - (278,744)
Total nonoperating revenues (expenses), net (23,588) 30,549 111,826 15,609 134,396 Income (loss) before transfers and contributions (1,128,754) (3,174,885) 191,869 585,310 (3,526,460)
Transfers in 758,988 37,976 9,415 - 806,379 Transfers out (413,753) (28,284) (21,432) - (463,469) Capital contributions 316,095 7,222,943 - - 7,539,038
Change in net position (467,424) 4,057,750 179,852 585,310 4,355,488 Total net position - beginning 9,835,373 44,063,033 (2,486,249) (1,684,742) 49,727,415 Total net position - ending 9,367,949$ 48,120,783 (2,306,397) (1,099,432) 54,082,903
193
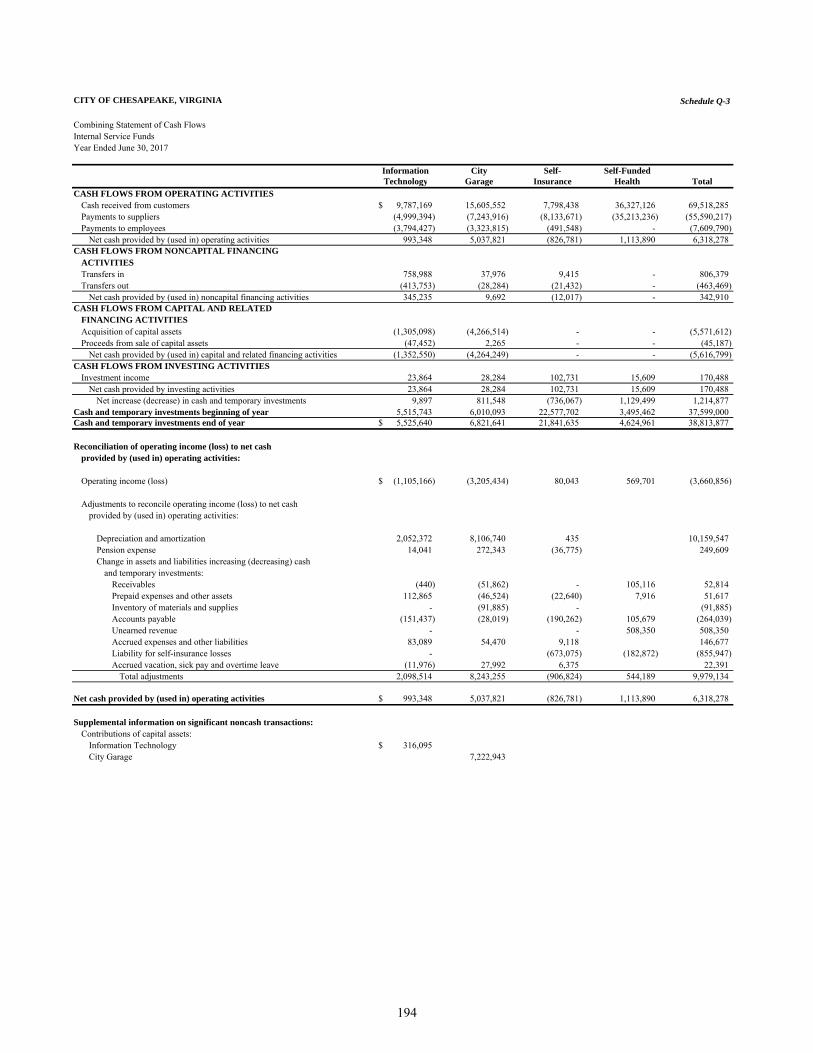
CITY OF CHESAPEAKE, VIRGINIA Schedule Q-3
Year Ended June 30, 2017
Information City Self- Self-FundedTechnology Garage Insurance Health Total
CASH FLOWS FROM OPERATING ACTIVITIES Cash received from customers 9,787,169$ 15,605,552 7,798,438 36,327,126 69,518,285 Payments to suppliers (4,999,394) (7,243,916) (8,133,671) (35,213,236) (55,590,217) Payments to employees (3,794,427) (3,323,815) (491,548) - (7,609,790)
Net cash provided by (used in) operating activities 993,348 5,037,821 (826,781) 1,113,890 6,318,278 CASH FLOWS FROM NONCAPITAL FINANCING
ACTIVITIESTransfers in 758,988 37,976 9,415 - 806,379 Transfers out (413,753) (28,284) (21,432) - (463,469)
Net cash provided by (used in) noncapital financing activities 345,235 9,692 (12,017) - 342,910 CASH FLOWS FROM CAPITAL AND RELATED
FINANCING ACTIVITIESAcquisition of capital assets (1,305,098) (4,266,514) - - (5,571,612) Proceeds from sale of capital assets (47,452) 2,265 - - (45,187)
Net cash provided by (used in) capital and related financing activities (1,352,550) (4,264,249) - - (5,616,799) CASH FLOWS FROM INVESTING ACTIVITIES
Investment income 23,864 28,284 102,731 15,609 170,488 Net cash provided by investing activities 23,864 28,284 102,731 15,609 170,488
Net increase (decrease) in cash and temporary investments 9,897 811,548 (736,067) 1,129,499 1,214,877 Cash and temporary investments beginning of year 5,515,743 6,010,093 22,577,702 3,495,462 37,599,000 Cash and temporary investments end of year 5,525,640$ 6,821,641 21,841,635 4,624,961 38,813,877
Reconciliation of operating income (loss) to net cashprovided by (used in) operating activities:
Operating income (loss) (1,105,166)$ (3,205,434) 80,043 569,701 (3,660,856)
Adjustments to reconcile operating income (loss) to net cashprovided by (used in) operating activities:
Depreciation and amortization 2,052,372 8,106,740 435 10,159,547 Pension expense 14,041 272,343 (36,775) 249,609 Change in assets and liabilities increasing (decreasing) cash
and temporary investments:Receivables (440) (51,862) - 105,116 52,814 Prepaid expenses and other assets 112,865 (46,524) (22,640) 7,916 51,617 Inventory of materials and supplies - (91,885) - (91,885) Accounts payable (151,437) (28,019) (190,262) 105,679 (264,039) Unearned revenue - - 508,350 508,350 Accrued expenses and other liabilities 83,089 54,470 9,118 146,677 Liability for self-insurance losses - (673,075) (182,872) (855,947) Accrued vacation, sick pay and overtime leave (11,976) 27,992 6,375 22,391
Total adjustments 2,098,514 8,243,255 (906,824) 544,189 9,979,134
Net cash provided by (used in) operating activities 993,348$ 5,037,821 (826,781) 1,113,890 6,318,278
Supplemental information on significant noncash transactions:Contributions of capital assets:
Information Technology 316,095$ City Garage 7,222,943
Combining Statement of Cash FlowsInternal Service Funds
194
Fiduciary Fund
Agency Fund: Includes Special Welfare Fund – To account for the assets held by the City as an agent for children in foster care.

This page intentionally left blank
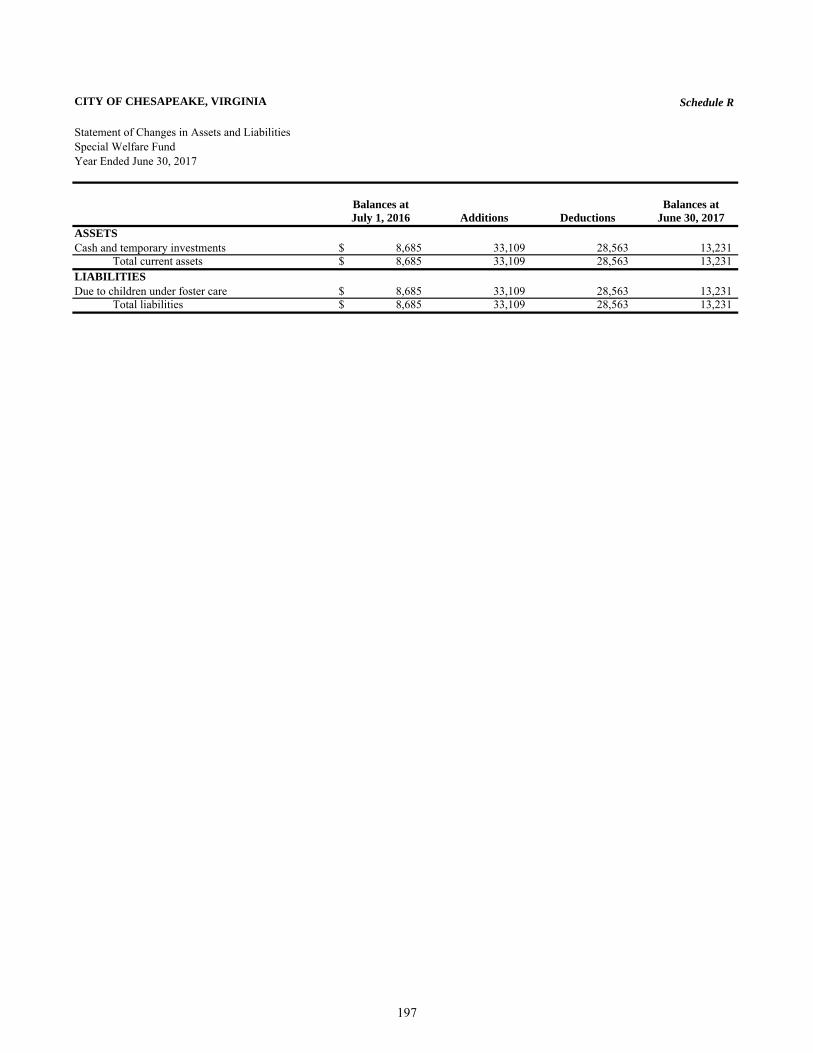
CITY OF CHESAPEAKE, VIRGINIA Schedule R
Statement of Changes in Assets and LiabilitiesSpecial Welfare FundYear Ended June 30, 2017
Balances at Balances atJuly 1, 2016 Additions Deductions June 30, 2017
ASSETSCash and temporary investments 8,685$ 33,109 28,563 13,231
Total current assets 8,685$ 33,109 28,563 13,231 LIABILITIESDue to children under foster care 8,685$ 33,109 28,563 13,231
Total liabilities 8,685$ 33,109 28,563 13,231
197

This page intentionally left blank

Chesapeake Public Schools Component Unit
Major Governmental funds Schools General Fund – To account for the general operations of the School Board which is used to account for all of the financial resources, except those required to be accounted for in another fund. Schools Food Services Fund– To account for the operations of the Schools’ cafeterias. Schools Textbooks Fund – To account for the operation of the School Textbook program.
Schools Capital Projects Fund – To account for financial resources to be used for the acquisition or construction of major capital facilities or maintenance of the school plant (other than those financed by the other funds or the City). Fiduciary Funds: Schools OPEB Trust Fund – To account for assets accumulated to fund other postemployment benefit (OPEB) obligations of the Schools.
Schools Agency Fund – Includes the Student Activity Fund, which accounts for the student activity monies maintained on behalf of the students by the principals at each school.

This page intentionally left blank
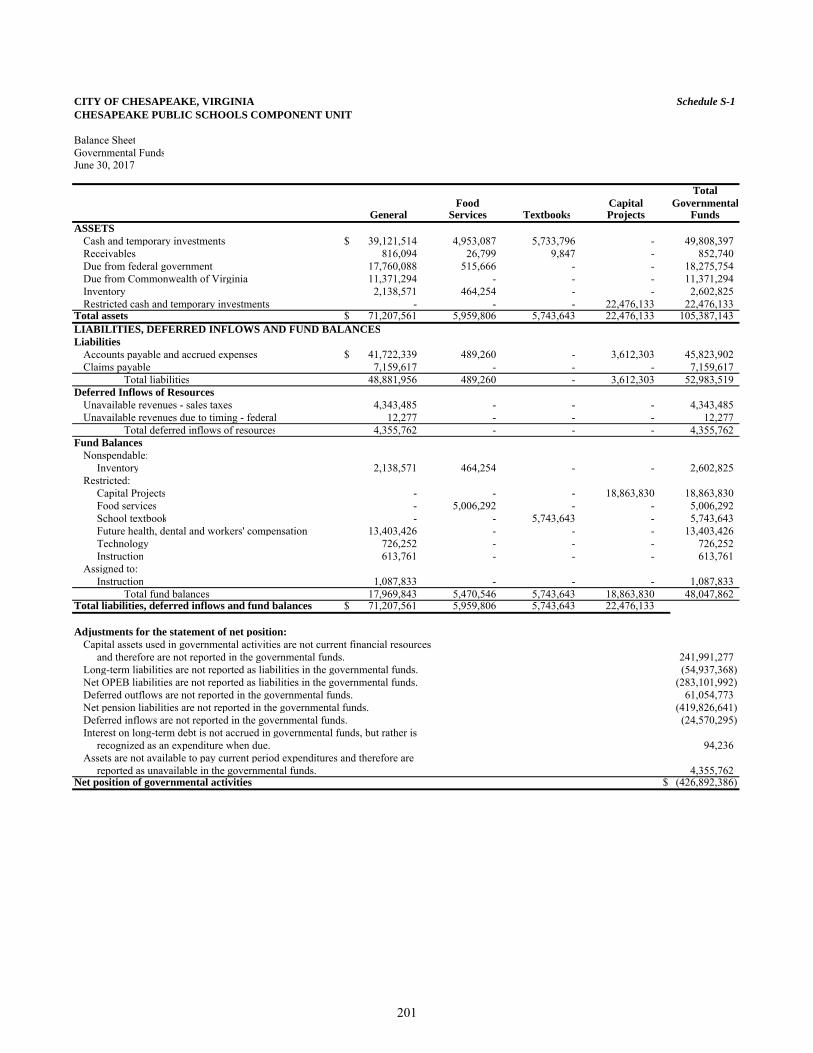
CITY OF CHESAPEAKE, VIRGINIA Schedule S-1CHESAPEAKE PUBLIC SCHOOLS COMPONENT UNIT
Balance SheetGovernmental Funds
TotalFood Capital Governmental
General Services Textbooks Projects FundsASSETS
Cash and temporary investments $ 39,121,514 4,953,087 5,733,796 - 49,808,397 Receivables 816,094 26,799 9,847 - 852,740 Due from federal government 17,760,088 515,666 - - 18,275,754 Due from Commonwealth of Virginia 11,371,294 - - - 11,371,294 Inventory 2,138,571 464,254 - - 2,602,825 Restricted cash and temporary investments - - - 22,476,133 22,476,133
Total assets $ 71,207,561 5,959,806 5,743,643 22,476,133 105,387,143LIABILITIES, DEFERRED INFLOWS AND FUND BALANCESLiabilities
Accounts payable and accrued expenses $ 41,722,339 489,260 - 3,612,303 45,823,902 Claims payable 7,159,617 - - - 7,159,617
Total liabilities 48,881,956 489,260 - 3,612,303 52,983,519 Deferred Inflows of Resources
Unavailable revenues - sales taxes 4,343,485 - - - 4,343,485 Unavailable revenues due to timing - federal 12,277 - - - 12,277
Total deferred inflows of resources 4,355,762 - - - 4,355,762 Fund Balances
Nonspendable:Inventory 2,138,571 464,254 - - 2,602,825
Restricted:Capital Projects - - - 18,863,830 18,863,830 Food services - 5,006,292 - - 5,006,292 School textbook - - 5,743,643 - 5,743,643 Future health, dental and workers' compensation 13,403,426 - - - 13,403,426 Technology 726,252 - - - 726,252 Instruction 613,761 - - - 613,761
Assigned to:Instruction 1,087,833 - - - 1,087,833
Total fund balances 17,969,843 5,470,546 5,743,643 18,863,830 48,047,862 Total liabilities, deferred inflows and fund balances $ 71,207,561 5,959,806 5,743,643 22,476,133
Adjustments for the statement of net position:Capital assets used in governmental activities are not current financial resources
and therefore are not reported in the governmental funds. 241,991,277Long-term liabilities are not reported as liabilities in the governmental funds. (54,937,368) Net OPEB liabilities are not reported as liabilities in the governmental funds. (283,101,992)Deferred outflows are not reported in the governmental funds. 61,054,773 Net pension liabilities are not reported in the governmental funds. (419,826,641)Deferred inflows are not reported in the governmental funds. (24,570,295) Interest on long-term debt is not accrued in governmental funds, but rather is
recognized as an expenditure when due. 94,236 Assets are not available to pay current period expenditures and therefore are
reported as unavailable in the governmental funds. 4,355,762 Net position of governmental activities $ (426,892,386)
June 30, 2017
201
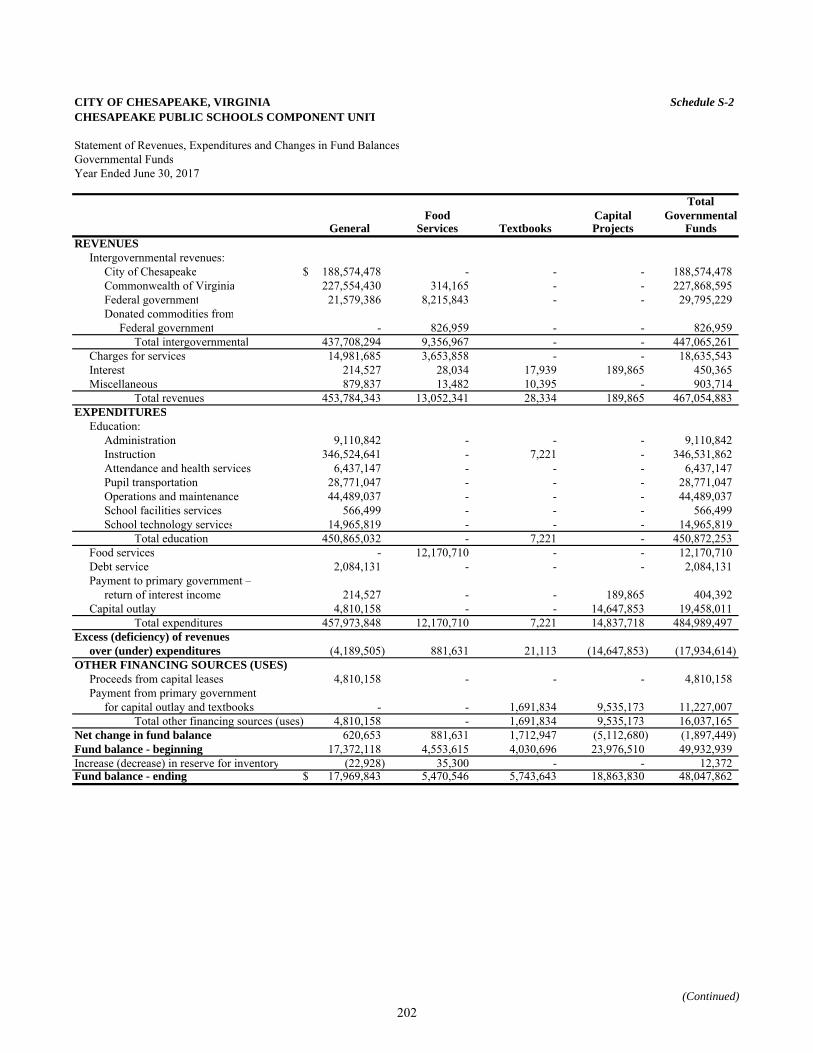
CITY OF CHESAPEAKE, VIRGINIA Schedule S-2CHESAPEAKE PUBLIC SCHOOLS COMPONENT UNIT
Statement of Revenues, Expenditures and Changes in Fund BalancesGovernmental FundsYear Ended June 30, 2017
TotalFood Capital Governmental
General Services Textbooks Projects FundsREVENUES
Intergovernmental revenues:City of Chesapeake $ 188,574,478 - - - 188,574,478Commonwealth of Virginia 227,554,430 314,165 - - 227,868,595Federal government 21,579,386 8,215,843 - - 29,795,229 Donated commodities from
Federal government - 826,959 - - 826,959 Total intergovernmental 437,708,294 9,356,967 - - 447,065,261
Charges for services 14,981,685 3,653,858 - - 18,635,543 Interest 214,527 28,034 17,939 189,865 450,365 Miscellaneous 879,837 13,482 10,395 - 903,714
Total revenues 453,784,343 13,052,341 28,334 189,865 467,054,883EXPENDITURES
Education:Administration 9,110,842 - - - 9,110,842 Instruction 346,524,641 - 7,221 - 346,531,862Attendance and health services 6,437,147 - - - 6,437,147 Pupil transportation 28,771,047 - - - 28,771,047 Operations and maintenance 44,489,037 - - - 44,489,037 School facilities services 566,499 - - - 566,499 School technology services 14,965,819 - - - 14,965,819
Total education 450,865,032 - 7,221 - 450,872,253Food services - 12,170,710 - - 12,170,710 Debt service 2,084,131 - - - 2,084,131 Payment to primary government –
return of interest income 214,527 - - 189,865 404,392 Capital outlay 4,810,158 - - 14,647,853 19,458,011
Total expenditures 457,973,848 12,170,710 7,221 14,837,718 484,989,497Excess (deficiency) of revenues
over (under) expenditures (4,189,505) 881,631 21,113 (14,647,853) (17,934,614) OTHER FINANCING SOURCES (USES)
Proceeds from capital leases 4,810,158 - - - 4,810,158 Payment from primary government
for capital outlay and textbooks - - 1,691,834 9,535,173 11,227,007 Total other financing sources (uses) 4,810,158 - 1,691,834 9,535,173 16,037,165
Net change in fund balance 620,653 881,631 1,712,947 (5,112,680) (1,897,449) Fund balance - beginning 17,372,118 4,553,615 4,030,696 23,976,510 49,932,939 Increase (decrease) in reserve for inventory (22,928) 35,300 - - 12,372 Fund balance - ending $ 17,969,843 5,470,546 5,743,643 18,863,830 48,047,862
(Continued)202
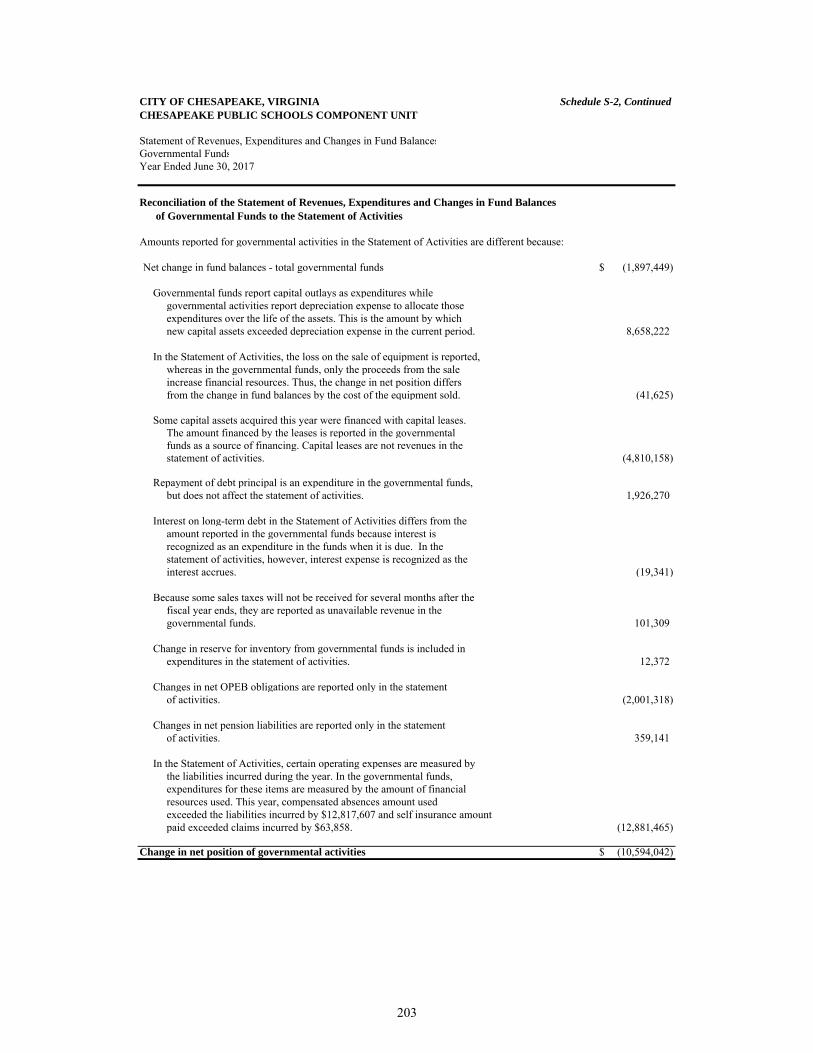
CITY OF CHESAPEAKE, VIRGINIA Schedule S-2, ContinuedCHESAPEAKE PUBLIC SCHOOLS COMPONENT UNIT
Statement of Revenues, Expenditures and Changes in Fund BalancesGovernmental FundsYear Ended June 30, 2017
Amounts reported for governmental activities in the Statement of Activities are different because:
Net change in fund balances - total governmental funds $ (1,897,449)
Governmental funds report capital outlays as expenditures while governmental activities report depreciation expense to allocate those expenditures over the life of the assets. This is the amount by which new capital assets exceeded depreciation expense in the current period. 8,658,222
In the Statement of Activities, the loss on the sale of equipment is reported, whereas in the governmental funds, only the proceeds from the sale increase financial resources. Thus, the change in net position differs from the change in fund balances by the cost of the equipment sold. (41,625)
Some capital assets acquired this year were financed with capital leases. The amount financed by the leases is reported in the governmental funds as a source of financing. Capital leases are not revenues in the statement of activities. (4,810,158)
Repayment of debt principal is an expenditure in the governmental funds, but does not affect the statement of activities. 1,926,270
Interest on long-term debt in the Statement of Activities differs from the amount reported in the governmental funds because interest is recognized as an expenditure in the funds when it is due. In the statement of activities, however, interest expense is recognized as the interest accrues. (19,341)
Because some sales taxes will not be received for several months after the fiscal year ends, they are reported as unavailable revenue in the governmental funds. 101,309
Change in reserve for inventory from governmental funds is included in expenditures in the statement of activities. 12,372
Changes in net OPEB obligations are reported only in the statement of activities. (2,001,318)
Changes in net pension liabilities are reported only in the statement of activities. 359,141
In the Statement of Activities, certain operating expenses are measured by the liabilities incurred during the year. In the governmental funds, expenditures for these items are measured by the amount of financial resources used. This year, compensated absences amount used exceeded the liabilities incurred by $12,817,607 and self insurance amount paid exceeded claims incurred by $63,858. (12,881,465)
Change in net position of governmental activities $ (10,594,042)
Reconciliation of the Statement of Revenues, Expenditures and Changes in Fund Balances of Governmental Funds to the Statement of Activities
203
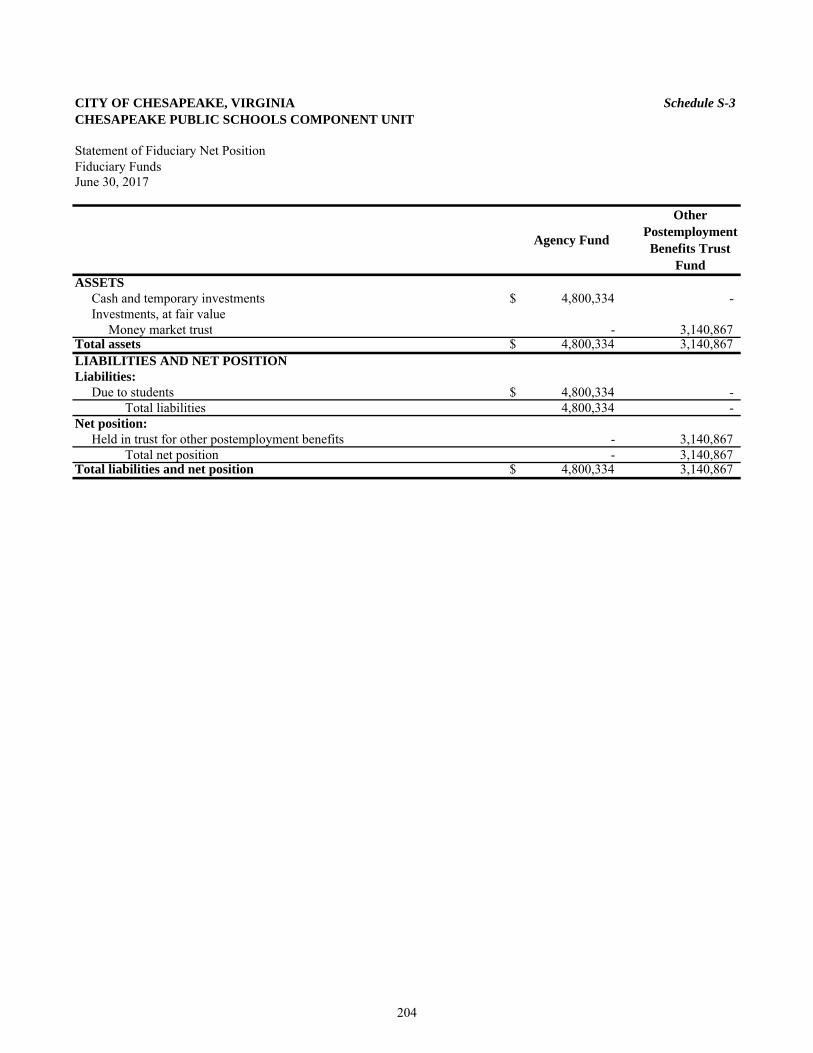
CITY OF CHESAPEAKE, VIRGINIA Schedule S-3CHESAPEAKE PUBLIC SCHOOLS COMPONENT UNIT
Fiduciary Funds
ASSETSCash and temporary investments $ 4,800,334 - Investments, at fair value
Money market trust - 3,140,867 Total assets $ 4,800,334 3,140,867 LIABILITIES AND NET POSITIONLiabilities:
Due to students $ 4,800,334 - Total liabilities 4,800,334 -
Net position:Held in trust for other postemployment benefits - 3,140,867
Total net position - 3,140,867 Total liabilities and net position $ 4,800,334 3,140,867
Statement of Fiduciary Net Position
June 30, 2017
Agency Fund
Other Postemployment Benefits Trust
Fund
204
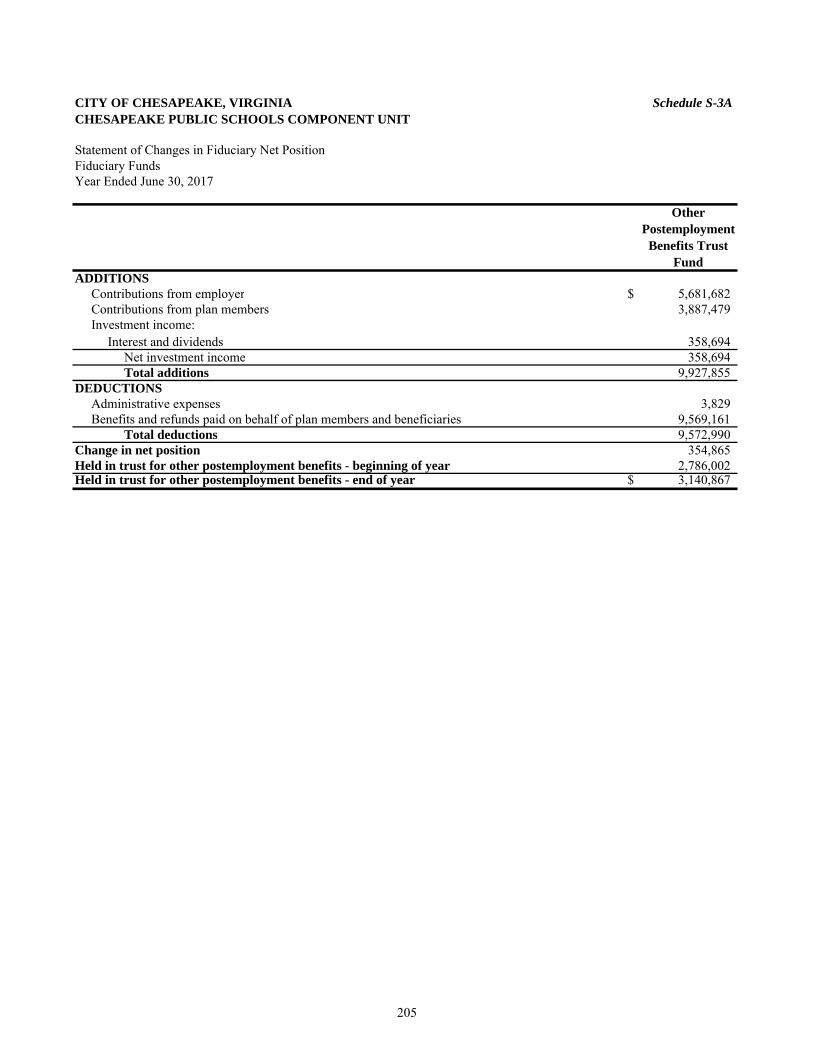
CITY OF CHESAPEAKE, VIRGINIA Schedule S-3ACHESAPEAKE PUBLIC SCHOOLS COMPONENT UNIT
Fiduciary FundsYear Ended June 30, 2017
ADDITIONSContributions from employer $ 5,681,682 Contributions from plan members 3,887,479 Investment income:
Interest and dividends 358,694 Net investment income 358,694 Total additions 9,927,855
DEDUCTIONSAdministrative expenses 3,829 Benefits and refunds paid on behalf of plan members and beneficiaries 9,569,161
Total deductions 9,572,990 Change in net position 354,865 Held in trust for other postemployment benefits - beginning of year 2,786,002 Held in trust for other postemployment benefits - end of year $ 3,140,867
Statement of Changes in Fiduciary Net Position
Other Postemployment
Benefits Trust Fund
205
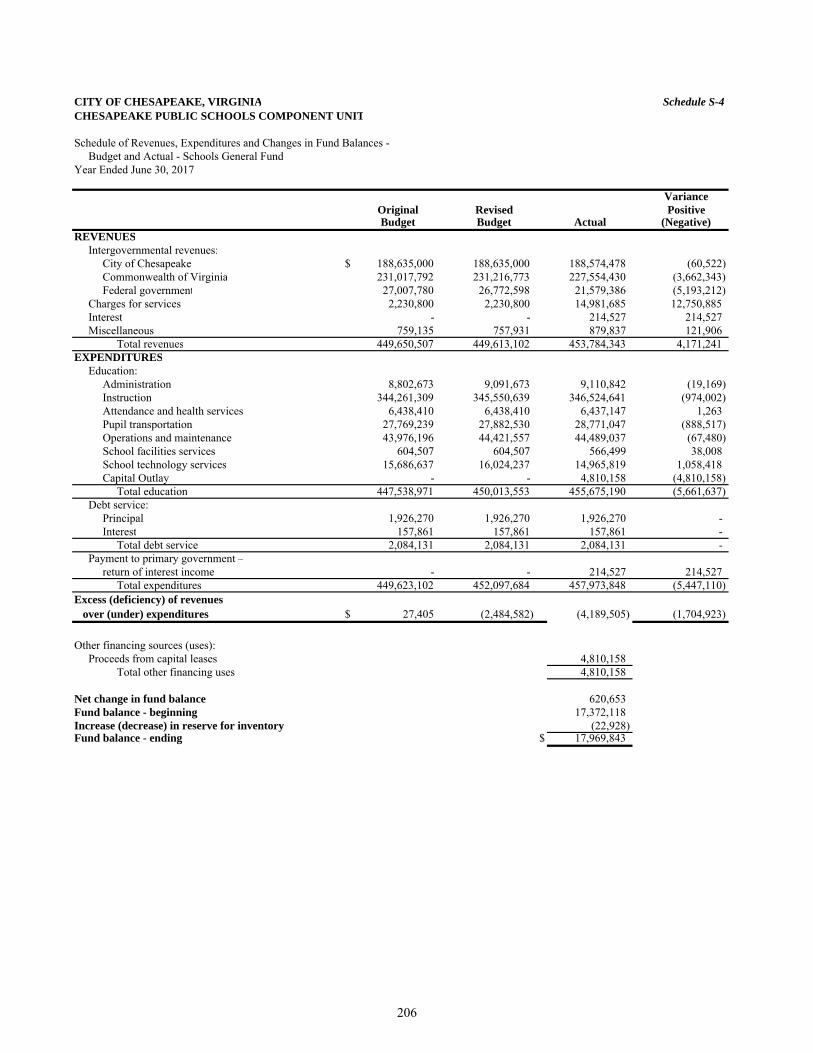
CITY OF CHESAPEAKE, VIRGINIA Schedule S-4CHESAPEAKE PUBLIC SCHOOLS COMPONENT UNIT
Schedule of Revenues, Expenditures and Changes in Fund Balances - Budget and Actual - Schools General Fund
Year Ended June 30, 2017
VarianceOriginal Revised PositiveBudget Budget Actual (Negative)
REVENUESIntergovernmental revenues:
City of Chesapeake $ 188,635,000 188,635,000 188,574,478 (60,522) Commonwealth of Virginia 231,017,792 231,216,773 227,554,430 (3,662,343) Federal government 27,007,780 26,772,598 21,579,386 (5,193,212)
Charges for services 2,230,800 2,230,800 14,981,685 12,750,885 Interest - - 214,527 214,527 Miscellaneous 759,135 757,931 879,837 121,906
Total revenues 449,650,507 449,613,102 453,784,343 4,171,241 EXPENDITURES
Education:Administration 8,802,673 9,091,673 9,110,842 (19,169) Instruction 344,261,309 345,550,639 346,524,641 (974,002) Attendance and health services 6,438,410 6,438,410 6,437,147 1,263 Pupil transportation 27,769,239 27,882,530 28,771,047 (888,517) Operations and maintenance 43,976,196 44,421,557 44,489,037 (67,480) School facilities services 604,507 604,507 566,499 38,008 School technology services 15,686,637 16,024,237 14,965,819 1,058,418 Capital Outlay - - 4,810,158 (4,810,158)
Total education 447,538,971 450,013,553 455,675,190 (5,661,637) Debt service:
Principal 1,926,270 1,926,270 1,926,270 - Interest 157,861 157,861 157,861 -
Total debt service 2,084,131 2,084,131 2,084,131 - Payment to primary government –
return of interest income - - 214,527 214,527 Total expenditures 449,623,102 452,097,684 457,973,848 (5,447,110)
$ 27,405 (2,484,582) (4,189,505) (1,704,923)
Other financing sources (uses):Proceeds from capital leases 4,810,158
Total other financing uses 4,810,158
Net change in fund balance 620,653Fund balance - beginning 17,372,118 Increase (decrease) in reserve for inventory (22,928) Fund balance - ending $ 17,969,843
Excess (deficiency) of revenues over (under) expenditures
206
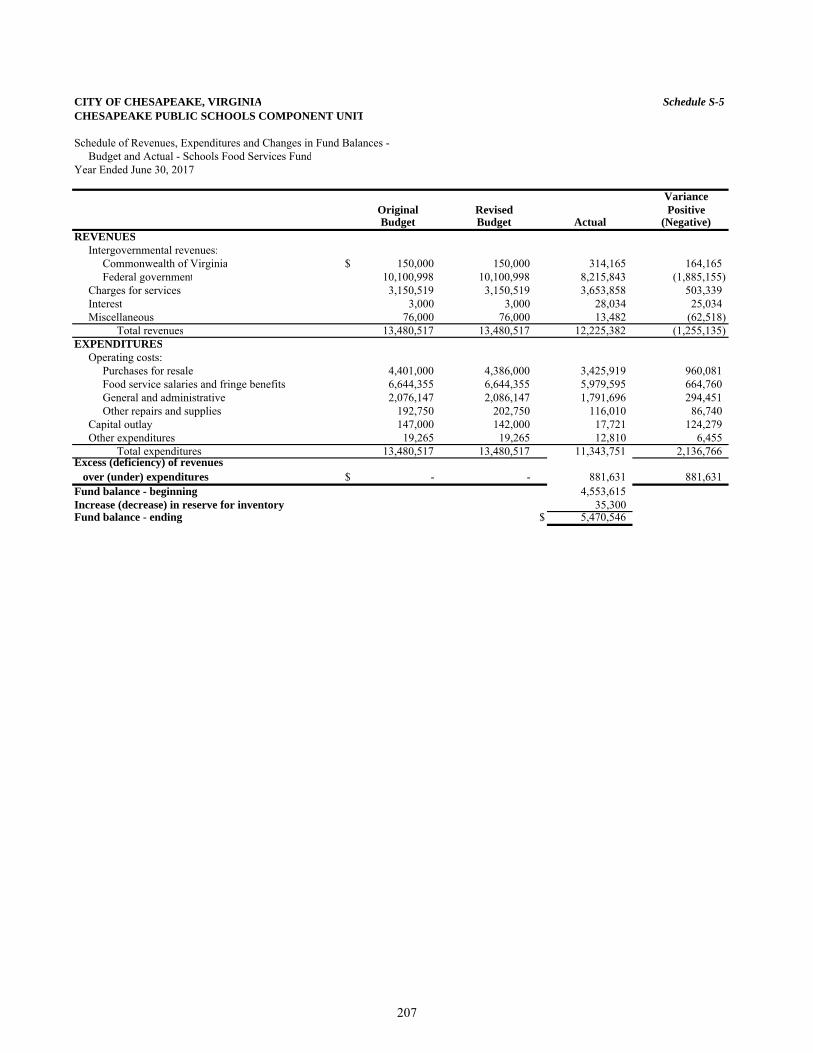
CITY OF CHESAPEAKE, VIRGINIA Schedule S-5CHESAPEAKE PUBLIC SCHOOLS COMPONENT UNIT
Schedule of Revenues, Expenditures and Changes in Fund Balances - Budget and Actual - Schools Food Services Fund
Year Ended June 30, 2017
VarianceOriginal Revised PositiveBudget Budget Actual (Negative)
REVENUESIntergovernmental revenues:
Commonwealth of Virginia $ 150,000 150,000 314,165 164,165 Federal government 10,100,998 10,100,998 8,215,843 (1,885,155)
Charges for services 3,150,519 3,150,519 3,653,858 503,339 Interest 3,000 3,000 28,034 25,034 Miscellaneous 76,000 76,000 13,482 (62,518)
Total revenues 13,480,517 13,480,517 12,225,382 (1,255,135) EXPENDITURES
Operating costs:Purchases for resale 4,401,000 4,386,000 3,425,919 960,081 Food service salaries and fringe benefits 6,644,355 6,644,355 5,979,595 664,760 General and administrative 2,076,147 2,086,147 1,791,696 294,451 Other repairs and supplies 192,750 202,750 116,010 86,740
Capital outlay 147,000 142,000 17,721 124,279 Other expenditures 19,265 19,265 12,810 6,455
Total expenditures 13,480,517 13,480,517 11,343,751 2,136,766
$ - - 881,631 881,631 Fund balance - beginning 4,553,615 Increase (decrease) in reserve for inventory 35,300 Fund balance - ending $ 5,470,546
Excess (deficiency) of revenues over (under) expenditures
207
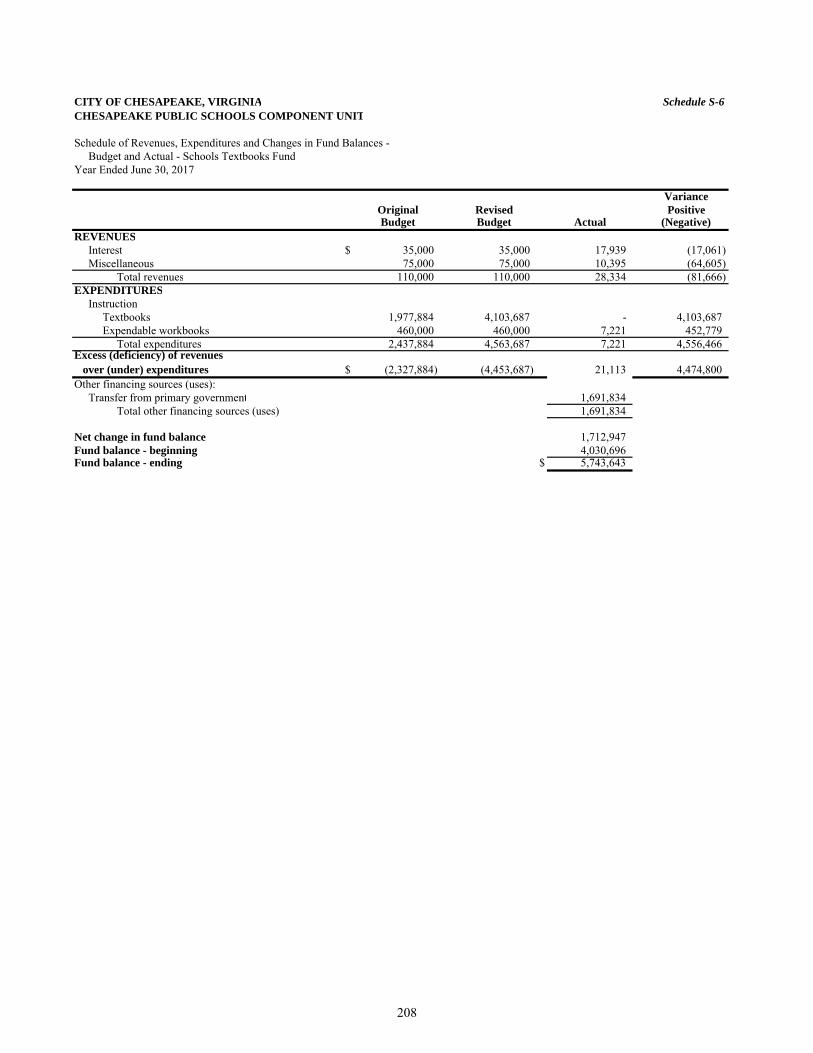
CITY OF CHESAPEAKE, VIRGINIA Schedule S-6CHESAPEAKE PUBLIC SCHOOLS COMPONENT UNIT
Schedule of Revenues, Expenditures and Changes in Fund Balances - Budget and Actual - Schools Textbooks Fund
Year Ended June 30, 2017
VarianceOriginal Revised PositiveBudget Budget Actual (Negative)
REVENUESInterest $ 35,000 35,000 17,939 (17,061) Miscellaneous 75,000 75,000 10,395 (64,605)
Total revenues 110,000 110,000 28,334 (81,666) EXPENDITURES
InstructionTextbooks 1,977,884 4,103,687 - 4,103,687 Expendable workbooks 460,000 460,000 7,221 452,779
Total expenditures 2,437,884 4,563,687 7,221 4,556,466
$ (2,327,884) (4,453,687) 21,113 4,474,800 Other financing sources (uses):
Transfer from primary government 1,691,834 Total other financing sources (uses) 1,691,834
Net change in fund balance 1,712,947Fund balance - beginning 4,030,696 Fund balance - ending $ 5,743,643
Excess (deficiency) of revenues over (under) expenditures
208
Other Component Units
Other Component Units – Include the Chesapeake Mosquito Control Commission and the Chesapeake Port Authority.
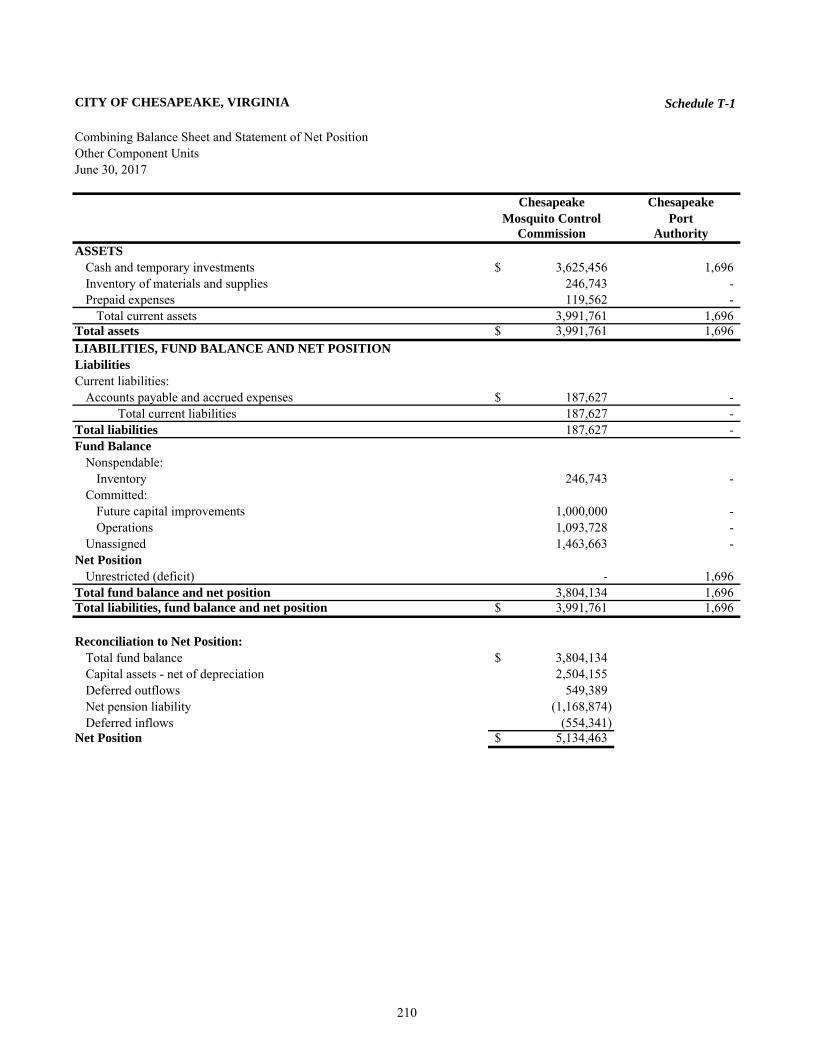
CITY OF CHESAPEAKE, VIRGINIA Schedule T-1
Combining Balance Sheet and Statement of Net PositionOther Component UnitsJune 30, 2017
Chesapeake ChesapeakeMosquito Control Port
Commission AuthorityASSETS
Cash and temporary investments 3,625,456$ 1,696 Inventory of materials and supplies 246,743 - Prepaid expenses 119,562 -
Total current assets 3,991,761 1,696 Total assets 3,991,761$ 1,696 LIABILITIES, FUND BALANCE AND NET POSITIONLiabilitiesCurrent liabilities:
Accounts payable and accrued expenses 187,627$ - Total current liabilities 187,627 -
Total liabilities 187,627 - Fund Balance
Nonspendable:Inventory 246,743 -
Committed:Future capital improvements 1,000,000 - Operations 1,093,728 -
Unassigned 1,463,663 - Net Position
Unrestricted (deficit) - 1,696 Total fund balance and net position 3,804,134 1,696 Total liabilities, fund balance and net position 3,991,761$ 1,696
Reconciliation to Net Position:Total fund balance 3,804,134$ Capital assets - net of depreciation 2,504,155 Deferred outflows 549,389 Net pension liability (1,168,874) Deferred inflows (554,341)
Net Position 5,134,463$
210
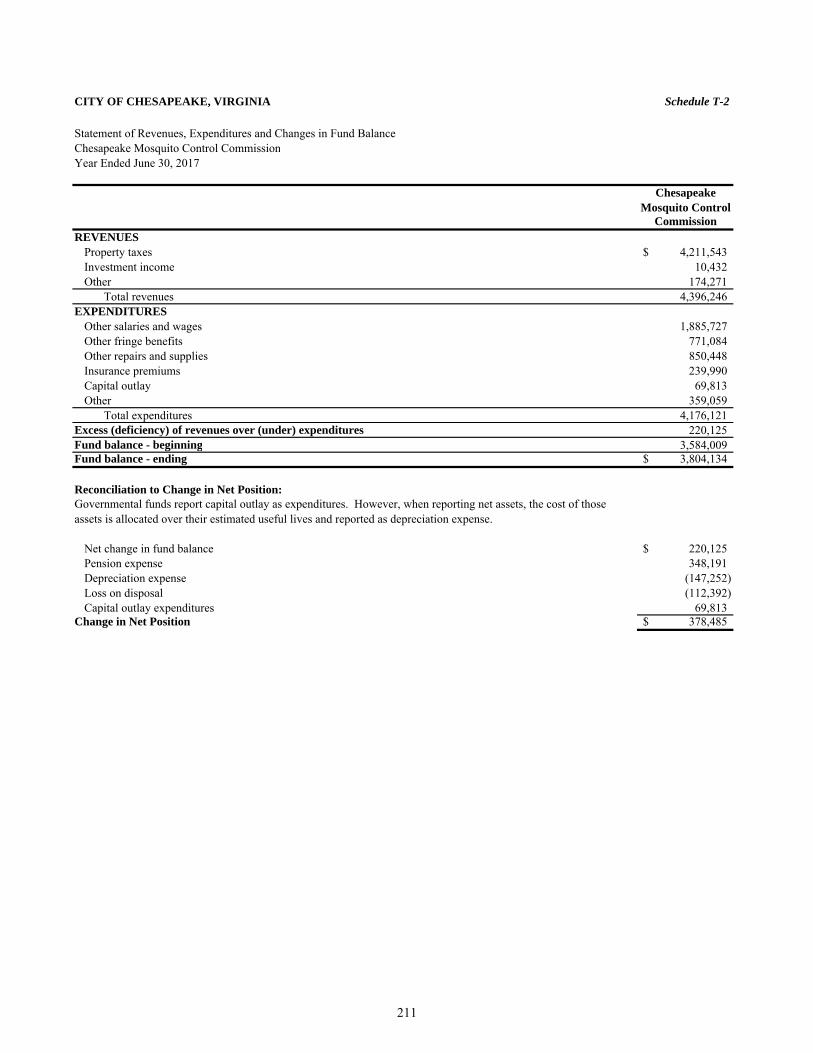
CITY OF CHESAPEAKE, VIRGINIA Schedule T-2
Statement of Revenues, Expenditures and Changes in Fund BalanceChesapeake Mosquito Control CommissionYear Ended June 30, 2017
ChesapeakeMosquito Control
CommissionREVENUES
Property taxes 4,211,543$ Investment income 10,432 Other 174,271
Total revenues 4,396,246 EXPENDITURES
Other salaries and wages 1,885,727 Other fringe benefits 771,084 Other repairs and supplies 850,448 Insurance premiums 239,990 Capital outlay 69,813 Other 359,059
Total expenditures 4,176,121 Excess (deficiency) of revenues over (under) expenditures 220,125 Fund balance - beginning 3,584,009 Fund balance - ending 3,804,134$
Reconciliation to Change in Net Position:Governmental funds report capital outlay as expenditures. However, when reporting net assets, the cost of those assets is allocated over their estimated useful lives and reported as depreciation expense.
Net change in fund balance 220,125$ Pension expense 348,191 Depreciation expense (147,252) Loss on disposal (112,392) Capital outlay expenditures 69,813
Change in Net Position 378,485$
211
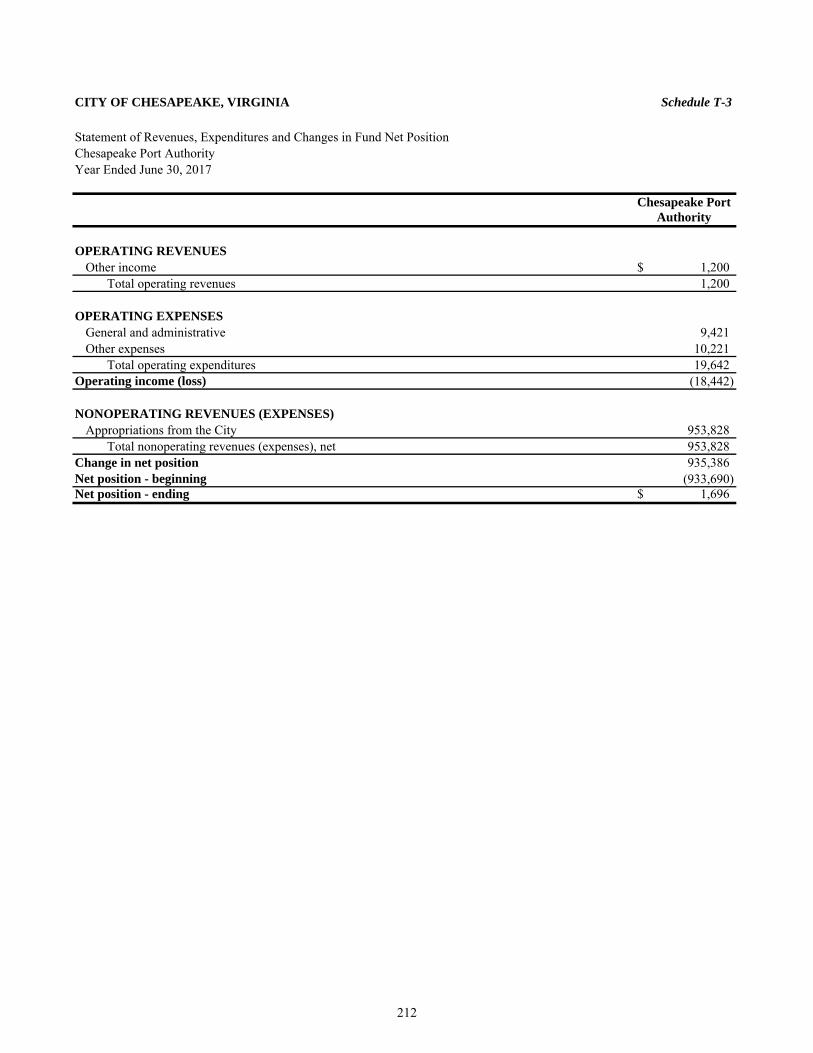
CITY OF CHESAPEAKE, VIRGINIA Schedule T-3
Statement of Revenues, Expenditures and Changes in Fund Net PositionChesapeake Port AuthorityYear Ended June 30, 2017
Chesapeake PortAuthority
OPERATING REVENUESOther income 1,200$
Total operating revenues 1,200
OPERATING EXPENSESGeneral and administrative 9,421 Other expenses 10,221
Total operating expenditures 19,642 Operating income (loss) (18,442)
NONOPERATING REVENUES (EXPENSES)Appropriations from the City 953,828
Total nonoperating revenues (expenses), net 953,828 Change in net position 935,386 Net position - beginning (933,690) Net position - ending 1,696$
212
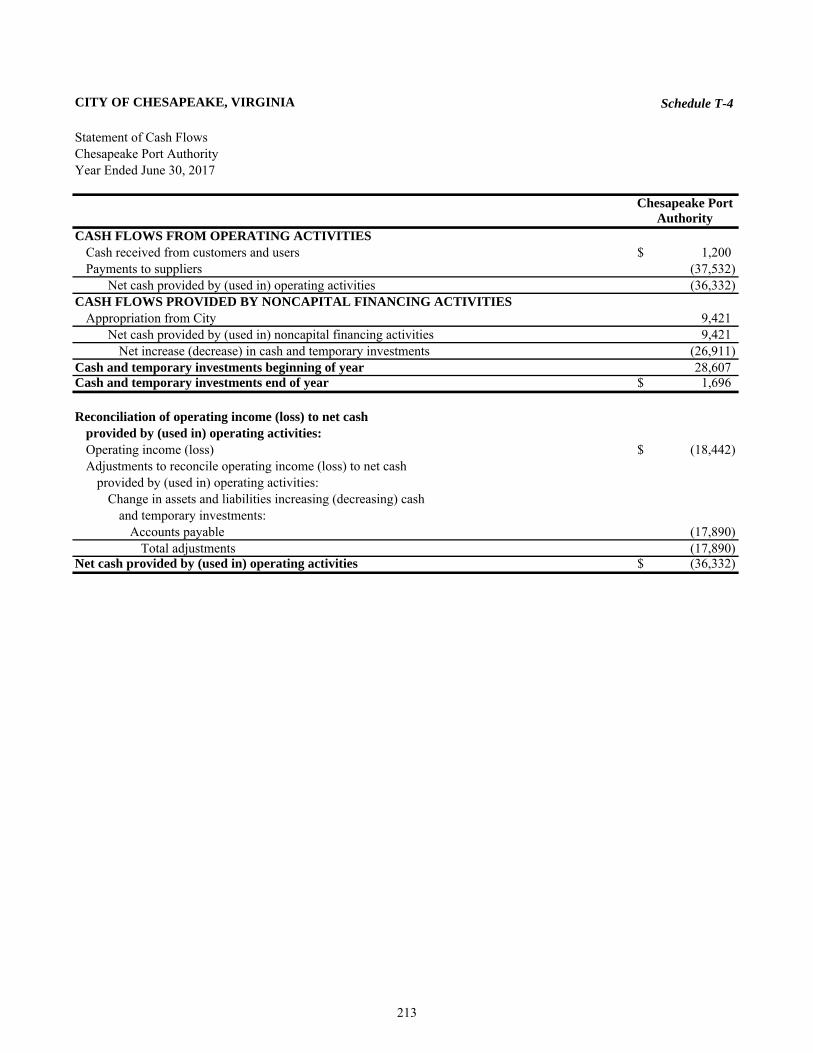
CITY OF CHESAPEAKE, VIRGINIA Schedule T-4
Statement of Cash FlowsChesapeake Port AuthorityYear Ended June 30, 2017
Chesapeake PortAuthority
CASH FLOWS FROM OPERATING ACTIVITIESCash received from customers and users 1,200$ Payments to suppliers (37,532)
Net cash provided by (used in) operating activities (36,332) CASH FLOWS PROVIDED BY NONCAPITAL FINANCING ACTIVITIES
Appropriation from City 9,421 Net cash provided by (used in) noncapital financing activities 9,421
Net increase (decrease) in cash and temporary investments (26,911) Cash and temporary investments beginning of year 28,607 Cash and temporary investments end of year 1,696$
Reconciliation of operating income (loss) to net cashprovided by (used in) operating activities:Operating income (loss) (18,442)$ Adjustments to reconcile operating income (loss) to net cash
provided by (used in) operating activities:Change in assets and liabilities increasing (decreasing) cash
and temporary investments:Accounts payable (17,890)
Total adjustments (17,890) Net cash provided by (used in) operating activities (36,332)$
213

This page intentionally left blank
STATISTICAL SECTION This part of the City of Chesapeake’s Comprehensive Annual Financial Report presents detailed information as a context for understanding how the information in the financial statements, note disclosures and required supplementary information depict the government’s overall financial health.
Financial Trends – These schedules contain information to help the reader understand how the government’s financial performance and well-being have changed over time. Revenue Capacity – These schedules contain information to help the reader assess the factors affecting the City’s ability to generate its property and sales taxes. Debt Capacity – These schedules present information to help the reader assess the affordability of the City’s current levels of outstanding debt and the City’s ability to issue additional debt in the future. Demographic and Economic Information – These schedules offer demographic and economic indicators to help the reader understand the environment within which the City’s financial activities take place and to help make comparisons over time and with other governments. Operating Information – These schedules contain service and infrastructure data to help the reader understand how the City’s financial information relates to the services the City provides and the activities it performs.
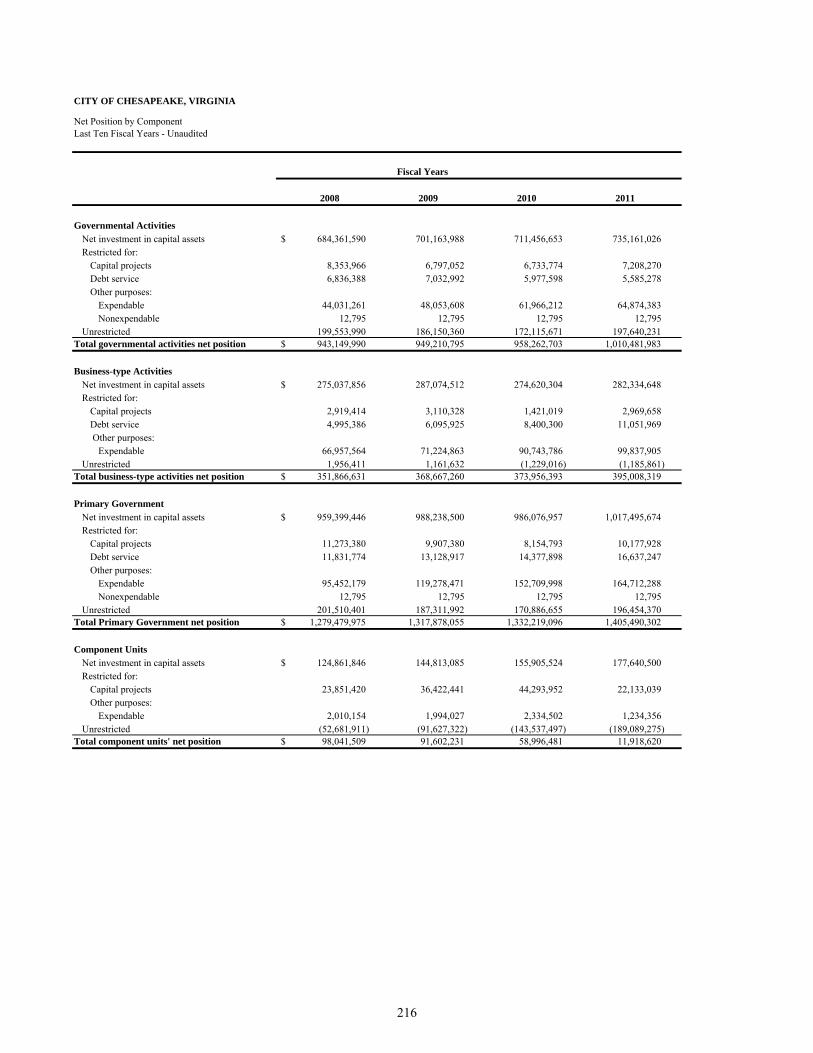
CITY OF CHESAPEAKE, VIRGINIA
Net Position by ComponentLast Ten Fiscal Years - Unaudited
2008 2009 2010 2011
Governmental ActivitiesNet investment in capital assets $ 684,361,590 701,163,988 711,456,653 735,161,026 Restricted for:
Capital projects 8,353,966 6,797,052 6,733,774 7,208,270 Debt service 6,836,388 7,032,992 5,977,598 5,585,278 Other purposes:
Expendable 44,031,261 48,053,608 61,966,212 64,874,383 Nonexpendable 12,795 12,795 12,795 12,795
Unrestricted 199,553,990 186,150,360 172,115,671 197,640,231 Total governmental activities net position $ 943,149,990 949,210,795 958,262,703 1,010,481,983
Business-type ActivitiesNet investment in capital assets $ 275,037,856 287,074,512 274,620,304 282,334,648 Restricted for:
Capital projects 2,919,414 3,110,328 1,421,019 2,969,658 Debt service 4,995,386 6,095,925 8,400,300 11,051,969 Other purposes:
Expendable 66,957,564 71,224,863 90,743,786 99,837,905 Unrestricted 1,956,411 1,161,632 (1,229,016) (1,185,861)
Total business-type activities net position $ 351,866,631 368,667,260 373,956,393 395,008,319
Primary GovernmentNet investment in capital assets $ 959,399,446 988,238,500 986,076,957 1,017,495,674 Restricted for:
Capital projects 11,273,380 9,907,380 8,154,793 10,177,928 Debt service 11,831,774 13,128,917 14,377,898 16,637,247 Other purposes:
Expendable 95,452,179 119,278,471 152,709,998 164,712,288 Nonexpendable 12,795 12,795 12,795 12,795
Unrestricted 201,510,401 187,311,992 170,886,655 196,454,370 Total Primary Government net position $ 1,279,479,975 1,317,878,055 1,332,219,096 1,405,490,302
Component UnitsNet investment in capital assets $ 124,861,846 144,813,085 155,905,524 177,640,500 Restricted for:
Capital projects 23,851,420 36,422,441 44,293,952 22,133,039 Other purposes:
Expendable 2,010,154 1,994,027 2,334,502 1,234,356 Unrestricted (52,681,911) (91,627,322) (143,537,497) (189,089,275)
Total component units' net position $ 98,041,509 91,602,231 58,996,481 11,918,620
Fiscal Years
216
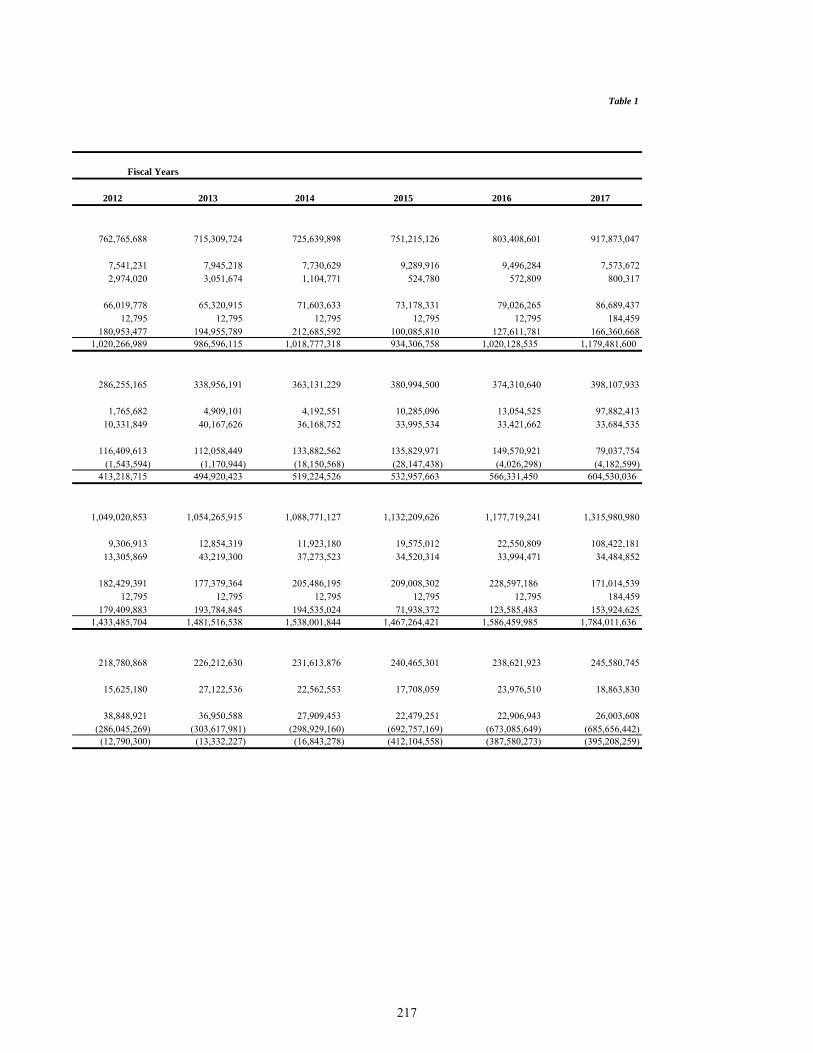
Table 1
2012 2013 2014 2015 2016 2017
762,765,688 715,309,724 725,639,898 751,215,126 803,408,601 917,873,047
7,541,231 7,945,218 7,730,629 9,289,916 9,496,284 7,573,6722,974,020 3,051,674 1,104,771 524,780 572,809 800,317
66,019,778 65,320,915 71,603,633 73,178,331 79,026,265 86,689,43712,795 12,795 12,795 12,795 12,795 184,459
180,953,477 194,955,789 212,685,592 100,085,810 127,611,781 166,360,6681,020,266,989 986,596,115 1,018,777,318 934,306,758 1,020,128,535 1,179,481,600
286,255,165 338,956,191 363,131,229 380,994,500 374,310,640 398,107,933
1,765,682 4,909,101 4,192,551 10,285,096 13,054,525 97,882,41310,331,849 40,167,626 36,168,752 33,995,534 33,421,662 33,684,535
116,409,613 112,058,449 133,882,562 135,829,971 149,570,921 79,037,754(1,543,594) (1,170,944) (18,150,568) (28,147,438) (4,026,298) (4,182,599)
413,218,715 494,920,423 519,224,526 532,957,663 566,331,450 604,530,036
1,049,020,853 1,054,265,915 1,088,771,127 1,132,209,626 1,177,719,241 1,315,980,980
9,306,913 12,854,319 11,923,180 19,575,012 22,550,809 108,422,18113,305,869 43,219,300 37,273,523 34,520,314 33,994,471 34,484,852
182,429,391 177,379,364 205,486,195 209,008,302 228,597,186 171,014,53912,795 12,795 12,795 12,795 12,795 184,459
179,409,883 193,784,845 194,535,024 71,938,372 123,585,483 153,924,6251,433,485,704 1,481,516,538 1,538,001,844 1,467,264,421 1,586,459,985 1,784,011,636
218,780,868 226,212,630 231,613,876 240,465,301 238,621,923 245,580,745
15,625,180 27,122,536 22,562,553 17,708,059 23,976,510 18,863,830
38,848,921 36,950,588 27,909,453 22,479,251 22,906,943 26,003,608(286,045,269) (303,617,981) (298,929,160) (692,757,169) (673,085,649) (685,656,442)
(12,790,300) (13,332,227) (16,843,278) (412,104,558) (387,580,273) (395,208,259)
Fiscal Years
217
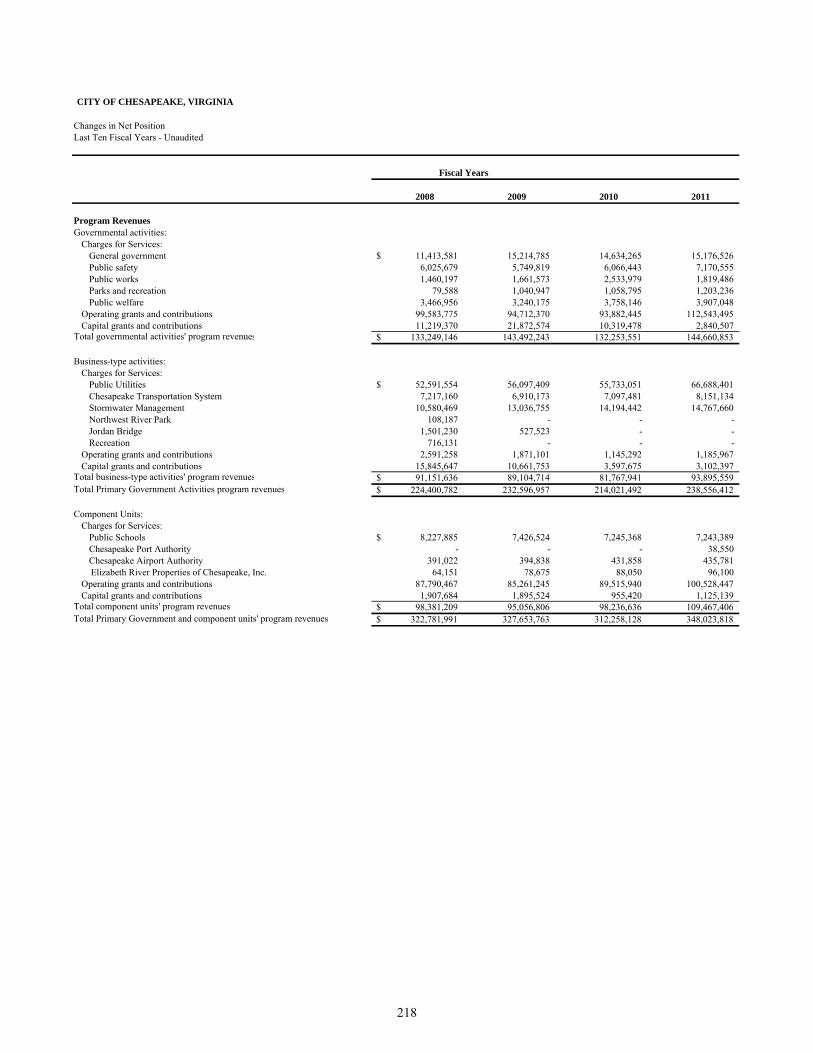
CITY OF CHESAPEAKE, VIRGINIA
Changes in Net PositionLast Ten Fiscal Years - Unaudited
2008 2009 2010 2011
Program RevenuesGovernmental activities:
Charges for Services:General government $ 11,413,581 15,214,785 14,634,265 15,176,526 Public safety 6,025,679 5,749,819 6,066,443 7,170,555 Public works 1,460,197 1,661,573 2,533,979 1,819,486 Parks and recreation 79,588 1,040,947 1,058,795 1,203,236 Public welfare 3,466,956 3,240,175 3,758,146 3,907,048
Operating grants and contributions 99,583,775 94,712,370 93,882,445 112,543,495 Capital grants and contributions 11,219,370 21,872,574 10,319,478 2,840,507
Total governmental activities' program revenues $ 133,249,146 143,492,243 132,253,551 144,660,853
Business-type activities:Charges for Services:
Public Utilities $ 52,591,554 56,097,409 55,733,051 66,688,401 Chesapeake Transportation System 7,217,160 6,910,173 7,097,481 8,151,134 Stormwater Management 10,580,469 13,036,755 14,194,442 14,767,660 Northwest River Park 108,187 - - - Jordan Bridge 1,501,230 527,523 - - Recreation 716,131 - - -
Operating grants and contributions 2,591,258 1,871,101 1,145,292 1,185,967 Capital grants and contributions 15,845,647 10,661,753 3,597,675 3,102,397
Total business-type activities' program revenues $ 91,151,636 89,104,714 81,767,941 93,895,559 Total Primary Government Activities program revenues $ 224,400,782 232,596,957 214,021,492 238,556,412
Component Units:Charges for Services:
Public Schools $ 8,227,885 7,426,524 7,245,368 7,243,389 Chesapeake Port Authority - - - 38,550 Chesapeake Airport Authority 391,022 394,838 431,858 435,781
Elizabeth River Properties of Chesapeake, Inc. 64,151 78,675 88,050 96,100 Operating grants and contributions 87,790,467 85,261,245 89,515,940 100,528,447 Capital grants and contributions 1,907,684 1,895,524 955,420 1,125,139
Total component units' program revenues $ 98,381,209 95,056,806 98,236,636 109,467,406 Total Primary Government and component units' program revenues $ 322,781,991 327,653,763 312,258,128 348,023,818
Fiscal Years
218
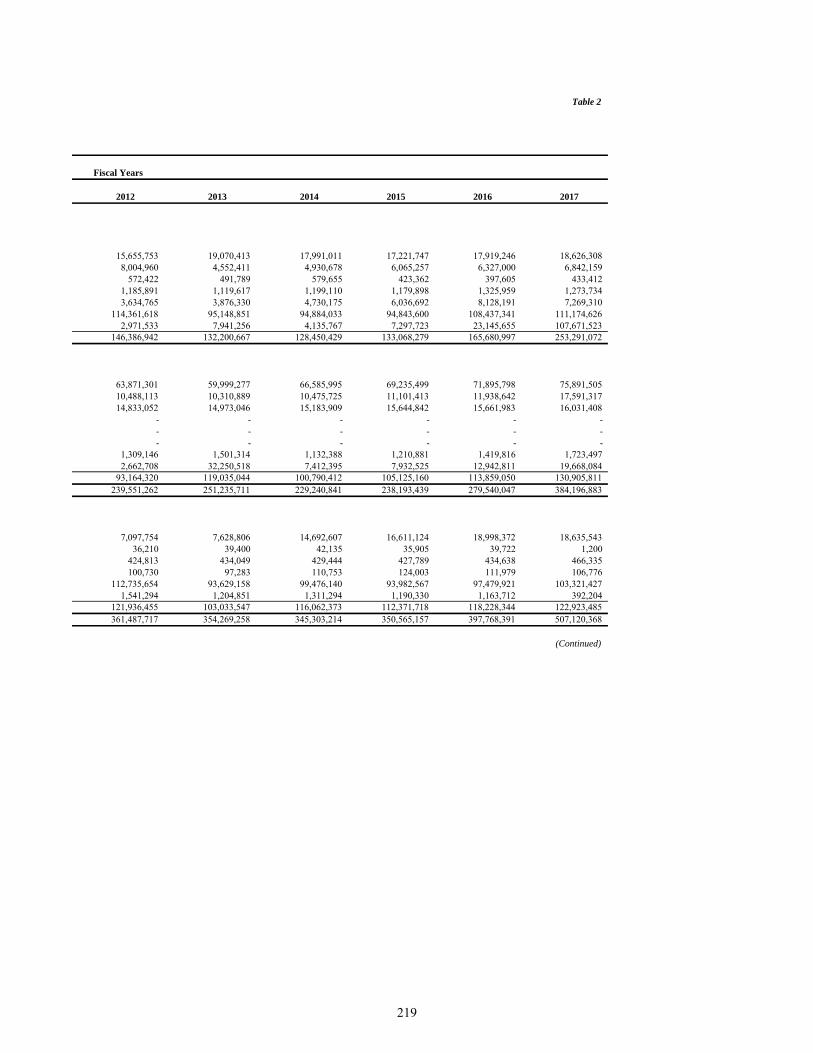
Table 2
2012 2013 2014 2015 2016 2017
15,655,753 19,070,413 17,991,011 17,221,747 17,919,246 18,626,308 8,004,960 4,552,411 4,930,678 6,065,257 6,327,000 6,842,159
572,422 491,789 579,655 423,362 397,605 433,412 1,185,891 1,119,617 1,199,110 1,179,898 1,325,959 1,273,734 3,634,765 3,876,330 4,730,175 6,036,692 8,128,191 7,269,310
114,361,618 95,148,851 94,884,033 94,843,600 108,437,341 111,174,626 2,971,533 7,941,256 4,135,767 7,297,723 23,145,655 107,671,523
146,386,942 132,200,667 128,450,429 133,068,279 165,680,997 253,291,072
63,871,301 59,999,277 66,585,995 69,235,499 71,895,798 75,891,505 10,488,113 10,310,889 10,475,725 11,101,413 11,938,642 17,591,317 14,833,052 14,973,046 15,183,909 15,644,842 15,661,983 16,031,408
- - - - - - - - - - - - - - - - - -
1,309,146 1,501,314 1,132,388 1,210,881 1,419,816 1,723,497 2,662,708 32,250,518 7,412,395 7,932,525 12,942,811 19,668,084
93,164,320 119,035,044 100,790,412 105,125,160 113,859,050 130,905,811 239,551,262 251,235,711 229,240,841 238,193,439 279,540,047 384,196,883
7,097,754 7,628,806 14,692,607 16,611,124 18,998,372 18,635,543 36,210 39,400 42,135 35,905 39,722 1,200
424,813 434,049 429,444 427,789 434,638 466,335 100,730 97,283 110,753 124,003 111,979 106,776
112,735,654 93,629,158 99,476,140 93,982,567 97,479,921 103,321,427 1,541,294 1,204,851 1,311,294 1,190,330 1,163,712 392,204
121,936,455 103,033,547 116,062,373 112,371,718 118,228,344 122,923,485 361,487,717 354,269,258 345,303,214 350,565,157 397,768,391 507,120,368
(Continued)
Fiscal Years
219
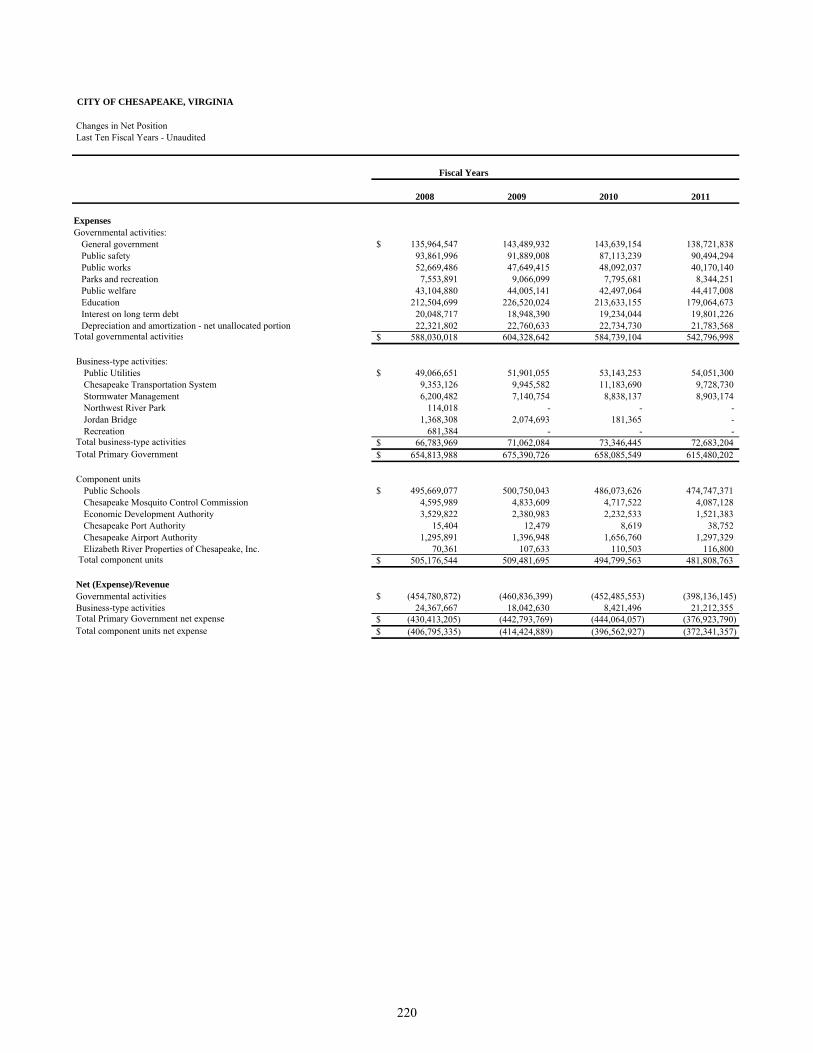
CITY OF CHESAPEAKE, VIRGINIA
Changes in Net Position Last Ten Fiscal Years - Unaudited
2008 2009 2010 2011
ExpensesGovernmental activities:
General government $ 135,964,547 143,489,932 143,639,154 138,721,838 Public safety 93,861,996 91,889,008 87,113,239 90,494,294 Public works 52,669,486 47,649,415 48,092,037 40,170,140 Parks and recreation 7,553,891 9,066,099 7,795,681 8,344,251 Public welfare 43,104,880 44,005,141 42,497,064 44,417,008 Education 212,504,699 226,520,024 213,633,155 179,064,673 Interest on long term debt 20,048,717 18,948,390 19,234,044 19,801,226 Depreciation and amortization - net unallocated portion 22,321,802 22,760,633 22,734,730 21,783,568
Total governmental activities $ 588,030,018 604,328,642 584,739,104 542,796,998
Business-type activities: Public Utilities $ 49,066,651 51,901,055 53,143,253 54,051,300 Chesapeake Transportation System 9,353,126 9,945,582 11,183,690 9,728,730 Stormwater Management 6,200,482 7,140,754 8,838,137 8,903,174 Northwest River Park 114,018 - - - Jordan Bridge 1,368,308 2,074,693 181,365 - Recreation 681,384 - - -
Total business-type activities $ 66,783,969 71,062,084 73,346,445 72,683,204 Total Primary Government $ 654,813,988 675,390,726 658,085,549 615,480,202
Component units Public Schools $ 495,669,077 500,750,043 486,073,626 474,747,371 Chesapeake Mosquito Control Commission 4,595,989 4,833,609 4,717,522 4,087,128 Economic Development Authority 3,529,822 2,380,983 2,232,533 1,521,383 Chesapeake Port Authority 15,404 12,479 8,619 38,752 Chesapeake Airport Authority 1,295,891 1,396,948 1,656,760 1,297,329 Elizabeth River Properties of Chesapeake, Inc. 70,361 107,633 110,503 116,800
Total component units $ 505,176,544 509,481,695 494,799,563 481,808,763
Net (Expense)/Revenue Governmental activities $ (454,780,872) (460,836,399) (452,485,553) (398,136,145) Business-type activities 24,367,667 18,042,630 8,421,496 21,212,355 Total Primary Government net expense $ (430,413,205) (442,793,769) (444,064,057) (376,923,790) Total component units net expense $ (406,795,335) (414,424,889) (396,562,927) (372,341,357)
Fiscal Years
220
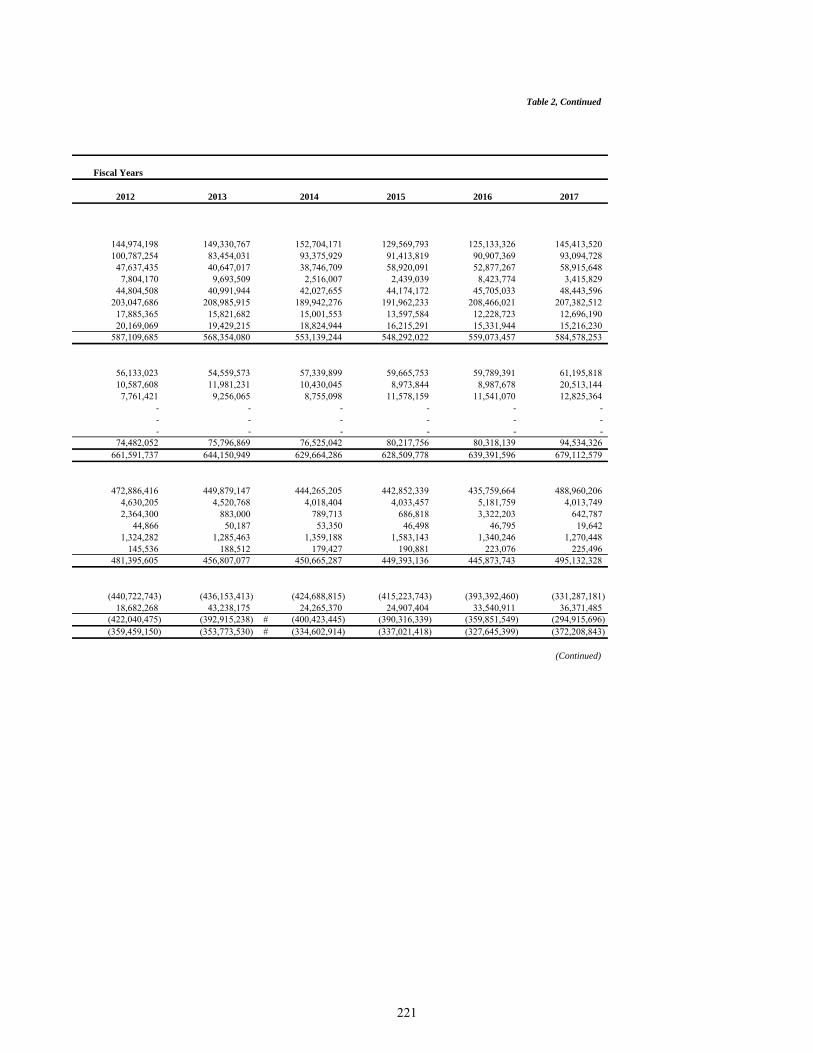
Table 2, Continued
2012 2013 2014 2015 2016 2017
144,974,198 149,330,767 152,704,171 129,569,793 125,133,326 145,413,520 100,787,254 83,454,031 93,375,929 91,413,819 90,907,369 93,094,728
47,637,435 40,647,017 38,746,709 58,920,091 52,877,267 58,915,648 7,804,170 9,693,509 2,516,007 2,439,039 8,423,774 3,415,829
44,804,508 40,991,944 42,027,655 44,174,172 45,705,033 48,443,596 203,047,686 208,985,915 189,942,276 191,962,233 208,466,021 207,382,512
17,885,365 15,821,682 15,001,553 13,597,584 12,228,723 12,696,190 20,169,069 19,429,215 18,824,944 16,215,291 15,331,944 15,216,230
587,109,685 568,354,080 553,139,244 548,292,022 559,073,457 584,578,253
56,133,023 54,559,573 57,339,899 59,665,753 59,789,391 61,195,818 10,587,608 11,981,231 10,430,045 8,973,844 8,987,678 20,513,144
7,761,421 9,256,065 8,755,098 11,578,159 11,541,070 12,825,364 - - - - - - - - - - - - - - - - - -
74,482,052 75,796,869 76,525,042 80,217,756 80,318,139 94,534,326 661,591,737 644,150,949 629,664,286 628,509,778 639,391,596 679,112,579
472,886,416 449,879,147 444,265,205 442,852,339 435,759,664 488,960,206 4,630,205 4,520,768 4,018,404 4,033,457 5,181,759 4,013,749 2,364,300 883,000 789,713 686,818 3,322,203 642,787
44,866 50,187 53,350 46,498 46,795 19,642 1,324,282 1,285,463 1,359,188 1,583,143 1,340,246 1,270,448
145,536 188,512 179,427 190,881 223,076 225,496 481,395,605 456,807,077 450,665,287 449,393,136 445,873,743 495,132,328
(440,722,743) (436,153,413) (424,688,815) (415,223,743) (393,392,460) (331,287,181) 18,682,268 43,238,175 24,265,370 24,907,404 33,540,911 36,371,485
(422,040,475) (392,915,238) # (400,423,445) (390,316,339) (359,851,549) (294,915,696) (359,459,150) (353,773,530) # (334,602,914) (337,021,418) (327,645,399) (372,208,843)
(Continued)
Fiscal Years
221
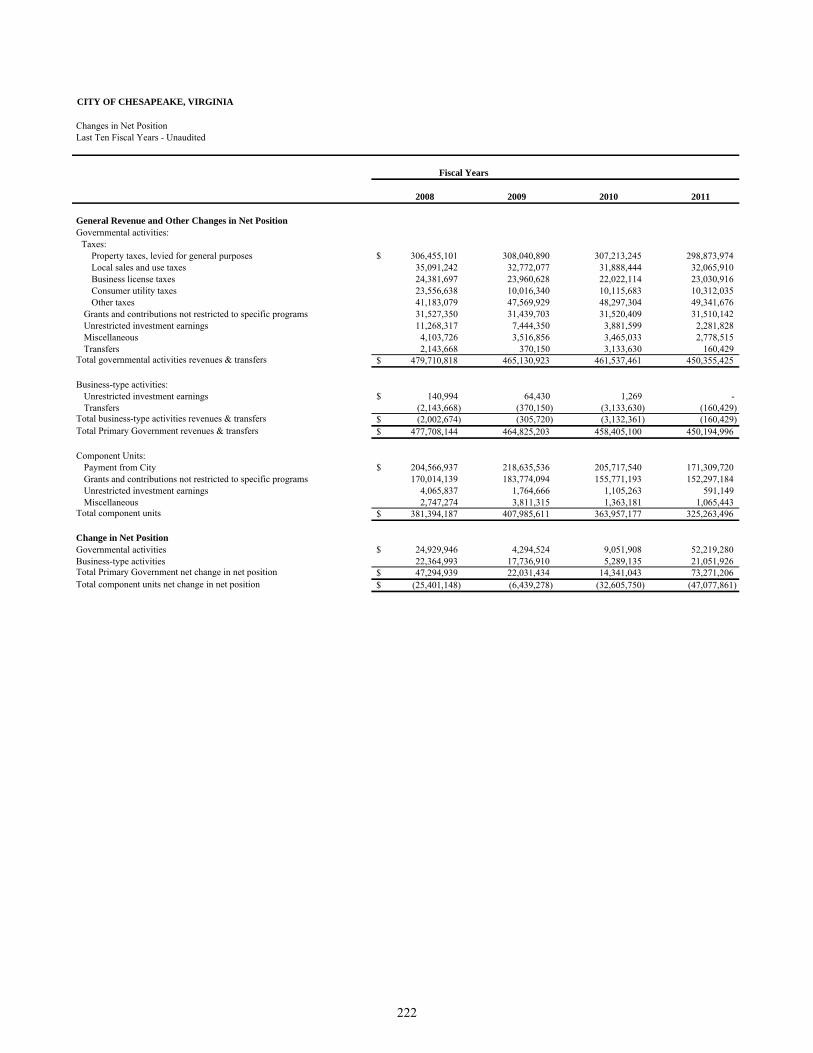
CITY OF CHESAPEAKE, VIRGINIA
Changes in Net Position Last Ten Fiscal Years - Unaudited
2008 2009 2010 2011
General Revenue and Other Changes in Net Position Governmental activities:
Taxes: Property taxes, levied for general purposes $ 306,455,101 308,040,890 307,213,245 298,873,974 Local sales and use taxes 35,091,242 32,772,077 31,888,444 32,065,910 Business license taxes 24,381,697 23,960,628 22,022,114 23,030,916 Consumer utility taxes 23,556,638 10,016,340 10,115,683 10,312,035 Other taxes 41,183,079 47,569,929 48,297,304 49,341,676
Grants and contributions not restricted to specific programs 31,527,350 31,439,703 31,520,409 31,510,142 Unrestricted investment earnings 11,268,317 7,444,350 3,881,599 2,281,828 Miscellaneous 4,103,726 3,516,856 3,465,033 2,778,515 Transfers 2,143,668 370,150 3,133,630 160,429
Total governmental activities revenues & transfers $ 479,710,818 465,130,923 461,537,461 450,355,425
Business-type activities: Unrestricted investment earnings $ 140,994 64,430 1,269 - Transfers (2,143,668) (370,150) (3,133,630) (160,429)
Total business-type activities revenues & transfers $ (2,002,674) (305,720) (3,132,361) (160,429) Total Primary Government revenues & transfers $ 477,708,144 464,825,203 458,405,100 450,194,996
Component Units: Payment from City $ 204,566,937 218,635,536 205,717,540 171,309,720 Grants and contributions not restricted to specific programs 170,014,139 183,774,094 155,771,193 152,297,184 Unrestricted investment earnings 4,065,837 1,764,666 1,105,263 591,149 Miscellaneous 2,747,274 3,811,315 1,363,181 1,065,443
Total component units $ 381,394,187 407,985,611 363,957,177 325,263,496
Change in Net Position Governmental activities $ 24,929,946 4,294,524 9,051,908 52,219,280 Business-type activities 22,364,993 17,736,910 5,289,135 21,051,926 Total Primary Government net change in net position $ 47,294,939 22,031,434 14,341,043 73,271,206 Total component units net change in net position $ (25,401,148) (6,439,278) (32,605,750) (47,077,861)
Fiscal Years
222
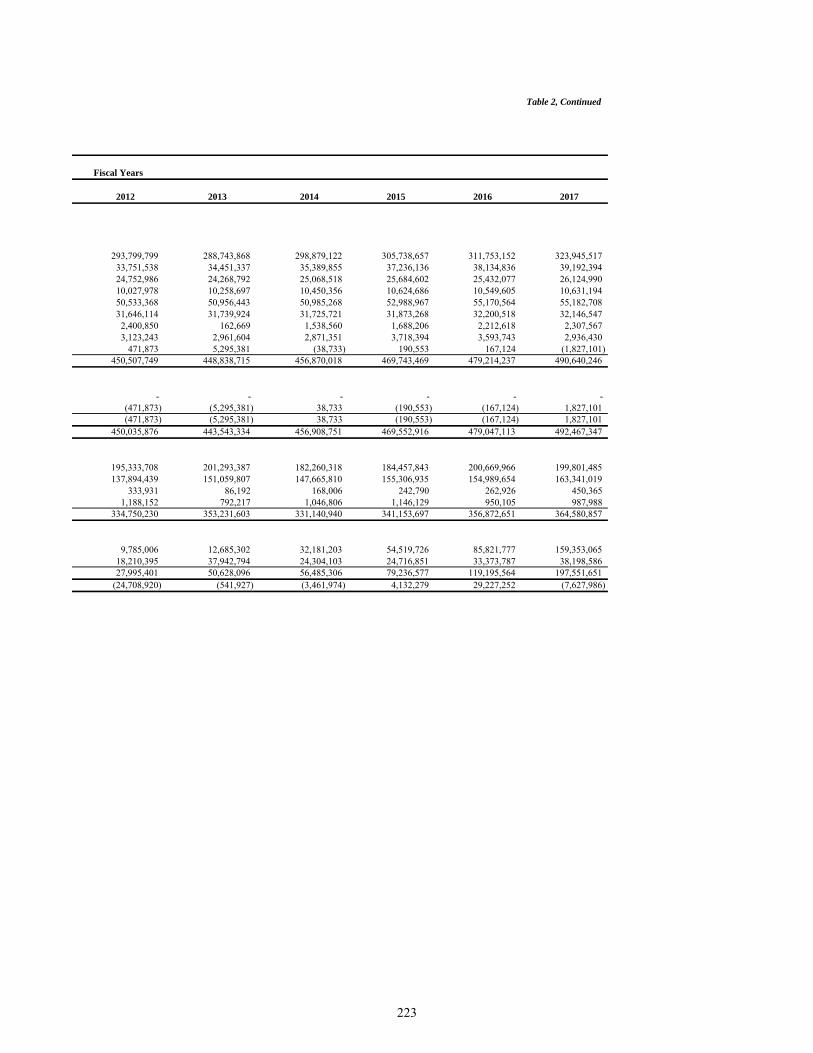
Table 2, Continued
2012 2013 2014 2015 2016 2017
293,799,799 288,743,868 298,879,122 305,738,657 311,753,152 323,945,517 33,751,538 34,451,337 35,389,855 37,236,136 38,134,836 39,192,394 24,752,986 24,268,792 25,068,518 25,684,602 25,432,077 26,124,990 10,027,978 10,258,697 10,450,356 10,624,686 10,549,605 10,631,194 50,533,368 50,956,443 50,985,268 52,988,967 55,170,564 55,182,708 31,646,114 31,739,924 31,725,721 31,873,268 32,200,518 32,146,547
2,400,850 162,669 1,538,560 1,688,206 2,212,618 2,307,567 3,123,243 2,961,604 2,871,351 3,718,394 3,593,743 2,936,430
471,873 5,295,381 (38,733) 190,553 167,124 (1,827,101) 450,507,749 448,838,715 456,870,018 469,743,469 479,214,237 490,640,246
- - - - - - (471,873) (5,295,381) 38,733 (190,553) (167,124) 1,827,101 (471,873) (5,295,381) 38,733 (190,553) (167,124) 1,827,101
450,035,876 443,543,334 456,908,751 469,552,916 479,047,113 492,467,347
195,333,708 201,293,387 182,260,318 184,457,843 200,669,966 199,801,485 137,894,439 151,059,807 147,665,810 155,306,935 154,989,654 163,341,019
333,931 86,192 168,006 242,790 262,926 450,365 1,188,152 792,217 1,046,806 1,146,129 950,105 987,988
334,750,230 353,231,603 331,140,940 341,153,697 356,872,651 364,580,857
9,785,006 12,685,302 32,181,203 54,519,726 85,821,777 159,353,065 18,210,395 37,942,794 24,304,103 24,716,851 33,373,787 38,198,586 27,995,401 50,628,096 56,485,306 79,236,577 119,195,564 197,551,651
(24,708,920) (541,927) (3,461,974) 4,132,279 29,227,252 (7,627,986)
Fiscal Years
223

This page intentionally left blank
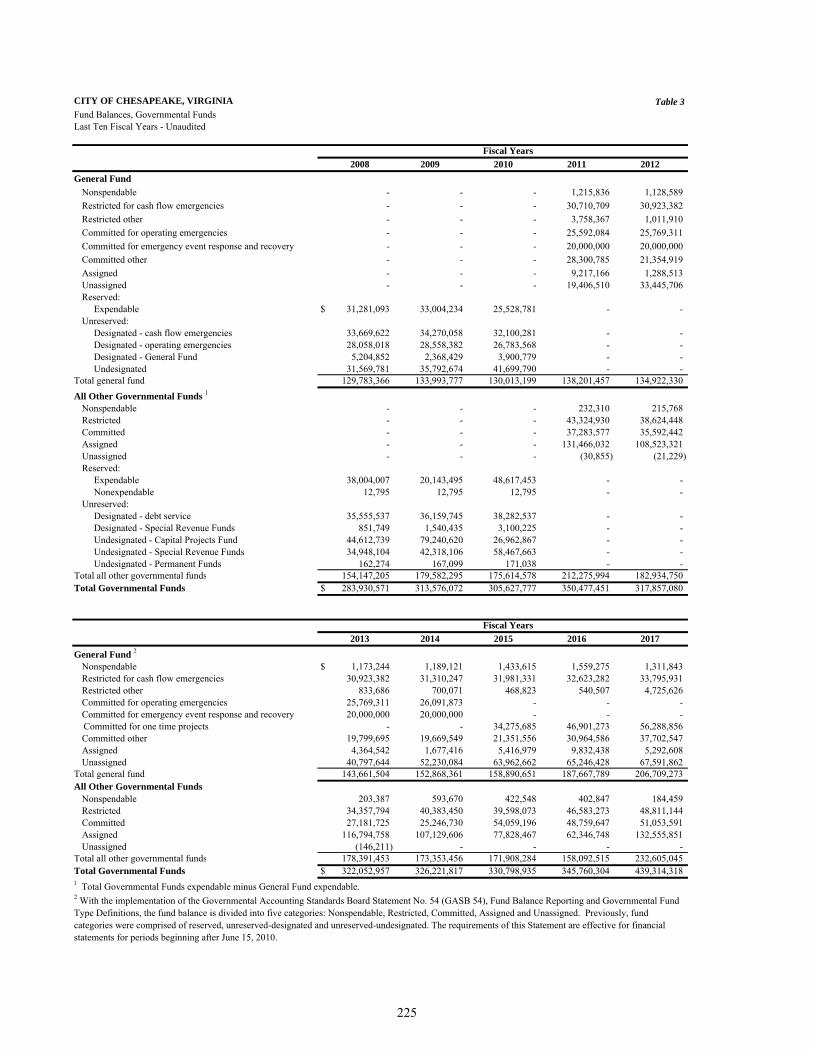
CITY OF CHESAPEAKE, VIRGINIA Table 3Fund Balances, Governmental FundsLast Ten Fiscal Years - Unaudited
2008 2009 2010 2011 2012General Fund
Nonspendable - - - 1,215,836 1,128,589 Restricted for cash flow emergencies - - - 30,710,709 30,923,382 Restricted other - - - 3,758,367 1,011,910 Committed for operating emergencies - - - 25,592,084 25,769,311 Committed for emergency event response and recovery - - - 20,000,000 20,000,000 Committed other - - - 28,300,785 21,354,919 Assigned - - - 9,217,166 1,288,513 Unassigned - - - 19,406,510 33,445,706 Reserved: Expendable $ 31,281,093 33,004,234 25,528,781 - - Unreserved: Designated - cash flow emergencies 33,669,622 34,270,058 32,100,281 - - Designated - operating emergencies 28,058,018 28,558,382 26,783,568 - - Designated - General Fund 5,204,852 2,368,429 3,900,779 - - Undesignated 31,569,781 35,792,674 41,699,790 - -
Total general fund 129,783,366 133,993,777 130,013,199 138,201,457 134,922,330 All Other Governmental Funds 1
Nonspendable - - - 232,310 215,768 Restricted - - - 43,324,930 38,624,448 Committed - - - 37,283,577 35,592,442 Assigned - - - 131,466,032 108,523,321 Unassigned - - - (30,855) (21,229) Reserved: Expendable 38,004,007 20,143,495 48,617,453 - - Nonexpendable 12,795 12,795 12,795 - - Unreserved: Designated - debt service 35,555,537 36,159,745 38,282,537 - - Designated - Special Revenue Funds 851,749 1,540,435 3,100,225 - - Undesignated - Capital Projects Fund 44,612,739 79,240,620 26,962,867 - - Undesignated - Special Revenue Funds 34,948,104 42,318,106 58,467,663 - - Undesignated - Permanent Funds 162,274 167,099 171,038 - -
Total all other governmental funds 154,147,205 179,582,295 175,614,578 212,275,994 182,934,750 Total Governmental Funds $ 283,930,571 313,576,072 305,627,777 350,477,451 317,857,080
2013 2014 2015 2016 2017General Fund 2
Nonspendable $ 1,173,244 1,189,121 1,433,615 1,559,275 1,311,843 Restricted for cash flow emergencies 30,923,382 31,310,247 31,981,331 32,623,282 33,795,931 Restricted other 833,686 700,071 468,823 540,507 4,725,626 Committed for operating emergencies 25,769,311 26,091,873 - - - Committed for emergency event response and recovery 20,000,000 20,000,000 - - -
Committed for one time projects - - 34,275,685 46,901,273 56,288,856 Committed other 19,799,695 19,669,549 21,351,556 30,964,586 37,702,547 Assigned 4,364,542 1,677,416 5,416,979 9,832,438 5,292,608 Unassigned 40,797,644 52,230,084 63,962,662 65,246,428 67,591,862
Total general fund 143,661,504 152,868,361 158,890,651 187,667,789 206,709,273 All Other Governmental Funds
Nonspendable 203,387 593,670 422,548 402,847 184,459 Restricted 34,357,794 40,383,450 39,598,073 46,583,273 48,811,144 Committed 27,181,725 25,246,730 54,059,196 48,759,647 51,053,591 Assigned 116,794,758 107,129,606 77,828,467 62,346,748 132,555,851 Unassigned (146,211) - - - -
Total all other governmental funds 178,391,453 173,353,456 171,908,284 158,092,515 232,605,045 Total Governmental Funds $ 322,052,957 326,221,817 330,798,935 345,760,304 439,314,318
Fiscal Years
1 Total Governmental Funds expendable minus General Fund expendable.
Fiscal Years
2 With the implementation of the Governmental Accounting Standards Board Statement No. 54 (GASB 54), Fund Balance Reporting and Governmental Fund Type Definitions, the fund balance is divided into five categories: Nonspendable, Restricted, Committed, Assigned and Unassigned. Previously, fund categories were comprised of reserved, unreserved-designated and unreserved-undesignated. The requirements of this Statement are effective for financial statements for periods beginning after June 15, 2010.
225
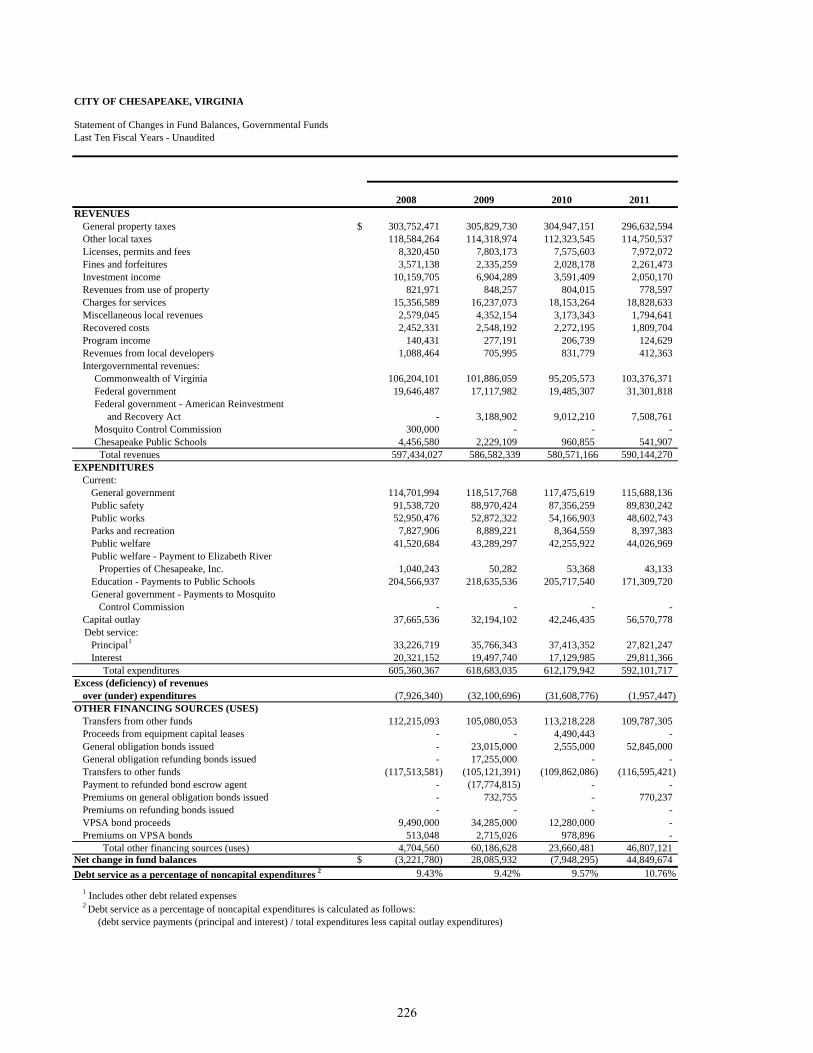
CITY OF CHESAPEAKE, VIRGINIA
Statement of Changes in Fund Balances, Governmental FundsLast Ten Fiscal Years - Unaudited
2008 2009 2010 2011REVENUES
General property taxes $ 303,752,471 305,829,730 304,947,151 296,632,594 Other local taxes 118,584,264 114,318,974 112,323,545 114,750,537 Licenses, permits and fees 8,320,450 7,803,173 7,575,603 7,972,072 Fines and forfeitures 3,571,138 2,335,259 2,028,178 2,261,473 Investment income 10,159,705 6,904,289 3,591,409 2,050,170 Revenues from use of property 821,971 848,257 804,015 778,597 Charges for services 15,356,589 16,237,073 18,153,264 18,828,633 Miscellaneous local revenues 2,579,045 4,352,154 3,173,343 1,794,641 Recovered costs 2,452,331 2,548,192 2,272,195 1,809,704 Program income 140,431 277,191 206,739 124,629 Revenues from local developers 1,088,464 705,995 831,779 412,363 Intergovernmental revenues:
Commonwealth of Virginia 106,204,101 101,886,059 95,205,573 103,376,371 Federal government 19,646,487 17,117,982 19,485,307 31,301,818 Federal government - American Reinvestment and Recovery Act - 3,188,902 9,012,210 7,508,761 Mosquito Control Commission 300,000 - - - Chesapeake Public Schools 4,456,580 2,229,109 960,855 541,907 Total revenues 597,434,027 586,582,339 580,571,166 590,144,270 EXPENDITURES
Current: General government 114,701,994 118,517,768 117,475,619 115,688,136 Public safety 91,538,720 88,970,424 87,356,259 89,830,242 Public works 52,950,476 52,872,322 54,166,903 48,602,743 Parks and recreation 7,827,906 8,889,221 8,364,559 8,397,383 Public welfare 41,520,684 43,289,297 42,255,922 44,026,969 Public welfare - Payment to Elizabeth River Properties of Chesapeake, Inc. 1,040,243 50,282 53,368 43,133 Education - Payments to Public Schools 204,566,937 218,635,536 205,717,540 171,309,720 General government - Payments to Mosquito Control Commission - - - -
Capital outlay 37,665,536 32,194,102 42,246,435 56,570,778 Debt service:
Principal1 33,226,719 35,766,343 37,413,352 27,821,247 Interest 20,321,152 19,497,740 17,129,985 29,811,366
Total expenditures 605,360,367 618,683,035 612,179,942 592,101,717 Excess (deficiency) of revenues
over (under) expenditures (7,926,340) (32,100,696) (31,608,776) (1,957,447) OTHER FINANCING SOURCES (USES)
Transfers from other funds 112,215,093 105,080,053 113,218,228 109,787,305 Proceeds from equipment capital leases - - 4,490,443 - General obligation bonds issued - 23,015,000 2,555,000 52,845,000 General obligation refunding bonds issued - 17,255,000 - - Transfers to other funds (117,513,581) (105,121,391) (109,862,086) (116,595,421) Payment to refunded bond escrow agent - (17,774,815) - - Premiums on general obligation bonds issued - 732,755 - 770,237 Premiums on refunding bonds issued - - - - VPSA bond proceeds 9,490,000 34,285,000 12,280,000 - Premiums on VPSA bonds 513,048 2,715,026 978,896 -
Total other financing sources (uses) 4,704,560 60,186,628 23,660,481 46,807,121 Net change in fund balances $ (3,221,780) 28,085,932 (7,948,295) 44,849,674 Debt service as a percentage of noncapital expenditures 2 9.43% 9.42% 9.57% 10.76%
1 Includes other debt related expenses 2 Debt service as a percentage of noncapital expenditures is calculated as follows: (debt service payments (principal and interest) / total expenditures less capital outlay expenditures)
226
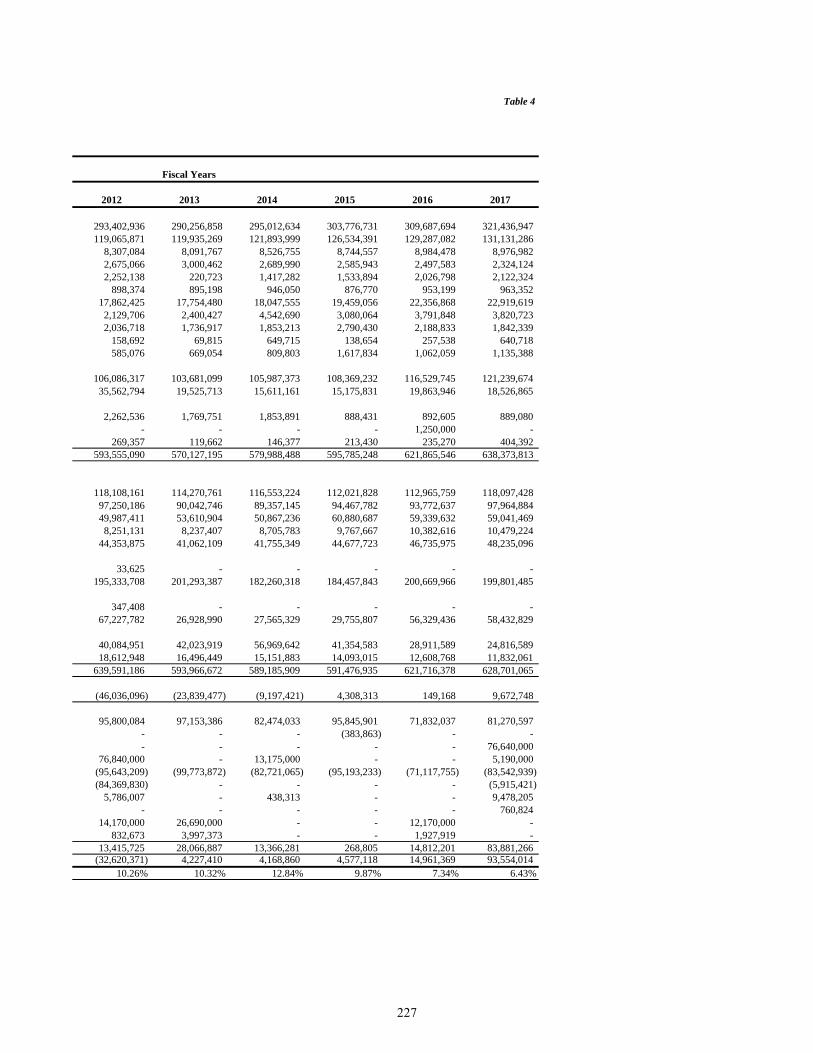
Table 4
2012 2013 2014 2015 2016 2017
293,402,936 290,256,858 295,012,634 303,776,731 309,687,694 321,436,947 119,065,871 119,935,269 121,893,999 126,534,391 129,287,082 131,131,286
8,307,084 8,091,767 8,526,755 8,744,557 8,984,478 8,976,982 2,675,066 3,000,462 2,689,990 2,585,943 2,497,583 2,324,124 2,252,138 220,723 1,417,282 1,533,894 2,026,798 2,122,324
898,374 895,198 946,050 876,770 953,199 963,352 17,862,425 17,754,480 18,047,555 19,459,056 22,356,868 22,919,619 2,129,706 2,400,427 4,542,690 3,080,064 3,791,848 3,820,723 2,036,718 1,736,917 1,853,213 2,790,430 2,188,833 1,842,339
158,692 69,815 649,715 138,654 257,538 640,718 585,076 669,054 809,803 1,617,834 1,062,059 1,135,388
106,086,317 103,681,099 105,987,373 108,369,232 116,529,745 121,239,674 35,562,794 19,525,713 15,611,161 15,175,831 19,863,946 18,526,865
2,262,536 1,769,751 1,853,891 888,431 892,605 889,080 - - - - 1,250,000 -
269,357 119,662 146,377 213,430 235,270 404,392 593,555,090 570,127,195 579,988,488 595,785,248 621,865,546 638,373,813
118,108,161 114,270,761 116,553,224 112,021,828 112,965,759 118,097,428 97,250,186 90,042,746 89,357,145 94,467,782 93,772,637 97,964,884 49,987,411 53,610,904 50,867,236 60,880,687 59,339,632 59,041,469 8,251,131 8,237,407 8,705,783 9,767,667 10,382,616 10,479,224
44,353,875 41,062,109 41,755,349 44,677,723 46,735,975 48,235,096
33,625 - - - - - 195,333,708 201,293,387 182,260,318 184,457,843 200,669,966 199,801,485
347,408 - - - - - 67,227,782 26,928,990 27,565,329 29,755,807 56,329,436 58,432,829
40,084,951 42,023,919 56,969,642 41,354,583 28,911,589 24,816,589 18,612,948 16,496,449 15,151,883 14,093,015 12,608,768 11,832,061
639,591,186 593,966,672 589,185,909 591,476,935 621,716,378 628,701,065
(46,036,096) (23,839,477) (9,197,421) 4,308,313 149,168 9,672,748
95,800,084 97,153,386 82,474,033 95,845,901 71,832,037 81,270,597 - - - (383,863) - - - - - - - 76,640,000
76,840,000 - 13,175,000 - - 5,190,000 (95,643,209) (99,773,872) (82,721,065) (95,193,233) (71,117,755) (83,542,939) (84,369,830) - - - - (5,915,421)
5,786,007 - 438,313 - - 9,478,205 - - - - - 760,824
14,170,000 26,690,000 - - 12,170,000 - 832,673 3,997,373 - - 1,927,919 -
13,415,725 28,066,887 13,366,281 268,805 14,812,201 83,881,266 (32,620,371) 4,227,410 4,168,860 4,577,118 14,961,369 93,554,014
10.26% 10.32% 12.84% 9.87% 7.34% 6.43%
Fiscal Years
227
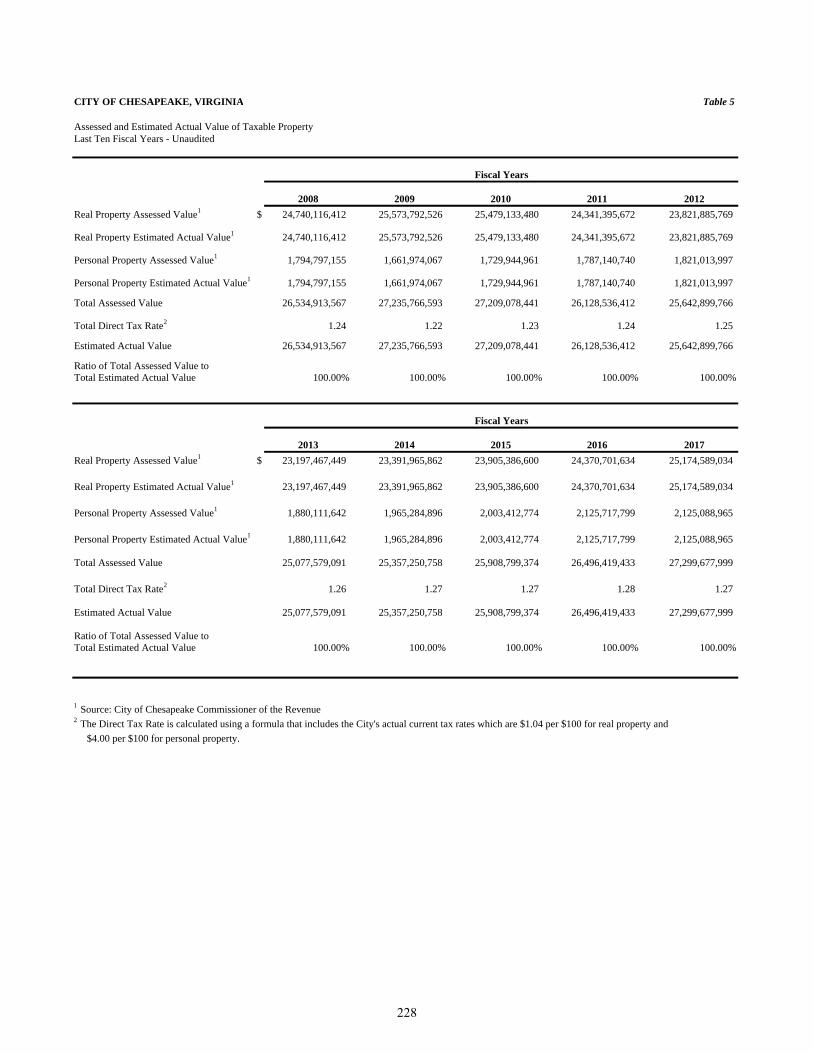
CITY OF CHESAPEAKE, VIRGINIA Table 5
2008 2009 2010 2011 2012Real Property Assessed Value1 $ 24,740,116,412 25,573,792,526 25,479,133,480 24,341,395,672 23,821,885,769
Real Property Estimated Actual Value1 24,740,116,412 25,573,792,526 25,479,133,480 24,341,395,672 23,821,885,769
Personal Property Assessed Value1 1,794,797,155 1,661,974,067 1,729,944,961 1,787,140,740 1,821,013,997
Personal Property Estimated Actual Value1 1,794,797,155 1,661,974,067 1,729,944,961 1,787,140,740 1,821,013,997
Total Assessed Value 26,534,913,567 27,235,766,593 27,209,078,441 26,128,536,412 25,642,899,766
Total Direct Tax Rate2 1.24 1.22 1.23 1.24 1.25
Estimated Actual Value 26,534,913,567 27,235,766,593 27,209,078,441 26,128,536,412 25,642,899,766
Ratio of Total Assessed Value toTotal Estimated Actual Value 100.00% 100.00% 100.00% 100.00% 100.00%
2013 2014 2015 2016 2017Real Property Assessed Value1 $ 23,197,467,449 23,391,965,862 23,905,386,600 24,370,701,634 25,174,589,034
Real Property Estimated Actual Value1 23,197,467,449 23,391,965,862 23,905,386,600 24,370,701,634 25,174,589,034
Personal Property Assessed Value1 1,880,111,642 1,965,284,896 2,003,412,774 2,125,717,799 2,125,088,965
Personal Property Estimated Actual Value1 1,880,111,642 1,965,284,896 2,003,412,774 2,125,717,799 2,125,088,965
Total Assessed Value 25,077,579,091 25,357,250,758 25,908,799,374 26,496,419,433 27,299,677,999
Total Direct Tax Rate2 1.26 1.27 1.27 1.28 1.27
Estimated Actual Value 25,077,579,091 25,357,250,758 25,908,799,374 26,496,419,433 27,299,677,999
Ratio of Total Assessed Value toTotal Estimated Actual Value 100.00% 100.00% 100.00% 100.00% 100.00%
1 Source: City of Chesapeake Commissioner of the Revenue2 The Direct Tax Rate is calculated using a formula that includes the City's actual current tax rates which are $1.04 per $100 for real property and $4.00 per $100 for personal property.
Assessed and Estimated Actual Value of Taxable PropertyLast Ten Fiscal Years - Unaudited
Fiscal Years
Fiscal Years
228
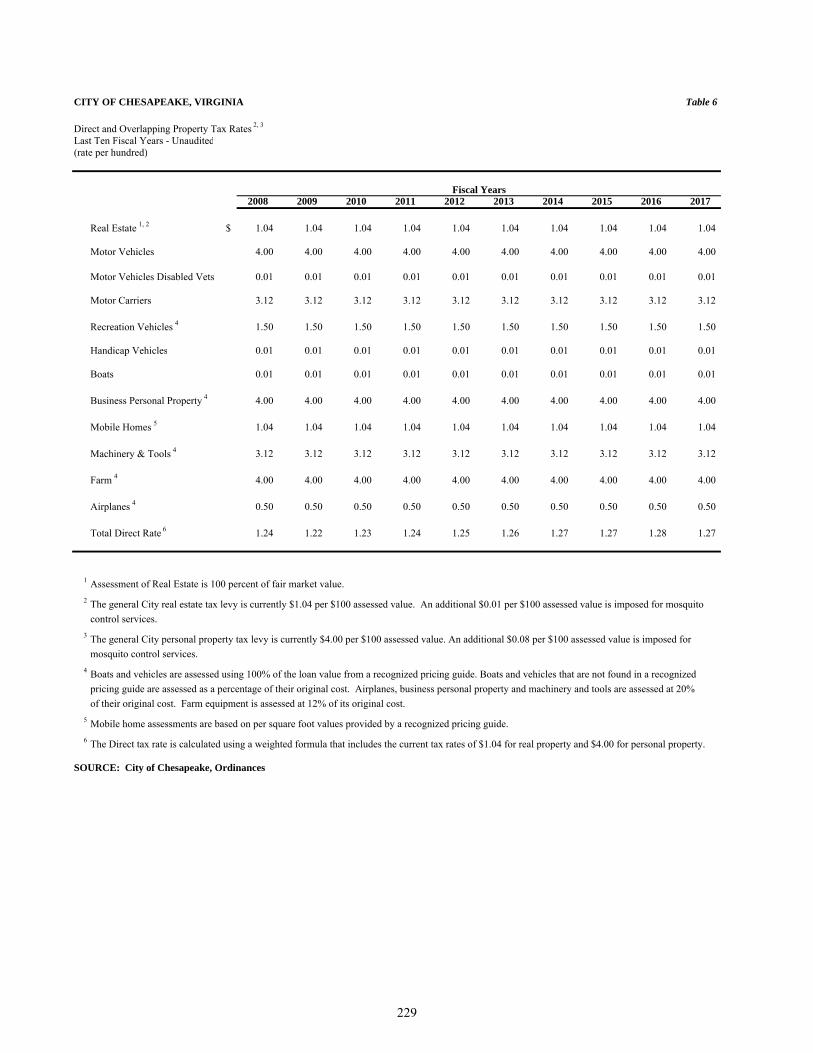
Table 6
2008 2009 2010 2011 2012 2013 2014 2015 2016 2017
Real Estate 1, 2 $ 1.04 1.04 1.04 1.04 1.04 1.04 1.04 1.04 1.04 1.04
Motor Vehicles 4.00 4.00 4.00 4.00 4.00 4.00 4.00 4.00 4.00 4.00
Motor Vehicles Disabled Vets 0.01 0.01 0.01 0.01 0.01 0.01 0.01 0.01 0.01 0.01
Motor Carriers 3.12 3.12 3.12 3.12 3.12 3.12 3.12 3.12 3.12 3.12
Recreation Vehicles 4 1.50 1.50 1.50 1.50 1.50 1.50 1.50 1.50 1.50 1.50
Handicap Vehicles 0.01 0.01 0.01 0.01 0.01 0.01 0.01 0.01 0.01 0.01
Boats 0.01 0.01 0.01 0.01 0.01 0.01 0.01 0.01 0.01 0.01
Business Personal Property 4 4.00 4.00 4.00 4.00 4.00 4.00 4.00 4.00 4.00 4.00
Mobile Homes 5 1.04 1.04 1.04 1.04 1.04 1.04 1.04 1.04 1.04 1.04
Machinery & Tools 4 3.12 3.12 3.12 3.12 3.12 3.12 3.12 3.12 3.12 3.12
Farm 4 4.00 4.00 4.00 4.00 4.00 4.00 4.00 4.00 4.00 4.00
Airplanes 4 0.50 0.50 0.50 0.50 0.50 0.50 0.50 0.50 0.50 0.50
Total Direct Rate 6 1.24 1.22 1.23 1.24 1.25 1.26 1.27 1.27 1.28 1.27
1 Assessment of Real Estate is 100 percent of fair market value.2 The general City real estate tax levy is currently $1.04 per $100 assessed value. An additional $0.01 per $100 assessed value is imposed for mosquito
control services.3 The general City personal property tax levy is currently $4.00 per $100 assessed value. An additional $0.08 per $100 assessed value is imposed for
mosquito control services.4 Boats and vehicles are assessed using 100% of the loan value from a recognized pricing guide. Boats and vehicles that are not found in a recognized
pricing guide are assessed as a percentage of their original cost. Airplanes, business personal property and machinery and tools are assessed at 20%of their original cost. Farm equipment is assessed at 12% of its original cost.
5 Mobile home assessments are based on per square foot values provided by a recognized pricing guide.6 The Direct tax rate is calculated using a weighted formula that includes the current tax rates of $1.04 for real property and $4.00 for personal property.
SOURCE: City of Chesapeake, Ordinances
CITY OF CHESAPEAKE, VIRGINIA
Direct and Overlapping Property Tax Rates 2, 3
Last Ten Fiscal Years - Unaudited(rate per hundred)
Fiscal Years
229
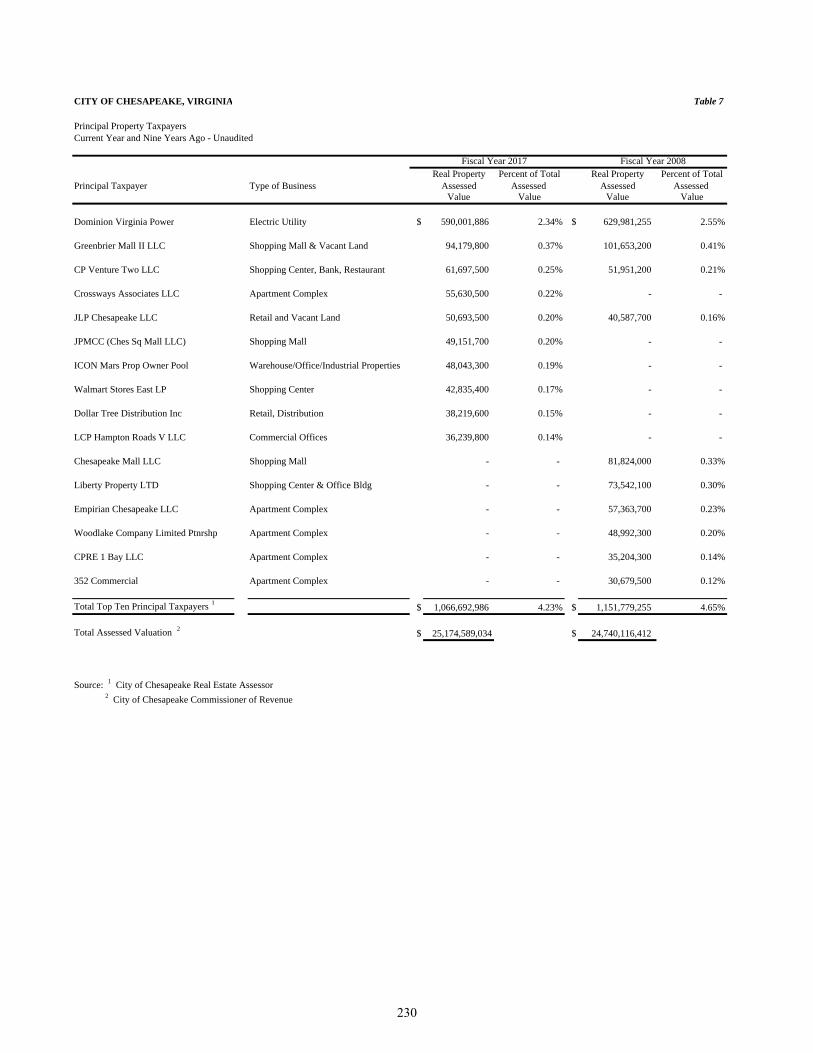
CITY OF CHESAPEAKE, VIRGINIA Table 7
Principal Property TaxpayersCurrent Year and Nine Years Ago - Unaudited
Real Property Percent of Total Real Property Percent of TotalPrincipal Taxpayer Type of Business Assessed Assessed Assessed Assessed
Value Value Value Value
Dominion Virginia Power Electric Utility $ 590,001,886 2.34% $ 629,981,255 2.55%
Greenbrier Mall II LLC Shopping Mall & Vacant Land 94,179,800 0.37% 101,653,200 0.41%
CP Venture Two LLC Shopping Center, Bank, Restaurant 61,697,500 0.25% 51,951,200 0.21%
Crossways Associates LLC Apartment Complex 55,630,500 0.22% - -
JLP Chesapeake LLC Retail and Vacant Land 50,693,500 0.20% 40,587,700 0.16%
JPMCC (Ches Sq Mall LLC) Shopping Mall 49,151,700 0.20% - -
ICON Mars Prop Owner Pool Warehouse/Office/Industrial Properties 48,043,300 0.19% - -
Walmart Stores East LP Shopping Center 42,835,400 0.17% - -
Dollar Tree Distribution Inc Retail, Distribution 38,219,600 0.15% - -
LCP Hampton Roads V LLC Commercial Offices 36,239,800 0.14% - -
Chesapeake Mall LLC Shopping Mall - - 81,824,000 0.33%
Liberty Property LTD Shopping Center & Office Bldg - - 73,542,100 0.30%
Empirian Chesapeake LLC Apartment Complex - - 57,363,700 0.23%
Woodlake Company Limited Ptnrshp Apartment Complex - - 48,992,300 0.20%
CPRE 1 Bay LLC Apartment Complex - - 35,204,300 0.14%
352 Commercial Apartment Complex - - 30,679,500 0.12%
Total Top Ten Principal Taxpayers 1 $ 1,066,692,986 4.23% $ 1,151,779,255 4.65%
Total Assessed Valuation 2 $ 25,174,589,034 $ 24,740,116,412
2 City of Chesapeake Commissioner of RevenueSource: 1 City of Chesapeake Real Estate Assessor
Fiscal Year 2008Fiscal Year 2017
230
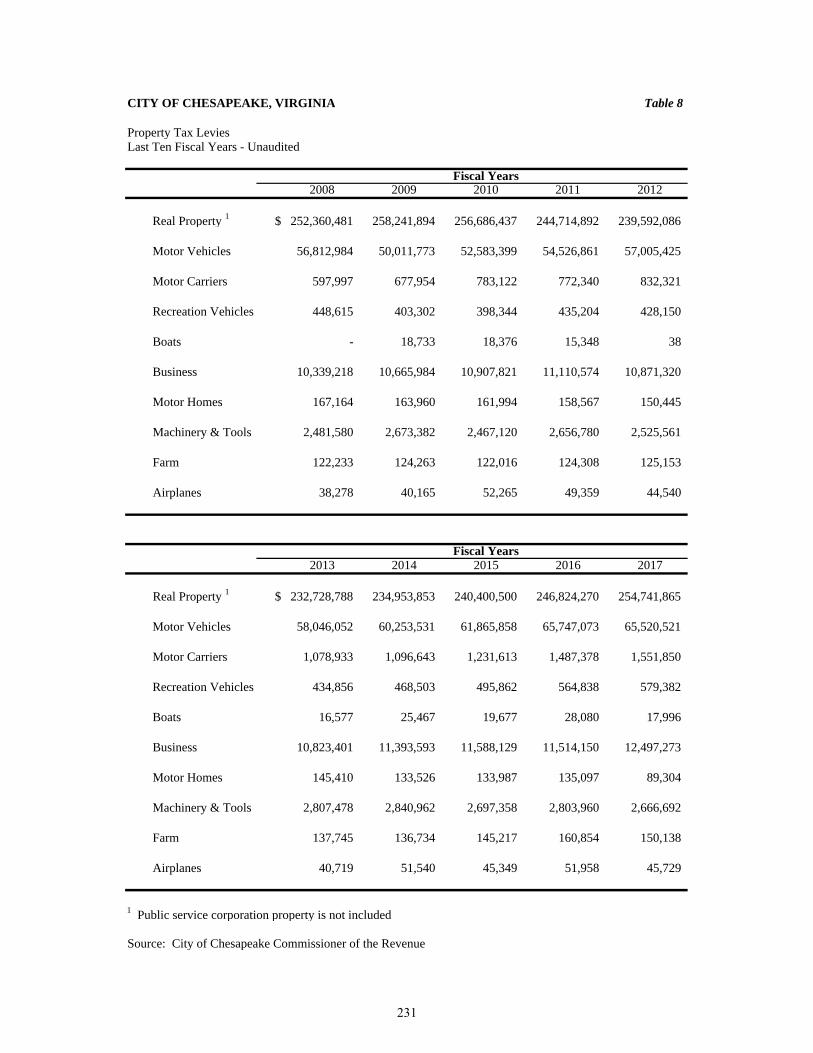
CITY OF CHESAPEAKE, VIRGINIA Table 8
Property Tax LeviesLast Ten Fiscal Years - Unaudited
2008 2009 2010 2011 2012
Real Property 1 $ 252,360,481 258,241,894 256,686,437 244,714,892 239,592,086
Motor Vehicles 56,812,984 50,011,773 52,583,399 54,526,861 57,005,425
Motor Carriers 597,997 677,954 783,122 772,340 832,321
Recreation Vehicles 448,615 403,302 398,344 435,204 428,150
Boats - 18,733 18,376 15,348 38
Business 10,339,218 10,665,984 10,907,821 11,110,574 10,871,320
Motor Homes 167,164 163,960 161,994 158,567 150,445
Machinery & Tools 2,481,580 2,673,382 2,467,120 2,656,780 2,525,561
Farm 122,233 124,263 122,016 124,308 125,153
Airplanes 38,278 40,165 52,265 49,359 44,540
2013 2014 2015 2016 2017
Real Property 1 $ 232,728,788 234,953,853 240,400,500 246,824,270 254,741,865
Motor Vehicles 58,046,052 60,253,531 61,865,858 65,747,073 65,520,521
Motor Carriers 1,078,933 1,096,643 1,231,613 1,487,378 1,551,850
Recreation Vehicles 434,856 468,503 495,862 564,838 579,382
Boats 16,577 25,467 19,677 28,080 17,996
Business 10,823,401 11,393,593 11,588,129 11,514,150 12,497,273
Motor Homes 145,410 133,526 133,987 135,097 89,304
Machinery & Tools 2,807,478 2,840,962 2,697,358 2,803,960 2,666,692
Farm 137,745 136,734 145,217 160,854 150,138
Airplanes 40,719 51,540 45,349 51,958 45,729
1 Public service corporation property is not included
Source: City of Chesapeake Commissioner of the Revenue
Fiscal Years
Fiscal Years
231

This page intentionally left blank
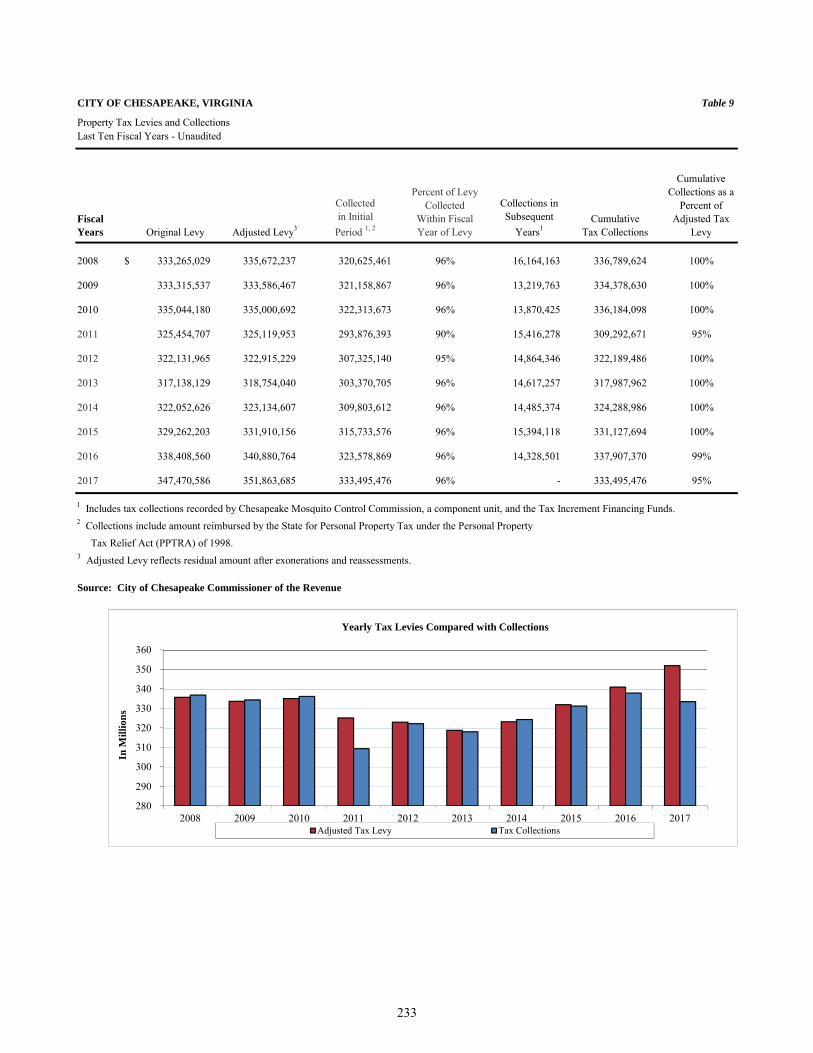
CITY OF CHESAPEAKE, VIRGINIA Table 9
Property Tax Levies and CollectionsLast Ten Fiscal Years - Unaudited
Fiscal Years Original Levy Adjusted Levy3
Collected in Initial
Period 1, 2
Percent of Levy Collected
Within Fiscal Year of Levy
Collections in Subsequent
Years1Cumulative
Tax Collections
Cumulative Collections as a
Percent of Adjusted Tax
Levy
2008 $ 333,265,029 335,672,237 320,625,461 96% 16,164,163 336,789,624 100%
2009 333,315,537 333,586,467 321,158,867 96% 13,219,763 334,378,630 100%
2010 335,044,180 335,000,692 322,313,673 96% 13,870,425 336,184,098 100%
2011 325,454,707 325,119,953 293,876,393 90% 15,416,278 309,292,671 95%
2012 322,131,965 322,915,229 307,325,140 95% 14,864,346 322,189,486 100%
2013 317,138,129 318,754,040 303,370,705 96% 14,617,257 317,987,962 100%
2014 322,052,626 323,134,607 309,803,612 96% 14,485,374 324,288,986 100%
2015 329,262,203 331,910,156 315,733,576 96% 15,394,118 331,127,694 100%
2016 338,408,560 340,880,764 323,578,869 96% 14,328,501 337,907,370 99%
2017 347,470,586 351,863,685 333,495,476 96% - 333,495,476 95%
1 Includes tax collections recorded by Chesapeake Mosquito Control Commission, a component unit, and the Tax Increment Financing Funds. 2 Collections include amount reimbursed by the State for Personal Property Tax under the Personal Property Tax Relief Act (PPTRA) of 1998.3 Adjusted Levy reflects residual amount after exonerations and reassessments.
Source: City of Chesapeake Commissioner of the Revenue
280
290
300
310
320
330
340
350
360
2008 2009 2010 2011 2012 2013 2014 2015 2016 2017
In M
illio
ns
Yearly Tax Levies Compared with Collections
Adjusted Tax Levy Tax Collections
233
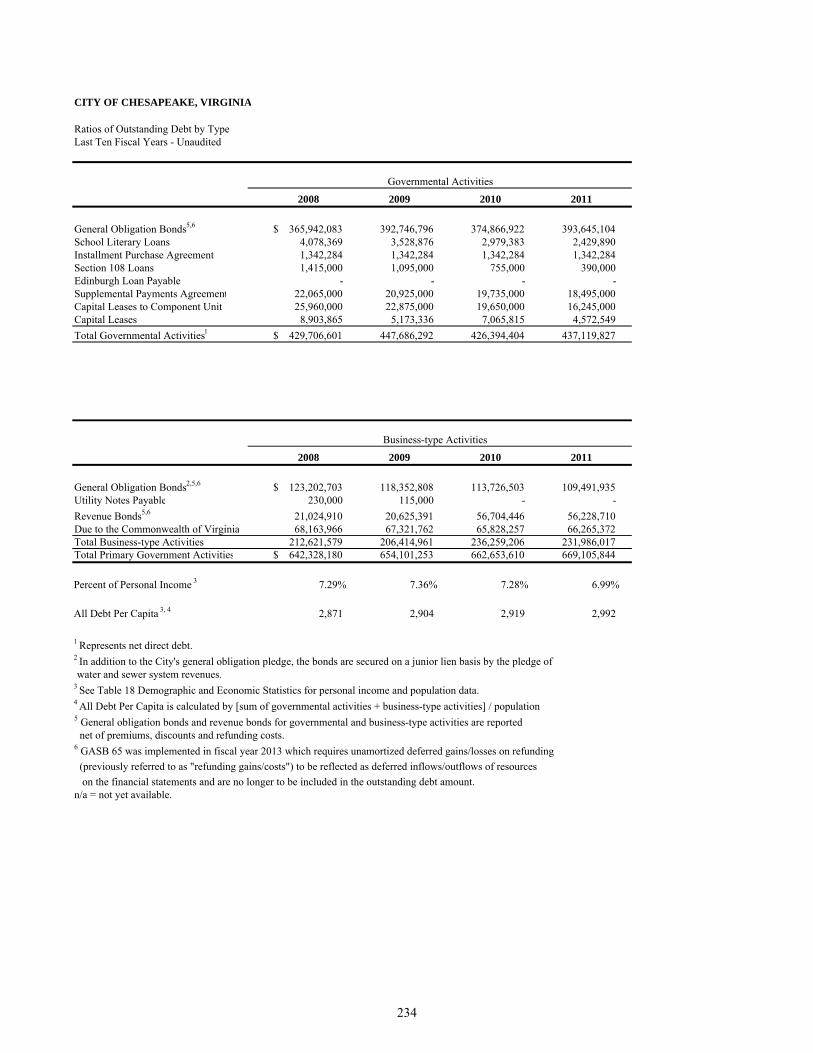
CITY OF CHESAPEAKE, VIRGINIA
2008 2009 2010 2011
General Obligation Bonds5,6 365,942,083$ 392,746,796 374,866,922 393,645,104 School Literary Loans 4,078,369 3,528,876 2,979,383 2,429,890 Installment Purchase Agreement 1,342,284 1,342,284 1,342,284 1,342,284 Section 108 Loans 1,415,000 1,095,000 755,000 390,000 Edinburgh Loan Payable - - - - Supplemental Payments Agreement 22,065,000 20,925,000 19,735,000 18,495,000 Capital Leases to Component Unit 25,960,000 22,875,000 19,650,000 16,245,000 Capital Leases 8,903,865 5,173,336 7,065,815 4,572,549 Total Governmental Activities1 429,706,601$ 447,686,292 426,394,404 437,119,827
2008 2009 2010 2011
General Obligation Bonds2,5,6 123,202,703$ 118,352,808 113,726,503 109,491,935 Utility Notes Payable 230,000 115,000 - - Revenue Bonds5,6 21,024,910 20,625,391 56,704,446 56,228,710 Due to the Commonwealth of Virginia 68,163,966 67,321,762 65,828,257 66,265,372 Total Business-type Activities 212,621,579 206,414,961 236,259,206 231,986,017 Total Primary Government Activities 642,328,180$ 654,101,253 662,653,610 669,105,844
Percent of Personal Income 3 7.29% 7.36% 7.28% 6.99%
All Debt Per Capita 3, 4 2,871 2,904 2,919 2,992
1 Represents net direct debt.2 In addition to the City's general obligation pledge, the bonds are secured on a junior lien basis by the pledge of water and sewer system revenues.3 See Table 18 Demographic and Economic Statistics for personal income and population data.4 All Debt Per Capita is calculated by [sum of governmental activities + business-type activities] / population5 General obligation bonds and revenue bonds for governmental and business-type activities are reported net of premiums, discounts and refunding costs.6 GASB 65 was implemented in fiscal year 2013 which requires unamortized deferred gains/losses on refunding (previously referred to as "refunding gains/costs") to be reflected as deferred inflows/outflows of resources on the financial statements and are no longer to be included in the outstanding debt amount.n/a = not yet available.
Ratios of Outstanding Debt by TypeLast Ten Fiscal Years - Unaudited
Governmental Activities
Business-type Activities
234
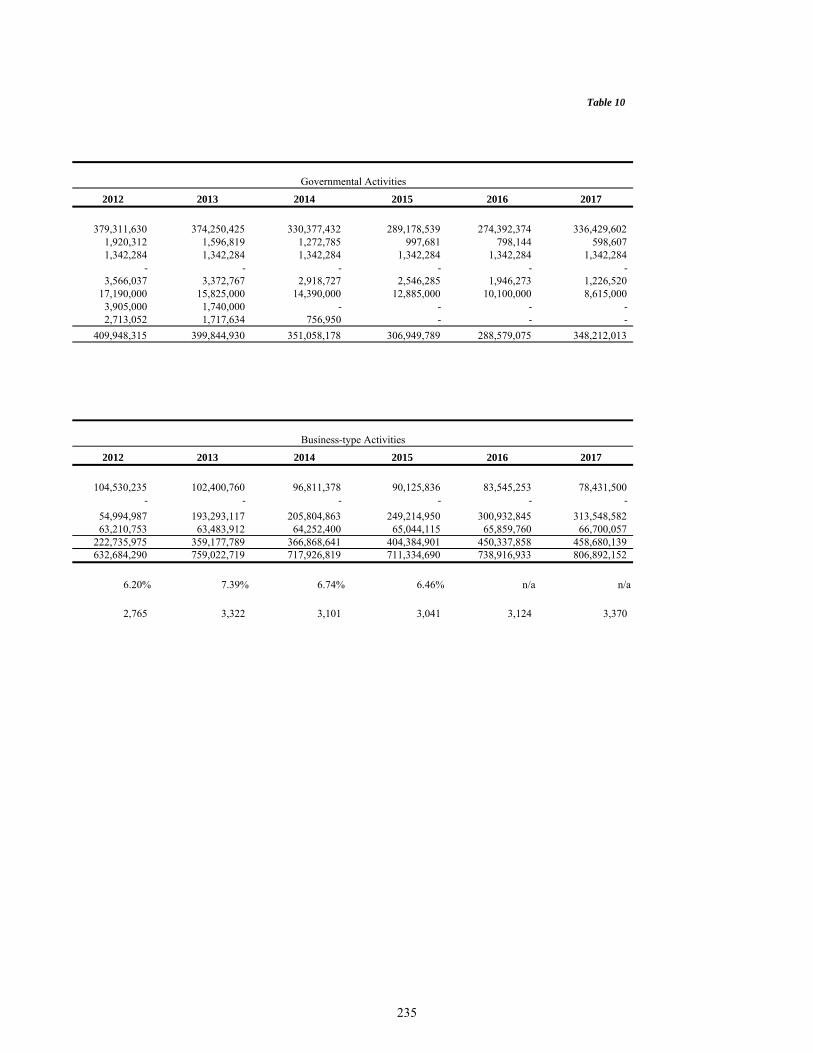
Table 10
2012 2013 2014 2015 2016 2017
379,311,630 374,250,425 330,377,432 289,178,539 274,392,374 336,429,602 1,920,312 1,596,819 1,272,785 997,681 798,144 598,607 1,342,284 1,342,284 1,342,284 1,342,284 1,342,284 1,342,284
- - - - - - 3,566,037 3,372,767 2,918,727 2,546,285 1,946,273 1,226,520
17,190,000 15,825,000 14,390,000 12,885,000 10,100,000 8,615,000 3,905,000 1,740,000 - - - - 2,713,052 1,717,634 756,950 - - -
409,948,315 399,844,930 351,058,178 306,949,789 288,579,075 348,212,013
2012 2013 2014 2015 2016 2017
104,530,235 102,400,760 96,811,378 90,125,836 83,545,253 78,431,500 - - - - - -
54,994,987 193,293,117 205,804,863 249,214,950 300,932,845 313,548,582 63,210,753 63,483,912 64,252,400 65,044,115 65,859,760 66,700,057
222,735,975 359,177,789 366,868,641 404,384,901 450,337,858 458,680,139 632,684,290 759,022,719 717,926,819 711,334,690 738,916,933 806,892,152
6.20% 7.39% 6.74% 6.46% n/a n/a
2,765 3,322 3,101 3,041 3,124 3,370
Governmental Activities
Business-type Activities
235
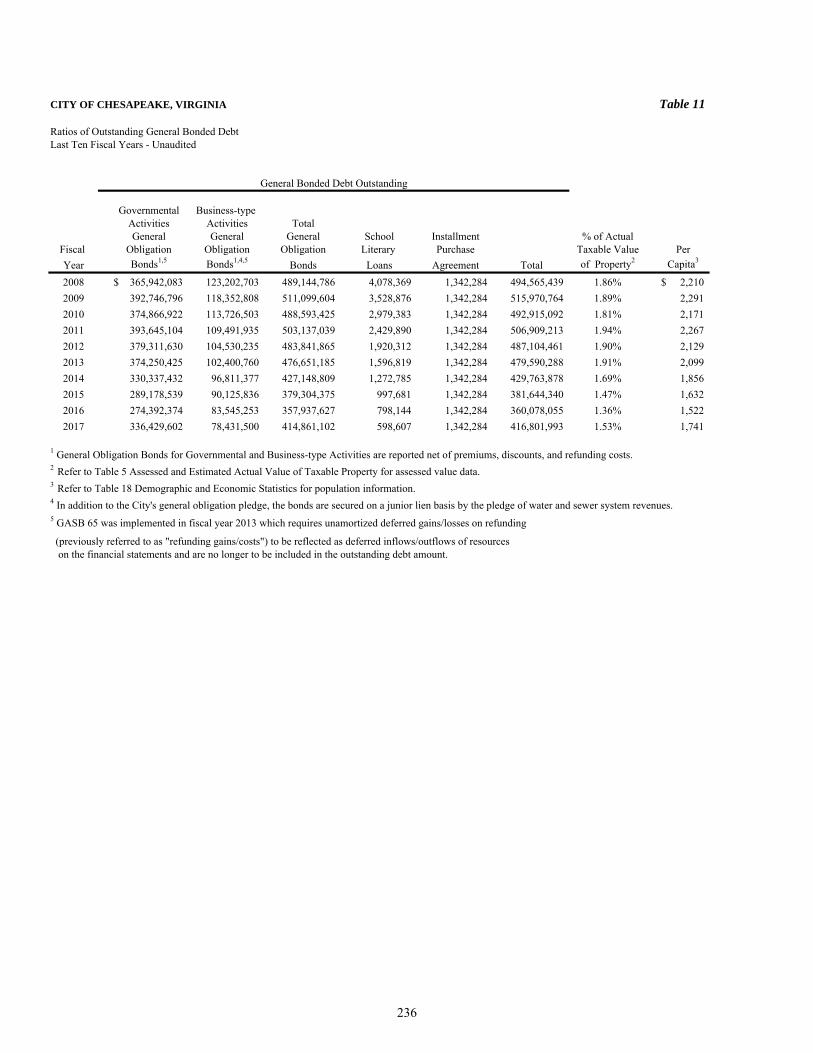
CITY OF CHESAPEAKE, VIRGINIA Table 11
Ratios of Outstanding General Bonded DebtLast Ten Fiscal Years - Unaudited
Governmental Business-type Activities Activities TotalGeneral General General School Installment % of Actual
Fiscal Obligation Obligation Obligation Literary Purchase Taxable Value PerYear Bonds1,5 Bonds1,4,5 Bonds Loans Agreement Total of Property2 Capita3
2008 365,942,083$ 123,202,703 489,144,786 4,078,369 1,342,284 494,565,439 1.86% 2,210$ 2009 392,746,796 118,352,808 511,099,604 3,528,876 1,342,284 515,970,764 1.89% 2,291 2010 374,866,922 113,726,503 488,593,425 2,979,383 1,342,284 492,915,092 1.81% 2,171 2011 393,645,104 109,491,935 503,137,039 2,429,890 1,342,284 506,909,213 1.94% 2,267 2012 379,311,630 104,530,235 483,841,865 1,920,312 1,342,284 487,104,461 1.90% 2,129 2013 374,250,425 102,400,760 476,651,185 1,596,819 1,342,284 479,590,288 1.91% 2,099 2014 330,337,432 96,811,377 427,148,809 1,272,785 1,342,284 429,763,878 1.69% 1,856 2015 289,178,539 90,125,836 379,304,375 997,681 1,342,284 381,644,340 1.47% 1,632 2016 274,392,374 83,545,253 357,937,627 798,144 1,342,284 360,078,055 1.36% 1,522 2017 336,429,602 78,431,500 414,861,102 598,607 1,342,284 416,801,993 1.53% 1,741
1 General Obligation Bonds for Governmental and Business-type Activities are reported net of premiums, discounts, and refunding costs.2 Refer to Table 5 Assessed and Estimated Actual Value of Taxable Property for assessed value data.3 Refer to Table 18 Demographic and Economic Statistics for population information.4 In addition to the City's general obligation pledge, the bonds are secured on a junior lien basis by the pledge of water and sewer system revenues.5 GASB 65 was implemented in fiscal year 2013 which requires unamortized deferred gains/losses on refunding
(previously referred to as "refunding gains/costs") to be reflected as deferred inflows/outflows of resources on the financial statements and are no longer to be included in the outstanding debt amount.
General Bonded Debt Outstanding
236
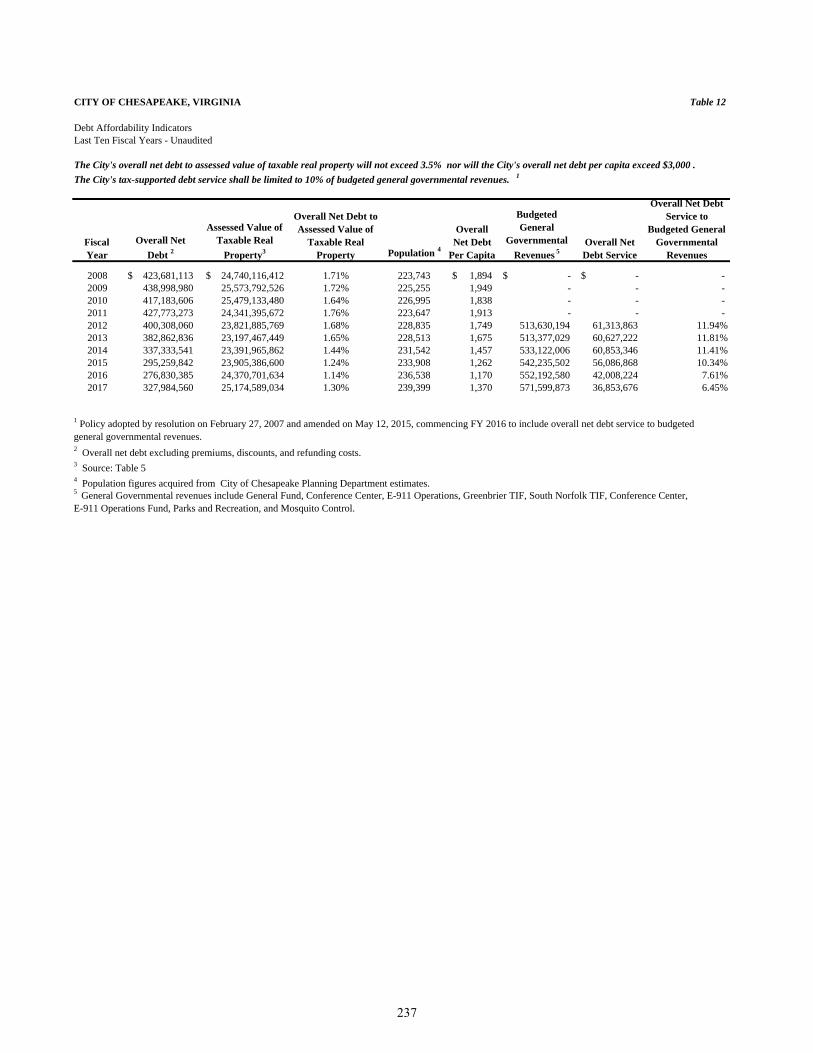
CITY OF CHESAPEAKE, VIRGINIA Table 12
Debt Affordability IndicatorsLast Ten Fiscal Years - Unaudited
Population 4
2008 423,681,113$ 24,740,116,412$ 1.71% 223,743 1,894$ -$ -$ - 2009 438,998,980 25,573,792,526 1.72% 225,255 1,949 - - - 2010 417,183,606 25,479,133,480 1.64% 226,995 1,838 - - - 2011 427,773,273 24,341,395,672 1.76% 223,647 1,913 - - - 2012 400,308,060 23,821,885,769 1.68% 228,835 1,749 513,630,194 61,313,863 11.94%2013 382,862,836 23,197,467,449 1.65% 228,513 1,675 513,377,029 60,627,222 11.81%2014 337,333,541 23,391,965,862 1.44% 231,542 1,457 533,122,006 60,853,346 11.41%2015 295,259,842 23,905,386,600 1.24% 233,908 1,262 542,235,502 56,086,868 10.34%2016 276,830,385 24,370,701,634 1.14% 236,538 1,170 552,192,580 42,008,224 7.61%2017 327,984,560 25,174,589,034 1.30% 239,399 1,370 571,599,873 36,853,676 6.45%
2 Overall net debt excluding premiums, discounts, and refunding costs.3 Source: Table 54 Population figures acquired from City of Chesapeake Planning Department estimates.
Overall Net Debt Service to
Budgeted General Governmental
RevenuesFiscal Year
Overall Net Debt 2
Overall Net Debt
Per Capita
1 Policy adopted by resolution on February 27, 2007 and amended on May 12, 2015, commencing FY 2016 to include overall net debt service to budgeted general governmental revenues.
5 General Governmental revenues include General Fund, Conference Center, E-911 Operations, Greenbrier TIF, South Norfolk TIF, Conference Center, E-911 Operations Fund, Parks and Recreation, and Mosquito Control.
The City's overall net debt to assessed value of taxable real property will not exceed 3.5% nor will the City's overall net debt per capita exceed $3,000 .
The City's tax-supported debt service shall be limited to 10% of budgeted general governmental revenues. 1
Assessed Value of Taxable Real
Property3
Overall Net Debt to Assessed Value of
Taxable Real Property
Budgeted General
Governmental Revenues 5
Overall Net Debt Service
237
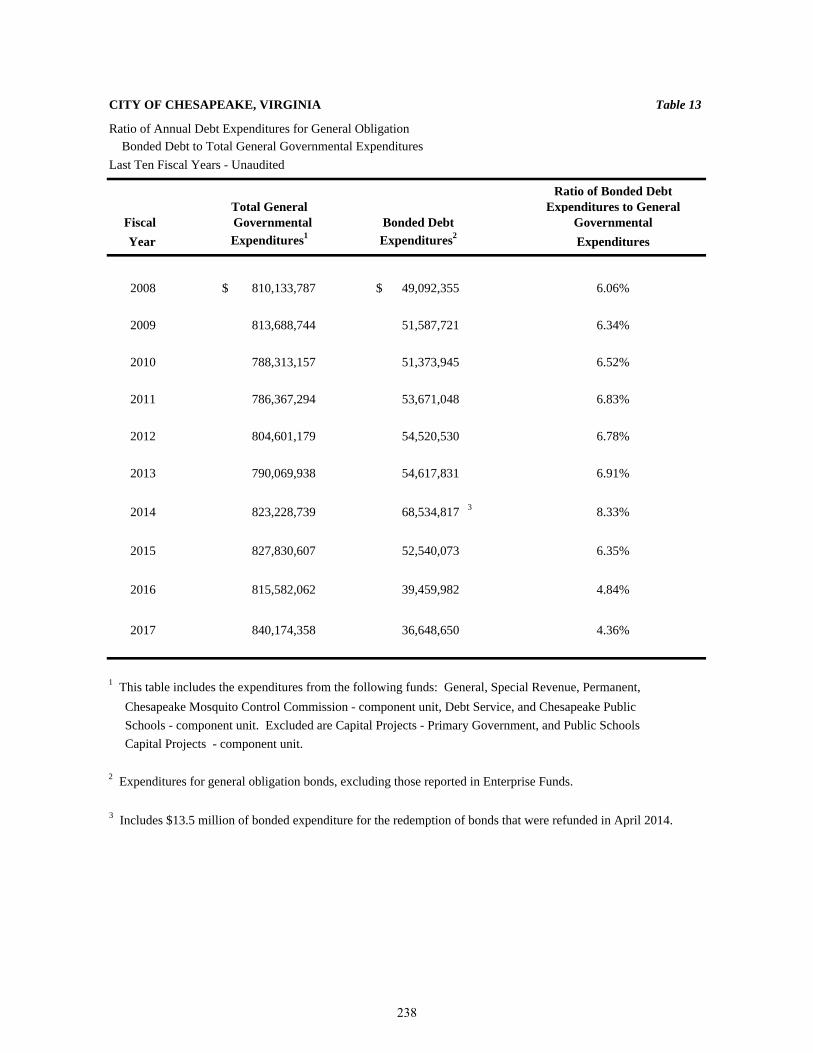
CITY OF CHESAPEAKE, VIRGINIA Table 13
Ratio of Annual Debt Expenditures for General Obligation Bonded Debt to Total General Governmental Expenditures
Last Ten Fiscal Years - Unaudited
Ratio of Bonded DebtTotal General Expenditures to General
Fiscal Governmental Bonded Debt GovernmentalYear Expenditures1 Expenditures2 Expenditures
2008 810,133,787$ 49,092,355$ 6.06%
2009 813,688,744 51,587,721 6.34%
2010 788,313,157 51,373,945 6.52%
2011 786,367,294 53,671,048 6.83%
2012 804,601,179 54,520,530 6.78%
2013 790,069,938 54,617,831 6.91%
2014 823,228,739 68,534,817 3 8.33%
2015 827,830,607 52,540,073 6.35%
2016 815,582,062 39,459,982 4.84%
2017 840,174,358 36,648,650 4.36%
1 This table includes the expenditures from the following funds: General, Special Revenue, Permanent, Chesapeake Mosquito Control Commission - component unit, Debt Service, and Chesapeake Public Schools - component unit. Excluded are Capital Projects - Primary Government, and Public Schools Capital Projects - component unit.
2 Expenditures for general obligation bonds, excluding those reported in Enterprise Funds.
3 Includes $13.5 million of bonded expenditure for the redemption of bonds that were refunded in April 2014.
238
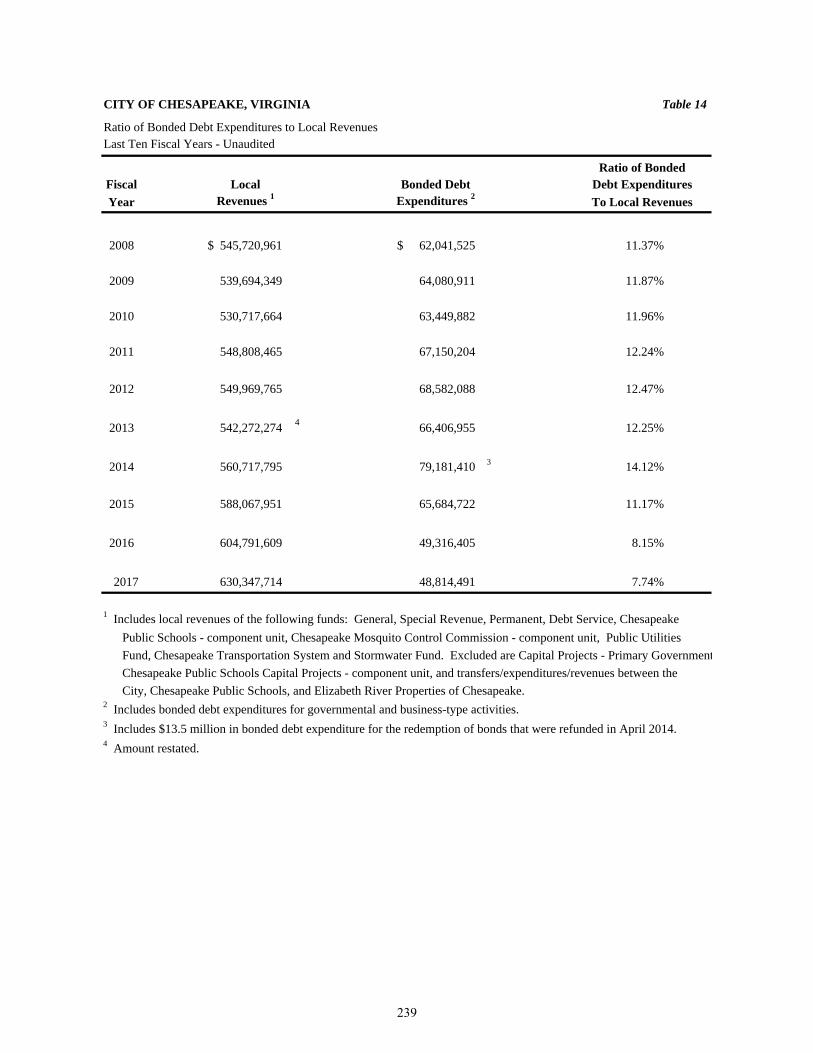
CITY OF CHESAPEAKE, VIRGINIA Table 14
Ratio of Bonded Debt Expenditures to Local RevenuesLast Ten Fiscal Years - Unaudited
Ratio of BondedFiscal Local Bonded Debt Debt ExpendituresYear Revenues 1 Expenditures 2 To Local Revenues
2008 545,720,961$ 62,041,525$ 11.37%
2009 539,694,349 64,080,911 11.87%
2010 530,717,664 63,449,882 11.96%
2011 548,808,465 67,150,204 12.24%
2012 549,969,765 68,582,088 12.47%
2013 542,272,274 4 66,406,955 12.25%
2014 560,717,795 79,181,410 3 14.12%
2015 588,067,951 65,684,722 11.17%
2016 604,791,609 49,316,405 8.15%
2017 630,347,714 48,814,491 7.74%
1 Includes local revenues of the following funds: General, Special Revenue, Permanent, Debt Service, Chesapeake Public Schools - component unit, Chesapeake Mosquito Control Commission - component unit, Public Utilities Fund, Chesapeake Transportation System and Stormwater Fund. Excluded are Capital Projects - Primary Government Chesapeake Public Schools Capital Projects - component unit, and transfers/expenditures/revenues between the City, Chesapeake Public Schools, and Elizabeth River Properties of Chesapeake.2 Includes bonded debt expenditures for governmental and business-type activities.3 Includes $13.5 million in bonded debt expenditure for the redemption of bonds that were refunded in April 2014.4 Amount restated.
239
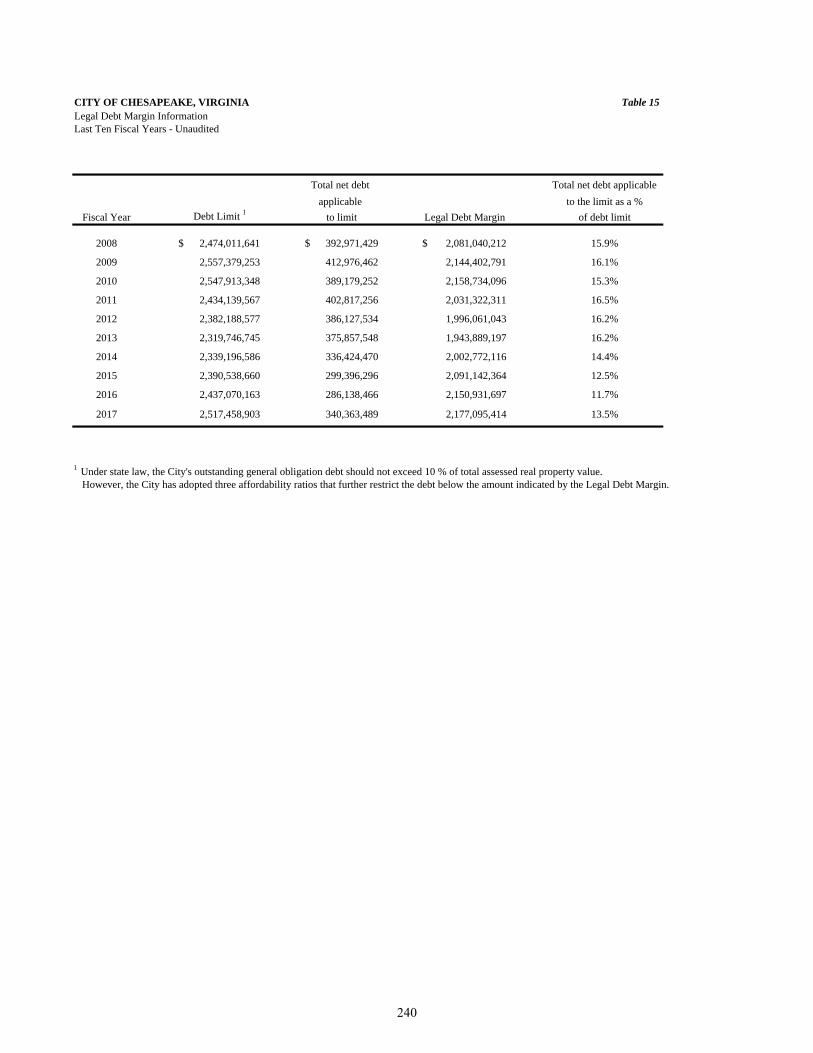
CITY OF CHESAPEAKE, VIRGINIA Table 15Legal Debt Margin InformationLast Ten Fiscal Years - Unaudited
Total net debt Total net debt applicableapplicable to the limit as a %
Fiscal Year Debt Limit 1 to limit Legal Debt Margin of debt limit
2008 2,474,011,641$ 392,971,429$ 2,081,040,212$ 15.9%
2009 2,557,379,253 412,976,462 2,144,402,791 16.1%
2010 2,547,913,348 389,179,252 2,158,734,096 15.3%
2011 2,434,139,567 402,817,256 2,031,322,311 16.5%
2012 2,382,188,577 386,127,534 1,996,061,043 16.2%
2013 2,319,746,745 375,857,548 1,943,889,197 16.2%
2014 2,339,196,586 336,424,470 2,002,772,116 14.4%
2015 2,390,538,660 299,396,296 2,091,142,364 12.5%
2016 2,437,070,163 286,138,466 2,150,931,697 11.7%
2017 2,517,458,903 340,363,489 2,177,095,414 13.5%
1 Under state law, the City's outstanding general obligation debt should not exceed 10 % of total assessed real property value. However, the City has adopted three affordability ratios that further restrict the debt below the amount indicated by the Legal Debt Margin.
240
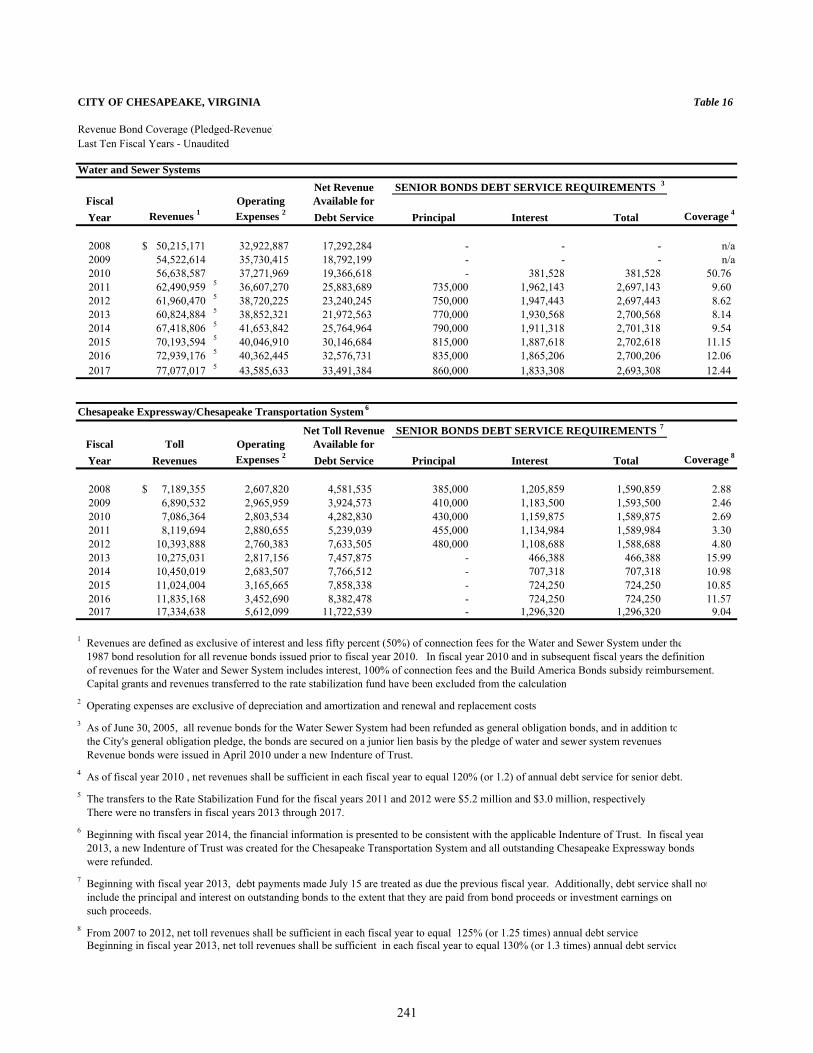
CITY OF CHESAPEAKE, VIRGINIA Table 16
Revenue Bond Coverage (Pledged-Revenue)Last Ten Fiscal Years - Unaudited
Water and Sewer Systems Net Revenue
Fiscal Operating Available for Year Revenues 1 Expenses 2 Debt Service Principal Interest Total Coverage 4
2008 50,215,171$ 32,922,887 17,292,284 - - - n/a2009 54,522,614 35,730,415 18,792,199 - - - n/a2010 56,638,587 37,271,969 19,366,618 - 381,528 381,528 50.762011 62,490,959 5 36,607,270 25,883,689 735,000 1,962,143 2,697,143 9.602012 61,960,470 5 38,720,225 23,240,245 750,000 1,947,443 2,697,443 8.622013 60,824,884 5 38,852,321 21,972,563 770,000 1,930,568 2,700,568 8.142014 67,418,806 5 41,653,842 25,764,964 790,000 1,911,318 2,701,318 9.542015 70,193,594 5 40,046,910 30,146,684 815,000 1,887,618 2,702,618 11.152016 72,939,176 5 40,362,445 32,576,731 835,000 1,865,206 2,700,206 12.062017 77,077,017 5 43,585,633 33,491,384 860,000 1,833,308 2,693,308 12.44
Chesapeake Expressway/Chesapeake Transportation System 6
Net Toll RevenueFiscal Toll Operating Available for Year Revenues Expenses 2 Debt Service Principal Interest Total Coverage 8
2008 7,189,355$ 2,607,820 4,581,535 385,000 1,205,859 1,590,859 2.882009 6,890,532 2,965,959 3,924,573 410,000 1,183,500 1,593,500 2.462010 7,086,364 2,803,534 4,282,830 430,000 1,159,875 1,589,875 2.692011 8,119,694 2,880,655 5,239,039 455,000 1,134,984 1,589,984 3.302012 10,393,888 2,760,383 7,633,505 480,000 1,108,688 1,588,688 4.802013 10,275,031 2,817,156 7,457,875 - 466,388 466,388 15.992014 10,450,019 2,683,507 7,766,512 - 707,318 707,318 10.982015 11,024,004 3,165,665 7,858,338 - 724,250 724,250 10.852016 11,835,168 3,452,690 8,382,478 - 724,250 724,250 11.572017 17,334,638 5,612,099 11,722,539 - 1,296,320 1,296,320 9.04
1 Revenues are defined as exclusive of interest and less fifty percent (50%) of connection fees for the Water and Sewer System under the1987 bond resolution for all revenue bonds issued prior to fiscal year 2010. In fiscal year 2010 and in subsequent fiscal years the definition of revenues for the Water and Sewer System includes interest, 100% of connection fees and the Build America Bonds subsidy reimbursement. Capital grants and revenues transferred to the rate stabilization fund have been excluded from the calculation
2 Operating expenses are exclusive of depreciation and amortization and renewal and replacement costs3 As of June 30, 2005, all revenue bonds for the Water Sewer System had been refunded as general obligation bonds, and in addition to
the City's general obligation pledge, the bonds are secured on a junior lien basis by the pledge of water and sewer system revenuesRevenue bonds were issued in April 2010 under a new Indenture of Trust.
4 As of fiscal year 2010 , net revenues shall be sufficient in each fiscal year to equal 120% (or 1.2) of annual debt service for senior debt.5 The transfers to the Rate Stabilization Fund for the fiscal years 2011 and 2012 were $5.2 million and $3.0 million, respectively
There were no transfers in fiscal years 2013 through 2017.6 Beginning with fiscal year 2014, the financial information is presented to be consistent with the applicable Indenture of Trust. In fiscal year
2013, a new Indenture of Trust was created for the Chesapeake Transportation System and all outstanding Chesapeake Expressway bonds were refunded.
7 Beginning with fiscal year 2013, debt payments made July 15 are treated as due the previous fiscal year. Additionally, debt service shall notinclude the principal and interest on outstanding bonds to the extent that they are paid from bond proceeds or investment earnings onsuch proceeds.
8 From 2007 to 2012, net toll revenues shall be sufficient in each fiscal year to equal 125% (or 1.25 times) annual debt service.Beginning in fiscal year 2013, net toll revenues shall be sufficient in each fiscal year to equal 130% (or 1.3 times) annual debt service
SENIOR BONDS DEBT SERVICE REQUIREMENTS 3
SENIOR BONDS DEBT SERVICE REQUIREMENTS 7
241
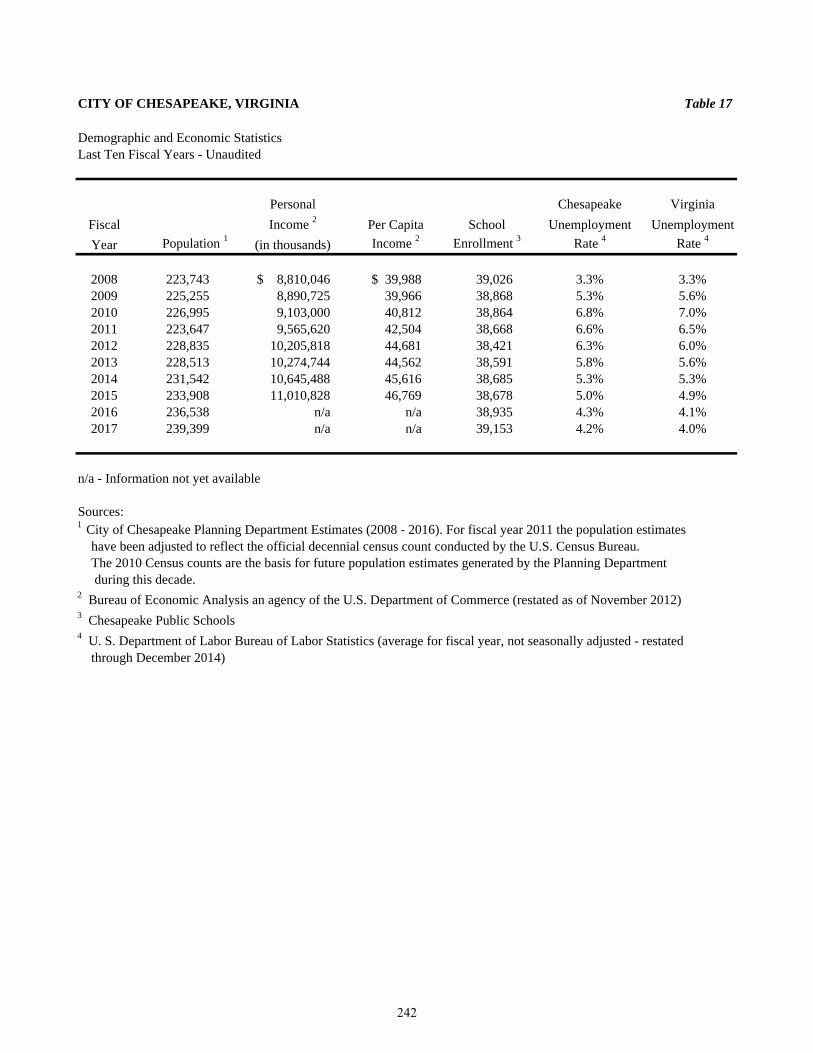
CITY OF CHESAPEAKE, VIRGINIA Table 17
Personal Chesapeake VirginiaFiscal Income 2 Per Capita School Unemployment UnemploymentYear Population 1 (in thousands) Income 2 Enrollment 3 Rate 4 Rate 4
2008 223,743 8,810,046$ 39,988$ 39,026 3.3% 3.3%2009 225,255 8,890,725 39,966 38,868 5.3% 5.6%2010 226,995 9,103,000 40,812 38,864 6.8% 7.0%2011 223,647 9,565,620 42,504 38,668 6.6% 6.5%2012 228,835 10,205,818 44,681 38,421 6.3% 6.0%2013 228,513 10,274,744 44,562 38,591 5.8% 5.6%2014 231,542 10,645,488 45,616 38,685 5.3% 5.3%2015 233,908 11,010,828 46,769 38,678 5.0% 4.9%2016 236,538 n/a n/a 38,935 4.3% 4.1%2017 239,399 n/a n/a 39,153 4.2% 4.0%
n/a - Information not yet available
Sources:1 City of Chesapeake Planning Department Estimates (2008 - 2016). For fiscal year 2011 the population estimates have been adjusted to reflect the official decennial census count conducted by the U.S. Census Bureau. The 2010 Census counts are the basis for future population estimates generated by the Planning Department during this decade.2 Bureau of Economic Analysis an agency of the U.S. Department of Commerce (restated as of November 2012)3 Chesapeake Public Schools 4 U. S. Department of Labor Bureau of Labor Statistics (average for fiscal year, not seasonally adjusted - restated through December 2014)
Last Ten Fiscal Years - UnauditedDemographic and Economic Statistics
242
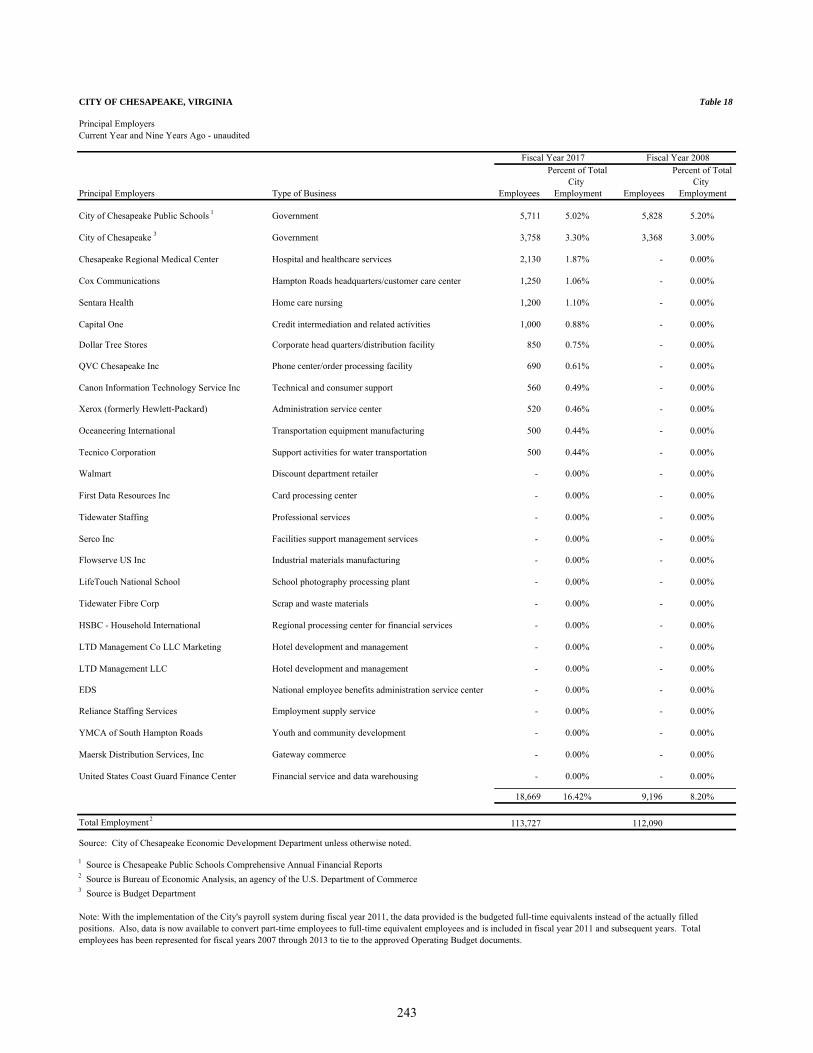
CITY OF CHESAPEAKE, VIRGINIA Table 18
Principal EmployersCurrent Year and Nine Years Ago - unaudited
Percent of Total Percent of TotalCity City
Principal Employers Type of Business Employees Employment Employees Employment
City of Chesapeake Public Schools 1 Government 5,711 5.02% 5,828 5.20%
City of Chesapeake 3 Government 3,758 3.30% 3,368 3.00%
Chesapeake Regional Medical Center Hospital and healthcare services 2,130 1.87% - 0.00%
Cox Communications Hampton Roads headquarters/customer care center 1,250 1.06% - 0.00%
Sentara Health Home care nursing 1,200 1.10% - 0.00%
Capital One Credit intermediation and related activities 1,000 0.88% - 0.00%
Dollar Tree Stores Corporate head quarters/distribution facility 850 0.75% - 0.00%
QVC Chesapeake Inc Phone center/order processing facility 690 0.61% - 0.00%
Canon Information Technology Service Inc Technical and consumer support 560 0.49% - 0.00%
Xerox (formerly Hewlett-Packard) Administration service center 520 0.46% - 0.00%
Oceaneering International Transportation equipment manufacturing 500 0.44% - 0.00%
Tecnico Corporation Support activities for water transportation 500 0.44% - 0.00%
Walmart Discount department retailer - 0.00% - 0.00%
First Data Resources Inc Card processing center - 0.00% - 0.00%
Tidewater Staffing Professional services - 0.00% - 0.00%
Serco Inc Facilities support management services - 0.00% - 0.00%
Flowserve US Inc Industrial materials manufacturing - 0.00% - 0.00%
LifeTouch National School School photography processing plant - 0.00% - 0.00%
Tidewater Fibre Corp Scrap and waste materials - 0.00% - 0.00%
HSBC - Household International Regional processing center for financial services - 0.00% - 0.00%
LTD Management Co LLC Marketing Hotel development and management - 0.00% - 0.00%
LTD Management LLC Hotel development and management - 0.00% - 0.00%
EDS National employee benefits administration service center - 0.00% - 0.00%
Reliance Staffing Services Employment supply service - 0.00% - 0.00%
YMCA of South Hampton Roads Youth and community development - 0.00% - 0.00%
Maersk Distribution Services, Inc Gateway commerce - 0.00% - 0.00%
United States Coast Guard Finance Center Financial service and data warehousing - 0.00% - 0.00%
18,669 16.42% 9,196 8.20%
Total Employment 2 113,727 112,090
Source: City of Chesapeake Economic Development Department unless otherwise noted.
1 Source is Chesapeake Public Schools Comprehensive Annual Financial Reports2 Source is Bureau of Economic Analysis, an agency of the U.S. Department of Commerce3 Source is Budget Department
Note: With the implementation of the City's payroll system during fiscal year 2011, the data provided is the budgeted full-time equivalents instead of the actually filledpositions. Also, data is now available to convert part-time employees to full-time equivalent employees and is included in fiscal year 2011 and subsequent years. Totalemployees has been represented for fiscal years 2007 through 2013 to tie to the approved Operating Budget documents.
Fiscal Year 2017 Fiscal Year 2008
243
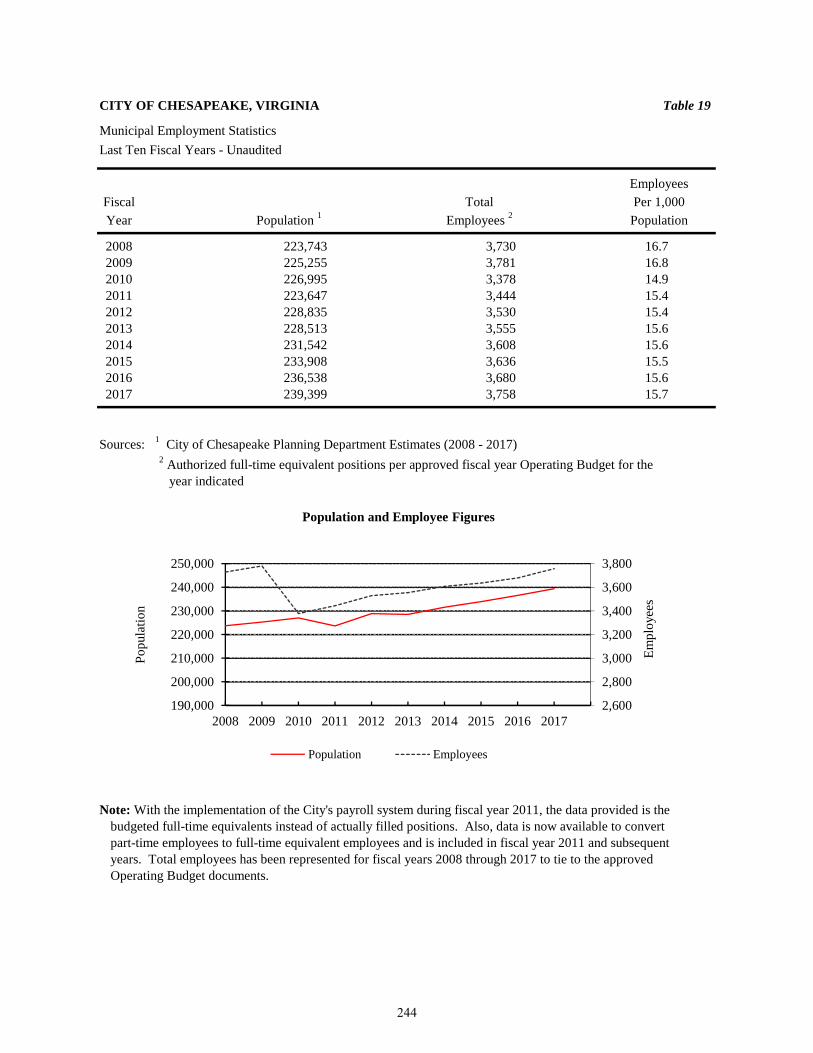
CITY OF CHESAPEAKE, VIRGINIA Table 19
Municipal Employment StatisticsLast Ten Fiscal Years - Unaudited
EmployeesFiscal Per 1,000
Year Population
2008 223,743 3,730 16.72009 225,255 3,781 16.82010 226,995 3,378 14.92011 223,647 3,444 15.42012 228,835 3,530 15.42013 228,513 3,555 15.62014 231,542 3,608 15.62015 233,908 3,636 15.52016 236,538 3,680 15.62017 239,399 3,758 15.7
Sources: 1 City of Chesapeake Planning Department Estimates (2008 - 2017) 2 Authorized full-time equivalent positions per approved fiscal year Operating Budget for the year indicated
Note: With the implementation of the City's payroll system during fiscal year 2011, the data provided is the budgeted full-time equivalents instead of actually filled positions. Also, data is now available to convertpart-time employees to full-time equivalent employees and is included in fiscal year 2011 and subsequentyears. Total employees has been represented for fiscal years 2008 through 2017 to tie to the approved Operating Budget documents.
Employees 2Total
Population 1
2,600
2,800
3,000
3,200
3,400
3,600
3,800
190,000
200,000
210,000
220,000
230,000
240,000
250,000
2008 2009 2010 2011 2012 2013 2014 2015 2016 2017
Empl
oyee
s
Popu
latio
n
Population and Employee Figures
Population Employees
244
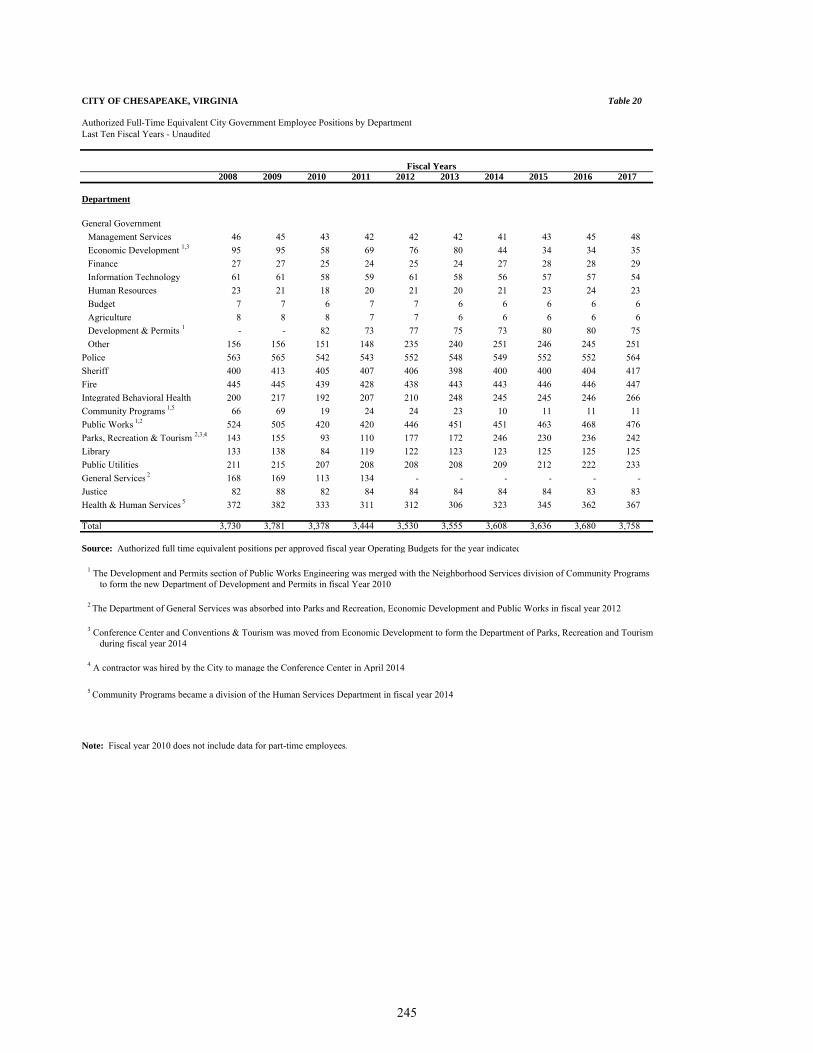
CITY OF CHESAPEAKE, VIRGINIA Table 20
Authorized Full-Time Equivalent City Government Employee Positions by Department Last Ten Fiscal Years - Unaudited
2008 2009 2010 2011 2012 2013 2014 2015 2016 2017
Department
General GovernmentManagement Services 46 45 43 42 42 42 41 43 45 48Economic Development 1,3 95 95 58 69 76 80 44 34 34 35Finance 27 27 25 24 25 24 27 28 28 29Information Technology 61 61 58 59 61 58 56 57 57 54Human Resources 23 21 18 20 21 20 21 23 24 23Budget 7 7 6 7 7 6 6 6 6 6Agriculture 8 8 8 7 7 6 6 6 6 6Development & Permits 1 - - 82 73 77 75 73 80 80 75Other 156 156 151 148 235 240 251 246 245 251
Police 563 565 542 543 552 548 549 552 552 564Sheriff 400 413 405 407 406 398 400 400 404 417Fire 445 445 439 428 438 443 443 446 446 447Integrated Behavioral Health 200 217 192 207 210 248 245 245 246 266Community Programs 1,5 66 69 19 24 24 23 10 11 11 11Public Works 1,2 524 505 420 420 446 451 451 463 468 476Parks, Recreation & Tourism 2,3,4 143 155 93 110 177 172 246 230 236 242Library 133 138 84 119 122 123 123 125 125 125Public Utilities 211 215 207 208 208 208 209 212 222 233General Services 2 168 169 113 134 - - - - - - Justice 82 88 82 84 84 84 84 84 83 83Health & Human Services 5 372 382 333 311 312 306 323 345 362 367
Total 3,730 3,781 3,378 3,444 3,530 3,555 3,608 3,636 3,680 3,758
Source: Authorized full time equivalent positions per approved fiscal year Operating Budgets for the year indicated
1 The Development and Permits section of Public Works Engineering was merged with the Neighborhood Services division of Community Programs to form the new Department of Development and Permits in fiscal Year 2010
2 The Department of General Services was absorbed into Parks and Recreation, Economic Development and Public Works in fiscal year 2012
3 Conference Center and Conventions & Tourism was moved from Economic Development to form the Department of Parks, Recreation and Tourism during fiscal year 2014
4 A contractor was hired by the City to manage the Conference Center in April 2014
5 Community Programs became a division of the Human Services Department in fiscal year 2014
Note: Fiscal year 2010 does not include data for part-time employees.
Fiscal Years
245

CITY OF CHESAPEAKE, VIRGINIA
Operating Indicators by Function/ProgramLast Ten Fiscal Years - Unaudited
2008 2009 2010 2011 2012
Function/Program
General GovernmentBuilding Permits Issued 4,843 3,947 3,481 3,973 4,199Building Inspections Conducted 9,452 7,251 7,417 8,085 8,744Electrical Permits Issued 3,578 3,028 4,926 3,194 2,911Electrical Inspections Performed 11,339 8,411 7,857 8,842 7,968Plumbing Permits Issued 1,738 1,418 1,490 1,530 1,402Plumbing Inspections Performed 7,441 4,569 5,849 5,639 5,261Mechanical/Gas Permits Issued 4,655 4,021 4,688 4,390 4,268Mechanical/Gas Inspections Performed 10,241 7,028 8,339 8,039 7,821Code Compliance Inspections 25,568 19,899 21,580 17,183 16,612
PoliceCalls for Police Service 7 159,180 156,618 136,811 120,216 126,508Part I Law Violations 8,270 8,640 9,338 8,534 7,914Total Criminal Charges (primary and secondary) 16,083 18,190 17,685 16,148 16,773Total Traffic Charges (moving/ non-moving/excludes DUI) 31,547 34,841 38,555 38,810 35,666DUI Arrests5 721 830 735 951 1,216
FireCalls answered for Fire Protection Services 25,152 24,839 25,051 24,916 25,268
Public WorksRefuse Collected (tons per year) 114,145 110,931 111,348 93,171 94,184Street Resurfacing (miles) 35.56 36.87 41.99 32.76 44.33Potholes Repaired 3,047 4,717 7,249 9,980 8,367
WaterActive Service Accounts 60,923 61,243 61,713 62,029 62,333Daily Average Consumption in Gallons (in mgd) 16.19 16.96 16.88 17.20 16.30Daily Average Water Provided by Chesapeake (in mgd) 10.69 11.14 10.66 11.10 10.10Daily Average Water Purchased from other localities (in mgd) 5.50 5.82 6.22 6.10 6.19
WastewaterActive Service Accounts 59,126 59,437 59,909 60,154 60,449
Parks and RecreationYouth Athletics - Participants 7,002 6,261 5,819 5,140 4,884Youth Athletics - Teams 537 506 481 433 413Youth Athletics - Coaches 1,062 915 834 727 664Adult Athletics - Participants 3,924 4,095 3,999 3,639 3,070Adult Athletics - Teams 227 237 228 218 189Special Programs Athletics - Programs4 7 6 3 1 2Leisure Classes - Youth Participants 1,580 2,372 1,901 1,249 1,159Leisure Classes - Adult Participants 614 1,301 855 703 787Leisure Classes - Community Program Participants 1 63,892 3,346 3,386 3,277 3,644Special Events - PR&T Sponsored Attendance6 26,915 27,775 28,095 34,328 20,525Community Center Attendance2 188,276 189,700 202,884 361,059 425,108Community Center ID Sales 7,604 8,314 8,086 9,518 7,060Community Center Rentals 1,157 1,328 1,340 1,637 2,092Senior Program Participants 15,982 21,742 23,478 18,337 21,664Therapeutic Program Participants 2,760 2,014 2,113 2,563 1,094
LibraryItems Checked Out 2,010,415 2,365,984 2,526,633 2,600,964 2,561,515Interlibrary Loans - Borrowed 1,269 1,189 1,151 605 311Interlibrary Loans - Loans 2,467 2,841 2,298 1,350 878Library Collection 699,943 598,224 566,744 575,462 580,046Patron Visits 1,491,973 1,623,514 1,520,528 1,392,890 1,410,177Website Visits 779,001 394,623 433,480 433,889 472,836Registered Patrons 227,348 161,373 139,821 130,989 154,252Total Programming 2,987 3,205 3,237 3,138 3,054Total Programming - Participants 78,256 66,313 71,425 64,416 58,945Typewriter Use 540 409 641 681 660Public Computer Use 596,540 651,984 682,863 636,072 565,386Bookmobile - Patrons 3 16,219 15,348 14,390 6,176 9,645Bookmobile - Number of Stops 3 1,331 1,291 1,324 448 492Bookmobile - Miles Driven 3 8,240 7,415 7,510 2,186 2,339
SchoolsStudent Enrollment 39,026 38,868 38,864 38,668 38,421
Source: Various City Departmentsn/a - Information not available1 Summer Food Service Program was transferred to Schools in FY09.2 Beginning in FY11, this number includes all activities taking place in the Community Center; prior years exclude athletic programs3 Beginning in FY11, Bookmobile services were provided on a more limited basis, primarily to those in need. Effective FY17 bookmobile no longer in service4 Beginning in FY14, this number includes all events instead of just tournaments (restated FY10 through FY13)5 Beginning in FY11, this number is calculated based on reports from the RMS system; prior years were hand counted by personnel6 Beginning in FY16, the Parks, Recreation and Tourism greatly increased their involvement in City Special Events7 Beginning in FY17, this number is based on reports from the new RMS system allowing the count to exclude services such as officers signing into court, traffic stops, etc.
Fiscal Year
246
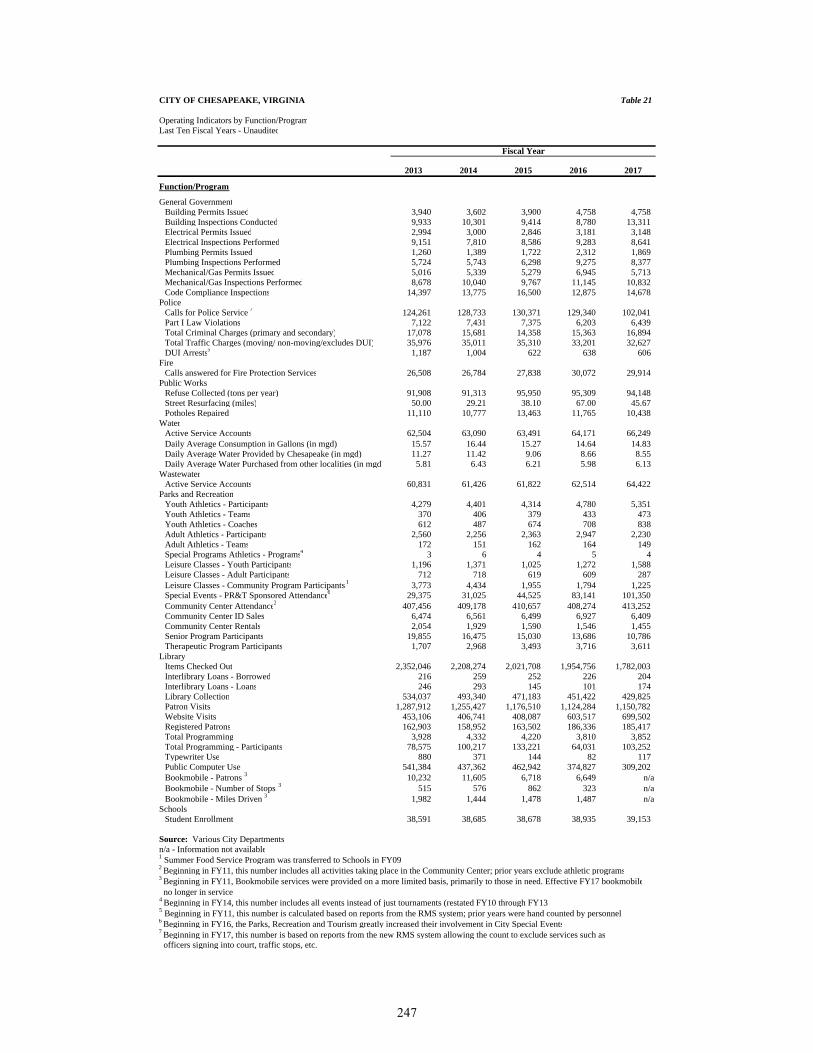
CITY OF CHESAPEAKE, VIRGINIA Table 21
Operating Indicators by Function/ProgramLast Ten Fiscal Years - Unaudited
2013 2014 2015 2016 2017
Function/Program
General GovernmentBuilding Permits Issued 3,940 3,602 3,900 4,758 4,758Building Inspections Conducted 9,933 10,301 9,414 8,780 13,311Electrical Permits Issued 2,994 3,000 2,846 3,181 3,148Electrical Inspections Performed 9,151 7,810 8,586 9,283 8,641Plumbing Permits Issued 1,260 1,389 1,722 2,312 1,869Plumbing Inspections Performed 5,724 5,743 6,298 9,275 8,377Mechanical/Gas Permits Issued 5,016 5,339 5,279 6,945 5,713Mechanical/Gas Inspections Performed 8,678 10,040 9,767 11,145 10,832Code Compliance Inspections 14,397 13,775 16,500 12,875 14,678
PoliceCalls for Police Service 7 124,261 128,733 130,371 129,340 102,041Part I Law Violations 7,122 7,431 7,375 6,203 6,439Total Criminal Charges (primary and secondary) 17,078 15,681 14,358 15,363 16,894Total Traffic Charges (moving/ non-moving/excludes DUI) 35,976 35,011 35,310 33,201 32,627DUI Arrests5 1,187 1,004 622 638 606
FireCalls answered for Fire Protection Services 26,508 26,784 27,838 30,072 29,914
Public WorksRefuse Collected (tons per year) 91,908 91,313 95,950 95,309 94,148Street Resurfacing (miles) 50.00 29.21 38.10 67.00 45.67Potholes Repaired 11,110 10,777 13,463 11,765 10,438
WaterActive Service Accounts 62,504 63,090 63,491 64,171 66,249Daily Average Consumption in Gallons (in mgd) 15.57 16.44 15.27 14.64 14.83Daily Average Water Provided by Chesapeake (in mgd) 11.27 11.42 9.06 8.66 8.55Daily Average Water Purchased from other localities (in mgd) 5.81 6.43 6.21 5.98 6.13
WastewaterActive Service Accounts 60,831 61,426 61,822 62,514 64,422
Parks and RecreationYouth Athletics - Participants 4,279 4,401 4,314 4,780 5,351Youth Athletics - Teams 370 406 379 433 473Youth Athletics - Coaches 612 487 674 708 838Adult Athletics - Participants 2,560 2,256 2,363 2,947 2,230Adult Athletics - Teams 172 151 162 164 149Special Programs Athletics - Programs4 3 6 4 5 4Leisure Classes - Youth Participants 1,196 1,371 1,025 1,272 1,588Leisure Classes - Adult Participants 712 718 619 609 287Leisure Classes - Community Program Participants 1 3,773 4,434 1,955 1,794 1,225Special Events - PR&T Sponsored Attendance6 29,375 31,025 44,525 83,141 101,350Community Center Attendance2 407,456 409,178 410,657 408,274 413,252Community Center ID Sales 6,474 6,561 6,499 6,927 6,409Community Center Rentals 2,054 1,929 1,590 1,546 1,455Senior Program Participants 19,855 16,475 15,030 13,686 10,786Therapeutic Program Participants 1,707 2,968 3,493 3,716 3,611
LibraryItems Checked Out 2,352,046 2,208,274 2,021,708 1,954,756 1,782,003Interlibrary Loans - Borrowed 216 259 252 226 204Interlibrary Loans - Loans 246 293 145 101 174Library Collection 534,037 493,340 471,183 451,422 429,825Patron Visits 1,287,912 1,255,427 1,176,510 1,124,284 1,150,782Website Visits 453,106 406,741 408,087 603,517 699,502Registered Patrons 162,903 158,952 163,502 186,336 185,417Total Programming 3,928 4,332 4,220 3,810 3,852Total Programming - Participants 78,575 100,217 133,221 64,031 103,252Typewriter Use 880 371 144 82 117Public Computer Use 541,384 437,362 462,942 374,827 309,202Bookmobile - Patrons 3 10,232 11,605 6,718 6,649 n/aBookmobile - Number of Stops 3 515 576 862 323 n/aBookmobile - Miles Driven 3 1,982 1,444 1,478 1,487 n/a
SchoolsStudent Enrollment 38,591 38,685 38,678 38,935 39,153
Source: Various City Departmentsn/a - Information not available1 Summer Food Service Program was transferred to Schools in FY09.2 Beginning in FY11, this number includes all activities taking place in the Community Center; prior years exclude athletic programs3 Beginning in FY11, Bookmobile services were provided on a more limited basis, primarily to those in need. Effective FY17 bookmobile no longer in service4 Beginning in FY14, this number includes all events instead of just tournaments (restated FY10 through FY13)5 Beginning in FY11, this number is calculated based on reports from the RMS system; prior years were hand counted by personnel6 Beginning in FY16, the Parks, Recreation and Tourism greatly increased their involvement in City Special Events7 Beginning in FY17, this number is based on reports from the new RMS system allowing the count to exclude services such as officers signing into court, traffic stops, etc.
Fiscal Year
247
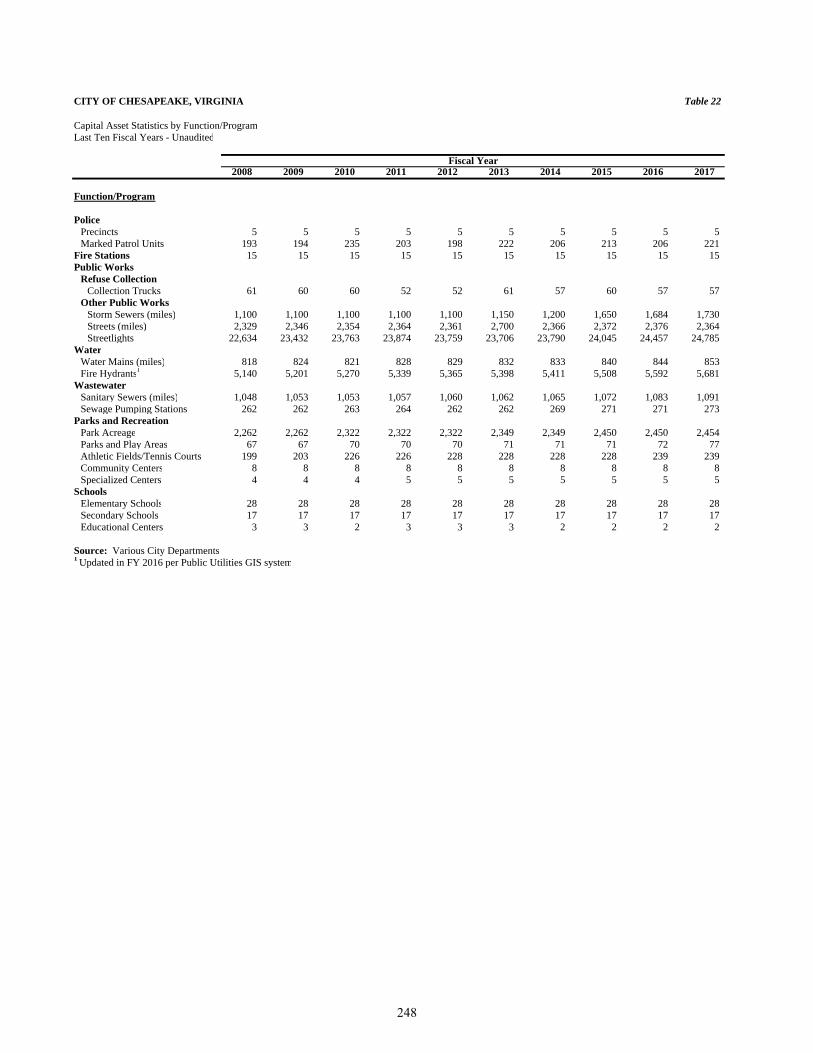
CITY OF CHESAPEAKE, VIRGINIA Table 22
Capital Asset Statistics by Function/ProgramLast Ten Fiscal Years - Unaudited
2008 2009 2010 2011 2012 2013 2014 2015 2016 2017
Function/Program
PolicePrecincts 5 5 5 5 5 5 5 5 5 5Marked Patrol Units 193 194 235 203 198 222 206 213 206 221
Fire Stations 15 15 15 15 15 15 15 15 15 15Public Works
Refuse CollectionCollection Trucks 61 60 60 52 52 61 57 60 57 57
Other Public WorksStorm Sewers (miles) 1,100 1,100 1,100 1,100 1,100 1,150 1,200 1,650 1,684 1,730Streets (miles) 2,329 2,346 2,354 2,364 2,361 2,700 2,366 2,372 2,376 2,364Streetlights 22,634 23,432 23,763 23,874 23,759 23,706 23,790 24,045 24,457 24,785
WaterWater Mains (miles) 818 824 821 828 829 832 833 840 844 853 Fire Hydrants1 5,140 5,201 5,270 5,339 5,365 5,398 5,411 5,508 5,592 5,681
WastewaterSanitary Sewers (miles) 1,048 1,053 1,053 1,057 1,060 1,062 1,065 1,072 1,083 1,091Sewage Pumping Stations 262 262 263 264 262 262 269 271 271 273
Parks and RecreationPark Acreage 2,262 2,262 2,322 2,322 2,322 2,349 2,349 2,450 2,450 2,454Parks and Play Areas 67 67 70 70 70 71 71 71 72 77Athletic Fields/Tennis Courts 199 203 226 226 228 228 228 228 239 239Community Centers 8 8 8 8 8 8 8 8 8 8Specialized Centers 4 4 4 5 5 5 5 5 5 5
SchoolsElementary Schools 28 28 28 28 28 28 28 28 28 28Secondary Schools 17 17 17 17 17 17 17 17 17 17Educational Centers 3 3 2 3 3 3 2 2 2 2
Source: Various City Departments1 Updated in FY 2016 per Public Utilities GIS system
Fiscal Year
248
COMPLIANCE SECTION

This page intentionally left blank
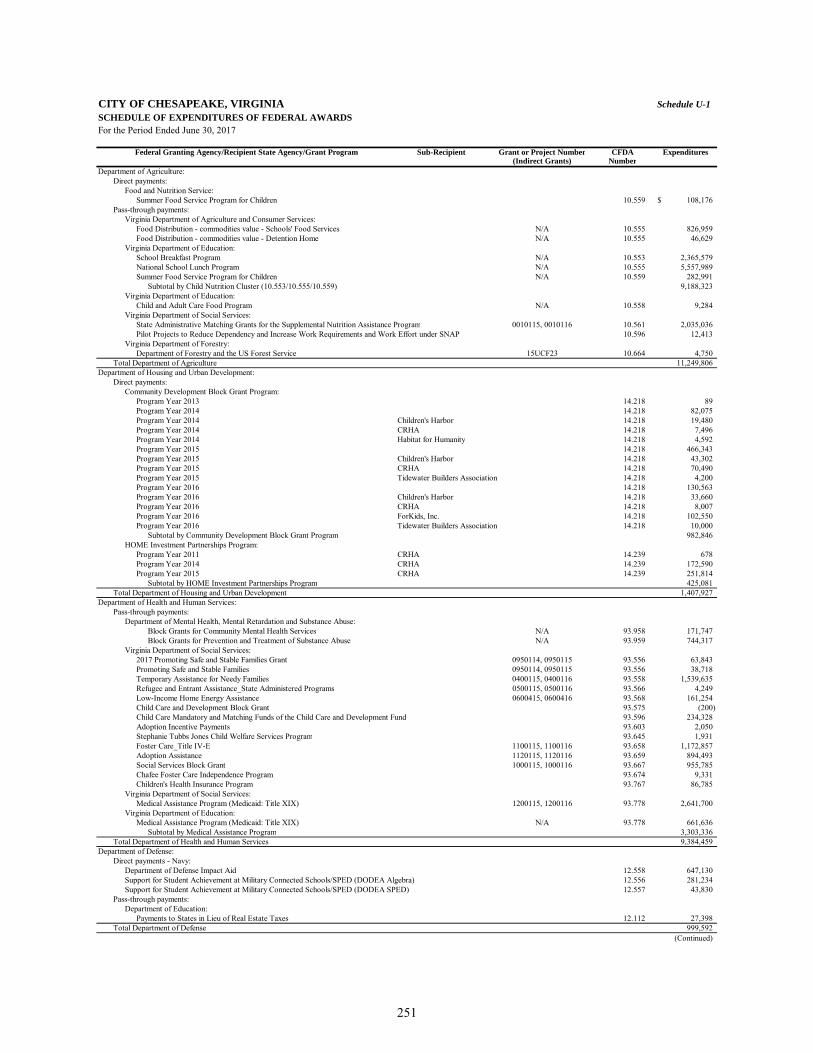
CITY OF CHESAPEAKE, VIRGINIA Schedule U-1SCHEDULE OF EXPENDITURES OF FEDERAL AWARDSFor the Period Ended June 30, 2017
Federal Granting Agency/Recipient State Agency/Grant Program Sub-Recipient Grant or Project Number CFDA Expenditures(Indirect Grants) Number
Department of Agriculture:Direct payments:
Food and Nutrition Service:Summer Food Service Program for Children 10.559 108,176$
Pass-through payments:Virginia Department of Agriculture and Consumer Services:
Food Distribution - commodities value - Schools' Food Services N/A 10.555 826,959 Food Distribution - commodities value - Detention Home N/A 10.555 46,629
Virginia Department of Education:School Breakfast Program N/A 10.553 2,365,579 National School Lunch Program N/A 10.555 5,557,989 Summer Food Service Program for Children N/A 10.559 282,991
Subtotal by Child Nutrition Cluster (10.553/10.555/10.559) 9,188,323 Virginia Department of Education:
Child and Adult Care Food Program N/A 10.558 9,284 Virginia Department of Social Services:
State Administrative Matching Grants for the Supplemental Nutrition Assistance Program 0010115, 0010116 10.561 2,035,036 Pilot Projects to Reduce Dependency and Increase Work Requirements and Work Effort under SNAP 10.596 12,413
Virginia Department of Forestry:Department of Forestry and the US Forest Service 15UCF23 10.664 4,750
Total Department of Agriculture 11,249,806 Department of Housing and Urban Development:
Direct payments:Community Development Block Grant Program:
Program Year 2013 14.218 89 Program Year 2014 14.218 82,075 Program Year 2014 Children's Harbor 14.218 19,480 Program Year 2014 CRHA 14.218 7,496 Program Year 2014 Habitat for Humanity 14.218 4,592 Program Year 2015 14.218 466,343 Program Year 2015 Children's Harbor 14.218 43,302 Program Year 2015 CRHA 14.218 70,490 Program Year 2015 Tidewater Builders Association 14.218 4,200 Program Year 2016 14.218 130,563 Program Year 2016 Children's Harbor 14.218 33,660 Program Year 2016 CRHA 14.218 8,007 Program Year 2016 ForKids, Inc. 14.218 102,550 Program Year 2016 Tidewater Builders Association 14.218 10,000
Subtotal by Community Development Block Grant Program 982,846 HOME Investment Partnerships Program:
Program Year 2011 CRHA 14.239 678 Program Year 2014 CRHA 14.239 172,590 Program Year 2015 CRHA 14.239 251,814
Subtotal by HOME Investment Partnerships Program 425,081 Total Department of Housing and Urban Development 1,407,927
Department of Health and Human Services:Pass-through payments:
Department of Mental Health, Mental Retardation and Substance Abuse:Block Grants for Community Mental Health Services N/A 93.958 171,747 Block Grants for Prevention and Treatment of Substance Abuse N/A 93.959 744,317
Virginia Department of Social Services:2017 Promoting Safe and Stable Families Grant 0950114, 0950115 93.556 63,843 Promoting Safe and Stable Families 0950114, 0950115 93.556 38,718 Temporary Assistance for Needy Families 0400115, 0400116 93.558 1,539,635 Refugee and Entrant Assistance_State Administered Programs 0500115, 0500116 93.566 4,249 Low-Income Home Energy Assistance 0600415, 0600416 93.568 161,254 Child Care and Development Block Grant 93.575 (200) Child Care Mandatory and Matching Funds of the Child Care and Development Fund 93.596 234,328 Adoption Incentive Payments 93.603 2,050 Stephanie Tubbs Jones Child Welfare Services Program 93.645 1,931 Foster Care_Title IV-E 1100115, 1100116 93.658 1,172,857 Adoption Assistance 1120115, 1120116 93.659 894,493 Social Services Block Grant 1000115, 1000116 93.667 955,785 Chafee Foster Care Independence Program 93.674 9,331 Children's Health Insurance Program 93.767 86,785
Virginia Department of Social Services:Medical Assistance Program (Medicaid: Title XIX) 1200115, 1200116 93.778 2,641,700
Virginia Department of Education:Medical Assistance Program (Medicaid: Title XIX) N/A 93.778 661,636
Subtotal by Medical Assistance Program 3,303,336 Total Department of Health and Human Services 9,384,459
Department of Defense:Direct payments - Navy:
Department of Defense Impact Aid 12.558 647,130 Support for Student Achievement at Military Connected Schools/SPED (DODEA Algebra) 12.556 281,234 Support for Student Achievement at Military Connected Schools/SPED (DODEA SPED) 12.557 43,830
Pass-through payments:Department of Education:
Payments to States in Lieu of Real Estate Taxes 12.112 27,398 Total Department of Defense 999,592
(Continued)
251
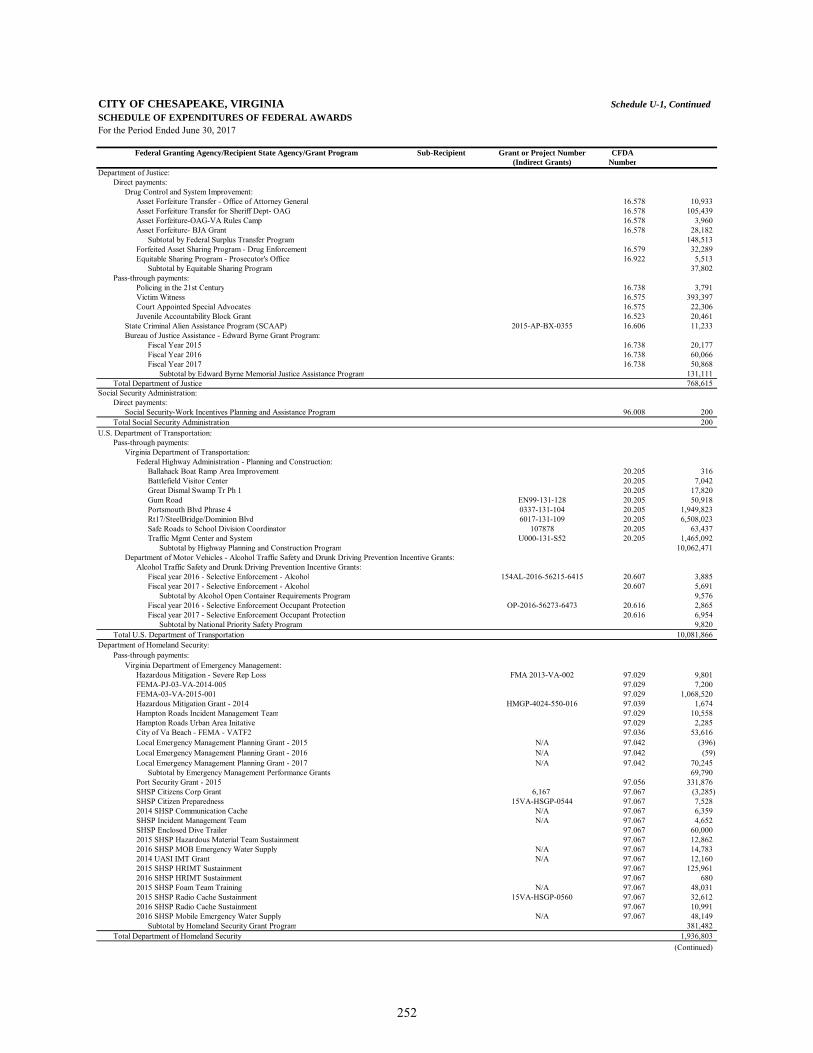
CITY OF CHESAPEAKE, VIRGINIA Schedule U-1, ContinuedSCHEDULE OF EXPENDITURES OF FEDERAL AWARDSFor the Period Ended June 30, 2017
Federal Granting Agency/Recipient State Agency/Grant Program Sub-Recipient Grant or Project Number CFDA(Indirect Grants) Number
Department of Justice: Direct payments:
Drug Control and System Improvement:Asset Forfeiture Transfer - Office of Attorney General 16.578 10,933 Asset Forfeiture Transfer for Sheriff Dept- OAG 16.578 105,439 Asset Forfeiture-OAG-VA Rules Camp 16.578 3,960 Asset Forfeiture- BJA Grant 16.578 28,182
Subtotal by Federal Surplus Transfer Program 148,513 Forfeited Asset Sharing Program - Drug Enforcement 16.579 32,289 Equitable Sharing Program - Prosecutor's Office 16.922 5,513
Subtotal by Equitable Sharing Program 37,802 Pass-through payments:
Policing in the 21st Century 16.738 3,791 Victim Witness 16.575 393,397 Court Appointed Special Advocates 16.575 22,306 Juvenile Accountability Block Grant 16.523 20,461
State Criminal Alien Assistance Program (SCAAP) 2015-AP-BX-0355 16.606 11,233 Bureau of Justice Assistance - Edward Byrne Grant Program:
Fiscal Year 2015 16.738 20,177 Fiscal Year 2016 16.738 60,066 Fiscal Year 2017 16.738 50,868
Subtotal by Edward Byrne Memorial Justice Assistance Program 131,111 Total Department of Justice 768,615
Social Security Administration:Direct payments:
Social Security-Work Incentives Planning and Assistance Program 96.008 200 Total Social Security Administration 200 U.S. Department of Transportation:
Pass-through payments:Virginia Department of Transportation:
Federal Highway Administration - Planning and Construction:Ballahack Boat Ramp Area Improvement 20.205 316 Battlefield Visitor Center 20.205 7,042 Great Dismal Swamp Tr Ph 1 20.205 17,820 Gum Road EN99-131-128 20.205 50,918 Portsmouth Blvd Phrase 4 0337-131-104 20.205 1,949,823 Rt17/SteelBridge/Dominion Blvd 6017-131-109 20.205 6,508,023 Safe Roads to School Division Coordinator 107878 20.205 63,437 Traffic Mgmt Center and System U000-131-S52 20.205 1,465,092
Subtotal by Highway Planning and Construction Program 10,062,471 Department of Motor Vehicles - Alcohol Traffic Safety and Drunk Driving Prevention Incentive Grants:
Alcohol Traffic Safety and Drunk Driving Prevention Incentive Grants:Fiscal year 2016 - Selective Enforcement - Alcohol 154AL-2016-56215-6415 20.607 3,885 Fiscal year 2017 - Selective Enforcement - Alcohol 20.607 5,691
Subtotal by Alcohol Open Container Requirements Program 9,576 Fiscal year 2016 - Selective Enforcement Occupant Protection OP-2016-56273-6473 20.616 2,865 Fiscal year 2017 - Selective Enforcement Occupant Protection 20.616 6,954
Subtotal by National Priority Safety Program 9,820 Total U.S. Department of Transportation 10,081,866
Department of Homeland Security: Pass-through payments:
Virginia Department of Emergency Management: Hazardous Mitigation - Severe Rep Loss FMA 2013-VA-002 97.029 9,801 FEMA-PJ-03-VA-2014-005 97.029 7,200 FEMA-03-VA-2015-001 97.029 1,068,520 Hazardous Mitigation Grant - 2014 HMGP-4024-550-016 97.039 1,674 Hampton Roads Incident Management Team 97.029 10,558 Hampton Roads Urban Area Initative 97.029 2,285 City of Va Beach - FEMA - VATF2 97.036 53,616 Local Emergency Management Planning Grant - 2015 N/A 97.042 (396) Local Emergency Management Planning Grant - 2016 N/A 97.042 (59) Local Emergency Management Planning Grant - 2017 N/A 97.042 70,245
Subtotal by Emergency Management Performance Grants 69,790 Port Security Grant - 2015 97.056 331,876 SHSP Citizens Corp Grant 6,167 97.067 (3,285) SHSP Citizen Preparedness 15VA-HSGP-0544 97.067 7,528 2014 SHSP Communication Cache N/A 97.067 6,359 SHSP Incident Management Team N/A 97.067 4,652 SHSP Enclosed Dive Trailer 97.067 60,000 2015 SHSP Hazardous Material Team Sustainment 97.067 12,862 2016 SHSP MOB Emergency Water Supply N/A 97.067 14,783 2014 UASI IMT Grant N/A 97.067 12,160 2015 SHSP HRIMT Sustainment 97.067 125,961 2016 SHSP HRIMT Sustainment 97.067 680 2015 SHSP Foam Team Training N/A 97.067 48,031 2015 SHSP Radio Cache Sustainment 15VA-HSGP-0560 97.067 32,612 2016 SHSP Radio Cache Sustainment 97.067 10,991 2016 SHSP Mobile Emergency Water Supply N/A 97.067 48,149
Subtotal by Homeland Security Grant Program 381,482 Total Department of Homeland Security 1,936,803
(Continued)
252
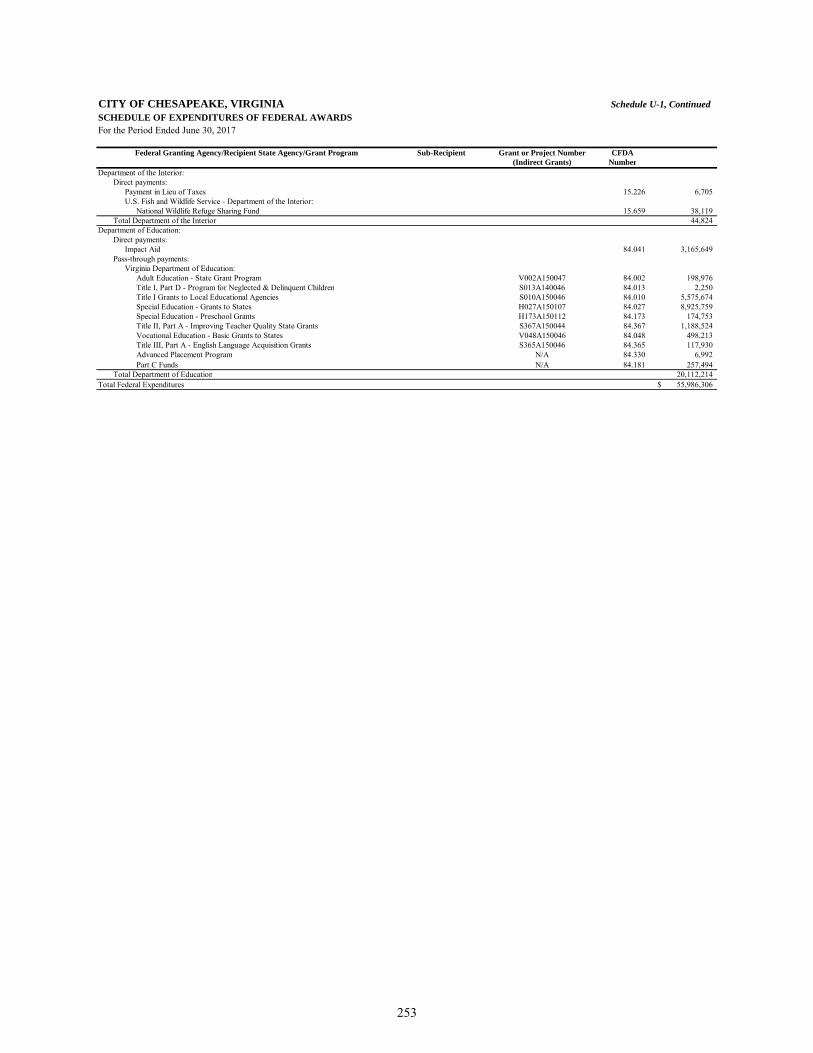
CITY OF CHESAPEAKE, VIRGINIA Schedule U-1, ContinuedSCHEDULE OF EXPENDITURES OF FEDERAL AWARDSFor the Period Ended June 30, 2017
Federal Granting Agency/Recipient State Agency/Grant Program Sub-Recipient Grant or Project Number CFDA(Indirect Grants) Number
Department of the Interior:Direct payments:
Payment in Lieu of Taxes 15.226 6,705 U.S. Fish and Wildlife Service - Department of the Interior:
National Wildlife Refuge Sharing Fund 15.659 38,119 Total Department of the Interior 44,824
Department of Education: Direct payments:
Impact Aid 84.041 3,165,649 Pass-through payments:
Virginia Department of Education:Adult Education - State Grant Program V002A150047 84.002 198,976 Title I, Part D - Program for Neglected & Delinquent Children S013A140046 84.013 2,250 Title I Grants to Local Educational Agencies S010A150046 84.010 5,575,674 Special Education - Grants to States H027A150107 84.027 8,925,759 Special Education - Preschool Grants H173A150112 84.173 174,753 Title II, Part A - Improving Teacher Quality State Grants S367A150044 84.367 1,188,524 Vocational Education - Basic Grants to States V048A150046 84.048 498,213 Title III, Part A - English Language Acquisition Grants S365A150046 84.365 117,930 Advanced Placement Program N/A 84.330 6,992 Part C Funds N/A 84.181 257,494
Total Department of Education 20,112,214 Total Federal Expenditures 55,986,306$
253
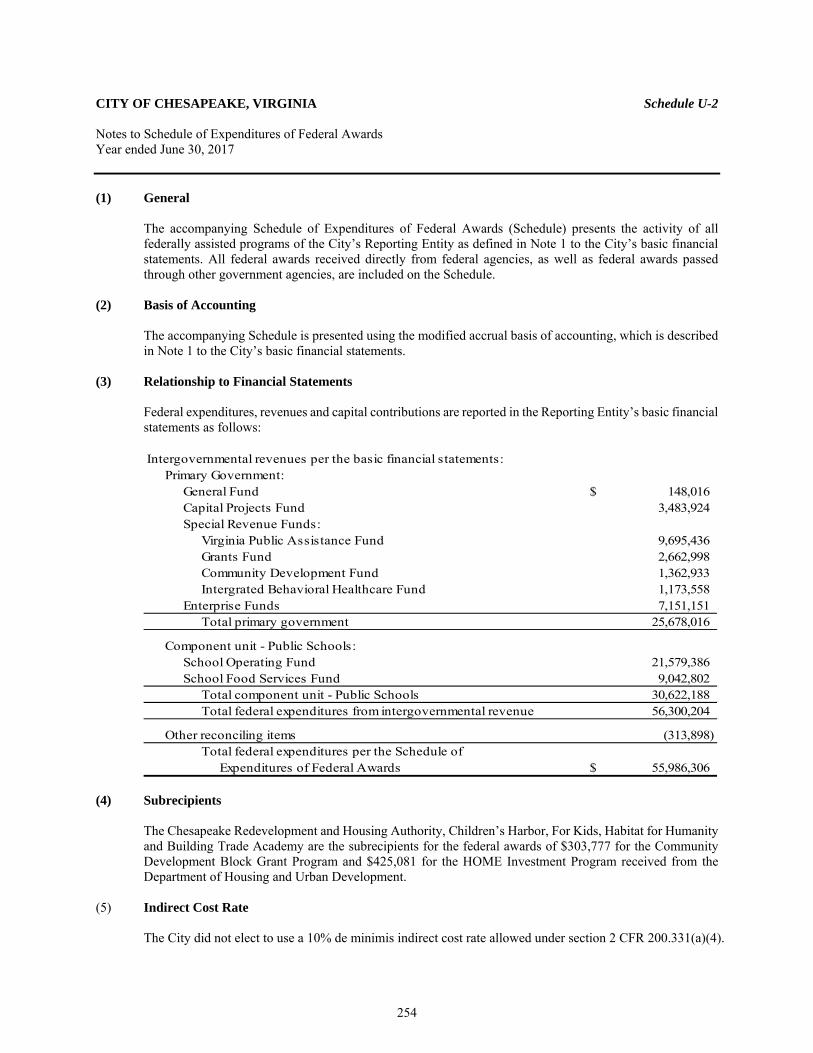
CITY OF CHESAPEAKE, VIRGINIA Schedule U-2 Notes to Schedule of Expenditures of Federal Awards Year ended June 30, 2017
(1) General
The accompanying Schedule of Expenditures of Federal Awards (Schedule) presents the activity of all federally assisted programs of the City’s Reporting Entity as defined in Note 1 to the City’s basic financial statements. All federal awards received directly from federal agencies, as well as federal awards passed through other government agencies, are included on the Schedule.
(2) Basis of Accounting
The accompanying Schedule is presented using the modified accrual basis of accounting, which is described in Note 1 to the City’s basic financial statements.
(3) Relationship to Financial Statements
Federal expenditures, revenues and capital contributions are reported in the Reporting Entity’s basic financial statements as follows:
Intergovernmental revenues per the basic financial statements:Primary Government:
General Fund $ 148,016 Capital Projects Fund 3,483,924 Special Revenue Funds:
Virginia Public Assistance Fund 9,695,436 Grants Fund 2,662,998 Community Development Fund 1,362,933 Intergrated Behavioral Healthcare Fund 1,173,558
Enterprise Funds 7,151,151 Total primary government 25,678,016
Component unit - Public Schools:School Operating Fund 21,579,386 School Food Services Fund 9,042,802
Total component unit - Public Schools 30,622,188 Total federal expenditures from intergovernmental revenue 56,300,204
Other reconciling items (313,898) Total federal expenditures per the Schedule of
Expenditures of Federal Awards $ 55,986,306 (4) Subrecipients
The Chesapeake Redevelopment and Housing Authority, Children’s Harbor, For Kids, Habitat for Humanity and Building Trade Academy are the subrecipients for the federal awards of $303,777 for the Community Development Block Grant Program and $425,081 for the HOME Investment Program received from the Department of Housing and Urban Development.
(5) Indirect Cost Rate
The City did not elect to use a 10% de minimis indirect cost rate allowed under section 2 CFR 200.331(a)(4).
254
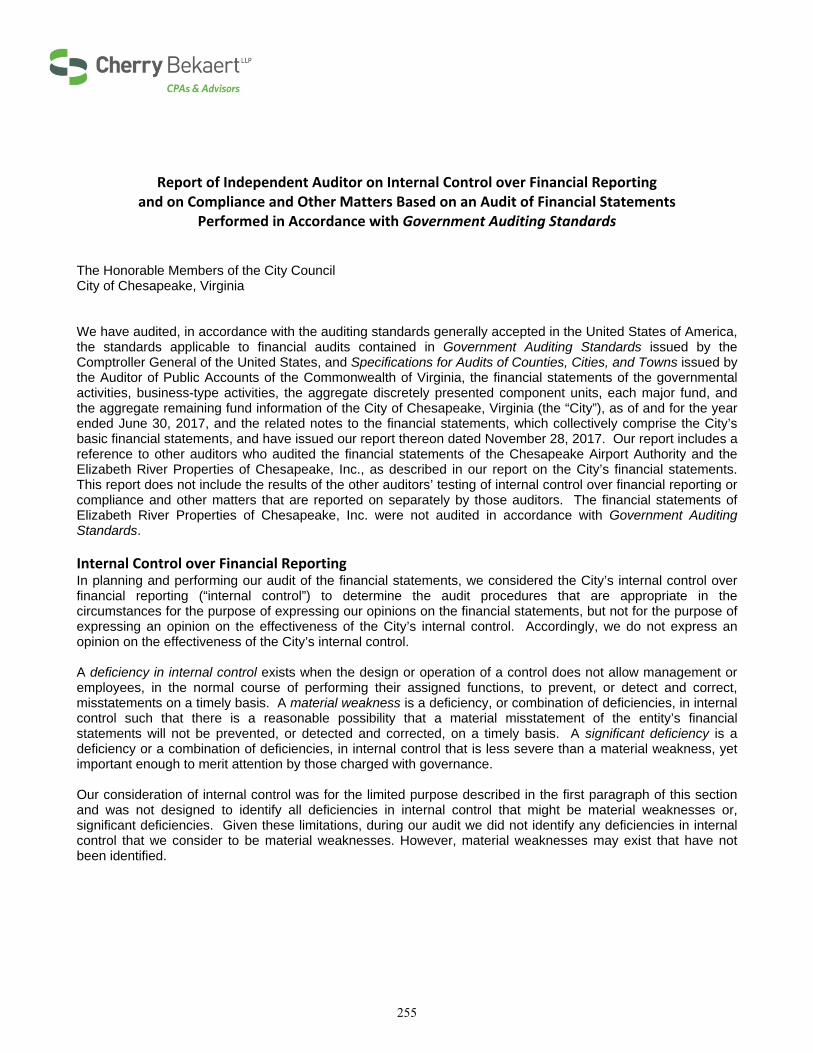
Report of Independent Auditor on Internal Control over Financial Reporting and on Compliance and Other Matters Based on an Audit of Financial Statements
Performed in Accordance with Government Auditing Standards The Honorable Members of the City Council City of Chesapeake, Virginia We have audited, in accordance with the auditing standards generally accepted in the United States of America, the standards applicable to financial audits contained in Government Auditing Standards issued by the Comptroller General of the United States, and Specifications for Audits of Counties, Cities, and Towns issued by the Auditor of Public Accounts of the Commonwealth of Virginia, the financial statements of the governmental activities, business-type activities, the aggregate discretely presented component units, each major fund, and the aggregate remaining fund information of the City of Chesapeake, Virginia (the “City”), as of and for the year ended June 30, 2017, and the related notes to the financial statements, which collectively comprise the City’s basic financial statements, and have issued our report thereon dated November 28, 2017. Our report includes a reference to other auditors who audited the financial statements of the Chesapeake Airport Authority and the Elizabeth River Properties of Chesapeake, Inc., as described in our report on the City’s financial statements. This report does not include the results of the other auditors’ testing of internal control over financial reporting or compliance and other matters that are reported on separately by those auditors. The financial statements of Elizabeth River Properties of Chesapeake, Inc. were not audited in accordance with Government Auditing Standards. Internal Control over Financial Reporting In planning and performing our audit of the financial statements, we considered the City’s internal control over financial reporting (“internal control”) to determine the audit procedures that are appropriate in the circumstances for the purpose of expressing our opinions on the financial statements, but not for the purpose of expressing an opinion on the effectiveness of the City’s internal control. Accordingly, we do not express an opinion on the effectiveness of the City’s internal control. A deficiency in internal control exists when the design or operation of a control does not allow management or employees, in the normal course of performing their assigned functions, to prevent, or detect and correct, misstatements on a timely basis. A material weakness is a deficiency, or combination of deficiencies, in internal control such that there is a reasonable possibility that a material misstatement of the entity’s financial statements will not be prevented, or detected and corrected, on a timely basis. A significant deficiency is a deficiency or a combination of deficiencies, in internal control that is less severe than a material weakness, yet important enough to merit attention by those charged with governance. Our consideration of internal control was for the limited purpose described in the first paragraph of this section and was not designed to identify all deficiencies in internal control that might be material weaknesses or, significant deficiencies. Given these limitations, during our audit we did not identify any deficiencies in internal control that we consider to be material weaknesses. However, material weaknesses may exist that have not been identified.
255
Compliance and Other Matters As part of obtaining reasonable assurance about whether the City’s financial statements are free from material misstatement, we performed tests of its compliance with certain provisions of laws, regulations, contracts, and grants, non-compliance with which could have a direct and material effect on the determination of financial statement amounts. However, providing an opinion on compliance with those provisions was not an objective of our audit, and accordingly, we do not express such an opinion. The results of our tests disclosed no instances of noncompliance or other matter that are required to be reported under Government Auditing Standards and one instance of noncompliance or other matter that is required to be reported under the Specifications for Audits of Counties, Cities, and Towns, which is described in the accompanying schedule of findings and questioned costs as items 2017-001. City of Chesapeake, Virginia’s Response to Finding The City’s response to the finding identified in our audit is described in the accompanying schedule of findings and questioned costs. The City’s response was not subjected to the auditing procedures applied in the audit of the financial statements and, accordingly, we express no opinion on it. Purpose of this Report The purpose of this report is solely to describe the scope of our testing on internal control and compliance and the results of that testing, and not to provide an opinion on the effectiveness of the City’s internal control or on compliance. This report is an integral part of an audit performed in accordance with Government Auditing Standards in considering the entity’s internal control and compliance. Accordingly, this communication is not suitable for any other purpose.
Virginia Beach, Virginia November 28, 2017
256
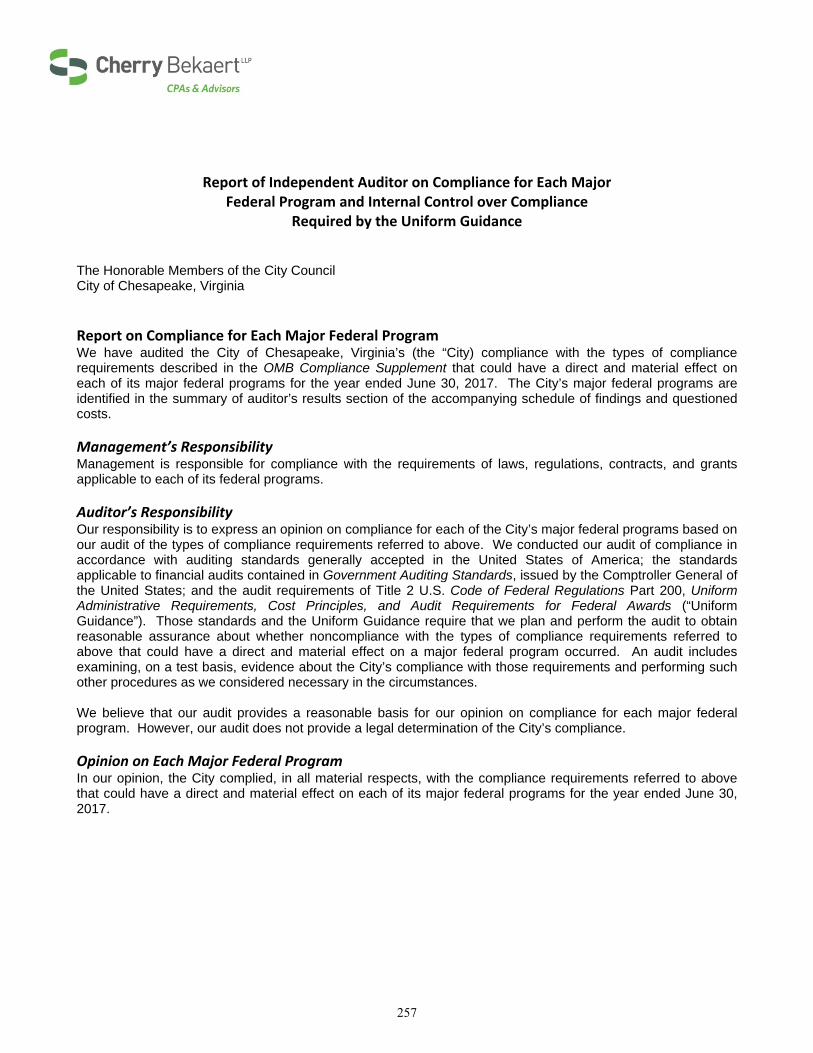
Report of Independent Auditor on Compliance for Each Major Federal Program and Internal Control over Compliance
Required by the Uniform Guidance The Honorable Members of the City Council City of Chesapeake, Virginia Report on Compliance for Each Major Federal Program We have audited the City of Chesapeake, Virginia’s (the “City) compliance with the types of compliance requirements described in the OMB Compliance Supplement that could have a direct and material effect on each of its major federal programs for the year ended June 30, 2017. The City’s major federal programs are identified in the summary of auditor’s results section of the accompanying schedule of findings and questioned costs. Management’s Responsibility Management is responsible for compliance with the requirements of laws, regulations, contracts, and grants applicable to each of its federal programs. Auditor’s Responsibility Our responsibility is to express an opinion on compliance for each of the City’s major federal programs based on our audit of the types of compliance requirements referred to above. We conducted our audit of compliance in accordance with auditing standards generally accepted in the United States of America; the standards applicable to financial audits contained in Government Auditing Standards, issued by the Comptroller General of the United States; and the audit requirements of Title 2 U.S. Code of Federal Regulations Part 200, Uniform Administrative Requirements, Cost Principles, and Audit Requirements for Federal Awards (“Uniform Guidance”). Those standards and the Uniform Guidance require that we plan and perform the audit to obtain reasonable assurance about whether noncompliance with the types of compliance requirements referred to above that could have a direct and material effect on a major federal program occurred. An audit includes examining, on a test basis, evidence about the City’s compliance with those requirements and performing such other procedures as we considered necessary in the circumstances. We believe that our audit provides a reasonable basis for our opinion on compliance for each major federal program. However, our audit does not provide a legal determination of the City’s compliance. Opinion on Each Major Federal Program In our opinion, the City complied, in all material respects, with the compliance requirements referred to above that could have a direct and material effect on each of its major federal programs for the year ended June 30, 2017.
257
Report on Internal Control over Compliance Management of the City is responsible for establishing and maintaining effective internal control over compliance with the types of compliance requirements referred to above. In planning and performing our audit of compliance, we considered the City’s internal control over compliance with the types of requirements that could have a direct and material effect on each major federal program to determine the auditing procedures that are appropriate in the circumstances for the purpose of expressing an opinion on compliance for each major federal program and to test and report on internal control over compliance in accordance with the Uniform Guidance, but not for the purpose of expressing an opinion on the effectiveness of internal control over compliance. Accordingly, we do not express an opinion on the effectiveness of the City’s internal control over compliance. A deficiency in internal control over compliance exists when the design or operation of a control over compliance does not allow management or employees, in the normal course of performing their assigned functions, to prevent, or detect and correct, noncompliance with a type of compliance requirement of a federal program on a timely basis. A material weakness in internal control over compliance is a deficiency, or combination of deficiencies, in internal control, such that there is a reasonable possibility that material noncompliance with a type of compliance requirement of a federal program will not be prevented, or detected and corrected, on a timely basis. A significant deficiency in internal control over compliance is a deficiency, or a combination of deficiencies, in internal control over compliance with a type of compliance requirement of a federal program that is less severe than a material weakness in internal control over compliance, yet important enough to merit attention by those charged with governance. Our consideration of internal control over compliance was for the limited purpose described in the first paragraph of this section and was not designed to identify all deficiencies in internal control over compliance that might be material weaknesses or significant deficiencies. We did not identify any deficiencies in internal control over compliance that we consider to be material weaknesses. However, material weaknesses may exist that have not been identified. The purpose of this report on internal control over compliance is solely to describe the scope of our testing of internal control over compliance and the results of that testing based on the requirements of the Uniform Guidance. Accordingly, this report is not suitable for any other purpose.
Virginia Beach, Virginia November 28, 2017
258
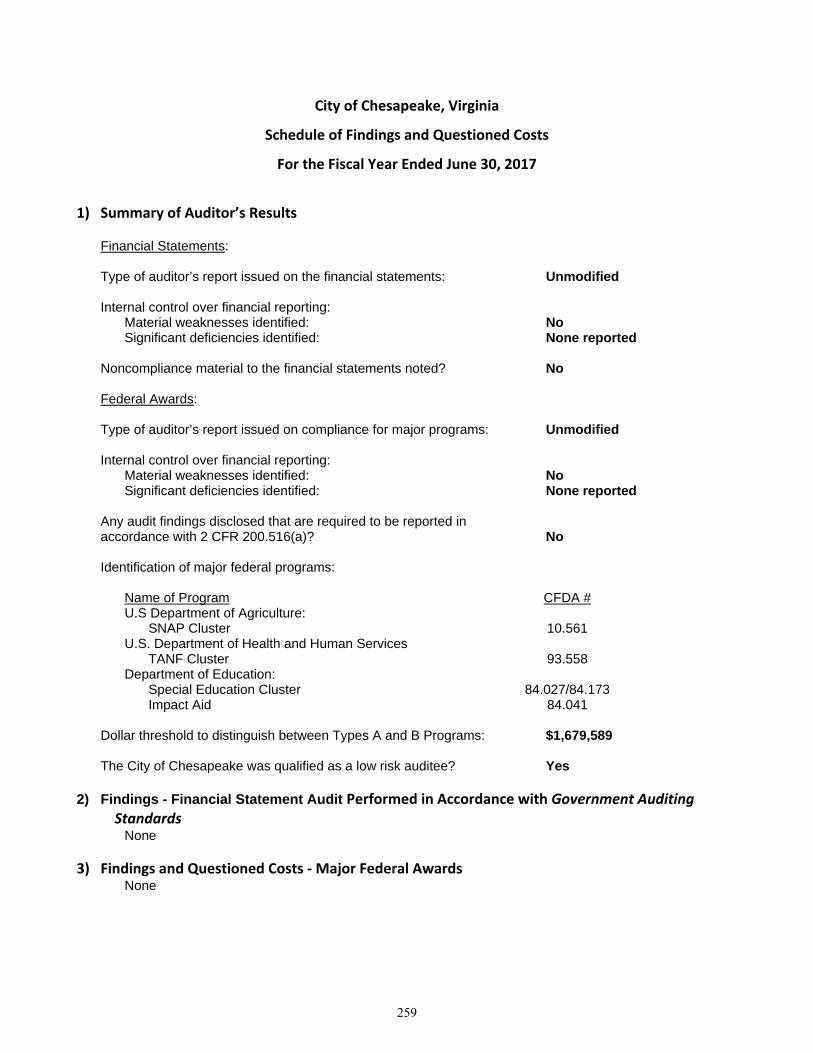
City of Chesapeake, Virginia
Schedule of Findings and Questioned Costs
For the Fiscal Year Ended June 30, 2017
1) Summary of Auditor’s Results
Financial Statements:
Type of auditor’s report issued on the financial statements: Unmodified Internal control over financial reporting:
Material weaknesses identified: No Significant deficiencies identified: None reported
Noncompliance material to the financial statements noted? No
Federal Awards:
Type of auditor’s report issued on compliance for major programs: Unmodified
Internal control over financial reporting:
Material weaknesses identified: No Significant deficiencies identified: None reported
Any audit findings disclosed that are required to be reported in accordance with 2 CFR 200.516(a)? No
Identification of major federal programs:
Name of Program CFDA #
U.S Department of Agriculture: SNAP Cluster 10.561
U.S. Department of Health and Human Services TANF Cluster 93.558
Department of Education: Special Education Cluster 84.027/84.173 Impact Aid 84.041
Dollar threshold to distinguish between Types A and B Programs: $1,679,589 The City of Chesapeake was qualified as a low risk auditee? Yes
2) Findings - Financial Statement Audit Performed in Accordance with Government Auditing Standards
None 3) Findings and Questioned Costs ‐ Major Federal Awards None
259
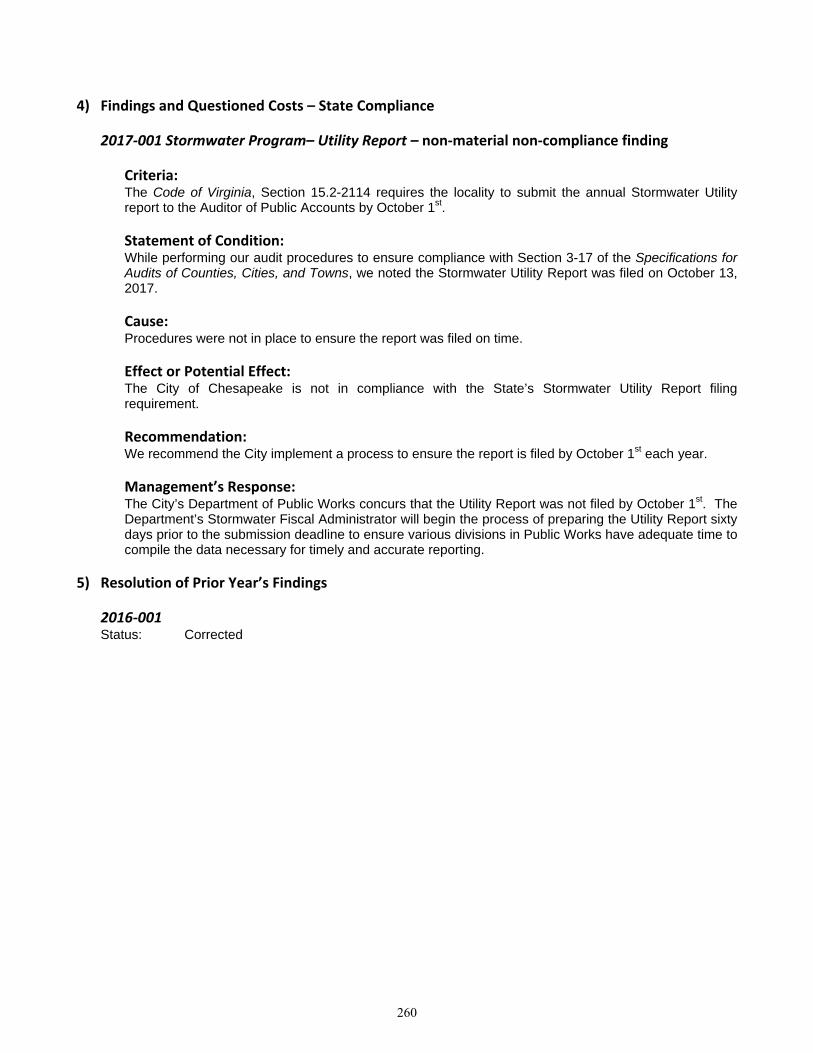
4) Findings and Questioned Costs – State Compliance
2017‐001 Stormwater Program– Utility Report – non‐material non‐compliance finding Criteria: The Code of Virginia, Section 15.2-2114 requires the locality to submit the annual Stormwater Utility report to the Auditor of Public Accounts by October 1st. Statement of Condition: While performing our audit procedures to ensure compliance with Section 3-17 of the Specifications for Audits of Counties, Cities, and Towns, we noted the Stormwater Utility Report was filed on October 13, 2017. Cause: Procedures were not in place to ensure the report was filed on time. Effect or Potential Effect: The City of Chesapeake is not in compliance with the State’s Stormwater Utility Report filing requirement. Recommendation: We recommend the City implement a process to ensure the report is filed by October 1st each year. Management’s Response: The City’s Department of Public Works concurs that the Utility Report was not filed by October 1st. The Department’s Stormwater Fiscal Administrator will begin the process of preparing the Utility Report sixty days prior to the submission deadline to ensure various divisions in Public Works have adequate time to compile the data necessary for timely and accurate reporting.
5) Resolution of Prior Year’s Findings
2016‐001 Status: Corrected
260

This page intentionally left blank
End of Comprehensive Annual Financial Report Of the City of Chesapeake, Virginia
For the Fiscal Year Ended June 30, 2017
FINANCE DEPARTMENTCITY OF CHESAPEAKE
306 CEDAR ROADCHESAPEAKE, VIRGINIA 23322
www.cityofchesapeake.net