
Comprehensive analyses of tumor immunity:...
16
RESEARCH Open Access Comprehensive analyses of tumor immunity: implications for cancer immunotherapy Bo Li 1,2 , Eric Severson 1,3 , Jean-Christophe Pignon 3 , Haoquan Zhao 1 , Taiwen Li 4 , Jesse Novak 3 , Peng Jiang 1 , Hui Shen 5 , Jon C. Aster 3 , Scott Rodig 3 , Sabina Signoretti 3 , Jun S. Liu 2* and X. Shirley Liu 1* Abstract Background: Understanding the interactions between tumor and the host immune system is critical to finding prognostic biomarkers, reducing drug resistance, and developing new therapies. Novel computational methods are needed to estimate tumor-infiltrating immune cells and understand tumor–immune interactions in cancers. Results: We analyze tumor-infiltrating immune cells in over 10,000 RNA-seq samples across 23 cancer types from The Cancer Genome Atlas (TCGA). Our computationally inferred immune infiltrates associate much more strongly with patient clinical features, viral infection status, and cancer genetic alterations than other computational approaches. Analysis of cancer/testis antigen expression and CD8 T-cell abundance suggests that MAGEA3 is a potential immune target in melanoma, but not in non-small cell lung cancer, and implicates SPAG5 as an alternative cancer vaccine target in multiple cancers. We find that melanomas expressing high levels of CTLA4 separate into two distinct groups with respect to CD8 T-cell infiltration, which might influence clinical responses to anti-CTLA4 agents. We observe similar dichotomy of TIM3 expression with respect to CD8 T cells in kidney cancer and validate it experimentally. The abundance of immune infiltration, together with our downstream analyses and findings, are accessible through TIMER, a public resource at http://cistrome.org/TIMER. Conclusions: We develop a computational approach to study tumor-infiltrating immune cells and their interactions with cancer cells. Our resource of immune-infiltrate levels, clinical associations, as well as predicted therapeutic markers may inform effective cancer vaccine and checkpoint blockade therapies. Keywords: Cancer immunity, Tumor immune infiltration, Cancer immunotherapies, Cancer vaccine, Checkpoint blockade Background Cancer immunotherapy has recently achieved remarkable success in treating late stage tumors [1, 2], but a substan- tial fraction of patients failed to respond [3, 4]. Efforts have been made to elucidate the tumor–immune interac- tions [5–8] and provide prognostic predictors [9–11]. Rooney et al. [6] studied cytolytic activity (CYT) using the expression levels of two effector molecules and identified possible mechanisms of immune evasion. Another recent work [7] characterized the immunophenotypes in colorec- tal cancer and provided novel therapeutic targets. While these studies profoundly improved the understanding of cancer immunoediting [12], less is known about how the interactions between tumor and the immune system im- pact patient outcome. Clinical investigations on tumor- infiltrating immune cells have established the roles of cytotoxic T cells (CTLs) and tumor-associated macro- phages (TAMs) in some diseases [13, 14]. However, the clinical impact of other immune cells in many cancers re- mains poorly understood. Hence, there is a great need for a more comprehensive and translational analysis of tumor immunity to better understand the multi-component * Correspondence: [email protected]; [email protected] 2 Department of Statistics, Harvard University, 1 Oxford St., Cambridge, MA 02138, USA 1 Department of Biostatistics and Computational Biology, Dana Farber Cancer Institute, 450 Brookline Ave., Boston, MA 02215, USA Full list of author information is available at the end of the article © 2016 The Author(s). Open Access This article is distributed under the terms of the Creative Commons Attribution 4.0 International License (http://creativecommons.org/licenses/by/4.0/), which permits unrestricted use, distribution, and reproduction in any medium, provided you give appropriate credit to the original author(s) and the source, provide a link to the Creative Commons license, and indicate if changes were made. The Creative Commons Public Domain Dedication waiver (http://creativecommons.org/publicdomain/zero/1.0/) applies to the data made available in this article, unless otherwise stated. Li et al. Genome Biology (2016) 17:174 DOI 10.1186/s13059-016-1028-7
Transcript of Comprehensive analyses of tumor immunity:...

RESEARCH Open Access
Comprehensive analyses of tumorimmunity: implications for cancerimmunotherapyBo Li1,2, Eric Severson1,3, Jean-Christophe Pignon3, Haoquan Zhao1, Taiwen Li4, Jesse Novak3, Peng Jiang1,Hui Shen5, Jon C. Aster3, Scott Rodig3, Sabina Signoretti3, Jun S. Liu2* and X. Shirley Liu1*
Abstract
Background: Understanding the interactions between tumor and the host immune system is critical to findingprognostic biomarkers, reducing drug resistance, and developing new therapies. Novel computational methods areneeded to estimate tumor-infiltrating immune cells and understand tumor–immune interactions in cancers.
Results: We analyze tumor-infiltrating immune cells in over 10,000 RNA-seq samples across 23 cancer types fromThe Cancer Genome Atlas (TCGA). Our computationally inferred immune infiltrates associate much more stronglywith patient clinical features, viral infection status, and cancer genetic alterations than other computationalapproaches. Analysis of cancer/testis antigen expression and CD8 T-cell abundance suggests that MAGEA3 is apotential immune target in melanoma, but not in non-small cell lung cancer, and implicates SPAG5 as analternative cancer vaccine target in multiple cancers. We find that melanomas expressing high levels of CTLA4separate into two distinct groups with respect to CD8 T-cell infiltration, which might influence clinical responses toanti-CTLA4 agents. We observe similar dichotomy of TIM3 expression with respect to CD8 T cells in kidney cancerand validate it experimentally. The abundance of immune infiltration, together with our downstream analyses andfindings, are accessible through TIMER, a public resource at http://cistrome.org/TIMER.
Conclusions: We develop a computational approach to study tumor-infiltrating immune cells and their interactionswith cancer cells. Our resource of immune-infiltrate levels, clinical associations, as well as predicted therapeuticmarkers may inform effective cancer vaccine and checkpoint blockade therapies.
Keywords: Cancer immunity, Tumor immune infiltration, Cancer immunotherapies, Cancer vaccine, Checkpointblockade
BackgroundCancer immunotherapy has recently achieved remarkablesuccess in treating late stage tumors [1, 2], but a substan-tial fraction of patients failed to respond [3, 4]. Effortshave been made to elucidate the tumor–immune interac-tions [5–8] and provide prognostic predictors [9–11].Rooney et al. [6] studied cytolytic activity (CYT) using theexpression levels of two effector molecules and identifiedpossible mechanisms of immune evasion. Another recent
work [7] characterized the immunophenotypes in colorec-tal cancer and provided novel therapeutic targets. Whilethese studies profoundly improved the understanding ofcancer immunoediting [12], less is known about how theinteractions between tumor and the immune system im-pact patient outcome. Clinical investigations on tumor-infiltrating immune cells have established the roles ofcytotoxic T cells (CTLs) and tumor-associated macro-phages (TAMs) in some diseases [13, 14]. However, theclinical impact of other immune cells in many cancers re-mains poorly understood. Hence, there is a great need fora more comprehensive and translational analysis of tumorimmunity to better understand the multi-component
* Correspondence: [email protected]; [email protected] of Statistics, Harvard University, 1 Oxford St., Cambridge, MA02138, USA1Department of Biostatistics and Computational Biology, Dana Farber CancerInstitute, 450 Brookline Ave., Boston, MA 02215, USAFull list of author information is available at the end of the article
© 2016 The Author(s). Open Access This article is distributed under the terms of the Creative Commons Attribution 4.0International License (http://creativecommons.org/licenses/by/4.0/), which permits unrestricted use, distribution, andreproduction in any medium, provided you give appropriate credit to the original author(s) and the source, provide a link tothe Creative Commons license, and indicate if changes were made. The Creative Commons Public Domain Dedication waiver(http://creativecommons.org/publicdomain/zero/1.0/) applies to the data made available in this article, unless otherwise stated.
Li et al. Genome Biology (2016) 17:174 DOI 10.1186/s13059-016-1028-7

antitumor response and guide effective immunotherapiesin different cancers.In this work, we integrated the molecular profiles of
over 10,000 tumor samples across 23 cancer types to in-vestigate the impact of individual immune componentson a wide spectrum of clinical features. Our estimates oftumor-infiltrating immune cells were validated usingmultiple approaches, including in silico simulation, com-parison with orthogonal inferences, and a pathologicalapproach. Correlating immune infiltration with patientoutcomes, we identified a number of associations, in-cluding both novel associations and those supported byprior studies [14]. Our analysis also suggested that theinter-tumor heterogeneity of immune infiltration is po-tentially caused by both cancer genetic variations as wellas the disease-specific expression pattern of the chemo-kine/receptor network. As a translational approach, weinvestigated immunotherapy targets for both therapeuticcancer vaccine and checkpoint blockade. Finally, our insilico inferences and associated findings have been pack-aged into a web-accessible resource, TIMER (Tumor IM-mune Estimation Resource), to enable further explorationsof the disease-specific clinical impact of different immuneinfiltrates in the tumor microenvironment.
ResultsComputational estimation of tumor immune infiltrationWe developed a computational method to estimate theabundance of six tumor-infiltrating immune cell types (Bcells, CD4 T cells, CD8 T cells, neutrophils, macrophages,and dendritic cells) to study 23 cancer types in The CancerGenome Atlas (TCGA): adenocortical carcinoma (ACC),bladder carcinoma (BLCA), breast carcinoma (BRCA), cer-vical squamous carcinoma (CESC), colon adenocarcinoma(COAD), diffusive large B-cell lymphoma (DLBC), glio-blastoma multiforme (GBM), head and neck carcinoma(HNSC), kidney chromophobe (KICH), kidney renal clearcell carcinoma (KIRC), kidney renal papillary cell carcin-oma (KIRP), lower grade glioma (LGG), liver hepatocellu-lar carcinoma (LIHC), lung adenocarcinoma (LUAD), lungsquamous carcinoma (LUSC), ovarian serous cystadeno-carcinoma (OV), prostate adenocarcinoma (PRAD), rec-tum adenocarcinoma (READ), skin cutaneous melanoma(SKCM), stomach adenocarcinoma (STAD), thyroid car-cinoma (THCA), uterine corpus endometrial carcinoma(UCEC), and uterine carsinosarcoma (UCS). These siximmune cell types include some of the currently mostpromising cancer immunotherapy targets and also havesufficient numbers of reference immune cell samples tomake accurate inferences (“Methods”). The prerequisitedata include tumor purity, tumor gene expression profiles(as transcript per million reads (TPM)) from TCGA, andan external reference dataset of purified immune cells.Tumor purity is critical to selecting genes informative for
deconvolving immune cells in the tumor tissue and wasinferred from copy number alteration data using an Rpackage, CHAT, we have developed [15] (Fig. 1a). Ourpurity estimation method has been validated using dilutedseries with known tumor/normal mixture ratios andagreed with previous methods and orthogonal estimations[16]. The distributions of tumor purity showed large varia-tions among different samples across most of the 23TCGA cancer types (Additional file 1: Figure S1). For eachcancer dataset, batch effects between TCGA and the ex-ternal reference data sets were removed using ComBat[17] (Fig. 1b). Next we selected genes whose expressionlevels are negatively correlated with tumor purity (Fig. 1c;Additional file 1: Figure S2; Additional file 2: Table S1), anindication that these genes are expressed by stromal cellsin the tumor microenvironment. Across all 23 cancers, in-formative genes selected from the above steps are signifi-cantly enriched for a predefined immune signature [18](Fig. 1d). This result indicates that large numbers of im-mune cell-specific genes are highly expressed in the tumormicroenvironment. Finally, we used constrained leastsquares fitting [19] on the informative immune signaturegenes to infer the abundance of the six immune cell types(Fig. 1e).As a key component of TIMER, the outcome of the
above method was validated with multiple approaches.The first one was pathology, where we estimated thelevels (low, median, and high) of neutrophils in bladdercancer samples using hematoxylin and eosin stainedslides from TCGA (“Methods”). Our in silico predictionsof neutrophil abundance agreed well with the histo-logical estimations (Additional file 1: Figure S3a, b). Wealso validated our predictions using total infiltrating leu-kocytes estimated from DNA methylation data [20] andobserved high concordance between our RNA and theDNA-based predictions in all available cancers (Additionalfile 1: Figure S3c). In addition, Monte Carlo simulationswith known immune cell fractions were applied to all can-cer types. High correlations were observed between thepredicted and simulated immune cell abundance for allcomparisons except CD4, CD8 T cells, dendritic cells inGBM, and B cells in DLBC (Additional file 1: Figure S3d;“Methods”), which were excluded from downstream ana-lysis. The inferred relative fractions of the six immune celltypes of all the samples across 23 cancers are available inAdditional file 3: Table S2.
Clinical relevance of tumor immune infiltrationTo study the distribution of infiltrating immune cells inthe tumor and adjacent/normal tissues, we focused on18 cancer types for which the mRNA expression profilesof adjacent or normal tissues were available. Consistentwith Rooney et al. [6], CD8 T cells are enriched in tumortissues in kidney cancer (KIRC) and head and neck
Li et al. Genome Biology (2016) 17:174 Page 2 of 16

cancer. In contrast, CD8 T cells appear to be in lowerabundance in most other cancers, such as non-small celllung carcinomas (including adenocarcinoma and squa-mous cell carcinoma) and colorectal cancer (includingcolon and rectal adenocarcinoma) (Fig. 2a). Macrophages
are significantly enriched in GBM, which is supportedby previous observations showing that microglia andmacrophages are present in large numbers in the gliomamicroenvironment [21]. Furthermore, the abundance oftumor-infiltrating B cells is significantly higher than in
a
b
c
d
e
Fig. 1 Computational method for estimating the abundance of tumor-infiltrating immune cells. Tumor purity was estimated for each sampleusing DNA single-nucleotide polymorphism (SNP) array data (a). B allele frequency (BAF) is the frequency of a randomly selected parental allele.The logR ratio (LRR) is the log2(Y/2), Y being the marker intensity in the SNP array. TCGA gene expression profiles were combined with referenceimmune cell expression data after batch effect removal (b). Informative genes with expression levels inversely correlated with tumor purity (Pearson’sr≤−0.2 and P value≤ 0.05) are selected (c) and tested for immune signature enrichment (Fisher’s exact test) (d). In all 23 cancers informative genesare significantly enriched for immune signature. Diffuse large B-cell lymphoma (DLBC) has the lowest enrichment (odds ratio = 1.6, q = 0.0005, Fisher’sexact test). In this study, we estimate the abundance of six immune cell types (B cells, CD4 T cells, CD8 T cells, neutrophil, macrophage, and dendriticcells) using selected immune signature genes through constrained least squares fitting (e). Asterisks in d indicate event significance at a 1 % falsediscovery rate
Li et al. Genome Biology (2016) 17:174 Page 3 of 16

a
b
Fig. 2 Distribution of infiltrating immune cells and selective enrichment of B cells in the tumor microenvironment. a The abundance ofinfiltrating CD8 T cells, macrophages, and B cells in 18 cancer types, with both primary tumor and adjacent (Adj)/normal (Norm) tissue available.Normal tissue was from healthy donors where adjacent tissues were unavailable. Statistical significance was evaluated by Wilcoxon rank sum test.Blue arrowheads point to three cancers with B cells significantly enriched in the primary tumor and associated with clinical outcomes. q values arecolored red, blue, or black for significant (false discovery rate≤ 0.15) enrichment in tumor, adjacent or normal tissue, or insignificance, respectively.b B-cell infiltration level significantly predicted patient survival in selected cancer types. Tumors in the top 20th percentile of B-cell infiltrationwere compared with those in the bottom 20th percentile. The median survival time for the top 20 % of patients with brain, lung, and bladdercancers was 460, 1778, and 2000 days, respectively, and for the bottom 20 % 345, 976, and 575 days, respectively. Statistical significance andhazard ratios (HR) with 95 % confidence intervals were calculated for all the samples, not just the top and bottom 20 %, using multivariate Coxregression including all six immune cell types, patient age, and clinical stage
Li et al. Genome Biology (2016) 17:174 Page 4 of 16

the adjacent or normal tissues in eight cancer types.Interestingly, B-cell infiltration predicts a significantlybetter outcome in a subset of these cancers (Fig. 2b).The most dramatic case is GBM, where patients withthe top 20 % of B-cell infiltration have a 4.7-month lon-ger median survival time than those with the lowest20 % (“Methods”). This result suggests that tumor-
infiltrating B cells play an important role in the antitu-mor responses in GBM and lung and bladder cancers.We next investigated how infiltrating immune cells in-
fluence clinical outcomes. Using multivariate Cox regres-sion adjusted for age, stage, and viral infection status, weidentified many significant associations between immunecell abundance and patient outcomes (Fig. 3). While CD8
a
b
c
Multivariate Cox Regression
Fig. 3 Immune cell infiltration predicts clinical outcome. a Association of tumor infiltrating immune cells with patient survival. For each cancertype, multivariate Cox regression was performed, with covariates including the abundance of six immune cell types, patient age at diagnosis,clinical stage, and viral infection status when available. Each entry on the first six rows of the heatmap represents the hazard ratio (HR) of acorresponding immune cell type, with larger size indicating statistical significance at a false discovery rate (FDR) of 0.15 and color indicating thevalue of the HR. The last row of the heatmap records the Cox model HRs and statistical significance using cytolytic activity (CYT) scores adjustedfor the same covariates. Multiple test correction was performed using q value across cancer types and six immune components. b Kaplan–Meiercurves of melanoma (SKCM) and head and neck cancer (HNSC) stratified by infiltration CD8 T-cell abundance. Median survival time for the top20 % of patients in melanoma and head and neck cancers is 4507 and 1838 days, respectively, and for bottom 20 % 2005 and 862 days, respectively.Statistical significance, hazard ratios, and 95 % confidence intervals were calculated using multivariate Cox regression and all the samples as describedabove. c CD8 T-cell infiltration in primary tumors (metastatic samples for SKCM) significantly (FDR≤ 0.15) predicts tumor relapse in selected cancers.Statistical significance was evaluated using logistic regression correcting for patient age and clinical stage
Li et al. Genome Biology (2016) 17:174 Page 5 of 16

T-cell infiltration associates with prolonged survival andmacrophage infiltration consistently predicts worse out-come, other immune cell types have cancer-specific effectson prognosis (Fig. 3a). These observations corroborateprevious reports that cytotoxic T-cell infiltration inde-pendently predicts better outcome in liver [22] and rectal[23] cancers. Consistent with established knowledge inmelanoma and head and neck cancer [24, 25], we alsofound infiltrating CD8 T cells to be associated with sur-vival in univariate analysis (Fig. 3b). However, it is not anindependent predictor of better outcome after adjustingfor other covariates, since CD8 T cells are correlated withneutrophil infiltration in melanoma and human papillomavirus (HPV) infection in head and neck cancer(“Methods”). In fact, infiltrations of B cells and CD4 andCD8 T cells are all significantly higher in HPV-positivethan in HPV-negative head and neck tumors (Additionalfile 1: Figure S4), suggesting that viral antigens result in anelevated lymphocyte response. Besides the effect on pa-tient survival, CD8 T cells may also play an important rolein preventing tumor recurrence (Fig. 3c). In melanomaand colorectal and cervical cancers, patients with higherCD8 T-cell infiltration in the primary tumors have a sig-nificantly lower risk of developing a second tumor duringthe follow-up period. Overall, our observations on tumor-infiltrating CD8 T cells are extensively supported by clinicalstudies [14] (Additional file 4: Table S3), thus providingadditional validation to our deconvolution method.Cytolytic activity (CYT) is a previously defined metricof immune-mediated cell destruction [6]. Comparedwith CYT, our analysis identified many more strong as-sociations between tumor-infiltrating immune cells andpatient clinical outcomes (Fig. 3a), presumably becauseour method takes into account expression data fromhundreds of genes instead of only two.TAM numbers have been reported to be a predictor of
worse outcome in many cancers [13]. Consistently, wefound that TAM significantly associates with worse out-come in bladder, breast, and ovarian cancers and inlower-grade glioma (Fig. 3a), supporting TAMs as an in-dependent prognostic factor for these cancers. Extendingthis analysis to the less well-studied chromophobe renalcarcinoma (KICH), we detected a significant inverse as-sociation between macrophage infiltration and patientsurvival (Fig. 3a), suggesting that TAMs function inKICH as in other solid tumors.
Potential causes for immune infiltration heterogeneityWe next examined the possible causes of inter-tumorimmune infiltration heterogeneity, such as somatic mu-tations and chemokine expression. Non-synonymoussomatic mutations in the tumor genome can generateimmunogenic neoantigens that trigger antitumor re-sponse through T-cell activation [26–29]. In addition,
total mutation load has been suggested as a surrogatefor neoantigen count [6]. To understand how the hostimmune system responds to tumor somatic mutations,we studied the association of infiltrating immune cellsand total mutation load. Tumor purity is a confoundingfactor in this analysis, since purity affects the power todetect somatic mutations [20] and drives the pattern ofgene expression [16]. After correcting for purity, we ob-served positive correlations between the total mutationcount and infiltrating immune cells in a subset of can-cers (Fig. 4a). In lung squamous cell carcinoma, lowergrade glioma, HPV-negative head and neck cancer, andprostate cancer, CD8 T-cell infiltration increases signifi-cantly with tumor mutation load, in support of a previ-ous study [6]. In addition, we observed that dendriticcell infiltration is correlated with the total mutation loadin breast cancer (Spearman’s ρ = 0.11, q = 0.037), as is B-cell infiltration (ρ = 0.13, q = 0.018), suggesting cancer-specific roles for these cell types in antitumor immunity.Similar associations were observed when we used neoan-tigen load estimated from a previous work [6] instead oftotal mutation load (Additional file 1: Figure S5), cor-roborating our conclusion that increased tumor neoepi-tope load elevates the infiltration of multiple immunecell types.Besides point mutations, microsatellite instability (MSI)
is seen in colorectal, stomach, and endometrial cancers.MSI typically generates small indels across the genome,producing non-self antigens that may be recognized bythe host immune system. Consistent with a previous re-port [7], we found CD8 T cells to be significantly moreabundant in MSI-high (MSI-H) tumors compared withMSI-low (MSI-L) tumors in colon cancer (Fig. 4b).Among the remaining three TCGA cancers with availableMSI information, we also found higher levels of MSI to beassociated with increased CD8 T cells in stomach cancer.A recent study reported that MSI-high colon cancer pa-tients showed significantly better responses to PD-1 block-ade therapies [12] and our results suggest that thisconclusion may be extended to other gastro-intestinalcancers with MSI.To further investigate the regulation of immune infil-
trates in different cancers, we also systematically studiedthe expression levels of chemokines and receptors. Mostof these molecules were expressed in the microenviron-ment (Additional file 1: Figure S6a, b). CD8 T-cell levelis significantly associated with a subset of chemokine–receptor pairs, including CCL3,4,5–CCR1,5 and XCL1,2–XCR1 (Fig. 4c). On the other hand, different molecules areassociated with macrophage abundance in cancer-specificpatterns. Macrophage infiltration appears to be related toCXCL12–CXCR4 in thyroid, head and neck, stomach, andcolon cancers and to CCL14,CCL23–CCR1 in lung can-cers (Fig. 4d). Our results highlight potential bases for
Li et al. Genome Biology (2016) 17:174 Page 6 of 16
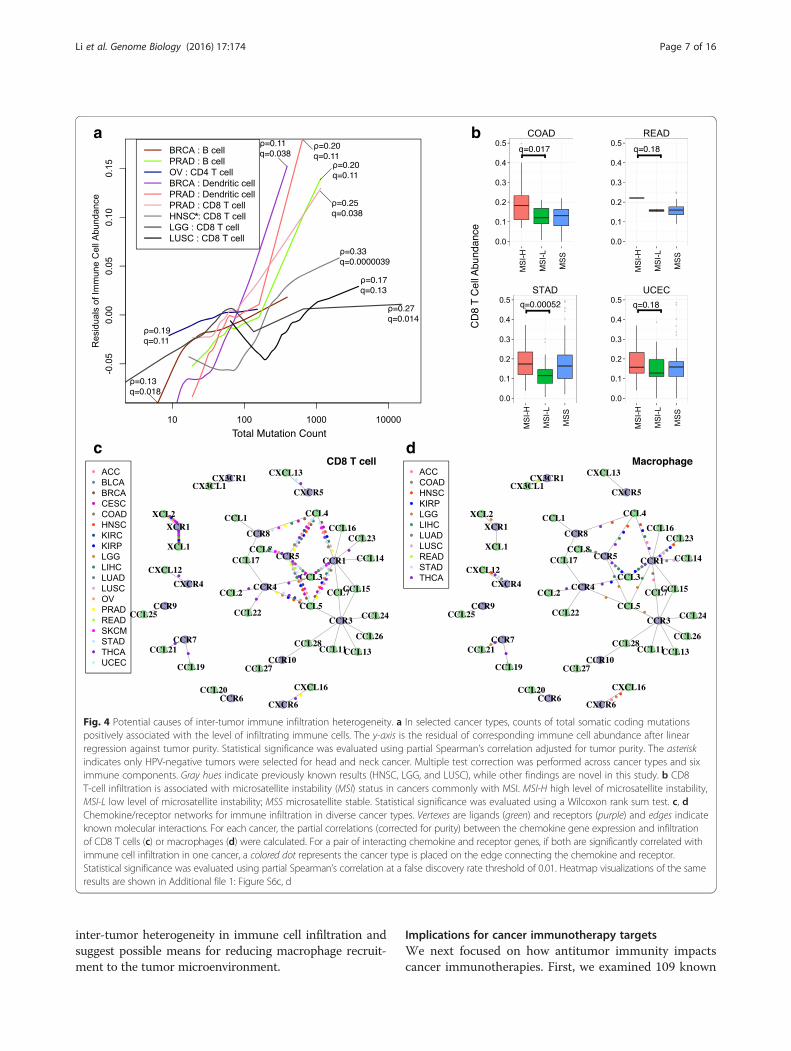
inter-tumor heterogeneity in immune cell infiltration andsuggest possible means for reducing macrophage recruit-ment to the tumor microenvironment.
Implications for cancer immunotherapy targetsWe next focused on how antitumor immunity impactscancer immunotherapies. First, we examined 109 known
a
c d
b
Fig. 4 Potential causes of inter-tumor immune infiltration heterogeneity. a In selected cancer types, counts of total somatic coding mutationspositively associated with the level of infiltrating immune cells. The y-axis is the residual of corresponding immune cell abundance after linearregression against tumor purity. Statistical significance was evaluated using partial Spearman’s correlation adjusted for tumor purity. The asteriskindicates only HPV-negative tumors were selected for head and neck cancer. Multiple test correction was performed across cancer types and siximmune components. Gray hues indicate previously known results (HNSC, LGG, and LUSC), while other findings are novel in this study. b CD8T-cell infiltration is associated with microsatellite instability (MSI) status in cancers commonly with MSI. MSI-H high level of microsatellite instability,MSI-L low level of microsatellite instability; MSS microsatellite stable. Statistical significance was evaluated using a Wilcoxon rank sum test. c, dChemokine/receptor networks for immune infiltration in diverse cancer types. Vertexes are ligands (green) and receptors (purple) and edges indicateknown molecular interactions. For each cancer, the partial correlations (corrected for purity) between the chemokine gene expression and infiltrationof CD8 T cells (c) or macrophages (d) were calculated. For a pair of interacting chemokine and receptor genes, if both are significantly correlated withimmune cell infiltration in one cancer, a colored dot represents the cancer type is placed on the edge connecting the chemokine and receptor.Statistical significance was evaluated using partial Spearman’s correlation at a false discovery rate threshold of 0.01. Heatmap visualizations of the sameresults are shown in Additional file 1: Figure S6c, d
Li et al. Genome Biology (2016) 17:174 Page 7 of 16
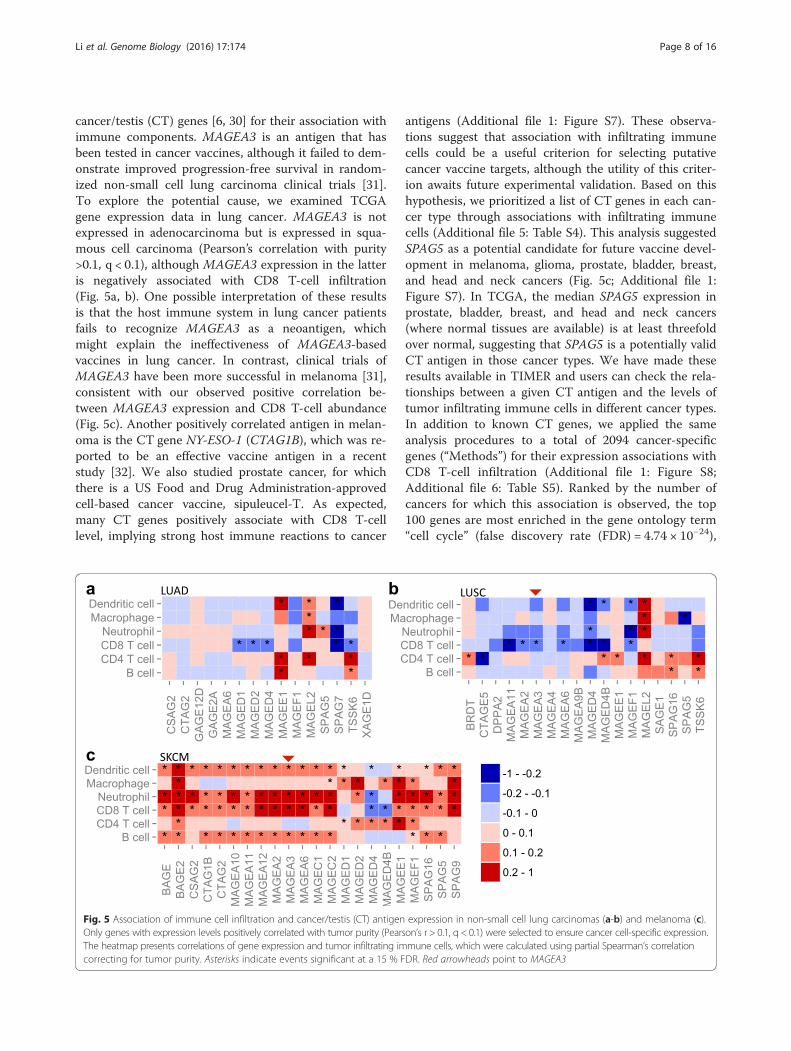
cancer/testis (CT) genes [6, 30] for their association withimmune components. MAGEA3 is an antigen that hasbeen tested in cancer vaccines, although it failed to dem-onstrate improved progression-free survival in random-ized non-small cell lung carcinoma clinical trials [31].To explore the potential cause, we examined TCGAgene expression data in lung cancer. MAGEA3 is notexpressed in adenocarcinoma but is expressed in squa-mous cell carcinoma (Pearson’s correlation with purity>0.1, q < 0.1), although MAGEA3 expression in the latteris negatively associated with CD8 T-cell infiltration(Fig. 5a, b). One possible interpretation of these resultsis that the host immune system in lung cancer patientsfails to recognize MAGEA3 as a neoantigen, whichmight explain the ineffectiveness of MAGEA3-basedvaccines in lung cancer. In contrast, clinical trials ofMAGEA3 have been more successful in melanoma [31],consistent with our observed positive correlation be-tween MAGEA3 expression and CD8 T-cell abundance(Fig. 5c). Another positively correlated antigen in melan-oma is the CT gene NY-ESO-1 (CTAG1B), which was re-ported to be an effective vaccine antigen in a recentstudy [32]. We also studied prostate cancer, for whichthere is a US Food and Drug Administration-approvedcell-based cancer vaccine, sipuleucel-T. As expected,many CT genes positively associate with CD8 T-celllevel, implying strong host immune reactions to cancer
antigens (Additional file 1: Figure S7). These observa-tions suggest that association with infiltrating immunecells could be a useful criterion for selecting putativecancer vaccine targets, although the utility of this criter-ion awaits future experimental validation. Based on thishypothesis, we prioritized a list of CT genes in each can-cer type through associations with infiltrating immunecells (Additional file 5: Table S4). This analysis suggestedSPAG5 as a potential candidate for future vaccine devel-opment in melanoma, glioma, prostate, bladder, breast,and head and neck cancers (Fig. 5c; Additional file 1:Figure S7). In TCGA, the median SPAG5 expression inprostate, bladder, breast, and head and neck cancers(where normal tissues are available) is at least threefoldover normal, suggesting that SPAG5 is a potentially validCT antigen in those cancer types. We have made theseresults available in TIMER and users can check the rela-tionships between a given CT antigen and the levels oftumor infiltrating immune cells in different cancer types.In addition to known CT genes, we applied the sameanalysis procedures to a total of 2094 cancer-specificgenes (“Methods”) for their expression associations withCD8 T-cell infiltration (Additional file 1: Figure S8;Additional file 6: Table S5). Ranked by the number ofcancers for which this association is observed, the top100 genes are most enriched in the gene ontology term“cell cycle” (false discovery rate (FDR) = 4.74 × 10⁻²⁴),
Fig. 5 Association of immune cell infiltration and cancer/testis (CT) antigen expression in non-small cell lung carcinomas (a-b) and melanoma (c).Only genes with expression levels positively correlated with tumor purity (Pearson’s r > 0.1, q < 0.1) were selected to ensure cancer cell-specific expression.The heatmap presents correlations of gene expression and tumor infiltrating immune cells, which were calculated using partial Spearman’s correlationcorrecting for tumor purity. Asterisks indicate events significant at a 15 % FDR. Red arrowheads point to MAGEA3
Li et al. Genome Biology (2016) 17:174 Page 8 of 16

consistent with a previous report that expression of cellcycle genes upregulates immune infiltration [33].The recent clinical success of checkpoint blockade
drugs in treating metastatic melanoma [1] is an excitingdevelopment but predictive biomarkers are needed. Inorder to find promising targets in diverse cancer types,we examined how tumor-infiltrating immune cells cor-relate with inhibitory molecules, including the receptorsCTLA4, PD-1, LAG3, and TIM3, and the ligands PD-L1/2, B7-H3/4. We noticed that the abundance of CD8 Tcells correlates with the expression levels of inhibitoryreceptors in almost all cancers (Additional file 1: FigureS9a), indicating that inhibitory receptors are expressedin the infiltrating T cells of most tumor sites at the timeof clinical intervention. We next investigated the poten-tial cell sources of the inhibitory ligands. PD-L1/2 andB7-H3 expression positively correlates with macrophage
infiltration in almost all cancers, suggesting TAM as asource of these ligands. The same is true for B7-H4 ex-cept for gliomas (GBM and LGG), rectal cancer, andmelanoma (Additional file 1: Figure S9b). In LGG andcervical cancer, further analysis reveals that B7-H4 isexpressed primarily in cancer cells (Additional file 1:Figure S9c). These findings might help identify alterna-tive therapeutic options in different cancers.Although effective in a subset of patients, checkpoint
blockade drugs usually have moderate response rates[31]. To explore possible explanations for the variedclinical responses, we studied the levels of inhibitory re-ceptors and CD8 T-cell infiltration within each cancertype. Unexpectedly, we found that CTLA4 expression inmelanoma differentially correlates with CD8 T-cell levelsin different tumors (Fig. 6a). In a subset of high puritytumors, CTLA4 is highly expressed despite low levels of
a
c d e
b
Fig. 6 Varied levels of CD8 T-cell infiltration in tumors highly expressing inhibitory receptors. a, b High CTLA4/TIM3-expressing tumors in melanoma/KIRC show different CD8 T-cell infiltration levels. Dashed lines in both panels are the hypothetical high CTLA4 or TIM3 cutoff. Tumor purity is indicatedby color. Arrows in b point to selected TCGA samples for immunohistochemistry (IHC) analysis. c Sample with low TIM3 expression and CD8 T-cellinfiltration used as a negative control. TIM3- or CD8-expressing cells are brown in color. Selected samples with (1) high TIM3 expression and (2) low (d)or high (e) CD8 T-cell infiltration showed the existence of two KIRC sample groups. TIM3 expression in d is twice as high as in e according to RNA-seqdata. d Image represents about 15 % TCGA KIRC samples while e represents 5 %. The upper and lower panels were synchronized. TIM3 was expressedin cancer cells (d, e) as well as in lymphocytes (e). High magnification insets are presented in d and e to illustrate TIM3 expression in different cell types.Yellow boxes indicate lymphocytes; red boxes indicate tumor cells
Li et al. Genome Biology (2016) 17:174 Page 9 of 16

CD8 T cells. The same phenomenon holds for renalclear cell cancer, where tumors with high TIM3 expres-sion have varying CD8 T-cell levels (Fig. 6b). Since anti-bodies that allow immunohistochemical staining ofCTLA4 were unavailable, we sought to experimentallyvalidate the levels of TIM3 and CD8 T-cell infiltration.A subset of the TCGA renal tumors was submitted lo-cally and remaining tissue slides were available for these.Staining of selected renal tumors (Fig. 6c–e) confirmedthat TIM3 is expressed on cancer cells as well as infil-trating lymphocytes (Fig. 6e), an observation recently re-ported [34]. More importantly, we found that tumorswith high TIM3 expression can be divided into two dis-tinct groups with different levels of infiltrating CD8 Tcells (Fig. 6d, e; Additional file 1: Figure S10). Melanomaand kidney cancer with high expression of inhibitory re-ceptors and low levels of CD8 T-cell infiltration mayhave different clinical responses to checkpoint blockadedrugs compared with tumors with high CD8 T-cell infil-tration, a hypothesis that awaits further testing.
DiscussionWith the clinical success of cancer immunotherapies,there is a growing need for a comprehensive under-standing of tumor–immune interactions. In this study,we developed a novel method for tumor immune cell de-convolution and have provided a comprehensive catalogof the abundance of six immune infiltrates in 23 cancertypes. Our method was validated using Monte Carlo simu-lations, orthogonal estimates from DNA methylation-based inferences, as well as pathological assessment.Further validations using immunohistochemistry (IHC)or cell sorting are infeasible since TCGA does not pro-vide original tumor samples. We have made our esti-mated immune cell abundance together with associatedfindings available as a public resource, TIMER, for bio-medical researchers to address more interesting ques-tions in cancer immunology. The information coveredin this work was accessible through a user-interactivewebsite (http://cistrome.org/TIMER).Our work first provided a systematic prognostic land-
scape of different tumor-infiltrating immune cells in di-verse cancer types. We compared our results with tworecent studies on the same topic [6, 11]. The methodused in Gentles et al., CIBERSORT [35], is currently onlyapplicable to microarray data, thus unable to analyze theTCGA RNA-seq data. Therefore, our immune compo-nent estimation is a unique addition to TCGA for futureintegrative analyses of tumor–immune interactions. Byincluding more immune cell types into regression,CIBERSORT inference also suffered from statistical co-linearity that might have resulted in biased estimations(Additional file 7: Table S6; Additional file 8). Due tothis limitation, although Gentles et al. studied more cell
types, they reported few significant prognostic immunepredictors, without correction for other clinical con-founders. In contrast, we observed many more signifi-cant clinical associations with the correction ofmultiple cofactors. It should be noted that due to lim-ited sample size, some of these associations onlyreached a FDR of 0.15, yet 85 % of these significantcalls are expected to be true and still be informative.These observations include both established resultsfrom previous clinical studies as well as novel ones thatmay provide new angles to study the clinical responsesof immunotherapies.We then demonstrated the usefulness of TIMER by
studying putative immunotherapy targets and made sev-eral interesting observations. First, CD8 T-cell andmacrophage infiltration is likely to be regulated by differ-ent sets of chemokine and chemokine receptors indifferent cancers. Second, the effectiveness of cancervaccine targets might be predicted via association withimmune infiltration levels; based on our data, it appearsthat SPAG5 is a potential vaccine candidate for multiplecancers. Third, the correlation of CTLA4 and PD-1 ex-pression with CD8 T-cell abundance suggests that a sub-set of patients from most cancer types may benefit fromcombined use of anti-CTLA4 and anti-PD-1 agents. Fi-nally, CTLA4 and TIM3 expression fall in distinct groupsrelative to CD8 T-cell infiltration in melanoma and kid-ney cancer, respectively, which might contribute to thevaried clinical response to checkpoint blockade therap-ies. Although detailed characterization of the underlyingmechanisms requires further work, the findings fromthis study have immediate implications for cancerimmunotherapies.The current release of TIMER is based on estimations
using transcriptome profiles (RNA-seq or microarray)from whole tissues at a single time point. Consequently,TIMER might have limited relevance to distinguish stro-mal or intra-tumor immune cell localization or capturetumor cell heterogeneity. In the future, we anticipatemore experimental measures with improved spatial andtemporal resolutions, and the applicability of TIMERshould continue to grow as we make inferences on newdatasets and incorporate them into the existingresources.
ConclusionsIn this study we systematically documented the abun-dance of six tumor-infiltrating immune compartments forTCGA samples and integratively analyzed the immune in-filtration with other cancer molecular profiles. We identi-fied widespread clinical associations of different immunecell types in multiple cancers. Systematic exploration oftumor–immune interactions revealed cancer genetic alter-ations and chemokine/receptor expression networks are
Li et al. Genome Biology (2016) 17:174 Page 10 of 16

potential regulators of immune cell infiltration heterogen-eity. Our analyses on putative immunotherapy targets ledto the findings on cancer vaccine candidate SPAG5 anddichotomized CD8 T-cell levels in tumors highly express-ing inhibitory receptors. Our results add value to thecurrent knowledgebase of tumor immunity and provide apublic resource for further exploration of cancer–immuneinteractions.
MethodsData collection and preprocessingMolecular data for 23 TCGA cancer types, includinglevel 2 DNA SNP array and clinical data, were down-loaded from TCGA data portal (https://gdc.nci.nih.gov)and level 3 mRNA expression data from the GDACFirehose website (http://gdac.broadinstitute.org). Forall cancers but GBM or OV, whole transcriptomeRNA-sequencing (RNA-seq) data were available andwe used the RSEM-processed transcript per million(TPM) measure. For GBM and OV, where RNA-seqdata were available for only a subset (approximatelyone-third for GBM and one-half for OV) of samples,we used microarray data profiled using AffymetrixHGU133a platforms for immune component estimation(Additional file 8). In this study, we found that theHGU133a array could not accurately profile the lowlyexpressed genes (including important therapeutic tar-gets such as PD-1). Therefore, we applied RNA-seq datafor GBM and OV to study the immunotherapy targets(Fig. 5; Additional file 1: Figures S7 and S9). We usedthe Human Primary Cell Atlas (HPCA) [36] as the ref-erence dataset of gene expression profiles of sorted im-mune cell types. HPCA is a collection of previousanalyses on human primary cells using the AffymetrixHGU133plus2 platform and includes more than 100studies, which are numbered in the dataset. We selectedsix immune cell types for our downstream analysis andthe studies used for each cell type are: 25, 45, and 115for B cells; 12, 42, 76, and 115 for CD4 T cells; 42, 115,and 116 for CD8 T cells; 39, 62, and 77 for neutrophils;104 for macrophages; and 7, 9, 14, 28, 86, 89, 91, and103 for dendritic cells. A complete list of reference sam-ples is available in Additional file 9: Table S7. It shouldbe noted that each immune cell type still represents amixed population with cells of potentially distinct func-tions. For example, CD4 T cells may include helper Tcells, memory T cells, and regulatory T cells and B cellsmay represent a mixture of mature CD19 B cells and Bplasma cells. In this study, we do not seek to furtherdistinguish these subpopulations, as their expressionprofiles are highly similar. Signature genes (n = 2271,denoted as Gi) overexpressed in the immune lineagewere obtained from the Immune Response In Silicodatabase [18].
Inclusion criteria for immune cell typesIn order to minimize co-linearity in the regression ana-lysis and maximize the robustness of our inference, ourstudy focused on six immune components based on twocriteria. First, the reference data contain at least ten in-dependent samples of the immune cell type. Second, ifthe expression profile of a given cell type is highly corre-lated (sample-wise Pearson’s r ≥ 0.9) with other celltype(s), we chose the cell type with more samples. Theselected cell types represent the finest resolution of im-mune cell lineages that we can achieve based on theabove inclusion standards. Cell types excluded from theinference may affect the highly correlated immune com-ponents included. Improved reference immune datasetswill be needed to deconvolve individual cell types.
Computational method for immune cell compositiondeconvolutionWe first estimated sample purity for each tumor throughDNA SNP array data using our previously developedtool CHAT [15]. Genomic estimations of tumor purityhave been validated using diluted series of cancer andblood cell lines with known mixture ratios [16]. To clar-ify, the quantity inferred from CHAT is the fraction ofaneuploid cells. In this work, we used this quantity as asurrogate of tumor purity. Samples with percent onpoint (PoP) <0.01 were excluded, where PoP is a qualitymeasure reported by CHAT. In each cancer, we selectedgenes with expression values negatively correlated withtumor purity (Pearson’s r ≤ −0.2, P ≤ 0.05), denoted asGp, and intersected with Gi. Our goal in this step is toselect informative genes with expression levels stronglyaffected by tumor purity. It is not important whether thegene is highly or lowly expressed. Pearson’s correlationis suitable because it is a measure of the linear depend-ence of two random variables, disregarding the magni-tude of the observations. The resulting smaller gene setintersection was denoted as G0, which is cancer-typespecific. Meanwhile, we merged the tumor gene expres-sion with the reference immune cell data of all genesusing ComBat [17]. According to the principal compo-nents analysis plot, ComBat effectively removed thebatch effect between different datasets generated usingdifferent platforms (Fig. 1b). For each of the six celltypes, we then calculated the median expression value inall the samples available for that cell type for each genein G0. The resulting dataset (referred to as R) containssix vectors of gene expression values, each for one celltype. We used R to filter G0 in the following way: foreach vector in R, genes with expression values in the top1 % in G0 are removed. This is because genes expressedat extremely high levels in the reference dataset willdominate the inference results. Since highly expressedgenes have large variance, our inferences become very
Li et al. Genome Biology (2016) 17:174 Page 11 of 16

sensitive to these outliers. We therefore remove them toacquire more robust estimations. The total removedgenes were the union of the top 1 % from of the six vec-tors. The resulting gene set was denoted as G0f. For eachsample, a constrained least square fitting described in aprevious study [19] was applied to infer the relativeabundance for each of the six immune components(Fig. 1e). The predictions of this method were validatedusing mixtures of different blood cell types with knownratios. For a given sample, let Yg denote the gene expres-sion of gene g, where g ∈ G0f. Let X
gr denote the gene ex-
pression of gene g in immune cell type r (r = 1,2,…,6) inreference dataset R. Since we model that the given sam-ple is a mixture of the six immune cell types, our task isto find positive coefficients f to minimize the totalsquared differences:
f ¼ argmin∀r:f r>0
Σg∈ G0ff g
Y g−X6r¼1
f rXgr
!2
which is a constrained linear regression problem. Theestimation accuracy of f should be affected by the genesused in the fitting, although our model assumes thatsuch an f exists and should be the same for all genes.To note, coefficients f estimated using this method arethe relative abundance of immune cells. The scale ofthe estimation of an individual immune cell type is de-termined by the variance of the corresponding refer-ence data Xr. Therefore, f are not comparable betweencancer types or different immune cells. Source codesfor TIMER and downstream statistical analysis as wellas related data files are available at http://cistrome.org/TIMER/download.html.
Correction for reference immune cell colinearityAlthough the six immune cell types in this study are se-lected in such ways that the colinearity between celltypes is minimized, we found that in THCA and UCS,CD4 and CD8 T-cell signatures are still very similar.Consequently, the inferred CD4 and CD8 T-cell levelsare negatively correlated (Pearson’s r ≤ −0.3), which isan artifact of covariates’ colinearity in the constraint re-gression. Additional analysis on these two cancers re-vealed that the negative correlation is driven by a smallnumber of CD4 or CD8 T-cell signature genes that areextremely overexpressed in the tumor samples. We re-move the union of the top expressed gene in eachtumor sample and re-estimate f. This step is repeateduntil the correlation between estimated CD4 and CD8T-cell levels is larger than −0.3. This analysis providesmore robust estimations of immune cell abundance incancer types.
Pathological estimation of neutrophil infiltration in BLCAFor the TCGA data sets, the original samples are unavail-able for further studies; however, hematoxylin and eosin(H&E) digital slides have been publicly released. While it isnot possible to distinguish T cells and B cells by H&E, neu-trophils are morphologically distinctive and their abun-dance can be estimated. Occasional dendritic cells andmacrophages can be identified by H&E but their trueabundance is difficult to estimate in the absence of immu-nohistochemical stains. Slides were reviewed via digital im-ages viewed with the Cancer Digital Slide Archive (http://cancer.digitalslidearchive.net). We chose BLCA because ithas a large sample size (n = 404), does not have excessivenecrosis, and has sufficient neutrophil counts and samplevariety to allow for validation by histological evaluation.The pathologist reviewing the slides was blinded to the insilico neutrophil predictions. Samples were stratified intothree groups (high, medium, low) with levels of neutro-phils relative to the entire collection of samples.
DNA methylation-based total leukocyte estimationThe percentage of total DNA for each tumor was esti-mated using DNA methylation data as previously de-scribed and compared with purity estimates derived fromSNP data [20, 37]. In brief, the estimates were derivedfrom loci with tissue-specific methylation that distin-guishes the corresponding tissue type from lymphocytesusing the TCGA Pancan12 [38] DNA methylation dataset.The leukocyte methylation signature was derived as fol-lows. Each probe was ranked by the difference in meanbeta value in buffy coat and corresponding normal sam-ples. We retained the 100 probes with the largest positivedifference and the 100 with the largest negative differencebetween mean DNA methylation in normal tissues andperipheral blood leukocytes, designated NT and BC probes(hypermethylated in normal tissue compared with buffycoat, and vice versa, respectively). Let Tik denote the betavalue for probe k in tumor sample i. Let Bk denote theaverage beta value of buffy coat samples for each probe.Let Tk denote the minimum observed beta value across alltumor samples for the BC probes and the maximum forthe NT probes, which theoretically reflects the groundstate of methylation level in the purest tumor. Denotewith fB the fraction of buffy coat (leukocyte) componentsin the sample, then, assuming a linear relationship, wehave the following equation for each probe:
Tik ¼ BkfB þ Tk 1 − fBð ÞSolving this equation for fB gives:
fB ¼ Tik− Tkð Þ= Bk− Tkð ÞThe values of fB for each of the 200 probes in the
signature were calculated and a kernel density estimate
Li et al. Genome Biology (2016) 17:174 Page 12 of 16

of fB was obtained. The leukocyte signature was thencalculated as the mode of this density estimate.
Monte Carlo sampling and in silico validationWe validated our predictions on infiltrating immune cellabundance using in silico simulated data. As mentioned,for each cancer we selected a gene set G0f (length n0) forleast squares fitting. In order to control for the mixingratios of the six components while maintaining the cor-relation structure of the real data, we first calculate thegene–gene covariance matrix Σ0f for all the genes in G0f
using tumor expression data. We then randomly samplesix numbers f1-6, from Uniform(0,1). We calculate μ0f(length n0), which is the average of six immune compo-nents weighted by f1-6. Next, we sample a vector oflength n0 from multivariate normal distribution withmean μ0f and covariance Σ0f. For each cancer type, wesimulated the same number of samples as its sample sizein the TCGA data. After applying our method, we com-pared the estimated immune abundance with true valuesusing Pearson’s correlation. Low quality estimations withPearson’s r ≤ 0.2 were excluded from the downstreamanalysis.
Selection of cancer specific genesFor each cancer type, we compare tumor samples withall normal samples collectively. Only genes overex-pressed in tumor samples and absent or expressed atlower levels in all normal tissues were selected. Differen-tially expressed genes were selected based on a FDR≤0.05 and at least a twofold difference in expressionlevels. In the case of tumors with established clinicalsubtypes, such as breast cancer, we selected the top 25samples for each gene based on their rank of raw readcounts, then identified differentially expressed geneswithin each subtype. The final tumor-specific gene setwas the union of all the cancer types (or subtypes).
Statistical analysisMultivariate Cox regression, log-rank test and Kaplan–Meier estimators were implemented using the R packagesurvival. The association between CD8 T-cell abundanceand tumor status was evaluated using logistic regressioncorrected for age and clinical stage and was imple-mented using the R package glm. The same analysis wasperformed for neutrophil abundance and gender associa-tions, corrected for age and smoking history. Partial cor-relations of immune cell abundance and gene expressionof chemokines and receptors, somatic mutation counts,CT gene expression, as well as immunosuppressive mol-ecule expression were calculated using the R packageppcor. Multiple test correction was performed using theR package qvalue [39] and FDR thresholds are appliedbased on the abundance of signals in the data. In this
study, we applied the Pearson correlation to purity andgene expression because it is reasonable to expect thatthe expression level is linearly associated with tumorpurity. For others, we used the Spearman correlation.We applied partial correlation analysis to remove the in-fluence of tumor purity on the involved variables. Allother analyses, including linear regression, Fisher’s exacttest, Wilcoxon rank sum test, Spearman’s correlation,and hierarchical clustering, were performed using R [40].Of note, in Figs. 2b and 3b, we used the 20 percentile asa cutoff only to help visualize the association of immuneinfiltration with outcomes and the statistical significancewas determined by multivariate Cox regression (Fig. 3a)including all the samples. Our results on survival ana-lysis, neoantigen association, tumor recurrence, and as-sociation of checkpoint blockade inhibitory moleculeswith immune cells are available in Additional file 10:Table S8.
Additional analysis on HNSC and SKCMOne intriguing result we observed is that univariate andmultivariate survival analysis results for HNSC andSKCM are not consistent (Fig. 3a, b). For HNSC, we dis-covered that HPV infection, a recently identified prog-nostic factor [41], correlates with CD8 T-cell infiltration(Additional file 1: Figure S4). It is likely that the previ-ously observed association of CD8 T cells with survivalis contributed to by virus infection. On the other hand,for SKCM, we found that the infiltration level of CD8 Tcells is highly correlated with neutrophils (Pearson’s r =0.79) and dendritic cells (r = 0.81), indicating that theseimmune cells work in concert. As highly correlated fea-tures confound each other in a multiple regression, weperformed principal component analysis on the abun-dance of the six immune cells. We reanalyzed the Coxmodel using six principal components (PCs), age andstage as covariates, and found PC1 (hazard ratio (HR) =2.6 × 10⁻⁴, p = 0.0062), PC4 (HR = 1.07 × 10², p = 0.033)and PC6 (HR = 0.01, p = 0.008) to be significantly associ-ated with survival. PC1 was comprised of CD8 T cells,neutrophils, and dendritic cells (by Pearson’s correl-ation), thus capturing the colinearity in the data. PC4represented macrophages and predicted worse outcome.There was no clear assignment of PC6 to any immunecomponent(s) and it may represent an unselected im-mune cell type.
Additional analysis on OV and BRCAIn the survival analysis (Fig. 3a, b), we failed to identifysome known prognostic predictors, notably B cells inOV and CD8 T cells in BRCA. A previous study reportedthat CD20 cells positively associate with survival [42].We investigated the expression levels of the B-cellmarkers CD19 and CD20 in OV and discovered that
Li et al. Genome Biology (2016) 17:174 Page 13 of 16
tumor purity is not negatively correlated with gene ex-pression levels for both genes, indicating that aneuploidcells in ovarian cancer may also express B-cell markers.Therefore, cell sorting based on CD19 or CD20, which isnot the B-cell component in our analysis, is likely to se-lect cancer cells. CD8 T cells were previously reported toassociate with better outcome in BRCA [43], althoughwe did not observe this relationship. This is possibly dueto insufficient follow-up time or fewer deaths in theTCGA BRCA data, which thus underpowered our sur-vival analysis.
Patient samples for IHCDe-identified clear cell renal cell carcinoma (ccRCC)formalin-fixed and paraffin-embedded tissue blocks fromcases included in the TCGA KIRC cohort were obtainedfrom the department of Pathology at the Brigham andWomen’s Hospital. Patients had provided an informedconsent for use of specimens and baseline and prospectiveclinical data for research purposes. The study was ap-proved by the Dana-Farber/Harvard Cancer Center(DF/HCC) institutional review board. In total, fiveTCGA samples were selected for IHC: TCGA-CZ-5453-01A (negative control), TCGA-CZ-4866-01A, TCGA-CZ-4863-01A, TCGA-CZ-5459-01A, and TCGA-CZ-4862-01A.
IHC protocolIHC for TIM3 and CD8 expression was performed asdescribed below. For TIM3 IHC, rehydrated tissue sec-tions were boiled in EDTA buffer (pH 8) with a micro-wave at 92 °C for 30 minutes. After cooling down atroom temperature (RT), tissue sections were successivelyincubated with a peroxidase block (Dual EndogenousEnzyme Block, Dako) and a protein block (Serum FreeBlock, Dako) for 10 minutes each. Sections were next in-cubated for 1 h at RT with the goat polyclonal anti-TIM3 antibody (1/400, AF2365, R&D Systems) dilutedin Da Vinci Green Diluent (Biocare Medical). Tissuesections were then incubated with a rabbit anti-goatbiotin-conjugated antibody (1/750, Dako) for 30 minutesfollowed by an incubation of 30 minutes with EnVisionanti-rabbit horseradish peroxidase (HRP)-conjugatedantibody (Dako). The HRP visualization was performedby applying 3,3-diaminobenzidine substrate (Dako) for5 minutes. Nuclei were counterstained with hematoxylin.For CD8 staining, rehydrated tissue sections were boiledin EDTA buffer (pH 8) with a pressure cooker at 125 °Cfor 30 s. Sections were blocked as described above andthen incubated for 1 h at RT with a mouse monoclonalanti-CD8 antibody (1/100, clone C8/144B, Dako) dilutedin Antibody Diluent with Background Reducing Compo-nents (Dako). Sections were then incubated with EnVisionanti-mouse HRP-conjugated antibody for 30 minutes
(Dako). The HRP visualization and the counterstainingwere performed as described above.
Additional files
Additional file 1: Supplementary figures. (PDF 9244 kb)
Additional file 2: Table S1. Purity correlated genes. (XLSX 442 kb)
Additional file 3: Table S2. Immune infiltration estimation. (XLSX 2364 kb)
Additional file 4: Table S3. Clinical reports on CD8 T cells. (XLSX 43 kb)
Additional file 5: Table S4. CT genes. (XLSX 60 kb)
Additional file 6: Table S5. Additional cancer-specific genes. (XLSX 990 kb)
Additional file 7: Table S6. Comparison with CIBERSORT. (XLSX 55 kb)
Additional file 8: Supplementary information. (DOCX 84 kb)
Additional file 9: Table S7. All statistical analysis. (XLSX 49 kb)
Additional file 10: Table S8. HPCA cell index. (XLSX 43 kb)
AbbreviationsACC, adenocortical carcinoma; BLCA, bladder carcinoma; BRCA, breastcarcinoma; CESC, cervical squamous carcinoma; COAD, colonadenocarcinoma; CT, cancer/testis; CTL, cytotoxic T cell; CYT, cytolytic activity;DLBC, diffusive large B-cell lymphoma; GBM, glioblastoma multiforme;H&E, hematoxylin and eosin; HNSC, head and neck carcinoma; HPCA,Human Primary Cell Atlas; HPV, human papilloma virus; HR, hazard ratio;HRP, horseradish peroxidase; IHC, immunohistochemistry; KICH, kidneychromophobe; KIRC, kidney renal clear cell carcinoma; KIRP, kidney renalpapillary cell carcinoma; LGG, lower grade glioma; LIHC, liver hepatocellularcarcinoma; LUAD, lung adenocarcinoma; LUSC, lung squamous carcinoma; MSI,microsatellite instability; OV, ovarian serous cystadenocarcinoma; PC, principalcomponent; PRAD, prostate adenocarcinoma; READ, rectum adenocarcinoma;RT, room temperature; SKCM, skin cutaneous melanoma; STAD, stomachadenocarcinoma; TAM, tumor-associated macrophage; TCGA, The CancerGenome Atlas; THCA, thyroid carcinoma; UCEC, uterine corpus endometrialcarcinoma; UCS, uterine carsinosarcoma
AcknowledgementsWe thank Nir Hacohen, Gordon Freeman, Glenn Dranoff, Toni Choueiri,Eliezer Van Allen, and Catherine Wu for their helpful discussions duringmanuscript preparation and revision.
FundingThis work was supported by NCI 1U01 CA180980 (to X.S.L.), National NaturalScience Foundation of China 31329003 (to X.S.L.), and Chinese Scholarshipcouncil fellowship (to T.L.).
Availability of data and materialsThis work is in part based on data generated from TCGA Research Network(http://cancergenome.nih.gov/). The data generated in this study areavailable in the Additional files for this manuscript.Tumor and adjacent normal samples: Level 2 SNP array data and clinicalannotation files were downloaded from TCGA data portal (https://gdc-portal.nci.nih.gov). Level 3 gene expression data were downloaded fromBroad GDAC Firehose (http://gdac.broadinstitute.org).Human Primary Cell Atlas: Gene expression profiles from the Human PrimaryCell Atlas were accessed at http://www.macrophages.com/hu-cell-atlas.Source code of TIMER: TIMER is developed under license GPL2.0 and isfreely accessible at https://zenodo.org/record/57669# (DOI: 10.5281/zenodo.57669).
Authors’ contributionsBL conceived this project, pre-processed the datasets, and performed statisticalanalysis. ES reviewed H&E slides, suggested the selection of the six immunecomponents, and helped to write the manuscript. HZ analyzed the chemokine/receptor associations and CIBERSORT inferences. JCP performed IHC analysisand generated the images with JN. SS supervised the IHC experiments andhelped to interpret the results. HS and TL helped to prepare the data fromTCGA and other resources. JA and SR helped to interpret the results and write
Li et al. Genome Biology (2016) 17:174 Page 14 of 16

the manuscript. XSL and JSL supervised the whole study and wrote themanuscript with BL. All authors read and approved the final manuscript.
Competing interestsThe authors declare no competing financial interests.
Ethics approval and consent to participateKIRC patients involved in this study had provided an informed consent foruse of specimens and baseline and prospective clinical data for researchpurposes. The study was approved by the Dana-Farber/Harvard CancerCenter (DF/HCC) institutional review board.
Author details1Department of Biostatistics and Computational Biology, Dana Farber CancerInstitute, 450 Brookline Ave., Boston, MA 02215, USA. 2Department ofStatistics, Harvard University, 1 Oxford St., Cambridge, MA 02138, USA.3Department of Pathology, Brigham and Women’s Hospital and HarvardMedical School, 75 Francis St., Boston, MA 02215, USA. 4State Key Laboratoryof Oral Diseases, West China Hospital of Stomatology, Sichuan University, 14Renmin South Rd 3rd Section, Wuhou, Chengdu, Sichuan 610041, China.5Center for Epigenetics, Van Andel Research Institute, 333 Bostwick Ave N.E.,Grand Rapids, MI 49503, USA.
Received: 30 January 2016 Accepted: 15 July 2016
References1. Sharma P, Wagner K, Wolchok JD, Allison JP. Novel cancer immunotherapy
agents with survival benefit: recent successes and next steps. Nat RevCancer. 2011;11:805–12.
2. Pardoll DM. The blockade of immune checkpoints in cancerimmunotherapy. Nat Rev Cancer. 2012;12:252–64.
3. Prieto PA, Yang JC, Sherry RM, Hughes MS, Kammula US, White DE, Levy CL,Rosenberg SA, Phan GQ. CTLA-4 blockade with ipilimumab: long-termfollow-up of 177 patients with metastatic melanoma. Clin Cancer Res.2012;18:2039–47.
4. Di Giacomo AM, Calabro L, Danielli R, Fonsatti E, Bertocci E, Pesce I, Fazio C,Cutaia O, Giannarelli D, Miracco C, Biagioli M, Altomonte M, Maio M.Long-term survival and immunological parameters in metastatic melanomapatients who responded to ipilimumab 10 mg/kg within an expandedaccess programme. Cancer Immunol Immunother. 2013;62:1021–8.
5. Bindea G, Mlecnik B, Tosolini M, Kirilovsky A, Waldner M, Obenauf AC, AngellH, Fredriksen T, Lafontaine L, Berger A, Bruneval P, Fridman WH, Becker C,Pages F, Speicher MR, Trajanoski Z, Galon J. Spatiotemporal dynamics ofintratumoral immune cells reveal the immune landscape in human cancer.Immunity. 2013;39:782–95.
6. Rooney MS, Shukla SA, Wu CJ, Getz G, Hacohen N. Molecular and geneticproperties of tumors associated with local immune cytolytic activity. Cell.2015;160:48–61.
7. Angelova M, Charoentong P, Hackl H, Fischer ML, Snajder R, Krogsdam AM,Waldner MJ, Bindea G, Mlecnik B, Galon J, Trajanoski Z. Characterization ofthe immunophenotypes and antigenomes of colorectal cancers revealsdistinct tumor escape mechanisms and novel targets for immunotherapy.Genome Biol. 2015;16:64.
8. Galon J, Pages F, Marincola FM, Angell HK, Thurin M, Lugli A, Zlobec I,Berger A, Bifulco C, Botti G, Tatangelo F, Britten CM, Kreiter S, Chouchane L,Delrio P, Arndt H, Asslaber M, Maio M, Masucci GV, Mihm M, Vidal-VanaclochaF, Allison JP, Gnjatic S, Hakansson L, Huber C, Singh-Jasuja H, Ottensmeier C,Zwierzina H, Laghi L, Grizzi F, et al. Cancer classification using theImmunoscore: a worldwide task force. J Transl Med. 2012;10:205.
9. Herbst RS, Soria JC, Kowanetz M, Fine GD, Hamid O, Gordon MS, Sosman JA,McDermott DF, Powderly JD, Gettinger SN, Kohrt HE, Horn L, Lawrence DP,Rost S, Leabman M, Xiao Y, Mokatrin A, Koeppen H, Hegde PS, Mellman I,Chen DS, Hodi FS. Predictive correlates of response to the anti-PD-L1antibody MPDL3280A in cancer patients. Nature. 2014;515:563–7.
10. Tumeh PC, Harview CL, Yearley JH, Shintaku IP, Taylor EJ, Robert L,Chmielowski B, Spasic M, Henry G, Ciobanu V, West AN, Carmona M, KivorkC, Seja E, Cherry G, Gutierrez AJ, Grogan TR, Mateus C, Tomasic G, Glaspy JA,Emerson RO, Robins H, Pierce RH, Elashoff DA, Robert C, Ribas A. PD-1blockade induces responses by inhibiting adaptive immune resistance.Nature. 2014;515:568–71.
11. Smyth MJ, Dunn GP, Schreiber RD. Cancer immunosurveillance andimmunoediting: the roles of immunity in suppressing tumor developmentand shaping tumor immunogenicity. Adv Immunol. 2006;90:1–50.
12. Schreiber RD, Old LJ, Smyth MJ. Cancer immunoediting: integratingimmunity’s roles in cancer suppression and promotion. Science.2011;331:1565–70.
13. Bingle L, Brown NJ, Lewis CE. The role of tumour-associated macrophagesin tumour progression: implications for new anticancer therapies. J Pathol.2002;196:254–65.
14. Fridman WH, Pages F, Sautes-Fridman C, Galon J. The immune contexturein human tumours: impact on clinical outcome. Nat Rev Cancer.2012;12:298–306.
15. Li B, Li JZ. A general framework for analyzing tumor subclonality using SNParray and DNA sequencing data. Genome Biol. 2014;15:473.
16. Li B, Senbabaoglu Y, Peng W, Yang ML, Xu J, Li JZ. Genomic estimates ofaneuploid content in glioblastoma multiforme and improved classification.Clin Cancer Res. 2012;18:5595–605.
17. Johnson WE, Li C, Rabinovic A. Adjusting batch effects in microarrayexpression data using empirical Bayes methods. Biostatistics.2007;8:118–27.
18. Abbas AR, Baldwin D, Ma Y, Ouyang W, Gurney A, Martin F, Fong S, vanLookeren Campagne M, Godowski P, Williams PM, Chan AC, Clark HF.Immune response in silico (IRIS): immune-specific genes identified froma compendium of microarray expression data. Genes Immun.2005;6:319–31.
19. Abbas AR, Wolslegel K, Seshasayee D, Modrusan Z, Clark HF. Deconvolutionof blood microarray data identifies cellular activation patterns in systemiclupus erythematosus. PLoS One. 2009;4:e6098.
20. Carter SL, Cibulskis K, Helman E, McKenna A, Shen H, Zack T, Laird PW,Onofrio RC, Winckler W, Weir BA, Beroukhim R, Pellman D, Levine DA,Lander ES, Meyerson M, Getz G. Absolute quantification of somatic DNAalterations in human cancer. Nat Biotechnol. 2012;30:413–21.
21. Hussain SF, Yang D, Suki D, Aldape K, Grimm E, Heimberger AB. The role ofhuman glioma-infiltrating microglia/macrophages in mediating antitumorimmune responses. Neuro Oncol. 2006;8:261–79.
22. Wada Y, Nakashima O, Kutami R, Yamamoto O, Kojiro M. Clinicopathologicalstudy on hepatocellular carcinoma with lymphocytic infiltration.Hepatology. 1998;27:407–14.
23. Anitei MG, Zeitoun G, Mlecnik B, Marliot F, Haicheur N, Todosi AM, KirilovskyA, Lagorce C, Bindea G, Ferariu D, Danciu M, Bruneval P, Scripcariu V,Chevallier JM, Zinzindohoue F, Berger A, Galon J, Pages F. Prognostic andpredictive values of the immunoscore in patients with rectal cancer. ClinCancer Res. 2014;20:1891–9.
24. Mackensen A, Ferradini L, Carcelain G, Triebel F, Faure F, Viel S, Hercend T.Evidence for in situ amplification of cytotoxic T-lymphocytes with antitumoractivity in a human regressive melanoma. Cancer Res. 1993;53:3569–73.
25. Shibuya TY, Nugyen N, McLaren CE, Li KT, Wei WZ, Kim S, Yoo GH, RogowskiA, Ensley J, Sakr W. Clinical significance of poor CD3 response in head andneck cancer. Clin Cancer Res. 2002;8:745–51.
26. Tran E, Turcotte S, Gros A, Robbins PF, Lu YC, Dudley ME, Wunderlich JR,Somerville RP, Hogan K, Hinrichs CS, Parkhurst MR, Yang JC, Rosenberg SA.Cancer immunotherapy based on mutation-specific CD4+ T cells in apatient with epithelial cancer. Science. 2014;344:641–5.
27. Yadav M, Jhunjhunwala S, Phung QT, Lupardus P, Tanguay J, Bumbaca S,Franci C, Cheung TK, Fritsche J, Weinschenk T, Modrusan Z, Mellman I, LillJR, Delamarre L. Predicting immunogenic tumour mutations by combiningmass spectrometry and exome sequencing. Nature. 2014;515:572–6.
28. Matsushita H, Vesely MD, Koboldt DC, Rickert CG, Uppaluri R, Magrini VJ,Arthur CD, White JM, Chen YS, Shea LK, Hundal J, Wendl MC, Demeter R,Wylie T, Allison JP, Smyth MJ, Old LJ, Mardis ER, Schreiber RD. Cancerexome analysis reveals a T-cell-dependent mechanism of cancerimmunoediting. Nature. 2012;482:400–4.
29. Rajasagi M, Shukla SA, Fritsch EF, Keskin DB, DeLuca D, Carmona E, ZhangW, Sougnez C, Cibulskis K, Sidney J, Stevenson K, Ritz J, Neuberg D, Brusic V,Gabriel S, Lander ES, Getz G, Hacohen N, Wu CJ. Systematic identification ofpersonal tumor-specific neoantigens in chronic lymphocytic leukemia.Blood. 2014;124:453–62.
30. Silina K, Zayakin P, Kalnina Z, Ivanova L, Meistere I, Endzelins E, Abols A,Stengrevics A, Leja M, Ducena K, Kozirovskis V, Line A. Sperm-associatedantigens as targets for cancer immunotherapy: expression pattern andhumoral immune response in cancer patients. J Immunother. 2011;34:28–44.
Li et al. Genome Biology (2016) 17:174 Page 15 of 16

31. Drake CG, Lipson EJ, Brahmer JR. Breathing new life into immunotherapy:review of melanoma, lung and kidney cancer. Nat Rev Clin Oncol.2014;11:24–37.
32. Dhodapkar MV, Sznol M, Zhao B, Wang D, Carvajal RD, Keohan ML, ChuangE, Sanborn RE, Lutzky J, Powderly J, Kluger H, Tejwani S, Green J,Ramakrishna V, Crocker A, Vitale L, Yellin M, Davis T, Keler T. Induction ofantigen-specific immunity with a vaccine targeting NY-ESO-1 to thedendritic cell receptor DEC-205. Sci Transl Med. 2014;6:232ra251.
33. Alvaro T, Lejeune M, Garcia JF, Salvado MT, Lopez C, Bosch R, Jaen J, EscrivaP, Pons LE. Tumor-infiltrated immune response correlates with alterations inthe apoptotic and cell cycle pathways in Hodgkin and Reed-Sternberg cells.Clin Cancer Res. 2008;14:685–91.
34. Komohara Y, Morita T, Annan DA, Horlad H, Ohnishi K, Yamada S, NakayamaT, Kitada S, Suzu S, Kinoshita I, Dosaka-Akita H, Akashi K, Takeya M, JinushiM. The coordinated actions of TIM-3 on cancer and myeloid cells in theregulation of tumorigenicity and clinical prognosis in clear cell renal cellcarcinomas. Cancer Immunol Res. 2015;3;999.
35. Gentles AJ, Newman AM, Liu CL, Bratman SV, Feng W, Kim D, Nair VS, Xu Y,Khuong A, Hoang CD, Diehn M, West RB, Plevritis SK, Alizadeh AA. Theprognostic landscape of genes and infiltrating immune cells across humancancers.Nat Med. 2015;21(8):938–45.
36. Mabbott NA, Baillie JK, Brown H, Freeman TC, Hume DA. An expression atlasof human primary cells: inference of gene function from coexpressionnetworks. BMC Genomics. 2013;14:632.
37. Zack TI, Schumacher SE, Carter SL, Cherniack AD, Saksena G, Tabak B,Lawrence MS, Zhsng CZ, Wala J, Mermel CH, Sougnez C, Gabriel SB,Hernandez B, Shen H, Laird PW, Getz G, Meyerson M, Beroukhim R.Pan-cancer patterns of somatic copy number alteration. Nat Genet.2013;45:1134–40.
38. Hoadley KA, Yau C, Wolf DM, Cherniack AD, Tamborero D, Ng S, LeisersonMD, Niu B, McLellan MD, Uzunangelov V, Zhang J, Kandoth C, Akbani R,Shen H, Omberg L, Chu A, Margolin AA, Van't Veer LJ, Lopez-Bigas N, LairdPW, Raphael BJ, Ding L, Robertson AG, Byers LA, Mills GB, Weinstein JN, VanWaes C, Chen Z, Collisson EA, Cancer Genome Atlas Research N, et al.Multiplatform analysis of 12 cancer types reveals molecular classificationwithin and across tissues of origin. Cell. 2014;158:929–44.
39. Storey J. qvalue: Q-value estimation for false discovery rate control. 2015.https://bioconductor.org/packages/release/bioc/html/qvalue.html.
40. R Development Core Team. R: a language and environment for statisticalcomputing. Vienna, Austria: R Foundation for Statistical Computing; 2014.
41. Cancer Genome Atlas N. Comprehensive genomic characterization of headand neck squamous cell carcinomas. Nature. 2015;517:576–82.
42. Milne K, Kobel M, Kalloger SE, Barnes RO, Gao D, Gilks CB, Watson PH,Nelson BH. Systematic analysis of immune infiltrates in high-grade serousovarian cancer reveals CD20, FoxP3 and TIA-1 as positive prognostic factors.PLoS One. 2009;4:e6412.
43. Mahmoud SM, Paish EC, Powe DG, Macmillan RD, Grainge MJ, Lee AH, EllisIO, Green AR. Tumor-infiltrating CD8+ lymphocytes predict clinical outcomein breast cancer. J Clin Oncol. 2011;29:1949–55.
• We accept pre-submission inquiries
• Our selector tool helps you to find the most relevant journal
• We provide round the clock customer support
• Convenient online submission
• Thorough peer review
• Inclusion in PubMed and all major indexing services
• Maximum visibility for your research
Submit your manuscript atwww.biomedcentral.com/submit
Submit your next manuscript to BioMed Central and we will help you at every step:
Li et al. Genome Biology (2016) 17:174 Page 16 of 16