COMPOSITION VARIATION DURING FLOW OF GAS-CONDENSATE … library/Research/oil-gas/Natural Gas... ·...
41
i Final Report to COMPOSITION VARIATION DURING FLOW OF GAS-CONDENSATE WELLS Project Number 07122-29.FINAL September 2011 Authors: Hai Xuan Vo and Roland N. Horne PI: Roland N. Horne ([email protected]) Department of Energy Resources Engineering 367 Panama Street Stanford University, CA 94305-2220 (650)723-4744
Transcript of COMPOSITION VARIATION DURING FLOW OF GAS-CONDENSATE … library/Research/oil-gas/Natural Gas... ·...

i
Final Report to
COMPOSITION VARIATION DURING FLOW OF GAS-CONDENSATE WELLS
Project Number 07122-29.FINAL
September 2011
Authors: Hai Xuan Vo and Roland N. Horne
PI: Roland N. Horne ([email protected]) Department of Energy Resources Engineering
367 Panama Street Stanford University, CA 94305-2220
(650)723-4744

ii
LEGAL NOTICE
This report was prepared by Stanford University as an account of work sponsored by the Research Partnership to Secure Energy for America, RPSEA. Neither RPSEA members of RPSEA, the National Energy Technology Laboratory, the U.S. Department of Energy, nor any person acting on behalf of any of the entities:
a. MAKES ANY WARRANTY OR REPRESENTATION, EXPRESS OR IMPLIED WITH RESPECT TO ACCURACY, COMPLETENESS, OR USEFULNESS OF THE INFORMATION CONTAINED IN THIS DOCUMENT, OR THAT THE USE OF ANY INFORMATION, APPARATUS, METHOD, OR PROCESS DISCLOSED IN THIS DOCUMENT MAY NOT INFRINGE PRIVATELY OWNED RIGHTS, OR
b. ASSUMES ANY LIABILITY WITH RESPECT TO THE USE OF, OR
FOR ANY AND ALL DAMAGES RESULTING FROM THE USE OF, ANY INFORMATION, APPARATUS, METHOD, OR PROCESS DISCLOSED IN THIS DOCUMENT.
THIS IS A FINAL REPORT. THE DATA, CALCULATIONS, INFORMATION, CONCLUSIONS, AND/OR RECOMMENDATIONS REPORTED HEREIN ARE THE PROPERTY OF THE U.S. DEPARTMENT OF ENERGY. REFERENCE TO TRADE NAMES OR SPECIFIC COMMERCIAL PRODUCTS, COMMODITIES, OR SERVICES IN THIS REPORT DOES NOT REPRESENT OR CONSTIITUTE AND ENDORSEMENT, RECOMMENDATION, OR FAVORING BY RPSEA OR ITS CONTRACTORS OF THE SPECIFIC COMMERCIAL PRODUCT, COMMODITY, OR SERVICE.

iii

iv
Signature Page
Roland N. Horne, Principal Investigator
5 December 2011
v
Abstract
Gas-condensate wells experience a significant decrease in gas productivity once the
flowing bottom-hole pressure drops below the dew-point pressure. However, there is still
a lack of understanding how the condensate bank affects the deliverability because of the
complex phase and flow behaviors. The difficulty of understanding the phase and flow
behaviors lies in the variation of the composition due to the existence of two-phase flow
and the relative permeability effect (each phase has different mobility). The change of
composition will also bring about a large change in saturation and phase properties such
as surface tension, viscosity, etc. of the fluids. These effects will impact mobilities and
hence productivity.
The composition variation has been observed in the field but its effects have been studied
only rarely in the literature. This work studied the impact of compositional variation on
the flow behavior of the gas-condensate system through numerical simulations and a
series of laboratory experiments. The study verified claims made about effect of flow
through porous media on the apparent phase behavior of a gas-condensate mixture,
namely compositional variation during depletion, saturation profile around the well,
experience on shutting in the wells in an attempt to achieve condensate revaporization,
and the effect of bottom-hole pressures on condensate banking.
Results from this study show that composition varies significantly during depletion. Due
to the difference in mobilities caused by relative permeability, the composition of the
mixture will change locally. The overall composition near the wellbore becomes richer in
heavy components. As a result, the phase envelope will shift to the right. Near-well fluids
can undergo a transition from retrograde gas to a volatile oil, passing through a critical
composition in the process. The condensate bank can be reduced with proper producing
sequence, hence the productivity of the well can be improved, for example by raising the
bottomhole flowing pressure.
Finally, the study investigated the effect of compositional variation on the optimization of
the producing strategy for gas-condensate reservoirs, reducing the impact of condensate
banking, and improving the ultimate gas and condensate recovery. Conducting an
optimization calculation using Genetic Algorithm, an example reservoir was used to
determine the optimal production strategy to benefit from the understanding of
composition change during production. This same approach can be applied to real
producing reservoirs, by substituting the real reservoir configuration in the numerical
simulation model.


vii
Contents
Abstract ............................................................................................................................... v
Contents ............................................................................................................................ vii
List of Figures .................................................................................................................... ix
1. Introduction ............................................................................................................. 3
1.1. Overview ............................................................................................................. 3
1.2. Scope of this Work.............................................................................................. 5
2. Experimental Investigation ..................................................................................... 7
2.1. Experimental Design ........................................................................................... 7
2.1.1. Synthetic Gas-Condensate Mixture ............................................................ 7
2.2. Experimental Apparatus ...................................................................................... 9
2.2.1. Computerized Tomography (CT) Scanner .................................................. 9
2.3. Experimental Procedures .................................................................................. 10
2.3.1. Gas-condensate Core Flooding Experiments ............................................ 10
2.3.2. Gas-condensate, Immobile Water Core Flooding Experiments ................ 12
2.3.3. Compositional Measurement .................................................................... 13
2.3.4. Saturation Measurement ........................................................................... 13
2.4. Results ............................................................................................................... 14
2.4.1. Gas-Condensate Flow without Water ....................................................... 14
2.4.2. Gas-Condensate with Immobile Water ..................................................... 20
2.5. Saturation .......................................................................................................... 20
3. Impact to Producers .............................................................................................. 23
3.1. Optimization of Revenue from Gas-Condensate Reservoirs ............................ 23
4. Conclusion ............................................................................................................ 29
References ......................................................................................................................... 31


ix
List of Figures
Figure 1-1: Phase diagram of a typical gas condensate with line of isothermal reduction of
reservoir pressure. ................................................................................................... 3
Figure 1-2: Illustration of pressure profile and liquid dropout in the near wellbore region.
................................................................................................................................. 4
Figure 1-3: An example of very poor performance of a gas-condensate well (from
Barnum et al., 1995). ............................................................................................... 5
Figure 2-1: Phase diagram of the synthetic gas-condensate mixture used for experiments
(85% C1 and 15% nC4 in mole fraction). ................................................................ 8
Figure 2-2: Condensate dropout of the synthetic gas-condensate mixture used for
experiments (85% C1 and 15% nC4 in mole fraction) at 70 °F from the simulation
of CCE and CVD tests............................................................................................. 8
Figure 2-3: Modified experiment apparatus to minimize sample tube volume. ................. 9
Figure 2-4: GE HiSpeed CT/i. .......................................................................................... 10
Figure 2-5: Performing experiments in the CT scanning room. ....................................... 13
Figure 2-6: Gas-condensate noncapture experiment 1: nC4 in the flowing mixture. ........ 15
Figure 2-7: Gas-condensate noncapture experiment 2: nC4 in the flowing mixture. ........ 15
Figure 2-8: Gas-condensate noncapture experiment 3: nC4 in the flowing mixture. ........ 16
Figure 2-9: Gas-condensate noncapture experiment: nC4 in the flowing mixture with
different BHP control cases. ................................................................................. 17
Figure 2-10: Condensate revaporization after noncapture experiment for gas-condensate
system 1................................................................................................................. 17
Figure 2-11: Condensate revaporization after noncapture experiment for gas-condensate
system 2................................................................................................................. 18
Figure 2-12: Condensate revaporization after noncapture experiment for gas-condensate
system 3................................................................................................................. 18
Figure 2-13: Gas-condensate capture experiment 1. ......................................................... 19

x
Figure 2-14: Gas-condensate capture experiment 2. ......................................................... 19
Figure 2-15: Gas-condensate capture experiment 3. ......................................................... 20
Figure 2-16: Gas-condensate-immobile water noncapture experiment 1: nC4 in the
flowing mixture. .................................................................................................... 21
Figure 2-17: Gas-condensate-immobile water noncapture experiment 2: nC4 in the
flowing mixture. .................................................................................................... 21
Figure 2-18: Gas-condensate noncapture experiment 3: (a) nC4 in the flowing phases. (b)
condensate saturation profile. ............................................................................... 22
Figure 3-1: The SPE3 reservoir model (Kenyon and Behie, 1987). ................................. 23
Figure 3-2: Phase diagram of the gas-condensate reservoir fluid. .................................... 24
Figure 3-3: Gas injection rate of the optimization problem. ............................................. 25
Figure 3-4: Revenue of an example gas-condensate reservoir under different injection rate
scenarios. ............................................................................................................... 26
Figure 3-5: Cumulative condensate production of the optimization problem. ................. 26
Figure 3-6: Cumulative gas production of the optimization problem. .............................. 27
Figure 3-7: Cumulative gas injection of the optimization problem. ................................. 27
Figure 3-8: Condensate to gas production ratio of the optimization problem. ................. 28

1
Executive Summary
One of the most significant and unique factors associated with tight gas reservoirs is their
low productivity, which is especially exacerbated in the case of gas-condensate fluids.
Gas-condensates fluids exhibit complex phase and flow behaviors due to the appearance
of condensate banking in the near-well region, and differ essentially in their behavior
from conventional gas reservoirs, especially for low permeability high yield condensate
systems, which have more severe condensate banking problems. A good understanding
of how the condensate accumulation influences the productivity and the composition
configuration in the liquid phase is very important to optimize the producing strategy for
tight gas sands, to reduce the impact of condensate banking, and to improve the ultimate
gas recovery.
This study addressed several issues related to the behavior of the composition variation,
condensate saturation build-up and condensate recovery during the gas-condensate
producing process in tight gas reservoirs. A key factor that controls the gas-condensate
well deliverability is the relative permeability, which is influenced directly by the
condensate accumulation. The accumulated condensate bank not only reduces both the
gas and liquid relative permeability, but also changes the phase composition of the
reservoir fluid, hence reshapes the phase diagram of reservoir fluid and varies the fluid
properties. The study found that different producing strategies impact the composition
configuration for both flowing and static phases and the amount of the liquid trapped in
the reservoir, which in turn influence the well productivity and hence the ultimate gas and
liquid recovery from the reservoir. Changing the manner in which the well is brought into
flowing condition was found to affect the liquid dropout composition and can therefore
change the degree of productivity loss.
Experiments using a binary synthetic mixture at laboratory scale were conducted to
measure the compositional variation and to test the contributing factors for composition
variation and condensate banking effect. Full compositional simulations of binary-
component and multicomponent gas-condensate fluids were conducted at field scale to
investigate the composition and condensate saturation variations. Different producing
strategies were tested to find out the optimum producing sequences for maximum gas
recovery. By taking account of the new understanding of the impact of compositional
changes, the composition of the liquid dropout can be “controlled” by the production
strategy (for example by dropping a lighter liquid in preference to a heavier one) and
hence the recovery from tight gas reservoirs with condensate fluids can be improved.
As a primary result, it was determined that increasing the bottomhole flowing pressure of
wells producing gas-condensate fluids can (depending on the composition) result in a
more valuable flow stream (in terms of net present value, NPV). One important
consequence of the composition variation examined in this work is that the reservoir fluid
progressively changes from a gas condensate to a volatile oil because the heavier
components are left in the formation due to relative permeability effects. This means that

2
producing companies are not able to revaporize the condensate by repressurizing the
wells.
Another way for producing companies to improve the productivity by adjusting the
compositional behavior of the reservoir fluid is to inject lean gas, for example by partial
gas recycling.
This report includes an abbreviated summary of the results and conclusions – a more
complete compilation of the experimental and numerical procedures and results is
contained in an accompanying Appendix report.

3
1. Introduction
1.1. Overview
Gas-condensate reservoirs are encountered more frequently as exploration is now targeted
at greater depth and hence higher pressure and temperature. The high temperature and
pressure lead to a higher degree of degradation of complex organic molecules. As a result,
the deeper the burial of an organic material, the higher tendency the organic material will
be converted to gas or gas condensate. The gas condensate usually consists mainly of
methane and other light hydrocarbons with a small portion of heavier components.
Gas condensate has a phase diagram as in Figure 1-1. In this case, the reservoir
temperature lies between the critical temperature and the cricondentherm, the maximum
temperature at which two phases can coexist in equilibrium. Initially, the reservoir
pressure is at a point that is above the dew-point curve so the reservoir is in the gaseous
state only. During production, the pressure declines isothermally from the reservoir
boundary to the well. If the well flowing bottom-hole pressure (BHP) drops below the
dew-point pressure, the condensate drops out of the gas and forms a bank of liquid around
the well (Figure 1-2). The gas condensate is special in the sense that when the pressure
decreases isothermally, instead of having gas evolution from liquid, we have liquid
condensation from the gas. Hence, sometimes, gas condensate is also called “retrograde
gas”.
Figure 1-1: Phase diagram of a typical gas condensate with line of isothermal reduction of
reservoir pressure.
When the condensate drops out in the reservoir, at first, due to relative permeability
behavior, the condensate liquid will not flow until the accumulated condensate saturation
exceeds the critical condensate saturation. This leads to a loss of valuable hydrocarbons
because the condensate contains most of the heavy components. Besides that, near the

4
wellbore where the condensate bank appears, there will be a multiphase flow so the gas
relative permeability is reduced. The reduction of gas permeability due to the condensate
bank is called condensate blocking. The condensate blocking effect leads to a reduction
of gas productivity of the well.
Figure 1-2: Illustration of pressure profile and liquid dropout in the near wellbore region.
The productivity loss due to condensate build up is large in some cases, especially in tight
reservoirs. Afidick et al. (1994) reported that liquid accumulation had occurred around
the wellbore in the Arun field and that it had reduced individual well productivity by 50%
even though the retrograde-liquid condensation in laboratory PVT experiments was less
than 2%. Barnum at al. (1995) conducted a study using data from 17 fields and concluded
that the condensation of hydrocarbon liquids in gas-condensate reservoirs can restrict gas
productivity severely. However, gas recovery factors below 50% are limited to reservoirs
with a permeability-thickness less than 1,000 md-ft. For more permeable reservoirs, the
productivity loss is not as severe. Barnum at al. (1995) also presented one example of
poor well performance (Figure 1-3). This is a moderately rich gas-condensate field with
an initial condensate-gas ratio of 73 bbl/MMscf. The well produced at initial rates over 1
MMscf/day. When the flowing bottom-hole pressure reached the dew-point, gas
production declined rapidly and the well died. Pressure surveys indicated that the well
was full of liquid hydrocarbons. Attempts to swab the well were unsuccessful, even
though data from surrounding wells indicated the average reservoir pressure was still over
2,000 psi above the dew-point pressure. The well appeared to have “locked up” and
ceased production shortly after flowing bottom-hole pressure fell below the dew-point
pressure. Eventually the well was stimulated successfully by hydraulic fracturing, and it
returned to the initial production rates.

5
Figure 1-3: An example of very poor performance of a gas-condensate well (from Barnum et al.,
1995).
1.2. Scope of this Work
The focus of the research was to gain a better understanding of how condensate blocking
affects the well productivity, with a focus on the effect of compositional variation on flow
behavior. This is important for optimizing the performance of gas-condensate reservoirs,
reducing the impact of condensate banking, and improving the ultimate gas and
condensate recovery.
The objective of the project was to develop methodology to increase the productivity of
gas-condensate fluids from tight gas reservoirs in the US. Presently, gas-condensate
reservoirs experience reductions in productivity by as much as a factor of 10 due to the
dropout of liquid close to the wellbore. The reduction is worse in low permeability
formations that make up tight gas reservoirs. The liquid dropout blocks the flow of gas to
the well and lowers the overall energy output by a very substantial degree (90% if the
productivity is reduced by 10). The combination of condensate phase behavior and rock
relative permeability results in a change of composition of the reservoir fluid, as heavier
components separate into the dropped-out liquid while the flowing gas phase becomes
lighter in composition. This effect has been sparsely recognized in the literature, although
there is clear evidence of it in field observations. The project quantified the effect,
developed a scientific understanding of the phenomena, and used the results to investigate
ways to enhance the productivity by controlling the liquid composition that drops out
close to the well. By optimizing the producing pressure strategy, it was found to be
possible to cause a lighter liquid to be condensed in the reservoir, after which the
productivity loss would be more easily remedied.
The research made use of experimental measurements of gas-condensate flow, as well as
compositional numerical simulations. The following issues and their contribution to

6
condensate banking and composition changes in tight gas reservoirs were examined
carefully:
1. How does the reservoir permeability contribute to the condensate banking problem?
How can understanding of this effect be used to reduce the production loss in low
permeability gas-condensate systems?
2. How do the reservoir flow properties (PVT, rich or lean gas-condensate system) and
phase behavior play a role in composition change and how can we predict the component
change given a flow characterization?
3. How does the composition change relate to the production sequence? Can we design a
production strategy for tight gas reservoirs that will apply different producing schemes to
maximize the gas recovery?

7
2. Experimental Investigation
2.1. Experimental Design
The strategy was to use a simple binary mixture in the experiments. Although field gases
have more complex composition, the use of a binary mixture in the laboratory improved
the ability to achieve accurate results. The laboratory results obtained using the binary
mixture could then be used subsequently to confirm numerical simulation results with the
same composition, then finally the numerical simulator was used with more complex
compositions found in the field.
2.1.1. Synthetic Gas-Condensate Mixture
The binary mixture used in the experiments was 85% C1 and 15% nC4 by mole fraction.
This gas-condensate mixture was selected based on the following criteria:
The binary mixture is easy to mix in the laboratory, from commercial high quality
pure component gases.
The critical temperature of the mixture is below the laboratory temperature so the
experiments can be performed at room temperature, which eliminates the need to
heat the flammable gases hence improving safety.
The gas has a broad two-phase region in order to achieve condensate dropout
during the experiment.
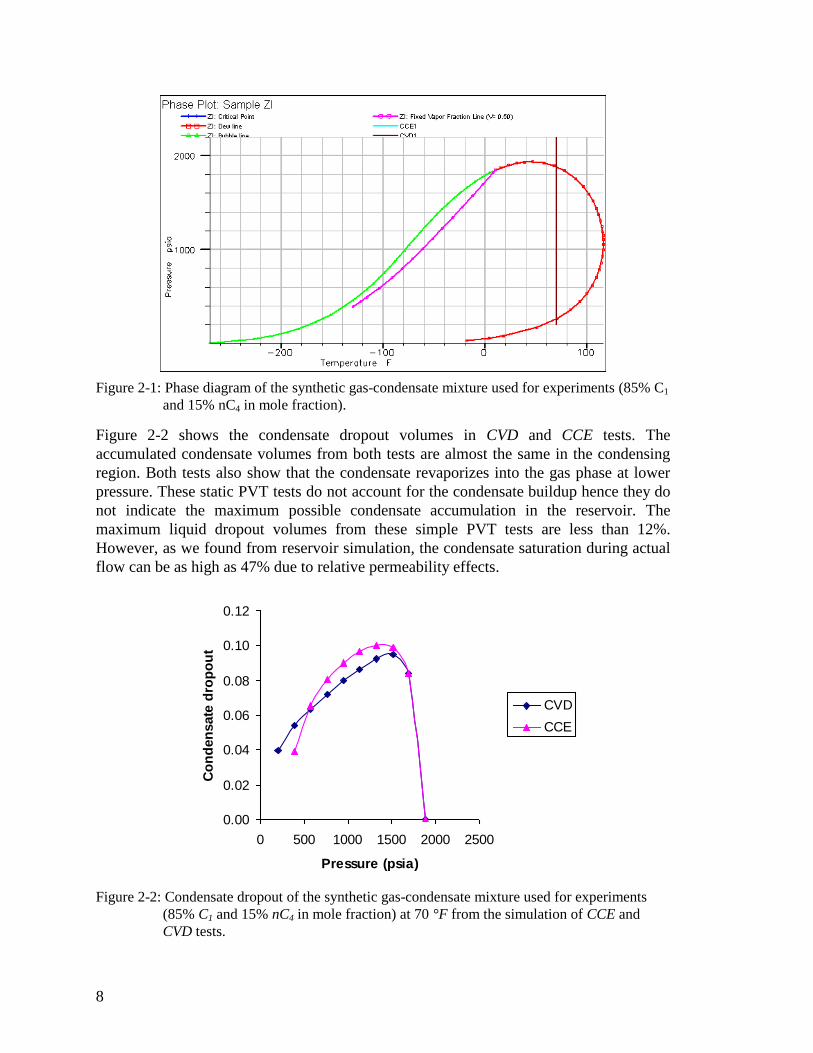
The phase diagram of the synthetic gas-condensate mixture used for the experiments is
shown in Figure 2-1. The critical point of the mixture is Tc= 10 °F, pc= 1,844 psia. At
room temperature of 70°F and pressure range from 2,200 – 1,000 psia, this mixture has a
broad two-phase region.
8
Figure 2-1: Phase diagram of the synthetic gas-condensate mixture used for experiments (85% C1
and 15% nC4 in mole fraction).
Figure 2-2 shows the condensate dropout volumes in CVD and CCE tests. The
accumulated condensate volumes from both tests are almost the same in the condensing
region. Both tests also show that the condensate revaporizes into the gas phase at lower
pressure. These static PVT tests do not account for the condensate buildup hence they do
not indicate the maximum possible condensate accumulation in the reservoir. The
maximum liquid dropout volumes from these simple PVT tests are less than 12%.
However, as we found from reservoir simulation, the condensate saturation during actual
flow can be as high as 47% due to relative permeability effects.
0.00
0.02
0.04
0.06
0.08
0.10
0.12
0 500 1000 1500 2000 2500
Pressure (psia)
Co
nd
en
sate
dro
po
ut
CVD
CCE
Figure 2-2: Condensate dropout of the synthetic gas-condensate mixture used for experiments
(85% C1 and 15% nC4 in mole fraction) at 70 °F from the simulation of CCE and
CVD tests.

9
The core used in the experiments is a low permeability sandstone. The synthetic gas-
condensate mixture was injected at one end and produced at the other end of the core, so
the flow was one-dimensional linear flow.
Numerical simulations were conducted to define the experimental parameters. Simulation
was also used to check the flow pressures and to have an idea how composition and
saturation were distributed along the core. In the simulation model, two wells, one gas
injection and one producing, were used. Both wells were controlled by constant bottom-
hole pressures. The bottom-hole pressure of the injection well was set above the dew-
point pressure while the bottom-hole pressure of the producing well was set below the
dew-point pressure of the gas-condensate mixture. So the fluid at the upstream end was
always in gas phase, and the fluid at the downstream end was always in the two-phase
region.
2.2. Experimental Apparatus
The apparatus was modified from a previous design of Shi (Shi, 2009) to achieve
repeatability of the experimental results. The apparatus was modified by fitting valves
directly onto the core holder to minimize the volume in the sample tubes. The
modification is shown in Figure 2-3. The modified experimental apparatus consists of
the three main subsystems: gas supply and exhaust, core flooding system and fluid
sampling system.
Figure 2-3: Modified experiment apparatus to minimize sample tube volume.
2.2.1. Computerized Tomography (CT) Scanner
In this study, a GE HiSpeed CT/i scanner was used to measure the saturation distribution
along the core during the experiments (Figure 2-4). For two-phase systems and three-

10
phase systems where the third phase is immobile, a single energy level scan is sufficient
to determine the saturations.
Figure 2-4: GE HiSpeed CT/i.
2.3. Experimental Procedures
2.3.1. Gas-condensate Core Flooding Experiments
Two types of experiments were performed in this study: noncapture and capture. The
difference between them was that in the noncapture experiments the samples were taken
while the fluid was flowing, while in the capture experiments fluid flowed through the
core for a given time period then both inlet and outlet valves were closed at the same
time. The samples were then taken from the “captured” fluid. At the end, the remaining
fluid in the core was discharged to an empty cylinder to determine the composition of the
condensate left in the core. These experimental procedures were modified from the
previous procedures to achieve repeatability of the results.
11
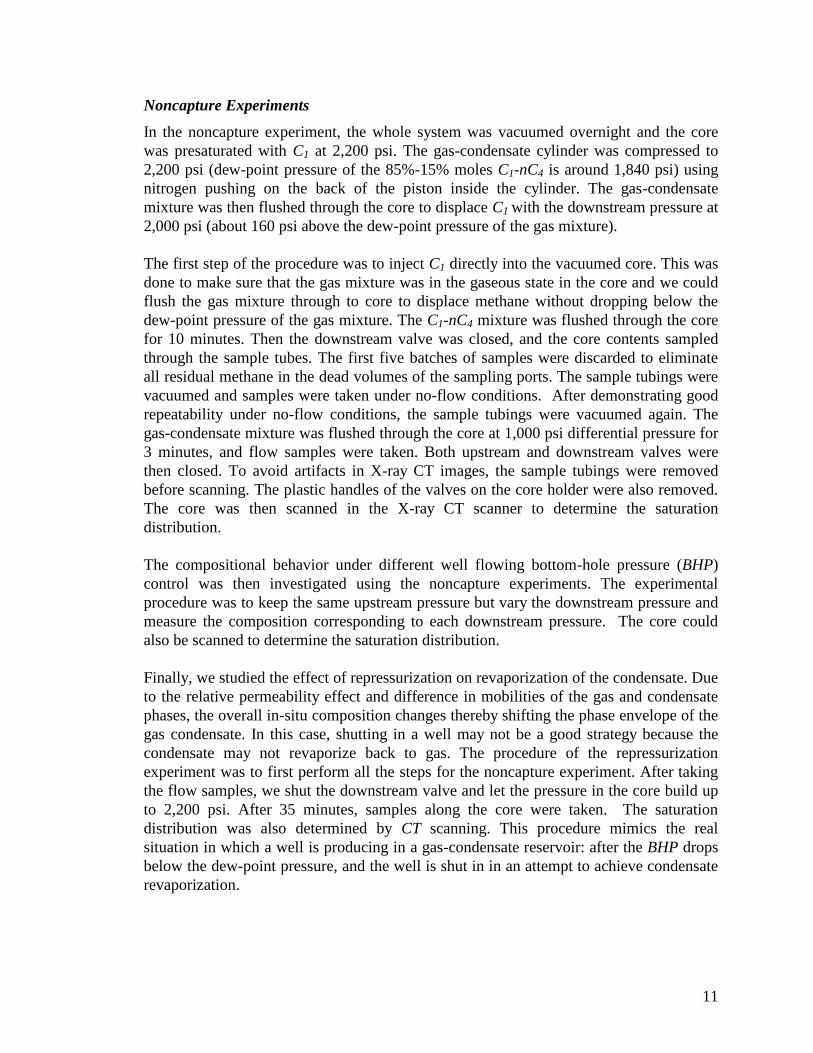
Noncapture Experiments
In the noncapture experiment, the whole system was vacuumed overnight and the core
was presaturated with C1 at 2,200 psi. The gas-condensate cylinder was compressed to
2,200 psi (dew-point pressure of the 85%-15% moles C1-nC4 is around 1,840 psi) using
nitrogen pushing on the back of the piston inside the cylinder. The gas-condensate
mixture was then flushed through the core to displace C1 with the downstream pressure at
2,000 psi (about 160 psi above the dew-point pressure of the gas mixture).
The first step of the procedure was to inject C1 directly into the vacuumed core. This was
done to make sure that the gas mixture was in the gaseous state in the core and we could
flush the gas mixture through to core to displace methane without dropping below the
dew-point pressure of the gas mixture. The C1-nC4 mixture was flushed through the core
for 10 minutes. Then the downstream valve was closed, and the core contents sampled
through the sample tubes. The first five batches of samples were discarded to eliminate
all residual methane in the dead volumes of the sampling ports. The sample tubings were
vacuumed and samples were taken under no-flow conditions. After demonstrating good
repeatability under no-flow conditions, the sample tubings were vacuumed again. The
gas-condensate mixture was flushed through the core at 1,000 psi differential pressure for
3 minutes, and flow samples were taken. Both upstream and downstream valves were
then closed. To avoid artifacts in X-ray CT images, the sample tubings were removed
before scanning. The plastic handles of the valves on the core holder were also removed.
The core was then scanned in the X-ray CT scanner to determine the saturation
distribution.
The compositional behavior under different well flowing bottom-hole pressure (BHP)
control was then investigated using the noncapture experiments. The experimental
procedure was to keep the same upstream pressure but vary the downstream pressure and
measure the composition corresponding to each downstream pressure. The core could
also be scanned to determine the saturation distribution.
Finally, we studied the effect of repressurization on revaporization of the condensate. Due
to the relative permeability effect and difference in mobilities of the gas and condensate
phases, the overall in-situ composition changes thereby shifting the phase envelope of the
gas condensate. In this case, shutting in a well may not be a good strategy because the
condensate may not revaporize back to gas. The procedure of the repressurization
experiment was to first perform all the steps for the noncapture experiment. After taking
the flow samples, we shut the downstream valve and let the pressure in the core build up
to 2,200 psi. After 35 minutes, samples along the core were taken. The saturation
distribution was also determined by CT scanning. This procedure mimics the real
situation in which a well is producing in a gas-condensate reservoir: after the BHP drops
below the dew-point pressure, and the well is shut in in an attempt to achieve condensate
revaporization.

12
Capture Experiments
Capture experiments were designed to have flow samples under conditions in which both
upstream and downstream valves were closed so the samples would be closer to static
composition rather than that of the flowing gas. Furthermore, the captured condensate in
the core could be discharged to an empty cylinder to determine the composition of the
condensate dropout.
The whole system was vacuumed overnight and the core was presaturated with C1 at
2,200 psi. The original procedure had been to presaturate with C1 at 2,000 psi. The gas-
condensate cylinder was compressed to 2,200 psi (dew-point pressure of 85%-15% molar
C1-nC4 is around 1,840 psi) using nitrogen pushing on the back of the piston inside the
cylinder. The gas-condensate mixture was flushed through the core for 10 minutes with
the downstream pressure at 2,000 psi (about 160 psi above the dew-point pressure of the
gas mixture). This was done to make sure that the gas mixture was in the gaseous state at
the inlet of the core and we could flush the gas mixture through to core to displace
methane without dropping below the dew-point pressure of the gas mixture (original
procedure was at 2,000 – 1,950 psi differential pressure so it had been difficult to remove
the methane out of the core). The C1-nC4 mixture was flushed through the core for 10
minutes. Then the downstream valve was closed and the fluids sampled. The first five
batches of samples were discarded to eliminate all residual methane in the dead volumes
of the sampling ports. The sample tubings were vacuumed and samples were taken under
no-flow conditions.
After demonstrating good repeatability under no-flow conditions, the sample tubings
were vacuumed and the gas-condensate mixture was flowed through the core at 1,000 psi
differential pressure for 3 minutes. Then the upstream and downstream valves were
closed simultaneously. Fluid samples were taken in capture mode immediately. At the
end, the entire content of the core was discharged into an empty (vacuumed) cylinder for
compositional analysis.
After scanning the core during noncapture experiments, we found out that the titanium
core-holder had caused X-ray beam hardening which can affect the measurement results
for saturation. We decided not to use the CT scanner for subsequent experiments.
2.3.2. Gas-condensate, Immobile Water Core Flooding Experiments
The core holder was vacuumed for 48 hours if there was some water in the core
previously. The vacuum pump was connected at the outlet of the core holder, the inlet
valve was closed. After that, the water pump was connected to the inlet of the core holder.
The inlet valve was opened. Deionized water was pumped in while keeping the vacuum
pump on. The vacuum pump was turned off and disconnected when water reached the
tubing at the outlet. The estimated time was calculated based on the water pumping rate
and the pore volume. Water pumping was continued to displace about four pore volumes
to eliminate any air trapped in the core. The upstream of the core holder was then lifted to
an angle about 30 degrees from horizontal. C1 was injected through the core at 50-100 psi
13
for two to three hours to drain the water to immobile water saturation Swi. The sample
tubings were also bled off from time to time to release trapped water. The core holder was
then put back to the horizontal position, the downstream valve was closed and the core
was filled with C1 at 2,200 psi. The capture and noncapture experiments were performed
in the same way as for the previous gas-condensate system without water. No CT
scanning was used for the gas-condensate-immobile water experiments.
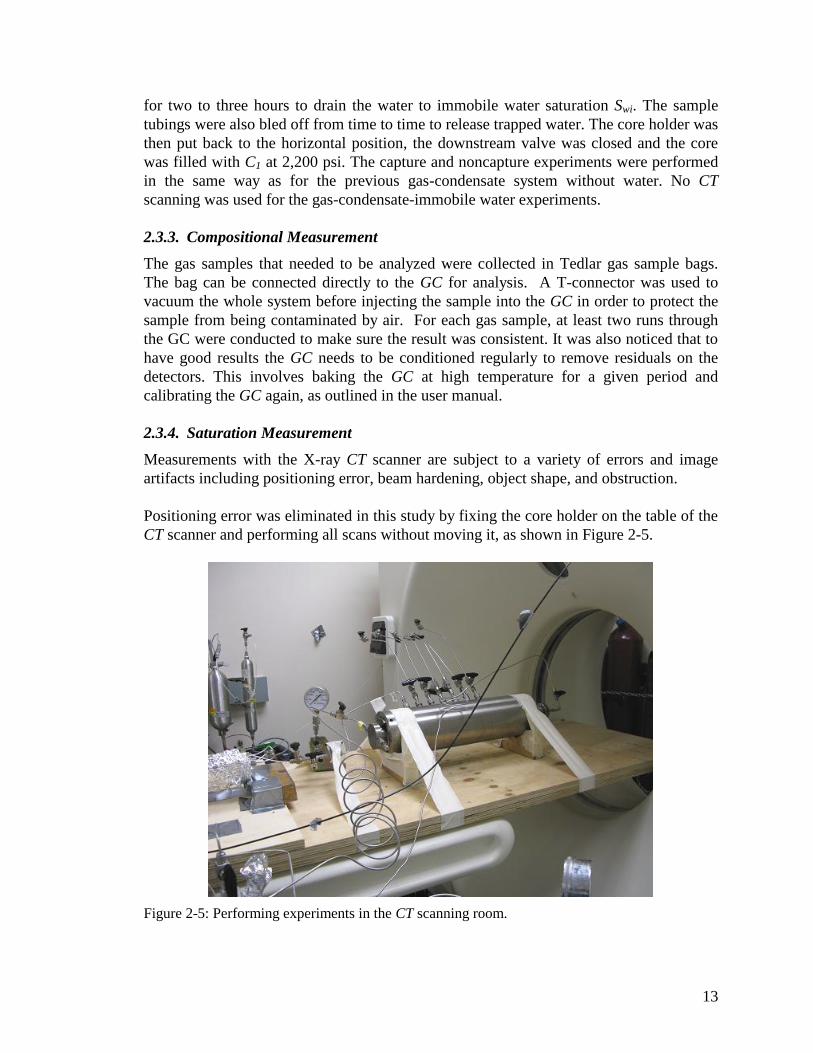
2.3.3. Compositional Measurement
The gas samples that needed to be analyzed were collected in Tedlar gas sample bags.
The bag can be connected directly to the GC for analysis. A T-connector was used to
vacuum the whole system before injecting the sample into the GC in order to protect the
sample from being contaminated by air. For each gas sample, at least two runs through
the GC were conducted to make sure the result was consistent. It was also noticed that to
have good results the GC needs to be conditioned regularly to remove residuals on the
detectors. This involves baking the GC at high temperature for a given period and
calibrating the GC again, as outlined in the user manual.
2.3.4. Saturation Measurement
Measurements with the X-ray CT scanner are subject to a variety of errors and image
artifacts including positioning error, beam hardening, object shape, and obstruction.
Positioning error was eliminated in this study by fixing the core holder on the table of the
CT scanner and performing all scans without moving it, as shown in Figure 2-5.
Figure 2-5: Performing experiments in the CT scanning room.

14
The X-ray source of the CT scanner delivers a spectrum of X-ray energies rather than
single-level energy. The lower energies are absorbed in the core holder, rock and at the
interfaces. Beam hardening is the process of increasing the average energy level of an X-
ray beam by filtering out the low-energy photons. This creates an error in the linear
attenuation measurement. In analyzing the rock, beam hardening can be reduced by using
special core holder designs (surrounding the core colder with a cylindrical water jacket,
using an aluminum core holder, etc.), moving to higher energy levels or calibrating the
CT scanner to a CT number higher than that of water using a doped water solution. In this
study, we tried to minimize the beam hardening by using higher energy level (140 kV).
2.4. Results
2.4.1. Gas-Condensate Flow without Water
Noncapture Experiments
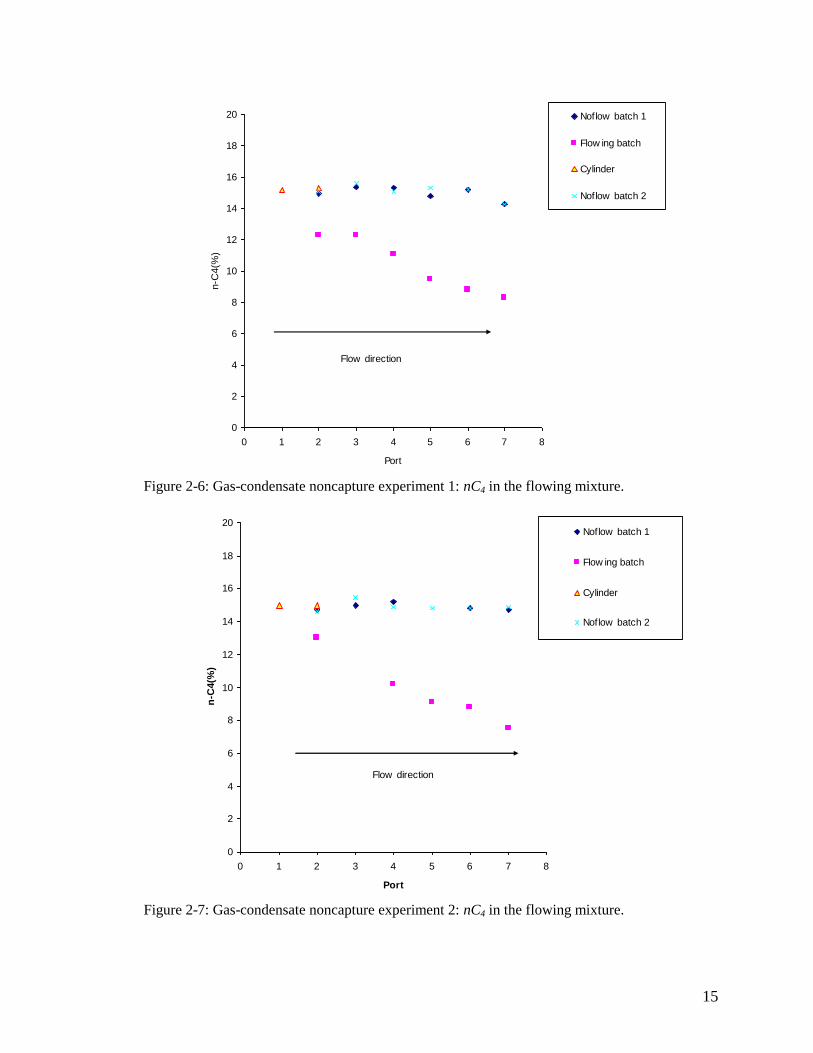
The compositional distribution along the core during a gas-condensate noncapture
experiment is shown in Figure 2-6. No-flow samples were taken before the flow test
when the gas mixture was above the dew-point. The no-flow compositions were repeated
perfectly and were identical to the composition from the source cylinder. This
confirmation indicated that the rock does not have an effect on the (static) phase behavior
of the gas mixture.
During flow through the core, going from left to right, the pressure drop was higher.
Liquid dropped out in the core and accumulated in the rock. The flowing mixture became
lighter (more C1) and the concentration of nC4 in the flowing phase along the core
decreased.
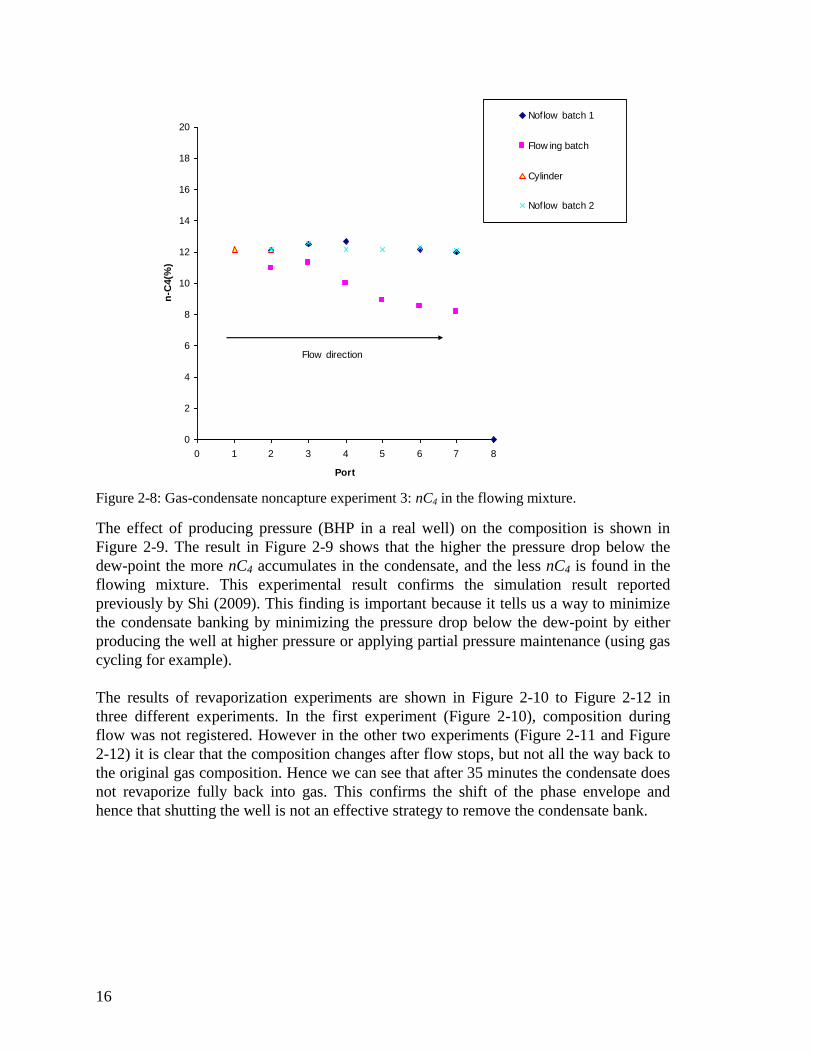
Figure 2-7 and Figure 2-8 show two more noncapture experiments following the same
procedure. The compositional distributions along the core confirm the result in Figure 2-
6. These results also confirm the three-region theory and the simulations results.
15
0
2
4
6
8
10
12
14
16
18
20
0 1 2 3 4 5 6 7 8
Port
n-C
4(%
)
Noflow batch 1
Flow ing batch
Cylinder
Noflow batch 2
Flow direction
Figure 2-6: Gas-condensate noncapture experiment 1: nC4 in the flowing mixture.
0
2
4
6
8
10
12
14
16
18
20
0 1 2 3 4 5 6 7 8
Port
n-C
4(%
)
Noflow batch 1
Flow ing batch
Cylinder
Noflow batch 2
Flow direction
Figure 2-7: Gas-condensate noncapture experiment 2: nC4 in the flowing mixture.
16
0
2
4
6
8
10
12
14
16
18
20
0 1 2 3 4 5 6 7 8
Port
n-C
4(%
)
Noflow batch 1
Flow ing batch
Cylinder
Noflow batch 2
Flow direction
Figure 2-8: Gas-condensate noncapture experiment 3: nC4 in the flowing mixture.
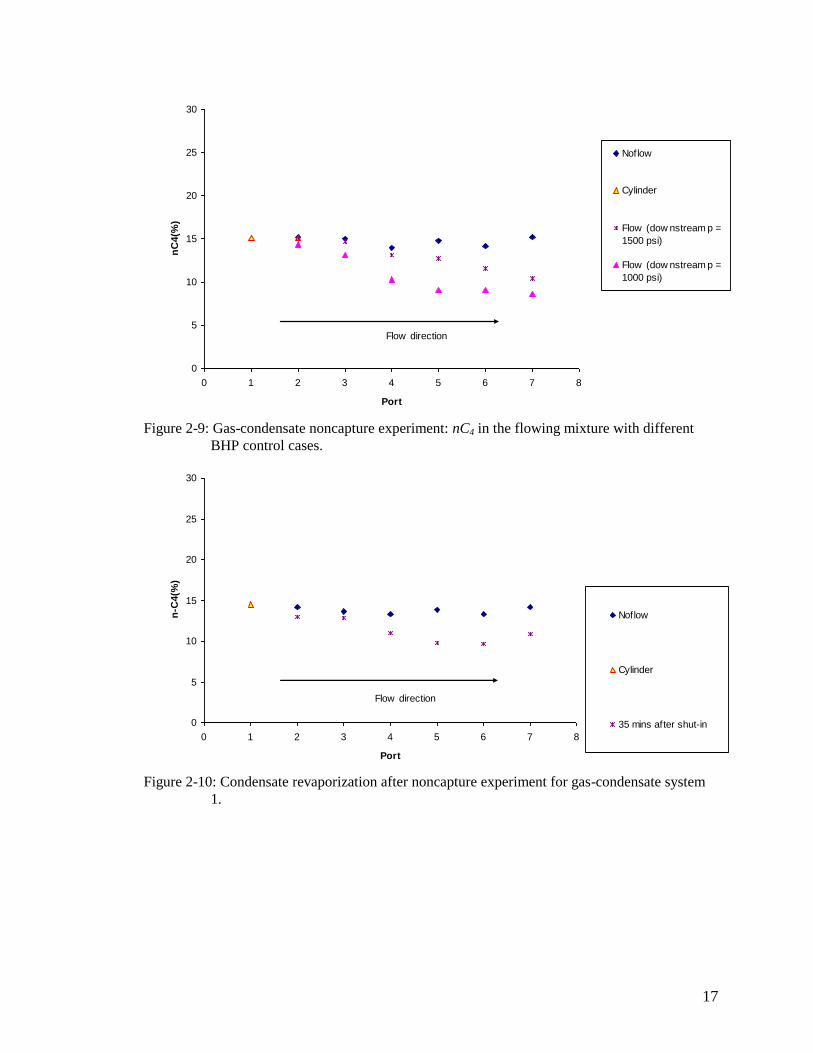
The effect of producing pressure (BHP in a real well) on the composition is shown in
Figure 2-9. The result in Figure 2-9 shows that the higher the pressure drop below the
dew-point the more nC4 accumulates in the condensate, and the less nC4 is found in the
flowing mixture. This experimental result confirms the simulation result reported
previously by Shi (2009). This finding is important because it tells us a way to minimize
the condensate banking by minimizing the pressure drop below the dew-point by either
producing the well at higher pressure or applying partial pressure maintenance (using gas
cycling for example).
The results of revaporization experiments are shown in Figure 2-10 to Figure 2-12 in
three different experiments. In the first experiment (Figure 2-10), composition during
flow was not registered. However in the other two experiments (Figure 2-11 and Figure
2-12) it is clear that the composition changes after flow stops, but not all the way back to
the original gas composition. Hence we can see that after 35 minutes the condensate does
not revaporize fully back into gas. This confirms the shift of the phase envelope and
hence that shutting the well is not an effective strategy to remove the condensate bank.
17
0
5
10
15
20
25
30
0 1 2 3 4 5 6 7 8
Port
nC
4(%
)
Noflow
Cylinder
Flow (dow nstream p =
1500 psi)
Flow (dow nstream p =
1000 psi)
Flow direction
Figure 2-9: Gas-condensate noncapture experiment: nC4 in the flowing mixture with different
BHP control cases.
0
5
10
15
20
25
30
0 1 2 3 4 5 6 7 8
Port
n-C
4(%
)
Noflow
Cylinder
35 mins after shut-in
Flow direction
Figure 2-10: Condensate revaporization after noncapture experiment for gas-condensate system
1.

18
0
5
10
15
20
25
30
0 1 2 3 4 5 6 7 8
Port
nC
4(%
)
Noflow
Cylinder
Flow
40 mins after shut-in
Flow direction
Figure 2-11: Condensate revaporization after noncapture experiment for gas-condensate system
2.
0
5
10
15
20
25
30
0 1 2 3 4 5 6 7 8
Port
nC
4(%
)
Noflow
Cylinder
Flow
40 mins after shut-in
Flow direction
Figure 2-12: Condensate revaporization after noncapture experiment for gas-condensate system
3.
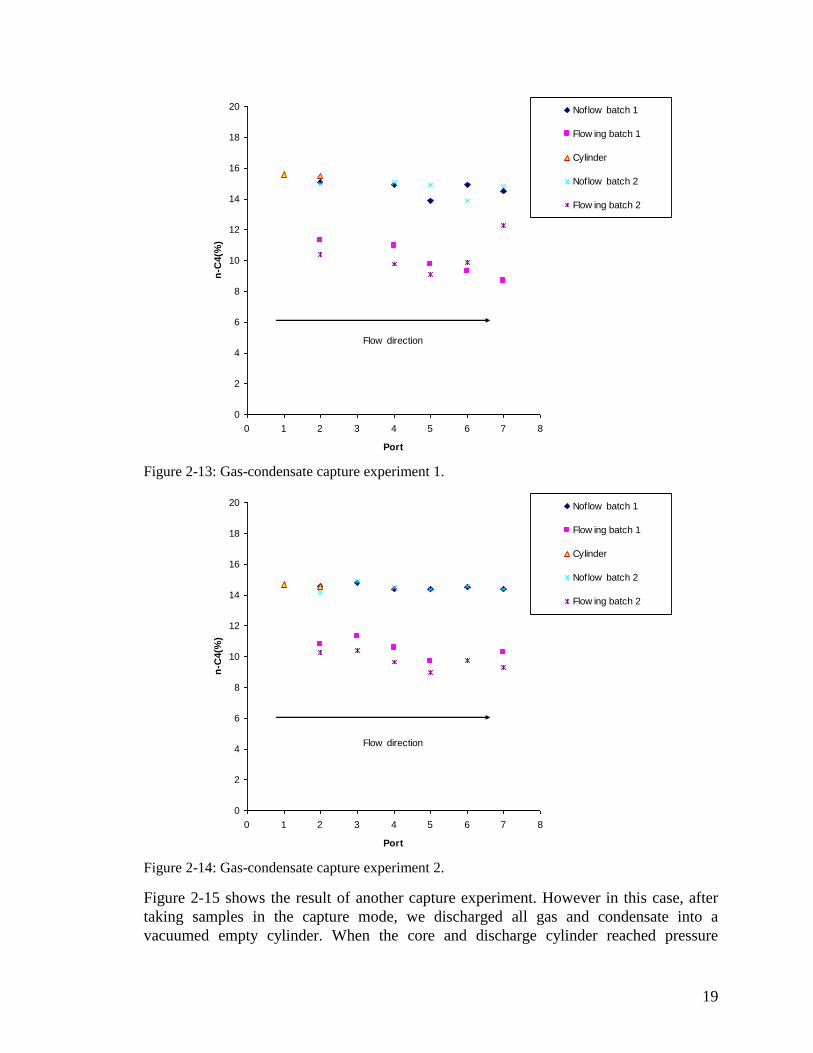
Capture Experiments
The results of a capture experiment are shown in Figure 2-13. Good repeatability was
achieved under both static conditions and flowing conditions. The compositional
distribution along the core shows a similar trend of liquid dropout as the trend seen
during noncapture experiments. A second capture experiment also confirmed the result
(Figure 2-14).
19
0
2
4
6
8
10
12
14
16
18
20
0 1 2 3 4 5 6 7 8
Port
n-C
4(%
)
Noflow batch 1
Flow ing batch 1
Cylinder
Noflow batch 2
Flow ing batch 2
Flow direction
Figure 2-13: Gas-condensate capture experiment 1.
0
2
4
6
8
10
12
14
16
18
20
0 1 2 3 4 5 6 7 8
Port
n-C
4(%
)
Noflow batch 1
Flow ing batch 1
Cylinder
Noflow batch 2
Flow ing batch 2
Flow direction
Figure 2-14: Gas-condensate capture experiment 2.
Figure 2-15 shows the result of another capture experiment. However in this case, after
taking samples in the capture mode, we discharged all gas and condensate into a
vacuumed empty cylinder. When the core and discharge cylinder reached pressure

20
equilibrium (at low pressure), we disconnected the core from the cylinder and took
samples from each of them. The nC4 compositions in the discharge cylinder and core
were very high, which confirmed that the liquid condensate that had deposited in the core
was rich in nC4.
0
10
20
30
40
50
60
70
80
90
100
0 1 2 3 4 5 6 7 8
Port
n-C
4(%
)
Noflow
Cylinder
Flow ing
Cylinder_Discharge
Core_discharge
Flow direction
Figure 2-15: Gas-condensate capture experiment 3.
2.4.2. Gas-Condensate with Immobile Water
Comparing Figures 2-6 to 2-12 (without water in the core) to Figures 2-16 and Figure 2-
17 for the system with immobile water in the core, it is clear that in the presence of
immobile water, condensate still dropped out in the core. The higher the pressure drop,
the more liquid dropped out in the core and accumulated in the rock. The flowing mixture
became lighter (more C1) and the concentration of nC4 in the flowing phase decreased.
The presence of the immobile water did not seem to alter the flow or composition
behavior in comparison to experiments in which no water was present.
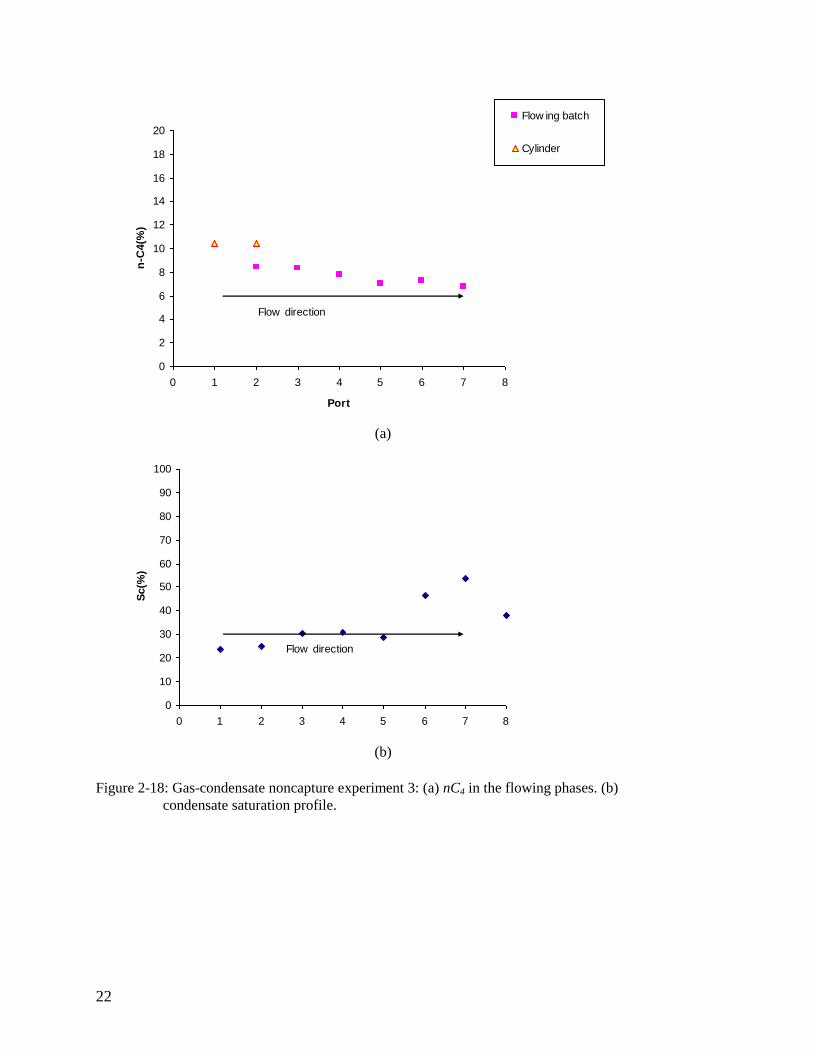
2.5. Saturation
Figures 2-18 shows condensate saturation distribution calculated from CT scanning.
Slice #1 is on the upstream of P2, slice #2 is between P1 and P2, etc., and slices #7 and #8
are on the downstream of P7. The condensate saturation profile is consistent with the nC4
compositional profile, although the saturation value estimated at slice #8 appears to be
influenced by end-effect. It should be noted that due to the low porosity rock, there is
only a small density difference between the liquid n-butane and methane, so the
difference between CT numbers of C1-nC4 mixture saturated, C1-saturated and nC4-
saturated rock is not large. This limits the accuracy of the saturation estimation.

21
0
2
4
6
8
10
12
14
16
18
20
0 1 2 3 4 5 6 7 8
Port
n-C
4(%
)
Noflow batch 1
Flow ing
Cylinder
Noflow batch 2
Flow direction
Figure 2-16: Gas-condensate-immobile water noncapture experiment 1: nC4 in the flowing
mixture.
0
2
4
6
8
10
12
14
16
18
20
0 1 2 3 4 5 6 7 8
Port
n-C
4(%
)
Noflow batch
Flow ing
Cylinder
Flow direction
Figure 2-17: Gas-condensate-immobile water noncapture experiment 2: nC4 in the flowing
mixture.
22
0
2
4
6
8
10
12
14
16
18
20
0 1 2 3 4 5 6 7 8
Port
n-C
4(%
)
Flow ing batch
Cylinder
Flow direction
(a) Noncapture Experiment (08/16/10)
0
10
20
30
40
50
60
70
80
90
100
0 1 2 3 4 5 6 7 8
Slice
Sc(%
)
Flow direction
(b)
Figure 2-18: Gas-condensate noncapture experiment 3: (a) nC4 in the flowing phases. (b)
condensate saturation profile.

23
3. Impact to Producers
3.1. Optimization of Revenue from Gas-Condensate Reservoirs
As an example of the impact of the change in composition on production from real gas-
condensate reservoirs, we will show an example in which the revenue stream was
optimized by capitalizing on the variation of condensate yield caused by the shift in the
phase envelope. These results are specific to the (hypothetical) example reservoir
simulated, and therefore are not necessarily general. Nonetheless, the approach illustrated
here can be applied to actual reservoirs by replicating this approach, but using the
simulation model of the reservoir under investigation. The model results shown here for
demonstration indicate the validity of the concept of taking advantage of the knowledge
of the composition change during production, by implementing a production/injection
strategy that adjusts the resulting fluid compositions in the reservoir.
In the example case, the model we used is based on the SPE3 model (Kenyon and Behie,
1987) used for the Third SPE Comparative Solution Project on Gas Cycling of
Retrograde Condensate Reservoirs, as shown in Figure 3-1. This model was chosen for
this illustrative case, as it represents an industry-standard example. The simulation grid
has 9×9×4 blocks in Cartesian coordinates. There are four layers and only one production
well at the center of the reservoir which is perforated in layers 3 and 4. The reservoir fluid
is gas-condensate with multiple components. Figure 3-2 shows the phase diagram of the
reservoir fluid, which has the composition shown in Table 3-1. At the reservoir
temperature of 200°F, there is a large condensate region between 3500 psia and 500 psia
(reservoir pressure is 3500 psia). The initial conditions for the location of the gas/water
contact and the capillary pressure data generate a water/gas transition zone extending into
the pay layers.
Figure 3-1: The SPE3 reservoir model (Kenyon and Behie, 1987).

24
Figure 3-2: Phase diagram of the gas-condensate reservoir fluid.
Table 3-1: Composition of fluid in SPE3 reservoir model.
z MW
CO2 0.0121 44.01
N2 0.0194 28.01
C1 0.6599 16.04
C2 0.0869 30.07
C3 0.0591 44.10
C4-6 0.0967 66.87
C7+1 0.0475 107.78
C7+2 0.0152 198.56
C7+3 0.0033 335.20
In the optimization problem we modified the SPE3 reservoir problem by considering C1
injection. The SPE3 model was augmented in this case to have one injector and two
producers. The two producers are set at a constant gas production rate of 4,500 Mscf/d.
The gas injection rate is varied to achieve the maximum net present value NPV. The
objective function is:
NPV = FOPT×80 + FGPT×4 - FGIT×6. (3.1)
FOPT: Field Oil Production Total (STB)
FGPT: Field Gas Production Total (Mscf)

25
FGIT: Field Gas Injection Total (Mscf).
In this calculation, the discount factor was taken to be zero. 80 is the oil price ($/STB), 4
is the produced gas price ($/Mscf), and 6 is the cost for injecting gas ($/Mscf).
The optimization algorithms used was gradient-based. This is likely to be the most
suitable kind of algorithm for producers to use in optimizing field problems involving
gas-condensate reservoirs. For the compositional problem of gas-condensate in a large
and complex reservoir, gradient-based algorithms are preferred because of the
computational cost of the simulation runs (function evaluations). The difficulty with a
gradient-based algorithm is to calculate gradients of the objective function with respect to
the control parameters. This requires either access to the source code or a simulator that
has the gradient based optimization capabilities built-in. In the study, we used the
commercial compositional simulator ECLIPSE 300.
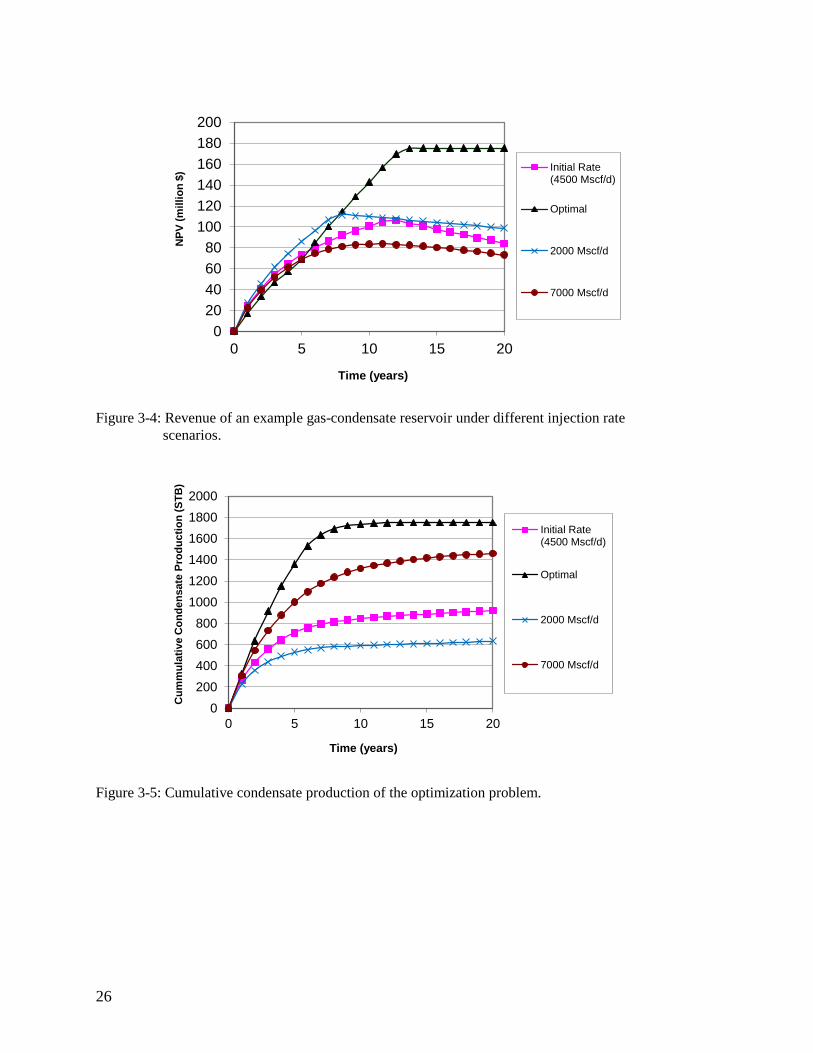
Figure 3-3 shows the result found to be optimal in terms of NPV for this example
problem. Figures 3-4 to 3-6 show the monetary outcome as well as the liquid and gas
production as a function of time. In this example case, the optimal result is not the one
with maximum sustained injection rate or even the maximum cumulative injection
(Figure 3-7). It is evident that injecting C1 changes the thermodynamic properties of the
fluid system, increasing the liquid yield as shown in the liquid/gas ratio in Figure 3-8.
This emphasizes the results of the research, namely that the change of composition during
production (and injection) influences the optimal strategy.
0
2000
4000
6000
8000
10000
12000
0 5 10 15 20
Gas I
nje
cti
on
Rate
(M
scf/
d)
Time (years)
Initial Rate (4500Mscf/d)
Optimal
2000 Mscf/d
7000 Mscf/d
Figure 3-3: Gas injection rate of the optimization problem.
26
0
20
40
60
80
100
120
140
160
180
200
0 5 10 15 20
NP
V (
mil
lio
n $
)
Time (years)
Initial Rate(4500 Mscf/d)
Optimal
2000 Mscf/d
7000 Mscf/d
Figure 3-4: Revenue of an example gas-condensate reservoir under different injection rate
scenarios.
0
200
400
600
800
1000
1200
1400
1600
1800
2000
0 5 10 15 20
Cu
mm
ula
tive C
on
de
nsate
Pro
du
cti
on
(S
TB
)
Time (years)
Initial Rate(4500 Mscf/d)
Optimal
2000 Mscf/d
7000 Mscf/d
Figure 3-5: Cumulative condensate production of the optimization problem.

27
0
10
20
30
40
50
60
70
0 5 10 15 20
Cu
mm
ula
tive G
as P
rod
ucti
on
(B
CF
)
Time (years)
Initial Rate(4500 Mscf/d)
Optimal
2000 Mscf/d
7000 Mscf/d
Figure 3-6: Cumulative gas production of the optimization problem.
0
10
20
30
40
50
60
0 5 10 15 20
Cu
mm
ula
tive G
as I
nje
cti
on
(B
CF
)
Time (years)
Initial Rate(4500 Mscf/d)
Optimal
2000 Mscf/d
7000 Mscf/d
Figure 3-7: Cumulative gas injection of the optimization problem.

28
0
20
40
60
80
100
120
0 5 10 15 20
Co
nd
en
sate
Pro
du
cti
on
(S
TB
/MM
CF
)
Time (years)
Initial Rate(4500 Mscf/d)
Optimal
2000 Mscf/d
7000 Mscf/d
Figure 3-8: Condensate to gas production ratio of the optimization problem.
These results are specific to the (hypothetical) reservoir simulated in the problem, and
therefore are not necessarily general. Nonetheless, the optimization illustrated here can
be applied to actual reservoirs by replicating this approach, but using the simulation
model of the reservoir under investigation. The model results shown here for
demonstration indicate the validity of the concept of taking advantage of the knowledge
of the composition change during production, by implementing a production/injection
strategy that adjusts the resulting fluid compositions in the reservoir to minimize the
impact of condensate dropout.

29
4. Conclusion
The main conclusions of this study are:
Repeatability of the experiments was achieved, demonstrating the validity of the
results.
Due to the relative permeability and the consequent difference in mobilities of gas
and condensate phase, the local composition will change hence the phase
envelope of the mixture will shift from a gas-condensate to a volatile oil. This
shift was evident in both the experiments and the simulation results, as the
thermodynamic behavior followed a different phase envelope during production
than that of the original fluid.
Condensate banking still occurs in the presence of immobile water. Water did not
have any measurable effect on the compositional variation of the gas condensate
in the experiments done here.
Shutting a well to remove the condensate banking may not be a useful strategy as
the condensate may not be able to revaporize due to the shift of the phase
envelope.
Condensate banking can be reduced by minimizing the pressure drop below the
dew point, either by producing the well slowly or by applying partial pressure
maintenance using gas injection.
The performance of a gas condensate well can be improved by using a proper
production strategy. The procedures by which this improvement can be achieved
were determined in this work, and would take the form of an optimization
algorithm applied to the numerical reservoir model of the field under
consideration.


31
References
Afidick, D., Kaczorowski, N.J., and Bette, S., 1994, “Production Performance of a
Retrograde Gas Reservoir: A Case Study of the Arun Field”, Presentation at SPE
Asia Pacific Oil and Gas Conference, Melbourne, Australia, SPE 28749.
Barnum, R.S., Brinkman, F.P., Richardson, T.W., and Spillette, A.G., 1995, “Gas
Condensate Reservoir Behavior: Productivity and Recovery Reduction Due to
Condensation”, Presentation at SPE Annual Technical Conference and
Exhibition, Dallas, USA, SPE 30767.
Kenyon, D. E., Behie, G. A., 1987, “Third SPE Comparative Solution Project: Gas
Cycling of Retrograde Condensate Reservoirs”. Journal of Petroleum Technology,
August 1987.
Shi, Chunmei, 2009, “Flow Behaviors of Gas Condensate Wells”, Ph.D. Dissertation,
Stanford University, California.