COMPOSITION AND STABILITY OF PHYTOCHEMICALS DURING …
83
COMPOSITION AND STABILITY OF PHYTOCHEMICALS DURING FOOD PROCESSING A Thesis Submitted to the Graduate Faculty of the North Dakota State University of Agriculture and Applied Science By Etsehiwot Yohannes Gebreselassie In Partial Fulfillment of the Requirements for the Degree of MASTER OF SCIENCE Major Program: Cereal Science December 2014 Fargo, North Dakota
Transcript of COMPOSITION AND STABILITY OF PHYTOCHEMICALS DURING …

COMPOSITION AND STABILITY OF PHYTOCHEMICALS DURING FOOD
PROCESSING
A Thesis
Submitted to the Graduate Faculty
of the
North Dakota State University
of Agriculture and Applied Science
By
Etsehiwot Yohannes Gebreselassie
In Partial Fulfillment of the Requirements
for the Degree of
MASTER OF SCIENCE
Major Program:
Cereal Science
December 2014
Fargo, North Dakota

North Dakota State University
Graduate School
Title
COMPOSITION AND STABILITY OF PHYTOCHEMICALS DURING
FOOD PROCESSING
By
ETSEHIWOT YOHANNES GEBRESELASSIE
The Supervisory Committee certifies that this disquisition complies with North Dakota State
University’s regulations and meets the accepted standards for the degree of
MASTER OF SCIENCE
SUPERVISORY COMMITTEE:
Clifford Hall
Chair
Julie Garden-Robinson
Senay Simsek
Paul Schwarz
Approved:
02/06/2015 Frank Manthey
Date Department Chair

iii
ABSTRACT
Dietary phytochemicals are thought to reduce the incidence of chronic degenerative
diseases. The concentration of these phytochemicals has been extensively studied, but less is
known about their stability during food processing. The objective of this study was to determine
the stability of lignans and other phytochemicals during the vinification and brewing processes.
The amount of secoisolariciresinol diglucoside (SDG), gallic acid, caffeic acid, coumaric acid,
chlorogenic acid, and ferulic acid increased up to 45 % during the vinification process; however,
the amount of folic acid remained unchanged. SDG content was determined in barley for the first
time. The SDG content also varied among barley varieties and showed a year-to-year variation.
In addition, no SDG was detected during the mashing, lautering, boiling, and fermentation steps
of the brewing process. Overall, processing techniques used in this study caused various effects
on the stability of phytochemicals.
iv
ACKNOWLEDGMENTS
First, I want to thank my advisor, Dr. Clifford Hall, for giving me the opportunity to
pursue my master’s in the Cereal Science program. I am grateful for his patience and valuable
guidance throughout this project. I would also like to thank my committee members‒Dr. Senay
Simsek, Dr. Paul Schwarz, and Dr. Julie Garden‒for their helpful feedbacks, as well as for
providing me with materials and allowing me to use their facilities for my project. In addition, I
would like to thank Dr. Jae Ohm, for his time and support with statistical analysis.
I am also grateful for the staff members of the Cereal Science Department, including
Mary Niehaus, James Gillespie, and John Barr. Thank you for your time, insightful feedbacks,
and for always being ready to help. Plus, my time at NDSU was made enjoyable due to the
Cereal Science graduate students and would like to take this time to thank them for the emotional
and educational support.
Lastly, I would like to express sincere appreciation to my parents, Yemisrach Afework
and Yohannes Gebreselassie, for their unconditional love and encouragement throughout my
undergraduate and graduate studies. I would also like to thank my two brothers, Sami and Biruk,
for their presence and kindness. And final thanks to my cousin, Melhik, for being patient, loving,
forgiving, and most of all for being present through the good and bad times.

v
TABLE OF CONTENTS
ABSTRACT ................................................................................................................................... iii
ACKNOWLEDGMENTS ............................................................................................................. iv
LIST OF TABLES ......................................................................................................................... ix
LIST OF FIGURES ........................................................................................................................ x
LIST OF APPENDIX TABLES .................................................................................................... xi
LIST OF APPENDIX FIGURES.................................................................................................. xii
1. INTRODUCTION ...................................................................................................................... 1
2. LITERATURE REVIEW ........................................................................................................... 3
2.1. Introduction to flaxseed ....................................................................................................... 3
2.2. History on flaxseed .............................................................................................................. 3
2.3. Flaxseed composition........................................................................................................... 4
2.3.1. Major chemical constituents ......................................................................................... 4
2.3.1.1. Lipid ....................................................................................................................... 4
2.3.1.2. Carbohydrate .......................................................................................................... 5
2.3.1.3. Protein .................................................................................................................... 5
2.3.2. Minor chemical constituents ......................................................................................... 6
2.3.2.1. Phenols in flaxseed ................................................................................................ 6
2.3.2.1.1. Phenolic acids. ................................................................................................ 6
2.3.2.1.2. Flavonoids. ...................................................................................................... 7
2.3.2.2. Lignans in flaxseed ................................................................................................ 7
2.3.2.3. Sources of lignans .................................................................................................. 8
2.3.2.4. Lignans in mammals .............................................................................................. 9

vi
2.3.2.5. Biological activity of lignans ............................................................................... 10
2.3.2.6. Lignan incorporation in foods .............................................................................. 11
2.3.2.7. Lignan extraction ................................................................................................. 12
2.3.2.8. Lignan analysis .................................................................................................... 13
2.3.2.8.1. HPLC analysis. ............................................................................................. 14
2.3.2.8.2. LC-MS analysis.. .......................................................................................... 14
2.3.2.8.3. Other analysis techniques. ............................................................................ 15
2.3.2.9. Stability of lignan during food processing ........................................................... 15
2.3.3. Other phytochemicals in flaxseed and their health implications ................................ 17
2.3.3.1. Folates .................................................................................................................. 17
2.3.3.2. Phenolics .............................................................................................................. 18
2.4. Overview of food processing ............................................................................................. 18
2.4.1. Food processing effect on foods ................................................................................. 19
2.4.1.1. Size reduction....................................................................................................... 19
2.4.1.2. Mixing .................................................................................................................. 20
2.4.1.3. Heat processing .................................................................................................... 20
2.4.1.4. Pasteurization ....................................................................................................... 21
2.4.1.5. Sterilization .......................................................................................................... 21
2.4.1.6. Fermentation ........................................................................................................ 22
2.4.1.6.1. Commonly fermented beverages .................................................................. 22
3. HYPOTHESIS .......................................................................................................................... 26
4. JUSTIFICATION AND OBJECTIVES ................................................................................... 27
5. MATERIALS AND METHODS .............................................................................................. 28

vii
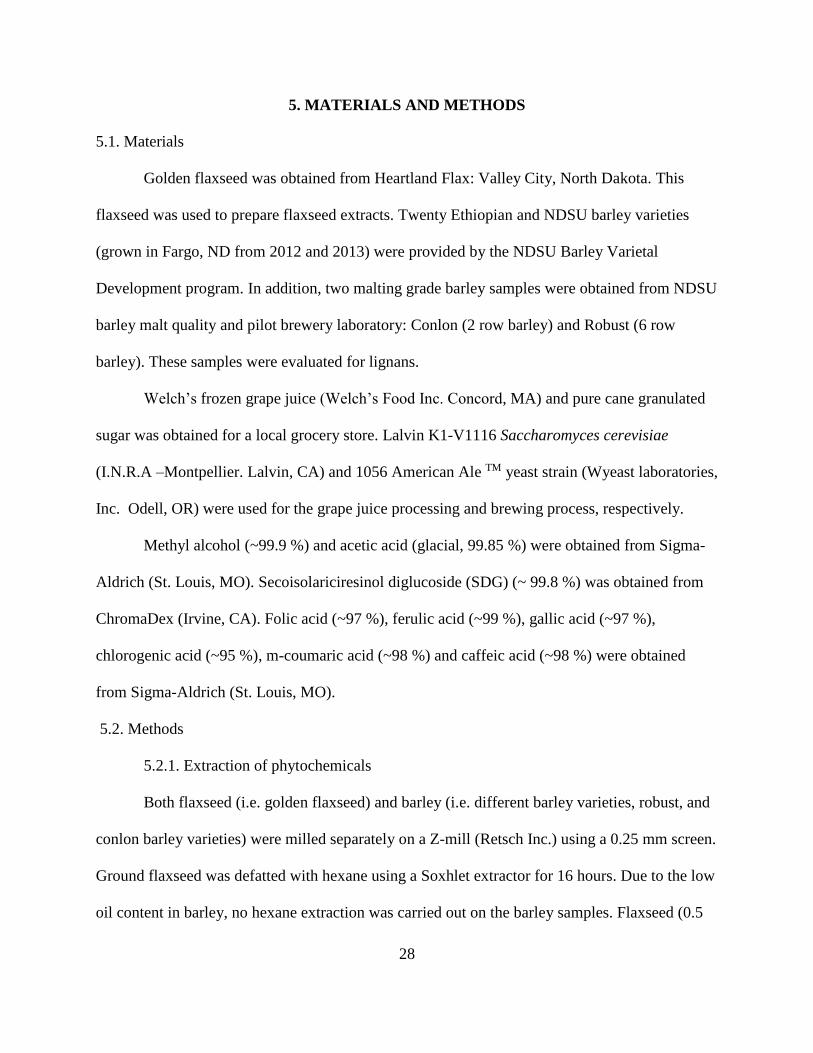
5.1. Materials ............................................................................................................................ 28
5.2. Methods.............................................................................................................................. 28
5.2.1. Extraction of phytochemicals ..................................................................................... 28
5.2.2. Analysis of phytochemicals ........................................................................................ 30
5.2.2.1. HPLC analysis ..................................................................................................... 30
5.2.2.2. HPLC/TOF-MS analysis ...................................................................................... 30
5.2.3. Grape juice processing (vinification) .......................................................................... 31
5.2.4. Malting process ........................................................................................................... 34
5.2.4.1. Steeping step ........................................................................................................ 34
5.2.4.2. Germination step .................................................................................................. 36
5.2.4.2.1. Germinative energy. ...................................................................................... 36
5.2.4.3. Kilning step .......................................................................................................... 36
5.2.5. Brewing process .......................................................................................................... 37
5.2.5.1. Cleaning, grinding, and ingredients ..................................................................... 37
5.2.5.2. Mashing................................................................................................................ 37
5.2.5.3. Lautering .............................................................................................................. 38
5.2.5.4. Wort boiling ......................................................................................................... 38
5.2.5.5. Fermentation ........................................................................................................ 38
5.2.6. Statistical analysis ....................................................................................................... 39
5.2.6.1. Randomized Complete Block Design (RCBD) ................................................... 39
6. RESULTS AND DISCUSSION ............................................................................................... 40
6.1. Stability of phytochemicals during vinification process .................................................... 40
6.1.1. Effect of vinification on lignans (SDG) ...................................................................... 40

viii
6.1.2. Effect of vinification on other phytochemicals ........................................................... 41
6.2. Discussion on phytochemicals during food processing ..................................................... 44
6.2.1. Structural changes of polyphenols .............................................................................. 44
6.2.2. Oxidative browning effect on phytochemicals ........................................................... 44
6.2.3. Folates ......................................................................................................................... 45
6.2.4. Enzymes role during food processing ......................................................................... 46
6.3. Stability of phytochemicals during malting and brewing process ..................................... 49
6.3.1. SDG analysis in different barley (raw) varieties......................................................... 49
6.3.2. Analysis of food and brewing barley varieties for SDG content ................................ 51
6.3.3. Effect of malting on SDG content .............................................................................. 51
6.3.4. Analysis of malted food and brewing barley varieties for lignan (SDG) content ...... 53
6.3.5. Difference between raw and malted barley ................................................................ 53
6.3.6. Effect of brewing on SDG .......................................................................................... 54
6.4. Discussion on composition and stability of SDG during food processing ........................ 55
6.4.1. Composition of SDG in barley varieties ..................................................................... 55
6.4.2. Stability of SDG during malting and brewing ............................................................ 57
7. CONCLUSION ......................................................................................................................... 58
8. FUTURE WORK ...................................................................................................................... 59
9. LITERATURE CITED ............................................................................................................. 60
APPENDIX A. STATISTICAL ANALYSIS OF PHYTOCHEMICALS DURING THE
VINIFICATION, MALTING AND BREWING PROCESS ....................................................... 70
APPENDIX B. HPLC AND LC-MS CHROMATOGRAPHS OF PHYTOCHEMICALS ......... 71

ix
LIST OF TABLES
Table Page
1. Lignan (SECO) content (µg/100g dw) of selected plant foods .......................................... 9
2. Lignan (SECO) content (µg/100g) of selected fermented foods and beverages .............. 16
3. The twenty barley varieties and their steeping hours ........................................................ 35
4. Two barley varieties (i.e. Robust and Conlon) used for studying the effect of
brewing on the SDG content ............................................................................................. 36
5. Secoisolariciresinol diglucoside (SDG) level (µg/ml) during the vinification
process............................................................................................................................... 41
6. pH values at each step of the vinification process ............................................................ 43
7. Secoisolariciresinol diglucoside (SDG) content (µg/g) in twenty barley varieties
grown in Fargo, ND .......................................................................................................... 50
8. Mean values of SDG content (µg/g) of raw barley varieties from year 2012 and
2013................................................................................................................................... 51
9. The SDG content (µg/g) in twenty barley varieties after malting .................................... 52
10. Mean SDG content (µg/g) of barley varieties after malting ............................................. 53
11. Secoisolariciresinol diglucoside (SDG) content (µg/g) in raw and malted barley
varieties from 2012 and 2013. .......................................................................................... 54
12. SDG levels (µg/g) of brewing ingredients. ....................................................................... 54
13. SDG levels (µg/g) during the brewing process. ................................................................ 55

x
LIST OF FIGURES
Figure Page
1. Example of three commonly known plant lignan structures (Adapted from Muir
and Westcott 2003). ............................................................................................................ 8
2. Example of two commonly known mammalian lignan structures (Adapted from
Muir and Westcott 2003). ................................................................................................. 10
3. Lignans competing with estradiol to bind with estrogen receptors (Adapted from
Mathern 2005). .................................................................................................................. 11
4. Flow chart of the phytochemical extraction, analysis, and vinification process .............. 33
5. Gallic acid (a), caffeic acid (b), coumaric acid (c), ferulic acid (d), chlorogenic
acid (e), and folic acid (f) level (µg/ml) during the vinification process. Means
with the same letter are not significantly different at p < 0.05; n= 3. ............................... 42

xi
LIST OF APPENDIX TABLES
Table Page
A.1. ANOVA of the phytochemicals content during the vinification process. ........................ 70
A.2. ANOVA of SDG in 12 raw barley varieties. .................................................................... 70
A.3. ANOVA of SDG in 6 malted barley varieties. ................................................................. 70
A.4. ANOVA of SDG content in raw vs. malted barley. ......................................................... 70

xii
LIST OF APPENDIX FIGURES
Figure Page
B.1. HPLC chromatograph of phytochemicals during the vinification process. ...................... 71
B.2. LC-MS chromatograph of barley extract with detectible SDG ........................................ 71
B.3. LC-MS chromatograph of barley extract with non-detectible SDG. ................................ 71

1
1. INTRODUCTION
The consumption of foods that are rich in phytochemicals may reduce the incidence of
birth defects, chronic degenerative diseases, including cancer, cardiovascular, and
neurodegenerative diseases (Blancquaert et al 2010; Liu 2013). Foods that contain these
phytochemicals include whole-grain cereals (e.g. wheat and barley), oilseeds (e.g. sesame and
flaxseed), legumes, fruits, and vegetables (Milder et al 2005). For instance, the health benefits
associated with flaxseed consumption have been recognized for centuries (Klimaszewski 2000).
Flaxseed, an ancient dicotyledonous crop, contains functional ingredients that promote
health (Liu 2013). One such ingredient is lignan, a di-phenolic compound with a 2, 3-
dibenzylbutane skeleton structure (Madhusudhan et al 2000; Setchell et al 1980). Flaxseed is by
far the richest known source of the lignan secoisolariciresinol (SECO), which can also exist in
the form of secoisolariciresinol diglucoside (SDG) after glycosylation (i.e. the attachment of two
glucose molecules on SECO) (Ford et al 2001). In the intestinal tract, these plant lignans are
converted to mammalian lignans, making them biologically active, and the increased intake of
these lignans has been correlated with reduced hormone-associated cancers (Wang 2002).
Apart from lignans, flaxseed contains other bioactive compounds, including vitamins
(e.g. folates) and phenolic acids (e.g. ferulic acid, gallic acid, m-coumaric acid, caffeic acid, and
chlorogenic acid) (Liu 2013). Similarly, these compounds are believed to reduce the incidence of
chronic diseases. The incorporation of folate in the diet, for example, lowers the risk of neural
tube birth defects (NTDs), cardiovascular diseases, and megaloblastic anemia (Blancquaert et al
2010). Due to its potential as a functional food, flaxseed has been incorporated into baked goods,
including breads and pastas for its lignan, as well as for other essential nutrients (Durazzo et al
2013; Muir and Westcott 2000).

2
To ensure the inclusion of such phytochemicals in our diet, the affect of food processing
on bioavailability of bioactive compounds is essential. For instance, the milling of spices and
nuts enhances the loss of volatile compounds due to the temperature increase during milling
(Fellows 2000). The amount of vitamin C decreased, by 78 %, after slicing (size-reduction)
cucumbers (Erdman and Erdman 1982). In addition, the blanching process can inactivate
enzymes and reduce the amount of ascorbic acid (Fellows 2000). Pasteurization, a relatively mild
process, is responsible for the reduction of serum proteins and vitamins (Fellows 2000). During
sterilization, 10-20 % loss of amino acids in canned meat has been observed. Extrusion process
also reduces (up to 50 %) the amount of ascorbic acid and β-carotene in cereals (Harper 1979).
Microbes, used during fermentation processes, also are known to change the composition of
proteins, fats, and carbohydrates (Dworschak 1982).
Many studies have been conducted on the concentration of bioactive compounds;
however, little is known about their stability during food processing. Researchers also have
analyzed the lignan stability during the production of bakery and dairy products (Liukkonen et al
2003; Hyvarinen et al 2006a, b). However, studies remain scarce on other processing techniques,
including malting, milling, vinification, and brewing. In this study, the stability of SDG and
other phytochemicals will be determined during fermentation and aging processes. In addition,
the effect of variety, malting, and brewing on SDG content were investigated.

3
2. LITERATURE REVIEW
2.1. Introduction to flaxseed
Flax (Linum usitatissimum L.) is an ancient plant grown for its seed to produce oil and
meal, as well as for its stem to produce fiber (Berglund and Zollinger 2007). Flax oil is very
susceptible to oxidation, making it desirable for industrial purposes, including paints, varnishes,
and printing inks (Daun et al 2003; Ehrensing 2008). For thousands of years, flaxseed has been
consumed by humans, but ever since the industrial revolution, flax oil has been predominantly
used for industrial purposes (Daun et al 2003). However, flax oil is considered healthy and is
often sold in health food stores. The ground flax meal, on the other hand, is used for animal feed
and also added to bakery products to enhance nutrition. Furthermore, the flax fiber is used to
make fine linen cloth and paper (Oplinger et al 1989).
Canada is the largest producer and exporter of flaxseed, accounting for 40 % of the
world’s production. In the United States, the four major states that produce flaxseed include
North Dakota (95.1 %), South Dakota (2.1 %), Montana (2.0 %) and Minnesota (0.8 %) (NASS
2013). Although flaxseed, currently, is used for the production of flaxseed oil, paint, and textile
fiber, its use for animal feed and human consumption is growing (Laurence and Mike 2014)
2.2. History on flaxseed
The consumption of flaxseed dates back to 5000 BC. Historians have documented the use
of flaxseed as medicinal ingredients. For example, Egyptians used to carry flaxseeds in their bag
for medicinal purposes (Klimaszewski 2000). In addition, Egyptians used the stem of the plant to
make linen cloth for wrapping mummies (Klimaszewski 2000; Anonymous 2007). In the 8th
Century, King Charlemagne of France mandated the consumption of flaxseed after recognizing
the health benefits associated with it (Anonymous 2007). Hippocrates, the father of modern

4
medicine, also recognized the use of flaxseed as a laxative and poultice (Anonymous 2007). The
US National Cancer Institute has recognized flaxseed as a potential food ingredient for providing
basic nutrition and protection from cancer and coronary heart disease (Carter 1993). Health
benefits associated with flaxseed consumption have been well acknowledged for centuries, and
many ongoing studies are being conducted to further identify its health benefits (Muir and
Westcott 2003).
2.3. Flaxseed composition
2.3.1. Major chemical constituents
The health benefits of flaxseed relate to the seed composition. Flaxseed is primarily
composed of lipids (40 %), dietary fiber (30 %), protein (20 %), and ash (4 %), which are located
separately in different parts of the seed (Daun et al 2003). The composition can also vary
depending on the variety of the flaxseed and growing environment (Daun et al 2003).
2.3.1.1. Lipid
Flaxseed structure is composed of cotyledon (55 %), seed coat and hull (36 %), and
embryo (4 %). The cotyledon is the major storage tissue for oil (Daun et al 2003). The lipid
constituent or oil mainly exists in triacylglyceride (98 %), phospholipids (0.9 %), and free fatty
acid (0.1 %) forms (Daun et al 2003). In oilseeds, the oil that is extracted via non-polar lipid
solvent (e.g. hexane) is a neutral lipid (e.g. triacylglyceride) (Daun et al 2003). On the other
hand, the lipids that are not extracted through non-polar solvents are polar lipids; to extract these
lipids, polar solvents or mixtures of solvents (e.g. chloroform and methanol) must be used. The
seed is also recognized for its high content of α-linolenic acid (ALA), which makes up more than
50 % of the total fatty acid composition of the lipid (Oomah 2003). In addition, the following
fatty acids are found in moderate amounts: palmitic (~ 5 %), stearic (~ 3 %), oleic (~ 18 %), and

5
linoleic (~ 14 %). According to Eckey (1954), the high degree of unsaturation in oils is positively
related to ALA content, and negatively associated with the saturated fatty acids (palmitic and
stearic) and unsaturated fatty acids (i.e. oleic and linoleic).
2.3.1.2. Carbohydrate
In flaxseed, digestible carbohydrates (e.g. simple sugars and starch) are present in small
amounts (Daun et al 2003). The majority (28 % of dry flaxseed weight) of these consists of non-
digestible carbohydrates (i.e. dietary fiber), which are not broken down by human digestive
enzymes (Daun et al 2003). Flaxseed is also rich in soluble (e.g. gums and pectin) and insoluble
(e.g. cellulose and lignin) dietary fibers (Rubilar et al 2010). The application of various
extraction methods and chemical analysis affects the ratio of these two dietary fibers (soluble:
insoluble), which can vary from 20:80 (%) to 40:60 (%) (Daun et al 2003). The hull or more
specifically the outer most layer contains the soluble fiber, also referred to as mucilage (Mazza
and Biliaderis 1989). Approximately 8 % of flaxseed weight is mucilage, and its content depends
on cultivar and extraction methods (Oomah et al 1995; Cui et al 1996). From the food industry
perspective, mucilage can be used as a food gum due to its thickening and emulsifying
properties. From the health perspective, mucilage is associated with lowering cholesterol content
in the blood stream (Daun et al 2003).
2.3.1.3. Protein
Flaxseed contains approximately 23 % crude protein (i.e. nitrogen both from protein and
non-protein sources) or 20 % true protein (i.e. nitrogen only from protein sources) (Daun et al
2003). Flaxseed also contains two major proteins, namely globulin (80 %) and albumin (20 %),
but the quality of the total protein depends on the adequate presence of three essential limiting
amino acids; the first being lysine, then methionine and cysteine (Bhatty 1995; Sammour 1999).

6
In flaxseed, like other oilseeds, inverse association between oil and protein content has been
reported (Daun et al 2003).
2.3.2. Minor chemical constituents
2.3.2.1. Phenols in flaxseed
Apart from the major constituents, flaxseeds contain phenolic compounds (phenols) that
are involved in the plant’s reproduction, growth, and defense mechanism against diseases (Dai
and Mumper 2010). Common phenols found in flaxseed consist of a hydroxyl group (one or
more) attached directly to an aromatic ring (one or more). Phenols protect plants against
parasites and pathogens, and are also responsible for the pigmentation of fruits and vegetables
(e.g. apples and beets). Identified phenols in flaxseed include phenolic acids (e.g. p-coumaric,
ferulic and caffeic acid) and flavonoids (Oomah et al 1995).
2.3.2.1.1. Phenolic Acids
Flaxseed contains approximately 8-10 g/kg total phenolic acids. The seed also contains
both esterified (5 g/ kg) and etherified phenolic acids (3-5 g/kg). Phenolic acids are derivatives of
benzoic and cinnamic acid (Oomah et al 1995). In plants, they are products of secondary
metabolism and categorized into phenolic acids, flavonoids, stilbenes, coumarins, and tannins
(Liu 2004). In our diet, phenolic acids account for up to one-third of the phenolics and the
remaining, two-third, comes from flavonoids (Liu 2004). Phenolic acids are grouped into two
groups, namely, hydroxybenzoic acid (e.g. p-hydroxybenzoic and gallic) and hydroxycinnamic
acid (e.g. p-coumaric, caffeic, chlorogenic, and ferulic acids) derivatives. In foods, the
hydroxybenzoic acids are not found in their free form; instead, they are found in complexes with
other plant components, such as lignin, hydrolyzable tannins, fiber, sugar, and proteins (Liu
2004). Similarly, the hydroxycinnamic acids are found in the bound form or linked with

7
cellulose, lignin, and proteins via ester bonds (Liu 2004). During food processing, some bound
phenolic acids become free. For instance, bound ferulic acid becomes free after thermal
processing, pasteurization, fermentation, and freezing (Dewanto et al 2002).
2.3.2.1.2. Flavonoids
Another common phenol in flaxseed includes flavonoid, a polyphenol made up of C6-C3-
C6 skeleton with two aromatic rings attached via three-carbon bridge (Oomah et al 1996). Some
examples of flavonoids include anthocyanins, flavanols, flavones, flavanones, and flavonols.
Flaxseed contains approximately 0.3-0.71 g/kg total flavonoids and this amount can vary
depending on environmental conditions (e.g. cultivar) (Oomah et al 1996). Furthermore,
flavonoids in flaxseed exist in the form of glucosides, including herbacetin 3, 8-O-
diglucopyranoside, herbacetin 3, 7-O-dimethyl ether, and kaempferol 3, and 7-O-
diglucopyranoside (Qiu et al 1999). In addition, some of these glucosides (e.g. herbacetin
diglucoside-HDG) can be found linked to lignan macromolecule through 3-hydroxy-3-
methylglutaric acid (HMGA) (Struijus et al 2007).
2.3.2.2. Lignans in flaxseed
Other than the common phenols, flaxseed contains a di-phenolic compound with a 2, 3-
dibenzylbutane skeleton structure called lignans (Madhusudhan et al 2000; Setchell et al 1980).
Lignans (Figure 1) are composed of two coniferyl alcohol residues that are found in the plant cell
wall (Jenab et al 1999; Muir and Westcott, 2003). Different types of lignans exist, but
secoisolariciresinol (SECO) is one type of lignan that is present in large quantities. Other types
of lignans found in small quantity, include matairesinol, lariciresinol, 7-hydroxymatairesinol,
shonanin (3, 4-divanillyltetrahydrofuran) and pinoresinol diglucoside (Heinonen et al 2001;
Liggins et al 2000). The major lignan, SECO, can also exist as secoisolariciresinol diglucoside

8
(SDG) after the attachment of two glucose molecules on SECO via glycosylation (Ford et al
2001).
Matairesinol (Secoisolariciresinol diglucoside) SDG (Secoisolariciresinol) SECO
Figure 1. Example of three commonly known plant lignan structures (Adapted from Muir and
Westcott 2003).
In flaxseed, SDG is concentrated in the seed coat and accounts for 0.74 1.9 % of the
seed weight (Muir 2006; Oomah and Sitter 2009). In flaxseed, SDG is not found in its free form;
instead it exists as a macromolecule. This macromolecule or lignan complex contains oligomers
of SDG residues connected with 3-hydroxy-3-methylglutaric acid (HMGA). Five SDG residues
(with an average molecular mass of 4000) have been identified in the lignan complex (Kamal-
Eldin et al 2001). In addition to SDG, coumaric acid glucoside (CouAG) and ferulic acid
glucoside (FeAG), along with HMGA, have been identified (Ford et al 2001; Johnsson et al
2002). To obtain free SDG, solvent treatment with basic ethanol or methanol is used.
Furthermore, free SDG can further be metabolized, via acid hydrolysis, into secoisolariciresinol
(SECO), where the two glucose molecules are removed (Toure and Xueming 2010).
2.3.2.3. Sources of lignans
Plants that contain lignan include whole-grain cereals, such as wheat, oats and barley;
oilseeds, such as sesame seed, sunflower seed, and flaxseed; legumes, such as beans, lentils, and
soybeans; fruits, such as strawberry, kiwi, and apricot; and vegetables, such as broccoli, carrots,

9
and garlic. Of these plants, oilseeds, particularly flaxseeds (Table 1), are by far the richest known
source of plant lignan (Milder et al 2005; Toure and Xueming 2010).
Table 1. Lignan (SECO) content (µg/100g dw) of selected plant foods.
Plant foods SECO (µg/100g) Source
Flaxseed 369900 Mazur et al (1996)
Barley 58 Mazur and Adlercreutz (1998)
Broccoli 414 Mazur and Adlercreutz (1998)
Wheat
Guava
8.1-868
700
Adlercreutz and Mazur (1998); Smeds et al (2007)
Mazur (1998)
2.3.2.4. Lignans in mammals
Bakke and Klosterman (1956) were the first to isolate and identify SDG from flaxseed;
however, no biological activity of the lignan (SDG) was reported. Approximately 20 years later,
researchers conducting a hormone study detected two unknown compounds in urine that had
great similarity to the structure of plant lignans. The unknowns were later identified as
enterolactone (ENL) and enterodiol (ED), collectively known as the mammalian lignans (Wang
2002). Setchell (1995) proposed that the origin of these mammalian lignans were due to bacteria
in the intestinal tract converting the plant lignans into mammalian lignans (Figure 2). First, the
gastrointestinal (GI) bacteria act upon SDG to release the carbohydrate free lignan, SECO (Toure
and Xueming 2010). With the help of colonic bacteria, SECO further undergoes dehydroxylation
and demethylation, resulting in the mammalian lignan‒ enterodiol (ED). The ED is oxidized via
GI microbial flora, forming enterolactone (ENL). In the past, the two plant lignans (matairesinol
and SDG) were thought to be the only plant precursors for the formation of the two mammalian

10
lignans, ED and EL. However, other lignans, including lariciresinol, 7-hydroxymatairesinol, and
pinoresinol diglucoside have been identified as precursors for the two mammalian lignans
(Heinonen et al 2001).
Enterolactone (ENL) Enterodiol (ED)
Figure 2. Example of two commonly known mammalian lignan structures (Adapted from Muir
and Westcott 2003).
2.3.2.5. Biological activity of lignans
The mammalian lignan, ENL, has been detected in the urine of humans, rats, baboons,
and vervet monkeys, where higher amounts being detected during luteal phase and early
pregnancy (Wang 2002). This varying amount at different stages has led researchers to associate
lignan with some biological role within the body. For instance, the stereo-chemical similarity
between lignans (phenyl ring) and estrogens has led scientists to suspect lignan as having some
estrogen-related activity (Wang 2002). Such plant-derived estrogens (i.e. phytoestrogens) as
lignan compete with estradiol (i.e. natural estrogen hormone) and bind to estrogen receptors
(Wang 2002; Figure 3). However, this binding is not as strong as the link between estradiol and
the estrogen receptors, which can give lignan either an estrogenic or anti-estrogenic role.
According to Dehennin et al (1982), the estrogenic role of ENL was disproved after treating
mouse uterine with synthetic ENL, which ended up showing no significant change on the weight

11
of the uterine. On the other hand, the natural estrogen hormone (i.e. estradiol) brought some
change to the weight of the uterine. Waters and Knowler (1982) concluded that an anti-
estrogenic activity was related to depressed RNA synthesis. Nesbitt and Thompson (1999)
conducted a study where they supplemented pre-menopausal women with breakfast meals
containing 5, 15, and 25 g ground flaxseed. They analyzed the urine of their patients and
observed a linear increase in mammalian lignans as the dose of flaxseed increased. Although
studies on humans have been completed, caution should be taken when consuming lignans or
flaxseeds during hormone-dependent periods, including pregnancy and lactation (Thompson
1998).
Figure 3. Lignans competing with estradiol to bind with estrogen receptors (Adapted from
Mathern 2005).
2.3.2.6. Lignan incorporation in foods
In the past two decades, the inclusion of flaxseed in the diet has increased world-wide
(Carraro et al 2012). Traditionally, ground and whole flaxseed has been added into baked goods,
including breads and pastas for lignan fortification, as well as for other essential nutrients
(Durazzo et al 2013; Muir and Westcott 2000). Although lignan-rich foods, such as flaxseed can
lower breast and colon cancer risk, the introduction of flaxseed into food products has limitations
(Carraro et al 2012). For instance, overtime, flaxseed can affect the flavor of the food. Flaxseed
is well known for its high lipid and ALA contents, which increases flaxseed’s susceptibility to

12
lipid oxidation (Oomah 2003). Another issue with the use of flaxseed is that it contains harmful
substances such as cyanogenic glycosides and cadmium. When cyanogenic glycosides comes in
contact with water, they release hydrogen cyanide, a toxic substance that can cause headaches,
tachycardia (increased heart beat), and disturbance to the central nervous system (Tarpila et al
2005). Cadmium, on the other hand, causes vomiting, diarrhea, kidney disease, fragile bones, and
it can be a possible cancer-causing agent (CDC 2009). To overcome possible limitations of
flaxseed, SDG from flaxseeds are being extracted and directly added into bakery products,
including breads and muffins, and dairy products, such as milk, cheese, yogurt, and whey drinks
(Hyvarinen et al 2006a, b).
2.3.2.7. Lignan extraction
A number of extraction methods have been developed. These methods have targeted the
removal of the lignan macromolecule or specific lignans. Solvent combination (e.g. ethanol:
dioxane) to remove hydroxymethyl glutaric acid (HMGA) from the SDG macromolecule of a
defatted flaxseed flour is one example (Klosterman and Smith 1954). Further treatment with
alkaline hydrolysis degrades the remaining macromolecule of the flaxseed flour, releasing SDG
(Klosterman et al 1955; Bakke and Klosterman 1956). In addition, the aglycone, i.e. SECO, can
be obtained either by enzyme or acid hydrolysis of SDG. For instance, Thompson et al (1991)
were able to hydrolyze the glycosidic bond through in vitro fermentation of gut bacteria. Mazur
et al (1996), on the other hand, utilized both enzyme and acid hydrolysis in a step-wise manner.
First and foremost, sample extracts are prepared using organic solvents. Then, the food extract is
treated with enzyme to remove glucose molecules (i.e. hydrolysis of the glycosidic bond from
SDG). This hydrolysis cannot be achieved with enzyme only; thus, the food extract is further
treated with hot acid to remove any remaining glycosidic bonds (Mazur et al 1996). Employing

13
similar methods, Liggins et al (2000) retrieved not only SDG, but also other type of lignan called
shonanin. The most common approach involves extraction of lignan macromolecule, first, using
methanol/water (70:30 v/v), followed by alkaline treatment (i.e. hydrolyzes HMGA) to release
the SDG free from the lignan macromolecule and acid to neutralize the previously added base
(Muir and Westcott 2000; Milder et al 2004).
Muir and Westcott (2000) quantified the SDG content of baked goods that contained
flaxseed or flax meal using high performance liquid chromatography (HPLC). They detected no
SDG in white and specialty breads (Muir and Westcott 2000). Only the flax-containing breads
contained SDG. These alkaline solvents released SDG from ester-linked lignan macromolecule.
In addition, Muir and Westcott (2000) reported the effect of particle size on the recovery of
SDG: finely ground flax bread facilitates the extraction of more SDG than the unground bread.
2.3.2.8. Lignan analysis
Once extracted, lignans are subjected to multiple separation and detection techniques,
including reversed-phase high performance liquid chromatography (RP-HPLC), gas
chromatography-mass spectrometry (GC-MS), and liquid chromatography-mass spectrometry
(LC-MS). For foods with high lignan concentration such as flaxseed, HPLC with ultraviolet
detection can be used (Milder et al 2004). HPLC-UV is less specific and sensitive than the other
techniques, making it hard to analyze foods with low lignan content. HPLC with coulometric
electrode array detection, on the other hand, is sensitive, but not specific enough. The GC-MS
technique, on the other hand, requires extracted compounds to undergo derivitization before
analysis, a technique that is time-consuming and complicated (Milder et al 2004; Wang 2002).
The high specificity, sensitivity, and the absence of derivitization has made LC-MS more
desirable than any of the previously mentioned techniques (Milder et al 2004).

14
2.3.2.8.1. HPLC analysis
The use of HPLC for analyzing SDG in flaxseed is a traditional approach developed by
Westcott and Muir (1996). They were the first to develop an HPLC technique that could rapidly
detect and quantify SDG in flaxseed and flaxseed meal. The following HPLC parameters were
used by Westcott and Muir (1996): Symmetry C18 column (5 µm, 250 mm × 4.6 mm), mobile
phase consisting of 1 % aqueous acetic acid (solvent A) and 100 % methanol (solvent B),
following gradient conditions that include: A/B (v/v): 0 min (95:5), 44 min (40:60), 48 min
(40:60), and 55min (95:5), and detection at 280 nm. Similarly, other phenolics, including p-
coumaric acid and ferulic acid can be quantified using similar parameters (Eliasson et al 2003).
2.3.2.8.2. LC-MS analysis
Detecting lignans in flaxseeds has also been carried out using LC-MS. For instance, the
following parameters were used by Popova et al (2009): A Zorbax Agilent Eclipse XDB-C18
Extend with a guard column (150 mm × 4.6 mm, 5 µm) with a temperature of 40 0C was used to
separate lignans. In addition, the mobile phase consisted of solvent A (0.05 mmol L-1 ammonium
acetate in water) and solvent B (0.05 mmol L-1 ammonium acetate in acetonitrile). The Gradient
was set up for 22 minutes and was applied as follows: 5 min, 10 % B, and 5 – 50 min, 95 % B.
The flow rate was 0.4 ml/min and the injection volume was 4-40 µL (Popova et al 2009). Popova
et al (2009) also used HPLC/MS/MS analysis for lignan quantification. An Agilent 1100 HPLC
coupled with API 3000 triple-quadrupole and an MS system with a turbo-ion spray was used.
The following parameters were optimized: temperature of ionization (4000C), and nebulizer gas
(air) flow rate (14 L/min). The same solvent system and gradient was used as described above.

15
2.3.2.8.3. Other analysis techniques
Multiple detection techniques have also been employed to analyze the mammalian
lignans in urine and plasma. The GC technique is less desirable as it requires derivitization
before analysis, making it tedious and complicated (Wang 2002). An alternative to this technique
was to couple the GC with ion mobility spectrometry (IMS). The IMS helps in the separation of
ions based upon their charge, mass, and collisional cross-sectional area. The ions are identified
based on the migration time or the time it takes the ions to reach a collector electrode (Wang
2002). Often, this GC-IMS technique requires chromatographic separation beforehand due to its
low-resolution power of detecting complex biological samples (e.g. urine and plasma).
Furthermore, an HPLC coupled with coulometric electrode array detection is more sensitive than
UV or diode array detection, but less sensitive than the GC-IMS. Unlike food lignan analysis, the
GC-IMS is a more preferred analytical technique for detecting mammalian lignans (Wang 2002).
2.3.2.9. Stability of lignan during food processing
The stability of SDG during the manufacturing process of baked goods has been studied.
For instance, Hyvarinen et al (2006a) investigated the stability of SDG (derived from flaxseed)
during baking of graham buns, rye breads and muffins. SDG remained stable during the baking
process at 225 oC for 15 minutes. No significant change in SDG content was observed even after
increasing both the baking temperature to 250 oC and the amount of time to 25 minutes. In the
same study, SDG was found to be stable when stored at room temperature for 1 week and at
freezing temperature for up to 2 months. Similar findings on SDG stability have been reported by
Muir and Westcott (2000). Liukkonen et al (2003) also found that SDG was very stable during
the fermentation and baking processes of sourdough rye bread production.

16
SDG stability in dairy products, such as milk, yogurt, cheese, and whey-based drinks also
been evaluated. The SDG was stable throughout the dairy processing of high-temperature
pasteurization, fermentation, and milk renneting (Hyvarinen et al 2006b). There was no
significant change in the SDG content during the heating and fermentation of the milk. In
addition, SDG stability was not affected by the addition of starter cultures (i.e. lactic acid
bacteria and bifidobacteria) during the process of yogurt fermentation (Hyvarinen et al 2006b;
Hall et al 2004). Similarly, the use of starter culture (i.e. lactic acid bacteria) and enzymes did
not affect the stability of SDG in cheese manufacturing (Hyvarinen et al 2006b). However, 25 %
of the added SDG was lost in the whey-based drinks when stored for 21 days at 4oC. This loss
was attributed to the low pH (3.0-4.1) of the whey drinks (Hyvarinen et al 2006b).
Thus far, most of the studies on lignan stability have been carried out on baked goods and
dairy products, and little is known about SDG stability during other food processing techniques.
Although Hyvarinen et al (2006b) analyzed the lignan stability in yogurt and cheese processing,
no further studies have been conducted on other processed products, including sauerkraut,
pickles, beer, and wine. However, Milder et al (2005) did evaluate the SECO content of these
products (Table 2). Based on this work, the main conclusion was that these foods were not good
sources of lignan. However, only SECO content was reported.
Table 2. Lignan (SECO) content (µg/100g) of selected fermented foods and beverages.
Fermented foods SECO (µg/100g or µg/100ml) Reference
Wheat Bread 15 Milder et al 2005
Beer (lager) 0-1.0 Milder et al 2005
Wine 5.2-61.3 Milder et al 2005
Grape Juice 10.8 Milder et al 2005

17
2.3.3. Other phytochemicals in flaxseed and their health implications
Although flaxseed is known for its lignan content, other phytochemicals, such as vitamins
(e.g. folic acid) and phenolic acids (e.g. ferulic acid, gallic acid, m-coumaric acid, caffeic acid,
and chlorogenic acid) exist in abundance (Liu 2013). In some cases, they are comparable to
levels found in fruits. Fruits, in general, have the highest phenolic content, of which wild
blueberries, blackberries, pomegranates, cranberries, and red grapes being the highest. These
bioactive compounds are believed to be beneficial to health, for instance, reducing the risk of
chronic diseases, such as cardiovascular disease and cancer. In the United States and other
industrialized countries, cancer and cardiovascular diseases are two leading causes of death (Liu
2013).
2.3.3.1. Folates
Folate, a water soluble vitamin, is naturally found in foods or synthesized (e.g. folic
acid). Both the natural folate and the synthetic form exist in the polyglutamate (long chain of
glutamate molecules) and monoglutamate (one glutamate molecule) form, respectively (Koontz
et al 2005). The structure of folate consists of pteroic acid and a side chain of conjugated
glutamic acid molecules (Rampersaud et al 2003).
Folate deficiency, a well-recognized worldwide health problem, is linked with increased
risk of cardiovascular diseases, megaloblastic anemia, and multiple birth defects, most notably
neural tube defects (NTDs) (Blancquaert et al 2010). Globally, folate deficiency is responsible
for approximately 300,000 to 400,000 children born with NTDs (spina bifida and anencephaly)
every year (Williams et al 2002). In the US, an estimated 2500 pregnancies are affected with
NTDs and in Europe, 4500 infants are born with this defect each year.

18
2.3.3.2. Phenolics
Phenolics, as mentioned earlier, are phytochemicals made up of one or more aromatic
rings with one or two hydroxyl groups attached. The plant phenols have biological effects, such
as antioxidant property (due to hydroxyl group on the structure), which is thought to have
protective effect against cardiovascular disease. They lower oxidative stress that is caused by the
saturation of highly reactive species in the body, including superoxide anion, hydrogen peroxide,
and hydroxyl radicals (Dai and Mumper 2010). Oxidative stress is responsible for chronic
degenerative diseases, such as heart disease, cancer, and aging. Phenolic compounds also inhibit
the oxidation of important cell components, such as DNA, enzymes, lipids, and proteins (Dai and
Mumper 2010). In an in vitro study, plant phenols prevented the oxidation of low-density
lipoproteins (LDL), which is important because oxidized LDL are involved in the development
of cardiovascular disease (Hollman 2001). Plant phenols have been recognized for their anti-
carcinogenic effect. They are thought to have an inhibitory role in all stages of cancer: initiation,
promotion, progression, and metastasis (Thompson 1998). The antioxidant behavior of phenols is
hypothesized to be related to their ability to scavenge free radicals and possibly the prevention of
cancer (Hollman 2001). Although health benefits of phenols have attracted the attention of
medical researchers, the phenolic compound must be present in food after processing to be
effective.
2.4. Overview of food processing
According to archaeological and ethnographic evidence, the hunter-gatherer societies
utilized the first food processing methods (Fellows 2000). They used open fire heat and boiling
water to prepare their meals, as well as increase palatability. Due to their nomadic life style, they
did not need to preserve their food; however, after the invention of agriculture, societies started

19
to store and preserve their food. By 3000-1500 BC, the Egyptians started using the sun to
dry/preserve fish and poultry, fermentation to produce alcohol, and cereal grinding to make
leavened bread (Fellows 2000). As societies progressed, they started specializing in different
food processing techniques, such as milling, baking, brewing, and cheese-making. Pastoral
societies in the Middle East, also, started adopting similar techniques to prevent famine, improve
their diet, and increase eating quality (Fellows 2000).
In those early days, the food processing techniques were simple craft skills that passed
from one generation to another, and little to no effort was done to understand the science behind
the processes (Fellows 2000). However, in the late 1700s, people with novel ideas started to be
recognized, which lead to further discoveries. For instance, Napoleon Bonaparte awarded
Nicholas Appert 12, 000 francs for discovering canning as a means to preserve foods for military
and naval forces. Also, multiple food processing technologies we use today are products of
World War I and World War II (Fellows 2000). Most food processing techniques, nowadays, are
still used to increase shelf life, as well as enhance sensory characteristics of foods. In addition to
the eating quality, current food industries aim to provide nutritional foods. Food products are
being enriched with vitamins, minerals, and prebiotic cultures, resulting in functional foods.
However, not all functional foods have been fully evaluated for retention of health promoting
compounds.
2.4.1. Food processing effect on foods
2.4.1.1. Size reduction
There are desirable outcomes to food processing. For instance, size reduction (via
milling) results in desirable textural and rheological properties, but can also result in unwanted
aroma and flavor in some foods (Fellows 2000). By milling, one can improve mixing and heat

20
transfer, but such processing can disrupt cells and increase surface area, which in turn facilitates
oxidative deterioration, and microbiological and enzymatic activities (Fellows 2000). For
instance, oxidation of carotenes in flour can affect the color as well as the nutritional value. In
some spices and nuts, increased temperature during milling can result in loss of volatile
compounds (Fellows 2000). Erdman and Erdman (1982) reported a 78 % loss of Vitamin C in a
sliced cucumber, which demonstrates an outcome of size reduction.
2.4.1.2. Mixing
Mixers, for blending foods or ingredients do not have any effect on nutritional value or
shelf life. Mixing produces desirable sensory and functional properties. For example, the
stretching and folding action during mixing results in gluten formation. Once formed, the strong
structure of gluten gives breads the desired texture (Fellows 2000).
2.4.1.3. Heat processing
Heating is a very common food processing technique that improves eating quality (e.g.
flavor). This technique is also used to preserve foods by inactivating enzymes and destroying
microbes, insects, and parasites (Fellows 2000). Heating allows some foods to be shelf stable
without refrigeration. Anti-nutrients such as trypsin inhibitors are destroyed by heating. It has
been documented that heating increases availability of nutrients (e.g. niacin) and protein
digestibility. On the other hand, heating can result in undesirable effects (e.g. flavor, color,
texture, nutrient loss) by destroying food components.
Blanching is a heating method (pre-treatment) used to inactivate enzymes and remove air
from foods (e.g. fruits and vegetables). This heat treatment has minimal effect on food quality as
it utilizes a lower temperature (less than 1000C) with a short time exposure. However, blanching

21
can result in the loss of some nutrients, including minerals and water-soluble vitamins (e.g.
ascorbic acid) (Fellows 2000).
2.4.1.4. Pasteurization
This technique involves mild heat treatment (less than 1000C) of foods. Pasteurization
can inactivate enzymes and destroy both pathogenic and spoilage microbes; thus, extending the
shelf life of foods, including bottled fruit and milk. This process is considered to have minimal
effect on sensory characteristics and nutritional value. In pasteurized fruit juices, loss of vitamin
C and carotene has been observed (Fellows 2000). In milk, loss of serum proteins and vitamin
has been reported.
2.4.1.5. Sterilization
Sterilization is a heating process that involves the exposure of foods to high temperature
for a longer time than blanching. This heating process is used to kill microorganisms and
inactivate enzymes, extending the shelf life of foods. Unlike blanching, sterilization has
detrimental effect on sensory characteristics and nutritional value of foods. For instance,
canning, which utilizes the sterilization process, can promote hydrolysis of carbohydrates,
proteins, and lipids. In canned meats, 10-20 % loss of amino acids has been observed (Fellows
2000). The loss of lysine increases with increasing heat treatment, maximum loss being 25 %.
Further losses of two amino acids, methionine and tryptophan, have been shown to decrease the
biological activity of protein up to 9 % (Fellows 2000). Vitamin loss also has been encountered
during canning, particularly losses of thiamin (50 to 75 %) and pantothenic acid (20 to 35 %)
have been reported. High loss of water-soluble vitamins such as ascorbic acid has also been
recorded (Fellows 2000). On the other hand, sterilizing soy-meat increases nutritional value by
inactivating trypsin inhibitors (Fellows 2000).

22
2.4.1.6. Fermentation
Fermentation is one of the oldest food processing techniques that has been practiced
worldwide for millennia (Fellows 2000). Today, this technique is used to produce breads,
alcoholic beverages, cheese, and other products. Unlike some food processing techniques, the
mild condition of fermentation do not have detrimental effect on sensory characteristics and
nutritional value (Fellows 2000). Mild changes such as protein and carbohydrate modification,
during fermentation, brings about texture (i.e. softens) change to the final fermented product. By-
products of fermentation (e.g. organic acids, ethanol) are also responsible for some flavor and
aroma changes. On the other hand, microbial growth during the fermentation process can affect
nutritive value (Fellows 2000). Microbes are able to alter the composition of proteins, fats, and
carbohydrates. Microbes can also bring about a loss of nutrients because they are also capable of
utilizing fatty acids, amino acids, sugars, and vitamins from foods (Fellows 2000). However,
according to Dworschak (1982), there are nutritive microbes that are able to secrete vitamins.
Microbes can also increase digestibility of proteins and polysaccharides by hydrolyzing
polymeric compounds (Dworschak 1982).
2.4.1.6.1. Commonly fermented beverages
Two of the oldest fermented beverages include wine and beer. Wine is produced by
fermenting grapes and other fruits. Beer, on the other hand, is commonly produced from barley
malt, but it also can be produced from different types of starchy plants, including maize (e.g.
South America), millet and sorghum (e.g. Africa), and rice (e.g. Far East) (FAO 2009).
Basic industrial brewing process comprises of mashing, boiling, and fermentation (FAO
2011). In the mashing step, hot water is used to extract soluble materials from grains (e.g. rice
and barley) and sweet liquid called wort is produced in large wood/stainless steel vessels. The

23
wort is boiled and hops can be added for palatability and antiseptic purposes (FAO 2011). Before
fermentation, wort must be cooled. Then, yeast is added into the wort and fermentation is carried
out in large vats or food-grade plastic bins. The fermentation process can take up to two weeks
depending on the storage temperature (FAO 2011).
Aside from beer production, use of barley for human consumption and the feed industry
is increasing (Andersson et al 1999). The end quality of a product can be affected by protein
content, lysine content, β-glucan, endosperm, and amylose contents of barley. Barley is
comprised of starch (600 g/kg), total dietary fiber (200 g/kg), and protein (110 g/kg). The dietary
fiber consists of β-glucan (30-70 g/kg) and arabinoxylans (40-70 g/kg), which are considered as
important constituents (Andersson et al 1999). Other minor constituents in barley include fat (30
g/kg), ash (20 g/kg), and low molecular weight sugars (40 g/kg) (Aman et al 1985).
The carbohydrates and proteins in barley have been exhaustively studied (Niemi et al
2012). For example, the extraction of proteins and carbohydrates from brewer’s spent grain
(BSG-a major by-product of brewing) has been studied for the past 10 years (Niemi et al 2012).
Complete removal of proteins and 50 % carbohydrate extraction from BSG has been achieved
via protease activity and enzyme treatment, respectively (Niemi et al 2012). However, there has
been a tremendous amount of work on barley phenolics, but very few on lignans. Smeds et al
(2007) found that wheat had the highest lignan (SECO) amount (868 µg/100 g), followed by
corn (125 µg/100 g), oat (90 µg/100 g), and barley (42 µg/100 g). Niemi et al (2012) determined
a total of lignan content (1300 µg/100 g) in BSG, which was comparable to un-malted barley
(Smeds et al 2007). Majority of these lignans were syringaresinol and secoisolariciresinol
(SECO).

24
Wine production, on the other hand, involves fermentation of fruit juice with the addition
of sugar and yeast (FAO 2011). First, fruit juice, yeast, and sugar are added into a fermentation
bin for approximately ten days. During this stage, the bin is kept closed to avoid microbial
contamination. After ten days, wine is filtered through a sterilized cloth and transferred into a
narrow-necked fermentation vessel. The vessel is fitted with an air lock and fermentation is
carried out at18 0C for approximately three weeks to three months (FAO 2011).
The source of phenolics in wine comes from the grapes or other fruits (e.g. blueberries)
used for wine making (Recamales 2006). The presence of these phenolics in wine have good
health benefits (i.e. free-radical scavenging and metal chelation), and contribute to the sensory
characteristics, including color, flavor, and astringency (Lee and Jaworsky 1987). Due to the
benefits associated with phenolics, studies have been conducted to access the stability of phenols
during food processing. For instance, storing and aging wine affects polyphenol compounds,
including anthocyanins, flavan-3-ol, and proanthocyanidins (Recamales 2006). These phenols
have the tendency to react with other compounds, such as glyoxylic acid, pyruvic acid, and
acetaldehyde, which results in pigment formation and ultimately wine color. Plus,
proanthocyanidins have been reported to disappear during the color formation (Bakker and
Timberlake 1997; Dallas et al 1996; Revilla et al 1999). Although similar studies have not been
carried out on lignans during vinification, various lignan types have been quantified in white and
red wines (e.g. secoisolariciresinol (7.6-61.3 µg/100 ml), matairesinol (2.7-7.8 µg/100 ml),
lariciresinol (4.6-16.1 µg/100 ml), and pinoresinol (1.7-11.9 µg/100 ml) (Milder et al 2005).
As discussed earlier, the effect of food processing on SDG has been extensively studied
in solid foods, including baked and dairy products, but little has been done on fermented
beverages. The changes that occur as a result from food processing can be beneficial or

25
degradative. Understanding how processing affects food component is essential if functional
foods are to be created. This thesis work addresses how processing affects lignan stability using
processing methods associated with fermentation, as well as the SDG profile in foods with low-
lignan content.

26
3. HYPOTHESIS
The fermentation process and the additives used during vinification, will not affect the
amount of SDG. It is also expected for the other phytochemicals to remain constant during the
mild process of fermentation. During aging/storage, both the amount of SDG and other
phytochemicals is expected to remain unchanged. In addition, a significant difference in SDG
content is expected among the barley varieties. An increase in SDG after the malting process is
also expected. Finally, the amount of SDG is expected to decrease during the high heat
treatments of the brewing process.

27
4. JUSTIFICATION AND OBJECTIVES
The incorporation of phytochemical-rich foods in our diet improves health (Blancquaert
et al 2010; Liu 2013). However, to ensure their availability before consumption, one must
understand the stability of these phytochemicals during processing treatments. Processing is
known to change sensory and nutritional quality of foods (Fellows 2000). In addition, processing
is known to affect the bioavailability of bioactive compounds (Fellows 2000). The effect of size-
reduction, blanching, pasteurization, and sterilization on vitamins, proteins, fats, carbohydrates,
and phytochemicals retention has been investigated in the past (Harper 1979; Dworschak 1982;
Erdman and Erdman 1982; Fellows 2000). However, more research is needed on other
processing methods, including malting, milling, vinification, and brewing. In this study, the
stability of lignans (SDG) and other phytochemicals was assessed in a fermented juice process.
The effect of malting and brewing on lignan (SDG) stability also was investigated. No data is
available on the amount of SDG in barley; thus, the third objective was to determine the SDG
content of different barley varieties.
28
5. MATERIALS AND METHODS
5.1. Materials
Golden flaxseed was obtained from Heartland Flax: Valley City, North Dakota. This
flaxseed was used to prepare flaxseed extracts. Twenty Ethiopian and NDSU barley varieties
(grown in Fargo, ND from 2012 and 2013) were provided by the NDSU Barley Varietal
Development program. In addition, two malting grade barley samples were obtained from NDSU
barley malt quality and pilot brewery laboratory: Conlon (2 row barley) and Robust (6 row
barley). These samples were evaluated for lignans.
Welch’s frozen grape juice (Welch’s Food Inc. Concord, MA) and pure cane granulated
sugar was obtained for a local grocery store. Lalvin K1-V1116 Saccharomyces cerevisiae
(I.N.R.A –Montpellier. Lalvin, CA) and 1056 American Ale TM yeast strain (Wyeast laboratories,
Inc. Odell, OR) were used for the grape juice processing and brewing process, respectively.
Methyl alcohol (~99.9 %) and acetic acid (glacial, 99.85 %) were obtained from Sigma-
Aldrich (St. Louis, MO). Secoisolariciresinol diglucoside (SDG) (~ 99.8 %) was obtained from
ChromaDex (Irvine, CA). Folic acid (~97 %), ferulic acid (~99 %), gallic acid (~97 %),
chlorogenic acid (~95 %), m-coumaric acid (~98 %) and caffeic acid (~98 %) were obtained
from Sigma-Aldrich (St. Louis, MO).
5.2. Methods
5.2.1. Extraction of phytochemicals
Both flaxseed (i.e. golden flaxseed) and barley (i.e. different barley varieties, robust, and
conlon barley varieties) were milled separately on a Z-mill (Retsch Inc.) using a 0.25 mm screen.
Ground flaxseed was defatted with hexane using a Soxhlet extractor for 16 hours. Due to the low
oil content in barley, no hexane extraction was carried out on the barley samples. Flaxseed (0.5

29
g) or barley (0.5 g) were placed into a screw-type test tubes (16 mm X 100 mm), followed by the
addition of 10 ml of 70 % aqueous methanol. Test tubes were securely capped and vortexed for
30 seconds. Samples were incubated in a water bath for three hours at 600C. The test tubes were
removed from the water bath every 15 minutes, and vortexed for 30 seconds during the one hour
incubation. After the one hour incubation, test tubes were removed from the water bath and
cooled using tap water. The test tubes were centrifuged (4100 rpm and 150C) for 20 minutes
using a benchtop centrifuge. After centrifugation, 2 ml of supernatant was transferred into a
clean screw cap test tube. The residue, after the centrifugation step, was discarded.
Into the test tube containing the 2 ml supernatant, 0.5 ml of 0.5 N sodium hydroxide was
added and vortexed for 15 seconds. A color change from pale to bright yellow was observed. The
sample was hydrolyzed for 3 hours at room temperature (22 0C). Afterwards, 0.5 ml of 0.5 N
acetic acid was added to neutralize the sample. The neutralized extract (3 ml) was vortexed for
15 seconds and a color change from bright to pale yellow was observed. The neutralized extracts
from the barley samples (i.e. barley extracts) were filtered through a 0.45 m micro-filter (nylon
acrodisc membrane) and transferred into HPLC vials. The neutralized extracts from the flaxseed
samples (i.e. Flaxseed Extract) were saved and the extraction process was carried out repeatedly
(30 times) until 90 ml of flaxseed extract was recovered for the grape juice fermentation study.
Since there was a total of three replications of the grape juice fermentation study, the extraction
process was carried out three times to produce a total of 270 ml. From the 90 ml FE obtained for
each replication, only 85 ml was added into the grape juice solution. The other 5ml was retained
as a control.

30
5.2.2. Analysis of phytochemicals
5.2.2.1. HPLC analysis
Lignans (SDG) and the other phytochemicals were analyzed using a Waters 2795 high
performance liquid chromatograph (HPLC) attached to a Waters 996 Photodiode Array Detector
(Mifford, MA). The HPLC was equipped with a LiChrosphere 100 RP- C18 column (5 µm, 250
mm × 4.5 mm). Column thermostat was set to 40 °C and injection volume was set to 10 µL. The
mobile phase consisted of 1 % acetic acid (solvent A) and 100 % methanol (solvent B). Gradient
conditions were as follows: A/B (v/v): 0 min (95:5), to 40:60 in 44 min, held 4 min, and back to
95:5 by 55 min. Lignans and the other phytochemicals were detected at 280 nm and peaks
integrated with Waters Millennium Workstation Software (version 4.0). The SDG and the
phytochemical peaks were confirmed and quantified by comparison with the appropriate
standards. Linear HPLC calibration curves for standard SDG and the other phytochemicals were
obtained for the concentrations of 0, 50, 500, 1000, and 2000 µg/ml (R value > 0.995). SDG was
expressed in ug (SDG amount) per g (starting sample grain) for the barley samples. For the
vinification and brewing process, the amount of phytochemicals (including SDG) were expressed
in mg (phenolic compound amount) per ml (sample solution).
5.2.2.2. HPLC/TOF-MS analysis
Lignan analysis in barley was performed using an Agilent 6540 UHD Accurate –Mass
Quadrupole Time-of-Flight mass spectrometer with AJS ESI source (Agilent Technologies,
Santa Clara, CA, USA). The Agilent was connected to a UHPLC instrument (Agilent 1290
infinity) via an Electro Spray Ionization (ESI) source with Jetstream technology. MassHunter
Quantification Analysis software was used to analyze chromatograms. Mass Spectra (ESI-MS)
was acquired in the positive mode using the protonation molecule [M-H]+. Nitrogen (N2) was

31
used as the nebulizing and sheathing gas. ESI parameters included capillary voltage (4.0 KJ),
flow rate (12 L/min), temperature (400 0C), nebulizer pressure (30 psi), fragmentor voltage (125
V), and mass analyzer scan range of (80 to 1100 (m/z). The UHPC conditions for the analysis
consisted of the following: an Agilent Eclipse plus C18 RRHD column (2.1 mm × 50 mm, 1.8
µm) was used at 40 0C. Purine (1.0 ml) and HP-092 (0.8 ml) were used as reference standards for
accurate mass reference. The mobile phase consisted of solvent A (0.1 % formic acid in high-
purity water) and solvent B (0.1 % acetic acid in acetonitrile). The Gradient was set up for 13
minutes and was applied as follows: 0-2 min, 0-5 % B, 2-10 min, 5-95 % B, 10-12.50 min, 95 %
B, 12.50-13 min, 95-10 % B. The flow rate was 0.4 ml/min and the injection volume was 10 µL.
The SDG peak was analyzed using a Mass Hunter Workstation software (version B.05.00). For
barley, standard solutions concentration range of 0, 0.01, 0.05, 0.5, and 1 mg/L were used to
quantify SDG (R value > 0.995). Since there was no significant matrix effect on SDG content,
the same calibration curve was used for raw and malted barley samples. In addition, the limit of
detection (LoD) and limit of quantitation (LoQ) for SDG in the barley samples was 0.005 mg/L
and 0.01 mg/L, respectively.
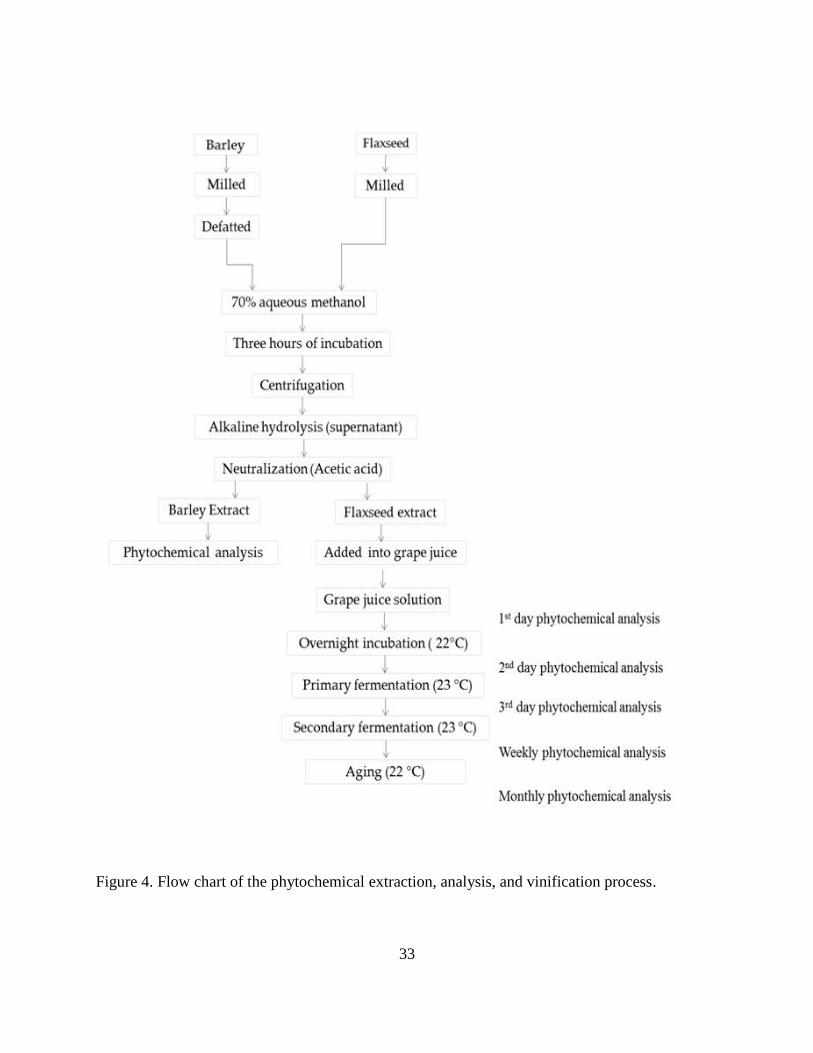
5.2.3. Grape juice processing (vinification)
The major steps carried out in the vinification process included primary fermentation,
secondary fermentation, and aging. The procedure used for this study was adapted from Horn
(1977). First, Welch’s grape concentrate (340 ml) was transferred into a primary fermenting
bucket and diluted to 3,785 ml (1 gallon). Into the grape solution, approximately 85 ml of the
flaxseed extract (FE) was added. The initial specific gravity of the fortified grape solution with
the FE was adjusted to 1.090 using granulated sugar (approximately 836 g). Then 0.3 g of
potassium bisulfite was added into the fortified grape solution. Five samples (~ 1.5 ml) were

32
transferred into HPLC vials and saved for phytochemical analysis. The fortified grape solution
was allowed to stand overnight in an incubator set at 220C. The following day, five samples (~
1.5 ml) were transferred into HPLC vials and saved (@ 40C) for phytochemical analysis. Into the
remaining fortified grape solution, 0.5 g of ammonium phosphate and 2.5 g of ammonium sulfate
was added and stirred to dissolve all additives. After adding all the additives, the primary
fermentation was carried out by sprinkling 0.5 g of yeast on top of the fortified grape solution.
The bucket was loosely covered with a piece of cloth and put into an incubator (230C) for three
days. On the third day, five samples (~ 1.5 ml) were transferred into HPLC vials and saved for
phytochemical analysis. Lower specific gravity was obtained (~ 1.050), which indicated
readiness for the secondary fermentation. After the end of primary fermentation, 200 ml of the
fortified grape solution was siphoned from the fermenting bucket into five secondary fermenters
(i.e. 250 ml Erlenmeyer flask). The fermenter was fitted with an airlock and was left in the
incubator (23 0C) until the fermentation ceased. This secondary fermentation took approximately
four weeks and every week, five samples (~ 1.5 ml) were transferred into HPLC vials and saved
for phytochemical analysis. Once the fermentation was completed, no CO2 bubble or belching
through the fermentation lock was observed. Finally, the wine was aged in a dark place for 3
months at 22 0C. Every month, five samples (~ 1.5 ml) were transferred into HPLC vials and
saved for phytochemical analysis (Figure 4). In addition, the pH of the grape solution was
obtained at each step of the vinification process.
33
Figure 4. Flow chart of the phytochemical extraction, analysis, and vinification process.

34
5.2.4. Malting process
Malt was prepared from two different barley samples: Different barley varieties (grown
in Fargo, ND from 2012 and 2013) and two malting grade barley: Conlon (2 row barley) and
Robust (6 row barley). From the twenty barley varieties, ten were varieties used for food
consumption, and the remaining ten were varieties used for brewing. For this study, the 20 barley
varieties were only malted and not used for brewing. In contrast, the two malting grade barley
varieties (i.e. Robust and Conlon) were used to prepare beer. Before malting, the steeping time
was determined for all barley samples to attain 44 % moisture.
5.2.4.1. Steeping step
Twenty barley varieties (50 g) were placed in a 100 × 25 mm plastic centrifuge tubes.
The centrifuge tubes had eight 3-mm holes to allow water flow. The test tubes were, then, placed
into steeping baskets and the steeping process was carried out at 16 0C and six minute aeration
with compressed air (Karababa et al 1993). The steep water was drained every 24 hour to allow
air-rest of samples for 2 hours. Time of steeping for the twenty barley samples are shown below
(Table 3). In addition, 300 g of robust and conlon barley samples were placed into different steep
tank baskets. Similar steeping conditions as described above were followed (Table 4). Once
steeped, barley samples were taken out of the steep tanks and spread over a paper towel for
moisture removal.

35
Table 3. The twenty barley varieties and their steeping hours.
Location Year Variety Barley
Type
Steeping
Time
Fargo 2012 Habesha Demoya-6R-W Food 44
Fargo 2012 RAWSON Brewing 50
Fargo 2012 Dimtu Food 48
Fargo 2012 HB-120 Brewing 55
Fargo 2012 DESTA Food 49
Fargo 2012 DIRBE Food 48
Fargo 2012 ARUSO Food 54
Fargo 2012 BEKA Brewing 58
Fargo 2012 Agegnehu (218950-08) Food 45
Fargo 2012 Estayish (218963-4) Food 43
Fargo 2012 Bekoji-1 Brewing 48
Fargo 2012 2ND27421 Brewing 50
Fargo 2012 Abechu Demoye-6R-W Food 39
Fargo 2012 2ND29835 Brewing 59
Fargo 2012 Netch gebs-6R-W-1 Food 44
Fargo 2012 ND26891 Brewing 52
Fargo 2012 Miscal-21 Brewing 54
Fargo 2012 HB-1307 Food 44
Fargo 2012 STELLAR-ND Brewing 51
Fargo 2012 PINNACLE Brewing 54
Fargo 2013 Agegnehu (218950-08) Food 37
Fargo 2013 ND26891 Brewing 60
Fargo 2013 2ND29835 Brewing 48
Fargo 2013 2ND27421 Brewing 53
Fargo 2013 Abechu Demoye-6R-W Food 34
Fargo 2013 RAWSON Brewing 35
Fargo 2013 DESTA Food 46
Fargo 2013 STELLAR-ND Brewing 41
Fargo 2013 Netch gebs-6R-W-1 Food 35
Fargo 2013 Estayish (218963-4) Food 37
Fargo 2013 BEKA Brewing 45
Fargo 2013 PINNACLE Brewing 44
Fargo 2013 HB-120 Brewing 38
Fargo 2013 ARUSO Food 46
Fargo 2013 Bekoji-1 Brewing 37
Fargo 2013 Habesha Demoya-6R-W Food 45
Fargo 2013 HB-1307 Food 44
Fargo 2013 Dimtu Food 40
Fargo 2013 Miscal-21 Brewing 41
Fargo 2013 DIRBE Food 44

36
Table 4. Two barley varieties (i.e. Robust and Conlon) used for studying the effect of brewing on
the SDG content.
Barley Varieties Barley Type Steeping Time (Hour)
Conlon Brewing 55.09
Robust Brewing 55.38
5.2.4.2. Germination step
5.2.4.2.1. Germinative Energy
Kernels (100) of each barley sample were transferred into two glass petri dishes (90 mm)
containing filter papers (Whatman no.1) for germinative energy determination. Once the kernels
were uniformly distributed within the petri dishes, 4 ml of distilled water was added and covered
with a lid. All closed petri dishes were packed in a polyethylene bag and placed in a dark cabinet
(20 0C). Sprouted kernels were removed from each petri dish after 24, 48, and 72 hours. Using
the formula below, germinative energy (GE) for each barley was calculated.
GE (%) = (Sum of sprouted kernels in the two petri dishes after 72 hours)
2
This step was only used to test the malting quality of the grain. For all barley samples, the GE
(%) was above 95 %.
Then, all the barley samples from the steeping step were transferred into 400 ml beaker
and placed into a germination cabinet. The germination was carried out for four days at 160C
with a relative humidity of 95 % (Karababa et al 1993).
5.2.4.3. Kilning step
All germinated barley samples were placed in kiln baskets and dried over a temperature
range of 49 to 85 0C for 24 hours (Karababa et al 1993). Once dried, the rootlets from the barley

37
samples were removed and malted barley was obtained. The malted samples (5 g) were saved for
lignan analysis.
5.2.5. Brewing process
Cream Ale (an American-styled brew) was used for this study. The brewing process was
carried out on the NDSU 4.0 L laboratory brewery (Figueroa et al 1987). The brewing process
included a cleaning, mashing, Lautering, boiling, and fermentation step. Samples were taken
from each step of the brewing process.
5.2.5.1. Cleaning, grinding, and ingredients
Before brewing, the pilot brewery lines, vessels, and kettle were cleaned with hot water.
In addition, the pilot brewery was cleaned with a Star San sanitizer (1 oz. /5 gallons of tap
water). The main ingredients for the brewing process included two types of malted barley,
namely conlon (two-row malt barley) and robust (six-row malt barley). Two adjuncts also were
used, including pre-gelatinized flaked corn and rahr two-row. All ingredients, except for the
flaked corn were ground using Buhler-Miag laboratory malt mill and saved for lignan analysis (~
5 g). In addition, the brewing process was carried out twice using different amounts of
ingredients. The first brewing process was comprised of four ingredients: conlon (2.3665 kg),
robust (0.9589 kg), flaked corn (0.9845 kg), and rahr two-row (0.4615 kg). The second brewing
process comprised conlon (0.9412 kg), robust (1.4378 kg), flaked corn (0.9841 kg), and rahr
two-row (0.9226 kg). These ingredients were subjected to mashing.
5.2.5.2. Mashing
All four ingredients from the first and second brewing process were added to 12 L of
warm (68 0C) water while stirring. After the addition of the malt, the temperature was lowered to
63 0C and the mashing was carried out for 45 minutes. Then, iodine drops were applied on
38
mashed samples every 10 minutes to check the conversion of starch into sugars. Once the
conversion was achieved (i.e. color change from yellow to amber), the sample was held in the
mash tank for an additional ten minutes at 75 0C. The total mash time was 94 minutes. Then,
mashed samples (~ 5 g) were saved for lignan analysis. The remaining mash was moved to a
lauter tun.
5.2.5.3. Lautering
After mashing, 8 L of 750C sparge water was transferred from a hot liquor tank into the
lauter tun containing the mash sample. After 15 minutes, the mash solution was recirculated to
separate the liquid portion from the solid. Once the liquid (wort) cleared, it was transferred into a
brew kettle. Approximately 27 L of wort was transferred into the brew kettle. Wort sample (2
ml) was saved for lignan analysis.
5.2.5.4. Wort boiling
The remaining wort (~ 27 L) was heated to boiling for 10 minutes and hops were added.
The boiling was carried out for additional 60 minutes and boiled wort was transferred into a
whirlpool. Hops (~31 g) were added for aroma and the whirlpool was allowed to cool for 10
minutes. Boiled wort (2 ml) was saved for lignan analysis and the remaining wort was moved to
the fermentation process.
5.2.5.5. Fermentation
Approximately, 20 L of wort was transferred into a carboy and carbonated with oxygen.
Then, yeast (Wyeast 1056 American Ale) was added and fermentation was carried out at 20 0C
for four weeks. Final beer samples (2ml) were saved for lignan analysis.

39
5.2.6. Statistical Analysis
Data were subjected to analysis of variance (ANOVA) to determine significant
differences among treatments (food processing times) using SAS Software (version 9.3, SAS
Institute Inc., Cary, NC). Differences were considered to be significant at p values ≤ 0.05. All
data were reported as means ± SD (standard deviation) on an as is basis.
5.2.6.1. Randomized Complete Block Design (RCBD)
A split-plot in time principle (repeated measure analysis) was applied to the wine and
beer preparation study, where successive analysis was made on the same experimental unit over
a period of time during the vinification and brewing process. The main plot being the
experimental unit (i.e. fermentation bucket containing the beverages) and the subplot being the
repeated measurements at different times (i.e. samples subjected to lignan and other
phytochemical analysis). However, RCBD design was implemented since the repeated measure
analysis requires at least two factors as opposed to one factor (i.e. one type of grape juice), which
was used in our study. Thus, for the RCBD analysis, the vinification process was replicated three
times and the brewing process was replicated two times. In addition, the different condition at
different time of the food processing step was considered as the treatment.
The RCBD design was also used for comparing the lignan (SDG) content of the twenty
barley varieties from the two years (2012 and 2013). Treatments included variety, barley type
(food or brewing), and malted barley. The two years were considered as two replications. In
addition, log transformation (LSDG) was carried out to minimize the wide variation of SDG
content in the barley samples.

40
6. RESULTS AND DISCUSSION
6.1. Stability of phytochemicals during vinification process
6.1.1. Effect of vinification on lignans (SDG)
The stability of SDG was determined after subjecting grape solution, containing FE,
through fermentation and aging (Table 5). Three replicates were carried out to determine the
SDG level, but only two replicates were used. The SDG levels in the third replicate had similar
increasing trend throughout the aging like the other two replicates, but the SDG content was very
high (results not shown) and was considered as an outlier. One explanation for this high SDG
level could be the amount of FE added at the initial step of the vinification process. Another
explanation could be due to the SDG extraction procedure, or more specifically during the
alkaline hydrolysis step. Depending on the hydrolysis time and degree of hydrolysis, the amounts
of SDG extracted can vary.
Significant differences were observed in the levels of SDG at different times of the
vinification process (Table 5). The FE-fortified grape solution during the first 10 days had a
constant SDG level. However, the amount of SDG increased by 16 % during the three
fermentation weeks (Table 5). The SDG content increased further during the last three months
of aging. Overall, the SDG level increased by 30 % during the vinification process (Table 5).

41
Table 5. Secoisolariciresinol diglucoside (SDG) level (µg/ml) during the vinification process.
Dates of sampling SDG level (µg/ml)-fermentation
Day 1 (grape juice solution + FE) 67.24 ± 0.001 a
Day 2 (overnight incubation) 67.46 ± 0.002 a
Day 3 (1st day of fermentation) 65.22 ± 0.003 a
Day 10 (1st week of fermentation) 66.50 ± 0.002 a
Day 17 (2nd week of fermentation) 76.50 ± 0.002 b
Day 24 (3rd week of fermentation) 75.88 ± 0.002 b
Day 31 (4th week of fermentation) 78.25 ± 0.002 b
Day 61 (1st month of aging) 83.98 ± 0.001 c
Day 91 (2nd month of aging) 87.73 ± 0.001 c
Day 121 (3rd month of aging) 87.41 ± 0.002 c
Means in a column with the same letter are not significantly different at p < 0.05; n= 2
Values are expressed as mean ± SD
6.1.2. Effect of vinification on other phytochemicals
The stability of other phytochemicals also was determined after subjecting grape solution,
containing FE, through fermentation and aging. Statistically, the processing condition had
significant effect on some of the phytochemicals (Table A.1). Gallic acid level remained
unchanged until after day 2, and then increased 26 % between days 3 and 10 (Figure 5a). The
gallic acid level, then, decreased by 25 % during days 17 and 61. By the end of the vinification
process (Day 121), the gallic acid level had increased by 45 % (Figure 5a). Similarly, the caffeic
acid level remained unchanged until the first week of fermentation (Day 10) (Figure 5b).

42
Figure 5. Gallic acid (a), caffeic acid (b), coumaric acid (c), ferulic acid (d), chlorogenic acid (e),
and folic acid (f) level (µg/ml) during the vinification process. Means with the same letter are not
significantly different at p < 0.05; n= 3.
a b
c d
e f

43
Although a clear trend was not obtained, about 24 % increase in caffeic acid was
observed after the second week of fermentation (Day 17) (Figure 5b).
The amount of coumaric acid remained unchanged until the first week of fermentation
(Day 10) of the vinification process (Figure 5c). However, coumaric level increased by 15 %
during days 17 and 31. Coumaric level continued to increase until the end of the aging process
(Day 121) (Figure 5c).
Ferulic acid remained unchanged until the third week of fermentation (Day 24), but
increased by 26 % afterwards (Figure 5d). Similarly, chlorogenic acid remained stable until day
2 and increased by 17 % afterwards (Figure 5e). The chlorogenic acid level was stable during
days 3 and 31, but increased by 23 % afterwards until the end of the aging process (Day 121)
(Figure 5e). In addition, the amount of folic acid remained stable throughout the vinification
process (Figure 5f).
The pH at different steps of the vinification process remained relatively stable (Table 6).
A slight increase in acidic pH, during the vinification process, was observed. This suggests that
FE did not affect the fermentation.
Table 6. pH values at each step of the vinification process.
Vinification steps pH
Grape juice solution 3.3
End of primary fermentation 3.1
End of secondary fermentation 3.1
End of Aging 3.1
44
6.2. Discussion on phytochemicals during food processing
6.2.1. Structural changes of polyphenols
Food processing and storage are thought to alter the chemical structure of soy
isoflavones, polyphenols that have similar chemical structure to lignans (Shimoni 2004). For
example, soy isoflavones mainly exist as glycosides (i.e. phenols with sugar molecules attached),
similar to lignans and studies have shown some change to these glycosides during food
processing (Shimoni 2004). For instance, Wang and Murphy (1994) determined high level of
glycosylated soy isoflavones in non-fermented foods and high level of aglycones (i.e. phenols
without sugar molecule) in fermented foods. In our study, however, the amount of SDG did not
decrease; it either increased or remained stable throughout the fermentation and aging process.
The other phytochemicals had similar stability and incremental increases during the vinification
process. An explanation for the increase could be due to the release of SDG and the other
phytochemicals from the FE. In other words, if the FE complex was not completely hydrolyzed
during the alkaline hydrolysis, the remaining phytochemicals might have been released during
the vinification process, due to hydrolysis of the FE complex during the fermentation and aging
steps.
6.2.2. Oxidative browning effect on phytochemicals
In wine, phenols, more specifically phenols with two hydroxyls attached (i.e. o-
diphenols), are more susceptible to oxidative browning. Both enzymatic as well as non-
enzymatic reactions are responsible for the browning reactions (Cheynier et al 2000). The
enzymatic browning occurs only in the grape must and the non-enzymatic reaction occurs both in
the grape must and in the wine (Cheynier et al 2000).

45
During grape processing, the intact cells of grape tissues get disrupted and phenols get
exposed to atmospheric oxygen and oxidoreductase enzymes, including peroxidase (POD) and
polyphenol oxidase (PPO). Once exposed, the phenols get oxidized and cause browning (Li et al
2008). The iron-containing enzyme (POD) has minimal effect on phenols, but if present with
PPO, it can degrade phenols (Li et al 2008). On the other hand, the copper-containing enzyme,
PPO, is known to oxidize phenols, more specifically, mono-phenols and o-diphenols. For
instance in grape must, PPO oxidizes caftaric acid and p-coumaric acid into a powerful oxidant
called caffeoyltartaric acid o-quinones (CTAQ), which are known to oxidize other compounds in
wine that bring about sensory changes (Robards et al 1999). First, mono-phenols get
hydroxylated into o-diphenols and diphenols, in the presence of PPO and oxygen. Further
oxidations of diphenols produce o-quinones that react with amino acids and hydroquinones,
resulting in brown pigments (Robards et al 1999). However, such enzymatic oxidation during red
wine processing is limited. Similarly, no degradation of phenols was observed in our study. In
addition, the relatively acidic pH (Table 6) during the vinification process had minimal effect on
phenols.
On the other hand, non-enzymatic browning occurs in the absence of PPO after the
fermentation of wines (Li et al 2008). Phenols can oxidize in the presence of air, high
temperatures, high pH, sunlight, and metal ions (Fe and Cu). O-diphenols (e.g. caffeic and gallic
acid) are, for instance, very susceptible to non-enzymatic oxidation (Li et al 2008). However, in
our study, no phenol degradation has been observed, suggesting the absence of oxidation.
6.2.3. Folates
Similar increases in food components, during food processing, have also been observed
in various studies (Katina et al 2007; Liukkonen et al 2003). For example, folates and phenolic

46
compounds increased during baking with rye. The yeast used during this sourdough fermentation
process was identified as the cause for the increase (Kariluoto et al 2004). The addition of yeast
(i.e. Saccharomyces cerevisiae) during the sourdough fermentation increased the folate level by
54%. In contrast, the amount of folates remained unchanged during similar sourdough
fermentation without yeast. Osseyi et al (2001) reported a 73 % increase in folate levels during
the production of wheat bread. The presence of yeast during the baking process was a major
factor for the increase in folate content. Seyoum and Selhub (1998) reported that baker’s yeast
was found to contain folates (>2000 µg/100g), which can explain the increased folate amount
during the baking process. Additional researchers have confirmed the increase in the folate level
in wheat breads, and that approximately 53–65 % of the folates come from the yeasts used
during the bread baking (Butterfield and Calloway 1972; Keagy et al 1975). In our study,
however, the amount of folates remained unchanged throughout the vinification process.
6.2.4. Enzymes role during food processing
The increase of SDG and other phenolics might be due to the release of phenols from
bound phenolics during fermentation. For instance, according to Abdel –Aal and Rabalski
(2013), the amount of free ferulic acids increased by 17 % and bound phenolics decreased by
36 % during the production of wholegrain breads. Similar increase in phenols has been reported
by Gelinas and McKinnon (2006) during the production of wholegrain breads. In the current
study, all phenolic acids and SDG increased during fermentation. This increase in phenolic acids
could be due to the release of bound phenols during the fermentation and aging process of wine.
Similar findings have also been reported by Budic-Leto and Lovric (2002) during the
fermentation and aging of white wines. They observed increased levels of phenolic acids, such as
vanillic, caffeic, p-coumaric, and ferulic acids. The increase likely resulted from the hydrolysis

47
of ester bound phenols like hydroxycinnamic acids (HCA) (e.g. caftaric, coutaric, fertaric) during
fermentation (Budic-Leto and Lovric 2002).
SDG is not found in its free form, but in complex with other SDG residues, coumaric acid
glucoside (CouAG), and ferulic acid glucoside (FeAG). The release of SDG and phenolics from
these complexes cannot fully explain the increase in SDG level (30 %) and other phytochemicals
(up to 45 %) during the vinification process. Another explanation for this apparent increase in
SDG could be due to the feruloyl esterases found in the wine yeast. Brewer’s yeast is known to
contain these esterases that can cleave ester bonds between plant cell wall polysaccharides and
phenolic acids (Benoit et al 2006). During the vinification process, any remaining bound-SDG
via ester linkage could have been cleaved by these enzymes, releasing free SDG as well as
phenolic acids.
Various researchers have documented the stability of SDG during the baking process and
storage (Hyvarinen et al 2006a; Muir and Westcott 2000; Liukkonen et al 2003). However,
according to a lignan stability study conducted on rye, the total amount of lignans increased by
two-fold and three-fold after germination and fermentation, respectively (Katina et al 2007).
These two food processing techniques comprise the hydration of grains at a certain condition to
activate both endogenous and added enzymes, which in turn can bring about changes, including
structure, bioactivity, flavor, stability, and digestibility. Liukkonen et al (2003) reported the
increase (2─3.5 folds) of folates and methanol-soluble phenolic acids (e.g. lignans) during a
germination period of 6 days at 15─25 0C. Katina et al (2007) stated that the increase during
germination and fermentation was due to the synthesis and action of hydrolytic enzymes, which
in turn can activate reactions and aid in the synthesis of new compounds. In addition, the outer
layer of rye kernel contains endogenous enzymes and indigenous microbes that can alter grain

48
composition when activated (Katina et al 2007; Loponen et al 2004). Thus, in our study, the
increase in most of the phenols, including SDG, gallic acid, caffeic acid, coumaric acid,
chlorogenic acid, and ferulic acid may have been due to yeast enzyme activity during the
vinification process.
The effect of enzymes on chemical compounds has been documented mostly in a solid
matrix, such as the rye kernel. Nogueira et al (2008) investigated the effect of alcoholic
fermentation (cider processing) on phenolic compounds. For instance, the amount of total
phenols remained unchanged in three cider apple varieties and decreased in two varieties of the
cider. An increase in caffeic acid and catechin content, regardless of the cider varieties also was
observed (Nogueira et al 2008). Apart from the enzyme effect, no clear explanation or
mechanism was proposed for the synthesis of these phenolic compounds. However, few
researchers have proposed possible explanation for the degradation of phenolic compounds
(Siebert et al 1996; Renard et al 2001; Guyot et al., 2003). For instance, the maceration step in
cider processing enhances the activity of polyphenol oxidase (PPO), which results in oxidation of
polyphenols (Nogueira et al 2008). In addition, the change in procyanidin during the production
of French ciders has been observed (Alonso-Salces et al 2004). Some of these reactive properties
included the binding of procyanidin with proteins and cell wall polysaccharides (Alonso-Salces
et al 2004). As a result, a major reduction in procyanidin has been reported during cider
processing (Alonso-Salces et al 2004). This scenario was not likely a reason for the increased
phenolic content obtained in our study, but provides a possible reason for increasing phenolic
compounds during food processing.

49
6.3. Stability of phytochemicals during malting and brewing process
6.3.1. SDG analysis in different barley (raw) varieties
The SDG analysis for the 20 barley varieties (grown in Fargo, ND from 2012 and 2013)
are presented on page 49 (Table 7). SDG content was determined in the barley varieties
(Appendix Figure B.2). Unlike the vinification process, the amount of SDG in these barley
varieties was very small, thus measured in µg/g.
The highest SDG content in the harvest year 2012 occurred in the food variety Dirbe
(25.79 µg/g) and the lowest occurred in another food variety Desta (0.01 µg/g) (Table 7). In the
harvest year 2013, Estayish (food variety) had the highest SDG level (13.04 µg/g) and HB-120
(brewing variety) had the lowest SDG level (0.10 µg/g) (Table 7). In contrast, six barley varieties
had non-detectible SDG content in the year 2012. In 2013, five barley varieties had non-
detectible concentration of SDG (Table 7; Appendix Figure B.3).
In addition, the year-to-year variation in SDG content was different among varieties. For
example, the SDG content in Rawson was 0.13 µg/g in 2012 and 2.37 µg/g in 2013. In contrast,
the SDG content in Aruso was higher (0.52 µg/g) in 2012 compared to 0.20 µg/g in 2013. This
year-to-year variation could be explained by the different growing conditions (e.g. climate and
soil type) in 2012 and 2013.

50
Table 7. Secoisolariciresinol diglucoside (SDG) content (µg/g) in twenty barley varieties grown
in Fargo, ND.
Variety (raw) Barley Type
SDG content (µg/g)
2012 2013
Habesha Demoya-6RW Food 0.15 nd
Rawson Food 0.13 2.37
Dimtu Food 0.17 nd
HB-120 Brewing 3.74 0.10
Desta Food 0.01 nd
Dirbe Food 25.79 nd
Aruso Food 0.52 0.20
Beka Brewing nd nd
Agegnehu (218950-08) Food 0.11 0.45
Estayish (218963-4) Food 0.08 13.04
Bekoji-1 Brewing nd 0.51
2ND27421 Brewing nd 0.46
Abechu Demoye-6RW Food nd 0.19
2ND29835 Brewing 0.12 3.94
Netch gebs-6R-W-1 Food 0.27 0.11
ND26891 Brewing 0.72 0.38
Miscal-21 Brewing 3.06 0.22
HB-1307 Food 0.10 4.38
Stellar-ND Brewing nd 0.27
Pinnacle Brewing nd 0.38
Note: (nd) none detected indicates that SDG concentration was lower than detection limit (0.005
mg/L).
Only 10 barley varieties had detectible SDG content in both 2012 and 2013 (Table 8).
From these varieties, Estayish (218963-4) and Netch gebs-6R-W-1, both food varieties,
contained the highest (6.56 ± 9.17 µg/g) and lowest (0.19 ± 0.11 µg/g) SDG concentrations,
respectively (Table 8). The two years (2012 and 2013) were considered as replications and

51
accounted for substantial variations in SDG concentrations. Due to this variation, no significant
differences between the 12 barley varieties were found (Appendix Table A.2). To minimize this
variation, the SDG value was transformed into logarithm and was subjected to statistical
analysis, but no significant differences were observed (data not shown).
6.3.2. Analysis of food and brewing barley varieties for SDG content
The amount of SDG was compared in the food and brewing barley varieties. The average
SDG content in the food barley (1.93 ± 2.73 µg/g) was higher than the brewing barley (1.48 ±
0.60 µg/g) (Table 8). However, the large standard deviation resulted in a CV of 41% for the
brewing varieties and 141 % for the food varieties.
Table 8. Mean values of SDG content (µg/g) of raw barley varieties from year 2012 and 2013.
Values are expressed as mean ± SD, n=2
6.3.3. Effect of malting on SDG content
The raw barley varieties discussed above were malted and the SDG level was determined
(Table 9). The highest SDG content in the harvest year 2012 occurred in the malted food variety-
Variety (raw) Barley Type SDG content ( µg/g )
Agegnehu Food 0.28 ± 0.24
Aruso Food 0.36 ± 0.23
Estayish (218963-4) Food 6.56 ± 9.17
Netch gebs-6R-W-1 Food 0.19 ± 0.11
HB-1307 Food 2.24 ± 3.03
Food barley Average 1.93 ± 2.73
Rawson Brewing 1.25 ± 10.13
ND26891 Brewing 0.55 ± 0.24
Miscal-21 Brewing 1.64 ± 2.01
HB-120 Brewing 1.92 ± 2.58
2ND29835 Brewing 2.03 ± 2.71
Brewing barley Average 1.48 ± 0.60

52
Habesha Demoya-6RW (6.50 µg/g) and the lowest occurred in the malted brewing variety-
Bekoji-1 (0.04 µg/g) (Table 9). In the harvest year 2013, HB-120 (brewing variety) had the
highest SDG level (16.02 µg/g) and pinnacle (brewing variety) had the lowest SDG level (0.02
µg/g) (Table 9). In contrast, 11 barley varieties had non-detectible SDG content in the year 2012.
In 2013, five barley varieties had non-detectible concentration of SDG.
Table 9. The SDG content (µg/g) in twenty barley varieties after malting.
Variety (raw) Barley Type
SDG content (µg/g)
2012 2013
Habesha Demoya-6RW Food 6.50 nd
Rawson Food 0.07 nd
Dimtu Food nd nd
HB-120 Brewing 0.60 16.02
Desta Food nd 0.28
Dirbe Food 1.34 0.32
Aruso Food nd 0.42
Beka Brewing 4.04 0.24
Agegnehu (218950-08) Food 0.26 0.41
Estayish (218963-4) Food nd nd
Bekoji-1 Brewing 0.04 nd
2ND27421 Brewing nd 0.66
Abechu Demoye-6RW Food nd 0.29
2ND29835 Brewing 0.10 0.40
Netch gebs-6R-W-1 Food nd 5.76
ND26891 Brewing nd 0.46
Miscal-21 Brewing nd 1.66
HB-1307 Food 0.35 0.55
Stellar-ND Brewing nd 2.98
Pinnacle Brewing nd 0.02
Note: (nd) none detected indicates that SDG concentration was lower than detection limit (0.005
mg/L).

53
Only 6 malted barley varieties had detectible SDG content in 2012 and 2013 (Table 10).
Statistically, there was no significant difference among the malted samples (Appendix Table
A.3). But, the SDG content varied widely in the malted barley samples. From these varieties,
HB-120 (brewing barley) and 2ND29835 (brewing barley) contained the highest (8.31 ± 10.90
µg/g) and the lowest (0.25 ± 0.21 µg/g) SDG level, respectively (Table 10).
6.3.4. Analysis of malted food and brewing barley varieties for lignan (SDG) content
The amount of SDG was compared in the food and brewing malted-barley varieties. The
average SDG content in the food barley (0.54 ± 0.26 µg/g) was lower than the brewing barley
(3.57 ± 4.22 µg/g) (Table 10). However, the large standard deviation resulted in a CV of 118%
for the brewing varieties and 48 % for the food varieties.
Table 10. Mean SDG content (µg/g) of barley varieties after malting.
Values are expressed as mean ± SD, n=2
6.3.5. Difference between raw and malted barley
The SDG content in the raw and malted barleys were compared (Table 11). Statistically,
no significant difference was observed between the raw and malted barley samples (Appendix
Table A.4). However, differences in the SDG content were observed. The average SDG content
Variety (malt) Barley Variety SDG level ( µg/g)
HB-1307 Food 0.45 ± 0.14
Dirbe Food 0.83 ± 0.72
Agegnehu (218950-08) Food 0.33 ± 0.10
Food barley average 0.54 ± 0.26
HB-120 Brewing 8.31 ± 10.90
Beka Brewing 2.14 ± 2.69
2ND29835 Brewing 0.25 ± 0.21
Brewing barley average 3.57 ± 4.22

54
of the raw barley varieties (2.08 ± 0.23 µg/g) was lower than the malted barley varieties (4.38 ±
5.56 µg/g). The CV for the raw and malted barley varieties are 11 % and 127 %, respectively.
The large % CV supports the non-significance between raw and malted barley samples.
Table 11. Secoisolariciresinol diglucoside (SDG) content (µg/g) in raw and malted barley
varieties from 2012 and 2013.
Values are expressed as mean ± SD, n=2
Note: (R) denotes raw barley and (M) denotes malted barley
6.3.6. Effect of brewing on SDG
The SDG content was determined for all the ingredients used in the brewing process
(Table 12). SDG was detected both in Robust and Conlon barley varieties. SDG was not detected
in the flaked corn and in Rahr two-row barley. The corn used for the brewing process was not
malted, so no data was obtained for the malt ingredient (Table 12). Rahr two-row barley was
already a malted ingredient, thus no data was obtained for the raw ingredient.
Table 12. SDG levels (µg/g) of brewing ingredients.
Note: (nd) none detected, (na) not available.
Barley variety SDG content (µg/g)
HB-120 (R) 1.92 ± 2.58
HB-1307 (R) 2.24 ± 3.03
Average 2.08 ± 0.23
HB-120 (M) 8.31 ± 10.90
HB-1307 (M) 0.45 ± 0.14
Average 4.38 ± 5.56
Brewing ingredients
SDG level (µg/g)
(RAW)
SDG level (µg/g)
(MALT)
Robust 0.09 0.07
Conlon 0.11 0.09
Flaked corn nd na
Rahr two-row na nd

55
Using these ingredients, two brewing processes were carried out to study the effect of
brewing (i.e. mashing, lautering, wort boiling, and fermentation) on SDG levels (Table 13).
During the mashing step, no SDG was detected in the solid portion (spent grain). Similarly,
during the lautering step, no SDG was detected in the liquid portion (wort). No SDG was
detected during the wort boiling and fermentation step of the brewing process (Table 13).
Table 13. SDG levels (µg/g) during the brewing process.
Note: (nd) none detected
6.4. Discussion on composition and stability of SDG during food processing
6.4.1. Composition of SDG in barley varieties
In this barley study, the aim was to investigate the effect of variety, malting, and brewing
on lignan (SDG) content. The SDG values showed high variability between replicates. However,
the values obtained from this study can be used as an indicative rather than a definitive result. No
barley SDG data has been reported in the past. Very few studies have been conducted on barley
lignans and if conducted, only lignan SECO (the aglycone) has been determined in barley and
some other foods (Milder et al 2005; Mazur et al 1996; Adlercreutz and Mazur 1997; Mazur
1998; Muir and Westcott 2000).
One explanation for the high % CV between the samples could be attributed to the barley
samples used for the study. The same barley varieties from two years (2012 and 2013) were
considered as two replicates, which may not have been sufficient. Another explanation for the
variability could be a difference in the growing condition /environment of the barley varieties in
those two years. Environmental factors affect on the phenolic content in plants is well
Brewing process Mashing Lautering Wort boiling Fermentation
1st rep nd nd nd nd
2nd rep nd nd nd nd
56
documented (Ali and Abbas 2003). In addition, the statistical analysis did not show significant
differences among barley varieties, but the amount of SDG varied greatly in the ten barley
varieties analyzed (Table 8). Studies have also shown the influence of variety on phenolic
compounds (Maillard et al 1996; Holtekjolen et al 2006).
In this study, the SDG content in barley was very small. Compared to oil seeds, cereals
have very low lignan (SECO) content, which supports the low values obtained from this study.
According to Smeds et al (2007), the SECO content for the following cereals is as follows: rye
(462 µg/100 g), wheat (868 µg/100 g), corn (125 µg/100 g), and barley (42 µg/100 g). Unlike
flaxseed, barley is saturated with carbohydrates (78─83 %) that can affect the extraction of
phenols from the food matrix. One explanation for the low lignan content, in our study, could be
due to the extraction procedure. In addition, known amount of SDG was spiked into raw and
malted barley samples; the SDG amount remained unchanged, indicating no matrix effect. No
methods were available for extracting SDG from cereals; thus, the same extraction procedure
used for flaxseed was used to extract SDG from the barley samples (method section in this
paper). On the other hand, many methods were available for extracting the aglycone form of the
lignan (SECO) and other phenolics (Smeds et al 2007; Milder et al 2004; Milder et al 2005). For
extracting the aglycone (SECO), acid (hot hydrochloric acid) or enzyme (β-glucosidase)
hydrolysis must be carried out after organic solvent extraction and alkaline hydrolysis,
respectively (Milder et al 2004; Liggins et al 2000). However, the main target in this study was
to analyze the SDG content, and it was possible to determine the SDG content in barley using the
extraction method of Westcott and Muir (1996). To my knowledge, no data is available on SDG
content in barley, thus this study can be used as a stepping stone for future studies.

57
6.4.2. Stability of SDG during malting and brewing
Other than variety, processing affects the content of polyphenols in barley (Goupy et al
1999). For instance, malted barleys had lower polyphenol content than their corresponding raw
barleys (Goupy et al 1999). However, in this study, the amount of SDG in the raw barley was
lower than the malted barley (Table 14). Similarly, Katina et al (2007) reported an increase in
lignan content by two-fold during the germination of wholemeal rye. In their study, the
processing condition was similar to an industrial malting of barley. In contrast, the fermentation
of the germinated wholemeal rye did not affect the lignan content, but increased the content of
phenols nearly 11 fold (Katina et al 2007). This increase was attributed to the starter culture
(Saccharomyces cerevisiae) used during the fermentation process (Katina et al 2007). Although
the exact mechanism is not clearly known, enzymes from microbes and outer layers of the cereal
enhance hydrolytic enzyme activities, which are thought to alter grain composition (Katina et al
2007; Loponen et al 2004). Some of these enzymes include amylases, xylanases, and proteases.
In addition, fermentation aids in the breakdown of cell walls, resulting in the liberation or
synthesis of functional compounds (Katina et al 2007).
During the brewing process, no SDG content was observed. The mashing step, a
relatively mild process, which involves the soaking of malt barley in hot water (68-75 0C) cannot
explain the disappearance of SDG. During the SDG analysis, representative sample may not
have been taken from the mash tun, which could explain the SDG absence during that step. SDG
was not detected in the solid and liquid portion of the mashed sample. In addition, it is hard to
obtain representative sample from big experimental units (i.e. mashing tun, lauter tun, brewing
kettle, and carboy). For the remaining steps of the brewing process, similar absence of SDG was
obtained. To obtain definitive results, the brewing process must be done in a smaller scale.

58
7. CONCLUSION
The hypothesis of this research was that the phytochemicals remain constant during the
vinification process. Therefore, we reject the hypothesis because a 30 % increase in SDG during
the vinification process was observed. Similarly, the concentration of the other phenolic
compounds (i.e. gallic acid, chlorogenic acid, coumaric acid, caffeic acid, and ferulic acid)
increased. However, folic acid remained unchanged during the vinification process. In addition,
SDG content was, for the first time, determined in barley. Statistically, no significant differences
were obtained among barley varieties; however, variations in SDG content among barley
varieties were observed, specifically the year-to-year variation. As hypothesized, the SDG
content was affected by the mashing, lautering, boiling, and fermentation treatments of the
brewing process. Overall, the processing conditions used in our study brought changes to the
composition of phytochemicals.

59
8. FUTURE WORK
Although the results obtained in this study have demonstrated the stability of lignans and
other phytochemicals during vinification, an in-depth study is required with the microbes used
during the fermentation process. From this study it is not possible to predict exactly what caused
the phytochemical content to increase. This increase could be attributed to the Saccharomyces
cerevisiae used during the process, but to verify that, other microbes used during food and
beverage fermentation should be tested. It is also important to test the synergistic effect of two or
more microbes on phytochemicals.
Furthermore, extraction methods for foods with low lignan content must be improved. In
this study, an extraction method used for flaxseed-SDG was used to obtain SDG from barley.
However, cereal grains have a different food matrix than oilseeds; thus, the amount of SDG
might be underestimated. Therefore, it is recommended to develop a specific extraction method
for SDG in barley.
Finally, the experimental design used for the barley varieties should be improved. The
use of years (2012 and 2013) as replications introduced large variability to the SDG values in the
barley cultivars. To minimize such variability, it is recommended to compare SDG levels in
barley cultivars grown in the same year and environment. Using more replicates can also
strengthen the experimental design and produce definitive results.

60
9. LITERATURE CITED
Abdel-Aal, E., and Rabalski, I. 2013. Effect of baking on free and bound phenolic acids in
wholegrain bakery products. Journal of Cereal Science. 57: 312-318.
Ali, R.M., and Abbas, H.M. 2003. Response of salt stressed barley seedlings to phenylurea. Plant
Soil Environment. 49: 158-162.
Adlercreutz, H., and Mazur, W. 1997. Phytoestrogens and Western diseases. Annals of
Medicine. 29: 95-120.
Alonso-Salces, R. M., Barranco, A., Abad, B., Berrueta, L. A., Gallo. B., and Vicente, F. 2004.
polyphenolic profiles of basque cider apple cultivars and their technological properties.
Journal of Agricultural and Food Chemistry. 52: 2938-2952.
Aman, P., Hesselman, K., and Tilly, A.C. 1985. The variation in chemical composition of
Swedish barleys. Journal of Cereal Science. 3: 73-77.
Andersson, A.A., Elfverson, C., Andersson, R., Regner, S., and Aman, P. 1999. Chemical and
physical characteristics of different barley samples. Journal of the Science of Food and
Agriculture. 79: 979-986.
Anonymous. 2007. NDSU agriculture flax page: timeline of flax history.
http://www.ag.ndsu.edu/agnic/flax/flax%20timeline/flax%20timeline.htm. Accessed on
January 27, 2014.
Bakke, J.E., and Klosterman, H.J. 1956. A new diglucoside from flaxseed. North Dakota
Academy Science Proceedings. 10: 18-22.
Bakker, J., and Timberlake, C. F. 1997. Isolation, identification and characterization of new
color-stable anthocyanins occurring in some red wine. Journal of Agricultural and Food
Chemistry. 45: 35-43.
Benoit, I., Navarro, D., Marnet, N., Rakotomanomana, N., Lesage-Meessen, L., Sigoillot, J.C.,
Asther, M., and Asther, M. 2006. Feruloyl esterases as a tool for the release of phenolic
compounds from agro-industrial by-products. Carbohydrate Research. 341: 1820-1827.
Berglund, D., and Zollinger, R. 2007. Flax production in North Dakota. Extension publication A-
1038 (Revised). North Dakota State University Extension.
http://www.ag.ndsu.edu/pubs/plantsci/crops/a1038.pdf. Accessed on January 15, 2014
Bhatty, R.S. 1995. Nutrient content of whole flaxseed and flaxseed meal, in flaxseed and human
Nutrition, 1st edition., edited by S.C. Cunnane and L.U Thompson, AOCS Press,
Champaign, Illinois, pp. 22-42.

61
Blancquaert, D., Storozhenko, S., Loizeau, K., De Steur, H., De Brouwer, V., Viaene, J.,
Ravanel, S., Rebeille, F., Lambert, W., and Van Der Straeten, D. 2010. Folates and folic
acid: from fundamental research towards sustainable health. Critical Review of Plant
Sciences. 29: 14-35.
Budic-Leto, I., and Lovric, T. 2002. Identification of phenolic acids and changes in their content
during fermentation and aging of white wines. Food Technology and Biotechnology.
40: 221-225.
Butterfield, S., and Calloway, D. H. 1972. Folacin in wheat and selected foods. Journal of
American Dietetic Association. 60: 310-314.
Carraro, J., Dantas, M., Espeschit, A., Martino, H., and Ribeiro, S. 2012. Flaxseed and human
health: reviewing benefits and adverse effects. Food Reviews International. 28: 203-230.
Carter, J.F. 1993. Potential of flaxseed and flaxseed oil in baked goods and other products in
human nutrition. Cereal Food World. 38:753-759.
Center for Disease Control and Prevention (CDC). Cadmium fact sheet. 2009.
Available:http://www.cdc.gov/biomonitoring/pdf/Cadmium_FactSheet.pdf. Accessed on
May 1, 2013.
Cheynier, V., Fulcrand, H., and Moutounet, M. 2000. Oxidation of polyphenols in wine musts.
Vignevini Italie. 27: 52-56.
Cui, W., Kenaschuk, E., and Mazza, G. 1996. Influence of genotype on chemical composition
and rheological properties of flaxseed gums. Food Hydrocolloids. 10: 221-227.
Dai, J., and Mumper, R. 2010. Plant phenolics: extraction, analysis and their antioxidant and
anticancer properties. Molecule Journal. 15: 7313-7352.
Dallas, C., Ricardo da Silva, J. M., and Laureano, O. 1996. Products formed in model wine
solutions involving anthocyanins, procyanidin B2 and acetaldehyde. Journal of
Agricultural and Food Chemistry. 44: 2402-2407.
Daun, J., Barthet, V., Chornick, T., Duguid, S. 2003. Structure, composition, and variety
development of flaxseed. In: Thompson, L., Cunanne, S. edition. Flaxseed in Human
Nutrition. 2nd edition Champaign, Illinois. pp. 1-40.
Davies, A., Netto, M., Glassenap, M., Gallaher, M., Labuza, TP., and Gallaher D.
1998. Indication of the Maillard reaction during storage of protein isolates. Journal of
Agricultural and Food Chemistry. 46: 2485-2489.
Dehennin, L., Reiffsteck, A., Joudet, M., and Thibier, M. 1982. Identification and quantitative
estimation of a lignan in human and bovine semen. Journal of Reproduction and Fertility.
66: 305-309.

62
Dewanto, V., Wu, X., and Liu, RH. 2002. Processed sweet corn has higher antioxidant activity.
Journal of Agricultural and Food Chemistry. 50:4959-4964.
Durazzo, A., Azzini, E., Turfani, V., Polito, A., Maiani, G., and Carcea, M. 2013. Effect of
cooking on lignans content in whole-grain pasta made with different cereals and other
seeds. Cereal Chemistry. 90: 169-171.
Dworschak, E. 1982. In: M. Rechcigl (ed.) Handbook of Nutritive Value of Processed Food,
Vol 1. CRC Press, Boca Raton, Florida, pp. 63–76.
Eckey, E.W. 1954. Vegetable fats and oils. Reinhold, New York. P. 541.
Ehrensing, D. 2008. Oilseed crops: flax. Extension publication EM 8952–E. Oregon State
University Extension.
http://extension.oregonstate.edu/catalog/pdf/em/em8952-e.pdf. Accessed on February 18,
2014
Eliasson, C., Kamal-Eldin, A., Andersson, R., and Aman, P. 2003. High performance liquid
chromatographic analysis of secoisolariciresinol diglucoside and hydroxycinnamic acid
glucosides in flaxseed by alkaline extraction. Journal of Chromatography A. 1012: 151-
159.
Erdman, J. W. and Erdman, E. A. 1982. Effect of home preparation practices on nutritive value
of food. In: M. Rechcigl (ed.) Handbook of Nutritive Value of Processed Foods, CRC
Press, Boca Raton, Florida, pp. 237–263.
FAO. 2009. Barley, malt, beer. Agri-business handbook. Rome: FAO.
http://www.fao.org/fileadmin/user_upload/tci/docs/AH3_BarleyMaltBeer.pdf. Accessed
August 12, 2014.
FAO. 2011. Traditional fermented food and beverages for improved livelihoods. Rural
infrastructure and Agro-industries Division. Rome: FAO.
http://www.fao.org/docrep/015/i2477e/i2477e00.pdf. Accessed on July 5, 2014.
Fellows, P. J., 2000. Freezing. In: Fellows, P.J., Food processing technology: principles and
practice (second ed). TJ International, Cornwall, England, pp 98-116; 170-187; 241-249;
294-308.
Figueroa, J. D. C., Madsen, M., and D’Appolonia, B. L. 1987. Pilot-brewing for evaluation of
cultivar performance. Brew Dig. 62: 32-35.
Ford, J.D., Huang, K.S., Wang, HB., Davin, LB., and Lewis, NG. 2001. Biosynthetic pathway to
the cancer chemo preventive secoisolariciresinol diglucoside-hydroxymethyl glutaryl
ester-linked lignan oligomers in flax (Linum usitatissimum) seed. Journal of Natural
Products. 64: 1388-1397.

63
Gelinas, P., and McKinnon, C.M. 2006. Effect of wheat variety, farming sites, and bread baking
on total phenolics. International Journal of Food Science and Technology. 41: 329-332.
Goupy, P., Hugues, M., Boivin, P., and Amiot, M. J. 1999. Antioxidant composition and activity
of barley (Hordeum vulgare) and malt extracts and of isolated phenolic
compounds. Journal of the science of food and agriculture. 79: 1625-1634.
Guyot, S., Marnet, N., Sanoner, P., and Drilleau, J.F. 2003. Variability of the polyphenolic
composition of cider apple (Malus domestica) fruits and juices. Journal of Agricultural
and Food Chemistry. 51: 6240-6247.
Hall, C.A., III, Niehaus, M., Auch, C., Stroerzinger, C., Wolf-Hall, C., and Bauer, A. 2004.
Flaxseed in yoghurt: lignan and flaxseed oil stability. Proceedings of the 60th Flax
Institute of the United States, pp 1-7.
Harper, J. M. 1979. Food extrusion. CRC Critical Reviews in Food Science and Nutrition. 11:
155-215.
Heinonen, S., Nurmi, T., Liukkonen, K., Poutanen, K., Wahala, K., Deyam, T., Nishibe, S., and
Adlercreutz. 2001. In vitro metabolism of plant lignans: New precursor of mammalian
lignans enterolactone and enterodiol. Journal of Agricultural and Food Chemistry.
49:3178-3186.
Hollman, P. 2001. Evidence for health benefits of plant phenols: local or systemic effects.
Journal of Science of Food and Agriculture. 81: 842-852.
Holtekjolen, A.K., Kinitz, C., and Knutsen, S.H. 2006. Flavanol and bound phenolic acid
contents in different barley varieties. Journal of Agricultural and Food Chemistry.
54: 2253-2260
Horn, D.E. 1977. Winemaking in the chemistry laboratory. Journal of Chemical Education. 54:
375.
Hyvarinen, H., Pihlava, J.M., Hiidenhovi, J., Hietaniemi, V., Korhonen, H., and Ryhanen, E.L.
2006a. Effect of processing and storage on the stability of flaxseed lignan added to
Bakery products. Journal of Agricultural and Food Chemistry. 54: 48-53.
Hyvarinen, H., Pihlava, J.M., Hiidenhovi, J., Hietaniemi, V., Korhonen, H., and Ryhanen, E.L.
2006b. Effect of processing and storage on the stability of flaxseed lignan added to dairy
Products. Journal of Agricultural and Food Chemistry. 54: 8788-8792.
Jenab, M., Rickard, SE., Orcheson, LJ., and Thompson, LU. 1999. Flaxseed and lignans increase
cecal beta-glucuronidase activity in rats. Nutrition and Cancer. 33: 154-158.

64
Johnsson, P., Peerlkamp, N., Kamal-Eldin, A., Andersson, R.E., Andersson, R., Lundgren, L.N.,
and Aman, P. 2002. Polymeric fractions containing phenol glucosides in flaxseed. Food
Chemistry. 76: 207-212.
Kamal-Eldin, A., Peerlkamp, N., Johnsson, P., Andersson, R., Andersson, R.E., Lundgren,
L.N., and Aman, P. 2001. An oligomer from flaxseed composed of secoisolariciresinol
diglucoside and 3-hydroxy-3-methyl glutaric acid residues. Phytochemistry. 58: 587-590.
Karababa, E., Schwarz, P. B., and Horsley, R. D. 1993. Effect of kiln schedule
on micromalt quality parameters. Journal of American Society of Brewing Chemists.
51: 163-167.
Kariluoto, S., Vahteristo, L., Salovaara, H., Katina, K., Liukkonen, K., Piironen, V. 2004. Effect
of baking method and fermentation on folate content of rye and wheat breads. Cereal
Chemistry. 81: 134–139.
Katina, K., Liukkonen, K., Norja, A., Adlercreutz, H., Heinonen, S., Lampi, A., Pihlava, J., and
Poutanen, K. 2007. Fermentation-induced changes in the nutritional value of native or
germinated rye. Journal of Cereal Science. 46: 348-355.
Keagy, P. M., Stokstad, E. L. R., and Fellers, D. A. 1975. Folacin stability during bread
processing and family flour storage. Cereal Chemistry. 52: 349-356.
Klimaszewski, A. 2000. Flax for health. Herbal select nature that nurtures. Bioriginal food and
science corp. http://www.herbalselect.ca/Library/Flax_ForHealth.pdf. Accessed on June
11, 2014.
Klosterman, H.J., Smith, F. 1954. The isolation of beta-hydroxy-beta methylglutaric acid from
the seed of flax (Linum usitatissimum). Journal of American Chemical Society. 76:1229–
1230.
Klosterman, H.J., Smith, F., and Clagett, C.O. 1955. The constitution of linocinnamarin. Journal
of American Chemical Society. 77:420–421.
Koontz, J.L., Phillips, K.M., Wunderlich, K.M., Exler, J., Holden, J.M., Gebhardt, S.E., and
Haytowitz, D.B. 2005. Comparison of total folate concentration in foods determined by
microbiological assay at several experienced laboratories, Journal of the Association of
Official Analytical Chemists International. 88: 805-813.
Laurence, E., and Mike, E. 2014. Flaxseed (Linseed) fiber: nutritional and culinary uses. Food
New Zealand. 14: 26-28.
Lee, C., and Jaworsky, A. 1987. Phenolic compounds in white grapes in New York. American
Journal of Enology and Viticulture. 38: 277–281.

65
Li, H., Guo, A., and Wang, H. 2008. Mechanisms of oxidative browning of wine. Food
Chemistry. 108: 1-13.
Liggins, J., Grimwood, R., and Bingham, S.A. 2000. Extraction and quantification of lignan
phytoestrogens in food and human samples. Analytical Biochemistry. 287: 102-109.
Liu, R.H. 2004. Potential synergy of phytochemicals in cancer prevention: mechanism of action.
Journal of Nutrition. 134: 3479S-3485S.
Liu, R.H. 2013. Dietary bioactive compounds and their health implications. Journal of Food
Science. 78: A18-A25.
Liukkonen, H., Katina, K., Wilhelmsson, A., Myllkmaki, O., Lampia, M., Kariluoto, S.,
Piironen, V., Heinonen, M., Nurmi, T., Adlercreutz, H., Peltoketo, A., Pihlava, M.,
Hietaniemi, V., and Poutanen, K. 2003. Process-induced changes on bioactive
compounds in wholegrain rye. Proceedings of the Nutrition Society. 62: 117-122.
Loponen, J., Mikola, M., Katina, K., Sontag-Strohm, T., Salovaara, H. 2004. Degradation of
HMW glutenins during wheat sourdough fermentations. Cereal Chemistry. 81: 87-90.
Madhusudhan, B.J., Wiesenborn, D., Schwarz, J., Tostenson, K., and Gillespie, J. 2000. A dry
mechanical method for concentrating the lignan secoisolariciresinol diglucoside in
flaxseed. Food Science and Technology. 33:268-275.
Maillard, M. N., Soum, M. H., Boivin, P., and Berset, C. 1996. Antioxidant activity of barley and
malt: relationship with phenolic content. Food Science and Technology. 29: 238-244.
Mathern, J. 2005. Flax Lignans. Flax lignan information bureau.
http://www.flaxlignaninfo.com/research-p1929-en.html. Accessed on September 02,
2014.
Mazur, W. 1998. Phytoestrogen content in foods. Baillieres Clinical Endocrinology and
Metabolism. 12: 729-742.
Mazur, W., and Adlercreutz, H. 1998. Naturally occurring oestrogens in food. Pure Application
of Chemistry. 70: 1759-1776.
Mazur, W., Fotsis, T., Wahala, K., Ojala, S., Salakka, A., and Adlercreutz, H. 1996. Isotope
dilution gas chromatographic-mass spectrometric method for the determination of
isoflavonoids, coumestrol, and lignans in food samples. Annals of Clinical Biochemistry.
233: 169-180.
Mazza, G., and Biliaderis, C.G. 1989. Functional properties of flaxseed mucilage. Journal of
Food Science. 54: 1302-1305.

66
Milder, I.E.J., Arts, I.C.W., Venema, D., Lasaroms, J., Wahala, K., and Hollman, P. 2004.
Optimization of a liquid chromatography-tandem mass spectrometry method for
quantification of the plant lignans secoisolariciresinol, matairesinol, lariciresinol, and
pinoresinol in foods. Journal of Agricultural and Food Chemistry. 52: 4643-4651.
Milder, I.E.J., Arts, I.C.W., Putte, B., Venema, D., and Hollman, P. 2005. Lignan contents of
Dutch plant foods: a database including lariciresinol, pinoresinol, secoisolariciresinol,
and matairesinol. British Journal of Nutrition. 93: 393-402.
Muir A.D. 2006. Flax lignans: analytical methods and how they influence our understanding of
biological activity. Journal of AOAC International. 89: 1147-1157.
Muir, A., and Westcott, N. 2000. Quantitation of the lignan secoisolariciresinol diglucoside in
baked goods containing flax seed or flax meal. Journal of Agricultural and Food
Chemistry. 48: 4048-4052.
Muir, A., and Westcott, N. 2003. Flaxseed lignan in disease prevention and health promotion.
Phytochemistry Reviews. 2: 401-417.
National Agricultural Statistics Service (NASS). 2013. USDA Crop Production 2012 Summary
http://usda01.library.cornell.edu/usda/current/CropProdSu/CropProdSu-01-11-2013.pdf.
Accessed on August 13, 2014.
Nesbitt, P., and Thompson, L. 1999. Human metabolism of mammalian lignan precursors in raw
and processed flaxseed. American Journal of Clinical Nutrition. 69: 549-555.
Niemi, P., Tamminen, T., Smeds, A., Viljanen, K., Ohra-aho, T., Holopainen-Mantila, U.,
Faulds, C., Poutanen, K., and Buchert, J. 2012. Characterization of lipids and lignans in
brewer’s spent grain, and its enzymatically extracted fraction. Journal of Agricultural and
Food Chemistry. 60: 9910-9917.
Nogueira, A., Guyot, S., Marnet, N., Luquere, J.M., Drilleau, J.F., and Wosiaki, G. 2008. Effect
of alcoholic fermentation in the content of phenolic compounds in cider
processing. Brazilian Archives of Biology and Technology, 51: 1025-1032.
Oomah, B.D. 2003. Processing of flaxseed fiber, oil, protein, and lignan fractions. Flaxseed in
Human Nutrition. 2nd edition. Champaign, Illinois. pp. 363-386.
Oomah, B.D., and Sitter, L. 2009. Characteristics of flaxseed hull oil. Food Chemistry.
114: 623-628.
Oomah, B.D., Mazza, G., and Kenaschuk, E.O. 1996. Flavonoid content of the flaxseed,
influence of cultivar and environment. Euphytica. 90: 163-167.

67
Oomah, B.D., Kenaschuk, E.O., Cui, W., and Mazza, G. 1995. Variation in the composition of
water-soluble polysaccharides in flaxseed. Journal of Agricultural and Food Chemistry.
43: 1484-1488.
Oplinger, E.S., Oelke E.A., Doll, J.D., Bundy, L.G., and Schuler, R.T. 1989. Alternative field
crops manual. University of Wisconsin–Madison and University of Minnesota Extension
http://www.hort.purdue.edu/newcrop/afcm/flax.html. Accessed on March 13, 2014.
Osseyi, E. S., Wehling, R. L., and Albrecht, J. A. 2001. HPLC determination of stability and
distribution of added folic acid and some endogenous folates during bread making.
Cereal Chemistry. 78: 375-378.
Popova, I.E., Hall, C., and Kubatova, A. 2009. Determination of lignans in flaxseed using liquid
chromatography with time-of-flight mass spectrometry. Journal of Chromatography A.
1216: 217-229.
Qiu, S., Lu, Z., Luyngi, L., Lee, S.K., Pezzuto, J.M., Farnsworth, N.R., Thompson, L.U., and
Fong, H.S. 1999. Isolation and characterization of flaxseed (Linum usitatissimum)
constituents. Pharmaceutical Biology. 37: 1-7.
Rampersaud, G.C., Kauwell, G.P., and Ailey, L.B. 2003. Folate: a key to optimizing health and
reducing disease risk in the elderly. Journal of the American College of Nutrition. 22:1-8.
Recamales, A., Sayago, A., Gonzalez-Miret, L., and Hernanz, D. 2006. The effect of time and
storage conditions on the phenolic composition and color of white wine. Food Research
International. 39: 220-229.
Renard, C. M., Baron, A., Guyot, S., and Drilleau. J. F. 2001. Interactions between apple cell
walls and native apple polyphenols: quantification and some consequences. International
Journal of Biological Macromolecules. 29: 115-125.
Revilla, I., Perez-Magarino, S., Gonzalez-San Jose, M. L., and Beltran, S. 1999. Identification of
anthocyanin derivatives in grape skin extracts and red wines by LC-DAD-MS. Journal of
chromatography A. 847: 83-90.
Robards, K., Prenzler, P. D., Tucker, G., Swatsitang, P., and Glover, W. 1999. Phenolic
compounds and their role in oxidative processes in fruits. Food Chemistry. 66: 401-436.
Rubilar, M., Gutierrez, C., Verdugo, M., Shene, C., and Sineiro, J. 2010. Flaxseed as a source of
functional ingredients. Journal of Plant Nutrition and Soil Science. 10: 373-377.
Sammour, R.H. 1999. Proteins of Linseed (Linum usitatissimum L.): Extraction characterization
by electrophoresis. Botanical Bulletin of Academia Sinica. 40: 121-126.

68
Setchell, K.D.R. 1995. Discovery and potential clinical importance of mammalian lignans.
Flaxseed in Human Nutrition. SC Cunnane and LU Thompson. 1st edition. AOCS Press,
Champaign, Ill. pp. 82-98.
Setchell, K.D.R., Lawson, A.M., Mitchell, F.L., Adlercreutz, H., Kirk, D.N., and Axelson, M.
1980. Lignans in man and in animal species. Nature. 287: 740-742.
Seyoum, E., and Selhub, J. 1998. Properties of food folates determined by stability and
susceptibility to intestinal pteroylpolyglutamate hydrolase action. Journal of Nutrition.
128: 1956-1960.
Shimoni, E. 2004. Stability and shelf life of bioactive compounds during food processing and
storage: soy isoflavones. Journal of Food Science. 69: 160-166.
Siebert, K. J., Carrasco, A., and Lynn, P. Y. 1996. Formation of protein-polyphenol haze in
beverages. Journal of Agricultural and Food Chemistry. 44: 1997-2005.
Smeds, A., Eklund, P., Sjoholm, R., Willfor, S., Nishibe, S., Deyama, T., and Holmbom, B.
2007. Quantification of a broad spectrum of lignans in cereals, oilseeds, and nuts. Journal
of Agricultural and Food Chemistry. 55: 1337-1346.
Struijus, K., Vincken, J.P., Verhoef, R., Vanostveen-Vancasteren, W.H.M., Voragen, A.G.J., and
Gruppen, H. 2007. The flavonoid herbacetin diglucoside as a constituent of the lignan
macromolecule from flax seed hulls. Phytochemistry. 68: 1227-1235.
Tarpila, A., Wennberg, T., and Tarpila, S. 2005. Flaxseed as a functional food. Current Topics in
Nutraceutical Research. 3: 167-188.
Thompson, L.U. 1998. Experimental studies on lignans and cancer. Baillieres Clinical
Endocrinology and Metabolism. 12: 691-705.
Thompson, L.U., Robb, P., Serraino, M., and Cheung, F. 1991. Mammalian lignan production
from various foods. Nutrition and Cancer. 16: 43-52.
Toure, A., and Xueming, X. 2010. Lignans: source, biosynthesis, metabolism, antioxidant
activity, bioactive components, and health benefits. Comprehensive Reviews in Food
Science and Food Safety. 9: 261-269.
Wang, L.Q. 2002. Mammalian phytoestrogens: enterodiol and enterolactone. Journal of
Chromatography A. 777: 289-309.
Wang, H., and Murphy, A. 1994. Isoflavone content in commercial soybean foods. Journal of
Agricultural and Food chemistry. 42: 1666-1673.
Waters, A.P., and Knowler, JT. 1982. Effect of lignan on RNA synthesis in the rat uterus.
Journal of Reproduction and Fertility. 66: 379-381.
69
Westcott, N.D., and Muir, A.D. 1996. Variation in the concentration of the flaxseed lignan
concentration with variety, location, and year. In proceedings of the 56th Flax Institute of
the United States; Flax Institute of the United States: Fargo, ND. pp. 77-80.
Williams, P., Williams, A., Graff, J., Hanson, S., Stanton, A., and Hafeman, C. 2002.
Interrelationships among variables affecting well siblings and mothers in families of
children with a chronic illness or disability. Journal of Behavioral Medicine.
25: 411-424.

70
APPENDIX A. STATISTICAL ANALYSIS OF PHYTOCHEMICALS DURING THE
VINIFICATION, MALTING AND BREWING PROCESS
Table A.1. ANOVA of the phytochemicals content during the vinification process.
Table A.2. ANOVA of SDG in 12 raw barley varieties.
Table A.3. ANOVA of SDG in 6 malted barley varieties.
Table A.4. ANOVA of SDG content in raw vs. malted barley.
Dependent variable Food processing dates
F-value
DF P-value
SDG 17.01 9 0.0001
Gallic acid 15.70 9 0.0001
Caffeic acid 5.11 9 0.0016
Ferulic acid 17.01 9 0.0001
Coumaric acid 97.35 9 0.0001
Chlorogenic acid 28.10 9 0.0001
Folic acid 0.52 9 0.8423 (N.S)
Dependent variable Raw barley varieties
F-value
DF P-value
SDG 0.73 11 0.6981
Dependent variable Malted barley varieties
F-value
DF P-value
SDG 0.32 5 0.8807
Dependent variable Raw vs. malted barley varieties
F-value
DF P-value
SDG 0.89 7 0.5577

71
APPENDIX B. HPLC AND LC-MS CHROMATOGRAPHS OF PHYTOCHEMICALS
Figure B.1. HPLC chromatograph of phytochemicals during the vinification process.
Figure B.2. LC-MS chromatograph of barley extract with non-detectible SDG.
Figure B.3. LC-MS chromatograph of barley extract with detectible SDG.