Habitat use and abundance of goliath grouper epinephelus itajara in brazil a participative survey
Upload
vuongkhuongCategory
view
217download
1
COMPOSITION, ABUNDANCE, AND HABITAT ASSOCIATIONS OF SMALL
MAMMALS IN SOUTHEASTERN OREGON, 1990–2010
George P. Keister, Jr., Ronald Garner, and Rodney J. Klus
Oregon Department of Fish and Wildlife
Technical Report # 2013-5-01
January, 2013

TABLE OF CONTENTS
ABSTRACT ………………………………………………………………………………... 1
INTRODUCTION …………………………………………………………………............. 2
STUDY AREA …………………………………………………………………………….. 2
METHODS ………………………………………………………………………………… 5
Small Mammal Capture ……………………………………………………............. 5
Data Analysis ………………………………………………………………............. 5
RESULTS ………………………………………………………………………….............. 7
Composition ………………………………………………………………………... 7
Abundance …………………………………………………………………............. 8
Weather ……………………………………………………………………………. 12
Habitat Associations ……………………………………………………………….. 13
DISCUSSION ……………………………………………………………………………… 14
Composition ……………………………………………………………………….. 14
Abundance …………………………………………………………………............. 14
Habitat Associations ……………………………………………………………….. 15
CONCLUSIONS AND MANAGEMENT IMPLICATIONS …………………………….. 17
ACKNOWLEDGEMENTS ……………………………………………………………….. 17
LITERATURE CITED ……………………………………………………………………. 18
APPENDICES …………………………………………………………………………….. 20
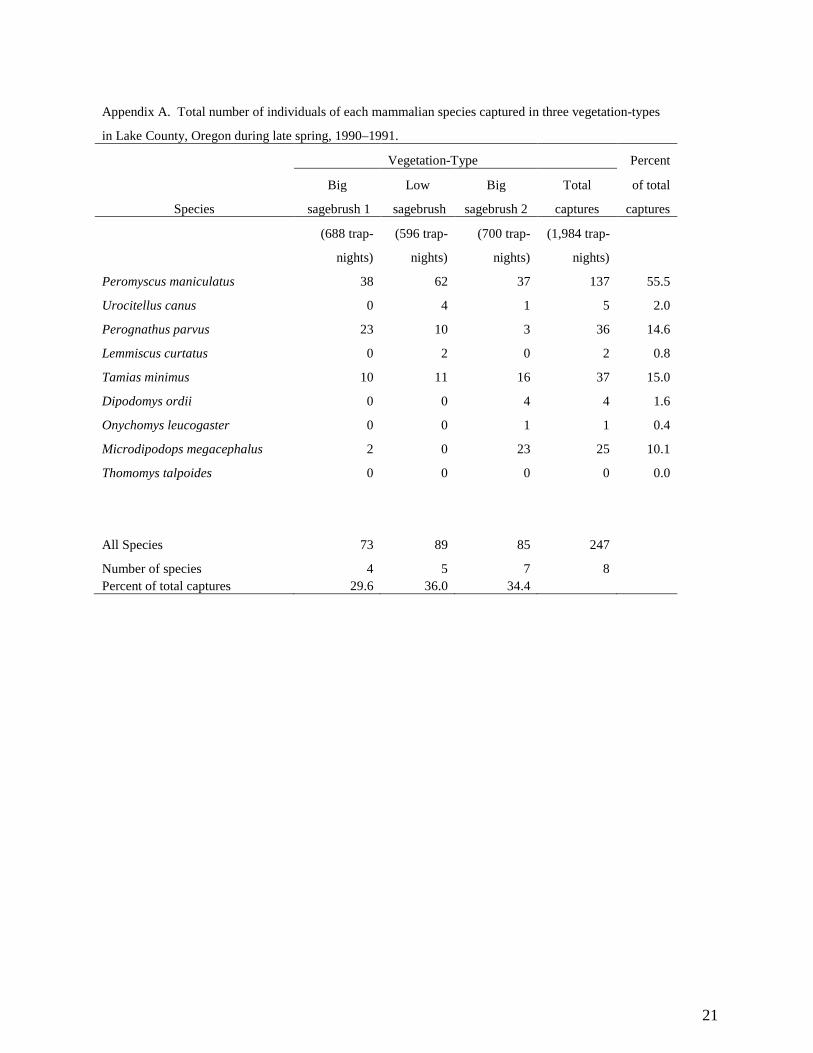
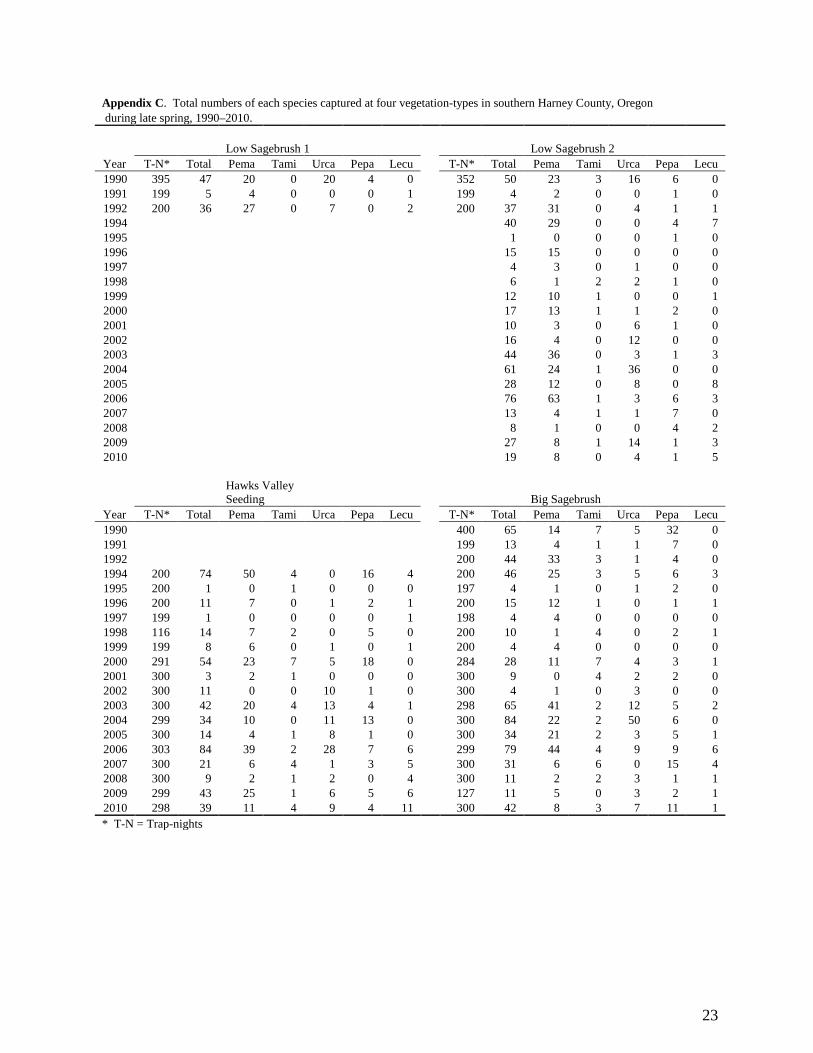
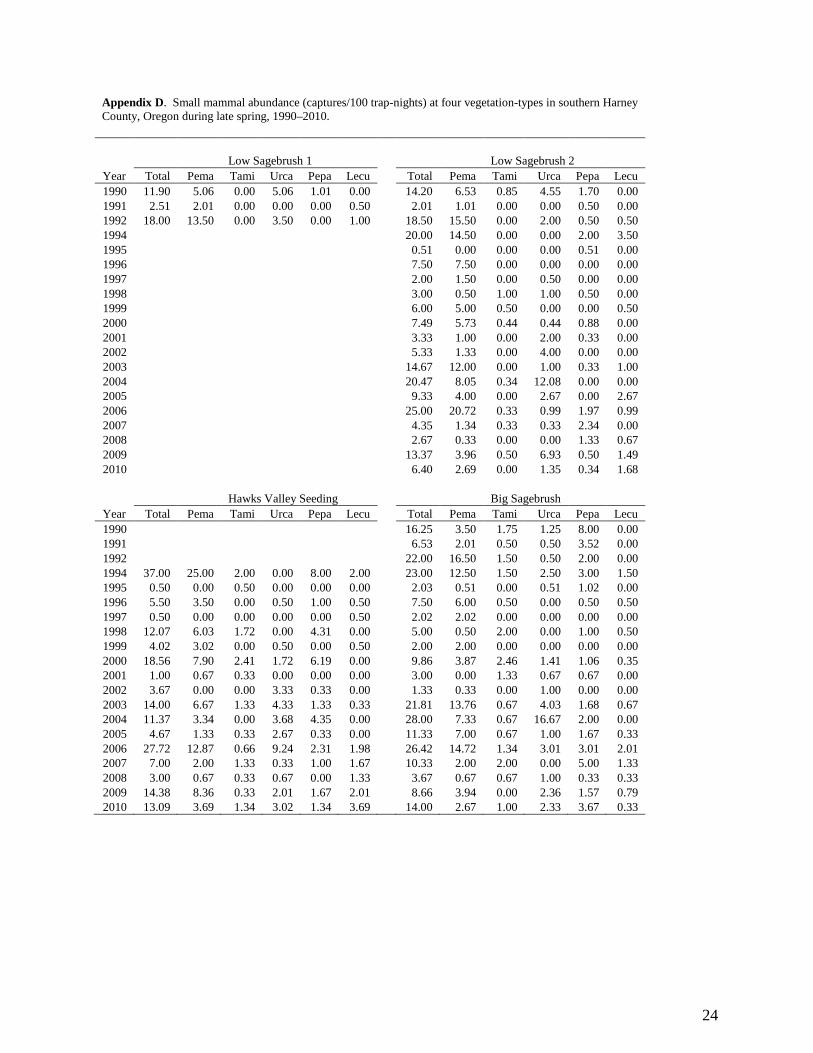
Appendix A. Total number of individuals of each mammalian species captured in three vegetation-types in Lake County, Oregon near Diablo Mountain during late spring 1990–1991………………………………………………………................... 21 Appendix B. Total number of individuals of each mammalian species captured in three vegetation-types in southern Harney County, Oregon during late spring 1990–1992………………………………………………………………………………… 22 Appendix C. Total numbers of each species captured at four sites in southern Harney County, Oregon during late spring, 1990–2010…………………………… 23 Appendix D. Small mammal abundance (captures/100 trap-nights) at four sites in southern Harney County, Oregon during late spring, 1990–2010…………………. 24
LIST OF TABLES
Table 1. Total number of individuals of each mammalian species captured in three vegetation-types is southern Harney County, Oregon during late spring, 1994–2010 .……………………………………………………………………………………………… 8 Table 2. Small mammal abundance (captures/100 trap-nights) in southern Harney County, Oregon during late spring, 1990–2010……………………………………………………... 10 Table 3. Correlation coefficients (r) for small mammal abundance (captures/100 trap-nights) in southern Harney County, Oregon vs. fall–spring precipitation, summer precipitation, and snowfall at Hart Mountain National Antelope Refuge during the just completed fall–spring and vs. the prior year, 1993–2010. …………………………………. 13
LIST OF FIGURES
Figure 1. Approximate location of each of three study areas in southeastern Oregon ……. 3 Figure 2. Approximate location of trap sites and alternate-year transects in southern Harney County, Oregon……………………………………………………………………………… 4 Figure 3. Annual fluctuations in small mammal abundance in southern Harney County, Oregon during late spring, 1990–2010 …………………………………………………….. 9 Figure 4. Annual fluctuations in abundance of several species of small mammals in southern Harney County, Oregon during late spring. 1990–2010 …………………………. 11 Figure 5. Fall–spring precipitation (September–May), summer precipitation (June–August), and snowfall (November–May) at Hart Mountain National Antelope Refuge, 1993–2010………………………………………………………………………………………… 12
1
ABSTRACT
As a part of a baseline study, we trapped small mammals and compared abundance and composition between common vegetation-types in southeastern Oregon (1990-2010). The majority of the study was in Harney County where we trapped small mammals along transects in two native sagebrush-steppe vegetation-types and a 1960s era crested wheatgrass (Agropyron cristatum) seeding during 1990 through 2010. We documented small mammal abundance and composition, examined fluctuations in abundance, and compared numbers among the three vegetation-types. Nine species were captured; deer mice (Peromyscus maniculatus) made up the highest proportion of all captures and Merriam’s ground squirrels (Urocitellus canus) were the second-most numerous. Highest peaks in abundance of all species combined occurred during 1994 and 2006. Both peaks were followed by a sharp decline in abundance. We found no significant relationship between small mammal abundance and seasonal precipitation or snowfall, which indicated small mammals were not limited by food or winter severity during our study. Differences in small mammal abundance were found among the three vegetation-types. Combined abundance of all species was greatest in the Wyoming big sagebrush (Artemisia tridentata wyomingensis) vegetation-type and least in low sagebrush (A. arbuscula). When only the Wyoming big sagebrush and crested wheatgrass seeding vegetation-types were compared, numbers of small mammals were similar. The relationship of relative abundance between species depended not only on habitat preferences but changed with population fluctuations; therefore, temporal patterns should be considered in designing short-term studies of small mammals. Results from this and other studies indicate that small mammal populations in crested wheatgrass seedings likely increase in diversity and abundance as plant diversity increases with reestablishment of native plants through time. To better understand mechanisms of population fluctuations, future research could focus on demographic studies as well as comparative or manipulative experiments. In addition, we made suggestions regarding use of these results to help evaluate future development projects in southeastern Oregon.
2
INTRODUCTION
Most of southeastern Oregon is composed of shrub-steppe plant communities dominated by sagebrush (Artemisia spp.). These sagebrush communities, located primarily in the northern Great Basin, are contiguous with large expanses of similar plant communities in southwestern Idaho and northern Nevada. The area is generally characterized by harsh climates, with relatively high elevations, low precipitation, and short growing seasons. As a result, ecosystems tend to be less complex and have lower species diversity than warmer, more mesic ecosystems. Several species of small mammals are present and are likely an important food source for raptors and mammalian predators and therefore play an important role in shrub-steppe ecosystems. Studies of small mammals in and adjacent to southeastern Oregon have been few and short-term. Feldhamer (1979a) described home ranges of three species of small mammals at Malheur National Wildlife Refuge in 1974 and 1975 as well as factors affecting abundance and distribution of small mammals during 1973–1975 (Feldhamer 1979b). Boula and Sharp (1985) compared small mammal abundance and composition on native rangeland and a crested wheatgrass seeding in northern Harney County, Oregon. Seasonal activity patterns were studied in west-central Nevada (O’Farrell 1974) and a base line descriptive study was conducted in northeastern Nevada (O’Farrell and Clark 1986). Larrison and Johnson (1973) studied small mammal density and habitat preferences in Idaho. None of these studies investigated multi-year fluctuations in abundance of small mammals. Our primary purpose was to describe abundance and composition of small mammals over a long time period in habitats that make up a large portion of southeastern Oregon. We hoped the results of this study would lead to a better understanding of the effects of future development and habitat conversions on small mammals, as well as the relationship between small mammals and other species, particularly raptors and other predators. We began the study in 1990 on three study areas, in each of three counties (Fig. 1). However, due to logistical constraints, we only trapped in Malheur County in 1990 and in Lake County in 1990 and 1991. At the Harney County study area, we trapped from 1990 through 2010. We did not trap in 1993. After data were collected, we investigated possible climatic reasons for fluctuations and compared differences in small mammal abundance and composition between Wyoming big sagebrush (Artemisia tridentata wyomingensis), low sagebrush (A. arbuscula), and a crested wheatgrass (Agropyron cristatum) seeding.
STUDY AREAS
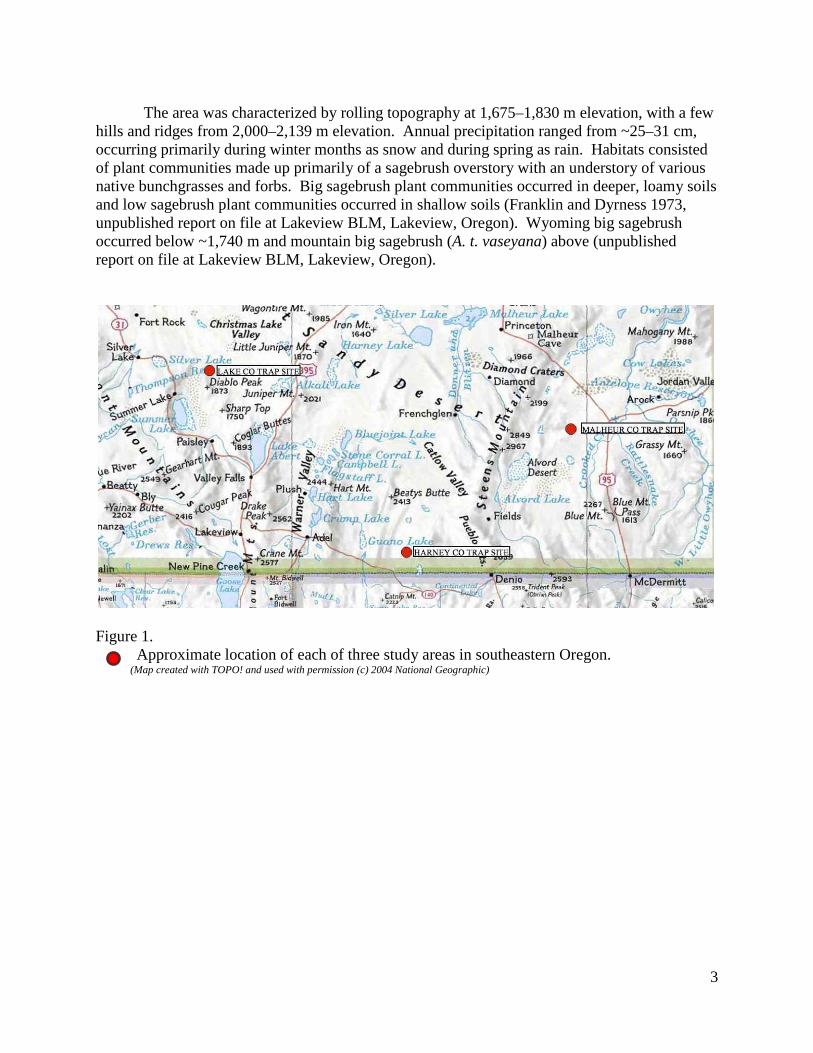
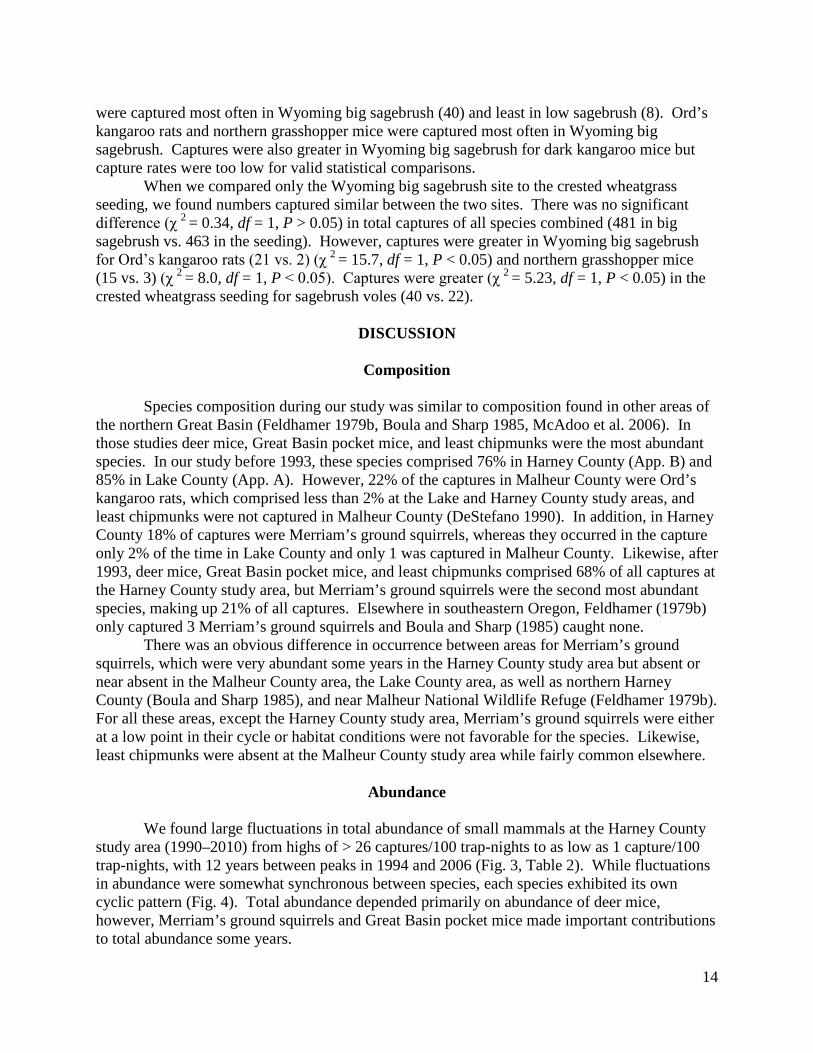
In the Malheur County study area, between Burns Junction, OR and Fields, OR (Fig. 1), DeStefano (1990) captured small mammals as part of a kit fox investigation contracted by the Oregon Department of Fish and Wildlife. Small mammals were captured in three vegetation-types: 1) vegetated sand dunes, 2) Wyoming big sagebrush, and 3) a mosaic of shrub-grass-desert pavement. In Lake County, we trapped small mammals near Diablo Mountain (Fig. 1) in two Wyoming big sagebrush sites and one low sagebrush site. The Harney County study area was our main focus and was located in the southwest corner of the county on land managed by the Bureau of Land Management (BLM) (Fig. 1). It was ~58 km southeast of Hart Mountain National Antelope Refuge (HMNAR) headquarters and ~13 km north of the Nevada border and centered around Acty Mountain (42º 06.1N, 119º 07.9W) (Fig. 2).
3
The area was characterized by rolling topography at 1,675–1,830 m elevation, with a few hills and ridges from 2,000–2,139 m elevation. Annual precipitation ranged from ~25–31 cm, occurring primarily during winter months as snow and during spring as rain. Habitats consisted of plant communities made up primarily of a sagebrush overstory with an understory of various native bunchgrasses and forbs. Big sagebrush plant communities occurred in deeper, loamy soils and low sagebrush plant communities occurred in shallow soils (Franklin and Dyrness 1973, unpublished report on file at Lakeview BLM, Lakeview, Oregon). Wyoming big sagebrush occurred below ~1,740 m and mountain big sagebrush (A. t. vaseyana) above (unpublished report on file at Lakeview BLM, Lakeview, Oregon).
Figure 1.
Approximate location of each of three study areas in southeastern Oregon. (Map created with TOPO! and used with permission (c) 2004 National Geographic)
4
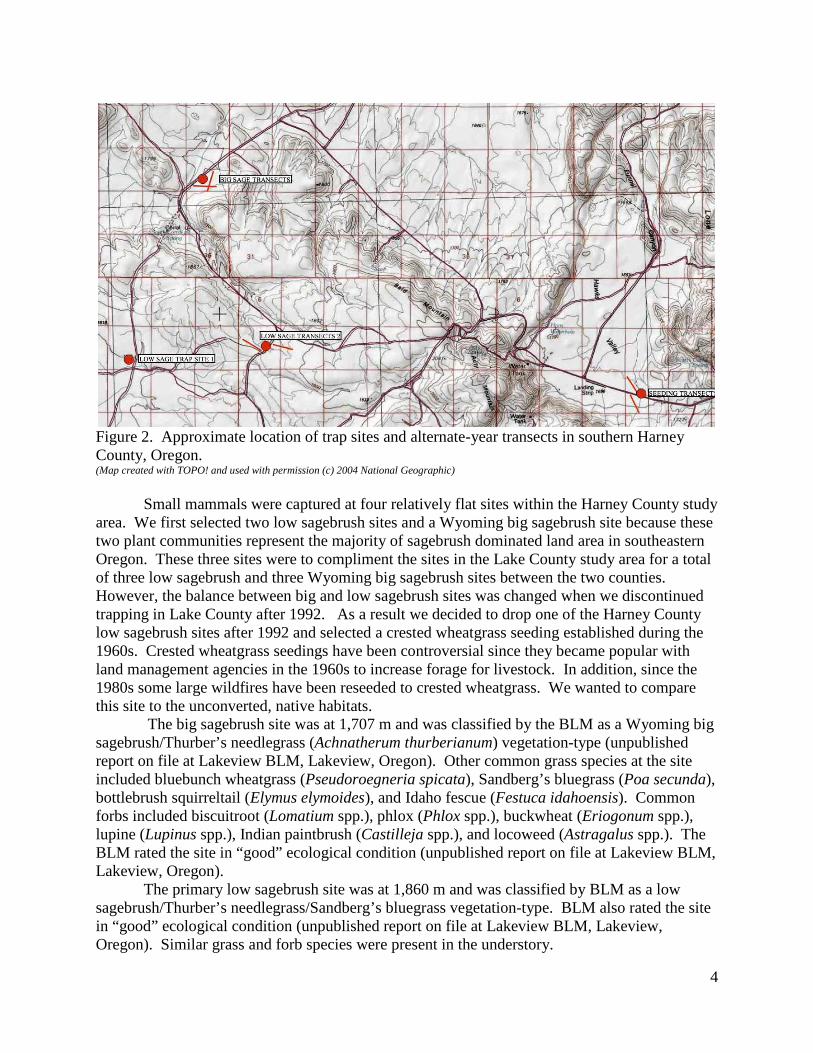
Figure 2. Approximate location of trap sites and alternate-year transects in southern Harney County, Oregon. (Map created with TOPO! and used with permission (c) 2004 National Geographic) Small mammals were captured at four relatively flat sites within the Harney County study area. We first selected two low sagebrush sites and a Wyoming big sagebrush site because these two plant communities represent the majority of sagebrush dominated land area in southeastern Oregon. These three sites were to compliment the sites in the Lake County study area for a total of three low sagebrush and three Wyoming big sagebrush sites between the two counties. However, the balance between big and low sagebrush sites was changed when we discontinued trapping in Lake County after 1992. As a result we decided to drop one of the Harney County low sagebrush sites after 1992 and selected a crested wheatgrass seeding established during the 1960s. Crested wheatgrass seedings have been controversial since they became popular with land management agencies in the 1960s to increase forage for livestock. In addition, since the 1980s some large wildfires have been reseeded to crested wheatgrass. We wanted to compare this site to the unconverted, native habitats. The big sagebrush site was at 1,707 m and was classified by the BLM as a Wyoming big sagebrush/Thurber’s needlegrass (Achnatherum thurberianum) vegetation-type (unpublished report on file at Lakeview BLM, Lakeview, Oregon). Other common grass species at the site included bluebunch wheatgrass (Pseudoroegneria spicata), Sandberg’s bluegrass (Poa secunda), bottlebrush squirreltail (Elymus elymoides), and Idaho fescue (Festuca idahoensis). Common forbs included biscuitroot (Lomatium spp.), phlox (Phlox spp.), buckwheat (Eriogonum spp.), lupine (Lupinus spp.), Indian paintbrush (Castilleja spp.), and locoweed (Astragalus spp.). The BLM rated the site in “good” ecological condition (unpublished report on file at Lakeview BLM, Lakeview, Oregon). The primary low sagebrush site was at 1,860 m and was classified by BLM as a low sagebrush/Thurber’s needlegrass/Sandberg’s bluegrass vegetation-type. BLM also rated the site in “good” ecological condition (unpublished report on file at Lakeview BLM, Lakeview, Oregon). Similar grass and forb species were present in the understory.
5
The crested wheatgrass site was at an elevation of 1,692 m. The natural climax community of the site was Wyoming big sagebrush/Thurber’s needlegrass, but it was converted to crested wheatgrass during fall of 1966 and spring of 1967. However, native plant species had reestablished since conversion. To describe the resulting plant community, in July 2010, we used the line intercept technique (Canfield 1941) to measure shrub cover. Total shrub cover was 13.7% and consisted of 7.6% Wyoming big sagebrush and 6.1% green rabbitbrush (Ericameria viscidiflora). This compared to a shrub cover of 17% (12% Wyoming big sagebrush and 5% green rabbitbrush) in the Wyoming big sagebrush vegetation-type and 15% low sagebrush in the low sagebrush vegetation-type (unpublished report on file at Lakeview BLM, Lakeview, Oregon). We also estimated proportion occurrence of herbaceous vegetation (grasses and forbs) using the step-point method (Evans and Love 1957). Crested wheatgrass comprised 16.6% of the herbaceous component of the site. Sandberg’s bluegrass (57.8%) was the most common grass. Thurber’s needlegrass (4.8%) and bottlebrush squirreltail (3.4%) were also present. The most common forb was Erigeron spp. (13.1%). Vegetation measurements showed the slow plant succession on the site during the previous 44 years from a monotypic stand of crested wheatgrass toward a Wyoming big sagebrush community. All three sites were in BLM’s Beaty’s Butte cattle allotment. However, the crested wheatgrass seeding was in the “Hawk’s Valley seeding” portion of the allotment and was grazed more intensively. Grazing intensity in the seeding during the study was about 30 Animal Unit Months (AUMs)/km2 from April through June, every other year (Les Boothe, 2010, Lakeview BLM, personal communication). The other two sites were in the “south common” part of the Beaty’s Butte allotment. Grazing pressure was reduced in the mid - 1960’s by 34% and again reduced in 1993 from every year grazing to every other year. Cattle are now turned out in April–May and leave the area by October 15. Grazing intensity during the study was 11.4–17 AUMs/ km2, every other year.
METHODS
Small Mammal Capture
We randomly placed two parallel, 750-m transects 100 m apart at each of the three capture sites within each study area. Each transect had 50 Museum Special snap traps placed at 15-m intervals for a total of 100 traps per site and therefore 300 traps per study area. Traps were baited with peanut butter and oatmeal. Traps were checked daily. During late spring (late May–early June) traps were set for four consecutive nights in 1990, then two nights in 1991–1999, and three nights in 2000–2010. Traps were checked daily. Logistical constraints prevented consistent trapping intensity among years. Parallel transects were moved to a nearby, alternate location within each site every other year to avoid effects of capture and removal on population abundance (Fig. 2). Small mammals were keyed to species according to Verts and Carraway (1998). Ground squirrel species (Urocitellus canus) identification was based on range distribution maps (Verts and Carraway 1998) and genus conforms to Helgen et al. (2009).
Data Analysis
Analysis of data was broken into two time periods, pre-1993 and post-1993. For the pre-1993 period, we compared composition and abundance of small mammals between the three

6
study areas in Harney, Lake, and Malheur Counties. Because of low sample size no statistical comparisons were made for the pre-1993 period. After 1993, no data were collected in Lake and Malheur Counties and in Harney County one of the low sagebrush sample sites was replaced with the crested wheatgrass site. For Harney County, we described abundance and trends in abundance for the total time period, 1990–2010. For analysis of habitat association and weather patterns we utilized 1994–2010 data only.
We calculated relative abundance of each small mammal species as the number captured/100 trap-nights. Correlation analysis was used to make comparisons among vegetation-types for each of the five most common species to determine if annual trends in small mammal abundance were similar among vegetation-types (e.g. annual abundance of deer mice was compared between big sagebrush and low sagebrush, and big sagebrush and the seeding, and low sagebrush and the seeding; then it was done for Merriam’s ground squirrels, etc.). In addition, we combined data from all capture sites to determine relative abundance for the entire study area and used correlation analysis to compare the five most common species to each other to assess whether annual fluctuations were synchronized between species. To assess potential habitat associations of small mammal species, we compared total number of all species and number of individual species captured (1994–2010) between the three vegetation-types using chi-square analysis. In addition, because the crested wheatgrass site was converted from a Wyoming big sagebrush vegetation-type we also compared captures between only the crested wheatgrass and the Wyoming big sagebrush sites. For chi-square analysis we assumed equal capture frequencies between vegetation-types for expected values. After data were collected for the study we hypothesized that there was a relationship between trends in small mammal abundance and weather conditions. Specifically, we hypothesized that annual fluctuations in small mammal abundance might depend on fluctuations in food availability and/or winter severity. We used precipitation as an indicator of annual plant productivity (food availability) and snowfall as an indictor of winter severity. We obtained weather data for Hart Mountain National Antelope Refuge (Oregon Climate Service, Oregon State University, Corvallis, Oregon), which is the closest (58 km) weather station to the study area and with similar elevation (1,707 m) and habitats. The next closest weather station was in Lakeview. It was further away (90 km), at lower elevation, and had different habitats. Therefore, we choose the HMNAR station. We wanted to use both temperature and snowfall data to characterize winter severity; however, temperature data were missing for large periods of time at HMNAR during 1993–2010 and were therefore not available. We believed snowfall, without temperature data, might have been a good indicator of weather severity. Species that spend winter below ground and snow level would be insulated from severely low temperatures, but during high snowfall years would be deprived of forage in early spring by lingering snow cover. We therefore compiled snowfall data (November–May) for each year.
Sneva (1982) showed a high correlation between herbage yield of all vegetation during the growing season and precipitation (September-June). Because of the relatively high elevation of the area, winter (October–November through March) precipitation generally falls as snow and combines with April–May rains to provide water available for vegetative growth. And, because we captured small mammals by early June each year, we compiled precipitation data from September–May instead of September-June to represent forage production. One month of precipitation data was missing for 2006–2007 and 2007–2008 and one month of snowfall data was missing for 1992–1993 from the HMNAR data set. We therefore did not use those years in our analysis. In addition, we compiled precipitation for summer (June–August).
7
We calculated correlation coefficients for abundance of all small mammals together and for the five most numerous species during spring vs. fall–spring precipitation (September–May) and snowfall for the just completed fall–spring period. We also examined correlations between small mammal abundance in a given spring and the prior year weather variables to see if conditions the previous year may have affected the present year’s abundance through its effect on last year’s reproduction, survival, recruitment, or body condition. We used summer precipitation (June–August) in addition to fall-spring precipitation and snowfall for prior year weather variables.
RESULTS
Composition
DeStefano (1990) reported results of small mammal trapping in Malheur County (1990). A total of 211 individuals of 6 species were captured in 1,174 trap-nights. Great Basin pocket mice (Perognathus parvus) comprised the highest proportion (51%) of captures. Great Basin pocket mice, Ord’s kangaroo rats (Dipodomys ordii) (22%), and deer mice (Peromyscus maniculatus) (20%) made up 93% of the captures. Dark kangaroo mice (Microdipodops megacephalus) and northern grasshopper mice (Onychomys leucogaster) comprised 5% and 2% of all captures, respectively. Only 1 ground squirrel (Urocitellus sp.) was captured. In Lake County 247 small mammals of 8 species were captured in 1,984 trap-nights during 1990 and 1991 (App. A). Deer mice comprised 56% of captures. Great Basin pocket mice and least chipmunks (Tamias minimus) each made up 15% of all captures. Merriam’s ground squirrels and Ord’s kangaroo rats made up 2% of captures. Only 2 sagebrush voles (Lemmiscus curtatus) and 1 northern grasshopper mouse were captured. At the Harney County study area (1990–1992), 301small mammals of 8 species were captured in 2,344 trap-nights (App. B). Deer mice comprised 53% of all captures. Great Basin pocket mice and Merriam’s ground squirrels each made up 18% of all captures. Least chipmunks and sagebrush voles comprised 5% and 3%, respectively, whereas Ord’s kangaroo rats and sagebrush voles were less than 2% of captures. There was 1 northern pocket gopher captured.
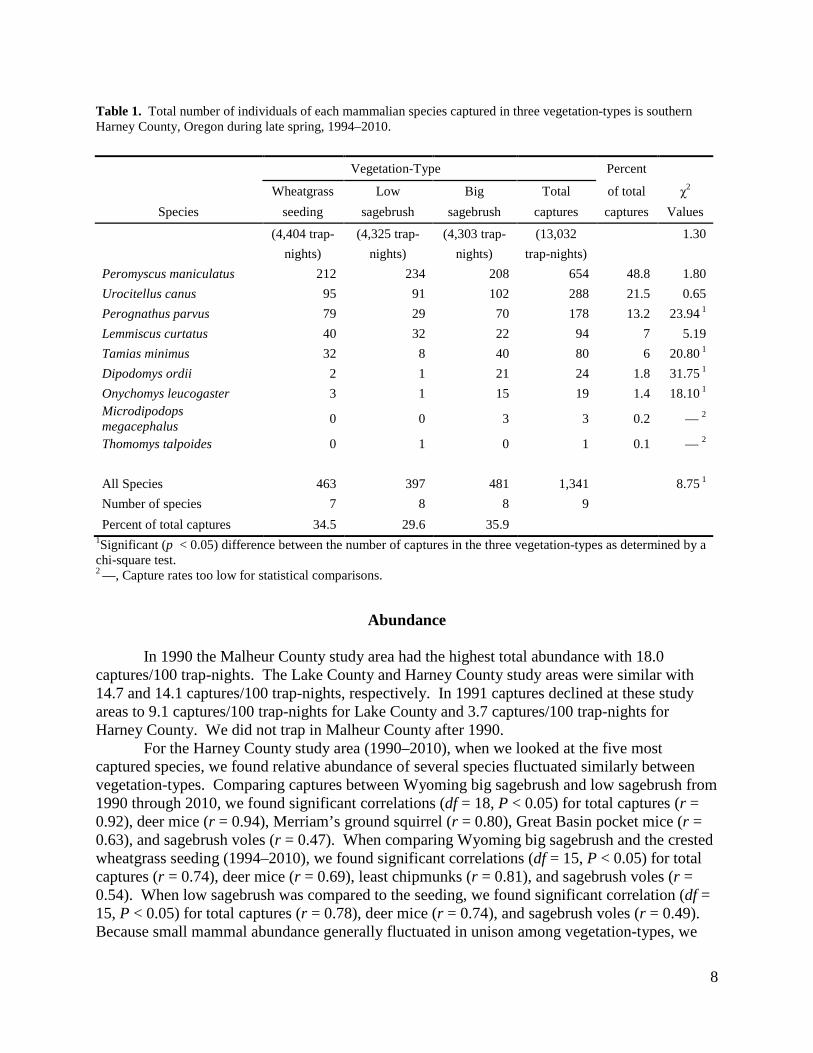
We captured 1,341 individuals of 9 species in 13,032 trap-nights during 1994–2010. Deer mice made up 49% of captures (Table 1). Deer mice, Merriam’s ground squirrels (22%), Great Basin pocket mice (13%), sagebrush voles (7%), and least chipmunks (6%) made up 96.5% of the captures (Table 1). Ord’s kangaroo rats and northern grasshopper mice made up fewer than 2% of the total captures each. Only 3 dark kangaroo mice and 1 northern pocket gopher (Thomomys talpoides) were captured.
8
Table 1. Total number of individuals of each mammalian species captured in three vegetation-types is southern Harney County, Oregon during late spring, 1994–2010. Vegetation-Type Percent
Wheatgrass Low Big Total of total χ2 Species seeding sagebrush sagebrush captures captures Values
(4,404 trap- (4,325 trap- (4,303 trap- (13,032 1.30 nights) nights) nights) trap-nights) Peromyscus maniculatus 212 234 208 654 48.8 1.80 Urocitellus canus 95 91 102 288 21.5 0.65 Perognathus parvus 79 29 70 178 13.2 23.94 1 Lemmiscus curtatus 40 32 22 94 7 5.19 Tamias minimus 32 8 40 80 6 20.80 1 Dipodomys ordii 2 1 21 24 1.8 31.75 1 Onychomys leucogaster 3 1 15 19 1.4 18.10 1 Microdipodops megacephalus 0 0 3 3 0.2 — 2
Thomomys talpoides 0 1 0 1 0.1 — 2 All Species 463 397 481 1,341 8.75 1 Number of species 7 8 8 9 Percent of total captures 34.5 29.6 35.9
1Significant (p < 0.05) difference between the number of captures in the three vegetation-types as determined by a chi-square test. 2 —, Capture rates too low for statistical comparisons.
Abundance
In 1990 the Malheur County study area had the highest total abundance with 18.0 captures/100 trap-nights. The Lake County and Harney County study areas were similar with 14.7 and 14.1 captures/100 trap-nights, respectively. In 1991 captures declined at these study areas to 9.1 captures/100 trap-nights for Lake County and 3.7 captures/100 trap-nights for Harney County. We did not trap in Malheur County after 1990.
For the Harney County study area (1990–2010), when we looked at the five most captured species, we found relative abundance of several species fluctuated similarly between vegetation-types. Comparing captures between Wyoming big sagebrush and low sagebrush from 1990 through 2010, we found significant correlations (df = 18, P < 0.05) for total captures (r = 0.92), deer mice (r = 0.94), Merriam’s ground squirrel (r = 0.80), Great Basin pocket mice (r = 0.63), and sagebrush voles (r = 0.47). When comparing Wyoming big sagebrush and the crested wheatgrass seeding (1994–2010), we found significant correlations (df = 15, P < 0.05) for total captures (r = 0.74), deer mice (r = 0.69), least chipmunks (r = 0.81), and sagebrush voles (r = 0.54). When low sagebrush was compared to the seeding, we found significant correlation (df = 15, P < 0.05) for total captures (r = 0.78), deer mice (r = 0.74), and sagebrush voles (r = 0.49). Because small mammal abundance generally fluctuated in unison among vegetation-types, we

9
believed combining data from all sites for each species provided an appropriate index to small mammal abundance for the area.
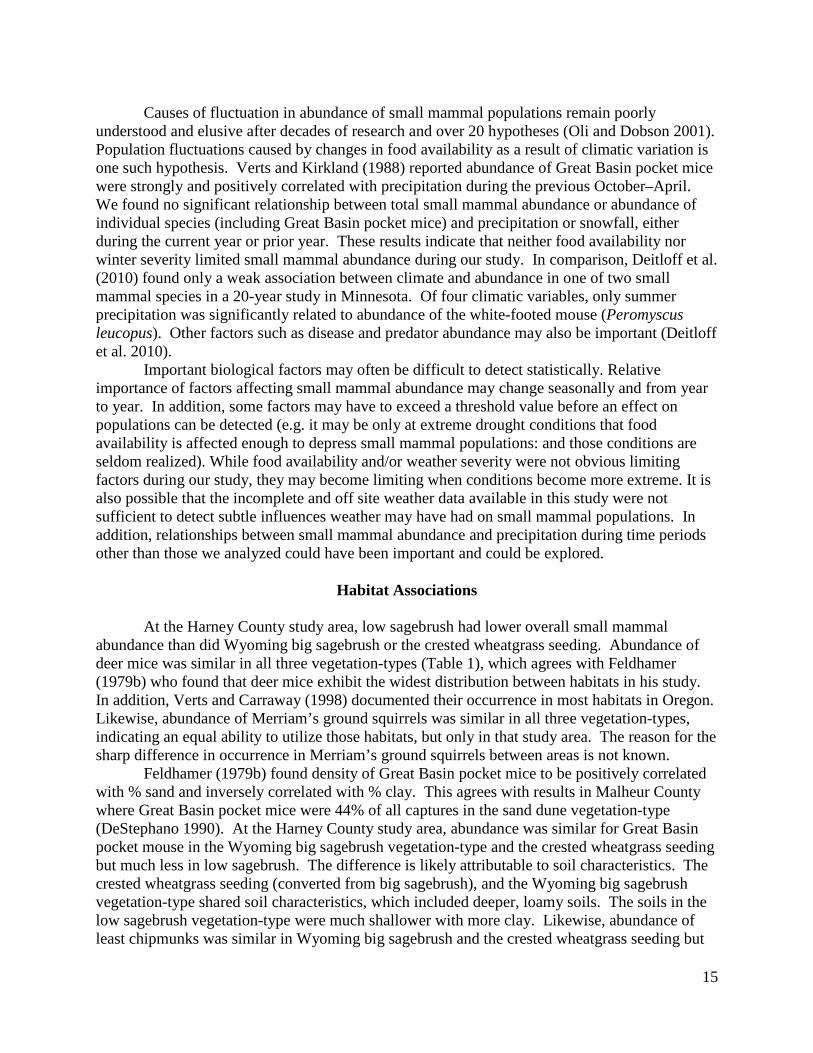
In Harney County between 1990 and 2010, the highest peaks in relative abundance of all species combined across vegetation-types were 12 years apart and occurred in 1994 (26.7 captures/100 trap-nights) and 2006 (26.4 captures/100 trap-nights) (Fig. 3, Table 2). Medium peaks in abundance occurred in 1990 (14.1 captures/100 trap-nights), 2000 (12.3 captures/100 trap-nights), 2003 (16.8 captures/100 trap-nights), 2004 (20.4 captures/100 trap-nights), 2009 (12.9 captures/100 trap-nights), and 2010 (11.2 captures/100 trap-nights). There was a crash in abundance in 1995 (1.0 captures/100 trap-nights) immediately following the peak of 1994, and another crash in 2007 and 2008 (7.2 and 3.1 captures /100 trap-nights, respectively) after the peak of 2006. Relative abundance was also low in 1991, 1997, 2001, and 2002 (3.7, 1.5, 2.4, and 3.4 captures/100 trap-nights, respectively).
Figure 3. Annual fluctuations in small mammal abundance in southern Harney County, Oregon during late spring, 1990–2010.
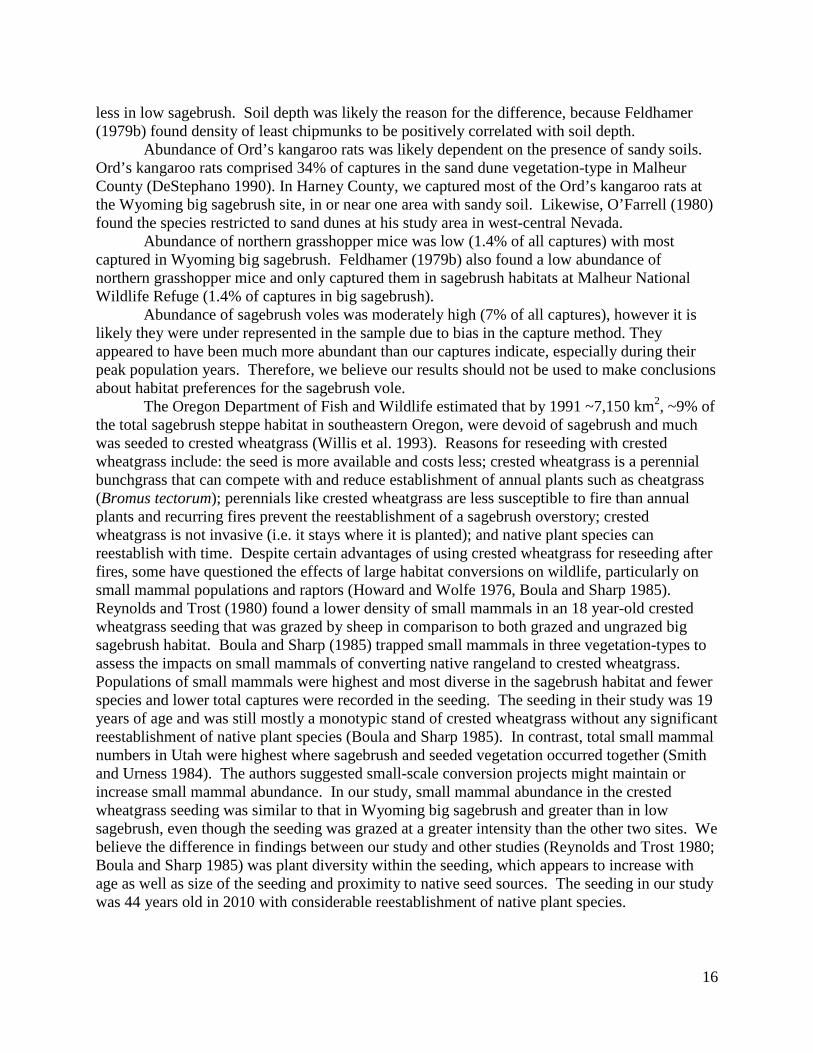
Fluctuations in abundance were somewhat, but not entirely, synchronous among species (Fig. 4). Total abundance of all species combined was largely dependent on and significantly correlated with deer mice abundance (r = 0.92, df = 18, P < 0.05). Total abundance was also significantly correlated (df = 18, P < 0.05) with abundance of Merriam’s ground squirrels (r = 0.55), Great Basin pocket mice (r = 0.67), and sagebrush voles (r = 0.56). Total abundance was not significantly correlated with least chipmunks (r = 0.36). In addition, there was significant correlation (df = 18, P < 0.05) between abundance of deer mice and sagebrush voles (r = 0.54)
0
5
10
15
20
25
30
1990 1992 1995 1997 1999 2001 2003 2005 2007 2009
Num
ber
Cap
ture
d/10
0 Tr
ap-N
ight
s
Year
10
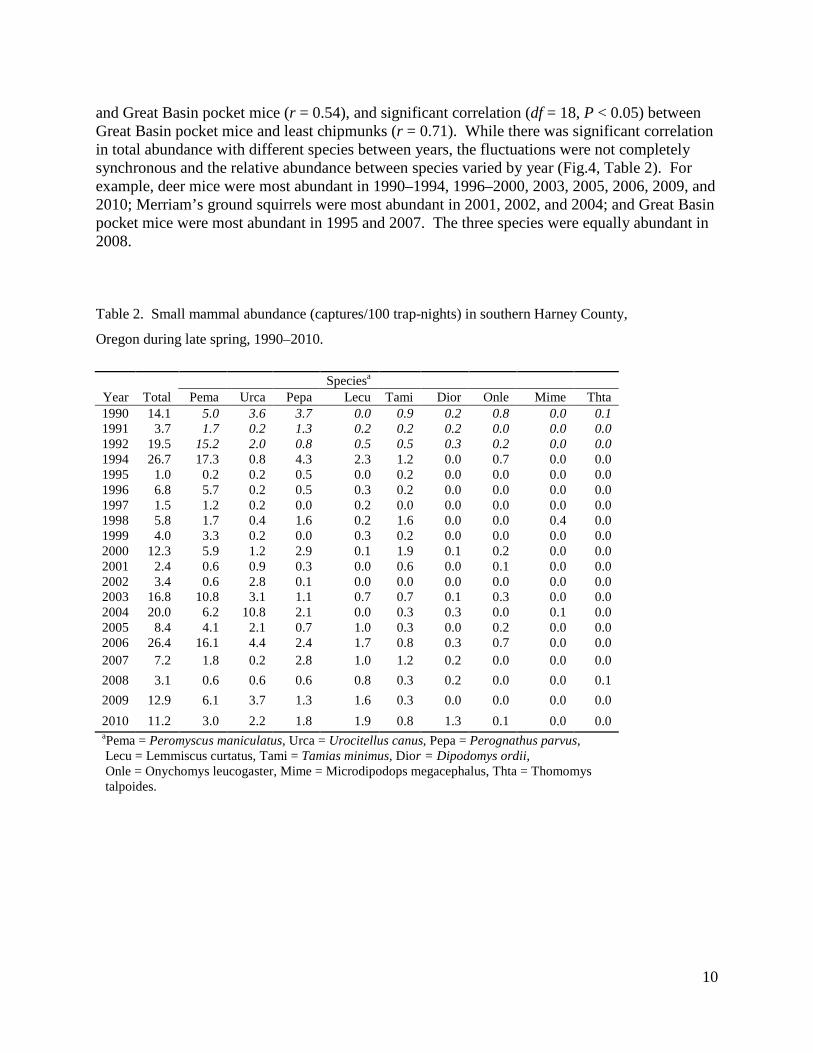
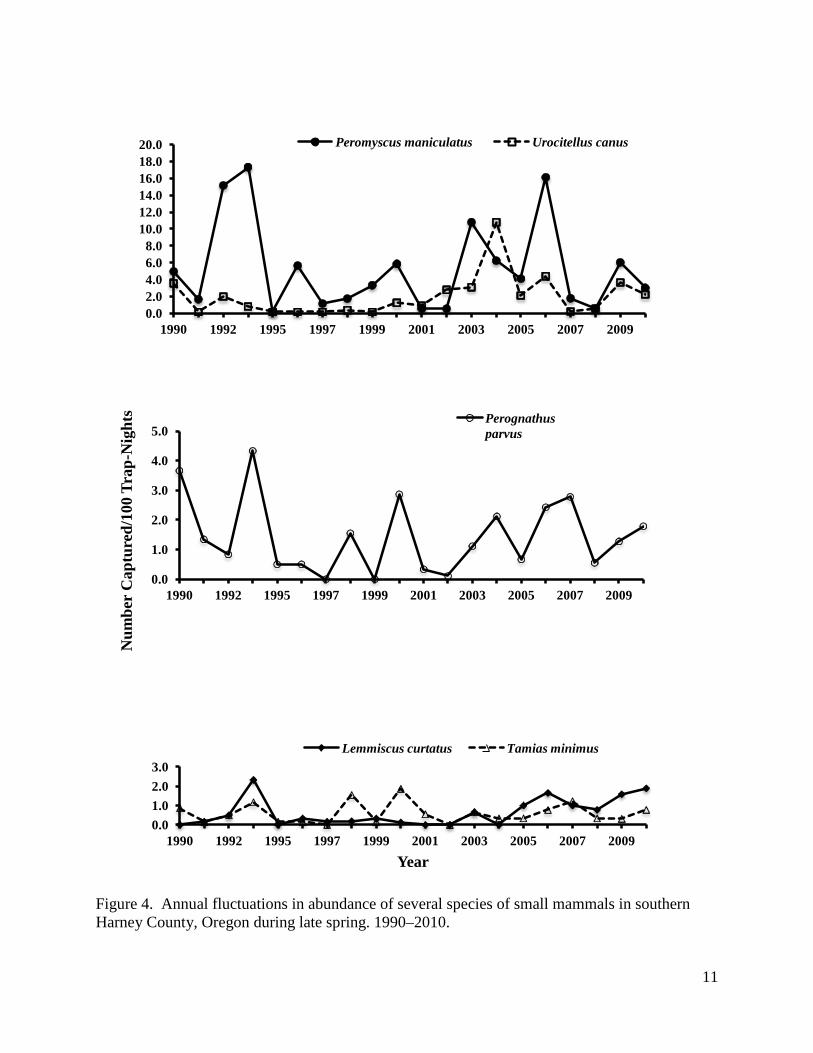
and Great Basin pocket mice (r = 0.54), and significant correlation (df = 18, P < 0.05) between Great Basin pocket mice and least chipmunks (r = 0.71). While there was significant correlation in total abundance with different species between years, the fluctuations were not completely synchronous and the relative abundance between species varied by year (Fig.4, Table 2). For example, deer mice were most abundant in 1990–1994, 1996–2000, 2003, 2005, 2006, 2009, and 2010; Merriam’s ground squirrels were most abundant in 2001, 2002, and 2004; and Great Basin pocket mice were most abundant in 1995 and 2007. The three species were equally abundant in 2008.
Table 2. Small mammal abundance (captures/100 trap-nights) in southern Harney County,
Oregon during late spring, 1990–2010. Speciesa
Year Total Pema Urca Pepa Lecu Tami Dior Onle Mime Thta 1990 14.1 5.0 3.6 3.7 0.0 0.9 0.2 0.8 0.0 0.1 1991 3.7 1.7 0.2 1.3 0.2 0.2 0.2 0.0 0.0 0.0 1992 19.5 15.2 2.0 0.8 0.5 0.5 0.3 0.2 0.0 0.0 1994 26.7 17.3 0.8 4.3 2.3 1.2 0.0 0.7 0.0 0.0 1995 1.0 0.2 0.2 0.5 0.0 0.2 0.0 0.0 0.0 0.0 1996 6.8 5.7 0.2 0.5 0.3 0.2 0.0 0.0 0.0 0.0 1997 1.5 1.2 0.2 0.0 0.2 0.0 0.0 0.0 0.0 0.0 1998 5.8 1.7 0.4 1.6 0.2 1.6 0.0 0.0 0.4 0.0 1999 4.0 3.3 0.2 0.0 0.3 0.2 0.0 0.0 0.0 0.0 2000 12.3 5.9 1.2 2.9 0.1 1.9 0.1 0.2 0.0 0.0 2001 2.4 0.6 0.9 0.3 0.0 0.6 0.0 0.1 0.0 0.0 2002 3.4 0.6 2.8 0.1 0.0 0.0 0.0 0.0 0.0 0.0 2003 16.8 10.8 3.1 1.1 0.7 0.7 0.1 0.3 0.0 0.0 2004 20.0 6.2 10.8 2.1 0.0 0.3 0.3 0.0 0.1 0.0 2005 8.4 4.1 2.1 0.7 1.0 0.3 0.0 0.2 0.0 0.0 2006 26.4 16.1 4.4 2.4 1.7 0.8 0.3 0.7 0.0 0.0 2007 7.2 1.8 0.2 2.8 1.0 1.2 0.2 0.0 0.0 0.0 2008 3.1 0.6 0.6 0.6 0.8 0.3 0.2 0.0 0.0 0.1 2009 12.9 6.1 3.7 1.3 1.6 0.3 0.0 0.0 0.0 0.0 2010 11.2 3.0 2.2 1.8 1.9 0.8 1.3 0.1 0.0 0.0 aPema = Peromyscus maniculatus, Urca = Urocitellus canus, Pepa = Perognathus parvus, Lecu = Lemmiscus curtatus, Tami = Tamias minimus, Dior = Dipodomys ordii, Onle = Onychomys leucogaster, Mime = Microdipodops megacephalus, Thta = Thomomys talpoides.
11
Figure 4. Annual fluctuations in abundance of several species of small mammals in southern Harney County, Oregon during late spring. 1990–2010.
0.0 2.0 4.0 6.0 8.0
10.0 12.0 14.0 16.0 18.0 20.0
1990 1992 1995 1997 1999 2001 2003 2005 2007 2009
Peromyscus maniculatus Urocitellus canus
0.0
1.0
2.0
3.0
4.0
5.0
1990 1992 1995 1997 1999 2001 2003 2005 2007 2009
Num
ber
Cap
ture
d/10
0 Tr
ap-N
ight
s Perognathus parvus
0.0 1.0 2.0 3.0
1990 1992 1995 1997 1999 2001 2003 2005 2007 2009 Year
Lemmiscus curtatus Tamias minimus
12
Weather
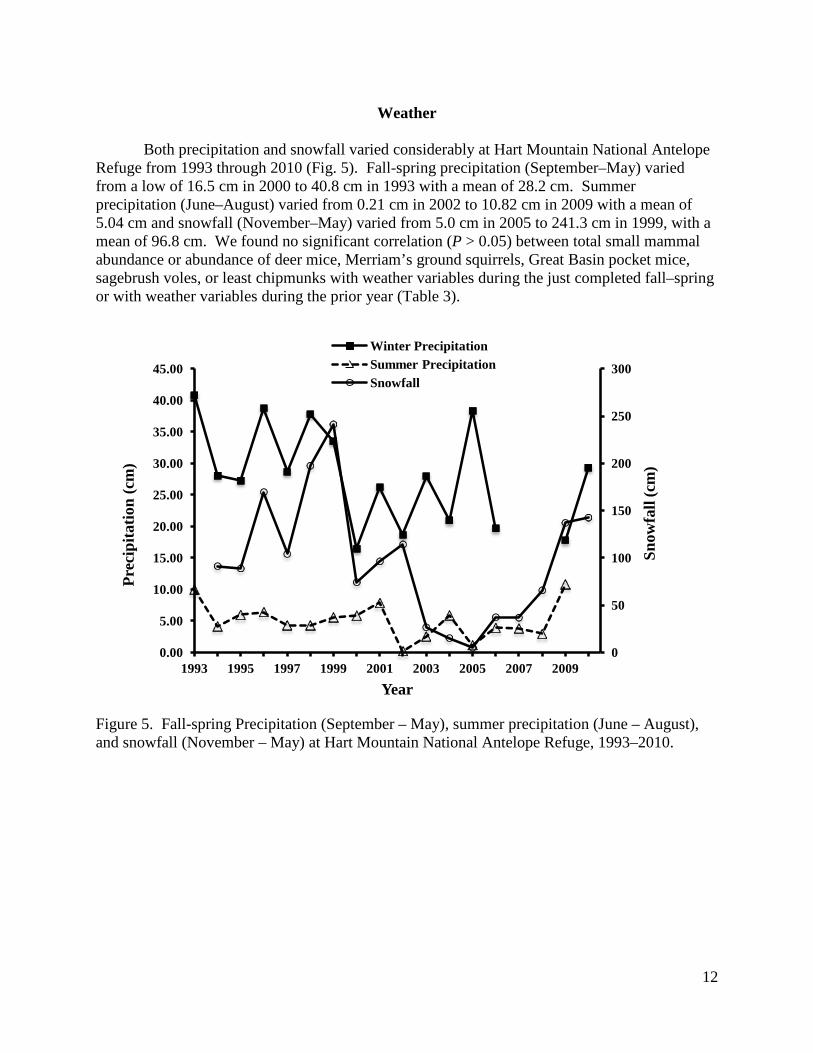
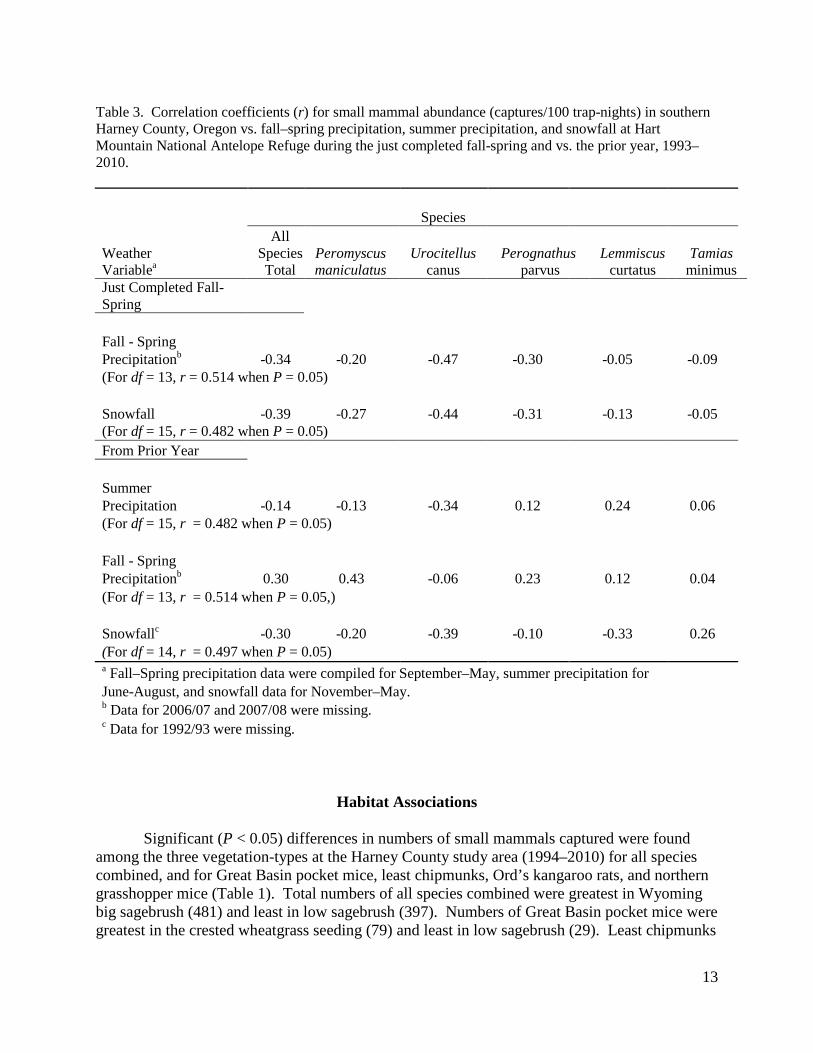
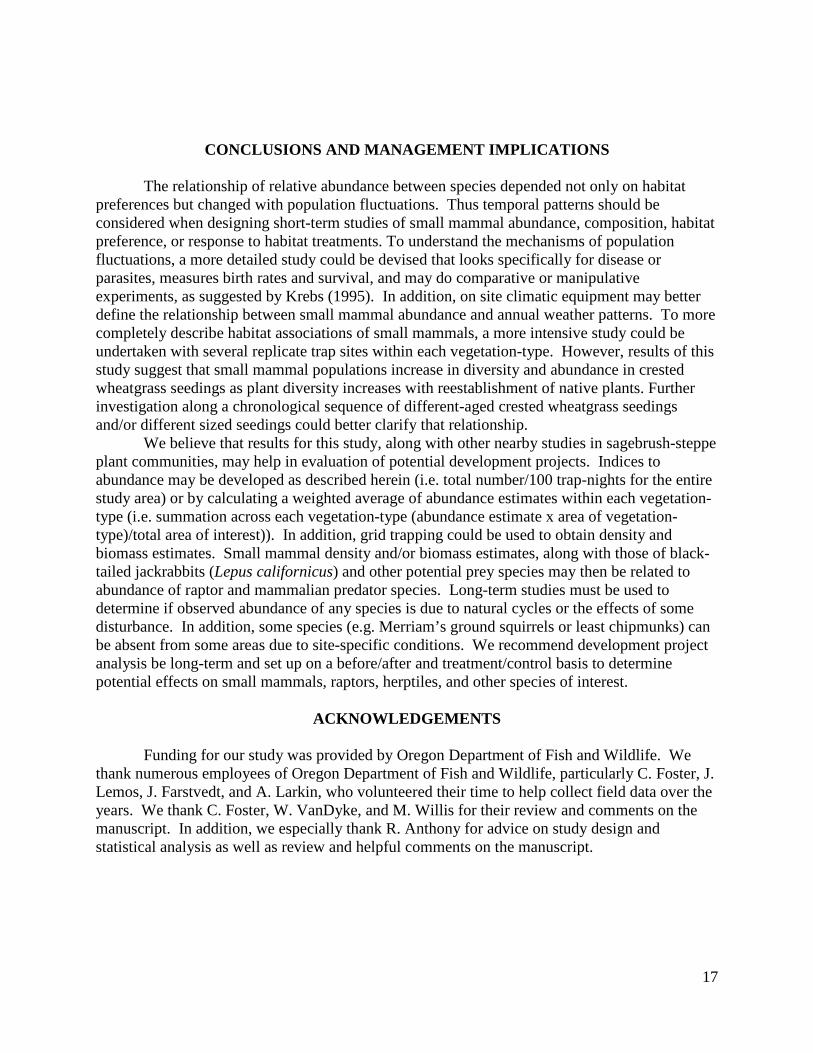
Both precipitation and snowfall varied considerably at Hart Mountain National Antelope Refuge from 1993 through 2010 (Fig. 5). Fall-spring precipitation (September–May) varied from a low of 16.5 cm in 2000 to 40.8 cm in 1993 with a mean of 28.2 cm. Summer precipitation (June–August) varied from 0.21 cm in 2002 to 10.82 cm in 2009 with a mean of 5.04 cm and snowfall (November–May) varied from 5.0 cm in 2005 to 241.3 cm in 1999, with a mean of 96.8 cm. We found no significant correlation (P > 0.05) between total small mammal abundance or abundance of deer mice, Merriam’s ground squirrels, Great Basin pocket mice, sagebrush voles, or least chipmunks with weather variables during the just completed fall–spring or with weather variables during the prior year (Table 3).
Figure 5. Fall-spring Precipitation (September – May), summer precipitation (June – August), and snowfall (November – May) at Hart Mountain National Antelope Refuge, 1993–2010.
0
50
100
150
200
250
300
0.00
5.00
10.00
15.00
20.00
25.00
30.00
35.00
40.00
45.00
1993 1995 1997 1999 2001 2003 2005 2007 2009 Sn
owfa
ll (c
m)
Prec
ipita
tion
(cm
)
Year
Winter Precipitation Summer Precipitation Snowfall
13
Table 3. Correlation coefficients (r) for small mammal abundance (captures/100 trap-nights) in southern Harney County, Oregon vs. fall–spring precipitation, summer precipitation, and snowfall at Hart Mountain National Antelope Refuge during the just completed fall-spring and vs. the prior year, 1993–2010. Species All Weather Species Peromyscus Urocitellus Perognathus Lemmiscus Tamias Variablea Total maniculatus canus parvus curtatus minimus Just Completed Fall-Spring Fall - Spring Precipitationb -0.34 -0.20 -0.47 -0.30 -0.05 -0.09 (For df = 13, r = 0.514 when P = 0.05) Snowfall -0.39 -0.27 -0.44 -0.31 -0.13 -0.05 (For df = 15, r = 0.482 when P = 0.05) From Prior Year Summer Precipitation -0.14 -0.13 -0.34 0.12 0.24 0.06 (For df = 15, r = 0.482 when P = 0.05) Fall - Spring Precipitationb 0.30 0.43 -0.06 0.23 0.12 0.04 (For df = 13, r = 0.514 when P = 0.05,) Snowfallc -0.30 -0.20 -0.39 -0.10 -0.33 0.26 (For df = 14, r = 0.497 when P = 0.05) a Fall–Spring precipitation data were compiled for September–May, summer precipitation for June-August, and snowfall data for November–May. b Data for 2006/07 and 2007/08 were missing. c Data for 1992/93 were missing.
Habitat Associations
Significant (P < 0.05) differences in numbers of small mammals captured were found among the three vegetation-types at the Harney County study area (1994–2010) for all species combined, and for Great Basin pocket mice, least chipmunks, Ord’s kangaroo rats, and northern grasshopper mice (Table 1). Total numbers of all species combined were greatest in Wyoming big sagebrush (481) and least in low sagebrush (397). Numbers of Great Basin pocket mice were greatest in the crested wheatgrass seeding (79) and least in low sagebrush (29). Least chipmunks
14
were captured most often in Wyoming big sagebrush (40) and least in low sagebrush (8). Ord’s kangaroo rats and northern grasshopper mice were captured most often in Wyoming big sagebrush. Captures were also greater in Wyoming big sagebrush for dark kangaroo mice but capture rates were too low for valid statistical comparisons. When we compared only the Wyoming big sagebrush site to the crested wheatgrass seeding, we found numbers captured similar between the two sites. There was no significant difference (χ 2 = 0.34, df = 1, P > 0.05) in total captures of all species combined (481 in big sagebrush vs. 463 in the seeding). However, captures were greater in Wyoming big sagebrush for Ord’s kangaroo rats (21 vs. 2) (χ 2 = 15.7, df = 1, P < 0.05) and northern grasshopper mice (15 vs. 3) (χ 2 = 8.0, df = 1, P < 0.05). Captures were greater (χ 2 = 5.23, df = 1, P < 0.05) in the crested wheatgrass seeding for sagebrush voles (40 vs. 22).
DISCUSSION
Composition
Species composition during our study was similar to composition found in other areas of the northern Great Basin (Feldhamer 1979b, Boula and Sharp 1985, McAdoo et al. 2006). In those studies deer mice, Great Basin pocket mice, and least chipmunks were the most abundant species. In our study before 1993, these species comprised 76% in Harney County (App. B) and 85% in Lake County (App. A). However, 22% of the captures in Malheur County were Ord’s kangaroo rats, which comprised less than 2% at the Lake and Harney County study areas, and least chipmunks were not captured in Malheur County (DeStefano 1990). In addition, in Harney County 18% of captures were Merriam’s ground squirrels, whereas they occurred in the capture only 2% of the time in Lake County and only 1 was captured in Malheur County. Likewise, after 1993, deer mice, Great Basin pocket mice, and least chipmunks comprised 68% of all captures at the Harney County study area, but Merriam’s ground squirrels were the second most abundant species, making up 21% of all captures. Elsewhere in southeastern Oregon, Feldhamer (1979b) only captured 3 Merriam’s ground squirrels and Boula and Sharp (1985) caught none.
There was an obvious difference in occurrence between areas for Merriam’s ground squirrels, which were very abundant some years in the Harney County study area but absent or near absent in the Malheur County area, the Lake County area, as well as northern Harney County (Boula and Sharp 1985), and near Malheur National Wildlife Refuge (Feldhamer 1979b). For all these areas, except the Harney County study area, Merriam’s ground squirrels were either at a low point in their cycle or habitat conditions were not favorable for the species. Likewise, least chipmunks were absent at the Malheur County study area while fairly common elsewhere.
Abundance
We found large fluctuations in total abundance of small mammals at the Harney County study area (1990–2010) from highs of > 26 captures/100 trap-nights to as low as 1 capture/100 trap-nights, with 12 years between peaks in 1994 and 2006 (Fig. 3, Table 2). While fluctuations in abundance were somewhat synchronous between species, each species exhibited its own cyclic pattern (Fig. 4). Total abundance depended primarily on abundance of deer mice, however, Merriam’s ground squirrels and Great Basin pocket mice made important contributions to total abundance some years.
15
Causes of fluctuation in abundance of small mammal populations remain poorly understood and elusive after decades of research and over 20 hypotheses (Oli and Dobson 2001). Population fluctuations caused by changes in food availability as a result of climatic variation is one such hypothesis. Verts and Kirkland (1988) reported abundance of Great Basin pocket mice were strongly and positively correlated with precipitation during the previous October–April. We found no significant relationship between total small mammal abundance or abundance of individual species (including Great Basin pocket mice) and precipitation or snowfall, either during the current year or prior year. These results indicate that neither food availability nor winter severity limited small mammal abundance during our study. In comparison, Deitloff et al. (2010) found only a weak association between climate and abundance in one of two small mammal species in a 20-year study in Minnesota. Of four climatic variables, only summer precipitation was significantly related to abundance of the white-footed mouse (Peromyscus leucopus). Other factors such as disease and predator abundance may also be important (Deitloff et al. 2010).
Important biological factors may often be difficult to detect statistically. Relative importance of factors affecting small mammal abundance may change seasonally and from year to year. In addition, some factors may have to exceed a threshold value before an effect on populations can be detected (e.g. it may be only at extreme drought conditions that food availability is affected enough to depress small mammal populations: and those conditions are seldom realized). While food availability and/or weather severity were not obvious limiting factors during our study, they may become limiting when conditions become more extreme. It is also possible that the incomplete and off site weather data available in this study were not sufficient to detect subtle influences weather may have had on small mammal populations. In addition, relationships between small mammal abundance and precipitation during time periods other than those we analyzed could have been important and could be explored.
Habitat Associations
At the Harney County study area, low sagebrush had lower overall small mammal abundance than did Wyoming big sagebrush or the crested wheatgrass seeding. Abundance of deer mice was similar in all three vegetation-types (Table 1), which agrees with Feldhamer (1979b) who found that deer mice exhibit the widest distribution between habitats in his study. In addition, Verts and Carraway (1998) documented their occurrence in most habitats in Oregon. Likewise, abundance of Merriam’s ground squirrels was similar in all three vegetation-types, indicating an equal ability to utilize those habitats, but only in that study area. The reason for the sharp difference in occurrence in Merriam’s ground squirrels between areas is not known. Feldhamer (1979b) found density of Great Basin pocket mice to be positively correlated with % sand and inversely correlated with % clay. This agrees with results in Malheur County where Great Basin pocket mice were 44% of all captures in the sand dune vegetation-type (DeStephano 1990). At the Harney County study area, abundance was similar for Great Basin pocket mouse in the Wyoming big sagebrush vegetation-type and the crested wheatgrass seeding but much less in low sagebrush. The difference is likely attributable to soil characteristics. The crested wheatgrass seeding (converted from big sagebrush), and the Wyoming big sagebrush vegetation-type shared soil characteristics, which included deeper, loamy soils. The soils in the low sagebrush vegetation-type were much shallower with more clay. Likewise, abundance of least chipmunks was similar in Wyoming big sagebrush and the crested wheatgrass seeding but
16
less in low sagebrush. Soil depth was likely the reason for the difference, because Feldhamer (1979b) found density of least chipmunks to be positively correlated with soil depth. Abundance of Ord’s kangaroo rats was likely dependent on the presence of sandy soils. Ord’s kangaroo rats comprised 34% of captures in the sand dune vegetation-type in Malheur County (DeStephano 1990). In Harney County, we captured most of the Ord’s kangaroo rats at the Wyoming big sagebrush site, in or near one area with sandy soil. Likewise, O’Farrell (1980) found the species restricted to sand dunes at his study area in west-central Nevada. Abundance of northern grasshopper mice was low (1.4% of all captures) with most captured in Wyoming big sagebrush. Feldhamer (1979b) also found a low abundance of northern grasshopper mice and only captured them in sagebrush habitats at Malheur National Wildlife Refuge (1.4% of captures in big sagebrush). Abundance of sagebrush voles was moderately high (7% of all captures), however it is likely they were under represented in the sample due to bias in the capture method. They appeared to have been much more abundant than our captures indicate, especially during their peak population years. Therefore, we believe our results should not be used to make conclusions about habitat preferences for the sagebrush vole. The Oregon Department of Fish and Wildlife estimated that by 1991 ~7,150 km2, ~9% of the total sagebrush steppe habitat in southeastern Oregon, were devoid of sagebrush and much was seeded to crested wheatgrass (Willis et al. 1993). Reasons for reseeding with crested wheatgrass include: the seed is more available and costs less; crested wheatgrass is a perennial bunchgrass that can compete with and reduce establishment of annual plants such as cheatgrass (Bromus tectorum); perennials like crested wheatgrass are less susceptible to fire than annual plants and recurring fires prevent the reestablishment of a sagebrush overstory; crested wheatgrass is not invasive (i.e. it stays where it is planted); and native plant species can reestablish with time. Despite certain advantages of using crested wheatgrass for reseeding after fires, some have questioned the effects of large habitat conversions on wildlife, particularly on small mammal populations and raptors (Howard and Wolfe 1976, Boula and Sharp 1985). Reynolds and Trost (1980) found a lower density of small mammals in an 18 year-old crested wheatgrass seeding that was grazed by sheep in comparison to both grazed and ungrazed big sagebrush habitat. Boula and Sharp (1985) trapped small mammals in three vegetation-types to assess the impacts on small mammals of converting native rangeland to crested wheatgrass. Populations of small mammals were highest and most diverse in the sagebrush habitat and fewer species and lower total captures were recorded in the seeding. The seeding in their study was 19 years of age and was still mostly a monotypic stand of crested wheatgrass without any significant reestablishment of native plant species (Boula and Sharp 1985). In contrast, total small mammal numbers in Utah were highest where sagebrush and seeded vegetation occurred together (Smith and Urness 1984). The authors suggested small-scale conversion projects might maintain or increase small mammal abundance. In our study, small mammal abundance in the crested wheatgrass seeding was similar to that in Wyoming big sagebrush and greater than in low sagebrush, even though the seeding was grazed at a greater intensity than the other two sites. We believe the difference in findings between our study and other studies (Reynolds and Trost 1980; Boula and Sharp 1985) was plant diversity within the seeding, which appears to increase with age as well as size of the seeding and proximity to native seed sources. The seeding in our study was 44 years old in 2010 with considerable reestablishment of native plant species.
17
CONCLUSIONS AND MANAGEMENT IMPLICATIONS
The relationship of relative abundance between species depended not only on habitat preferences but changed with population fluctuations. Thus temporal patterns should be considered when designing short-term studies of small mammal abundance, composition, habitat preference, or response to habitat treatments. To understand the mechanisms of population fluctuations, a more detailed study could be devised that looks specifically for disease or parasites, measures birth rates and survival, and may do comparative or manipulative experiments, as suggested by Krebs (1995). In addition, on site climatic equipment may better define the relationship between small mammal abundance and annual weather patterns. To more completely describe habitat associations of small mammals, a more intensive study could be undertaken with several replicate trap sites within each vegetation-type. However, results of this study suggest that small mammal populations increase in diversity and abundance in crested wheatgrass seedings as plant diversity increases with reestablishment of native plants. Further investigation along a chronological sequence of different-aged crested wheatgrass seedings and/or different sized seedings could better clarify that relationship. We believe that results for this study, along with other nearby studies in sagebrush-steppe plant communities, may help in evaluation of potential development projects. Indices to abundance may be developed as described herein (i.e. total number/100 trap-nights for the entire study area) or by calculating a weighted average of abundance estimates within each vegetation-type (i.e. summation across each vegetation-type (abundance estimate x area of vegetation-type)/total area of interest)). In addition, grid trapping could be used to obtain density and biomass estimates. Small mammal density and/or biomass estimates, along with those of black-tailed jackrabbits (Lepus californicus) and other potential prey species may then be related to abundance of raptor and mammalian predator species. Long-term studies must be used to determine if observed abundance of any species is due to natural cycles or the effects of some disturbance. In addition, some species (e.g. Merriam’s ground squirrels or least chipmunks) can be absent from some areas due to site-specific conditions. We recommend development project analysis be long-term and set up on a before/after and treatment/control basis to determine potential effects on small mammals, raptors, herptiles, and other species of interest.
ACKNOWLEDGEMENTS
Funding for our study was provided by Oregon Department of Fish and Wildlife. We thank numerous employees of Oregon Department of Fish and Wildlife, particularly C. Foster, J. Lemos, J. Farstvedt, and A. Larkin, who volunteered their time to help collect field data over the years. We thank C. Foster, W. VanDyke, and M. Willis for their review and comments on the manuscript. In addition, we especially thank R. Anthony for advice on study design and statistical analysis as well as review and helpful comments on the manuscript.
18
LITERATURE CITED
Boula, K. M., and P. L. Sharp. 1985. Distribution and abundance of small mammals on native and converted rangelands in southeastern Oregon. Oregon Department of Fish and Wildlife Technical Report 85-5-01. Salem, Oregon, USA. Canfield, R. H. 1941. Application of the line intercept method in sampling range vegetation. Journal of Forestry, 39:388–394. Deitloff, J., M. R. Falcy, J. D. Krenz, and B. R. McMillan. 2010. Correlating small mammal
abundance to climatic variation over twenty years. Journal of Mammalogy, 91:193-199. DeStefano, S. 1990. Investigation of the status of kit foxes in southeastern Oregon. Oregon
Department of Fish and Wildlife Technical Report 90-5-01. Salem, Oregon, USA. Evans, R. A., and R. M. Love. 1957. The step-point method of sampling: a practical tool in range research. Journal of Range Management, 10:208-212. Feldhamer, G. A. 1979a. Home range relationships of three rodent species in southeast Oregon. The Murrelet, 60:50–57. Feldhamer, G. A. 1979b. Vegetative and edaphic factors affecting abundance and distribution of small mammals in southeast Oregon. The Great Basin Naturalist, 39:207-218. Franklin, J. F. and C. T. Dyrness. 1973. Natural vegetation of Oregon and Washington. Pacific Northwest Forest and Range Experiment Station, United States Department of Agriculture Forest Service, General Technical Report PNW-8, Portland, Oregon. USA. Helgen, K. M., F. R. Cole, L. E. Helgen, and D. E. Wilson. 2009. Generic revision in the holarctic ground squirrel genus Spermophilus. Journal of Mammalogy, 90:270-305. Howard, R. P., and M. L. Wolfe. 1976. Range improvement practices and ferruginous hawks. Journal of Range Management, 29:33-37. Krebs, C. J. 1995. Two paradigms of population regulation. Wildlife Research 22:1-10. Larrison, E. J., and D. R. Johnson. 1973. Density changes and habitat affinities of rodents of shadscale and sagebrush associations. The Great Basin Naturalist, 33:255-264. McAdoo, J. K., M. R. Barrington, and M. A. Ports. 2006. Habitat affinities of rodents in northeastern Nevada rangeland communities. Western North American Naturalist, 66:321-331. O’Farrell, M. J. 1974. Seasonal activity patterns of rodents in a sagebrush community. Journal of Mammalogy, 55:809-823. O’Farrell, M. J. 1980. Spatial relationships of rodents in a sagebrush community. Journal of Mammalogy, 61:589-605. O’Farrell, M. J., and W. A. Clark. 1986. Small mammal community structure in northeastern Nevada. The Southwestern Naturalist, 31:23-32. Oli, M. K., and F. S. Dobson. 2001. Population cycles in small mammals: The α-hypothesis.
Journal of Mammalogy, 82:573-581. Reynolds, T. S., and C. H. Trost. 1980. The response of native vertebrate populations to crested wheatgrass planting and grazing by sheep. Journal of Range Management, 33:122-125. Smith, C. B., and P. J. Urness. 1984. Small mammal abundance on native and improved foothill ranges, Utah. Journal of Range Management, 37:353-357. Sneva, F. A. 1982. Relation of precipitation and temperature with yield of herbaceous plants in eastern Oregon. International Journal of Biometeorology, 27:263-276. Verts, B. J., and L. N. Carraway. 1998. Land Mammals of Oregon. University of California Press, Berkeley and Los Angeles, California, and London, England.

19
Verts, B. J., and G. L, Kirkland, Jr. 1988. Perognathus parvus, Mammalian Species, 318:1-8. Willis, M. J., G. P. Keister, Jr., D. A. Immell, D. M. Jones, R. M. Powell, and K. R. Durbin. 1993. Sage Grouse in Oregon. Oregon Department of Fish and Wildlife Research Report Number 15. Salem, Oregon, USA.

20
APPENDICES
21
Appendix A. Total number of individuals of each mammalian species captured in three vegetation-types
in Lake County, Oregon during late spring, 1990–1991.
Vegetation-Type Percent
Big Low Big Total of total
Species sagebrush 1 sagebrush sagebrush 2 captures captures
(688 trap- (596 trap- (700 trap- (1,984 trap-
nights) nights) nights) nights)
Peromyscus maniculatus 38 62 37 137 55.5
Urocitellus canus 0 4 1 5 2.0
Perognathus parvus 23 10 3 36 14.6
Lemmiscus curtatus 0 2 0 2 0.8
Tamias minimus 10 11 16 37 15.0
Dipodomys ordii 0 0 4 4 1.6
Onychomys leucogaster 0 0 1 1 0.4
Microdipodops megacephalus 2 0 23 25 10.1
Thomomys talpoides 0 0 0 0 0.0
All Species 73 89 85 247
Number of species 4 5 7 8 Percent of total captures 29.6 36.0 34.4

22
Appendix B. Total number of individuals of each mammalian species captured in three vegetation-types
in southern Harney County, Oregon during late spring, 1990–1992.
Vegetation-Type Percent
Low Low Big Total of total
Species sagebrush 1 sagebrush 2 sagebrush captures captures
(794 trap- (751 trap- (799 trap- (2,344 trap-
nights) nights) nights) nights)
Peromyscus maniculatus 51 56 51 158 52.5
Urocitellus canus 27 20 7 54 17.9
Perognathus parvus 4 8 43 55 18.3
Lemmiscus curtatus 3 1 0 4 1.3
Tamias minimus 0 3 11 14 4.7
Dipodomys ordii 0 1 4 5 1.7
Onychomys leucogaster 3 2 5 10 3.3
Microdipodops megacephalus 0 0 0 0 0.0
Thomomys talpoides 0 0 1 1 0.3
All Species 88 91 122 301
Number of species 5 7 7 8 Percent of total captures 29.2 30.2 40.5
23
Appendix C. Total numbers of each species captured at four vegetation-types in southern Harney County, Oregon during late spring, 1990–2010. Low Sagebrush 1 Low Sagebrush 2 Year T-N* Total Pema Tami Urca Pepa Lecu T-N* Total Pema Tami Urca Pepa Lecu 1990 395 47 20 0 20 4 0 352 50 23 3 16 6 0 1991 199 5 4 0 0 0 1 199 4 2 0 0 1 0 1992 200 36 27 0 7 0 2 200 37 31 0 4 1 1 1994 40 29 0 0 4 7 1995 1 0 0 0 1 0 1996 15 15 0 0 0 0 1997 4 3 0 1 0 0 1998 6 1 2 2 1 0 1999 12 10 1 0 0 1 2000 17 13 1 1 2 0 2001 10 3 0 6 1 0 2002 16 4 0 12 0 0 2003 44 36 0 3 1 3 2004 61 24 1 36 0 0 2005 28 12 0 8 0 8 2006 76 63 1 3 6 3 2007 13 4 1 1 7 0 2008 8 1 0 0 4 2 2009 27 8 1 14 1 3 2010 19 8 0 4 1 5
Hawks Valley Seeding Big Sagebrush
Year T-N* Total Pema Tami Urca Pepa Lecu T-N* Total Pema Tami Urca Pepa Lecu 1990 400 65 14 7 5 32 0 1991 199 13 4 1 1 7 0 1992 200 44 33 3 1 4 0 1994 200 74 50 4 0 16 4 200 46 25 3 5 6 3 1995 200 1 0 1 0 0 0 197 4 1 0 1 2 0 1996 200 11 7 0 1 2 1 200 15 12 1 0 1 1 1997 199 1 0 0 0 0 1 198 4 4 0 0 0 0 1998 116 14 7 2 0 5 0 200 10 1 4 0 2 1 1999 199 8 6 0 1 0 1 200 4 4 0 0 0 0 2000 291 54 23 7 5 18 0 284 28 11 7 4 3 1 2001 300 3 2 1 0 0 0 300 9 0 4 2 2 0 2002 300 11 0 0 10 1 0 300 4 1 0 3 0 0 2003 300 42 20 4 13 4 1 298 65 41 2 12 5 2 2004 299 34 10 0 11 13 0 300 84 22 2 50 6 0 2005 300 14 4 1 8 1 0 300 34 21 2 3 5 1 2006 303 84 39 2 28 7 6 299 79 44 4 9 9 6 2007 300 21 6 4 1 3 5 300 31 6 6 0 15 4 2008 300 9 2 1 2 0 4 300 11 2 2 3 1 1 2009 299 43 25 1 6 5 6 127 11 5 0 3 2 1 2010 298 39 11 4 9 4 11 300 42 8 3 7 11 1 * T-N = Trap-nights
24
Appendix D. Small mammal abundance (captures/100 trap-nights) at four vegetation-types in southern Harney County, Oregon during late spring, 1990–2010. Low Sagebrush 1 Low Sagebrush 2 Year Total Pema Tami Urca Pepa Lecu Total Pema Tami Urca Pepa Lecu 1990 11.90 5.06 0.00 5.06 1.01 0.00 14.20 6.53 0.85 4.55 1.70 0.00 1991 2.51 2.01 0.00 0.00 0.00 0.50 2.01 1.01 0.00 0.00 0.50 0.00 1992 18.00 13.50 0.00 3.50 0.00 1.00 18.50 15.50 0.00 2.00 0.50 0.50 1994 20.00 14.50 0.00 0.00 2.00 3.50 1995 0.51 0.00 0.00 0.00 0.51 0.00 1996 7.50 7.50 0.00 0.00 0.00 0.00 1997 2.00 1.50 0.00 0.50 0.00 0.00 1998 3.00 0.50 1.00 1.00 0.50 0.00 1999 6.00 5.00 0.50 0.00 0.00 0.50 2000 7.49 5.73 0.44 0.44 0.88 0.00 2001 3.33 1.00 0.00 2.00 0.33 0.00 2002 5.33 1.33 0.00 4.00 0.00 0.00 2003 14.67 12.00 0.00 1.00 0.33 1.00 2004 20.47 8.05 0.34 12.08 0.00 0.00 2005 9.33 4.00 0.00 2.67 0.00 2.67 2006 25.00 20.72 0.33 0.99 1.97 0.99 2007 4.35 1.34 0.33 0.33 2.34 0.00 2008 2.67 0.33 0.00 0.00 1.33 0.67 2009 13.37 3.96 0.50 6.93 0.50 1.49 2010 6.40 2.69 0.00 1.35 0.34 1.68 Hawks Valley Seeding Big Sagebrush Year Total Pema Tami Urca Pepa Lecu Total Pema Tami Urca Pepa Lecu 1990 16.25 3.50 1.75 1.25 8.00 0.00 1991 6.53 2.01 0.50 0.50 3.52 0.00 1992 22.00 16.50 1.50 0.50 2.00 0.00 1994 37.00 25.00 2.00 0.00 8.00 2.00 23.00 12.50 1.50 2.50 3.00 1.50 1995 0.50 0.00 0.50 0.00 0.00 0.00 2.03 0.51 0.00 0.51 1.02 0.00 1996 5.50 3.50 0.00 0.50 1.00 0.50 7.50 6.00 0.50 0.00 0.50 0.50 1997 0.50 0.00 0.00 0.00 0.00 0.50 2.02 2.02 0.00 0.00 0.00 0.00 1998 12.07 6.03 1.72 0.00 4.31 0.00 5.00 0.50 2.00 0.00 1.00 0.50 1999 4.02 3.02 0.00 0.50 0.00 0.50 2.00 2.00 0.00 0.00 0.00 0.00 2000 18.56 7.90 2.41 1.72 6.19 0.00 9.86 3.87 2.46 1.41 1.06 0.35 2001 1.00 0.67 0.33 0.00 0.00 0.00 3.00 0.00 1.33 0.67 0.67 0.00 2002 3.67 0.00 0.00 3.33 0.33 0.00 1.33 0.33 0.00 1.00 0.00 0.00 2003 14.00 6.67 1.33 4.33 1.33 0.33 21.81 13.76 0.67 4.03 1.68 0.67 2004 11.37 3.34 0.00 3.68 4.35 0.00 28.00 7.33 0.67 16.67 2.00 0.00 2005 4.67 1.33 0.33 2.67 0.33 0.00 11.33 7.00 0.67 1.00 1.67 0.33 2006 27.72 12.87 0.66 9.24 2.31 1.98 26.42 14.72 1.34 3.01 3.01 2.01 2007 7.00 2.00 1.33 0.33 1.00 1.67 10.33 2.00 2.00 0.00 5.00 1.33 2008 3.00 0.67 0.33 0.67 0.00 1.33 3.67 0.67 0.67 1.00 0.33 0.33 2009 14.38 8.36 0.33 2.01 1.67 2.01 8.66 3.94 0.00 2.36 1.57 0.79 2010 13.09 3.69 1.34 3.02 1.34 3.69 14.00 2.67 1.00 2.33 3.67 0.33