COMPOSITE MAGNETIC ANOMALY MAP OF THE UNITED STATES · COMPOSITE MAGNETIC ANOMALY MAP OF THE UNITED...
60
DEPARTMENT OF THE INTERIOR UNITED STATES GEOLOGICAL SURVEY TO ACCOMPANY MAP GP-954A COMPOSITE MAGNETIC ANOMALY MAP OF THE UNITED STATES PART A: CONTERMINOUS UNITED STATES Compiled under the direction of Isidore Zietz UNITED STATES GEOLOGICAL SURVEY In cooperation with THE SOCIETY OF EXPLORATION GEOPHYSICISTS EDITORIAL COMMITTEE Isidore Zietz, Chairman John D. Corbett Gordon P. Eaton Michael D. Fuller Richard H. Godson William F. Hanna James R. Heirtzler WilliamJ. Hinze James A Schwartz The accompanying magnetic-anomaly map of the conterminous United States and adjacent offshore areas was compiled as a cooperative effort by the U.S. Geological Survey and the Society of Exploration Geophysicists (Hinze, 1976). The map is published in two sheets in color showing magnetic-anomaly contours at an interval of 200 gammas (nanoteslas) with supplemental contours at an interval of 100 gammas on an Albers equal-area projection atthe scale of 1:2,500,000. The map may be compared directly with the tectonic (U.S. Geol. Survey and Am. Assoc. Petroleum Geologists, 1961), Bouguer gravity anomaly (Am. Geophys. Union, 1964), basement rock (Bayley and Muehlberger, 1968), and geologic (King and Beikman, 1974) maps of the contermin- ous United States published by the U.S. Geological Survey in coopera- tion with professional societies. Hundreds of magnetic-data sources were used in the map compila- tion. Most of them were total-intensity aeromagnetic-anomaly data; others included total-intensity ground and shipborne magnetic-anomaly data· and vertical-intensity ground magnetic-anomaly data. Flight al- titudes, directions, and spacings of aeromagnetic surveys varied widely; no attempt was made to analytically continue magnetic-anomaly data to a common altitude. The anomaly data were referenced to numerous mag- netic-field datums; however, an attempt was made to adjust most ano- maly data to a common magnetic-field datum. On the basis of compari- sons with aeromagnetic-anomaly data of the U.S. Naval Oceanographic Office and the National Uranium Resource Evaluation (NURE) program of the Department of Energy, we inferred that the zero level of the com- piled map is approximately 1,000 gammas higher than the zero level of data based on the International Geomagnetic Reference Field (IGRF). Because the quality of the map is limited by the diversity of data types, data-acquisition specifications and the compilation techniques, it is strongly recommended that the map be used only at the 1:2,500,000 publication scale or smaller scales of interest in broad regional investiga- tions. For more detailed work at scales larger than the 1:2,500,000 publi- cation scale, we recommend that original data sources be used. Compilation involved the following steps: ( 1) Magnetic anomaly data of a given survey were inspected and, as necessary, were referenced to the IGRF (Fabiano and Peddie, 1969; Barraclough and Fabiano, 1978), adjusted for the time of the survey, and an arbitrary zero datum; 1 (2) contour lines at an interval of 100 or 200 gammas were selected; (3) the map of the selected contour lines was reduced to the 1:1,000,000 compilation scale; (4) the reduced map was placed on an albers equal-area projection master base map of the contermin- ous United States and offshore areas; (5) near the boundaries of adjacent sur- veys, contour lines were visually joined as smoothly as possible; and (6) where major discontinuities of anomaly values existed, contoured NURE data were used to guide the connecting of contour lines; and (7) the map at the 1:1,000,000 compilation scale was photographically reduced to the 1:2,500,000 publication scale. The NURE data, acquired during a 7 -year period for the conterminous United States and referenced to the IGRF, provided a reliable base net for con- trolling the compilation of individual surveys. As an independent check on the validity of the compilation, profiles from the map were compared with a series of north-south aeromagnetic traverses of the U.S. Naval Oceanographic Office (NOO). The traverses were flown in 1976 and 1977 and were spaced approxi- mately one degree of longitude apart across the conterminous United States. This comparison shows that the compiled data agree with the NOO data, after adjustment to the IGRF, to within 100 gammas throughout the country. Mag- netic profiles for the 83°W, 90°W, and 119°W meridians comparing total inten- sity magnetic anomaly data obtained from the NOO survey with those taken from the composite U.S. magnetic anomaly map are shown in Figure 1. The magnetic profiles along each meridian are arbitrarily displaced vertically to ef- fect a better visual comparison. Individual data sources used in the map compilation are shown on index maps. These index maps are keyed to the "Sources of Data" and "Specifica- tions" (direction, altitude, and spacing of traverses), shown later in this pam- phlet. Index maps for the Atlantic Ocean, Gulf of Mexico, and Pacific Ocean are included. 1 Exceptions: IGRF 1965.0 not updated, was removed from total-intensity data of reference B, Illinois; reference E, Nebraska; reference A, Ohio; andre- ference 2, Oregon. A field of 9 gammas per mile north and 3.2 gammas per mile east was removed from vertical-intensity data of reference F, South Dakota. Unknown reference fields were removed from vertical-intensity data of reference H, Missouri, and reference 38, New Mexico. It is not known whether a reference field has been removed from the total-intensity or vertical- intensity data of reference 26, New Mexico.
Transcript of COMPOSITE MAGNETIC ANOMALY MAP OF THE UNITED STATES · COMPOSITE MAGNETIC ANOMALY MAP OF THE UNITED...
DEPARTMENT OF THE INTERIOR UNITED STATES GEOLOGICAL SURVEY
TO ACCOMPANY MAP GP-954A
COMPOSITE MAGNETIC ANOMALY MAP OF THE UNITED STATES
PART A: CONTERMINOUS UNITED STATES
Compiled under the direction of
Isidore Zietz
UNITED STATES GEOLOGICAL SURVEY In cooperation with
THE SOCIETY OF EXPLORATION GEOPHYSICISTS
EDITORIAL COMMITTEE Isidore Zietz, Chairman
John D. Corbett Gordon P. Eaton Michael D. Fuller
Richard H. Godson William F. Hanna James R. Heirtzler WilliamJ. Hinze
James A Schwartz
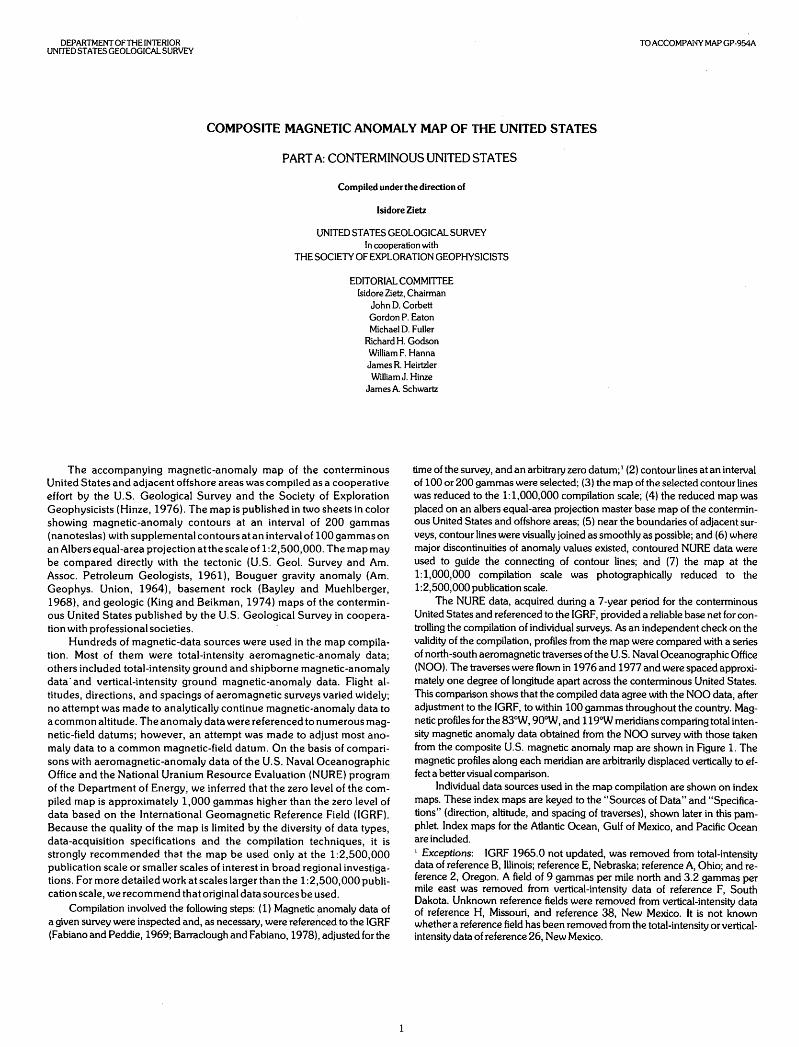
The accompanying magnetic-anomaly map of the conterminous United States and adjacent offshore areas was compiled as a cooperative effort by the U.S. Geological Survey and the Society of Exploration Geophysicists (Hinze, 1976). The map is published in two sheets in color showing magnetic-anomaly contours at an interval of 200 gammas ( nanoteslas) with supplemental contours at an interval of 100 gammas on an Albers equal-area projection atthe scale of 1:2,500,000. The map may be compared directly with the tectonic (U.S. Geol. Survey and Am. Assoc. Petroleum Geologists, 1961), Bouguer gravity anomaly (Am. Geophys. Union, 1964), basement rock (Bayley and Muehlberger, 1968), and geologic (King and Beikman, 1974) maps of the conterminous United States published by the U.S. Geological Survey in cooperation with professional societies.
Hundreds of magnetic-data sources were used in the map compilation. Most of them were total-intensity aeromagnetic-anomaly data; others included total-intensity ground and shipborne magnetic-anomaly data· and vertical-intensity ground magnetic-anomaly data. Flight altitudes, directions, and spacings of aeromagnetic surveys varied widely; no attempt was made to analytically continue magnetic-anomaly data to a common altitude. The anomaly data were referenced to numerous magnetic-field datums; however, an attempt was made to adjust most anomaly data to a common magnetic-field datum. On the basis of comparisons with aeromagnetic-anomaly data of the U.S. Naval Oceanographic Office and the National Uranium Resource Evaluation (NURE) program of the Department of Energy, we inferred that the zero level of the compiled map is approximately 1,000 gammas higher than the zero level of data based on the International Geomagnetic Reference Field (IGRF). Because the quality of the map is limited by the diversity of data types, data-acquisition specifications and the compilation techniques, it is strongly recommended that the map be used only at the 1:2,500,000 publication scale or smaller scales of interest in broad regional investigations. For more detailed work at scales larger than the 1:2,500,000 publication scale, we recommend that original data sources be used.
Compilation involved the following steps: ( 1) Magnetic anomaly data of a given survey were inspected and, as necessary, were referenced to the IGRF (Fabiano and Peddie, 1969; Barraclough and Fabiano, 1978), adjusted for the
time of the survey, and an arbitrary zero datum; 1 (2) contour lines at an interval of 100 or 200 gammas were selected; (3) the map of the selected contour lines was reduced to the 1:1,000,000 compilation scale; (4) the reduced map was placed on an albers equal-area projection master base map of the conterminous United States and offshore areas; (5) near the boundaries of adjacent surveys, contour lines were visually joined as smoothly as possible; and (6) where major discontinuities of anomaly values existed, contoured NURE data were used to guide the connecting of contour lines; and (7) the map at the 1:1,000,000 compilation scale was photographically reduced to the 1:2,500,000 publication scale.
The NURE data, acquired during a 7 -year period for the conterminous United States and referenced to the IGRF, provided a reliable base net for controlling the compilation of individual surveys. As an independent check on the validity of the compilation, profiles from the map were compared with a series of north-south aeromagnetic traverses of the U.S. Naval Oceanographic Office (NOO). The traverses were flown in 1976 and 1977 and were spaced approximately one degree of longitude apart across the conterminous United States. This comparison shows that the compiled data agree with the NOO data, after adjustment to the IGRF, to within 100 gammas throughout the country. Magnetic profiles for the 83°W, 90°W, and 119°W meridians comparing total intensity magnetic anomaly data obtained from the NOO survey with those taken from the composite U.S. magnetic anomaly map are shown in Figure 1. The magnetic profiles along each meridian are arbitrarily displaced vertically to effect a better visual comparison.
Individual data sources used in the map compilation are shown on index maps. These index maps are keyed to the "Sources of Data" and "Specifications" (direction, altitude, and spacing of traverses), shown later in this pamphlet. Index maps for the Atlantic Ocean, Gulf of Mexico, and Pacific Ocean are included. 1 Exceptions: IGRF 1965.0 not updated, was removed from total-intensity data of reference B, Illinois; reference E, Nebraska; reference A, Ohio; andreference 2, Oregon. A field of 9 gammas per mile north and 3.2 gammas per mile east was removed from vertical-intensity data of reference F, South Dakota. Unknown reference fields were removed from vertical-intensity data of reference H, Missouri, and reference 38, New Mexico. It is not known whether a reference field has been removed from the total-intensity or verticalintensity data of reference 26, New Mexico.

EXPLANATION
---- Aeromagnetic profile flown by U.S. Naval Oceanographic Office
----- Aeromagnetic profile from map in this report
CANADA UNITED STATES
UNITED STATES MEXICO
GAMMAS
~ ~
2
FLORIDA GULF OF MEXICO
NO DATA
GAMMAS 0 0 ~ 0 N ~
~ c:> :z g s: 1'2
Figure 1.-Comparison of selected north-south aeromagnetic profiles from map in this report and those from the U.S. Naval Oceanographic Office ..

Acknowledgements
The cooperative arrangement between the U.S. Geological Survey and the Society of Exploration Geophysicists, effected in 1975, resulted in formation of the National Magnetic Anomaly Map (NMAM) Committee, which interacted with a group of U.S. Geological Survey personnel. Current members of the NMAM Committee are:
WilliamJ. Hinze, Chairman (Purdue University) Anthony R. Barringer (Barringer Research Inc.) Sheldon Breiner (Geometries) LeRoy Brow (Exxon Production Research Co.) James E. Case (U.S. Geological Survey) Howard L. Cobb (Atlantic Richfield Co.) John D. Corbett (Anaconda Minerals Co.) Michael D. Fuller (University of California at Santa Barbara) James R. Heirtzler (Woods Hole Oceanographic Inst.) Charles E. Helsley (University of Hawaii) Robert H. Higgs (U.S. Naval Oceanographic Office) Robert A. Langel (U.S. National Aeronautics & Space Admin.) H. David Maclean (Gulf Mineral Resources Co.) Emil J. Mateker, Jr. (Aero Service Co.) AlfredJ. Navazio (Carson Helicopters) George Podolsky (Kidd Creek Mines Ltd.) MichaelS. Reford (Geoterrex Ltd.) James A. Schwartz (Gulf Oil Exploration and Production Co.) Paul H. Serson (Canada Dept. of Energy, Mines & Resources) Kendall L. Svendsen (U.S. National Oceanic & Atmospheric Admin.) Eric E. Wicherts (Amoco International Co.) RichardJ. Wold (U.S. Geological Survey) Isidore Zietz (Phoenix Corp.) W. Glen Zinn (Moly Corp. Inc.)
Previous members of the committee and their affiliation during their period of participation are:
Joseph W. Berg, Jr. (National Academy of Sciences) Bimal K. Bhattacharyya (Deceased) (U.S. Geological Survey) Ernest J. lufer (U.S. National Aeronautics & Space Admin.) John F. Landau (Gulf Research & Development Co.) P. L. Lawrence (Mobil Oil Corporation) D. Beadle Moore (Exxon Co., U. S. A.) Robert F. McMahon (Chevron Oil Co.) Robert D. Regan (U.S. Geological Survey)
U.S. Geological Survey coordinators of the cooperative effort were Martin F. Kane, William F. Hanna, Gordon P. Eaton, and Charles J. Zablocki. Richard D. Hovey (Chevron Overseas Petroleum Co.) and Val W. Chandler (Minnesota Geological Survey) assisted the Editorial Committee in reviewing selected areas of preliminary versions of the map.
The Amoco Production Company, Chevron Oil Company, Gulf Oil Corporation, and Mobil Exploration and Production Services contributed data to the map. Compilation of the map was performed by Kevin R. Bond, Francis P. Gilbert (Deceased), John R. Kirby, Frederic E. Riggle, and Stephen L. Snyder, all of the U.S. Geological Survey.
3
References Cited
American Geophysical Union, Special Committee for the Geophysical and Geological Study of the Continents, 1964, Bouguer gravity anomaly map of the United States (exclusive of Alaska and Hawaii): Washington, D.C., U.S. Geological Survey, 2 sheets, scale 1:2,500,000.
Barraclough, D. R., and Fabiano, E. B., 1978, Grid values and charts for the International Geomagnetic Reference Field-1975: U.S.Department of Commerce, National Technical Information Service PB-276 630, 139 p.
Bayley, R. W., and Muehlberger, W. R., compilers, 1968, Basement rock map of the United States (exclusive of Alaska and Hawaii): Washington, D.C., U.S. Geological Survey, 2 sheets, scale 1:2,500,000.
Fabiano, E. B., and Peddie, N. W., 1969, Grid values of total magnetic intensity, IGRF-1965: U.S. Environmental Science Services Administration Technical Report, C and GS 38, 55 p.
Hinze, W. J., 1976, Report of the SEG Committee for a National Magnetic Anomaly Map: Geophysics, v. 41, no. 5, p. 1055.
King, P. B., and Beikman, H. M., compilers 1974, Geologic map ofthe United States (exclusive of Alaska and Hawaii): Reston, Va., U.S. Geological Survey, 3sheets, scale 1:2,500,000.
U.S. Geological Survey and American Association of Petroleum Geologists, 1961, Tectonic map of the United States (exclusive of Alaska and Hawaii):Washington, D.C., U.S. Geological Survey, 2 sheets, scale 1:2,500,000.

ALABAMA
88° 87" 86° 35°\ ----- ------ --,
l \
I \
F K \ :A I
34°
I
I \
\ I I B G \
I \
\ I 33°
\
I \85° I
I
I c
32°-
H
N
'
\ \
D I o I
31'-
I
' E J \
I
' 50 100 MILES
50 100
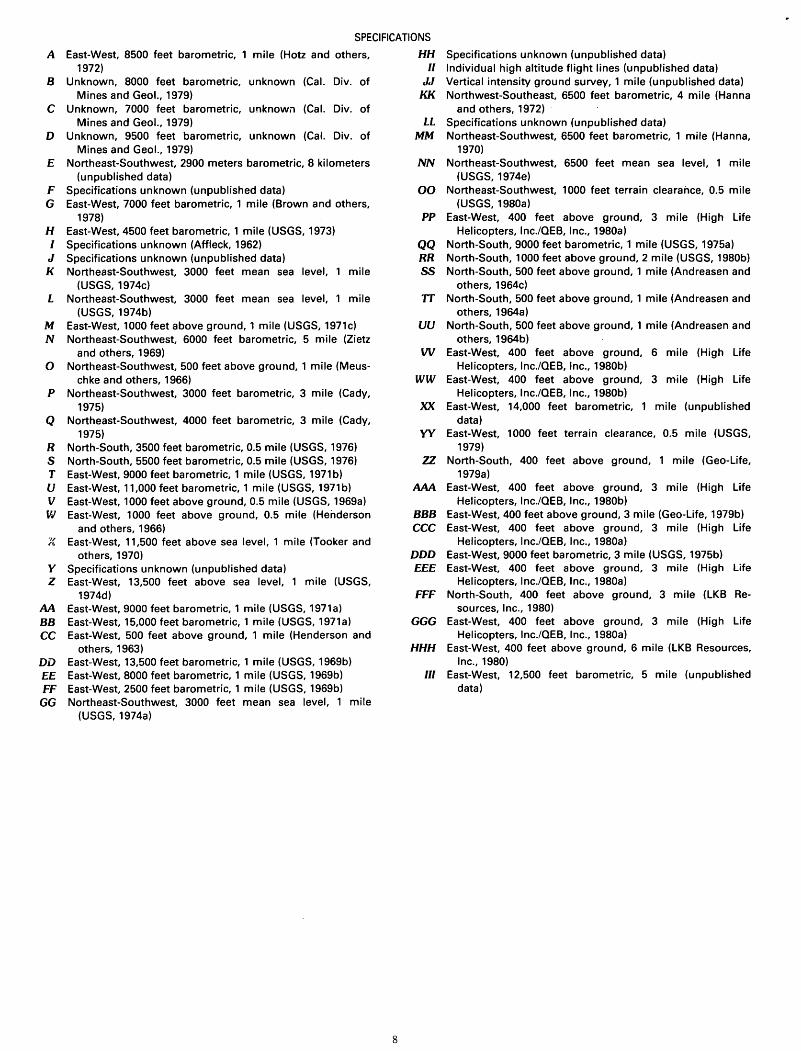
SPECIFICATIONS
A East-West, 400 feet above ground, 6 mile (EG&G GeoMetries, 1980d) B East-West, 400 feet above ground, 6 mile (EG&G GeoMetries, 1980c) C East-West, 400 feet above ground, 6 mile (EG&G GeoMetries, 1980a) D East-West, 400 feet above ground, 6 mile (EG&G GeoMetries, 1980b) E East-West, 400 feet above ground, 6 mile (EG&G GeoMetries, 1980e) F East-West, 400 feet above ground, 6 mile (North half) and 3 mile
(South half) (High Life/OEB, 1980) G East-West,400feetaboveground, 3 mile (High Life/OEB, 1980) H East-West, 400feet above ground, 3 mile (North half) and 6 mile
(South half) (Geodata, 1980a) I East-West, 400 feet above ground, 6 mile (EG&G GeoMetries, 1981 c) J East-West, 400 feet above ground, 6 mile (EG&G GeoMetries, 1981 b) K East-West, 400 feet above ground, 6 mile (Carson Helicopters, 1980) L Northwest-Southeast, 1000 feetterrain clearance, 1% mile
(Geoterrex, 1969) M North-South, 152 meters above ground, 1.6 kilometers
(Neathery and others, 1976) N East-West,400feetaboveground, 6 mile (Geodata, 1980b) 0 East-West, 400feet above ground, 6 mile (EG&G GeoMetries, 1981 a)
I \.
4
SOURCES OF DATA
Carson Helicopters, Inc., 1980, National Uranium Resource Evaluation aerial gamma-ray and magnetic reconnaissance survey of portions of Alabama, Georgia, Kentucky, Maryland, North Carolina, Ohio, Pennsylvania, Virginia, and West Virginia, Rome quadrangle-Final Report: U.S. Department of Energy Grand Junction Office [Report] GJBX 92-80, v. 2, n.p., scale 1:500,000.
EG&G GeoMetries, 1980a, National Uranium Resource Evaluation aerial gamma-ray and magnetic reconnaissance survey, Meridian quadrangle, Mississippi and Alabama-Final Report: U.S. Department of Energy Grand Junction Office [Report] GJBX 154-80, v. 2, n.p., scale 1:500,000.
___ 1980b, National Uranium Resource Evaluation aerial gamma-ray and magnetic reconnaissance survey, Hattiesburg quadrangle, Mississippi, Alabama, and Louisiana-Final Report: U.S. Department of Energy Grand Junction Office [Report] GJBX 155-80, v. 2, n.p., scale 1:500,000.
___ 1980c, National Uranium Resource Evaluation aerial gamma-ray and magnetic reconnaissance survey, West Point quadrangle, Mississippi and Alabama-Final Report: U.S. Department of Energy Grand Junction Office [Report] GJBX 181-80, v. 2, n.p., scale 1:500,000.
___ 1980d, National Uranium Resource Evaluation aerial gamma-ray and magnetic reconnaissance survey, Tupelo quadrangle, Mississippi, Alabama, and Tennessee -Final Report: U.S. Department of Energy Grand Junction Office [Report] GJBX 203-80, v. 2, n.p., scale 1:500,000.
___ 1980e, National Uranium Resource Evaluation aerial gamma-ray and magnetic reconnaissance survey, Mobile quadrangle, Louisiana, Mississippi, and Alabama-Final Report: U.S. Department of Energy Grand Junction Office [Report] GJBX 222-80, v. 2, n.p., scale 1:500,000.
___ 1981a, National Uranium Resource Evaluation aerial gamma-ray and magnetic survey, Dothan quadrangle, Georgia and Alabama-Final Report: U.S. Department of Energy Grand Junction Office [Report] GJBX 121-81, v. 2, n.p., scale 1:500,000.
___ l981b, National Uranium Resource Evaluation aerial gamma-ray and magnetic survey, Pensacola quadrangle, Florida and Alabama -Final Report: U.S. Department of Energy Grand Junction Office [Report] GJBX 122-81, v. 2, n.p., scale 1:500,000.
___ 1981c, National Uranium Resource Evaluation aerial gamma-ray and magnetic survey, Andalusia quadrangle, Alabama -Final Report: U.S. Department of Energy Grand Junction Office [Report] GJBX 123-81, v. 2, n.p., scale 1:500,000.
Geodata International, Inc., 1980a, National Uranium Resource Evaluation aerial radiometric and magnetic survey, Montgomery quadrangle-Final Report: U.S. Department of Energy Grand Junction Office [Report] GJBX 101-80, v. 2, n.p., scale 1:500,000.
___ 1980b, National Uranium Resource Evaluation aerial radiometric and magnetic survey, Phenix City quadrangle, Alabama and Georgia-Final Report: U.S. Department of Energy Grand Junction Office [Report] GJBX 101-80, v. 2, n.p., scale 1:500,000.
Geoterrex Limited, 1969, High sensitivity reconnaissance aeromagnetic survey of portions of Alabama and Tennessee, scale 1:500,000.
High Life Helicopters, Inc./QEB, Inc., 1980, National Uranium Re-source Evaluation aerial gamma-ray and magnetic reconnaissance survey (F) Gadsden quadrangle, (G) Birmingham quadrangleFinal Report: U.S. Department of Energy Grand Junction Office [Report] GJBX 70-80, v. 2, n.p., scale 1:500,000.
Neathery, T. L., Bentley, R. D., Higgins, M. W., and Zietz, Isidore, 1976, Preliminary interpretation of aeromagnetic and aeroradioactivity maps of the Alabama piedmont: Geology, v . . ti, no. 6, p. 375-381.
_/ ........... _

114° 113° 111° 110° 109° 112° 37" ---- ---t-
I
\ I
A~ H
,-/~ _ _/ 36"
B I
I \ G
35° \
' \ ' "' c
34°-
( D
I 33° -
I E ............
~2" ....
0 .,
N I
............ --~ ----
0 50 100 MILES 'Ill 1111 I I I I I
I I 0 50 100 150 KILOMETERS
SPECIFICATIONS
A East-West,400feetaboveground, 3 mile (Western Geophysical Co., 1979)
B North-South,8000feetbarometric, 1 mile(USGS, 1972a) C North-South, 9000feetabove sea level,3 mile (Sauck and
Sumner, 1970) D North-South, 400feet above ground, 3 mile (LKB Resources,
Inc., 1980) E East-West,400feetabove ground, 6 mile (LKB Resources,
Inc., 1980). F North-South, 2400feet barometric, 1 mile (Mitchell and
Zandle, 1965) G East-West, 400 feet aboveground, 3 mile (EG&G GeoMetries,
Inc., 1979a) H East-West,400feetaboveground,3mile (EGBtG GeoMetries,
Inc., 1979b) I East-West,400feetaboveground, 3 mile (EG&G GeoMetries,
Inc., 1979b) J North-South, 11 ,OOOfeetabovesea level,3 mile (Sauck and
Sumner, 1970) K East-West, 10,500feetbarometric, 1 mile(USGS, 1972b) L East-West, 1500feet mean terrain clearance, 0.6 mile
(USGS, 1979) M North-South, 1500feetmeanterrainclearance, 1 mile
(USGS, 1979) N North-South,400feetabove ground,3 miiEHTexas
Instruments, Inc., 1979) 0 North-South, 9000feetabovesea level, 1.5mile.(Sauckarld
Sumner, 1970)
5
ARIZONA
SOURCES OF DATA
EG&G GeoMetries, Inc., 1979a, National Uranium Resource Evaluation aerial gamma-ray and magnetic survey, Raton Basin Project, Flagstaff quadrangle, Arizona-Final Report: U.S. Department of Energy Grand Junction Office [Report] GJBX 157-79, v. 2, n.p., scale 1:500,000.
___ 1979b, National Uranium Resource Evaluation aerial gammaray and magnetic survey, Raton Basin Project, Shiprock and Gallup quadrangles, Arizona/New Mexico and Albuquerque quadrangle, New Mexico-Final Report: U.S. Department of Energy Grand Junction Office [Report] GJBX 116-79, v. 2, n.p., scale 1:500,000.
LKB Resources, Inc., 1980, National Uranium Resource Evaluation aerial gamma-ray and magnetic reconnaissance survey, Colorado/ Arizona area, Salton Sea, El Centro, Phoenix, Ajo and Lukeville quadrangles-Final Report: U.S. Department of Energy Grand Junction Office [Report] GJBX 12-80, v. 2, n. p., scale 1:500,000.
Mitchell, C. M., and Zandle, G. L., 1965, Aeromagnetic map of the Casa Grande area, Maricopa and Pinal Counties, Arizona: U.S. Geological Survey Geophysical Investigations Map GP-548, scale 1:62,500.
Sauck, W. A., and Sumner, J. S., 1970, Residual aeromagnetic map of Arizona: Tucson, Ariz., University of Arizona Department of Geosciences, The Laboratory of Geophysics, scale 1:500,000.
Texas Instruments, Inc., 1979, National Uranium Resource Evaluation aerial radiometric and magnetic reconnaissance survey of portions of Arizona-New Mexico, Douglas quadrangle-Final Report: U.S . Department of Energy Grand Junction Office [Report] GJBX 23-79, v. 2f, n.p., scale 1:500,000.
U.S. Geological Survey, 1972a, Aeromagnetic map of the Gold ButteChloride area, Arizona and Nevada: U.S. Geological Survey Geophysical Investigations Map GP-75 7, 2 sheets, scale 1:62,500.
___ 1972b, Aeromagnetic map of the Morenci-Monticello area, southeastern Arizona and southwestern New Mexico: U.S. Geological Survey Geophysical Investigations Map GP-838, scale 1:250,000.
___ 1979, Aeromagnetic map of the north and west parts of th·e Silver City 1 o by 2° quadrangle, New Mexico and Arizona: U.S. Geological Survey Open-File Report 79-1452, 5 sheets, scale 1:62,500.
Western Geophysical Co. of America, 1979, National Uranium Resource Evaluation aerial gamma-ray and magnetic survey of Las Vegas, Kingman, Williams, and Prescott quadrangles, Nevada, California, and Arizona-Final Report: U.S. DepartmentofEnergyGrandJunctionOffice [Report] GJBX59-79, v. 2, n.p., scale 1:500,000.

ARKANSAS
,--- 1------ ~--- ------ ---\.
\ A E I I
/
I / go• --, 36"
I
\ ? I B F J ~I I
I s· _j_ , . .1
I / I ,.\
I c G K f) I
I If I }
I D ~ \...:-1 \
H L ~ I \
I J
33°-1. ----- ------ ___ j_
50 100 MILES t-r-'-r'' ,, • .__,,rl~.-o __.___.,----L,'o.-1 o_,_,__.___._,.5,........~o ~ILOMETERS
SPECIFICATIONS
A East-West, 400feetaboveground, 3 mile (Texas Instruments, Inc., 1978) B East-West,400feetaboveground, 6 mile (EG&G GeoMetries, 1980f) C East-West,400feetabove ground, 6 mile (Geo-Life, 1979b) D East-West, 400feetabove ground, 3 mile (EG&G GeoMetries, 1980a) E East-West,400feetaboveground, 6 mile (EG&G GeoMetries, 1980b) F East-West,400feetaboveground, 6 mile (EG&G GeoMetries, 1980h) G North-South,400feetabove ground, 3 mile (Geo-Life, 1979a) H East-West,400feetabove ground, 6 mile (EG&G GeoMetries, 1980d) I East-West,400feetabove ground,3 mile (Texas Instruments, Inc., 1980) J East-West,400feetabove ground, 6 mile (EG&G GeoMetries, 1980c) K East-West,400feetaboveground, 6 mile (EG&G GeoMetries, 1980g) L East-West,400feetaboveground, 6 mile (EG&G GeoMetries, 1980e) M East-West, 400 feet aboveground, 6 mile (EG&G GeoMetries, 1980i)
6
SOURCES. OF DATA
EG&G GeoMetries, Inc., 1980a, National Uranium Resource Evaluation aerial gamma-ray and magnetic reconnaissance survey, NebraskaTexas Project, Tyler, Texarkana, and Waco quadrangles of Texas, Oklahoma, Arkansas, and Louisiana-Final Report: U.S. Department of Energy Grand Junction Office [Report] GJBX 69-80, v. 2, n.p., scale 1:500,000.
___ 1980b, National Uranium Resource Evaluation aerial gammaray and magnetic reconnaissance survey, Harrison quadrangle, Missouri and Arkansas-Final Report: U.S. Department of Energy Grand Junction Office [Report] GJBX 150-80, v. 2, n.p., scale 1:500,000.
___ 1980c, National Uranium Resource Evaluation aerial gammaray and magnetic reconnaissance survey, Memphis quadrangle, Arkansas, Missouri and Tennessee-Final Report: U.S. Department of Energy Grand Junction Office [Report] GJBX 179-80, v. 2, n.p., scale 1:500,000.
___ 1980d, National Uranium Resource Evaluation aerial gammaray and magnetic reconnaissance survey, El Dorado quadrangle, Louisiana and Arkansas-Final Report: U.S. Department of Energy Grand Junction Office [Report] GJBX 182-80, v. 2, n.p., scale 1:500,000.
___ 1980e, National Uranium Resource Evaluation aerial gammaray and magnetic reconnaissance survey, Greenwood quadrangle, Mississippi, Arkansas, and Louisiana-Final Report: U.S. Department of Energy Grand Junction Office [Report] GJBX 183-80, v. 2, n.p., scale 1:500,000.
___ 1980f, National Uranium Resource Evaluation aerial gammaray and magnetic reconnaissance survey, Fort Smith quadrangle, Oklahoma and Arkansas-Final Report: U.S. Department of Energy Grand Junction Office [Report] GJBX 200-80, v. 2, n.p., scale 1:500,000.
___ 1980g, National Uranium Resource Evaluation aerial gammaray and magnetic reconnaissance survey, Helena quadrangle, Arkansas, Mississippi, and Tennessee-Final Report: U.S. Department of Energy Grand Junction Office [Report] GJBX 201-80, v. 2, n.p., scale 1:500,000.
___ 1980h, National Uranium Resource Evaluation aerial gammaray and magnetic reconnaissance survey, Russellville quadrangle, Arkansas-Final Report: U.S. DepartmentofEnergyGrandJunction Office [Report] GJBX204-80, v. 2, n.p., scale 1:500,000.
___ 1980i, National Uranium Resource Evaluation aerial gammaray and magnetic reconnaissance survey,Blytheville quadrangle, Tennessee, Arkansas, Alabama, and Missouri-Final Report: U.S. Department of Energy Grand Junction Office [Report] GJBX 205-80, v. 2, n.p., scale 1:500,000.
Geo-Life (A joint venture between High Life Helicopters, Inc. and Geodata International, Inc.), 1979a, National Uranium Resource Evaluation aerial gamma-ray and magnetic reconnaissance survey, Little Rock National Topographic Map, Arkansas-Final Report: U.S. Department of Energy Grand Junction Office [Report] GJBX 115-79, v. 2, n.p., scale 1:500,000.
___ 1979b, National Uranium Resource Evaluation aerial gammaray and magnetic reconnaissance survey, McAlester National Topographic Map, Arkansas and Oklahoma-Final Report: U.S. Department of Energy Grand Junction Office [Report] GJBX 174-79, v. 2, n.p., scale 1:500,000.
Texas Instruments, Inc., 1978, National Uranium Resource Evaluation aerial gamma-ray and magnetic reconnaissance survey, Great Plains, Tulsa quadrangle, Oklahoma, Missouri, and Arkansas-Final Report: U.S. Department of Energy Grand Junction Office [Report] GJBX 100-78, v. 2N, n.p., scale 1:500,000.
___ 1980, National Uranium Resource Evaluation aerial gammaray and magnetic reconnaissance survey of portions of Arkansas, Illinois Indiana, Kentucky, Missouri, and Tennessee: Poplar Bluff quadrangle-Final Report: U.S. Department of Energy Grand Junction Office [Report] GJBX42-80, v. 2, n.p., scale 1:500,000.

124°
0 so I I II I I II I .11 I
0 50 100
7
100 MILES II I 150 KILOMETERS
' ' """ 116° '
EEE
GGG
----------
CALIFORNIA
\
\ DDD l
' ) /
I
I
FFF I
) ,_
SPECIFICATIONS
A East-West, 8500 feet barometric, 1 mile (Hotz and others, 1972)
B Unknown, 8000 feet barometric, unknown (Cal. Div. of Mines and Geol., 1979)
C Unknown, 7000 feet barometric, unknowil (Cal. Div. of Mines and Geol., 1979)
D Unknown, 9500 feet barometric, unknown (Cal. Div. of Mines and Geol., 1979)
E Northeast-Southwest, 2900 meters barometric, 8 kilometers (unpublished data)
F Specifications unknown (unpublished data) G East-West, 7000 feet barometric, 1 mile (Brown and others,
1978) H East-West, 4500 feet barometric, 1 mile (USGS, 1973) I Specifications unknown (Affleck, 1962) J Specifications unknown (unpublished data) K Northeast-Southwest, 3000 feet mean sea level, mile
(USGS, 1974c) L Northeast-Southwest, 3000 feet mean sea level, mile
(USGS, 1974b) M East-West, 1000 feet above ground, 1 mile (USGS, 1971c) N Northeast-Southwest, 6000 feet barometric, 5 mile (Zietz
and others, 1969) 0 Northeast-Southwest, 500 feet above ground, 1 mile (Meus
chke and others, 1966) P Northeast-Southwest, 3000 feet barometric, 3 mile (Cady,
1975) Q Northeast-Southwest, 4000 feet barometric, 3 mile (Cady,
1975) R North-South, 3500 feet barometric, 0.5 mile (USGS, 1976) S North-South, 5500 feet barometric, 0.5 mile (USGS, 1976) T East-West, 9000 feet barometric, 1 mile (USGS, 1971b) U East-West, 11,000 feet barometric, 1 mile (USGS, 1971b) V East-West, 1000 feet above ground, 0.5 mile (USGS, 1969a) W East-West, 1000 feet above ground, 0.5 mile (Henderson
and others, 1966) X East-West, 11,500 feet above sea level, 1 mile (Tooker and
others, 1970) Y Specifications unknown (unpublished data) Z East-West, 13,500 feet above sea level, 1 mile (USGS,
1974d) AA East-West, 9000 feet barometric, 1 mile (USGS, 1971a) BB East-West, 15,000 feet barometric, 1 mile (USGS, 1971a) CC East-West, 500 feet above ground, 1 mile (Henderson and
others, 1963) DD East-West, 13,500 feet barometric, 1 mile (USGS, 1969b) EE East-West, 8000 feet barometric, 1 mile (USGS, 1969b) FF East-West, 2500 feet barometric, 1 mile (USGS, 1969b)
GG Northeast-Southwest, 3000 feet mean sea level, 1 mile (USGS, 1974a)
8
HH Specifications unknown (unpublished data) II Individual high altitude flight lines (unpublished data)
JJ Vertical intensity ground survey, 1 mile (unpublished data) KK Northwest-Southeast, 6500 feet barometric, 4 mile (Hanna
and others, 1972) LL Specifications unknown (unpublished data)
MM Northeast-Southwest, 6500 feet barometric, 1 mile (Hanna, 1970)
NN Northeast-Southwest, 6500 feet mean sea level, 1 mile (USGS, 1974e)
00 Northeast-Southwest, 1000 feet terrain clearance, 0.5 mile (USGS, 1980a)
PP East-West, 400 feet above ground, 3 mile (High Life Helicopters, lnc./OEB, Inc., 1980a)
QQ North-South, 9000 feet barometric, 1 mile (USGS, 1975a) RR North-South, 1000 feet above ground, 2 mile (USGS, 1980b) SS North-South, 500 feet above ground, 1 mile (Andreasen and
others, 1964c) TT North-South, 500 feet above ground, 1 mile (Andreasen and
others, 1964a) UU North-South, 500 feet above ground, 1 mile (Andreasen and
others, 1964b) W East-West, 400 feet above ground, 6 mile (High Life
Helicopters, lnc./QEB, Inc., 1980b) WW East-West, 400 feet above ground, 3 mile (High Life
Helicopters, lnc./QEB, Inc., 1980b) XX East-West, 14,000 feet barometric, 1 mile (unpublished
data) YY East-West, 1000 feet terrain clearance, 0.5 mile (USGS,
1979) ZZ North-South, 400 feet above ground, 1 mile (Geo-Life,
1979a) AAA East-West, 400 feet above ground, 3 mile (High Life
Helicopters, lnc./QEB, Inc., 1980b) BBB East-West, 400 feet above ground, 3 mile (Geo-Life, 1979b) CCC East-West, 400 feet above ground, 3 mile (High Life
Helicopters, lnc./QEB, Inc., 1980a) DDD East-West, 9000 feet barometric, 3 mile (USGS, 1975b) EEE East-West, 400 feet above ground, 3 mile (High Life
Helicopters, lnc./QEB, Inc., 1980a) FFF North-South, 400 feet above ground, 3 mile (LKB Re
sources, Inc., 1980) GGG East-West, 400 feet above ground, 3 mile (High Life
Helicopters, lnc./OEB, Inc., 1980a) HHH East-West, 400 feet above ground, 6 mile (LKB Resources,
Inc., 1980) Ill East-West, 12,500 feet barometric, 5 mile (unpublished
data)

SOURCES OF DATA
Affleck, James, 1962, Exploration for petroleum by the magnetic method, in Nagata, Takesi, ed., Benedum earth magnetism symposium: Pittsburgh, Pennsylvania, University of Pittsburgh Press, p. 159-175.
Andreasen, G. E., Pitkin, J. A., and Petrafeso, F. A., 1964a, Aeromagnetic map of eastern Los Angeles and vicinity, California: U.S. Geological Survey Geophysical Investigations Map GP-465, scale 1:48,000.
___ , 1964b, Aeromagnetic map of the Long Beach-Santa Ana area, Los Angeles and Orange Counties, California: U.S. Geological Survey Geophysical Investigations Map GP-464 scale 1:48,000.
___ , 1964c, Aeromagnetic map of western Los Angeles and vicin-ity, California: U.S. Geological Survey Geophysical Investigations MapGP-466scale 1:48,000.
Brown, R. D., Jr., Grimes, D. J., and Reinhardt, Leinz, 1978, Mineral Resources of the Snow Mountain Wilderness study area, California, with a section on aeromagnetic data by Andrew Griscom and R. D. Brown, Jr: U.S. Geological Survey Open-File Report 78-296,81 p., 4pls.
Cady, J. W., 1975, Magnetic and gravity anomalies in the California Great Valley and western Sierra Nevada metamorphic belt: Geological Society of America Special Paper 168, 56 p.
California Division of Mines and Geology, 1979, Aeromagnetic map of the Modoc area, California: California Division of Mines and Geology Open-File Report78-13ASAC, scale 1:250,000.
Geo-Life (A joint venture between High Life Helicopters, Inc. and Geodata International, Inc.), 1979a, National Uranium Resource Evaluation aerial radiometric and magnetic survey, Death Valley National Topographic Map, California and Nevada-Final Report: U.S. Department of Energy Grand Junction Office [Report] GJBX 164-79, v. 2, n.p. scale 1:500,000.
___ 1979b, National Uranium Resource Evaluation aerial radiometric and magnetic survey, Trona National Topographic Map, California-Final Report: U.S. Department of Energy Grand Junction Office [Report] GJBX65-79, v. 2, n.p. scale 1:500,000.
Hanna, W. F., 1970, Aeromagnetic and gravity features of the western Franciscan and Salinian basement terranes between Cape San Martin and San Luis Obispo, California: U.S. Geological Survey Professiona1Paper700-B, p. B66-B77.
Hanna, W. F., Brown, R. D., Jr., Ross, D. C., and Griscom, Andrew, 1972, Aeromagnetic reconnaissance and generalized geologic map of the San Andreas fault between San Francisco and San Bernardino, California: U.S. Geological Survey Geophysical Investigations MapGP-815, scale 1:250,000.
Henderson, J. R., Jr., Stromquist, A. A., and Jespersen, Anna, 1966, Aeromagnetic map of parts of the Mother Lode gold and Sierra Foothills copper mining districts, California, and its geologic interpretation: U. S. Geological Survey Geophysical Investigations Map GP-561, scale 1:62,500.
Henderson, J. R., Jr., White, B. L., and others, 1963, Aeromagnetic map of Long Valley and northern Owens Valley, California: U.S. Geological Survey Geophysical Investigations Map GP-329, scale 1:62,500.
High Life Helicopters, lnc./QEB, Inc., 1980a, National Uranium Resource Evaluation airborne gamma-ray spectrometer and magnetometer survey, Los Angeles, San Bernardino, Santa Ana, and San Diego (California) quadrangles-Final Report: U.S. Department of Energy Grand Junction Office [Report] GJBX 214-80, v. 2, n.p. scale 1:500,000.
___ 1980b, National Uranium Resource Evaluation airborne gamma-ray spectrometer and magnetometer survey, Mariposa quadrangle (California and Nevada), Fresno,quadrangle (California), and Bakersfield quadrangle (California) -Final Report: U.S. Department of Energy Grand Junction Office [Report] GJBX 231-80, v. 2, n.p. scale 1:500,000.
Hotz, P. E., Thurber, H. K., Marks, L. Y., and Evans, R. K., 1972, Mineral Resources of the Salmon-Trinity Alps Primitive Area, California, with a section on an aeromagnetic survey and interpretation by Andrew Griscom: U.S. Geological Survey Bulletin 1371-B, 267p.
9
LKB Resources, Inc., 1980, National Uranium Resource Evaluation aerial gamma-ray and magnetic reconnaissance survey, ColoradoArizona area, Salton Sea, El Centro, Phoenix, Ajo, and Lukeville quadrangles-Final Report: U.S. Department of Energy Grand Junction Office [Report] GJBX 12-80, v. 2, n.p. scale 1:500,000.
Meuschke,J. L., Pitkin,J. A., and Smith, C. W., 1966, Aeromagnetic map of Sacramento and vicinity, California: U.S. Geological Survey Geophysical Investigations MapGP-574, scale 1:250,000.
Tooker, E. W., Morris, H. T., and Fillo, P. V., 1970, Mineral resources of the Emigrant Basin primitive area, California, with a section on geophysical studies by H. W. Oliver: U.S. Geological Survey Bulletin 1261-G, 70 p.
U.S. Geological Survey, 1969a, Aeromagnetic map of the northern Mother Lode area, California: U.S. Geological Survey Geophysical Investigations MapGP-671, scale 1:62,500.
___ 1969b, Aeromagnetic strip map across the central Sierra Nevada, California: U.S. Geological Survey GeophysicallnvestigationsMapGP-657, scale 1:125,000.
___ 1971a, Aeromagnetic map of parts of the Goldfield, Mariposa and Death Valley 1 o by 2° quadrangles, Nevada-California: U.S. Geological Survey Geophysical Investigations Map GP-753, scale 1:250,000.
___ 1971b, Aeromagnetic map of parts of the Walker Lake, Reno, Chico, and Sacramento 1 o by 2o quadrangles, Nevada-California: U.S. Geological Survey Geophysical Investigations Map GP-751, scale 1:250,000.
___ 1971c, Aeromagnetic map of the southern part of the San Francisco Bay region, California: U.S. Geological Survey Open-File Report, scale 1:125,000.
___ 1973, Aeromagnetic map of the Clear Lake area, Lake, Sonoma, Napa, and Mendocino Counties, California: U.S. Geological Survey Open-File Report, scale 1:62,500.
___ 197 4a, Aeromagnetic map of parts of the San Jose, Santa Cruz, and San Francisco 1 o by 2o quadrangles, California: U.S. Geological Survey0pen-FileReport74-79, scale 1:125,000.
___ 1974b, Aeromagnetic map of parts of the San Jose, Santa Rosa, and Sacramento 1 o by 2o quadrangles, California: U.S. Geological Survey Open-File Report 7 4-80, scale 1:125,000.
___ 1974c, Aeromagnetic map of parts of the Santa Rosa and San Francisco 1 o by 2o quadrangles, California: U.S. Geological Survey Open-File Report74-81, scale 1:125,000.
___ 1974d, Aeromagnetic map of parts of the Walker Lake and Mariposa 1 o by 2° quadrangles, eastern California: U.S. Geological Survey Open-File Report 7 4-109, scale 1:250,000.
___ 1974e, Aeromagnetic map of the Cholame-Taft area, southwestern California: U.S. Geological Survey Open-File Report 74-8, scale 1:125,000.
___ 1975a, Aeromagnetic map of Santa Barbara and vicinity, California: U.S. Geological Survey Open-File Report 75-132, scale 1:125,000.
___ 1975b, Aeromagnetic map of southeastern California and part of southern Nevada: U.S. Geological Survey Open-File Report 75-52, scale 1:250,000.
___ 1976, Preliminary aeromagnetic maps of Nevada City and Alleghany 15-minute quadrangles, California: U.S. Geological Survey Open-File Report 76-274, scale 1:62,500.
___ 1979, Aeromagnetic map of the Golden Trout area, California: U.S. Geological Survey Open-File Report 79-1459, scale 1:62,500.
___ 1980a, Aeromagnetic map of the Los Padres area, California: U.S. Geological Survey Open-File Report 80-986, 8 sheets, scale 1:62,500.
___ 1980b, Aeromagnetic map of the Ventura basin, Ventura and Los Angeles Counties, California: U.S. Geological Survey Open-File Report80-64, scale 1:62,500.
Zietz, Isidore, and others 1969, Aeromagnetic investigation of crustal structure for a strip across the western United States: Geological Society of America Bulletin, v. 80, no. 9, p. 1703-1714, 1 pl.

.. COLORADO
41o ~ 108o 107o 106" 1W 104o 103o 102o
1
: ----f------r----:_-----1-----r------ ----\
M I N J A I
400 J I
I~ f-I I
39° J I I
I I I F
38° l I I
I
B
\ CJ I
H
c
K
G
1\
I
I I I
I I
Q I I I
I
I
,.1~~~-- ---L------ ---- 0---- .,__ ___ t ___ l SPECIFICATIONS
A East-West, 13,000feetbarometric, 1 mile(USGS, 1970b) B East-West, 14,000feetbarometric, 1 mile(USGS, 1968) C East-West, 14,500feetbarometric, 1 mile(USGS, 1970a)
50
D East-West,8500feetbarometric, 1 mile(CaseandJoesting, 1972) E East-West, 10,000feetbarometric, 1 mile(CaseandJoesting, 1972) F East-West,500feetaboveground, 1 mile(CaseandJoesting, 1972) G East-West, 500feetabove ground, 1 mile (Petty and others, 1966) H East-West, 14,500feetbarometric,2mile(USGS, 1978) I East-West, 14,500feet barometric, 5 mile (Zietz, and Kirby, 1972) J East-West, 14,500feetto 16,000feetbarometric, 5 mile (Zietz and
others, 1969) K East-West, 14,500feetbarometric, 1 mile(USGS, 1972) L East-West, 14,000feetbarometric, 1 mile(USGS, 1972) M East-West,400feetabove ground, 3 mile (Geo-Life, 1979) N East-West,400feetaboveground, 3 mile (LKB Resources, Inc., 1979)
100
0 East-West,400feetaboveground, 3 mile (Texas Instruments, Inc., 1980) P East-West,400feetaboveground, 5 mile (Texas Instruments, Inc., 1978a) Q East-West,400feetabove ground, 5 mile (Texas Instruments, Inc., 1978b)
SOURCES OF DATA
Case, J. E., and Joesting, H. R., 1972, Regional geophysical investigations in the central Colorado Plateau: U.S. Geological Survey Professional Paper 736, 31 p., 3 pis.
Geo-Life (A joint venture between High-Life Helicopters, Inc., and Geodata International, Inc.), 1979, National Uranium Resource Evaluation aerial radiometric and magnetic survey, Vernal National Topographic Map, Colorado and Utah-Final report: U.S. Department of Energy Grand Junction Office [Report] GJBX 167-79, v. 2, n.p., scale 1:500,000.
LKB Resources, Inc., 1979, National Uranium Resource Evaluation aerial radiometric and magnetic reconnaissance survey, Colorado/ Arizona area, Craig quadrangle -Final report: U.S. Department of Energy Grand Junction Office [Report] GJBX 153-79, v. 2, n.p., scale 1:500,000.
10
150 KILOMETERS
Petty, A. J., Vargo, J. L., and Smith, F. C., 1966, Aeromagnetic map of the Denver area, Colorado: U.S. Geological Survey GeophysicallnvestigationsMapGP-557, scale 1:250,000.
Texas Instruments, Inc., 1978a, National Uranium Resource Evaluation aerial radiometric and magnetic reconnaissance survey of portions of the Great Plains and Central Lowlands, La Junta quadrangleFinal report: U.S. Department of Energy Grand Junction Office [Report] GJBX 100-78, v. 21, n.p., scale 1:500,000.
___ 1978b,National Uranium Resource Evaluation aerial radiometric and magnetic reconnaissance survey of portions of the Great Plains and Central Lowlands, Lamar quadrangle-Final report: U.S. Department of Energy Grand Junction Office [Report] GJBX 100-78, v. 2J, n.p., scale 1:500,000.
___ 1980, National Uranium Resource Evaluation aerial radiometric and magnetic reconnaissance survey of south-central Colorado, Trinidad quadrangle-Final report: U.S. Department of Energy Grand Junction Office [Report] GJBX 59-80, v. 2, n.p., scale 1:500,000.
U.S. Geological Survey, 1968, Aeromagnetic map of the Wolcott-Boulder area, north-central Colorado: U.S. Geological Survey Open-File Report, scale 1:125,000.
___ 1970a, Aeromagnetic map of the Cripple Creek-Saguache area, south-central Colorado: U.S. Geological Survey Open-File Report, 3 sheets, scale 1:62,500.
___ 1970b, Aeromagnetic map of North Park and vicinity, northcentral Colorado: U.S. Geological Survey Open-File Report, scale 1:125,000.
___ 1972, Aeromagnetic map of the Ridgway-Pagosa Springs area, southwestern Colorado: U.S. Geological Survey GeophysicallnvestigationsMapGP-840, scale 1:250,000.
___ 1978, Aeromagnetic map of Arkansas Valley and vicinity, Colorado: U.S. Geological Survey Open-File Report, 78-112, scale 1:125,000.
Zietz, Isidore, and others, 1969, Aeromagnetic investigations of crustal structure for a strip across the western United States: Geological SocietyofAmericaBulletin, v. 80, no. 9, p. 1703-1714,1 pl.
Zietz, Isidore, and Kirby, John R., 1972, Aeromagnetic map of Colorado: U.S. Geological Survey Geophysical Investigations Map GP-880, scale 1:1,000,000.

CONN., MASS., N.H., R. 1., VT.
50 100 MILES r.~T.-r~-J--~~~_,~
SPECIFICATIONS
A East-West,4000feetbarometric, 2 mile (Zietz and others, 1972)
8 North-South, 3500 feet barometric, 1f2 mile (Zietz and others, 1972)
C North-South, 1000feetabove·ground, 1f2 mile (Zietz and others, 1972)
D East-West,2300feetbarometric, %mile(Zietzand others, 1972)
E East-West, 5500feet barometric,% mile (Zietz and others, 1972)
F East-West,5000feetbarometric, Y2mile(Zietzand others, 1972)
G East-West, 500feetabove ground, 1 mile (Zietz and others, 1972)
H East-West, 2200feet barometric, 2 mile (Zietz and others, 1972)
I East-West, 750 feet above ground,% mile (Zietz and others, 1972)
J East-West, 500feetaboveground,% mile (Zi'etzand others, 1972)
K East-West,400feetaboveground, Y2mile(Zietzand others, 1972)
L Shipborne survey, specifications unknown (Zietz and others, 1972; Heirtzler, 1971)
50
M Northwest-Southeast, 500to 2500feet barometric, 5 mile (Zietz and others, 1972; Taylor and others, 1968)
N North-South,400feetaboveground, %mile(Zietzand others, 1972)
100 150 KILOMETERS
SOURCES OF DATA
Heirtzler, J. R., 1971, Magnetic anomalies measured at sea, in The sea:
11
New York, Wiley-Interscience, v. 4, pt. 1, p. 85-128. Taylor, P. T., Zietz, Isidore; and Dennis, L. S., 1968, Geologic implica
tions of aeromagnetic data from the eastern continental margin of the United States: Geophysics, v. 33, no. 5, p. 755-780.
Zietz, Isidore, Gilbert, F. P., and Kirby, J. R., Jr., 1972, Northeastern United States regional aeromagnetic maps: U.S. Geological Survey Open-File Report, 13 sheets, scale 1:250,000. (Aeromagnetic map of Connecticut, Massachusetts, New Hampshire, Rhode Island, Vermont, and part of New York: U.S. Geological Survey Geophysical Investigations Map GP-928, scale 1:1,000,000.)

DEL., MD., N.J., PA., WASH., D. C.
80° ..... , yl 42"....-----+--- - -- - -
79°
I \
B
I 41°-r----~-------l--l--l------1---l------1--------l----+----.~--------r--r
A
I
'/ (,/
50
50 100
c D
PENN YLVANIA
JJER§EY
0
100 MILES
150 KILOMETERS
SPECIFICATIONS
A North-South, 500 feet above ground, 1 mile (Popenoe and others, 1964)
B North-South, 1000 feet above ground, 4 mile (USGS 1974a, b, c, d, e, f)
C North-South, 1000 feet above ground,% mile (Joesting and others, 1949)
D North-South, 3000 feet barometric, 2 mile (USGS, 1969) E North-South, 500 feet above ground, % mile (Bromery and
Griscom, 1967) F North-South, 1000 feet above ground, %mile (Henderson and
others, 1963) G North-South, 1000 feet barometric, 1 mile (USGS, 1974k) H North-South, 500 feet above ground, % mile (Henderson and
others, 1966) I North-South, 1000 feet above ground, 4 mile (unpublished data) J East-West, 500 feet above ground, 1 mile (USGS, 1973a) K East-West, 500 feet above ground, 1 mile (USGS, 1974g)
12
L East-West, 500 feet above ground,% mile (Bromery, 1967) M Northwest-Southeast, 500 feet above ground,% mile (Bromery
and others, 1964) N East-West, 400 feet above ground,% mile (USGS, 1971a) 0 East-West, 500 feet above ground, 1 mile (USGS, 1979) P East-West, 500 feet above ground, 1 mile (USGS, 1974h) Q East-West, 500 feet above ground, 1 mile (USGS, 1974j) R East-West, 500 feet above ground, 1 mile (USGS, 1974i) S East-West, 500 feet above ground, 1 mile (unpublished data) T East-West, 400 feet above ground,% mile (USGS, 1971 b) U East-West, 1200 feet barometric, 1 mile (USGS, 1974n) V East-West, 1200 feet barometric, 1 mile (USGS, 1974m) W East-West, 1200 feet barometric, 1 mile (USGS, 19741) X East-West, 1200 feet barometric, 1 mile (USGS, 1973b) Y East-West, 1000 feet barometric, 1 mile (Balsley and
others, 1946)
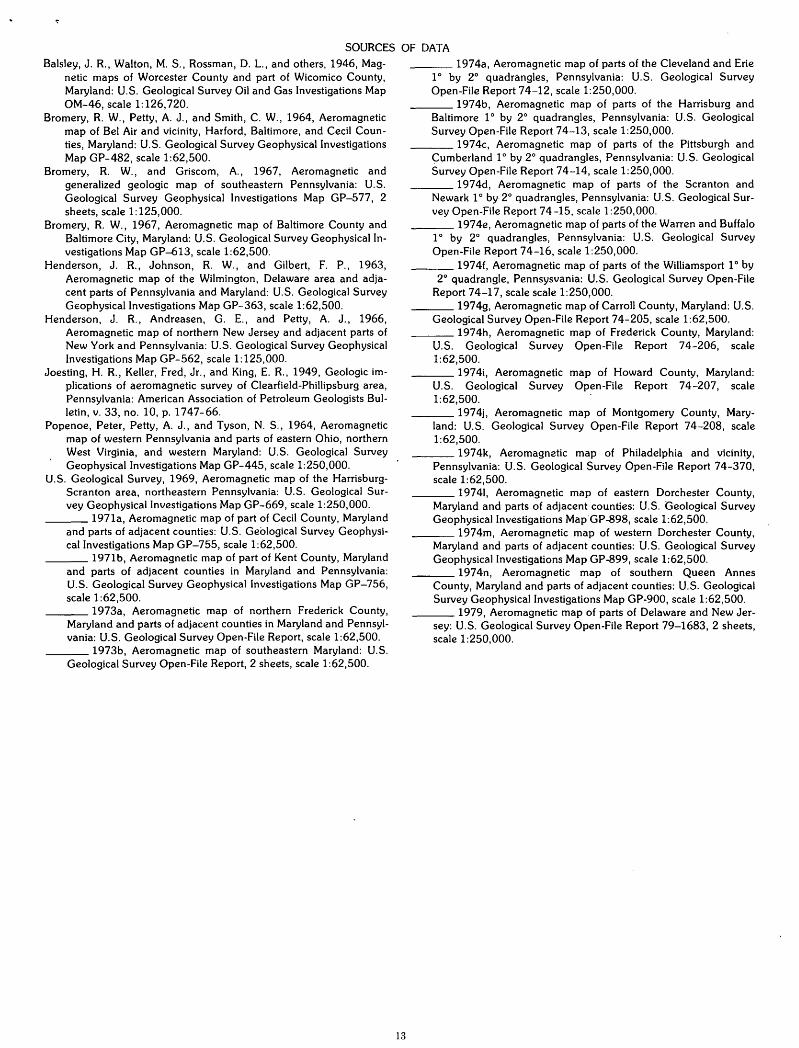
SOURCES OF DATA
Balsley, J. R., Walton, M. S., Rossman, D. L., and others, 1946, Magnetic maps of Worcester County and part of Wicomico County, Maryland: U.S. Geological Survey Oil and Gas Investigations Map OM-46, scale 1:126,720.
Bromery, R. W., Petty, A. J., and Smith, C. W., 1964, Aeromagnetic map of Bel Air and vicinity, Harford, Baltimore, and Cecil Counties, Maryland: U.S. Geological Survey Geophysical Investigations Map GP-482, scale 1:62,500.
Bromery, R. W., and Griscom, A., 1967, Aeromagnetic and generalized geologic map of southeastern Pennsylvania: U.S. Geological Survey Geophysical Investigations Map GP-577, 2 sheets, scale 1:125,000.
Bromery, R. W., 1967, Aeromagnetic map of Baltimore County and Baltimore City, Maryland: U.S. Geological Survey Geophysical Investigations Map GP--613, scale 1:62,500.
Henderson, J. R., Johnson, R. W., and Gilbert, F. P., 1963, Aeromagnetic map of the Wilmington, Delaware area and adjacent parts of Pennsylvania and Maryland: U.S. Geological Survey G€ophysical Investigations Map GP-363, scale 1:62,500.
Henderson, J. R., Andreasen, G. E., and Petty, A. J., 1966, Aeromagnetic map of northern New Jersey and adjacent parts of New York and Pennsylvania: U.S. Geological Survey Geophysical Investigations Map GP-562, scale 1:125,000.
Joesting, H. R., Keller, Fred, Jr., and King, E. R., 1949, Geologic implications of aeromagnetic survey of Clearfield-Phillipsburg area, Pennsylvania: American Association of Petroleum Geologists Bulletin, v. 33, no. 10, p. 1747-66.
Popenoe, Peter, Petty, A. J., and Tyson, N. S., 1964, Aeromagnetic map of western Pennsylvania and parts of eastern Ohio, northern West Virginia, and western Maryland: U.S. Geological Survey Geophysical Investigations Map GP-445, scale 1:250,000.
U.S. Geological Survey, 1969, Aeromagnetic map of the HarrisburgScranton area, northeastern Pennsylvania: U.S. Geological Survey Geophysical Investigations Map GP-669, scale 1:250,000.
___ 1971a, Aeromagnetic map of part of Cecil County, Maryland and parts of adjacent counties: U.S. Geological Survey Geophysical Investigations Map GP-755, scale 1:62,500.
___ 1971b, Aeromagnetic map of part of Kent County, Maryland and parts of adjacent counties in Maryland and Pennsylvania: U.S. Geological Survey Geophysical Investigations Map GP-756, scale 1:62,500.
___ 1973a, Aeromagnetic map of northern Frederick County, Maryland and parts of adjacent counties in Maryland and Pennsylvania: U.S. Geological Survey Open-File Report, scale 1:62,500.
___ 1973b, Aeromagnetic map of southeastern Maryland: U.S. Geological Survey Open-File Report, 2 sheets, scale 1:62,500.
13
___ 1974a, Aeromagnetic map of parts of the Cleveland and Erie 1 o by 2° quadrangles, Pennsylvania: U.S. Geological Survey Open-File Report 74-12, scale 1:250,000.
___ 1974b, Aeromagnetic map of parts of the Harrisburg and Baltimore 1 o by 2° quadrangles, Pennsylvania: U.S. Geological Survey Open-File Report 74-13, scale 1:250,000.
___ 1974c, Aeromagnetic map of parts of the Pittsburgh and Cumberland 1 o by 2° quadrangles, Pennsylvania: U.S. Geological Survey Open-File Report 74-14, scale 1:250,000.
___ 1974d, Aeromagnetic map of parts of the Scranton and Newark 1 o by 2° quadrangles, Pennsylvania: U.S. Geological Survey Open-File Report 74-15, scale 1:250,000.
___ 1974e, Aeromagnetic map of parts of the Warren and Buffalo 1 o by 2° quadrangles, Pennsylvania: U.S. Geological Survey Open-File Report 74-16, scale 1:250,000.
___ 197 4f, Aeromagnetic map of parts of the Williamsport 1 o by 2° quadrangle, Pennsysvania: U.S. Geological Survey Open-File
Report 74-17, scale scale 1:250,000. ___ 1974g, Aeromagnetic map of Carroll County, Maryland: U.S.
Geological Survey Open-File Report 74-205, scale 1:62,500. ___ l974h, Aeromagnetic map of Frederick County, Maryland:
U.S. Geological Survey Open-File Report 74-206, scale 1:62,500.
___ 1974i, Aeromagnetic map of Howard County, Maryland: U.S. Geological Survey Open-File Report 74-207, scale 1:62,500.
___ 1974j, Aeromagnetic map of Montgomery County, Maryland: U.S. Geological Survey Open-File Report 74-208, scale 1:62,500.
___ 1974k, Aeromagnetic map of Philadelphia and vicinity, Pennsylvania: U.S. Geological Survey Open-File Report 74-370, scale 1:62,500.
___ 19741, Aeromagnetic map of eastern Dorchester County, Maryland and parts of adjacent counties: U.S. Geological Survey Geophysical Investigations Map'GP-898, scale 1:62,500.
___ 1974m, Aeromagnetic map of western Dorchester County, Maryland and parts of adjacent counties: U.S. Geological Survey Geophysical Investigations Map GP-899, scale 1:62,500.
___ 1974n, Aeromagnetic map of southern Queen Annes County, Maryland and parts of adjacent counties: U.S. Geological Survey Geophysical Investigations Map GP-900, scale 1:62,500.
___ 1979, Aeromagnetic map of parts of Delaware and New Jersey: U.S. Geological Survey Open-File Report 79-1683, 2 sheets, scale 1:250,000.

FLORIDA
SPECIFICATIONS
86° 85°
0 50 I•'• 'Ill I I·, I
0 50 100
100 MILES I I I
150 KILOMETERS
A East-West, 500feetaboveground, 1 mile (USGS, 1978c) B East-West,500feetmeanterrainclearance, 1 mile(USGS, 1978a) C East-West, 500feet mean terrain clearance, 1 mile (USGS, 1978b) D Southwest-Northeast, 1 OOOfeetabove sea level, 5 nautical mile
(US NOO, 1972) E Northwest-Southeast, 450 meters above ground, 8 kilometers
(Kiitgord and Behrendt, 1977) F East-West,500feetmeanterrainclearance, 1 mile(USGS, 1978d)
14
82°
SOURCES OF DATA
Klitgord, K. D., and Behrendt, J. C., 1977, Aeromagnetic anomaly map of the United States Atlantic continental margin: U.S. Geological SurveyMapMF913, 2sheets, scale 1:1,000,000.
U.S. Geological Survey, 1978a, Aeromagnetic map of part of the Apalachicola 1 ox 2° quadrangle, Florida: U.S. Geological Survey Open-File Report78-714, scale 1:250,000.
___ 1978b, Aeromagnetic map of north-central Florida: U.S. Geological Survey Open-File Report 78-761, scale 1:250,000.
___ 1978c, Aeromagnetic map of northern Florida: U.S. Geological SurveyOpen-FileReport 78-891, 2sheets, scale 1:250,000.
___ 1978d, Aeromagnetic map of part of the Pensacola 1 o x 2° quadrangle, Florida: U.S. Geological Survey Open-File Report 78-716, scale 1:250,000.
U.S. Naval Oceanographic Office, 1972, Residual magnetic intensity contour chart-Gulf of Mexico, Caribbean Sea, North American Basin in Environmental-acoustic atlas of the Caribbean Sea and Gulf of Mexico, vol. II, marine environment: U.S. Naval Oceanographic OfficeSP-18911, 181 p.
85° 84° 83°
\_ __ _ -----
0 50 100 MILES jhr,·~, r,·~·~\~~'~·~~~,,1~1 0 50 100 150 KILOMETERS
SPECIFICATIONS
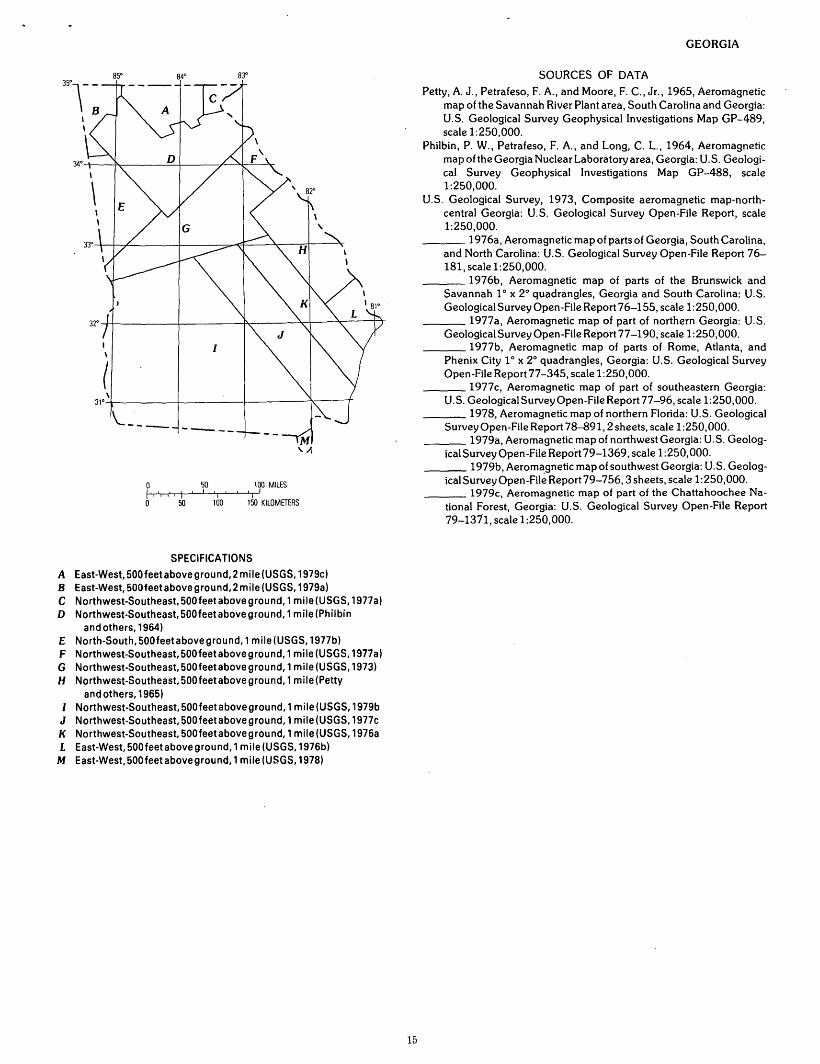
A East-West,500feetaboveground,2mile(USGS, 1979c) B East-West,500feetaboveground,2mile(USGS, 1979a) C Northwest-Southeast,500feetaboveground, 1 mile(USGS, 1977a) D Northwest-Southeast,500feetaboveground, 1 mile(Philbin
and others, 1964) E North-South,500feetaboveground, 1 mile(USGS, 1977b) F Northwest-Southeast,500feetaboveground, 1 mile(USGS, 1977a) G Northwest-Southeast,500feetaboveground, 1 mile(USGS, 1973) H Northwest-Southeast, 500feetaboveground, 1 mile(Petty
and others, 1965) I Northwest-Southeast,500feetaboveground, 1 mile(USGS, 1979b J Northwest-Southeast,500feetaboveground, 1 mile(USGS, 1977c K Northwest-Southeast, 500feetaboveground, 1 mile (USGS, 1976a L East-West,500feetaboveground, 1 mile(USGS, 1976b) M East-West, 500feetaboveground, 1 mile (USGS, 1978)
15
GEORGIA
SOURCES OF DATA
Petty, A. J., Petrafeso, F. A., and Moore, F. C., Jr., 1965, Aeromagnetic map of the Savannah River Plant area, South Carolina and Georgia: U.S. Geological Survey Geophysical Investigations Map GP-489, scale 1:250,000.
Philbin, P. W., Petrafeso, F. A., and Long, C. L., 1964, Aeromagnetic map of the Georgia Nuclear Laboratory area, Georgia: U.S. Geological Survey Geophysical Investigations Map GP-488, scale 1:250,000. I
U.S. Geological Survey, 1973, Composite aeromagnetic map-northcentral Georgia: U.S. Geological Survey Open-File Report, scale 1:250,000.
___ 1976a, Aeromagnetic map of parts of Georgia, South Carolina, and North Carolina: U.S. Geological Survey Open-File Report 76-181, scale 1:250,000.
___ 1976b, Aeromagnetic map of parts of the Brunswick and Savannah 1 o x 2° quadrangles, Georgia and South Carolina: U.S. GeologicaiSurvey0pen-FileReport76-155, scale 1:250,000.
___ 1977a, Aeromagnetic map of part of northern Georgia: U.S. Geological Survey Open -File Report 77-190, scale 1:250,000.
___ 1977b, Aeromagnetic map of parts of Rome, Atlanta, and Phenix City 1 o x 2o quadrangles, Georgia: U.S. Geological Survey Open -File Report 77-345, scale 1:250,000.
___ 1977c, Aeromagnetic map of part of southeastern Georgia: U.S. Geological Survey Open -File Report 77-96, scale 1:250,000.
___ 1978, Aeromagnetic map of northern Florida: U.S. Geological Survey0pen-FileReport78-891, 2sheets, scale 1:250,000.
___ 1979a, Aeromagnetic map of northwest Georgia: U.S. Geological Survey Open-File Report 79-1369, scale 1:250,000.
___ 1979b, Aeromagnetic map of southwest Georgia: U.S. Geologica1Survey0pen-FileReport79-756, 3sheets, scale 1:250,000.
___ 1979c, Aeromagnetic map of part of the Chattahoochee National Forest, Georgia: U.S. Geological Survey Open-File Report 79-1371, scale 1:250,000.

IDAHO
8 A-1
' \ (
0
I•'• 11
'
1
1 0 50
50• I 'I
100
100 MILES I I I
150 KILOMETERS
I I ___ [ __ __ j_
SPECIFICATIONS
A East-West, 7000feet barometric, 2 miles (A-1, USGS 1973a; A-2, USGS 1973c)
8 East-West, 7000 feet barometric, 1 mile (Kieinkopf and others, 19782).
C Northern part North-South, 5000feet barometric, %-2 miles; Southern part East-West, 6000 feet barometric, %-2 miles (Kieinkopf and others, 1972)
D East-West, 12,000 feet barometric, 2 miles (USGS, 1975) E North-South, 11 ,OOOfeet barometric, 1 mile (E-1, USGS 1972c; E-2,
USGS, 1972d; E-3, Weis and others, 1972; E-4, Cater and others, 1973; E-5, unpublished data)
F East-West, 9000 feet barometric, 1 and 2 miles (USGS, 1980) G East-West, 15,000 feet barometric, 5 miles (Zietz and others, 1971) H North-South, 11,000 feet barometric, 2 miles (USGS, 1972b) I East-West, 9000 feet barometric, 1 mile (Zietz and others, 1978) J North-South, 12,000 feet barometric, 1 mile (Kiilsgaard and others,
1970) K East-West, 11,000feetbarometric, 1 mile(K-1,USGS, 1971a;K-2,
USGS, 1971b; K-3, USGS 1971c) L East-West, 12,500feet barometric, 5 miles (L-1, USGS, 1972a; L-2,
USGS, 1971d) M East-West, 12,000 feet barometric, 1 mile (USGS, 1973b) N North-South, 12,000 feet barometric, 5 miles (Zietz and others, 1978) 0 Northeast-Southwest, 8000 feet barometric, 1 mile (Meuschke and
Long, 1965) P East-West, 9000feet barometric, 1 mile (Mitchell and others, 1965) R North-South, 8000 feet barometric, 2 miles (USGS, 1974b) S North-South, 6000feet barometric,% mile (USGS, 1974a) T North-South, 12,000 feet barometric, 1 mile (Tschantz and others, 1974) U North~South, 1000feetaboveground, %mile(USGS, 1981)
16
SOURCES OF DATA
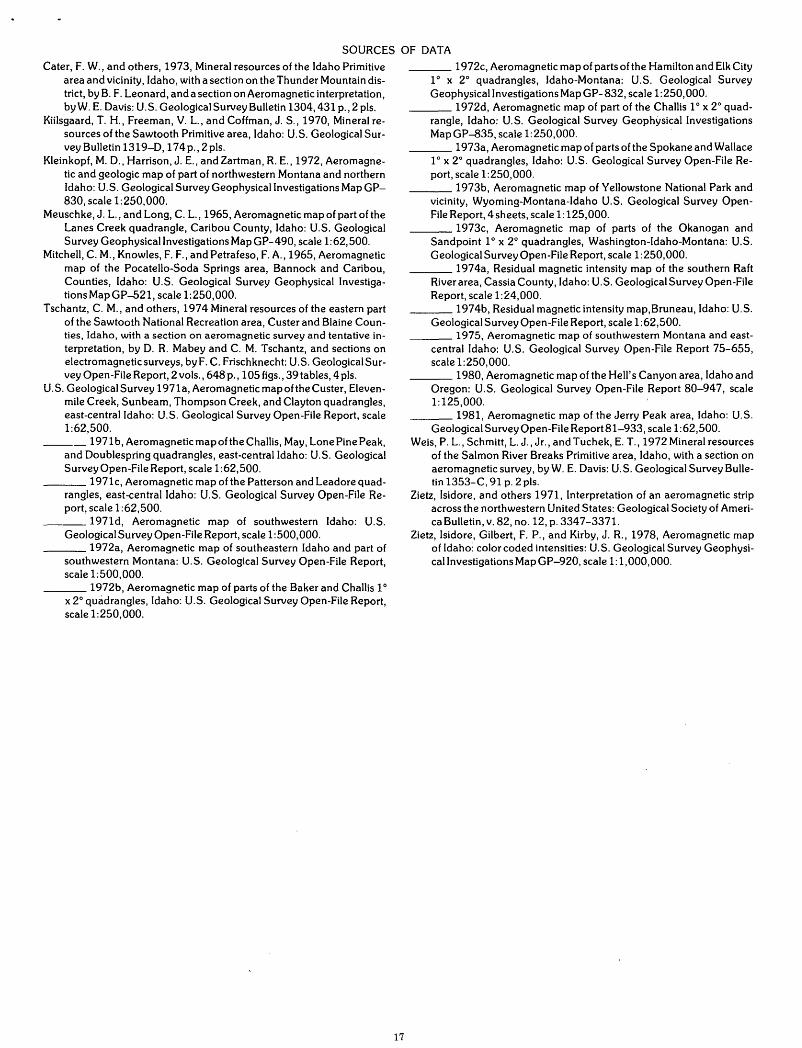
Cater, F. W., and others, 1973, Mineral resources of the Idaho Primitive area and vicinity, Idaho, with a section on the Thunder Mountain district, by B. F. Leonard, and a section on Aeromagnetic interpretation, byW. E. Davis: U.S. Geological Survey Bulletin 1304,431 p., 2 pis.
Kiilsgaard, T. H., Freeman, V. L., and Coffman, J. S., 1970, Mineral resources of the Sawtooth Primitive area, Idaho: U.S. Geological Survey Bulletin 1319-D, 174p., 2pls.
Kleinkopf, M.D., Harrison, J. E., and Zartman, R. E., 1972, Aeromagnetic and geologic map of part of northwestern Montana and northern Idaho: U.S. Geological Survey Geophysical Investigations Map GP-830, scale 1:250,000.
Meuschke, J. L., and Long, C. L., 1965, Aeromagnetic map of part of the Lanes Creek quadrangle, Caribou County, Idaho: U.S. Geological Survey Geophysical Investigations Map GP- 490, scale 1:62,500.
Mitchell, C. M., Knowles, F. F., and Petrafeso, F. A., 1965, Aeromagnetic map of the Pocatello-Soda Springs area, Bannock and Caribou, Counties, Idaho: U.S. Geological Survey Geophysical lnvestigationsMapGP--521, scale 1:250,000.
Tschantz, C. M., and others, 197 4 Mineral resources of the eastern part of the Sawtooth National Recreation area, Custer and Blaine Counties, Idaho, with a section on aeromagnetic survey and tentative interpretation, by D. R. Mabey and C. M. Tschantz, and sections on electromagnetic surveys, by F. C. Frischknecht: U.S. Geological Survey Open-File Report, 2 vols., 648 p., 105 figs., 39 tables, 4 pis.
U.S. Geological Survey 1971a, Aeromagnetic map ofthe Custer, Elevenmile Creek, Sunbeam, Thompson Creek, and Clayton quadrangles, east-central Idaho: U.S. Geological Survey Open-File Report, scale 1:62,500.
___ 1971b, AeromagneticmapoftheChallis, May, LonePine Peak, and Doublespring quadrangles, east-central Idaho: U.S. Geological Survey Open-File Report, scale 1:62,500.
___ 1971c, Aeromagnetic map of the Patterson and Leadore quadrangles, east-central Idaho: U.S. Geological Survey Open-File Report, scale 1:62,500.
___ 1971d, Aeromagnetic map of southwestern Idaho: U.S. Geological Survey Open-File Report, scale 1:500,000.
___ 1972a, Aeromagnetic map of southeastern Idaho and part of southwestern Montana: U.S. Geological Survey Open-File Report, scale 1:500,000.
___ 1972b, Aeromagnetic map of parts of the Baker and Challis 1 o
x 2° quadrangles, Idaho: U.S. Geological Survey Open-File Report, scale 1:250,000.
17
___ 1972c, Aeromagnetic map of parts of the Hamilton and Elk City 1 o x 2o quadrangles, Idaho-Montana: U.S. Geological Survey Geophysical Investigations Map GP- 832, scale 1:250,000.
___ 1972d, Aeromagnetic map of part of the Challis 1 o x 2o quadrangle, Idaho: U.S. Geological Survey Geophysical Investigations MapGP--835, scale 1:250,000.
___ 1973a, Aeromagnetic map of parts of the Spokane and Wallace 1 o x 2o quadrangles, Idaho: U.S. Geological Survey Open-File Report, scale 1:250,000.
___ 1973b, Aeromagnetic map of Yellowstone National Park and vicinity, Wyoming-Montana-Idaho U.S. Geological Survey OpenFile Report, 4sheets, scale 1:125,000.
___ 1973c, Aeromagnetic map of parts of the Okanogan and Sandpoint 1 o x 2° quadrangles, Washington-Idaho-Montana: U.S. Geological Survey Open-File Report, scale 1:250,000.
___ 1974a, Residual magnetic intensity map of the southern Raft River area, Cassia County, Idaho: U.S. Geological Survey Open-File Report, scale 1:24,000.
___ 1974b, Residual magnetic intensity map, Bruneau, Idaho: U.S. Geological Survey Open-File Report, scale 1:62,500.
___ 1975, Aeromagnetic map of southwestern Montana and eastcentral Idaho: U.S. Geological Survey Open-File Report 75-655, scale 1:250,000.
___ 1980, Aeromagnetic map of the Hell's Canyon area, Idaho and Oregon: U.S. Geological Survey Open-File Report 80-947, scale 1:125,000.
___ 1981, Aeromagnetic map of the Jerry Peak area, Idaho: U.S. Geological Survey Open-File Report 81-933, scale 1:62,500.
Weis, P. L., Schmitt, L. J., Jr., and Tuchek, E. T., 1972 Mineral resources of the Salmon River Breaks Primitive area, Idaho, with a section on aeromagnetic survey, by W. E. Davis: U.S. Geological Survey Bulletin 1353-C, 91 p. 2 pis.
Zietz, Isidore, and others 1971, Interpretation of an aeromagnetic strip across the northwestern United States: Geological Society of AmericaBulletin, v. 82, no. 12, p. 3347-3371.
Zietz, Isidore, Gilbert, F. P., and Kirby, J. R., 1978, Aeromagnetic map of Idaho: color coded intensities: U.S. Geological Survey GeophysicallnvestigationsMapGP-920, scale 1:1,000,000.

ILLINOIS goo ago BSO
"-' \ NO DATA
4~~+-------~--4-----------~--~
(
~--
' /
I A
8
4~·~----~-----------+----------~~----------+---~
' \ NO DATA
' 3g0
'4r-------+----------~~----------+---~ ,,--...., J
I I
)
\ c D
" /
/ I
I 38°~..,._ _________ -+---------,+
50 100 MILES ~~~·.~,-~~~~~~--~~~~----~l~j I
50 100 150 KILOMETERS
SPECIFICATIONS
A East-West, 500 feet above ground, 1 mile (Beck, 1965) 8 East-West, 6000 feet above sea level, 5 mile (Zietz
and others, 1966) C North-South, 3000 feet above mean sea level, 1 mile (Heigold,
1976) D North-South, 1000 feet above mean terrain, 1 mile (Johnson
and others, 1980) E East-West, 400 feet above ground, 6 mile (Texas Instruments,
1980)
\
18
..I
}
SOURCES OF DATA Beck, M. E., Jr., 1965, Aeromagnetic map of northeastern Illinois and
its geologic interpretation: U.S. Geological Survey Geophysical Investigations Map GP-523, with 6 p. text, scale 1:250,000.
Heigold, P. C., 1976, An aeromagnetic survey of southwestern Illinois: Illinois State Geological Survey, Circular 495, 28 p., 1 pl., 11 figs., 2 tables.
Johnson, R. W., and others, 1980, Aeromagnetic map of the east-central midcontinent of the United States-Washington: Division of Reactor Safety Research, Office of Nuclear Regulatory Research, United States Nuclear Regulatory Commission: Springfield, Va., 12 p., 1 pl. scale 1:250,000.
Texas Instruments, Inc., 1980, National Uranium Resource Evaluation aerial gamma-ray and magnetic reconnaissance survey of portions of Arkansas, Illinois, Indiana, Kentucky, Missouri, and Tennessee; Paducah quadrangle-Final Report: U.S. Department of Energy Grand Junction Office [Report] GJBX 41-.SO, v. 2, n.p., scale 1:500,000.
Zietz, Isidore, and others, 1966, Crustal study of a continental strip from the Atlantic ocean to the Rocky Mountains: Geological Society of America Bulletin, v. 77, no. 12, p. 1427-1448, 2 pis.

87" 86° as·
I I
41°'--t---1----1-----+-+-
sso ss· 94• 93° 92" ,- -- --< \
0 I 111111 I 0 50
50 I I
1tlo
D
E
F
'~ " 100 MILES
I I
1 ~0 KILOMETERS
/
I
19
INDIANA;· IOWA
SPECIFICATIONS
North-South, 1000 feet above ground, 1 mile (Richardson, 1978)
SOURCES OF DATA
Richardson, N. R., Jr., 1978, Total magnetic intensity map of Indiana: Purdue University, Department of Geosciences, scale 1:500,000.
SPECIFICATIONS
The flight elevation of all surveys was 1000 feet above ground, except for area F which was 2000 feet above sea level. The flight direction and spacing for all the surveys was east-west and one mile, respectively. Data used to compile this map were published by the U.S. Geological Survey, A (Henderson and Vargo, 1965), and by the Iowa Geological Survey, 8 (1965), C (1968), D (1969), E (1970), and F (1973).
SOURCES OF DATA
Henderson, J. R., and Vargo, J. L., 1965, Aeromagnetic map of central Iowa: U.S. Geological Survey Geophysical Investigations Map GP-476, scale 1:316,800.
Iowa Geological Survey, 1965, Preliminary interpretation report, airborne magnetometer survey of northwestern Iowa: Iowa Geological Survey, scale 1:500,000.
___ 1968, Preliminary interpretation report, airborne magnetometer survey of northeastern Iowa: Iowa Geological Survey, scale 1:500,000.
___ 1969, Preliminary interpretation report, airborne magnetometer survey of east-central Iowa: Iowa Geological Survey, scale 1:500,000.
___ 1970, Preliminary interpretation report, airborne magnetometer survey of southeastern Iowa: Iowa Geological Survey, scale 1:500,000.
___ 1973, Preliminary interpretation report, airborne magnetometer survey of southern Iowa: Iowa Geological Survey, scale 1:500,000.

KANSAS, KENTUCKY
102" 41f.
101° 1000 99"
I I
39"
A B
3Bo
37°
0 50 I•'• :,•1 I I 'I I
0 50 100
37°
0 50 I •'• /,'1 I I 'I I
0 50 100
9Bo
100 MILES I
I
97°
150 KILOMETERS
)
100 MILES I I I
150 KILOMETERS
96° 95°
c
63° ,,_
' '
\
' "'
""'
_L
/
20
SPECIFICATIONS
All lines flown in an East-West direction at 2 mile spacing with elevations as shown below. A 4500 feet above sea level (Yarger and others, 1980) B 3000 feet above sea level (Yarger and others, 1980) C 2500 feet above sea level (Yarger and others, 1980)
SOURCES OF DATA
Yarger, H., Robertson, R., Martin , J,. Ng, K., Sooby, R., and Wentland, R., 1980, Aeromagnetic map of Kansas: Kansas Geological Survey Open-File Map, scale 1:500,000.
SPECIFICATIONS East-West, 1000 feet constant barometric altitude, 1 mile
(Johnson and others, 1978)
SOURCES OF DATA
Johnson, R. W., Jr., Haygood, C., and Kunselman, P. M., 1978, Residual total-intensity aeromagnetic map of Kentucky: Kentucky Geological Survey 3 sheets, scale 1:250,000.

l '\
)
93° 92"
E J/ ~
,)
31°'--l----il------+-""""-(
I
f F
50
50
91°
K
100
SPECIFICATIONS
90"
100 MILES
150 KILOMETERS
A East-West,400feetaboveground,3mile (EG&G GeoMetries, 1980a)
B East-West, 400feet above ground, 3 mile (Texas Instruments, 1980)
C East-West,400feetaboveground,6mile (EG&G GeoMetries, 1980f)
D East-West,400feet above ground, Smile (EG&G GeoMetries, 1980b)
E East-West,400feetabove ground,6 mile (EG&G GeoMetries, 1980c)
F East-West,400feetaboveground,6mile (EG&G GeoMetries, 1980j)
G Specifications unknown (unpublished data) H East-West,400feetaboveground,6 mile (EG&G GeoMetries,
1980g) I East-West,400feetabove ground, 6 mile (EG&G GeoMetries,
1980d) J East-West, 400feet above ground, 6 mile (EG&G GeoMetries,
1980e) K East-West,400feetabove ground, Smile (EG&G GeoMetries,
1980h) L East-West, 400feetabove ground, 6 mile (EG&G GeoMetries,
1980i)
21
LOUISIANA
SOURCES OF DATA
EG&G GeoMetries, Inc., 1980a, National Uranium Resource Evaluation aerial gamma-ray and magnetic reconnaissance survey, NebraskaTexas project, Tyler, Texarkana, and Waco quadrangles of Texas, Oklahoma, Arkansas, and Louisiana-Final Report: U.S. Department of Energy Grand Junction Office [Report] GJBX 69-80, v. 2, n.p., scale 1:500,000.
___ 1980b, National Uranium Resource Evaluation aerial gammaray and magnetic reconnaissance survey, Shreveport quadrangle, Louisiana-Final Report: U.S. Department of Energy Grand Junction Office [Report] GJBX 151-80, v. 2, n.p., scale 1:500,000.
___ 1980c, National Uranium Resource Evaluation aerial gammaray and magnetic reconnaissance survey, Alexandria quadrangle, Louisiana and Texas-Final Report: U.S. Department of Energy Grand Junction Office [Report] GJBX 152-80, v. 2, n.p., scale 1:500,000.
___ 1980d, National Uranium Resource Evaluation aerial gammaray and magnetic reconnaissance survey, Jackson quadrangle, Louisiana and Mississippi-Final Report: U.S. Department of Energy Grand Junction Office [Report] GJBX 153-80, v. 2, n.p., scale 1:500,000.
___ 1980e, National Uranium Resource Evaluation aerial gammaray and magnetic reconnaissance survey, Natchez quadrangle, Mississippi and Louisiana-Final Report: U.S. Department of Energy Grand Junction Office [Report] GJBX 180-80, v. 2, n.p., scale 1:500,000.
___ 1980f, National Uranium Resource Evaluation aerial gammaray and magnetic reconnaissance survey, El Dorado quadrangle, Louisiana and Arkansas-Final Report: U.S. Department of Energy Grand Junction Office [Report] GJBX 182-80, v. 2, n.p., scale 1:500,000.
___ 1980g, National Uranium Resource Evaluation aerial gammaray and magnetic reconnaissance survey, Greenwood quadrangle, Mississippi, Arkansas, and Louisiana-Final Report: U.S. Department of Energy Grand Junction Office [Report] GJBX 183-80, v. 2, n.p., scale 1:500,000.
___ 1980h, National Uranium Resource Evaluation aerial gammaray and magnetic reconnaissance survey, Baton Rouge quadrangle, Louisiana and Mississippi-Final Report: U.S. Department of Energy Grand Junction Office [Report] GJBX 221-80, v. 2, n.p., scale 1:500,000.
___ 1980i, National Uranium Resource Evaluation aerial gammaray and magnetic reconnaissance survey, Mobile quadrangle, Louisiana, Mississippi, and Alabama-Final Report: U.S. Department of Energy Grand Junction Office [Report] GJBX 222-80, v. 2, n.p., scale 1:500,000.
___ 1980j, National Uranium Resource Evaluation aerial gammaray and magnetic reconnaissance survey of Lake Charles and Port Arthur quadrangles, Texas and Louisiana-Final Report: U.S. Department of Energy Grand Junction Office [Report] GJBX 224-80, v. 2, n.p., scale 1:500,000.
Texas Instruments, Inc., 1980, National Uranium Resource Evaluation aerial gamma-ray and magnetic reconnaissance survey of portions of Texas [Palestine quadrangle]-Final Report: U.S. Department of Energy Grand Junction Office [Report] GJBX 45-80, v. 2, n. p., scale 1:500,000.

MAINE
69"
/'
I I
44°'-t-----t:-----+-----/-
' \
50 100 MILES ~~~~-L-L~~_J~~
50 100 150 KILOMETERS
SPECIFICATIONS
A Northwest-Southeast, 2500feet barometric, 10 mile (Zietz and others, 1972)
B North-South, 2500feet barometric, 2to 6 mile (Zietz and others, 1972)
C East-West,500feetaboveground, %mile(Zietzand others, 1972)
D East-West, 500feetabove ground,% mile (Zietz and others, 1972)
E North-South, 500feetabove ground,% mile (Zietz and others, 1972)
F North-South, 3500feet barometric,% mile (Zietz and others, 1972)
G Northwest-Southeast, 500feet above ground,% mile (Zietz and others, 1972)
H North-South, 500feet above ground,% mi·le (Zietz and others, 1972)
I East-West, 500feetabove ground,% mile (Zietz and others, 1972)
J East-West, 1 OOOfeetabove ground, 2 mile (Zietz and others, 1972)
K North-South, 750feet above ground,% mile (Zietz and others, 1972)
L North-South, 500feet above ground,% mile (Zietz and others, 1972)
M East-West, 500feetabove ground,% mile (Zietz and others, 1972)
N North-South,500feetaboveground, %mile(Zietzand others, 1972)
0 North-South, 500feet above ground,% mile (Zietz and others, 1972)
P Northwest-Southeast, 2500feet barometric, 5 mile (Zietz and others, 1972)
22
Q Northwest-Southeast, 500feet above ground, V4tO% mile (Zietz and others, 1972)
R North-South, 500feetabove ground,% mile (Zietz and others, 1972)
S Northwest-Southeast, 500feetabove ground,% mile (Zietz and others, 1972)
T Northwest-Southeast, 2500feet barometric, 5 mile (Zietz and others, 1972)
U East-West,500feetaboveground, %mile(Zietzand others, 1972)
V East-West,400feetaboveground, %mile(Zietzand others, 1972)
W Northwest-Southeast, 2500feet barometric, 6 mile (Zietz and others, 1972)
X East-West, 750feelaboveground, %mile(Zietzand others, 1972)
Y Northwest-Southeast, 150 meters above sea level, 8 kilometers (Taylor and others, 1968)
SOURCES OF DATA
Taylor, P. T., Zietz, Isidore, and Dennis, L. S., 1968, Geologic implications of aeromagnetic data from the eastern continental margin of the United States: Geophysics, v. 33, no. 5, p. 755-780.
Zietz, Isidore, Gilbert, F. P., and Kirby, J. R., Jr., 1972, Northeastern United States aeromagnetic maps: U.S. Geological Survey OpenFile Report, 13 sheets, scale 1:250,000.

BB"
SPECIFICATIONS A North-South and East-West, 500feetaboveground,
0.25-3 mile (Zietz and Kirby, 1971) 8 North-South, 500feet above ground, 0.5 mile (USGS, 1970) C North-South, 3000feetbarometric, 3 mile (Hinze and others,
1971) D North-South, 3000feet barometric, 6 mile (Wold and Ostenso,
1966) E Northeast-Southwest, 3000feet barometric, 6 mile (Hinze and
others, 1966) F Northwest-Southeast (southern half) Northeast-Southwest
(northern half), 3000feet barometric, 6 mile (O'Hara and Hinze, 1966)
23
0 11'1 I'll
50 I I I
I 100
100 MILES I I I
150 KILOMETERS
SOURCES OF DATA
MICHIGAN
Hinze, W. J., O'Hara, N. W., Trow, J. W., and Secor, G. B., 1966, Aeromagnetic studies of eastern Lake Superior, in Steinhart, J. S., and Smith, T. J., editors, The earth beneath the continents: American Geophysical Union Geophysical Monograph 10, p. 95-110, 8 figs., 1 pl.
Hinze, W. J., Kellogg, R. L., and Merritt, D. W., 1971, Gravity and aeromagnetic anomaly maps of the southern peninsula of Michigan: Michigan Department of Natural Resources Geological Survey Division Report of Investigation 14, 15 p., 2 pls., 5 figs.
0' Hara, N. W., and Hinze, W. J., Michigan State University, written com. munication, 1966.
U.S. Geological Survey, 1970, Aeromagnetic map of the MenomineeNorthland area, Dickinson, Marquette, and Menominee Counties, Michigan, and Marinette County, Wisconsin: U.S. Geological Survey Geophysical Investigations Map GP-711, 2 sheets, scale 1:62,500.
Wold, R. J., and Ostenso, N. A., 1966, Aeromagnetic, gravity, and subbottom profiling studies in western Lake Superior, in Steinhart, J. S., and Smith, T. J., editors, The earth beneath the continents: American Geophysical Union Geophysical Monograph 10, p. 66-94, 33 figs.
Zietz, Isidore, and Kirby, J. R., 1971, Aeromagnetic map ofthe western part of the northern peninsula, Michigan, and part of northern Wisconsin: U.S. Geological Survey Geophysical Investigations Map GP-750, scale 1:250,000.

MINNESOTA
95°
97° 49°-
I
~ I I A 48°
B
47°
I I
\H I
46°
\ ..... I N
45°
44° p
I I L
0 I,·,,. •'I 0
SPECIFICATIONS A North-South,500feetaboveground, 1 mile (Bath and
others,1964b) B North-South, 1 OOOfeetabove ground, 1 mile (Bath and
others, 1964b) C North-South, 1 OOOfeetabove ground, 1 mile (Bath and
others, 1965a)
50
'
D North-South, 1000feetaboveground, 1 mile(USGS, 1968b) E North-South, 500feetaboveground, 0.5to 1 mile (Bath
and others, 1965a) F North-South, 1 OOOfeetabove ground, 1 mile (USGS, 1969) G East-West, 1000feetaboveground, 1 mile (Bath and
others, 1965a) H North-South, 500feetabove ground, 1 mile (Bath and
others, 1965b) I North-South, 1 OOOfeetabove ground, 1 mile (Bath and
others, 1965b) J North-South, 1000feetaboveground, 1 mile(Bathand
others, 1964a) K East-West, 1000feet above ground, 1 mile (Bath and
others, 1964a) L North-South, 1000feetabove ground,2to4 mile (Bath
and others, 1964a) M East-West, 1000feetbarometric, 1 mile(USGS, 1968a) N East-West,1000feetaboveground, 1 mile(USGS,1970) 0 East-West,500feetaboveground, 1 mile(Simsand
Zietz, 1967) P East-West, 1 OOOfeetaboveground, 1 mile (Philbin and
Gilbert, 1966b) Q East-West, 1 OOOfeetabove ground, 1 mile (Philbin and
Gilbert, 1966a)
94° 93°
\__,'
J
0
50 I I
I I
100
24
92o
'
Q \ I
- __..J
100 MILES I I
I
150 KILOMETERS
SOURCES OF DATA Bath, G. D., Schwartz, G. M., and Gilbert, F. P., 1964a, Aeromagnetic
and geologic map of east-central Minnesota: U.S. Geological Survey Geophysical Investigations Map GP-4 7 4, scale 1:250,000.
___ 1964b, Aeromagnetic and geologic map of northwestern Minnesota: U.S. Geological Survey Geophysical Investigations Map GP-471, scale 1:250,000.
___ 1965a, Aeromagnetic and geologic map of northeastern-Minnesota: U.S. Geological Survey Geophysical Investigations Map GP-472, scale 1:250,000.
___ 1965b, Aeromagnetic and geologic map of west-central Minnesota: U.S. Geological Survey Geophysical Investigations Map GP-473, scale 1:250,000.
Philbin, P. W., and Gilbert, F. P., 1966a, Aeromagnetic map of southeastern Minnesota: U.S. Geological Survey Geophysical Investigations Map GP-559, scale 1:250,000.
____ 1966b, Aeromagnetic map of southwestern Minnesota: U.S. Geological Survey Geophysical Investigations Map GP-560, scale 1:250,000.
Sims, P. K., and Zietz, Isidore, 1967, Aeromagnetic and inferred Precambrian paleogeologic map of east-central Minnesota and part of Wisconsin: U.S. Geological Survey Geophysical Investigations Map GP-563, 6p. text, scale 1:250,000.
U.S. Geological Survey, 1968a, Aeromagnetic map of central Pine County, Minnesota and adjacent parts of Wisconsin: U.S. Geological Survey Geophysical Investigations Map GP-636, scale 1:62,500.
___ 1968b, Aeromagnetic map of the Kabetogama Lake-Grassy Lake area, St. "Louis County, Minnesota: U.S. Geological Survey Geophysical InvestigationsMapGP-616, scale 1:250,000.
___ 1969, Aeromagnetic map of the McNair-Grand Portage area, northeastern Minnesota: U.S. Geological Survey Geophysical InvestigationsMapGP-639, scale 1:250,000.
___ 1970, Aeromagnetic map of a part of western Minnesota: U.S. Geological Survey Geophysical Investigations Map GP-692, scale 1:250,000.

9(Y' 89" ~l!i"--r--- -------!------
I " ,1
~· I A E
/
91' .J" 15,
\
,d >-,,.. (/)
B F
33° (j - ) !
~~ L J!
~ c G
j') r
,_[I 32
/ i
D H
_j ______ l \ 31"---
50
I I
( I
' '
SO 100 MILES
100 150 KILOMETERS
SPECIFICATIONS
I
I I I
I I I
I I I
I I
I
I I I
I I I
I I I
\ I I
\ I
I I
\
All lines flown East-West, 400 feet above ground, with six-mile spacing. A (EG&G GeoMetries, 1980g) B (EG&G GeoMetries, 1980f) C (EG&G GeoMetries, 1980a) D (EG&G GeoMetries, 1980d) E (EG&G GeoMetries, 1980h) F (EG&G GeoMetries, 1980e) G (EG&G GeoMetries, 1980b) H (EG&G GeoMetries, 1980c) I (EG&G GeoMetries, 1980i)
25
MISSISSIPPI
SOURCES OF DATA
EG&G GeoMetries, 1980a, National Uranium Resource Evaluation aerial gamma-ray and magnetic reconnaissance survey, Jackson quadrangle, Louisiana and Mississippi -Final Report: U.S. Department of Energy Grand Junction Office [Report] GJBX 153-80, v. 2, n.p., scale 1:500,000.
___ 198Gb, National Uranium Resource Evaluation aerial gammaray and magnetic reconnaissance survey, Meridian quadrangle, Mississippi and Alabama-Final Report: U.S. Department of Energy Grand Junction Office [Report] GJBX 154-80, v. 2, n.p., scale 1:500,000.
___ 1980c, National Uranium Resource Evaluation aerial gammaray and magnetic reconnaissance survey, Hattiesburg quadrangle, Mississippi, Alabama, and Louisiana-Final Report: U.S. Department of Energy Grand Junction Office [Report] GJBX 155-80, v. 2, n.p., scale 1:500,000.
___ 1980d, National Uranium Resource Evaluation aerial gammaray and magnetic reconnaissance survey, Natchez quadrangle, Mississippi, and Louisiana-Final Report: U.S. Department of Energy Grand Junction Office [Report] GJBX 180-80,· v. 2, n.p., scale 1:500,000.
___ 1980e, National Uranium Resource Evaluation aerial gammaray and magnetic reconnaissance survey, West Point quadrangle, Mississippi, and Alabama-Final Report: U.S. Department of Energy Grand Junction Office [Report] GJBX 181-80, v. 2, n.p., scale 1:500,000.
___ 1980f, National Uranium Resource Evaluation aerial gammaray and magnetic reconnaissance survey, Greenwood quadrangle, Mississippi, Arkansas, and Louisiana-Final Report: U.S. Department of Energy Grand Junction Office [Report] GJBX 183-80, v. 2, n.p., scale 1:500,000.
___ 1980g, National Uranium Resource Evaluation aerial gammaray and magnetic reconnaissance survey, Helena quadrangle, Arkansas, Mississippi, and Tennessee-Final Report: U.S. Department of Energy Grand Junction Office [Report] GJBX 201-80, v. 2, n.p., scale 1:500,000.
___ 1980h, National Uranium Resource Evaluation aerial gammaray and magnetic reconnaissance survey, Tupelo quadrangle, Mississippi, Alabama, and Tennessee-Final Report: U.S. Department of Energy Grand Junction Office [Report] GJBX 203-80, v. 2, n.p., scale 1:500,000.
___ 1980i, National Uranium Resource Evaluation aerial gammaray and magnetic reconnaissance survey, Mobile quadrangle, Louisiana, Mississippi, and Alabama-Final Report: U.S. Department of Energy Grand Junction Office [Report] GJBX 222-80, v. 2, n.p., scale 1:500,000.

MISSOURI 95° 94° 93° 92" --~
' r------- 1------- ------
I \ A I
l \ 4~-
\........., I
~ H \ I B ' \ '\ 91° '<
\ ' ~} '
I ) I ,,--......., I
I J ,.--- I
J I ) c K p
l - I I
~ Q I
I - r--
~-"" I I L M AA 38° ~·
I I v uj FF ) , .... N
w z
""" ~
I D T X \ I '
t F R BB r-- GG ) H y
I J HHI \
IE cc DD \
37°_1_ \.S' I F I EE ~ ~
0 s II ,
I G J
L ___ ---------------1------- ----~ v/"'
\. ,.' I
0 50 100 MILES /. '/s _21~
0 50 100 150 KILOMETERS 36"--r-
SPECIFICATIONS
A East-West, 400 feet above ground, 6 mile (EG&G GeoMetries, 1980e)
B East-West, 400 feet above ground, 6 mile (EG&G GeoMetries, 1980c)
C East-West, 400 feet above ground, 6 mile (EG&G GeoMetries, 1980b)
D East-West, 400 feet above ground, 3 mile (Texas Instruments, 1978)
E North-South, 1000 feet above ground,% mile (Keller and Henderson, 1963)
F North-South, 2000 feet above sea level,% mile (Missouri Geological Survey, 1968a)
G East-West, 400 feet above ground, 3 mile (Texas Instruments, 1978)
H Vertical intensity data, 1 and 2 mile intervals (Missouri Geological Survey, 1943)
I North-South, 1500 feet above sea level,% mile (Missouri Geological Survey, 1970)
J East-West, 400 feet above ground, 6 mile (EG&G GeoMetries, 1980d)
K North-South, 1500 feet above sea level,% mile (Missouri Geological Survey, 1969)
L North-South, 1500 feet above sea level,% mile (Missouri Geological Survey, 1963a)
M North-South, 1500 feet barometric,% mile (Missouri Geological Survey, 1965)
N North-South, 1700 feet above sea level,% mile (Missouri Geological Survey, 1962)
0 East-West, 400 feet above ground, 6 mile (EG&G GeoMetries, 1980a)
P North-South, 1500 feet above sea level,% mile (Missouri Geological Survey, 1961a)
Q North-South, 500 feet above ground, 1 mile (Missouri Geological Survey, 1968c)
R North-South, 1800feetbarometric, %mile(USGS, 1979)
26
S East-West, 400 feet above ground, 3 mile (Texas Instruments, 1980b)
T North-South, 1800feetbarometric, %mile(Dempseyand Duffner, 1949)
U North-South, 1800 feet barometric,% mile (Dempsey and others, 1950a)
V North-South, 1800 feet barometric,% mile (Dempsey and others, 1950b)
W North-South, 1800 feet barometric, V4 mile (Dempsey and Meuschke, 1951a)
X North-South, 1800 feet barometric, V4 mile (Dempsey and Meuschke, 1951b)
Y North-South, 1800feet barometric,% mile (Dempsey and Meuschke, 1951c)
Z North-South, 1800feet barometric,% mile (Dempsey and Meuschke, 1951d)
AA North-South, 1800feet barometric,% mile (Dempsey and Meuschke, 1951e)
BB North-South, 1500 feet above sea level,% mile Missouri Geological Survey, 1961b)
CC North-South, 1500 feet above sea level,% mile (Missouri Geological Survey, 1968d)
DD North-South, 500 feet above ground,% mile (Missouri Geological Survey, 1968b)
EE North-South, 400 feet above ground, 1 mile (Missouri Geological Survey, 1963b)
FF East-West, 1000feetaboveground, 1 mile(Johnsonand others, 1980)
GG East-West, 400 feet above ground, 6 mile (Texas Instruments, 1980a)
HH North-South, 1000 feet above sea level,% mile (Missouri Geological Survey, 1963c)
II East-West, 1500 feet constant barometric altitude, 1 mile (USGS, 1974)

SOURCES OF DATA
Dempsey, W. J., and Duffner, R. T., 1949, Total intensity aeromagnetic maps of [Missouri]: U.S. Geological Survey Geophysical Investigations Maps (no numbers), 8 sheets, scale 1:31,680 (Coldwater, DeSoto, Des Arc, Farmington and part of Crystal City, Fredericktown, Ironton, Richwoods and St. Clair quadrangles).
Dempsey, W. J., Duffner, R. T., Keller, Fred, Jr., and Henderson, J. R., Jr., 1950a, Total intensity aeromagnetic map of Bonne Terre quadrangle, Missouri: U.S. Geological Survey Geophysical Investigations Map GP-14, scale 1:31,680.
____ 1950b, Total intensity aeromagnetic map of Potosi quadrangle, Missouri: U.S. Geological Survey Geophysical Investigations Map GP-13, scale 1:31,680.
Dempsey, W. J., and Meuschke, J. L., 1951a, Total intensity aeromagnetic map of Berryman quadrangle, Missouri: U.S. Geological Survey Geophysical Investigations Map GP-77, scale 1:31,680.
____ 1951b, Total intensity aeromagnetic map of part of Higdon quadrangle, Missouri: U.S. Geological Survey GeophysicallnvestigationsMapGP-80, scale 1:31,680.
____ 1951c, Total intensity aeromagnetic map of part of Marquand quadrangle, Missouri: U.S. Geological Survey GeophysicallnvestigationsMapGP-79, scale 1:31,680.
____ 1951d, Total intensity aeromagnetic map of part of Weingarten quadrangle, Missouri: U.S. Geological Survey Geophysical InvestigationsMapGP-81, scale 1:31,680.
____ 1951e, Total intensity aeromagnetic map of Sullivan quadrangle and part of Union quadrangle, Missouri: U.S. Geological Survey Geophysical Investigations Map GP-78, scale 1:31,680.
____ 1980a, National Uranium Resource Evaluation aerial gammaray and magnetic reconnaissance survey, Harrison quadrangle, Missouri and Arkansas-Final Report: U.S. Department of Energy Grand Junction Office [Report] GJBX 150-80, v. 2, n.p., scale 1:500,000.
____ 1980b, National Uranium Resource Evaluation aerial gammaray and magnetic reconnaissance survey, Lawrence quadrangle, Kansas and Missouri -Final Report: U.S. Department of Energy Grand Junction Office [Report] GJBX 239-80, v. 2, n.p., scale 1:500,000.
____ 1980c, National Uranium Resource Evaluation aerial gammaray and magnetic reconnaissance survey, Kansas City quadrangle, Kansas and Missouri-Final Report: U.S. Department of Energy Grand Junction Office [Report] GJBX 259-80, v. 2, n.p., scale 1:500,000.
____ 1980d, National Uranium Resource Evaluation aerial gammaray and magnetic reconnaissance survey, Jefferson City quadrangle, Missouri -Final Report: U.S. Department of Energy Grand Junction Office [Report] GJBX260-80, v. 2, n.p., scale 1:500,000.
____ 1980e, National Uranium Resource Evaluation aerial gammaray and magnetic reconnaissance survey, Nebraska City quadrangle, Missouri, Iowa, Nebraska, and Kansas-Final Report: U.S. Department of Energy Grand Junction Office [Report] GJBX 261-80, v. 2, n.p., scale 1:500,000.
Johnson, R. W., and others, 1980, Aeromagnetic map of the east-central midcontinent of the United States-Washington: Division of Reactor Safety Research, Office of Nuclear Regulatory Research, United States Nuclear Regulatory Commission: Springfield, Va., scale 1:250,000.
Keller, Fred Jr., and Henderson, J. R., 1963, Aeromagnetic map of part of the Tri-State mining district, Kansas, Missouri, and Oklahoma: U.S. Geological Survey Geophysical Investigations Map GP-427, scale 1:125,000.
Missouri Geological Survey and Water Resources, 1943, Magnetic map of Missouri showing anomalies of vertical intensity: (Rolla, Missouri), scale 1:500,000 (reprinted in 1958).
27
Missouri Division of Geological Survey and Water Resources, 1961a, Total intensity aeromagnetic maps, Augusta, Bland, Hermann, Linn, Meta, Mokane, Morrison, Redbird, St. Clair, Tavern, Union, Vienna, and Washington quadrangles: (Rolla, Missouri), 13 sheets, scale 1:62,500.
____ 1961b, Total intensity aeromagnetic maps, Boss, Corridon, Edgehill, and Lesterville quadrangles: (Rolla, Missouri), 4 sheets, scale 1:62,500.
____ 1962, Total intensity aeromagnetic maps, Ash Grove, Fairplay, Greenfield, Hermitage, Macks Creek, Stockton, Stockton 1, Stockton 2, Stoutland, and Urbana quadrangles: (Rolla, Missouri), 10sheets, scale 1:62,500.
___ 1963a, Total intensity aeromagnetic maps, Butler 4, Clinton 3, Clinton 4, and Fristoe quadrangles: (Rolla, Missouri), 4 sheets, scale 1:62,500.
____ 1963b, Total intensity aeromagnetic map of Carter County, (Rolla, Missouri), scale 1:62,500.
____ 1963c, Total intensity aeromagnetic map, Advance quadrangle: (Rolla, Missouri), scale 1:62,500.
____ 1965, Total intensity aeromagnetic maps, Eugene, Iberia, Linn Creek, Little Niangua, Richland, Tavern, and Warsaw quadrangles: (Rolla, Missouri), 7 sheets, scale 1:62,500.
____ 1968a, Total intensity aeromagnetic maps, Joplin East, Neosho, Ritchey, Sarcoxie, Seneca, Bolivar, Buffalo, Morrisville, and Strafford quadrangles: (Rolla, Missouri), 9sheets, scale 1:62,500.
___ 1968b, Total intensity aeromagnetic maps, Ellington, Greenville, Piedmont, and Zalma quadrangles: (Rolla, Missouri), 4 sheets, scale 1:62,500.
____ 1968c, Total intensity aeromagnetic map, Gerald quadrangle: (Rolla, Missouri), scale 1:62,500.
___ 1968d, Total intensity aeromagnetic map, Cardavera quadrangle: (Rolla, Missouri), scale 1:62,500.
___ 1969, Total intensity aeromagnetic maps, Eldon, Gravois Mills, Green Ridge, Lincoln, Nelson, Pilot Grove, Smithton, Tipton, and Warsaw I quadrangles: (Rolla, Missouri), 9sheets, scale 1:62,500.
___ 1970, Total intensity aeromagnetic maps, Boonville, California, Fayette, Glasgow, Glasgow 2, Huntsville, Marshall, and Marshall1 quadrangles: (Rolla, Missouri), 8sheets, scale 1:62,500.
Texas Instruments, Inc., 1978, National Uranium Resource Evaluation aerial gamma-ray and magnetic reconnaissance survey of the Great Plains and Central Lowlands (Joplin quadrangle, v. 2-L, and Tulsa quadrangle, v. 2-N)-Final Report: U.S. Department of Energy Grand Junction Office [Report] GJBX 100-78, v. 2, n.p., scale 1:500,000.
____ 1980a, National Uranium Resource Evaluation aerial gammaray and magnetic reconnaissance survey of portions of Arkansas, Illinois, Indiana, Kentucky, Missouri and Tennessee: Paducah quadrangle-Final Report: U.S. Department of Energy Grand Junction Office [Report] GJBX41-80, v. 2, n.p., scale 1:500,000.
____ 1980b, National Uranium Resource Evaluation aerial gammaray and magnetic reconnaissance survey of portions of Arkansas, Illinois, Indiana, Kentucky, Missouri and Tennessee: Poplar Bluff quadrangle- Final Report: U.S. Department of Energy Grand Junction Office [Report] GJBX42-80, v. 2, n.p., scale 1:500,000.
U.S. Geological Survey, 1974a, Aeromagnetic map of the New Madrid region, Missouri, Kentucky, Arkansas, and Tennessee: U.S. Geological Survey Open-File Report74-360, scale 1:125,000.
___ 1979, Aeromagnetic map of the Rolla, Missouri area: U.S. Geological Survey Open-File Report 79-966, scale 1:250,000.
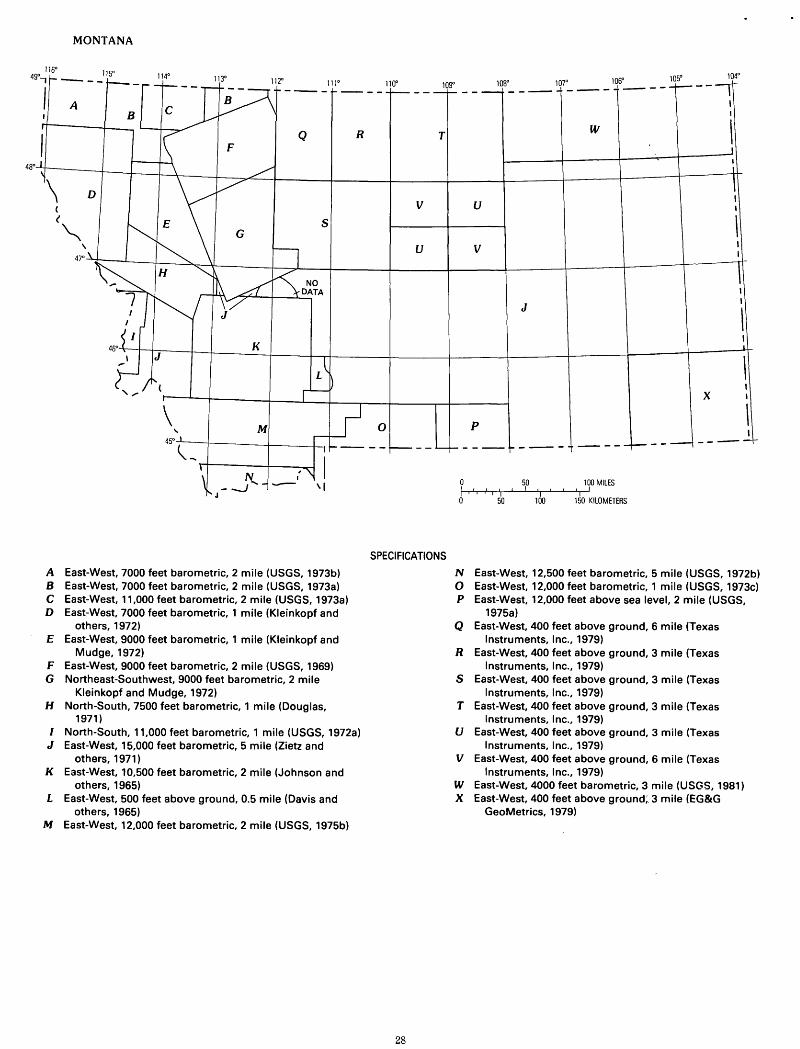
48°
MONTANA
115°
A
\ (
< s
"' \ 47°
NO DATA
\ M ' 45°
'--N
, I
- -.J' 'I J
A East-West, 7000 feet barometric, 2 mile (USGS, 1973b) 8 East-West, 7000 feet barometric, 2 mile (USGS, 1973a) C East-West, 11,000 feet barometric, 2 mile (USGS, 1973a) D East-West, 7000 feet barometric, 1 mile (Kieinkopf and
others, 1972) E East-West, 9000 feet barometric, 1 mile (Kieinkopf and
Mudge, 1972) F East-West, 9000 feet barometric, 2 mile (USGS, 1969) G Northeast-Southwest, 9000 feet barometric, 2 mile
Kleinkopf and Mudge, 1972) H North-South, 7500 feet barometric, 1 mile (Douglas,
1971)
R
I North-South, 11,000 feet barometric, 1 mile (USGS, 1972a) J East-West, 15,000 feet barometric, 5 mile (Zietz and
others, 1971) K East-West, 10,500 feet barometric, 2 mile (Johnson and
others, 1965) L East-West, 500 feet above ground, 0.5 mile (Davis and
others, 1965) M East-West, 12,000 feet barometric, 2 mile (USGS, 1975b)
105° 104° 110" 109" 108° 107° 106" ---- , ___ _
T
v
u
0
SPECIFICATIONS
28
w
u
v
J
X
p
0 50 100 MILES I•'• ,'I 'j I 'j I I I
I 0 50 100 150 KILOMETERS
N East-West, 12,500 feet barometric, 5 mile (USGS, 1972b) 0 East-West, 12,000 feet barometric, 1 mile (USGS, 1973c) P East-West, 12,000 feet above sea level, 2 mile (USGS,
1975a) Q East-West, 400 feet above ground, 6 mile (Texas
Instruments, Inc., 1979) R East-West, 400 feet above ground, 3 mile (Texas
Instruments, Inc., 1979) S East-West, 400 feet above ground, 3 mile (Texas
Instruments, Inc., 1979) T East-West, 400 feet above ground, 3 mile (Texas
Instruments, Inc., 1979) U East-West, 400 feet above ground, 3 mile (Texas
Instruments, Inc., 1979) V East-West, 400 feet above ground, 6 mile (Texas
Instruments, Inc., 1979) W East-West, 4000 feet barometric, 3 mile (USGS, 1981) X East-West, 400 feet above ground; 3 mile (EG&G
GeoMetries, 1979)

SOURCES OF DATA
Davis, W. E., Kinoshita, W. T., and Robinson, G. D., 1965, Bouguer gravity, aeromagnetic, and generalized geologic map of the eastern part of the Three Forks Basin, Broadwater, Madison, and Gallatin Counties, Montana: U.S. Geological Survey Geophysical Investigations Map GP-498, scale 1:62,500.
Douglas, J. K., 1971, Total-intensity aeromagnetic map of a portion of the Montana lineament: Billings, Montana University of Montana.
EG&G GeoMetries, 1979, National Uranium Resource Evaluation aerial gamma-ray and magnetic survey, Powder River II Project, Newcastle and Gillette [1 o by 2° quadrangles], Wyoming and South Dakota, and Ekalaka [1 o by 2o quadrangle], Montana, South and North DakotaFinal Report: U.S. Department of Energy Grand Junction Office [Report] GJBX 82-79, v. 2, n.p., scale 1:500,000.
Johnson, R. W., Jr., Henderson, J. R., and Tyson, N. S., 1965, Aeromagnetic map of the Boulder Batholith area, southwestern Montana: U.S. Geological Survey Geophysical Investigations Map GP-538, scale 1:250,000.
Kleinkopf, M. D., Harrison, J. E., and Zartman, R. E., 1972, Aeromagnetic and geologic map of part of northwestern Montana and northern Idaho: U.S. Geological Survey Geophysical Investigations Map GP-830, scale 1:250,000.
Kleinkopf, M. D., and Mudge, M. R., 1972, Aeromagnetic, Bouguer gravity, and generalized geologic studies of the Great Falls-Mission Range area, northwestern Montana: U.S. Geological Survey Professional Paper 726A, 19 p.
Texas Instruments, Inc., 1979, National Uranium Resource Evaluation aerial radiometric and magnetic reconnaissance survey of portions of Arizona, Idaho, Montana, New Mexico, South Dakota, and Washington, [Havre, Great Falls, Lewistown and Shelby 1 o by 2° quadrangles]-Final Report: U.S. Department of Energy Grand Junction Office. [Report] GJBX 126-79, v. 2B, C, E, F, n.p., scale 1:500,000.
29
U.S. Geological Survey, 1969, Aeromagnetic map of the Cut Bank-Hungry Horse Reservoir area, northwestern Montana: U.S. Geological Survey Open-File Report, scale 1:250,000.
___ 1972a, Aeromagnetic map of parts of the Hamilton and Elk City 1 o by 2° quadrangles, Idaho-Montana: U.S. Geological Survey Geophysical Investigations Map GP-832, scale 1:250,000.
___ 1972b, Aeromagnetic map of southeastern Idaho and part of southwestern Montana: U.S. Geological Survey Open-File Report, scale 1:500,000.
___ 1973a, Aeromagnetic map of parts of the Kalispell and Cutbank 1 o by 2° quadrangles, Montana: U.S. Geological Survey Open-File Report, scale 1:250,000.
___ 1973b, Aeromagnetic map of parts of the Okanogan and Sandpoint 1 o by 2° quadrangles, Washington-Idaho-Montana: U.S. Geological Survey Open-File Report, scale 1:250,000.
___ 1973c, Aeromagnetic map of Yellowstone National Park and vicinity, Wyoming-Montana-Idaho: U.S. Geological Survey OpenFile Report, 4 sheets, scale 1:125,000.
___ 1975a, Aeromagnetic map of the southeastern part of the Billings 1 o by 2° quadrangle, Montana: U.S. Geological Survey Open-File Report, 75-656, scale 1:250,000.
___ 1975b, Aeromagnetic map of southwestern Montana and east-central Idaho: U.S. Geological Survey Open-File Report, 75-655, scale 1:250,000.
___ 1981, Aeromagnetic map of northeastern Montana and western North Dakota: U.S. Geological Survey Open-File Report, 81-434, scale 1:250,000.
Zietz, Isidore, and others, 1971, Interpretation of an aeromagnetic strip across the northwestern United States: Geological Society of America Bulletin, v. 82, no. 12, p. 3347-3372.

NEBRASKA
JOJ• ------ 102" 101° 1000
D
A
99" -~
'... sa· -----..... 97° ......
I
\ )
'
50 100 MILES ~~rr+-~~~~~~~
50 100 150 KILOMETERS
SPECIFICATIONS
A East-West, 400 feet above ground, 3 mile (EG&G GeoMetries, 1979a)
8 East-West, 400 feet above ground, 3 mile (EG&G GeoMetries, 1979b)
C East-West, 400 feet above ground, 6 mile (EG&G GeoMetries, 1980)
D East-West, 400 feet above ground, 6 mile (Geodata, 1981a) E East-West, 6000 feet above sea level, 5 mile (Zietz and
others, 1966)
F East-West, 400 feet above ground, 6 mile (Geodata, 1981 b) G East-West, 400 feet above ground, 5 mile (Texas Instruments,
1978) H East-West, 400 feet above ground, 3 mile (EG&G GeoMetries,
1978) I East-West, 1000 feet above ground, 2 mile (USGS, 1973)
SOURCES OF DATA
EG&G GeoMetries, 1978, National Uranium Resource Evaluation aerial gamma-ray and magnetic survey, Fremont quadrangle, Nebraska, Iowa; Lincoln quadrangle, Nebraska; Manhattan and Hutchinson quadrangles, Kansas-Final Report: U.S. Department of Energy Grand Junction Office [Report) GJBX 20-78, v. 2, n.p., scale 1:500,000.
___ 1979a, National Uranium Resource Evaluation aerial gamma-ray and magnetic survey; Powder River II Project, Torrington and Casper quadrangles, Wyoming and Nebraska-Final Report: U.S. Department of Energy Grand Junction Office [Report] GJBX 158-79, v. 2, n.p., scale 1:500,000.
___ 1979b, National Uranium Resource Evaluation aerial gamma-ray and magnetic survey, Rock Springs, Rawlins, and Cheyenne quadrangles, Wyoming, and the Greeley quadrangle, Colorado-Final Report: U.S. Department of Energy Grand Junction Office [Report] GJBX 17-79, v. 2, n.p., scale 1:500,000.
___ 1980, National Uranium Resource Evaluation aerial gammaray and magnetic survey, Nebraska-Texas project, Alliance and Scottsbluff quadrangles, Nebraska-Final Report: U.S. Department of Energy Grand Junction Office [Report) GJBX 25-80, v. 2, n.p., scale 1:500,000.
Geodata International, Inc., 198la, National Uranium Resource
30
Evaluation aerial radiometric and magnetic survey, Valentine [quadrangle} Nebraska and South Dakota-Final Report: U.S. Department of Energy Grand Junction Office [Report] GJBX 41-81, v. 2, n.p., scale 1:500,000.
___ 1981b, National Uranium Resource Evaluation aerial radiometric and magnetic survey, McCook quadrangle, Nebraska-Final Report: U.S. Department of Energy Grand Junction Office [Report] GJBX 55-81, v. 2, n.p., scale 1:500,000.
Texas Instruments, Inc., 1978 ,National Uranium Resource Evaluation aerial radiometric and magnetic reconnaissance survey of portions of the Great Plains and Central Lowlands [Sioux City (v. 2-A), O'Neill (v. 2-B), Broken Bow (v. 2-C), and Grand Island (v. 2-D) quadrangles] -Final Report: U.S. Department of Energy Grand Junction Office [Report) GJBX 100-78, v. 2, n.p., scale 1:500,000.
U.S. Geological Survey, 1973, Aeromagnetic map of southeastern Nebraska and parts of adjacent states: U.S. Geological Survey Open-File Report, scale 1:250,000.
Zietz, Isidore, and others, 1966, Crustal study of a continental strip from the Atlantic ocean to the Rocky Mountains: Geological Society of America Bulletin, v. 77, no. 12, p. 1427-1448, pis.

120" 119" 118" 42"t--A-2
41·-~, ----+----.-+-_J_--1-----1--r_J_--J-----1
B
I I c 1 A-1
40~~-----r----L-r----~~~-+----+-----
' ' ' '
0 50 1 00 MILES rl ~.·~· ~·~·\r~'-L1 ~·~1 ~·~~·,~' 0 50 100 150 KILOMETERS
SPECIFICATIONS
K ' '
A East-West, 9000 feet barometric, 2 mile (A-1, USGS, 1972a; A-2, USGS, 1972b)
N ,,
B East-West, 1000 feet above ground, 0.5 mile (USGS, 1964); North-South, 9000 feet barometric, 1 mile (USGS, 1967a, b, c, and d; 1968a, c, e, f, g, h, i, j, k and I; 1970, 1973a, b, d, and e)
C North-South, 12,000 feet barometric, 5 mile (Zietz and others, 1978)
D North-South, 9000 feet barometric, 1 mile (Robertson, 1970)
E North-South, 9000 feet barometric, 1 mile (Davis and Stewart, 1970)
F North-South, 9000 feet barometric, 1 mile {F-1, USGS, 1968b); East-West 9000 feet barometric, 1 mile (F-2, USGS, 1969)
G East-West, 9000 to 15,000 feet barometric, 1 mile (G-1, USGS, 1971a; G-2, USGS, 1971b; G-3, USGS, 1971c)
H East-West, 500 and 1000 feet above ground, 1 mile (USGS, 1968d)
I North-South, 11,500 feet barometric, 1 mile (1-1, USGS, 1976c; 1-2, USGS, 1976d; 1-3, USGS, 1976e)
J North-South, 9000 feet barometric, 1 mile (J-1, USGS, 1973c; J-2, USGS, 1976a)
K East-West, 12,500 feet barometric, 5 mile (Zietz and others, 1978)
31
NEVADA
L East-West, 8000 feet barometric, 0.5 mile (Boynton and others, 1963a and b; Philbin and White, 1965a, b, c, d, e, f, g, h, i, and j)
M North-South, 12,000 feet barometric, 1 mile (USGS, 1976b) N East-West, 9000 feet barometric, 3 mile (USGS, 1975) 0 North-South, 400 feet above ground, 3 mile (Geo-Life, 1979) P East-West, 400 feet above ground, 3 mile (Western
Geophysical Co., 1979) Q East-West, 8000 feet barometric, 1 mile (unpublished data)
SOURCES OF DATA
Boynton, G. R., Meuschke, J. L., and Vargo, J. L., 1963a, Aeromagnetic map of the Timber Mountain quadrangle and part of the Silent Canyon quadrangle, Nye County, Nevada: U.S. Geologicai Survey Geophysical Investigations Map GP-443, scale 1:62,500.
___ 1963b, Aeromagnetic map of the Tippipah Spring quadrangle and parts of the Papoose Lake and Wheelbarrow Peak quadrangles, Nye County, Nevada: U.S. Geological Survey Geophysical Investigations Map GP-441, scale 1:62,500.
Davis, W. E., and Stewart, J. H., 1970, Aeromagnetic and generalized geologic map of the Austin area, Lander County, Nevada: U.S. Geological Survey Geophysical Investigations Map GP-694, scale 1:125,000.
Geo-Life (A joint venture between High Life Helicopters, Inc. and Geodata International, Inc.), 1979, National Uranium Resource Evaluation aerial radiometric and magnetic survey, Death Valley National Topographic Map, California and Nevada-Final Report: U.S. Department of Energy Grand Junction Office [Report] GJBX 164-79, v. 2, n.p., scale 1:500,000.
Philbin, P. W., and White, B. L., Jr., 1965a, Aeromagnetic map of the Belted Peak quadrangle and part of the White Blotch Springs quadrangle, Nye County, Nevada: U.S. Geological Survey Geophysical Investigations Map GP-514, scale 1:62,500.
___ 1965b, Aeromagnetic map of the Black Mountain quadrangle, Nye County, Nevada: U.S. Geological Survey Geophysical Investigations Map GP-519, scale 1:62,500.
___ 1965c, Aeromagnetic map of the Cactus Spring quadrangle and part of the Goldfield quadrangle, Esmeralda and Nye Counties, Nevada: U.S. Geological Survey Geophysical Investigations Map GP-511, scale 1:62,500.
___ 1965d, Aeromagnetic map of parts of the Cactus Peak and Stinking Spring quadrangles, Nye County, Nevada: U.S. Geological Survey Geophysical Investigations Map GP-517, scale 1:62,500.
___ 1965e, Aeromagnetic map of parts of the Kawich Peak and Reveille Peak quadrangles, Nye County, Nevada: U.S. Geological Survey Geophysical Investigations Map GP-516, scale 1:62,500.
___ 1965f, Aeromagnetic map of the Mellan quadrangle, Nye County, Nevada: U.S. Geological Survey Geophysical Investigations Map GP-518, scale 1:62,500.
___ 1965g, Aeromagnetic map of the Quartzite Mountain quadrangle, Nye County, Nevada: U.S. Geological Survey Geophysical Investigations Map GP-515, scale 1:62,500.
___ 1965h, Aeromagnetic map of the Sarcobatus Flat area, Esmeralda and Nye Counties, Nevada: U.S. Geological Survey Geophysical Investigations Map GP-512, scale 1:125,000.
___ 1965i, Aeromagnetic map of the Silent Canyon quadrangle, Nye County, Nevada: U.S. Geological Survey Geophysical Investigations Map GP-520, scale 1:62,500.
___ 1965j, Aeromagnetic map of the Wheelbarrow Peak quadrangle and part of the Groom Mine quadrangle, Nye and Lincoln Counties, Nevada: U.S. Geological Survey Geophysical Investigations Map GP-513, scale 1:62,500.
Robertson, E. S., 1970 Relations between geological structure and aeromagnetic anomalies in central Nevada: Geological Society of America Bulletin, v. 81, no. 7, p. 2045-2060.
U.S. Geological Survey, 1964, Stratigraphy and structure of the Antler Peak quadrangle, Humboldt and Lander Counties, Nevada: U.S. Geological Survey Professional Paper 459-A, 7 pis., 93 p.
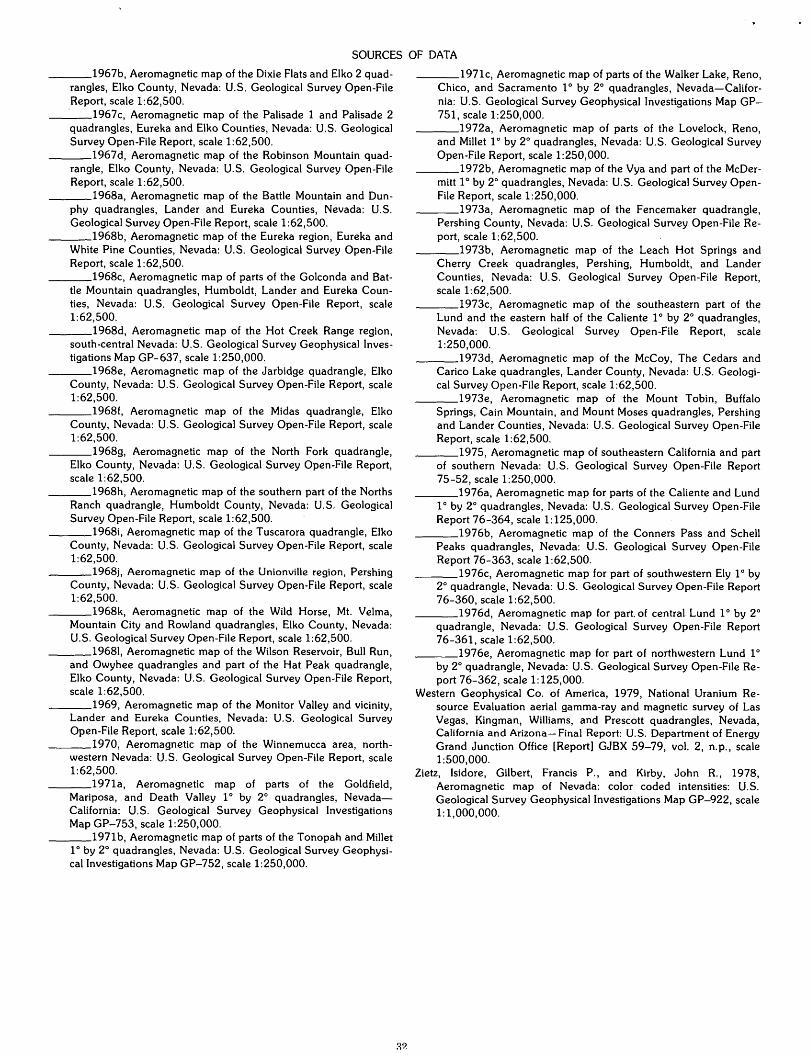
SOURCES OF DATA
___ 1967b, Aeromagnetic map of the Dixie Flats and Elko 2 quadrangles, Elko County, Nevada: U.S. Geological Survey Open-File Report, scale 1:62,500. · 196 7 c, Aeromagnetic map of the Palisade 1 and Palisade 2 quadrangles, Eureka and Elko Counties, Nevada: U.S. Geological Survey Open-File Report, scale 1:62,500.
___ 1967d, Aeromagnetic map of the Robinson Mountain quadrangle, Elko County, Nevada: U.S. Geological Survey Open-File Report, scale 1:62,500.
___ 1968a, Aeromagnetic map of the Battle Mountain and Dunphy quadrangles, Lander and Eureka Counties, Nevada: U.S. Geological Survey Open-File Report, scale 1:62,500.
___ 1968b, Aeromagnetic map of the Eureka region, Eureka and White Pine Counties, Nevada: U.S. Geological Survey Open-File Report, scale 1:62,500.
___ 1968c, Aeromagnetic map of parts of the Golconda and Battle Mountain quadrangles, Humboldt, Lander and Eureka Counties, Nevada: U.S. Geological Survey Open-File Report, scale 1:62,500.
___ 1968d, Aeromagnetic map of the Hot Creek Range region, south-central Nevada: U.S. Geological Survey Geophysical Investigations Map GP-637, scale 1:250,000.
___ 1968e, Aeromagnetic map of the Jarbidge quadrangle, Elko County, Nevada: U.S. Geological Survey Open-File Report, scale 1:62,500.
___ 1968f, Aeromagnetic map of the Midas quadrangle, Elko County, Nevada: U.S. Geological Survey Open-File Report, scale 1:62,500.
___ 1968g, Aeromagnetic map of the North Fork quadrangle, Elko County, Nevada: U.S. Geological Survey Open-File Report, scale 1:62,500.
___ 1968h, Aeromagnetic map of the southern part of the Norths Ranch quadrangle, Humboldt County, Nevada: U.S. Geological Survey Open-File Report, scale 1:62,500.
___ 1968i, Aeromagnetic map of the Tuscarora quadrangle, Elko County, Nevada: U.S. Geological Survey Open-File Report, scale 1:62,500.
___ 1968j, Aeromagnetic map of the Unionville region, Pershing County, Nevada: U.S. Geological Survey Open-File Report, scale 1:62,500.
___ 1968k, Aeromagnetic map of the Wild Horse, Mt. Velma, Mountain City and Rowland quadrangles, Elko County, Nevada: U.S. Geological Survey Open-File Report, scale 1:62,500.
___ 19681, Aeromagnetic map of the Wilson Reservoir, Bull Run, and Owyhee quadrangles and part of the Hat Peak quadrangle, Elko County, Nevada: U.S. Geological Survey Open-File Report, scale 1:62,500.
___ 1969, Aeromagnetic map of the Monitor Valley and vicinity, Lander and Eureka Counties, Nevada: U.S. Geological Survey Open-File Report, scale 1:62,500.
___ 1970, Aeromagnetic map of the Winnemucca area, northwestern Nevada: U.S. Geological Survey Open-File Report, scale 1:62,500.
___ 1971a, Aeromagnetic map of parts of the Goldfield, Mariposa, and Death Valley 1 o by 2° quadrangles, NevadaCalifornia: U.S. Geological Survey Geophysical Investigations Map GP-753, scale 1:250,000.
___ 1971b, Aeromagnetic map of parts of the Tonopah and Millet 1 o by 2° quadrangles, Nevada: U.S. Geological Survey Geophysical Investigations Map GP-752, scale 1:250,000.
___ 1971c, Aeromagnetic map of parts of the Walker Lake, Reno, Chico, and Sacramento 1 o by 2° quadrangles, Nevada-California: U.S. Geological Survey Geophysical Investigations Map GP-751, scale 1:250,000.
___ 1972a, Aeromagnetic map of parts of the Lovelock, Reno, and Millet 1 o by 2° quadrangles, Nevada: U.S. Geological Survey Open-File Report, scale 1:250,000.
___ 1972b, Aeromagnetic map of the Vya and part of the McDermitt 1 o by 2° quadrangles, Nevada: U.S. Geological Survey OpenFile Report, scale 1:250,000.
___ 1973a, Aeromagnetic map of the Fencemaker quadrangle, Pershing County, Nevada: U.S. Geological Survey Open-File Report, scale 1:62,500.
___ 1973b, Aeromagnetic map of the Leach Hot Springs and Cherry Creek quadrangles, Pershing, Humboldt, and Lander Counties, Nevada: U.S. Geological Survey Open-File Report, scale 1:62,500.
___ 1973c, Aeromagnetic map of the southeastern part of the Lund and the eastern half of the Caliente 1 o by 2° quadrangles, Nevada: U.S. Geological Survey Open-File Report, scale 1:250,000.
___ 1973d, Aeromagnetic map of the McCoy, The Cedars and Carico Lake quadrangles, Lander County, Nevada: U.S. Geological Survey Open-File Report, scale 1:62,500.
___ 1973e, Aeromagnetic map of the Mount Tobin, Buffalo Springs, Cain Mountain, and Mount Moses quadrangles, Pershing and Lander Counties, Nevada: U.S. Geological Survey Open-File Report, scale 1:62,500.
___ 1975, Aeromagnetic map of southeastern California and part of southern Nevada: U.S. Geological Survey Open-File Report 75-52, scale 1:250,000.
___ 1976a, Aeromagnetic map for parts of the Caliente and Lund 1 o by 2o quadrangles, Nevada: U.S. Geological Survey Open-File Report 76-364, scale 1:125,000.
___ 1976b, Aeromagnetic map of the Conners Pass and Schell Peaks quadrangles, Nevada: U.S. Geological Survey Open-File Report 76-363, scale 1:62,500.
___ 1976c, Aeromagnetic map for part of southwestern Ely 1 o by 2° quadrangle, Nevada: U.S. Geological Survey Open-File Report 76-360, scale 1:62,500.
___ 1976d, Aeromagnetic map for part. of central Lund 1 o by 2o quadrangle, Nevada: U.S. Geological Survey Open-File Report 76-361, scale 1:62,500.
___ 1976e, Aeromagnetic map for part of northwestern Lund 1 o by 2o quadrangle, Nevada: U.S. Geological Survey Open-File Report 76-362, scale 1:125,000.
Western Geophysical Co. of America, 1979, National Uranium Resource Evaluation aerial gamma-ray and magnetic survey of Las Vegas, Kingman, Williams, and Prescott quadrangles, Nevada, California and Arizona-Final Report: U.S. Department of Energy Grand Junction Office [Report] GJBX 59-79, vol. 2, n.p., scale 1:500,000.
Zietz, Isidore, Gilbert, Francis P., and Kirby, John R., 1978, Aeromagnetic map of Nevada: color coded intensities: U.S. Geological Survey Geophysical Investigations Map GP-922, scale 1:1,000,000.

A
B c D E
F
G
H
I
J
K
L M N 0 p
Q R s T u v
NEW MEXICO 106° 10JD _____ , 106" 105~ ___ _!04° ____ 4''
A B E F )
I D 36"·~--------r-------~--------~------~--------~------~
I I
I I I
G H
L 0 p
I J
s v w X y
T AA
LL MM
I NN 00 I
I
____ l
0 50 1 00 MILES \h·~··~·h'•r'•~·~·~·1~·~~·,~' 0 50 100 150 KILOMETERS
SPECIFICATIONS
East-West, 400 feet above ground, 3 mile (EG&G GeoMetries, w East-West, 1000 feet above ground 1 mile (Dempsey and 1979) Hill, 1950d)
North-South, 1000 feet above ground, 1 mile (USGS, 1980) X East-West, 1000 feet above ground, 1 mile (Dempsey and East-West, 11,000 feet barometric, 1 mile (USGS, 1976a) Hill, 1950a) East-West, 11,000 feet barometric, 1 mile (USGS, 1972a) y East-West, 1000 feet above ground, 1 mile (Dempsey and East-West, 400 feet above ground, 6 mile (EG&G GeoMetries, Hill, 1950b)
1980) z Specifications unknown (unpublished data) East-West, 400 feet above ground, 3 mile (Texas AA East-West, 400 feet above ground, 3 mile (Geodata
Instruments, Inc., 1980) International, Inc., 1976b) East-West, 400 feet above ground, 3 mile (EG&G GeoMetries, BB East-West, 400 feet above ground, 3 mile (Texas
1979) Instruments, Inc., 1979b) East-West, 400 feet above ground, 3 mile (EG&G GeoMetries, cc East-West, 400 feet above ground, 6 mile (Geo-Life, 1979b)
1979) DD East-West, 10,500 feet barometric, 1 mile (USGS, 1972b) East-West, 400 feet above ground, 3 mile (EG&G GeoMetries, EE East-West, 400 feet above ground, 3 mile (Geo-Life, 1979b)
1980) FF Northwest-Southeast, 1737 meter barometric, 2 kilometer East-West, 400 feet above ground, 3 mile (Geodata (Bath, 1977)
International, Inc., 1976c) GG East-West, 1500 feet mean terrain clearance, 0.6 mile East-West, 400 feet above ground, 3 mile (Texas (USGS, 1979b)
Instruments, Inc., 1979a) HH East-West, 400 feet above ground, 3 mile (Texas East-West, 8500 feet terrain clearance, 1 mile (USGS, 1979a) Instruments, Inc., 1979d) East-West, 9500 feet terrain clearance, 1 mile (USGS, 1979a) II East-West, 400 feet above ground, 3 mile (Texas East-West, 400 feet above ground, 3 mile (Geo-Life, 1979a) Instruments, Inc., 1979c) East-West, 8000 feet barometric, 1 mile (USGS, 1975a) JJ East-West, 10,000 feet above sea level, 1 mile (USGS, 1974a) East-West, 10,000 feet barometric, 1 mile (USGS, 1975b) KK Specifications unknown (unpublished data) East-West, 10,000 feet above sea level, 1 mile (USGS, 1974b) LL Vertical-intensity ground survey, 1 mile (unpublished data) East-West, 8000 feet barometric, 1 mile (USGS, 1975c) MM East-West, 400 feet above ground, 3 mile (Geodata East-West, 7500 feet barometric, 1 mile (USGS, 1976b) International, Inc., 1976a) East-West, 7000 feet barometric, 1 mile (USGS, 1976b) NN East-West, 500 feet above ground, 1 mile (USGS, 1973) East-West, 8500 feet barometric, 1 mile (USGS, 1976b) 00 East-West, 400 feet above ground, 3 mile (Geodata East-West, 1000 feet above ground, 1 mile (Dempsey and International, Inc., 1980)
Hill, 1950c)
33

SOURCES OF DATA
Bath, G. D., 1977, Aeromagnetic maps with geologic interpretations for the Tularosa Valley, south-central New Mexico: U.S. Geological Survey Open-File Report 77-258, 16 p., 12 pis., 9 figs., scale 1:62,500.
Dempsey, W. J., and Hill, M. E., 1950a, Total-intensity aeromagnetic map of parts of Guadalupe and De Baca Counties, New Mexico (R. 16 E.R. 21 E. and T. 3 N.-T. 6 N.): U.S. Geological Survey Geophysical Investigations Map GP-16, scale 1:63,360.
___ 1950b, Total-intensity aeromagnetic map of parts of ·Guadalupe and De Baca Counties, New Mexico (R. 21 E.-R. 26 E. and T. 3 N.-T. 6 N.): U.S. Geological Survey Geophysical Investigations Map GP-15, scale 1:63,360.
___ 1950c, Total-intensity aeromagnetic map of parts of San Miguel and Guadalupe Counties, New Mexico (R. 16 E.- R. 21 E. and T. 6 N.-T. 10 N., and part of Anton Chico Grant): U.S. Geological Survey Geophysical Investigations Map GP-18, scale 1:63,360.
___ 1950d, Total-intensity aeromagnetic map of parts of San Miguel and Guadalupe Counties, New Mexico (R. 21 E.-R. 25 E. and T. 6 N.-T. 12 N. ): U.S. Geological Survey Geophysical Investigations Map GP-17, scale 1:63,360.
EG&G GeoMetries, Inc., 1979, National Uranium Resource Evaluation aerial gamma-ray and magnetic survey, Raton Basin Project, Shiprock and Gallup quadrangles, Arizona/New Mexico and Albuquerque quadrangle, New Mexico-Final Report: U.S. Department of Energy Grand Junction Office [Report] GJBX 116-79, v. 2, n.p., scale 1:500,000.
___ 1980, National Uranium Resource Evaluation aerial gammaray and magnetic survey, Raton Basin Project, The Raton and Santa Fe quadrangles of New Mexico-Final Report: U.S. Department of Energy Grand Junction Office [Report] GJBX 9-80, v. 2, n.p., scale 1:500,000.
Geo-Life (A joint venture between High-Life Helicopters, Inc. and Geodata International Inc.), 1979a, National Uranium Resource Evaluation aerial radiometric and magnetic survey, Socorro National Topographic Map, New Mexico-Final Report: U.S. Department of Energy Grand Junction Office [Report] GJBX 163-79, v. 2, n.p., scale 1:500,000.
___ 1979b, National Uranium Resource Evaluation aerial radiometric and magnetic survey, Tularosa National Topographic Map, New Mexico-Final Report: U.S. Department of Energy Grand Junction Office [Report] GJBX 67-79, v. 2, n.p., scale 1:500,000.
Geodata International, Inc., 1976a, National Uranium Resource Evaluation aerial radiometric and magnetic survey, Brownfield National T opographic Map, Texas and New Mexico-Final Report: U.S. Department of Energy Grand Junction Office [Report] GJBX 33-76, v. 2, n.p., scale 1:500,000.
___ 1976b, National Uranium Resource Evaluation aerial radiometric and magnetic survey, Clovis National Topographic Map, Texas and New Mexico-Final Report: U.S. Department of Energy Grand Junction Office [Report] GJBX 33-76, v. 2, n.p., scale 1:500,000.
___ 1976c, National Uranium Resource Evaluation aerial radiometric and magnetic survey, Tucumcari National Topographic Map, Texas and New Mexico-Final Report: U.S. Department of Energy Grand Junction Office [Report] GJBX 33-76, v. 2, n.p., scale 1:500,000.
___ 1980, National Uranium Resource Evaluation aerial radiometric and magnetic survey, Hobbs National Topographic Map, Texas and New Mexico-Final Report: U.S. Department of Energy Grand Junction Office [Report] GJBX 228-80, v. 2, n.p., scale 1:500,000.
Texas Instruments, Inc., 1979a, National Uranium Resource Evaluation aerial radiometric and magnetic reconnaissance survey of portions of Arizona, Idaho, Montana, New Mexico, South Dakota, and Washington, St. Johns quadrangle-Final Report:U.S. Department of Energy Grand Junction Office [Report] GJBX 126-79, v. 2L, n.p., scale 1:500,000.
34
___ 1979b, National Uranium Resource Evaluation aerial radiometric and magnetic reconnaissance survey of portions of Arizona-New Mexico, Clifton quadrangle-Final Report: U.S. Department of Energy Grand Junction Office [Report] GJBX 23-79, vol. 2B, n.p., scale 1:500,000.
___ 1979c, National Uranium Resource Evaluation aerial radiometric and magnetic reconnaissance survey of portions of Arizona-New Mexico, Douglas quadrangle-Final Report: U.S. Department of Energy Grand Junction Office [Report] GJBX 23-79, vol. 2F, n.p., scale 1:500,000.
___ 1979d, National Uranium Resource Evaluation aerial radiometric and magnetic reconnaissance survey of portions of Arizona-New Mexico, Silver City quadrangle-Final Report: U.S. Department of Energy Grand Junction Office [Report] GJBX 23-79, vol. 2D, n.p., scale 1:500,000.
___ 1980, National Uranium Resource Evaluation aerial radiometric and magnetic reconnaissance survey of portions of New Mexico, Oklahoma, and Texas-Dalhart quadrangle-Final Report: U.S. Department of Energy Grand Junction Office [Report] GJBX 46-80, vol. 2, n.p., scale 1:500,000.
U.S. Geological Survey, 1972a, Aeromagnetic map of the Jemez area, New Mexico: U.S. Geological Survey Open-File Report, scale 1:250,000.
___ 1972b, Aeromagnetic map of the Morenci-Monticello area, southeastern Arizona and southwestern New Mexico: U.S. Geological Survey Geophysical Investigations Map GP-838, scale 1:250,000.
___ 1973, Aeromagnetic map of the Carlsbad area, New Mexico and Texas: U.S. Geological Survey Geophysical Investigations Map GP-861, scale 1:250,000.
___ 1974a, Aeromagnetic map of parts of the Silver City and Las Cruces 1 o by 2° quadrangles, southwestern New Mexico: U.S. Geological Survey Open-File Report, scale 1:250,000.
___ 1974b, Aeromagnetic map of parts of the Socorro and Tularosa 1 o by 2° quadrangles, southwestern New Mexico: U.S. Geological Survey Open-File Report, scale 1:250,000.
___ 1975a, Aeromagnetic map of Albuquerque and vicinity, New Mexico: U.S. Geological Survey Open-File Report 75-186, scale 1:125,000.
___ 1975b, Aeromagnetic map of an area east of Albuquerque, New Mexico: U.S. Geological Survey Open-File Report 75-183, scale 1:125,000.
___ 1975c, Aeromagnetic map of an area north and east of Socorro, New Mexico: U.S. Geological Survey Open-File Report 75-185, scale 1:125,000.
___ 1976a, Aeromagnetic map of an area north of Abiquiu, New Mexico: U.S. Geological Survey Open-File Report 76-503, scale 1:62,500.
___ 1976b, Residual magnetic intensity map of central New Mexico: U.S. Geological Survey Open-File Report 76-806, scale 1:250,000.
___ 1979a, Aeromagnetic map of the Malpais area, New Mexico: U.S. Geological Survey Open-File Report 79-1644, scale 1:250,000.
___ 1979b, Aeromagnetic map of the north and west parts of the Silver City 1 o by 2° quadrangle, New Mexico and Arizona: U.S. Geological Survey Open-File Report 79-1452, 5 sheets, scale 1:62,500.
___ 1980, Aeromagnetic map of northeast Arizona and northwest New Mexico: U.S. Geological Survey Open-File Report 80-614, 4 sheets, scale 1:250,000.

I
I
/ / ,.
4ZO-L- __
79° __ _ 78°
u
0 I,·,,· I 11
0 50
NEW YORK
750 740
X y
v
50 100 MILES I 'I I
I I I
100 150 KILOMETERS
SPECIFICATIONS
A East-West, 1700 feet barometric, 1 mile (USGS, 1979b) B East-West, 1700 feet barometric, 1/2 mile (USGS, 1979b) C East-West, 500 feet above ground,% mile (USGS, 1975a) D North-South, 1000 feet above ground,% mile (Zietz and
others, 1972) E East-West, 1000 feet above ground,% mile (Zietz and
others, 1972) F East-West, 1000 feet above ground,% mile (Zietz and
others, 1972) G North-South, 1000 feet above ground,% mile (Balsley and
others, 1954b) H North-South, 1000 feet above ground, %mile (Balsley and
others, 1954a) I East-West, 1000 feet above ground, %mile (Balsley and
others, 1959a) J East-West, 1000 feet above ground,% mile (Balsley and
others, 1959b) K North-South, 1000 feet above ground,% mile (Balsley and
others, 1965a) L North-South, 1000 feet above ground, 1/2 mile (Balsley and
others, 1965f) M East-West, 1000 feet above ground, 1/2 mile (Balsley and
others, 1965b) N East-West, 1000 feet above ground, 1/2 mile (Balsley and
others, 1965d) 0 East-West, 1000 feet above ground,% mile (Balsley and
others, 1965c)
35
P East-West, 1000 feet above ground,% mile (Balsley and others, 1965e)
Q East-West, 1000 feet above ground, 1 mile (USGS, 1978) R North-South, 1000 feet above ground, 1 mile (USGS, 1978) S East-West, 1000 feet above ground, 1/2 mile (Zietz and
others, 1972) T North-South, 1000 feet above ground, 1/2 mile (Zietz and
others, 1972) U East-West, 1000 feet above ground, 2 mile (USGS, 1975b V East-West, 3000 feet barometric, 2 mile (USGS, 1979a) W East-West, 1000 feet above ground, 1 mile (USGS, 1977) X North-South, 500 feet above ground, 1 mile (unpublished
data) Y North-South, 500 feet above ground, 1 mile (Zietz and
others, 1972) Z East-West, 500 feet above ground, 1 mile (Zietz and
others, 1972) AA East-West, 3000 feet barometric, 2 mile (USGS, 1979c) BB East-West, 500 feet above ground, 1/2 mile (Zietz and
others, 1972) CC North-South, 500 feet above ground, 1/2 mile (Henderson
and others, 1966) DD Northwest-Southeast, 500 to 2500 feet barometric, 5 mile
(Zietz and others, 1972) EE Specifications unknown (unpublished data)

SOURCES OF DATA
Balsley, J. R., and Bromery, R. W., 1965a, Aeromagnetic map of the Big Moose quadrangle, Herkimer and Hamilton Counties, New York: U.S. Geological Survey Geophysical Investigations Map GP-504, scale 1:62,500.
___ 1965b, Aeromagnetic map of part of the Lowville quadrangle, Lewis County, New York: U.S. Geological Survey GeophysicallnvestigationsMapGP-508, scale 1:62,500.
___ 1965c, Aeromagnetic map of the McKeever quadrangle and part of the Port Leyden quadrangle, north-central New York: U.S. Geological Survey Geophysical Investigations Map GP-510, scale 1:62,500.
___ 1965d, Aeromagnetic map of the Number Four quadrangle, Herkimer and Lewis Counties, New York: U.S. Geological Survey Geophysical Investigations Map GP-502, scale 1:62,500.
___ 1965e, Aeromagnetic map of the Old Forge and part of the West Canada Lakes quadrangle, Herkimer and Hamilton Counties, New York: U.S. Geological Survey Geophysical Investigations Map GP-501, scale 1:62,500.
___ 1965f, Aeromagnetic map of the Raquette Lake quadrangle, Hamilton County, New York: U.S. Geological Survey Geophysical Investigations Map GP-503, scale 1:62,500.
Balsley, J. R., Buddington, A. F., and others, 1959a, Aeromagnetic and geologic map of the Oswegatchie quadrangle, St. Lawrence, Herkimer, and Lewis Counties, New York: U.S. Geological Survey Geophysical Investigations Map GP-192, scale 1:62,500.
___ 1959b, Aeromagnetic and geologic map of the Tupper Lake quadrangle, St. Lawrence, Hamilton and Franklin Counties, New York: U.S. Geological Survey Geophysical Investigations Map GP-193, scale 1:62,500.
Balsley, J. R., Hill, M. E., and others, 1954a, Aeromagnetic survey and geologic map of Cranberry Lake quadrangle, New York: U.S. Geological Survey Geophysical Investigations Map GP-118, scale 1:62,500.
36
___ 1954b, Total aeromagnetic intensity and geologic map of Stark, Childwold and part of Russell quadrangles, New York: U.S. Geological Survey Geophysical Investigations Map GP-117, scale 1:62,500.
Henderson, J. R., Andreasen, G. E., and Petty, A. J., 1966, Aeromagnetic map of northern New Jersey and adjacent parts of New York and Pennsylvania: U.S. Geological Survey Geophysical Investigations Map GP-562, scale 1:125,000.
U.S. Geological Survey, 1975a, Aeromagnetic survey of Odensburg and vicinity, New York: U.S. Geological Survey Open-File Report 75-526, 16 plates, scale 1:62,500.
___ 1975b, Aeromagnetic map of westernmost New York: U.S. Geological Survey Open -File Report 7 5-28, scale 1:250,000.
-----,- 1977, Aeromagnetic map of parts of the Rochester and Utica 1 o by 2o quadrangles, New York: U.S. Geological Survey Open-File Report 77-553, scale 1:250,000.
___ 1978, Aeromagnetic map of the eastern part of the Adirondack Mountains, New York: U.S. Geological Survey Open-File Report 78-279, scale 1:250,000.
___ 1979a, Aeromagnetic map of central New York: U.S. Geological Survey Open-File Report 79-653, scale 1:250,000.
___ 1979b, Aeromagnetic map of northern New York: U.S. Geological Survey Open -File Report 79-655, scale 1:250,000.
___ 1979c, Aeromagnetic map of southeastern New York: U.S. Geological Survey Open -File Report 79-654, scale 1:250,000.
Zietz, Isidore, Gilbert, F. P., and Kirby, J. R., 1972, Northeastern United States regional aeromagnetic maps: U.S. Geological Survey OpenFile Reports, 13 sheets, scale 1:250,000. (Aeromagnetic map of New York: U.S. Geological Survey Geophysical Investigations Map GP-938.)
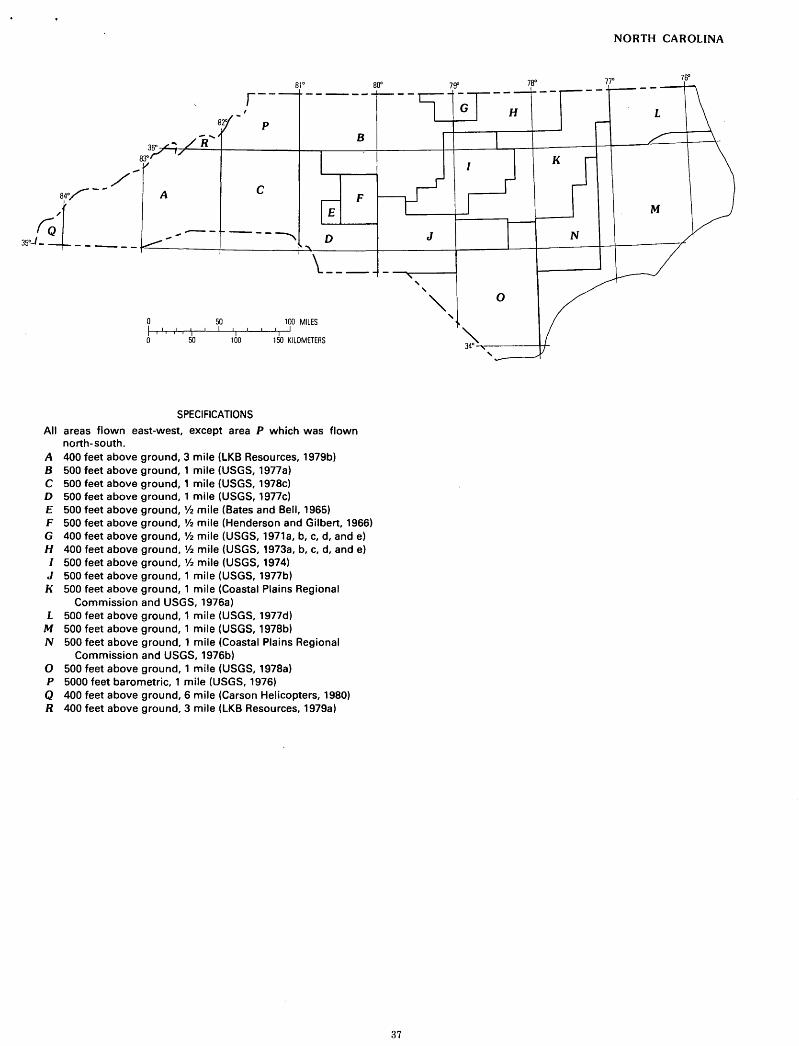
NORTH CAROLINA
7~
82'l p
n' B
/-c 840/-- A F
3~10'[ -----~~----jL -_ -_-_-_--...~~_:: __ ---l------f--__L-+----t-t---/ \_ __ _
0 I 111 11
I 11
50 I 'I I
100 MILES 'I I
0 50 100 150 KILOMETERS
SPECIFICATIONS
All areas flown east-west, except area P which was flown north-south.
A 400 feet above ground, 3 mile (LKB Resources, 1979b) B 500 feet above ground, 1 mile (USGS, 1977a) C 500 feet above ground, 1 mile (USGS, 1978c) D 500 feet above ground, 1 mile (USGS, 1977c) E 500 feet above ground,% mile (Bates and Bell, 1965) F 500 feet above ground,% mile (Henderson and Gilbert, 1966) G 400 feet above ground,% mile (USGS, 1971a, b, c, d, and e) H 400 feet above ground,% mile (USGS, 1973a, b, c, d, and e) I 500 feet above ground,% mile (USGS, 1974) J 500 feet above ground, 1 mile (USGS, 1977b) K 500 feet above ground, 1 mile (Coastal Plains Regional
Commission and USGS, 1976a) L 500 feet above ground, 1 mile (USGS, 1977d)
M 500 feet above ground, 1 mile (USGS, 1978b) N 500 feet above ground, 1 mile (Coastal Plains Regional
Commission and USGS, 1976b) 0 500 feet above ground, 1 mile (USGS, 1978a) P 5000 feet barometric, 1 mile (USGS, 1976) Q 400 feet above ground, 6 mile (Carson Helicopters, 1980) R 400 feet above ground, 3 mile (LKB Resources, 1979a)
37
' '
" 0
'

SOURCES OF DATA
Bates, R. G., and Bell, Henry, III, 1965, Geophysical investigations in the Concord quadrangle, Cabarrus and Mecklenburg Counties, North Carolina: U.S. Geological Survey Geophysical Investigations Map GP-522, scale 1:48,000.
Carson Helicopters, Incorporated, 1980, National Uranium Resource Evaluation aerial gamma-ray and magnetic reconnaissance survey of portions of Alabama, Georgia, Kentucky, Maryland, North Carolina, Ohio, Pennsylvania, Virginia, and West Virginia [Chattanooga quadrangle]Final Report: U.S. Department of Energy Grand Junction Office [Report] GJBX92-80, v. 2, n.p., scale 1:500,000.
Coastal Plains Regional Commission and U.S. Geological Survey, 1976a, Aeromagnetic maps of parts of Georgia, South Carolina, and North Carolina: U.S. Geological Survey Open-File Report 76-181, 13 pis., scale 1:250,000.
___ 1976b, Aeromagnetic map of parts of the Rocky Mount and Beaufort 1 o by 2° quadrangles, North Carolina: U.S. Geological Survey Open-File Report76-815, scale 1:250,000.
Henderson, J. R., and Gilbert, F. P., 1966, Aeromagnetic map of the Mount Pleasant, Albemarle, Denton, and Salisbury quadrangles, west-central North Carolina: U.S. Geological Survey Geophysical InvestigationsMapGP-581, scale 1:62,500.
LKB Resources, Inc., 1979a, National Uranium Resource Evaluation aerial gamma-ray and magnetic reconnaissance survey, Blue Ridge area, Johnson City and Winston-Salem quadrangles-Final Report: U.S. Department of Energy Grand Junction Office [Report] GJBX 16-79, v. 2, n.p., scale 1:500,000.
LKB Resources, Inc., 1979b, National Uranium Resource Evaluation aerial gamma-ray and magnetic reconnaissance survey, Blue Ridge area, Knoxville and Charlotte quadrangles-Final Report: U.S. Department of Energy Grand Junction Office [Report] GJBX 57-79, v. 2, n.p., scale 1:500,000.
U.S. Geological Survey, 1971a, Aeromagnetic map ofthe Danville quadrangle, Pittsylvania County, Virginia, and Caswell County, North Carolina: U.S. Geological Survey Geophysical Investigations Map GP-745, scale 1:62,500.
___ 197lb, Aeromagnetic map of the Milton quadrangle, Halifax and Pittsylvania Counties, Virginia, and Caswell and Person Counties, North Carolina: U.S. Geological Survey Geophysical Investigations Map GP-746, scale 1:62,500.
___ 1971c, Aeromagnetic map of the South Boston quadrangle, Halifax County, Virginia, and Person and Granville Counties, North Carolina: U.S. Geological Survey Geophysical Investigations Map GP-747, scale 1:62,500.
___ 1971d, Aeromagnetic map of the Winstead quadrangle, Person and Caswell Counties, North Carolina: U.S. Geological Survey Geophysical Investigations Map GP-7 48, scale 1:62,500.
38
___ 1971e, Aeromagnetic map of the Roxboro quadrangle, Person and Granville Counties, North Carolina: U.S. Geological Survey Geophysical InvestigationsMapGP-749, scale 1:62,500.
___ 1973a, Aeromagnetic map of the Oxford quadrangle and part of the Clarksville quadrangle, north-central North Carolina: U.S. Geological Survey Geophysical Investigations Map GP-882, scale 1:62,500.
___ 1973b, Aeromagnetic map of the northern parts of the Durham North and Creedmore quadrangles, north-central North Carolina: U.S. Geological Survey Geophysical Investigations Map GP-883, scale 1:62,500.
___ 1973c, Aeromagnetic map of the Henderson quadrangle and parts of the Louisburg and Boydton quadrangles, north-central North Carolina: U.S. Geological Survey Geophysical Investigations MapGP-884, scale 1:62,500.
___ 1973d, Aeromagnetic map of the Norlina quadrangle and parts of the Castalia and South Hill quadrangles, north-central North Carolina: U.S. Geological Survey Geophysical Investigations Map GP-885, scale 1:62,500.
___ 1973e, Aeromagnetic map of the Essex-Roanoke Rapids area, northeastern North Carolina: U.S. Geological Survey Geophysical InvestigationsMapGP-886, scale 1:62,500.
___ 197 4, Aeromagnetic map of parts of the Greensboro and Raleigh 1 o by 2° quadrangles, North Carolina: U.S. Geological Survey Open-File Report 7 4-29, scale 1:250,000.
___ 1976, Aeromagnetic map of part of the Winston-Salem 1 o by 2° quadrangle, North Carolina, Virginia, and Tennessee: U.S. Geological Survey Open-File Report 76-534, scale 1:125,000.
___ 1977a, Aeromagnetic map of north-central North Carolina: U.S. Geological Survey Open-File Report77-192, scale 1:250,000.
___ 1977b, Aeromagnetic map of south-central North Carolina: U.S. Geological Survey Open-File Report 77-205, scale 1:250,000.
___ 1977c, Aeromagnetic map of Charlotte and vicinity, North Carolina: U.S. Geological Survey Open-File Report 77-723, scale 1:250,000.
___ 1977d, Aeromagnetic map of the northern North Carolina coast: U.S. Geological Survey Open-File Report 77-804, scale 1:250,000.
___ 1978a, Aeromagnetic map of Elizabethtown and vicinity, North Carolina: U.S. Geological Survey Open-File Report 78-758, scale 1:250,000.
___ 1978b, Aeromagnetic map of southeastern North Carolina: U.S. GeologicaiSurveyOpen-FileReport78-764, scale 1:250,000.
___ 1978c, Aeromagnetic map of west Charlotte, North Carolina: U.S. Geological Survey Open-File Report 78-1088, scale 1:250,000.

103°
SPECIFICATIONS
A East-West, 4000 feet barometric, 3 mile (USGS, 1981b) B East-West, 15,000 feet barometric, 5 mile (Zietz and
others, 1971)
102"
0 I I I,· I ~ 0 50
C East-West, 400 feet above ground, 3 mile (Geodata, 1979b) D East-West, 400 feet above ground, 3 mile (Geodata, 1979a) E East-West, 3500 feet barometric, 3 mile (USGS, 1981a) F East-West, 3000 feet above sea level, 1 mile (Aeroservice
Corporation, unpublished data) G Total intensity ground magnetics, 3 mile (unpublished
data H Total intensity ground magnetics, 2 mile (Okland, 1978)
East-West, 3500 feet barometric, 3 mile (USGS, 1981b)
101"
50 I 'j
100
100" ggo NORTH DAKOTA
---.,----
100 MILES I I I
150 KILOMETERS
SOURCES OF DATA Geodata International, Inc., 1979a, National Uranium Resource Evalua
tion aerial radiometric and magnetic survey, Lemmon National Topographic Map, South Dakota-Final Report: U.S. Department of Energy Grand Junction Office [Report] GJBX 138-79, v. 2, n.p., scale 1:500,000.
___ 1979b, National Uranium Resource Evaluation aerial radiometric and magnetic survey, Dickinson National Topographic Map, North Dakota-Final Report: U.S. Department of Energy Grand Junction Office (Report] GJBX 139-79, v. 2, n.p., scale 1:500,000.
Okland, H. D., 1978, A geomagnetic survey of Pembina, Grand Forks, and eastern Walsh counties, North Dakota: Grand. Forks, North Dakota, University of North Dakota, M.S. thesis, 51 p., (unpublished).
U.S. Geological Survey, 1981a, Aeromagnetic map of part of the Bismarck 1 o by 2° quadrangle, North Dakota: U.S. Geological Survey Open-File Report 81-433, scale 1:250,000.
___ 1981b, Aeromagnetic map. of northeastern Montana and western North Dakota: U.S. Geological Survey Open-File Report 81-434, scale 1:250,000.
Zietz, Isidore, and others, 1971, Interpretation of an aeromagnetic strip across the northwestern United States: Geological Society of America Bulletin, v. 82, no. 12, p. 3347-3371.
39
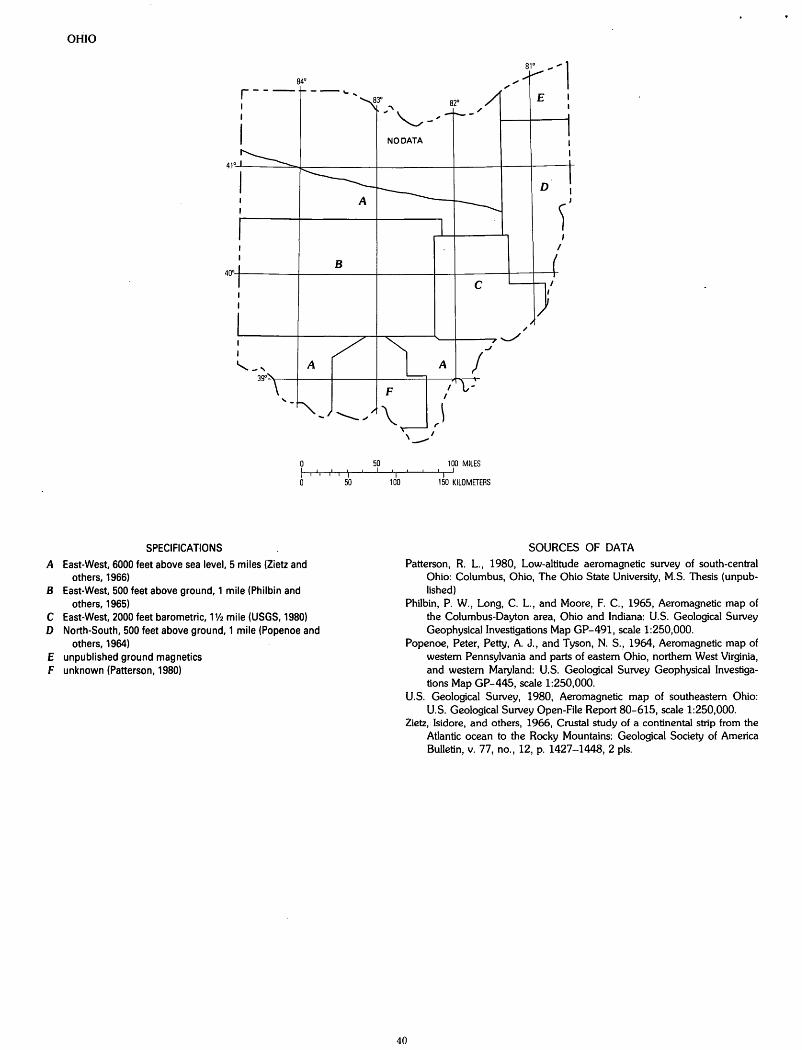
OHIO
81° ~ ~ l 84° ,.
r--- ,; -- ...... E 83° 82°
~ "\ / "----; NO DATA
D
' ) I
I
B 4tr
c
/
I .._,/
I .J ,_, I
39"
50 100 MILES ~,~·.~.·~,4;~~'--~·,~~~~~~~'
SPECIFICATIONS
A East-West, 6000 feet above sea level, 5 miles (Zietz and others, 1966)
B East-West, 500 feet above ground, 1 mile (Philbin and others, 1965)
C East-West, 2000 feet barometric, 1% mile (USGS, 1980) D North-South, 500 feet above ground, 1 mile (Popenoe and
others, 1964) E unpublished ground magnetics F unknown (Patterson, 1980)
50 100 150 KILOMETERS
SOURCES OF DATA
Patterson, R. L., 1980, Low-altitude aeromagnetic survey of south-central Ohio: Columbus, Ohio, The Ohio State University, M.S. Thesis (unpublished)
Philbin, P. W., Long, C. L., and Moore, F. C., 1965, Aeromagnetic map of the Columbus-Dayton area, Ohio and Indiana: U.S. Geological Survey Geophysical Investigations Map GP-491, scale 1:250,000.
Popenoe, Peter, Petty, A. J., and Tyson, N. S., 1964, Aeromagnetic map of western Pennsylvania and parts of eastern Ohio, northern West Virginia, and western Maryland: U.S. Geological Survey Geophysical Investigations Map GP-445, scale 1:250,000.
U.S. Geological Survey, 1980, Aeromagnetic map of southeastern Ohio: U.S. Geological Survey Open-File Report 80-615, scale 1:250,000.
Zietz, Isidore, and others, 1966, Crustal study of a continental strip from the Atlantic ocean to the Rocky Mountains: Geological Society of America Bulletin, v. 77, no., 12, p. 1427-1448, 2 pis.
40

OKLAHOMA
--- ------p-------·------ --:----·--T ggo ga• 96"
I
F I I c
\ I I l
! \ I \
I D G J \
I I I I
3SO
I I
I I ~ E
I
", --.1'\ H K I
I \
--~ -,r-_-- I J4•J ... ' '- <"~~., __,-"- ../"'"" ' I - v· , L 0 50 100 MILES
~~~~~,,,L'rl ~~~~-Li~'I-L'~~'I-Ji 0 50 100 150 KILOMETERS -v ,I .......
SPECIFICATIONS A East-West, 400 feet above ground, 3 mile (Texas
Instruments, 1980) B East-West, 400 feet above ground, 6 mile (Geodata, 1980a) C East-West, 400 feet above ground, 6 mile (Geodata, 1980b) D East-West, 400 feet above ground, 3 mile (Geodata, 1976) E East-West, 400 feet above ground, 3 mile (Geodata, 1976) F East-West, 400 feet above ground, 3 mile (Texas
Instruments, 1978)
G East-West, 400 feet above ground, 3 mile (Geodata, 1976) H East-West, 400 feet above ground, 3 mile (Texas
Instruments, 1977) I East-West, 400 feet above ground, 3 mile (Texas
Instruments, 1978) J East-West, 400 feet above ground, 6 mile (GeoMetries, 1980b) K East-West, 400 feet above ground, 6 mile (Geodata, 1979) L East-West, 400 feet above ground, 3 mile (GeoMetries, 1980a)
SOURCES OF DATA
EG&G GeoMetries, 1980a, National Uranium Resource Evaluation aerial gamma-ray and magnetic reconnaissance survey, NebraskaTexas project, Tyler, Texarkana, and Waco quadrangles of Texas, Oklahoma, Arkansas, and Louisiana-Final Report: U.S. Department of Energy Grand Junction Office [Report] GJBX 69-80, v. 2, n.p., scale 1:500,000.
___ 1980b, National Uranium Resource Evaluation aerial gamma-ray and magnetic reconnaissance survey, Fort Smith quadrangle, Oklahoma and Arkansas-Final Report: U.S. Department of Energy Grand Junction Office [Report] GJBX 200-80, v. 2, n.p., scale 1:500,000.
Geodata International, Inc., 1976, National Uranium Resource Evaluation aerial radiometric and magnetic survey [of the (D) Clinton, (E) Lawton, and (G) Oklahoma City quadrangles, Oklahoma and Texas]-Final Report: U.S. Department of Energy Grand Junction Office [Report] GJBX 34-76, v. 2, n.p., scale 1:500,000.
___ 1979, National Uranium Resource Evaluation aerial gamma-ray and magnetic reconnaissance survey, McAlester National Topographic Map, Arkansas and Oklahoma-Final Report: U.S. Department of Energy Grand Junction Office [Report] GJBX 174-79, v. 2, n.p., scale 1:500,000.
___ 1980a, National Uranium Resource Evaluation aerial gamma-ray and magnetic reconnaissance survey, Perryton quadrangle Texas and Oklahoma-Final Report: U.S. Department of Energy Grand Junction Office [Report] GJBX 229-80, v. 2, n.p., scale 1:500,000.
41
___ 1980b, National Uranium Resource Evaluation aerial gamma-ray and magnetic reconnaissance survey, Woodward quadrangle, Oklahoma-Final Report: U.S. Department of Energy Grand Junction Office [Report] GJBX 251-80, v. 2, n.p., scale 1:500,000.
Texas Instruments, Inc., 1977, National Uranium Resource Evaluation aerial gamma-ray and magnetic reconnaissance survey, Red River Area, Block C [Ardmore and Sherman quadrangles]-Final Report: U.S. Department of Energy Grand Junction Office [Report] GJBX 17-77, v. 2, n.p., scale 1:500,000.
___ 1978, National Uranium Resource Evaluation aerial gamma-ray and magnetic reconnaissance survey, Great Plains [Tulsa and Enid quadrangles]-Final Report: U.S. Department of Energy Grand Junction Office [Report] GJBX 100-78, v. 2, n.p., scale 1:500,000.
___ 1980, National Uranium Resource Evaluation aerial gamma-ray and magnetic reconnaissance survey of portions of New Mexico, Oklahoma, and Texas [Dalhart quadrangle]Final Report: U.S. Department of Energy Grand Junction Office [Report] GJBX 46-80, v. 2, n.p., scale 1:500,000.
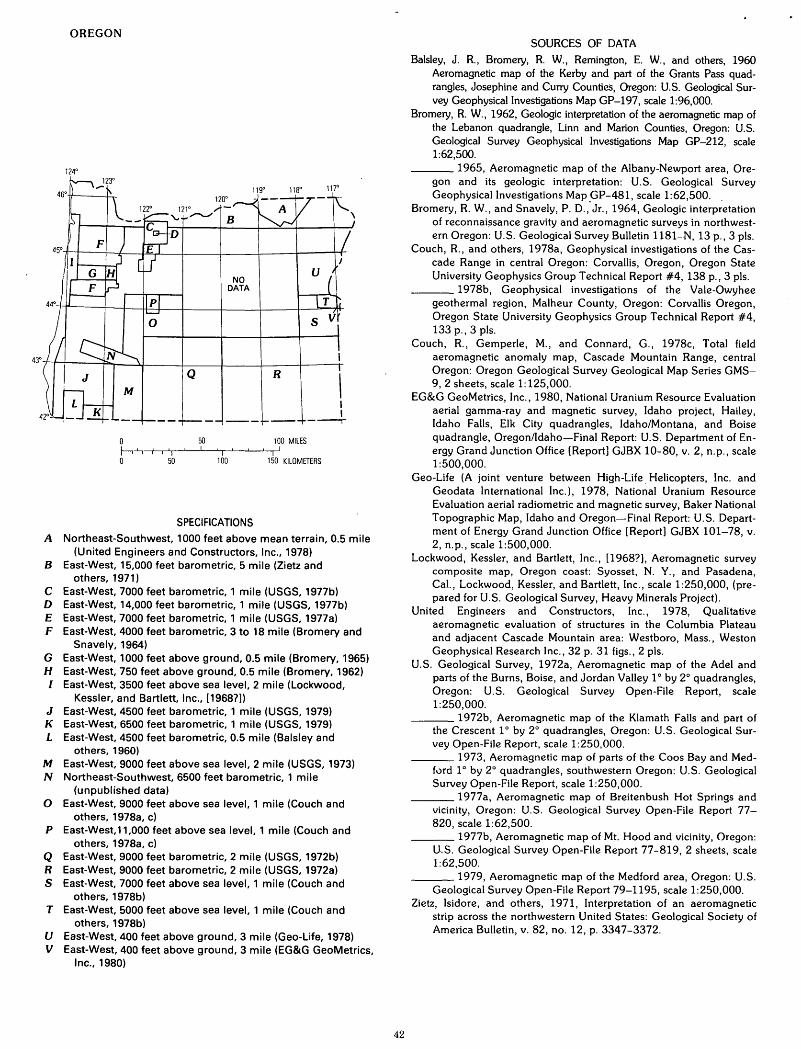
OREGON
50 100 MILES
50 100
SPECIFICATIONS
A Northeast-Southwest, 1000 feet above mean terrain, 0.5 mile (United Engineers and Constructors, Inc., 1978)
B East-West, 15,000 feet barometric, 5 mile (Zietz and others, 1971)
C East-West, 7000 feet barometric, 1 mile (USGS, 1977b) D East-West, 14,000 feet barometric, 1 mile (USGS, 1977b) E East-West, 7000 feet barometric, 1 mile (USGS, 1977a) F East-West, 4000 feet barometric, 3 to 18 mile (Bromery and
Snavely, 1964) G East-West, 1000 feet above ground, 0.5 mile (Bromery, 1965) H East-West, 750 feet above ground, 0.5 mile (Bromery, 1962) I East-West, 3500 feet above sea level, 2 mile (Lockwood,
Kessler, and Bartlett, Inc., [1968?]) J East-West, 4500 feet barometric, 1 mile (USGS, 1979) K East-West, 6500 feet barometric, 1 mile (USGS, 1979) L East-West, 4500 feet barometric, 0.5 mile (Balsley and
others, 1960) M East-West, 9000 feet above sea level, 2 mile (USGS, 1973) N Northeast-Southwest, 6500 feet barometric, 1 mile
(unpublished data) 0 East-West, 9000 feet above sea level, 1 mile (Couch and
others, 1978a, c) P East-West,11,000 feet above sea level, 1 mile (Couch and
others, 1978a, c) Q East-West, 9000 feet barometric, 2 mile (USGS, 1972b) R East-West, 9000 feet barometric, 2 mile (USGS, 1972a) S East-West, 7000 feet above sea level, 1 mile (Couch and
others, 1978b) T East-West, 5000 feet above sea level, 1 mile (Couch and
others, 1978b) U East-West, 400 feet above ground, 3 mile (Geo-Life, 1978) V East-West, 400 feet above ground, 3 mile (EG&G GeoMetries,
Inc., 1980)
42
SOURCES OF DATA
Balsley, J. R., Bromery, R. W., Remington, E. W., and others, 1960 Aeromagnetic map of the Kerby and part of the Grants Pass quadrangles, Josephine and Curry Counties, Oregon: U.S. Geological Survey Geophysical Investigations Map GP-197, scale 1:96,000.
Bromery, R. W., 1962, Geologic interpretation of the aeromagnetic map of the Lebanon quadrangle, Linn and Marion Counties, Oregon: U.S. Geological Survey Geophysical Investigations Map GP-212, scale 1:62,500.
___ 1965, Aeromagnetic map of the Albany-Newport area, Oregon and its geologic interpretation: U.S. Geological Survey Geophysical Investigations Map _GP-481, scale 1:62,500. .
Bromery, R. W., and Snavely, P. D., Jr., 1964, Geologic interpretation of reconnaissance gravity and aeromagnetic surveys in northwestern Oregon: U.S. Geological Survey Bulletin 1181-N, 13 p., 3 pis.
Couch, R., and others, 1978a, Geophysical investigations of the Cascade Range in central Oregon: Corvallis, Oregon, Oregon State University Geophysics Group Technical Report #4, 138 p., 3 pis.
___ 1978b, Geophysical investigations of the Vale-Owyhee geothermal region, Malheur County, Oregon: Corvallis Oregon, Oregon State University Geophysics Group Technical Report #4, 133 p., 3 pis.
Couch, R., Gemperle, M., and Connard, G., 1978c, Total field aeromagnetic anomaly map, Cascade Mountain Range, central Oregon: Oregon Geological Survey Geological Map Series GMS-9, 2 sheets, scale 1:125,000.
EG&G GeoMetries, Inc., 1980, National Uranium Resource Evaluation aerial gamma-ray and magnetic survey, Idaho project, Hailey, Idaho Falls, Elk City quadrangles, Idaho/Montana, and Boise quadrangle, Oregon/Idaho-Final Report: U.S. Department of Energy Grand Junction Office [Report] GJBX 10-80, v. 2, n.p., scale 1:500,000.
Geo-Life (A joint venture between High-Life. Helicopters, Inc. and Geodata International Inc.), 1978, National Uranium Resource Evaluation aerial radiometric and magnetic survey, Baker National Topographic Map, Idaho and Oregon-Final Report: U.S. Department of Energy Grand Junction Office [Report] GJBX 101-78, v. 2, n.p., scale 1:500,000.
Lockwood, Kessler, and Bartlett, Inc., [ 1968?], Aeromagnetic survey composite map, Oregon coast: Syosset, N. Y., and Pasadena, Cal., Lockwood, Kessler, and Bartlett, Inc., scale 1:250,000, (prepared for U.S. Geological Survey, Heavy Minerals Project).
United Engineers and Constructors, Inc., 1978, Qualitative aeromagnetic evaluation of structures in the Columbia Plateau and adjacent Cascade Mountain area: Westboro, Mass., Weston Geophysical Research Inc., 32 p. 31 figs., 2 pis.
U.S. Geological Survey, 1972a, Aeromagnetic map of the Adel and parts of the Burns, Boise, and Jordan Valley 1 o by 2° quadrangles, Oregon: U.S. Geological Survey Open-File Report, scale 1:250,000.
___ 1972b, Aeromagnetic map of the Klamath Falls and part of the Crescent 1 o by 2o quadrangles, Oregon: U.S. Geological Survey Open-File Report, scale 1:250,000.
___ 1973, Aeromagnetic map of parts of the Coos Bay and Medford 1 o by 2o quadrangles, southwestern Oregon: U.S. Geological Survey Open-File Report, scale 1:250,000.
___ 1977a, Aeromagnetic map of Breitenbush Hot Springs and vicinity, Oregon: U.S. Geological Survey Open-File Report 77-820, scale 1:62,500.
___ 1977b, Aeromagnetic map of Mt. Hood and vicinity, Oregon: U.S. Geological Survey Open-File Report 77-819, 2 sheets, scale 1:62,500.
___ 1979, Aeromagnetic map of the Medford area, Oregon: U.S. Geological Survey Open-File Report 79-1195, scale 1:250,000.
Zietz, Isidore, and others, 1971, Interpretation of an aeromagnetic strip across the northwestern United States: Geological Society of America Bulletin, v. 82, no. 12, p. 3347-3372.

SOUTH CAROLINA
83" ... /A
82" -------,81.
B
c
'
SPECIFICATIONS
A East-West, 400 feet above ground, 3 mile (LKB Resources, 1979) B East-West, 500 feet above ground, 1 mile (USGS, 1977) C East-West, 500 feet above ground, 1 mile (Riggle and
others, 1980) D East-West, 400 feet above ground,% mile (USGS, 1970) E East-West, 500 feet above ground, 1 mile (Tyson and
others, 1980) F Northwest-Southeast, 500 feet above ground, 1 mile (Petty
and others, 1965) G East-West, 500 feet above ground, 1 mile (USGS, 1976a) H North-South, 500 feet above ground, 1 mile (USGS, 1975) I East-West, 500 feet above ground, 1 mile (USGS, 1976b)
50
43
80"
100 MILES
SOURCES OF DATA
LKB Resources, Inc., 1979, National Uranium Resource Evaluation aerial gamma-ray and magnetic reconnaissance survey, Blue Ridge area, Knoxville and Charlotte quadrangles-Final Report: U.S. Department of Energy Grand Junction Office [Report] GJBX 57-79, v. 2, n.p., scale 1:500,000.
Petty, A. J., Petrafeso, F. A., and Moore, F. C., Jr., 1965, Aeromagnetic map of the Savannah River Plant area, South Carolina and Georgia: U.S. Geological Survey Geophysical Investigations Map GP-489, scale 1:250,000.
Riggle, F. E., Zietz, Isidore, and Daniels, D. L., 1980, Aeromagnetic map of northwest South Carolina: U.S. Geological Survey Open-File Report 80-1240, 2 sheets, scale 1:250,000.
Tyson, N. S., Riggle, F. E., Zietz, Isidore, and Daniels, D. L., 1980, Aeromagnetic map of northeast South Carolina: U.S. Geological Survey Open-File Report 80-2020, scale 1:250,000.
U.S. Geological Survey, 1970, Aeromagnetic map of the Camden-Kershaw area, north-central South Carolina: U.S. Geological Survey Open-File Report, 4 sheets, scale 1:24,000.
___ 1975, Aeromagnetic map of Charleston and vicinity, South Carolina: U.S. Geological Survey Open-File Report 75-590 scale 1:250,000.
___ 1976a, Aeromagnetic maps of parts of Georgia, South Carolina, and North Carolina: U.S. Geological Survey Open-File Report 76-181 13 sheets, scale 1:250,000.
___ 1976b, Aeromagnetic map of parts of the Brunswick and Savannah 1 o by 2° quadrangles, Georgia and South Carolina: U.S. Geological Survey Open-File Report 76-155, scale 1:250,000.
___ 1977, Aeromagnetic map of Spartanburg and vicinity, South Carolina: U.S. Geological Survey Open-File Report 77-252, scale 1:250,000.

SOUTH DAKOTA 104°
46° 101° 1000 9 1---- - --- -------f-------- T--- ------ ~---- I
I F / I B
A
I l \
I c "' I I
G I
I B l so I I I I
J I
\ I D I F I
I I
l 44
I I
I I
\ I E I I -
I (
I l
'4 -----1 J_ I ------------- ------f------- --""
I
SPECIFICATIONS
A East-West, 400 feet above ground, 3 mile (EG&G GeoMetries, 1980)
B East-West, 400 feet above ground, 3 mile (Geodata, 1979) C Vertical intensity ground magnetics, 1 mile spacing (Mobil
Oil Company, unpublished data) D East-West, 400 feet above ground, 3 mile (EG&G GeoMetries,
1979) E East-West, 400 feet above ground, 3 mile (Texas
Instruments, 1979) F Vertical intensity ground magnetics, 4-6 mile (Petsch, 1967) G East-West, 3000 feet above sea level, 6 mile (Aeroservice
Corporation, unpublished data)
50
50 100
.....
~ .. .........----, I '-t--
100 MILES
150 KILOMETERS
SOURCES OF DATA
\ \ \ ~
EG&G GeoMetries, 1979, National Uranium Resource Evaluation aerial gamma-ray and magnetic survey, Idaho project, Rapid City quadrangle, South Dakota-Final Report: U.S. Department of Energy Grand Junction Office [Report] GJBX 83-80, v. 2, n.p., scale 1:500,000.
___ 1980, National Uranium Resource Evaluation aerial gammaray and magnetic survey, Powder River II project, Newcastle and Gillette quadrangles, Wyoming and South Dakota, Ekalaka quadrangle, Montana-Final Report: U.S. Department of Energy Grand Junction Office [Report] GJBX 82-79, v. 2, n.p., scale 1:500,000.
44
Geodata International, Inc., 1979, National Uranium Resource Evaluation aerial gamma-ray and magnetic survey, Lemmon National Topographic Map, South Dakota-Final Report: U.S. Department of Energy Grand Junction Office [Report] GJBX 138-79, v. 2, n.p., scale 1:500,000.
Petsch, B. C., 1967, Vertical intensity magnetic map of South Dakota, in Magnetometer map of South Dakota: South Dakota Geological Survey Mineral Resource Investigations Map No. 4, scale 1:750,000.
Texas Instruments, Inc., 1979, National Uranium Resource Evaluation aerial gamma-ray and magnetic reconnaissance survey of portions of Arizona, Idaho, Montana, New Mexico, South Dakota, and Washington, Hot Springs quadrangle-Final Report: U.S. Department of Energy Grand Junction Office [Report] GJBX 126-79, v. 2, n.p., scale 1:500,000.

88°
89"
------
8
SPECIFICATIONS
c
I 1
1 11
I 1j
50
50 I
100
All surveys flown in an east-west direction with altitude and spacing as shown below.
A 1500 feet constant barometric altitude, 1 mile (USGS, 1974) B 1500 feet constant barometric altitude, 1 mile (Johnson and
others, 1979) C 1000 feet above ground, 1 mile (Johnson and others, 1979) D 2500 feet above mean sea lev~l, 1 mile (Johnson and others,
1979) E 3500 feet above mean sea level, 2 mile (Johnson and others,
1979) F 3500 feet above mean sea level, 1 mile (Johnson and others,
1979) G 400 feet above ground, 6 miles (Carson Helicopters, Inc., 1980) H 3500 feet above mean sea level, 2 mile (Johnson and others,
1979) I 400 feet above ground, 3 mile (LKB Resources, Inc., 1979b) J 400 feet above ground, 3 mile (LKB Resources, Inc., 1979a)
86°
45
TENNESSEE
840
D
100 MILES I I
I 150 KILOMETERS
SOURCES OF DATA
Carson Helicopters, Inc., 1980, National Uranium Resource Evaluation aerial gamma-ray and magnetic reconnaissance survey of portions of Alabama, Georgia, Kentucky, Maryland, North Carolina, Ohio, Pennsylvania, Virginia and West Virginia (Chattanooga quadrangle)-Final Report: U.S. Department of Energy Grand Junction Office [Report] GJBX 92-80, v. 2J, n.p., scale 1:500,000.
Johnson, R. W., Haygood, C., and Kunselman, P. M., 1979, Aeromagnetic map of Tennessee, Tennessee Division of Geology, 4 sheets, scale 1:250,000.
LKB Resources, Inc., 1979a, National Uranium Resource Evaluation aerial gamma-ray and magnetic reconnaissance survey of the Blue Ridge Area, Johnson City and Winston-Salem quadrangles-Final Report: U.S. Department of Energy Grand Junction Office [Report] GJBX 16-79, v. 2, n.p., scale 1:500,000.
___ 1979b, National Uranium Resource Evaluation aerial gamma-ray and magnetic reconnaissance survey of the Blue Ridge Area, Knoxville and Charlotte quadrangles-Final Report: U.S. Department of Energy Grand Junction Office [Report] GJBX 57-79, v. 2, n.p., scale 1:500,000.
U.S. Geological Survey, 1974, Aeromagnetic map of the New Madrid region, Missouri-Kentucky-Arkansas-Tennessee: U.S. Geological Survey Open-File Report 74-360, scale 1:125,000.

TEXAS
100
102° 100"
~~-~--~--l 36° I
I
I E I 35ot'r---+---+----l-l
zoo
G
200 MILES
300 KILOMETERS
SPECIFICATIONS
A East-West, 400 feet above ground, 3 mile (EG&G Geometries, Q 1978) R
B East-West, 400 feet above ground, 3 mile (LKB Resources, S 1979) T
C East-West, 400 feet above ground, 3 mile (Texas U Instruments, 1980c) V
D East-West, 400 feet above ground, 6 mile (Geodata, 1980h) E East-West, 400 feet above ground, 3 mile (Geodata, 1976a) F Unpublished data G Vertical intensity ground magnetic data (Chevron Oil
Company, unpublished data) H East-West, 400 feet above ground, 3 mile (Geodata, 1980g) I East-West, 400 feet above ground, 3 mile (Geodata, 1980f) J East-West, 400 feet above ground, 3 mile (Geodata, 1980e) K East-West, 400 feet above ground, 3 mile (Geodata, 1980i) L East-West, 400 feet above ground, 3 mile (Geodata, 1980b)
M East-West, 400 feet above ground, 3 mile (Geodata, 1980c) N East-West, 400 feet above ground, 3 mile (Geodata, 1976b) 0 East-West, 400 feet above ground, 3 mile (Texas
Instruments, 1977) P East-West, 400 feet above ground, 3 mile (Geodata, 1979a)
46
w X y
z AA BB
cc
DD EE
FF
N
East-West, 400 feet above ground, 3 mile (Geodata, 1980a) East-West, 400 feet above ground, 3 mile (Geodata, 1980d) East-West, 400 feet above ground, 3 mile (Geodata, 1979c) East-West, 400 feet above ground, 3 mile (Geodata, 1979d) East-West, 400 feet above ground, 3 mile (Geodata, 1978b) East-West, 400 feet above ground, 3 mile (EG&G GeoMetries,
1980a) East-West, 400 feet above ground, 3 mile (Geodata, 1979e) Ground magnetic data (Gulf Oil Company, unpublished data) North-South, 1000 feet above ground, 2 mile (USGS, 1974) Specifications unknown (unpublished data) East-West, 400 feet above ground, 3 mile (Geodata, 1979b) East-West, 400 feet above ground, 3 mile (Texas
Instruments, 1980b) E~st-West, 400 feet above ground, 3 mile (Texas
Instruments, 1980a) East-West, 400 feet above ground, 3 mile (Geodata, 1978a) East-West, 400 feet above ground, 6 mile (EG&G GeoMetries
1980b) East-West, 400 feet above ground, 6 mile (EG&G GeoMetries
1980c)

SOURCES OF DATA
EG&G GeoMetries, 1978, National Uranium Resource Evaluation aerial gamma-ray and magnetic reconnaissance survey, Big Bend area [Van Hom and Pecos quadrangles] -Final Report: U.S. Department of Energy Grand Junction Office [Report] GJBX 2-78, v. 2, n.p., scale 1:500,000.
___ 1980a, National Uranium Resource Evaluation aerial gamma-ray and magnetic reconnaissance survey, Nebraska-Texas project, Tyler, Texarkana, and Waco quadrangles of Texas, Oklahoma, Arkansas, and Louisiana-Final Report: U.S. Department of Energy Grand Junction Office [Report] GJBX 69-80, v. 2, n.p., scale 1:500,000.
___ 1980b, National Uranium Resource Evaluation aerial gamma-ray and magnetic reconnaissance survey, Alexandria quadrangle, Louisiana and Texas-Final Report: U.S. Department of Energy Grand Junction Office [Report] GJBX 152-80, v. 2, n.p., scale 1:500,000.
___ 1980c, National Uranium Resource Evaluation aerial gamma-ray and magnetic reconnaissance survey of Lake Charles and Port Arthur quadrangles, Texas and Louisiana-Final Report: U.S. Department of Energy Grand Junction Office [Report] GJBX 224-80, v. 2, n.p., scale 1:500,000.
Geodata International, Inc., 1976a, National Uranium Resource Evaluation aerial radiometric and magnetic survey [Tucumcari, Clovis, Brownfield, and Amarillo quadrangles]-Final Report: U.S. Department of Energy Grand Junction Office [Report] GJBX 33-76, v. 2, n.p., scale 1:500,000.
___ 1976b, National Uranium Resource Evaluation aerial radiometric and magnetic survey [Lawton and Wichita Falls quadrangles] -Final Report: U.S. Department of Energy Grand Junction Office [Report] GJBX 34-76, v. 2, n.p., scale 1:500,000.
___ 1978a, National Uranium Resource Evaluation aerial radiometric and magnetic survey, Houston National Topographic Map, Texas Gulf Coast-Final Report: U.S. Department of Energy Grand Junction Office [Report] GJBX 102-78, v. 2, n.p., scale 1:500,000.
___ 1978b, National Uranium Resource Evaluation aerial radiometric and magnetic survey, Brownsville/McAllen National Topographic Map, Texas Gulf Coast-Final Report: U.S. Department of Energy Grano Junction Office [Report] GJBX 117-78, v. 2, n.p., scale 1:500,000.
___ 1979a, National Uranium Resource Evaluation aerial radiometric and magnetic survey, Brownwood National Topographic Map, Texas Gulf Coast-Final Report: U.S. Department of Energy Grand Junction Office [Report] GJBX 68-79, v. 2, n.p., scale 1:500,000.
___ 1979b, National Uranium Resource Evaluation aerial radiometric and magnetic survey, Beeville/Bay City National Topographic Map, Texas Gulf Coast-Final Report: U.S. Department of Energy Grand Junction Office [Report] GJBX 69-79, v. 2, n.p., scale 1:500,000.
___ 1979c, National Uranium Resource Evaluation aerial radiometric and magnetic survey, Crystal City National Topographic Map, Texas Gulf Coast-Final Report: U.S. Department of Energy Grand Junction Office [Report] GJBX 98-79, v. 2, n.p., scale 1:500,000.
___ 1979d, National Uranium Resource Evaluation aerial radiometric and magnetic survey, Corpus Christi/Laredo National Topographic Map, Texas Gulf Coast-Final Report: U.S. Department of Energy Grand Junction Office [Report] GJBX 99-79, v. 2, n.p., scale 1:500,000.
___ 1979e, National Uranium Resource Evaluation aerial radiometric and magnetic survey, Austin National Topographic Map, Texas Gulf Coast-Final Report: U.S. Department of Energy Grand Junction Office [Report] GJBX 148-79, v. 2, n.p., scale 1:500,000.
47
___ 1980a, National Uranium Resource Evaluation aerial radiometric and magnetic survey, Llano National Topographic Map, Texas-Final Report: U.S. Department of Energy Grand Junction Office [Report] GJBX24-80, v. 2, n.p., scale 1:500,000.
___ 1980b, National Uranium Resource Evaluation aerial radiometric and magnetic survey, Del Rio, Texas-Final Report: U.S. Department of Energy Grand Junction Office [Report] GJBX 156--80, v. 2, n.p., scale 1:500,000.
___ 1980c, National Uranium Resource Evaluation aerial radiometric and magnetic survey, Eagle Pass, Texas-Final Report: U.S. Department of Energy Grand Junction Office [Report] GJBX 157--80, v. 2, n.p., scale 1:500,000.
___ 1980d, National Uranium Resource Evaluation aerial radiometric and magnetic survey, San Antonio, Texas-Final Report: U.S. Department of Energy Grand Junction Office [Report] GJBX 160--80, v. 2, n.p.,scale 1:500,000.
___ 1980e, National Uranium Resource Evaluation aerial radiometric and magnetic survey, San Angelo, Texas-Final Report: U.S. Department of Energy Grand Junction Office [Report] GJBX 168--80, v. 2, n. p., scale 1:500,000.
___ 1980f, National Uranium Resource Evaluation aerial radiometric and magnetic survey, Big Spring, Texas-Final Report: U.S. Department of Energy Grand Junction Office [Report] GJBX 196-80, v. 2, n.p., scale 1:500,000.
___ 1980g, National Uranium Resource Evaluation aerial radiometric and magnetic survey, Hobbs National Topographic Map, TexasandNewMexico-FinalReport: U.S. DepartmentofEnergy Grand Junction Office [Report] GJBX 228-80, v. 2, n.p., scale 1:500,000.
___ 1980h, National Uranium Resource Evaluation aerial radiometric and magnetic survey, Perryton [quadrangle], Texas and Oklahoma-Final Report: U.S. Department of Energy Grand Junction Office [Report] GJBX229-80, v. 2, n.p., scale 1:500,000.
___ 1980i, National Uranium Resource Evaluation aerial radiometric and magnetic survey, Sonora National Topographic Map, Texas-Final Report: U.S. Department of Energy Grand Junction Office [Report] GJBX245-80, v. 2, n.p., scale 1:500,000.
LKB Resources, Inc., 1979, National Uranium Resource Evaluation aerial gamma-ray and magnetic reconnaissance survey, Big Bend Area, Marfa, Presidio, Fort Stockton, and Emory Peak quadrangles-Final Report: U.S. Department of Energy Grand Junction Office [Report] GJBX88-79, v. 2, n.p., scale 1:500,000.
Texas Instruments, Incorporated, 1977, National Uranium Resource Evaluation aerial gamma-ray and magnetic reconnaissance survey, Red River area -Block C [Abilene, Sherman, and Dallas quadrangles]-Final Report: U.S. Department of Energy Grand Junction Office [Report] GJBX 17-77, v. 2, n.p., scale 1:500,000.
___ 1980a, National Uranium Resource Evaluation aerial gammaray and magnetic reconnaissance survey of a portion of Texas, Beaumont a·nd Palestine quadrangles-Final Report: U.S. Department of Energy Grand Junction Office [Report] GJBX 44-80, v. 2, n.p., scale 1:500,000.
___ 1980b, National Uranium Resource Evaluation aerial gammaray and magnetic reconnaissance survey of portions of Texas [Palestine quadrangle]- Final Report: U.S. Department of Energy Grand Junction Office [Report] GJBX45-80, v. 2, n.p., scale 1:500,000.
___ 1980c, National Uranium Resource Evaluation aerial gammaray and magnetic reconnaissance survey of portions of New Mexico, Oklahoma, and Texas [Dalhart quadrangle]- Final Report: U.S. Department of Energy Grand Junction Office [Report] GJBX 46-80, v. 2, n.p., scale 1:500,000.
U.S. Geological Survey, 1974, Aeromagnetic map of part of the Texas coastal plain: U.S. Geological Survey Open-File Report 74-100, scale 1:250,000.

UTAH
1 J40 113° 112" 111° 42" ____ .J. ____ _
J
41°--Jt------1---.....--+---.....---4--
0 50 100 MILES ,,., •' I 'I I 'I I I
I I
0 50 100 150 KILOMETERS
SPECIFICATIONS
A East-West, 8500 feet barometric, 1 mile (Case and Joesting, 1972)
B East-West, 9000 feet barometric, 1 mile (USGS, 1971) c East-West, 9000 feet barometric, 1 mile (USGS, 1966) D East-West, 12,500 feet barometric, 1 mile (Case and
Joesting, 1972) E East-West, 11,500 feet barometric, 1 mile (Case and
Joesting, 1972) F East-West, 12,500 feet barometric, 1 mile (Case and
others, 1963) G East-West, 500 feet above ground, 2 mile (Byerly and
Joesting, 1959) H East-West, 11,000 feet barometric, 2 mile (Crittenden
and others, 1967) I East-West, 12,000 feet barometric, 2 mile (Mabey and
others, 1964) J North-South, 12,000 feet barometric, 5 mile (Zietz and
others, 1976) K North-South, 8500 feet barometric, 2 to 4 mile
(G. K. Eppich, R. T. Shuey, D. K. Schellinger, and L. B. Alley, between 1971 and 1974, Zietz and others, 1976)
L North-South, 12,000 feet barometric, 2 to 4 mile (L. B. Alley and R. T. Shuey, between 1971 and 1974, Zietz and others, 1976)
M East-West, 9000 feet barometric, 2 mile (USGS, 1972a) N East-West, 9000 feet barometric, 2 mile (USGS, 1972b) 0 North-South, 14,000 feet barometric, 2 mile (Steenland,
1969) p East-West, 400 feet above ground, 3 mile (Geo-Life, 1979) Q East-West, 15,000 feet barometric, individual flight lines
(unpublished data) 48
SOURCES OF DATA
Byerly, P. E., andJoesting, H. R., 1959, Regional geophysical investigations of the Lisbon Valley area, Utah and Colorado: U.S. Geological SurveyProfessionalPaper316-C, p. 39-50, scale 1:125,000.
Case, J. E., and Joesting, H. R., 1972, Regional geophysical investigations in the central Colorado Plateau: U.S. Geological Survey Professiona1Paper736, 31 p., 3pls.; scale 1:125,000.
Case, J. E., Joesting, H. R., and Byerly, P. E., 1963, Regional geophysical investigations in the La Sal Mountains area, Utah and Colorado: U.S. Geological Survey Professional Paper 316-F, p. 91-116, scale 1:125,000.
Crittenden, M.D., Jr., Wallace, C. A., and Sheridan, M. J., 1967, Mineral resources of the High Uintas primitive area, Utah: U.S. Geological Survey Bulletin 1230-1, 27p., 1 pl.
Geo-Life (A joint venture between High Life Helicopters, Inc., and Geodata International, Inc.), 1979, National Uranium Resource Evaluation aerial radiometric and magnetic survey, Vernal National Topographic Map, Colorado and Utah-Final Report: U.S. Department of Energy Grand Junction Office [Report] GJBX 167-79, v. 2, n.p., scale 1:500,000.
Mabey, D. R., Crittenden, M.D., Jr., Morris, H. T., Roberts, R. J., and Tooker, E. W., 1964, Aeromagnetic and generalized geologic map of part of north-central Utah: U.S. Geological Survey Geophysical Investigations Map GP-422, scale 1:250,000.
Steenland, N. C., 1969, An aeromagnetic survey of the Uinta Mountains, in Intermountain Association of Geologists (and Utah Geological Society), 16th Annual Field Conference, Salt Lake City, Utah, 1969, Geologic guidebook of the Uinta Mountains, Utah's maverick range: Utah Geological Survey, p. 47-51.
U.S. Geological Survey, 1966, Aeromagnetic map ofthe San Francisco Mountains and vicinity, southwestern Utah: U.S. Geological Survey Geophysical Investigations Map GP-598, scale 1:62,500.
___ 1971, Aeromagnetic map of part of west-central Utah: U.S. Geological Survey Open-File Report, scale 1:250,000.
___ 1972a, Aeromagnetic map of parts of the Delta and Richfield 1" by 2° quadrangles, Utah: U.S. Geological Survey Open-File Report, scale 1:250,000.
___ 1972b, Aeromagnetic map of parts of the Richfield and Cedar City 1 o by 2° quadrangles, Utah: U.S. Geological Survey Open-File Report, scale 1:250,000.
Zietz, Isidore, Shuey, Ralph, and Kirby, John R., 1976, Aeromagnetic map of Utah: U.S. Geological Survey Geophysical Investigations Map GP-907, scale 1:1,000,000.

~....._/
)I ) I
A 4tt( t
, 80"
81° --
B
VIRGINIA , WEST VIRGINIA
82" .I 3~~~------~--------+---------+-~~~--+-----~
50 100 MILES r-~.--r--~r-~--~--~--~--~--Lo~
50 100 150 KILOMETERS
SPECIFICATIONS
A North-South, 1000 feet above ground, 1 mile (USGS, 1976) I East-West, 500 feet above ground,% mile (Virginia Division B Northwest-Southeast, 1000 feet above ground, 1 mile
(USGS, 1976) C Northwest-Southeast, 1000 feet above ground, 1 mile
(USGS, 1974b) D Northwest-Southeast, 1000 feet above ground, 1 mile
(USGS, 1974a) E Northwest-Southeast, 5000 feet above sea level, 11/2 mile
(Virginia Division of Mineral Resources, 1962) F Northwest-Southeast, 5000 feet above sea level, 3 mile
(Virgina Division of Mineral Resources, 1972) G East-West, 500 feet above ground, % mile (Virginia Division
of Mineral Resources, 1972) · H East-West, 500 feet above ground, % mile (Virginia Division
of Mineral Resources, 1966)
49
of Mineral Resources, 1970) · J East-West, 500 feet above ground, % mile (Virginia Division
of Mineral Resources, 1969) K East-West, 400 feet above ground, 1/2 mile (USGS, 1971a, b, c) L East-West, 500 feet above ground, % mile (Virginia Division
of Mineral Resources, 1971) M East-West, 500 feet above ground, % mile (USGS,
unpublished data) N East-West, 500 feet above ground, % mile (Bromery and
others, 1963a, b) 0 East-West, 500 feet above ground,% mile (Neuschel, 1970) P East-West, 500 feet above ground, 2 mile (USGS, 1972)

SOURCES OF DATA
Bromery, R. W., Galat, G. H., and Chandler, E. J., 1963a, Aeromagnetic map of the Joplin quadrangle, Prince William and Stafford Counties, Virginia: U.S. Geological Survey Geophysical Investigations Map GP-390, scale 1:24,000.
___ 1963b, Aeromagnetic map of the Quantico quadrangle, Prince William and Stafford Counties, Virginia: U.S. Geological Survey Geophysical Investigations Map GP-391, scale 1:24,000.
Neuschel, S. K., 1970, Correlation of aeromagr.etics and aeroradioactivity with lithology in the Spotsylvania area, Virginia: Geological SocietyofAmericaBulletin, v. 81, no.12, p. 3575-82.
U.S. Geological Survey, 1971a, Aeromagnetic map of the Danville quadrangle, Pittsylvania County, Virginia, and Caswell County, North Carolina: U.S. Geological Survey Geophysical Investigations Map GP-745, scale 1:62.500.
___ 1971b, Aeromagnetic map of the Milton quadrangle, Halifax and Pittsylvania Counties, Virginia, and Caswell and Person Counties, North Carolina: U.S. Geological Survey Geophysical Investigations Map GP-746, scale 1:62,500.
___ 1971c, Aeromagnetic map of the South Boston quadrangle, Halifax County, Virginia and Person and Granville Counties, North Carolina: U.S. Geological Survey Geophysical Investigations Map GP-747, scale 1:62,500.
50
___ 1972, Aeromagnetic map of southeastern Virginia: U.S. Geological Survey Open-File Report, scale 1:250,000.
___ 1974a, Aeromagnetic map of the southern part of West Virginia: U.S. Geological Survey Open-File Report 74-47, scale 1:250,000.
___ 197 4b, Aeromagnetic map of the central part of West Virginia: U.S. Geological Survey Open -File Report 7 4-33 7, scale 1:250,000.
___ 1976, Aeromagnetic map of the northern part of West Virginia: U.S. GeologicalSurveyOpen-FileReport76-780, scale 1:250,000.
Virginia Division of Mineral Resources, 1962, Composite aeromagnetic map of Southwestern Virginia: Charlottesville, Virginia, scale 1:250,000.
___ 1966, Magnetic and radiometric data, southwest Piedmont of Virginia: Information Circular 12, scale 1:62,500.
___ 1969, Composite aeromagnetic map of the south-central Piedmont, Virginia: Charlottesville, Virginia, scale 1:250,000.
___ 1970, Composite aeromagnetic map of the Roanoke quadrangle, Virginia: Charlottesville, Virginia, scale 1:250,000.
___ 1971, Composite aeromagnetic map of the Piedmont area, Virginia: Charlottesville, Virginia, scale 1:250,000.
___ 1972, Composite aeromagnetic map of western Virginia: Charlottesville, Virginia, 2 sheets, scale 1:250,000.

A
B
c D E F G H I J K
L
M
N
0
p
Q
R
s
T
H
--'--
I \
.......__- _.. I
0 I I II
121° 120°
K
----..__, _./"--
50 100 MILES I I I
50 100 1 ~0 KILOMETERS
119° I
GG
KK
WASHINGTON
118° -..l---, HH
II
LL
K I
__ 1 117°
SPECIFICATIONS
North-South, 300 meters above sea level, 1.2 kilometers u East-West, 1000 feet above ground, 0.5 mile (Henderson (Geological Survey of Canada, 1979a) and others, 1958n)
North-South, 300 meters above sea level, 1.2 kilometers v East-West, 1000 feet above ground, 0.5 mile (Henderson (Geological Survey of Canada, 1979b) and others, 1958k)
East-West, 3000 feet barometric, 2 mile (USGS, 1978) w East-West, 1000 feet above ground, 0.5 mile (Henderson East-West, 7000 feet barometric, 1 mile (Thompson, 1973) and others, 1958e) North-South, 3000 feet barometric, 2 mile (USGS, 1977a) X East-West, 1000 feet above ground, 0.5 mile (Henderson North-South, 3000 feet barometric, 1 mile (USGS, 1974a) and others, 1958g) North-South, 4200 feet above sea level, 2 mile (USGS, 1980d) y East-West, 1000 feet above ground, 0.5 mile (Henderson East-West, 500 feet above sea level, 2 mile (USGS, 1980a) and others, 1958b) East-West, 2500 feet above sea level, 2 mile (USGS, 1980c) z North-South, 8000 feet barometric, 1 mile (Simmons and East-West, 2500 feet above sea level, 2 mile (USGS, 1980b) others, 1974) East-West, 15,000 feet barometric, 5 mile (Zietz and AA Northeast-Southwest, 1000 feet above mean terrain, 0.5
others, 1971) mile (United Engineers and Constructors, Inc., 1978) East-West, 1000 feet above ground, 0.5 mile (Henderson BB Northeast-Southwest, 1500 feet above mean terrain, 0.5
and others, 1958h) mile (United Engineers and Constructors, Inc., 1978) East-West, 1000 feet above ground, 0.5 mile (Henderson cc Northeast-Southwest, 1000 feet terrain clearance, 1 mile
and others, 1958d) (USGS, 1979) East-West, 1000 feet above ground, 0.5 mile (Henderson DD East-West, 10,000 feet barometric, 1 mile (Staatz and
and others, 1958j) others, 1971) East-West, 1000 feet above ground, 0.5 mile (Henderson EE East-West, 10,000 feet barometric, 1 mile (USGS, 1976)
and others, 1958i) FF East-West, 9500 feet barometric, 1 mile (USGS, 1977b) East-West, 1000 feet above ground, 0.5 mile (Henderson GG East-West, 500 feet above ground, 0.25 mile (Hunting
and others, 19581) Geophysical Services, Inc., 1960) East-West, 1000 feet above ground, 0.5 mile (Henderson HH East-West, 7000 feet barometric, 2 mile (USGS, 1973)
and others, 1958c) II East-West, 7000 feet barometric, 1 mile (USGS, 1974b) East-West, 1000 feet above ground, 0.5 mile (Henderson JJ East-West, 400 feet above ground, 3 mile (LKB Resources,
and others, 1958a) Inc., 1979) East-West, 1000 feet above ground, 0.5 mile (Henderson KK East-West, 400 feet above ground, 3 mile (Texas
and others, 1958f) Instruments, Inc., 1979) East-West, 1000 feet above ground, 0.5 mile (Henderson LL East-West, 400 feet above ground, 3 mile (LKB Resources,
and others, 1958m) Inc., 1978)
51
SOURCES OF DATA
Geological Survey of Canada, 1979a, Cape Aattery, British ColumbiaWashington, Canada-United States: Geological Survey of Canada Geophysical Series (High Resolution Aeromagnetic Total Field) Map 8192-G, scale 1:250,000.
___ 1979b, Victoria-Vancouver, British Columbia-Washington, Canada-United States: Geological Survey of Canada Geophysical Series (High Resolution Aeromagnetic Total Field) Map 8191-G, scale 1:250,000.
Henderson, J. R., Tyson, N. S., Gilchrist, S. A., and others, 1958a, Aeromagnetic map of part of the Yelm qua.drangle, Thurston and Lewis Counties, Washington: U.S. Geological Survey Geophysical Investigations Map GP-182, scale 1:62,500.
___ 1958b, Aeromagnetic map of the Onalaska quadrangle, Lewis County, Washington: U.S. Geological Survey Geophysical Investigations Map GP-189, scale 1:62,500.
Henderson, J. R., Tyson, N. S., McGowan, E. F., and others, 1958c, Aeromagnetic- map of part of the Tenino quadrangle, Thurston and Lewis Counties, Washington: U.S. Geological Survey Geophysical Investigations Map GP-181, scale 1:62,500.
___ 1958d, Aeromagnetic map of the Aberdeen quadrangle, Grays Harbor and Pacific Counties, Washington: U.S. Geological Survey Geophysical Investigations Map GP-177, scale 1:62,500.
___ l958e, Aeromagnetic map of the Adna quadrangle, Lewis County, Washington: U.S. Geological Survey Geophysical Investigations Map GP-187, scale 1:62,500.
___ l958f, Aeromagnetic map of the Cape Shoalwater quadrangle, Pacific County, Washington: U.S. Geological Survey Geophysical Investigations Map GP-183, scale 1:62,500.
___ 1958g, Aeromagnetic map of the Centralia quadrangle, Lewis County, Washington: U.S. Geological Survey Geophysical Investigations Map GP-188, scale 1:62,500.
___ 1958h, Aeromagnetic map of the Grayland quadrangle, Grays Harbor and Pacific Counties, Washington: U.S. Geological Survey Geophysical Investigations Map GP-176, scale 1:62,500.
___ 1958i, Aeromagnetic map of the Malone quadrangle, Grays Harbor, Pacific and Lewis Counties, Washington: U.S. Geological Survey Geophysical Investigations Map GP-179, scale 1:62,500.
___ 1958j, Aeromagnetic map of the Montesano quadrangle, Grays Harbor and Pacific Counties, Washington: U.S. Geological Survey Geophysical Investigations Map GP-178, scale 1:62,500.
___ 1958k, Aeromagnetic map of the Pe Ell quadrangle, Pacific and Lewis Counties, Washington: U.S. Geological Survey Geophysical Investigations Map GP-186, scale 1:62,500.
___ 19581, Aeromagnetic map of the Rochester quadrangle, Thurston, Grays Harbor and Lewis Counties, Washington: U.S. Geological Survey Geophysical Investigations Map GP-180, scale 1:62,500.
___ 1958m, Aeromagnetic map of the South Bend quadrangle, Pacific County, Washington: U.S. Geological Survey Geophysical Investigations Map GP-184, scale 1:62,500.
___ 1958n, Aeromagnetic map of the Wiilapa quadrangle, Pacific County, Washington: U.S. Geological Survey Geophysical Investigations Map GP-185, scale 1:62,500.
Hunting Geophysical Services, Inc., 1960 Geological interpretation of airborne magnetometer and scintillometer survey, Mt. Bonaparte, Bodie Mountain, Curlew, Aeneas and Republic quadrangles, Okanogan and Ferry Counties, Washington: Washington Division of Mines and Geology Report of Investigations No. 20, 34 p., 5 pis.
LKB Resources, Inc., 1978, National Uranium Resource Evaluation aerial gamma-ray and magnetic reconnaissance survey, NE Washington area, Spokane NL 11-2 quadrangle-Final Report: U.S. Department of Energy Grand Junction Office [Report] GJBX 121-78, v. 2, n.p., scale 1:500,000.
___ 1979, National Uranium Resource Evaluation aerial gammaray and magnetic reconnaissance survey, NE Washington area, Okanogan NM 11-10 and Sandpoint NM 11-11 quadrangles-Final Report: U.S. Department of Energy Grand Junction Office [Report] GJBX 142-79, v. 2, n.p., scale 1:500,000.
52
Simmons, G. C., VanNoy, R. M., and Zilka, N. T., 1974, Mineral resources of the Cougar Lake-Mount Aix study area, Yakima and Lewis Counties, Washington, with a section on Interpretation of aeromagnetic data by Willard E. Davis: U.S. Geological Survey Open-File Report 7 4-243, 80 p., 3 pis.
Staatz, M. H., Weis, P. L., Tabor, R. W., Robertson, J. F., Van Nay, R. M., Pattee, E. C., and Holt, D. C., 1971, Mineral resources of the Pasayten Wilderness area, Washington, with a section on aeromagnetic interpretation by Gordon P. Eaton and Mortimer H. Staatz: U.S. Geological Survey Bulletin 1325, 255 p., 3 pis.
Texas Instruments, Inc., 1979, National Uranium Resource Evaluation aerial radiometric and magnetic reconnaissance survey of portions of Arizona, Idaho, Montana, New Mexico, South Dakota and Washington, Ritzville quadrangle-Final Report: U.S. Department ofEnergyGrandJunction Office [Report] GJBX 126-79, v. 2J, n.p., scale 1:500,000.
Thompson, G. A., 1973, Aeromagnetic and Bouguer gravity map of Twin Sisters Dunite, northwestern Washington: U.S. Geological Survey Geophysical Investigations Map GP-90 1, scale 1:125,000.
United Engineers and Constructors, Inc., 1978, Qualitative aeromagnetic evaluation of structures in the Columbia Plateau and adjacent Cascade Mountain area: Westboro, Mass., Weston Geophysical Research, Inc., 32 p., 31 figs., 2 pis.
U.S. Geological Survey, 1973, Aeromagnetic map of parts of the Okanogan and Sandpoint 1 o by 2o quadrangles, Washington-Idaho-Montana: U.S. GeologicaiSurveyOpen-FileReport, scale 1:250,000.
___ l974a, Aeromagnetic map of part of the Puget Sound area, Washington: U.S. Geological Survey Open-File Report, scale 1:125,000.
___ 1974b, Aeromagnetic map of parts of the Okanogan, Sandpoint, Ritzville, and Spokane 1 o by 2° quadrangles, northeastern Washington: U.S. Geological Survey Open-File Report, scale 1:250,000.
___ 1976, Aeromagnetic:: map of the Horseshoe Basin quadrangle, Okanogan County, Washington: U.S. Geological Survey Open-File Report76-359, scale 1:62,500.
___ 1977a, Aeromagnetic map of northern and eastern parts of the Puget Sound area, Washington: U.S. Geological Survey Open-File Report 77-34, scale 1:125,000.
___ 1977b, Aeromagnetic map of part of northern Washington: U.S. Geological Survey Open-File Report 77-254, 2 sheets, scale 1:62,500.
___ 1978, Aeromagnetic map of the Bellingham area, Washington: U.S. Geological Survey Open-File Report 78-354, scale 1:250,000.
___ 1979, Aeromagnetic map of the Cascade Pass area, Washington: U.S. Geological Survey Open-File Report 79-1645, scale 1:62,500.
___ 1980a, Aeromagnetic map of offshore northwest Washington: U.S. Geological Survey Open -File Report 80-97 6, scale 1: 125,000.
___ 198Gb, Aeromagnetic map of the central Grays Harbor County area, Washington: U.S. Geological Survey Open-File Report 80-948, scale 1:125,000.
___ 1980c, Aeromagnetic map of the north-central Washington Coast: U.S. Geological Survey Open-File Report 80-977, scale 1:125,000.
___ 1980d, Aeromagnetic map of the northwest part of the Olympic National Forest, Washington: U.S. Geological Survey Open-File Report80-950, scale 1:125,000.
Zietz, Isidore, and others, 1971, Interpretation of an a_eromagnetic strip across the northwestern United States: Geological Society of AmericaBulletin, v. 82, no. 12,3347-3372.

90"
0 50 100 MILES I~~~~~~ I I I I II I I 0 50 100 150 KILOMETERS
53
WISCONSIN SPECIFICATIONS
A North-South, 3000 feet above sea level, 6 mile (Patenaude, 1966)
B North-South, 500 feet above ground, % mile (Zietz and others, 1977)
C North-South, 500 feet above ground, % mile (unpublished data)
D Northwest-Southeast (southern half) Northeast-Southwest (northern half), 3000 feet barometric, 6 mile (Hinze and and O'Hara, 1966)
SOURCES OF DATA
Hinze, W. J., and O'Hara, N. W., Michigan State University, written communication, 1966
Patenaude, R. W., 1966, A regional aeromagnetic survey of Wisconsin, in Steinhart, J. S., and others, eds., The earth beneath the continents: American Geophysical Union Geophysical Monograph 10, p. 111-126, fig. 1, scale 1:2,500,000.
Zietz, Isidore, Karl." J. H., and Ostrom, M. E., 1977, Preliminary aeromagnetic map (in color) covering most of the exposed Precambrian terrane in Wisconsin: U.S. Geological Survey Open-File Report 77-598, scale 1:250,000.
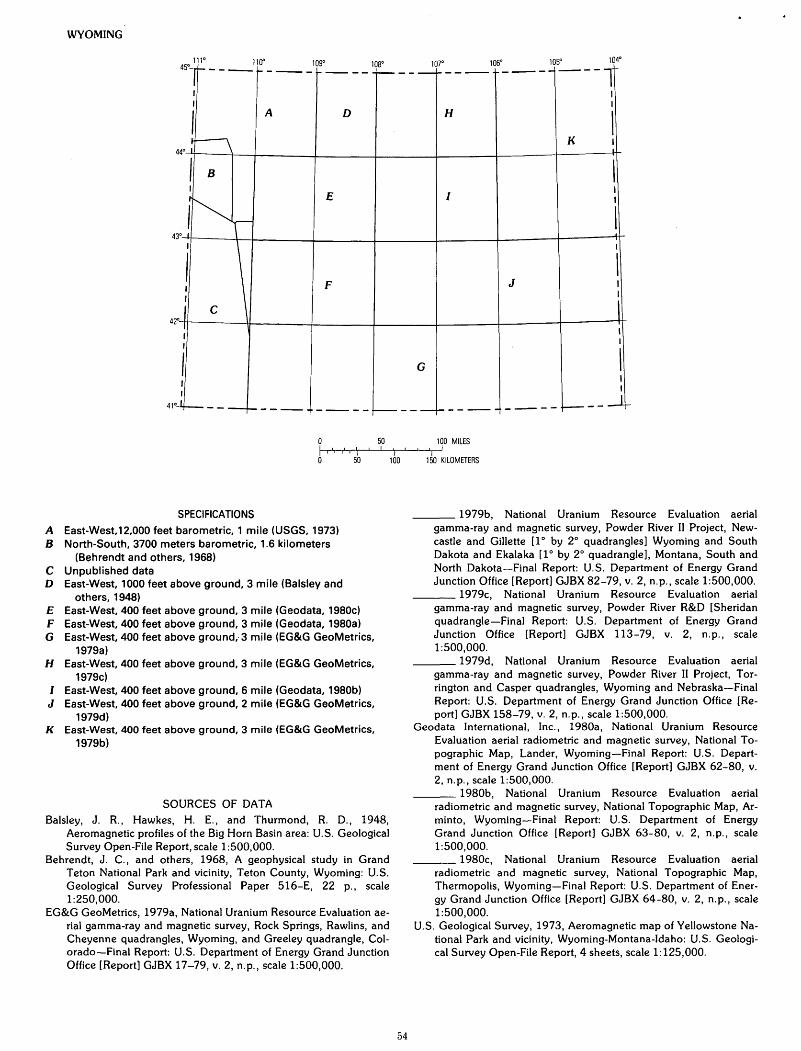
WYOMING
111° 110" 109° 108° 107° 106° 105° 104° 450-r- - - -- ~-- - -- - .... -- - - ,..----1----- ----- ---1
I I I I
I A D H I
1~ K I 44° .J.
I B \ I I I
~~ E I I
I \ 30 __t
I
\ I
I \ I F J I
I I
.1 c 1 I
I I I I
I G \ I I
I I
42
41°
JL__ ___
----- ----- ---------- ----- f---- _j+--
0 50 1 DO MILES ~~ r,'~,~.·~·~\~~·-+'1~'~~·~~~~ 0 50 100 150 KILOMETERS
SPECIFICATIONS
A East-West,12,000 feet barometric, 1 mile (USGS, 1973) B North-South, 3700 meters barometric, 1.6 kilometers
(Behrendt and others, 1968) C Unpublished data D East-West, 1000 feet above ground, 3 mile (Balsley and
others, 1948) E East-West, 400 feet above ground, 3 mile (Geodata, 1980c) F East-West, 400 feet above ground, 3 mile (Geodata, 1980a) G East-West, 400 feet above ground,· 3 mile (EG&G GeoMetries,
1979a) H East-West, 400 feet above ground, 3 mile (EG&G GeoMetries,
1979c) I East-West, 400 feet above ground, 6 mile (Geodata, 1980b) J East-West, 400 feet above ground, 2 mile (EG&G GeoMetries,
1979d) K East-West, 400 feet above ground, 3 mile (EG&G GeoMetries,
1979b)
SOURCES OF DATA
Balsley, J. R., Hawkes, H. E., and Thurmond, R. D., 1948, Aeromagnetic profiles of the Big Horn Basin area: U.S. Geological Survey Open-File Report, scale 1:500,000.
Behrendt, J. C., and others, 1968, A geophysical study in Grand Teton National Park and vicinity, Teton County, Wyoming: U.S. Geological Survey Professional Paper 516-E, 22 p., scale 1:250,000.
EG&G GeoMetries, 1979a, National Uranium Resource Evaluation aerial gamma-ray and magnetic survey, Rock Springs, Rawlins, and Cheyenne quadrangles, Wyoming, and Greeley quadrangle, Colorado-Final Report: U.S. Department of Energy Grand Junction Office [Report] GJBX 17-79, v. 2, n.p., scale 1:500,000.
54
___ 1979b, National Uranium Resource Evaluation aerial gamma-ray and magnetic survey, Powder River II Project, Newcastle and Gillette [1 o by 2o quadrangles] Wyoming and South Dakota and Ekalaka [1 o by 2° quadrangle], Montana, South and North Dakota-Final Report: U.S. Department of Energy Grand Junction Office [Report] GJBX 82-79, v. 2, n.p., scale 1:500,000.
___ 1979c, National Uranium Resource Evaluation aerial gamma-ray and magnetic survey, Powder River R&D [Sheridan quadrangle-Final Report: U.S. Department of Energy Grand Junction Office [Report] GJBX 113-79, v. 2, n.p., scale 1:500,000.
___ 1979d, National Uranium Resource Evaluation aerial gamma-ray and magnetic survey, Powder River II Project, Torrington and Casper quadrangles, Wyoming and Nebraska-Final Report: U.S. Department of Energy Grand Junction Office [Report] GJBX 158-79, v. 2, n.p., scale 1:500,000.
Geodata International, Inc., 1980a, National Uranium Resource Evaluation aerial radiometric and magnetic survey, National Topographic Map, Lander, Wyoming-Final Report: U.S. Department of Energy Grand Junction Office [Report] GJBX 62-80, v. 2, n.p., scale 1:500,000.
___ 1980b, National Uranium Resource Evaluation aerial radiometric and magnetic survey, National Topographic Map, Arminto, Wyoming-Final Report: U.S. Department of Energy Grand Junction Office [Report] GJBX 63-80, v. 2, n.p., scale 1:500,000.
___ 1980c, National Uranium Resource Evaluation aerial radiometric and magnetic survey, National Topographic Map, Thermopolis, Wyoming-Final Report: U.S. Department of Energy Grand Junction Office [Report] GJBX 64-80, v. 2, n.p., scale 1:500,000.
U.S. Geological Survey, 1973, Aeromagnetic map of Yellowstone National Park and vicinity, Wyoming-Montana-Idaho: U.S. Geological Survey Open-File Report, 4 sheets, scale 1:125,000.

-
H·
I~
55
0 50 100 1•'•1•'1 I I I I I 0 50 100 200
ATLANTIC OCEAN
ZOO MILES I J
300 KILOMETERS

SPECIFICATIONS
A Northwest-Southeast, 150 meters above sea level, 8 kilometers (Taylor and others, 1968)
B North-South, 2500 feet barometric, 1.25 mile (USGS, 1979) C Northwest-Southeast, 310 meters above sea level, 2.4
kilometers (Kiitgord and Behrendt, 1977) D Northwest-Southeast, 460 meters above sea level, 3.2
kilometers (Kiitgord and Behrendt, 1977) E Northwest-Southeast, 460 meters above sea level, 32
kilometers (Kiitgord and Behrendt, 1977) F Northwest-Southeast, 460 meters above sea level, 9.7
kilometers (Kiitgord and Behrendt, 1977) G Northwest-Southeast, 460 meters above sea level, 4.8
kilometers (Kiitgord and Behrendt, 1977) H Northwest-Southeast, 500 feet above sea level, 5 nautical
miles (US Naval Oceanographic Office, 1972) I Northeast-Southwest, 1500 feet above sea level, 5 nautical
miles (US Naval Oceanographic Office, 1972) J East-West and North-South, sea level, 10 nautical miles
(US Naval Oceanographic Office, 1972)
56
SOURCES OF DATA
Klitgord, K. D., and Behrendt, J. C., 1977, Aeromagnetic map of the United States Atlantic Continental Margin: U.S. Geological Survey Miscellaneous Field Studies Map MF-913, 2 sheets, scale 1:1,000,000.
Taylor, P. T., Zietz, Isidore, and Dennis, L. S., 1968, Geologic implications of aeromagnetic data from the eastern continental margin of the United States: Geophysics, v. 33, no. 5, p. 755-780.
U.S. Geological Survey, 1979, Aeromagnetic map of the central part of the Gulf of Maine: U.S. Geological Survey Open-File Report 79-1198, scale 1:250,000.
U.S. Naval Oceanographic Office, 1972, R~sidual magnetic intensity · contour chart-Gulf of Mexico, Caribbean Sea, North American
Basin, in Environmental-Acoustic atlas of the Caribbean Sea and Gulf of Mexico, v. II, marine environment: U.S. Naval Oceanographic Office SP-189 II, 181 p.
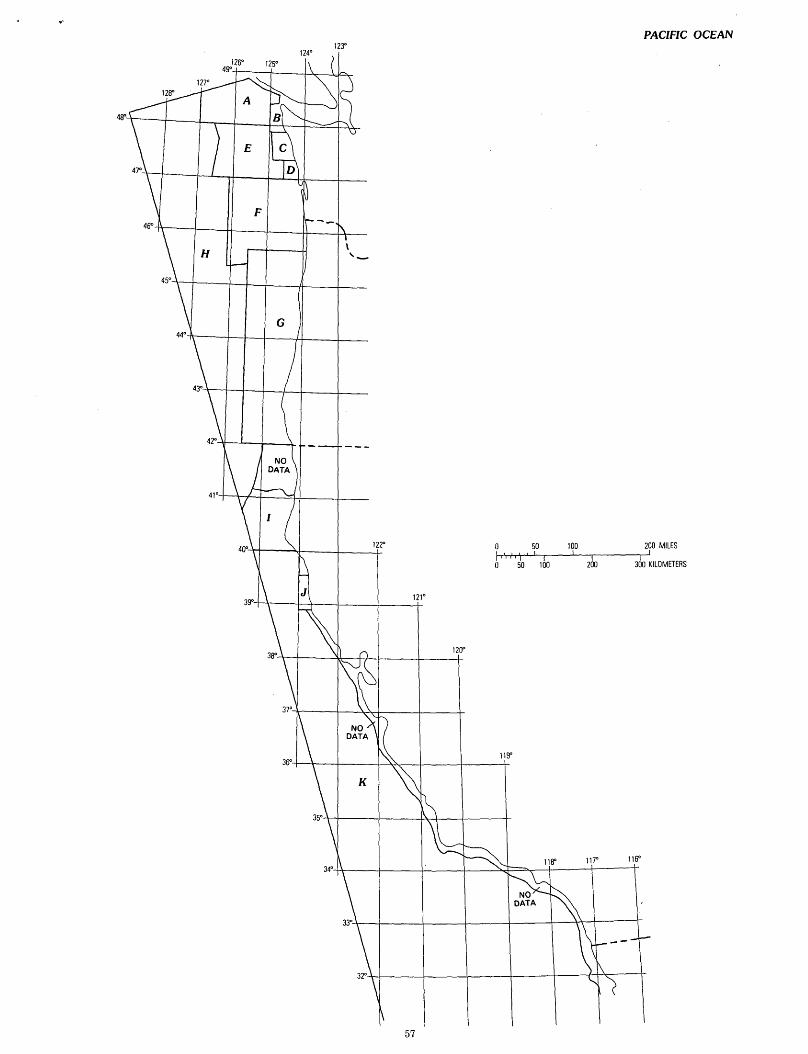
PACIFIC OCEAN 123°
124°
F
H \ ,_
G
12ZO 0 50 100 200 MILES hJ,~',+•'~''I~'~'~~----~~--~~------~~ I 0 50 100 200 300 KILOMETERS
121°
120°
119"
117" 116"
57

SPECIFICATIONS
A Unkown, sea level, 5-10 kilometers (Tiffin and Currie, 1976)
B East-West, 500 feet above sea level, 2 mile (USGS, 1980a) C East-West, 2500 feet above sea level, 2 mile (USGS, 1980c) D East-West, 2500 feet above sea level, 2 mile (USGS, 1980b) E East-West, sea level, 10 nautical miles (Couch and others,
1978) F East-West, 15,000 feet barometric, 5 mile (Zietz and others,
1971) G East-West, 500 feet above sea level, 2 mile (Lockwood,
Kessler, and Bartlett, Inc., [19687]) H East-West, sea level, 5 nautical miles (Raft and Mason,
1961) I Northeast-Southwest, 2900 meters barometric, 8 kilometers
(unpublished data) J Specifications unknown (Affleck, 1962) K East-West, sea level, 5-15 nautical miles (Theberge, 1971)
58
SOURCES OF DATA
Affleck, James, 1962 Exploration for petroleum by the magnetic method, in Nagata, Takesi, ed., Benedum earth magnetism symposium: Pittsburgh, Pennsylvania, University of Pittsburgh Press, p. 159-175.
Couch, R., Kienle, C., and Con nard, G., 1978, The continental margin of the Pacific Northwest: A summary of the geological and geophysical data: Corva11lis, Oregon, Oregon State University Report GTR 780816 to the U.S. Department of State, 1978, plate Ill.
Lockwood, Kessler, and Bartlett, Inc., (1968?), Aeromagnetic survey composite map, Oregon coast: Syosset, New York, and Pasadena, California, Lockwood, Kessler, and Bartlett, Inc., scale 1:250,000, (prepared for U.S. Geological Survey Heavy Minerals Project).
Raff, A. D., and Mason, R. G., 1961, Magnetic survey off the west coast of North America, 40° N. latitude to 52° N. latitude: Geological Society of America Bulletin, v. 72, p. 1267-1270, 1 fig., 1 pl.
Theberge, A. E., Jr., 1971, Magnetic survey off southern California and Baja California: U.S. National Ocean Survey Operational Data Report NOS DR-12, 11 p., 2 pis., 2 figs.
Tiffin, D. L., and Currie, R. G., 1976, Magnetic Anomaly map, west coast of Vancouver Island (NTS 92C, D, E; 102A, H, 1): Geological Survey of Canada Open-File Report 392, scale 1:500,000.
U.S. Geological Survey, 1980a, Aeromagnetic map of offshore northwest Washington: U.S. Geological Survey Open-File Report 80-976, scale 1:125,000.
___ 1980b, Aeromagnetic map of the central Grays Harbor County area, Washington: U.S. Geological Survey Open-File Report 80-948, scale 1:125,000.
___ 1980c, Aeromagnetic map of the north-central Washington Coast: U.S. Geological Survey Open-File Report 80-977, scale 1:125,000.
Zietz, Isidore, and others, 1971, Interpretation of an aeromagnetic strip across the northwestern United States: Geological Society of America Bulletin, v. 82, no. 12, p. 3347-3372.
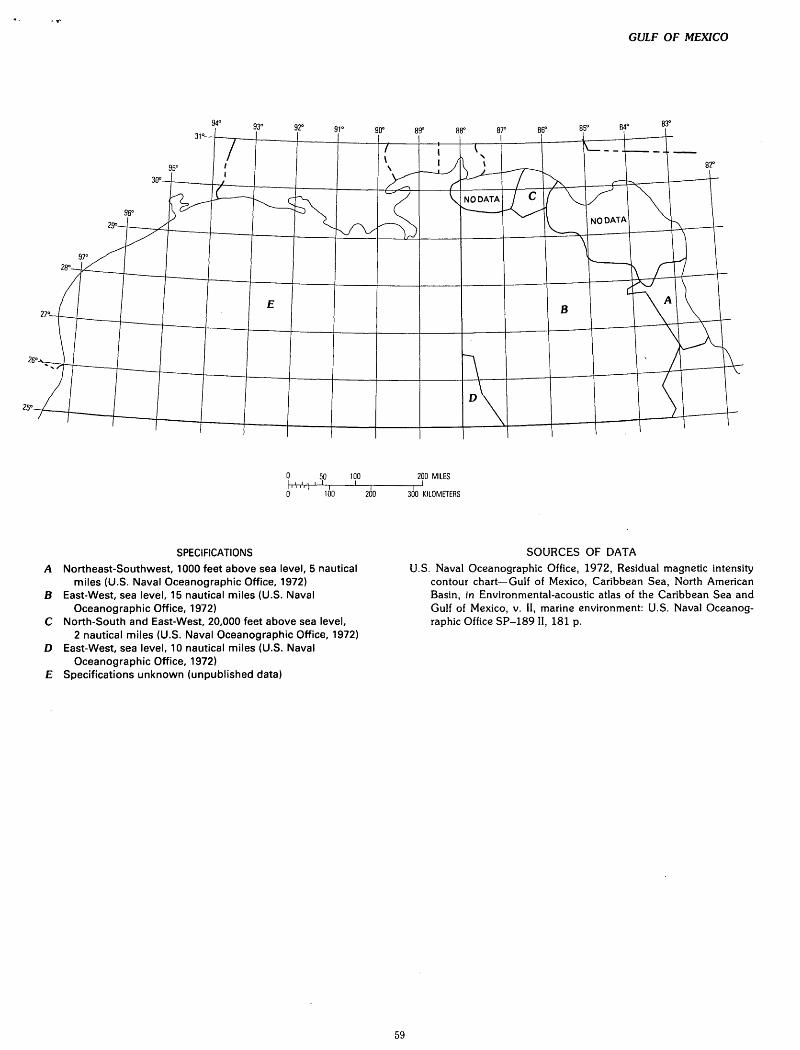
GULF OF MEXICO
0 50 100 200 MILES ~~~~'"Y','~i ~• ~I ~~---LI ~~------~~~ 0 100 200 300 KILOMETERS
SPECIFICATIONS
A Northeast-Southwest, 1000 feet above sea level, 5 nautical miles (U.S. Naval Oceanographic Office, 1972)
B East-West, sea level, 15 nautical miles (U.S. Naval Oceanographic Office, 1972)
C North-South and East-West, 20,000 feet above sea level, 2 nautical miles (U.S. Naval Oceanographic Office, 1972)
D East-West, sea level, 10 nautical miles (U.S. Naval Oceanographic Office, 1972)
E Specifications unknown (unpublished data)
59
SOURCES OF DATA
U.S. Naval Oceanographic Office, 1972, Residual magnetic intensity contour chart-Gulf of Mexico, Caribbean Sea, North American Basin, in Environmental-acoustic atlas of the Caribbean Sea and Gulf of Mexico, v. II, marine environment: U.S. Naval Oceanographic Office SP-189 II, 181 p.