Rush Springs Aquifer and Enid Isolated Terrace Aquifer Study ...

May 25, 2021
Arturo Duran
Designated Agency Manager
Environmental Management
U.S. Department of Energy
Los Alamos Field Office
P.O. Box 1663 MS M984
Los Alamos, New Mexico 87544
Re: Notice of Disapproval
MICHELLE LUJAN GRISHAM
GOVERNOR
CERTIFIED MAIL- RETURN RECEIPT REQUIRED
JAMES C. KENNEY
CABINET SECRETARY
Completion Report for Regional Aquifer Well R-70, Revision 1, and the Response to the New Mexico
Environment Department's Draft Comments on the Completion Report for Regional Aquifer Well R-70
Los Alamos National Laboratory
EPA ID#NM0890010515
HWB-LANL-19-080
Dear Arturo Duran,
The New Mexico Environment Department (NMED) received the United States Department of Energy's (DOE)
Completion Report for Regional Aquifer Well R-70, Revision 1 (Revised Report) and the Response to the New
Mexico Environment Department's Draft Comments on the Completion Report for Regional Aquifer Well R-70
(November Response). The Revised Report is dated November 2020, is referenced by EM2020-0564, and was
submitted in response to NMED's draft review comments on the original well completion report. DOE submitted
the original Completion Report for Regional Aquifer Well R-70 (Report), referenced by EM2019-0365 on
December 20, 2019.
NMED's technical review of the Report found multiple inaccuracies and misrepresentations of well hydraulics
and hydrogeological concepts and a draft comment letter (Comments) was sent via e-mail on May 7, 2020. In
this correspondence, NMED requested a post-submittal meeting (Meeting) be held before DOE provided
responses because of the severity of the technical deficiencies concerning DOE's approach to aquifer testing and
understanding of well hydraulics.
Despite several reminders, DOE never scheduled the requested Meeting before submitting their draft response
to the Comments (August Response) via email on September 3, 2020 (see Attachment 1). DOE also scheduled
the Meeting for September 8, 2020, one week after submitting the August Response. DOE's August Response
disputed most of NMED's Comments that pertained to the validity of DOE's aquifer testing methodology and
SCIENCE I INNOVATION I COLLABORATION I COMPLIANCE
Hazardous Waste Bureau - 2905 Rodeo Park Drive Bldg. 1, Santa Fe, New Mexico 87505 - (505) 476-6000 www.env.nm.gov
EMID-701439Rec'd 5/25/21

Mr. Duran Page 2
analyses. In the September 3, 2020 email, DOE requested NMED's concurrence with their August Response and,
if found acceptable, to cancel the Meeting. NMED did not concur with DO E's responses, and the Meeting was
held on September 8, 2020.
During the Meeting, NMED stated that the aquifer tests were improperly conducted by DOE and, consequently,
the results were not usable. DOE explained that they used the "early time" data because the intent is to test
only the hydraulic properties immediately around the well. NMED suggested use of "slug" testing in lieu of
pumping tests to obtain such information. NMED recommended removing the aquifer test from the Report
because hydraulic testing is not a specific requirement at every well per the Consent Order and the data was
questionable. It was mutually agreed that a revision of the Report would be submitted without the aquifer tests.
On November 24, 2020, DOE submitted the Revised Report and the November Response without the aquifer
test.
NMED completed its review the Revised Report and the November Response and noted that DOE still intends to
use information from the aquifer test in the pending Assessment Report for the Evaluation of Conditions in the Regional Aquifer Around Well R-70 (Assessment Report). Due to DO E's intent to use the R-70 aquifer test in the
Assessment Report, NMED had an independent third-party analysis on the data from the R-70 pumping tests.
NMED received these data from DOE on January 15, 2021 and asked the U.S. Environmental Protection Agency
(EPA) Kerr Environmental Research Center in Ada, Oklahoma to conduct the independent review. EPA provided
comments and recommendations on the data on April 28, 2021 that concur with NMED's comments and
recommendations.
NMED notes that the work plan was approved by NMED in April 2020, prior to completion of NMED's review of
the Report. Based on NMED's evaluation and input from EPA the inclusion of R-70 aquifer test in the Assessment
Report is not acceptable. DOE must exclude analyses from the R-70 aquifer test and any pumping not conducted
at a true constant rate from the Assessment Report (see General Comments below).
NMED notes that DOE did not resolve all of NMED's Comments in the Revised Report. These Comments are
provided below and must be resolved before NMED is able to approve the Revised Report.
General Comments: DOE's intent to use the results and conclusions from the aquifer test data presented in Appendix E of the Report
in the pending Assessment Report or any future submittal is not acceptable because NMED has not approved
this information. DO E's August Response to specific comments nos. 6, 7, 8, and 11 through 26 of NMED's
Comments remain unresolved thus the aquifer test methods, approach and results remain unacceptable. During
the Meeting, the use of the R-70 aquifer test results was found to be unacceptable because the pump was
operated at maximum capacity from the start of the pumping. This and many other technical issues lead NMED
to recommend removing the aquifer tests from the Report.
The pumping method used and defended by DOE in their August Response to NMED's specific comment no. 17
prevented the ability to regularly adjust pump backpressure that is required to maintain a true constant rate.
NMED explained to DOE during the Meeting that pump efficiency losses that result from a continually lowered
water level in the pumping well require continual adjustment to the pump backpressure to maintain an actual
constant rate. DOE's pumping method is unacceptable because it prevents the expansion of the cone of

Mr. Duran Page 3
depression, which violates the non-steady flow requirement of the applied mathematical solutions and the
ability to evaluate hydraulic pressure responses at adjacent wells. The resulting hydraulic pressure responses,
whether observed or unobserved at adjacent wells, would not reflect the water levels that would have
materialized at those adjacent wells if the pumping rates were truly kept constant in these tests. As such, the
data analyses and derived aquifer parameters from applying standard mathematical solutions are unusable and
any conclusion that pumping effects at adjacent wells from R-70 or any test conducted in the manner R-70 was
conducted will be deemed irrelevant and unacceptable for decision making purposes.
During the Meeting, NMED also conveyed to DOE that the selected time periods DOE analyzed as "early time"
data are only from the first few seconds of pumping, which are not representative of radial flow from the
aquifer (specific comment no. 15). NMED further disqualified the analyses of DOE's "early time" data because
the flow into the well during initial pumping is plagued with known physical issues that typically preclude use of
the data in the analytical solutions upon which aquifer parameters are derived. DOE's response to specific
comment 15 is not acceptable. NMED rejects DO E's position on the validity of the aquifer testing at R-70
because DOE failed to provide credible sources as requested to defend its position in their August Response to
NMED's specific comments No. 6, Nos. 12 through 15, Nos. 17 and 18, No. 20 and Nos. 23 through 26.
In their independent third-party review, EPA stated that the findings from the drawdown curves in Appendix E
were not reproducible using the provided data, and that DOE's justification for procedures used to conduct the
aquifer test are "concerning." EPA concluded that NMED's concerns regarding the data used and DOE's
reasoning behind their procedures need to be corrected prior to conducting additional tests and before using
the results of future tests in groundwater modeling efforts. EPA also questioned DOE's decision to exclude the
24-hourtest "late time data" from transmissivity estimations. In response to EPA's recommendations, NMED
requires DOE to submit a Standard Operating Procedure (SOP) that will serve as the basis for future aquifer
testing workplans. The SOP will be reviewed for comment (but not approval) by NMED and EPA and their
contractors prior to receiving a work plan to conduct the next aquifer test. Because testing duration, goals and
conditions may vary by future aquifer tests, NMED requires a specific workplan for each aquifer test. In addition,
NMED will require DOE to catalogue all model input that is based on information from similarly conducted tests
as the R-70 aquifer test. This submittal will be the basis of editing the models to be based on sound input.
Specific Comments:
1. Title Page
NMED Comment: Explain why "Monitoring" was struck from the Report title considering R-70 is intended to serve as a monitoring well. Restore the original title to the Report in a second revision.
2. Section 8.1 Well Development, page 10.
DOE Statement: Field parameter data are discussed in greater detail in Appendix 8, and aquifer test data will be discussed in the assessment report for evaluation of conditions in the regional aquifer around well R-70, which is due to NMED no later than June 30, 2021.
NMED Comment: Use of the R-70 aquifer test data in the pending Assessment Report is not acceptable. NMED and DOE agreed during the Meeting to remove this information from the Report because the testing was not conducted properly in the field nor the data analyzed correctly (see general comment above). In

Mr. Duran Page 4
NMED's August 4, 2020 email to DOE that approved a revised submittal date for the Assessment Report, NMED stated that if the R-70 aquifer testing results are to be used in the Assessment Report that the Comments must be resolved beforehand. Considering that the Comments have not been resolved and that it was mutually agreed to remove the testing from the Report, it should have been obvious to DOE that these data are also not valid for use in any other submittal. NMED requires DOE to submit another revision of the Report that does not include this statement and to not use and reference the R-70 aquifer tests in any manner in future reports.
3. Section 8.1.1 Well Development Field Parameters, page 11.
DOE Statement: In screen 2 the final parameters at the end of well development were pH of 8.13, temperature of 21.4oC, specific conductance of 290.4 µS/cm, DO of 6.76 mg/L, ORP of 198.3 mV, and turbidity of 0.72 NTU. Table 8.1-2 shows field parameters measured during well development.
-
NMED Comment: In specific comment no. 2, NMED requested clarification of the discrepancy between the final parameters listed on page 11 and in Table 8.1-2. In the August Response, DOE stated that the text on page 11 was in error and will revise the Report accordingly. However, the text remains unchanged in the November 2020 Revised Report. If the text on page 11 is in error, it should have been deleted from the Revised Report, but was not deleted in the red line version or from the Revised Report. Resolve this discrepancy and issue the correction in another revision of the Report including a separate red line version.
4. Section 8.1.1, Well Development Field Parameters, page 11/Figure 8.3-la - Installation and construction details for the R-70 sampling system, page 21.
a. Based on the most recent Well Completion Details 1•2, the following are missing and need to be included in the well completion details for R-70 (Figure 8.3-la) In a second revision of the Report:
i. Pad ii. Transducer sleeves and description iii. Borehole diameter and description iv. Pump location and description v. Check valve location vi. Pump column and description vii. Casing string shoe locations
b. Revise Figure 8.3-la for to be similar to previous regional aquifer monitoring wells mentioned above. Figure 8.3-la in the Revised Report lacks the graphical clarity and details and well completion information provided in other dual screen chromium monitoring wells (i.e., R-43 through R-45, R-50, R-61) and in the most recent monitoring well (R-69), which provide far better understanding of the well construction, completion and Baski sampler set up. NMED would like to emphasize to DOE the importance of well construction as-built diagrams as technical references in future decision making and public review. For instance, in the current
1 Newport News Nuclear BWXT-Los Alamos, LLC, October 2019, Completion Report for Regional Aquifer Well R-69, Revision 1 {EM2019-0335): Figure 8.3-la Monitoring well R-69 as-built diagram with borehole lithology and technical well completion
details. 2 Los Alamos National Laboratory, September 2011, Completion Report for Regional Aquifer Well R-61 (EP2011-0274), Figure 8.3-la Monitoring well R-61 as-built diagram with borehole lithology and technical well completion details and Figure 7 .2-1 Monitoring well R-61 as-built well construction diagram.

Mr. Duran Pages
figure, the symbols for the surface seal and the bentonite appear in the background of the well casing area obscuring necessary details. Also, the transducer tubes and pump column for R-70 need to be drafted in a manner that is well-defined and clear like those of the other well completion details.
c. Revise Figure 3.2-1 Monitoring well R-70 as-built construction diagram and technical well completion details to include well development, final parameter and well survey information like Figure 7.2-1 for R-612•
d. Correct the different pattern used for the top filter pack to be the same as the bottom filter pack, the legend and Figure 3.2-1, if both screens have the same 10/20 gradation filter pack. Likewise, correct the pattern for the transition sand to match with that shown in the legend and Figure 3.2-1.
e. Correct "Filter Rack" to read "Filter Pack" in the diagram annotations and make the descriptions in the figure on page 21 match the descriptions provided in the text on page 11. Provide better quality assurance and quality control on this and all figures submitted to NMED.
f. Label the features shown in the as-built well diagram within the lower filter pack below the "lower transducer screen" as requested. It is not clear what these features are and how they relate to the other dedicated well components. Please label these features and make the well completion details in the as-built diagram clearer and readily understandable as in the previous chromium group monitoring wells. Revise Figure 8.3-lb to include and explain these features.
g. Indicate where the lower screen transducer tube port is in the well head plan view in the pending revision of this figure.
5. Section 8.2 Aquifer Testing, page 11.
DOE Statement: Applicable R-70 aquifer test results and analysis will be included in the assessment report for evaluation of conditions in the regional aquifer around well R-70, which is due to NMED no later than June 30, 2021.
NMED Comment: NMED requires DOE to remove this and all similar statements and subsection 8.2 from the second revision of the Report. See NMED's general comment and specific comment no. 1 above.
6. Section 10.0 Acknowledgements, page 13.
DOE Statement: David C. Schafer designed, implemented, and analyzed the aquifer tests.
NMED Comment: Remove the aquifer tests acknowledgement and all references to the aquifer tests from the second revision of the Report considering NMED and EPA have judged the tests to have been improperly conducted and the results to be unsuitable for hydraulic analyses.
The second revision of the Report is due within 60 days of receipt of this letter. NMED's May 7, 2020 Comments with DOE's draft August Response is included as Attachment 1 with this letter.

Mr. Duran
Page 6
Should you have any questions regarding this correspondence, please contact Christopher Kram bis (SOS) 231-
5423.
Sincerely,
Kevin Pierard
Digitally signed by : Kevin Pierard , Date: 2021.05.25
13:30:00-06'00'
Kevin M. Pierard, Chief
Hazardous Waste Bureau
Cc with Attachment:
N. Dhawan, NMED HWB
C. Krambls, NMED HWB
M. Petersen, NMED HWB
C. Catechis, NM ED-DOE-OB
M. Hunter, NMED GWQB
S. Pullen, NMED GWQB
P. Longmire, NMED GWQB
S. Vanicak, NMED-DOE-0B
L. King, US EPA Region 6
R. Ross, US EPA Groundwater Technical Support Center
T. Burton, US EPA Region 6 STL
R. Martinez, San Ildefonso Pueblo, NM
D. Chavarria, Santa Clara Pueblo, NM
C. Rodriguez, EM-LA
H. Shen, EM-LA
D. Katzman, N3B
J. Murdock, N3B
S. Veenis, N3B
E. Day, N3B
C. Maupin, N3B
P. Maestas, N3B
W. Alexander, N3B
File: LANL 2021 and Reading, Completion Report for Regional Aquifer Well R-70, Revision 1, November
2020
HWB-LANL-19-080

Response to the New Mexico Environment Department's Draft Comments on the Completion Report for Regional Aquifer Well R-70, December 2019,
Dated May 7, 2020
INTRODUCTION
To facilitate review of this response, the New Mexico Environment Department's (NMED's) comments are included verbatim. The U.S. Department of Energy (DOE) Environmental Management Los Alamos Field Office responses follow each NMED comment.
COMMENTS
NMED Comment
1. Section 8.1, Well Development, p 10
Permittees' Statement: "During development, the pumping rate in scre~n 1 varied from 100. 7 to 129. 7 gpm. The pumping rate in screen 2 varied from 101. 7 to 115.6 gpm. The average pumping rates for screens 1 and 2 were 108. 5 and 105.4 gpm, respectively<
NMED's Comment: Please provide in Table B. _1-2 the pumping rotes recorded during development. Of specific interest to NMED is when the development was conducted under the pumping rates of 100.7 to 129. 7 gpm in screen 1 (S1) and 101.7 to 115.6 gpm in screen (S2) as described on page 10 versus the trial test rates of 46 gpm as described on page E-3, Section 1.0 of Appendix E.
DOE Response ·-·<',-
1. Pumping rates vary during th,{diff~rJnt phases of well development. The pumping rates quoted from page 10 reflect the discharge during initial flow-rate testing and step development of the two screens. Regarding the pumping discusse_d on page E:3, Section 1.0, discharge rates were lowered during the final stages of development for trial testing and to achieve more accurate turbidity readings by reflecting pump rates that wiU be _seen during sampling with the final dedicated Baski sampling
,,/"'.,~--. -~_;<"",
system and its associated pump.>,
We concur that Table 8.1.-2 needs to be revised to include pumping rates. if~\/ _-·'.,
NMED Comment \, <4:t~h. __ -4.:,~--
2. Section 8.1.1, Well Development Field Parameters, p 11 ¥c(S,\'--i:;/:?"
Permittees'Statement: "In screen 2 the final parameters at the end of well development were pH of 8.13, temperature of 21.4'C, specific conductance of 290.4 µSiem, DO of 6. 76 mg/L, ORP of 198.3 mV, and turbidity of 0. 72 NTU. Table 8. 1-2 shows field parameters measured during well development."
NMED's Comment: Explain why the final well development field parameters discussed on page 11 for S2 do not match the final parameters provided in Table 8. 1-2, Field Parameters Measured During Well Development at R-70, and explain why turbidity, which is provided in the text on page 11 is not provided in this table for both screens.
EM2020-0425 (Supplement to EM2019-0365) August 2020

DOE Response
2. The final well development field parameters listed on page 11 for Screen 2 are in error and do not reflect the final readings. As previously mentioned, Table 8.1-2 needs to be revised; turbidity readings will be added to the table during revision.
NMED Comment
3. Section 8. 1.1, Well Development Field Parameters, p 11
Permittees' Statement: "The sampling system is a Baski, lnc.-manufactured system that uses a single 5-hp, 4-in.-O.O. environmentally retrofitted Grundfos submersible pump capable of purging each screened interval discretely via pneumatically actuated access port ~alv;'s, 9ne 1- in. stainlesssteel check valve was installed within the pump shroud above the purne fudy. A ·weep valve was installed at the bottom of the uppermost pipe joint to protect the pump -column from freezing. The system includes a Vi/on-wrapped isolation packer between screened intervals. Pump riser pipes
/ . consist of threaded and coupled nonannealed (pickled), passivated1- in.-diameter stainless steel. Two 1-in.-diameter polyvinyl chloride (PVC) tubes were ins/131/~d along with, and banded to, the pump riser for dedicated transducers. The tubes are 1-in.-l. D. fl1,1sfl-threaded{;chedule 80 PVC pipe. The upper PVC transducer tube is equipped with two 5-ft sections 6f 6,ofo-in. slot screen with a threaded end-cap at the bottom of the tube. The lower PVC transducer tube'is equipped with a flexible nylon tube that extends from a threaded end- cap at the bottom of the· PVC-tube through the isolation
. . -·- . . ) packer to measure water levels m the lower screen. Two ln-S1/u Inc. -Level Troll 500 transducers were installed in the PVC tubes to monitor water-le~e/s in each screened interval.
\ \ _;· /' )
Installation and construction details for the moJ/toring,~11 R-l{}sampling system are presented in Figure 8.3-1a." \ \//
,f~----, \ (
NMED's Comment: Please)vdicµt;;iand labelin F.Jgure 8.3-1a the details of/he Baski sampling system, including the drop pipe, ch"!,bk valves, Pl!Jf'P location, the sample port locations in both screens, the location of both pressure Tfahsduqe'rs and the packer separating screen 1 from screen 2. Figure 8.3-1a does n'ot i;tibv-: of)alierthese dfitails, which NMED believes are important to the as-built
diagram for regional well R.(~~ -- "' < ~
DOE Response \ •· .. ) / \
3. We concur that the instal)ed depths of the various Baski system components should be added to Figure.8.3-1a; the figufe
7will be revised accordingly. " .· ',, ·,,. _: j
NMED C~mQ1:/nt_ / •/ < ·, ,, /' . /
4. Table 8.1-2,'Field Parameters Measured During Well Development at R-70, p 29 NMED's Comments:
a) Explain how the development field parameters from S2 were measured on May 20 th between 3:00 PM (15:00) and 4:00 PM (16:00) when the pump was supposedly off for recovery as described on page E-3 of Appendix E. Likewise, explain how the development field parameters shown in Table 8. 1-2 from S1 were measured on May 20th between 10:30 PM (22:30) and 11:30 PM (23:30) when the pump was off for recovery as described in page E-3. Based on page E-3, both periods correspond to the start of the trial tests. The same issue is noted in Table B-2.2-1, Field Parameters Monitored during Aquifer Testing.
EM2020-0425 /Supplement to EM2019-0365) 2 August 2020

b) Explain the cause for the significant and sudden increase in the specific conductance on May 20th between 1:13 PM (13:13) and 1:48 PM (13:48) for S2 and the decline in temperature during development of S2 on May 20th between 5:31 PM (17:31) and 8:37 PM (20:37). A similar pattern for the specific conductance is also noted in Table 8-2.2-1, Field Parameters Monitored during Aquifer Testing.
c) Explain why well development field parameters are provided for S1 about one-half hour (at 07:28:01) prior to starting the 24-hour pumping test on May 23rd at 08:01 (page E-3). Discuss if well development continued right up to the start of the 24-hour pumping test. Discuss if the water table was at static prior to the start of the 24-hour pumping test for S 1. If S 1 was not being pumped at the time of the field parameters were measured, explain how they were measured.
d) Explain why the field parameters measured on 05/21/2019 2:03:07, which appear to correspond to well development time, are not reported in Table 8.1-2 but are in Table 8-2.2-1, Field Parameters Monitored during Aquifer Testing on page 8-5.
DOE Response
4.a. Discrepancies between the tables and narratives are noted and need to be resolved. As previously noted, Table 8.1-2 will be revised. Table B-2.2-1 will also be revised as needed.
4.b. The abnormal specific conductivity and temperature readings noted in Table 8.1-2 are clearly erroneous and most likely caused by lack of groundwater moving through the flow-through cell of the meter used to collect parameters. This will be noted in the revised table. Table B-2.2-1 contains incorrect data as described in Comment 4b and as responded to below.
< ~< , •• -.J·v . 4.c. Table B-2.2-1 contains data collected fromwEilLdevelopment, which should not be included with
aquifer testing data, and also has erroneous tfn,~/data sets. The table will be revised. Well development did not continue to the start of aquifer testing; the water table was static when testing began. These points,will be clarified in the revi~ed text.
4.d. See response to Comment 4c above.
NMED Comment .
5. Appendix0
B, Table0
~-2.2-1, Field Parameters Monitored during Aquifer Testing, p B-4 through B 6 -~-;J ~,.;J~ - ,, Y/:~-
Y:'i?i a) Please indicate from which screen the data are from in this table or provide separate tables for each sc;reen. i!f b) Explain why;~:~ield parameters are provided for the R-70 S2 24-hour pumping test conducted on May 26th bu/are provided for R-70 S1 24-hourtest.
DOE Response
5. Table B-2.2-1 contains multiple errors and will be revised, and comments 5.a and 5.b will be fully addressed in the revised table.
EM2020-0425 (Supplement to EM2019-0365) 3 August 2020
NMED Comment
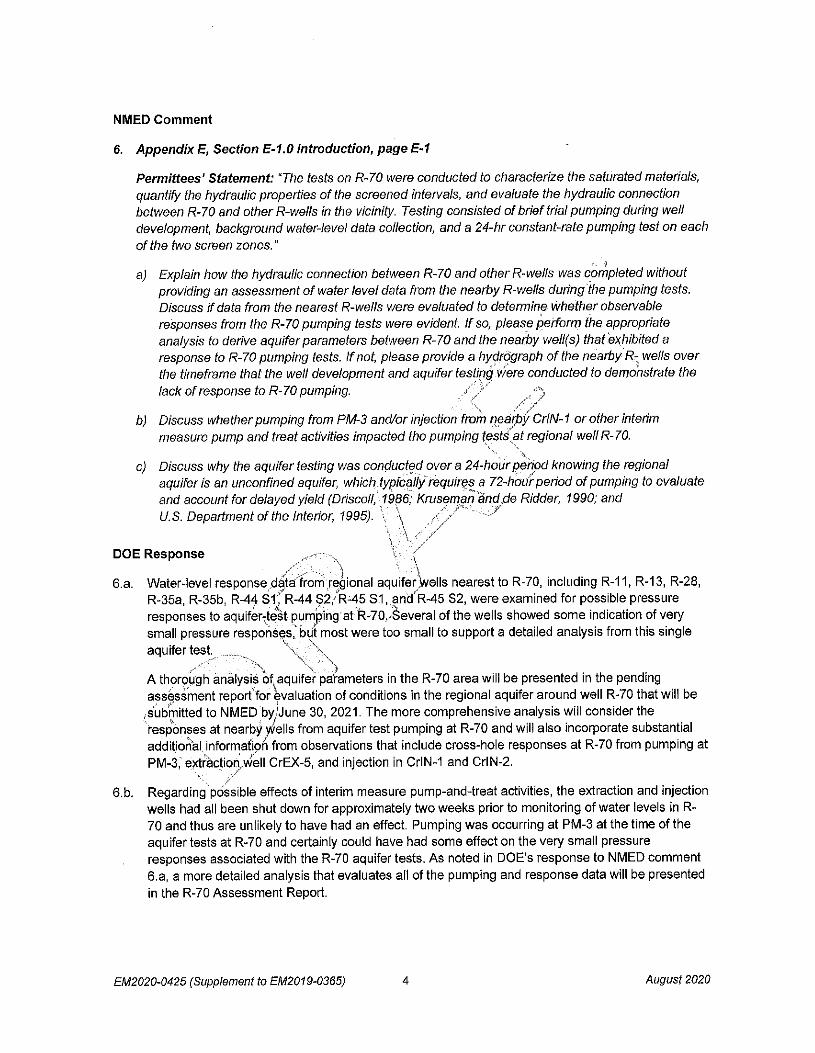
6. Appendix E, Section E-1.0 Introduction, page E-1
Permittees' Statement: "The tests on R-70 were conducted to characterize the saturated materials, quantify the hydraulic properties of the screened intervals, and evaluate the hydraulic connection between R-70 and other R-wells in the vicinity. Testing consisted of brief trial pumping during well development, background water-level data collection, and a 24-hr constant-rate pumping test on each
of the two screen zones."
' ' a) Explain how the hydraulic connection between R-70 and other R-wells was completed without providing an assessment of water level data from the nearby R-welfs during the pumping tests. Discuss if data from the nearest R-wells were evaluated to determine whether observable responses from the R-70 pumping tests were evident. If so, please perform the appropriate analysis to derive aquifer parameters between R-70 and the nearby well(s) that ex_hibited a response to R-70 pumping tests. If not, please provide a hyc/rdgraph of the nearby°R~ wells over the timeframe that the well development and aquifer testing were conducted to demonstrate the
,' '/ lack of response to R-70 pumping. .• / S:¾
,> ) ,, / / ' . . b) Discuss whether pumping from PM-3 and/or injection from f!earby CrlN-1 or other interim
/ measure pump and treat activities impacted the pumping t,estS.at regional well R-70.
', ' ' 'I-.,
c) Discuss why the aquifer testing was conducted over a 24-hour period knowing the regional aquifer is an unconfined aquifer, which tyP,ici,iir require~ a 72-houf period of pumping to evaluate and account for delayed yield (Driscoll, 19{36; Krusemi;m and.de Ridder, 1990; and U.S. Department of the Interior, 1995). · \ //' · .,,/
\ / /,, \,1 /
DOE Response ~/~
/,, . . .., \
6.a. ,/ /'"',' \ ' \
Water-level response .dat,:(from regional aquiferl,vells nearest to R-70, including R-11, R-13, R-28, R-35a, R-35b, R-44 S1'.R-44 S2/R-45 S1, and'R-45 S2, were examined for possible pressure responses to aquifer-.te'st ~umj,ing at·R-70,,Several of the wells showed some indication of very small pressure responses, but most were too small to support a detailed analysis from this single
' ,, aquifer !~st_ _ ,, • ...... \
A thorough analysis of aquifer parameters in the R-70 area will be presented in the pending assilssment report'for ~valuation of conditions in the regional aquifer around well R-70 that will be
,s·ub'~itted to NMED by}June 30, 2021. The more comprehensive analysis will consider the responses at nearby y./ells from aquifer test pumping at R-70 and will also incorporate substantial additiorial informafioh from observations that include cross-hole responses at R-70 from pumping at
~ ; y
PM-3,' extractionJNell CrEX-5, and injection in CrlN-1 and CrlN-2.
6.b. Regardingpci~sible effects of interim measure pump-and-treat activities, the extraction and injection wells had all been shut down for approximately two weeks prior to monitoring of water levels in R-70 and thus are unlikely to have had an effect. Pumping was occurring at PM-3 at the time of the aquifer tests at R-70 and certainly could have had some effect on the very small pressure responses associated with the R-70 aquifer tests. As noted in DOE's response to NMED comment 6.a, a more detailed analysis that evaluates all of the pumping and response data will be presented
in the R-70 Assessment Report.
EM2020-0425 (Supplement to EM2019-0365) 4 August 2020

6.c. Selection of pumping test duration takes into account the data needs, costs (including waste management), and potential benefits of extended pumping and recovery time. Various test durations have historically been used at LANL, all with good results and success in assessing the aquifer properties of interest. We believe that the 24-hour aquifer test for a transmissive aquifer such as that in the R-70 area is suitable for obtaining the objective aquifer parameters.
Tests of the R-wells over the years have shown mixed confined and unconfined responses. In other words, some zones exhibit confined response and some exhibit unconfined response. II is not always possible to know in advance which will be the case.
Extended pumping lime, especially in unconfined settings, tends to be most useful in instances where either (1) there are nearby observation wells that allow significant, analyzable drawdown to be induced by extended pumping; or (2) the aquifer is not extremely thick, so that the cone of depression cannot continue to grow without limit to great depths. In typical R-well tests at LANL, there have been few, if any, wells close enough to be used as viable observation wells. Furthermore, the aquifer beneath the Laboratory is up to several thousand feet thick. Because of this, pumping the R-wells commonly results in steady growth of the cone of depression to great depths, which flattens the drawdown or recovery curve throughout the entire test, regardless of pumping duration. In such cases, the late pumping data are not particularly useful. (For example, see the late recovery data from the R-70 test, which show generally flat, uninteresting plots.)
NMED Comment
7. Appendix E, Section E-1.0 Introduction, page E:1
Permittees' Statement: ''The filter pack at screen· 1 extended above the screen and intersected the water table 15 ft above the top of the screen. This meant that filter pack drainage and refilling would occur during pumping and recovery at screen 1, creating the possibility of a storage effect on the test data."
NMED Comment: Pro~ide pub;i~:ti:n(s) that support this statement. NMED is aware how filter packs can affect the falling head "slug" test analyses when the water table intersects the well screen but is not familiar with this situation having the same impact on drawdown and recovery data from pumping tests. ·
DOE Response
7. This is covered in the discussion of wellbore storage in Groundwater and Wells, Third Edition (Robert J. Sterrett, -2007). [This is a revision of the Driscoll reference cited by NMED.] Some explanation isyvarranted here.
The significance of filter pack drainage is a function of its permeability. At the low end of the spectrum where, say, the filter pack permeability is less than or equal to that of the aquifer, there would be no storage effect.
However, if the filter pack permeability were great, it would drain rapidly when the well was pumped as the water level in the pack kept pace with the declining pumping water level in the well. In this instance, the water volume stored in the filter-packed annulus plays the same role as water standing in the casing in a conventional pumping test (with no packer) and causes a storage effect. An easier
EM2020-0425 (Supplement to EM2019-0365) 5 August 2020

way to visualize this would be to picture no filter pack in the annulus. If this were the case, the water standing in the open annulus, like standing water in a well casing with no packer, would drain immediately when pumping began and would give the classic casing storage response. Placing the filter pack in the annulus takes up space, thereby reducing the stored water volume, but it does not eliminate the storage response. If the permeability of the filter pack were great enough, water drainage could occur just as rapidly and cause a storage effect.
NMED Comment
8. Appendix E, Section E-1.0 Introduction, page E-1
Permittees' Statement: "R-70 was drilled at an angle of 25 degrees off vertical and in a direction 20. 3 degrees east of north."
NMED Comment: Describe how the well angle affects the analysis of the pumping test data. Discuss if an evaluation was conducted to assess if the angled screen may have had any effe_cts on the drawdown analysis as discussed by Zhan and Zlotnik (2002). ✓-
DOE Response
8. The following statement is proposed to be added to Section Eca,2 In a revised report:
"The Neuman analysis that was applied to the pumping test was based on vertical wells. To apply it to the slanted screens, the simulated screens in the Neuman calculations were assumed 1) to be vertical, 2) to span the same vertical extent as· the actual, screens; and 3) to be located such that their midpoints were at the same locations as the mldpoints bf the actual screens. This substitution can be made with negligible error in the calculated resu'ltsjf
,,,- -·-~,._ (
The Neuman method was us;d inst~ad of Zhan ahd Zlotnik because it is readily available in commercial aquifer test analysis ~ofuvare. The author used Aqtesolv (from HydroSOLVE, Inc.) for the Neuman calculations. Aqtesolv, first released i_n 1989, is probably the most widely used aquifer test software in the industry. The o,yner"of HydroSOLVE, Inc., has reported that the company does not incorporate the Zhan and Zlotnlk solution in Aqtesolv due to lack of demand.
Another poptii~i ~q'oifer test so~~re program is Aquifer Test from Waterloo Hydrogeologic, Inc. Waterloo Hydrogeologic also reports that it does not support the Zhan and Zlotnik method for unconfi;ed aquifers. ·
J NMED Co~ment ''/
• • 9. Appendix E, ·seq116n E-1.0 Introduction, p E-1 and E-2
. /
Permittees' Statement: "During the inflation and deflations of the downhole packers, attempts were made to determine the relative changes in water levels at each screen in order to discern the individual static water levels of the two screen zones and the difference in water levels between the zones. An accurate determination of the zone-specific water levels was made difficult by several
factors:
• The difference in water levels between the two screen zones was very small.
EM2020-0425 /Supplement to EM2019-0365) 6 August 2020

• The transducer output was abnormally "noisy" with data scatter often approaching a magnitude of 0. 10 ft.
• A persistent leak through a defective coupling connection in the bottom joint of the 2- in. droppipe string continuously allowed drainage of drop-pipe water into the well, altering water levels slightly.
• Any time that packers are inflated or deflated, there is a substantial change in the tension to which the drop pipe is subjected. As a result, there can be slight physical movement of portions of the pipe string, which cause slight vertical movement of the attached transducers.
The combination of data scatter, drop-pipe leak, and changing tension in the drop pipe contributed to obscuring accurate data measurement. Three episodes of packer inflation/deflation produced inconsistent and contradictory measurements.
Nevertheless, the results suggested a slight upward gradient from screen 2 to screen 1 under ambient conditions. Measurements showed the screen 1 water level to be approximately 0. 01 ft below the composite water level and the screen 2 water level to be approximately 0. 05 ft above the composite level. Thus, the overall difference in the water levels was estimated to be 0. 06 ft."
NMED Comment: Based on the issues, specifically the "inconsistent and contradictory measurements", and the very small head differences between R-70 S1 and S2 described by DOE, NMED believes the cross-flow calculation is.speculative and not defensible. The 25° screen angle places the two screens in R-70 not only 40 feet apart vertically, but also about 18 feet apart horizontally. Consequently, the slight head difference conceivably can also be attributed to the horizontal hydraulic gradient between the two screens. Additionally, R-70 would have to be near an area of discharge for an upward hydraulic gradient to be present. Please explain to where the groundwater discharges if there is an upward gradient. NMED is not convinced that a slight upward vertical hydraulic gradient is present in R-70 as postulated by DOE. DOE should either remove the calculation from the Report or provide a convin8in9 justification to retain it.
DOE Response
9. A subtle vertical gradient, such as that preliminarily estimated in the report, can be caused by aquifer heterogeneity,_ stratification, bed orientation, or other factors such as water-supply well pumping cycles and is therefore not dependent on nearby discharge points ..
Our calculations for the_ screens' spatial locations indicate the effective horizontal hydraulic separation between screens 1 and 2 to be 31. 7 ft rather than 18 ft. This is the horizontal distance between the
, >N- -- 0
centers __ ofJtle two -~qeens. Screens respond hydraulically as if they were located at their centers. Multiplying t_hi~dimension by the sine of 20.3 degrees puts the center of screen 2 approximately 11 ft in the downgra_dient direction from the center of screen 1, assuming an easterly flow gradient. Based on an estimated horizontal gradient of about 0.001 in this extraordinarily transmissive portion of the aquifer, it is expected that horizontal displacement accounts for about 0.01 ft of the head difference between screens 1 and 2 (in a direction from screen 1 to screen 2).
Additional data from a longer period of water level measurements obtained from dedicated transducers in R-70, and the ability to relate the long-term record to other Interim Measure activities and pumping from water-supply wells, will provide a more complete data set for determining gradients between the screened intervals in R-70.
EM2020-0425 (Supplement to EM2019-0365) 7 August 2020

This analysis will be conducted and integrated into the overall evaluation in the Assessment Report for the evaluation of conditions in the regional aquifer around well R-70, which is scheduled for submittal to NMED by June 30, 2021.
To address NMED's comment, it is proposed that language be added to the report that notes that because of the uncertainty and inconsistency in the relative head measurements between screens 1 and 2, the evaluation of transient gradients will be refined when a longer-term record of head data is available.
NMED Comment
10. Appendix E, Section E-1.0 Introduction, p E-2
Permittees' Statement: 'Well R-70 was tested from May 20 to 28, 2019. Brief trial testing was performed from May 20 to 21 as part of the well development operation."
7 " / ,/''i
NMED Comment: The brief trial testing is stated to have been performed as part of the well development operation. Additionally, the note in Figure E-8._2'.111tatelthat "possible ongoing well development" may have been occurring during the 24-hour'pumping test for R-70 S1 .
. ¾
Explain when exactly well development took place and at what rates. /(either situation is true, the results of the test analyses may be invalid. · -. J
DOE Response / / /
/
10. The trial testing was indeed partof the testing effor( not the development effort, which had already been completed. It was, howfer, pe_rformed immediately following the development work using the same equipment setup that had been used for the development. Only later, after the trial testing was completed, was the equipment string changed over and modified for the 24-hr tests. Because of this sequence of events, the trial test execution in the field felt more like part of the development operation than the testing operation. · · ( ·
'·\,, ·- .,~
To address potential confusion, it is proposed that the revision to this report include language as follows:· :, sz• .,- "- 7
/
• / From 'Brief trial testing was performed from May 20 to 21 as part of the well development . ...,,"'1operation." ' /
. I ,.,,iii, £. ../
• · !1"'?.J3!ief_t~~I testing was performed from May 20 to 21 using the equipment setup that had been used as part of the well development operation."
,-,--- )F
Regarding the apparent change in well efficiency observed during the 24-hr test of screen 1, this phenomenon occurs commonly during aquifer tests. A change in efficiency, either positive or negative, can be attributed to such factors as (1) production of sand/solids during the test; (2) movement or settlement of filter pack material or formation material; or (3) either accumulation or expulsion of trapped gas/air from the formation voids near the well.
Many of the aquifer tests at LANL have shown significant observed gas content in the pumped water, either naturally occurring or possibly an artifact of drilling with compressed air. If air that has previously accumulated near the wellbore is released, the permeability of the nearby sediments will
EM2020-0425 (Supplement to EM2019-0365) 8 August 2020
increase, resulting in a reduction in drawdown. The opposite can occur as well, as in the screen 2 test, where it appears that air may have accumulated near the well during the pumping test, slightly reducing the efficiency. These phenomena do not invalidate the test results. They do however indicate that the portion of the drawdown graph from the pumped well affected by the efficiency change cannot be analyzed. In both the screen 1 and 2 tests, the affected data consisted of late data that would have shown flat, unusable slopes. Such random efficiency changes have no effect on the recovery data or observation-well data (screen 1 data collected during the screen 2 test, and vice versa).
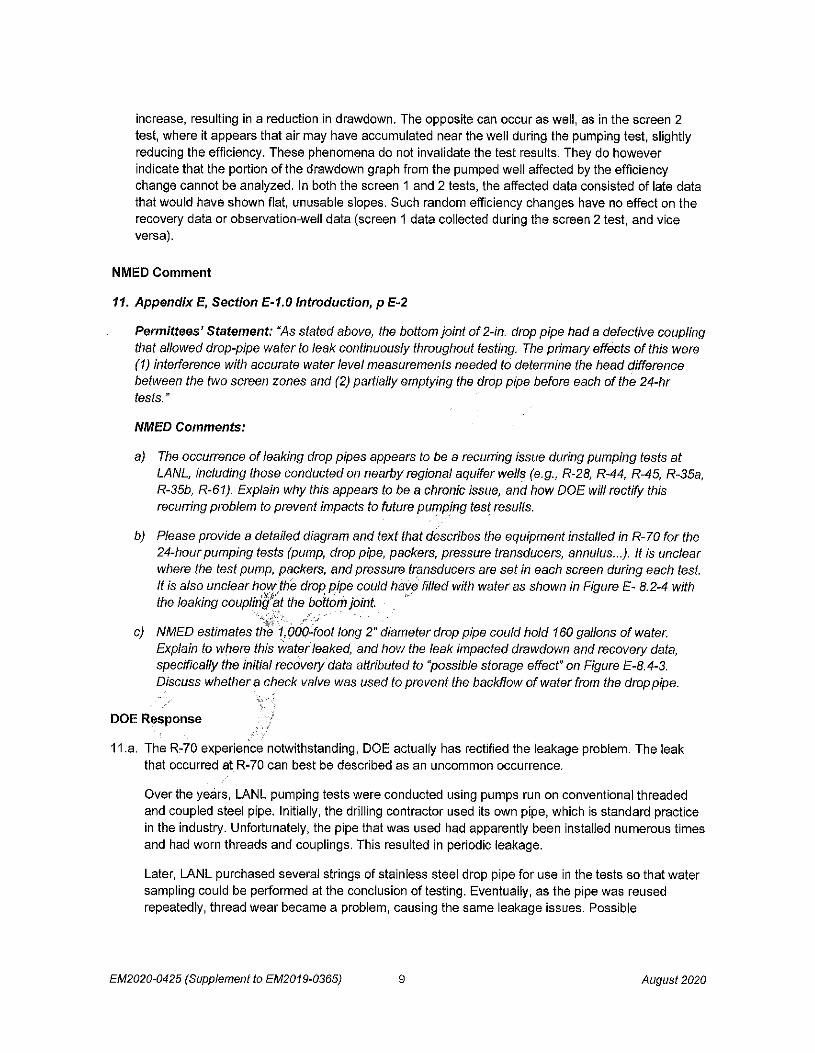
NMED Comment
11. Appendix E, Section E-1.0 Introduction, p E-2
Permittees' Statement: "As stated above, the bottom joint of 2-in. drop pipe had a defective coupling that allowed drop-pipe water to leak continuously throughout testing. The primary effects of this were (1) interference with accurate water level measurements needed to determine the head difference between the two screen zones and (2) partially emptying the drop pipe before each of the 24-hr tests."
NMED Comments:
a) The occurrence of leaking drop pipes appears to be a recurring issue during pumping tests at LANL, including those conducted on nearby regional aquifer wells (e.g., R-28, R-44, R-45, R-35a, R-35b, R-61). Explain why this appears to be a chronic issue, and how DOE will rectify this recurring problem to prevent impacts to future puf!lping test results.
b) Please provide a detailed diagram and text that describes the equipment installed in R-70 for the 24-hour pumping tests (pump, drop pipe, packers, pressure transducers, annulus .. .). It is unclear where the test pump, packers, and pressure transducers are set in each screen during each test. If is also unclear how the drop pipe could have filled with water as shown in Figure E- 8.2-4 with the leaking couplirig~t the bottom joint. "
. '''"'i{:·--~- _ _.J_.; / . . . ' c) NMED estimates the 1,000-foot long 2" diameter drop pipe could hold 160 gallons of water.
Explain to where this water leaked, and how the leak impacted drawdown and recovery data, specifically the initial recovery data attributed to "possible storage effect" on Figure E-8.4-3. Discuss whether a check valve was used to prevent the backflow of water from the drop pipe.
DOE Response
11.a. The R-70 experience notwithstanding, DOE actually has rectified the leakage problem. The leak that occurred at R-70 can best be described as an uncommon occurrence.
Over the years, LANL pumping tests were conducted using pumps run on conventional threaded and coupled steel pipe. Initially, the drilling contractor used its own pipe, which is standard practice in the industry. Unfortunately, the pipe that was used had apparently been installed numerous times and had worn threads and couplings. This resulted in periodic leakage.
Later, LANL purchased several strings of stainless steel drop pipe for use in the tests so that water sampling could be performed at the conclusion of testing. Eventually, as the pipe was reused repeatedly, thread wear became a problem, causing the same leakage issues. Possible
EM2020-0425 (Supplement to EM2019-0365) 9 August 2020

contributing factors include galling of the stainless steel threads, which may have accentuated wear, or the fact that threaded fittings often are not machined to proper industry standards.
Approximately 2 years ago, LANL purchased a supply of stainless-steel JSL pipe to replace the threaded material. Instead of threaded connections, JSL pipe uses a slip-in, spline-lock design fitted with O rings, which provides a connection that has been pressure-tested to thousands of psi without
leaking.
Since LANL procured the JSL pipe, numerous pumping tests involving some 40,000 feet of drop pipe trip length have been conducted. In all of this use, the O-ring fittings have never leaked, including at R-70.
Prior to the R-70 pumping test, the driller purchased an additional string of JSL pipe. Unfortunately, one of the pipe ends was defective. There was a pinhole leak where one of the stainless steel grooved O-ring fittings was welded onto the end of the 2-inch pipe. Apparently, the welder at the factory did not complete the entire circumferential welding pass when attaching the fitting to the pipe body, or completed the pass improperly so that the weld Jooked fine but hid the small pinhole. This is an extremely rare occurrence not likely to be repeatea. Note that the leak was through the steel body, not through the O-ring seal end connection. The defective pipe joint was culled from the working string and will not be reused. /
\.', 11.b. The test string setup was straightforward, consisting of 2 packers r2ughly 60 ft apart with a pump
between them. Three transducers were d_eployed to monitor the thr~e distinct zones created when
the packers were inflated:
1. Upper transducer Gust above the upper'packer)J · c: _".} L~.Y
2. Middle transducer (between the packers, ju?t above the lower packer)
3. Lower transducer Gust beneath the lower packer) ✓- % '! ~-- \
' A drawing of this setup was not included but can be provided if this explanation does not sufficiently address NMED's comment.. . . -
a,:;- ,,/""
When screen 2 was strad_gjedjpumped), the upper transducer monitored screen 1 while the middle transduc~Lmonitored screen .1: ~hen screen 1 was straddled, the middle transducer monitored screen 1 while the lower transducer monitored screen 2.
7 ' . A ... ./
Regarding Figure E-8.2-4, it shows water levels in the 8-inch well casing, i.e., the annulus outside "th~ __ 2:inch drop pipejot inside the drop pipe. As indicated on the figure, the upper transducer was initi~~everal fe~t _l:Jeneath the static water level. The measured head remained at that level, as slow d[,<!inage ff£~ the drop pipe was free to flow into the aquifer. As soon as the packers were inflated, t~~--~i:iter level began to rise in the annulus above the upper packer, which sealed it off from the screen zones.
11.c. The pinhole leak in the drop pipe occurred approximately 3 feet above the upper packer. The leakage rate was approximately 0.11 gpm during testing. The effects of the leakage on the two pumping tests were negligible, as follows:
• Screen 1 Test - The 0.11 gpm leakage did not go through the flow meter, and the discharge rate was therefore underreported by 0.11 gpm (negligible: just over 0.1 %). There was no effect on the drawdown or recovery data because the leaked water was contained in the
annulus above the upper packer.
EM2020-0425 (Supplement to EM2019-0365) 10 August2020

• Screen 2 Test-As with the screen 1 test, the discharge rate was underreported by 0.11 gpm (again, negligible). In addition, the 0.11 gpm leakage flowed steadily into screen 1 throughout the screen 2 test, artificially raising the screen 1 water level by 0.008 ft (also negligible).
The possible storage effect shown on Figure E-8.2-3 was unrelated to the pinhole leak in the drop pipe. It was most likely attributable to the accumulation and presence of air or gas bubbles around the borehole, which also would explain and be consistent with the increase in the drawdown slope on Figure E-8.2-2 and the contradictory recovery trends shown on Figure E-8.4-5.
There was a check valve in the pumping string, located just above the pump.
NMED Comment
12. Appendix E, Section E-1.0 Introduction, p E-3
Permittees' Statement: "The empty drop pipe meant that when the 24-hr tests were started, the pump operated against reduced head and therefore produced a greater discharge rate initially (for a minute or two). As the drop pipe filled, the flow rate gradually declined to the steady-state rate. This had the effect of skewing the early drawdown data and complicating the analysis."
NMED Comments:
a) It is unclear how an empty drop pipe would be the reason the pump would initially discharge at a higher rate as postulated by DOE on page E-12 to be 160 gpm. The physical limits of the pump are illustrated by its performance curve. Performance curves show the maximum capacity of a pump is when the water level in the aquifer is zero i.e. al land surface. Consequently, the greatest pumping rate occurs at the start of pumping when the water table is closest to the surface. Please provide the pump curve and specifications of the pump used for the 24-hour tests (not the dedicated or developmentpump).
b) The leaking pipe, the gradually decreasing initial pumping rates, and various other uncontrollable variables that occur once pumping commences (i.e. well losses), render results obtained from the analysis of the initial data from the two 24-hour pumping tests as invalid. If aquifer parameters of the formation immediately around the well screens are desired, slug testing may be a more suitable method to obtain this information.
DOE Response
12.a. A graph of performance curves from the Grundfos product guide is being supplied separately in this response. The graph includes the bowl assembly used at R-70-Grundfos Model 85S300-26. As indicated on the plot, the pumping rates shown are truncated at 118 gpm. According to the graph, at this discharge rate the selected pump produces 620 ft of pressure head.
The pressure head that the pump operates against is essentially the difference between the head at the discharge side of the pump and the head at the intake. If the drop pipe is empty down to the static water level when pumping begins, the heads at the intake and discharge are equal, so the pumping head is near zero initially. This accounts for the greater assumed initial flow rate. After pumping begins, as the drop pipe fills, the head that the pump operates against increases gradually and steadily from zero to the sum of the eventual lift distance from the pumping water level to the discharge elevation (approximately 10 ft above land surface) plus friction loss. At R-70, the maximum pumping head was approximately 1000 ft.
EM2020-0425 {Supplement to EM2019-0365) 11 August 2020

12.b. DOE believe the pumping test approach is applicable and provides sufficiently accurate test data Slug testing is not conducted at LANL because slug tests often underestimate hydraulic conductivity by up to 1 or 2 orders of magnitude. In light of this, they would not likely provide any useful information on the aquifer properties at R-70.
(Osborne 1993) states the following:
"It should be emphasized that slug tests provide very limited information on the hydraulic properties of the aquifer and often produce estimates which are only accurate within an order of magnitude."
and
" .. . slug tests often produce results which are as much as an order of magnitude low."
NMED Comment
13. Appendix E, Section E-2.0 Background Data; p E-4
Permittees' Statement: "The corrected barometric pressure data reflecting pressure conditions at the water table were compared with the water-level hydrograph to.discern the correlation between the two and to determine whether water-level corrections were needea before data analysis."
NMED Comment: Explain whether water-level°'cforrectio{ls were needdd before data analysis. Such a discussion is not provided in this section. Howe·ver, the firs/observation in Section E-9.0 on page E-16 suggests that such an analysis was conducted. Please provide the comparison of barometric pressure and R-70 water levels. Provide, ·;rr ~n electronic format, the raw barometric data, the corrected barometric data, the pressure tran'sf/uGer data, and the barometrically-compensated data, if the latter was performec(' \
-,/ \ DOE Response /
·;, •'
13. It was assumed as a given that (he lack oi' hydrograph response to barometric pressure changes meant that barometric corrections were not needed. This will be stated in the revised report by adding the following sentence at the ·end of paragraph 4 in Section 7.0:
.. ~_-,_/ "'\ "Bec_i:i_~se of the lack ~!£!irrelation between the hydrograph and barometric pressure, no corrections were made to the test data."
, ~--··w •--- _/
The first observation in Section 9.0 is consistent with this. . 7
The reques\ed data files will be provided separately.
NMED Comment
14. Appendix E, Section E-2.0 Background Data, p E-5
Permittees' Statement: "I/I/hen pumping or recovery first begins, the vertical extent of the cone of depression is limited to approximately the well screen length, the filter pack length, or the aquifer thickness in relatively thin permeable strata. For many pumping tests on the Plateau, the early pumping period is the only lime the effective height of the cone of depression is known with certainty because soon after startup, the cone of depression expands vertically through permeable materials
EM2020-0425 (Supplement to EM2019-0365) 12 August 2020

above and/or below the screened interval. Thus, the early data often offer the best opportunity to obtain hydraulic conductivity information because conductivity would equal the earliest-time transmissivity divided by the well screen length."
NMED Comments: Provide peer-review publications and research that support each of the technical issues in the statement, specifically:
a) Explain what is meant by the "vertical extent of the cone of depression" and "the effective height of the cone of depression". Explain how these concepts differ from aquifer drawdown as described by many of the references provided below. Please provide supporting publications that explain the difference. If they are the same the conventional term "drawdown" should be used.
b) Explain how the "vertical extent of the cone of depression" is limited to the well screen or filler pack length, knowing that the cone of depression occurs and expands laterally and vertically from along the water table regardless of the position of the well screen as shown by Driscoll (1986), Kruseman and de Ridder (1990), Lohman (1972), and described by Theis (1940) among many others. Provide supporting publications that explains how "the vertical extent of the cone of depression is limited to the well screen". NMED sees this to be true only when the water table is intercepted by the well screen. However, in the case of R-70, which has two fully submerged screens, this statement is confusing.
c) Explain how the cone of depression can expand vertically below the well screen. Provide supporting publications to support this statement and explain how this is possible.
d) Provide the reference(s) that support that "the early data often offer the best opportunity to obtain hydraulic conductivity information because conductivity would equal the earliest-time transmissivity divided by the well screen length.'. See comment 15a) if formation hydraulic properties along the screened interval ar~ ,desired.
DOE Response
14. The best sources of information regarding the effects of partial penetration in relation to cone of depression are the Hantush papers listed in the References section of the R-70 report.
14.a. The cone of i:lepression refers to the drawdown created by pumping, including the area (or volume) of influence. In the contexts of the report, it can be thought of as the "zone of drawdown" or "zone of pressure reduction.". This includes the three-dimensional physical portion of the aquifer where
. drawdown occurs.
The USGS identifies two different definitions of cone of depression. The first is "a depression of the potentiometric surface in the shape of an inverted cone that develops around a well which is being pumped." ·n1is definition is flawed and simplistic, in that it likens the drawdown pattern to a simple two-dimensional surface (cone). This implies that the drawdown is constant with depth. Indeed, most text references show diagrams of cones that imply the same thing-that at any given geographic location around the well, a single drawdown value describes the head at all vertical horizons at that particular location.
However, that is never the case; there is always some variation in head with depth in real wells. Note that "cone of depression" does not refer just to the phreatic surface around a well in an unconfined aquifer. In unconfined aquifers, that definition would ignore the drawdown everywhere
EM2020-0425 (Supplement to EM2019-0365) 13 August 2020

else in the three-dimensional zone affected by pumping; in confined aquifers, it would not be
applicable at all.
The second USGS definition is "the depression of heads around a pumping well caused by withdrawal of water." This is a little more general in that 1) it includes all areas of the aquifer affected by pumping and all drawdown values; 2) it doesn't imply the oversimplification of a twodimensional cone; and 3) it addresses more than just the phreatic surface or uppermost portion of the aquifer. Despite the name, the concept of a "cone" actually no longer applies. The "depression of heads" in real wells, particularly partially penetrating wells, is a complex three-dimensional field of drawdown values that can't be described by a two-dimensional surface. In unconfined aquifers, the phreatic surface is the only place where a "cone" comes into play. Everywhere else in the threedimensional zone of pressure reduction in the unconfined aquifer, and everywhere around a well in a confined aquifer, the term "cone" is inappropriate. Nevertheless, the industry uses the term "cone of depression" to describe the "depression of heads," and most practitioners know what is actually meant by this term. j '
The zone that is depressurized has a physical size, i.e., a lateral extent, an upper extent, and a lower extent. The lateral limit of drawdown is often referred fa as the radius of influence. There are also vertical limits of drawdown effect. In a partially penetrating weU, the depressurized zone will extend some distance above the well screen and some distance beneath it. This may be what caused NMED's confusion over the statements about the cone of depression extending below the screen. This simply means that the zone where drawdown occurs inc)udes some sediments beneath the screen; it does not mean that the.physical water level 'itself is drawn down below the
screen.
Just as the zone of depressurization has a physical lateral extent (radius of influence) it has a height or thickness at any particular location (the distance between the upper and lower limits of the depressurized zone). This is what is referred to as the height of the cone of depression in the
report ". ".;>"·", j' ' ' 7 / ' " /
14.b. The well screen length' mentioned fn-the report refers to that of the pumped screen. ,_ - "\., ,{,<>->M,,,._"_,_ -.. ___ ,/'
When pumping begins, the drawdown pressure wave rapidly expands horizontally through the sediments adjacent to the-~e_l,L~creen. It also expands vertically, both upward from the screened interval ;and dovV_nw_ard, thoug~~ a slow rate because of the low vertical hydraulic conductivity of the 2-!csliments compared to the horizontal conductivity. Drawdown thus occurs both above and b.~Jow the screened i~terval, even though the images of cones of depression that NMED refers to ,a_lw~s show a cone _shape above the well screen. According to the USGS definition, the cone of depre~_~_ion is the "9epression of heads," i.e., the drawdown-not a graphical picture representing the m~tg~itude of_t_he drawdown. In other words, saying that there is drawdown beneath the screen does not _mean _that water levels are pulled below the screen. Rather, it means that sediments beneath the_ screen see some drawdown below the previous static piezometric head there.
The transmissivity value computed from standard analysis techniques is the transmissivity of the thickness of sediments through which the cone of depression is expanding horizontally. Initially, this zone of expansion is limited to a thickness of sediments approximately equal to the screen length. Thus, the early slope on a drawdown graph should yield the transmissivity of only that thickness. As time passes, there is viable vertical growth of the cone of depression, meaning that the horizontal expansion of the cone takes place through a progressively thicker and thicker portion of the aquifer. This results in a steady flattening of the drawdown slope, as the data reflect the properties of a
EM2020-0425 (Supplement to EM2019-0365) 14 August 2020

progressively thicker section of the aquifer. The Hantush equation for partial penetration confirms this.
To illustrate this point, the Hantush equation was used to generate synthetic drawdown data for a confined aquifer having the same thickness and screen 1 design as R-70 and a transmissivity of 55,000 gpdlft. Angled screen 1 is approximately 41 ft long, making the equivalent vertical height 37.1 ft. The aquifer thickness was assumed to be 160 ft in the calculations. This makes the hydraulic conductivity 55,0001160, or 344 gpd/ft2• The transmissivity of a 37.1-ft thickness of sediments (equal to the screen length in the Hantush simulation) having this conductivity is 344 x 37.1, or 12,800 gpdlft. Using the Hantush equation, the following figure shows the calculated drawdown from such an installation, assuming a discharge rate of 90.8 gpm and the various other parameters shown on the graph.
3
4 i
5 ! ,
Simulated Drawdown in a Partially Penetrating Well In a Confined Aquifer Using the Hantush Equation
. ! •
. ' ' ' ii ii ! i i : : : • ! ;
i, i i 1
i Q= 90.8gpm
•
i '
b=160ft
.: ts ' i
;-, I . I ' L=37.1 ft
• •
T = 13,800 gpd/ft T= 55,000 gpd/ft '
!i 0
] l!! Cl
7
8
9
10
11 0.01
:
•
j
' .
• ' '
: '
~ ii .
' ' . ' .
•• ' ,
.
i Ii 1, ,,,
0.1
J1!i • I i! . •• s C 0.0005
' ! K = 344 gpd/ft2 ,; ·-•· A= 0.018
' I; ·,. '
i a) ' ' ' ' '! ii i
' " I• ' I Ii i
' ' I t""°"" ' '' ' ' i •
;, I
' '
! '
i T 55,000 gpd/ft ~ ' : I ' . 10 100 1000
Time Since Pumping Started (minutes)
i ! i '
': •
' ' ' .
' '
. ' '
' '
'
' ' ' ,,
I ' 10000
Note that the initial slope on the graph produces a calculated transmissivity value of 13,800 gpdlft, approximately equal to the known transmissivity of the screened interval (12,800 gpdlft). This is because of the limi_te_d height of the cone of depression at early time. As the cone of depression (zone of depressurization) expands vertically throughout the test, a progressively greater effective transmissi~ity_is reflected. Once the cone of depression is fully developed through the entire aquifer thickness, th_e data reflect the total aquifer transmissivity of 55,000 gpdlft.
For further illustration, the Neuman equation was used to compute the theoretical drawdown in the pumped screen for an unconfined aquifer using the same set of input parameters. The following figure shows the results.
EM2020-0425 (Supplement to EM2019-0365) 15 August 2020

10
11 0.01
Simulated Drawdown In a Partially Penetrating Well in an Unconfined Aquifer Using the Neuman Equation
0.1
· · · r ····rrr1rnr·TTT ............ ·t·,1; Q=90.8gpm .
; i , b = 160 ft I: ;
-· -· .. [! : T = 55,000 gpd/ft
r i': L=37.1ft
lj • s = 0.0005 . . .... .. 1 ! : Sy= 0.05
I , , , A = 0.018 ···- -+- .,,, t
ii ii
···~··-·~ --~ -~-- • i' ! ••• ~ -~-····
; 1; 1:
ii
10 100
Time Since Pumping Started (minutes)
~-., "'- < /
1000 10000
Similar to the Hantush analysis, the early slope shows ,the transmissivity of a section of the aquifer approximately commensurate with the well screen length. ,, \ ,· .
l ~
The complex hydrogeologic setting at R-70=~ncgnfined conditions, partial penetration, as well as possible leakage from a sign_ifi~~.nt thickness_of underlying sediments-masks the final slope shown on the R-70 pumping tes.!._grap~~, .. Delayed yield.causes flattening of the curve, as does leakage from below the aquife_i:""i.e., conti,n.ued vertical .9rowth of the cone of depression to depths below the aquifer being teste9.:.J,!lus, the actual data set from R-70 does not show the slope indicating a transmissivity of 55,000_gpd'!!, Nevertheless, the examples shown above are useful in illustrating the early-time effects of partial penetration and, by implication, the concept of vertical growth of the cone of depr~ssion. · . ,
. \ 14.c. This qu.estion is related to semantics of the definition of cone of depression, or "zone of
depressurization." The.sediments beneath the screen see drawdown (depressurization). In other words, the drawdown l)ffect extends below the screen. This does not mean that the physical water level falls below the sdreen.
• _,_Tu, ,1. /
14.d. Both Groundwater and Wells, Second Edition (Driscoll, 1986) and Groundwater and Wells, Third Edition (Sterretf 2007) contain general discussions of the preference of early data when later data are affected by anomalies such as boundaries, recharge, and delayed yield. See also the response to NMED Comment 14b.
EM2020-0425 /Supplement to EM2019-0365) 16 August 2020

NMED Comment
15. Appendix E, Section E-2.0 Background Data, p E-5
Permittees' Statement: "Unfortunately, in many pumping tests, casing-storage effects dominate the early-time data, potentially hindering the effort to determine the transmissivity of the screened interval."
NMED Comments:
a) Explain why "slug" testing was not conducted to evaluate the transmissivity of the screened interval.
b) Explain why Equations E-3 and E-4 are provided and discussed if packers were used to eliminate casing storage as staled on page E-1. Casing storage is only one issue that complicates the practical use of initial drawdown data. Turbulent flow, non-radial flow, friction losses, and nonsteady pumping occur when pumping first commences. These issues are difficult to account for and plague the inclusion of "Early Data" in aquifer test analyses.
/ c) Provide publications that support the importance of "Early Data" as stressed by DOE on page E-5
over the remainder of drawdown data, and provide a detailed discussion why aquifer tests are routinely run for 24 hours for confined aquifers and 72 hours or more for unconfined aquifers (see comment 6c) if the "Early Data" are the mo?t important for analysis, An example of a semi-log drawdown analysis using later time data is provided by Osborne (1993). If uncertain, the portion of drawdown data suitable for curve matching can be /Jest determined by derivative analysis, which demonstrates when the required radial flow regime suitable for analysis has been achieved (Horne, 1995). The casing storage narrative on page E-5 should be removed from the report if it has not been used in the analysis. '·
DOE Response
15.a. DOE believes that slug testing of R-70 would not have provided useful information for the testing objective. See the response to NMED Comment 12b.
15.b. Equations E~3 and E-4 are pertinent because they drive the decision to use packers in virtually all R-well tests:includlng single-·screen wells. Further, they are germane to the general subject of storage· effects, which can arise by means other than conventional casing storage. For example, filter pack storage has been observed in other wells at LANL and had the potential of cropping up in the screen 1 test; and storage related to gas bubble expansion and contraction may have occurred in the screen 2 test and has been observed elsewhere in the R-well testing program.
-,~
Regarding t.~e,Ust of phenomena that could plague early data, the following is provided to address NMED's comment:
Turbulent flow - When turbulent flow occurs, it increases the drawdown by a constant factor as long as the discharge rate is constant. This is no different than any other well inefficiency drawdown component that results in the pumped well drawdown exceeding the theoretical drawdown that would have been observed in a 100% efficient well. It has no effect on the analysis of timedrawdown data from the pumped well. For example, if a constant is added to each drawdown value in the Hantush example shown in the graph above, there would be no change in the slopes anywhere on the plot, and the exact same transmissivity values would be calculated.
EM2020-0425 (Supplement to EM2019-0365) 17 Augus/2020

Non-radial flow- The early data are the only data where the flow is, in fact, radial (or approximately so). Later, as the cone expands vertically to a significant extent, the flow becomes non-radial. Thus, it is the late data that are plagued by non-radial flow, not the early data. The later data show delayed yield and continued vertical growth of the cone of depression. In the Hantush example in the above graph, the early time transmissivity value and the straight line plot confirm that flow is largely radial early on. The subsequent flattening of the slope (the curved part of the graph) shows the onset of significant non-radial flow. The late data show radial flow again by virtue of the fact that the assumed confined aquifer in the calculation example is not affected by either delayed yield or unlimited vertical growth of the cone of depression, as seen in R-70. (In R-70, the late data continue to be affected by delayed yield and vertical expansion of the cone of depression, perpetuating nonradial flow throughout the lest.)
Friction losses - II is was not clear whether NMED meant friction losses betw~en the aquifer and the pump intake or in the discharge piping. In any case, neither one affects the_u~ability of any of the test data, early or otherwise. The losses on the intake side of_ the pump are us_u;;illy negligible but are nevertheless constant. Thus, as with turbulent flow, tl)_ey increase all pumpe9 \Veil drawdown values by a constant factor and have no effect_c;,)1 the analysis. Those on the discharge side of the pump simply add to the total lift and remain constant as well (for tests in which the drop pipe remains full al all times). ~
✓
Non-steady pumping - This does not occur with electric subm.!:_r:!l[ele pumps. The submersible motors have the remarkable properties of 1tgelting up to speed Eapidly (literally by the lime the hydrologist's finger is off the start button);_ a_nd ?).EtJ!l~Jng at a constant speed and, therefore, al a constant rate (assuming again that the drop pipe is full). In general, the pump performance is the same al times of 1 second, 1 minute, 1 hour: and 1 day'.'· ,/
, ,'/ \ ;I
In summary, the early data are not plagued by .ttJrbulent flow, non-radial flow, friction losses, or nonsteady pumping as posited by NMED. They are, in fact, quite usable for analysis of near-well aquifer conditions. ,./ ' \
/ -~- i / / ,
As long as the droppjp_e is fulLa_nd_p~te.n~_al_casing storage sources are eliminated, about the only thing that can interfere with early data collection and analysis is inertial effects, which last for only a second or two. '" ·· • (
15.c. As discussed.in th·e respo~·se to l)JMED Comment 14d, both Groundwater and Wells, Second Edition (Driscoll, 1986) and Groundwater and Wells, Third Edition (Sterrett, 2007) contain general discu§sions about the preference of early data when later data are affected by anomalies such as boGndaries, recharge, ~nd delayed yield.
' Rega_rding the rati~nale for conducting 24- and 72-hour pumping tests, the following information is
provided.:
Although early data from some pumping tests can be particularly useful, ii does not obviate the need for extended pumping. The hydrologic setting being tested affects the overall pumping lest response and its usability. In some settings, the best information may be obtained from the early data. In others, late data may be revealing. In many tests, good information can be acquired from the entire data set while in some tests, sadly, little useful information can be extracted from any part
of the data set.
The early data reflect properties in the vicinity of the pumped well (say, 100 to 200 fl or so around the well). To obtain information on a broader area of the aquifer, and distant features such as
EM2020-0425 (Supplement to EM2019-0365) 18 August 2020

heterogeneities, boundaries, or recharge, longer pumping time may be useful, but that was not the objective of this single-well pumping test. The Neuman analyses in the R-70 pumping test utilized virtually the entire data sets to obtain a good set of aquifer parameters. Larger-scale evaluations of the aquifer around R-70 have been conducted as part of cross-hole aquifer tests and will be reported in the Assessment Report on the evaluation of conditions in the regional aquifer around well R-70, due to NMED by June 30, 2021.
The casing storage narrative should remain, based on the reasons discussed in the response to NMED Comment 15a.
NMED Comment
16. Appendix E, Section E-8.1 Well R-70 Screen 1 Trial Test, p E-12
Permittees' Statement: "To remove some of the "noise" in the data graph, the drawdown data were replotted as a rolling average on Figure E-8. 1-3."
NMED Comments: Provide the time period that was used to remove the noise. Explain how much data was lost using the moving average, and how did it impact analyses. Explain if other filters were considered.
DOE Response
16. The following statement could be added to the discu~fion:
"The rolling average was computed by averagin_g e~ch data point with the 4 preceding and 4 following data points. This resulted in minimal data loss --;iust 1 second at the beginning of the test and 4 minutes at the end."
No other filters were con_sidered necessary.
NMED Comment
17. Appendix E, Section E-8.2 Well R-70 Screen 1 24-hr Test, p E-12 ~. -.
Permittees' St~~ement: "The initial discharge rate was not known because the pump curve does not cover this condition. An attempt was made to extrapolate the available pump performance data to project what the initial discharge rate might have been. This resulted in a rough estimate of 160 gpm although there could be substantial error in this figure. Over the next couple of minutes, as the drop pipe filled, the disc~~rge rate gradually decreased to 90. 8 gpm."
·/
NMED Comment: Pump curves provide the initial (maximum) pump rates (see comment 12a). Extrapolation to find the maximum pumping rate of a pump is not necessary. The description in the last sentence indicates that discharge was not regulated at the well head by either a variable
rate pump controller or a gale valve that is required lo maintain a constant pumping rate throughout the test (Osborne, 1993). A constant rate must be maintained to within ±5% of the target pumping fest rate throughout the test (U.S. Department of the Interior, 1995).
EM2020-0425 (Supplement to EM2019-0365) 19 August 2020

a) Provide a discussion that details how the pumping rate was measured and maintained at a constant rate throughout both tests. Provide the field log/notes documenting the measured
discharge rates made throughout both 24-hour pumping tests.
b) If the pumping rate was not maintained at a constant rate throughout the tests, explain why a valve or variable-rate pump wasn't used to control discharge during the pumping test, and how
long did it take for the pump to achieve the 90. 8 gpm rate.
c) If 90. 8 gpm was the target pumping rate for the two 24-hour pumping tests, explain how that rate
was determined.
DOE Response
17. DOE does not agree with NMED's comment regarding pump curves and discharge rates. See the
response to NMED Comment 12a. .. . '
There was a ball valve in the discharge line. However, it was left wide open for the 24-hr tests as " discussed below.
.,_ ✓L
17.a. The pumping rate was measured using an in line totalizing flow meter. ~~ .3/
'···",,'"" The pump operated at a constant rate and the pumping head ch_?.,r,ged little during the test, so valve adjustment was unnecessary. For exampl!l, .. !:!uring the screen 1 tei_~t_ after the first few minutes of pumping, the drawdown (and pumping li~)!em?i'"!e,d_ in anarrow range of about 1.6 fl, i.e., plus or minus 0.8 ft from the midpoint. According t~_the pump curve,, t_his corresponded to possible flow rate variations of plus or minus 0.08 gpm, or less than 0.1 % of the total rate.
\ 17.b. The target discharge rate was achieved as soon as the drop pipe filled-about a minute (plus or
minus) for the two tests. (Seethe fjeld data sheets.) Prior to that the rate was greater, starting out at a maximum, because of antecede~t drainage of the drop pipe, and gradually declining as the drop pipe filled. Once wa_ter reached th~ surface, the ;ate remained constant. The small variations in rates observed during the tests were like_ly caused by slightly varying gas content in the water that
? ·--./
affected the pump bowl efficiency. . . •. . It is essential In the deep R-w;ll tests to leave the discharge valve setting unchanged, regardless of whether the valve is ·partially closed to constrain the flow rate or wide open to maximize it. The constant speed of the pump, combined with the great pumping lift compared to the minimal drawdown changes that occur during pumping, ensures that the discharge rate will remain con.sistent and uniform' (except for the limitations of random changes in gas content in the pumped water). Striving for perfection by constantly fiddling with the discharge valve in this environment will always cause more noise, chaos, variation, and/or erratic pumping rates than would otherwise
occur if the valve position is kept constant. ,_,✓
17.c. The intent was to pump each zone at the maximum rate that the pump could attain.
NMED Comment
18. Appendix E, Sections E-8.1 through E-8.5, p E-12, E-13 and E-14
Permittees' Statement: "The late data showed a flattening of the curve associated with vertical expansion of the cone of impression and, possibly, delayed yield effects." - p E-12 "Late data on the
EM2020-0425 (Supplement to EM2019-0365) 20 August 2020

left-hand side of the plot showed continuing flattening of the data trace, corresponding to ongoing vertical expansion of the cone of impression at late time and delayed yield effects." - p E-13 "Subsequent data showed continuous flattening of the recovery curve, consistent with vertical expansion of the cone of impression and delayed yield. ... Subsequent data showed the effects of vertical expansion of the cone of impression and delayed yield." - p E-14
NMED Comment: The term "cone of impression" is used throughout these sections and on several figures in Appendix E. This term describes the conical shape of the mound formed by well injection (e.g., the "CrlN" injection wells) and in well image theory as described in multiple text books and publications (Kruseman and de Ridder (1990), Lohman (1972), Ferris et al. (1962), among many others). Explain if water was injected into R-70 during the recovery phases of the aquifer tests. Explain if backflow from the leaking 2" drop pipe injected water back into the well during the onset of the recovery tests. If not, explain why this term is used to describe the recovery of the cone of depression back to non-pumping water table conditions.
DOE Response
18. The water level recovery response to shutting off the pump is mathematically equivalent to what would have been observed had the real well continued pumping and an imaginary well injected water into the aquifer at the same pumping rate. The term "cone of impression" is defined as "a rise of the potentiometric surface in the shape of a cone that develops around an injection well."
The actual response was the superposition of 1) the extrapolation of the original cone of depression (zone of depressurization) into the future, assuming continued pumping; and 2) the cone of impression (zone of repressurization) associated with an imaginary well injecting water into the aquifer at the same pumping rate. Rather than repeat all of that each time, it was less cumbersome to simply use the term "cone of impression" as a shorthand description of the water level trends associated with recovery. .- . ·
/;' ,;'"",_.. ,,>t,,jf::
Water was not injected into the well during recovery, except for the ongoing drop-pipe leak. As discussed in the response to NMED Comment 11 c, the leakage rate was 0.11 gpm. During screen 1 pumping and recovery, this had zero effect, as the leaked water was trapped in the casing annulus above the upper packer. During the screen 2 test, the leak had the effect of raising the water level at screen 1 by 0.008 ft for the duration of testing-both pumping and recovery.
NMED Comment
19. Appendix E, Section E-8.2 Well R-70 Screen 1 24-hr Test, p E-13
Permittees' Statement: "Figure E-8.2-4 illustrates response to the drop-pipe leak that occurred during the screen 1 24-hr pumping test. The plot shows data recorded in the annulus above the upper packer just above the top of screen 1. As shown in the figure, as soon as the downhole packers were inflated, water began accumulating in the annular space above the packer. The water level reached a height of approximately 60 ft overnight before the test. Once pumping began, the rate of rise was linear because the drop pipe remained full throughout the test, maintaining a constant head and steady leakage rate. During recovery after pump shutdown, the water level in the annulus continued to rise, eventually reaching a height of 173 ft by the time the packers were deflated."
NMED Comment: Describe where the drop-pipe leak is located relative to the packer, where the water that accumulated above the packer after pump shutdown came from, and how this was measured. Explain Figure E-8.2-4 in detail to better describe what happened, as the provided
EM2020-0425 (Supplement to EM2019-0365) 21 August 2020

explanation is confusing. Provide a figure that details the pumping test equipment setup down the well (see comment 11b) and explicitly illustrates the annular space above the packer, and where the
drop-pipe leak is located.
DOE Response
19. The following dimensions may help clarify this issue.
Component
Static Water Level
Pinhole Leak
Upper Transducer
Top of Upper Packer
Bottom of Upper Packer
Top of Screen 1
Approximate Depth
948 ft
951 ft
954 ft
954 ft
959 ft
963 ft
After pump shutdown, the additional accumulated water in the annulus came from the drop pipe. y
The water height in the annulus was measured via the upper pressure transducer . .. NMED Comment
20. Appendix E, Section E-8.3 Well R-70 Screen 2 Trial Test, p E-14 . ,/ -· \ /
Permittees' Statement: "Subsequent data sno'wed. continuous flattening of the recovery curve, consistent with vertical expansion of the cone' of impression and delayed yield."
. . \
NMED Comment: Explain: what is meant by, ahd how "the vertical expansion of the cone of impression and delayed yield" can o'ccur during re·covery, especially considering delayed yield occurs during pumping (Krusem'an and deRidder, 1990; Mishra and Kuhlman, 2013, U.S. Department of the Interior, 1995). Similarly, explain the similar speculative conclusions shown in the notes on Figures E-8.1-1, E-8.1-3, E-a.2:2, E-8.3-1, E-8.3-2, E-8.4-3, and E-8.4-4.
/,. . ' ',,
DOE Response
20. When operating a part(ally penetrating well, just as the cone of depression or zone of depressurization expa~ds vertically over time (per the Hantush equation), so too does the zone of repressur[zati,:m expar),d when pumping stops (analogous to what would occur if an imaginary well
began injecting water). y
With respect to delayed yield, this occurs during pumping because the vertical drainage rate of water at the top of the aquifer lags the rate of elastic drawdown response to pumping. In the same manner, when pumping stops, the vertical flow that refills the void space above the phreatic surface is sluggish compared to the rapid elastic head buildup associated with recovery. Because the pore spaces are receiving water during recovery, rather than yielding water as they do during pumping, the effect is
essentially more of a "delayed reception."
To view this from a different perspective, all standard well hydraulics equations apply to injection just as they do to pumping. The only thing that changes is that a negative sign is applied to the term Q.
EM2020-0425 (Supplement to EM2019-0365) 22 August 2020

DOE believes that the conclusions regarding delayed yield and vertical expansion of the cones in Figures E-8.1-1, E-8.1-3, E-8.2-2, E-8.3-1, E-8.3-2, E-4.1-3, and E-8.4-4 are correct and wellfounded.
NMED Comment
21. Appendix E, Section E-8.5 Well R-70 Drawdown and Recovery Aquifer Coefficient Summary, pE-15
Permittees' Statement: "Excluding the anomalous values obtained from the 24-hr pumping period, the average upper-bound transmissivity for this approximately 20-ft thick zone was 16,730 gpdlft, making the upper-bound hydraulic conductivity of the screen 2 zone 817 gpdlft2, or 109 ft/day."
NMED Comment: Clarify if the upper bound value of 109 ft/day for hydraulic conductivity was attributed to R-70 S2 or S1. On page E-16 this value appears to be attributed to R-70 S1. In Table E-8.5-2, Section E-8.5 on page E-15, and conclusion #9 on page E-17 it is attributed to S2. Explain if the 109 ft/day hydraulic conductivity value is within the expected range of values for the aquifer rock according to published sources for similar rock.
DOE Response
21. DOE acknowledges the error. The revision will include a correction to read "screen 2."
Some anecdotal conductivity ranges from the literature (after converting to ft/d and rounding off):
1. Driscoll - 0.1 to10,000 ft/d for fine to coarse sand
2. Zheng and Bennett- 0.02 to 160 ft/d for coarse sand / ::t>, {y--.l'
3. Freeze and Cherry - 1 to 4000 ft/d for clean sand . / -~ ...
NMED Comment
22. Appendix E, Section E-8.6, p E-15
NMED Comment: Explain why there is no Section E-8. 6.
DOE Response
22. DOE ac~nowledges the error: The section labeled 8.7 will be changed to 8.6 in the revised document.
NMED Com;;..ent ,Y 'v"
23. Appendix E, Figure E-8.2-1 Well R-70 screen 1 drawdown, p E-22
NMED Comment: Three curves appear to be discern able in the drawdown data for R-70 S 1 during the 24-hour test following the 10-minute mark. The speculation in the note on this figure states that delayed yield could be one reason for the observed recovery at the 700-minute mark during pumping. If DOE speculated delayed yield as a cause of the recovery, discuss whether the Neuman solution was used on this data. If not, discuss whether the apparent recovery was due to a decrease in the pumping rate and/or affects from injection at nearby CrlN wells.
EM2020-0425 (Supplement to EM2019-0365) 23 August 2020

DOE Response
23. The note on the graph was intended to apply to the bulk of the late data, not just to what happened at the 700-minute mark. Delayed yield and vertical expansion of the cone of depression would have, by themselves, contributed to a flattening of the curve, but drawdown would have continued to increase slightly. The actual reversal of water levels was only possible because of a change in well efficiency (probably gas-related). The pumping rate remained constant throughout, and there was no other
pumping going on in Mortandad Canyon after May 9.
The Neuman solution does not work effectively on the pumped well data in general, often because of the inefficiency drawdown component, which cannot readily be accounted for. lt_s application to screen 1 would have been particularly futile based on the combination of the elevated initial discharge rate and the well efficiency change that occurred.
NMED Comment
24. Appendix E, Figure E-8.4-2 Well R-70 screen 2 drawdown - expanded scale, p E-26 ; ";
NMED Comment: Three curves can be discerned in the. drawdown data for R-70 S2 during the 24-hour pumping test. However, the note on this figure specuiates.ihe later data of increased drawdown may be due to permeability reduction. Describe if the Neuman solution was used to evaluate whether a better fit of the solution to the data can be a'chieved. . )
DOE Response . .,
24. As stated previously, the Neuman solution dc,es_ nou;1enerally work well for pumped well data. The magnitude of the drawdown in the pumped WE:11. ?.a.n be greater than the theoretical value due to inefficiency or the screen bet!l_g..L<JE~ed in a pre!~entially low conductivity zone within the aquifer. Conversely, it can be less.!],an thE:!~eoretical v:3lue by virtue of the screen being set in a preferentially permeabl<,l_portion o_fJh',) ~<1uifer. These effects-combined with the large initial discharge rate and su_bs,':lguent_dtnami~ESJ_ffi<:iency degradation, as well as other boundaries or recharge that may be en2_C>~}!)"'red (such as possible continued vertical growth of the cone of depression beyond the confine~_of the 160 foot thick upper aquifer)-tend to render the pumped well
data unusable in theNeuman analysis. ~ . "" -- . ---~, ''r ~:-- \
' The N"'uman analysi~j~volves extremely complex mathematics and must solve for four unknowns simultaneously: horizon_t1'11 conductivity, vertical conductivity, storage coefficient, and specific yield. The a_nomalies cited above play havoc with the calculations. For example, a reasonable-looking Neum_§l_ll type curve m~tch to the screen 2 drawdown data (when pumping screen 2) yielded a transmis~ivity val~e approximately one-third too high, a storage coefficient four orders of magnitude too low, a sp!)Cif(c yield three orders of magnitude too low, and an anisotropy ratio more than an order of magnitude too high. When the storage and anisotropy were constrained to reasonable values, the best possible data match was quite poor visually, and the resulting transmissivity was about 75% high. In short, it was not possible to obtain a sound, reasonable, and independent Neuman analysis
using the pumped screen data.
EM2020-0425 (Supplement to EM2019-0365) 24 Augus/2020

NMED Comment
25. Appendix E, Figures E-8.4-2 and E-8.4-4, p E-26 and E-27
NMED Comment:
a) Explain why the result for the S2 drawdown analysis (Figure E-8. 4-2) and the result for the S2 recovery analyses (Figure E-8.4-4) provide highly different results.
b) Explain why the result for the S1 drawdown and recovery analyses provided in Figure E-8.2-1 and Figure E-8. 2-2, respectively provide highly different values for transmissivity compared to the result for the S1 drawdown response form pumping S2 (Figure E-8.4-6).
c) Provide a discussion of the quality of the drawdown and recovery data and the reliability of the results made from the analyses of these data.
DOE Response
25.a. Early time snapshots of data from trial recovery (Figur•tE:8.3-1), trial drawdown (Figure E-8.3-2), and 24-hour recovery immediately following the storage portion of the curve (Figure E-8.4-4) yielded near-well transmissivity values for the screened zone of 16,900 gpdlft, 17,000 gpd/ft, and 16,300 gpd/ft-fairly consistent. The empty drop pipe and the elevated and inconsistent initial discharge rate associated with the start of _the 24-hour pumping period made it difficult to determine a reliable transmissivity value from Figure E-8.4-2." ·-
25.b. Calculations on Figures E-8.2-1 and E-8.2:2 use early data and therefore reflect a portion of the aquifer having a thickness of approximately_the _IEl_ngth of screen 1. The Neuman analysis, on the other hand, accounts for partial penetration a_nt:I delayed yield and utilizes the whole data setearly, mid, and late time-::_aD.~EEl!I.Elcts the en~~El aquifer transmissivity. (See the Hantush and Neuman partial penetration discussion in the response to NMED Comment 14b.)
_:~'./ . - ; '·)
25.c. Opinions about the quality and reliability of the data and results are highly subjective, reflecting different meanings, criteria, goals, expectations, and perspectives for different observers. A general comment concerning the pumping test approach at LANL can be offered. The pumping tests at LANL are planned c1s meticulously, and conducted with as much care, as any in the industry-in
. - . ' . -· spite of the considerable challenges of testing very deep, small-diameter wells (without close-in observation wells}°with 20-foot screens in an aquifer that is hundreds or thousands of feet thick and contains gassy or aerated water. The analyses are performed with a particular emphasis on obtaining the information that is obtainable and defensible.
NMED Comment
26. Appendix E, Figure E-8.4-4, p E-27
NMED Comment: Regarding the curve matching shown on Figure E-8.4-4, describe what value of transmissivity would be obtained if the data between log cycle 100 to 10,000 was used. If/he data between these log cycles were considered, provide a discussion how the results may compare to the values obtained from the pumping phase of the R-70 S2 24-hour test shown in Figure E-8.4-2, and Figures E-8.2-3 and E-8.4-6. Explain why the initial portion of recovery from log cycle 100,000 to 10,000 was used in Figure E-8.4-4 and the bulk of the recovery data was not considered in the analysis (see comment 15c). Explain how delayed yield can possibly be observed during the recovery
EM2020-0425 (Supplement to EM2019-0365) 25 August 2020

period after pumping and dewatering of the water table has stopped, and likewise describe how and why the cone of impression (depression?) expands during the recovery period (see comment 20).
DOE Response
26. The bulk of the recovery curve is a giant arc that steadily flattens over time. Moving from a tit' value of 10,000 to 100, the corresponding erroneous transmissivity values obtained start at 35,000 gpd/ft and rise steadily to 76,000 gpd/ft. Continuing to smaller tit' values, the data plot continues to flatten, eventually supporting a transmissivity calculation of 640,000 gpd/ft at a tit' value of 10. Thus, depending on which part of the graph is used between tit' values of 10,000 and._10, the corresponding transmissivity can take on all values ranging from 35,000 gpd/ft to 640,000 gpcJ/ft. None of the computed values are legitimate except when the curve fortuitously and a~gidentally is at just the right slope to yield the correct transmissivity. Because the steadily changing sJope ~u_pp_orts all transmissivity values between 35,000 gpd/ft and 640,000 gpd/ft, it is inevitable that the true transmissivity will be encountered somewhere along the way, even though there is no way to know
when or where that occurs. . .
The steady flattening of the data graph reflects two simultaneous effec!s: vertical growth of the "cone of impression" and delayed yield. It is not possible to sort out these effects mathematically, except by applying the Neuman mathematics, which is generally unsucc,e~2ful for the pumped well. At any point along the recovery arc, the slope is a function of 1) some unkno1,11n_hJ,ight of the cone of impression at that particular time and 2) some unknown delayed-yield effect at th!)t2articular time. Using any of these slopes to compute a transmissivity would _be a_prime_example of "misapplying the wrong equation at the wrong time to the wrong portion of the data to get a wrong answer."
r·· -- ·, - ;·,-
'.l The early data were analyzed because the height of the cone of impression was better known (approximately equal to the screen length), and delayed yield would not yet have affected the data significantly. , ·· \ \
/ - \ ·' - ; .. >
The concept of delayed yield is the same during recovery as during pumping, as discussed in the response to NMED Comment 20. ,, ..
. , --~ -~_\...(·:✓.v_,-·~· -, The superimposed cone ofj_m,pression-analogous to the effect of injection via an imaginary wellgrows latera~Y..fl!J.9.~ertically o_y~r_~me in the same way that the original cone of depression does. For example, if _an injection _test were conducted, the resulting head buildup and head changes over time woulcl_l)_e the same as the drawdown patterns that would be observed if pumping were performed
instead.
REFERENCES
List to be added pri?r io submittal to NMED
EM2020-0425 (Supplement to EM2019-0365) 26 August 2020