Multimarket Contact and Collusion in the Ecuadorian Pharmaceutical Sector (Slides)
Upload
magnus-owenCategory
view
218download
0
Competitor Analysisand
Multimarket Competition
The Role of Competitor Position
in Crafting Strategy

Know Your Rivals
What: their objectives and strategies Why? to predict their future strategies
• Why? to guide own strategies
What: their strengths and weaknesses Why? to compare with own strengths and weaknesses
• Why? to evaluate opportunities and threats–Why? to build and sustain own position

Sources of information
Recorded data, e.g, annual reports; press releases; newspaper articles; analyst reports; tender offers; regulatory reports; government reports
Observable data, e.g., pricing; advertising and promotion; seminars and conferences; patent applications; presentations/speeches; trade shows
Opportunistic (anecdotal) data: from suppliers; distributors; customers and competitors; ex-employees

Hard-to-find information
Overall sales and profits Sales and profits by market Sales by main brand Cost structure Market share (revenues and volume) Organization structure Distribution system Advertising strategy and spending Customer/consumer profile & attitudes

Multimarket Competition
What: firms competing against each other in several markets in, e.g.,different geographical markets for the same products different parts of a verticalsubstitute markets
Why Increase in related product diversification Increase in geographic market diversification Greater use of coordinated worldwide strategies
Results “Mutual forbearance”: benefit of aggressive action in any market is
reduced because rivals can retaliate in multiple common markets True for repeated actions (e.g., promotional activities) but not
introduction of innovations

Visual Aids
Multimarket Competitor Chart: displays competitors in common markets
Strategic Group Map: displays clusters of rivals along two dimensions of industry positioning

Simple Multimarket Competitor Chart
2000
2011

Industry/Country
Industry/Country
Industry/Country
Industry/Country
Client Products:a, c
Products:c, d
Products:a, b, c
Products:b, c, d
Competitor #1 Products: a
Products:e
Products:c, e
Products: d, e
Competitor #2 Products: a, b, c, d, e
Competitor #3 Products: a, e
Products: a, e
Competitor #4 Products: a
Products: a, b
Products: a, b
Global Product-Market Competition

Dry Wet Moist
Cat Food
Dog FoodGourmet
Average
Economy
Segment Multimarket Competition Pet Food Industry
Snack

Strategic Group Maps
A strategic group consists of rival firms with similar competitive strategies and positioning in an industry
A strategic group map displays clusters of groups within an industry based on two variables that you choose for their strategic significance.
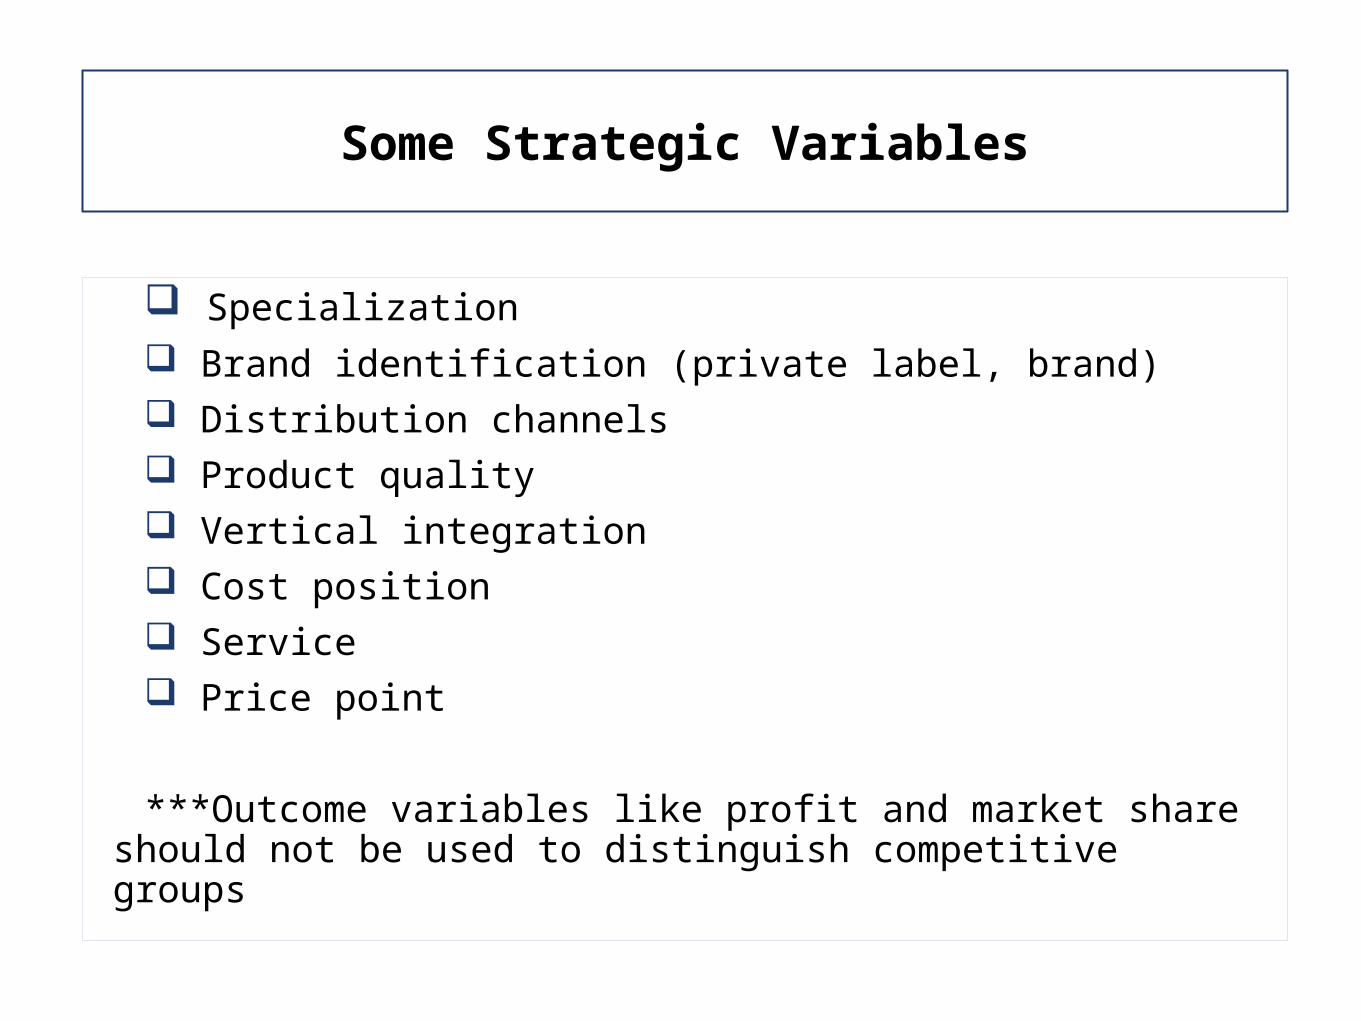
Some Strategic Variables
Specialization Brand identification (private label, brand) Distribution channels Product quality Vertical integration Cost position Service Price point
***Outcome variables like profit and market share should not be used to distinguish competitive groups

Constructing a Strategic Group Map
1. Choose two variables that distinguish competitors Maximize contrast Minimize correlation
2. Plot on graph3. Represent firm/group size with circle proportional to market share OR 4. Begin grouping firms and then identify variables5. Position firms on map6. Represent firm/group size with circle proportional to market share

Example of Strategic Group Map in Stage 1

Price Point
Qu
alit
y L
evel
10
1
$350 $500 $1500
Burberry
Louis Vuitton
ChanelLoro Piana
Hermes
Gucci
Tiffany
Luxury Goods Market

Luxury Goods Market: Potential Variables
Target customer* Top tier: (24%) not affected by business cycles Aspirational: (36%) upper middle class; make luxury purchases “AOAP” Accessible luxury: (40%) affluent middle class; make occasional luxury
purchases when times are good Scope of products sold Degree of vertical integration Distribution channel
* Research by Bain and Co.

Interpreting the Map
Fiercest rivalry occurs within strategic groups The closer the clusters, the stronger the rivalry Firms attempt moves into different segments as industry conditions change Mobility barriers: group-specific entry barriers that restrict movement
across groups Identify mobility barriers