Competitiveness Of Pakistan Textile Industry
34
Competitiveness of Pakistan Textile Competitiveness of Pakistan Textile Industry Industry Issues and Challenges Issues and Challenges By. Syed Mumtaz Ali By. Syed Mumtaz Ali
-
date post
17-Oct-2014 -
Category
Documents
-
view
4.882 -
download
5
description
Issues and ChallengesBy. Syed Mumtaz Ali
Transcript of Competitiveness Of Pakistan Textile Industry
Competitiveness of Pakistan Textile IndustryCompetitiveness of Pakistan Textile Industry
Issues and ChallengesIssues and Challenges
By. Syed Mumtaz AliBy. Syed Mumtaz Ali
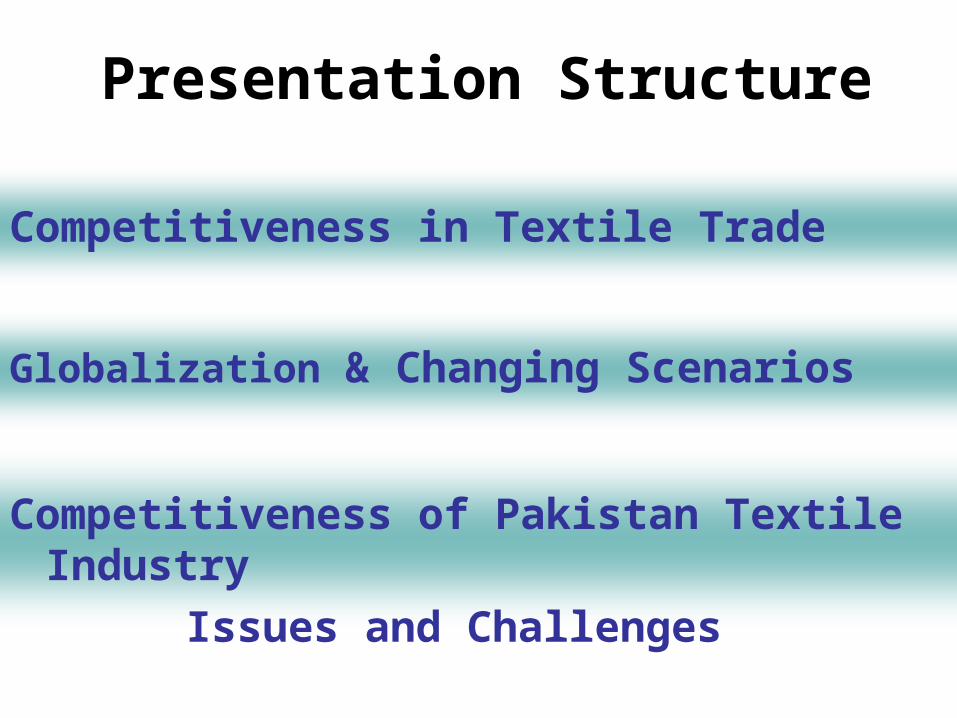
Presentation Structure
Globalization & Changing Scenarios
Competitiveness in Textile Trade
Competitiveness of Pakistan Textile Industry
Issues and Challenges
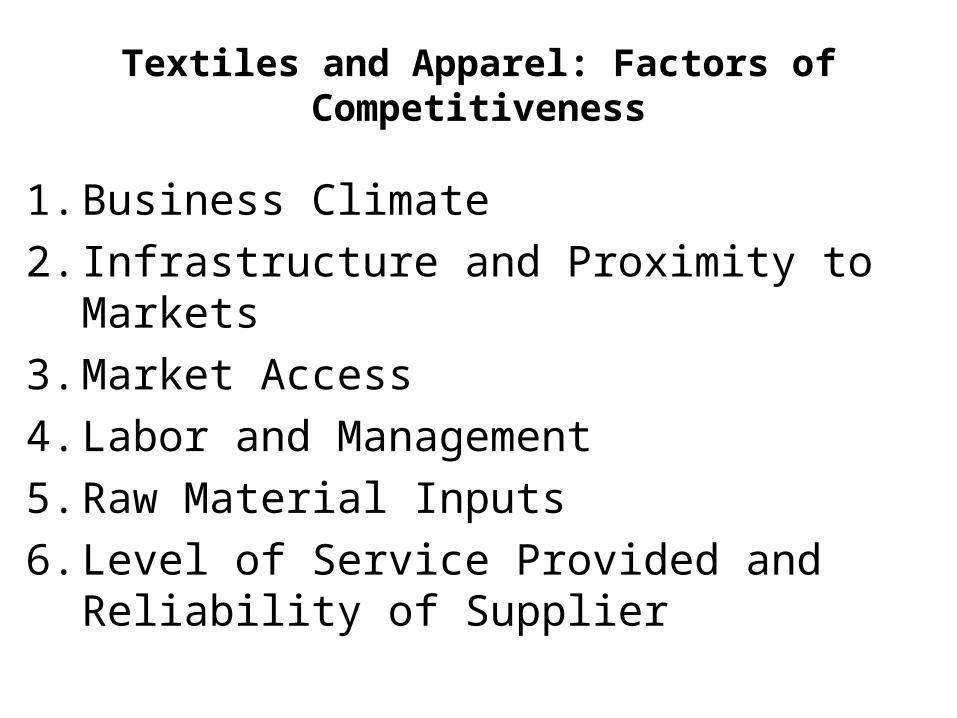
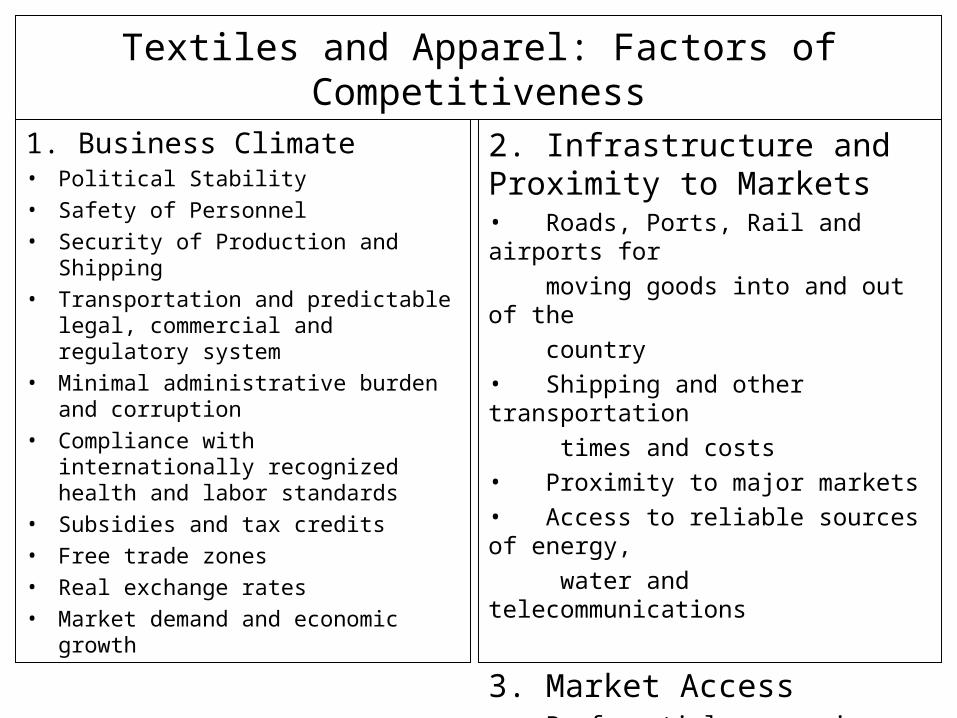
Textiles and Apparel: Factors of Competitiveness
1. Business Climate
2. Infrastructure and Proximity to Markets
3. Market Access
4. Labor and Management
5. Raw Material Inputs
6. Level of Service Provided and Reliability of Supplier
Textiles and Apparel: Factors of Competitiveness
1. Business Climate• Political Stability
• Safety of Personnel
• Security of Production and Shipping
• Transportation and predictable legal, commercial and regulatory system
• Minimal administrative burden and corruption
• Compliance with internationally recognized health and labor standards
• Subsidies and tax credits
• Free trade zones
• Real exchange rates
• Market demand and economic growth
2. Infrastructure and Proximity to Markets• Roads, Ports, Rail and airports for
moving goods into and out of the
country
• Shipping and other transportation
times and costs
• Proximity to major markets
• Access to reliable sources of energy,
water and telecommunications
3. Market Access• Preferential access in major markets
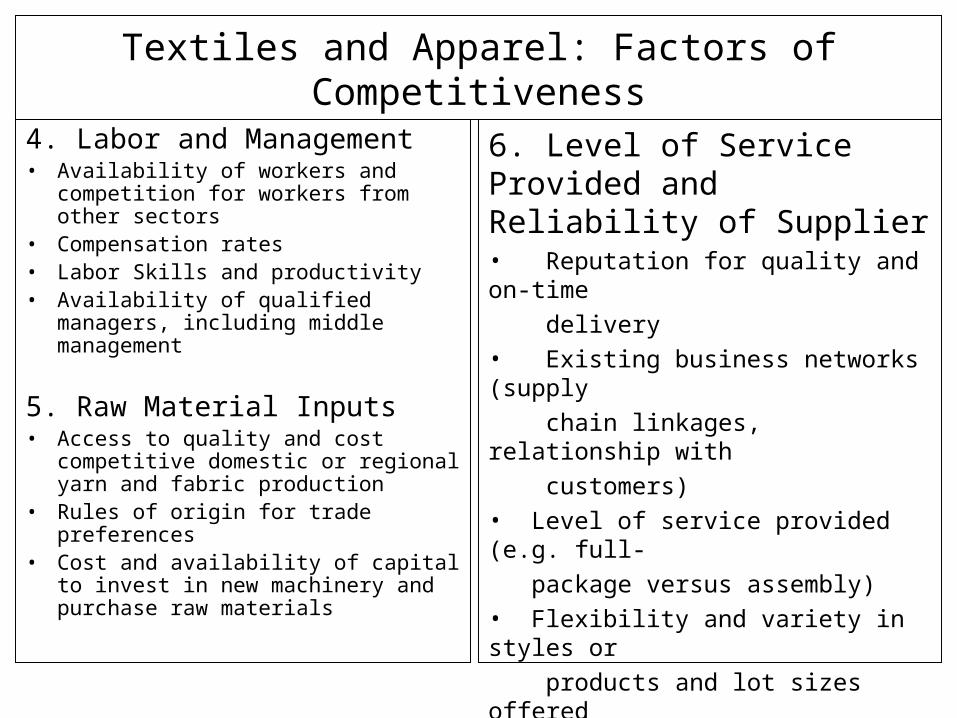
Textiles and Apparel: Factors of Competitiveness
4. Labor and Management• Availability of workers and
competition for workers from other sectors
• Compensation rates• Labor Skills and productivity• Availability of qualified managers,
including middle management
5. Raw Material Inputs• Access to quality and cost
competitive domestic or regional yarn and fabric production
• Rules of origin for trade preferences• Cost and availability of capital to
invest in new machinery and purchase raw materials
6. Level of Service Provided and Reliability of Supplier• Reputation for quality and on-time
delivery
• Existing business networks (supply
chain linkages, relationship with
customers)
• Level of service provided (e.g. full-
package versus assembly)
• Flexibility and variety in styles or
products and lot sizes offered
• Lead time and flexibility to respond to
quick turnaround orders
Globalization & Changing Scenarios

Global Trade is Growing
201 232 258
281351
397
0
100
200
300
400
500
600
700
2005 2008 2010
Textile Apparel
US
$ B
n
CAGR
Textile: 5.8%
Apparel: 9.6%
482 Bn
583 Bn
655 Bn
Projections of World Textile and Apparel Trade
Source: ITC
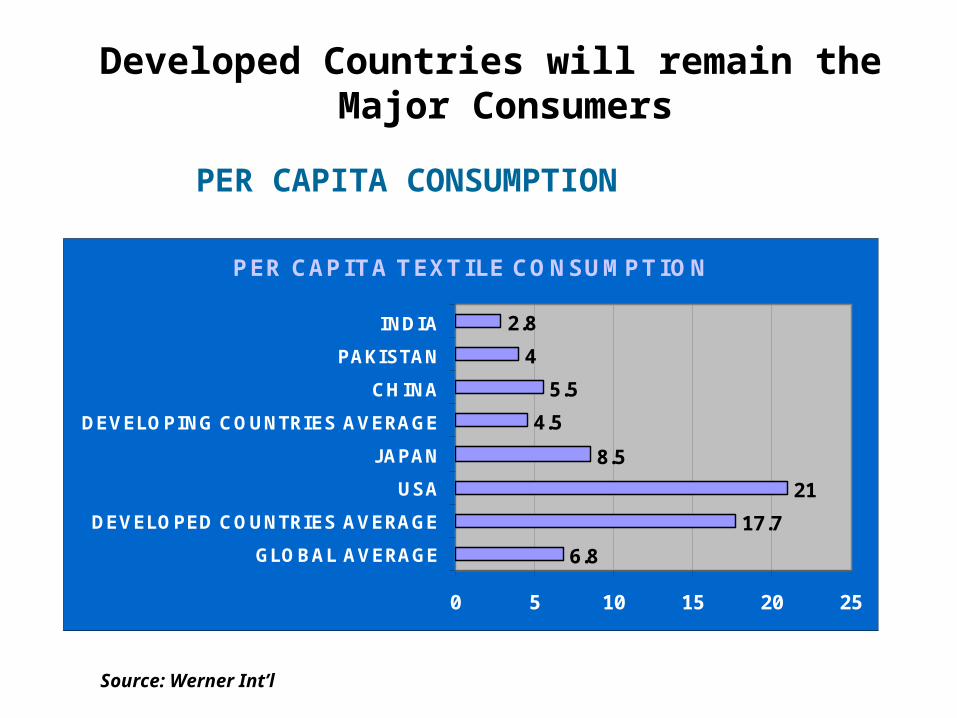
Developed Countries will remain the Major Consumers
PER CAPITA CONSUMPTION
PER CAPITA TEXTILE CONSUMPTION
6.8
17.7
21
8.5
4.5
5.5
4
2.8
0 5 10 15 20 25
GLOBAL AVERAGE
DEVELOPED COUNTRIES AVERAGE
USA
JAPAN
DEVELOPING COUNTRIES AVERAGE
CHINA
PAKISTAN
INDIA
Source: Werner Int’l
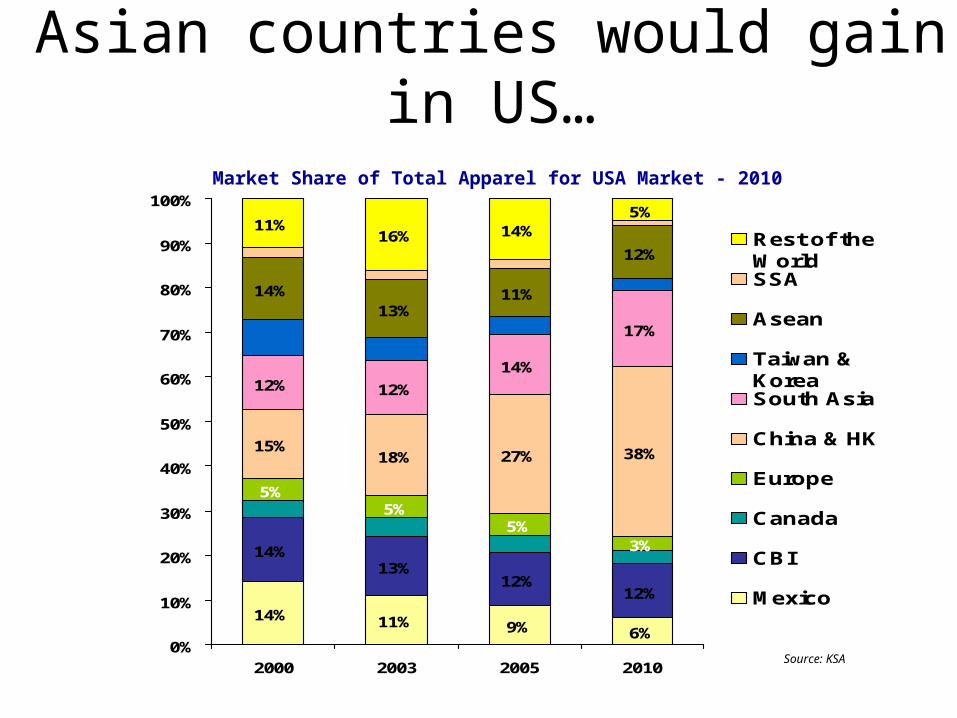
Market Share of Total Apparel for USA Market - 2010
Asian countries would gain in US…
14% 11% 9% 6%
14%13%
12%12%
5%5%
5%3%
15%18% 27% 38%
12% 12%
14%
17%
14%13%
11%
12%
11%16% 14%
5%
0%
10%
20%
30%
40%
50%
60%
70%
80%
90%
100%
2000 2003 2005 2010
Rest of theWorldSSA
Asean
Taiwan &KoreaSouth Asia
China & HK
Europe
Canada
CBI
Mexico
Source: KSA
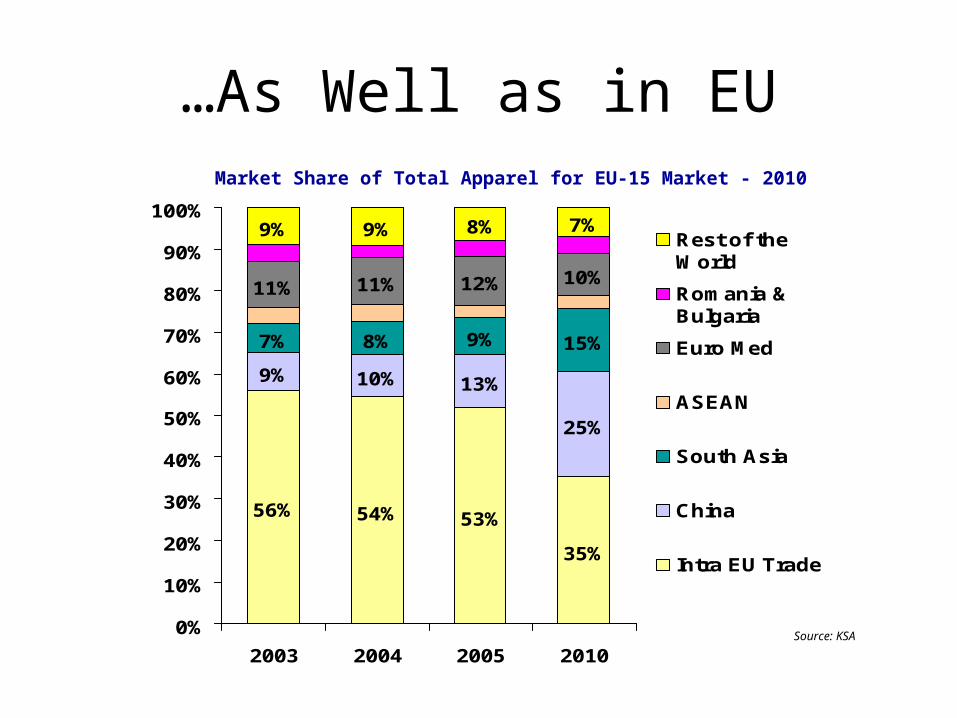
…As Well as in EU
56% 54% 53%
35%
9% 10% 13%
25%
7% 8% 9% 15%
11% 11% 12% 10%
9% 9% 8% 7%
0%
10%
20%
30%
40%
50%
60%
70%
80%
90%
100%
2003 2004 2005 2010
Rest of theWorld
Romania &Bulgaria
Euro Med
ASEAN
South Asia
China
Intra EU Trade
Source: KSA
Market Share of Total Apparel for EU-15 Market - 2010
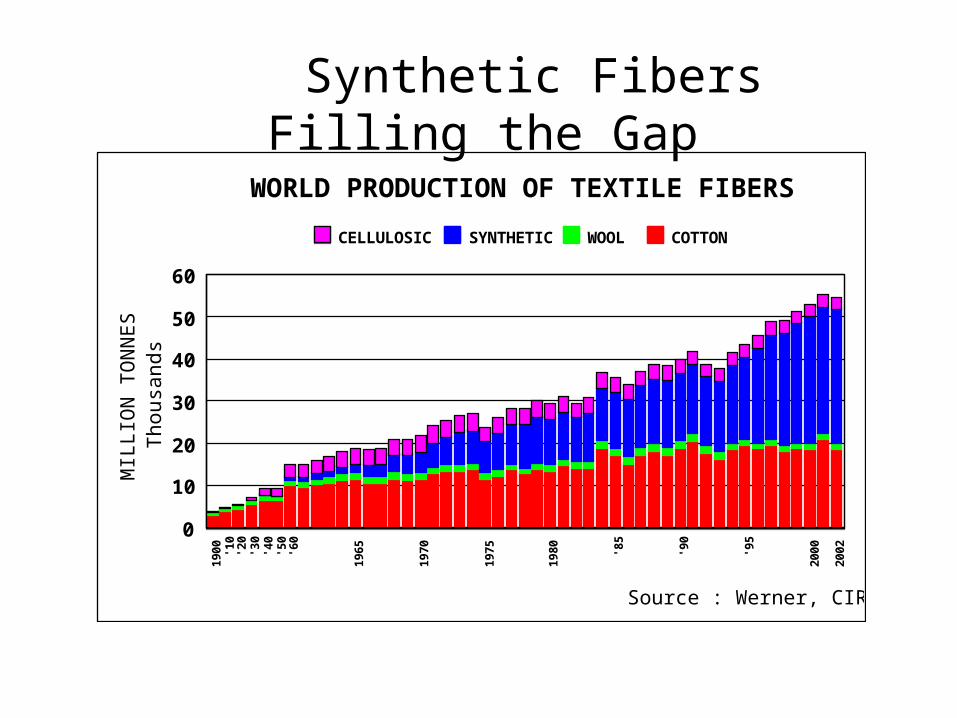
1900 '10
'20
'30
'40
'50
'60
1965
1970
1975
1980 '85
'90
'95
2000
2002
0
10
20
30
40
50
60
Tho
usan
dsM
ILLI
ON
TO
NN
ES
CELLULOSIC SYNTHETIC WOOL COTTON
Source : Werner, CIRFS
WORLD PRODUCTION OF TEXTILE FIBERS
Synthetic Fibers Filling the Gap
Changing Requirements of Customers
Customers are……• Focusing more on Retail end
and • Looking to Optimize Sourcing Costs
Therefore………• Identifying Their Strategic Partners …..and• Increasing Direct Sourcing

Traditional VS Strategic Relationships
80%
20%
Past
TransactionalVendors
Relationship
StrategicPartnerships
Future
20%
80%
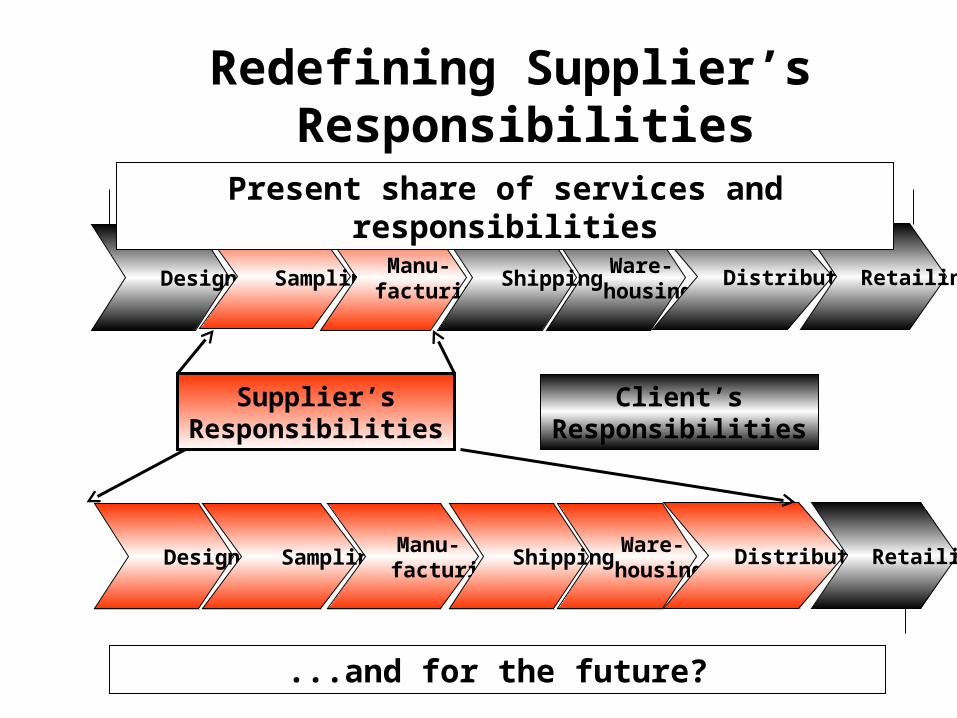
Redefining Supplier’s Responsibilities
Ware- housing
Distribution Retailing
Client’sResponsibilities
Design Sampling Manu-
facturing Shipping
Supplier’sResponsibilities
Ware- housing
Distribution Retailing Design Sampling Manu-
facturing Shipping
Present share of services and responsibilities
...and for the future?

Buyers are looking for complete Solutions
Convenience
Compliance
Cost
Flexibility
Speed
Innovation
Buyer Requirements
Successful Suppliers would need to build new competencies
• In addition to price and quality buyers would increasingly evaluate their supplier on:
– Innovations– Cycle Time Reduction – Product Design & Development– Supply Chain Optimization– Service Levels– Strategic Partnerships with Buyers

Globalization
Equally easy access to latest technologies for all players. Capital not technology is the only restricting factor
to set up new capacities
Equally easy access to latest technologies for all players. Capital not technology is the only restricting factor
to set up new capacities
Fully integrated textile chain becomes a strategic asset
Fully integrated textile chain becomes a strategic asset
Reliability in services and short lead times being THE KEY purchasing factors for buyers
initiating partnership and alliances
Reliability in services and short lead times being THE KEY purchasing factors for buyers
initiating partnership and alliances
The strategic choice for textile manufacturers is between high volume low
cost products or niche products
The strategic choice for textile manufacturers is between high volume low
cost products or niche products
Closures or reduction of textile production capacities in high cost countries, mainly EU, Japan, USA
Closures or reduction of textile production capacities in high cost countries, mainly EU, Japan, USA
Exchangeability of the products, price becomes major factor of
differentiation
Exchangeability of the products, price becomes major factor of
differentiation
In a Nutshell the Effects of Globalisation are…..

Competitiveness of Pakistan Textile Industry
Issues and Challenges
Pakistan Textiles & Apparel industry
1. Generates about 64 % of total exports2. Constitutes 46 % of Manufacturing
Industry3. Employs 40% of Country’s working
population
4. Contributes 11% of the total GDP
5. Pakistani clothing export growth slowed to 8% in 2006, following three years of double digit increase.
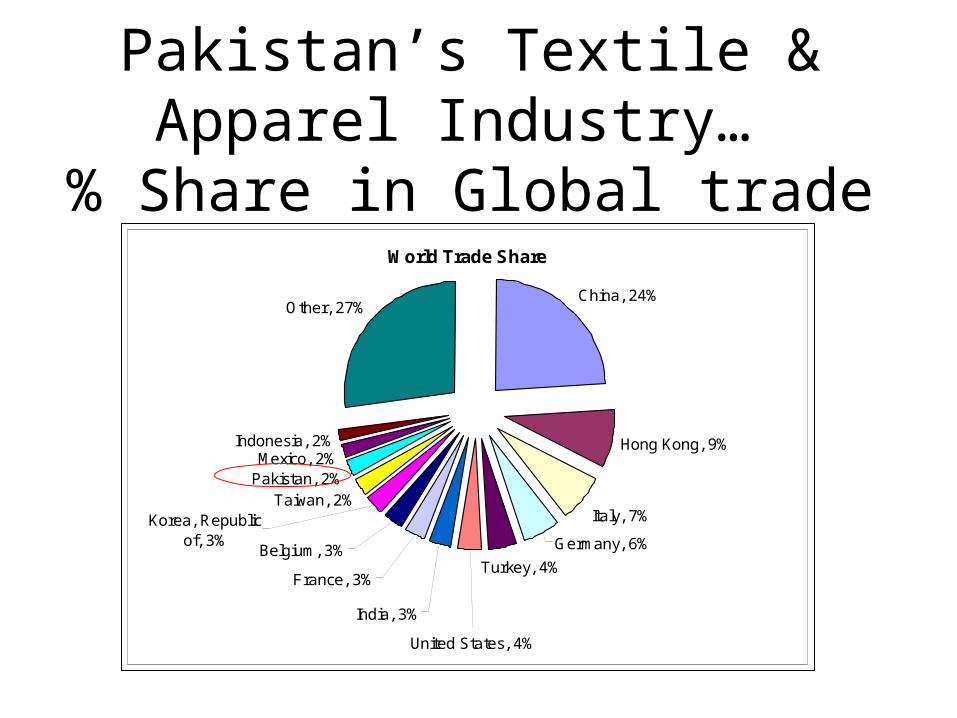
World Trade Share
China, 24%
Hong Kong, 9%
Italy, 7%Taiwan, 2%
Pakistan, 2%Mexico, 2%
Indonesia, 2%
Other, 27%
Germany, 6%
Turkey, 4%Belgium, 3%
France, 3%
United States, 4%
India, 3%
Korea, Republic of, 3%
Pakistan’s Textile & Apparel Industry…
% Share in Global trade
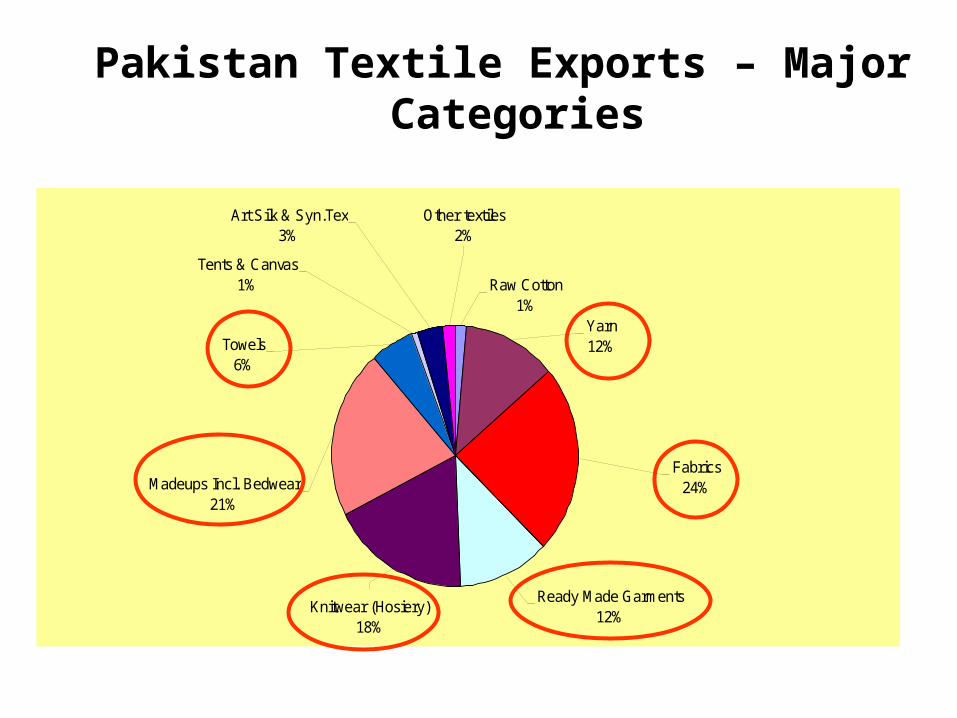
Pakistan Textile Exports – Major Categories
Fabrics 24%
Ready Made Garments 12%
Knitwear (Hosiery)18%
Madeups Incl. Bedwear 21%
Tents & Canvas 1%
Art Silk & Syn.Tex 3%
Towels 6%
Other textiles2%
Yarn 12%
Raw Cotton 1%
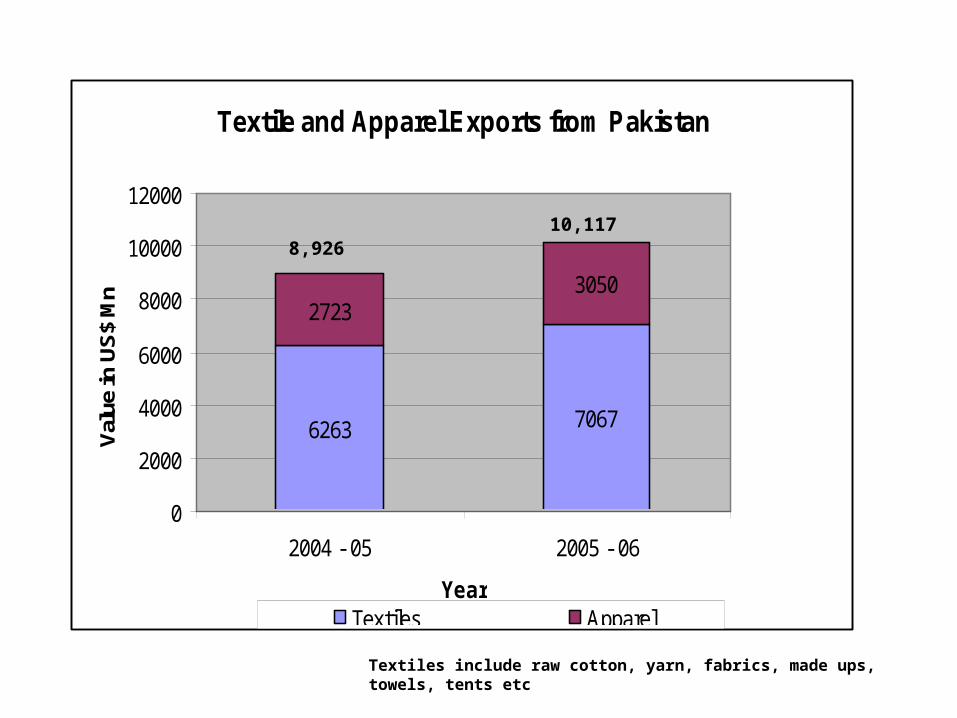
Textile and Apparel Exports from Pakistan
6263 7067
27233050
0
2000
4000
6000
8000
10000
12000
2004 - 05 2005 - 06
Year
Val
ue in
US
$ M
n
Textiles Apparel
8,92610,117
Textiles include raw cotton, yarn, fabrics, made ups, towels, tents etc
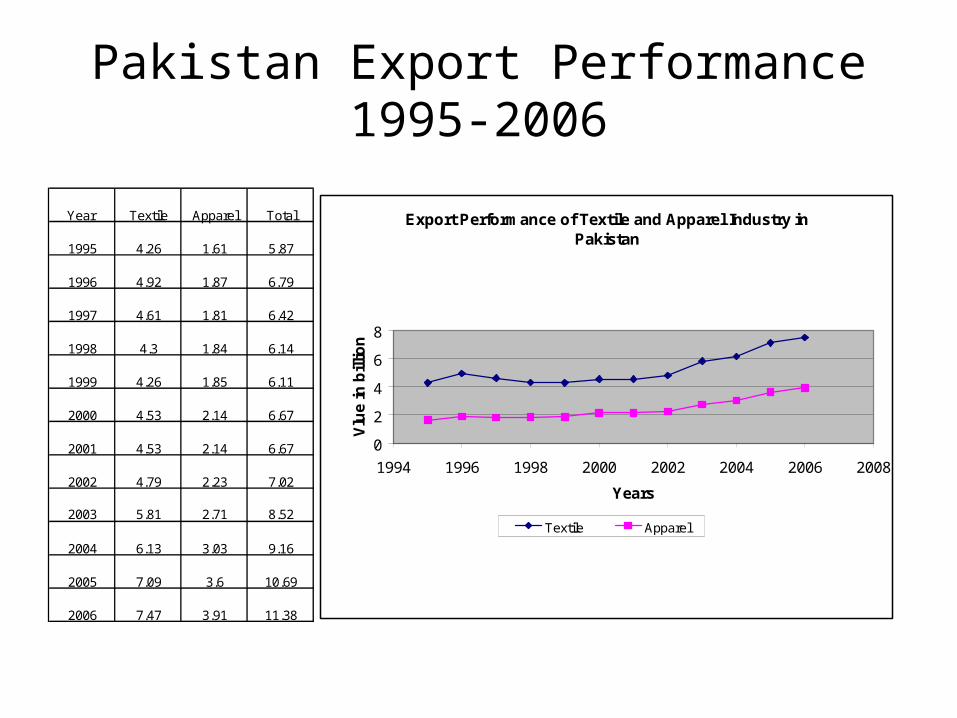
Pakistan Export Performance1995-2006
Year Textile Apparel Total
1995 4.26 1.61 5.87
1996 4.92 1.87 6.79
1997 4.61 1.81 6.42
1998 4.3 1.84 6.14
1999 4.26 1.85 6.11
2000 4.53 2.14 6.67
2001 4.53 2.14 6.67
2002 4.79 2.23 7.02
2003 5.81 2.71 8.52
2004 6.13 3.03 9.16
2005 7.09 3.6 10.69
2006 7.47 3.91 11.38
Export Performance of Textile and Apparel Industry in Pakistan
0
2
4
6
8
1994 1996 1998 2000 2002 2004 2006 2008
Years
Vlu
e in
bill
ion
Textile Apparel
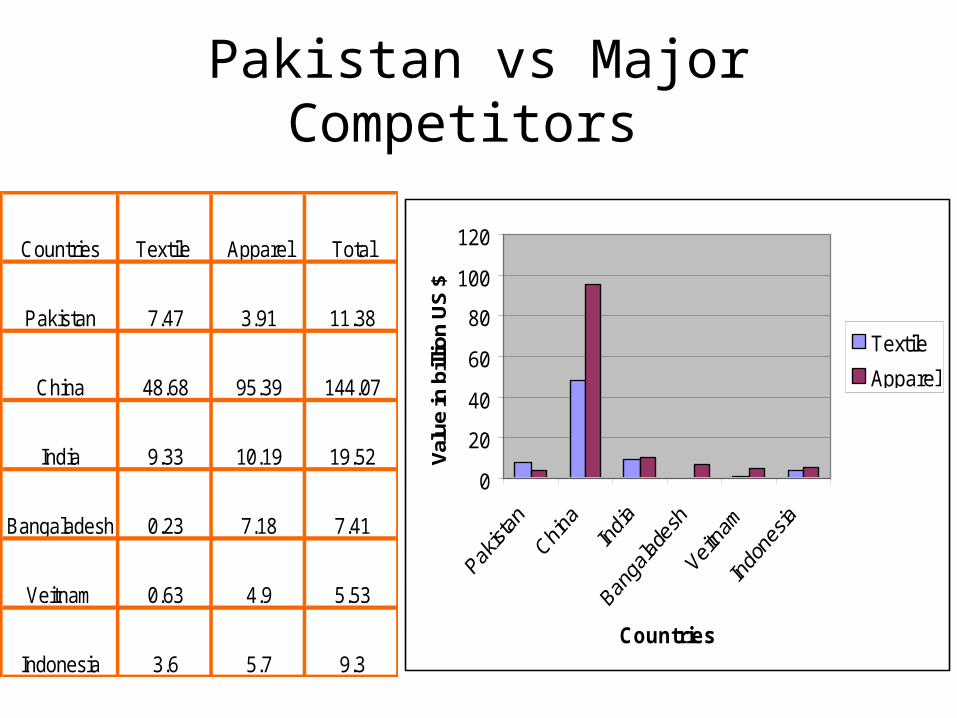
Pakistan vs Major Competitors
Countries Textile Apparel Total
Pakistan 7.47 3.91 11.38
China 48.68 95.39 144.07
India 9.33 10.19 19.52
Bangaladesh 0.23 7.18 7.41
Veitnam 0.63 4.9 5.53
Indonesia 3.6 5.7 9.3
0
20
40
60
80
100
120
Countries
Valu
e in
bill
ion
US
$
Textile
Apparel
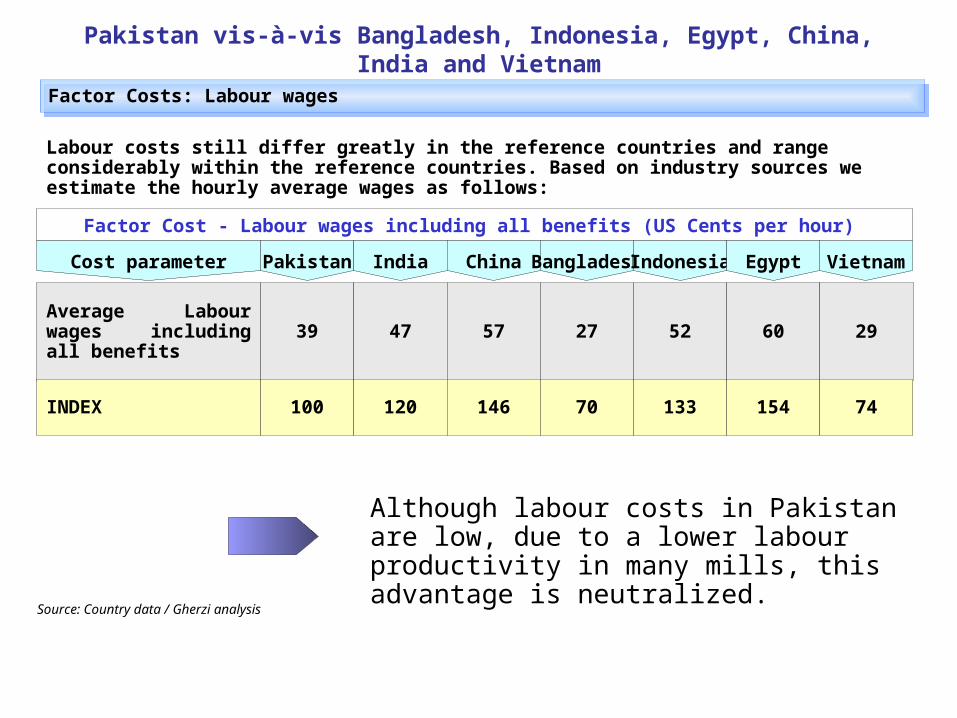
Cost parameter Pakistan India China Bangladesh Indonesia Egypt
Average Labour wages including all benefits 39 47 57 27 52 60
Factor Cost - Labour wages including all benefits (US Cents per hour)
Source: Country data / Gherzi analysis
Factor Costs: Labour wages Factor Costs: Labour wages
29
Vietnam
Labour costs still differ greatly in the reference countries and range considerably within the reference countries. Based on industry sources we estimate the hourly average wages as follows:
INDEX 100 120 146 70 133 154 74
Although labour costs in Pakistan are low, due to a lower labour productivity in many mills, this advantage is neutralized.
Pakistan vis-à-vis Bangladesh, Indonesia, Egypt, China, India and Vietnam
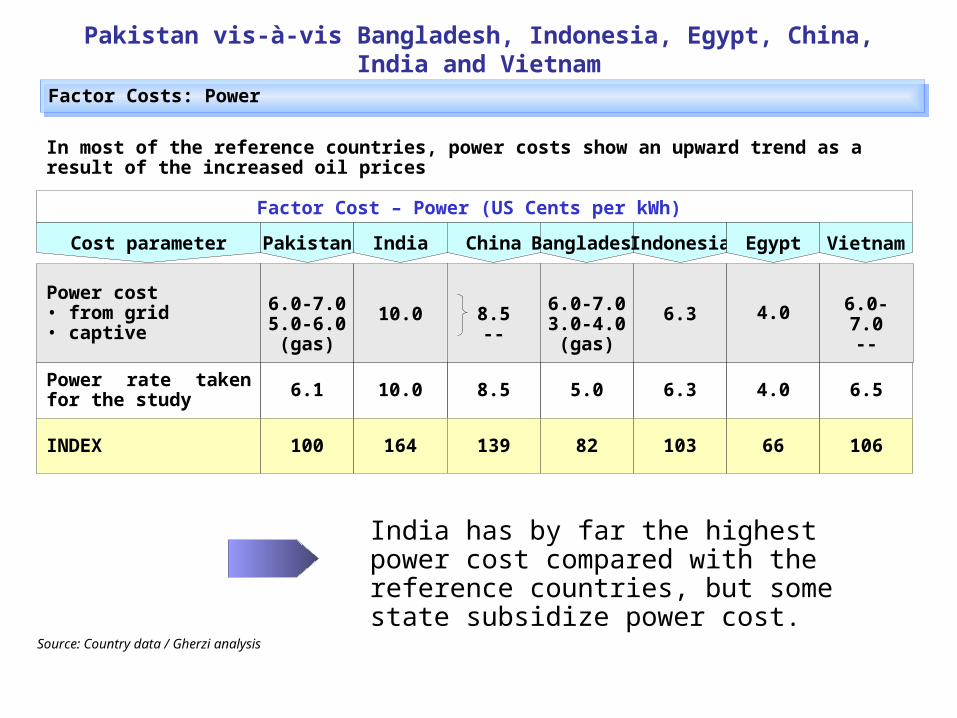
Source: Country data / Gherzi analysis
Factor Costs: PowerFactor Costs: Power
Cost parameter Pakistan India China Bangladesh Indonesia Egypt
Power cost• from grid• captive
6.0-7.05.0-6.0
(gas)
10.0 8.5--
6.0-7.03.0-4.0(gas)
6.3 4.0
Factor Cost – Power (US Cents per kWh)
6.0-7.0--
Vietnam
In most of the reference countries, power costs show an upward trend as a result of the increased oil prices
Power rate taken for the study 6.1 10.0 8.5 5.0 6.3 4.0 6.5
INDEX 100 164 139 82 103 66 106
India has by far the highest power cost compared with the reference countries, but some state subsidize power cost.
Pakistan vis-à-vis Bangladesh, Indonesia, Egypt, China, India and Vietnam
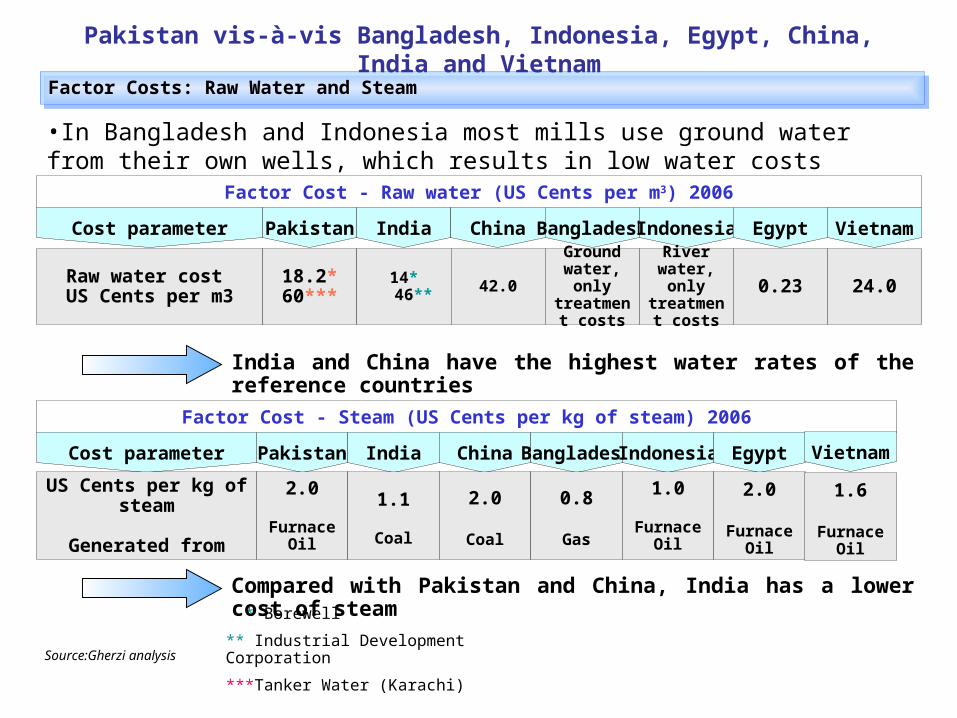
Factor Cost - Raw water (US Cents per m3) 2006
Source:Gherzi analysis
Cost parameter Pakistan India China Bangladesh Indonesia Egypt
Raw water cost US Cents per m3
18.2*60***
14* 46** 42.0
Ground water, onlytreatment
costs
River water, onlytreatment
costs
0.23 24.0
Vietnam
Factor Costs: Raw Water and SteamFactor Costs: Raw Water and Steam
•In Bangladesh and Indonesia most mills use ground water from their own wells, which results in low water costs
* Borewell
** Industrial Development Corporation
***Tanker Water (Karachi)
Factor Cost - Steam (US Cents per kg of steam) 2006
Cost parameter Pakistan India China Bangladesh Indonesia Egypt
US Cents per kg of steam
Generated from
2.0
Furnace Oil
1.1
Coal
2.0
Coal
0.8
Gas
1.0
Furnace Oil
2.0
Furnace Oil
Vietnam
1.6
Furnace Oil
India and China have the highest water rates of the reference countries
Compared with Pakistan and China, India has a lower cost of steam
Pakistan vis-à-vis Bangladesh, Indonesia, Egypt, China, India and Vietnam
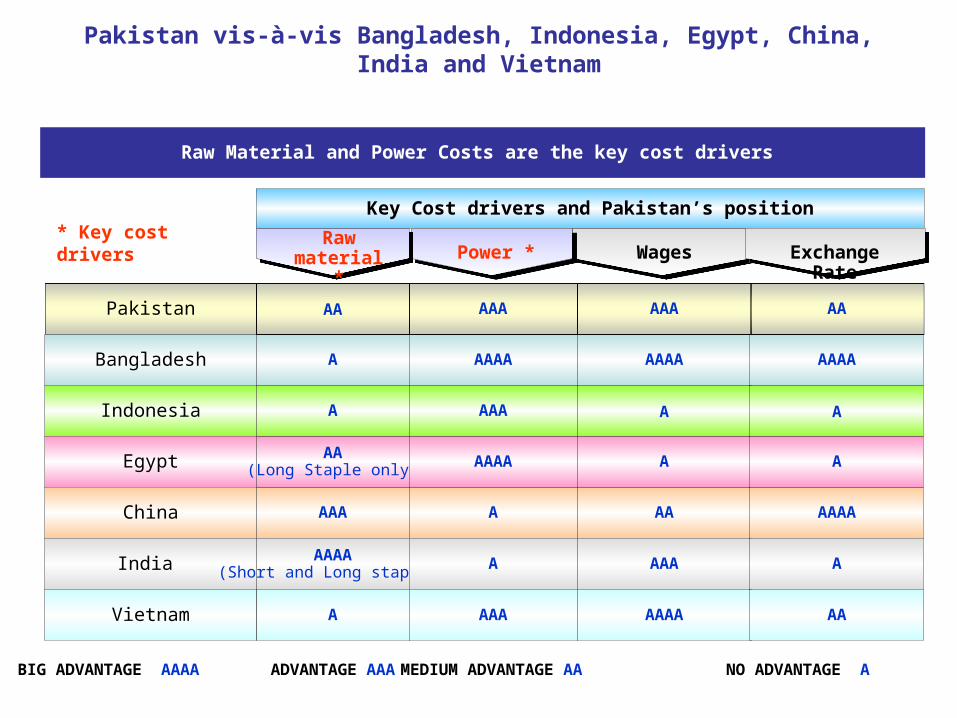
Raw Material and Power Costs are the key cost drivers
BIG ADVANTAGE AAAA ADVANTAGE AAA MEDIUM ADVANTAGE AA NO ADVANTAGE A
Raw material
*Power * Wages
Key Cost drivers and Pakistan’s position* Key cost drivers
Exchange Rate
Pakistan
Bangladesh
Indonesia
Egypt
China
India
AAA A AA
AA(Long Staple only) AAAA A
A AAA A
A AAAA AAAA
AA AAA AAA
AAAA(Short and Long staples) A AAA
A AAA AAAAVietnam
AAAA
A
A
AAAA
AA
A
AA
Pakistan vis-à-vis Bangladesh, Indonesia, Egypt, China, India and Vietnam
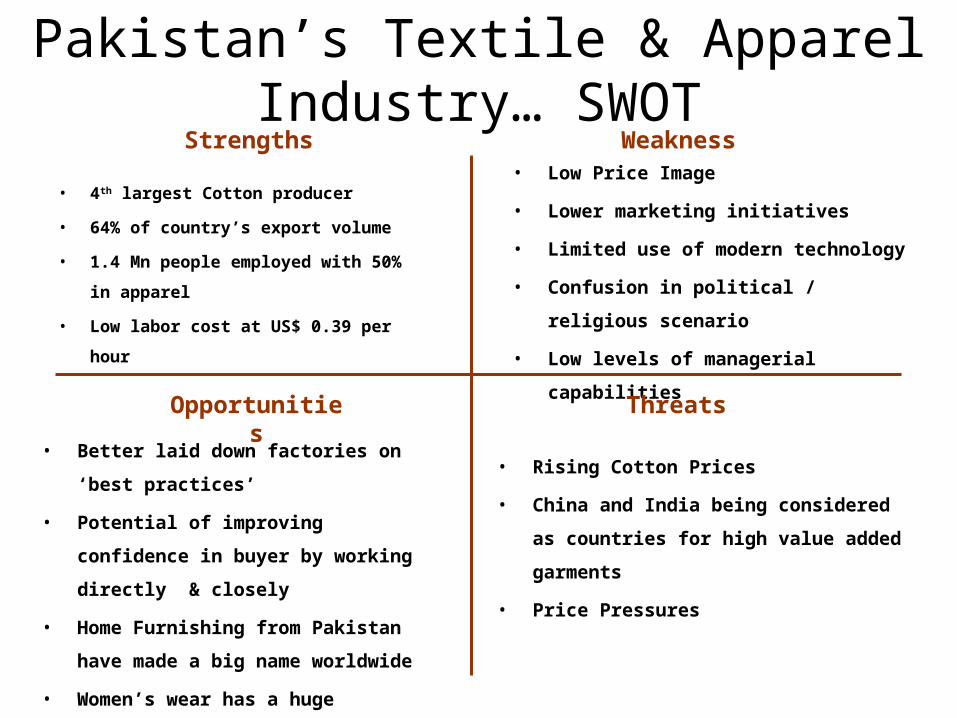
Pakistan’s Textile & Apparel Industry… SWOT
• 4th largest Cotton producer
• 64% of country’s export volume
• 1.4 Mn people employed with 50% in
apparel
• Low labor cost at US$ 0.39 per hour
• Low Price Image
• Lower marketing initiatives
• Limited use of modern technology
• Confusion in political / religious
scenario
• Low levels of managerial capabilities
• Rising Cotton Prices
• China and India being considered as
countries for high value added garments
• Price Pressures
• Better laid down factories on ‘best
practices’
• Potential of improving confidence in
buyer by working directly & closely
• Home Furnishing from Pakistan have
made a big name worldwide
• Women’s wear has a huge potential
Strengths Weakness
Opportunities Threats

What Needs to be done
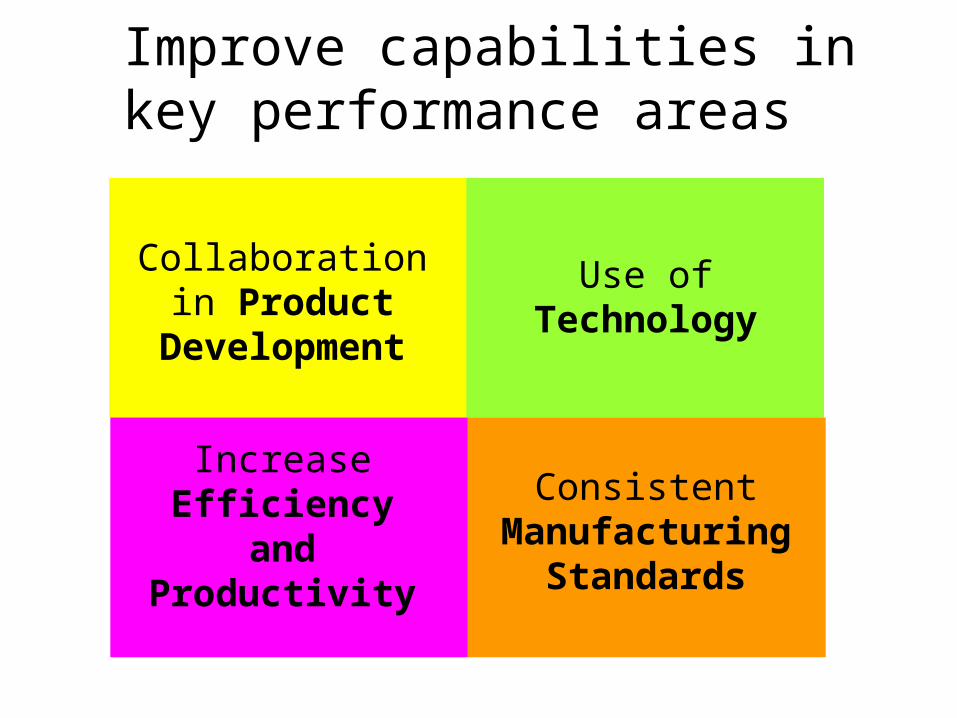
Use of Technology
Collaboration in Product
Development
Increase Efficiency and Productivity
Consistent Manufacturing
Standards
Improve capabilities in key performance areas

• Build capabilities in the following areas:
– Productivity Improvements across Supply Chain
– Consolidating Operations
– Building Logistic Capabilities
– Developing long term relationships with Clients
– Collaborating with buyers on forecasting and
inventory management
– Investing in IT infrastructure and compliance
What Needs to be done
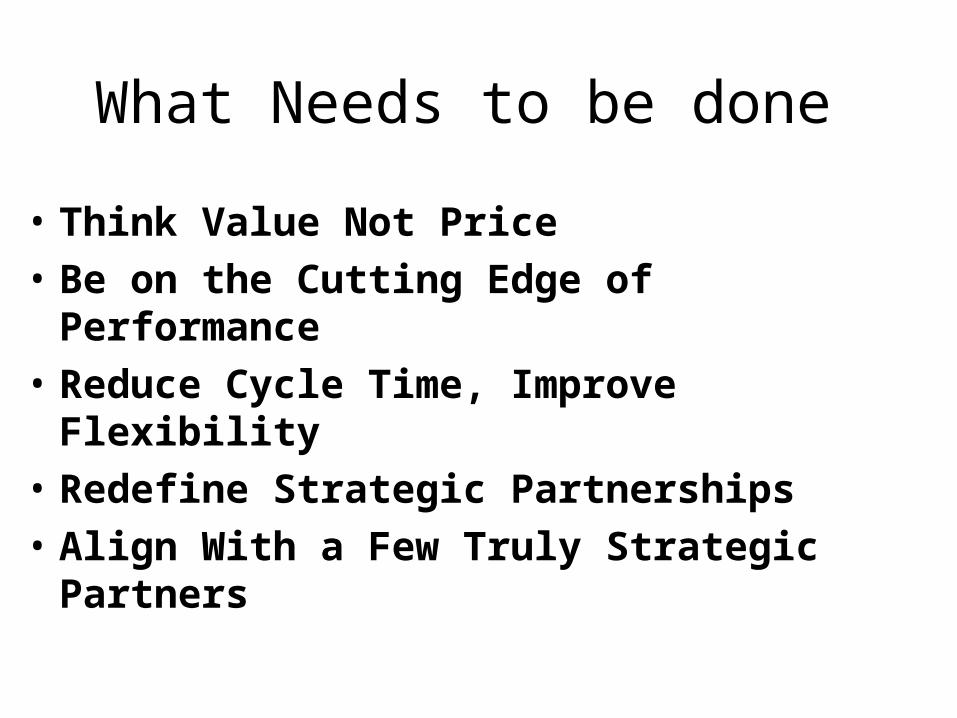
What Needs to be done
• Think Value Not Price
• Be on the Cutting Edge of Performance
• Reduce Cycle Time, Improve Flexibility
• Redefine Strategic Partnerships
• Align With a Few Truly Strategic Partners

Thank You