4 firm strategic resources and sustained competitive advantage - barney
University of KentuckyUKnowledge
University of Kentucky Doctoral Dissertations Graduate School
2009
COMPETITIVE STRATEGY, ALLIANCENETWORKS, AND FIRM PERFORMANCEGoce AndrevskiUniversity of Kentucky, [email protected]
Click here to let us know how access to this document benefits you.
This Dissertation is brought to you for free and open access by the Graduate School at UKnowledge. It has been accepted for inclusion in University ofKentucky Doctoral Dissertations by an authorized administrator of UKnowledge. For more information, please contact [email protected].
Recommended CitationAndrevski, Goce, "COMPETITIVE STRATEGY, ALLIANCE NETWORKS, AND FIRM PERFORMANCE" (2009). University ofKentucky Doctoral Dissertations. 710.https://uknowledge.uky.edu/gradschool_diss/710

ABSTRACT OF DISSERTATION
Goce Andrevski
The Graduate School
University of Kentucky
2009

COMPETITIVE STRATEGY, ALLIANCE NETWORKS AND
FIRM PERFORMANCE
ABSTRACT OF DISSERTATION
A dissertation submitted in partial fulfillment of the
requirements for the degree of Doctor of Philosophy in the
College of Business and Economics
at the University of Kentucky
By
Goce Andrevski
Lexington, Kentucky
Co-Directors: Dr. Walter J. Ferrier, Gatton Endowed Associate Professor of Management
and Dr. Daniel J. Brass, J. H. Hilliard Professor of Innovation Management
Lexington, Kentucky
2009
Copyright © Goce Andrevski 2009

ABSTRACT OF DISSERTATION
COMPETITIVE STRATEGY, ALLIANCE NETWORKS, AND FIRM
PERFORMANCE
This dissertation explores the interplay between competitive strategy and alliance
network structure in explaining firm performance in highly volatile environments (e.g.,
personal computers or consumer electronics). In particular, I examine the following three
questions: (1) Which competitive strategies enable firms to gain superior performance?
(2) How do these strategies affect the firm‘s networking behavior and lead to the
formation of particular network positions? (3) What optimal combinations of competitive
strategies and network structures maximize firm performance?
Firms can outperform rivals by pursuing two types of competitive strategies:
advantage-creating and advantage-enhancing. Each of these strategies creates different
needs, motivations, and opportunities for collaborative activity. Therefore, certain
regularities in the firms‘ strategic behavior in the previous period can lead to distinctive
and recognizable patterns of networking behavior in the future period, which in turn leads
to predictable types of network structure. This study shows that firms with superior
advantage-creating strategies become embedded in sparse network structures and are
more likely to form non-equity alliances in the future period, whereas firms with strong
advantage-enhancing tendencies become embedded in dense network structures with
many equity-based alliances in the future period. However, if different strategies lead to
formation of different types of network structure, are these tendencies beneficial for firm
performance? If not, what is the optimal combination of competitive strategy and
network structure that maximizes firm performance? I argue that network structure

iv
provides advantageous access to external resources that can both complement (enhance)
the internal capabilities of the firm and substitute for the capabilities that a firm is
lacking. I find that network structure plays both complementary and substitutive roles.
However, my findings suggest dense network structure is more beneficial for firms that
have superior either advantage-creating or advantage-enhancing capabilities, whereas
firms with inferior internal capabilities can benefit more from a sparse network structure.
I tested the proposed dynamic model on a sample of the largest 125 firms from computers
and electronics industries that initiated 11,075 competitive actions and were embedded in
a larger network of 36,766 alliances over 7 years.
KEYWORDS: Strategic Entrepreneurship, Corporate Entrepreneurship,
Alliance Networks, Social Network Theory,
Competitive Strategy
Goce Andrevski
April 28, 2009

COMPETITIVE STRATEGY, ALLIANCE NETWORKS AND FIRM
PERFORMANCE
By
Goce Andrevski
Dr. Walter J. Ferrier
Co-Director of Dissertation
Dr. Daniel J. Brass
Co-Director of Dissertation
Dr. Merlin Hackbart
Director of Graduate Studies
April 28, 2009

RULES FOR THE USE OF DISSERTATIONS
Unpublished dissertations submitted for the Doctor‘s degree and deposited in the
University of Kentucky Libraries are as a rule open for inspection, but are to be used only
with due regard to the rights of the authors. Bibliographical references may be noted, but
quotations or summaries of parts may be published only with the permission of the
author, and with the usual scholarly acknowledgements.
Extensive copying or publication of the dissertation in whole or in part also requires the
consent of the Dean of the Graduate School of the University of Kentucky.
A library that borrows this dissertation for use by its patrons is expected to secure the
signature of each user.
Name Date

DISSERTATION
Goce Andrevski
The Graduate School
University of Kentucky
2009
COMPETITIVE STRATEGY, ALLIANCE NETWORKS AND FIRM
PERFORMANCE
DISSERTATION
A dissertation submitted in partial fulfillment of the
requirements of the degree of Doctor of Philosophy
in the College of Business and Economics
at the University of Kentucky
By
Goce Andrevski
Lexington, Kentucky
Co-Directors: Dr. Walter J. Ferrier, Gatton Endowed Associate Professor of Management
and Dr. Daniel J. Brass, J. H. Hilliard Professor of Innovation Management
Lexington, Kentucky
2009
Copyright © Goce Andrevski 2009

To My Wife, Viki
I thank God for bringing you in my life. You make every failure bearable and every
triumph memorable. I love you!

iii
ACKNOWLEDGEMENTS
I would like to thank my adviser, Dr. Walter Ferrier, for providing me with many
insightful comments and suggestions during the development of this dissertation. I am
grateful for his time and readiness to meet with me regularly through many formal and
informal conversations to enhance my intellectual potential. He provided a perfect
balance between direction and guidance in shaping my research ideas and autonomy and
freedom to develop my own stream of research. He has been a great friend and mentor
who inspired me to strive to achieve academic excellence. I also want to express my
gratitude to my dissertation co-chair, Dr. Dan Brass. I was fortunate to have an
opportunity to learn from him and to have his support throughout my doctoral studies at
University of Kentucky. I have benefited immensely from his intellectual ability to
recognize the gist of complex problems and to ask thought-provoking questions. His
comments and suggestions have been invaluable for developing my research ideas. We
should all aspire to the personal and professional standards of Dan and Wally. I hope I
will be able to inspire other students as these mentors have inspired me.
I owe a special thanks to Joe Labianca who served as a member of my dissertation
committee. I am grateful to him for providing me with thorough feedback and thoughtful
suggestions in the previous drafts of this dissertation and for continuously challenging me
to develop rigorous reasoning and empirical analyses. I am also thankful to Frank Scott
for serving as a member of my committee and for asking challenging questions that
helped me improve my research. I am especially grateful to Jeff Covin from Indiana
University for serving as the Dean‘s appointed outside examiner of my dissertation
defense. Jeff‘s comments and ideas for improving my current dissertation work and for

iv
extending it into new research avenues have been truly invaluable. In this respect, I am
thankful to University of Kentucky‘s Graduate School for awarding me with the Myrle E.
and Verle D. Nietzel Visiting Distinguished Faculty Program Award, which provided
financial support for Jeff Covin‘s visit.
I also want to thank to all other professors at the University of Kentucky that I had
a chance to learn from and work with on various doctoral seminars and projects. I am
especially indebted to Dr. Jason Shaw and Dr. Steve Borgatti for their willingness to
share with me their enormous knowledge on research methods and for providing me
advice and suggestions on various projects. I want to thank Professors Brian Dineen,
Michelle Duffy, Ajay Mehra, and Emery Yao, who also contributed to my development
as a researcher and as a teacher. In addition, I want to thank Jacquelyn Thompson for
being so helpful in editing my dissertation and many other papers.
I am grateful to the current and former PhD students in the College of Business
and Economics at the University of Kentucky for their support and friendship. I would
like to thank especially Travis Grosser and Chris Sterling for the many inspiring Café
conversations. Thanks also to Ruolian Fang, Jody Damron, Margaret Hughes, Kelly
Rehm, Xun Lee, Shashank Rao, Zsuzsa Huszar, Pankaj Maskara, Ginny Kidwell, Scott
Soltis, Brandon Ofem, and Josh Marineau.
My family has been constant support throughout my PhD studies. No words can
express how grateful I am to my parents Zlatka and Paunko for providing me with
unconditional love, encouragement, and support. I thank them for sacrificing so much to
provide me with an opportunity to pursue my dreams. I am also thankful to my sister
Danche and her husband Sasko; without their emotional and financial support, this

v
accomplishment would not have been possible. I want also to thank Bobo and Jamie
Gjorgjevic for their sincere friendship and support and Filip Angelovski for developing
data-coding software for my dissertation research.

vi
TABLE OF CONTENTS
ACKNOWLEDGEMENTS ............................................................................................... iii
LIST OF TABLES ........................................................................................................... viii LIST OF FIGURES ........................................................................................................... ix CHAPTER I: INTRODUCTION .........................................................................................1
Overview ..........................................................................................................................1 Competitive Strategy and Firm Performance ...............................................................4
Competitive Strategy and Network Formation.............................................................5 Competitive Strategy, Network Structure, and Firm Performance ..............................6
Intended Contributions for Research and Practice ...........................................................8 CHAPTER II: COMPETITIVE STRATEGY AND FIRM PERFORMANCE ................11
Introduction ....................................................................................................................11
Theoretical Background .................................................................................................11 Conceptualization of competitive strategy .................................................................11
Defining advantage-creating strategy .........................................................................14
Defining advantage-enhancing tendencies .................................................................17 Theory and Hypotheses ..................................................................................................19
Advantage-creating tendencies, advantage-enhancing tendencies, and firm
performance ................................................................................................................19 Strategic entrepreneurship and firm performance ......................................................22
CHAPTER III: COMPETITIVE STRATEGY AND ALLIANCE NETWORK
FORMATION ....................................................................................................................24 Introduction ....................................................................................................................24
Theoretical Background .................................................................................................26 Theory and Hypotheses ..................................................................................................28
Advantage-creating tendencies and network structure ...............................................28 Advantage-creating tendencies and weak ties ............................................................31
Advantage-enhancing tendencies and network structure ...........................................32 Advantage-enhancing tendencies and strong ties .......................................................34 Strategic entrepreneurship and network structure ......................................................35
CHAPTER IV: COMPETITIVE STRATEGY, ALLIANCE NETWORK STRUCTURE
AND FIRM PERFORMANCE..........................................................................................37
Introduction ....................................................................................................................37 Theoretical Background .................................................................................................37 Theory and Hypotheses ..................................................................................................40
Advantage-creating tendencies and firm performance ...............................................41 Advantage-enhancing tendencies and firm performance ...........................................43
CHAPTER V: RESEARCH METHODOLOGY ..............................................................46 Sample Selection ............................................................................................................46
Alliance Network: Data and Measures ...........................................................................47 Data.............................................................................................................................47 Measures .....................................................................................................................49
Advantage-enhancing Strategic Tendencies: Data and Measures ..................................52 Data.............................................................................................................................52 Measures .....................................................................................................................53

vii
Advantage-creating Strategic Tendencies: Data and Measures .....................................57
Proactiveness: Data and Measures .............................................................................57 Innovativeness: Data and measures ............................................................................60
Performance ...................................................................................................................64
Control Variables ...........................................................................................................64 Construct Validity ..........................................................................................................65 Research Design .............................................................................................................67 Model Specification .......................................................................................................68
Modeling performance ...............................................................................................69
Modeling network structure .......................................................................................71 CHAPTER VI: RESULTS .................................................................................................73
Summary Statistics and Correlation Matrix ...................................................................73 Competitive Strategy and Firm Performance .................................................................75
Hypothesis 1 ...............................................................................................................75 Hypothesis 2 ...............................................................................................................75
Post-hoc analysis ........................................................................................................76 Hypothesis 3 ...............................................................................................................77
Competitive Strategy and Alliance Network Formation ................................................82 Hypothesis 4 ...............................................................................................................82 Hypothesis 5 ...............................................................................................................82
Hypothesis 6 ...............................................................................................................83 Hypothesis 7 ...............................................................................................................83
Hypotheses 8a and 8b .................................................................................................84 Competitive Strategy, Alliance Network Structure and Firm Performance ...................89
Hypothesis 9 ...............................................................................................................89
Hypothesis 10 .............................................................................................................90
Hypothesis 11 .............................................................................................................94 Hypothesis 12 .............................................................................................................95 Robustness check........................................................................................................98
CHAPTER VII: DISCUSSION AND CONCLUSION ...................................................100 Overview ......................................................................................................................100
Competitive Strategy and Firm Performance ...............................................................101 Competitive Strategy and Network Formation ............................................................102
Competitive Strategy, Network Structure, and Firm Performance ..............................104 Limitations and Future Research ..................................................................................107 Conclusion ....................................................................................................................112
REFERENCES ................................................................................................................114 APPENDIX ......................................................................................................................122
VITA ................................................................................................................................128

viii
LIST OF TABLES
Table 1: Scores of Network Constraint and Betweenness Centrality ................................51
Table 2: Selected News Reports on Advantage-enhancing Actions ..................................56
Table 3: Selected News Reports on ―Proactive‖ New Products ........................................59
Table 4: Example of Multiple News Sources ....................................................................60
Table 5: Eigenvalues ..........................................................................................................66
Table 6: Factor Loadings ...................................................................................................67
Table 7: Summary Statistics and Correlation Matrix ........................................................74
Table 8: ACT, AET and Performance ...............................................................................79
Table 9: ACT, AET and Performance ...............................................................................80
Table 10: The Effect of Innovativeness on AET and Proactiveness .................................81
Table 11: ACT, AET and Network Structure ....................................................................87
Table 12: ACT, AET and Strength of Ties ........................................................................88
Table 13: ACT, Network Structure and Performance .......................................................92
Table 14: Advantage-creating strategy, Network Structure and Performance ..................93
Table 15: Advantage-enhancing strategy, Network Structure and Performance ...............96
Table 16: AET, Network Structure and Performance ........................................................97

ix
LIST OF FIGURES
Figure 1: Apple‘s iPod Collaborative Network ...................................................................1
Figure 2: Theoretical Model ................................................................................................4 Figure 3: Competitive Strategy and Firm Performance .......................................................5 Figure 4: Competitive Strategy and Network Structure ......................................................6 Figure 5: Competitive Strategy, Network Structure and Firm Performance .......................7 Figure 6: Conceptualization of Competitive Strategy .......................................................13
Figure 7: Conceptualization of Advantage-Creating and Advantage-Enhancing Strategy14 Figure 8: Advantage-creating and Advantage-enhancing Strategic Tendencies ...............19 Figure 9: Network Constraint versus Betweenness Centrality ..........................................51 Figure 10: Network Constraint versus Betweenness Centrality ........................................51 Figure 11: Network Density...............................................................................................52
Figure 12: Scree Plot ..........................................................................................................66 Figure 13: Research Design ...............................................................................................68
Figure 14: Interaction between ACT (Proactiveness) and AET ........................................77
Figure 15: Interaction between ACT (proactiveness) and AET in Explaining Future
Betweenness Centrality ......................................................................................................85 Figure 16: Interaction between ACT (proactiveness) and AET in Explaining Future
Network Density ................................................................................................................86 Figure 17: Moderating role of Betweenness Centrality on the Relationship Between ACT
(proactivenes) and Performance ........................................................................................90
Figure 18: Moderating role of Network Density on the Relationship between ACT
(Innovativeness) and Performance .....................................................................................91
Figure 19: Moderating Role of Network Density on the Relationship Between AET and
Performance .......................................................................................................................94
Figure 20: Moderating role of Betweenness Centrality on the Relationship Between AET
and Performance ................................................................................................................95
Figure 21: Moderating role of Betweenness Centrality on the Relationship Between AET
and Performance ..............................................................................................................106 Figure 22: Moderating role of Betweenness Centrality on the Relationship Between ACT
(proactivenes) and Performance ......................................................................................106

1
CHAPTER I: INTRODUCTION
Overview
In today‘s hypercompetitive environments (D‘Aveni, 1994), firms do not control
all resources necessary for persistently outperforming rivals. In industries such as
personal computers or consumer electronics, products are complex systems that comprise
many components and modules produced and supplied by a variety of independent
suppliers (Garud & Kumaraswamy, 2003). For example, Apple‘s iPod consists of more
than 400 components and modules, none of which is manufactured internally. Figure 1
below illustrates Apple‘s ten major suppliers (that account for 85% of the iPod‘s costs)
and alliances with firms with complementary products and services that upgrade and
enhance the user‘s experience and value of the iPod.
Figure 1: Apple’s iPod Collaborative Network
Ap p le ’s 10 la rge st su p pl ie rs fo r iPo d *
B M W G M
A pp le ’ iP od
U nk no w n
B a tte ry P a ck
R e ne s a s (J ap a n)
D is pla y D riv e r
Inv e n te c (T a iw a n) -
A ss e m bly , T e st i ng
T o s hi ba ( Ch in a) – H a rd D rive
B ro a dco m (S ing a po re ) -
M u lt im e dia P roc e ss or
T os hi ba -M a ts u sh ita (J a pa n )-
D is pla y M o du le
Po rtal P la y e r (U S)
P orta l P la ye r CP U
U nk no w n
B a ck E nc lo s ure
U n kn ow n
M a in bo a rd PC B
D is n e y
T i m e x
D ig ita l M u s ic
G ro up
D e l ta A ir li ne
N i ke
S a m s un g (K ore a) – M o b ile
SD R A M m e m o ry
Co lla b or a tors f o r o ff e ring p ro du c t b u nd le s
* 85% o f th e c o s t ; 40 0 a d d it ion a l in p ut s ; A p ple o u ts ou rc e s a l l of i ts m a n u fa c tu rin g
* * S ou rc e : L in d e n, K ra e m e r, & D e d ric k (200 7) PC IC Al fre d Slo a n Fo u nd a tio n a n d P orte ll ig e n t In c .
2
How do firms such as Apple frequently design innovative products, such as the
iPod or iPhone? How is Apple able to continuously improve these products despite the
lack of ownership and control of the resources needed for their development? To create
an innovative complex product, firms need to be aware of ―who knows what‖ in the
market (i.e., the most recent technologies and competences developed by other firms).
However, this information is not available to all firms; only those that closely collaborate
with other firms with specialized knowledge in different technological domains have
ready access to such information. The awareness of the technological possibilities is a
precondition for discovering new resource combinations (O‘Driscoll & Rizzo, 1996). In
addition, once the product is designed, the firm needs to extensively collaborate and
coordinate the activities of various suppliers as these components are continuously
improved and updated (Garud & Kumaraswamy, 2003).
This suggests that the ability of the firm to frequently create innovative products
and to intensively improve and enhance their value depends on successful collaboration
with partners from various industries and technological domains. These
interdependencies can be effectively managed through forming strategic alliances, since
alliances ease transfer of fine-grained information, curb opportunistic behavior, and
encourage sharing of ideas and technologies (Uzzi, 1997). Because each firm needs to
collaborate with many partners, firms are constantly embedded in a complex network of
alliances. The structure of these alliance networks can provide advantageous access to
valuable strategic resources and information that increases firms‘ potential to
continuously create new innovative products or intensively improve the value of the
existing modular products (Gulati, Nohria & Zaheer, 2000; Gnyawali & Madhavan,
2001).
Given the importance of alliance networks for the firms‘ competitive success, it is
critical to understand (1) how and why firms form different types of alliance networks,
and (2) how and why different firms benefit from different types of alliance networks. In
this dissertation, I argue that for adequate understanding of these questions, it is critical to
consider the type of competitive strategy a firm is pursuing. Different competitive
strategies lead to the formation of different types of alliance networks, and each type of

3
competitive strategy requires an optimal structure of alliance network to maximize firm
performance.
More specifically, different strategies create different needs, incentives, and
motives for collaboration with rivals. As a result, firms with different strategies engage in
different patterns of collaborative activity. These networking patterns are stable over time
and form a recognizable interfirm network structure, which is defined as a set of firms
and a pattern of alliance ties that connect these firms (Brass, Galaskiewicz, Greve, &
Tsai, 2004). Thus, to understand why firms form different types of network structures, we
need to know their competitive strategies.
Furthermore, if firms pursue different strategies and each strategy leads to a
distinctive type of network structure, do these combinations of strategies and network
structures have a positive effect on firms‘ performance? If not, what is the optimal
network structure for each strategy type that maximizes firm performance? To answer
these questions, I also examine which type of network structure is the most beneficial for
each type of competitive strategy. Once the network structure is formed, it provides
network level benefits for the firm beyond the immediate gains from each alliance.
Different network structures provide firms with access to different types of network
resources. The extent to which a firm will exploit such external resource potential
depends on its competitive strategies. Different strategies may benefit from different
types of network resources, and therefore it is important to examine which network
structure is optimal for each strategy type. Hence, this dissertation examines the
following three research questions:
1. Which competitive strategies enable firms to gain superior performance in
highly volatile environments?
2. How do these strategies affect the firm‘s networking behavior and lead to
the formation of particular network positions?
3. What are the optimal combinations of competitive strategies and network
positions for firms to gain superior performance?
Figure 2 below shows the proposed theoretical model in this dissertation. Chapter 2
examines the link between current strategy and future performance (question 1 above);
Chapter 3 examines the relationship between past strategy and current network structure

4
(question 2 above); and Chapter 4 explores how current network structure and current
competitive strategy interact in explaining future firm performance (question 3 above). I
briefly discuss the content of each of these chapters below.
Figure 2: Theoretical Model
Competitive Strategy and Firm Performance
In Chapter 2, I introduce two distinctive strategies: advantage-creating and
advantage-enhancing, and examine how these strategies enable firms to outperform rivals
in hypercompetitive environments. Strategy in this study is conceptualized as a pattern in
the stream of firms‘ actions over time (Mintzberg, 1978) or a tendency of firms to act in a
particular way. I use the term tendency to emphasize that firms engage in recurring
patterns of strategic actions over time. For example, some firms show tendencies to be
frequently first to introduce new products and services and to develop radically new
technologies. Because these strategic tendencies enable firms to create new competitive
advantages, I will refer to them as advantage-creating tendencies. Other firms exhibit
strong tendencies to aggressively initiate competitive actions (such as product
improvements, price cuts, advertising, capacity building) that enable them to protect or
extend their existing market position. These tendencies enhance the existing competitive
advantages of the firm, and I refer to them as advantage-enhancing tendencies. Firms
5
differ in their abilities to pursue each tendency. Some firms outperform rivals by
possessing superior advantage-creating capabilities, whereas others have superior
capabilities to aggressively protect and enhance their existing competitive advantages.
Firms that possess superior abilities to exhibit simultaneously high advantage-creating
and high advantage-enhancing tendencies will exhibit the best performance (Ireland, Hitt,
& Sirmon, 2003). I will refer to this combined strategic tendency as strategic
entrepreneurship.
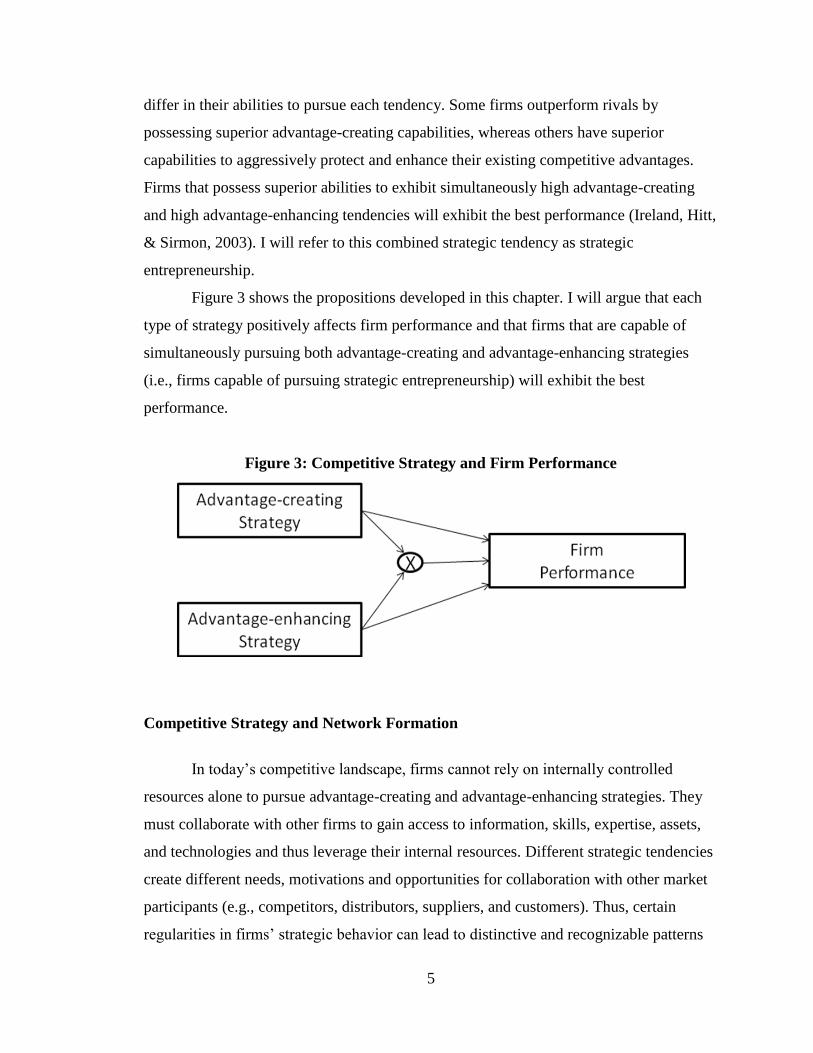
Figure 3 shows the propositions developed in this chapter. I will argue that each
type of strategy positively affects firm performance and that firms that are capable of
simultaneously pursuing both advantage-creating and advantage-enhancing strategies
(i.e., firms capable of pursuing strategic entrepreneurship) will exhibit the best
performance.
Figure 3: Competitive Strategy and Firm Performance
Competitive Strategy and Network Formation
In today‘s competitive landscape, firms cannot rely on internally controlled
resources alone to pursue advantage-creating and advantage-enhancing strategies. They
must collaborate with other firms to gain access to information, skills, expertise, assets,
and technologies and thus leverage their internal resources. Different strategic tendencies
create different needs, motivations and opportunities for collaboration with other market
participants (e.g., competitors, distributors, suppliers, and customers). Thus, certain
regularities in firms‘ strategic behavior can lead to distinctive and recognizable patterns

6
of networking behavior, which in turn leads to predictable types of network structure. I
focus on two types of alliance network structure: dense and sparse. A dense network
structure refers to the degree of interconnectedness among a firm‘s partners, whereas a
sparse network structure refers to the degree to which a firm maintains ties with firms
from disconnected clusters. Figure 4 below shows the propositions developed in Chapter
3. I will argue that firms with superior advantage-creating strategies will become
embedded in sparse network structures and have many non-equity alliances (weak ties),
whereas firms with strong advantage-enhancing tendencies will be embedded in dense
network structures with many equity-based alliances (strong ties) in the future. When
firms are strategically entrepreneurial, they dynamically change the network structure
over time. They create many new structural holes (i.e., connections with partners who are
themselves disconnected), and subsequently stimulate collaborative activity among
partners to sustain their newly created advantages.
Figure 4: Competitive Strategy and Network Structure
Advantage-creating Strategy
Advantage-enhancing Strategy
Network Structure •Global Structural Holes / Weak Ties •Ego Network Density / Strong Ties
X
Competitive Strategy, Network Structure, and Firm Performance
If some firms pursue advantage-creating strategic tendencies and become
embedded sparse network structures, whereas other firms exhibit advantage-enhancing
strategic tendencies and form dense network structures, are these combinations of
competitive strategies and network structures beneficial for firm performance? I examine
this question in Chapter 4. Different network structure provides firms with distinctive
benefits. A dense network structure stimulates efficient exchange of information, assets,
expertise, and ideas and provides effective mechanisms for reducing the partners‘

7
opportunistic behavior and free riding. A sparse network structure provides firms with
exclusive information about the most recent technological advances in different
industries, increased power to control competitive information in the network, and access
to diverse resources and capabilities controlled by the other market participants (Burt,
1992; Coleman, 1988; Gnyawali & Madhavan, 2001; Rowley, Behrens, & Krackhardt,
2000; Ahuja, 2000a). However, the extent to which a firm can capitalize on such network
potential depends on the type of competitive strategy a firm is pursuing. Thus, different
network structures and competitive strategies will interact in explaining firm
performance.
Figure 5: Competitive Strategy, Network Structure and Firm Performance
I propose two alternative theoretical arguments for the interplay between the
network structure and competitive strategy in explaining firm performance. First, network
structure can play a role of complementor (or enhancer) of firms‘ capabilities by
providing firms with resource potential needed for successful pursuit of a given strategy.
For example, firms with strong advantage-creating capability will be better able to exploit
the advantageous access to diverse network resources than firms that lack such
capabilities. Similarly, firms with strong advantage-enhancing capabilities will have
greater potential to exploit the advantages that dense network brings about. Second, the
network structure can play a role of substitutor for capabilities that a firm is lacking. For
example, a firm that has superior advantage-creating capability may use a dense network
of collaborators as a substitute for its advantage-enhancing capability. A firm embedded
in a dense network structure, in which all firms contribute significantly in improving an
existing complex product, can use the advantage-enhancing capabilities of network
partners to complement its advantage-creating capabilities.

8
Intended Contributions for Research and Practice
This dissertation contributes to the research in corporate entrepreneurship,
strategic alliance networks, and strategic management in general. It extends the research
in corporate entrepreneurship area by emphasizing the role of advantage-enhancing
capabilities (i.e., capabilities to protect and further extend the newly created competitive
advantages) in explaining how firms gain superior performance in hypercompetitive
environments. Corporate entrepreneurship research mainly focuses on firms‘ abilities to
create consistently new competitive advantages and, through this intensive
entrepreneurial activity, to earn above-average profits that persist over time (Sharma &
Chrisman, 1999; Covin & Miles, 1999). This study shows how advantage-enhancing
capabilities of firms strengthen the effect of entrepreneurial strategies on firm
performance. As such, this study is among the first to empirically examine the Ireland,
Hitt, and Sirmon (2003) proposition that firms need to be ―strategically entrepreneurial‖
to outperform rivals consistently.
In addition, corporate entrepreneurship research generally assumes that firms act
entrepreneurially because of purposeful enactment of internal organizational processes,
methods, and practices that stimulate entrepreneurial discoveries (Lumpkin & Dess,
1996; Dess, Lumpkin & Covin, 1997; Ireland, Covin & Kuratko, 2009). However,
entrepreneurship is an act of removing market ignorance (Mises, 1949). A discovery of
new things necessarily implies that other market participants were unaware of the
existence of available resources and technologies that could produce resource
configurations that provide superior value for customers (Kirzner, 1979). However, the
opportunities for removing this market ignorance are unequally accessible to firms. Firms
are unevenly aware of such opportunities in part because of their position in the overall
alliance network structure. Alliances provide access to preferential information about the
newly developed resource potential by other market participants; and therefore, a firm
favorably positioned in the alliance network structure will be more aware of the
opportunities for developing more productive resource combinations (Burt, 1992; 2005).
Thus, to understand why some firms (and not others) are capable of systematically
outperforming rivals in hypercompetitive environments, we need to consider both the

9
entrepreneurial abilities of firms and the potential for entrepreneurial discovery in the
network in which they are embedded. Chapter 4 integrates the research in corporate
entrepreneurship and social network theory to explain more completely the sources of
performance differences across firms in hypercompetitive environments.
This integrative approach of strategy and structure also extends the research in
interfirm alliance networks. This research has rarely examined how firms‘ strategies (and
their strategic resources) enable firms to exploit the advantages provided by the favorable
positions in the network structure. Recently, Zaheer and Bell (2005) examined how
certain innovative capabilities of firms enhance the relationship between network
structure and firm performance, and Zahra and George (2002) emphasized the importance
of internal capabilities of firms in exploiting the external resources available through
network structure. This study extends this research by arguing that different strategies can
benefit from different types of network structures and, therefore, network structures (e.g.,
dense or sparse networks) are not universally beneficial for firms‘ performance. Firms
need to construct their alliance networks according to their strategic needs. Hence, this
dissertation has some important managerial implications.
Finally, Chapter 3 addresses the paucity of research on the antecedents of network
formation. Several researches have emphasized the importance of understanding the
origins of network formation and have called for more research on how firms can
strategically shape their positions in the network structure (Stuart & Sorenson, 2007;
Salancik, 1995). This is especially critical for strategy research as several researchers
have shown that certain network positions enable firms to improve their performances
(e.g., Baum, Calabrese, & Silverman, 2000; Powell, Koput & Smith-Doerr, 1996;
Rowley, Behrens, & Krackhardt, 2000; Zaheer & Bell, 2005; Uzzi, 1997; Ahuja, 2000a).
Previous research on the antecedents of network formation has mostly examined
contextual factors such as key industry events (Madhavan, Koka, & Prescott, 1998), prior
alliance experience (Powell, Koput, & Smith-Doerr, 1996), the competitive environment
and market stages (Eisenhardt & Schoonhoven, 1996), and structural network properties
such as past network centrality (Gulati, 1999; Gulati & Gargiulo, 1999) and network
density (Sorenson & Stuart, 2008). Eisenhardt and Schoonhoven‘s study (1996) is among
the few that examined some agent-based antecedents of the rate of alliance formation.

10
Although these studies have advanced our understanding of the likelihood of firms to
form alliances, they have not addressed the question of how and why different strategies
lead to different types of network structure and why some firms are embedded in
networks with many structural holes whereas others tend to get embedded in dense
network structures with many strong ties among network partners. Chapter 4 shows that
different types of competitive strategies lead to different types of network structures.

11
CHAPTER II: COMPETITIVE STRATEGY AND FIRM PERFORMANCE
Introduction
This chapter introduces two competitive strategies that enable firms to gain
superior performance in hypercompetitive environments: advantage-creating and
advantage enhancing strategies. Advantage-creating strategic tendencies refer to firms‘
tendencies to frequently create new competitive advantages by discovering radically new
technologies (i.e., innovativeness) and proactively introducing new products (i.e.,
proactiveness). Advantage-enhancing strategic tendencies refer to firms‘ tendencies to
aggressively introduce competitive actions (e.g., quality improvements, new product
versions, creative advertising, price cuts, sale incentives, market expansions) that protect
or enhance the competitive position of its existing products and services.
I argue that firms that exhibit superior advantage-creating or advantage-enhancing
strategic tendencies will outperform rivals. In addition, I posit that when a firm is capable
of simultaneously pursuing both types of strategies, it will maximize its performance.
Understanding how these two strategies affect firm performance is important for at least
two reasons. First, empirical examination of the interplay between these two strategies
will advance the research in corporate entrepreneurship and strategic entrepreneurship.
This study is among the first to empirically investigate (at the firm level of analysis) how
the interaction between these two strategies affects firm performance. Second, by
showing that these strategies enable firms to outperform rivals, I provide relevance and
justification for using these strategies in explaining how firms become embedded in
different network structures (I examine this question in Chapter 3).
Theoretical Background
Conceptualization of competitive strategy
Researchers have taken different approaches in conceptualizing and
operationalizing firm strategy. For example, strategy can be viewed as a plan that defines
long-term goals and objectives (Chandler, 1962), or as a distinctive, favorable and
defendable positioning in the industry (vis-à-vis rivals) (Porter, 1985), or as a pattern or

12
consistency in the firm‘s actions over time (Mintzberg & Waters, 1985). In this study, I
follow Mintzberg and Waters‘s (1985) view of strategy and conceptualize (and
operationalize) competitive strategy as a recurring pattern (or a tendency) in a firm‘s
competitive behavior (Mintzberg, 1978). For example, a firm can exhibit a consistent
pattern (tendency) of entrepreneurial behavior by frequently discovering radically new
products and technologies. Other firms may focus more on protecting and enhancing their
existing products and services and exhibit a tendency to intensively introduce actions
such as new product versions, price cuts, advertising, promotions, capacity expansions, or
new product features.
I also assume that strategy is driven by the firm‘s ability to manage its resources
strategically (Barney, 1991). As Penrose (1959: 84) noted ―the type of product in which
the consumer might be interested is in effect very often suggested…by the firm‘s
resources.‖ Managers continuously face many choices about restructuring, bundling, and
leveraging their internally controlled resources (Sirmon, Hitt & Ireland, 2007; Ireland et
al., 2003). The pattern of these resource allocation choices is reflected in the patterns of
the firm‘s actual competitive behavior over time. Because the researchers often cannot
observe resource allocation decisions, this dissertation focuses on examining the patterns
in the firm‘s externally-oriented and observable competitive activity (Grimm & Smith,
1997). For example, a firm‘s ability to strategically use its resource potential to enhance
its existing market position (i.e., to pursue advantage-enhancing tendency) is reflected in
its intensity of introducing competitive actions such as updates and improvements of
existing products, and new product versions, advertising campaigns, promotional events,
price cuts, sale incentives, extended warranties, new capacity, new distribution channels,
and extended dealership networks. Likewise, firms with strong advantage-creating
capabilities will be frequently first to introduce new products and services and will
frequently generate path-breaking technologies. The focus is, therefore, on the actual
(i.e., realized) and observable strategic tendencies of firms, and it is assumed that these
tendencies are reflections of the firm‘s capabilities. The term capabilities refers to the
concept of dynamic capabilities defined as ―the firm‘s ability to integrate, build, and
reconfigure internal and external [resources] to address rapidly changing environments‖
(Teece, Pisano, & Shuen, 1997:516). Resources include all production factors,
13
organizational routines, processes, technologies, reputation, status, competences, and
other tangible and intangible assets available to a firm (either owned by the firm or
available through network partners).
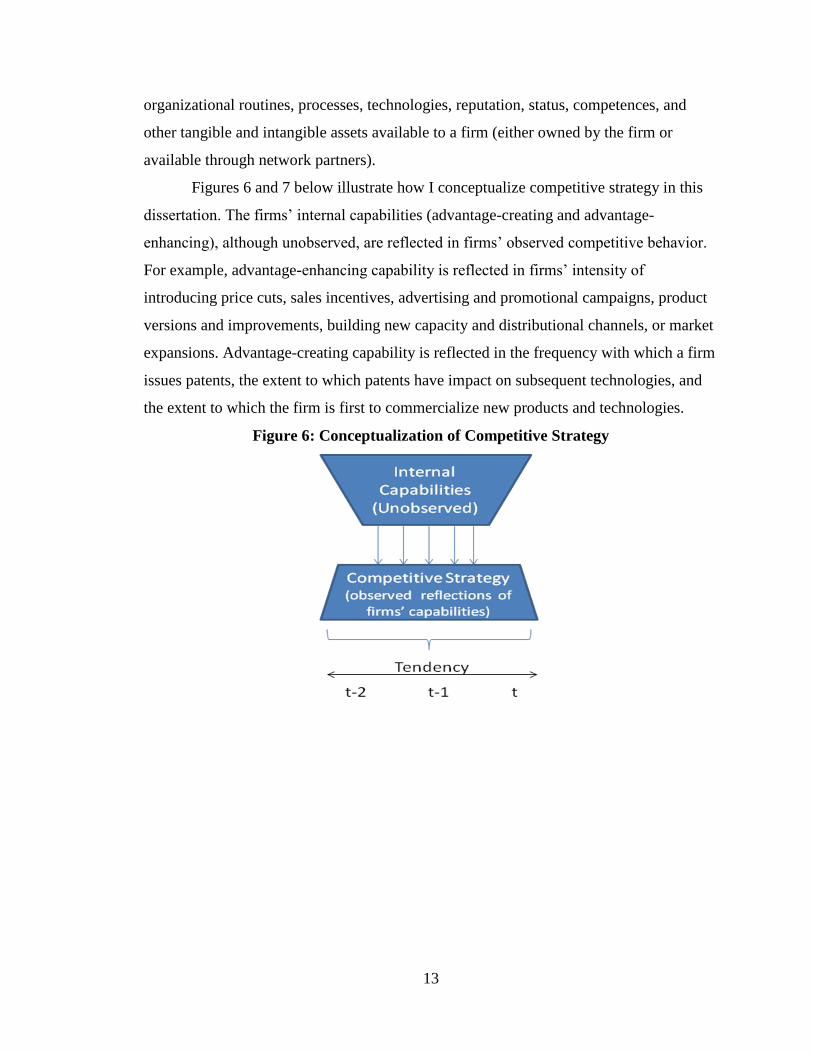
Figures 6 and 7 below illustrate how I conceptualize competitive strategy in this
dissertation. The firms‘ internal capabilities (advantage-creating and advantage-
enhancing), although unobserved, are reflected in firms‘ observed competitive behavior.
For example, advantage-enhancing capability is reflected in firms‘ intensity of
introducing price cuts, sales incentives, advertising and promotional campaigns, product
versions and improvements, building new capacity and distributional channels, or market
expansions. Advantage-creating capability is reflected in the frequency with which a firm
issues patents, the extent to which patents have impact on subsequent technologies, and
the extent to which the firm is first to commercialize new products and technologies.
Figure 6: Conceptualization of Competitive Strategy

14
Figure 7: Conceptualization of Advantage-Creating and Advantage-Enhancing
Strategy
Defining advantage-creating strategy
D‘Aveni (1994) argued that in today‘s hypercompetitive environments, firms
cannot gain sustainable competitive advantage over rivals. Rivals can quickly imitate or
make obsolete any advantage and therefore firms can outperform rivals only when they
are able to create a series of new (temporary) competitive advantages. To achieve this,
research has suggested that some firms adopt an entrepreneurial strategy-making mode
(Dess, Lumpkin, & Covin, 1997). This entrepreneurial strategy is often driven by the
presence of an entrepreneurial mindset (McGrath & MacMillan, 2000), an entrepreneurial
orientation (Lumpkin & Dess, 1996), or entrepreneurial leadership and an entrepreneurial
culture within the firm (Ireland, Hitt, & Sirmon, 2003) that encourages the discovery of
radically new products and technologies. Researchers have recognized that some firms
exhibit systematic and recurring patterns of such entrepreneurial behavior that can be
reliably and objectively studied (Covin & Slevin, 1991; Jennings & Lumpkin, 1989).
For example, researchers have identified that some firms show the tendency to be
frequently first to introduce new products on the market (i.e., proactiveness) (Miles &
Snow, 1978; Miller, 1983; Miller & Friesen, 1978; Covin & Slevin, 1991, Covin &
Miles, 1999; Lumpkin & Dess, 1996). These proactive firms generate, change, and shape
markets and industries rather than merely responding to the changes in their environment
(Miller & Friesen, 1978). Other firms exhibit tendencies to frequently produce
―significant technological breakthroughs, and reinvent themselves and retain

15
technological leadership in their industry‖ (Ahuja & Lampert, 2001). Covin and Miles
(1999) argued that this innovative tendency enables firms to frequently rejuvenate and
redefine their organizations, markets or industries. Both of these tendencies –
proactiveness and innovativeness – enable firms to create new competitive advantages
frequently. I refer to these two tendencies of firms – to be first to introduce innovative
products and services and to pursue technological leadership – as advantage-creating
tendencies. Following the prior research in corporate entrepreneurship area, I consider
proactiveness and innovativeness as two interrelated but distinct dimensions that produce
advantage-creating strategic tendency1 (Lumpkin & Dess, 1996; 2001). Below I discuss
each dimension separately.
Proactiveness
According to Jennings and Lumpkin (1989), ―an organization is entrepreneurial if
it develops a higher than average number of new products and/or new markets.‖ Lumpkin
and Dess (1996; 2001) clarified that proactiveness, as a dimension of the broader
entrepreneurial orientation construct, captures the tendency of firms to introduce
pioneering products in the industry. They defined proactiveness as ―introducing new
products or services ahead of the competition and acting in anticipation of future demand
to create, change, and shape the environment‖ (Lumpkin & Dess, 2001; p. 431). Thus,
firms with a proactive orientation are first to introduce a product, service, or technology
on the market and thus to surprise their rivals and change the environment. Similarly,
Miles and Snow (1978) described entrepreneurial firms as those that pursue a
―prospector‖ strategy, which is characterized by being first on the market to introduce
new products and services: ―The prospector‘s prime capability is that of finding and
exploiting new product and market opportunities‖ (p. 55). Finally, Miller (1983) and
Miller and Friesen (1978) referred to proactive firms as those that are first to introduce
innovative products, technologies, or administrative techniques intended to shape the
environment rather than merely react. Consistent with previous research, I define
proactiveness as a firm’s tendency to be first to introduce new products, services, or
technologies on the market (i.e., ahead of competitors).
1 I discuss how these two dimensions are interrelated in more detail in the methods section (Chapter 5).

16
Innovativeness
Innovation is one of the major sources of a firm‘s ability to create new
competitive advantages. Innovation is ―simply the doing of new things or the doing of
things that are already being done in new ways‖ (Schumpeter, 1947: 151). The concept of
innovation and its impact on firm performance and economic growth has been studied in
many different fields and, therefore, many definitions have been offered. However, one
common characteristic underlying all definitions is the element of newness (i.e., creation
and adoption of something new) (Gopalakrishnan & Damanpour, 1997). Accordingly, the
innovation construct encompasses the generation, development, and implementation of
new ideas and behaviors (e.g., Damanpour, 1991). Covin and Miles (1999) noted that
innovations are critical for a firm‘s ability to gain competitive advantage because they
enable firms (1) to regenerate (by frequently introducing new products and services and
entering new markets), (2) to rejuvenate (by significantly changing their organizational
processes, structure, and capabilities), (3) to renew their strategies and the way they
compete in the marketplace, and (4) to shape their product market domain and attain first
mover status (Covin & Miles, 1999). Firms can purposefully instigate innovation by
developing an organizational culture and an entrepreneurial mindset that promotes
experimentation and creativity and by intensively spending on research and development
for maintaining technological leadership (MacGrath & MacMillan, 2000; Lumpkin &
Dess, 1996).
Researchers have distinguished between different types of innovation:
administrative and technical, product and process innovation, or radical and incremental
innovation (Gopalakrishnan & Damanpour, 1997). In this study, I focus on technical and
radical innovations. Accordingly, in this dissertation innovativeness refers to a firm’s
tendency to pursue technological leadership. I assume that a firm with the capability to
frequently discover radically new technologies is better able to create new competitive
advantages than a firm without such capability (Ahuja, 2001). Hence, innovativeness
captures the firm‘s tendency to discover new technologies, whereas proactiveness refers
to the firm‘s tendency to be first to introduce (or commercialize) new products, services,
and technologies on the market.

17
Defining advantage-enhancing tendencies
The proponents of the ―entrepreneurial‖ strategies, discussed above, implicitly or
explicitly assume that competitive advantages of firms are not persistent. Competitive
advantages (unique resources or market positions) in hypercompetitive environments are
quickly eroded either by imitative efforts of other firms or by developing more innovative
products and technologies that make the existing products obsolete; therefore, firms need
to frequently create new advantages and disrupt the status quo (D‘Aveni, 1994). In
contrast, some researchers have emphasized that even in the most volatile environments,
some firms can sustain their advantages for a prolonged period (e.g., Makadok, 1998).
Lieberman and Montgomery (1988) emphasized several mechanisms that firms can
strategically use to protect and enhance the durability of their superior competitive
position. For example, firms with superior learning capabilities can quickly accumulate
experience and move down the learning curve, which in turn enables them to cut prices
and thus prevent market entry. They can also have the ability to quickly develop a variety
of product versions and preemptively occupy attractive market niches (e.g., spatial
preemption of locations in geographic and product characteristics space). Additionally,
firms may have marketing competences to develop recognizable brand name or ability to
add intensively new product features and updates to increase customers‘ switching costs.
Porter (1985) noted a wide variety of strategic and tactical moves that firms use to protect
their competitive position, such as building extra capacity, preempting shelf space, and
cutting prices. Finally, in highly competitive environments, it is crucial that firms have
the ability to intensively update and improve their existing products and thus keep ahead
of competitors (Brown & Eisenhardt, 1998; Porter, 1991). This competitive activity can
be depicted by the intensity with which a firm introduces actions such as price cuts, sale
incentives, advertising, promotions, product improvements, new product versions, new
capacity, or market expansions. Because this competitive tendency is likely to enhance
and further develop the firm‘s existing competitive advantages, I refer to this tendency as
an advantage-enhancing strategy.
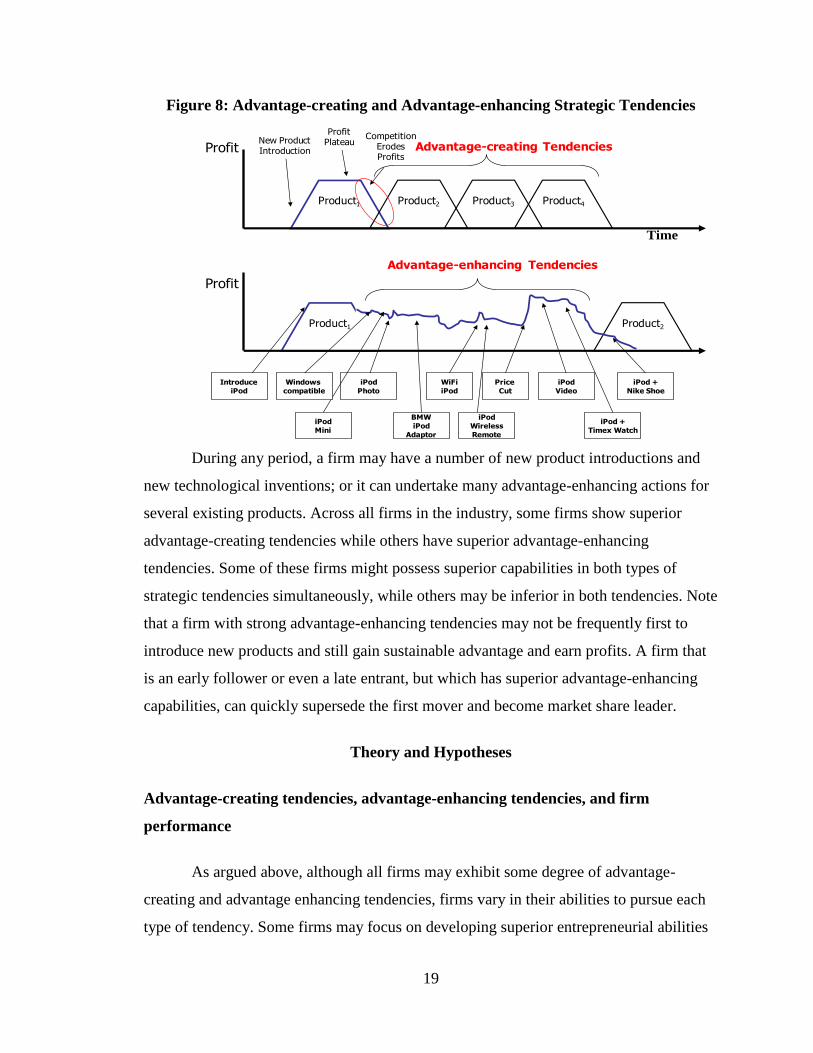
Figure 8 illustrates the distinction between advantage-creating and advantage-
enhancing tendencies. The top portion of Figure 8 illustrates D‘Aveni‘s (1994) view of

18
how firms with strong advantage-creating tendencies gain superior performance. Because
it is assumed that advantages are short lived in hypercompetitive environments, firms
must create a series of new competitive advantages. By the time rivals imitate the
existing advantage, the firm has created a new short-term competitive advantage and thus
will remain ahead of its competition.
The lower portion of Figure 8 depicts the role of firms‘ advantage-enhancing
capabilities in maintaining competitive advantage over rivals. Despite operating in a
hypercompetitive environment, Apple introduced the iPod in 2001 and has managed to
sustain its competitive advantage for more than seven years. Apple managed this despite
the market entry of several powerful competitors (e.g., Creative, Dell, and Gateway)
within one year of iPod‘s first introduction. The competitors offered close substitutes to
the iPod: similar quality levels and lower prices. Despite its rivals‘ quick reaction, Apple
has sustained the iPod‘s competitive advantage by introducing actions that continuously
enhanced the iPod‘s value. For example, Apple intensively introduced updated versions
of the iPod, such as the iPod shuffle, the iPod movie, the iPod nano, and the iPod Photo,
offered complementary software (iTunes) and expanded memory, launched new creative
advertising campaigns frequently, introduced many sales incentives and price cuts,
teamed with Nike, Disney, Motorola, and Timex to introduce product bundles, and
entered new international markets (more detailed information about iPod‘s advantage-
enhancing activity is shown in Table 17 in the appendix). The intensity of these value-
enhancing actions enabled Apple to stay ahead of competitors and sustain its advantage.
19
Figure 8: Advantage-creating and Advantage-enhancing Strategic Tendencies
Product1
New ProductIntroduction
ProfitPlateau
CompetitionErodesProfits
Product2
Profit
Profit
Introduce
iPod
iPod
Mini
iPod
Photo
BMW
iPod
Adaptor
iPod
Wireless
Remote
WiFi
iPod
iPod
Video
iPod +
Timex Watch
iPod +
Nike Shoe
Advantage-enhancing Tendencies
Product1 Product2
Product3 Product4
Time
Windows
compatible
Price
Cut
Advantage-creating Tendencies
During any period, a firm may have a number of new product introductions and
new technological inventions; or it can undertake many advantage-enhancing actions for
several existing products. Across all firms in the industry, some firms show superior
advantage-creating tendencies while others have superior advantage-enhancing
tendencies. Some of these firms might possess superior capabilities in both types of
strategic tendencies simultaneously, while others may be inferior in both tendencies. Note
that a firm with strong advantage-enhancing tendencies may not be frequently first to
introduce new products and still gain sustainable advantage and earn profits. A firm that
is an early follower or even a late entrant, but which has superior advantage-enhancing
capabilities, can quickly supersede the first mover and become market share leader.
Theory and Hypotheses
Advantage-creating tendencies, advantage-enhancing tendencies, and firm
performance
As argued above, although all firms may exhibit some degree of advantage-
creating and advantage enhancing tendencies, firms vary in their abilities to pursue each
type of tendency. Some firms may focus on developing superior entrepreneurial abilities

20
to frequently create innovative products and technologies and thus earn above average
profits. Other firms may be able to create only a few new advantages but may possess a
strong ability to continuously enhance and expand their existing advantages and thus
outperform rivals. Indeed, previous research has shown that pioneers and firms with
entrepreneurial strategies possess a different set of skills, practices, and competences than
firms that focus on protecting and enhancing their existing advantages and are often
followers or late entrants (e.g., Kerin, Varadarajan, & Peterson, 1992; Miles & Snow,
1978; Covin & Slevin, 1989). The underlying cause of the differences in firms‘ skills and
competences to pursue both strategies is based on the assumption that all firms face
resource constraints. Firms have limited resources and thus they must make choices in
allocating their attention and resources either toward continuously exploring new
products, markets, and technologies or toward exploiting and enhancing their existing
advantages (Levinthal & March, 1993; March, 1991). Prior research has suggested that
firms with superior advantage-creating or superior advantage-enhancing capability can
outperform rivals.
On one hand, firms that show innovative and proactive tendencies (i.e.,
advantage-creating tendencies) frequently create and act on first-mover opportunities.
These entrepreneurial actions disrupt the status quo on the market and often render the
existing products and technologies of rivals obsolete (D‘Aveni, 1994). These
groundbreaking entrepreneurial actions are complex and difficult for rivals to imitate
(Smith & Di Gregorio, 2002), which causes delayed rivals‘ responses. This in turn can
enable the first mover firms to gain (at least temporarily) above-average profits. First
mover advantage literature has suggested that the late entrants gain substantially less
market share than early entrants do (see Kalyanaram, Robinson, & Urban, 1995).
Robinson (1988) and Robinson and Fornell (1985) showed that the order of market entry
alone can explain from 9% to 18% of the variation in market share and Makadok (1998)
found that first movers (in the money market mutual fund industry) were able to
sustainably charge higher expense ratios (higher fees for operating the fund). Hence, we
can expect that firms that are frequently first to introduce new products and technologies
on the market will earn greater profits than will the less innovative and proactive firms.
Indeed, research in corporate entrepreneurship has shown that firms can pursue an

21
entrepreneurial strategy regardless of their size and that this entrepreneurial strategy (or
posture) has a positive effect on firm performance especially in highly volatile
environments (Covin & Slevin, 1989). In addition, several researchers have shown that
firms with entrepreneurial orientation (measured by its degree of proactiveness,
innovativeness, and risk taking) exhibit superior performance (e.g., Wiklund, 1999;
Wiklund and Shepherd, 2003; Zahra, 1991). Hence,
Hypothesis 1: Firms’ advantage-creating tendencies will be positively related to
firm performance.
On the other hand, firms with strong advantage-enhancing tendencies can gain
superior performance either by adopting a ―wait-and-see‖ strategy and entering the
market once the uncertainty is resolved or by being able to successfully protect a few
well-established competitive advantages. These firms may possess superior marketing
and promotional capabilities, reputation and recognizable brand name, economies of
scale and learning experience advantages, or ability to continuously update and improve
the value of the existing products and services. These capabilities enable them to catch up
quickly with first movers even if they enter the market as later entrants and gain profits.
This is because later entrants have opportunity to learn from pioneers‘ mistakes, to collect
more comprehensive information about the probability of success of the new
product/technology, and benefit from lower imitation costs and free riding (Lieberman &
Montgomery, 1988). Prior research has provided empirical evidence for this argument.
For example, the research in competitive dynamics has shown that firms that compete
aggressively with a wide variety of competitive actions (such as series of price cuts,
advertising, and product versions) can dethrone industry leaders and gain greater market
share and profits (Ferrier, Smith, & Grimm, 1999). In addition, Boyd and Bresser (2008)
provided evidence that moderately late entrants (firms that enter markets neither too fast
nor too late) enjoyed performance advantages. This finding also suggests that firms with
advantage-enhancing strategies can outperform rivals. On one hand, firms with
advantage-enhancing tendencies are less likely to enter markets as early movers (second
or third) because of their predominant focus on extending the existing advantages. On the
other hand, they are also less likely to wait too long to enter the new markets, as they
possess superior advantage-enhancing capabilities to quickly mobilize resources and
22
imitate the first movers‘ products and technologies. This capability enables them to offer
a wide variety of new product versions at lower prices than those offered by first movers.
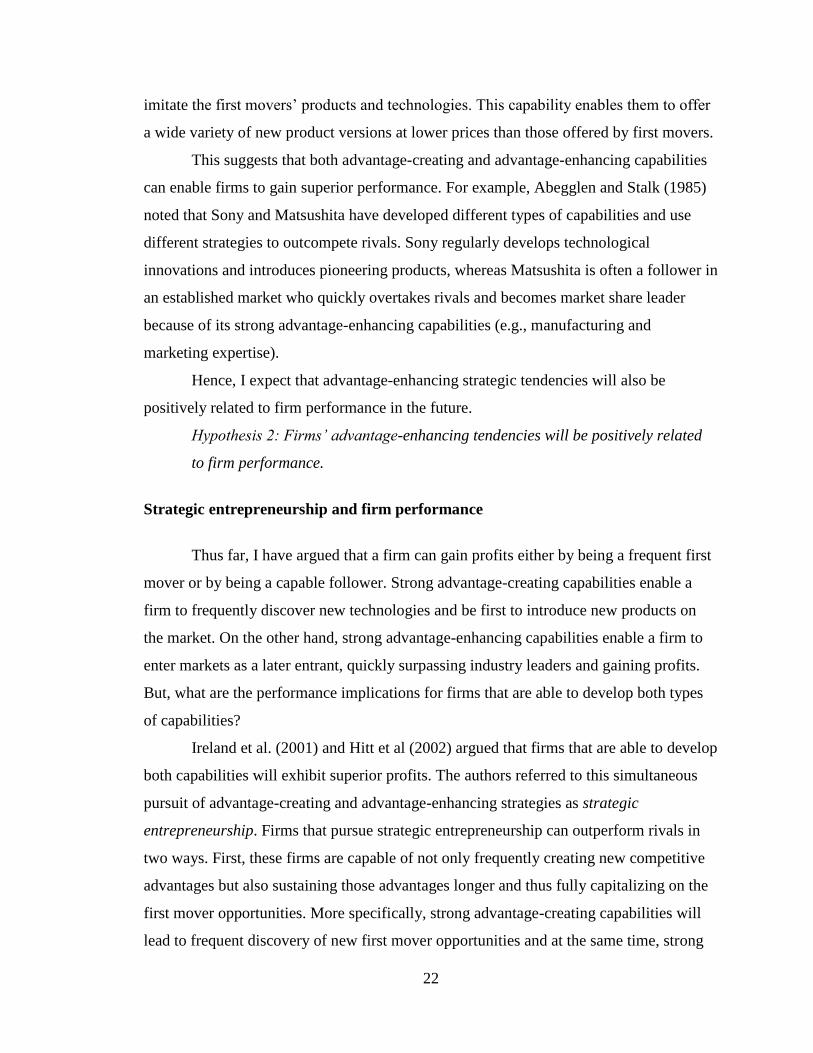
This suggests that both advantage-creating and advantage-enhancing capabilities
can enable firms to gain superior performance. For example, Abegglen and Stalk (1985)
noted that Sony and Matsushita have developed different types of capabilities and use
different strategies to outcompete rivals. Sony regularly develops technological
innovations and introduces pioneering products, whereas Matsushita is often a follower in
an established market who quickly overtakes rivals and becomes market share leader
because of its strong advantage-enhancing capabilities (e.g., manufacturing and
marketing expertise).
Hence, I expect that advantage-enhancing strategic tendencies will also be
positively related to firm performance in the future.
Hypothesis 2: Firms’ advantage-enhancing tendencies will be positively related
to firm performance.
Strategic entrepreneurship and firm performance
Thus far, I have argued that a firm can gain profits either by being a frequent first
mover or by being a capable follower. Strong advantage-creating capabilities enable a
firm to frequently discover new technologies and be first to introduce new products on
the market. On the other hand, strong advantage-enhancing capabilities enable a firm to
enter markets as a later entrant, quickly surpassing industry leaders and gaining profits.
But, what are the performance implications for firms that are able to develop both types
of capabilities?
Ireland et al. (2001) and Hitt et al (2002) argued that firms that are able to develop
both capabilities will exhibit superior profits. The authors referred to this simultaneous
pursuit of advantage-creating and advantage-enhancing strategies as strategic
entrepreneurship. Firms that pursue strategic entrepreneurship can outperform rivals in
two ways. First, these firms are capable of not only frequently creating new competitive
advantages but also sustaining those advantages longer and thus fully capitalizing on the
first mover opportunities. More specifically, strong advantage-creating capabilities will
lead to frequent discovery of new first mover opportunities and at the same time, strong

23
advantage-enhancing capabilities will enable them to quickly build entry barriers or
intensively improve the value of the new products and thus stay ahead of competitors (as
Apple did with iPod, see Figure 8). Second, firms pursuing strategic entrepreneurship can
outperform rivals (1) by quickly eroding rivals‘ competitive advantages and (2) by
capitalizing on rivals‘ newly created advantages. In the former case, advantage-creating
capabilities lead to formation of new product categories and discoveries of radically new
technologies; this innovative and proactive activity can make rivals‘ technology obsolete
and can erode rivals‘ well-established monopolistic position on the market (because the
new product category may offer superior value to that offered by the rival‘s established
products). In the latter case, advantage-enhancing capabilities will enable them to
effectively imitate rivals‘ newly created products and technologies and capitalize on
pioneers‘ expenses in research and development of new products and technologies (e.g.,
costs of obtaining regulatory approvals, educating customers, developing infrastructure,
learning from pioneers‘ experiences, and lower imitation costs through reverse
engineering) (Porter, 1980; Lieberman & Montgomery, 1988). This suggests that a firm
with both types of capabilities will be better able (1) to discover and fully capitalize on
the first mover opportunities and (2) either to eliminate rivals‘ advantages or capitalize on
their investment in research and development of new products and technologies.
Consequently, the firms that possess both advantage-creating and advantage-enhancing
capabilities will earn higher profits compared with firms that have either capability (but
not both).
Hypothesis 3: Firms pursuing strategic entrepreneurship (high advantage-
creating and high advantage-enhancing) will exhibit highest performance.

24
CHAPTER III: COMPETITIVE STRATEGY AND ALLIANCE NETWORK
FORMATION
Introduction
In the previous chapter, I argued that firms could develop superior internal
capabilities that enable them to pursue intensively advantage-creating and advantage-
enhancing strategies. However, the differences in the firms‘ internally controlled
resources and capabilities can only partially explain performance differentials across
firms. Firms‘ ability to persistently outperform rivals depends also on the advantageous
access to external information and resources uniquely held by other market participants
(Dyer & Singh, 1998). The increased competitive pressure and the unprecedented pace of
technological change in most industries today (Bettis & Hitt, 1995; D‘Aveni, 1994) have
made collaboration with other firms a necessary condition for sustained success in the
marketplace. This increased collaborative activity, strategically initiated by firms in their
efforts to outcompete rivals, leads to formation of a network of interfirm relationships (in
the form of strategic alliances, joint ventures, and long-term agreements) at the system
level. Each firm in the alliance network maintains a distinct portfolio of alliances and has
a distinct pattern of alliance ties with other network members, which in turn provide
different potential for gaining access to network resources (Gulati, 1998; Gulati, Nohria,
& Zaheer, 2000). Applying social network theories, researchers have shown empirically
that several network positions (e.g., brokerage position, ego network density, centrality)
and configurations (e.g., diversity of ties, proportion of strong/weak ties) provide firms
with advantageous access to network resources, which in turn is positively related to
firms‘ performance (e.g., Zaheer & Bell, 2005; Ahuja, 2000a; Rowley, Behrens, &
Krackhardt, 2000; Baum, Calabrese & Silverman, 2000; Powell, Koput, & Smith-Doerr,
1996).
In this dissertation, I argue that the effect of network structure on firm
performance is contingent on the type of competitive strategy the firm is pursuing.
However, before I examine which type of network structure is optimal for a given type of
strategy, it is important to understand how firms with different strategies become
embedded in different network structures. Firms purposefully form alliances to support

25
their competitive strategies. The degree to which a firm has the ability to pursue
advantage-creating or advantage-enhancing tendencies leads to different managerial
choices and motivations about (1) the intensity of interorganizational collaborative
activity, (2) the type of alliance partners, and/or (3) the type of alliance governance form
(equity vs. non-equity). Thus, it is likely that the network structure is also a function of
firms‘ strategies, because different strategies produce different needs and motivations for
collaboration with other market participants. Hence, in this chapter, I examine how firms
actually construct their network structures (i.e., how different strategies lead to different
types of network structure).
The prevailing preoccupation in the networks literature has been in understanding
how the firm‘s network position leads to certain outcomes; less emphasis has been placed
on how the firm arrives in that network position. A few studies that have tried to explain
the origins of network positions have mainly focused on how previous network positions
provide opportunities for alliance formation and how these tendencies lead to formation
of certain network positions (e.g., Gulati & Garguilo, 1999; Gulati, 1999; Powell, Koput,
& Smith-Doerr, 1996). Although these studies have increased our understanding of
network structure formation, we still have ―very little systematic knowledge of how
strategic actors construct their networks‖ (Stuart & Sorensen, 2007: 219, emphasis
added). As Stuart and Sorensen (2007) noted, firms are not randomly assigned to network
positions. Firms strategically and purposefully engage in collaborative activity in an
effort to enhance their ability to gain or sustain competitive advantage. Different firms
exhibit different strategies and these strategies create different needs, motivations, and
incentives for collaborative activity. Thus, it is reasonable to expect that particular
regularities in the strategic behavior of firms may lead to recognizable patterns of
networking behavior, which in turn may result in being located in predictable network
positions.
This study adopts a resource-based view of alliance formation (Eisenghardt &
Schoonhoven, 1996). It assumes that alliances and the resulting network structure are
driven by the firms‘ needs for resources or capabilities that are controlled by other firms.
Firms have different strategic needs because they pursue different types of strategies and
therefore certain strategies are associated with certain types of network structure. This is

26
not to say that firms are purposefully constructing their alliance network structure. Firms
form alliances to satisfy their strategic needs, and these individual decisions aggregate to
certain types of alliance network structure that may be the unintended outcome of this
networking activity. Firms purposefully create alliances, but they may unintentionally
become embedded in a certain network structure. I will argue that different firms exhibit
recurrent patterns of strategic behavior and hence have different needs for external
resources; therefore, they are consistently embedded in certain network structures. Thus,
although the overall alliance network is constantly changing, firms with particular
strategic tendencies tend to maintain stable network positions.
Theoretical Background
Previous research has identified two general sets of factors that affect firms‘
likelihood to form alliances: resource needs and social opportunities (Eisenhardt &
Schoonhoven, 1996). The first set of factors assumes that firms act strategically to
outcompete rivals and earn profits. Therefore, firms form alliances to gain access to
resources needed to accomplish certain strategic goals. For example, firms may use
alliances to reduce the transaction costs and increase their operational efficiency.
According to transaction cost economics, firms purposefully form joint ventures when the
costs of writing and executing contracts are too high (because of a small number of
bidders, asset specificity and hold up issues, a high degree of uncertainty, or significant
incentives for partners to act opportunistically) and, at the same time, it is inefficient to
internalize the production process (because the firm lacks such competences)
(Williamson, 1975). Another explanation for alliance formation is based on resource
dependence theory (Pfeffer & Salancik, 1978). This theory suggests that firms
strategically form alliances to effectively manage symbiotic interdependencies
(interdependencies between supplier and buyer) and competitive interdependencies
(interdependencies between competitors). Furthermore, strategy researchers have focused
on various characteristics of the firm such as top management team characteristics,
employing an innovative strategy (Eisenhardt et al., 1996), and the availability of
technical and commercial capital (Ahuja, 2000b) to explain the likelihood of firms to
form alliances. Another research stream builds on exchange theory (Emerson, 1962) and
27
emphasizes the need for collectively achieving strategic goals through enhanced
coordination, reciprocity, and mutual support (Oliver, 1990). Thus, according to this
research, the motivation to form alliances is found in the achievement of collective goals.
Finally, research based on institutional theory (DiMaggio & Powell, 1983; Tolbert &
Zucker, 1983) has highlighted the need for organizational legitimacy as an important
motive for forming alliances (Baum & Oliver, 1991). This research argues that firms
form alliances to improve their reputation and image, to signal creditworthiness, to gain
government approval, to increase their attractiveness as worthy alliance partners, or to
increase investors‘ confidence in their business activities (Dacin, Oliver, & Roy, 2007).
The other set of factors focuses on the social opportunities for forming new
alliance ties. Firms may have needs for external resources but may not have many
opportunities for accessing the needed resources. Firms differ in the amount of
information they have about which partners have complementary resources, which
potential partners are actually interested in collaborative activity, and which firms might
be reliable and valuable partners. Gulati (1999) showed that firms‘ awareness of potential
partners is a function of their prior alliance experience and their favorable position in the
network structure. Ahuja (2000a; 2000b) found that a focal firm is considered an
attractive partner when it possesses a high degree of technical (innovative) and
commercial capital. Prior alliance experience also provides information (often through
third-party referrals) about the complementarity of the resources held by the potential
partners, as well as the partners‘ trustworthiness and the likelihood of opportunistic
behavior (Gulati, 1998; Gulati & Garguilo, 1999).
In this chapter, I argue that firms vary in both their strategic needs for resources
and their access to social opportunities for alliance activity as a function of their
competitive strategy. Different strategies create different needs and opportunities for
firms to obtain network resources. In particular, I focus on how two types of strategic
tendencies – advantage-creating and advantage enhancing – lead to firms forming either
dense or sparse network structures. Network density refers to a network structure in which
a large proportion of a firm‘s network partners are connected with one another. Thus, a
firm is embedded in a dense network when all of its alliance partners are connected with
each other. Coleman (1988) argued that actors (individuals or firms) can benefit from

28
being embedded in a dense network because it creates norms, obligations, and
reciprocity; promotes the development of trust; and ease the transfer of information and
resources. In contrast, other firms might be embedded in a sparse network structure,
which provides opportunities for them to bridge structural holes. Structural holes are the
disconnections between two clusters of actors; brokers are the firms that bridge between
the two disconnected clusters of actors. Burt (1992) argued that actors embedded in
networks with many structural holes enjoy competitive advantage because (1) they have
faster access to diverse and nonredundant information because they bridge different
knowledge and information pools, which tend to be homogeneous within the same cluster
and heterogeneous across different clusters, and (2) they have the power to control the
flow of information and resources from one to another part of the network.
I will argue that firms with advantage-creating strategic tendencies will tend to be
embedded in sparse networks with many structural holes, whereas firms with an
advantage-enhancing strategy will be embedded in dense network structures. In addition,
because a sparse network structure is often associated with weak ties (Granovetter, 1973),
whereas strong ties enhance the stability of dense network structures, I also examine how
advantage-creating and advantage-enhancing strategies affect firms‘ tendencies to form
weak and strong ties. In this study, weak ties refer to non-equity alliances (e.g., licensing,
long-term supply contracts, marketing and distribution agreements), whereas strong ties
refer to equity alliances (e.g., joint ventures and other strategic alliances in which partners
exchange equity). Strategic alliances refer to ―any voluntarily initiated interfirm
cooperative agreement that involves exchange sharing, or co-development, and it can
include contributions by partners of capital, technology or firm-specific assets‖ (Gulati,
1995:621).
Theory and Hypotheses
Advantage-creating tendencies and network structure
An advantage-creating tendency refers to the tendency of a firm to develop
radically new products and technologies (innovativeness) and to frequently be first on the
market to introduce new products and services (proactiveness). I argue that firms with
29
advantage-creating tendencies are more likely to form new alliances with partners outside
their current network. This behavior in turn will lead to forming sparse network structures
with many structural holes.
First, proactive firms, by definition, tend to frequently introduce new products
ahead of competitors (Lumpkin & Dess, 1996). This frequent discovery of new products
creates a greater need for acquiring or developing new and different resources and
capabilities. For example, when a firm introduces a pioneering product it often needs to
form new relationships with suppliers, distributors, manufacturers, customers, or other
firms with complementary products, technologies, or services. Although some of the
existing partners may provide adequate resources and capabilities, it is likely that the
introduction of radically new products will require new sets of partners with more
compatible and sophisticated resources. As a result, proactive firms will frequently bring
new partners into their networks and thus are less likely to be locked in dense networks.
In support of this argument, Eisenhardt and Schoonhoven (1996) found that firms in
emergent-stage markets have a higher rate of new alliance formation than firms in other
market stages (e.g., in growth stage or mature stage markets).
Firms with proactive tendencies also continuously search for new partners to
explore new opportunities to offer superior value to customers. Sarkar, Echambadi, and
Harrison (2001: 702) argued that proactive firms exhibit greater ―efforts to identify
potentially valuable partnering opportunities and to initiate preemptive actions in
response to identified opportunities.‖ These exploratory tendencies lead to frequent
discoveries of unique ways for creating product bundles that provide greater value to
customers (e.g., Apple collaborated with Disney, Nike, and GM to create product bundles
with iPod). This continuous recognition of partners with complementary resources or
products from a wide range of indsutries leads to formation of new structural holes.
Proactive firms are not only first to introduce innovative products, but are also
more likely to enter new markets with new or existing products. Proactive firms actively
seek for opportunities where their newly created products provide superior value (i.e.,
better quality for similar price, or similar quality for significantly lower price, or both) to
customers in different markets and market segments (Kirzner, 1973). For example, firms
increasingly use alliances and joint ventures to accelerate entry into international markets
30
by gaining access to local market knowledge, sharing investment risk and resources
(Garcia-Canal, Duarte, Criado, & Llaneza, 2002). This again leads to formation of
network structures with many structural holes – in this case by forming alliances with
partners across geographical regions and countries.
Firms that pursue advantage-creating tendencies are also more innovative than
their rivals. The discovery of new technologies increases both (1) the potential of the
innovative firm to discover new resource combinations through forming alliances with
firms with complementary resources and (2) the likelihood that other firms will approach
the innovative firm with new ideas for collaborative activity. Shane (2000), for example,
observed that the discovery of three-dimensional printing (3DP) technology generated
opportunities for many firms from technologically distant industries (e.g.,
pharmaceuticals, orthopedics, surgical models, retail consumer goods) to combine their
own resources and competencies with the newly developed technology. This suggests
that when a firm discovers a radically new technology it increases the range of
opportunities for discovering more productive resource combinations with diverse
partners. Ahuja (2000a) argued that innovative firms are considered attractive partners
and are often approached by other firms with ideas for combining their complementary
resources. This further suggests that innovative firms will be more likely to form new
alliance ties and thus bring new partners into their networks. Eisenhardt and
Schoonhoven (1996) provided empirical evidence that innovative firms are more likely to
form new alliances than their less innovative rivals do.
Finally, firms with a history of innovative activity are attractive alliance partners
for gaining legitimacy. Allying with innovative partners often provides assurance that the
new entrepreneurial venture is highly likely to succeed. As Dacin, Oliver, and Roy (2007:
177) noted, ―investor confidence in a novel or seemingly risky initiative may be secured
by entering into a strategic alliance with a partner who exhibits strong support,
experience, and confidence for the uncertain business activity by its willingness to share
risk in the investment.‖ Because new industry players will have greater need to legitimize
their entrepreneurial activity (Baum & Oliver, 1991), they are more likely to seek to form
an alliance with a firm having a reputation for successful innovating. This again suggests

31
that innovative firms will have more opportunities to establish alliances with new
partners and therefore will tend to form more structural holes.
Hypothesis 4: Firms exhibiting higher advantage-creating tendencies
(proactiveness and innovativeness) will have more structural holes in their
alliance network structure in subsequent periods.
Advantage-creating tendencies and weak ties
Firms exhibiting high levels of advantage-creating tendencies will also be more
likely to form non-equity alliances rather than equity alliances as compared with firms
that are less proactive and innovative, because non-equity alliances provide more
flexibility for entrepreneurial firms both to form new alliances and to dissolve the old
ones.
As argued above, proactive firms are continuously first to develop and introduce
new products. This tendency creates a greater need to form new alliances because the
new products and technologies are likely to be incompatible with the competencies of the
current set of alliance partners. As firms move from one product to another (or as they
introduce radically new technologies), the old collaborative relationships may no longer
be effective and/or productive. Proactive firms will therefore not only create many new
alliances but also will terminate their alliances sooner and at a higher rate than firms that
are not proactive. This is not to say that all types of alliances will become unproductive
or ineffective. For example, a distributor or a manufacturer may successfully adjust
operations to serve the newly developed product, which may lead them to renew and
extend the alliance contract. On average, though, it is more likely that firms with greater
advantage-creating tendencies will have greater need to restructure their alliance portfolio
than firms that rarely introduce radically new products and technologies. This tendency
requires greater flexibility to exit the old alliances, given that all firms face limitations
about the number of alliances they can enter and reasonably maintain.
This flexibility can be more efficiently achieved by forming non-equity alliances.
Non-equity alliances do not involve exchange of equity between partners and typically do
not entail hierarchical controlling mechanisms and joined ownership structure (Gulati,
1995; Gulati & Singh, 1998). As a result, non-equity alliances are less costly and require

32
less time to terminate (Harrigan, 1988). Equity alliances, on the other hand, involve
shared equity and more formal organizing mechanisms such as authority and command
systems, incentive systems, or standard operating procedures (Gulati & Singh, 1998). As
such they provide less strategic flexibility because they are ―normally considered more
difficult than a contractual agreement[s] to establish, terminate, and fundamentally
change‖ (Osborn & Baughn, 1990: 505). Because proactive and innovative firms
continuously generate new opportunities for collaborative activity and therefore exhibit
greater rate of alliance turnover, the non-equity alliances would be more suitable for
pursuing an advantage-creating strategy, as compared with equity alliances. Therefore,
Hypothesis 5: Firms exhibiting higher advantage-creating tendencies
(proactiveness and innovativeness) will have more non-equity alliances in their
alliance network in subsequent periods.
Advantage-enhancing tendencies and network structure
Firms exhibiting advantage-enhancing tendencies intensively and continuously
enhance the value of existing products and services. In highly competitive environments,
this advantage-enhancing tendency is highly dependent on close collaboration and
coordination of activities among several firms. Baldwin and Clark (2003) noted that firms
in industries such as personal computers or consumer electronics have adopted modular
system designs to cope with the high pace of technological change. ―A modular system is
composed of units (or modules) that are designed independently but still function as an
integrated whole‖ (p. 151). Modules thus refer to a group of interrelated components or
subsystems (e.g., peripherals, processors, software applications, displays) that, combined
with other modules and components, form a complex product (such as a computer or an
iPhone). To deal with this enormous product complexity, firms in these industries
specialize in developing one or few modules (or components). This greater flexibility by
the module providers permits greater experimentation and innovation, which in turn leads
to frequent improvements and upgrades of different components of the whole product.
However, because each component/module is continuously modified by
independent firms, the module providers must communicate and interact intensively. A
complex product comprises components and modules that are highly interrelated; any

33
change in one component requires appropriate adjustments of other components. Garud
and Kumaraswamy (2003) noted that the improvements of different components (or
modules) cannot be effectively integrated into the whole product through arm-length
relationships. Instead, integration requires formation of alliances and joint ventures that
facilitate the exchange of fine-grained information about each module‘s functions: how a
particular module interacts with other modules, and how all components and modules fit
together in the whole product. Alliances help coordination among module suppliers and
thus ensure that the improvements and upgrades in the performances in one module will
be compatible with other components. For clarity, it is useful to distinguish between a
firm architect and a firm module-designer (Baldwin & Clark, 2003). A firm architect is
responsible for the design of the whole product (e.g., Apple is an architect of iPod); while
a firm module-designer is responsible for manufacturing and designing particular
modules and components. I argue that both firm architects and firm module-designers
that exhibit strong advantage-enhancing tendencies will tend to form a dense network
structure.
The firm architect is likely to encourage its network partners to collaborate with
one another for at least two reasons. First, as Garud and Kumaraswamy (2003) noted,
standardization can be achieved through close collaboration among component providers.
Standardization refers to ―the use of the same component in multiple products…‖ (p.
132). Standardized components involve lower costs: a standard component can be used in
several versions of the product, thus providing greater economy of scale and scope and
higher performance. Another reason for firms with advantage-enhancing strategy to
develop dense network structure is the increased need for ensuring greater compatibility
among various components of the complex product. As argued above, when independent
firms are continuously improving a complex product (e.g., 90% of iPod‘s components are
outsourced), the process requires intensive communication to assure compatibility (1)
between the firms‘ architects and module (components) designers, and (2) among all
firms component-designers. Dense alliance networks enhance information exchange
among network partners and prevent information spillover outside the network by
imposing strong norms, expectations, and sanctions for network members (Coleman,
1988). Hence, it is reasonable to expect that the firm-architect (in an attempt to enhance

34
the market position of their existing modular products), will work hard to encourage
partners to collaborate with one another and create dense network structures.
However, this cannot be accomplished unless network partners (module
designers) also have strong incentives to collaborate. For a firm module-designer,
information exchange about specific characteristics of the other components/modules as
well as updates and improvements of the other components are crucial for achieving
greater alignment and compatibility. Greater compatibility in turn provides greater
operational efficiency and avoids unnecessary delays and product malfunctioning.
Because the success of a complex product in the marketplace affects the profitability of
all participating firms, module designers also have strong incentives to closely
collaborate.
This suggests that both firm architects and firm module designers will seek to
closely collaborate with one another to continuously improve the existing modular
product and thus create a dense network structure.
Hypothesis 6: Firms exhibiting higher advantage-enhancing tendencies will have
higher degree of network density in the subsequent periods.
Advantage-enhancing tendencies and strong ties
While advantage-creating tendencies require greater flexibility in restructuring the
alliance portfolio, advantage-enhancing tendencies require a more stable network in
which partners develop trustful relationships and intensively collaborate to develop
compatible components. Network stability can be enhanced when firms form equity
alliances. One characteristic of equity alliances is that they are more difficult and costly
to dissolve (Das & Teng, 2000; Gulati, 1995). This characteristic reduces high alliance
turnover rate, and thus strengthens the current network structure.
As argued above, advantage-enhancing tendencies in the context of modular
product design require intensive exchange of information for effective coordination
among all partners responsible for manufacturing various components. Equity alliances
in this respect are more effective in managing such interdependencies than are non-equity
alliances. Equity alliances typically involve some form of governance structure and
hierarchical elements such as authority and incentive systems, standard operating

35
procedures, dispute resolution procedures, and nonmarket pricing systems that enable
coordination between partners (Gulati & Singh, 1998). Gulati and Singh (1998) showed
empirically that firms are more likely to form equity alliances when they face a higher
degree of interdependency.
In addition, equity alliances promote trust development and deter opportunistic
behavior (Gulati, 1995). Trust between partners is critical if they are to share confidential
information and knowledge. Reduced concerns that partners will act opportunistically
encourage firms to invest in transaction-specific assets and be more willing to share
knowledge and resources and thus jointly develop new competences. This mutual
commitment toward achieving a common goal is an essential precondition for continuous
improvement and enhancement of the value of an existing modular product.
Hypothesis 7: Firms exhibiting higher advantage-enhancing tendencies will have
more equity alliances in subsequent periods.
Strategic entrepreneurship and network structure
Although advantage-creating and advantage-enhancing strategies are distinct, it is
also possible that some firms are able to pursue both simultaneously. These firms have
been identified as following a strategy of ―strategic entrepreneurship.‖ Following Ireland,
Hitt, and Sirmon (2003), strategic entrepreneurship is defined here as the simultaneous
pursuit of advantage-creating and advantage-enhancing strategies at high levels relative
to other industry participants. As argued above, however, advantage-creating and
advantage-enhancing tendencies lead to different types of network structures.
On the one hand, proactive advantage-creating tendencies create a greater need
for restructuring the alliance portfolio and seeking out new partners with complementary
resources and capabilities, because being first in the market to introduce a new product
often requires a new set of partners. Similarly, innovative advantage-creating tendencies
create more opportunities for forming alliances with new partners because (1) innovative
firms are attractive partners and (2) innovative technologies generate new entrepreneurial
opportunities. This leads to forming sparse network structures. On the other hand, firms
that pursue strategic entrepreneurship also have strong advantage-enhancing abilities that
stimulate the formation of dense network structures. They are likely to subsequently

36
encourage the new firms to closely collaborate with their other network partners because
network coordination is critical for continuously enhancing the current competitive
advantages. Their new partners will also have incentive to collaborate because it is to
their benefit to become valued partners within the innovative firm‘s network.
So, within what type of network structure will ―strategically entrepreneurial‖
firms be embedded? Firms that pursue strategic entrepreneurship will exhibit dynamic
network structures with moderate levels of network density and structural holes.
Advantage-creating tendencies will continuously create new alliances and bring new
partners into the network and thus form new structural holes, whereas advantage-
enhancing tendencies will encourage those new partners to form ties with the other
network partners and thus close up the structural holes. This dynamic cycle of creating
and closing structural holes will change the level of density and structural holes in the
firm‘s network. Thus, we can expect that the relative degree to which a firm pursues
advantage-creating and advantage-enhancing tendencies at any given time will determine
the type of their network structure. Specifically, an increase in advantage-creating
tendencies will increase the number of structural holes, whereas an increase in advantage-
enhancing tendencies will decrease the number of structural holes. Alternatively, an
increase in advantage-creating tendencies will decrease network density, whereas an
increase in advantage-enhancing tendency will increase network density. Hence,
Hypothesis 8a: There will be a negative interaction between advantage-creating
and advantage-enhancing tendencies of firms in explaining the future degree of
network density.
Hypothesis 8b: There will be a negative interaction between advantage-creating
and advantage-enhancing tendencies of firms in explaining the future number of
structural holes in the alliance network structure.

37
CHAPTER IV: COMPETITIVE STRATEGY, ALLIANCE NETWORK STRUCTURE
AND FIRM PERFORMANCE
Introduction
In Chapter 2, I argue that firms vary in their capabilities to pursue advantage-
creating and advantage-enhancing tendencies. In Chapter 3, I show that each type of
strategic tendency tends to lead a firm to be embedded in a different type of network
structure. This chapter explores how these combinations of strategic and networking
tendencies affect firm performance. More specifically, I address the following questions:
If advantage-creating tendencies lead to sparse network structures, whereas advantage-
enhancing tendencies lead to dense network structures, are these combinations of strategy
and network structure the most beneficial for the firm‘s performance? If not, what is the
optimal network position for a given strategic tendency that enhances a firm‘s
performance? Answers to these questions are important both (1) for gaining greater
understanding of how firms should construct their networks and (2) for providing a more
complete explanation of the causes for conflicting findings about the relationship
between network structure and performance (e.g., Ahuja, 2000a; Zaheer & Bell, 2005).
First, providing empirical support for the optimal fit between different strategies and
network positions can provide basis for developing normative propositions; that is, how
should managers construct their networks to enhance the effect of their strategy on firm
performance? Second, the empirical research on social networks has demonstrated
conflicting findings about which type of network structure (sparse vs. dense network) is
more beneficial for the firm. This study tries to reconcile these opposing perspectives by
arguing that the effect of the network structure on firm performance is contingent on the
type of strategy the firm is pursuing.
Theoretical Background
Previous research has mainly examined how the firm‘s position in the network
structure directly affects firm performance. The main argument is that certain positions in
the network structure provide firms with unique resources and strategic information
(controlled by other network members) that is not available to other firms. Because some

38
firms consistently occupy such advantageous network positions (and thus preferential
access to network resources), they are able to gain a sustainable competitive advantage
over rivals (Gulati, Nohria, & Zaheer, 2000).
Two basic arguments exist about which type of alliance network structure is the
most beneficial for an actor. The first argument is that dense network structures (network
structures in which all actors are highly interconnected with one another) are conducive
to developing strong norms, reciprocity, and trust. These collective network properties on
one hand encourage efficient exchange of information, resources, and ideas and on the
other hand, curb partners‘ opportunistic behavior by enforcing sanctions (Coleman,
1988). The second argument is that sparse network structures with many brokerage
opportunities provide benefits for actors. Brokerage opportunities exist when a focal actor
links other disconnected members of its network. The absence of ties between
disconnected others is called a structural hole (Burt, 1992). When an actor spans many
structural holes in its network, the actor enjoys two types of benefits: (1) preferential
access to nonredundant information, and (2) the power to control the information flow
between disconnected parties.
The mechanisms through which these network structures provide benefits for
network members are quite different. Network density (also called network closure)
primarily works through solidarity, coordination, and collective action; whereas network
brokerage works through providing opportunities for entrepreneurial action. To some
extent, network density and network brokerage offer alternative ways for actors to gain
benefits. For example, network density eases coordination among network members,
whereas sparse networks may hinder the cooperative exchange of information among
members. In operational terms, the two types of network structure more clearly appear to
be mutually exclusive. A sparse network structure with many brokerage opportunities
implies that the network structure is not dense. When a focal firm‘s partners are
disconnected, it has a maximum number of structural holes, whereas when all of its
partners are connected, the focal firm has a maximum density score of one.
Empirical research at the firm level of analysis (i.e., when actors are firms, not
individuals) has also produced conflicting findings. Uzzi (1997) documented that firms
embedded in a dense network have access to fine-grained information and knowledge

39
from network partners and exhibit a higher likelihood of surviving. Ahuja (2000a) also
found that network density is more beneficial for firms‘ innovative performance. In
contrast, research has also found that firms embedded in a sparse network structure
exhibit greater revenue growth (Baum, Calabrese & Silverman, 2000) and enjoy greater
market share (Zaheer & Bell, 2005).
In general, research has taken two approaches in reconciling these opposing
arguments. On one hand, Burt (2000) and Reagans and Zuckerman (2001) posited that
network density and brokerage are complementary arguments and thus an actor can
simultaneously gain benefits from brokerage and closure. For example, actor A may
benefit from its membership in two dense clusters X and Y, whose members are
disconnected. Thus, actor A can enjoy the benefits from its membership in X and Y, and,
at the same time, enjoy brokerage position between the members of X and members of Y.
On the other hand, some researchers propose a contingency perspective in
explaining how network structure provides benefits for network members. Rowley et al.
(2000) argued that whether a firm will benefit from a dense or sparse network structure
depends on the type of competitive environment it faces. They argued that in stable
environments (e.g., the steel industry), network density increases firms‘ performances,
whereas in dynamic environments (e.g., the semiconductor industry) sparse network
structures will be more beneficial. Their empirical findings showed that the effect of
network density on firm performance was stronger in stable environments. Zahra and
George‘s (2002) work suggested that whether a firm will exploit the resources embedded
in the network structure will depend on their internally developed absorptive capacity
(i.e., their ability to recognize, assimilate, and exploit external knowledge and
information). Building on this argument, Zaheer and Bell (2005) showed that more
innovative firms have a greater ability to extract value from a sparse network structure,
and thus exhibit better performance. Finally, discussing the conflicting findings in the
literature, Ahuja (2000a) also speculated that which type of network structure (sparse
versus dense) would be more beneficial for a firm may depend on what it seeks to
achieve through the network structure.

40
Theory and Hypotheses
This dissertation also adopts a contingency perspective. I posit that whether a firm
will benefit from a sparse or dense network structure depends on the type of competitive
strategy it exhibits. Each type of network structure provides distinct benefits that are
differentially relevant for each type of strategy. I develop two theoretical explanations for
the interplay between network position and firm strategy in explaining firm performance:
(1) network as complementor of firms‘ capabilities and (2) network as substitutor of
firms‘ capabilities.
Network-as-complementor. The first potential role of a network involves having
the resources provided by a particular network position that complements and enhances a
given type of strategy. Specifically, a firm with strong advantage-creating tendencies can
better exploit the diverse and unique information provided through a sparse network
structure than a firm with low emphasis on such a strategy. Similarly, a high level of
advantage-enhancing capabilities enables firms to better realize the resource potential
provided by a dense network.
Network-as-substitutor. The second potential role of network refers to the use of
network position as a substitute for capabilities that a firm is lacking. The rationale for
the beneficial impact of this role builds on the strategic entrepreneurship argument that
firms need to have both high advantage-creating and advantage-enhancing capabilities.
Thus, a firm with strong advantage-creating capabilities may use the capabilities of a
dense network of collaborators to enhance its advantage-enhancing capabilities.
Likewise, a firm with strong advantage-enhancing capabilities may use a network
structure rich with structural holes to gain access to innovative partners outside of their
cluster, and thus substitute for their lack of internal advantage-creating capabilities. I next
discuss how each combination of strategy and structure might positively affect firm
performance.

41
Advantage-creating tendencies and firm performance
A complementary role of a sparse network structure
Firms that span structural holes are more at ―risk‖ of discovering profit
opportunities (Burt, 1992). I refer to profit opportunity as a situation in which a firm
becomes aware of a unique combination of resources (internal, external, or both) that
could produce superior value for customers. Network positions create such situations by
providing unique access to information, resources, or technologies that could be used to
create a product or service that is superior to those hitherto offered by competitors. A
firm embedded in a network structure rich with structural holes has greater awareness of
and access to a diverse set of resources and competences uniquely held by firms in
different industries and industry segments. However, the access to resources and the
ability (and motivation) to exploit those resources are distinct processes (Portes, 1998).
The network position only provides the potential for gaining valuable and advantageous
information and resources. A mere exposure to diverse network resources is insufficient
for creating new competitive advantages. A firm needs the capability to create unique
resource configurations by combining its internal resources with those available through
network ties. Zahra and George (2002) noted that firms can utilize the external resources
and information if they have developed routines and processes to analyze, interpret, and
make sense of new information, if they possess the capability to re-combine the
externally acquired resources with their own internally developed resource potential, and
they have the ability to utilize the newly created resource base in developing pioneering
products.
A firm with strong advantage-creating tendencies (innovative and proactive) will
be better able to utilize the diverse resource potential available through network ties.
These innovative and proactive firms are recognized by their ability to continuously
experiment with new products and technologies and stay alert to the changes in their
environments. They also have greater experience in developing new resource
configurations than less innovative and proactive firms (Ireland, Covin, & Kuratko,
2009). Building on this argument, Zaheer and Bell (2005) tested the interaction between
innovative capabilities and sparse network structure in explaining firm performance and

42
found that highly innovative firms with access to many structural holes outperform rivals.
This suggests that more innovative and proactive firms will be better able to utilize the
access to diverse information provided by sparse network structures, and will thus
perform better in the future. Thus, in this case, the network rich with structural holes
complements and enhances the firm‘s advantage-creating tendencies.
Hypothesis 9: The number of structural holes in the alliance network structure
will strengthen the relationship between advantage-creating tendency and firm
performance.
A substitutive role of a dense network structure
Alternatively, a firm with strong advantage-creating tendencies can use a dense
network structure to substitute for the lack of advantage-enhancing capabilities. This
combination of strategy and network structure would be especially beneficial for firm
designers that develop strong capabilities for frequently creating innovative product
designs. Once the new complex product is designed, the responsibility for its continuous
enhancement can be shifted to network partners. A dense network structure facilitates
information flow and encourages an intensive exchange of ideas and resources that can
lead to frequent improvements and updates of existing products. Thus, instead of building
its own advantage-enhancing capabilities, a firm can focus on developing superior
advantage-creating capabilities and maintain a dense alliance network structure as a way
of substituting for lacking the internal advantage-enhancing capabilities. For example,
Apple‘s superior advantage-creating capabilities led to discovering the iPod, but the
continuous enhancement and improvement of the iPod (i.e., advantage-enhancing
activity) is mainly carried out in close collaboration with the other component providers
in its network. This combination of an advantage-creating strategy and a dense network
structure enables Apple to sustain its advantages over rivals. In addition, Linden,
Kraemer, and Dedrick (2007) showed that Apple captured a far larger portion of the
iPod‘s gross profit margin than did any of the other component providers, retailers, and
distributors. This further suggests that firms with advantage-creating tendencies can
enhance their performance when they are embedded in a dense network structure and
thus use partners‘ capabilities to substitute for advantage-enhancing capability.

43
Hypothesis 10: The degree of density in the alliance network structure will
strengthen the positive effect of advantage-creating tendency on firm
performance.
Advantage-enhancing tendencies and firm performance
A complementary role of dense network structure
As argued in Chapter 3, firms are increasingly becoming specialized in
manufacturing one or a few components of a complex product. No single firm can have
all the capabilities needed to continuously enhance and upgrade the value of an existing
complex product. Therefore, it is crucial for a firm to collaborate with other component
providers and encourage the other component providers to collaborate. I argue that firms
with advantage-enhancing tendencies embedded in a dense network will be more
successful in inducing partners (component providers) to commit their time and resources
to continuously improve an existing product. Thus, in this case, dense network structure
will play a complementary role to the firm‘s advantage-enhancing capabilities.
A firm with a strong commitment to advantage-enhancing activity is more likely
to generate reciprocal expectations from network partners to match its inputs by investing
extra time and resources in the joined project. A dense network enhances this process
because it encourages the development of norms, solidarity, and obligations and leads to
the development of shared behavioral expectations (Rowley, 1997). In addition, when all
firms are interconnected, the information about an actor‘s behavior deviating from the
established norms is quickly disseminated throughout the network, and is immediately
sanctioned (Walker, Kogut, & Shan, 1997). In addition, a dense network eases the
exchange of ideas, information, and resources among network members, which creates
system-level benefits for all participating firms. The increased input of all network
partners creates synergy at the network level and thus enables each individual partner to
gain greater benefit for their input. The intensive information-exchange also reduces the
possibilities of product malfunctioning, which can adversely affect product sales and firm
performance. This suggests that a firm with a strong focus on an advantage-enhancing
strategy will be better able to extend its existing competitive advantages when it is

44
embedded in a dense network. Hence, it is reasonable to expect that the network density
will augment the effect of advantage-enhancing strategy on firm performance.
Hypothesis 11: The degree of density in the alliance network structure will
strengthen the positive effect of advantage-enhancing tendencies on firm
performance.
A substitutive role of a sparse network structure
A firm with strong advantage-enhancing tendencies may use a network with high
degree of structural holes to substitute for its advantage-creating capabilities. Because a
sparse network provides preferential access to information and technologies from a wide
range of geographical and technological clusters, a firm can substitute for its lack of
advantage-creating capabilities in at least two ways. First, a firm that maintains alliances
with firms from different clusters (industries or regions) can recognize more
opportunities for entering new product markets. Second, because brokerage ties provide
timely information about technological advances from distant network clusters, these
firms have greater awareness of collaborative opportunities with inventors. This suggests
that a firm with strong advantage-enhancing capabilities, embedded in a network with
many (global) structural holes, is in a better position to identify innovative firms and
offer collaborative activity to these firms. At the same time, because of their strong
advantage-enhancing capability, they are attractive partners for innovative firms.
Innovative firms have also a need to identify firms with strong advantage-enhancing
capabilities to successfully commercialize their new products and technologies
(Rothaermel & Deeds, 2004).
Furthermore, a sparse network structure also provides quick access to information
about new industries and technological trends. This can increase a firm‘s ability to more
accurately anticipate the introduction of pioneering products and technologies. The
timely information provided through the network can enable a firm to begin developing
capabilities to enter the newly created product market as an early follower. Early entry
into new markets is especially crucial for firms with strong advantage-enhancing
capabilities. Huff and Robinson (1994) showed that the ability of later entrants to catch
up with the pioneering firm increases as the time decreases between market entry of

45
pioneering firm and the market entry of later entrants. Similarly, Lilien and Yoon (1990)
found that early followers that enter the market in the early stages of the product life-
cycle (e.g., introductory or growth stages rather than late-growth or maturity stages) have
higher product success rates. Thus, firms can fully capitalize on their superior advantage-
enhancing capabilities when they are embedded in a sparse network structure, and thus
network structure again plays a substitutive role for the firm‘s advantage-creating
capabilities.
Hypothesis 12: The number of structural holes in the alliance network structure
will strengthen the relationship between advantage-enhancing tendencies and
firm performance.

46
CHAPTER V: RESEARCH METHODOLOGY
Sample Selection
I draw a sample of firms from the computer and electronics industries to test the
theoretical propositions. These industries are characterized by intense alliance activity,
short product life cycles, frequent updates of products and services, and intense rivalry
(Mendelson & Pillai, 1999). For example, the computer industry‘s share of the total
number of granted patents across all industries increased from 5% in 1960s to 20% in the
late 1990s, and the patent activity in the electronics segment remained at about 18% of
the total number of patents granted in all industries (Hall, Jaffe, & Trajtenberg, 2001).
Furthermore, the frequency of new product introductions by the firms in these broad
industry segments has substantially increased to almost one new product introduction per
year (Nadkarni & Narayanan, 2007).
The computer and electronics industries are a very broad segment and include a
number of four-digit SIC codes. However, one commonality that all firms in this industry
share is the use of the integrated circuit chip as a core technology; thus, they are close
competitors and collaborators across a wide range of product markets. For example, the
integrated circuit chip is used as a base for producing a wide variety of products such as
computers (e.g., laptops, desktops, workstations), computer peripherals (e.g., printers, fax
machines, scanners), consumer electronics (e.g., camcorders, digital cameras, TVs), and
other electronic products (Mendelson & Pillai, 1999).
Firms were selected from the following four three-digit SICs: 357 (computer and
office equipment), 365 (household audio and video equipment and audio recordings), 367
(electronic components and accessories), and 386 (photographic equipment).
Additionally, I included the computer software industry (SIC 7372 – prepackaged
software and 7373 – integrated systems design), as firms in this industry are often both
collaborators and competitors to the firms in the computer hardware and consumer
electronics industry. From the population of 598 firms for which COMPUSTAT had
available financial data, I selected firms based on the following criteria: total revenues >
= $1 billion and number of employees > = 1,000. These criteria yielded a sample of 103
firms. I chose to sample large and publicly more prominent firms to reduce the concerns

47
of the so-called newspaper bias (Earl, Martin, McCarthy, & Soule, 2004). One of the
main sources of data collection in this study is content analysis of published new articles,
which sometimes can be susceptible to bias toward more prominent firms (see below for
more detail about my content analysis approach).
It is possible, however, that some smaller companies are major competitors in
these industries and draw substantial attention from the media, despite not reaching the
criteria of at least 1,000 employees and at least $1 billion in sales. To identify these firms,
I conducted an additional search for announcements of firms‘ competitive activities in
nearly 8,000 newspapers and magazine articles available through Factiva (see below for
more information). I searched for general news (i.e., media coverage) using the following
key word criteria: company name in the headline, time period (1993 to 1999), and
Factiva code (in = i3302) for the ―computer and electronics‖ industry. The total number
of news articles that were generated was used to rank all firms that did not satisfy the
initial selection criteria (i.e., >1,000 employees and >$1,000 million sales). All firms with
a news count greater than the news count of the lowest ranked firm in my initial sample
were added back to the sample. This procedure yielded an additional 22 firms. The final
sample included 125 major competitors in the computer (hardware and software) and
electronics industries (because of missing data, this number varied in the regression
analysis over time). The distribution of firms by 3-digit SICs are as follows: 47 firms in
SIC 357 (computer and office equipment), 54 firms in SIC 367 (electronic components
and accessories), 16 firms in SIC 737 (prepackaged software and integrated systems
design), 4 firms in SIC 386 (photographic equipment) and 4 firms in SIC 365 (audio and
video equipment).
Alliance Network: Data and Measures
Data
I used the SDC database (a product of Thomson Financial) as a main source for
collecting alliance data. I used ―Joint Ventures/Strategic Alliances‖ section of SDC
database to access data on newly formed alliances. Compared with other similar data
sources (e.g., MERIT-CATI, CORE, RECAP, or Bioscan), the SDC database is the most

48
comprehensive. It includes the widest range of industries and sectors, alliances with both
public and private firms, and an extensive searchability across a large number of items
coded with high accuracy (e.g., current status of the alliance, date of announcement and
termination of the alliance, equity vs. non-equity alliances, nation, SIC code of partners,
type of alliance across different business functions, parent company identification
number - CUSIP) (Schilling, 2009). I searched alliances for each firm using its unique
CUSIP number. The CUSIP numbers are unique for each firm and allow for reliable
merging of the data across all three databases used in this study: COMPUSTAT, NBER
Patent Citations Database, and SDC Joint Ventures and Strategic Alliances. To
adequately compute my network measures (e.g., network density) I collected complete
network data, including the alliances formed both by my sample firms and by the
partners of my sample firms. More specifically, I first searched for all alliances
established by the 125 firms in my sample (by CUSIP number) between 1990 and 2003.
This search identified 4,561 alliances among 2,502 unique firms. To construct a full
network, I then searched for alliances that these 2,502 firms have formed over the same
period. This search generated 36,766 alliances. Table 18 in the appendix reports detailed
summary statistics on the alliances.
I created matrixes for each year. These matrixes were of different sizes for each
year. The number of unique firms varied from a minimum of 1,806 in 1990 to a
maximum of 3,934 in 1995. The SDC database provides data for alliance termination
date for many of the alliances. I used these data to remove the alliance ties in the year
when the alliance was dissolved. However, several researchers have suggested that
alliance termination data are not as reliable (or reported) as alliance formation data,
which can cause overrepresentation of the alliances for some firms (e.g., Gulati, 1995).
To reduce these concerns, I followed the prior research and used ―moving-window‖
approach. The prior research has used three- or five-year moving windows (e.g., Stuart,
2000; Lavie, 2007). I chose the more conservative three-year moving window (i.e., I
considered only the alliances formed in the past three years).
Because matrixes were sized differently in each year (i.e., a different number of
firms appeared in the network in each year), I used the ―time stack‖ function available in
UCINET VI (Borgatti, Everett, & Freeman, 2002) to generate even matrixes for each
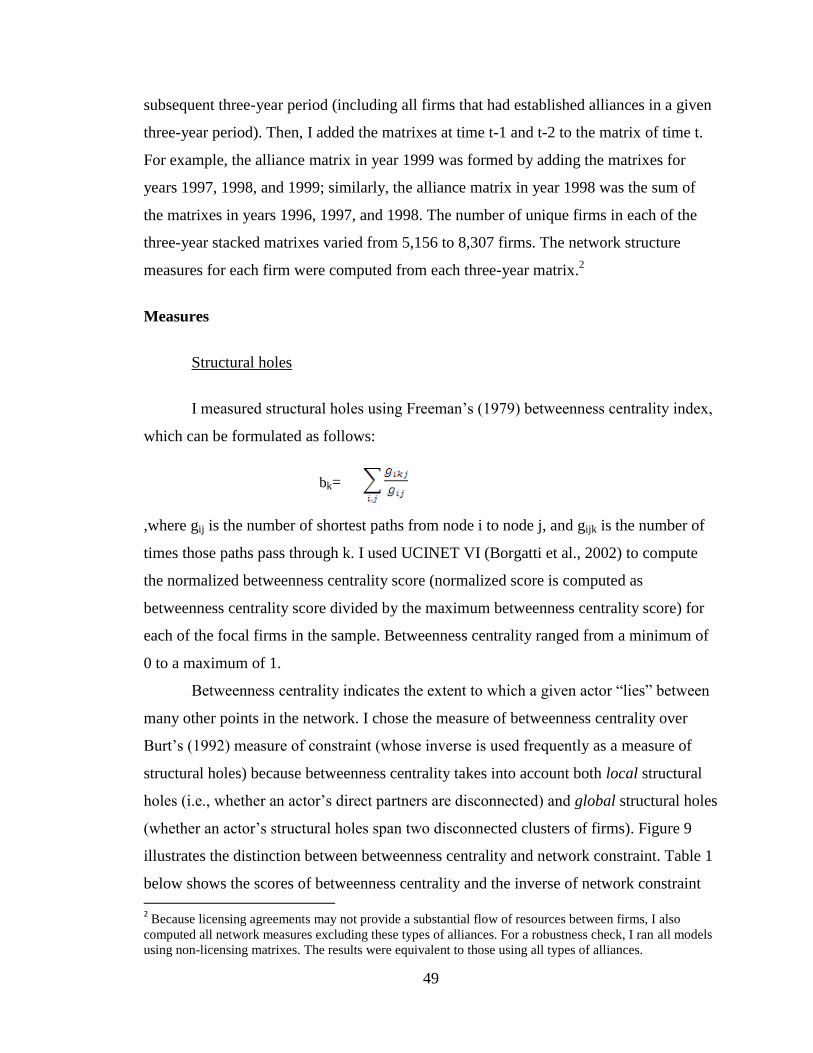
49
subsequent three-year period (including all firms that had established alliances in a given
three-year period). Then, I added the matrixes at time t-1 and t-2 to the matrix of time t.
For example, the alliance matrix in year 1999 was formed by adding the matrixes for
years 1997, 1998, and 1999; similarly, the alliance matrix in year 1998 was the sum of
the matrixes in years 1996, 1997, and 1998. The number of unique firms in each of the
three-year stacked matrixes varied from 5,156 to 8,307 firms. The network structure
measures for each firm were computed from each three-year matrix.2
Measures
Structural holes
I measured structural holes using Freeman‘s (1979) betweenness centrality index,
which can be formulated as follows:
,where gij is the number of shortest paths from node i to node j, and gijk is the number of
times those paths pass through k. I used UCINET VI (Borgatti et al., 2002) to compute
the normalized betweenness centrality score (normalized score is computed as
betweenness centrality score divided by the maximum betweenness centrality score) for
each of the focal firms in the sample. Betweenness centrality ranged from a minimum of
0 to a maximum of 1.
Betweenness centrality indicates the extent to which a given actor ―lies‖ between
many other points in the network. I chose the measure of betweenness centrality over
Burt‘s (1992) measure of constraint (whose inverse is used frequently as a measure of
structural holes) because betweenness centrality takes into account both local structural
holes (i.e., whether an actor‘s direct partners are disconnected) and global structural holes
(whether an actor‘s structural holes span two disconnected clusters of firms). Figure 9
illustrates the distinction between betweenness centrality and network constraint. Table 1
below shows the scores of betweenness centrality and the inverse of network constraint 2 Because licensing agreements may not provide a substantial flow of resources between firms, I also
computed all network measures excluding these types of alliances. For a robustness check, I ran all models
using non-licensing matrixes. The results were equivalent to those using all types of alliances.
bk=
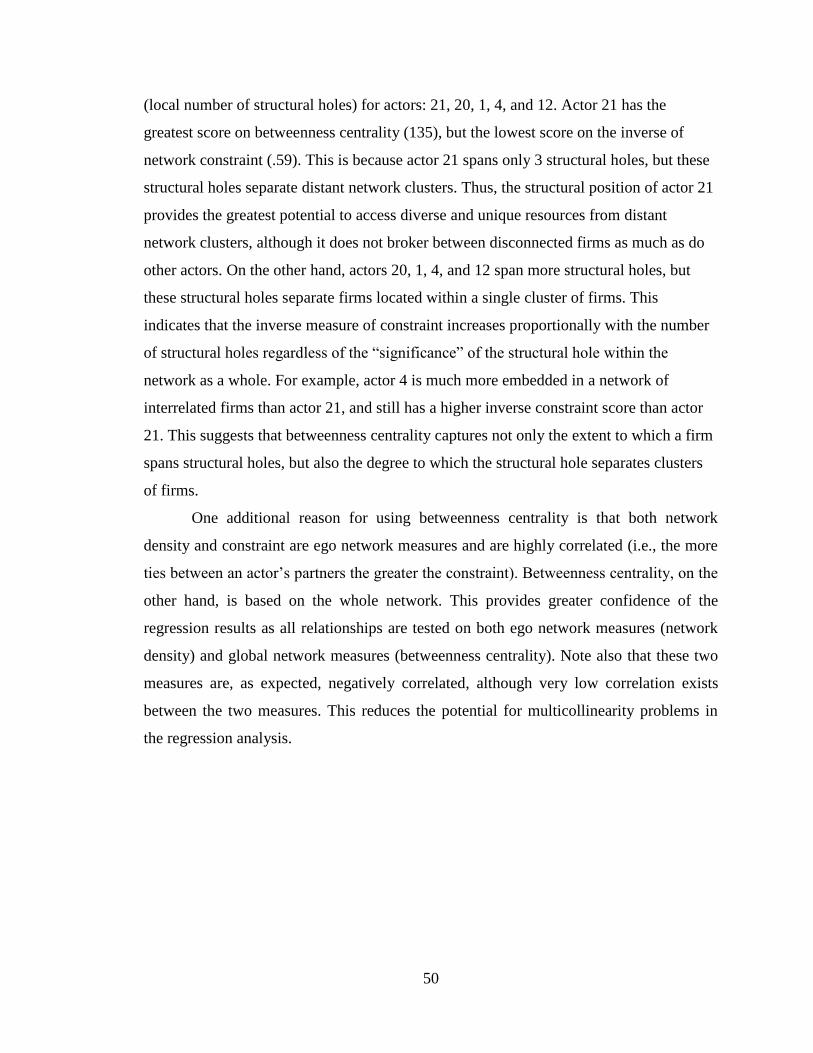
50
(local number of structural holes) for actors: 21, 20, 1, 4, and 12. Actor 21 has the
greatest score on betweenness centrality (135), but the lowest score on the inverse of
network constraint (.59). This is because actor 21 spans only 3 structural holes, but these
structural holes separate distant network clusters. Thus, the structural position of actor 21
provides the greatest potential to access diverse and unique resources from distant
network clusters, although it does not broker between disconnected firms as much as do
other actors. On the other hand, actors 20, 1, 4, and 12 span more structural holes, but
these structural holes separate firms located within a single cluster of firms. This
indicates that the inverse measure of constraint increases proportionally with the number
of structural holes regardless of the ―significance‖ of the structural hole within the
network as a whole. For example, actor 4 is much more embedded in a network of
interrelated firms than actor 21, and still has a higher inverse constraint score than actor
21. This suggests that betweenness centrality captures not only the extent to which a firm
spans structural holes, but also the degree to which the structural hole separates clusters
of firms.
One additional reason for using betweenness centrality is that both network
density and constraint are ego network measures and are highly correlated (i.e., the more
ties between an actor‘s partners the greater the constraint). Betweenness centrality, on the
other hand, is based on the whole network. This provides greater confidence of the
regression results as all relationships are tested on both ego network measures (network
density) and global network measures (betweenness centrality). Note also that these two
measures are, as expected, negatively correlated, although very low correlation exists
between the two measures. This reduces the potential for multicollinearity problems in
the regression analysis.

51
Table 1: Scores of Network Constraint and Betweenness Centrality
21 20 1 4 12Degree Centrality 5 5 5 5 5Betweenness 135 112 112 42.83 42.83Constraint (reversed) 0.59 0.80 0.80 0.62 0.62
Actors
Figure 9: Network Constraint versus Betweenness Centrality
Figure 10: Network Constraint versus Betweenness Centrality
Size of the nodes is proportional with the
score of betweenness centrality
Size of the nodes is proportional with the score
of reversed constraint
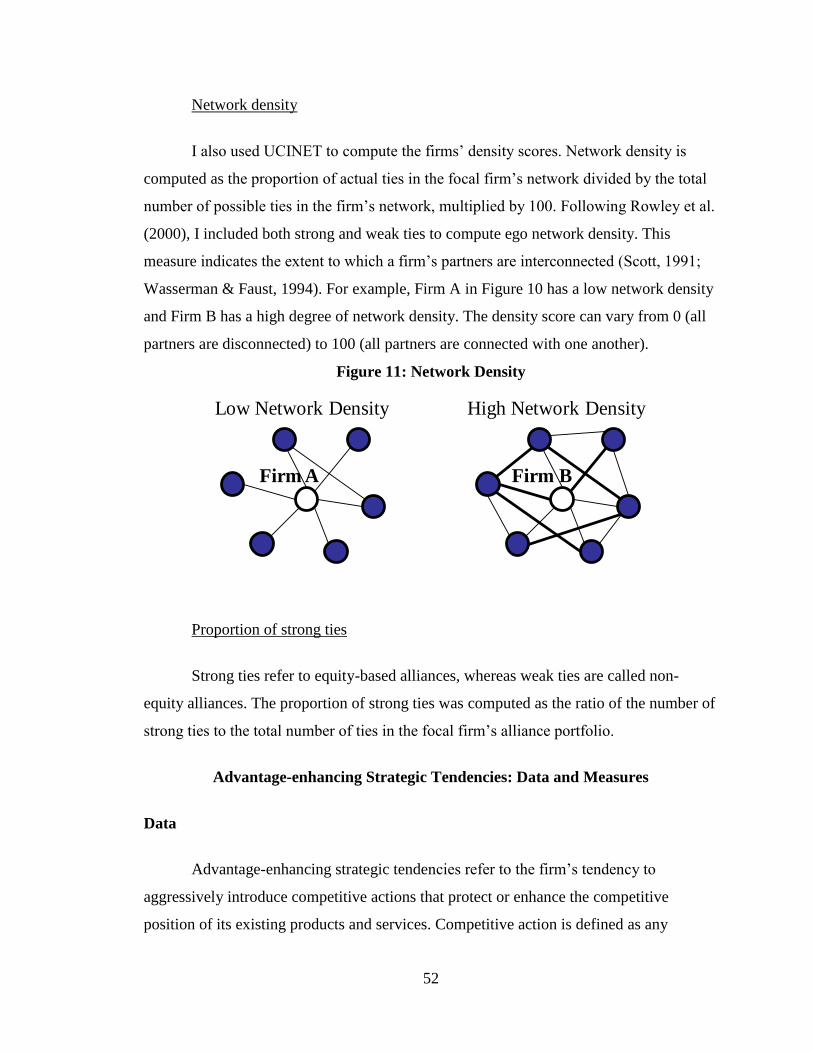
52
Network density
I also used UCINET to compute the firms‘ density scores. Network density is
computed as the proportion of actual ties in the focal firm‘s network divided by the total
number of possible ties in the firm‘s network, multiplied by 100. Following Rowley et al.
(2000), I included both strong and weak ties to compute ego network density. This
measure indicates the extent to which a firm‘s partners are interconnected (Scott, 1991;
Wasserman & Faust, 1994). For example, Firm A in Figure 10 has a low network density
and Firm B has a high degree of network density. The density score can vary from 0 (all
partners are disconnected) to 100 (all partners are connected with one another).
Figure 11: Network Density
Low Network Density High Network Density
Firm A Firm B
Proportion of strong ties
Strong ties refer to equity-based alliances, whereas weak ties are called non-
equity alliances. The proportion of strong ties was computed as the ratio of the number of
strong ties to the total number of ties in the focal firm‘s alliance portfolio.
Advantage-enhancing Strategic Tendencies: Data and Measures
Data
Advantage-enhancing strategic tendencies refer to the firm‘s tendency to
aggressively introduce competitive actions that protect or enhance the competitive
position of its existing products and services. Competitive action is defined as any

53
externally directed, specific, and observable competitive move initiated by the firm to
enhance the firm‘s competitive position (Ferrier et al, 1999; Smith, Grimm, Gannon, &
Chen, 1991). The data collection method used in this study was structured content
analysis (Jauch, Osborn, & Martin, 1980). Content analysis is a technique for reducing a
text into manageable content categories, which are meaningful units of information that
can be analyzed and interpreted. This technique enables a researcher to generate a unit-
by-variable matrix suitable for quantitatively testing hypotheses (Denzin & Lincoln,
2000). Following the research in competitive dynamics, I used content analysis to
identify publically announced competitive moves of firms. The primary source of data for
measuring firms‘ advantage-enhancing tendencies was Factiva, an electronic online data
base. Factiva is one of the most comprehensive databases for business news and
information covering more than 2,100 newspapers (including the Wall Street Journal, the
Financial Times), 3,500 magazines (e.g., the Economist and Computerworld), 500
newswires (including Dow Jones, Reuters, and the Associated Press), transcripts from
280 media programs (e.g., BBC, CNN, NBC, ABC, Fox) and 12,000 of the world‘s top
news and business Web sites. Factiva is used extensively by firms such as Microsoft,
Ford, Seiko Epson, De Beers and Ernst & Young for competitive intelligence and
knowledge management purposes (www.factiva.com). Factiva provides full articles in
electronic form, which enhances the researchers‘ ability to reliably code the competitive
activity of firms. In addition, because of its global scope, the use of Factiva as a news
source provides greater confidence that the published news articles are not biased toward
covering only the competitive actions of the firms that predominantly sell in the North
American market.
Measures
To identify advantage-enhancing competitive actions, I followed the coding
procedure developed in previous research in competitive dynamics (e.g., Ferrier, Smith,
& Grimm, 1999; Boyd & Bresser, 2008; Smith et al., 1991; Gnyawali & Madhavan,
2006). I first randomly selected five firms from each of the six industry segments
(described in the sample selection section above). For each of these firms, I downloaded
news articles using a general key word searching criteria available in Factiva: company

54
name (e.g., Sony/f30/ – the company name in the first 30 words of the article), year =
1999, and Factiva-specific industry code (in = i3302 – for computers and electronics
industry). I then tried to identify inductively all possible advantage-enhancing actions
these firms carried out in 1999. I focused on market-based and externally oriented actions
that indicated a firm‘s attempt to enhance and improve its market position. After
consulting with two experts with extensive prior experience in the consumer electronics
and computer industries, I identified the following four advantage-enhancing competitive
actions: marketing (advertising and promotions), improvements (product improvements
and new versions of an existing product), price cuts (price cuts and sales incentives), and
market expansions (new capacity, new distribution channels, expansion of dealership
network, and winning of new supply contracts).3 Table 2 below shows examples of the
news announcements for each action category.
I developed key word searching criteria using a combination of Factiva‘s
intelligent indexing and Boolean search operators. Table 21 in the appendix shows the
key-word criteria used in Factiva search engine to retrieve relevant articles. I also provide
more detail about the process of developing key word queries. Using these queries, the
search generated 42,481 news articles. The articles were exported into an Excel
spreadsheet. The data were carefully screened for duplicates and irrelevant news (e.g.,
news about stock prices, analyst commentaries, legal actions). Only the earliest news
announcement of each action was retained. After cleaning and coding all articles, I
identified 11,075 competitive actions initiated by the 125 firms between 01/01/1993 and
12/31/1999. To estimate the reliability of the coding, two coders independently coded a
randomly selected subsample of 1% of the total number of news items (110 news
articles). To estimate inter-rater reliability of the coding process, I used Perreault and
Leigh‘s (1989) index, which is formulated as follows:
Ir={[(Fo/N) – (1/k)][k/(k-1)]}^.5.
where, Fo is number of correct choices (agreement), N is total number of choices, and k
is number of action categories. The estimated interrater reliability was .85, which exceeds
the convention of 0.70 (Denzin & Lincoln, 2000). On average, firms introduced about 3.3
3 New products are excluded from this list and are used exclusively for measuring proactiveness (see
below).

55
marketing actions (range from 0 to 86), 7.7 improvements (min 0 to max 153), 1.1 price
cuts (min 0 to max 32), and 1.84 market expansions (min 0 to max 35). The average
number of competitive actions per firm/year (i.e., the average advantage-enhancing
activity) was 19 (min 0 to max 250). The confirmatory factor analysis (discussed below)
provided evidence for treating advantage-enhancing tendency as a distinctive construct.
The estimated factor scores were used in the regression analysis.

56
Table 2: Selected News Reports on Advantage-enhancing Actions
Product
Improvements
Dec. 10, 1997 SUNNYVALE, Calif., (Reuters) - Advanced Micro Devices Inc.
Wednesday unveiled an upgrade to its flash memory chip family which will extend
battery life in hand-held portable devices such as cellular telephones and pagers.
Product
Improvements
Feb. 28, 1995. PRINCETON, N.J.--(BUSINESS WIRE)-- --Dataram Corp., a leading
developer, manufacturer, and marketer of memory and storage products, today
announced the immediate availability of memory upgrades for Digitals‘ AlphaServer
1000 4/200. Dataram‘s DR70 memory upgrade is available in 16, 32, 64, and 128 MB
capacities.
New Product
Version
1/16/1998 Tewksbury, Massachusetts based Avid Technology Inc has unveiled an
upgraded version of its video production system Avid Xpress version 2.0 with
enhanced graphics, titling and audio features. The system will begin shipping next
month in four new configurations with prices beginning at $9,995.
New Product
Version
6/12/1998 -Oracle Corp has released Version 3.0 of its Video Server product,
boasting numerous enhancements and new features to the software that was first
introduced in 1993 for interactive TV video-on-demand. Video Server 3.0 is designed
to, along with Oracle8 database server, offer the central components for interactive
applications.
Price cuts 4/17/1995-CUPERTINO, Calif. (Reuter) - Apple Computer Inc. said Monday it was
cutting prices on its entry-level PowerBook 150 notebook computers by 27%. Under
the new pricing, the PowerBook 150 with 4 megabytes RAM and a 120 megabyte hard
drive will cost $1,069, down from $1,469 previously.
Price cuts 2/13/1997-Bracknell-based Dell Computer has slashed up to 16% off the price of its
Optiplex business desktop computers in a bid to put pressure on its main rivals
Compaq and Gateway.
Market
expansion:
1/14/1999-Apple Computer, Inc. has expanded its online store into France, Germany,
Italy, Spain, Holland and Belgium, following the launch of the UK store last May.
European customers can now take advantage of Apple‘s build-to-order capabilities for
G3 systems.
Market
Expansion:
11/30/1998-MILPITAS, CALIF.--Solectron has purchased 40 acres of land in
Timisoara, Romania and has started building a new manufacturing campus. The
move, the firm said, brings to Europe an expanded, full-service, high-volume, low-cost
manufacturing hub for Solectron‘s growing regional customer base.
Marketing:
Promotion May 8, 1995--SANTA CLARA, Calif. – (BUSINESS WIRE) – Intel Corporation
today announced it is donating $1 million to Smart Valley, Inc. to support the Smart
Schools Project. The donation will include cash, expertise, and equipment such as
Intel‘s ProShare Video Systems and Pentium Processor Systems.
Marketing:
Advertising
8/17/1995-SEATTLE, Aug 17 (Reuter) - Microsoft Corp. has bought rights to use the
Rolling Stones song "Start Me Up" as the theme to its advertising campaign for the
new Windows 95 operating system, a spokeswoman for the software giant said
Thursday.
Marketing:
Advertising
April 26 ,1996-ROCHESTER, N.Y., (Reuter) - Eastman Kodak Co said Friday it has
introduced a new television advertising campaign to strengthen its brand this week
under the theme "Take Pictures.‖

57
Advantage-creating Strategic Tendencies: Data and Measures
An advantage-creating strategic tendency is defined as a firm‘s tendency to
frequently create new competitive advantages by discovering radically new technologies
(i.e., innovativeness) and introducing new products, services, or technologies on the
market ahead of competitors (i.e., proactiveness). Thus, advantage-creating strategy
comprises two dimensions: proactiveness and innovativeness. In an operational sense, I
consider these two dimensions as formative rather than reflective. Formative measures
are viewed as causes of the latent construct, whereas reflective measures are viewed as
reflections (or manifestations) of the latent construct, and thus they are caused by the
latent factor (Diamantopoulos & Siguaw, 2006; Edwards & Bagozzi, 2000). The
advantage-creating tendency is behavioral, higher-order construct that is caused by firms‘
innovative and proactive activity. This implies that firms can exhibit advantage-creating
tendency by pursuing different degrees of innovative and proactive activity. Thus, a firm
may create new competitive advantages either by discovering new technologies or by
creating new product categories or both. Therefore, although these two dimensions can be
related, they can also vary independently (Lumpkin & Dess, 1996). Previous research
suggests a positive relationship between innovativenses and proactiveness (e.g., Comanor
& Scherer, 1969; Hagadoorn & Clodt, 2003) and that this relationship may be sequential
(Lumpkin & Dess, 2001). For example, high innovativeness may increase the firm‘s
potential to introduce new products. However, the firm can also introduce new products
(proactively) without possessing radically new technology. I, therefore, consider
proactiveness and innovativeness related but independent dimensions (i.e., they can
differentially explain other outcome variables) that capture a distinctive portion of the
advantage-creating tendency construct.
Proactiveness: Data and Measures
I also used the content analysis approach described above to measure
proactiveness. The announcements of new product introductions were identified using the
criteria shown in Table 21 in the appendix (also used for identifying product versions and
improvements). I identified 3,488 news articles with announcements of new products and

58
versions. Then, I read each article to identify key words that indicate the firms‘
proactiveness. To capture the proactive tendency of firms, I searched for key words in the
news reports that indicated the ―pioneering‖ nature of the new product. Some examples
of the identified key words of proactive tendency are ―first company to offer,‖ ―industry
first,‖ ―industry‘s only,‖ ―world‘s first,‖ ―set industry standards,‖ ―revolutionary,‖
―breakthrough,‖ ―pioneering,‖ ―the only device on the market,‖ and ―new world
standard‖ (the full list of identified phrases is shown in Table 19 in the Appendix). Using
these words and phrases as a guideline, two raters independently coded all 3,488 news
articles with new-product announcements. The two coders identified 587 announcements
of new products that indicated the firm‘s proactiveness. Table 3 below shows examples
of news reports that indicated the ―pioneering‖ nature of the products. Firms‘
proactiveness was measured as the number of pioneering products that a firm initiated in
a given year. To capture the firm‘s tendency to be proactive, I averaged this count over
the past three years for each firm. On average, firms initiated about 0.73 pioneering
products a year, ranging from minimum 0 to maximum 7.

59
Table 3: Selected News Reports on “Proactive” New Products
To provide greater confidence in the content validity of the news reports, I also
searched for at least two additional independent news sources for each announcement of
a ―proactive‖ new product. To illustrate, Table 4 below shows several news reports from
various newspapers, magazines and newswires that announced the introduction of the
Proactiveness 3/3/1995 PALO ALTO, Calif. (Reuter) - Hewlett-Packard Co., aiming to exploit the rapid
growth of the mobile computing market, will announce Monday the industry’s first
wireless printers. The printers use infrared technology that allows them to take orders from
laptops and other mobile computers.
Proactiveness Tokyo, Nov. 6, 1996- (Jiji Press)-Fujitsu Ltd. said Wednesday it will launch the world’s
first personal computer equipped with a DVD-ROM drive, a computer peripheral device
that reads information on digital videodiscs, in Japan in mid-December. The FMV
Deskpower T20D, powered by Intel Corp‘s 200-megahertz Pentium microprocessor, will
allow users to enjoy high-quality video on DVDs, a new large-scale digital storage. They
can also use CD-ROMs and DVD-ROMs as well as music CDs.
Proactiveness Oct 1, 1999. Adobe launches "revolutionary" design software. KUALA LUMPUR: Adobe
Systems Inc has launched the Adobe InDesign, touted to be a revolutionary product
designed to change the way professionals view layout applications.
Proactiveness SANTA CLARA, Calif.–(BUSINESS WIRE)–Oct. 15, 1997–3Com Corp.
(NASDAQ:COMS), a leader in providing networking solutions for the retail industry,
today launched its Point of Sale (POS) Partners Program to deliver the industry’s first
complete enterprise-wide, standards-based networked POS solution. The first-of-its-kind
in the networking industry, the 3Com POS Partners Program brings a new level of
functionality, performance, and investment protection to the point of sale.
Proactiveness SUNNYVALE, Calif.–(BUSINESS WIRE)–Nov. 4, 1998–SanDisk Corporation
(Nasdaq:SNDK) today introduced the world’s first solid-state flash memory card in the
new CompactFlash Type II form factor approved by the CompactFlash Association (CFA)
last March. The new card can store 160 megabytes (MB) of data, audio and images.
SanDisk, inventor of CompactFlash(TM) (CF(TM)), is a founding member and technical
chairman of the CFA.
Proactiveness SAN JOSE, Calif.–(BUSINESS WIRE)–May 11, 1999–Sony Tuesday announced a
breakthrough in tape recording density, by demonstrating the ability to store one billion
bits of data on a square inch of tape. This achievement was made possible by
incorporating the first use of magneto-resistive (MR) heads in a helical scan tape
mechanism. This achievement demonstrates the viability of Sony‘s next generation of AIT
(AIT-3), which will provide 100GB of uncompressed data in a compact media cartridge
and 3.5 inch drive form factor.
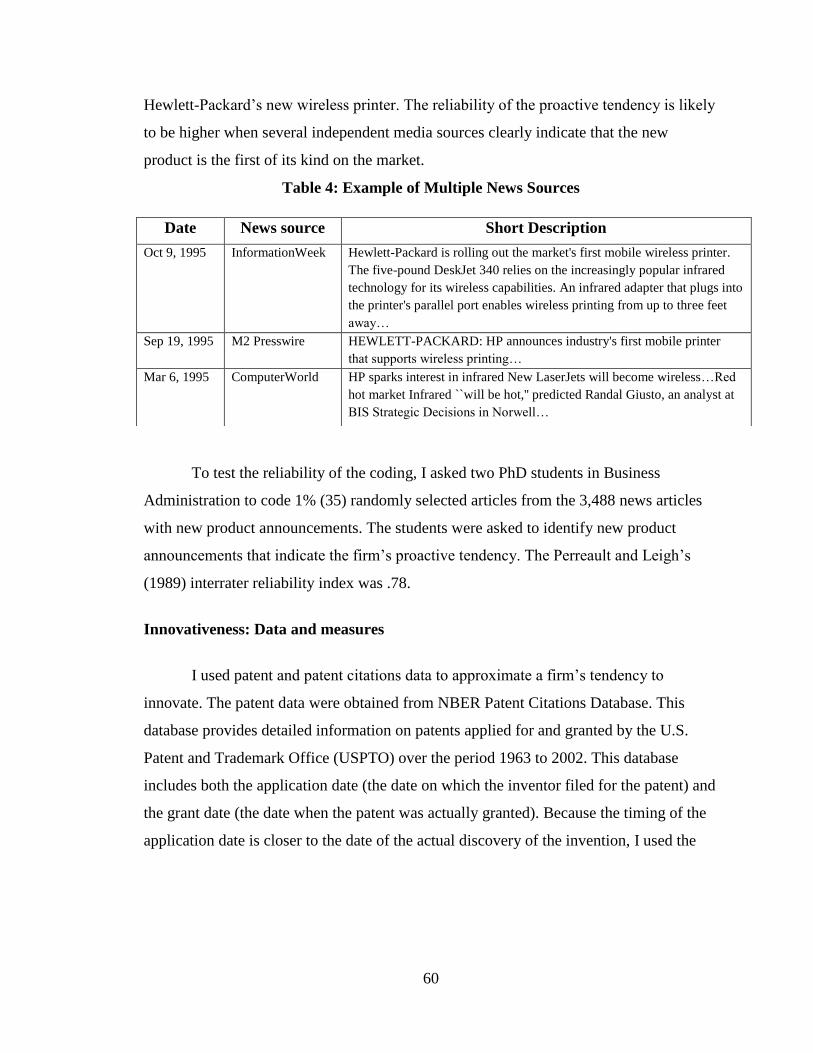
60
Hewlett-Packard‘s new wireless printer. The reliability of the proactive tendency is likely
to be higher when several independent media sources clearly indicate that the new
product is the first of its kind on the market.
Table 4: Example of Multiple News Sources
To test the reliability of the coding, I asked two PhD students in Business
Administration to code 1% (35) randomly selected articles from the 3,488 news articles
with new product announcements. The students were asked to identify new product
announcements that indicate the firm‘s proactive tendency. The Perreault and Leigh‘s
(1989) interrater reliability index was .78.
Innovativeness: Data and measures
I used patent and patent citations data to approximate a firm‘s tendency to
innovate. The patent data were obtained from NBER Patent Citations Database. This
database provides detailed information on patents applied for and granted by the U.S.
Patent and Trademark Office (USPTO) over the period 1963 to 2002. This database
includes both the application date (the date on which the inventor filed for the patent) and
the grant date (the date when the patent was actually granted). Because the timing of the
application date is closer to the date of the actual discovery of the invention, I used the
Date News source Short Description
Oct 9, 1995 InformationWeek Hewlett-Packard is rolling out the market's first mobile wireless printer.
The five-pound DeskJet 340 relies on the increasingly popular infrared
technology for its wireless capabilities. An infrared adapter that plugs into
the printer's parallel port enables wireless printing from up to three feet
away…
Sep 19, 1995 M2 Presswire HEWLETT-PACKARD: HP announces industry's first mobile printer
that supports wireless printing…
Mar 6, 1995 ComputerWorld HP sparks interest in infrared New LaserJets will become wireless…Red
hot market Infrared ``will be hot,'' predicted Randal Giusto, an analyst at
BIS Strategic Decisions in Norwell…

61
application date to identify the number of patents that each firm was involved with in a
given year4 (Hall, Jaffe, & Trajtenberg, 2001).
NBER database also includes information about citations received and citations
made for each patent. Citations made refer to the number of previous patents that are
cited in a given patent‘s application document, whereas citations received refer to the
number of subsequent patents that have cited a given patent. Citing any prior knowledge
is a legal duty and is critical information for clearly specifying the patent‘s property
rights (Hall, Jaffe, & Trajtenberg, 2001). Research has shown that high patent citation
counts are important indicators of the path-breaking nature of an invention. An invention
that is cited by many subsequent patents is likely to provide the basis for many future
technological discoveries (Ahuja & Lampert, 2001; Trajtenberg, 1990). I used citations
received to approximate the impact or ―radicality‖ of each patent (see below for more
detail).
Previous research using patent citations data have highlighted several issues that
need to be adequately addressed. First, not all patents have the same citation ―window.‖
More recent patents have shorter time periods in which to be cited. To avoid this
problem, all patents were compared only with the patents in the same year. In addition, as
recommended by Hall et al. (2001), I use time fixed effects to eliminate any systematic
time-related effects that might affect the citation rate over time. Second, there is a lag
between the invention time and the time when the patent is actually granted by USPTO.
To deal with this problem, I followed Hall et al.‘s (2001) recommendation to use the
application date of the granted patents, because the application date is closest to the
actual timing of the invention. Finally, following prior research, I used U.S. Patent and
Trade Office data for all firms including non-U.S. firms. This approach reduces the
inconsistencies and incompatibilities between the patent systems across different nations
(Ahuja & Lampert, 2001). In addition, because the United States is the largest technology
4 ―Inventors have a strong incentive to apply for a patent as soon as possible following the completion of
the innovation, whereas the grant date depends upon the review process at the Patent Office, which takes on
average about 2 years, with significant variance…Indeed, the mode of operation of the patent Office
underwent significant changes in the past decades, thereby introducing a great deal of randomness (that
have noting to do with the actual timing of the inventions (into any patent time series dated by grant year‖
(Hall, Jaffe, & Trajtenberg, 2001: 10)

62
market, most of the major non-U.S. headquartered firms submit their patent applications
in the United States (Stuart & Podolny, 1996).
I measured firms‘ innovativeness using three items: innovation intensity,
innovation radicality, and innovation generality. The first item captures the total quantity
of innovative activity, whereas the other two items capture the technological significance
of the inventions (Morris & Sexton, 1996).
Innovation intensity
Innovation intensity is simply a count of the total number of patents a firm has
applied for in a given year. Although this measure does not directly capture the radicality
of the inventions, I included this measure for two reasons. First, entrepreneurship
research suggests that firms‘ entrepreneurial activity can be more closely depicted using
measures of both the amount and the magnitude of innovativeness (Moris & Sexton,
1996). Second, it is possible that a firm has strong entrepreneurial (advantage-creating)
tendency, but in a given period has not discovered radically new technology. Because I
use patent activity of firms to depict firms‘ innovative strategy (tendency), a more
reliable measurement would include both firms‘ entrepreneurial intent and
entrepreneurial outcome. To approximate the innovative tendency of firms, I averaged
the number of patents for each firm over the past three years. Thus, innovation intensity
refers to the average number of patents that a firm has applied for (and was subsequently
granted) in the past three years. On average, firms applied for 43 patents per year.
Innovation radicality
This item captures the tendency of firms to discover radical (breakthrough)
innovations. I used ―citations received‖ to approximate the impact of a given patent on
the subsequent innovations in the industry. More specifically, when patent B cites patent
A, it means that patent B builds on the knowledge previously created by patent A. The
more subsequent patents that cite patent A, the greater the technological significance of
patent A (Hall, Jaffe, & Trajtenberg, 2001).

63
I first ranked all patents in a given year by the number of ―citations received.‖
Then, I identified the top 1% most cited patents in the industry for that year. Innovation
radicality is the total number of patents that each firm has in the top 1% most cited
patents in the industry in a given year (Ahuja & Lampert, 2001, refer to these patents as
breakthrough patents). To approximate the firms‘ strategic tendency to generate radical
innovation, I averaged this measure over the past three years. On average firms issued
0.43 patents per year in the top 1% most cited patents in the industry (min 0 – max 17).
Innovation generality
Innovation generality refers to the tendency of firms to discover innovations that
have broad impact on subsequent technologies in wide range of industries. I measured
innovation generality as the firm‘s number of patents in the top 1% most cited patents
across different technological domains in a given year. Similar to innovation radicality
measure, I first ranked all patents in the industry in a given year. This time, however, the
ranking was based on each patent‘s generality score. The generality score is computed
using Blau‘s (1977) heterogeneity index:
Generalityi = 1-∑pij2
where pij is the proportion of citations received by patent i in technological category j.5
―High generality score suggests that the patent presumably had a widespread impact, in
that it influenced subsequent innovations in a variety of fields‖ (Hall et al., 2001:21).
Innovation generality for each firm/year was computed as the number of patents
in the top 1% most ―general‖ patents in the industry in a given year. I averaged this
number over the past three years to approximate a firm‘s tendency to generate
innovations with a broad impact across wide range of industries. On average, firms issued
5 I used two patent classification systems: (1) USPTO classification system based on 428 technological
categories (j = 428) and (2) 36 higher-order technological categories (j = 36) developed by Hall et al.
(2001). The two measures were highly correlated and the results were similar for both measures. The
innovation generality item based on 36 technological categories was used in the factor analysis.

64
0.42 patents in the top 1% most cited patents across different technological categories
(min 0 – max 11).
Performance
I measured firms‘ financial performance using the two most frequently used
measures of firm and industry profitability: return on equity (ROE - net income divided
by total equity) and return on assets (ROA - net income divided by total assets)
(Schmalensee, 1989). To estimate the long-term impact of the network structure and
competitive strategy, I used averages of these measures over the next three years. This
approach reduces short-run fluctuations of firms‘ profitability and is more likely to
capture the full effect of previous entrepreneurial and collaborative activity that may have
both immediate and lagged effects. Both one-year and three-year averages of ROA and
ROE produce similar pattern of regression results. The regression results in all tables are
based on three-year average ROA.
Control Variables
Firm size was measured using the accounting value of firms‘ total assets as proxy.
Firms with larger stocks of assets may systematically differ from smaller firms in their
strategic behavior, their propensity to form alliances, and their performance.
Performance was approximated using return on assets. Past performance can
affect a firm‘s propensity to engage in innovative activity and undertake major
investment activities. Organizational learning theory suggests that firms adjust their
aspiration targets according to their present and past performance (Cyert & March, 1963;
Nelson & Winter, 1982). Therefore, future performance is also a function of the firm‘s
prior performance (e.g., a firm that is underperforming may try to reduce the operational
costs and thus increase its financial performance in the next years).
Financial slack was measured using the quick ratio. I computed the quick ratio as
a firm‘s current assets minus its current liabilities divided by its current liabilities. The
availability of slack resources can affect the decision to enter new alliances and to invest
in and introduce new products and services.

65
Betweenness centrality and Network Density were also included as control
variables because previous research has found that past networking behavior can affect
the future likelihood to form alliances (Gulati, 1999) by facilitating or constraining the set
of available partnering opportunities (Ahuja, 2000b).
Market Share. A firm‘s profitability can be affected by its monopolistic position
in the market. I approximated this measure by the firm‘s market share. I computed market
share as total sales divided by total industry sales in the firm‘s primary three-digit SIC
code.
Financial Leverage. I measured financial leverage as the firm‘s debt-to-equity
ratio (total long-term debt divided by total shareholder equity). This measure controls for
the firm‘s propensity to use debt to finance its major capital investments, which can
affect the firm‘s performance in the next period.
I also included firm and time fixed effects. Firm fixed effects controlled for all
firm-specific factors that were invariant over time, such as industry segment, corporate
level diversification, firms‘ reputation, firms‘ country of origin, top management team
(TMT) experience and skills or other unobserved and idiosyncratic characteristics of
firms. Time fixed effects controlled for time-related exogenous factors such as changes in
tax policy, technological changes, financial crises, or wars and other conflicts. In
addition, time fixed effects absorb the effect of variables with constant change such as
firm age and TMT tenure.
Construct Validity
To establish the convergent and discriminant validity of advantage-creating and
advantage-enhancing tendencies, I applied confirmatory factor analysis. I chose common
factor analysis over principal component analysis (PCA) for two reasons: (1) the
constructs above and the measures are theoretically driven, which renders confirmatory
factor analysis more appropriate than the exploratory nature of PCA, and (2) my focus is
predominantly on the common or shared variance (or underlying structure – latent
constructs) and thus the unique variance or the error variance (which are both considered
in PCA) is not of primary interest in deriving the underlying latent factors.

66
Table 5 shows the results of the factor analysis. Only the eigenvalues of the first
three factors are greater than 1. Figure 11 plots Eigen values against the number of
factors. This scree test criterion shows that the eigenvalues drop sharply after the third
factor. For more accurate interpretation of the factors, I performed factor rotation using
an oblique rotational procedure. Oblique rotation allows correlated factors in contrast to
orthogonal rotation, which assumes that factors are not correlated. The oblique procedure
is more appropriate for this study because value-creating tendencies and value-enhancing
tendencies are likely to be closely related, although firms may differ in their emphasis on
each tendency. I used the PROMAX rotation method available in STATA to perform the
oblique factor rotation.
Table 5: Eigenvalues
Factor Eigenvalue Difference Proportion
Factor1 4.88005 2.24999 0.5461
Factor2 2.63006 1.20314 0.2943
Factor3 1.42692 1.33179 0.1597
Factor4 0.09513 0.04459 0.0106
Factor5 0.05054 0.06106 0.0057
Figure 12: Scree Plot
01
23
45
Eige
nval
ues
0 2 4 6 8Number
Scree plot of eigenvalues after factor
Table 6 also shows the factor loadings for all items. The number of marketing
actions, product improvements, price reductions, and market expansions represent the
construct of advantage-enhancing tendency (AET). The number of patents, the radicality
of those patents, and the generality of those patents are all measures of innovativeness

67
(the first dimension of advantage-creating tendency – ACT). The factor analysis results
indicated that proactiveness is a distinctive dimension of advantage-creating tendency
(ACT). All factor loadings are statistically significant at the .001 level.
Table 6: Factor Loadings
Variable Factor1 Factor2 Factor3
Advertising (AET) 0.757 -0.0244 0.1367
Improvements/Versions (AET) 0.7699 -0.0334 0.2776
Pricing (AET) 0.8491 0.1409 -0.2098
Market expansions (AET) 0.7029 -0.0005 0.1044
Patent radicality (Innovativeness - ACT) 0.1678 0.5872 -0.0604
Patent intensity (Innovativeness - ACT) -0.0378 0.9856 0.0241
Patent generality (Innovativeness - ACT) -0.0363 0.9524 0.0688
Proactiveness (ACT) 0.2614 0.0445 0.5977
To provide additional support for convergent validity, I also computed variance
extracted. Variance extracted (VE) refers to the variance explained by the factor and is
computed as the average of the squared standardized factors loadings. VE for factor 1 is
.5935 and for factor 2 is .7395, which are both greater than the rule of .5. I also conducted
two tests for providing evidence for discriminant validity. A comparison of three-factor
solution, with two and one factor models, showed that the model fit of three factor
structure is significantly better than either the one- or two-factor model. Second, variance
extracted for both constructs is greater than the square of the correlation estimates
between the three constructs (.15, .09, and .38). This implies that each factor explains its
items better than it explains another construct.
Research Design
This study‘s research design is shown in Figure 12. The independent variables
and control variables are computed as average values over the past three years (t-1, t-2,
and t-3) and the dependent variables are measured over the next three years (t, t+1, and
t+2). To illustrate, I use network structure as the dependent variable, which is measured
on the basis of the alliance formed in the next three years. The measures of the
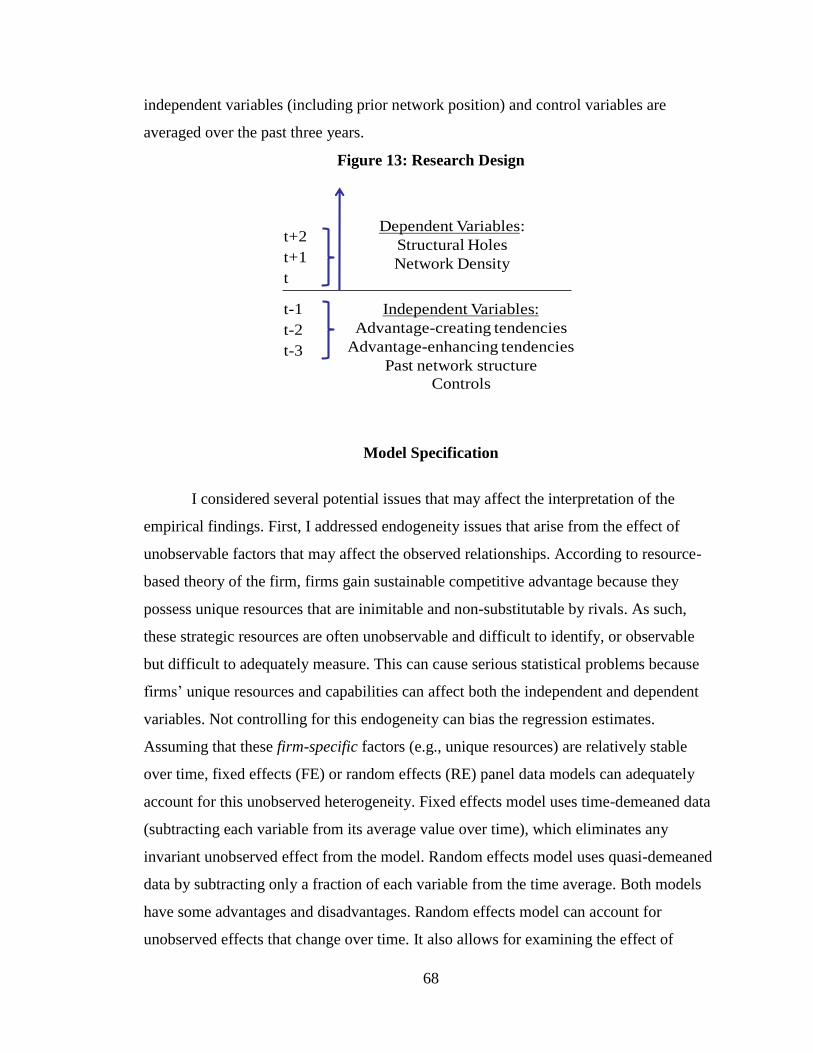
68
independent variables (including prior network position) and control variables are
averaged over the past three years.
Figure 13: Research Design
t-1
t-2
t-3
Independent Variables:
Advantage-creating tendencies
Advantage-enhancing tendencies
Past network structure
Controls
t
t+1
t+2Dependent Variables:
Structural Holes
Network Density
Model Specification
I considered several potential issues that may affect the interpretation of the
empirical findings. First, I addressed endogeneity issues that arise from the effect of
unobservable factors that may affect the observed relationships. According to resource-
based theory of the firm, firms gain sustainable competitive advantage because they
possess unique resources that are inimitable and non-substitutable by rivals. As such,
these strategic resources are often unobservable and difficult to identify, or observable
but difficult to adequately measure. This can cause serious statistical problems because
firms‘ unique resources and capabilities can affect both the independent and dependent
variables. Not controlling for this endogeneity can bias the regression estimates.
Assuming that these firm-specific factors (e.g., unique resources) are relatively stable
over time, fixed effects (FE) or random effects (RE) panel data models can adequately
account for this unobserved heterogeneity. Fixed effects model uses time-demeaned data
(subtracting each variable from its average value over time), which eliminates any
invariant unobserved effect from the model. Random effects model uses quasi-demeaned
data by subtracting only a fraction of each variable from the time average. Both models
have some advantages and disadvantages. Random effects model can account for
unobserved effects that change over time. It also allows for examining the effect of

69
invariant independent variables. In addition, a random effects model is preferable to a
fixed effects model because fixed effects lead to a large loss of degrees of freedom,
especially in large cross-sectional panels. Finally, random effects produce more efficient
estimates for samples with large N (number of firms) and small T (number of time
periods). However, the random effects model must satisfy one additional assumption: the
unobserved individual effects should be uncorrelated with the other independent variables
Cov(xitj, ai) = 0, where xitj denotes all independent variables and ai is the unobserved
effect. Violation of this assumption produces inconsistent estimates. I used Hausman‘s
(1978) specification test to detect violation of this assumption. When this assumption was
not violated I used random effects model (see below).
Furthermore, the relationship between a firm‘s strategy and network formation or
its strategy and performance can also be affected by time-specific factors, such as abrupt
changes in oil prices, government interventions, or economic downturn and recession.
One way to control for these time-related factors is to include dummy variables for each
time period. One last consideration in selecting an appropriate model and estimation
technique was the use of lagged dependent variables. Because both firm performance and
the firm‘s position in the network structure can be affected by the value of these variables
in the previous period, it is important to control for this possibility. Inclusion of lagged
values of the dependent variables was also important for providing more confidence for
the direction of causality. Given all these considerations, all models in this dissertation
account for both firm- and time-specific effects and include lagged dependent variables.
Finally, I computed variance inflation factors (VIFs) to test for any possible
multicollinearity problem. Multicollinearity can be especially present in the models that
use fixed effects and interaction terms. The VIFs for all variables in the analysis
(including the interaction terms) was lower than 3 (which is below the critical value of
10), ruling out any potentially major multicollinearity problems.
Modeling performance
I applied a random effects model with time fixed effects to test the hypotheses
predicting performance. One reason for selecting random effects over fixed effects model
was that the Hausman test was insignificant (Chi2 = 3.37; prob>Chi2 = .91). A rejection

70
of the Hausman test means that the assumption that the unobservable effects are not
correlated with the independent variables Cov(xitj, ai) = 0 is violated. Failure to reject the
Hausman test implies that the estimates of RE and FE models are very similar. Another
reason for selecting RE model is that the estimates of RE model are consistent and more
efficient than those estimated by FE model for panels with a large N and small T. Given
that the panel examined in this study has a large N (112 firms after listwise deletion) and
small T (5 years), the random effects model was preferable. In addition, because I also
control for the past values of the dependent variables (in this case firm‘s past
performance), the presence of a lagged dependent variable is a source of serial correlation
(i.e., the lagged dependent variable and the error term are correlated). Indeed,
Wooldridge‘s test for autocorrelation in panel data showed the presence of serial
correlation in all models. To correct for serial correlation, I used a random-effects model
with an autoregressive error term—AR(1). The random effects model can be formulated
as follows:
Yit = ái + äYit-1 + â'Xit-1 + åit
where subscripts i and t represent firms (i = 1 to 8) and years (t = 1 to 5) respectively. β'xit
is the coefficient (slope) of the independent variables that is assumed to be constant
across firms. εit represents the two-way error component disturbances (εit=µi+λt+νit),
where µi denotes the unobservable individual effect, λt denotes the time-specific effect
and νit represents the remaining stochastic disturbance term (Baltagi, 2008). It is assumed
that Xit is independent of µi, λt, and νit for all i and t, and that µi ~ IID (0 , λt~
IID(0 vit~ IID (0 are independent of each other. I also included an
autoregressive AR(1) parameter ρ with zero mean, homoskedastic and serially
uncorrelated: εit = ρεit-1 + zi,t and -1<ρ<1. The coefficients are estimated using generalized
least squares method (GLS).
Previous research suggests that firms adjust their competitive activity and
aspiration targets as a function of their previous performance (Ferrier, MacFhionnlaoich,
Smith, & Grimm, 2002; Cyert & March, 1963). In addition, including past values of
dependent variables provides more confidence about the causality of the relationships
between the IVs and DVs. Finally, in panel data with short T (time periods) and large N
(number of firms), the coefficient of the lagged dependent variable may be biased in both

71
FE and RE models with AR(1). This is because the presence of a lagged dependent
variable is correlated with the error term, which produces biased estimates (Baum, 2006).
Hence, to deal with this problem, Arellano and Bond (1991) recommended a two-step
approach: (1) following Anderson and Hsiao (1981), the model is first-differenced to
remove the firm-specific effects (which eliminates any endogeneity because of the
correlation between the unobserved firm-specific effects and the other independent
variables), and (2) a generalized method of moments (GMM) procedure is used to
produce consistent and efficient estimates of the parameters. In the first step, Arelano and
Bond‘s (1991) approach takes the first difference to remove the constant term and any
unobserved and invariant individual (firm) effect. Because this transformation does not
eliminate the correlation between the change in the lagged dependent variable and the
change in the error term, they proposed using the other lags (the second or third lags) as
instruments for the dependent variable. These lagged values Δyit-2 and Δyit-3 are
instruments that are correlated with Δyit-1 and uncorrelated with the error term (εt-1)
(Baum, 2006). The Arellano and Bond (1991) GMM estimator assumes that the original
disturbances are serially uncorrelated and that the differenced error is MA(1) with unit
root (Baltagi, 2008).This procedure was developed further by Blundell and Bond (1998),
who proposed the extended system of GMM estimator, which uses extra moment
conditions. This approach produces unbiased and consistent estimates and, in the GMM
context, the most efficient estimates. Hence, I also estimated the coefficients using this
system GMM technique.
Modeling network structure
For network structure variables (network density and betweenness centrality), the
Hausman test was statistically significant (Chi2 = 401; prob>Chi2 = .0000), rejecting the
assumption that the unobserved effects are uncorrelated with independent variables. I,
therefore, used the firm and time effects model (Greene, 2003), which can be formulated
as follows:
Yit = ái + äYit-1 + â'Xit-1 + åit
where subscripts i and t represent firms (i = 1 to 8) and years (t = 1 to 5) respectively. εit
represents two-way error component disturbances (εit=µi+λt+νit), where µi denotes the

72
unobservable individual effect, λt denotes the time-specific effect and νit represents the
remaining stochastic disturbance term (Baltagi, 2008). Here, µi and λt are assumed to be
fixed parameters to be estimated and the remaining disturbances are stochastic with vit~
IID (0 . Xit is assumed to be independent only from the νit for all i and t. Because I
also controlled for the firm‘s previous network position, the inclusion of a lagged
dependent variable can cause serial correlation. The Wooldridge test for autocorrelation
available within STATA (Wooldridge, 2002) did not provide support to reject the null
hypothesis (H0: no first-order autocorrelation) for all models. To correct for serial
correlation, I used fixed effects model with a first order autoregressive disturbance term -
AR (1), using Durbin–Watson estimator of rho (the autocorrelation coefficient).
I estimated Poisson regression coefficients for the network density variable
because of the distribution of that variable. Many of the firms in my sample (almost 40%)
had a zero score on network density. This is because there were many cases where a focal
firm‘s partners had not formed alliances with one another within a three-year period.
Hausman, Hall, and Grilliches (1984) suggested that panel data Poisson regression model
might be a more appropriate model when the dependent variable is a count variable
containing many zeros and non-negative integers. The Poisson panel regression can be
formulated as follows:
where yit = 0, 1, 2, …; i denoting firms, and t denoting time. Because the computed
network density measure also included some non-integer values, I rounded the decimals
to the closest integer. This transformation did not change the distribution of this variable
as the correlation coefficient between transformed variables and the original ones was
.99. As a robustness check on the regression results, I also report the estimated
coefficients and standard errors using a panel data Poisson regression model with firm
and time fixed effects. The coefficients of this model were estimated using a maximum
likelihood algorithm.

73
CHAPTER VI: RESULTS
Summary Statistics and Correlation Matrix
Table 7 below shows the summary statistics and correlations among all variables.
The correlation coefficients are bivariate and based on pooled data across all firms and
years. Larger firms have greater market share, use more debt to finance their capital
investments (financial leverage), have less slack resources, are more likely to be
embedded in a sparse network structure, form more ties (strong/equity or weak/non-
equity), and exhibit greater advantage-creating (proactivenes and innovativeness) and
advantage-enhancing strategic tendencies than smaller firms. Firms‘ performance (ROA)
is not related to firm size, but is positively related to their betweenness centrality, their
number of weak (non-equity) ties, their advantage-creating tendencies (specifically,
proactiveness), and their advantage-enhancing tendencies. Betweenness centrality is
negatively related to the proportion of strong ties in the firm‘s alliance portfolio (i.e., a
sparse network is associated with more weak/non-equity ties than strong/equity ties), and
positively related to firm size, market share, performance (ROA), and both advantage-
creating and advantage-enhancing tendencies. Network density, on the other hand, is
positively related to the proportion of strong ties in the firms‘ alliance portfolio (at 10%
level), but not related to advantage-creating and advantage-enhancing tendencies.

74
Table 7: Summary Statistics and Correlation Matrix
Mean SD 1 2 3 4 5 6 7 8 9 10 11 12 13
1 Firm size (total assets) 4682.44 11917.82 1
2 Market share 0.01 0.02 0.5174* 1
3 Financial Leverage 0.28 1.16 0.0914* 0.0974* 1
4 Financial Slack 2.10 1.85 -0.1350* -0.1825* -0.0748* 1
5 Performance 0.04 0.11 0.0707 0.0717* 0.0409 0.0317 1
6 Network Density 3.55 9.55 0.0245 -0.008 -0.0141 0.0517 0.0201 1
7 Betweenness Centrality 0.11 0.09 0.5000* 0.3143* 0.027 -0.0507 0.1221* -0.0429 1
8 Strong ties to total ties 0.52 0.12 -0.0674 -0.0271 -0.0067 -0.0523 -0.1865* 0.1189 -0.2231* 1
9 Strong ties 24.07 22.33 0.5797* 0.4082* -0.0132 -0.0392 0.1321 -0.2041* 0.7749* -0.1812* 1
10 Weak ties 25.84 26.95 0.3672* 0.2768* -0.0563 0.1208 0.1971* -0.2062* 0.7640* -0.3997* 0.8963* 1
11 Advantage-creating tendency - Proactiveness 0.00 0.81 0.4837* 0.2411* -0.0061 0.0194 0.0967* -0.0195 0.4415* -0.3079* 0.5955* 0.6667* 1
12 Advantage-creating tendency - Innovativeness 0.00 0.98 0.5185* 0.1940* 0.0448 -0.0982* 0.0753 0.0162 0.4108* -0.2390* 0.2156* 0.2093* 0.3464* 1
13 Advantage-enhancing tendency 0.00 0.95 0.3799* 0.2022* -0.0191 -0.0377 0.1219* 0.0616 0.5264* -0.2382* 0.6449* 0.7187* 0.5217* 0.3949* 1
* significant at 5% level
N=415 to 545

75
Competitive Strategy and Firm Performance
Table 8 shows the GLS estimates with AR (1), and Table 9 shows the system
GMM estimates. All models in Tables 8 and 9 account for time and firm-specific
unobserved heterogeneity. Model 1 presents the coefficients for all control variables. The
coefficients for past performance and market power are statistically significant. Firms
with greater performance and a possibly monopolistic position in the previous period
perform better in the next three years. The coefficients for year dummies are jointly
significant (Chi2 (4) = 12.32; Prob>Chi2 = .0151) indicating influential macroeconomic
factors affecting firms‘ performances.
Hypothesis 1
Hypothesis 1 predicts that high advantage-creating strategic tendencies (ACT)
will have a positive effect on firm performance. Model 2 in Table 8 shows the
coefficients of the two dimensions of ACT. Both proactiveness and innovativeness are
positively related to performance. The coefficient for proactiveness is positive and
statistically significant at the 5% level (b = .0199; p <.017) and the coefficient for
innovativeness is statistically significant at the 10% level (b = .0086; p <.082). Table 9
(Model 2) shows the GMM estimates for proactiveness and innovativeness. The GMM
estimates of the coefficients for proactiveness and innovativeness in Table 9 (Model 2)
are also positive and statistically significant at the 10% level (b = .0268; p <.074 and b =
.017; p <.064). Given that I use the more conservative two-tailed significance test (even
though the direction of the effects is predicted), these results suggest some support for
Hypothesis 1. Firms with higher advantage-creating strategic tendencies exhibit better
performance than do other firms.
Hypothesis 2
Hypothesis 2 states that advantage-enhancing strategic tendencies (AET) will be
positively related to firm performance. Model 3 in Table 8 shows the results for the
relationship between advantage-enhancing tendencies and firm performance. The

76
coefficient for AET is positive and statistically significant at the 1% level (b = .0334; p
<.003), which provides support for Hypothesis 2. The GMM estimates of the coefficient
of AET in Table 9 (Model 2), are also positive and statistically significant at the 5% level
(b = .053; p <.018). These findings provide support for Hypothesis 2. Firms with higher
advantage-enhancing strategic tendencies exhibit better financial performance than do
firms with lower level of advantage-enhancing strategic tendencies.
Post-hoc analysis
Model 4 in Tables 8 and 9 includes both AET and ACT (proactiveness and
innovativeness) simultaneously. The coefficients for AET and one dimension of ACT
(proactiveness) remain statistically significant at the 5 % level (b = .022; p <.038, and b =
.016; p <.043 respectively). The coefficient for innovativeness, however, becomes
insignificant (b = .0029; p <.678). These results suggest a potential mediating effect of
advantage-enhancing on the relationship between innovativeness and firm performance.
For example, firms that have had greater innovative abilities in the past period may have
a greater ability to intensively introduce advantage-enhancing actions going forward.
Therefore, I also tested whether innovativeness in the previous period affects
proactiveness and AET in the future period. Table 10 shows the results of this post-hoc
analysis. Model 1 shows that the coefficient of innovativeness is positive and significant
(b = .136; p <.04) in predicting future degree of proactiveness (controlling for past
innovativeness). In Model 2, the coefficient of innovativeness is also marginally
significant in predicting future advantage-enhancing tendency (b = .053; p <.09). These
results suggest that innovativeness has a positive effect on the future ability of the firms
to be proactive and to compete intensively using advantage-enhancing actions.
Controlling for the lagged dependent variable and using lagged values of the independent
variables suggests support for the causality of these relationships. To further investigate
the causal direction of these relationships, I tested whether there is a reciprocal
relationship (that is, whether proactivenses and AET in the previous period also affect
innovativeness in the future period). Model 3 shows that the effect of AET on
innovativeness is negative and nonsignificant (b = - .069; p <.32). Model 4 shows that the
effect of proactiveness on innovativeness is negative and nonsigificant (b = - .64; p <.19).

77
The coefficients remain nonsignificant when both are included in predicting future
innovativeness (Model 5). Hence, these results suggest that past innovativeness positively
affects the firm‘s future ability to proactively introduce new products and intensively
initiate advantage-enhancing actions such as new product versions, product
improvements, or market expansions.
Hypothesis 3
Hypothesis 3 predicts that firms that are high in both ACT and AET will exhibit
the best performance. The GLS estimates in Table 8 Model 5 do not provide support for
the interaction effect between ACT and AET. The coefficient of PROXAET is negative
and significant at 5% level (b = -.0104; p <.024), whereas INNXAET is not significant.
GMM estimates in Table 9 are also consistent with GLS estimates. The coefficient of
PRO x AET is negative and significant at 5% level (b = -.0155; p <.041). In addition, the
coefficient of INN x AET is negative and marginally significant at 10% level (b = -.0087;
p <.075). Thus, Hypothesis 3 is not supported. Figure 13 illustrates the form of the
interaction.
Figure 14: Interaction between ACT (Proactiveness) and AET
in Explaining Firm Performance
Although firms with high levels of proactiveness and high levels of advantage-
enhancing tendencies exhibit the best performance, this effect is not significantly higher

78
than firms with low levels of proactiveness and high levels of advantage-enhancing
tendencies. The chart in Figure 13 also shows that when firms exhibit low levels of both
proactiveness and advantage-enhancing tendencies, they are least profitable. In addition,
the positive relationship between advantage-enhancing tendencies and firm performance
is stronger for firms that exhibit low levels of proactiveness. Alternatively, the effect of
proactiveness on firm performance is stronger at low levels of advantage-enhancing
tendencies.

79
Table 8: ACT, AET and Performance
Random Effects Model – GLS estimator
DV: Performance (average ROA over the next three years)
Model 1 Model 2 Model 3 Model 4 Model 5
Performance (past ROA) 0.2385* 0.2314* 0.2289* 0.2251* 0.2186*
(0.095) (0.094) (0.094) (0.094) (0.094)
Firm size (total assets) -8.27e-07 -7.80e-07 -2.31e-07 -4.19e-07 -4.33e-07
(5.61e-07) (5.74e-07) (3.85e-07) (7.39e-07) (7.39e-07)
Market Power 0.8029+ 0.8398+ 0.7645+ 0.7919+ 0.7808+
(0.456) (0.459) (0.440) (0.448) (0.441)
Financial Leverage 0.006 0.0068 0.0069 0.0071 0.0073
(0.008) (0.008) (0.008) (0.008) (0.008)
Financial Slack 0.0132 0.012 0.0131 0.0125 0.0124
(0.010) (0.010) (0.010) (0.010) (0.010)
Year dummy 1996 -0.0474* -0.0540* -0.0494* -0.0523* -0.0533*
(0.024) (0.025) (0.024) (0.025) (0.025)
Year dummy 1997 -0.036 -0.0507+ -0.0429+ -0.0489+ -0.0518*
(0.025) (0.026) (0.025) (0.026) (0.026)
Year dummy 1998 -0.0808* -0.0959* -0.0928* -0.0978* -0.1016*
(0.035) (0.039) (0.037) (0.039) (0.040)
Year dummy 1999 -0.0805* -0.0955* -0.0921* -0.0974* -0.1040*
(0.035) (0.039) (0.037) (0.039) (0.042)
ACT - Proactivenes (PRO) 0.0199* 0.0157* 0.0207*
(0.008) (0.008) (0.009)
ACT - Innovativeness
(INN) 0.0086+ 0.0029 0.0013
(0.005) (0.007) (0.007)
AET 0.0334** 0.0221* 0.0666*
(0.011) (0.011) (0.028)
Interaction (PRO X AET) -0.0104*
(0.005)
Interaction (INN X AET) -0.0032
(0.003)
Constant -0.0063 0.0047 0.0055 0.0084 0.0201
(0.027) (0.025) (0.025) (0.025) (0.023)
R-squared 0.500 0.520 0.530 0.550 0.600
Observations 521 521 521 521 521
Number of i 113 113 113 113 113
Robust standard errors in parentheses
* significant at 5%; ** significant at 1%; + significant at 10%
ACT - advantage-creating strategy
AET - advantage-enhancing strategy

80
Table 9: ACT, AET and Performance
Dynamic Panel Data Model - System GMM Estimator
DV: Performance (average ROA over the next three years)
Model 1 Model 2 Model 3 Model 4 Model 5
Performance (past ROA) 0.0601 0.3463** 0.3437** 0.3448** 0.3422**
(0.049) (0.119) (0.121) (0.120) (0.119)
Firm size (total assets) -1.61e-06 -4.53e-06 -5.62e-08 -8.00e-07 -1.01e-06
(1.11e-06) (1.53e-07) (1.07e-06) (1.29e-06) (1.31e-06)
Market Power 1.0205 1.8357 1.6592 1.7427 1.6585
(0.804) (1.206) (1.102) (1.162) (1.081)
Financial Leverage 0.0032 0.0043 0.0044 0.0047 0.0055
(0.003) (0.004) (0.004) (0.004) (0.004)
Financial Slack 0.0074 0.0072 0.0079 0.0076 0.0073
(0.005) (0.007) (0.007) (0.007) (0.007)
Year dummy 1996 0.0304* 0.1417** 0.1403** 0.1441** 0.1520**
(0.012) (0.045) (0.041) (0.045) (0.048)
Year dummy 1997 0.0573** 0.1318** 0.1361** 0.1364** 0.1430**
(0.017) (0.041) (0.039) (0.041) (0.043)
Year dummy 1998 0.0273 0.0847** 0.0927** 0.0898** 0.0952**
(0.023) (0.014) (0.014) (0.015) (0.016)
Year dummy 1999 0.0148 0.0287** 0.0277** 0.0273* 0.0322**
(0.019) (0.011) (0.011) (0.011) (0.011)
ACT - Proactivenes (PRO) 0.0268+ 0.0123 0.0158
(0.015) (0.015) (0.015)
ACT - Innovativeness (INN) 0.0171+ 0.009 0.0083
(0.009) (0.009) (0.008)
AET 0.0533* 0.0439* 0.1131**
(0.023) (0.021) (0.042)
Interaction (PRO X AET) -0.0155*
(0.008)
Interaction (INN X AET) -0.0087+
(0.005)
Constant -0.0095* -0.0163* -0.0155* -0.0157* -0.0144*
(0.004) (0.007) (0.006) (0.007) (0.006)
Observations 535 535 535 535 535
Number of i 113 113 113 113 113
Robust standard errors in parentheses
* significant at 5%; ** significant at 1%; + significant at 10%
ACT - advantage-creating strategy
AET - advantage-enhancing strategy

81
Table 10: The Effect of Innovativeness on AET and Proactiveness
Dynamic Panel Data Model - System GMM Estimator
ACT-Proactiveness1 AET ACT-Innovativeness ACT-Innovativeness ACT-Innovativeness
Model 1 Model 2 Model 3 Model 4 Model 5
Firm size
(total assets) -1.09e-05** 6.56e-05 -1.12e-05 -1.88e-05 -1.20e-05
(4.14e-06) (6.72-e06) (7.44-e06) (1.41e-05) (9.20-e06)
Market Power 1.7967 1.5982 1.556 1.8973 1.5095
(1.199) (1.782) (1.149) (1.551) (1.247)
Financial Leverage -0.0133 -0.0221 0.0058* -0.0026 -0.0029
(0.015) (0.058) (0.003) (0.005) (0.005)
Financial Slack 0.0043 0.0059 0.0048 0.0101 0.0082+
(0.007) (0.006) (0.004) (0.006) (0.005)
Year dummy 1997 0.6764** 0.0653 0.1396** -0.0429+ -0.0441+
(0.108) (0.101) (0.043) (0.023) (0.023)
Year dummy 1998 0.4417** 0.0714 0.0279 -0.1300** -0.1369**
(0.075) (0.067) (0.017) (0.042) (0.043)
Year dummy 1999 0.4578** -0.0975* 0.0879 -0.1252** -0.1370**
(0.077) (0.040) (0.077) (0.043) (0.042)
AET 0.7592** -0.0689 -0.1004
(0.075) (0.069) (0.088)
ACT -Proactiveness 0.9216** -0.064 -0.0268
(0.047) (0.049) (0.057)
ACT -Innovativeness 0.1359* 0.1290+ 0.9450** 1.1985** 1.0975**
(0.066) (0.078) (0.134) (0.213) (0.127)
Constant -0.2761** 0.0297 -0.1172** 0.0774+ 0.0498
(0.052) (0.051) (0.039) (0.044) (0.034)
Observations 552 552 552 552 552
Number of i 112 112 112 112 112
Robust standard errors in parentheses
* significant at 5%; ** significant at 1%; + significant at 10%
AET - advantage-enhancing strategy
1 - DV's are based on the next three years (t, t+1 and t+2), whereas IV's on the past three years (t-3, t-2, and t-1)

82
Competitive Strategy and Alliance Network Formation
Hypothesis 4
Hypothesis 4 proposes that advantage-creating tendencies will be positively
associated with betweenness centrality. The regression results for this hypothesis are
shown in Table 11. Models 1, 2, and 3 show the result for betweenness centrality, while
Models 4 through 7 show the results for network density. Model 2 in Table 11 shows that
the coefficient for proactiveness is positive but not significant (b = .003; p <.69), whereas
the coefficient for innovativeness is positive and significant at the 5% level (b = .013; p
<.037). Thus, Hypothesis 4 is supported only for one dimension of ACT – innovativeness
(i.e., the tendency of firms to pursue technological leadership). Additional support for this
hypothesis provides the negative and statistically significant coefficients for
proactiveness in Model 7 (b = -.361; p <.0001) in predicting network density. Thus, the
overall pattern of these results provides support for Hypothesis 4. Firms with a greater
emphasis on advantage-creating tendencies are more likely to be embedded in a network
with many structural holes and are less likely to be locked in a dense network compared
with firms that are low on advantage-creating tendencies.
Hypothesis 5
Hypothesis 5 predicts that firms with a high level of advantage-creating
tendencies will form more non-equity alliances. The results for this hypothesis are shown
in Table 12. The dependent variable is expressed as a proportion of strong ties to the total
number of ties. As predicted, the coefficients for proactiveness (b = -.033; p <.008) and
innovativeness (b = -.022; p <.047) are negative and statistically significant, providing
support for Hypothesis 5. Thus, firms with high advantage-creating tendencies are more
likely to form weak ties (i.e., non-equity alliances) than strong ties (i.e., equity alliances).

83
Hypothesis 6
Hypothesis 6 states that firms with a high level of advantage-enhancing strategic
tendencies will become embedded in a dense network of alliances in the future period.
The coefficients for advantage-enhancing tendencies (ACT) in Models 5 and 7 (Table 11)
are positive and significant (b = 1.382; p <.007 and b = .368; p <.001, respectively) in
predicting future network density. In addition, Model 2 in Table 11 shows that the
coefficient of AET is negative and significant (b = -.027; p <.001) in predicting
betweenness centrality. These results provide support for Hypothesis 6. Firms with a high
level of advantage-enhancing tendencies are more likely to form dense network structures
and less likely to span many structural holes.
Hypothesis 7
Hypothesis 7 states that firms with high advantage-enhancing tendencies will
form more equity alliances in the future period. The coefficient for AET in Table 12‘s
Model 2 is positive (as predicted) but nonsignificant (b = .0003; p <.997). Thus,
Hypothesis 7 is not supported. This was surprising because a dense network is likely to
provide incentives for firms to establish more stable ties and further enhance the
exchange of fine-grained information and know-how. To further examine this
proposition, I conducted additional (post hoc) analyses. Instead of the ratio of strong ties
to total ties, I estimated two additional models where the dependent variables were the
―number of strong ties‖ and the ―number of weak ties.‖ This approach would estimate the
effect of ACT and AET on the propensity of firms to form strong or weak ties. Model 5
in Table 12 shows that the coefficient of AET is positive and statistically significant in
predicting the number of strong ties formed over the subsequent in the next three years (b
= 3.96; p <.009). At the same time, the coefficients of ACT dimensions (proactiveness
and innovativeness) are negative (as predicted), though not statistically significant.
However, the coefficient of AET in Model 6 in Table 12 is, contrary to the prediction,
positive and not significant in predicting weak ties. Thus, these results provide somewhat
mixed results for Hypothesis 7.

84
The overall pattern of these results suggest that firms with high advantage-
creating strategic tendencies are more likely to be embedded in sparse network structures
with a greater proportion of weak/non-equity alliances, whereas firms with high levels of
advantage-enhancing strategic tendencies are more likely to be embedded in dense
networks with a large proportion of strong/equity ties.
Hypotheses 8a and 8b
Hypotheses 8a and 8b tested the effect of strategically entrepreneurial firms on
network formation. These hypotheses predict a negative interaction between AET and
ACT in predicting the type of network structure (betweenness centrality and network
density). The results of the tests of these moderating hypotheses are shown in Table 11.
The interaction between proactiveness and advantage-enhancing tendency in predicting
betweenness centrality in Model 3 is negative and statistically significant (b = -.005; p
<.002), providing some support for Hypothesis 8a. The same interaction effects in
Models 6 and 8, when network density is dependent variable, are positive and statistically
significant (b = .402; p <.057, and b = .105; p <.001), providing support for Hypothesis
8b. I did not find support for the interaction effect between innovativeness and
advantage-enhancing tendencies in predicting either betweenness centrality or network
density. The coefficient for the interaction between innovativeness and AET is negative
and nonsignificant (b = -.0001; p <.885) in Model 3 and positive and nonsignificant in
Models 6 and 7 (b = .067; p <.743, and b = .011; p <.724).
Taken together, these findings provide some support for moderating effects.
Figure 14 below displays the form of the moderating effect of AET on the relationship
between proactiveness and betweenness centrality. Betweenness centrality is highest
when a firm is pursuing highly proactive advantage-creating tendencies and very low
advantage-enhancing tendencies. However, as the firm is increasing its level of AET,
betweenness centrality also decreases. Advantage-enhancing tendencies stimulate greater
collaboration among a firm‘s partners, which leads to the closure of the firm‘s structural
holes. Therefore, the rate of decrease in the betweenness score is higher for firms with a
high level of proactiveness than for firms with a low level of proactiveness. There is no
effect of AET on betweenness centrality at low levels of proactiveness.

85
Figure 15: Interaction between ACT (proactiveness) and AET in Explaining Future
Betweenness Centrality
The results for the interaction effects between ACT and AET in predicting
network density depicted in Figure 15 below show a similar pattern. Initially, firms with
low levels of proactiveness are embedded in a highly dense network. However, as
proactiveness increases, network density rapidly decreases to moderate-to-low levels.
The negative slope is steeper for firms that have low levels of advantage-enhancing
tendencies. For firms with high levels of AET, the increase in proactiveness decreases the
density of the alliance network, but at a slower rate than that of the firms with low levels
of AET.

86
Figure 16: Interaction between ACT (proactiveness) and AET in Explaining Future
Network Density
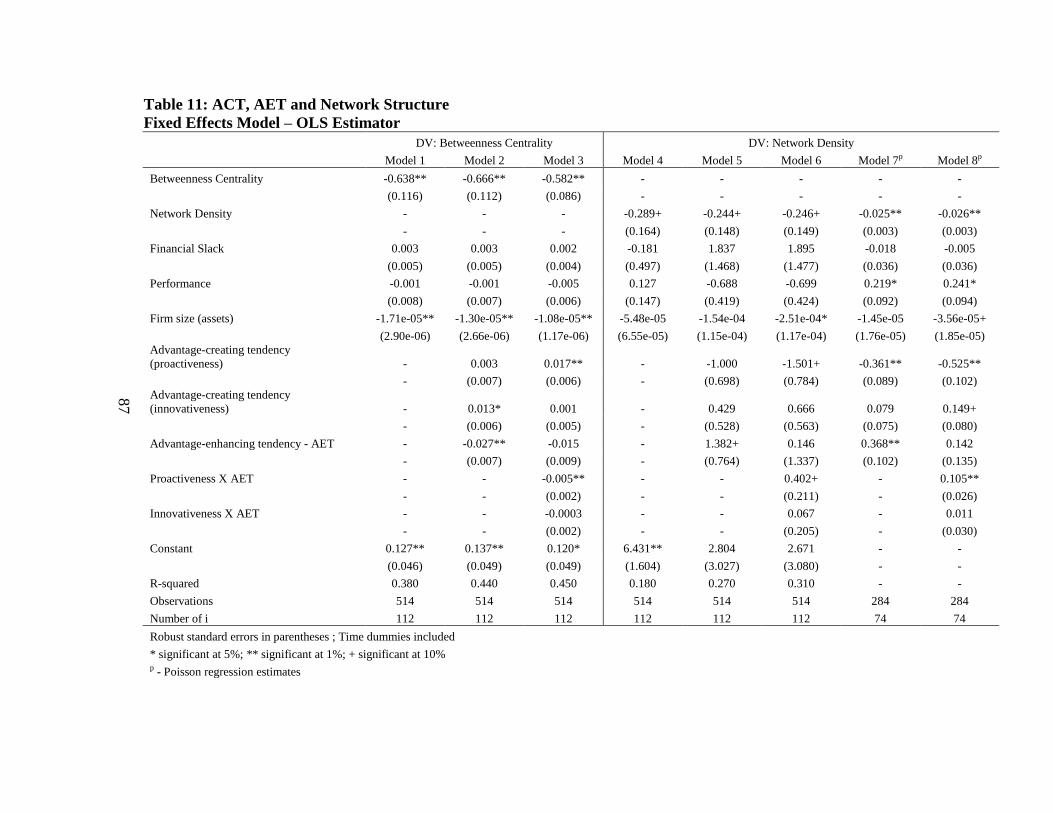
87
Table 11: ACT, AET and Network Structure
Fixed Effects Model – OLS Estimator
DV: Betweenness Centrality DV: Network Density
Model 1 Model 2 Model 3 Model 4 Model 5 Model 6 Model 7p Model 8p
Betweenness Centrality -0.638** -0.666** -0.582** - - - - -
(0.116) (0.112) (0.086) - - - - -
Network Density - - - -0.289+ -0.244+ -0.246+ -0.025** -0.026**
- - - (0.164) (0.148) (0.149) (0.003) (0.003)
Financial Slack 0.003 0.003 0.002 -0.181 1.837 1.895 -0.018 -0.005
(0.005) (0.005) (0.004) (0.497) (1.468) (1.477) (0.036) (0.036)
Performance -0.001 -0.001 -0.005 0.127 -0.688 -0.699 0.219* 0.241*
(0.008) (0.007) (0.006) (0.147) (0.419) (0.424) (0.092) (0.094)
Firm size (assets) -1.71e-05** -1.30e-05** -1.08e-05** -5.48e-05 -1.54e-04 -2.51e-04* -1.45e-05 -3.56e-05+
(2.90e-06) (2.66e-06) (1.17e-06) (6.55e-05) (1.15e-04) (1.17e-04) (1.76e-05) (1.85e-05)
Advantage-creating tendency
(proactiveness) - 0.003 0.017** - -1.000 -1.501+ -0.361** -0.525**
- (0.007) (0.006) - (0.698) (0.784) (0.089) (0.102)
Advantage-creating tendency
(innovativeness) - 0.013* 0.001 - 0.429 0.666 0.079 0.149+
- (0.006) (0.005) - (0.528) (0.563) (0.075) (0.080)
Advantage-enhancing tendency - AET - -0.027** -0.015 - 1.382+ 0.146 0.368** 0.142
- (0.007) (0.009) - (0.764) (1.337) (0.102) (0.135)
Proactiveness X AET - - -0.005** - - 0.402+ - 0.105**
- - (0.002) - - (0.211) - (0.026)
Innovativeness X AET - - -0.0003 - - 0.067 - 0.011
- - (0.002) - - (0.205) - (0.030)
Constant 0.127** 0.137** 0.120* 6.431** 2.804 2.671 - -
(0.046) (0.049) (0.049) (1.604) (3.027) (3.080) - -
R-squared 0.380 0.440 0.450 0.180 0.270 0.310 - -
Observations 514 514 514 514 514 514 284 284
Number of i 112 112 112 112 112 112 74 74
Robust standard errors in parentheses ; Time dummies included
* significant at 5%; ** significant at 1%; + significant at 10% p - Poisson regression estimates
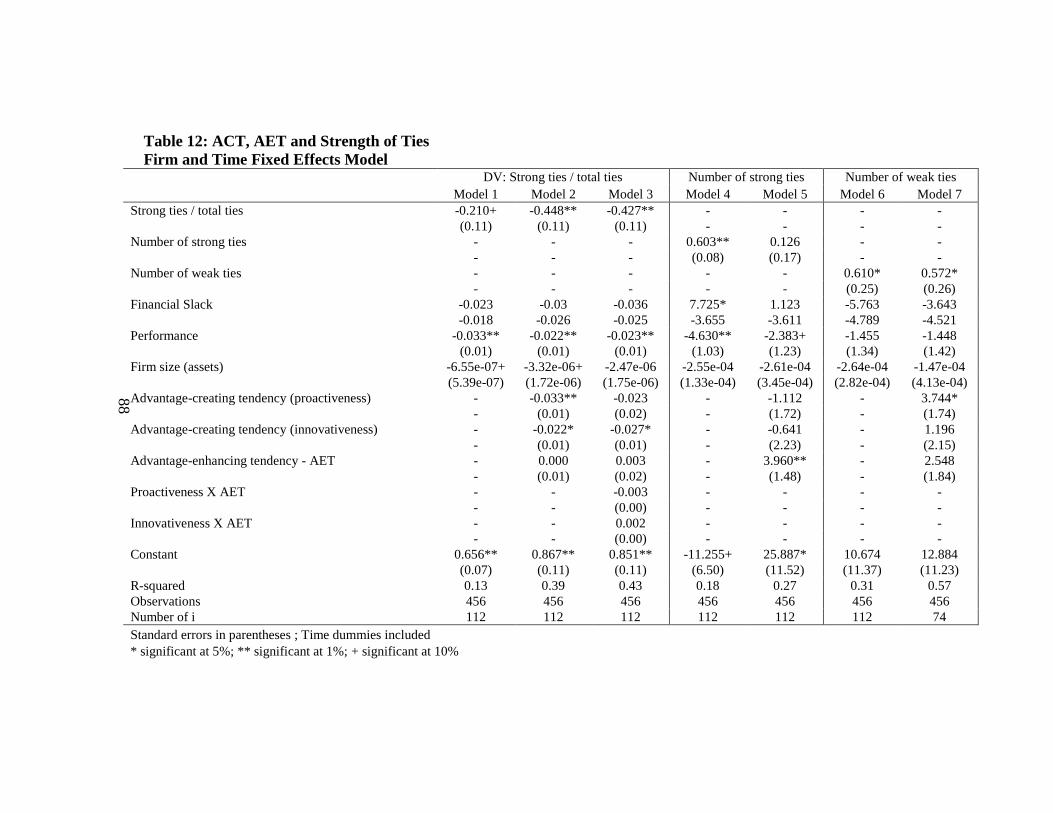
88
Table 12: ACT, AET and Strength of Ties
Firm and Time Fixed Effects Model DV: Strong ties / total ties Number of strong ties Number of weak ties
Model 1 Model 2 Model 3 Model 4 Model 5 Model 6 Model 7
Strong ties / total ties -0.210+ -0.448** -0.427** - - - -
(0.11) (0.11) (0.11) - - - -
Number of strong ties - - - 0.603** 0.126 - -
- - - (0.08) (0.17) - -
Number of weak ties - - - - - 0.610* 0.572*
- - - - - (0.25) (0.26)
Financial Slack -0.023 -0.03 -0.036 7.725* 1.123 -5.763 -3.643
-0.018 -0.026 -0.025 -3.655 -3.611 -4.789 -4.521
Performance -0.033** -0.022** -0.023** -4.630** -2.383+ -1.455 -1.448
(0.01) (0.01) (0.01) (1.03) (1.23) (1.34) (1.42)
Firm size (assets) -6.55e-07+ -3.32e-06+ -2.47e-06 -2.55e-04 -2.61e-04 -2.64e-04 -1.47e-04
(5.39e-07) (1.72e-06) (1.75e-06) (1.33e-04) (3.45e-04) (2.82e-04) (4.13e-04)
Advantage-creating tendency (proactiveness) - -0.033** -0.023 - -1.112 - 3.744*
- (0.01) (0.02) - (1.72) - (1.74)
Advantage-creating tendency (innovativeness) - -0.022* -0.027* - -0.641 - 1.196
- (0.01) (0.01) - (2.23) - (2.15)
Advantage-enhancing tendency - AET - 0.000 0.003 - 3.960** - 2.548
- (0.01) (0.02) - (1.48) - (1.84)
Proactiveness X AET - - -0.003 - - - -
- - (0.00) - - - -
Innovativeness X AET - - 0.002 - - - -
- - (0.00) - - - -
Constant 0.656** 0.867** 0.851** -11.255+ 25.887* 10.674 12.884
(0.07) (0.11) (0.11) (6.50) (11.52) (11.37) (11.23)
R-squared 0.13 0.39 0.43 0.18 0.27 0.31 0.57
Observations 456 456 456 456 456 456 456
Number of i 112 112 112 112 112 112 74
Standard errors in parentheses ; Time dummies included
* significant at 5%; ** significant at 1%; + significant at 10%

89
Competitive Strategy, Alliance Network Structure and Firm Performance
Hypothesis 9
Hypothesis 9 predicts that the positive effect of advantage-creating strategic
tendencies on firm performance will be stronger when the firm is embedded in a sparse
network structure. Table 13 shows the GLS estimators and Table 14 shows system GMM
estimators. Model 1 in Table 13 regresses firm performance on all control variables and
the two dimensions of advantage-creating strategic tendencies: proactiveness and
innovativeness. Model 2 adds betweenness centrality. The coefficient for betweenness
centrality is positive and statistically significant (b = .129; p <.015). Model 3 introduces
the two interaction terms. Only the coefficient for the interaction between proactiveness
and betweenness centrality is negative and significant (b =. -047; p <. 009). The GMM
estimates in Table 14 exhibit a similar pattern. The coefficient for betweenness centrality
is significant at the 10% level (p <.059); the interaction between proactiveness and
betweenness centrality is negative and significant (b = - .067; p <. 029). The interaction
between innovativeness and betweenness centrality is not significant (b = -.064; p <.127).
Thus, Hypothesis 9 is supported only for proactiveness. Figure 16 below illustrates this
moderating effect. Highly proactive firms embedded in a network with many structural
holes exhibit the highest level of performance. The chart below also shows that firms that
span structural holes across distant clusters exhibit better performance than highly
proactive firms that do not span structural holes. However, this chart also suggests that
firms with low advantage-creating capabilities (proactiveness) benefit more from sparse
network structures than do firms with high advantage-creating capabilities. These
findings confirm the complementary role of sparse network structure and further suggest
that firms that lack advantage-creating capabilities benefit more from sparse network
structure.

90
Figure 17: Moderating role of Betweenness Centrality on the Relationship Between
ACT (proactivenes) and Performance
Hypothesis 10
Hypothesis 10 proposes that firms with high advantage-creating capabilities can
use network density as a substitute for advantage-enhancing capabilities. More
specifically, it predicts that network density will strengthen the positive effect of
advantage-creating strategic tendencies (being highly proactive and innovative) on firm
performance. Models 4 and 5 in Tables 13 and 14 show the results for Hypothesis 10.
The main effect for network density in Model 4 is not significant (b = -.0007; p <.26).
Model 5 shows that the coefficient for the interaction term between innovativeness and
network density is positive and significant (b = .0017; p <.004), whereas the interaction
between proactiveness and network density is not significant (b = .0005; p <.32). GMM
estimates in Table 14 show a similar pattern. The interaction between innovativeness and
density is marginally significant at the 10% level (b = .0014; p <. 054), whereas the
interaction between proactiveness and density is not significant. Thus, Hypothesis 10 is
supported only for innovativeness. Figure 17 below shows the form of the interaction
between innovativeness and network density in explaining firm performance. Firms with
strong innovative capabilities (advantage-creating strategic tendencies) that are embedded
in highly dense networks exhibit better performance than other firms. The positive effect

91
of innovativeness on firm performance becomes stronger as the firm becomes more
densely embedded in the alliance network. Note also that at low levels of network
density, innovativeness has no effect on firm performance. Thus, firms with high
advantage-creating tendencies can increase their performance when they use dense
network structures to substitute for advantage-enhancing tendencies.
Figure 18: Moderating role of Network Density on the Relationship between ACT
(Innovativeness) and Performance
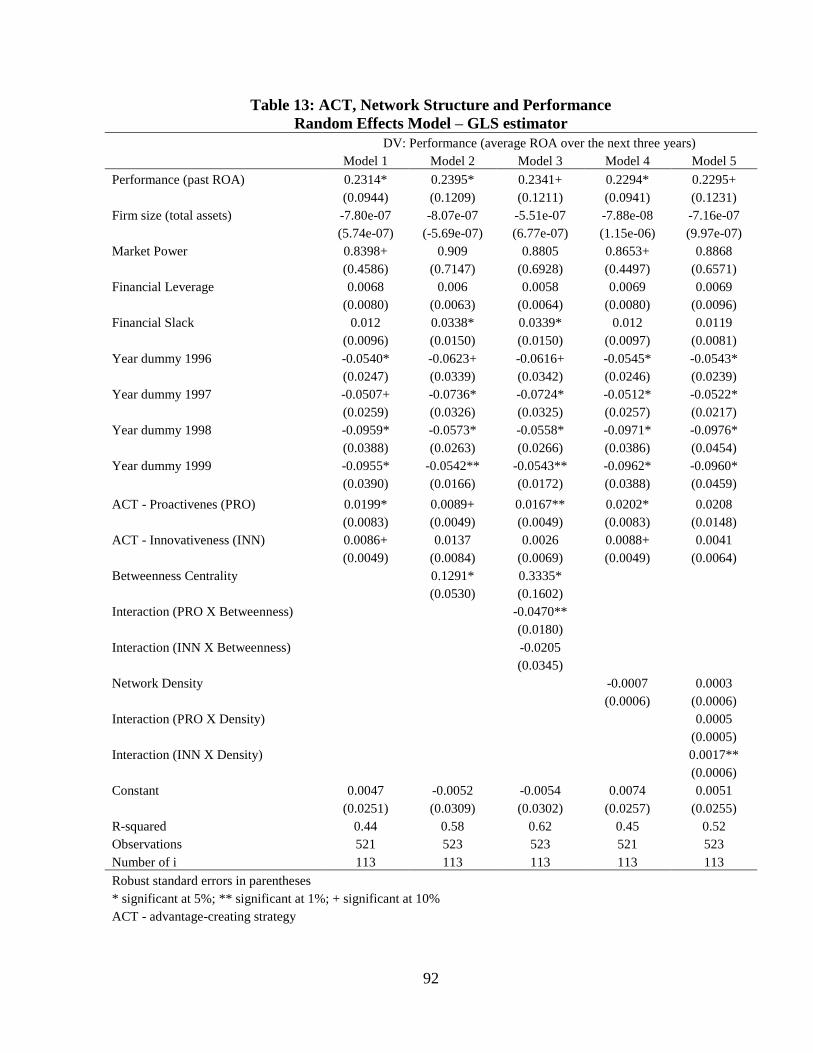
92
Table 13: ACT, Network Structure and Performance
Random Effects Model – GLS estimator
DV: Performance (average ROA over the next three years)
Model 1 Model 2 Model 3 Model 4 Model 5
Performance (past ROA) 0.2314* 0.2395* 0.2341+ 0.2294* 0.2295+
(0.0944) (0.1209) (0.1211) (0.0941) (0.1231)
Firm size (total assets) -7.80e-07 -8.07e-07 -5.51e-07 -7.88e-08 -7.16e-07
(5.74e-07) (-5.69e-07) (6.77e-07) (1.15e-06) (9.97e-07)
Market Power 0.8398+ 0.909 0.8805 0.8653+ 0.8868
(0.4586) (0.7147) (0.6928) (0.4497) (0.6571)
Financial Leverage 0.0068 0.006 0.0058 0.0069 0.0069
(0.0080) (0.0063) (0.0064) (0.0080) (0.0096)
Financial Slack 0.012 0.0338* 0.0339* 0.012 0.0119
(0.0096) (0.0150) (0.0150) (0.0097) (0.0081)
Year dummy 1996 -0.0540* -0.0623+ -0.0616+ -0.0545* -0.0543*
(0.0247) (0.0339) (0.0342) (0.0246) (0.0239)
Year dummy 1997 -0.0507+ -0.0736* -0.0724* -0.0512* -0.0522*
(0.0259) (0.0326) (0.0325) (0.0257) (0.0217)
Year dummy 1998 -0.0959* -0.0573* -0.0558* -0.0971* -0.0976*
(0.0388) (0.0263) (0.0266) (0.0386) (0.0454)
Year dummy 1999 -0.0955* -0.0542** -0.0543** -0.0962* -0.0960*
(0.0390) (0.0166) (0.0172) (0.0388) (0.0459)
ACT - Proactivenes (PRO) 0.0199* 0.0089+ 0.0167** 0.0202* 0.0208
(0.0083) (0.0049) (0.0049) (0.0083) (0.0148)
ACT - Innovativeness (INN) 0.0086+ 0.0137 0.0026 0.0088+ 0.0041
(0.0049) (0.0084) (0.0069) (0.0049) (0.0064)
Betweenness Centrality 0.1291* 0.3335*
(0.0530) (0.1602)
Interaction (PRO X Betweenness) -0.0470**
(0.0180)
Interaction (INN X Betweenness) -0.0205
(0.0345)
Network Density -0.0007 0.0003
(0.0006) (0.0006)
Interaction (PRO X Density) 0.0005
(0.0005)
Interaction (INN X Density) 0.0017**
(0.0006)
Constant 0.0047 -0.0052 -0.0054 0.0074 0.0051
(0.0251) (0.0309) (0.0302) (0.0257) (0.0255)
R-squared 0.44 0.58 0.62 0.45 0.52
Observations 521 523 523 521 523
Number of i 113 113 113 113 113
Robust standard errors in parentheses
* significant at 5%; ** significant at 1%; + significant at 10%
ACT - advantage-creating strategy
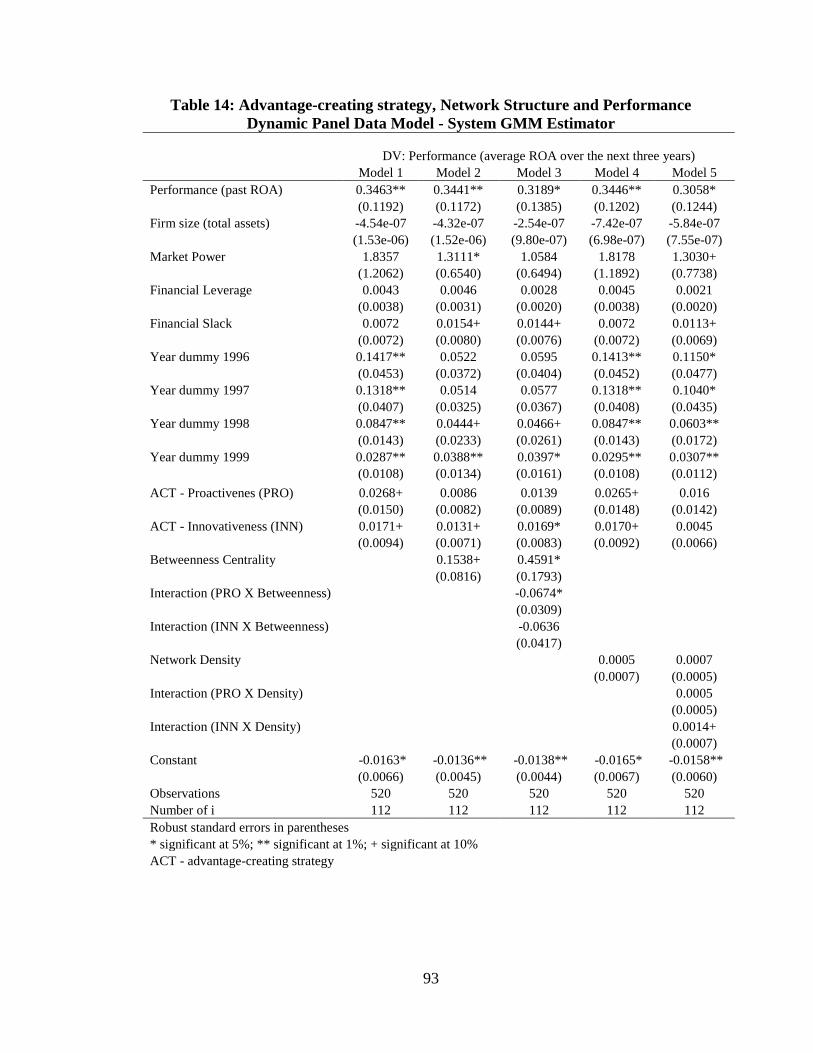
93
Table 14: Advantage-creating strategy, Network Structure and Performance
Dynamic Panel Data Model - System GMM Estimator
DV: Performance (average ROA over the next three years)
Model 1 Model 2 Model 3 Model 4 Model 5
Performance (past ROA) 0.3463** 0.3441** 0.3189* 0.3446** 0.3058*
(0.1192) (0.1172) (0.1385) (0.1202) (0.1244)
Firm size (total assets) -4.54e-07 -4.32e-07 -2.54e-07 -7.42e-07 -5.84e-07
(1.53e-06) (1.52e-06) (9.80e-07) (6.98e-07) (7.55e-07)
Market Power 1.8357 1.3111* 1.0584 1.8178 1.3030+
(1.2062) (0.6540) (0.6494) (1.1892) (0.7738)
Financial Leverage 0.0043 0.0046 0.0028 0.0045 0.0021
(0.0038) (0.0031) (0.0020) (0.0038) (0.0020)
Financial Slack 0.0072 0.0154+ 0.0144+ 0.0072 0.0113+
(0.0072) (0.0080) (0.0076) (0.0072) (0.0069)
Year dummy 1996 0.1417** 0.0522 0.0595 0.1413** 0.1150*
(0.0453) (0.0372) (0.0404) (0.0452) (0.0477)
Year dummy 1997 0.1318** 0.0514 0.0577 0.1318** 0.1040*
(0.0407) (0.0325) (0.0367) (0.0408) (0.0435)
Year dummy 1998 0.0847** 0.0444+ 0.0466+ 0.0847** 0.0603**
(0.0143) (0.0233) (0.0261) (0.0143) (0.0172)
Year dummy 1999 0.0287** 0.0388** 0.0397* 0.0295** 0.0307**
(0.0108) (0.0134) (0.0161) (0.0108) (0.0112)
ACT - Proactivenes (PRO) 0.0268+ 0.0086 0.0139 0.0265+ 0.016
(0.0150) (0.0082) (0.0089) (0.0148) (0.0142)
ACT - Innovativeness (INN) 0.0171+ 0.0131+ 0.0169* 0.0170+ 0.0045
(0.0094) (0.0071) (0.0083) (0.0092) (0.0066)
Betweenness Centrality 0.1538+ 0.4591*
(0.0816) (0.1793)
Interaction (PRO X Betweenness) -0.0674*
(0.0309)
Interaction (INN X Betweenness) -0.0636
(0.0417)
Network Density 0.0005 0.0007
(0.0007) (0.0005)
Interaction (PRO X Density) 0.0005
(0.0005)
Interaction (INN X Density) 0.0014+
(0.0007)
Constant -0.0163* -0.0136** -0.0138** -0.0165* -0.0158**
(0.0066) (0.0045) (0.0044) (0.0067) (0.0060)
Observations 520 520 520 520 520
Number of i 112 112 112 112 112
Robust standard errors in parentheses
* significant at 5%; ** significant at 1%; + significant at 10%
ACT - advantage-creating strategy

94
Hypothesis 11
Hypothesis 11 proposes that being embedded in a dense network structure will
strengthen the positive effect of advantage-enhancing strategic tendencies on firm
performance (and thus network will play a complementary role). Model 5 in Table 15
shows that the coefficient for AET and network density is positive and statistically
significant (b = .0033; p >.01). The GMM estimates are also consistent (b = .0028; p
<.01). Figure 19 shows the form of this interaction. The positive effect of advantage-
enhancing strategic tendencies on firm performance is stronger when a firm is embedded
in a dense network structure. Firms with high levels of advantage-enhancing strategic
tendencies that are highly embedded in a dense network exhibit the best performance.
Thus, Hypothesis 12 is supported. Firms with high levels of advantage-enhancing
tendency can extract greater value from dense network structures than firms with low
levels of advantage-enhancing tendencies. In addition, no effect is seen for advantage-
enhancing tendencies when firms are not embedded in a dense network structure.
Figure 19: Moderating Role of Network Density on the Relationship Between AET
and Performance
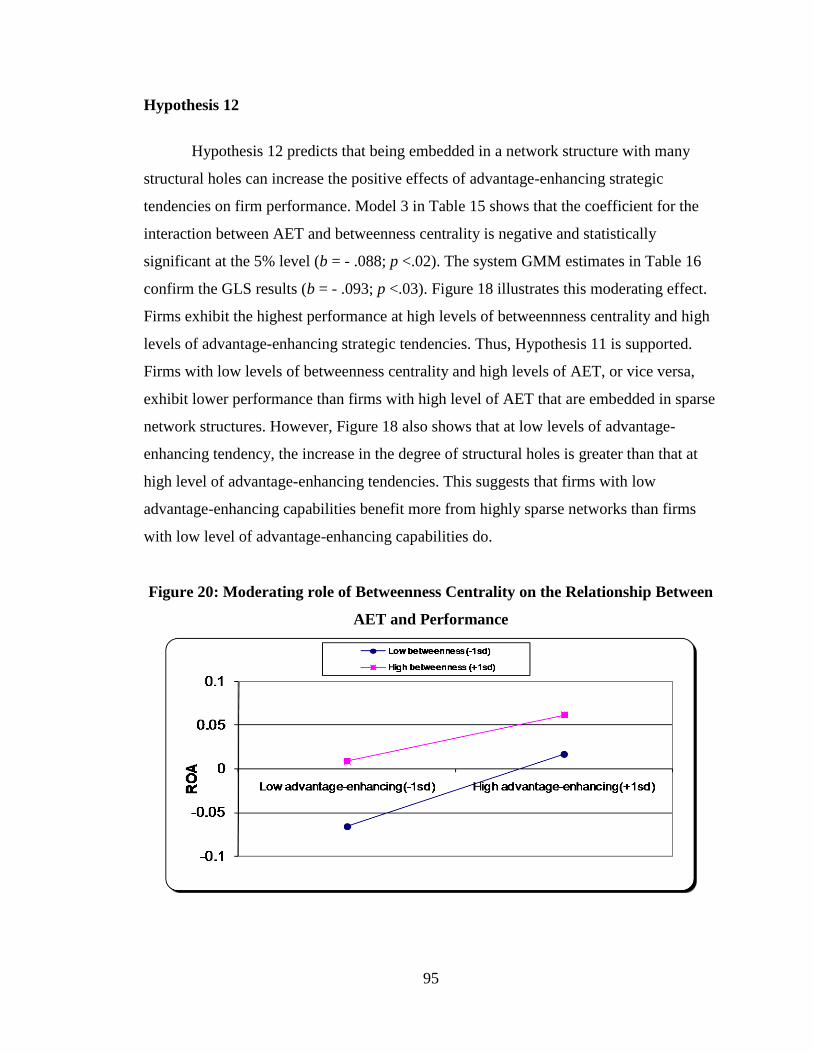
95
Hypothesis 12
Hypothesis 12 predicts that being embedded in a network structure with many
structural holes can increase the positive effects of advantage-enhancing strategic
tendencies on firm performance. Model 3 in Table 15 shows that the coefficient for the
interaction between AET and betweenness centrality is negative and statistically
significant at the 5% level (b = - .088; p <.02). The system GMM estimates in Table 16
confirm the GLS results (b = - .093; p <.03). Figure 18 illustrates this moderating effect.
Firms exhibit the highest performance at high levels of betweennness centrality and high
levels of advantage-enhancing strategic tendencies. Thus, Hypothesis 11 is supported.
Firms with low levels of betweenness centrality and high levels of AET, or vice versa,
exhibit lower performance than firms with high level of AET that are embedded in sparse
network structures. However, Figure 18 also shows that at low levels of advantage-
enhancing tendency, the increase in the degree of structural holes is greater than that at
high level of advantage-enhancing tendencies. This suggests that firms with low
advantage-enhancing capabilities benefit more from highly sparse networks than firms
with low level of advantage-enhancing capabilities do.
Figure 20: Moderating role of Betweenness Centrality on the Relationship Between
AET and Performance

96
Table 15: Advantage-enhancing strategy, Network Structure and Performance
Random Effects Model – GLS Estimator
DV: Performance (average ROA over the next three years)
Model 1 Model 2 Model 3 Model 4 Model 5
Performance (past ROA) 0.2289* 0.2395* 0.2350* 0.2269* 0.2245*
(0.0943) (0.0971) (0.0968) (0.0939) (0.0933)
Firm size (total assets) -2.31e-07 -3.68e-07 -5.30e-07 -3.68e-07 -5.30e-07
(3.85e-07) (5.29e-07) (7.83e-07) (5.29e-07) (7.83e-07)
Market Power 0.7645+ 0.8561+ 0.8547+ 0.7865+ 0.7891+
(0.4401) (0.4764) (0.4771) (0.4311) (0.4267)
Financial Leverage 0.0069 0.006 0.0062 0.007 0.007
(0.0081) (0.0075) (0.0074) (0.0081) (0.0081)
Financial Slack 0.0131 0.0344* 0.0349* 0.0131 0.013
(0.0098) (0.0151) (0.0152) (0.0099) (0.0098)
Year dummy 1996 -0.0494* -0.0598* -0.0609* -0.0498* -0.0514*
(0.0241) (0.0290) (0.0290) (0.0240) (0.0240)
Year dummy 1997 -0.0429+ -0.0703+ -0.0728* -0.0432+ -0.0434+
(0.0249) (0.0364) (0.0369) (0.0248) (0.0247)
Year dummy 1998 -0.0928* -0.0616* -0.0612* -0.0938* -0.0947**
(0.0369) (0.0257) (0.0255) (0.0368) (0.0367)
Year dummy 1999 -0.0921* -0.0580** -0.0589** -0.0926* -0.0937*
(0.0368) (0.0179) (0.0179) (0.0367) (0.0366)
AET 0.0334** 0.0239* 0.0388** 0.0337** 0.0224+
(0.0111) (0.0100) (0.0136) (0.0112) (0.0118)
Betweenness Centrality 0.0133 0.3332*
(0.0846) (0.1403)
Interaction (AET X Betweenness) -0.0883*
(0.0378)
Network Density -0.0006 0.0001
(0.0006) (0.0006)
Interaction (AET X Density) 0.0033**
(0.0011)
Constant 0.0055 -0.0048 -0.0049 0.0079 0.0043
(0.0250) (0.0037) (0.0038) (0.0256) (0.0254)
R-squared 0.51 0.64 0.68 0.51 0.54
Observations 521 521 521 521 521
Number of i 113 113 113 113 113
Robust standard errors in parentheses
* significant at 5%; ** significant at 1%; + significant at 10%
AET - advantage-enhancing strategy

97
Table 16: AET, Network Structure and Performance
Dynamic Panel Data Model - System GMM Estimator
DV: Performance (average ROA over the next three years)
Model 1 Model 2 Model 3 Model 4 Model 5
Performance (past ROA) 0.3437** 0.3428** 0.3177* 0.3419** 0.3047*
(0.1205) (0.1170) (0.1381) (0.1216) (0.1250)
Firm size (total assets) -5.62e-08 -6.20e-08 -3.33e-07 -3.01e-07 -4.94e-07
(1.07e-06) (1.07e-06) (6.43e-07) (7.16e-07) (7.78e-07)
Market Power 1.6592 1.1979* 1.0016 1.6428 1.1637+
(1.1016) (0.5895) (0.6120) (1.0852) (0.6970)
Financial Leverage 0.0044 0.0045 0.003 0.0045 0.002
(0.0036) (0.0031) (0.0021) (0.0036) (0.0021)
Financial Slack 0.0079 0.0156+ 0.0144+ 0.0079 0.0119+
(0.0072) (0.0083) (0.0078) (0.0072) (0.0070)
Year dummy 1996 0.1403** 0.0562 0.0618 0.1400** 0.1116*
(0.0408) (0.0350) (0.0384) (0.0407) (0.0434)
Year dummy 1997 0.1361** 0.0581+ 0.0610+ 0.1362** 0.1042*
(0.0388) (0.0306) (0.0353) (0.0388) (0.0418)
Year dummy 1998 0.0927** 0.0523* 0.0498* 0.0927** 0.0647**
(0.0143) (0.0208) (0.0247) (0.0144) (0.0165)
Year dummy 1999 0.0277** 0.0382** 0.0381* 0.0285** 0.0299**
(0.0105) (0.0131) (0.0156) (0.0106) (0.0112)
AET 0.0533* 0.0202 0.0387* 0.0530* 0.0194
(0.0226) (0.0134) (0.0174) (0.0224) (0.0150)
Betweenness Centrality 0.0154 0.3361*
(0.1354) (0.1434)
Interaction (AET X Betweenness) -0.0933*
(0.0451)
Network Density 0.0005 0.0012*
(0.0007) (0.0005)
Interaction (AET X Density) 0.0028**
(0.0011)
Constant -0.0155* -0.0135** -0.0132** -0.0157* -0.0155**
(0.0063) (0.0045) (0.0043) (0.0064) (0.0057)
Observations 520 520 520 520 520
Number of i 112 112 112 112 112
Robust standard errors in
parentheses
* significant at 5%; ** significant at 1%; + significant at 10%
AET - advantage-enhancing strategy
98
Robustness check
Advantage creating (proactiveness and innovativeness) and advantage-enhancing
strategic tendencies are measured as the observable and realized strategic activity of firms
over time. This activity, however, may reflect not only firms‘ internal advantage-creating
and advantage-enhancing capabilities; it may also capture firms‘ access to network
resources in the previous period. This effect can be removed by partialling out the
explained variance in competitive strategy due to the network structure effect in the
previous period. Therefore, I first regressed each strategy variable (i.e., proactiveness,
innovativeness, and AET) on each type of network structure (betweenness centrality and
network density). Then, I used the residuals from this regression as a measure of firm
strategy. For example, to remove the effect of prior network density on advantage-
enhancing tendency (AET), I regressed AET on network density and used the residuals
from this regression as a measure of AET. This procedure partials out the variance in
AET that is explained by past network density. Thus, the interaction between AET and
network density is a product of the current period AET (without the effect from past
network density) and the current period network density. I ran all models using these
modified measures of AET and ACT. The results were consistent with those shown
below, which used the original measures.
In addition, all measures of the network structure are based on all types of
alliances, including licensing alliances. Although licensing agreements also facilitate
transfer of knowledge and information, they are different from other types of alliances
because the transfer of knowledge mostly goes one-way: from a licensor to a licensee.
Because firms that have many licensing agreements are more likely to have many
structural holes (partners are less likely to collaborate with one another) for reasons other
than their competitive strategy, I also computed alliance network measures excluding
licensing agreements. The pattern of the results remained unchanged.
Finally, my sample included the largest companies in computers and electronics
industry. However, because some of the smaller firms may be important rivals in these
industries, I also included those firms that were more newsworthy than some of the
largest firms in the sample (selected by number of employees and the total revenues). The

99
inclusion of these firms can introduce some bias in the sample, because these additional
firms added to the sample of the largest firms are not a random draw from the population
of smaller firms in these industries. Therefore, I also tested the propositions excluding
these firms. The results again remained consistent with those shown above.

100
CHAPTER VII: DISCUSSION AND CONCLUSION
Overview
In this dissertation, I explore the interplay between alliance networks and firms‘
strategies in explaining firm performance. In hypercompetitive environments, in which
firms compete with complex modular products, a firm‘s ability to systematically
outperform rivals depends not only on its internally developed capabilities but also on the
advantageous access to information, assets, and expertise controlled by the other firms.
Recent research suggests that the sources of performance differences across firms reside
in the firm‘s favorable pattern of alliance ties (Gulati, Nohria & Zaheer, 2000). For
example, Dyer and Nobeoka (2000) qualitative research has shown that Toyota‘s
productivity advantages over rivals can be, at least partially, attributed to its dense
network of interconnected suppliers. Dense network stimulates knowledge sharing among
network partners, discourages free riding and reduces the cost of accessing and
mobilizing valuable external resources. On the other hand, Burt (1992) work suggests
that firms can gain from sparse network structure in which a focal firm is connected with
firms from disconnected clusters. This network structure provides access to diverse
knowledge and resources, which increases firms‘ potential for discovering
entrepreneurial opportunities and developing radical innovation. However, although this
research has increased our understanding of how the structure of alliance network affect
firm performance, we still have incomplete understanding of two fundamental questions
for strategy researchers: 1) Why some firms (and not others) develop such advantageous
positions in the alliance network structure, and 2) Why some firms benefit from dense
network structure, whereas others benefit from sparse network structure?
In this dissertation, I argue that firms develop and benefit from different alliance
network structures because they pursue different competitive strategies. Different
strategies create different needs, motivations, and opportunities for collaboration with
other market participants. Because different network resources are needed for different
types of strategies, the effect of network position on firm performance is contingent on
the type of strategy a firm is pursuing. I find that firms with superior advantage-creating
strategies tend to create sparse network structures with many non-equity alliances,

101
whereas those with superior advantage-enhancing strategies become embedded in dense
network structures with many equity alliances. However, this tendency is not universally
beneficial for all firms. Firms with superior advantage-creating or advantage-enhancing
capabilities can benefit more from creating dense network structures, whereas firms that
lack such capabilities will benefit more from network structures with many brokerage
opportunities between disconnected clusters. Thus, network structure plays both
supplementary and complementary role to the firm‘s advantage-creating and advantage-
enhancing capabilities. I discuss this point in more detail in Section 7.4. Here, I first start
with discussion of the major findings in Chapter 1 (the relationship between competitive
strategy and firm performance).
Competitive Strategy and Firm Performance
This dissertation extends the research in corporate entrepreneurship by showing
that superior performance in hypercompetitive environments can be achieved not only
through proactiveness and innovativeness (advantage-creating tendencies) but also
through intensive advantage-enhancing activity. I find that advantage-creating and
advantage-enhancing strategies have independent positive effects on firm performance.
Firms with advantage-creating strategy are frequently first to introduce new products and
technologies on the market and thus create series of short-term monopolistic market
positions. Firms with strong advantage-enhancing capabilities, on the other hand, are
better able to protect and extend a few well-established market positions and to quickly
imitate the new products and technologies of first movers. In addition, I find that firms
cannot pursue strategic entrepreneurship (frequent creation of new competitive
advantages and ability to protect and sustain those advantages) relying solely on its
internal capabilities; this study‘s results suggest, however, that firms can achieve strategic
entrepreneurship through developing an optimal alliance network structure that can
substitute for the capabilities that a firm is lacking. As such, this research study is among
the few that has empirically examined some important aspects of the emergent ―strategic
entrepreneurship‖ paradigm (I discuss this point in more detail below).
This study advances the research in corporate entrepreneurship also by examining
the relationship between the changes in entrepreneurial strategies and firm performance

102
over time. Using a longitudinal time-series research design, this study empirically
examines the causal relationship between different dimensions of entrepreneurial
strategies (proactiveness and innovativeness), advantage-enhancing strategies, and firm
performance. For example, the post-hoc analyses reveal that the past level of firms‘
innovativeness affects the future ability of firms both to proactively introduce new
products (proactiveness) and to intensively enhance the value of their existing products
(advantage-enhancing tendencies). The confidence in the direction of the causality of this
relationship is increased (1) by including lagged dependent variables, (2) by using lagged
independent variables, (3) by controlling for unobserved heterogeneity, and (4) by
showing that the reverse effect is not statistically significant, none of which could have
been possible using cross-sectional data. This additional analysis corroborates Covin and
Miles‘s (1999) argument that innovativeness is a central characteristic of entrepreneurial
firms and that the dimensions of entrepreneurial orientation may be sequentially related
(Lumpkin & Dess, 2001). It is possible, however, that the magnitude of the effect of each
of these dimensions on firm performance may vary for different firm performance
measures. For example, a firm‘s innovativeness and proactiveness may be more strongly
related to measures of firm performances such as market share change or sales growth
rate. Thus, future research may examine how advantage-creating and advantage-
enhancing tendencies are interrelated in explaining different measures of firm
performance.
Competitive Strategy and Network Formation
This study also contributes to a better understanding of how strategic actors find
their way into certain network positions. Firms are embedded in different network
structures, because they pursue different strategies. Because firms exhibit recurring and
stable strategic behavior over time, they also show consistent patterns of networking
behavior. Thus, although the overall alliance network is changing dynamically, firms
exhibit stable patterns of network ties, which in turn result in their being in a stable
position in the alliance network structure over time.
I find that firms with strong advantage-creating tendencies in the previous period
exhibit enduring propensity to become embedded in sparse network structures and to

103
form more non-equity alliances in the future. These firms have a greater need and
motivation to frequently bring new partners into their networks, often from distant
network clusters; therefore, they constantly maintain sparse network structures. Because
this frequent formation of new alliances requires greater flexibility (both to form new
alliances and dissolve old alliances that are no longer useful), they are also more likely to
form non-equity alliances. Non-equity alliances provide this flexibility because they
involve less formal organizing mechanisms and are less costly to dissolve. On the other
hand, firms with an emphasis on advantage-enhancing strategies are more likely to
become embedded in a dense network with many equity-based alliances. Because the
products are complex systems involving components supplied by independent firms, the
component providers need to closely collaborate with one another. A dense network
structure facilitates the flow of information and resources and decreases the incentives of
network members to behave opportunistically. This increased exchange of information
ensures greater fit among components and modules, which leads to a reduced risk of
product malfunctioning. Thus, it is reasonable to expect that firms with advantage-
enhancing strategies will intensively form alliances with the other firms as well as
encouraging greater collaboration among the other network members. Because equity
alliances are more effective in managing interdependencies among firms, we would
expect that these firms will be more likely to form equity rather than non-equity alliances.
This research provides new insights into how firms that try to pursue strategic
entrepreneurship use their alliances to outperform rivals. Because these firms are able to
simultaneously pursue advantage-creating and advantage-enhancing strategies, they
dynamically change their network positions. They form new ties with firms from distant
network clusters and at the same time encourage their partners to collaborate with one
another. Thus, their network structure is changing from dense to sparse and back again as
a function of their relative needs and motivations to pursue advantage-enhancing and
advantage-creating strategic tendencies.
This study also addresses Stuart and Sorenson‘s (2007) concerns with the
endogeneity problems in current network research. Firms‘ competitive strategies may
affect both their position in the network structure and their performance. The results of
this study suggest that future studies should account for firms‘ competitive strategies

104
when they investigate the relationship between network structure (and portfolio
configuration) and firm performance.
It is important to note that in this chapter, I examine how individual decisions of
firms to form alliances leads to recognizable network structure at the interfirm level of
analysis. I did not initially assume that firms are aware of their network structure and they
purposefully shape their position in the network structure. Adopting methodological
individualism (Hayek, 1948; Mises, 1949), I try to understand the formation of the
overall network structure by examining the strategic and entrepreneurial actions of
individual actors in the network. However, to examine how firms can maximize their
performance, I adopt the Granovetter (1985) embeddeddness perspective by taking a
―middle ground‖ approach between an oversocialized and undersocialized view of firms‘
market activity (Granovetter, 1985). Specifically, I assume that firms pursue different
strategies, but that the effectiveness of these strategies is affected by the network
structure in which they are embedded. This approach can lead to normative statements
about what would be the optimal network structure for each strategy to maximize firm
performance. Thus, if in this chapter I examine ―what firms do,‖ I next examine ―what
firms should do‖ to enhance their performance.
Competitive Strategy, Network Structure, and Firm Performance
This dissertation shows that the effect of network structure on firm performance
depends on the strength of the firm‘s internally developed capabilities. Firms that possess
superior advantage-creating and advantage-enhancing capabilities can benefit more from
dense network structures, whereas firms that lack superior internal capabilities find sparse
network structures more beneficial.
More specifically, I find that network density, although not having a direct effect
on firm performance, plays an important moderating role on the relationship between
competitive strategy and firm performance. The positive relationship between advantage-
creating and advantage-enhancing tendencies and firm performance is much stronger
when firms are embedded in a dense network structure. This suggests that firms with
superior advantage-creating capabilities can use a dense network of collaborators to
continuously improve their newly created advantages and thus stay ahead of competitors.
105
In this case, network density plays a supplementary role by enabling firms with strong
advantage-creating capabilities to achieve strategic entrepreneurship. Firms can focus
their internal resources on building advantage-creating capabilities while using network
density to substitute for their lack of advantage-enhancing capabilities.
I also find that network density plays a complementary role by enabling firms
with superior advantage-enhancing capabilities to extract greater value from a dense
network of collaborators. This combination of strategy and dense network structure
provides firms with the capability to intensively and incrementally improve their existing
complex products and thus sustainably retain a leadership position in the market. An
obvious example (outside of computers and electronics industry) of this finding is the
ability of Toyota to continuously improve its existing vehicle models and sustainably
outperform rivals. Because the vehicles are also complex systems, Toyota‘s
embeddedness in a dense network of suppliers ensures greater diffusion of knowledge
among suppliers, which partially explains its ability to outperform rivals. Dyer and
Nobeoka (2000) found that Toyota‘s dense supply network encourages exchange of
knowledge (both tacit and explicit), ideas and expertise, discourages ―free riding,‖ and
prevents leakage of strategic information and knowledge to rivals. Hence, this study helps
to generalize Dyer and Nobeoka‘s (2000) findings to other industries, such as computers
and electronics.
In contrast to network density, a sparse network structure has a positive direct
effect on firm performance, which supports Burt‘s (1992) structural hole argument and is
consistent with the empirical findings at the firm level of analysis (Baum et al., 2000;
Zaheer & Bell, 2005). This study, however, extends this research by showing that firms‘
without superior internal capabilities can benefit more from spanning global structural
holes. Although the firms with strong advantage-creating and advantage-enhancing
capabilities do increase their performance when they form sparse network structures,
these effects are much stronger for firms that lack such capabilities. As Figure 20 and 21
below illustrate, the effects of an increase in betweenness centrality is much stronger
when advantage-creating and advantage-enhancing tendencies are at low levels, as
compared with when these tendencies are at high level.

106
Figure 21: Moderating role of Betweenness Centrality on the Relationship Between
AET and Performance
Figure 22: Moderating role of Betweenness Centrality on the Relationship Between
ACT (proactivenes) and Performance
These findings suggest that firms that lack superior internal capabilities can
increase their performance when they have access to diverse knowledge and
technologies. On one hand, firms that lack advantage-creating tendencies can use a sparse
network structure to increase their innovative and proactive capabilities in the future and
thus enhance their performance. On the other hand, firms that lack advantage-enhancing
capabilities are less likely to be considered attractive network partners either because this

107
firms have higher risk of free riding (i.e., they can gain much more than what they can
contribute to the network members) or because they cannot provide the needed resources.
Hence, forming new alliances from distant technological domains may be used to
leverage their internal innovative capabilities, which in turn may increase their legitimacy
as valuable network partners in the future.
Finally, this study also extends the research in competitive dynamics area (e.g.,
Smith, Ferrier, & Ndofor, 2001; Grimm, Lee, & Smith, 2006). It suggests that firms
systematically differ in their tendencies to initiate ―proactive‖ versus ―advantage-
enhancing‖ competitive actions. The extent to which firms exhibit tendencies to carry out
either proactive or advantage-enhancing competitive actions is powerful predictor of the
intensity and the pattern of collaborative actions (i.e., strategic alliances). Relatedly, this
study extends the application of the awareness-motivation-capability (A-M-C) framework
(Chen, 1996) to the relationship between competitive strategy and alliance network
structure. On one hand, different types of network structure increase the effectiveness of
each type of competitive strategy by increasing the firm‘s awareness of profit
opportunities and by leveraging its capabilities with those of network partners. On the
other hand, firms with different types of capabilities have different needs and motivation
to collaborate with other firms.
Limitations and Future Research
This study measures competitive strategy and alliance network structure based on
the firm‘s competitive and collaborative activity over a three-year window. Indeed, the
reliability of the strategic and network variables could be increased as the time over
which these variables are measured becomes longer. In addition, the stability of firms‘
positions in the network structure would be more reliably estimated over longer periods.
Nevertheless, previous research suggests that in the computers and electronics industries,
the intensity of new product introduction is almost one new product per year (Nadkarni &
Narayanan, 2007), and the firms in my sample initiated 43 patents per year on average.
This indicates sufficient variation of the advantage-creating strategic tendencies across
firms. In addition, the alliance duration in highly competitive environments is about three
108
years (e.g., Pangarkar, 2003), which provides justification for using a three-year moving
window in mapping network structure.
Another limitation of this study is that the data are drawn from several interrelated
industries in hypercompetitive context. This choice is important for this study to isolate
the effect of firms‘ strategies from other industry-specific factors that may affect firm
performance. However, this approach also limits the external validity of the findings. For
example, the type of strategy and the rate of change in alliance and innovative activity of
firms is likely to be different in more stable industries. Future research should, therefore,
examine how the competitive environment in different industries affects the propositions
tested in this study.
Relatedly, this dissertation focuses on only two types of strategies that the recent
research in dynamic capabilities, first mover advantages, and strategic entrepreneurship
has suggested can enable firms to gain superior performance in hypercompetitive
environments. Other typologies of competitive strategies such as those proposed by Miles
and Snow (1978) or Porter (1985) may also be used to study the interplay between
network structure and competitive strategy in multi-industry samples.
Furthermore, the focus of this study is at firm level of analysis. Future research
should examine the effect of competitive strategy on alliance formation at the dyadic
level of analysis. For example, the likelihood of alliance formation between two firms
will also be affected by their type of competitive strategy. Firms with advantage-creating
capabilities may choose to collaborate with partners with strong advantage-enhancing
capabilities beyond the effect of prior alliance activity and the position in the network
structure (Gulati & Garguilo, 1999). On the other hand, we can expect a higher level of
competitive tension between two firms pursuing a similar competitive strategy and thus
have a lower likelihood of alliance formation. In addition, rivals with similar strategic
tendencies may also be prone to terminate their alliances sooner and at a faster rate than
firms that pursue different strategies. The risk of leakage of proprietary knowledge and
technologies between partners can have more adverse effect when firms pursue similar
strategies, because they are more likely to perceive each other as direct rivals. This can
create higher tension and distrust between partners, which increases the risk of
terminating the alliance.

109
In addition, I collected data on advantage-enhancing activity of firms at the firm
level of analysis. An alternative approach would be to collect data at the product level
and examine how the intensity and the type of advantage-enhancing actions will affect its
market share and profits. Future research could examine how the alliance network at the
product level would increase the firm‘s ability to continuously enhance the value of a
given product and whether the network structure varies over different stages in the
product life cycle.
This study focuses mainly on two types of network structure: sparse versus dense.
Future research is needed to explore how differences in firms‘ strategies will affect other
relational and structural network measures such as alliance network diversity (i.e.,
functional variety of alliance in the firm‘s portfolio) (Powell et al., 1996) or closeness
centrality (Gnyawali & Madhavan, 2001). In addition, the similarities in strategic
orientation between two firms can be important predictor of their tendency to occupy
structurally equivalent position in the network structure. Two firms pursuing same
competitive strategies may exhibit similar patterns of network ties (i.e., being structurally
equivalent) despite being disconnected with one another. This interplay between
competitive strategies and the degree of structural equivalence between two firms can
have important implications for predicting the intensity of the competitive interaction
between firms. On one hand, firms with similar strategies that are also structurally
equivalent may become fierce competitors because they will closely monitor each other
and because they have access to similar information and resources from third parties. On
the other hand, firms that are connected with the same partners may have more
opportunities to interact and tacitly collude (through third parties) and thus decrease their
level of rivalry. Hence, future research should empirically investigate these opposing
arguments.
In explaining why firms with high advantage-creating strategies will become
embedded in sparse network structures, I argue that proactive firms have a greater need
for forming new alliances and thus will frequently bring new partners into their networks
(because the new partners are not connected with the existing network partners, these
firms are more likely to span structural holes). This in turn implies that proactive firms
will have a higher rate of alliance termination, assuming that all firms face resource

110
constraints (i.e., firms cannot maintain an infinite number of alliances.) However, more
rigorous examination is needed to establish whether proactive firms do terminate their
alliances sooner or they just form alliances of shorter duration.
In this study, I measured advantage-enhancing strategy as a count of advantage-
enhancing actions such as price cuts, marketing, product improvements and market
expansions, initiated by firms in a given year. These four types of competitive actions
loaded in one factor, which represents the firm‘s strategic focus and capability toward
continuously enhancing the existing product and services. However, it is possible to use
other operationalizations of advantage-enhancing activity of the firm. Researchers in
competitive dynamics literature have used measures that capture more interactive and
dynamic aspects of competitive behavior of firms. For example, the extent to which a
firm uses different types of actions – competitive repertoire complexity (Ferrier, 2001;
Miller & Chen, 1994) can capture finer distinction between different types of advantage-
enhancing activity (e.g., some firms may have greater emphasis on price cuts and
advertising, whereas others may launch more balanced repertoire of actions. Another
potentially useful operationalization of advantage-enhancing tendency is to measure the
degree of conformity of the firm‘s advantage-enhancing tendency with the industry
norms (Ferrier, 2001; Deephouse, 1999). Firms‘ conformity with industry norms can be
assessed based on the type and timing of actions over time (in calendar days or months).
The greater overlap of the type and timing of advantage-enhancing actions with those of
rivals can mitigate the positive effect of advantage-enhancing capability on firm
performance. As a result, firms may have greater need for collaboration with rivals to
reduce the intensity of rivalry.
Furthermore, in this study, I did not directly capture the firm‘s order and speed of
response to rivals‘ new products. Competitive dynamics research have provided more
nuanced measures of the firms‘ speed of response to rivals‘ new products by counting the
number of days elapsed between the proactive action and the subsequent reaction of
rivals (Basdeo et al. 2006; Lee, Smith, & Grimm, 2003; Chen & Hambrick, 1995; Ferrier,
Smith, & Grimm, 1999). Although, this study‘s focus was to capture the firm‘s
advantage-enhancing capability rather than the firm‘s propensity to quickly respond to
rivals‘ actions, measuring directly a firm‘s responsive capability can provide additional
111
understanding of how the access to information through network partners can affect
firms‘ ability to quickly imitate and respond to the pioneering products of first-movers.
This dissertation focused on the firm‘s observable product-market activity of
firms to capture its advantage-enhancing capability. I assume that firms‘ strategies can be
more comprehensively measured by examining the consistency in their observable
competitive behavior over time. By focusing on the realized competitive activity of firms,
I was able to capture both the intended and emergent strategies of firms (Mintzberg,
1978). This approach, however, prevented me to examine the firm‘s resource allocation
decisions that lead to market-based actions such as new products, improvements, or new
market entry. Future research should examine how firms‘ internally oriented actions such
as changes in human resource management practices (e.g., initiation of new employee
training programs, profit-sharing plans, or recruiting practices), or the top management
team‘s decision making processes affect firms‘ advantage-creating and advantage-
enhancing tendencies.
Finally, this dissertation uses a combination of archival sources and structured
content analysis of published news announcements to measure competitive strategies of
firms. An alternative approach to obtain data on competitive activity of firms is through
use of survey-based techniques. This approach increases the construct validity of the
measures, as managers are directly asked to report their perceived and intended strategies
(Lyon, Lumpkin, & Dess, 2000). Both approaches have some limitations. For example,
using questionnaire as a data collection instrument may bias the results due to systematic
differences between respondents and non-respondents. In addition, because this method
often relies on single informants, the responses on different measures can be
systematically affected by managers‘ unobservable and stable characteristics, which in
turn can bias the results because of the presence of common method variance. On the
other hand, content analysis of published news announcements is susceptible to media
reporting bias (e.g., toward more prominent firms) and fails to capture many internal
strategic actions that the media do not report. Because it was critical for this study to
examine changes in firms‘ strategies and network positions over time, the combination of
content analysis and archival data was the preferable data collection method. The

112
shortcoming of this approach was reduced to some extent by careful sample selection
process and by achieving high interrater reliability coefficients.
Conclusion
Performance differences across firms can be explained, at least partially, by the
extent to which firms enjoy favorable access to external resources and capabilities
developed by other market participants. Previous research has suggested that two types of
network structure – dense and sparse – are especially beneficial for firms to maximize the
effect of their internally developed entrepreneurial and strategic capabilities. Given that
these two types of network structure are important sources of firms‘ competitive
advantages, it is critical for strategic management research and practice to explain why
some firms (and not others) enjoy such advantageous access to network resources. In this
dissertation I attempt to provide greater understanding of (1) why some firms become
embedded in a sparse alliance network structure rich with structural holes, whereas others
form dense network structure, and (2) why some firms benefit from sparse network
structure, whereas others benefit from dense network structure.
My results show that firms become embedded in different types of network
structure because they pursue different competitive strategies. As firms increase the
degree of advantage-creating tendency, they tend to frequently bring new partners into
their alliance network and thus continuously create new structural holes. On the other
hand, when firms exhibit strong advantage-enhancing tendency, they tend to stimulate
greater collaborative activity between network partners and thus form dense network
structure. Despite the frequent and dynamic evolution of the overall alliance network,
firms occupy stable positions in the network structure because they pursue recurrent
patterns of strategic behavior.
However, this study reveals that these tendencies of firms are not universally
beneficial for all firms. I found that firms with superior advantage-creating or advantage-
enhancing capabilities could benefit more from dense network structure, whereas firms
with inferior capabilities are better off when they form alliances with firms from distant
network clusters and thus form a network structure rich with global structural holes.
These findings suggest that managers should carefully construct their alliance networks.

113
Firms with superior advantage-creating or advantage-enhancing capabilities should
encourage partners to actively collaborate with one another. On the other hand, firms that
lack superior capabilities need to economize their network structure by forming
nonredundant ties with firms from distant technological areas and thus increase their
potential to discover new entrepreneurial opportunities.

114
REFERENCES
Abegglen, J. & Stalk, G. 1985. Kaisha, The Japanese Corporation. New York: Harper &
Row Publishers, Inc.
Ahuja, G., & Lampert, CM. 2001. Entrepreneurship in the large corporation: a
longitudinal study of how established firms create breakthrough inventions.
Strategic Management Journal, 22(6-7):521-543.
Ahuja, G. 2000a. Collaboration networks, structural hoes, and innovation: a longitudinal
sturdy. Administrative Science Quarterly, 45(3):425-455
Ahuja, G. 2000b. The duality of collaboration: Inducements and opportunities in the
formation of interfirm linkages. Strategic Management Journal, 21: 317-343.
Andersen, T.W., & Hsiao, C. 1981. Estimation of dynamic models with error
components. Journal of American Statistical Association, 76: 598-606.
Arellano, M., & Bond, S. 1991. Some tests of specification for panel data: Monte carlo
evidence and an application to employment equations. The Review of Economic
Studies, 58(2): 277-297.
Baldwin, C.Y., & Clark, K.B. 2003. Managing in an age of modularity. In Garud, R.,
Kumaraswamy, A., & Langlois, R.N. (Eds.), Managing in the Modular Age.
Malden, MA: Blackwell Publishers Ltd.
Baltagi, H.B. 2008. Econometric Analysis of Panel Data. West Sussex, UK: John Wiley
& Sons Ltd.
Barney,J. 1991. Firm resources and sustained competitive advantage. Journal of
Management, 17(1):99-120.
Basdeo, D.K., Smith, K.G., Grimm, C.M., Rindova, V.P., Derfus, P.J., & Smith, R.H.
2006. The impact of market actions on firm reputation. Strategic Management
Journal, 27, 12 ; 1205-1219.
Baum, C.F. 2006. An Introduction to Modern Econometrics Using Stata. College
Station, TX: A Stata Press Publication.
Baum, JAC, Calabrese, T., & Silverman, BS. 2000. Don‘t go it alone: Alliance network
composition and startups‘ performance in Canadian biotechnology. Strategic
Management Journal, 21(3):267-294
Baum, J.A.C., & Oliver, C. 1991. Institutional linkages and organizational mortality.
Administrative Science Quarterly, 36(2): 187-218
Bettis, R.A., & Hitt, M.A. 1995. The new competitive landscape. Strategic management
journal, 16(summer):7-19
Blundell, R., & Bond, S. 1998. Initial conditions and moment restrictions in dynamic
panel data models. Journal of Econometrics, 87(1): 115-143.
Borgatti, S.P., Everett, M.G. and Freeman, L.C. 2002. Ucinet for Windows: Software for
Social Network Analysis. Harvard, MA: Analytic Technologies.
Boyd, J.L., & Bresser, R.K.F. 2008. Performance implications of delayed competitive
responses: evidences from the U. S. retail industry. Strategic Management
Journal, 29(10): 1077-1096.
Brass, D.J, Galaskiewicz, J., Greve, H.R. & Tsai, W. 2004 Taking stock of networks and
organizations: A multilevel perspective. Academy of Management Journal,
47(6):795-817.

115
Brown, S.L. & Eisenhardt, K.M. 1998. Competing on the edge: Strategy as structured
chaos. Boston, MA: Harvard Business School Press.
Blau, P.M. 1977. Inequality and Heterogeneity. Free Press: New York.
Burt, R.S. 1992 Structural Holes: The social structure of competition. Cambridge, UK:
Harvard University Press.
Burt, R.S. 2000. The network structure of social capital. Research in Organizational
Behavior, 22: 345-423.
Burt, R.S. 2005. Brokerage and Closure: An Introduction to Social Capital. Oxford,
New York: Oxford University Press.
Chandler, A.D. 1962. Strategy and Structure. Cambridge, MA: MIT Press.
Chen, M-J. 1996. Competitor analysis and interfirm rivalry: Toward A theoretical
integration. Academy of Management Review, 21, 1: 100-134.
Chen, M-J., & Hambrick, D.C. 1995. Speed, stealth and selective attack: How small
firms differ from large firms in competitive behavior. Academy of Management
Journal, 38: 453-482.
Coleman, JS. 1988. Social capital in the creation of human capital. American Journal of
Sociology, 94:95-120.
Comanor, W., & Scherer, F.M. 1969. Patent statistics as a measure of technical change.
Journal of Political Economy, 77: 392-398.
Covin, J.G., & Slevin, D.P. 1989. Strategic management of small firms in hostile and
benign environments. Strategic Management Journal, 10(1): 75-87
Covin J.G, & Slevin DP. 1991. A conceptual model of entrepreneurship as firm behavior.
Entrepreneurship Theory and Practice, 16(1): 7-25.
Covin J.G., & Miles M.P. 1999. Corporate entrepreneurship and the pursuit of
competitive
advantage. Entrepreneurship Theory and Practice, 23(3): 47-63.
Cyert, R.M., & March, J.G. 1963. A Behavioral Theory of the Firm. Englewood Cliffs,
NJ: Prentice-Hall.
D‘Aveni, R.A. 1994. Hypercompetition: Managing the dynamics of strategic
maneuvering. New York, NY: Free Press.
Dess, GG, Lumpkin, GT, & Covin, JG. 1997. Entrepreneurial strategy making and firm
performance: tests of contingency and configurational models. Strategic
Management journal, 18(9)677-695.
Earl, J, Martin, A, McCarthy, JD, & Soule, SA. 2004. The use of newspaper data in the
study of collective action. Annual Review of Sociology, 30:65-80.
Dacin, MT, Oliver, C, & Roy, JP. 2007. The legitimacy of strategic alliances: an
institutional perspective. Strategic Management Journal, 28(2):169-187.
Damanpour, F. 1991. Organizational innovation: A meta-analysis of effects of
determinants and moderators. Academy of Management Journal, 34 (3): 555-
590.
Damanpour, F., & Wischnevsky, D.J. 2006. Research on innovation in organizations:
Distinguishing innovation-generating from innovation-adopting organizations.
Journal of Engineering and Technology Management, 23: 269-291.
Das, T.K., & Teng, B. 2000. A resource-based theory of strategic alliances. Journal of
Management, 26 (1): 31-61.

116
Denzin, N. and Lincoln, Y. 2000. Data management and analysis methods. In Gery Ryan
and Russell Bernard (eds) Handbook of Qualitative Research, Thousand Oaks,
CA: SAGE publication.
Deephouse, D.L. 1999. To be different, or to be the same? It‘s a question (and theory) of
strategic balance. Strategic Management Journal, 20: 147-166.
Diamantopoulos, A. & Siguaw, J.A. 2006. Formative versus reflective indicators in
organizational measure development: A comparison and empirical illustration.
British Journal of Management, 17: 263-282.
DiMaggio, P.J., & Powell, W.W. 1983. The iron cage revisited: Institutional
isomorphism and collective rationality in organizational fields. American
Sociological Review, 48(2): 147-160.
Dyer, J.H., & Singh, H. 1998. The Relational view: Cooperative strategy and sources of
interorganizational competitive advantage. Academy of Management Review, 23
(44):660-679.
Dyer, J.H., & Nobeoka, K. 2000. Creating and managing a high-performance knowledge-
sharing network: the Toyota case. Strategic Management Journal, 21(3): 345-
367.
Edwards, J.R., & Bagozzi, R.P. 2000. On the nature and direction of relationships
between constructs and measures. Psychological Methods, 5(2): 155-174.
Eisenhardt, KM, & Schoonhoven, CB. 1996. Resource-Based view of strategic alliance
formation: Strategic and social effects in entrepreneurial firms. Organization
Science, 7(2):136-150
Emerson, R.M. 1962. Power-dependence relations. American Sociological Review,
27(1): 31-41
Ferrier, WJ, Smith, KG, & Grimm, CM. 1999. The role of competitive action in market
share erosion and industry dethronement: A study of industry leaders and
challengers. Academy of Management Journal, 42(4):372-388.
Ferrier, W.J., MacFhionnlaoich, C., Smith, K.G., & Grimm, C.M. 2002. The impact of
performance distress on aggressive competitive behavior: A reconciliation of
conflicting views. Managerial and Decision Economics, 23: 301-316.
Garcia-Canal, E., Duarte, CL, Criado, JR, & Llaneza, AV. 2002. Accelerating
international expansion through global alliances: a typology of cooperative
strategies. Journal of World Business, 37(2):91-107
Garud, R., & Kumaraswamy, A. 2003. Technological and organizational designs for
realizing economices of substitution. In Garud, R., Kumaraswamy, A., &
Langlois, R.N. (Eds.), Managing in the Modular Age. Malden, MA: Blackwell
Publishers Ltd.
Gnyawali,D.R., & Madhavan, R. 2001. Cooperative networks and competitive dynamics:
A structural embeddedness perspective. The Academy of Management Review,
26(3): 431-445.
Gnyawali, D.R., He, J. & Madhavan, R. 2006. Impact of co-opetition on firm competitive
behavior: An empirical examination. Journal of Management, 32: 507-530.
Gopalakrishnan, S. & Damanpour, F. 1997. A review of innovation research in
Economics, Sociology and Technology Management. Omega, The International
Journal of Management Science, 25, (1): 15-28.

117
Granovetter, MS. 1973. The strength of weak ties. The American Journal of Sociology,
78(6):1360-1380.
Granovetter, M. 1985. Economic action and social structure: The problem of
embeddedness. The American Journal of Sociology, 91(3): 481-510
Greene, W.H. 2003. Econometric Analysis (5th ed). Upper Saddle River, NJ: Prentice
Hall
Grimm, C.M. & Smith, K.G. 1997. Strategy as Action: Industry Rivalry and
Coordination. South-Western College Pub.
Gulati, R. 1998. Alliances and networks. Strategic Management Journal. 19(4): 293-317
Gulati, R. 1999. Network location and learning: the influence of network resources and
firm capabilities on alliance formation. Strategic Management Journal,
20(5):397-420
Gulati, R, & Gargiulo, M. 1999. Where do interorganizational networks come from? The
American Journal of Sociology, 104(5):1439-1493
Gulati, R., Nohria, N., & Zaheer, A. 2000. Strategic networks. Strategic Management
Journal, 21:203-215
Gulati, R. 1995. Social structure and alliance formation patterns: A longitudinal analysis.
Administrative Science Quarterly, 40(4):619-652
Gulati, R., & Singh, H. 1998. The architecture of cooperation: Managing coordination
costs and appropriation concerns in strategic alliances. Administrative Science
Quarterly, 43(4):781-814.
Hagedoorn, J., & Cloodt, M. 2003. Measuring innovative performance: Is there an
advantage in using multiple indicators? Research Policy, 32: 1365-1379.
Harrigan, K.R. 1988. Strategic alliance and partner asymmetries. Management
International Review, 9: 53-72.
Hall, B., Jaffe, A., & Trajtenberg, M. 2001. The NBER patent citation data file: Lessons,
insights, and methodological tools. NBER Working Paper 8498 (2001).
Hausman, J, Hall, BH, & Griliches, Z. 1984. Econometric models for count data with an
application to the patents-R & D Relationship. Econometrica, 52(4):909-938
Hausman, J.A. 1978. Specification test in econometrics. Econometrica: Journal of the
Econometric Society, 46(6): 1251-1271.
Hayek, F.A. 1948. Individualism and Economic Order. Chicago: The University of
Chicago Press.
Huff, L.C., & Robinson, W.T. 1994. The impact of leadtime and years of competitive
rivalry on pioneer market share advantages. Management Science, 40 (10): 1370-
1377.
Hitt, M. A., Ireland, R. D., Camp, S. M., & Sexton, D. L. 2002. Strategic
entrepreneurship: Integrating entrepreneurial and strategic management
perspectives. In M. A. Hitt, R. D. Ireland, S. M. Camp, & D. L.Sexton (Eds.):
Strategic entrepreneurship: Creating a new mindset, 1–16. Oxford: Blackwell
Publishers.
Ireland, RD, Hitt, MA, Camp, SM, & Sexton, DL. 2001. Integrating entrepreneurship and
strategic management actions to create firm wealth. The Academy of
Management Executive, 15(1):49-63.
Ireland, RD, Hitt, MA, & Sirmon, DG. 2003. A model of strategic entrepreneurship: The
construct and its dimensions. Journal of Management, 29(6):963-989.

118
Ireland, R.D., Covin, J.G., & Kuratko, D.F. 2009. Conceptualizing corporate
entrepreneurship strategy. Entrepreneurship Theory and Practice, 33(1): 19-46.
Jauch, LR, Osborn, RN, & Martin, TN. 1980. Structured content analysis of cases: A
complementary method for organizational research. The Academy of
Management Review, 5(4):517-525.
Jennings, D.F. and Lumpkin, J.R., 1989. Functionally modeling corporate
entrepreneurship: an empirical integrative analysis. Journal of Management , 15:
485–502.
Kirzner, I.M. 1973. Competition and entrepreneurship. Chicago, IL: University of
Chicago Press.
Kalyanaram, G., Robinson, W.T., & Urban, G.L. 1995. Order of market entry:
Established empirical generalizations, emerging empirical generalizations, and
future research. Marketing Science, 14 (3): G212-221.
Kerin, R.A., Varadarajan, P.R., & Peterson, R.A. 1992. First-mover advantage: A
synthesis, conceptual framework, and research propositions. The Journal of
Marketing, 56(4): 33-52.
Kirzner, I.M. 1979. Perception, Opportunity, and Profit: Studies in the Theory of
Entrepreneurship. Chicago, IL: University of Chicago Press.
Lavie, D. 2007. Alliance portfolios and firm performance: A study of value creation and
appropriation in the U.S. software industry. Strategic Management Journal,
28(12): 1187-1212.
Lee, H., Smith, K., Grimm, C., and Schomburg, A. 2000. Timing, order and durability of
new product advantages with imitation. Strategic Management Journal, 21: 23-
30.
Levinthal, D.A., & March, J.G. 1993. The myopia of learning. Strategic Management
Journal, 14(S2):95-112.
Lieberman, MB, & Montgomery, DB. 1988. First-mover advantages. Strategic
Management Journal, 9(5):41-58.
Lilien, G.L., & Yoon, E. 1990. The timing of competitive market entry: An exploratory
study of new industrial products. Management Science, 36(5): 568-585.
Linden, G., Kramer, K.L., & Dedrick, J. 2007. Who captures value in a global innovation
systems? The case of Apple‘s iPod. Unpublished paper. Personal Computing
Industry Center – An Alfred P. Sloan Foundation Center. UCIrvine.
Lumpkin, GT, & Dess, GG. 1996. Clarifying the entrepreneurial orientation construct and
linking it to performance. The Academy of Management Review, 21(1):135-172.
Lumpkin, GT, & Dess, GG. 2001. Linking two dimensions of entrepreneurial orientation
to firm performance: The moderating role of environment and industry life cycle.
Jounal of Business Venturing, 16(5):429-451.
Lyon, D.W., Lumpkin, G.T., & Dess, G.G. 2000. Enhancing entrepreneurial orientation
research: Operationalizing and measuring a key strategic decision making
process. Journal of Management, 26(5): 1055-1085.
Madhavan, R., Koka BR, & Prescott, JE. 1998. Networks in transition: How industry
events (re) shape interfirm relationships. Strategic Management Journal,
19(5):439-459

119
Makadok, R. 1998. Can first-mover and early-mover advantages be sustained in an
industry with low barriers to entry/imitation? Strategic Management Journal,
19(7):683-696
March, J.G. 1991. Exploration and exploitation in organizational learning. Organization
Science, 2(1): 71-87.
McGrath RM, MacMillan IC. 2000. The Entrepreneurial Mindset. Boston: Harvard
Business School Press.
Mendelson, H., & Pillai, RR. 1999. Industry Clockspeed: Measurement and operational
implications. Manufacturing & Service Operations Management, 1(1):1-20
Miller, D. 1983. The Correlates of entrepreneurship in three types of firms. Management
Science, 29(7):770-791.
Miles, R.E., & Snow, C.C. 1978. Organizational Strategy, Structure, and Process. New
York: McGraw-Hill
Miller, D., & Friesen, P. 1978. Archetypes of strategy formulation. Management
Science, 24(9):921-933.
Mintzberg, H. 1978. Patterns in strategy formation. Management Science, 24(9):934-948
Mintzberg, H. & Waters, J.A. 1985. Of strategies, deliberate and emergent. Strategic
Management Journal, 6(3): 257-272.
Mises, L.V. 1949. Human Action: A Treatise on Economics. New Haven, MA: Yale
University Press.
Morris, MH, & Sexton, DL. 1996. The concept of entrepreneurial intensity: Implications
for company performance. Journal of Business Research, 36(1):5-13
Nadkarni, S, & Narayanan, VK. 2007. Strategic schemas, strategic flexibility, and firm
performance: the moderating role of industry clockspeed. Strategic Management
Journal, 28(3):243-270.
Nelson, R.R., & Winter, S.G. 1982. Evolutionary Theory of Economic Change.
Cambridge, MA: Harvard University Press.
O‘Driscoll, G.P. and Rizzo, M.J. 1985. The Economics of Time and Ignorance. New
York, N.Y.: Basil Blackwell Inc.
Oliver, C. 1990. Determinants of interorganizational relationships: integration and future
directions. The Academy of Management Review, 15(2): 241-265.
Osborn, RN, & Baughn, CC. 1990. Forms of interorganizational governance for
multinational alliances. Academy of Management Journal, 33(3):503-519.
Pangarkar, N. 2003. Determinants of alliance duration in uncertain environments: The
case of the biotechnology sector. Long Range Planning, 36: 269-284.
Penrose, E. (1959). The Theory of the Growth of the Firm.London, UK: Basil
Blackwell.
Perreault, W.D., & Leigh, L.E., 1989. Reliability of nominal data based on qualitative
judgments. Journal of Marketing Research, 26, 2.
Pfeffer, J., & Salancik, G. R. 1978. The external control of organizations: A resource
dependence perspective. New York, NY: Harper & Row.
Porter,M.E. 1980. Competitive Strategy: Techniques for Analyzing Industries and
Competitors. New York: Free Press
Porter, M.E. 1985 Competitive advantage. New York, NY: Free Press.
Porter, M.E. 1991. Towards a dynamic theory of strategy. Strategic Management
Journal, 12 (Winter): 95-117.

120
Portes, A. 1998. Social capital: Its origins and applications in modern sociology. Annual
Review of Sociology, 24(1): 1-24.
Powell, WW, Koput, KW, & Smith-Doerr, L. 1996. Interorganizational collaboration and
the locus of innovation: Networks of learning in biotechnology. Administrative
Science Quarterly, 41(1):116-145.
Reagans, R., & Zuckerman, E.W. 2001. Networks, diversity, and productivity: The social
capital of corporate R&D teams. Organization Science, 12(4): 502-517.
Robinson, W.T. & Fornell, C. 1985. Sources of pioneer advantages in consumer goods
industries. Journal of Marketing Research, 22, (3): 305-317.
Robinson, W.T. 1988. Sources of market pioneer advantages: The case of industrial
goods industries. Journal of Marketing Research, 25, (1): 87-94.
Robinson, W.T., Fornell, C., & Sullivan, M. 1992. Are market pioneers intrinsically
stronger than later entrants? Strategic Management Journal, 13: 609-624.
Rothaermel, F.T., & Deeds, D.L. 2004. Exploration and exploitation alliances in
biotechnology: A system of new product development. Strategic Management
Journal, 25(3): 201-221.
Rowley, T.J. 1997. Moving beyond dyadic ties: A network theory of stakeholder
influences. The Academy of Management Review, 22(4): 887-910.
Rowley, T., Behrens, D., & Krackhardt, D. 2000. Redundant governance structures: An
analysis of structural and relational embeddedness in the steel and semiconductor
industries. Strategic Management Journal, 21(3):369-386.
Salancik, G.R. 1995. Wanted: A good network theory of organization. Administrative
Science Quarterly, 40(2): 345-349.
Sarkar, MB, Echambadi, RAJ, & Harrison, JS. 2001. Alliance entrepreneurship and firm
market performance. Strategic Management Journal, 22(6-7):701-711.
Schilling, M.A. 2009. Understanding the alliance data. Strategic Management Journal,
30: 233-260.
Schumpeter, J.A. 1947. The creative response in economic history. Journal of Economic
History, 7, (2): 149-159.
Scott, J. 1991. Social Network Analysis: A Handbook. Thousands Oaks, CA: Sage.
Shane, S. 2000. Prior knowledge and the discovery of entrepreneurial opportunities.
Organization Science, 11 (4): 448-469.
Sharma, P. & Chrisman, J.J. 1999. Toward a reconciliation of definitional issues in the
field of corporate entrepreneurship. Entrepreneurship: Theory & Practice, 23(3):
11-27.
Sirmon, D.G., Hitt, M.A., & Ireland, R.D. 2007. Managing firm resources in dynamic
environments to create value: Looking inside the black box. The Academy of
Management Review, 32(1):273-292.
Schmalensee, 1989. Inter-industry studies of structure and performance. In R.
Schmalensee, and Willig, R.D. (Eds.), Handobook of Industrial Organization,
Volume II, Chapter 16. New York, NY: Elsevier Science Publishers.
Smith, K.G., Ferrier, W.J., and Ndofor, H. 2001. Competitive dynamics research:
Critique and future directions. In M.A. Hitt, Freeman, R.E., and Harrison, J.S.
(Eds.), The Blackwell Handbook of Strategic Management. Malden, MA:
Blackwell Publishers Ltd.

121
Smith, KG, Grimm, CM, Gannon, MJ, & Chen, MJ. 1991 Organizational information
processing, competitive responses, and performance in the U.S. domestic airline
industry. Academy of Management Journal, 34(1):60-85.
Smith, K. G., & Di Gregorio, D. 2002. Bisociation, discovery, and the role of
entrepreneurial action. In M. A.Hitt, R. D. Ireland, S. M. Camp, & D. L. Sexton
(Eds.), Strategic entrepreneurship: Creating a new mindset, 129–150. Oxford:
Blackwell Publishers.
Sorenson, O., & Stuart, T. 2008. Bringing the context back in: Settings and search for
syndicate partners in venture capital investment networks. Administrative Science
Quarterly, 53(2):266-294.
Stuart, T.E., & Podolny, J.M.1996. Local search and the evolution of technological
capabilities. Strategic Management Journal, 17: 21-38.
Stuart, T.E. 2000. Interorganizational alliances and the performance of firms: A study of
growth and innovation rates in a high-technology industry. Strategic
Management Journal, 21: 791-811.
Stuart, T.E., & Sorenson, O. 2007. Strategic networks and entrepreneurial ventures.
Strategic Entrepreneurship Journal, 1: 211-227.
Teece, D.J., Pisano, G., & Shuen, A. 1997. Dynamic capabilities and strategic
management. Strategic Management Journal, 18, (7): 509-533.
Tolbert, P.S., & Zucker, L.G. 1983. Institutional sources of change in the formal structure
of organizations: The diffusion of civil service reform, 1880-1935. Administrative
Science Quarterly, 28(1): 22-39.
Trajtenberg, M. 1990. A penny for your quotes: Patent citations and the value of
innovations. The RAND Journal of Economics, 21(1): 172-187.
Uzzi, B. 1997. Social structure and competition in interfirm networks: The paradox of
embeddedness. Administrative Science Quarterly, 42 (1): 35-67.
Walker, G., Kogut, B., & Shan, W.1997. Social capital, structural holes and the formation
of an industry network. Organization Science, 8(2): 109-125.
Waserman, S., & Faust, K. 1994. Social Network Analysis: Methods and Applications.
New York, NY: Cambridge University Press.
Wiklund J. 1999. The sustainability of the entrepreneurial orientation–performance
relationship. Entrepreneurship Theory and Practice, 24(1): 37-48.
Wiklund J, Shepherd D. 2003. Knowledge-based resources, entrepreneurial orientation,
and the performance of small and medium-sized businesses. Strategic
Management Journal, 24(1): 1307-1314.
Williamson, 0. E. 1975. Markets and hierarchies: Analysis and antitrust implications.
New York, NY: Free Press.
Wooldridge, J.M. 2002. Econometric analysis of cross section and panel data.
Cambridge, MA: The MIT Press.
Zaheer, A., & Bell, G.G. 2005. Benefiting from network position: firm capabilities,
structural holes, and performance. Strategic Management Journal, 26(9):809-
825.
Zahra, S.A.,& George, G. 2002. Absorptive capacity: A review, reconceptualization, and
extension. The Academy of Management Review, 27(2): 185-203.
Zahra S. 1991. Predictors and financial outcomes of corporate entrepreneurship: an
explorative study. Journal of Business Venturing, 6(4): 259-285.

122
APPENDIX
Table 17: Selected News Reports on Apple and Rivals
October, 23, 2001 Apple introduces iPod: ―Apple today introduced iPod(TM), a breakthrough MP3 music player that packs up to 1,000 CD-quality songs into an ...‖
March 21, 2002 Apple enhances iPod: ―Apple today announced a second model of its groundbreaking iPod(R) digital music player that features a 10GB hard drive
…‖
October 14, 2002 Creative imitates iPod: ―Creative launches its NOMAD Jukebox Zen , a pocket-sized, 20GB MP3 player priced 40% less than Apple's iPod…‖
July 17, 2002 Apple enhances iPod: ―Apple chief Steve Jobs said on Wednesday that Apple has expanded the audience for its popular iPod music player with new
versions of the device designed to work with Windows-based personal computers...‖
March 1, 2003 Creative enhances Zen: ―Thanks for the R&D, Apple! Creative takes a look at Apple‘s iPod and—thankfully—bites its design in new product
extension…‖
April 28, 2003 Creative enhances Zen: ―Creative introduces three exciting new speaker systems to match the Apple iPod…‖
November 11, 2003 Gateway imitates iPod: ―Gateway's new digital jukebox is $100 less than Apple iPod; the 20GB Jukebox delivers industry's best value…‖
December 8, 2003 Dell imitates iPod: ―Hoping to duplicate the success of Apple's iPod and iTunes music store, Dell introduces DJ Player with Dell Jukebox powered
by Musicmatch ($249 for 15 GB; $299 for 20 GB)…‖
January 6, 2004 Apple enhances iPod: ―Apple today introduced iPod(TM) mini, the smallest portable music player ever to hold up to 1,000 CD-quality songs. The
new iPod mini is encased in an ultra-portable, lightweight...‖
June 21, 2004 Apple enhances iPod: ―Apple Computer Inc. and BMW Group on Monday introduced an adapter that allows iPod and BMW customers to plug their
music collections directly into their car sound systems…‖
July 19, 2004 Apple enhances iPod: ―Apple introduces the new fourth-generation iPod featuring Apple's ‗click wheel‘ and 12-hour battery life…‖
October 26, 2004 Apple enhances iPod: ―Apple introduces iPod Photo, your entire music and photo library in your pocket…‖
November 3, 2004 Apple enhances iPod: ―iTunes 4.7, the version of Apple‘s music player released to coincide with iPod Photo…‖
January 11, 2005 Apple enhances iPod: ―Apple introduces iPod shuffle, first iPod under $100…‖
September 7, 2005 Apple enhances iPod: ―Apple today introduced the iPod(R) nano, a revolutionary full-featured iPod that holds 1,000 songs, yet is thinner than a
standard #2 pencil and less than half the size of…‖
September 7, 2005 Apple enhances iPod: ―Motorola, Apple unveil ‗iPod Phone‘…‖
October 12, 2005 Apple enhances iPod: ―Apple unveils new video iPod, Disney TV deal…‖
November 20, 2005 Apple enhances iPod: ―Apple launches iPod Movie…‖
February 5, 2006 Apple enhances iPod: ―Apple introduces cheaper iPod…‖
February 28, 2006 Apple enhances iPod: ―Apple unveils iPod hi-fi home stereo system…‖
March 29, 2006 Apple enhances iPod: ―Apple Computer unveils iPod max volume software update…‖
May 24, 2006 Apple enhances iPod: ―Nike and Apple team up to launch Nike+iPod…‖
July 10, 2006 Apple enhances iPod: ―Apple introduces talking iPod…‖
September 12, 2006 Apple enhances iPod: ―Apple‘s CEO Jobs unveils games for iPod…‖
April 16, 2007 Apple enhances iPod: ―Apple to release WiFi iPod…‖

123
Table 18: Summary Statistics of Alliances
1993 3771 2520 1251 1549 2222
1994 4471 2952 1519 2095 2376
1995 4402 2964 1438 2454 1948
1996 2620 1732 888 1341 1279
1997 3090 1866 1224 1353 1737
1998 3415 2078 1337 1061 2354
1999 3837 2175 1662 1069 2768
2000 4577 2617 1960 1431 3146
2001 2953 1842 1111 847 2106
2002 1971 1327 644 689 1282
2003 1659 1076 583 332 1327
Total 36766 23149 13617 14221 22545
YearTotal Number of
Alliances
International
Alliances
Domestic
Alliances
Equity
Alliances
Non-Equity
Alliances
1993 3771 486 12.9% 1010 26.8% 1134 30.1% 1541 40.9% 167 4.4%
1994 4471 707 15.8% 1237 27.7% 1411 31.6% 1593 35.6% 169 3.8%
1995 4402 826 18.8% 940 21.4% 1477 33.6% 1410 32.0% 82 1.9%
1996 2620 534 20.4% 397 15.2% 729 27.8% 653 24.9% 32 1.2%
1997 3090 651 21.1% 544 17.6% 702 22.7% 603 19.5% 40 1.3%
1998 3415 661 19.4% 252 7.4% 730 21.4% 521 15.3% 88 2.6%
1999 3837 494 12.9% 181 4.7% 693 18.1% 436 11.4% 53 1.4%
2000 4577 141 3.1% 309 6.8% 460 10.1% 452 9.9% 103 2.3%
2001 2953 101 3.4% 244 8.3% 391 13.2% 357 12.1% 166 5.6%
2002 1971 78 4.0% 202 10.2% 430 21.8% 290 14.7% 53 2.7%
2003 1659 162 9.8% 177 10.7% 261 15.7% 309 18.6% 28 1.7%
Total 36766 4841 13.2% 5493 14.9% 8418 22.9% 8165 22.2% 981 2.7%
Marketing% of
total
Supply
Alliances
% of
total
Total Number
of Alliances
Licensing
Agreements% of total R&D
% of
totalManufacturing
% of
totalYear
Note: A single alliance maybe coded in two or more categories (e.g., marketing and manufacturing). Thus, the alliance
categories shown above are neither exhaustive nor unique.

124
Table 19: Examples of Words that Indicated “Proactiveness” of New Products
Most innovative to date
First to offer
Revolutionary
Breakthrough (technology/product)
Industry’s first
First of its kind
First ever
First generation
First product to bring
First company
Revolutionary design
World’s first
World’s fastest
Fastest and most versatile model ever
Smallest and lightest in the industry
Industry’s only
The world’s smallest and most cost-effective
First commercially available
Smallest module on the market
First to market new technology
“there isn’t anything like this on the market”
Takes the lead in…
It is the first company to have brought c.d. technology to the stage of practical use
Highest performance available
Superior to industry standard
The only device on the market
New world standard
Moves ahead of competitors
Pioneering
Up to 10 (100,1000) times/faster, better etc.
Set industry standards

125
Table 20: List of Sample Companies # SIC COMPANY NAME # SIC COMPANY NAME # SIC COMPANY NAME
1 3570 HEWLETT-PACKARD CO 43 3577 XEROX CORP 84 3674 MACRONIX INTL LTD -ADR
2 3570 HITACHI LTD -ADR 44 3578 DIEBOLD INC 85 3674 MAXIM INTEGRATED PRODUCTS
3 3571 APPLE INC 45 3578 HYPERCOM CORP 86 3674 MICRON TECHNOLOGY INC
4 3571 CONCURRENT COMPUTER CP 46 3578 NCR CORP 87 3674 NATIONAL SEMICONDUCTOR CORP
5 3571 DELL INC 47 3579 PITNEY BOWES INC 88 3674 QLOGIC CORP
6 3571 GATEWAY INC 48 3651 EMERSON RADIO CORP 89 3674 SIGMA DESIGNS INC
7 3571 NEC CORP -ADR 49 3651 HARMAN INTERNATIONAL INDS 90 3674 SILICON STORAGE TECHNOLOGY
8 3571 SUN MICROSYSTEMS INC 50 3651 RECOTON CORP 91 3674 STMICROELECTRONICS NV -ADR
9 3571 XYBERNAUT CORP 51 3651 SONY CORP -ADR 92 3674 TAIWAN SEMICONDUCTOR -ADR
10 3572 DATARAM CORP 52 3670 AVX CORP 93 3674 TEXAS INSTRUMENTS INC
11 3572 EMC CORP/MA 53 3670 CTS CORP 94 3674 THREE-FIVE SYSTEMS INC
12 3572 IOMEGA CORP 54 3670 EPCOS AG -ADR 95 3674 XILINX INC
13 3572 NETWORK APPLIANCE INC 55 3670 KEMET CORP 96 3674 ZILOG INC
14 3572 QUANTUM CORP 56 3670 VISHAY INTERTECHNOLOGY INC 97 3678 AMPHENOL CORP
15 3572 READ-RITE CORP 57 3672 ACT MANUFACTURING INC 98 3678 METHODE ELECTRONICS -CL A
16 3572 SANDISK CORP 58 3672 BENCHMARK ELECTRONICS INC 99 3678 MOLEX INC
17 3572 WESTERN DIGITAL CORP 59 3672 FLEXTRONICS INTERNATIONAL 100 3679 CORNING INC
18 3575 BOUNDLESS CORP 60 3672 JABIL CIRCUIT INC 101 3679 HUTCHINSON TECHNOLOGY INC
19 3576 3COM CORP 61 3672 PARK ELECTROCHEMICAL CORP 102 3679 SPARTON CORP
20 3576 ADAPTEC INC 61 3672 PARK ELECTROCHEMICAL CORP 103 3679 STONERIDGE INC
21 3576 CIRRUS LOGIC INC 62 3672 SANMINA-SCI CORP 104 3679 TDK CORP -ADS
22 3576 CISCO SYSTEMS INC 63 3672 SOLECTRON CORP 105 3679 TECHNITROL INC
23 3576 DIGI INTERNATIONAL INC 64 3672 VIASYSTEMS INC 106 3861 AVID TECHNOLOGY INC
24 3576 EMULEX CORP 65 3674 ADVANCED MICRO DEVICES 107 3861 EASTMAN KODAK CO
25 3576 FOCUS ENHANCEMENTS INC 66 3674 ALTERA CORP 108 3861 FUJIFILM HOLDINGS CORP -ADR
26 3576 INTERPHASE CORP 67 3674 AMKOR TECHNOLOGY INC 109 3861 OCE NV -ADR
27 3576 NETWORK EQUIPMENT TECH INC 68 3674 ANADIGICS INC 110 7372 ADOBE SYSTEMS INC
28 3576 PLAINTREE SYSTEMS INC 69 3674 ANALOG DEVICES 111 7372 CA INC
29 3577 AMPEX CORP/DE -CL A 70 3674 ATMEL CORP 112 7372 CADENCE DESIGN SYSTEMS INC
30 3577 CANON INC -ADR 71 3674 BROADCOM CORP -CL A 113 7372 COMPUWARE CORP
31 3577 CREATIVE TECHNOLOGY LTD 72 3674 CELESTICA INC 114 7372 ELECTRONIC ARTS INC
32 3577 FRANKLIN ELECTRONIC PUBLISH 73 3674 CHARTERED SEMICONDUCTR -ADR 115 7372 JL HALSEY CORP
33 3577 GEMPLUS INTL SA -ADR 74 3674 CONEXANT SYSTEMS INC 116 7372 MICROSOFT CORP
34 3577 HAUPPAUGE DIGITAL INC 75 3674 CYPRESS SEMICONDUCTOR CORP 117 7372 ORACLE CORP
35 3577 INTERMEC INC 76 3674 EXAR CORP 118 7372 SUNGARD DATA SYSTEMS INC
36 3577 KEY TRONIC CORP 77 3674 INFINEON TECHNOLOGIES AG-ADR 119 7372 SYBASE INC
37 3577 LEXMARK INTL INC -CL A 78 3674 INTEGRATED DEVICE TECH INC 120 7373 AUTODESK INC
38 3577 LOGITECH INTL SA 79 3674 INTEL CORP 121 7373 FUJITSU LTD -ADR
39 3577 MEDIA 100 INC 80 3674 INTL RECTIFIER CORP 122 7373 MENTOR GRAPHICS CORP
40 3577 PRINTRONIX INC 81 3674 KYOCERA CORP -ADR 123 7373 SAFEGUARD SCIENTIFICS INC
41 3577 RADISYS CORP 82 3674 LINEAR TECHNOLOGY CORP 124 7373 TYLER TECHNOLOGIES INC
42 3577 SCM MICROSYSTEMS INC 83 3674 LSI CORP 125 7373 UNISYS CORP
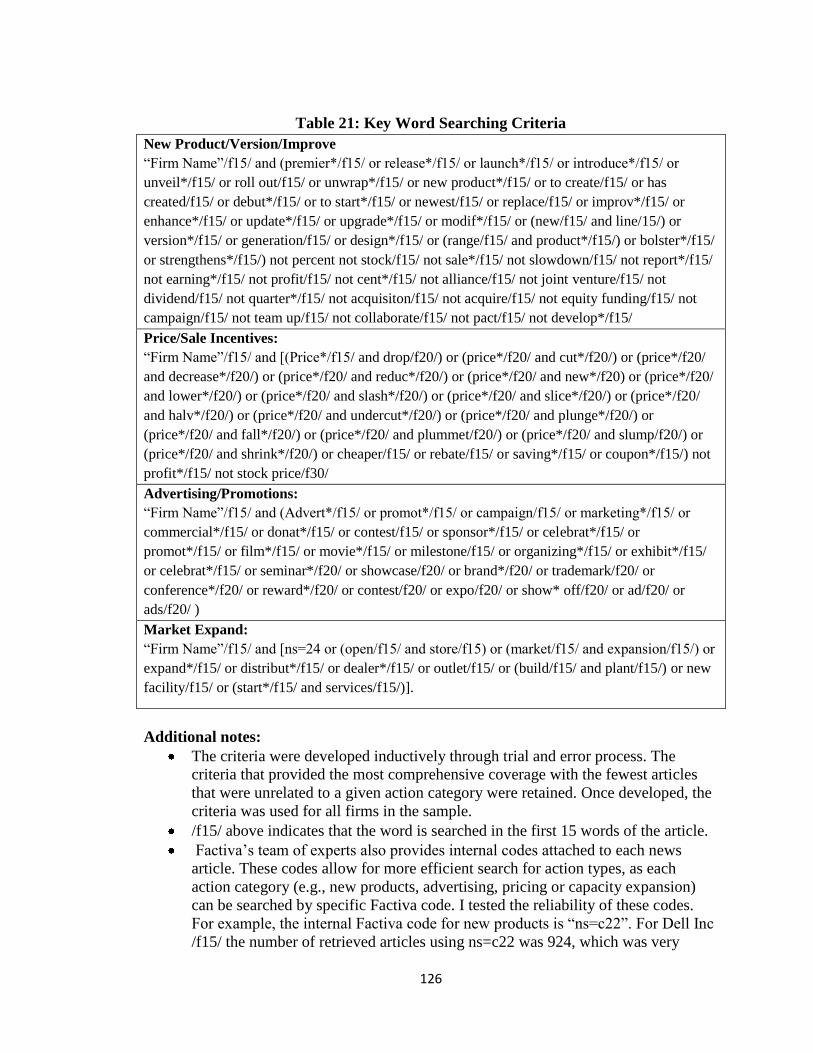
126
Table 21: Key Word Searching Criteria
New Product/Version/Improve
―Firm Name‖/f15/ and (premier*/f15/ or release*/f15/ or launch*/f15/ or introduce*/f15/ or
unveil*/f15/ or roll out/f15/ or unwrap*/f15/ or new product*/f15/ or to create/f15/ or has
created/f15/ or debut*/f15/ or to start*/f15/ or newest/f15/ or replace/f15/ or improv*/f15/ or
enhance*/f15/ or update*/f15/ or upgrade*/f15/ or modif*/f15/ or (new/f15/ and line/15/) or
version*/f15/ or generation/f15/ or design*/f15/ or (range/f15/ and product*/f15/) or bolster*/f15/
or strengthens*/f15/) not percent not stock/f15/ not sale*/f15/ not slowdown/f15/ not report*/f15/
not earning*/f15/ not profit/f15/ not cent*/f15/ not alliance/f15/ not joint venture/f15/ not
dividend/f15/ not quarter*/f15/ not acquisiton/f15/ not acquire/f15/ not equity funding/f15/ not
campaign/f15/ not team up/f15/ not collaborate/f15/ not pact/f15/ not develop*/f15/
Price/Sale Incentives:
―Firm Name‖/f15/ and [(Price*/f15/ and drop/f20/) or (price*/f20/ and cut*/f20/) or (price*/f20/
and decrease*/f20/) or (price*/f20/ and reduc*/f20/) or (price*/f20/ and new*/f20) or (price*/f20/
and lower*/f20/) or (price*/f20/ and slash*/f20/) or (price*/f20/ and slice*/f20/) or (price*/f20/
and halv*/f20/) or (price*/f20/ and undercut*/f20/) or (price*/f20/ and plunge*/f20/) or
(price*/f20/ and fall*/f20/) or (price*/f20/ and plummet/f20/) or (price*/f20/ and slump/f20/) or
(price*/f20/ and shrink*/f20/) or cheaper/f15/ or rebate/f15/ or saving*/f15/ or coupon*/f15/) not
profit*/f15/ not stock price/f30/
Advertising/Promotions:
―Firm Name‖/f15/ and (Advert*/f15/ or promot*/f15/ or campaign/f15/ or marketing*/f15/ or
commercial*/f15/ or donat*/f15/ or contest/f15/ or sponsor*/f15/ or celebrat*/f15/ or
promot*/f15/ or film*/f15/ or movie*/f15/ or milestone/f15/ or organizing*/f15/ or exhibit*/f15/
or celebrat*/f15/ or seminar*/f20/ or showcase/f20/ or brand*/f20/ or trademark/f20/ or
conference*/f20/ or reward*/f20/ or contest/f20/ or expo/f20/ or show* off/f20/ or ad/f20/ or
ads/f20/ )
Market Expand:
―Firm Name‖/f15/ and [ns=24 or (open/f15/ and store/f15) or (market/f15/ and expansion/f15/) or
expand*/f15/ or distribut*/f15/ or dealer*/f15/ or outlet/f15/ or (build/f15/ and plant/f15/) or new
facility/f15/ or (start*/f15/ and services/f15/)].
Additional notes:
The criteria were developed inductively through trial and error process. The
criteria that provided the most comprehensive coverage with the fewest articles
that were unrelated to a given action category were retained. Once developed, the
criteria was used for all firms in the sample.
/f15/ above indicates that the word is searched in the first 15 words of the article.
Factiva‘s team of experts also provides internal codes attached to each news
article. These codes allow for more efficient search for action types, as each
action category (e.g., new products, advertising, pricing or capacity expansion)
can be searched by specific Factiva code. I tested the reliability of these codes.
For example, the internal Factiva code for new products is ―ns=c22‖. For Dell Inc
/f15/ the number of retrieved articles using ns=c22 was 924, which was very

127
similar to the number of articles retrieved using my own criteria – 926 (for the
period 1993 - 1999). I chose to use the Factiva code because the number of
unrelated articles was lower. In the Dell‘s example, from 924 articles generated
using Factiva code, 203 news articles were unrelated with new product
announcements, whereas from 926 articles generated with my own criteria 312
were unrelated (Factiva reports the number of articles in each content area – new
products, political/general news, analysis comments, commodity/financials,
equity markets etc.).
The code used for Market Expand, ns=24 is used in addition to my own criteria,
because it generated additional unique news articles that were not generated using
my own criteria. Ns=24 is assigned to articles that are related to ―production or
service facilities and their capacity...‖

128
VITA
GOCE ANDREVSKI
BIOGRAPHICAL INFORMATION
Date of Birth: July 22, 1970
Place of Birth: Skopje, Macedonia
EDUCATION
M.B.A – Finance; April 2004
Grand Valley State University
Grand Rapids, Michigan
Bachelors in Business Economics, December 1998
University of Saints Cyril & Methodious
Skopje, Macedonia
PUBLISHED CONFERENCE PROCEEDINGS
Andrevski, G., Ferrier, W.J., & Brass, D.J. 2007. Social capital and competitive behavior:
A study of interfirm networks and rivalry among automakers. In George T. Solomon
(Ed.), Proceedings of the Sixty-Seven Annual Meeting of the Academy of Management
(CD), ISSN 1543-8643.
Andrevski, G. 2009. Competitive strategy and the alliance network formation:
Understanding the origins of network positions. In George T. Solomon (Ed.),
Proceedings of the Sixty-Nineth Annual Meeting of the Academy of Management (CD),
ISSN 1543-8643.
MANUSCRIPTS UNDER REVIEW
Andrevski, G., Ferrier, W.J., & Brass, D.J. Social capital and competitive behavior: A
study of interfirm networks and rivalry among automakers. Under second review,
Academy of Management Journal.
Labianca, J., Fairbank, J., Andrevski, G., & Parzen, M. The dream of future aspirations
and its relationship to planned organizational change. Under second review, Strategic
Organization.

129
Chi, L., Ravichandran, T., & Andrevski, G. Digital platforms, network structure and
competitive actions. Revise and resubmit, Information Systems Research.
WORK IN PROGRESS
Andrevski, G., Shaw, J.D., Richard, O., & Ferrier, W. Managerial racial diversity,
competitive actions, and organizational performance. Manuscript in preparation for
Strategic Management Journal.
Andrevski, G. Network structure, strategic entrepreneurship, and firm‘s ability to
systematically outperform rivals. Manuscript in preparation for Strategic Management
Journal
Andrevski, G., Shaw, J.D. Ferrier, W. Entrepreneurial proactiveness, competitive
aggressiveness, and store performance among supermarkets. Manuscript in preparation
for Journal of Management.
Yao, E., & Andrevski, G. The relationship between national culture and alliance
termination: Evidence from the information technology industry. Manuscript in
preparation.
Andrevski, G. & Ferrier, W. Opportunity recognition, opportunity exploitation and the
position in the network structure: Conceptual model and empirical investigation. Data
collection.
PROFESSIONAL PRESENTATIONS
Andrevski, G. 2009. Competitive strategy and the alliance network formation:
Understanding the origins of network positions.
To be presented at the Academy of Management 2009 conference (Chicago)
Ofem, B. & Andrevski, G. 2009. CEO versus top management teams: Performance
differences in the entrepreneurial environment.
To be presented at the Academy of Management 2009 conference (Chicago)
Andrevski, G., Shaw, J., Richard, O., & Ferrier, W. Racial diversity in management,
competitive actions and firm performance.
Presented at the Academy of Management 2008 conference (Anaheim).
To be presented at the Strategic Management Society 2008 conference (Cologne,
Germany).
Andrevski, G., Chen, D., & Yao, E. (alphabetical order). The relationship between
country culture, and alliance termination: Evidences from the information technology
industry.
130
To be presented at the Strategic Management Society 2008 conference (Cologne,
Germany).
Labianca, J., Fairbank, J., Andrevski, G., & Parzen, M. The dream of future aspirations,
and its relationship to planned organizational change.
Presented at the Academy of Management 2008 conference (Anaheim).
Andrevski, G., & Ferrier, W. Toward an ―Austrian‖ theory of sustainable competitive
advantage: The role of value-enhancing actions. Presented at the Competitive Dynamics
Research Workshop 2008 (Helsinki, Finland).
Andrevski, G., Ferrier, W., & Brass, D. Social capital and competitive behavior: A study
of interfirm networks and rivalry among automakers.
Presented at the Academy of Management 2007 conference (Philadelphia).
Presented at the ACAC 2007 conference (Atlanta).
Andrevski, G. & Shaw, J.D. Entrepreneurial orientation, competitive aggressiveness, and
store performance among supermarkets.
Presented at the Academy of Management 2007 conference (Philadelphia).
Andrevski, G., & Damron, J. Toward a universal definition of the construct of
competitive action in competitive dynamics research.
Presented at the Academy of Management 2006 conference (Atlanta).
Ferrier, W. & Andrevski, G. Behavior-eliciting options: Testing the waters prior to
launching a competitive attack on rivals.
Presented at the Strategic Management Society 2006 conference (Vienna, Austria).
Andrevski, G. & Ferrier, W. Inter-firm networks, competitive behavior and performance
in Automotive Industry.
Presented at the Midwest Academy of Management 2006 conference (Louisville).
ACADEMIC EXPERIENCE
Instructor:
Management 301 (spring, 2008); University of Kentucky; Avg. evaluation: 3.7/4.0
Strategic Management 499 (fall 2007); University of Kentucky; Avg. evaluation: 3.8/4.0
Management 301 (spring 2007); University of Kentucky: Avg. evaluation: 3.3/4.0
Management 301 (summer, 2006); University of Kentucky; Avg. evaluation: 4.0/4.0
Management 301 (spring, 2005); University of Kentucky; Avg. evaluation: 3.2/4.0
Managerial Finance (fall, 2003); Grand Valley State University; Avg. evaluation: 3.8/5.0

131
HONORS AND AWARDS
Winner of the 2009 Myrle E. and Verle D. Nietzel Visiting Distinguished Faculty
Program Award –only three doctoral students received this award for the quality of their
doctoral research at the University of Kentucky in 2009.
Winner of the 2008 Provost’s Outstanding Teaching Award – one of only three graduate
students to receive this honor across all colleges at the University of Kentucky in 2008
Max Steckler Fellowship Award for outstanding academic accomplishments
University of Kentucky (2007/2008 and 2008/2009)
Research Challenge Trust Fund II Gatton Doctoral Fellowship
University of Kentucky (2005, 2006, & 2007)
Kauffman Scholarship, AOM-Entrepreneurship Division (2007)
Delta Epsilon Iota Academic Honor Society (2008)
University of Kentucky
Beta Gamma Sigma Academic Honor Society (2003)
Grand Valley State University
International Student Scholarship, Padnos International,
Grand Valley State University (2002)
Certificate for Budget, Fiscal Management and Revenue Forecasting Training Program at
Georgia State University sponsored by USAID and the government of R. Macedonia
(2001)
PROFESSIONAL SERVICE
Ad-hoc reviewer, Academy of Management Journal, 2008
Ad-hoc reviewer, Organization Science, 2008
Ad-hoc reviewer, Journal of Business Research, 2007 - 2008
Session Chair at 2007 and 2008 AOM Conference – Entrepreneurship Division
Reviewer, AOM - Entrepreneurship Division, 2006, 2007, 2008
Reviewer, AOM - Business Policy and Strategy Division, 2006, 2008

132
PROFESSIONAL EXPERIENCE
Center of Applied Energy Research, University of Kentucky (summer 2007)
Research Consultant
Kent County Government Offices, Grand Rapids, MI (spring, summer 2003)
Internship
Merrill Lynch, Private Client Group, Grand Rapids, MI (2002)
Internship
Public Revenue Office, R. of Macedonia (2000 – 2001)
Senior Officer
Professional Basketball Player, FIBA (1992-2000)