
‘Competition generally raises quality.’ ‘I plead guilty to believing in choice and competition’
This PDF is a selection from an out-of-print volume from the National Bureauof Economic Research
Volume Title: The Industrial Organization and Regulation of the SecuritiesIndustry
Volume Author/Editor: Andrew W. Lo, editor
Volume Publisher: University of Chicago Press
Volume ISBN: 0-226-48847-0
Volume URL: http://www.nber.org/books/lo__96-1
Conference Date: January 19-22, 1994
Publication Date: January 1996
Chapter Title: Competition, Fragmentation, and Market Quality
Chapter Author: Thomas H. McInish, Robert A. Wood
Chapter URL: http://www.nber.org/chapters/c8102
Chapter pages in book: (p. 63 - 92)
CORE Metadata, citation and similar papers at core.ac.uk
Provided by Research Papers in Economics

3 Competition, Fragmentation, and Market Quality Thomas H. McInish and Robert A. Wood
3.1 Introduction
A key issue in the Market 2000 debate is whether the fragmentation of trad- ing in individual stocks harms or enhances market quality. The New York Stock Exchange (NYSE) has steadily lost market share to the regional ex- changes, to National Association of Securities Dealers (NASD) broker-dealers, and, more recently, to proprietary trading systems (PTSs) such as Instinet, In- stinet Crossing, Posit, the Arizona Stock Exchange, and Lattice. This increas- ingly effective competition naturally leads to the fragmentation of order flow. Although fragmentation disperses the orders, most competitors are informa- tionally linked, so that all participants observe each others’ trades and quotes within seconds of their execution.?
In the competition for order flow of listed securities, the NYSE is the domi- nant market center because of its natural advantages resulting from its histori- cal position, from dominance in listings, and from a variety of rules that pro- vide it with competitive advantages. In spite of these advantages, the erosion of NYSE market share appears to be increasing, particularly as the PTSs and third-market dealers-especially Madoff and Madoff clones-gain competi- tive strength. Perhaps the most important result of the Market 2000 debate will be the reaction of regulators and legislators to the fragmentation issue.
Branch and Freed (1977) investigate the relative impacts on spreads of in- creased competition and lost volume due to fragmentation of NYSE trading.
Thomas H. McInish is the Wunderlich Professor of Finance at the University of Memphis.
The authors wish to thank the National Association of Securities Dealers for financial support
1. See the report of the General Accounting Office (Bothwell 1993). 2. Some PTSs are not permitted to print their trades on the Consolidated Tape System at present.
Robert A. Wood is distinguished professor of finance at the University of Memphis.
and Ananth Madhavan for helpful suggestions.
63

64 Thomas H. McInish and Robert A. Wood
These authors conclude that competition plays a much larger role in reducing spreads than loss of volume plays in increasing them. Hamilton (1979) notes that off-exchange trading of listed stocks can result in smaller and less volatile bid-ask spreads if effects due to increased competition predominate. If frag- mentation of trading reduces economies of scale, spreads will be larger and more volatile. Hamilton concludes that at the time of his study the net effect of fragmentation is to reduce spreads and returns variance by at most a few percent. It should be stressed that the focus of these papers is on competition between the NYSE and other market centers.
Mendelson (1 987) develops a model showing that fragmentation reduces the expected quantity traded, increases the price variance traders face, and reduces expected gains from trade. But the model also shows that fragmentation may improve the quality of market price signals. Although these theoretical argu- ments show that concentrating orders at one location can reduce spreads, a crucial assumption underlying this result is that the specialist, who is then given a monopoly position, will act altruistically for the public welfare rather than extract monopoly profits from traders.
Several studies have examined related topics. Cohen, Maier, Schwartz, and Whitcomb (1982) examine whether brokerage firms should be allowed to offer in-house execution services or all transactions should be forced instead to go through an exchange. These authors develop a model leading to the conclusion that the ancillary services exchanges offer, such as stabilization and surveil- lance, which have characteristics of public goods, will be undersupplied when fragmentation exists. Cohen and Conroy (1990) examine Securities and Ex- change Commission (SEC) rule 19c-3, which allows off-exchange trading of NYSE stocks listed after April 26, 1979. They find that during 1983 increased fragmentation resulted in lower spreads but greater return variance.
This paper examines the impact of fragmentation on the quality of markets as measured by the bid-ask spread, premium (the difference between the mid- point of the outstanding spread and the price), and volatility (variance of re- turn). The research design employed forms five stock portfolios that are equal in the attributes known to affect spreads and volatility. Firm attributes held equal include size, financial leverage, dividend payout, and market-to-book ratio. Trading characteristics held equal include stock price, market risk, dollar volume of trading, trading frequency, the availability of options for stocks, and membership in the S&P 500.
The key aspect of the research design is that the difference in the fragmenta- tion of orders is maximized across the five portfolios. Hence the portfolios are nearly identical in attributes that affect their spreads, premiums, and volatility, and as different as possible in fragmentation of order share. Examination of the portfolio bid-ask spread, premium, and volatility supports the view that competition between market centers is beneficial for market participants.
The remainder of the paper is divided into seven sections. In section 3.2 the data are described. How fragmentation is measured, the variables used in the study, and how trading quality is measured follow. Next, the linear program-

65 Competition, Fragmentation, and Market Quality
ming (LP) model is described. Section 3.7 presents the findings and the final section the conclusions.
3.2 The Data
Trading data for 1991 for NYSE-listed common stocks were obtained from the Institute for the Study of Security Markets (ISSM) tapes. Balance-sheet data for the three years ending in 1990 were obtained from Compustat files. The following criteria were used in selecting the sample. The data needed for each variable must be present on both the ISSM and Compustat tapes. To mini- mize thin trading problems, only common stocks with at least one thousand trades during the year are considered. To avoid the aberrant spread behavior of low-priced stocks, only stocks with an average price of at least $5 are included in the sample. A total of 980 firms met these criteria.
3.3 Measuring the Fragmentation of Trading
Fragmentation is measured using the Herfindahl index, which is commonly employed in the economics literature to assess the concentration of industries. For this study, the Herfindahl index calculation is based on the dollar volume of trading in NYSE-listed stocks during 1991 on the NYSE, each regional exchange, and Nasdaq. If trading occurs solely on the NYSE, the index value for that stock is 0.0. As trading becomes increasingly dispersed, the index value increases toward 1 .O. Let P, equal the dollar volume on an exchange for stock i divided by the total dollar volume for stock i on all exchanges. And let n, equal the number of exchanges on which stock i trades. Define p , as the summation of P: across n,. Then the Herfindahl index for stock i is calculated as
HERFINDAHLl = (1 - p, ) / ( (n , - 1)pJ.
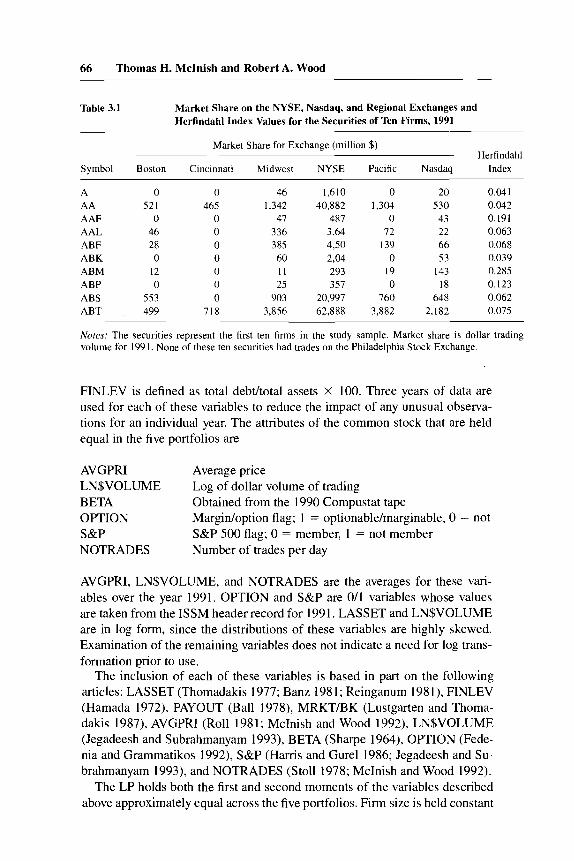
Examples of market shares based on dollar volume and Herfindahl indexes for the first ten securities in our sample are provided in table 3.1. The more dispersed the order flow, the greater the value of the Herfindahl index.
3.4 Equalizing Portfolio Trading Attributes
As noted above, the research design involves forming portfolios with similar attributes so that the spread, premium, and volatility are equalized, except for the influence of fragmentation. The average value for the period 1988-90 of the following firm attributes is held equal in the five portfolios.
LASSET Log of assets FINLEV Financial leverage PAYOUT Dividend payout MRKTBK Market-to-book ratio
66 Thomas H. McInish and Robert A. Wood
Table 3.1 Market Share on the NYSE, Nasdaq, and Regional Exchanges and Herfindah1 Index Values for the Securities of Ten Firms, 1991
Market Share for Exchange (million $)
Symbol Boston Cincinnati Midwest NYSE Pacific Nasdaq Index Herfindahl
A AA AAF AAL ABF ABK ABM ABP ABS ABT
0 52 I
0 46 28 0
12 0
553 499
0 465
0 0 0 0 0 0 0
718
46 1,342
47 336 385 60 I 1 25
903 3,856
1,610 40,882
487 3.64 4.50 2,04 293 357
20,997 62,888
0 20 1,304 530
0 43 72 22
I39 66 0 53
19 143 0 18
760 648 3,882 2.182
0.041 0.042 0.191 0.063 0.068 0.039 0.285 0.123 0.062 0.075
Norest The securities represent the first ten firms in the study sample. Market share is dollar trading volume for 1991. None of these ten securities had trades on the Philadelphia Stock Exchange.
FINLEV is defined as total debdtotal assets X 100. Three years of data are used for each of these variables to reduce the impact of any unusual observa- tions for an individual year. The attributes of the common stock that are held equal in the five portfolios are
AVGPRI Average price LN$VOLUME BETA OPTION S&P NOTRADES
Log of dollar volume of trading Obtained from the 1990 Compustat tape Margidoption flag; 1 = optionable/marginable, 0 = not S&P 500 flag; 0 = member, 1 = not member Number of trades per day
AVGPRI, LN$VOLUME, and NOTRADES are the averages for these vari- ables over the year 1991. OPTION and S&P are 011 variables whose values are taken from the ISSM header record for 1991. LASSET and LN$VOLUME are in log form, since the distributions of these variables are highly skewed. Examination of the remaining variables does not indicate a need for log trans- formation prior to use.
The inclusion of each of these variables is based in part on the following articles: LASSET (Thomadakis 1977; Banz 1981; Reinganum 198 I ) , FINLEV (Hamada 1972), PAYOUT (Ball 1978), MRKT/BK (Lustgarten and Thoma- dakis 1987), AVGPRI (Roll 198 1 ; McInish and Wood 1992), LN$VOLUME (Jegadeesh and Subrahmanyam 1993), BETA (Sharpe 1964), OPTION (Fede- nia and Grammatikos 1992), S&P (Harris and Gurel 1986; Jegadeesh and Su- brahmanyam 1993), and NOTRADES (Stoll 1978; McInish and Wood 1992).
The LP holds both the first and second moments of the variables described above approximately equal across the five portfolios. Firm size is held constant

67 Competition, Fragmentation, and Market Quality
by equalizing the log of assets. Holding the market-to-book ratio equal ensures that the growth expectations in all portfolios are the same. Note that this proce- dure results in holding market capitalizations approximately equal as well. Each of the trading attributes held equal is known to affect both the bid-ask spread and volatility. Equalizing the trading attributes as measured during the test year (with the exception of beta) rather than during a prior period better controls for the influence of these variables on fragmentation.
Table 3.2 presents the mean, standard deviation, minimum, and maximum values for each variable for the entire sample.
3.5 Trading Quality Measurement
Trading quality for the five portfolios is measured with three variables: bid- ask spread (SPREAD) in cents; PREMIUM, as measured by the absolute value of the difference between the midpoint of the outstanding NYSE bid and ask and the trade price; and VOLATILITY, calculated as the variance of the minute-by-minute returns for each portfolio over the year. SPREAD is formed by first obtaining the average for each stock in the sample over the year and then obtaining the weighted average within each portfolio where the weight is the LP solution level (discussed below). PREMIUM is calculated in the same manner. VOLATILITY is calculated by first forming a minute-by-minute re- turn index for each portfolio (weighting the return for each stock by its LP solution level) and then calculating the standard deviation of the return series over the year.
3.6 Linear Programming Model
Before describing the LP model more formally, it may be helpful to provide an intuitive description. The LP forces the sample firms into five portfolios so that the attributes noted above are held equal in each portfolio. Both the mean
Table 3.2 Sample Statistics for Each Variable for the Entire Sample (N = 980)
Standard Variable Mean Deviation Minimum Maximum
LASSET FINLEV PAY OUT MRKTBK AVGPRI LN$VOLUME BETA OlTION S&P NOTRADES HERFINDAHL
7.20 6.78
49.97 2.06
31.46 12.18 1.03 0.54 0.61
122.91 0.09
1.71 17.01 57.65
1.43 24.20
2.81 0.41 0.50 0.49
196.83 0.09
2.81 0.00 0.00 0.02 6.63
-2.30 -0.10
0.00 0.00 4.29 0.00
12.32 94.79
445.94 9.3 1
44 1.20 17.73 2.70 1 .oo 1 .oo
37,132.57 0.99
68 Thomas H. McInish and Robert A. Wood
and the standard deviation of the attributes are held equal so that the LP will not, for example, have one extreme portfolio with very large and very small firms while the other extreme portfolio has all average-sized firms. Although the means of firm size would be equal across portfolios in this case, the size composition of firms in the portfolios would vary considerably. Holding equal the standard deviation of firm size in the portfolios alleviates this concern.
In considering the number of variables included, note that multicollinearity, which may be a significant problem when adding variables to any variant of the general linear model, is not of concern with the LP model. Although each added variable narrow5 the reach of the objective function somewhat, this is not a problem for most research designs. Thus, adding variables that might be considered overcontrolling, for example, using both the market-to-book ratio and the dividend payout ratio to control for growth, will not compromise the research. However, increasing the number of constraints may lead to spreading the sample firms across portfolios as discussed below.
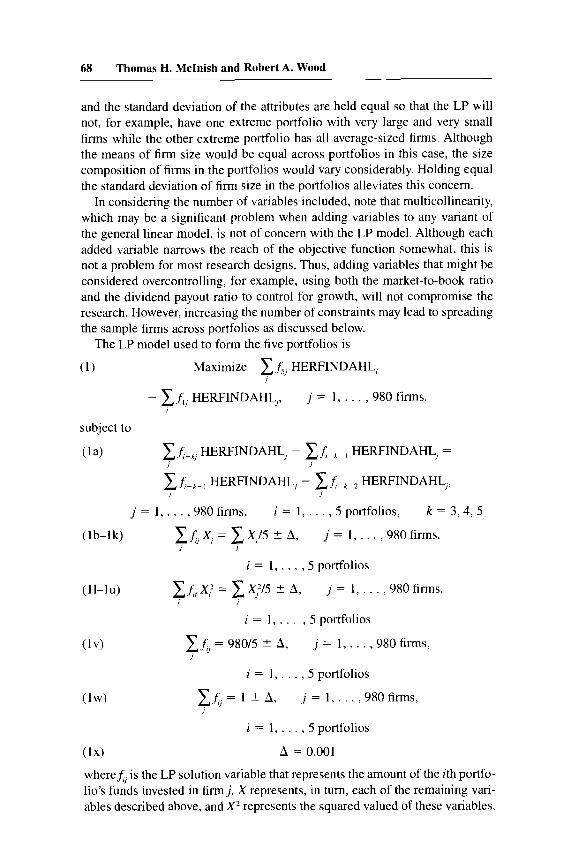
The LP model used to form the five portfolios is
(1) Maximize c f5, HERFINDAHL, I
- c f , , HERFINDAHLJ, j = 1, . . . ,980 firms. I
subject to
( 1 4 ci-kJ HERFINDAHL, - HERFINDAHL, =
HERFINDAHL, - c i-k-2 HERFINDAHL,, I J
c J I
j = 1 , . . . ,980 firms, i = 1, . . . ,5 portfolios, k = 3,4,5
(lb-lk) cJrJ XJ = c XJ/5 -+ A, j = 1, . . . ,980 firms, J I
i = 1,. . . ,5 portfolios
(11-lu) c fifX,’ = X,% 2 A, j = 1, . . . ,980 firms, I I
i = 1 , . . . , 5 portfolios
(1v) ELJ = 98015 2 A, j = 1,. . . ,980 firms, J
i = 1 , . . . , 5 portfolios
(1w) xi, = 1 -t A, J = 1 , . . . ,980 firms, J
i = 1,. . . , 5 portfolios
( 1 4 A = 0.001
whereiJ is the LP solution variable that represents the amount of the ith portfo- lio’s funds invested in firm j , X represents, in turn, each of the remaining vari- ables described above, and X2 represents the squared valued of these variables.

69 Competition, Fragmentation, and Market Quality
The objective function of the LP given in equation (1) maximizes the differ- ence between the value of HERFINDAHL in portfolio 1 and the value of HER- FINDAHL in portfolio 5. Hence, one extreme portfolio will have the least frag- mentation of its trading, while the other extreme portfolio will have the most. Equation (la) holds the distance between the HERFINDAHL values of the intervening portfolios equal. Equations (lb-1 k) hold the first moments of the control variables equal, while equations (11-lu) hold the second moments equal. Equation (lv) holds the number of stocks in each portfolio equal, while equation ( lw) forces every stock into the solution.
As table 3.3 shows, the LP achieves the desired goal. The resulting portfolios are nearly identical in attributes that affect their trading quality, while the mea- sure of trading fragmentation (HERFINDAHL) is spread evenly across the portfolios. The difference in the level of HERFINDAHL across the five portfo- lios is maximized. With these portfolios, we can isolate the effect of fragmen- tation on portfolio trading characteristics.
Table 3.3 Statistics for Sample Portfolios: Mean and Standard Deviation (below)
Portfolio
1 2 3 4 5
HERFINDAHL 0.138 0.089
LASSET 7.20 1.70
FINLEV 26.17 17.00
PAYOUT 49.90 57.66
MRKTlBK 2.06 1.43
AVGPRI 31.41 24.24
LN$VOLUME 15.21 1.60
BETA 1.03 0.42
OPTION 0.54 0.50
S&P 0.61 0.49
NOTRADES 122.96
N 196.62 208
0.114 0.089 0.064 0.032 1.20 7.22 1.73 1.62
26.12 26.78 17.06 17.03 49.98 50.06 57.57 57.60 2.06 2.06 1.43 1 .43
3 1.40 3 1.52 24.23 24.14 15.20
1.64 1.03 0.42 0.54 0.50 0.61 0.49
122.92
15.22 1.61 1.03 0.41 0.54 0.50 0.61 0.49
22.91 196.59 196.86 211 210
0.065 0.017 7.21 1.71
26.83 16.95 50.08 57.58 2.06 I .43
31.47 24.20 15.20
1.72 1.03 0.41 0.54 0.50 0.61 0.49
22.94 196.85 215
0.040 0.012 7.19 1.76
26.78 16.98 49.88 57.65 2.06 1.43
3 1.46 24.16 15.17
1.88 1.03 0.41 0.54 0.50 0.61 0.49
122.67 196.74 205
Notes: The means and standard deviations of each variable for each of the five portfolios formed using the LP model are presented. The LP separates the Herfindahl index values as much as pos- sible across the five portfolios. At the same time, it holds the values of each of the other variables approximately equal across the five portfolios.

70 Thomas H. McInish and Robert A. Wood
The LP solution technique chosen results in continuous solution values rather than integer solution values. With an integer solution, firms would be totally in one of the five portfolios. Finance theory permits a continuous solu- tion wherein a firm may be spread over more than one portfolio, since it is realistic to form portfolios in this manner. Since the LP formulation is basically an assignment problem, the solution values naturally gravitate to either 0.0 or 1.0 as long as the constraints are not too binding, so that relatively few firms are spread across portfolios. In the solution obtained, 88 percent of the nonzero solution values are 1.0. The results were replicated by rounding the solution values of 0.5 and above to 1 .O and those below 0.5 to 0.0 to ensure that signifi- cant bias did not result.
This low level of intermediate solution values is fortunate, since the size of the problem makes integer programming computationally intractable. The need to have a relatively low number of solution values between 0.0 and 1.0 arises because, as the number of intermediate solution values increases, the intent of the equality constraints is being defeated. To illustrate, if a $10 billion firm has a solution value of 0.5 for portfolio 1 and 0.5 for portfolio 2, the size equality constraints will indicate that a $5 billion firm is being included in each portfolio.
If strict equality were specified in the LP constraints, no feasible solution could be obtained. Hence, each equality constraint is held equal to 0.0 plus or minus 0.1 percent. Thus, rather than obtaining exactly 1.0 for most nonzero solution values, we obtain 0.999 or 1.001.
3.7 Why Use LP to Form Portfolios
The 980 sample stocks could be analyzed by applying a form of the general linear model to the individual trades and quotes. Three concerns arise from this procedure. First, the signal obtained in this manner is very noisy as a result of bid-ask bounce and the high level of idiosyncratic risk in each stock. Sec- ond, the functional form of the linear model must be specified. Third, multicol- linearity among the dependent variables may confound the results. Each of these problems is minimized or avoided with the use of LP to form portfolios.
While portfolios are often used to avoid the noisy signal problem, the typical approach of ranking on a variable such as market capitalization does not avoid multicollinearity. To illustrate the problems that result from the traditional pro- cedure, data for market capitalization (EQUITY), MRKTBK, PAYOUT, AVG- PRI, and BETA are averaged for 3,995 firms on the Compustat Plus tile for the three years ending in 1991. The Spearman correlations of EQUITY with the remaining variables are MRKTBK 0.30195, PAYOUT 0.56676, AVGPRI 0.86729, and BETA 0.10597. All of these correlation coefficients are signifi- cant at the 0.0001 level. While data for spreads, trading frequency, and stock price were not available for this sample, we know from other research that these variables are highly correlated with market capitalization. Thus, ranking

71 Competition, Fragmentation, and Market Quality
on market capitalization introduces considerable correlation in these variables across the portfolios. It is easy to see that many research designs will be con- founded by these correlations. The LP approach controls this source of bias in portfolio formulation. While portfolios are often used to avoid the noisy signal problem, the typical approach of ranking on a variable such as market capital- ization does not avoid multicollinearity. The determination of the number of portfolios to be formed involves a judgment between the advantage of reducing the noise of the signal in each portfolio by increasing it size versus the advan- tage of increasing the number of observations.
3.8 Findings
Table 3.4 repeats the values of HERFINDAHL for the five portfolios and reports the levels of SPREAD, PREMIUM, and VOLATILITY as well. The values of the liquidity and spread measures for each of the five portfolios are also presented graphically in figure 3.1. Note that both SPREAD and PRE- MIUM tend to decrease as fragmentation increases. The Pearson correlation coefficients presented in table 3.4 show that these relationships are significant at the 0.05 level. Volatility decreases from a level of 0.052 for portfolio 5 , which has the least order flow fragmentation, to portfolio 3, but then increases for portfolios 1 and 2 , reaching 0.073. The correlation between portfolio vola- tility and the Herfindahl index is not statistically significant.
Although the observed range of spread across the five portfolios is only 0.6 cent, this evidence nevertheless supports the hypothesis that competition be- tween market centers, which, if effective, naturally results in fragmentation of the order flow, reduces both SPREAD and PREMIUM, thereby benefiting mar- ket participants. Further, VOLATILITY is not found to be affected signifi- cantly by fragmentation.
Table 3.4 Statistics for Analysis of the Effect of Trading Fragmentation
Portfolio HERFINDAHL SPREAD PREMIUM VOLATILITY ~~
1 0.138 0.241 0.059 0.073 2 0.114 0.239 0.058 0.062 3 0.089 0.244 0.060 0.035 4 0.065 0.244 0.061 0.038 5 0.040 0.247 0.064 0.052
Pearson correlation -0.9018 -0.8929 0.6366 coefficient of HERFINDAHL (0.036) (0.041) (0.248) (confidence level in parentheses)
Nore: The means of Herfindahl index (HERFINDAHL), spread (SPREAD), premium (PRE- MIUM), and portfolio variance (VOLATILITY) are provided for each of the five sample port- folios.

72 Thomas H. McInish and Robert A. Wood
Liquidity Premium (Cents) 71
Spread (Cents
6
55
5 040 065 089 114 138
25
24.5
24
23.5
23
Herfindahl Index = Avg Liquidity Prem Avg Bid-Ask Spread
Fig. 3.1 Average spread and liquidity premium of five portfolios with varying levels of off-board market share
3.9 Conclusion
In the Securities Reform Act of 1975, Congress mandated an increase in competition between the regional exchanges, Nasdaq, and the NYSE for NYSE-listed securities. The NYSE has consistently argued that such competi- tion fragments the order flow to the detriment of market quality. This study examines the NYSE concern by forming five portfolios of NYSE-listed com- mon stocks. These five portfolios are nearly identical in attributes known to affect trading quality but have the maximum possible difference in the frag- mentation of trading across competing market centers. These five portfolios isolate the effect of fragmentation on market quality.
The findings show that bid-ask spreads and premiums (the difference be- tween the midpoint of the outstanding spread and the price) are significantly reduced by competition. This result is consistent with evidence reported by Branch and Freed (1977), Hamilton (1979), and McInish and Wood (1992) that competition reduces spreads. Volatility shows no significant change as fragmentation increases. Hence the traditional view that competition benefits

73 Competition, Fragmentation, and Market Quality
society is found to apply to securities trading. This issue will be of continuing interest, since the General Accounting Office (Bothwell 1993) has urged the SEC to continue to monitor the issue of market fragmentation.
References
Ball, Ray. 1978. Anomalies in relationships between securities’ yields and yield- surrogates. Journal of Financial Economics 6: 103-26.
Banz, Rolf W. 1981. The relationship between return and market value of common stock. Journal of Financial Economics 9:3-18.
Bothwell, James L. 1993. Securities markets: SEC actions needed to address market fragmentation issues. In Oversight Hearings on the Future of the Stock Market Focus- ing on the Results of a GAO Study on Market Fragmentation before the Subcommittee on Telecommunications and Finance of the House Committee on Energy and Com- merce. 103d Cong., 1st sess., 1993.
Branch, Ben, and Walter Freed. 1977. Bid-ask spreads on the Amex and the Big Board. Journal of Finance 32:159-63.
Cohen, Kalman, J., and Robert M. Conroy. 1990. An empirical study of the effect of rule 19c-3. Journal of Law and Economics 33:277-305.
Cohen, Kalman J., Steven F. Maier, Robert A. Schwartz, and David K. Whitcomb. 1982. An analysis of the economic justification for consolidation in a secondary securities market. Journal of Banking and Finance 6: 1 17-36.
Fedenia, Mark, and Theoharry Grammatikos. 1992. Options trading and the bid-ask spread of the underlying stocks. Journal of Business 65:335-5 1.
Hamada, Robert S. 1972. The effect of the firm’s capital structure on the systematic risk of common stock. Journal of Finance 27:435-52.
Hamilton, James L. 1979. Marketplace fragmentation, competition, and the efficiency of the stock exchange. Journal of Finance 34:171-87.
Harris, Lawrence, and Eitan Gurel. 1986. Price and volume effects associated with changes in the S&P 500: New evidence for the existence of price pressures. Journal of Finance 4:815-30.
Jegadeesh, Narasimhan, and Avanidhar Subrahmanyam. 1993. Liquidity effects of the introduction of the S&P SO0 index futures contract on the underlying stocks. Journal of Business 66: 17 1-87.
Lustgarten, Steven, and Stavros Thomadakis. 1987. Mobility barriers and Tobin’s q. Journal of Business 60:519-37.
McInish, Thomas H., and Robert A. Wood. 1992. An analysis of intraday patterns in bidask spreads for NYSE stocks. Journal of Finance 47:753-64.
Mendelson, Haim. 1987. Consolidation, fragmentation, and market performance. Jour- nal of Financial and Quantitative Analysis 22: 189-207.
Reinganum, Marc R. 198 1. Misspecification of capital asset pricing: Empirical anoma- lies based on earnings’ yield and market values. Journal of Financial Economics
Roll, Richard. 1981. A possible explanation of the small firm effect. Journal of Fi-
Sharpe, William F. 1964. Capital asset prices: A theory of market equilibrium under
Stoll, Hans. 1978. The pricing of security dealer services: An empirical study of
9: 19-46.
nance 36:879-88.
conditions of risk. Journal of Finance S:309-27.
NASDAQ stocks. Journal of Finance 33:1153-72.
74 Thomas H. McInish and Robert A. Wood
Thomadakis, Stavros. 1977. A value-based test of profitability and market structure. Review of Economics and Statistics 59: 179-85.
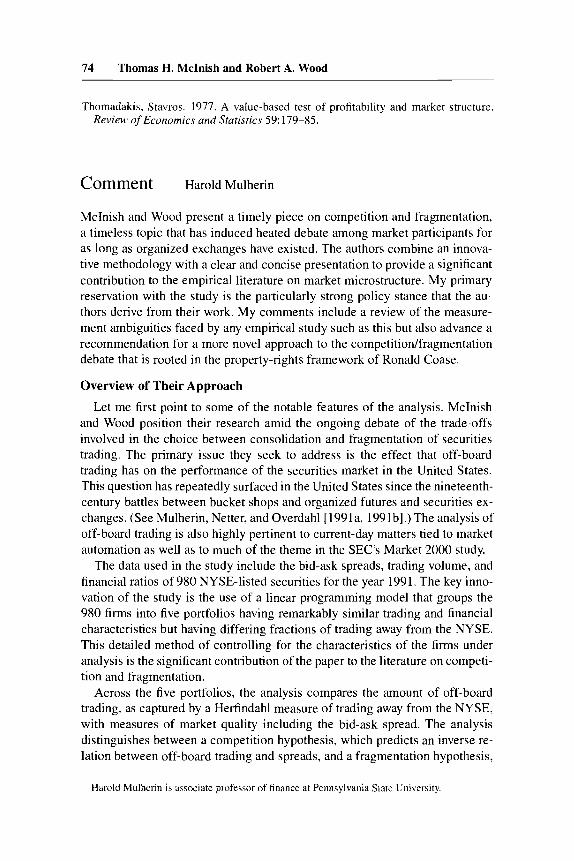
Comment Harold Mulherin
McInish and Wood present a timely piece on competition and fragmentation, a timeless topic that has induced heated debate among market participants for as long as organized exchanges have existed. The authors combine an innova- tive methodology with a clear and concise presentation to provide a significant contribution to the empirical literature on market microstructure. My primary reservation with the study is the particularly strong policy stance that the au- thors derive from their work. My comments include a review of the measure- ment ambiguities faced by any empirical study such as this but also advance a recommendation for a more novel approach to the competitiodfragmentation debate that is rooted in the property-rights framework of Ronald Coase.
Overview of Their Approach
Let me first point to some of the notable features of the analysis. McInish and Wood position their research amid the ongoing debate of the trade-offs involved in the choice between consolidation and fragmentation of securities trading. The primary issue they seek to address is the effect that off-board trading has on the performance of the securities market in the United States. This question has repeatedly surfaced in the United States since the nineteenth- century battles between bucket shops and organized futures and securities ex- changes. (See Mulherin, Netter, and Overdahl [ 1991a, 1991 b].) The analysis of off-board trading is also highly pertinent to current-day matters tied to market automation as well as to much of the theme in the SEC’s Market 2000 study.
The data used in the study include the bid-ask spreads, trading volume, and financial ratios of 980 NYSE-listed securities for the year 1991. The key inno- vation of the study is the use of a linear programming model that groups the 980 firms into five portfolios having remarkably similar trading and financial characteristics but having differing fractions of trading away from the NYSE. This detailed method of controlling for the characteristics of the firms under analysis is the significant contribution of the paper to the literature on competi- tion and fragmentation.
Across the five portfolios, the analysis compares the amount of off-board trading, as captured by a Herfindahl measure of trading away from the NYSE, with measures of market quality including the bid-ask spread. The analysis distinguishes between a competition hypothesis, which predicts an inverse re- lation between off-board trading and spreads, and a fragmentation hypothesis,
Harold Mulherin is associate profersor of finance at Pennsylvania Statc University,

75 Competition, Fragmentation, and Market Quality
which predicts that a larger Herfindahl measure will lead to wider spreads. The authors find that the portfolio with the greatest Herfindahl measure of off- board trading has a spread that is 0.6 cent narrower than the portfolio that has the least amount of off-board trading. They conclude that off-board trading advances competition and that the SEC and Congress should take efforts to facilitate more dispersion of trading across securities markets.
Measurement Issues
Although the analysis in the paper is quite sound, there are several measure- ment issues that temper the policy implications that can be drawn from the results. A query that immediately comes to mind regards the economic sig- nificance of the results. While the authors find statistical significance, the dif- ference between the market quality of the two most extreme portfolios is still only 0.6 cent per share. Given the bid-ask spread of 24.1 cents per share for the most competitive portfolio, the savings to investors is around 2 percent. For the average security in the sample, which has 123 trades per day, this trans- lates into a savings of 74 cents per day. Certainly one can quibble with the economic significance of these numbers, but an even more telling benchmark comes from Charles Lee’s (1993, 1011) analysis of off-board trading in NYSE listings, which finds that “the price for non-NYSE trades is .7 to 1 cent per share less favorable than that for adjacent NYSE trades.” Hence, even if Mcln- ish and Wood have successfully measured the effect of competition on NYSE market quality, it is not obvious that mandated increases in off-board trading will improve investor welfare. Indeed, welfare may decline if the trade execu- tion of the regionals and Nasdaq is not as favorable as that of the NYSE.
A second concern that I have with the empirical design is the ambiguous interpretation of the Herfindahl measure used in the study. The authors present the measure as a clean proxy for both fragmentation and competition, being of the opinion that fragmentation and competition are pure synonyms. How- ever, the Herfindahl formula suggests a less-than-perfect relation between frag- mentation and competition. Consider table 3C. 1 , an example of three securi- ties, all with 75 percent of their volume on the NYSE but with varying fractions of trading at competing venues. The example holds specialist compe- tition at 25 percent but varies the dispersion of this competition across dif-
Table 3C.l Example of the Herfindahl Index
Fraction of Trading
Security NYSE Midwest Pacific Nasdaq Herfindahl
1 7 5 .25 0 0 .60 2 .75 ,125 ,125 0 .34 3 .75 ,0833 ,0833 ,0833 .24

76 Thomas H. McInish and Robert A. Wood
fering numbers of alternative exchanges. In doing so, the Herfindahl index var- ies noticeably. Mechanically, therefore, fragmentation and competition are not perfect substitutes. More important, the given numbers raise thorny issues of a kind that have plagued the Justice Department as to whether specialist compe- tition is greater when one or many competitors have 25 percent of the market.
An even more problematic aspect of interpreting the Herfindahl variable as a proxy for specialist competition stems from the lack of data on limit orders and floor trading activity in the sample of securities. Since the initial insights of Demsetz (1 968), microstructure theory has recognized that one factor keeping specialists honest is the heated competition on the floor of the NYSE itself. 1 am concerned that such internal competition is likely to be correlated with the off-board trading measured by the Herfindahl index and that the reported association between the Herfindahl and spreads may be driven in whole or part by the incidence of limit orders and floor trading activity.
Similar missing-variable arguments can be made regarding the emphasis of bid-ask spreads as the measure of market quality. We know that market quality is multidimensional and includes, in addition to spreads, the depth of quotes and fraction of within-the-spread executions. Without the consideration of these aspects of market quality, the authors cannot unambiguously say that added off-board trading improves quality. It is possible that off-board trading lessens depth and thereby detracts from market quality.
Sample selection and endogeneity issues give further weight to the point that the reported results do not lead to the causal inference that added off-board trading will improve market quality. In spite of the careful work of the authors, their study still faces sample-selection biases because their data requirements lead them to analyze only the hi-cap segment of the NYSE. But what if the data were available to study all NYSE listings? I wager this would strengthen the results, as the second-tier NYSE firms likely have wider spreads and less off-board trading. But certainly we would not interpret the results from such extended analysis to say that more off-board trading will lead to narrower spreads, as we know that the selection of trading location is endogenously chosen in the market.
In the United States, there is a standard life cycle of a security from an OTC setting of many dealers, to the NYSE environment of a single specialist to a hybrid system of specialists and many dealers. Post-Big Bang London also is experiencing such a hybrid life cycle (Waters [ 19921). For the purpose of the present study, this endogenous life cycle places further clouds over the inter- pretation of the Herfindahl measure. Does it really represent competition or are the off-board trading venues merely cream-skimming bucket shops? Blume and Goldstein (1 99 1) as well as a companion piece by McInish and Wood (1992) find that the regionals and Nasdaq free ride at least 90 percent of the time on trading in NYSE-listed securities. This free riding may impede the depth and absolute level of quotes. Such effects on market quality cannot be captured in McInish’s and Wood’s cross-sectional analysis, thus tempering the

77 Competition, Fragmentation, and Market Quality
authors’ conclusion that increased off-board trading will improve overall mar- ket quality.
Opening the Black Box
Moving from specific measurement issues to a more general perspective, I think the authors must broaden the paradigm underlying their analysis. The authors are deeply rooted in the “NYSE-as-a-monopoly” viewpoint that strongly influenced economists at least up through May Day in 1975. This monopoly paradigm has gone the way of fixed commissions due to the practi- cal fact of the many domestic and global alternatives for trading NYSE listings. From a more intellectual standpoint, the monopoly label for organized finan- cial exchanges has been rendered obsolete by the property-rights model of Ronald Coase and others, which tells us not to attach the tag of monopoly to a complex organization simply because we do not fully understand it.
Coase (1988, 7-10) himself admits that many economists still assume that the rules of organized exchanges foment market power. But Coase chastises his colleagues for this presumption and notes that, for anything approaching perfect competition to exist, an intricate system of rules is required. For Coase, the term “rules” is synonymous with property rights and is quite distinct from SEC regulations.
In the Coasian spirit, I think that any perceived problems inherent in the competitiodfragmentation debate can be mitigated via the allocation of prop- erty rights rather than by the extension of the arm of the SEC. What I have in mind is placing more solid property rights to listing in the hands of the listing corporations. Both initial listing decisions as well as additional trading loca- tions would be at the discretion of corporations and would not be co-opted by the SEC’s grant of unlisted trading privileges. As Coase has taught us, this clear definition of property rights in listing would internalize the cost-benefit trade-offs involved in the competitiodfragmentation debate and would lead to the optimal number of trading locations for all publicly traded securities. The nice thing about the property-rights approach is that the amount of off-board trading for each security is determined by the invisible hand of the market rather than the visible, and clumsy, hand of the SEC.
References
Blume, Marshall E., and Michael A. Goldstein. 1991. Differences in Execution Prices among the NYSE, the Regionals, and the NASD. Working paper, Wharton School, University of Pennsylvania, September.
Coase, R. H. 1988. The F i m , the Market, and the Law. Chicago: University of Chi- cago Press.
Demsetz, Harold. 1968. The Cost of Transacting. Quarterly Journal of Economics 82 (February): 33-53.
Lee, Charles. 1993. Market Integration and Price Execution for NYSE-Listed Securi- ties. Journal ofFinance 48 (July): 1009-38.

78 Thomas H. McInish and Robert A. Wood
McInish, Thomas H., and Robert A. Wood. 1992. Price Discovery, Volume and Re- gionalmhird Market Trading. Working paper, Memphis State University, April.
Mulherin, J. Harold, Jeffry M. Netter, and James A. Overdahl. 1991a. Prices Are Prop- erty: The Organization of Financial Exchanges from a Transaction Cost Perspective. Journal of Law and Economics 34, part 2 (October): 591-644.
. 1991b. Who Owns the Quotes? A Case Study into the Definition and Enforce- ment of Property Rights at the Chicago Board of Trade. Review of Futures Markets
Waters, Richard. 1992. SE Acts on Small Company Shares. Financial Times, October 10 (1): 108-29.
15, 21.
Comment John C. Coffee, Jr.
Wood and McInish ask an important question: Does the fragmentation of trad- ing in multiply listed stocks harm or enhance market quality? But this is not the question they answer. Rather, they answer that in their study competition among markets seems to be producing slightly tighter spreads and lower pre- miums without seriously affecting volatility. This is not fully responsive to their own question, because more is involved in the assessment of market qual- ity. A focus on the average spread can be misleading, particularly if any aggre- gate improvement in the average bid-ask spread comes at significant expense to a discrete class of market participants (here, small shareholders). Because there is evidence of such injury to at least one class of investors and because the Wood and McInish study itself reveals only a very modest improvement in price spreads, the result is an uncertain trade-off between aggregate efficiency and distributive equity. In this light, it is far from self-evident that public policy should permit the kind of nonprice competition by which emerging competi- tors in the third market and on regional exchanges seem to be diverting order flow from the New York Stock Exchange (NYSE).
The first part of this brief comment examines this evidence that some invest- ors systematically lose as the result of contemporary intermarket competition, and the second part turns to the problematic character of competition based on payments for order flow. Although payments for order flow are not addressed in Wood's and McInish's paper, to omit this topic from a discussion of competi- tion among market centers is frankly like casting Humlet without the prince of Denmark. Indeed, the prevalence of nonprice competition (such as rebates for order flow), when coupled with the problem of informed trading, may explain why intermarket competition has yielded only the scant improvement in bid- ask spreads and Wood and McInish find.
John C. Coffee, Jr., is the Adolf A. Berle Professor of Law at Columbia University Law School.

79 Competition, Fragmentation, and Market Quality
Who Wins and Who Loses from Intermarket Competition
The magnitude of the price effect shown by the Wood and McInish data seems very modest. Comparing their portfolio 5 (which has the least order flow fragmentation) with their portfolio 1 (which has the most), one finds that the quoted spread falls by 0.6 cent and the liquidity premium declines by 0.5 cent. Although this change is certainly in the desired direction, such a slight im- provement in market efficiency may be thought insufficient to justify the possi- bility that some classes of customers systematically lose when their transac- tions are diverted away from the primary market (NYSE or American Stock Exchange [AMEX]) to other markets. A number of recent studies reach essen- tially this conclusion, each stressing different evidence. Lee (1993) finds that in 1988 and 1989 “[tlhe average price difference between the NYSE and matched off-Board trades is 0.7 to 1 cent per share.” Examining liquidity pre- miums, he further reports “that off-Board trades generally involve higher exe- cution costs in the order of 0.5 to 1.5 cents per share.” The most illuminating data uncovered by Lee emerges when he breaks down the average liquidity premium by trade size. On trades of one hundred to four hundred shares (the typical trade of small retail customers), the average excess liquidity premium paid for off-board trades in matched samples in 1989 was 1.22 cents (and 1.58 and 2.65 cents per share when the trades were effected on the NASD or on the Cincinnati exchange, respectively). Yet, on larger trades above two thousand shares, some regional exchanges (most notably the Midwest and Pacific) of- fered significantly better executions than the NYSE. Thus, even if Wood and McInish are entirely correct in their conclusion that competition among market centers is reducing the average bid-ask spread, it appears that some rival mar- ket centers are besting the NYSE by offering superior execution services (chiefly for midsized blocks), but others are offering inferior executions while diverting order flow by means of nonprice competition.
Lee’s study has received some methodological criticism (on the ground that it does not adequately distinguish market and limit orders) and is subject to the further objection that its 1988 and 1989 data are now out-of-date because some third-market dealers have subsequently introduced price-improvement programs under which they will in certain circumstances execute transactions between their own bid and asked quotations. Still, later studies have shown an even greater disparity between NYSE and off-board execution in the same stock. Blume and Goldstein (1993) employ 1990 data to examine the extent of price improvement on the NYSE versus other markets. Similarly to Lee, they find the NYSE to significantly outperform rival markets on trade sizes below five hundred shares, but to lag behind some other markets on transactions in the five-hundred- to three-thousand-share range. Mayer and Leigh (1991) re- port that daily extreme prices (highs and lows) are significantly more likely to be off-board trades than mere chance would dictate. If one accepts their assumption that the daily highs are disproportionately purchases by public cus-

80 Thomas H. McInish and Robert A. Wood
tomers and the daily lows are sales by them, this finding further corroborates the inferiority of off-board executions. Finally and most importantly, Fialkow- ski and Petersen (1992) use a data set consisting of the orders sent to all ex- changes from a major retail brokerage firm through automated routing systems during two days in 1991. They report that the expected price improvement per trade was 3 cents per share higher on the NYSE than on off-board transactions. This result (which is three times above Lee’s estimate of the disparity) may result both from the fact that they consider price improvement in one-eighth- point markets’ and because a retail brokerage firm will chiefly be routing smaller orders.2
Another recent form of study has been to compare the bid-ask spreads on Nasdaq and exchange-listed common stocks, after controlling for differences in market capitalization. Grouping stocks into decile portfolios by market capi- talization, Goldstein (1993) finds that all stock exchanges had significantly tighter price spreads (both in absolute terms and as a percentage of price) than Nasdaq in 1990. Indeed, he reports that 99 percent of the stocks traded on the exchanges had a lower average closing bid-ask spread than the median stock traded on Nasdaq’s National Market System. Focusing just on stocks that would meet NYSE listing requirements, he finds that the spreads are 15-18 cents wider when the stocks trade only on Nasdaq. Similarly, Christie and Huang (1993) find that, when issuers move from Nasdaq to the NYSE or AMEX, the quoted spread narrows and the average liquidity premium declines. Such data are not inconsistent with the implication of the Wood and McInish study that intermarket competition reduces spreads, but they suggest that mar- ket structure is a critical variable.
Still, at least one study suggests that competition can produce undesirable market fragmentation and higher volatility. Porter and Thatcher (1992) com- pare daily spreads of NYSE-listed stocks that were also listed on at least one regional exchange from 1987 to 1989. For some stocks, as volume increased on the regional exchanges, they find that the NYSE quoted spread narrowed in apparent response to this competition. But for other stocks, as volume rose on the regional exchanges, the NYSE spread increased-apparently as the result of market fragmentation. The dividing line, they find, depended on whether the average bid-ask spread exceeded $0.3 125. Above this level, increased vol- ume on the regional exchange seemed to produce market fragmentation, not tighter spreads. Whether competition from regional exchanges will widen or
1. When the spread is an eighth of a point, price improvement typically occurs only in auction markets, because when public orders cross in them, one side by definition gets a superior price to the bid-ask spread in a dealer market. For example, if the spread is $10 to $10 1/8 and two public orders for one hundred shares cross, the transaction will be either at $10 (in which case the buyer does better than in a dealer market where it would normally be charged $10 1/8) or at $10 1/8 (in which case the seller does better than in a dealer market where it would normally receive $10 per share).
2. In this sample, 99 percent of the trades were under three thousand shares.

81 Competition, Fragmentation, and Market Quality
narrow the quoted spread on the NYSE depends, they surmise, on the volume of public limit orders in the stock. If they are correct, the direct challenge of a rival market (whether the third market or a regional exchange) may be less important in inducing narrower spreads than the influence of limit orders (which dealer markets may not process or may treat less favorably than do auction markets).
Price Competition versus Cream Skimming
When order flow is diverted from a primary exchange to a rival market cen- ter, proponents of intermarket competition assume that there is an efficiency gain: either ( 1 ) the customer is getting a better price (whether in the form of a tighter spread or a between-the-spread execution) or (2) the broker is receiving a rebate for its order flow, which it presumably passes on to the customer (ei- ther in whole or at least in part) in the form of a reduced brokerage commis- sion. But this assumption of a net cost saving may be incorrect, for either of two distinct reasons.
First, the customer may experience a loss greater than the rebate paid to the broker. According to several commentators, the typical payment for order flow in the case of a NYSE-listed stock is 1 cent per share.’ But, according to Fial- kowski and Petersen (1992), the expected price improvement that is forgone when transactions are diverted away from the NYSE is 3 cents per share. Thus, there is an asymmetry between the broker’s gain and the customer’s loss. In effect, the customer loses the expected value of an execution between the bid and asked spread (worth 3 cents), and there is no way, even in a highly efficient market for brokerage services, that the broker can “pass on” the 1 -cent rebate it receives so as to compensate the customer fully for its 3-cent loss.
Second, rival market centers appear to be following a general strategy of “cream skimming” rather than directly contesting the primary exchanges across the board. This is evident in three distinct respects. First, third-market dealers do not attempt to compete for order flow on most NYSE-listed stocks. The NYSE estimates that order flow payments are currently common with re- gard to some 428 NYSE-listed s t o c k ~ , ~ and the practice of paying for order flow is far less pervasive with regard to AMEX stocks. Why? Seemingly, third- market makers find it profitable to pay for flow only in actively traded stocks. Second, rival market centers still engage in derivative pricing; that is, they simply match the NYSE specialist’s quoted spread, rarely moving their own bid and asked quotations inside the specialist’s. Although there is some evi-
3. Qpically, a payment is made for order flow only if (I) the trading spread exceeds one-eighth of a point, (2) a minimum monthly order flow is promised (usually 100,000 shares), (3) the trans- action does not exceed a maximum size (often 3,000 shares), and (4) certain source restrictions are observed (no professional traders). See Coffee (1991); National Association of Securities Deal- ers (1991).
4. I was provided this estimate by James E. Shapiro of the NYSE Research and Planning Di- vision.

82 Thomas H. McInish and Robert A. Wood
dence of change, the NYSE still largely monopolizes price discovery. Has- brouck ( 1 993) examined quote data at one-second intervals for three high- volume NYSE-listed stocks that also trade heavily on other markets. He found that between 80 and 90 percent of price discovery occurred on the NYSE. McInish and Wood (1992) find that a better bid or offer is available off-board only 11 percent of the time for NYSE-listed stocks and 7 percent of the time for AMEX stocks (although they also identify some stocks in which a regional exchange has the “best bid or offer” as much as 40 percent of the time).
Third, the regional exchanges focus their efforts on competing for smaller trades in NYSE-listed stocks. In 1988, trades of nine hundred shares or less represented over 75 percent of all transactions in NYSE-listed securities on the Boston, Midwest, Pacific, and Philadelphia exchanges, as well as on the NASD (see Lee 1993, 1017). Why? The best explanation may be that rival market centers want to avoid the professional (or “informed’) trader and obtain trans- actions from less sophisticated (or “uninformed”) retail customers. Derivative pricing is a means to this end. By simply matching the bid-ask quotation of the NYSE or AMEX (and declining to pay for order flow on large or professional trades), the rival market center does not attract order flow from informed trad- ers. If instead the third-market maker or regional specialist were to quote the inside spread, it could not refuse to deal with the professional trader under the Intermarket Trading System’s rules. The result is that the burden of adverse selection falls disproportionately on the primary exchange specialist, who loses the “safe” business of the retail customer but must accept the problematic trades of the professional.
If one accepts this premise that rival market centers do not want to expose themselves to informed traders and so will not quote a bid-ask spread inside that of the NYSE specialist, it may explain why the benefits of intermarket competition in the Wood and McInish study are so modest (i.e., no more than 0.6 cent). Moreover, the ability of the NYSE specialist to narrow its spreads further in response to competitive pressure would also appear to be limited. As uninformed trades are diverted to rival market centers, informed trades will represent an increasing percentage of the trades it handles, and the logical re- sponse to informed trading is to widen (not narrow) the bid-ask spread.
In this light, competition from rival market centers that is not based on price competition (i,e., payments for order flow and similar practices) may stalemate the public policy objective of narrower bid-ask spreads. Even reforms such as decimalization, which should induce a lower-cost market center to quote a tighter spread in order to obtain order flow, may be significantly frustrated if the more efficient market maker can hope instead to divert a nonrepresentative and “safer” order flow by offering rebates to the broker for desired transac- tions. To be sure, the extent of the “informed” trading problem has not been reliably estimated.5 But beyond the traditionally cited reasons-unfairness to
5. New literature suggests that “informed trades are concentrated in the medium-sized cate- gory.” See Barclay and Warner (1993). But, as noted earlier, midsized blocks appear to be the one

83 Competition, Fragmentation, and Market Quality
the customer and the asserted risk of market fragmentation-there may be a third reason for public policy to disfavor payments for order flow: it may chill price competition and reduce the efficiency gains that normally should accrue from intermarket competition.
References
Barclay, M., and J. Warner. 1993. Stealth Trading and Volatility: Which Trades Move Prices? Journal of Financial Economics 34:28 1-306.
Blume, M., and M. Goldstein. 1993. Dissimilar Market Structures and Market Liquid- ity: A Transaction Data Study of Exchange Listings. Working paper, Owen Graduate School of Management, Vanderbilt University.
Christie, W., and R. Huang. 1994. Market Structure and Liquidity: A Transactions Data Study of Exchange Listings. Journal of Financial Intermediation 3:320-26.
Coffee, J. 1991. Brokers and Bribery. New York Law Journal, September 27, 1991, 5 . Fialkowski, D., and M. Petersen. 1992. Posted versus Effective Spreads: Good Prices
or Bad Quotes? Working paper, Center for Research in Security Prices, University of Chicago.
Goldstein, M. 1993. Competitive Specialist vs. Dealer Markets: Effective and Dis- played Spreads on Nasdaq-NMS and the U.S. Stock Exchange System. Working pa- per, Graduate School of Business, University of Colorado, Boulder.
Hasbrouck, J. 1993. One Security, Many Markets: Determining the Contributions to Price Discovery Working paper, Stem School of Business, New York University.
Lee, C. 1993. Market Integration and Price Execution for NYSE-Listed Securities. Journal of Finance 48: 1009-38.
McInish, T., and R. Wood. 1992. Price Discovery, Volume, and RegionaVThird Market Trading Volume. Working paper, Memphis State University.
Mayer, M., and B. Leigh. 1991. Does Off-Board Trading Compromise Execution Qual- ity? The Evidence from High and Down Low. Working paper, American Stock Exchange Research Department.
National Association of Securities Dealers. 1991. Inducements for Order Flow: A Re- port of the Order Flow Committee to the Board of Governors. Washington, DC: Na- tional Association of Securities Dealers.
Porter, D., and J. Thatcher. 1992. Fragmentation, Competition, and Limit Orders: New Evidence from Interday Spreads. Working paper, Marquette University, Milwaukee.
Authors’ Reply
The comments by Coffee and Mulherin have two focuses: (1) the economic perspective underlying our paper, and (2) technical questions about our proce- dures and findings. We will respond to each of these in turn.
The Economic Perspective
Philosophical differences exist between Mulherin’s and Coffee’s views and our views of the competition for order flow among the New York Stock Ex-
area where regional exchanges are attracting order flow away from the NYSE, based on traditional price competition. See Lee (1993); Blume and Goldstein (1993). Hence, the magnitude of in- formed trading as a barrier to price competition that tightens the bid-ask spread remains debatable.

84 Thomas H. McInish and Robert A. Wood
change (NYSE), the regionals, and the third-market broker-dealers. We will outline their views and contrast them with ours.
Mulherin subscribes to a Coasian perspective in which, ideally, no regula- tory intervention would interfere with the invisible hand’s allocation of order flow so as to optimize global welfare. Corporations’ property rights would allow them, within the framework of our legal system, to determine where their stock would be traded. With this view, corporations, acting in the interests of their shareholders, will determine an optimal allocation of order flow among the NYSE, regional exchanges, and third-market dealers. According to Coase, exchange rules such as those of the NYSE (perhaps complex and difficult to understand) may “exist in order to reduce transactions costs and therefore to increase the volume of trade” ( I 988, 9).
Coffee’s philosophical perspective, which is primarily focused on price competition, leads to the view that the regionals and third-market broker- dealers are cream skimming, free riders that compete unfairly with practices such as the purchase of order flow and do not contribute significantly to the price discovery process. One might infer from Coffee’s statements that invest- ors would be better served if the regional exchanges were eliminated and third- market dealers were prohibited by fiat from trading listed securities. Then the order flow would be concentrated at the NYSE and the market depth max- imized at one location. We are concerned that the NYSE specialists would not use their then supreme market power for the public benefit but rather for their own wealth enhancement.
Our philosophical view of the competition for listed order flow stems from (1) a pragmatic assessment of the present regulatory environment, and (2) Stigler’s dominant-firm oligopoly model (1940, 1964), which, in our opinion, describes the competition for listed order flow. Garbade and Silber (1979) were the first to characterize the NYSE as the dominant competitor, with the region- als and third-market dealers offering satellite competition. In the dominant- firm oligopoly model, satellite competitors are unable to compete on price but rather must offer superior service through better technology and in other ways, attention to local clientele, and so forth (McInish and Wood 1995). The NYSE publicly invites price competition (bettering quotes) from the satellites, yet according to this model this is precisely the kind of competition that they are far less able to offer, particularly with trading in eighths. Thus, the principal arena for competition is technology, not price. In fact, before we seriously con- sider abolishing the satellite competitors we should remember that all of the extensive technological innovations in market mechanisms during the past thirty years have been initiated by the regional exchanges, the third-market dealers, and the proprietary trading systems (PTSs),’ with the NYSE matching
1. PTSs include Inatinet (continuous and crossing), Posit, and the Arizona Stock Exchange call auction system. Competition to NYSE specialists is also provided by Morgan Stanley’s Market Match, Lattice, and Fidelity’s Institutional Liquidity Network, all of which match buy and sell
85 Competition, Fragmentation, and Market Quality
innovations to avoid loss of market share. According to an early study by Gar- vey, “[tlhe initiative of minor exchanges was of no less importance in inducing the Regular Board [NYSE] to modernize its trading technique” (1944, 142). Dominant competitors have little incentive to innovate.
Within the framework of the dominant-firm oligopoly model, Salop and Scheffman show that raising rivals’ costs is a strategy used by dominant firms to gain market share: “It may be relatively inexpensive for a dominant firm to raise rivals’ costs substantially” (Salop and Scheffman 1983, 267). “Possible cost-raising strategies include . . . lobbying legislatures or regulatory agencies to create regulations that disadvantage rivals.” (Salop and Scheffman 1987, 19). We believe that evidence exists (discussed below) that supports the view that the dominant-firm oligopoly model and the strategy of raising rivals’ costs accurately characterize the competition for order flow in listed stocks. Thus, Coffee appears to view the NYSE as a benevolent competitor without selfish motives while satellites possess less pure motives; our perspective is that NYSE behavior is better explained by the nonprice predation (i.e., cost preda- tion) literature.
This philosophy leads to several positions that differ from the Mulherin and Coffee views.
Accusing satellite competitors of cream skimming and free riding reflects, in our opinion, a misunderstanding of the role of competition in a dominant- firm environment, which, as noted above, is not primarily focused on price.
As we and others have found, the satellites do contribute meaningfully to price discovery (McInish and Wood [ 1993al; Hams, McInish, Shoesmith, and Wood [ 199.51; Hasbrouck [ 19931; Garbade and Silber [ 1979]), providing price leadership 10-20 percent of the time. Assuming the dominant-firm oligopoly model is the appropriate paradigm to characterize the competition for listed order flow, it is not sensible to expect more of the satellites.
As Demsetz (1982) notes, a fine line exists between property rights and regulatory barriers to entry. Even Coase recognizes the possibility of exchange rules being administered so as to limit competition. Coase (1988, 9) quotes Adam Smith on this point: “To widen the market may frequently be agreeable enough to the interest of the public, but to narrow the competition must always be against it.” We are concerned that property-rights arguments may lead to regulatory bamers to competition. To illustrate our concern, the Securities and Exchange Commission (SEC) has limited the trading hours of the Arizona Stock Exchange call auction system (AZX) to thirty minutes before the NYSE open and one hour after the NYSE close. This restriction imposes serious limi- tations on the use of the AZX: traders must stay late at the office to place
orders and print the resulting trades typically through third-market dealers. Additional order flow is matched internally and printed off-board by the large retail brokers such as Merrill Lynch and Shearson. The ability of brokers and large buy-side institutions to profitably cross orders internally is, in our opinion, further evidence of the existence of rents on the NYSE.
86 Thomas H. McInish and Robert A. Wood
orders, indexers may not be able to capture market-on-close prices, and SO
forth. Many other NYSE and SEC rules and regulations hamper the use of the PTSs. We agree with Oesterle, Winslow, and Anderson (1992) that the NYSE quotes are not more proprietary than those of any other vendor. Can K-Mart prohibit their competitors from using their quoted prices? Since futures mar- kets lead cash markets, does this mean that the NYSE is free riding on the futures markets?2 We also think that the property rights of investors are being overlooked. Our discussions with institutional buy-side3 traders reveals dismay that the property-rights argument is being used to limit their use of PTSs.? In their estimation, they own the quotes that stem from their limit orders, not the NYSE. Contrary to Mulherin, we submit that buy-side traders are far more qualified to make decisions about where orders should be executed than the boards of directors or executives of public corporations.
Purchase of order flow, instead of being a nefarious scheme to bilk investors, may merely reflect the fact that rents exist (i.e., that spreads are wider than are needed to generate a return required by the riskiness of market making) on the floor of the NYSE. Or it may simply be a way of separating informed from uninformed order flow. Further, these moneys flow into the competitive retail brokerage arena. At this point, we observe discount brokers offering trade exe- cutions for no commission. Further, we observe Madoff clones competing for his business.
Having established the differences among our views and those of our re- viewers regarding the competition for order flow, we next consider evidence that can help discriminate among these views.
Evidence That Discriminates among the Three Perspectives
In this section, we offer evidence that supports our view that NYSE behavior can be explained with the paradigm of raising rivals’ costs. We also offer evi- dence that discriminates between NY SE behavior that increases the NYSE vol- ume at the expense of its competitors, versus behavior that increases the aggre-
2. We thank Robert Neal for this insight. 3. “Buy-side’’ refers to the money managers-mutual funds, pension funds, and so forth-and
individual investors, while “sell-aide” refers to the brokerage firms and the market centers. This terminology historically arose because stocks are considered to be sold.
4. The PTSs currently present the most serious threat to the NYSE, since they provide trading features that the more aggressive institutional buy-side traders desire: anonymity, which prevents front-running (they hate their agent’s also being their competitor); transparency; the ability to enter and control orders directly without going through an intermediary; lower commissions, since they are not subsidizing immediacy; low trading costs; the ability to see depth for a montage of quotes-four price increments on either side (that is, thcy see the whole book); the ability to trade electronically; the opportunity to avoid subsidizing the liquidity needs of others; the ability to post quotes in decimals and to be able to gain priority by bettering quotes by 1 cent; and so forth. Liquidity naturally attracts order flow. This fact, combined with the NYSE’s anticompetitive rules, provides the NYSE with a decided competitive advantage as the dominant market center. The recent rapid growth in trading on the PTSs that is occurring in the face of the natural NYSE advantage reflects the strong preference aggressive buy-side traders have for the PTSs. At this point, the PTSs threaten the existence of the weaker regional exchanges.

87 Competition, Fragmentation, and Market Quality
gate order flow from a Coasian perspective, the former behavior being anticompetitive. In addition to the evidence cited below, our views are also based on scores of discussions with investment professionals.
McInish and Wood (1995) show that the NYSE specialists fail to display about one-half of all limit orders that are inside existing quotes for a sample of 118 NYSE-listed stocks, in apparent contravention of SEC regulations. Why would the NYSE specialists engage in such conduct? As noted above, while satellite competitors are unable to beat the dominant firm on price, they must match its price. If the NYSE obfuscates true prices by systematically hiding limit orders, the satellite competitors, according to regional specialists with whom we have discussed this matter, must engage in costly procedures to discover true prices (Harris, McInish, and Wood 1993). Presently, the re- gionals do so by submitting their own limit and market orders in small quan- tities to the NYSE, while some third-market dealers engage in the costly practice of temporarily displaying limit orders if the spread is wider than one eighth.’ To block this practice, the AMEX has submitted a proposed rule to im- pose restrictions on so-called competing dealers to the SEC, which, if imple- mented, would place regional specialists’ orders at the end of the NYSE/ AMEX queues (SEC 1994, 111-11). If implemented, this proposal will seri- ously impact the ability of regional specialists to determine true prices. The SEC’s Division of Market Regulation concludes that “the proposal’s restric- tions are imposed primarily for competitive reasons. Accordingly, the Division recommends that the AMEX amend or withdraw the proposal” (SEC 1994, 111- 11).
A NYSE rule that is anticompetitive in that it increases NYSE volume at the expense of their competitors is rule 390, which prohibits a broker from execut- ing principal trades or agency trades, if the broker has both sides of the trade, off the exchanges (i.e., off the Intermarket Trading System) (McInish and Wood 1992b).
Rule 500 makes delisting from the NYSE extremely difficult, which, ac- cording to the SEC’s Market 2000 report, is considered to be an anticompeti- tive rule by market participants.6 The SEC’s Division of Market Regulation
5. Other important aspects of hiding limit orders are that (1) the practice results in the illusion of price improvement, which the NYSE characterizes as market orders crossing within the spread but which in many cases results from executions against hidden limit orders; and (2) it creates a fiduciary responsibility on the part of money managers to execute trades on the NYSE, since illusion of price improvement exists. (We thank Junius Peake for this insight.) If the true spreads were revealed by the NYSE at all times, they would be matched by the satellites. Thus, the illusory price improvement would disappear. The practice of hiding limit orders is an example of the NYSE market power and its willingness to use such power to disadvantage the competition.
6. Rule 500 states, in part: “In the absence of special circumstances, a security considered by the Exchange to be eligible for continued listing will not be removed from the list upon request or application of the issuer, unless the proposed withdrawal from listing is approved by the security holders at a meeting at which a substantial percentage of the outstanding amount of the particular security is represented, without objection to the proposed withdrawal from a substantial number of individual holders.” (CCH 1991, 2597) Thus, delisting cannot simply be approved by a com- pany’s board of directors, or even by a simple majority of the firms’ stockholders.

88 Thomas H. McInish and Robert A. Wood
“cannot identify any justification for the stringent approval requirements [for delisting] built into NYSE Rule 500” (SEC 1994, 31).
The NYSE policy that any new listing is prohibited from trading on region- als or in the third market for the first month does not foster increased aggregate trading volume. Rather, it is anticompetitive.
The NYSE resistance to decimal trading, which Peake ( 1 995) perceives to be the last vestige of fixed commissions, can hardly be construed as a policy that will enhance aggregate volume. The NYSE policy of fixed commission, which ended by SEC fiat in 1975, clearly was not designed to increase order flow.
The Security Investment Automation Corporation (SIAC), which is two- thirds owned by the NYSE, rounds trades and quotes from PTSs to eighths, masking price advantages that might be offered by the PTSs. Thus competition is limited, and NYSE volume is enhanced, while aggregate order flow is not in- creased.
Response to Coffee and Mulherin Specific Concerns
Mulherin and Coffee note that we find only 0.6 cent difference in spread between the portfolios with the greatest and the least fragmentation, which averages $8.46 per trade, or $1,040 per day per stock. Yet this position ignores what spreads would be if the NYSE had no competitors. McInish and Wood (1992a) show that competition reduces spreads. As Neal (1987) finds for op- tions markets, the mere presence of a competitor will reduce spreads. Our goal is to test the NYSE position that fragmentation harms markets. Our evidence does not support the NYSE position. Further, Branch and Freed state “that competition appears to play a much larger role in restraining NYSE spreads than increased volume might play if trading were more concentrated on the Big Board” (1977, 163).
Mulherin and Coffee point out that we do not address other market-quality issues such as depth and trades between quotes. To investigate this objection, we examine market depth. We find that market depth, as measured by the aver- age bid depth plus ask depth for each quote, is essentially identical across the five portfolios for both the NYSE and for the other market centers. Thus, frag- mentation does not alter depth. Given the finding in McInish and Wood (1995, in press) that NYSE specialists hide about half of all limit orders that are inside existing spreads, it may not be possible to measure trades between the quotes in a meaningful way.
Mulherin questions the use of the Herfindahl index as a measure offragmen- tation. While other measures might be used, depending on one’s conception of fragmentation, the Herfindahl index is widely employed as a measure of concentration (competition or lack thereof) in the industrial organization liter- ature. To address Mulherin’s concern, we create an alternate measure of compe- tition motivated by Neal’s findings cited above, by calculating the number of competitors for each stock with at least 1 percent of the dollar volume of trad-

89 Competition, Fragmentation, and Market Quality
ing.’ The research design was replicated for this metric. The mean number of competitors for the five portfolios ranges from 3.1 to 5.2. The correlations of this metric with SPREAD, PREMIUM, and VOLATILITY are -0.94, -0.98, and -0.52, respectively, with corresponding confidence levels of 0.01 7,0.004, and 0.38. These results, using the alternate measure of fragmentation, confirm even more strongly that fragmentation does not appear to harm markets.
Mulherin is concerned that the inferences drawn from the sample can be questioned because we use only hi-cap stocks, but, in fact, we have included stocks of all sizes in our sample. In fact, the market value of the smallest of our 980 firms is only $31 million. We exclude only NYSE stocks that do not have a minimal trading level of at least one thousand shares (to avoid thin- trading biases), that trade at less than $5 per share (to avoid aberrant spread behavior), or that do not have both Institute for the Study of Security Markets and Compustat data. Further, Mulherin conjectures that the second tier of firms in our sample “likely have wider spreads and less off-board trading.” To test this conjecture, we divided the sample firms into two groups based on size and find that he is correct. The percentage of dollar volume traded on the NYSE for each group is large firms, 87.8 percent; small firms, 85.5 percent. While this difference is statistically significant, it does not seem to be practically sig- nificant.
Mulherin expresses concern that a positive correlation between the Herfin- dahl index and the limit orders and crowd activity may drive our results. Unfor- tunately, the NYSE does not release data that would permit us to evaluate this conjecture. (We are able to discriminate between block and nonblock trades- replicating our study with the elimination of block trades does not change our findings.) Yet in our opinion Mulherin’s view seems unlikely since this would require stocks that have greater floor and limit order activity to also have pro- portionally greater regional trading activity.
Mulherin posits a life-cycle hypothesis wherein the age of the firm is posi- tively correlated with the Herfindahl index and, in turn, with bid-ask spread, so that our research design may have been confounded. Yet this exactly is the kind of confounding that the linear program is designed to protect against. Note that the first and second moments of a number of variables related to the life cycle of firms are held equal in each of the five portfolios. Specifically, these are the dividend payout ratio, market-to-book ratio, asset value, financial leverage, dollar value of trading, and beta. Thus, we feel reasonably confident that the life-cycle concern has been accounted for to the best of our ability.
Coffee expresses concern that some investors are disadvantaged by trades on the satellites and cites a series of papers. In our opinion, he is drawing inferences concerning investor welfare that are not justified by our present knowledge of market microstructure. A great many issues about trading costs
7. For a discussion of additional studies that have used number of competitors as a proxy for competition, see McInish and Wood (1993a).
90 Thomas H. McInish and Robert A. Wood
are not yet clearly understood.8 He further cites evidence comparing Nasdaq quotes with NYSE quotes-our paper did not mention Nasdaq. However, for a perspective of NY SE versus Nasdaq spreads that differs from Coffee’s, see McInish and Wood (1993b).
Mulherin also argues “that the selection of trading location is endogenously chosen in the market.” This disregards the impact of anticompetitive NYSE rules such as rule 500 and rule 390.
Coffee points out that Porter and Thatcher (1992) find that increased compe- tition from regional exchanges narrowed NYSE spreads for stocks with rela- tively low initial spreads, but increased spreads for stock with relatively high initial spreads. Coffee concludes from this finding that “increased volume on the regional exchange seemed to produce market fragmentation, not tighter spreads.” We believe that the wider spreads in the face of increased regional competition are more likely to reflect an increased incidence of hiding limit orders as a competitive response by NYSE specialists.
Coffee argues that in the presence of asymmetric information the NYSE specialist must widen the spread even further if the probability of being picked off by an informed trader (in the midsize range especially) rises because unin- formed order flow has been attracted by rebates offered by satellite competi- tors. But, if Coffee is otherwise correct, his thinking fails to incorporate (1) the fact that this process is, like all market phenomena, self-limiting and (2) the implication of the NYSE being the dominant competitor. To clarify, frag- mentation, interacting with the asymmetric information to raise that compo- nent of the spread, drives both informed and uninformed order flow to the satellites. So it is not as though fragmentation has caused these higher spreads associated with the movement of order flow to the satellites; fragmentation is also the result of the dominant-firm price leader having the market power to raise spreads to cover the cost of being picked off. The satellites certainly do not have this ~ p t i o n . ~
To summarize, we continue to affirm that the data do not support the NYSE contention that fragmentation harms investors. We are sympathetic with the world Mulherin champions, where nothing stands in the way of the invisible hand’s allocation of order flow among competitors. But our view that the dominant-firm oligopoly model is the appropriate paradigm to characterize the competition for listed order flow, combined with our pragmatic assessment of
8. For example, we are aware of two studies conducted by buy-side firms that extensively exam- ine trading performance on the NYSE, regional exchanges, and Nasdaq, finding essentially no difference in execution costs. These studies have the advantage of knowing the characteristics of each order-data not yet made available to academics by the NYSE. Further insights are provided by Angel (1994) and Chan and Lakonishok (1991). Additional concerns are that trading-cost stud- ies have not been extended to the PTSs and that they do not include all trading costs. For example, commission costs on the PTSs can be as low as 1-2 cents a share compared to 5-6 cents a share on the NYSE. Further, front-running costs, which may be largely avoided on the PTSs, are not yet measured.
9. We have benefited from discussions with Frederick Hams on this topic.

91 Competition, Fragmentation, and Market Quality
what can realistically be accomplished in the present regulatory environment, causes us to be less sanguine about moving from the present state of competi- tion to our ideal trading world following the Mulherin path. It is not our goal, as Mulherin suggests, that the SEC extend its regulatory reach. We are encour- aged that the Market 2000 report does not move in that direction. In our opin- ion, if the PTSs were able to compete without any regulatory obstacles, the costs of trading services presently being paid by the institutional buy-side to the sell-side would be reduced by 50-75 percent.
References
Angel, J. 1994. Who receives price improvement? Working paper, Georgetown Univer-
Branch, Ben, and Walter Freed. 1977. Bid-ask spreads on the AMEX and the Big Board.
Chan, Louis K. C., and Josef Lakonishok. 1991. Institutional trades and intra-day stock
Coase, R. H. 1988. The firm, the market, and the law. Chicago: University of Chicago
Commerce Clearing House (CCH). 1991. New York Stock Exchange, Inc.: Constitution
Demsetz, Harold. 1982. Barriers to entry. American Economic Review 72:47-57. Garbade, K., and W. Silber. 1979. Dominant and satellite markets: A study of dually
traded securities. Review of Economics and Statistics 6 1 :455-60. Garvey, George. 1944. Rivals and interlopers in the history of the New York security
market. Journal of Political Economy 52: 128-43. Hams, Frederick D., Thomas H. McInish, Gary L. Shoesmith, and Robert A. Wood.
1995. Cointegration, error correction and price discovery on informationally linked security markets. Journal of Financial and Quantitative Analysis, Spring.
Hams, Frederick D., Thomas H. McInish, and Robert A. Wood. 1993. Raising rivals’ costs. Working paper, University of Memphis.
Hasbrouck, Joel. 1993. One security, many markets: Determining the contributions to price discovery. Worlung paper, New York University.
McInish, Thomas H., and Robert A. Wood. 1992a. An analysis of intraday patterns in bid-ask spreads for NYSE stocks. Journal of Finance 47: 753-64.
. 1992b. The effect of NYSE rule 390 on spreads, premiums, and volatility. Working paper, University of Memphis.
. 1993a, Price discovery, volume, and regionalhird-market trading. Working paper, University of Memphis.
. 1993b. Volatility of NasdaqNMS and listed stocks. Working paper, University of Memphis.
. 1995. Hidden limit orders on the NYSE. Journal of Portfolio Management.
sity, Washington, DC.
Journal of Finance 32: 159-63.
price behavior. Working paper, University of Illinois, Champaign.
Press.
and rules. Chicago: Commerce Clearing House.
Neal, Robert. 1987. Potential competition and actual competition in equity options. Journal of Finance 42:511-3 1.
Oesterle, Dale Arthur, Donald Arthur Winslow, and Seth C. Anderson. 1992. The New York Stock Exchange and its outmoded specialist system: Can the exchange innovate to survive? Journal of Corporation Law 17:223-310.
Peake, Junius. 1995. Brother can you spare a dime? In Robert A. Schwartz, ed., Global Equity Markets: Technological, Competitive, and Regulatoiy Challenges. Burr Ridge, IL: Business One Irwin.

92 Thomas H. McInish and Robert A. Wood
Porter, David, and John Thatcher. 1992. Fragmentation, competition, and limit orders: New evidence from interday spreads. Working paper, Marquette University, Mil- waukee.
Salop, Steven C., and David T. Scheffman. 1983. Raising rivals’ costs. American Eco- nomic Review, papers and proceedings issue, sect. “Recent Advances in the Theory of Industrial Structure,” 73:267-71.
. 1987. Cost-raising strategies. Journal of Industrial Economics 36: 19-34. Securities and Exchange Commission. Division of Market Regulation. 1994. Market
2000: An examination of current equity market developments. Washington, DC: Government Printing Office.
Stigler, George. 1940. Notes on the theory of duopoly. Journal of Political Economy
. 1964. A theory of oligopoly. Journal of Political Economy 72:44-6 1. 48152 1-41.


