COMPENSATION SOLUTIONS CATALOGUE - imercer€¦ · COMPENSATION SOLUTIONS CATALOGUE Pre-order to...
44
COMPENSATION SOLUTIONS CATALOGUE Pre-order to Receive 2011 Prices! 2012 CANADA (see back cover)
Transcript of COMPENSATION SOLUTIONS CATALOGUE - imercer€¦ · COMPENSATION SOLUTIONS CATALOGUE Pre-order to...

COMPENSATION SOLUTIONS CATALOGUE
Pre-orderto Receive
2011 Prices!
2012 CANADA
(see back cover)

PREFACE
TALENTISM IS THE NEW CAPITALISM Talent is the fuel that drives the global economy and will lead organizations to
future growth. In the latter part of 2011, the World Economic Forum, in partnership
with Mercer, embarked on a talent mobility good practice research project that
explored how effective talent mobility can help spur economic growth. The published
report, Talent Mobility Good Practices: Collaboration at the Core of Driving Economic Growth, uncovers four foundational issues faced by organizations – widespread
unemployability, critical skills gap, information gaps, and public and private
constraints – and reveals how talent mobility can address these impediments through:
• Basic employment training and employment subsidies to reduce unemployability
• Retraining and up-skilling the workforce and better career development to close
skills gaps
• Increasing the information available to individuals and employers, improving
workforce planning within organizations, and strengthening credentialing to
fill information gaps
• Easing migration, facilitating mobility within organizations, and moving jobs
to people to reduce constraints on mobility
COLLABORATION IS KEY
Collaboration among multiple stakeholders is at the core of successful talent
mobility practices. Collaboration requires new skills and new thinking. Convincing
stakeholders to consider goals greater than their own immediate ones takes
diplomacy and persuasion. Critical to success is the development of a collaborative
mindset – prepared to think broadly, comfortable with complexity, and able to
understand and find common ground with the goals of other stakeholders. With the
right mindset in place, successful collaboration on talent mobility practices requires:
• Developing a clear, common understanding of the problem
• Establishing aligned incentives for participation and action
• Instituting strong governance that spells out who will lead the effort and
what information is to be shared among participants
• Obtaining the right data to base the practice
• Continuously assessing progress and results to ensure proof of concept
To learn more about talent mobility good practices or to download the full research
report please visit mercer.com/globaltalent.

TABLE OF CONTENTS
CANADIAN COMPENSATION SURVEYS
GENERAL
Mercer Benchmark Database 3
Corporate Services and HR 4
Engineering and Design 4
Executive 4
Finance, Accounting and Legal 4
High-Tech and e-Commerce 4
Logistics and Supply Chain 5
Manufacturing and Operations 5
Marketing and Sales 5
Mercer/Gartner Information Technology 5
Compensation Policies and Practices 6
Mercer/Gartner IT Workforce Practices 7
Compensation Planning 8
Contact Centre 8
Executive Management and Professional (EMP)™ 9
Geographic Salary Differentials 9
INDUSTRY
Mercer Total Compensation Survey (MTCS) for the Energy Sector 10
Ontario Municipal 12
OSPE Employer Compensation 13
Retail Industry and Benefits 14
Canadian Investment Management Industry 15
Professional Services Industry 15
EHRA Engineering 16
Management and IT Consulting 16
Medical Device Technology (MEDEC) 17
Pharmaceutical and Biotechnology 17
COMPENSATION MANAGEMENT
Mercer WIN® 19
Mercer WIN® | Core 19
Mercer WIN® | Advanced 20
Mercer WIN | ePRISM™ 20
GLOBAL COMPENSATION / MOBILITY DATA
Global Mobility Events and Training 23
Total Remuneration Surveys 24
Total Remuneration Surveys Membership 26
Benefits Survey for Expatriates and Internationally Mobile Employees 27
Cost of Living 28
Global Compensation Planning 30
Global Mobility Assessment Survey 31
Global Pay Summary 32
International Geographic Salary Differentials 33
Mercer Global HRMonitor® 34
Mercer’s International Assignment Management Solution 35
Mercer Mobility Starter Kit 36
Total Employment Costs around the World 37
Worldwide Benefit & Employment Guidelines 38
Worldwide Survey of International Assignment Policies and Practices 39
Global Mobility Metrics Report 40
Global Mobility Handbook 40
BEST SELLER
NEW
NEW
NEW
BEST SELLER
BEST SELLER
BEST SELLER
BEST SELLER
BEST SELLER
BEST SELLER
BEST SELLER
BEST SELLER
BEST SELLER
BEST SELLER
BEST SELLER
NEW
NEW
NEW
NEW
NEW
NEW

CANADIAN COMPENSATION SURVEY DATA OVERVIEW
2 imercer.ca 800 333 3070
GENERAL
These surveys report compensation for “functional” positions
employed in any industry. Paying functional positions competitively
is critical since organizations compete for talent with all others that
have these jobs – not just those in their industry.
INDUSTRY
Covering a wide range of key markets, Mercer industry-based
surveys allow organizations to determine competitive pay for
industry specific or niche positions. Industries include:
In Canada, Mercer conducts 25 compensation
surveys annually covering critical functions,
industries, organizations and geographies.
The Canadian database includes thousands of
distinct positions and represents 2.5+ million
employees. Reports include base pay, short- and
long-term incentives, policies/practices, salary
planning and geographic differentials.
• Accounting/Professional
Services
• Energy
• Engineering
• Fast-moving Consumer Goods
• Information Technology
• Investment Management
• Management and IT Consulting
• Medical Device Technology
• Municipal Government
• Pharmaceutical and
Biotechnology
• Retail
C O N S U LT I N G . O U T S O U R C I N G . I N V E S T M E N T S .

The Mercer Benchmark Database (MBD) is the
premier general industry database for evaluating
and creating competitive compensation offerings.
POSITION FAMILIES
Administration
Communications
Corporate affairs
Engineering
Finance
Human resources
Information technology
Manufacturing
Quality
Research and development
Sales/marketing
Supply and logistics
Top management
and more
SCHEDULE
Questionnaire sent February
Data effective April 1
Report available August
MERCER BENCHMARK DATABASE (MBD)imercer.ca/mbd
COMPENSATION GENERAL
3 800 333 3070 imercer.ca
The database consists of 9 modules (see pgs 4 and 5) and features:
• Base pay, incentive and total direct compensation information for more than 1,000 positions
• Analyses by industry, assets, revenue/sales, operating expenses/budget, gross premiums, total employment, geographic region and metropolitan area
• Year-over-year comparisons by position
• Long-term incentive prevalence and valuation
Mercer/Gartner Information Technology Compensation Survey
– now part of the Mercer Benchmark Database! Mercer has
collaborated with Gartner, the world’s leading information
technology research and advisory company, to create a
world-class IT benchmark compensation survey. As a result,
the Mercer Benchmark Database now has 168 new IT positions
and 164 updated position descriptions!
PRICING
Single primary user.
MBD (all modules)
Participant $ 7,400
Nonparticipant $22,200
Flex (any 6 modules)
Participant $ 5,500
Nonparticipant $ 16,500
Individual modules
Participant $ 1,050
Nonparticipant $ 3,150
Add MBD users $ 1,040/ea.
Add Flex users $ 520/ea.
Add individual module users
$ 150/ea.
ORGANIZATIONS
Participants 966
Employees 508,000
Positions 1,000+
Survey results delivered in Mercer WIN®
Our largest database ever!
4% increase over 2011!
C O N S U LT I N G . O U T S O U R C I N G . I N V E S T M E N T S .

4 imercer.ca 800 333 3070
CORPORATE SERVICES AND HR
ENGINEERING AND DESIGN
EXECUTIVE
FINANCE, ACCOUNTING AND LEGAL
HIGH-TECH AND E-COMMERCE
ORGANIZATIONS
Participants 873
Employees 74,000+
Positions 158
ORGANIZATIONS
Participants 492
Employees 35,754
Positions 141
ORGANIZATIONS
Participants 838
Employees 9,000+
Positions 94
Civil engineer
Chemical engineer
Construction engineer
Electrical engineer
Manufacturing engineer
Mechanical engineer
Professional engineer
Project engineer
and more
POSITION FAMILIES
Actuarial
Administrative support
Economics
Human resources
Investor relations
Project management
Public relations
Regulatory affairs
Underwriting
and more
POSITION FAMILIES
Administration
Communications
Corporate affairs
Finance
Human resources
Information technology
Legal
Property/real estate management
Quality
R&D
Sales
and more
POSITION FAMILIES
ORGANIZATIONS
Participants 856
Employees 37,000+
Positions 88
ORGANIZATIONS
Participants 216
Employees 16,764
Positions 79
Audit
Budget
Cost accounting
Costing/pricing
Credit and collections
Financial control
Investment
Risk management
Tax
Treasury
and more
POSITION FAMILIES
Applications development
Hardware design
Information technology
IT business analysis
IT outsourcingPre-sales engineering
Product development
Softwaredevelopment
Web development
Website management
and more
POSITION FAMILIES
COMPENSATION GENERAL
C O N S U LT I N G . O U T S O U R C I N G . I N V E S T M E N T S .

MERCER/GARTNER IT
ORGANIZATIONS
Participants 679
Employees 47,519
Positions 332
Cloud computing
Data warehousing
Database development & administration
Electronic data interchange (EDI)
IT audit
IT business analysis
Middleware
Network administration & operations
Project management (technical)
Social networking
Software development
and more
POSITION FAMILIES
LOGISTICS AND SUPPLY CHAIN
ORGANIZATIONS
Participants 574
Employees 33,973
Positions 74
Dispatch and distribution
Import/export
Logistics
Materials management and handling
Purchasing
Production and inventory management
Scheduling
Shipping and receiving
Supply chain management
Transportation/fleet
Warehousing and more
POSITION FAMILIES
MANUFACTURING AND OPERATIONS
ORGANIZATIONS
Participants 560
Employees 43,461
Positions 102
Assembly
General labour
General maintenance
Painting
Plant management
Production and shift management
Production planning and forecasting
Quality control and assurance
Shift/shop floor management
Tool and die
Tradespeople
and more
POSITION FAMILIES
MARKETING AND SALES
ORGANIZATIONS
Participants 735
Employees 216,000
Positions 137
Account management
Advertising and promotionBusiness development
Contract and bid management
Customer service eBusiness commerce
Field service
Marketing analysis
Sales administration
Sales engineers
Sales executives managers
Sales planning
Sales representatives
and more
POSITION FAMILIES
5 800 333 3070 imercer.ca
COMPENSATION GENERAL
C O N S U LT I N G . O U T S O U R C I N G . I N V E S T M E N T S .

6 imercer.ca 800 333 3070
The Compensation Policies and Practices Survey is
a valuable new survey that goes beyond the
paycheque and explores other areas of
employee compensation.
COMPENSATION POLICIES AND PRACTICES imercer.ca/cpp
COMPARE YOUR ORGANIZATION TO THE MARKETPLACE
The biennial survey was developed to provide organizations with a
reliable source of policies and practices data that is often hard to come
by but essential in developing a well-rounded compensation plan. Learn
how organizations across industries are managing:
• Executive perquisites • Overtime/on-call pay
• Flexible work arrangements • Retention
• Hiring of college grads • Turnover
• Maternity and parental leave • Vacation time
SCHEDULE
Questionnaire sent (biennial) October
Report available (biennial) January
PRICING (USD)
Participant
Standard report* $ 300
Detailed report** $ 500
Nonparticipant
Standard report* $ 900
Detailed report** $ 1,500
*Includes national data
**Includes industry, regional, revenue, employee size scopes
ORGANIZATIONS
Participants 620+
COMPENSATION GENERAL
C O N S U LT I N G . O U T S O U R C I N G . I N V E S T M E N T S .
7 800 333 3070 imercer.ca
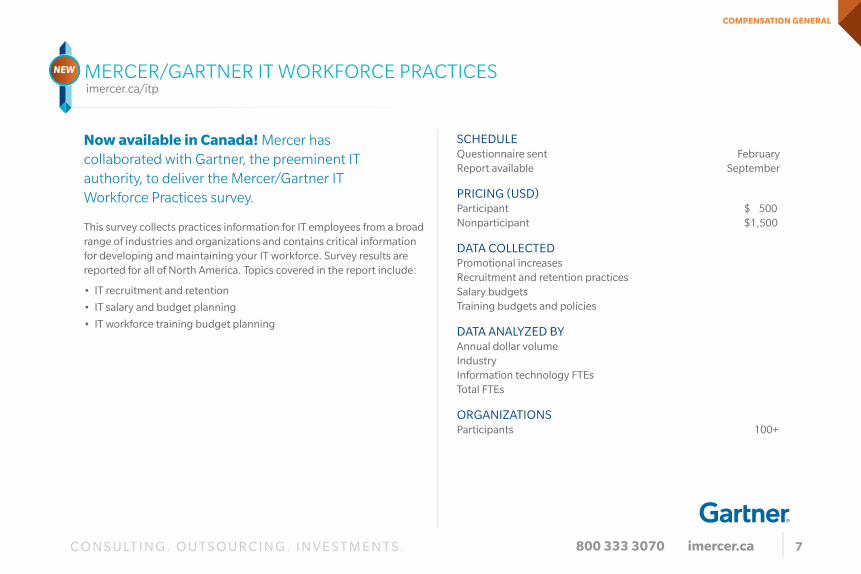
Now available in Canada! Mercer has
collaborated with Gartner, the preeminent IT
authority, to deliver the Mercer/Gartner IT
Workforce Practices survey.
MERCER/GARTNER IT WORKFORCE PRACTICES imercer.ca/itp
This survey collects practices information for IT employees from a broad
range of industries and organizations and contains critical information
for developing and maintaining your IT workforce. Survey results are
reported for all of North America. Topics covered in the report include:
• IT recruitment and retention
• IT salary and budget planning
• IT workforce training budget planning
SCHEDULE
Questionnaire sent February
Report available September
PRICING (USD)
Participant $ 500
Nonparticipant $1,500
DATA COLLECTED
Promotional increases
Recruitment and retention practices
Salary budgets
Training budgets and policies
DATA ANALYZED BY
Annual dollar volume
Industry
Information technology FTEs
Total FTEs
ORGANIZATIONS
Participants 100+
COMPENSATION GENERAL
C O N S U LT I N G . O U T S O U R C I N G . I N V E S T M E N T S .

The Canadian Compensation Planning Survey is
widely cited by media across the country and with
750+ participating organizations, it’s no wonder.
ORGANIZATIONS
Participants 750+
Observations 1.5 million
Positions N/A
POSITION FAMILIES
Executive
Management
Office/clerical/technician
Professional sales/non-sales
Trades/production/service
COMPENSATION PLANNING imercer.ca/cps
The Contact Centre Survey is a valuable resource for
contact centre managers and HR professionals
challenged with developing competitive
compensation plans.
POSITION FAMILIES
Collections
Customer service
Full account management
Inbound/outbound
Inbound with selling
Inbound-order entry
Internet support
Outbound with selling
Outbound-lead generation
Response collection/polling
Retention
Specialized support
Staff
Technical support
SCHEDULE
Questionnaire sent May
Data effective N/A
Report available August
Report update December
PRICING
Participant FREE
Nonparticipant $650
SCHEDULE
Questionnaire sent February
Data effective April 1
Report available September
PRICINGSingle primary user.
Participant $1,200
Nonparticipant $3,600
Add users $150/ea.
ORGANIZATIONS
Participants 100
Observations 59,000+
Positions 96
8 imercer.ca 800 333 3070
CONTACT CENTRE imercer.ca/contact
The survey provides current and projected data on salary increases,
structure adjustments, variable pay programs, and non-traditional pay
programs, including:
• Actual 2012 and projected 2013 salary increases and structure adjustments
• Promotional increase budgets
• Attraction and retention practices
• Incentive practices and more
COMPENSATION GENERAL
C O N S U LT I N G . O U T S O U R C I N G . I N V E S T M E N T S .
The Survey includes key compensation and incentive data for an array of
functional positions and an extensive policy section.
All-time high participation!
10% increase over 2011!

9 800 333 3070 imercer.ca
The Executive, Management and Professional
(EMP) Compensation Survey is a primary
reference tool for benchmark positions across the
Canadian job market.
The survey is a balanced cross-section of the most popular jobs in
the Mercer Benchmark Database.
POSITION FAMILIES
Corporate affairs
Engineering
Finance and administration
Human resources
Information technology
Legal
Manufacturing
R&D
Sales and marketing
Supply and logistics
Top management
and more
The Geographic Salary Differentials (GEO) tool
provides an analysis of pay differentials for more
than 145 Canadian locations, including
provinces, regions and cities.
PRICING
New purchase $ 850
Renewal $ 700
SCHEDULE
Questionnaire sent February
Data effective April 1
Report available August
PRICING
Single primary user.
Participant $ 1,400
Nonparticipant $ 4,200
Add users $150/ea.
ORGANIZATIONS
Participants 945
Employees 180,000+
Positions 158
Industry segments 51
SCHEDULE
Questionnaire sent N/A
Data effective January 1
Report available February
EXECUTIVE, MANAGEMENT AND PROFESSIONAL (EMPTM)imercer.ca/emp
GEOGRAPHIC SALARY DIFFERENTIALSimercer.ca/geo
COMPENSATION GENERAL
C O N S U LT I N G . O U T S O U R C I N G . I N V E S T M E N T S .
Rather than using data interpolation, Mercer’s GEO provides
specific salary differential information based on actual market data
collected each year in Mercer’s compensation surveys. This
methodology ensures that the information reflects the ever
changing Canadian compensation landscape.

209All-time high participation!
organizations in 2012!
MERCER TOTAL COMPENSATION SURVEY FOR THE ENERGY SECTOR (MTCS) imercer.ca/mtcs
INDUSTRY SEGMENTS SCHEDULE
Questionnaire sent February
Submission meeting March
Data effective April 1
Report available August
Results meeting September
PARTICIPANT PRICINGSingle primary user.
Core $7,500
Additional modules (each) $1,450
Add users $150/ea.
ORGANIZATIONS
Participants 209
Employees 115,000+
Positions 614
10 imercer.ca 800 333 3070
MTCS provides you with the most comprehensive perspective on the energy sector in Canada.
The 2012 survey incorporates salaried and hourly compensation data and HR policies for staff across the
energy industry value chain, from exploration to refining, drilling to distribution. Each segment of the industry
can be analyzed in isolation to examine sector-specific roles, or users can get a holistic picture of the entire
energy labour market for petro-technical and other roles that exist across all segments of the industry.
THE MTCS ALLOWS YOU TO:
• Access the most up-to-date intelligence, reflecting your business’ core labour markets.
• Avoid the burden of participating in multiple surveys with overlapping content and differing timelines.
• Analyze data using scopes including industry sub-sectors, revenue size, production volume and geography and access a consistent reporting framework for all job types/families.
• Use consistent job coding and career mapping across all functions nationally and globally.
• Benefit from increased sector coverage including more jobs in core technical fields, more downstream jobs and revamped project management jobs.
Alternative energy
Downstream
Energy mining
Energy-related government entities and regulators
Engineering, procurement, and construction
Exploration and production
Gas operations
Integrated oil and gas
Midstream/pipelines
Off-shore platforms
Oil field servicing
Power utilities
Refineries
Terminal operations/ storage
Upgraders
COMPENSATION INDUSTRY
C O N S U LT I N G . O U T S O U R C I N G . I N V E S T M E N T S .

11800 333 3070 imercer.ca
CROSS-SEGMENT
Regulatory/compliance
Safety/environment
Joint ventures
Marketing
Transportation and supply
Engineering/geology/geophysics
Technicians and technologists
Construction and project management
DOWNSTREAM AND OILFIELD SERVICES
Sales and contracts
Product/brand management
Terminal operations
Refinery operations
Completions
Fluids servicing
Wireline
FIELD/HOURLY
Operators:
Pipeline
Field
Control centre
Heavy equipment
Plant
Trades
GENERAL BENCHMARK
Top management
Investor relations
Economists/risk analysts
Communications/PR
Human resources
Accounting/finance
Document controls
Project controls
UPSTREAM/MIDSTREAM
Community affairs
Production accounting
Drilling management
Exploration and production management
Pipeline management
Land contracts and administration
UTILITIES
Power generation management
Rates analysts
Power analysts
Meter readers
Line and wiremen
Transmission systems management
Energy programs representatives
POSITION FAMILIES (BY COMPENSATION MODULE)
COMPENSATION INDUSTRY
C O N S U LT I N G . O U T S O U R C I N G . I N V E S T M E N T S .

Brought to you by Mercer and the Ontario Municipal
Human Resources Association (OMHRA), the Ontario
Municipal Compensation Survey will equip you with
the insights you need to design competitive
compensation packages that attract and retain
the right people.
In addition, the survey looks at municipal
compensation policies and practices giving you a
better understanding and support for your human
resource programs. The survey will allow you to
support your compensation and HR decisions with
credible and current information.
Special for small municipalities! Mercer also offers a
Small Municipalities Report, which is comprised of
data for 32 of the 222 positions reported, in addition
to the full HR policy report.
POSITION FAMILIES Community services
Corporate services
Development services
Emergency services
Municipal administration
Public works
Areas:
Clerk and HR
Energy management
Fire and police
Parks and recreation
Planning and development
Public health
Roads
Transit
and more
ONTARIO MUNICIPALimercer.ca/municipal
SCHEDULE
Questionnaire sent May
Data effective June 1
Report available October
PRICINGSingle primary user.
Participant $1,900
Nonparticipant $5,700
Add users $150/ea.
Small Municipalities Report
(PDF)
Participant $ 420
Nonparticipant $ 1,260
12 imercer.ca 800 333 3070
ORGANIZATIONS
Participants 60+
Positions 222
Employees 56,000+
COMPENSATION INDUSTRY
C O N S U LT I N G . O U T S O U R C I N G . I N V E S T M E N T S .

13 800 333 3070 imercer.ca
Conducted for over 50 years, the OSPE Employer
Compensation Survey is the only survey in the
marketplace specifically designed for professional
engineers in Ontario. It provides a valuable
picture of hiring trends and compensation levels
across all categories and disciplines of the
engineering profession. The survey covers
engineering responsibility levels from A-F.
This survey is open to any employer of engineers
who work in Ontario.
DATA
Standard Features
• PDF of prepared base salary and total cash compensation
statistics for each of the 6 responsibility levels (A-F)
• Price benchmark roles
• Age statistics
• Run an unlimited number of reports and analyses
• Export and/or print data
• Access pre-defined markets based on 6 established scope
criteria: location, industry, # of engineers, year of
graduation, job type, gross revenues
Premium Features
(All Standard Features Plus)
• Ability to customize markets based on queries you define,
including any combination of 6 standard scopes plus
number of employees, union, gender and engineering
discipline
• Exclude your data from calculations*
• Compare your data to the market*
• Full set of industry reports
*Participants only
SCHEDULE
Questionnaire sent May
Data effective June
Report available September
ONTARIO SOCIETY OF PROFESSIONAL ENGINEERS imercer.ca/ospe
ORGANIZATIONS
Participants 160+
Employees 14,500+
Positions Engineering
responsibility
levels A-F
PRICING
Single primary user.
Standard
Participant $ 325
Nonparticipant $ 975
Premium
Participant $ 650
Nonparticipant $ 1,950
Add users $150/ea.
COMPENSATION INDUSTRY
C O N S U LT I N G . O U T S O U R C I N G . I N V E S T M E N T S .
All-time high participation!
10% increase over 2011!

This survey provides data on compensation, pay
policies and practices and benefits such as wage
planning and merit increase budgets, short-term
incentive programs, overtime, turnover, shift
operations, vacation entitlement and much more.
Data is displayed in aggregate and within key scope
measures such as location and organization/store
revenues and sizes.
Participants are invited to join the Spring and Fall
HR Roundtables for an opportunity to network with
peers, hear from experts on human capital trends
and discuss the participation process and
survey results.
RETAIL INDUSTRY COMPENSATION AND BENEFITS imercer.ca/retail
POSITION FAMILIES
Head office/distribution centre:
Executives
Hourly
Management
Salaried
Store operations:
Full-time/part-time
Management
SCHEDULE
Questionnaire sent February
Data effective April 1
Report available August
HR Roundtable (Spring) March
HR Roundtable (Fall) September
PRICINGSingle primary user.
Participant $ 1,400
Nonparticipant $ 4,200
Add users $150/ea.
ORGANIZATIONS
Participants 80+
Employees 318,000+
Positions 120
Merchandise categories 5
Market categories 21
14 imercer.ca 800 333 3070
Survey results delivered in Mercer WIN®
COMPENSATION INDUSTRY
C O N S U LT I N G . O U T S O U R C I N G . I N V E S T M E N T S .

15800 333 3070 imercer.ca
The Canadian Investment Management Survey
provides the Canadian financial services
community with accurate compensation data
for multiple industry positions. The survey is
presented in partnership with Russell Reynolds
Associates and is supported by senior
industry consultants.
POSITION FAMILIES
Back office operations
Finance
Information technology
Middle office operations
Mortgage administration
Portfolio managers
Private client management
Research/economics
Sales and marketing executives
Senior investment executives
Top executives
Traders
This survey is the leading source for
compensation and HR policy information for
professional services firms employing accounting
professionals in Canada. It is sponsored by the
four largest accounting firms in Canada and
supported by an additional three accountancies
with national operations.
POSITION FAMILIES
Audit
Client accounting services
Financial advisory services
Risk advisory services
Tax
Translation services
SCHEDULE
Questionnaire sent March
Data effective March 1
Report available August
PRICINGSingle primary user.
Participant $3,150
Add users $150/ea.
ORGANIZATIONS
Participants 35
Positions 97
Employees 3,500+
SCHEDULE
Questionnaire sent October
Data effective October 1
Report available February
Results meeting April
PRICING The PSI survey is a non-public
survey and results are available
to participants only. Call for
participation and pricing details.
ORGANIZATIONS
Participants 15
Positions 200
Employees 18,500+
CANADIAN INVESTMENT MANAGEMENT INDUSTRY imercer.ca/cims
PROFESSIONAL SERVICES INDUSTRY imercer.ca/psi
Survey results delivered in Mercer WIN®
COMPENSATION INDUSTRY
C O N S U LT I N G . O U T S O U R C I N G . I N V E S T M E N T S .

SCHEDULE
Questionnaire sent May
Data effective June 1
Report available August
PRICING
Included in EHRA membership
ORGANIZATIONS
Participants 70
Employees 34,000+
Positions 37
Prepared for the Engineering Human Resources
Association (EHRA), this survey provides total annual
cash remuneration data for a wide spectrum of
engineering positions. The EHRA survey helps
association members develop effective
compensation plans for their professional
engineering employees.
POSITION FAMILIES
Engineers
Engineering technicians/
technologists
Project controls
Materials management
Contracts administration
Scientists
ENGINEERING HUMAN RESOURCE ASSOCIATION imercer.ca/ehra
Mercer’s Management and IT Consulting
Compensation Survey collects industry-specific
information regarding compensation and pay
policies in management and information technology
consulting environments.
POSITION FAMILIES
Strategic/organizational
consulting
Business process consulting
Information technology
consulting
Business development
Program/project management
Resource management
SCHEDULE
Questionnaire sent February
Data effective March 1
Report available June
PRICING The MIT survey is a closed survey
and results are available to
participants only. Please call
for details.
ORGANIZATIONS
Participants 15
Employees 7,500+
Positions 28
16 imercer.ca 800 333 3070
MANAGEMENT AND IT CONSULTING imercer.ca/mit
COMPENSATION INDUSTRY
C O N S U LT I N G . O U T S O U R C I N G . I N V E S T M E N T S .

17 800 333 3070 imercer.ca
With key roles exclusive to the medical device
industry, this survey collects and reports results
on total cash and direct compensation, short-
and long-term incentives and includes targets
and payouts for sales positions.
Additionally, participants receive access to either the Mercer Benchmark Database (pg. 3) or the Executive, Management and Professional survey (pg. 9).
POSITION FAMILIES
Clinical field
Clinical trials
Continuing health education
Contract negotiations
Field service
Regulatory affairs
Sales representatives
Evaluate your compensation program with the
broad selection of benchmarks ranging from
biotechnology, pharmaceutical, research, sales,
production and administration.
POSITION FAMILIES
Account management
Applied research
Bio-statistics
Business development
Clinical research
Field sales
Health economics
Investor relations
Laboratory
Medical
Pre-sales engineering
Product/brand management
Quality assurance /control
Regulatory affairs
and more
SCHEDULE
Questionnaire sent February
Data effective April 1
Report available August
ORGANIZATIONS
Participants 28
Positions 24
Employees 1,200
SCHEDULE
Questionnaire sent February
Data effective April 1
Report available September
PRICING Single primary user.
Participant $1,200
Nonparticipant $3,600
Add users $150/ea.
ORGANIZATIONS
Participants 40+
Positions 112
Employees 6,800+
MEDICAL DEVICE TECHNOLOGY imercer.ca/medec
PHARMACEUTICAL AND BIOTECHNOLOGY imercer.ca/pharma
COMPENSATION INDUSTRY
C O N S U LT I N G . O U T S O U R C I N G . I N V E S T M E N T S .
Survey results delivered in Mercer WIN®
PRICING PARTICIPANT ONLY
w/EMP
w/MBD
MEDEC Member
MEDEC Non-Member
$1,850 $7,850
$2,350 $8,350
Survey results delivered in Mercer WIN®

18 imercer.ca 800 333 3070
COMPENSATION MANAGEMENT
COMPENSATION MANAGEMENT OVERVIEW
IN-SOURCING SHARED CO-SOURCING
YOU MANAGE COMPENSATION USING Mercer WIN | ePRISM™ FLEXIBLE COMBINATION OF SERVICES AND
INTERACTION BETWEEN MERCER AND YOU
FORGING A PARTNERSHIP
Mercer can work with you to define the scope and nature of the relationship that will help you meet your business goals. We offer a continuum of services
and solutions permitting you to choose the level of involvement and support appropriate for your organization.
COMPENSATION MANAGEMENT CO-SOURCINGMercer provides this solution to help organizations create a more robust and efficient compensation function. We share responsibility with you for
compensation management transactions, analysis, strategic design and technology. A co-sourcing partnership with Mercer permits you to leverage
our specialized consulting capabilities, global footprint, robust market data and technology.
Learn more at mercer.ca/compensationcosourcing.
A compensation management partnership with Mercer can provide any or all of these advantages depending upon the nature of your engagement.
• Eliminate or reduce staff time spent on transactional activities
• Realize efficiencies related to staffing costs, technology acquisition
and market data
• Shift resources to other higher value/strategic areas of
compensation management
• Mitigate the need to hire staff only during peak periods or for
special projects
• Increase efficiency/effectiveness of compensation services delivery
• Implement global compensation program consistency, governance
and reporting
• Access Mercer Human Capital experts in a spectrum of specialty
niches
C O N S U LT I N G . O U T S O U R C I N G . I N V E S T M E N T S .

The Mercer Workforce Intelligence
Network® (Mercer WIN) is single-point
access to Mercer’s unparalleled survey
data and analytics, representing one of
the most comprehensive and intuitive
platforms available. Mercer WIN is now
the overarching platform for delivering
information and select services to our
clients. See the chart on page 21 for a
comparison of all Mercer WIN solutions.
core
Mercer WIN | Core is the entry-level tool in which many 2012
compensation surveys will be delivered. It provides single-point
access to Mercer survey data and analytics. Using this sophisticated,
yet easy-to-deploy tool, you are able to explore, interpret and
formulate insights on important human capital decisions and
investments. Mercer WIN | Core makes information easily accessible
and readily converts data into charts, graphs and reports. You will
appreciate the flexibility in arranging, plotting and exporting data by
industry, country or other criteria.
PRICING
Complimentary with survey purchase
(For surveys delivered in Mercer WIN)
19800 333 3070 imercer.caC O N S U LT I N G . O U T S O U R C I N G . I N V E S T M E N T S .
COMPENSATION MANAGEMENT
imercer.ca/WIN

20 imercer.ca 800 333 3070
Mercer WIN | Advanced is a next-level compensation solution that
gives you more control over your own data. You’ll get all of the features
in Mercer WIN | Core, plus you can load your own employee data
so you’re always using current information and load market data
from other survey vendors to benchmark jobs. You can also store
benchmarks for future changes, annual updates and easy reporting,
having full confidence that the information will be there when you
need it.
PRICING
$5,000 for a single-user annual license
Mercer WIN | ePRISM is a comprehensive compensation management, modeling and planning tool. It combines compensation-specific tools with powerful analytics and reporting, turning data into information. Mercer WIN | ePRISM streamlines the compensation process and saves you time by providing the following:
• Reporting capabilities – view your results graphically, share reports/charts/diagrams internally, export data into internal report tools
• Market analysis – compile global survey providers, benchmarkpositions, integrate job evaluation results and identify below-market, high-potential employees
• Salary planning – respond quickly to pay plan and model changes and see anticipated changes before they happen; analyze employees by geography, business or level
PRICING
Call or visit imercer.ca/ePRISM for details
COMPENSATION MANAGEMENT
C O N S U LT I N G . O U T S O U R C I N G . I N V E S T M E N T S .
imercer.ca/WIN imercer.ca/WIN

CORE ADVANCED ePRISM
View and analyze Mercer Market Data – One or several market views simultaneously and securely across countries, regions and globally
Store other market data sources in My Market Library – Including Mercer surveys not currently on WIN and non-Mercer
Store other benchmark details – Degree of match, weights and adjustments
Manage team access to data – Through self-service user administration and security controls
Configurable benchmarking capabilities – Includes personalized job definition, job segmentation, benchmarking rules, etc.
Broader support for other market data sources – Including more detailed compensation and benefits data
Benchmark all employees to market – Whether they are matched to Mercer data through a survey process or not
Refine your market by geography, industry, and company size
Combine Jobs and Position Classes to create hybrid roles
Summarize data based on Family, Career Stream, Career Level and Position Class
Normalize data into a common currency
Age data to a common point in time
Unlimited self-service peer groups (participants only)
Print and export results as you desire
Report on, analyze and export data related to your entire population of Jobs and Employees
Personalization of data elements, tracking and field names
Salary structure development and analysis
Annual Salary budget/forecasting tools
Ad-hoc reporting, modeling and analysis
Share Mercer Market Data, My Market Library and My Jobs/My Employees between users across your organization
Mercer WIN This chart compares features across all Mercer WIN products to guide you as you choose a
solution for your organization.
Deluxe security options
Compare My Data against your defined market – based on job averages or incumbents (participants only)
21 800 333 3070 imercer.caC O N S U LT I N G . O U T S O U R C I N G . I N V E S T M E N T S .
COMPENSATION MANAGEMENT
™
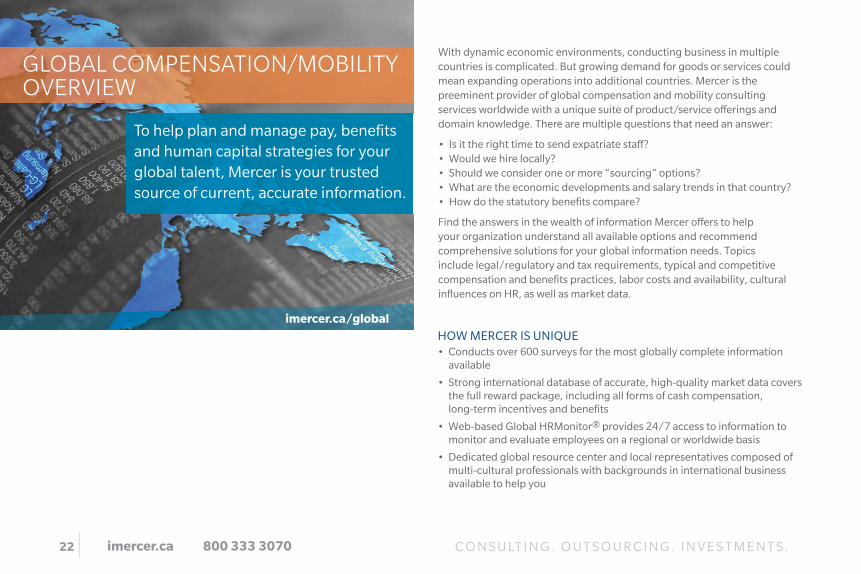
GLOBAL COMPENSATION/MOBILITY OVERVIEW
22 imercer.ca 800 333 3070
HOW MERCER IS UNIQUE
• Conducts over 600 surveys for the most globally complete information
available
• Strong international database of accurate, high-quality market data covers
the full reward package, including all forms of cash compensation,
long-term incentives and benefits
• Web-based Global HRMonitor® provides 24/7 access to information to
monitor and evaluate employees on a regional or worldwide basis
• Dedicated global resource center and local representatives composed of
multi-cultural professionals with backgrounds in international business
available to help you
With dynamic economic environments, conducting business in multiple
countries is complicated. But growing demand for goods or services could
mean expanding operations into additional countries. Mercer is the
preeminent provider of global compensation and mobility consulting
services worldwide with a unique suite of product/service offerings and
domain knowledge. There are multiple questions that need an answer:
• Is it the right time to send expatriate staff?
• Would we hire locally?
• Should we consider one or more “sourcing” options?
• What are the economic developments and salary trends in that country?
• How do the statutory benefits compare?
Find the answers in the wealth of information Mercer offers to help
your organization understand all available options and recommend
comprehensive solutions for your global information needs. Topics
include legal/regulatory and tax requirements, typical and competitive
compensation and benefits practices, labor costs and availability, cultural
influences on HR, as well as market data.
To help plan and manage pay, benefits
and human capital strategies for your
global talent, Mercer is your trusted
source of current, accurate information.
imercer.ca/global
C O N S U LT I N G . O U T S O U R C I N G . I N V E S T M E N T S .

EXPATRIATE COMPENSATION NETWORKS
Regional expatriate workforce networks allow participants to share information and innovative approaches to managing international
compensation and a global workforce. Mercer consultants facilitate the meetings, plan agendas and provide expertise, including relevant
outside speakers who offer comprehensive knowledge in areas beyond international compensation.
For details, visit imercer.ca/gmevents.
EXPATRIATE MANAGEMENT TRAINING SEMINARS
These seminars offer hands-on consultant training and are designed as a two-day course of introduction and application, but an option to
participate in only one day is available. Our expatriate compensation seminars earn certification credits from SHRM, WorldatWork and
Worldwide ERC.
Principles of the Balance Sheet Approach to Expatriate Compensation is a one-day, in-depth explanation of the Balance Sheet
methodology created for HR or compensation professionals with less than three years’ experience in expatriate compensation or program
management.
Advanced Data Applications, Compensation Approaches, and Policy Development is a one-day training seminar on pay packages and key
policy, building on the skills learned in the principles seminar. You will learn advanced compensation techniques, examine the methodology
behind short-term assignment compensation and take a strategic approach to tailoring your international policies with that of your company’s
business philosophy.
Attend a one-day seminar for $875 or two back-to-back seminars for $1,600 per person. View dates and locations at
imercer.ca/expatseminars.
NORTH AMERICA EXPATRIATE MANAGEMENT CONFERENCE
The North America Expatriate Management Conference is a major networking and learning opportunity for HR professionals who want to stay
abreast of the latest trends and practices in international assignments.
Held annually. Visit imercer.ca/naexpatconf for details.
GLOBAL MOBILITY EVENTS AND TRAINING imercer.ca/gmevents
23 800 333 3070 imercer.ca
GLOBAL COMPENSATION/MOBILITY
C O N S U LT I N G . O U T S O U R C I N G . I N V E S T M E N T S .

TRS provides valuable local, regional, and global market data, saves time
and is cost effective for designing competitive pay packages.
TOTAL REMUNERATION SURVEYS imercer.ca/trs
24 imercer.ca 800 333 3070
CONSIDER THESE QUESTIONS . . .
• Do you have an easy-to-use tool to compare compensation and benefits
across geographies?
• Can you evaluate the competitive position of each total remuneration
element?
• Is your pay strategy consistent enough to ensure external competitiveness
and maintain internal equity?
• Do you instantly generate customized comparisons of your organization
against the market?
. . . FIND THE ANSWERS USING TRS!
Mercer Total Remuneration Surveys (TRS) provide consistent, high-quality
market data, including all forms of cash compensation, long-term incentives
and benefits. TRS is one common global survey so everything is the same – the
jobs, the data, the methodology and the online tool. The surveys cover an
average of 400 benchmark positions from the executive to administrative level
in over 100 countries across multiple regions.
BOTTOM LINE
TRS has great flexibility and multiple users can have access to the same survey.
HR professionals at the world’s leading organizations use TRS to remain cost
effective and competitive in the global marketplace.
GLOBAL COMPENSATION/MOBILITY
C O N S U LT I N G . O U T S O U R C I N G . I N V E S T M E N T S .

Base salary Monthly base salary times the number of months paid
Total guaranteed cash compensation Base salary plus guaranteed allowances
Total cash compensation Total guaranteed cash compensation plus short-term incentive, sales incentive, profit sharing/other
Total direct compensation Total cash compensation plus long-term incentive awards, valued using Black-Scholes methodology
Total remuneration Total direct compensation plus benefits and perquisites
25800 333 3070 imercer.ca
WHAT DO YOU RECEIVE?
Online access – TRS surveys delivered online through Mercer WIN®, accessible anywhere, anytime – makes market pricing a snap
Survey overview – review salary practices, compensation mixes, employment trends and human resource economic indicators
Benefits summary – information on short- and long-term incentives and benefits practices including retirement, company cars,
pensions and medical benefits
Actual market data – detailed market analysis of individual positions within job families
Market regression – regression statistics and graphs for the major components of total remuneration
Custom analysis – generate custom statistics based on peer groups, revenue size and total employees
TRS – HELPS MAKE INFORMED DECISIONS
Consistency – apply the same methodology to about 400 general industry jobs
Coverage – access benchmark positions in over 100 countries
Reliability – consistent participation by organizations in each country
Versatility – use online tools to analyze survey data and conduct what-if analyses
EVALUATE THE TOTAL REWARD PACKAGE
Total Remuneration Surveys are made up of five components providing a complete picture of total remuneration data.
GLOBAL COMPENSATION/MOBILITY
C O N S U LT I N G . O U T S O U R C I N G . I N V E S T M E N T S .

Membership provides value to organizations through the global coordination of services,
consistency of methodologies and jobs, and opportunities to network with peer organizations.
TRS MEMBERSHIP imercer.ca/membership
26 imercer.ca 800 333 3070
The TRS membership program ensures that you have quick and easy access to Mercer’s total remuneration data and services around the world.
Benefits include:
• Special pricing – multi-country membership savings
• Dedicated client relationship manager – one point of contact to coordinate your services
• Personalized services – implementation, project management, and training
TRS IS AVAILABLE IN OVER 100 COUNTRIES, INCLUDING:
Algeria
Argentina
Australia
Austria
Azerbaijan
Bahrain
Bangladesh
Belarus
Belgium
Bolivia
Brazil
Bulgaria
Canada
Chile
China-Beijing
China-Changzhou/
Wuxi
China-Chengdu/
Chongqing
China-Dalian
China-Guangdong
China-Hangzhou
China-Nanjing
China-Qingdao
China-Shanghai
China-Shenyang/
Changchun
China-Suzhou
China-Tianjin
China-Wuhan
China-Xiamen/
Fuzhou
China-Xi’an
Colombia
Costa Rica
Croatia
Czech Republic
Denmark
Dominican
Republic
Ecuador
Egypt
El Salvador
Estonia
Finland
France
Germany
Greece
Guatemala
Honduras
Hong Kong
Hungary
India
Indonesia
Ireland
Israel
Italy
Japan
Kazakhstan
Kuwait
Latvia
Lithuania
Malaysia
Mexico
Moldova
Morocco
Netherlands
New Zealand
Nicaragua
Norway
Oman
Pakistan
Panama
Paraguay
Peru
Philippines
Poland
Portugal
Puerto Rico
Qatar
Romania
Russia
Saudi Arabia
Serbia
Singapore
Slovakia
Slovenia
Spain
Sri Lanka
Sweden
Switzerland
Taiwan
Thailand
Tunisia
Turkey
Ukraine
United Arab
Emirates
United Kingdom
United States
Uruguay
Venezuela
Vietnam
GLOBAL COMPENSATION/MOBILITY
C O N S U LT I N G . O U T S O U R C I N G . I N V E S T M E N T S .

27 800 333 3070 imercer.ca
GLOBAL COMPENSATION/MOBILITY
C O N S U LT I N G . O U T S O U R C I N G . I N V E S T M E N T S .
The new Benefits Survey for Expatriates and Internationally
Mobile Employees offers a unique opportunity to identify
multinational company policies and trends when providing
employee benefit programs for international assignees.
The survey covers benefit programs across regions of operation,
industries, company size, revenue levels and number of
expatriates.
BENEFITS SURVEY FOR EXPATRIATES AND INTERNATIONALLY MOBILE EMPLOYEES imercer.ca/expatbenefits
TOPICS SURVEYED
• The latest trends in international benefit policies and regional differences
• Retirement benefits
• Medical benefits
• Risk benefits (death, disability, accident)
• Localization
• Types of international assignments
• Program monitoring
• Common areas of success and failure
• General policies and trends
SCHEDULE
Release date May
PRICING (USD)
Participant $ 500
Nonparticipant $1,500
This survey is one of the largest of its kind ever
conducted, covering 288 multinational
companies and 119,000 expatriates.

28 imercer.ca 800 333 3070
GLOBAL COMPENSATION/MOBILITY
C O N S U LT I N G . O U T S O U R C I N G . I N V E S T M E N T S .
Determine fair and cost-effective expatriate compensation.
COST OF LIVING imercer.ca/col
COST OF LIVING – THE BENEFIT OF TWO APPROACHES
Finding the best way to address the cost-of-living issue is a challenge
when managing a modern global workforce that originates in, and is
assigned to, a diverse array of locations. To help find the optimal
solution, Mercer offers two distinct approaches and several
index types.
1. MERCER MULTINATIONAL COST OF LIVING
Mercer’s Cost-of-Living surveys account for the cost of more than
200 goods and services. Surveys are conducted simultaneously by
independent researchers in 325 locations. Carefully chosen
vendors reflect only those outlets where your expatriates can buy
goods and services of international quality. Mercer’s precise cost-
of-living information allows companies to assess fair and
competitive cost-of-living allowances.
The multinational cost-of-living approach develops indices and
differentials based on a blended spending pattern among a variety
of expatriate types, nationalities and assignment patterns. With the
same weighting of goods and services for all locations, this
approach compares prices of similar brands from similar retail
outlets in the home city and host city. Indices may be “reversible.”
SCHEDULE
Updated twice a year
PRICING (USD)
Per location $ 775
COVERAGE
Countries 152
Locations 325
Contact us for custom location surveys
REPORT SNAPSHOT
City-to-city index comparison
Home country/international spendable income
Home country housing norms
Expatriate accommodation costs
International education costs
Business travel expenses
Actual item price lists

29 800 333 3070 imercer.ca
2. MERCER ORC COST OF LIVING
The Mercer ORC Cost of Living approach develops cost-of-living
indices and differentials that are based on the unique spending
patterns in a base (usually home or headquarters) country. By
using different weights for each home country, the approach
ensures that expatriates can retain their expenditure pattern in the
host location. This compares prices in the home country from a
local-national perspective to prices in the host city from an
expatriate perspective. Indices are not “reversible.”
Both of the ongoing service relationships offered include online
access to up-to-date information; Home-Country Data and Tax
Profiles; limited telephone consulting with an international
consultant (or team) assigned to your company; a user guide for
applying the data; and quarterly publications on expatriate living,
international HR administration and expatriate tax issues.
SCHEDULE
Ongoing updates (at least four times a year)
PRICING (USD) — SERVICE RELATIONSHIPS
Single-Base Country Service $ 1,500*
Appropriate for transferring employees of only one nationality;
purchase data from a single home country to any assignment location
Multinational Pay Systems Service $ 2,730*
Order data from any home country to any assignment location
*Plus additional fee for each home/host combination
Options Available with Service Relationships
International Compensation Tables
Request international compensation tables to determine
cost-of-living allowances, foreign housing costs, home-country
housing norms and hypothetical taxes
Most locations $ 780
(annual subscription with quarterly updates)
One-time table $ 475
COVERAGE
Home locations 162
Assignment (host) locations 375
GLOBAL COMPENSATION/MOBILITY
C O N S U LT I N G . O U T S O U R C I N G . I N V E S T M E N T S .

Don’t risk your talent assets. Use this bestselling
global report and leading source of information on
economic and salary increase trends.
GLOBAL COMPENSATION PLANNING imercer.ca/gcpr
30 imercer.ca 800 333 3070
For making timely, fully informed decisions on compensation budgeting,
Mercer has the interactive, online Global Compensation Planning Report
(GCPR). GCPR-Online is continuously updated so the hard-to-find data
that will make a difference in evaluating your compensation plans and
budgets is at your fingertips.
GCPR-ONLINE
GCPR-Online is always available with reliable, timely information that can
be downloaded for offline planning. With 15 years of economic and
salary change data, you can observe and analyze short- and long-term
trends. GCPR-Online includes some remarkable features:
• Fast, online access for one year, including the July/October
PDF reports
• View your compensation data online, anytime, from anywhere
• Country-specific data delivered as it becomes available
• Interactive charting tool displays up to 15 years of pay increase data
• Download data into Excel® for offline planning
• Proprietary videos on current compensation topics
SCHEDULE
GCPR-Online Ongoing
PDF reports available July/October
PRICING (USD)
GCPR-Online $ 2,500
July/October PDF reports $ 990
COVERAGE
Countries 114
REPORT SNAPSHOT
Salary increase trends
Economic indicators and trends
GDP growth
Inflation
Unemployment rates
Regional overviews
Short-term incentives
GLOBAL COMPENSATION/MOBILITY
C O N S U LT I N G . O U T S O U R C I N G . I N V E S T M E N T S .

31 800 333 3070 imercer.ca
GLOBAL MOBILITY ASSESSMENT SURVEY imercer.ca/assessment
The Global Mobility Assessment Survey is a simple
and cost-effective benchmark of your expatriate
compensation practices against those of over
250 top global companies.
DELIVERY METHODS
Assessment Survey Executive Summary outlines best practices for key expatriate policy elements, provides critical findings by industry and expatriate program size and details mobility demographics and cost trends.
Customized Assessment Survey Reports are desktop review tools that provide an individualized analysis of the cost impact of your company’s global mobility policy. You can benchmark to all survey participants, choose a comparator set of seven or more companies that best suits your needs or both.
Online Dashboard allows you to get the latest benchmarking data and create custom analysis and deliverable reports. You can filter and report the data to analyze your company’s package cost position against a range of comparator groups customized for a specific category (industry, region, expatriate population size, revenue, administrative function).
The survey provides every participating company with an individual
comparison of the cost impact of its key expatriate package elements.
PRICING (USD)
Executive Summary Complimentary
(With purchase of an Individualized Assessment Report)
Individualized Assessment Report $ 2,000
(Your company vs. all survey participants)
Custom Individualized Assessment Report $ 2,500
(Your company vs. a set of companies of your choice)
New Online Dashboard – Yearlong access $ 1,000
Bundled Option – All of the above $ 5,000*
*$500 savings
GLOBAL COMPENSATION/MOBILITY
C O N S U LT I N G . O U T S O U R C I N G . I N V E S T M E N T S .

This easy-to-read report gives concise pay
information to stay updated on global salary trends.
GLOBAL PAY SUMMARY imercer.ca/gps
32 imercer.ca 800 333 3070
For busy HR professionals, Mercer Global Pay Summary (GPS) is the
quick reference for current, reliable global pay information. Stay up to
date on salary trends to enable fast, informed decision making without
the need to refer to weighty databases.
Find the answers to these questions and more.
• What would an IT head be paid if moving between countries?
• What do Western European CEOs typically earn?
• How do salaries compare for customer service officers?
• What is total cash compensation for an HR manager in Japan?
Completely updated and increased to 69 countries, the 2012 report
is available in four regional volumes to help you make knowledgeable
decisions. The 11 job families range from entry level to upper
management and include easy-to-read information for
50 benchmark positions.
SCHEDULE
Report available January
PRICING (USD)
Americas $ 560
Asia-Pacific $ 560
Eastern Europe/Middle East $ 560
Western Europe $ 560
All volumes/Best value $ 1,870
COVERAGE
Countries 69
POSITION FAMILIES
Administration
Corporate affairs
Engineering
Finance
General management
Human resources
Information technology
Operations
Research and development
Sales and marketing
Supply and logistics
REPORT SNAPSHOT
At-a-glance data by position
Annual base pay/total cash by country
Regional position comparison
GLOBAL COMPENSATION/MOBILITY
C O N S U LT I N G . O U T S O U R C I N G . I N V E S T M E N T S .
33 800 333 3070 imercer.ca
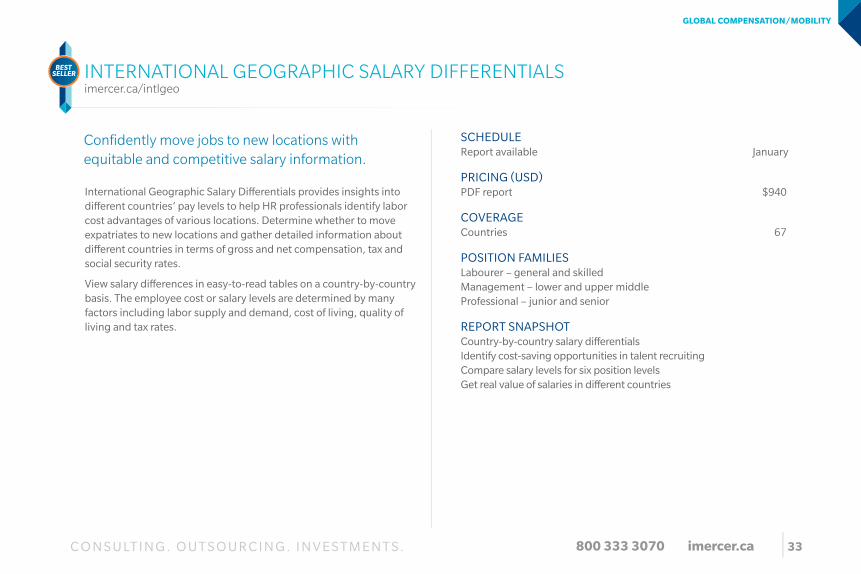
INTERNATIONAL GEOGRAPHIC SALARY DIFFERENTIALS imercer.ca/intlgeo
Confidently move jobs to new locations with
equitable and competitive salary information.
International Geographic Salary Differentials provides insights into
different countries’ pay levels to help HR professionals identify labor
cost advantages of various locations. Determine whether to move
expatriates to new locations and gather detailed information about
different countries in terms of gross and net compensation, tax and
social security rates.
View salary differences in easy-to-read tables on a country-by-country
basis. The employee cost or salary levels are determined by many
factors including labor supply and demand, cost of living, quality of
living and tax rates.
SCHEDULE
Report available January
PRICING (USD)
PDF report $940
COVERAGE
Countries 67
POSITION FAMILIES
Labourer – general and skilled
Management – lower and upper middle
Professional – junior and senior
REPORT SNAPSHOT
Country-by-country salary differentials
Identify cost-saving opportunities in talent recruiting
Compare salary levels for six position levels
Get real value of salaries in different countries
GLOBAL COMPENSATION/MOBILITY
C O N S U LT I N G . O U T S O U R C I N G . I N V E S T M E N T S .

Mercer Global HRMonitor is a web-based application
designed to support you in managing your expatriate
employees worldwide.
MERCER GLOBAL HRMONITOR®
imercer.ca/ghrm
34 imercer.ca 800 333 3070
With instant access to data, reports, and calculators, you will have the
most sophisticated and easy-to-use global mobility database on the
market. The online calculators let users customize data and expedite
delivery of quality information to meet the needs of hr programs,
administrators and employees.
Mercer global mobility calculators include:
• Cost-of-Living Allowance
• Cost-of-Living Index
• Employment Conditions Comparator
• Exchange Rates and Inflation Calculator
• Expatriate Accommodation Costs
• Expatriate Compensation
• Hypothetical Tax Calculator
• International Spendable Income
• Quality-of-Living Index
• Short-term Assignment Allowance
• Spendable Income, Home Housing Norm and Saving
• Statutory Benefits Comparator
PRICING
Based on reports purchased
COVERAGE
Global
SNAPSHOT
Make home country balance-sheet calculations
Address expatriate cost-of-living differences
Compensate employees on short-term assignments
Set the quality-of-living/hardship allowances
Assess expatriate tax issues
Identify global statutory benefit and employment conditions
Compare local pay and benefits packages
Review key economic indicators
Learn about host countries
GLOBAL COMPENSATION/MOBILITY
C O N S U LT I N G . O U T S O U R C I N G . I N V E S T M E N T S .

Transform how you manage and administer your mobile workforce.
35 800 333 3070 imercer.ca
MERCER’S INTERNATIONAL ASSIGNMENT MANAGEMENT SOLUTION imercer.ca/expatmgmt
GLOBAL COMPENSATION/MOBILITY
C O N S U LT I N G . O U T S O U R C I N G . I N V E S T M E N T S .
PRICING
Based on chosen services
SNAPSHOT
This cost-effective, time-saving tool will automate:
Compensation and payroll reporting, including balance sheets
Cost projections
Exception from policy tracking
Ability to create customized user reports
Assignment tracking, including supplier management, contract
management, workflow and assignee communications
Expense management and actual pay tracking
Travel calendars
Worldwide compensation data collection
Mercer’s new technology offering, AssignmentPro™, provides
end-to-end automation to effectively manage all aspects of
international assignments. The system houses all information
in a single, easy-to-use format, removing the need to outsource
expatriate administration.

The Mobility Starter Kit was created to assist
companies new to global mobility to get their
programs up and running.
MERCER MOBILITY STARTER KIT imercer.ca/mobilitystarterkit
36 imercer.ca 800 333 3070
The Mobility Starter Kit has three delivery options:
TIER I PACKAGE
The Tier I option is a bundled service offering that provides all the
information necessary to consider before, during and after deploying
staff globally, as well as a set of individualized costing and
communication tools:
• Global Mobility Handbook
• Total Assignment Cost Projections and Setup
• An Assignment Balance Sheet and corresponding Host Housing Page
• MercerPassport® Report
• Expatriate Checklists
• Letter of Assignment (LOA) – List of items to include only
In addition to the core elements above, you can choose one of the
following reports best suited for your policy needs:
• Short-term Per Diems for a specific location
• Location Evaluation Report (Hardship report)
• International Car Policies Report
PRICING (USD)
Tier I Package $ 6,000
Tier II Package $ 10,000
Tier III Package $ 14,000
TIER II PACKAGE
The Tier II service offering is designed for organizations seeking
Mercer’s expertise in streamlining their global mobility policy. We will
guide you through the development of your expatriate management
program, focusing on developing concrete plans for all policy
elements.
Following collaborations with your team, Mercer will provide a
completed Policy Development Workbook to help jump-start your
mobility program.
TIER III PACKAGE
Includes all elements of Tier I and Tier II packages.
GLOBAL COMPENSATION/MOBILITY
C O N S U LT I N G . O U T S O U R C I N G . I N V E S T M E N T S .

37 800 333 3070 imercer.ca
TOTAL EMPLOYMENT COSTS AROUND THE WORLD imercer.ca/employmentcosts
Assess the fairness and competitiveness of employee
pay and identify cost-saving opportunities.
Growing competition and workforce mobility have increased the
demand for information on total employment costs. Salaries,
bonuses and cash-based incentive compensation are easy enough to
compute. But total employment costs – an employer’s real costs –
need to be addressed for employers struggling to set remuneration
strategies that attract and retain the right employees.
Total Employment Costs around the World provides an easy-to-read
analysis of total costs and employee value in major markets.
Comparisons by country include total remuneration for mandatory
employer contributions (social security, pension and medical) and
typical employer-sponsored benefits (retirement and savings, health,
death, disability, car and other benefits). This report will help to
manage costs and optimize human capital investments.
SCHEDULE
Report available March
PRICING (USD)
PDF report $940
COVERAGE
Major markets 68
REPORT SNAPSHOT
Identify cost-saving opportunities in talent recruiting
Insights on critical total employment cost issues
and challenges
Acquire key information for business planning and budgeting
Compare differences for selected positions
GLOBAL COMPENSATION/MOBILITY
C O N S U LT I N G . O U T S O U R C I N G . I N V E S T M E N T S .

Get up-to-date, critical facts on global benefit
practices and statutory regulations.
WORLDWIDE BENEFIT & EMPLOYMENT GUIDELINES imercer.ca/wbeg
38 imercer.ca 800 333 3070
Because benefit laws and regulations change constantly, it is time
consuming and expensive to keep up. Worldwide Benefit & Employment
Guidelines (WBEG) is the top-selling, trusted resource for
comprehensive information on employment conditions, statutory
employee benefits and typical employer benefit practices.
WBEG-ONLINE
For immediate information, WBEG-Online provides fast access to
comprehensive WBEG data on benefits around the world. Key benefits
include:
• Fast, online access for one year to the entire set of WBEG reports
• Updated monthly to stay informed on relevant changes
• Employment Conditions Calculator compares specific employment
provisions and contract features between countries
• Statutory Benefits Calculator evaluates country-specific statutory
benefits and contributions required by law
• Download information by country instead of region
With extensive analysis and narrative reports, WBEG offers unparalleled
quality and is the ultimate reference for worldwide benefit and
employment information. WBEG is available in five easy-to-use volumes
for the major economic regions of the world.
SCHEDULE
WBEG-Online Ongoing
PDF reports available July
PRICING (USD)
WBEG-Online $ 9,900
Americas $ 1,310
Asia-Pacific $ 1,740
Eastern Europe $ 1,740
Middle East & Africa $ 1,310
Western Europe $ 1,740
All volumes/Best value $ 7,050
COVERAGE
Countries 62
REPORT SNAPSHOT
Country overview
Employment conditions
Statutory benefits
Typical benefits practices
GLOBAL COMPENSATION/MOBILITY
C O N S U LT I N G . O U T S O U R C I N G . I N V E S T M E N T S .

39 800 333 3070 imercer.ca
WORLDWIDE SURVEY OF INTERNATIONAL ASSIGNMENT POLICIESAND PRACTICES imercer.ca/wiapp
The most comprehensive survey on international
assignment policies and practices.
Finding the right talent for your expatriate assignments is not easy.
Ensuring their assignment package is fair and cost-effective is even
more difficult. In today’s economic climate, it is essential for your
company to compare against up-to-date expatriate policy and practice
data in order to remain competitive.
The Worldwide Survey of International Assignment Policies and
Practices (WIAPP) will help you uncover current trends in international
assignment program management and evaluate your policy
competitiveness and market positioning for specific assignment types,
so your expatriate program can be more effective.
FAST FACTS
• WIAPP has the largest survey participant base in the industry, with
the 2011 edition gathering data from over 1,000 global companies,
including the Top 10 Fortune 500® companies
• Participants receive a FREE regional question-by-question analysis
report
• The full All-Region Report, which includes analysis and the
Executive Summary, is available to participants at a discount
• Custom report cuts by any comparator group are available
PRICING (USD) – PARTICIPANTS ONLY
All-region report $ 500
Custom cut comparisons $ 1,500
IN 2012 – GLOBAL MOBILITY ASSESSMENT SUITE
WIAPP now includes the Global Mobility Assessment Suite, a new way
to understand best practices for long- and short-term international
assignments from early to mid-career assignments, C-Suite to high-
potential new hires and permanent moves to intra-regional transfers.
GLOBAL COMPENSATION/MOBILITY
C O N S U LT I N G . O U T S O U R C I N G . I N V E S T M E N T S .

The Global Mobility Metrics report can help focus
your mobility decision making and identify gaps in
your international assignment program.
Metrics places objectivity in the perceptions of managers and
expatriates. It provides a rationale for informed decisions – and a
“defense” of the mobility policy if warranted. But the impact of
metrics goes further, allowing HR to predict future needs.
Linking mobility decisions to business results, this report covers the
relevance of demographics on benchmark data and analyzes how
they impact short- and long-term retention. It shows how expatriate
package elements and processes are correlated against short- and
long-term retention.
GLOBAL MOBILITY METRICS: FOCUS ON RETAINING KEY TALENT imercer.ca/mobilitymetrics
The Global Mobility Handbook gives you practical
information to consider before, during and
after deploying staff around the world.
• Administration
• Pre-assignment preparation
• Pay packages and compensation design
• Budgeting/cost containment
• Tax
• Repatriation
Volume 1 is a primer for international assignment administrators
who are newcomers to the expatriate field. Volume 2 offers
advanced topics. Both volumes provide insights and guidelines for
successful expatriation. The Handbook covers all phases of the
expatriation process:
40 imercer.ca 800 333 3070
GLOBAL MOBILITY HANDBOOK (VOLUMES 1 AND 2) imercer.ca/mobilityperspectives
SCHEDULE
Release date July 2011
PRICING (USD)
Per report $ 940
PRICING (USD)
Per volume $ 940
Both volumes $ 1,600
GLOBAL COMPENSATION/MOBILITY
C O N S U LT I N G . O U T S O U R C I N G . I N V E S T M E N T S .

For detailed information visit imercer.ca
is a leading global provider of
consulting, outsourcing and investment services, with
more than 25,000 clients worldwide. Mercer consultants
help clients design and manage health, retirement and
other benefits and optimize human capital. The firm also
provides customized administration, technology and total
benefit outsourcing solutions. Mercer’s investment
services include global leadership in investment consulting
and multi-manager investment management. Mercer’s
global network of more than 20,000 employees, based
in over 40 countries, ensures integrated, worldwide
solutions. Our consultants work with clients to develop
solutions that address global and country-specific
challenges and opportunities. Mercer is experienced
in assisting both major and growing,
mid-size companies.

161 Bay Street, P.O. Box 501
Toronto, ON
M5J 2S5
Argentina
Australia
Austria
Belgium
Brazil
Canada
Chile
China
Colombia
Czech Republic
Denmark
Finland
France
Germany
Hong Kong
India
Indonesia
Ireland
Italy
Japan
Malaysia
Mexico
Netherlands
New Zealand
Norway
Peru
Philippines
Poland
Portugal
Saudi Arabia
Singapore
South Korea
Spain
Sweden
Switzerland
Taiwan
Thailand
Turkey
United Arab
Emirates
United Kingdom
United States
Venezuela
For further information, please contact your local
Mercer office or visit our website at imercer.ca.
Copyright 2012 Mercer LLC. All rights reserved.
Pre-order 2012 results and receive 2011 prices!Non-participant orders placed prior to the release of the
survey results using offer code CA12CAT will receive
2011 pricing!