Compatibilisation of Powdered Nitrile Rubber Toughened Polystyrene
207
COMPATIBILISATION OF POWDERED NITRILE RUBBER TOUGHENED POLYSTYRENE Thesis submitted to the COCHIN UNIVERSITY OF SCIENCE AND TECHNOLOGY in partinlfulfilment of the requirements for the award of the degree of DOCTOR OF PHILOSOPHY under the F ACULTY 0 .. ' TECHNOLOGY by SREENIV ASAN P.V. DEPARTMENT OF POLYMER SCIENCE AND RUBBER TECHNOLOGY COCHIN UNIVERSITY OF SCIENCE AND TECHNOLOGY KOCHI • 682 022, INDIA. October 2007
Transcript of Compatibilisation of Powdered Nitrile Rubber Toughened Polystyrene

COMPATIBILISATION OF POWDERED
NITRILE RUBBER TOUGHENED
POLYSTYRENE
Thesis submitted to the
COCHIN UNIVERSITY OF SCIENCE AND TECHNOLOGY
in partinlfulfilment of the requirements for the award of the degree of
DOCTOR OF PHILOSOPHY
under the
F ACUL TY 0 .. ' TECHNOLOGY
by
SREENIV ASAN P.V.
DEPARTMENT OF POLYMER SCIENCE AND RUBBER TECHNOLOGY
COCHIN UNIVERSITY OF SCIENCE AND TECHNOLOGY
KOCHI • 682 022, INDIA.
October 2007

DEPARTMENT OF POLYMER SCIENCE AND RUBBER TECHNOLOGY
COCHIN UNIVERSITY OF SCIENCE AND TECHNOLOGY KOCHI-682 022, INDIA.
Dr. Pbilip Kurian
Professor
CERTIFICATE
Phone: 0484-2575723 (Off)
0484-2575590 (Res)
E-mail: [email protected]
This is to certify that the thesis entitled "Compatibilisation of Powdered
Nitrile Rubber Toughened Polystyrene" is based on the authentic research carried
out by Mr. Sreenivasan P.V. under my guidance and supervision, in the
Department of Polymer Science and Rubber Technology, Cochin University of
Science and Technology, Kochi-682 022, and no part of the work reported in the
thesis has been presented for the award of any degree from any other institution.
(]~ Dr. Philip Kurian
Kochi-22
15 October 2007

DECLARATION
I hereby declare that the work presented 10 this thesis entitled
"Compatibilisation of Powdered Nitrile Rubber Toughened Polystyrene" is
based on the original research work carried out by me under the guidance and
supervision of Dr. Philip Kurian, Professor, Department of Polymer Science and
Rubber Technology, Cochin University of Science and Technology,
Kochi-682 022 and no part of the work reported in this thesis has been presented
for the award of any degree from any other institution.
,~~I.U.: '----- -'
Kochi-22 Sreenivasan P.V.
15 October 2007

Acknowledgements
The successful completion of the present research endeavour was made
possible by the generous, enthusiastic and inspiring guidance of my supervising
teacher Dr. Philip Kurian, Professor, Department of Polymer Science and Rubber
Technology, Cochin University of Science and Technology, Kochi-22. I owe an
immense debt of gratitude to him for the judicious encouragement, the scholarly and
illuminating criticism and stimulating suggestions provided to me throughout the
tenure of my research work.
I am thankful to Dr. Thomas Kurian, Head of the Department, Polymer
Science and Rubber Technology, and former Heads of the Department,
Dr. lLE. George and Dr. Rani Joseph for providing me the necessary facilities.
I am thankful to the faCUlty members of the Department of Polymer Science
and Rubber Technolog, Dr. Eby Thomas Thachil, Dr. Sunil K Narayanankutty,
laboratory staffs, Mr. Ravi, Mr. Gopalakrishnan, Mr. Manoharan and the librarian,
Mrs. Girija for their good wishes and support
I would like to express my heartfelt thanks to all my co-researchers,
especially Dr. Lovely Mathew, Mr. P. Raju, Mr. M.K. Joshi, Mr. Jude Martin
Mendez, Ms. Maya, Ms. K. V. Aswathy, Mr. Parameswaran, Dr. Anoop,
Mr. Bipinbal, Ms. Saritha Chandran, Ms. Dhanya, Ms. Prema, Ms. Ansu Jacob,
Mr. Sin to Jacob, Ms. Suma, Ms. Mary Alexander and Ms. Bhuvaneswary for the
fruitful interactions and supports given to me.

I gratefully acknowledge the support received ft'om the Manager, Principal
and former Principal Dr. Raju K John, Union Chri.'Itian College, Aluva. With
immense pleasure I take this opportunity to thank Ms. Roshni Mathew Maliakal,
Dr. Benny Cherian and Dr. K.P. Unllikris/man of the Dept. of ChemistlY,
Union Christian College, Aluva for their valuable support and encouragement. The
endless inspiration and support I received from my family members are highly
appreciated.
I wish to thank the University Grants Commission, New Delhi for the award
of Teacher Fellowship for the completion of the resear£'/, work.
Above all, I thank God Almighty for his blessings for
successful completion of the research work.
Sreenivasan P.V.

Preface
The mechanical properties of polymer blends are strongly influenced by
the strength of the interfaces between the different phases. Polymeric materials
gain their strength and toughness from molecular entanglement or cross linking
between the chains. The main hindrance to crack propagation is the energy
dissipated in the inelastic deformation around the nick. This deformation is
triggered by the high stresses borne by the chains right at the crack tip. In
uncrosslinked polymers chains at the crack-tip are not entangled on both sides of
the interface and often experience facile pullout, initiating little inelastic
deformation and contributing nothing to toughness. Interfaces between polymer
phases are normally narrow in incompatible blends compared to average distance
between entanglements along a chain, so there is little cross-interface
entanglement. Hence, the strenbrths or toughness of interfaces are normally low.
The most common way to strengthen a polymer-polymer interface is to
incorporate or synthesise a block or graft copolymer at the interface, so that one of
the two types of block or graft chains mixes with each of the two substrate
polymers. As long as the block or graft chains are long enough to entangle with the
substrate polymers, the copolymer will increase the mechanical coupling and
normally strengthen the interface. The other main reason for introducing block or
graft copolymers into polymer blends is to refine the phase size by decreasing
interfaciql tension and suppressing phase coalescence. Effective phase size control
does not require the block or graft copolymer chains to be long enough to entangle
with those of the substrate polymers, so selection of the right compatibiliser at the
optimum levels increases the interfacial area and interfacial adhesion ..
The present study alms at the preparation of an ABS
(acrylonitrile-butadiene-styrene) type toughened thermoplastic by melt blending

Preface
polystyrene (PS) and powdered nitrile rubber (NBR). The product is an interesting
class of toughened thennoplastic, which would combine the superior mechanical
and processing characteristics of PS and the excellent oil-resistant properties of
NBR. In this thesis an attempt has been made to investigate systematically the
effect of compatibilisation and dynamic vulcanisation on the morphology and
properties of powdered nitrile rubber toughened polystyrene.
The results of the investigation on the compatibilisation of powdered
nitrile rubber toughened polystyrene in this thesis are divided into seven chapters.
Chapter 1 presents the fundamentals of blending, need for
compatibilisation and morphology development. A review of the current research
in this field is also presented.
Chapter 2 discusses varIOUS materials used for the study. The
experimental techniques used for blending, sample preparation and measurement
of various properties are also discussed.
Chapter 3 focuses on the preparation of toughened thennoplastic polymer
by melt blending polystyrene with uncrosslinked and partially crosslinked
powdered nitrile rubber powder (NBR and XNBR) and to evaluate mechanical
properties, morphology, dynamic mechanical properties, melt rheology and
thermogravimetric analysis of the resulting blends.
Chapter 4 discusses the effects of dynamic cross linking on the
morphology, mechanical properties, dynamic mechanical propertie.s, melt rheology
and thennal properties of powdered nitrile rubber toughened polystyrene.
Chapter 5 discusses the compatibilisation of powdered nitrile rubber
toughened polystyrene with maleic anhydride modified polystyrene (MAPS) and
phenolic modified polystyrene (PhPS). The effect of compatibilisation on
morphology, mechanical properties, dynamic mechanical properties, rheological
ii

Preface
characteristics and thennal properties of nitrile rubber toughened polystyrene is
also explained in this chapter.
Chapter 6 deals with the effect of styrene-acrylonitrile copolymer (SAN)
as a compatibiliser for powdered nitrile rubber toughened polystyrene was
investigated. The effect of compatibilisation on the mechanical properties,
morphology, dynamic mechanical properties, rheological characteristics and
thennal properties of nitrile rubber toughened polystyrene is also given.
Chapter 7 is the concluding chapter with emphasis on the major findings
of the present work.
111

CONTENTS
Page No.
i~«fi~~~if Introduction
1.1 Polystyrene 2
1.2 Origin and development of rubber toughened plastics 3
1.3 Toughening mechanisms 5
1.4 Miscibility and dispersion of the rubber Phase 14
1.5 Problems with immiscible blends 14
1.6 Miscibility of polymers - compatibilisation 15
1.7 Role of compatibilisers in blending process 15
1.8 Strategies for compatibilisation of polymer blends 17
1.9 Dynamic vulcanisation 25
1.10 Addition of lonomers 29
1.11 Addition of a third polymer partially miscible with all blend phases 30
1.12 Effect of reactive blending on phase morphology 30
1.13 Phase morphology development in reactive blending 32
1.14 Effect of mode of addition of the compatlbiliser 40
1.15 Effect of reactive blending on phase stabilisation in the melt 43
1.16 Effect of reactive blending on phase co-continuity 45

l.l7
1.18
2.1
2.2
2.3
2.4
2.5
2.6
2.7
2.8
2.9
2.10
2.11
3.1
3.2
Studies on the toughening of polystyrene
Scope and objectives of the work
References
Experimental techniques
Materials
Experimental procedure
Moulding
Scanning electron microscopy
Mechanical properties
Dynamic mechanical analysis
Melt flow measurements
Die swell measurements
Detennination of cross link density
Thennogravimetric analysis
Fourier transform infrared spectroscopy
References
47
51
53
65
66
67
67
68
70
70
71
71
72
72
72
Toughening of polystyrene with· uncrossIinked and partially crosslinked
powdered NBR
Processing characteristics
Effect of blend ratio on mechanical properties and morphology
77
78

3.3 Dynamic mechanical analysis 88
3.4 Melt rheology 92
3.5 Thermogravimetric analysis 101
3.6 Conclusion 105
References 105
Compatibilisation by dynamic crosslinking
4.1 Processing characteristics III
4.2 Variation of cross link density 113
4.3 Effect ofDCP content on the morphology and mechanical properties 114
4.4 Dynamic mechanical analysis 122
4.5 Rheological studies 125
4.6 Thermogravimetric analysis 127
4.7 Conclusion 131
References 131
Compatibilisation by the addition of modified polystyrene
5.1 Morphology of compatibilised blends 135
5.2 IR Spectra of modified polystyrenes 142
5.3 Mechanism of grafting 144
5.4 Effect of compatibilisers on mechanical properties 146
5.5 Dynamic mechanical properties 150

5.6
5.7
5.8
6.1
6.2
6.3
6.4
6.5
6.6
Rheological studies
Thermogravimetric analysis
Conclusion
References
Compatibilisation by the addition of styrene-co-acrylonitrile
Compatibilisation with random SAN copolymer
Effect of compatibiliser concentration on mechanical Properties
Dynamic mechanical properties
Thermogravimetric analysis
Rheological studies
Conclusion
References
:~~(~~~~l~r'P
Conclusion
List abbreviations
List of symbols
List of publications
155
161
166
167
170
170
175
177
181
183
184
187

Chapter 1
Introduction
Plastics play an important role in our daily lives. They are one of the most
useful materials ever created. Plastics can be flexible or rigid and they can be
shaped into an endless variety of objects, ranging from car bumpers to squeezable
bottles and soft fabrics. Plastic products, especially those used by industries, often
have a useful life of many years. According to their structure and behaviour,
plastics can be classified as thermoplastics and thermosetting plastics or
thermosets.
Thermoplastics soften or melt on heating and can be converted into any
shape before they cool down to a solid. Melting and solidification of these
polymers are reversible and they can be reshaped by the application of heat and
pressure, each cycle causing some deterioration in properties. Their polymer chains
consist of linear or branched chain molecules having strong intramolecular bonds
but weak intermolecular bonds. They are semi-crystalline or amorphous in
structure and the chains can move freely each time the plastics are melted or
softened. They generally require less time to solidify compared to thcrmosets
which undergo a cross-linking reaction before solidification. Important commercial
examples include polyethylene, polyvinyl chloride, polystyrene, polypropylene,
polyamides, polycarbonate, polyacetals and polyesters.
Chapter 1
Thennosetting plastics have cross-linked or network structures with
covalent bonds between molecules. Once solidified by the cross-linking process,
they cannot be reme1ted or reshaped. Since thermosets cannot be remelted,
engineers use them in applications that require high resistance to heat. Common
examples include phenolics, aminopiastics, silicones, epoxy resins and unsaturated
polyester resins.
1.1 Polystyrene
Styrene readily polymerises to polystyrene (PS) by a relatively
conventional free radical chain mechanism. Either heat or initiators will begin the
polymerisation. Initiators thermally decompose, thereby fonning active free
radicals that are effective in starting the polymerisation process. Typical initiators
used in the suspension process include benzoyl peroxide and di-tert-butyl per
benzoate. Potassium persulphate is a typical initiator used in emulsion
polymerisation. In the presence of inert materials, styrene monomer will react itself
to form a homopolymer.
Polystyrene is an odourless, tasteless, rigid thermoplastic. PS has the
following repeating unit in its molecular structure.
-,CH ----CH 2
t:
The homopolymer of styrene are also referred to as general purpose or
crystal polystyrene. Because of the brittleness of crystal polystyrene, styrene is
frequently polymerised in the presence of dissolved polybutadiene rubber to
improve the strength of the polymer. Such modified polystyrene is called high
2

Introduction
impact polystyrene (HIPS). The styrene content of HIPS vanes from 88 to 97
percent.
Polystyrene is fourth largest thermoplastic by production volume. It is used
for applications in the following major markets: packaging, consumer/institutional
goods, electrical/electronic goods etc. Injection moulded grades of polystyrene are
extensively used in the manufacture of cosmetic containers and photo film
packages. Other polystyrene items include refrigerator door liners, audio and video
cassettes, toys, picture frames, kitchen utensils, radio and television cabinets and
computer housings.
1.2 Origin and development of rubber toughened plastics
The technology of rubber toughening, which involves blending small
amounts of rubber with rigid polymers in order to increase their fracture resistance,
has been used commercially in the late 1940s, when manufacturers began to
produce 'high-impact' grades of polystyrene, poly(styrene-co-acrylonitrile) (SAN)
and poly(vinyl chloride) (PVC); the resulting products, high impact polystyrene
(HIPS), acrylonitrile-butadiene-styrene (ABS)and rubber toughened polyvinyl
chloride (RT -PVC) - are now well established as 'commodity' polymers.
Multiphase polymers, in which a soft, rubber-like, toughening phase IS
combined with a rigid glassy or crystalline component, offer significant advantages
over homogeneous glassy polymers. However, these advantages are obtained only
when the properties of the two phases, their morphology, and the quality of the
interface between them are carefully chosen or designed to meet certain criteria:
The rigid phase should be relatively stiff, but ductile, with the ability to reach high
tensile strains, and a shear yield stress that is not too high. Preferably, the shear
modulus of the rubber phase should be as low as possible, the rubber should be
present as discrete particles, and the level of adhesion between the rubber and rigid
phase should be very high. The concentration q> and average diameter d of the
3
Chapter 1
particles are very important, as is the distribution of particle sizes. Impact
resistance increases with cl> but falls sharply when d is reduced below a critical
diameter, which in the case of toughened PA 6 at 23uC is about 0.2 /lm [1].
Toughness also decreases when the particle size is too large. It has been suggested
by Wu [2] that the key parameter is not the particle size but the inter particle
spacing, which is a function of both d and cp. ill order to absorb energy at the tip of
a notch or a propagating crack, the mUltiphase polymer must first strain-soften
(yield), and then strain-harden, so that a limit is imposed on the local strains in the
most highly stressed regions of the material. When the polymer exhibits this type
of behaviour, regions further from the crack tip then begin to deform plasticaily,
the yield zone spreads, and the fracture toughness is high. Stress fields at crack tips
are largely dilatational in nature, especially in thick sections, and therefore tend to
promote crack propagation rather than yielding. The most effective solution to this
problem is to develop materials that form dispersed micro voids in the most highly
stressed region ahead of the crack tip, thereby allowing the material to strain-soften
and draw. This type of dilatational plastic response has been observed in many
tough multiphase polymers, and probably applies to all members of this class. The
soft phase provides sites for the initiation of voids, while the adjacent rigid phase
not only yields but also strain hardens, through extension of its entangled network
of long chains. The mechanism of strain hardening, which is more accurately,
described by the term 'orientation hardening' is most clearly observed in
cross-linked rubbers. Haward and Thackray [3] have drawn attention to the
similarity between the ductile drawing behaviour of thermoplastics and the stress
strain behaviour of crosslinked rubbers, which have common origins.
4

Introduction
1.3 Toughening mechanisms
The principal mechanisms of inelastic deformation in rubber toughened
plastics are multiple crazing and shear yielding in the rigid matrix phase and
cavitation in the dispersed soft rubber phase
1.3.1 Multiple crazing
The principal toughening mechanism in brittle polymers is matrix crazing.
Under an applied stress, crazes are initiated at points of maximum principal strain,
typically near the equator of rubber particles and propagate outwards normal to the
maximum applied stress [4, 5]. Craze growth is terminated when another rubber
particle is encountered, preventing the growth of very large crazes. The result is a
large number of small crazes in contrast to a small number of large crazes fomled
in the same polymer in the absence of rubber particles. The dense crazing that
occurs throughout a comparatively large volume of the multiphase material
accounts for the high energy absorption observed in tensile and impact tests and
the extensive stress whitening which accompanies deformation and failure.
A craze actually contains fibrils of polymer drawn across, normal to the
craze surfaces, in an interconnecting void network [6, 7]. The void network is
established at the craze tip. The craze tip advances by a finger like h'TOwth
produced by the meniscus instability mechanism [8]. The fibrils are formed at the
polymer webs between void fingers and contain highly oriented polymer with the
chain axis parallel to the fibril axis [9]. As the craze tip advances, the craze
thickens by drawing in more polymers from the craze surfaces. In the presence of
relatively strong craze fibrils, that makes the craze load bearing and consequently
differing from crack. It has been demonstrated experimentally in polymer matrices
which fail by crazing that the optimum rubber particle size in the range 1-5 f11ll
[10]. Donald and Kramer [11] studied the craze initiation mechanism in HIPS and
suggested that the ease of initiation is related to particle size and that crazes are
5

Chapter 1
rarely nucleated from particle sizes less than about 1~. They proposed two
criteria necessary for craze initiation from a rubber particle:
• the initial elastic stress concentration at the rubber particle must exceed the
stress concentration at a static craze tip;
• the distance over which this critical stress acts must extend at least three
fibril spacing from the particle into the glassy matrix.
HIPS is usually prepared by polymerization of styrene monomer containing about
5-10 % of dissolved rubber. As the polystyrene forms, phase separation of rubber
occurs as dispersion in the polystyrene solution. However, the dispersed rubber
particles are swollen with styrene monomer, which continues to polymerise and
forms a dispersion of polystyrene within the dispersed rubber particles [12]. This
system has three-phase morphology. It was discovered that the larger particles only
contained occluded polystyrene in the particle while the smaller ones tended to be
rubber alone. This non-uniformity of particles appears to reduce the chances of
premature craze breakdown. When crazes form around the rubber particles either
by initiating or by intersecting them, significant lateral contraction and
accompanied elongation of the particle in the applied stress direction occurs. As
the contraction proceeded, debonding at the particle- craze interface resulted and a
void was thus formed. Under increasing load the void grew, resulting in premature
craze breakdown and subsequent crack initiation and propagation. In the non
uniform particles, occluded polystyrene accommodates the displacements due to
crazing by local fibrillation of the rubber surrounding each subinclusion, without
the formation of large voids.
Figures 1.1 and 1.2 are two electron microscope images of HIPS. One is
taken from a tensile bar that was taken past its yield point, unloaded, stained with
OS04 and then microtomed; the other was stretched in-situ in the TEM. Both show
6

Introduction
evidence of fibrillation, which occurs not onl y in the PS matrix but also in the
rubber phase.
Fig. 1.1: Section of deformed HIPS. showing jibrillation in the rubber phase and
crazing in the matrix. Specimen strained and prestained with osmium tetroxide.
IC.B. Buckn.ll, Joun.) of Microscopy, 201, 221(2001»).
Fig.I.2: Section of HIPS strained in situ on the stage of an electron microscope.
showingjibrillation of the rubber phase and crazing in the PS matrix.
(C.B. BucknaU, Journal of Microscopy, 201 , 221(2001»).
7

Chapter I
From figure 1.1 it is evident that the rubber is present not as simple
homogeneous spheres, but as complex particles with roughly spherical sub
inclusions of polystyrene embedded in the continuous polybutadiene (PB) phase.
The sub-inclusions are separated by thin membranes of rubber, which
fibrillate in response to high tensile stresses, thereby providing an effective
mechanism of strain softening. Grafting reactions ensure a good bond between PS
and PB, so that the fibrillated rubber phase, when fully extended, is able to sustain
high stresses and thus act as a strain hardening element in the deformation.
50 ,-----.
SOD 1000
Tme(s)
1500 2000
Fig.I.3: Creep curve for HIPS, showing strain softening, drawing and strain
hardening. [8. O'Connor, C.B. Bucknall, & J.L. Hahnfeld, Plast. Rubber
Compos. Process Appl. 26, 360 (1997»)
The strain-softening and strain-hardening effects due to fibrillation of the
rubber particles and subsequent stretching of the fibrils are well illustrated in figure
1.3, which shows the creep behaviour of a HIPS specimen in tension. At short
8

Introduction
loading times, cavitation begins in a few of the larger rubber particles, and crazes
grow from these initiation points. As the crazes extend and thicken, cavitation is
initiated in other rubber particles, and the creep rate accelerates (strain-softening),
reaching a steady state at a strain of about 5%. The fibrils in some rubber
membranes become fully stretched, thus limiting craze thickening in the adjacent
matrix, but the strain rate is maintained through fresh cavitation in other rubber
membranes. Eventually, a stage is reached at which most of the rubber has
fibrillated, and no new crazes are initiated. The creep rate then falls, tending
towards zero (strain hardening).The ability of well-designed, composite rubber
particles both to initiate multiple crazing and to prevent the toughened polymer
from reaching excessively high strains is a key feature of standard HIPS.
1.3.2 Shear yielding
Shear yielding is the usual mechanism of plastic deformation in ductile
solids. In polymers deformation tends to be concentrated into localized bands.
Newman and Strella [13] proposed that shear yielding in the matrix was
responsible for rubber toughening of plastics. Mechanical property and optical
property studies on ABS materials showed that in tensile tests, necking, drawing
and orientation hardening occurred together with localised plastic deformation of
the matrix around the rubber particles, indicative of shear yielding. The function of
the rubber particles was to produce enough triaxial tension in the matrix so as to
increase the local free volume and consequently to initiate shear yielding and
drawing of the matrix. This proposal did not account for stress whitening
characteristic of rubber toughening and the fact that triaxial tension promotes
crazing and brittle fracture rather than shear yielding.
It is now generally accepted that the shear yielding mechanism constitutes
cavitation of rubber particles followed by extensive shear yielding throughout the
9
Chapter J
matrix [14-17]. The cavitation of the rubber particles explains the observed stress
whitening, as light scattering occurs which is enhanced by the holes enlarging. The
voids created by cavitated rubber particles act further as stress concentrators [18].
Although cavitation of the rubber particles does not involve energy absorption, the
enhanced shear yielding of the matrix is the major energy absorbing mechanism.
However, cavitation ofthe rubber particles is a prerequisite for enhanced toughness
where shear yielding is the principal mechanism.
Because of their high plastic strains, shear bands are strongly birefringent,
and therefore easy to see in a polarizing light microscope. In PS and other
relatively brittle polymers, there is little evidence of shear bands when the material
is deformed in tension. To observe them, it is necessary to subject the polymer to
compression. With appropriate lighting, it is possible to see shear bands in a
transparent glassy polymer with the naked eye. Straining alters the refractive index
tensor within the shear band, so that light is reflected from the interface between
the optically anisotropic band and the adjacent, isotropic, bulk polymer.
It is more difficult to observe shear bands using electron microscopy,
especially in non-crystalline polymers. In some cases, the magnitude of plastic
deformation is so high that it becomes evident in the high levels of distortion in the
second-phase particles. The most effective method for observing shear bands at
lower overall strains is to use chemical etching. Plastic deformation raises the free
energy of the polymer, and makes it more susceptible to chemical attack. For
example, shear bands in PS are preferentially etched by concentrated chromic
phosphoric acid, which also attacks PB and other rubbery polymers. This method
has been used to observe shear bands and rubber particles in ABS, and in blends of
HIPS with poly 2, 6-dimethyl-l, 4-phenylene oxide [19]. The etched specimens
can be studied using either reflection OM or SEM, or alternatively used to make
replicas for examination by TEM.
10

Introduction
1.3.3 Crazing and shear yielding
Crazing and shear yielding may occur simultaneously in many other rubber
toughened plastics. The dominant mechanism is the one by which the unmodified
matrix would typically fail. The contribution of each mechanism to the toughening
of the system depends on a number of factors such as the rubber particle size and
dispersion, concentration of the rubber particles, rate and temperature of the test.
1.3.4 Cavitation in rubber particles
Observations of void formation within rubber particles have been reported
since the early 1970s [20]. In some cases, there are simple spherical voids in
homogeneous particles. In others, cavitation takes more complex [onns, as in the
fibrillated rubber membranes shown in figures !.land 1.2. For many years these
cavitation processes were largely ignored as being of no importance. or even
artefacts, but there is now an increasing recognition that they play a critical role in
the toughening mechanism.
Fig. 1.4: Scanning electron micrograph o/toughened epoxy resin, showing
cavitation 0/ homogeneous rubber particles on the fracture sur/ace and
retraction o/the surrounding rubber shell. IA.J. Kinloch, Proc. Instu.
Mech.Eugrs, 211, 307 (1997))
11

Chapter 1
The evidence for rubber particle cavitation comes from SEM studies of the
fracture surfaces of rubber toughened epoxy resins. In most cases, there is a
relatively deep hemispherical depression near the centre of each half particle,
surrounded by a shallow depression where the surrounding shell of rubber has
retracted after fracture, as illustrated in figure lA.
It is obvious that the growth of the central void is accompanied by
expansion of the surrounding rubber shell and yielding in the adjacent matrix, so
that the radius of the particle increases until the crack bisects it. It is important to
note that this mechanism applies only to lightly crosslinked resins, which retain
some ductility and can therefore benefit from the addition of rubber particles (21].
12
T .... ile Direction
Fig. 1.5: Schematic diagram of a dilatational shear band. IC.B. Bucknan.
Journal of Mlcroscopy, 201, 221(2001)].

Introduction
The association between cavitated particles and shear bands is an
important one. They constitute a dilatation band as illustrated in figure 1.5. Bands
of this type, which are also observed in metals, can deform by both shear in the
plane of the band, and extension normal to it, thereby generating a dilatation.
The angle 0 and the ratio of shear strain to volume strain depend upon:
(a) the components of the local stress tensor; (b) the void content of the band; and
(c) the pressure-dependence of the yield criterion for the bulk material. For an
isotropic, void free material that obeys the von Mises or Tresca yield criterion,
shear yielding occurs on planes of maximum shear stress, and the angle 0 is
therefore 45°. However, in polymers, because yielding is strongly dependent upon
the mean stress 0llb 0 is typically about 38°. The introduction of voids increases the
effect of Om on yielding, causing both a reduction in yield stress, and a
decrease in o.
Calculations by Lazzeri & Bucknall [22] on the behaviour of a cavitated
polymer under uniaxial tension show that 0 falls rapidly at void contents", > 0.4,
reaching. 0 = 0 at '" = 0.53. It is clear from the foregoing discussion that dilatation
bands containing high volume fractions of cavitated rubber particles have much in
common with crazes, and indeed a craze can be regarded as a particular type of
dilatation band. However, it is useful to preserve the distinction between cavitated
shear bands, in which the loss of cohesion is confmed to a minor particulate phase,
and crazes, which are formed by cavitation of a continuous matrix phase
The energy-b~lance theory developed by Lazzeri &Bucknall [23] shows
that rubber particles cavitate when the dilatational strain energy stored in the
surrounding material is large enough to initiate a void in the rubber. The
dilatational strains might be at a higher level in the matrix than in the rubber
particle, but cavitation will usually occur preferentially in the soft phase, where the
resistance to void expansion is very much lower. Recent work by Bucknall [24] has
13

Chapter 1
shown that the critical stage in cavitation involves sunnounting an energy barrier at
very small void sizes, and that thennal contraction stresses play an important part
in generating the strain energy necessary to cross this minute energy barrier.
1.4 Miscibility and dispersion of the rubber phase
The rubber phase intended for rubber toughening must be dispersed as
small particles in the plastic matrix. The particle size and size distribution of the
dispersed particles will depend on the miscibility of the two phases and on the way
in which they are mixed. If the miscibility is good, the particles of the rubber will
be too small to promote toughening and may even be distributed on a molecular
scale. If the two phases are immiscible, the rubber may be dispersed as
macroscopic particles and too large to give toughening.
1.5 Problems with immiscible blends
Most immiscible blends have inferior mechanical properties relative to
their components, and their phase morphology strongly depends on their
processing history. The primary cause of such behaviour is the unfavourable
interaction between molecular segments of the components, which is responsible
for their immiscibility. An unfavourable interaction leads to (a) a large interfacial
tension in the melt, which makes it difficult to disperse the components finely
enough during mixing and drives phase rearrangements during low stress
conditions, and (b) poor interfacial adhesion in the solid state, which causes
mechanical failure. Compatibilisation of the two phases can be effected by the
addition of appropriate block or graft copolymers that act as interfacial
agents [25-34]. For effective compatibilisation, the molecular weight and
architecture of the block copolymer need to be carefully optimised: Low molecular
weight block copolymers tend to diffuse to the interface rapidly, but do not provide
stability of morphology [35] while higher molecular weight block copolymers are
14

Introduction
----------------------------------------------ineffective, because they do not readily diffuse to the interface and they have a low
critical micelle concentration [36].
1.6 Miscibility of polYmers: compatibilisation
Components that resist !,TfOSS phase segregation andlor give desirable
properties are frequently said to have a dCbTfee of compatibility. There are two
types of compa6bility, thennodynamic and technological [37-39]. Homogeneous
miscibility in polymer blends requires a negative free energy of mixing:
LlG mix = LlH mix - T flS mix
However, if two high molecular weight polymers are blended, the gain in
entropy, flS mix is negligible, and the free energy of mixing can only be negative if
the heat of mixing, flHmix is negative. In other words, the mixing must be
exothermic, which requires specific interactions between the blend components.
These interactions may range from strongly ionic to weak and nonbonding
interactions, such as hydrogen bonding, ion-dipole, dipole-dipole and donor
acceptor interactions. Usually, only van der Waals interactions occur, which
explains why polymer miscibility is the exception rather than the rule. The
miscibility behaviour of two Polymers is strongly dependent on temperature. Each
polymer pair is characterized by an interaction parameter, which usually exhibits
such a temperature dependence that possible miscibility at lower temperatures is
lost at higher temperatures, e.g. during processing.
1.7 Role of compatibilisers in blending process
Compatibilisers are macromOlecules species exhibiting interfacial activities in
heterogeneous polymer blends. Usually the chains of a compatibiliser have a block
structure with one block miscible with one polymer component. These block
structures can be premade and added to the immiscible polymer blend, but they can
also be generated in-situ during the blending process. The latter procedure is called
1 "

Chapter 1
reactive compatibilisation and mutual reactivity of both blend components is
required. Figure 1.6 presents a schematic picture of the supposed conformation of
some compatibiliser molecules at the interface of a heterogeneous polymer blend.
<":r-~ :;''::j-r 't: ) -'~ /
Fig. 1.6: Schematic picture of conformationsfor diblock, triblock, multi graft
and single graft copolymers at the interface of a heterogeneous polymer blend.
[C. Koning et al. Prog. Polym. Sei., 23,707 (1998)}
16

Introduction
In the figure diblock, triblock, multi grafted and single grafted copolymers
are shown. A heterogeneous blend of polymers A and B can be compatibilised by a
diblock copolymer poly (C-b-D), provided that block C is miscible with polymer A
(block C can also be polymer A) and that block D is miscible with polymer B
(block D can also be polymer B), since phases A and B are merely solvents for
blocks C and D, respectively. The mutual miscibility of phase A with block C and
phase B with block D implies specific interactions between A and C, Band D, a
poly (C-b-D) is usually the more effective compatibiliser for blend AlB.
The role of compatibilisers in the blending processes is firstly to retard the
formation of Rayleigh disturbances on the generated threads of polymer, as a result
of decreased interfacial tension. The presence of compatibiliser molecules at the
surface prevents coalescence during subsequent processing. Compatibilisers are
thus able to stabilise a fine morphology. Each block of a poly compatibiliser
penetrates into the parent phase deeply enough to entangle with the consecutive
chains and the interfacial adhesion is enhanced. Good interfacial adhesion is
essential for stress transfer from one phase to the other. Refinement and
stabilisation of the phase morphology and the enhancement of the interfacial
adhesion usually upgrade an inferior and useless immiscible polymer blend to an
interesting material.
1.8 Strategies forcompatibilisation of polymer blends
There are several methods to compatibilise immiscible polymer blends. A
detailed discussion with special reference to non reactive and reactive
compatibilisation is given below.
1.8.1 Addition of graft and block copolymers
The emulsification of polymer blends has been proposed as the most
efficient tool for obtaining fine phase morphology and good mechanical propeliies.
The best way to validate that concept is to tailor block and grafted copolymers and
17

Chapter 1
to investigate the beneficial effects that they can have on immiscible polymer
blends. That approach allows the main molecular characteristic features of block
and graft copolymers to be changed in a systematic way, for example, molecular
architecture, composition and molecular weight, so that basic relationships can be
drawn between the structural characteristics of these additives and the general
properties of the polyblends.
Early efforts were concentrated on blends of diblock copolymer with
homopolymers possessing repeat units identical or chemically similar to each
segment of the copolymer. This type compatibilised blend will be desi!,'11ated as
AlBI A-B system where the A-B diblock is an entropic acting copolymer. The
emulsification of PE and PS blends by copolymer consisting of hydrogenated
plybutadiene (HPB) and PS has been extensively studied by Fayt et al [40].
Recently this approach has been extended to A-C diblock copolymer, for filling the
incompatibility gap between some AlB pairs, provided C is miscible with B.
sPMMA containing diblocks are among the most universal compatibilisers for the
AlB/A-C type systems. sPMMA is indeed quite miscible a number of important
polymers (PVC, PVDF, SAN etc.) and it can be copolymerised in a two step living
polymerisation with styrenes and dienes [41]. Another valuable fami ly of diblock
copolymers is based on PCL (42] which is miscible with phenoxy, SAN, PVC,
nitrocellulose, PECR, Chlorinated polyether (43], Saran [44], chlorinated
polystyrene [45], CPE [46], PC [47] and polyesters such as PET and PBT (48].
The use of graft copolymers is another possible route for the control of
phase morphology and mechanical properties of immiscible polymer blends. In
addition to polymer-polymer or polymer-monomer reactions a large variety of
macro lllonomers has been prepared as precursors of graft copolymers [49, 50]
with some control on the copolymer structure, since the length and number of
grafts are dictated by the macro monomer molecular weight, the comonomer feed
18

TntriJdUclum
and the comonomer reactivity ratios. Recently, w-dihydroxy PS has been
synthesized as a macro monomer for the synthesis of poly (PBT-g-styrene). The
SEM analysis of fracture surfaces of blends containing PBT/PS 70/30 by weight
shows spherical PS domains with diameters ranging from 1 to 4 ~m. In addition,
during the fracture process, many domains are pulled away from their previous
positions and the surfaces of holes left by removed PS spheres appear to be very
smooth. These observations suggest a poor compatibility between PBT and PS.
As PBT-g-PS is added (10%) to the incompatible blend, the domain sizes of PS are
reduced and the interface between the two phases becomes more diffuse. These
features demonstrate the compatibilising effect of PBT-g-PS in the PBT/PS blend.
Also, increased modulus, elongation at break and impact strength were observed in
PBTIPS blend containing up to 10% compatibiliser [51].
I ~ I Cnpol>.rnQr
~o '191 .. 0
- PS
.- I(u.l>h",
Fig. 1.7: Effect of the HPB-b-PS diblock copolymer on the dispersion of HIPS in
a PE matrix. [C. Koning et al. Prog. Polym. Sci., 23,707 (1998)]
19

Chapter 1
Fayt and Teyssie [52] have studied the emulsification of LDPE and
commercial HIPS blends by a hydrogenated tapered block copolymer of butadiene
and styrene (MW= 80,000). In this diblock, there is smooth transition from pure
PB block (MW= 32,000) to pure PS block (MW= 26,000) through an intermediate
section of MW= 22,000 [53]. As expected the phase morphology of neat
LDPEIHIPS blends is coarse and heterogeneous at all compositions and the
interfacial adhesion is very poor. Upon the addition of the block copolymer (5%)
there is a marked decrease in the particle size and a significant enhancement of the
interfacial adhesion. Figure 1.7 illustrates the state of dispersion of HIPS in LOPE.
Upon the addition of the hydrogenated poly (butadiene-b-styrene), PS becomes
finely dispersed in LOPE whereas the PB particles still coated by an adherent layer
of PS. This assumption is convincingly supported by the stability of the rubber
particles against coalescence when LOPE content is decreased. Furthermore there
is an improvement ofthe ultimate mechanical properties of the LOPE/HIPS blends
when the diblock copolymer is added.
Braun et al [54] have investigated the compatibilising efficiency of a
block-graft copolymer, which is prepared by radical grafting on a block copolymer,
in immiscible PVCIPS blends. The copolymer PS-b-(PB-g-PCHMA), was prepared
by radical grafting of cyc10hexyl methacrylate on to the PB block of a PS-b-PB
copolymer. As a result a long PS block is connected to PCHMA blocks through
short PB segments. This copolymer refines the morphology of an immiscible
PSIPVC (50/50) blend by forming an interfacial layer.
1.8.2 Reactive compatibilisation
An attractive alternate method for compatibilisation is to form the block or
graft copolymer in situ during blend preparation via interfacial reaction of added
functionalised polymeric components [55-57] as illustrated in figure 1.8. The
functional groups may be the reactive chain ends that occur naturally in
20

Introduction
condensation polymerisation provided that end- capping techniques are not used.
For addition polymers, functional groups can be placed along the chain by
copolymerisation or by grafting or at the chain end by special techniques [55, 56].
The functional groups must be carefully selected to ensure that adequate reaction
can occur within the limited time-frame of melt processing, for which the only
opportunity for encounter is within the interfacial region between the two polymer
phases. Formation of the copolymer species at the interface reduces the interfacial
tension; leads to steric stabilisation, which retards dispersed phase coalescence and
strengthens the interface, in the solid state, between phases. A primary benefit is
the significant reduction in the dimensions of the phase domains, which is critical
for achieving good physical properties of the blend. Tn addition the morphology of
the blend is more stable and predictable, which broadens the processing or
fabrication conditions that can be used.
<-- \ (A rxn ---~ -B" tu
( ( ')
) (
ra)
A A
U~J ,,-)0 A A rxn - -~--~-B B c:: ""' ) ? l )
(b)
Fig. 1.8: Reaction of polymer-bound functional groups A and B to form
(a) a block copolymer and (b) a graft copolymer at the interface between two
immiscible polymer blends. [D.R. Paul, C.B. Bucknall, eds. Polymer Blends,
Vol.1, Ch.17, Wiley-Interscience, New York, (2000)]
21

ChApzet 1
Theoretical predictions [58] show that presence of appropriate block or
graft copolymers leads to reduction in the interfacial tension between phases in
immiscible blends. The block or graft copolymers generated in-situ during the
process of melting through reaction between chemical functionalities available on
the polymer chains [59-100] affect the blend morphology and properties. It is
important to note that the generation of morphology in multiphase polymeric
systems through chemical reactions is a dynamic process. As breaking down the
dispersed phase through interfacial reactions creates more surface area, the
probability becomes higher for functional groups to find each other to react to form
more copolymer, which results in an even finer dispersed particle size. However
there are both chemical and physical limitations on the extent to which this process
can proceed. The limitations of reaction kinetics can be severe, since the residence
time in commercial compounding devices, typically extruders is on the order of
one minute and the reaction can occur only at the interface between phases.
Eventually, the surface density of copolymers at the interface could build up to a
level that physically precludes further unreacted chains from coming together.
Recent analysis of reactive interfaces [101,102] suggests that the interface becomes
too crowded with copolymer before significant reduction in interfacial tension
occurs. This suggestion implies that the dominant mechanism of reducing particle
size is the suppression of droplet-droplet coalescence through steric hindrance at
the interface.
Functional groups useful for reactive compatibilisation can be incorporated
into polymers in a variety of ways. For example, anhydride units can be introduced
by grafting (103-1 07J or copolymerisation [108] of maleic anhydride, end capping
[109] and other schemes [110,111]. Among these schemes, reactive grafting has
been the method of choice for attaching maleic anhydride groups into several
polymers including polyolefines [103-1 07J polyphenylene ether (PPE) [112,1 13]
and ABS [114]. For polyolefines, grafting is achieved by mixing the polymer with
22

Introduction
maleic anhydride (MA) and an initiator in an extruder at elevated temperatures
[107]. Various mechanisms have been proposed by Gaylord [104-106] for the
grafting of MA to both unsaturated and saturated polyolefins. Heinen et al [107]
concluded that MA is attached to polyolefins through a variety of mechanisms.
When the polyotefin contains only methylene carbon atoms, MA is attached in the
fonn of single succinic anhydride rings as well as oligomers. When there are
tertiary hydrogen atoms, as in polypropylene, MA grafts onto the polymer
backbone primarily in the form of single succinic anhydride groups, and chain
scission often occurs, so that the anhydride unit is attached to the end of a short
chain.
Reactive polymers undergo the usual chemical reactions seen III low
molecular weight materials. However, there are a number of factors that limit the
extent of reaction. For example, the steric hindrance to the reaction sites by
polymer backbone reduces the reaction rate [115]. The reaction rate can also be
reduced by the restricted diffusional mobility of the functional groups in the melt
stage. The low concentration of the functional groups and the short reaction time
are two other limiting factors that further limit the extent of reaction efficiency.
Therefore in order to achieve successful compatibilisation of polymer blends, the
polymers must have sufficiently reactive functional groups; the reaction should be
fast, selective and preferably irreversible; and mixing conditions should be such as
to minimize mass transfer limitations to reaction.
1.8.3 Addition of reactive polymers
The addition of a reactive polymer, miscible with one blend component
and reactive towards functional groups attached to the second blend component
results in the "in-situ" formation of block or graft copolymers. This technique has
certain advantages over the addition ofpremade block or graft copolymers. Usually
reactive polymers can be generated by free radical copolymerization or by melt
23

c7tapter7
grafting of reactive groups on to chemically inert polymer chains. Furthermore,
reactive polymers only generate block or graft copolymers at the site
Re:\£:Ii\'e ~ddi'i \'0;
(Of ph;IJ,~ (A)
Al!emal.in~ Ill. -~ X
Alternative IV. ~ X
R;('!ll~li~c polym.:r- 111 ,itu or rhase (fll g<!ntnlle<1 ''''I'''lylY~r
y.,
I Y
y---
I Y
I y' X'
i ~~-
X' Y' t
i x
Fig. 1.9: BIQck and graft copolymer precursors and type of copolymer formed
during reactive processing. [C. Koning et al. Prog. Polym. Sei., 23, 707 (1998»)
24

Introduction
where they are needed, i.e. at the interface of an immiscible polymer blend.
Although graft and (especially) block copolymers may form micelles after being
added to or formed in a blend, the chance that the critical micelle concentration
exceeded is actually higher in the case of pre-made structures. This is a drawback
with respect to the efficiency of the compatibiliser. Finally, the melt viscosity of a
linear reactive polymer is lower than that of a pre-made block or graft copolymer,
at least if the blocks of the premade copolymer and the reactive blocks are of
similar molecular weights. Lower molecular weight polymers will diffuse at a
higher rate towards the interface. This is of utmost importance in view of the short
processing times used in reactive blending which may be on the order of a minute
or less. In order to successfully apply reactive polymers as block or graft
copolymer precursors, the functional groups must have suitable reactivity in order
to react across the melt phase boundary during the short blending time. In addition,
the generated covalent bond must be sufficiently stable to survive subsequent
processing conditions. Figure 1.9 illustrates the different block and graft copolymer
precursors that can be added to a blend of immiscible polymer A and polymer B, as
well as the type of copolymer formed. The unmodified polymer A is assumed to be
unreactive towards polymer B. The reactive, polymeric additive (left column in
scheme) may be either an X-functionalized polymer A or an X-functionalized
polymer C, provided that polymer C is miscible with polymer A. Polymer B is
supposed to have either end-reactive or pendant-reactive groups For example,
amine and carboxylic acid groups if B is a polyamide, or succinic anhydride if B is
a styrene-maleic anhydride copolymer.
1.9 Dynamic vulcanisation
Dynamic vulcanisation is a route to new thermoplastic elastomers which
have properties as good or even in some cases, better than those of block
copolymers. These new materials are prepared from blends of existing polymers,
thereby eliminating new processes and materials. In short, dynamic vulcanisation is
25

Chapter 1
a cost effective technique to achieve better properties. Improvements in properties
include reduced permanent set, improved ultimate mechanical properties, improved
fat igue resistance, greater resistance to attack by fluids at elevated temperature,
improved high temperature utility, greater stability of phase morphology in the
melt, greater melt strength and more reliable thermoplastic fabricabi lity.
Dynamic vulcanisat ion is the process of vulcanising the elastomer during
its melt mixing with a non-vulcanising themloplastic polymer. The introduction of
crosslinks in to one of the phases increases the viscosity of that phase lead ing 10 a
change in the morphology of the blend [1 16, 117]. The uncrossl inked phase is
unaltered by the vulcanisation in the other phase, permitting easy processing of the
blend. The modified blend can be additionally compounded, if required, and
fonned to shape. Because dynamic vulcanisation takes place inside the mixer, the
mix cycle should be as short as possible, fo r economic reasons. It must be noted
that thermoplastic elastomers (TPEs) are the fastest grow ing part of the e1astomer
market (12% per year).The world use of thermoplastic vulcanisates (TPVs)in 1995
was about 60 ktons [1 18].
thennoplaltic 1 • J.llomer
.,. ... ~M;e IoIwlco,..Iu,t<on ~
phalle Invenlo,..
Fig. 1.10: Morphology of a thermoplu::ilicirubber blend before and after dynamic
vulcanisation. IC. Koning et al. Prog. Potym. Sei., 23, 707 (1998)J
The morphological changes accompanying dynamic vulcanisation are
shown in figure 1.10. Since an excess of rubber is used and the viscosities of the
26

Introduction
thermoplastic and the rubber at the processing temperature do not deviate too
much, the physical blend is a dispersion of the thermoplastic in a rubber matrix.
Upon the addition of the crosslinking agent, the viscosity of the rubber phase
increases and at a sufficient degree of curing phase inversion occurs [119). The
high degree of crosslinking of the rubber phase inhibits the process of strand break
into smaller particles, the reduction of interfacial area by formation of smooth
spheres and also the coalescence of the dispersed particles. As a result, the
dispersion of a thermoplastic/rubber dynamic vulcanisate is very irregular
(figure 1.10). The thin thermoplastic layers between the crosslinked rubber
particles are somehow elastic and act as a kind of glue between the cross linked
rubber domains [120J.
Thermoplastic vulcanisate compositions have been prepared from a great
number of plastics and elastomers. However, only a limited number of e1astomer
plastic combinations give technologically useful blends, even after dynamic
vulcanisation. The best elastomer/plastic thermoplastic vulcanisates are those in
which the surface energies of the plastic and elastomer are matched, when the
entanglement molecular length of the elastomer is low and when the plastic is 15-
30% crystalline [121].
The dynamic vulcanisation process was used by Gessler [122) In the
preparation of semi-rigid elastomer-plastic compositions containing minor
proportions of vulcanised elastomer. Fischer [123] used this process to prepare
compositions containing varying amounts of partially vulcanised elastomer.
Several recent article; deal with thermoplastic vulcanisates reSUlting from the
dynamic vulcanisation of various rubber/plastic blends [124-129].
Sulphur/accelerator combinations, the most abundant crosslinking systems
for static vulcanisation of elastomers, have been demonstrated to be applicable to
dynamic vulcanisation of PP/EPDM blends [130]. An increase in the amount of
27

Chapter 1
sulphur from 0 to 2.0 phr in combination with a standard zinc oxidel
stearicacidl tetramethyi thiuram disulphidel mercaptobenzathiazole vulcanisation
recipe has resulted in a dramatic improvement of the elasticity of a 40/60 blend of
PP/EPDM. The tensile strength increases from 4.9 to 24.3 MPa, the elongation at
break increases from 190 to 530% and the tension set decreases from 66 to 16%
(figure 1.11).
- 100 C'I3 n.. ,.-..
G 20 60 ~
t 1" ;6 15 60 -~ ~ c: <:Do 10 40 0 ~
.~ Oii 02)
5 20 GJ
~ ~
~ .!l 0
0 5 10 15 20
crossUnk def1slty -t (.x1OS moOt/m!)
Fig. 1.11: Effect of crosslink density of the EPDM phase on tensile strength and
tension set/or PPIEPDM 40160 blends dynamically vulcanized with a sulphur
cure system. re. Koning et al. Prog. Polym. Sei., 23, 707 (1998)]
However, sulphur crosslinking systems are not used in commercial
PP/EPDM TPVs, since pp has a relatively high melting point and the crosslinks
lack thennal stability. Moreover, the production and processing of these TPVs
suffer from severe stench problems. In the case of pp based TPVs, pp degradation
by 1I3-scission may be initiated by the peroxide/co-agent cure system and this
results in inferior properties. A specific crosslinking system, for example, PF resins
prepared at high pH (resoles), is used in the commercial PP/EPDM dynamic
28

Introduction
vulcanisation. The main reasons for using these crosslinking agents are their
activities at temperatures above 200ae and the fonnation of thermally stable
carbon-carbon crosslinks. Usually catalysts are added, such as stannous chloride
dihydrate or a halogen donor, pve or ePE, in combination with zinc oxide. The
acidity of these catalysts allows the ether linkages andlor the alcohol end groups of
the resole to be activated. The chemical structure of the crosslinked rubber has
recently been elucidated by using low molecular weight models, and was shown to
consist mainly of mono- and bisphenol units linked to the elastomer by methylene
or cyclic chroman bridges. Dynamic vulcanisation of a PP/EPDM blend by
increasing the amounts of resole results in improvements of tensile strength and, to
a lesser extent, of elongation at break [131].
1.10 Addition of ionomers
Ionomers are polymeric species carrymg a relatively low number of
pendant ionic groups per molecule. Usually, the ionic group result from
neutralisation of sulphonic acid or carboxylic acid groups. Either monovalent
(Na +, K+) or divalent (Zn2+) metal cations are used as counter ions. Sulphonic acid
or carboxylic acid groups are introduced into the polymer chains by
copolymerisation or chemical modification of existing polymers. Whatever be the
cations, the ionic groups tend to associate into multiplets which at sufficiently high
concentrations can associate into clusters. Multiplets and clusters act as physical
crosslinks between polymer chains. At elevated temperatures, these ionic
crosslinks become reversible. Now, if two different ionomers, based on two
different and immiscible polymers, are intensively ~ixed in the melt, the ionic
domains may reorganise. The newly formed clusters may contain ionic species of
both immiscible polymers. As a result branched copolymers, in which the link
between both polymer chains is an ionic bond, are generated at the interface, and a
stable compatibilised multiphase blend is generated. Thus a blend of PE and PA66
can be compatibilised using ethylene - methacrylic based ionomer [132].
29

Chapter J
1.11 Addition of a third polymer partially miscible with all blend phases
According to this, a polymer e partially miscible with the two constitutive
polymers A and B of a two phase binary blend, can act as a common solvent and
accordingly can promote complete or partial miscibility of the originally
immiscible polymers. The choice of polymers A, Band e is such that the binary
interaction parameter is negative for the Ale and B/C pairs and positive for the
AlB pair.
A number of elastomer-based modifiers have been blended with pve for
improving its impact resistance. PVC is however immiscible with most non-polar
elastomers, so these blends have to be compatibilised. Yu-Der Lee et at [133] have
investigated tricomponent blends of PVCICPE/EPDM where EPDM is the very
low temperature impact modifier and ePE is the compatibiliser.
1.12 Effect of reactive blending on phase morphology
The control of phase morphology is the key issue when desirable
mechanical properties have to be imparted to polyblends. The shape, size and
spatial distribution of the phases result from a complex interplay among viscosity
and elasticity of the phases, interfacial properties, blend composition and
processing parameters. The morphology development at short mixing times can be
summarised as follows [134].
30
• the dispersed phase fonn, sheets or ribbon in the matrix
• holes appear in these sheets or ribbons as a result of interfacial instability
• size and number of holes increase which leads to lace structure
• lace breaks down into irregularly shaped pieces of diameter close to the
ultimate particle size and

Introduction
• break-up of drops and cylinders lead to the final spherical droplets.
At intennediate mixing times, thus in the melt state, mixing affects only
the size of the largest particles which are transfonned into smaller ones, so leading
rapidly to an almost invariant morphology governed by the dynamic equilibrium
between domain break-up and coalescence [135-139].
The pioneering work of Taylor on drop break up in Newtonian systems in
a simple shear field has been the basis of investigations on more complex systems
and flow fields (140,141]. The analysis of Taylor considers how the balance of
applied shear forces and counteracting interfacial forces affects drop dimensions
and stability. The results have been expressed in temlS of the so-called capillary
number (ca) versus the viscosity ratio, p
p =.1L llm
_ Yw llm D ca
2a
where D is the diameter of the droplet, Yw the shear rate, l1m the matrix viscosity,
l1d the dispersed phase viscosity, and (J the interfacial tension. According to
TayJor's analysis, defonnation of the droplet is enhanced by large shear rates, a
high matrix viscosity,· large droplet size and small interfacial tension. The
defonnation is retarded by large interfacial tension, high dispersed phase viscosity
and small droplet size. Taylor noted that if a lower or equal viscosity droplet is
placed in a high viscosity matrix, it is readily drawn out into a large filamentous
ligament, which eventually breaks up. This was not the case for very high viscosity
drops placed in a low viscosity matrix; these tend to retain their spherical shape.
Several studies on Newtonian system in both shear and extensional flow were in
agreement with Taylor's prediction [142,143]. However, it has been reported that
drop break up was possible over a wide range of viscosity ratios in extensional
31

flow for Newtonian systems [144,145]. In the case of polymer blends, since the
individual components exhibit large normal stresses in flow, the extension of
Taylor's analysis to such systems has some limitations. The final morphology of
polymer blends is the result of the balance of domain break-up and coalescence at
the end of the mixing process. However, most of the studies on polymer blends in
literature regarding domain size, expressed in terms of capillary number and
viscosity ratio (based on Taylor's analysis), do not account for the coalescence
process. In one of the most frequently cited studies on polyamide/rubber blends,
Wu extrapolated an empirical equation fitting the capillary master curve [146].
According to this equation
Y w 11m D/cr = 4(p )10.84 positive when p> 1; negative when p< 1
Wu's correlation suggests a minimum particle size when the viscosities of the two
phases are closely matched. The validity of this equation has been tested by
researchers [147,148] who have indicated some disagreement with respect to the
dependence of the particle size on viscosity ratio and the correlation proposed by
Wu. On the other hand Serpe et al [149] found a good agreement of their
experimental observations with Wu's results. An experimental minimum in the
dispersed phase size with increasing shear rate was reported in the literature and
this has been explained based on the high elasticity of the droplet and the resulting
resistance to deformation at increased shear rates [150].
1.13 Phase morphology development in reactive blending
In the case of reactive melt blending, the effects of the chemical reaction at
the interface on the phase morphology development are multi-fold. The chemical
reaction at the interface leads to:
32
• a reduction in the average size of the dispersed phase due to the
suppression of coalescence and the decrease of interfacial tension.

•
•
•
Introduction
an increase in the break-up of the largest particles in the size distribution of
the dispersed phase.
a substantial narrowing of the size distribution of the dispersed phase
a decrease of the mobility of the interface which slows down the
coalescence rate.
A number of systematic investigations have been reported in the literature
on the phase morphology generation in reactively compatibilised polymer
blends [151-156]. The study on the morphology development during reactive melt
blending ofPA 6 6 (PA 6) with EPM-MA and PS-Ox with EPM-MA is one of the
early investigations [135]. These blends were prepared in a Haake batch mixer.
The morphology of the non reactive and reactive blends was sampled at different
melt-mixing times ranging from 1.5 to 15 minutes. It is shown that in both blend
systems the morphology is characterised by a few very large particles along with a
large number of small particles, which have nearly the same size as those observed
after long mixing times. The major influence of prolonged mixing time is the
reduction in size of the largest particles in the distribution. As expected, the
average size of the dispersed phase particles in the reactive blends is smaller than
in the nonreactive blends; the distribution of the particle size is also found to be
narrower in the case of reactive blends.
The particle size distribution of the reactive and non-reactive blends after
a mixing time of 15 minutes is compared. The major effects of the chemical
reaction at the interface are a reduction in the average size of the dispersed phase
particles and a narrowing of the size distribution. The change in the average
diameter of the dispersed rubber particles as a function of the mixing time for non
reactive PA6/EPM and reactive PA6/EPM-MA blends are presented in figure 1.12.
As can be seen, the interfacial chemical reaction has a dramatic influence on the
33

Chapter 1
dispersed phase size even at very short mixing times. Additionally, the particle size
distribution narrows at larger mixing time.
7
6
E5 ::1.
Qj 05 4 E ro '0 3
<1l Ol
~ g; 2 «
o
PNEPM
~-~ PNEPM-MA • ---- -- _ __A___ ___ _
2 4 6 8 10 12 14 16
Mixing time(min.)
Fig. 1.12: Variation in the average diameter of the dispersed rubber particles
for PA6/EPM and PA6IEPM-MA blends as afunction ofmixing time
[W.E. Baker, C.E. Scott, G.H. Hu, Hanser, Munich,2001]
The study on the morphology development in blends of PS-Ox with
EPM-MA also showed similar results as that of PA6/EPM-MA blends [135]. In
fact, the smaller dispersed phase size in the reactive blends compared to the non
reactive blends is due to the several different effects:
34
• reduction of the interfacial tension between the phases.
• inhibition of particle coalescence by the formation of copolymer at the
interface.

•
•
Introduction
differences in the shear stress applied to the blends during melt mixing and
differences in the viscosity ratio between the two phases caused by the
temperature.
The morphology development in the case of EPM/PA6 blends, reactively
compatibilised by EPM-g-MA, is reported to be extremely fast [154]. In this
study the evolution of the morphology was carefully followed as a function of
the mixing time. The mixing was carried out in a co-rotating twin screw mini
extruder. The rotor speed and the mixing temperature were lOOrpm and 250°C
respectively. The number average domain diameter as a function of the mixing
time for the uncompatibilised and reactively compatibilised blends is given in
figure 1.13. In the reactively compatibilised blend the morphology
development was so fast that within 30 seconds of mixing the morphology was
almost completely developed. No major change in morphology could be
observed up to 10 minutes.
8.-----------------------________ ~
8 • • •
~4 • C • • ca •
• u nc:ompatlbftl?8ed blend I . • compatibllsed blend(2owt%EPM-g-MA)
• • 2 ..
• • • 0
0 5 10 15 2(} 25 ml:lting time. min.
Fig. 1.13: Influence of the mixing time on the number average domain diameter
for uncompatiblised and reactively compatiblised 30/70 EPM/PA 6 blends.
(S. Thomas, G. Groeninckx. Polymer, 40, 5799 (1999)1
35

Chapter 1
However, on prolonging the mixing time, there was a strong tendency for
phase coarsening both in uncompatibilised and reactively compatibilised blends.
The reason for the shear induced coalescence (dynamic coalescence) is attributed
to:
• the decrease of the polyamide matrix viscosity on longer mixing and/or
• the removal of the graft copolymer from the interface as a result of shear
forces.
Jerome and co-workers investigated the dependence of the phase
morpholob'Y development on the kinetics of the interfacial reaction [157]. For this
purpose, SAN containing 20wt% reactive SAN-X was melt blended with EPDM
containing 50 wt% of maleic anhydride grafted EPM chains(EPM-g-MA). Two
groups (X) reacting with maleic anhydride at a different rate were randomly
attached to SAN (0.028 mole X wt %) ie. a primary amine and a carbamate which
actually releases a primary amine at the processing temperature. The SAN/rubber
weight composition was kept constant at 75/25. The development of the phase
morphology from pellet-sized rubber particles to dispersed submicrometer droplets
was analysed for the two types of reactive SAN and found to depend on the rate of
the interfacial reaction. In the case of the primary amine, the interfacial reaction
took place mainly during the melting and softening step, leading to phase
morphology after 2-3 min. mixing which did not change upon further mixing.
When the reactive groups were carbamates, the interfacial reaction was
controlled by the carbamate thermolysis into primary amine, which was the rate
determining step. The interfacial reaction was then occurring essentially after the
softening/melting of the blend components. It was found that, the highly reactive
SAN-NH2IEPM-g-MA system is much more effective than the slowly reacting
SAN carbamateIEPM-g-MA counterpart in stabilising finely dispersed rubber
particles of a narrow size distribution even for long mixing times.
36

Introduction
It is important to examine the effect of the concentration of the reactive
compatibiliser on the blend phase morphology development. In a systematic and
detailed study on reactive PA6/(PMMAlSMA) blends by Dedecker and
Groeninckx [155,156], it is demonstrated that the concentration of SMA 20
(20 wt% MA), as reactive compatibiliser in the blend has a controlling influence on
the phase morphology development. The necessary mixing time required for the
generation of equilibrium morphology is presented in figure 1.14 as a function of
the SMA 20 concentration.
As can be seen from this figure, the critical time required for the
equilibrium morphology development decreased drastically from 30 to 3 min. as
the amount of SMA in the blend was increased from 1 to 3 wt %. The points below
the indicated line represent morphologies which are still in development; those
above the line and on the line represent equilibrium morphologies .
• •
•
•
•
•
• • • (j~ _____ ....... ____ --'-__ ,.1...
J
Wei~tll % SMAI:Il
Fig. 1.14: The necessary extrusion time to obtain an equilibrium morphology as
afunction of the SMA 20 content in the blend PA-6/(PMMAlSMA20)
75/(25-xlx), x = wt% o/SMA 20. [K. Dedecker, G. Groeninckx, Polymer, 39,
4985 (1998)]
37

Chapter 1
•
• • • •
__________ • .L.-..>
Fig. 1.15: The weight average particle diameter as afunction oftheSMA20
content in the blend PA-6/(PMMAlSMA20) 75/(25-x/x), x = wt% ofSMA 20.
[K. Dedecker, G.Groeninckx, Polymer, 39, 4985 (1998)J
When low contents of SMA 20 are added, the amount of interfacial area
will initially be relatively low. Only a very limited amount of SMA 20 will be
close enough to the P A6/PMMA interface to react immediately. The remaining
amount of SMA 20 will have to diffuse over large distances, which will take a
longer time. When larger amounts of SMA 20 are added the amount of SMA 20
which can immediately react will be higher. The reaction of this SMA 20 can
already cause a significant particle size reduction. In these smaller particles, the
diffusion distance of the remaining SMA 20 towards the interface is decreased and
the amount of interfacial area is increased. In this way, the formation of the
equilibrium morphology will be very fast. It is important to note that the very fast
formation of the equilibrium morphology in blends with minimum 3 wt% SMA 20
is only possible because of the particle size reduction during extrusion. In parallel,
the small amount of the compatibiliser, SMA 20, could cause a dramatic reduction
of the equilibrium particle size (figure 1.15). It was also observed that the
38

Introduction
dispersed particles showed a more spherical shape and a more uniform size as the
amount of added SMA 20 was increased. The polydispersity of the particle size
also decreased.
Macosko and coworkers compared the reaction rates of aliphatic amine
and ~omatic amine end-capped PS with anhydride end-capped polyisoprene at
1800C. The reaction of the aliphatic amine was much faster than the aromatic one
and resulted in a molecular scale self-assembly into cylindrical micelles within
2 minutes of mixing. In contrast in the case of the slower reactive aromatic amine,
the blend did not show this molecular scale morphology even after 90 minutes of
mixing [158].
The molecular weight of the reacting polymers has also a direct influence
on the yield of the compatibilisation reaction. At a constant weight fraction of the
reacting polymers, the concentration of the reactive group attached as an cnd-group
of linear chains increases with decreasing molecular weight. In addition, lower
molecular weight chains diffuse faster to the interface and are localised in this
region as favourably as the entropic penalty is small [159-164]. Thus any decrease
in the molecular weight of the reacting polymers must be in favour of the
interfacial reaction.
Koning et al [165] studied the reactive compatibilisation of SMA and
poly (phenylene oxide) (PPO) blends by mixtures of a-amino-PS and
styrene/maleic anhydride random copolymers (SMA) containing 28 wt% maleic
anhydride groups. At constant weight faction of the a-amino-PS, the size of the
dispersed PPO particles was observed to decrease with decreasing molecular
weight of PS, and with the increasing concentration of the end functional groups.
Nevertheless, there is a lower limit for the molecular weight of the reactive
polymer below which the in-situ formed compatibiliser may escape the interface
where it has been formed. For example, in the reactive blending of PS with PMMA
39
Chapter 1
having end-reactive chains (PS-COOH: MW= 30,000 and PMMA-epoxy:
MW = 20,000), large PMMA particles were surrounded by small clouds of
micelles, whereas when a copolymer of higher molecular weight was formed in the
otherwise identical system, formation of micelles was not observed. Although the
mechanism of formation of these micelles is not well understood, it is strongly
related to the molecular weight of the copolymer.
1.14 Effect of mode of addition of the compatibiliser
In order to study the influence of mode of addition of EPM-g-MA [154]
the blending operations were carried out in four different ways: These include:
(i) PA6, EPM and EPM-g-MA were added together into the extruder and then
mixed (ii) Both PA 6 and EPM were preblended for three minutes and then EPM
g-MA was added into the blend (iii) EPM-g-MA was preblended with the minor
EPM phase for 3 min. and then mixed with the PA 6 phase(iv) EPM-g-MA was
preblended with the major continuous PA 6 phase for 3 min. and then mixed with
the EPM minor phase.
The morphology of the 20/80 EPMlPA 6 blend containinglO wt.% of
EPM-g-MA for the case (i), (ii), (iii); and (iv) are given in figures 1.16 (a-d)
respectively. The results are presented in Table 1.2. It is interesting to note that the
most finely and uniform dispersion is obtained when the EPM-g-MA was
preblended with the minor EPM phase. The size of the domains increases in the
order case (iii) , case (i) , case(ii) , case (iv); and case (iv) was the worst. This has
been further explained in figure 1.17 with a schematic model. In fact a two-step
mixing process in which the EPM-g-MA is mixed with the EPM phase
(EPM master batch) gives more opportunity for the EPM-g-MA to diffuse towards
the blend interface. In this method of mixing, the EPM-g-MA is forced to be at the
blend interface.
40

/ntroducdon
Fig. 1.16: SEM micrographs showing the influence mode o/Ilddiiion on the
morphology of 20180 EPMlPA 6 blend contllining 10 wt." 0/ EPM·g-MA:
(a) PA 6, EPM rubber IInd EPM-g-MA were lidded together into the extruder
and then mixed, (b) both PA 6 IInd EPM were prehlended lor three minutes and
then EPM-g-MA was added into the hlend, (e) EPM-g-MA was preblended with
the minor EPM phase/or 3 min. (EPM mtuterhatch) and then mixed with the
PA 6 phase,(d) EPM-g-M~ was preblended with the major condnuous PA 6
phase/or 3 min. (PA 6 masterbalch) and then mixed with the EPM minor
phase. (S. Thomas, G. Gro~nlnd(l:. Polym~r, 40, 5799 (1999»)
41

Chapter 1
-• • • · ., '. . .. • • • • · .' . •
• c
:~~~' . ." . • ••• • '. , i ' .' I
•
••• 0._ • e • • .1 • b
Fig. 1.17: Schematic models illustrating tire mode of mixing on blend
morphology: (a) mixing all together (simulhmeous addition), (b) added into
blend, (c) EPM masterbatch, (d) PA 6 masterbatclr. (S. Thomas, G. Groeninda.
Polymer, 40, 5799 (1999)J
This will lead to a situation where the EPM-g-MA can react with the
amino end group ofPA 6 at the interface and the resulting graft copolymer will be
easily located at the blend interface. Interestingly the polydispersity was lowest in
this case (table 1.1). In contrast, when the EPM-g-MA is pre-mixed with the PA 6
phase at high temperature (PA 6 masterbatch), the graft copolymer is already
generated as result of the reaction between the amino end group of PA 6 and MA
group of EPM-g-MA.
This graft copolymer has to diffuse into the blend interface during the final
mixing with the EPM rubber. It is believed that only a very small fraction of the
graft copolymer will be able to reach the interface in such a situation. Most of the
graft copolymer will be located in the bulk PA 6 phase where they will give rise to
micellar aggregation as depicted in figure 1.17 d and results a coarse morphology.
42

Introduction
Table 1.1: Effect of order of addition of compatibiliseron the morphology of
20180110EPMIPA 6/EPM-g-MA blend. {Se Thomas, G. Groeninckx. Polymer, 40,
5799 (1999)J
Mode of addition Dn (Ilm) Dw (Ilm) DwlDn
Added into blend 1.02 1.54 1.50
P A 6 masterbatch 2.03 3.42 1.68
EPM masterbatch 0.50 0.62 1.24
Mixed together 0.61 0.92 1.50
1.15 Effect of reactive blending on phase stabillsatioD in the melt
One of the important advantages of reactive blending is the stabilisation of
the blend phase morphology in the melt. The general morphology should be
preserved against coalescence during melt processing, on account of the fact that
very often polymer blends are annealed during fabrication and processing
operations which can lead to coalescence.
The phase instability was shown to be dramatic for blends of PPIP A6,
PFJPC and PSIPA6, as reported by White and co-workers [166-168] These studies
were carried out in the barrel of a capillary rheometer where annealing was
conducted. The influence of reactive compatibilisation on phase stability of blends
in the melt can be understood from table 1.2. The study of the phase stability of
reactive and non-reactive EPMIP A6 blends indicated that the number average
domain diameter is unaffected by annealing the melt in the case of the reactively
compatibilised blends. However, for the uncompatibilised EPMIP A6 blends, the
domain size increases drastically as a function of time; the rate of growth was
43

Chapter 1
found to be much faster at longer times [154]. Based on this observation, the
authors have concluded that the in-situ formed graft copolymer at the interface
between the phases stabilise the morphology against coalescence. It is believed that
the graft copolymer forms a shell around the dispersed phase, which leads to a
broad, stable and less mobile interface, which can resist coalescence.
Table 1.2: Mean dimension of phases in annealed polymer melt blends
[W.E. Baker, C.E. Scott, G.B. Bu, eds., Hanser, Munich, 2001)
Mean phase dimension (~m)
Blend System Blend ratio 30a 60· 90a
PSIPA6 60/40 90.2 140 310
HDPElPA6 50/50 163 248 278
LDPEIPA6 55/45 251 314 319
HDPElPA 11 50/50 50.9 202 229
LDPElPA 11 55/45 162 275 303
PSIPA 6/SAN 57/38/5 131 104 117
PSIPA6/SMA 57/38/5 4.02 4.65 4.58
HDPEIP A 6IMA-g-PP 47.5/47.5/5 8.81 11.9 10.1
LDPEIP A 6IMA-g-PP 47.5/47.5/5 4.53 6.90 13.0 .
HDPElPA I1IMA-g-PP 47.5/47.5/5 11.6 12.5 13.0
LDPFJPA IIIMA-g-PP 47.5/47.5/5 4.76 5.68 4.12
a annealing time in minutes
44

16 Effect of Reactive Blending on Phase Co-continuity 1.
Introduction
A lot of literature deal with the fonnation of co-continuous phase
morphologies in uncompatibilised binary polymer blends [169-172]. However,
very few literature deal with the phase co-continuity of reactively compatibilised
blends. Hietaoja et al [173] have investigated the phase morphology of the blend
system PA6IPP compatibilised by PP-MA.
E :::I.. C C
t i
,I I
I
/
o~ ______________________________ ~
o M ~ ~ 11 weight percent of EPU
Fig. 1.18: Effect of blend ratio on number average domain diameter for
uncompatibilised and reactively (2wL % EPM-g-MA) compatibilised EPMIPA6
blends IS. Thomas, G. Groeninckx, Polymer, 40, 5799 (1999)
The effect of the addition of the reactive compatibiliser on the location and
width of the phase inversion region was also studied; the authors observed only a
minor effect upon the addition of the reactive compatibiliser. De Roover [174] has
shown that in the case of in-situ compatibilisation, the amount of graft copolymer
formed at the interface does not affect the composition at which phase inversion
occurs. According to De Roover during the reactive blending of Poly (m-xylene
45

Chapter 1
adipamide) (PAMXD6) and PP-g-MA, the only parameter that detennines the
phase inversion composition is the viscosity ratio of the blend components at the
first stage of the mixing process. The location of the phase inversion region is fixed
early during the blending process and does not seem to be influenced by either
further modification of the viscosity ratio versus mixing time, or the amount of
graft copolymer formed during reactive blending. Recent data of Thomas and
Groeninckx [154], which were in agreement with those reported by De Roover,
showed that the addition of a reactive compatibiliser, EPM-g-MA does not have
any influence on the location of the region of phase co-continuity in EPM/P A 6
blends [154]. This can be understood from figure1.18 where the co-continuity is
observed between 40 and 70 wt% of EPM in both uncompatibilised and reactively
compatibilised blends.
On the other hand, upon reactive compatibilisation of PA6/PMMA blends
by SMA 20, a pronounced change in the region of phase co-continuity was
reported [156]. In this study the region of phase co-continuity has been analysed
both for the uncompatibilised and reactively compatibilised blends. It is reported
that the region of phase co-continuity is much smaller in the compatibilised blends,
and that this region is shifted to lower contents of P A6. The narrowing of the
region of phase co-continuity is ascribed to the reduced rate of coalescence in the
compatibilised blends. However, the observed shift in the region of co-continuity
upon reactive compatibilisation was not accounted for. It is believed that factors
such as increased viscosity, reduced mobility of the interface and the generation of
core-shell morphology have to be considered to explain the observed shift in the
region of co-continuity.
46

Introduction
1.17 Studies on the toughening of polystyrene
Several methods for incorporating rubber into PS matrix are known.
Besides the melt blending technology, the in-situ polymerisation technique has
been well proven to be an attractive method for producing HIPS [175,176]. In this
process, polymerisation of styrene containing 5-10% of dissolved butadiene based
rubber takes place thermally under agitation. While PS is forming, phase
separation occurs that finally produces multiphase morphology. The proposed
mechanisms for toughening rely mainly on the dispersion of rubber particles within
the glassy matrix results in energy absorption by the rubber particles, debonding at
the rubber matrix interface and crazing. Factors such as amount of rubber added,
type of rubber, size and morphology of the rubber particles, rubber phase volume,
degree of adhesion of the rubber to the matrix, relaxation behaviour of rubber, and
composition of rubber are believed to play a significant role in the improved
impactresistanceofHlPS [4,175,177 -183].
Natural rubber (NR) latex was also studied for its use as an impact
modifier of several polymers [184-186]. Due to its broad particle size distribution,
the existence of large size and high molecular weight [187], the NR latex particle
might be suitable for the improvement of toughness of glassy polymers including
PS. Tangboriboonrat et al [188] reported an attractive method for the preparation
of HIPS based on NR. The key steps involved the use of y-radiation vulcanised
natural rubber (RVNR) latex/phase transfer /bulk polymerisation. The toughened
PS prepared exhibited the HIPS like morphology, and the impact enerb'Y was
higher than that of the unmodified PS. The phase transfer technique has been
successfully used to transfer uncrosslinked, y-radiation vulcanised and
deproteinated NR latex particles from the aqueous phase into the styrene monomer
phase [189-191].
47

Chapter 1
Core shell particles containing PS subinclusions are well suited for the
toughening of PS [185). For the fine reinforcement of PS, the NR based particles
were coated with a shell of crosslinked PMMA or PS. Core shell particles based on
NR containing PS subinclusions toughened PS more effectively. The hard shell
assures adequate stress transfer at fast deformation speeds and the rigid
subinclusions render the rubber particles capable of stabilising a generated craze
since the incorporated rubber particles do not debond from the matrix.
The technological compatibilisation of PSINBR blend by
styrene-acrylonitrile copolymer (SAN) was carried out by M. Mathew et al [192].
The incorporation of SAN is effective in reducing the phase size of PSINBR
blends. The domain size of the dispersed phase decreases with the addition of small
amounts of the copolymer followed by levelling of at higher concentration. The
compatibilised blends showed improved impact toughness and transfonned into
super tough materials.
PS was toughcrltrl with EPDM in the presence of styrene-butadiene-styrene block
copolymer (SBS) and the incorporation of SBS into the PS/EPDM blends
improved the impact properties [\93]. The impact strength of PS can be increased
by reactive extrusion with trimethylol propane triacrylate (TMPTA) and dicumyl
peroxide (DCP) [194]. The coupling reaction caused by TMPTA increased the
molecular weight of PS. The coupling reaction was enhanced in the presence of
DCP at high TMPT AlDCP ratio. Toughness, thennal stability and storage modulus
of brittle PS could be improved by the addition of some more brittle polyphenyl
silsesquioxane (PPSQ) particles [195].
The influence of poly[( ethylene-co-vinylacetate )-g-polystyrene)
(EV A-g-PS) on the mechanical properties and morphological properties of PS has
been investigated by Soares et al [196]. Addition of the graft copolymer enhances
the mechanical and impact resistance of the PS matrix. Better results on impact
48

Introduction
strength and elongation at break have been achieved by using an EV A-g-PS
copolymer with higher EV A proportion by weight. Morphological studies by SEM
revealed some interfacial adhesion between the components in the compatibiJised
blends.
The impact strength of blends consisting of PS and EPDM could be
increased by adding poly (styrene/ethylene-propylene) (SEP) compatibiliser and
an organic peroxide during reactive extrusion [197]. The enhanced impact strength
could be related to the enhanced adhesion between the dispersed EPDM phase and
the PS matrix as a consequence of radical graft link between the rubbery part (EP)
ofthe compatibiliser and the dispersed EPDM phase.
S. Shaw et at [198] studied the impact modification of PS by EPDM
compatibilised by PS/EPDM-g-(styrene-co-methyl methacrylate) and observed that
there is improvement in impact strength with subsequent decrease in tensile
strength.
The effects of dynamic vulcanisation and blend ratios on mechanical
properties and morphology of thermoplastic elastomeric compositions based on
blends of NBR and SAN were studied [199]. Dynamic vulcanisation causes a
decrease in the size of the dispersed particles and improvement in mechanical
properties.
The impact strength of PS was considerably increased by the addition of
poly[ (n-BNMMA)/S] core shell structured particles. When the amount of core
shell particles added was 15 phr, impact strength was almost six times higher than
/that of unmodified PS [200].
The siLe of 00mains in a !i'ries of ~biImi polystyrene-( ethylene-propylene
rubber) blends was measured by solid-state NMR spin diffusion measurements.
The average diameter of ethylene propylene rubber (EPM) particles in the blends
Was observed to decrease as the concentration of interfacial agent was increased up
49

Chapter 1
to approximately 15% (weight/volume of EPM) and remained constant upon
further addition of interfacial agent. Comparison of the domain sizes obtained from
NMR measurements with those obtained from scanning electron microscopy
measurements suggests that the NMR technique can be used to confirm large scale
phase separation and investigate the trends in domain sizes in immiscible blends
[201].
Two triblock copolymers of styrene/ethylene-butylene/styrene (SEBS), of
different molecular weights, were used to compatibilise a blend of 80 vol %
polystyrene (PS) and 20% ethylene propylene rubber (EPM) [202]. Charpy and
Izod impact tests were performed to determine the effect of the compatibilisation
on mechanical properties of the blend and to establish links between morphology,
interface, and properties. Results suggest that for the lower molecular weight
interfacial agent, a transition in fracture mechanisms, from fragile to ductile, occurs
around 20% interfacial agent (based on the volume of the minor phase). This
transition, however, is not observed with the high molecular weight interfacial
agent.
The compatibility of solid blends: PS/SBR, PS/SBR filled with glass fibre
and PS/SBR filled with talc were studied using ultrasonic pulse echo technique.
Measurements were carried out at room temperature (298 K) and a frequency of
3 MHz. The ultrasonic velocity for the compressional wave and that for shear wave
have been measured to obtain the elastic modulus data by knowing the density.
The variation of ultrasonic wave velocities and elastic modulus with weight
percent of the blend was found to be linear in PS/SBR blend, indicating some
degree of compatibility but the drawback of elastic modulus indicate
incompatibility of the system blend, while it deviates from linearity in blends of
PS/SBR filled with glass fibre and talc but the increase in elastic modulus indicates
50

Introduction
that there is an increase in degree of compatibility between PS and SBR due to
addition of .glass fibre or talc [203].
1.18 Scope and objectives of the work
The objective of this research work is to prepare an ABS (acrylonitrile
butadiene-styrene) type toughened thermoplastic by melt blending polystyrene
(PS) and powdered nitrile rubber (NBR). The product may be an interesting class
of toughened thermoplastic, which would combine the superior mechanical and
processing characteristics of PS and the excellent oil-resistant properties of NBR.
PS offers excellent ozone resistance, weather resistance, mechanical properties and
easy processability. NBR compounds assume commercial interest due to its
excellent oil-resistance, abrasion resistance and elastic properties. Unfortunately,
blends of non-polar PS and polar NBR form incompatible mixtures, owing to poor
interaction between the two constituent polymers. Powdered NBR offers good flow
rate, mixing possibility and fully automatic continuous operation. No serious
efforts have been made to develop a technologically compatible toughened
thermoplastic from PS and NBR. Several methods have been developed to
alleviate the problem of incompatibility in polymer blends. These include
(1) addition of a third homopolymer or graft or block copolymer which is miscible
with the two phases, non-reactive compatibilisation (2) in-situ generation of graft
or block copolymer during melt blending via interfacial reaction of added
functionalised polymeric components, reactive compatibilisation, (3) using
vulcanised rubbers and (4) dynamic vulcanisation of the elastomeric part. The .
. 8ddition of these interfacial agents or compatibilisers reduces the surface tension
between the phases and thereby improves the interfacial adhesion and mechanical
properties. In this thesis an attempt has been made to investigate systematically the
effect of compatibilisation and dynamic vulcanisation on the morphology and
properties of powdered nitrile rubber toughened polystyrene.
51

Chapter 1
The main objectives of the work are:
.:. Correlation between morphology and mechanical properties of binary
blends
In a two phase system such as PSINBR, morphology is a major
determinant of properties. Thus the shape, size and distribution of the dispersed
phase along with the interfacial characteristics decide the mechanical properties. In
an incompatible blend premature failure occurs when subjected to a mechanical
load due to lack of adhesion between the two. The tensile measurements give an
idea about the maximum load bearing capacity of the material. The influence of
blend composition on the mechanical properties has been investigated .
• :. Evaluation of the effectiveness of compatibilisation based on phase
morphology
The PS/NBR blend system is incompatible resulting in inferior mechanical
properties. Hence it is essential to compatibilise it for satisfactory product
performance. Three compatibilisers, maleic anhydride modified polystyrene
(MAPS), phenolic modified polystyrene (PhPS) and styrene-co-acrylonitrile (SAN)
were used as compatibilisers. The effect of compatibiliser concentration on #
morphology and mechanical properties were investigated. Dynamic vulcanisation
using dicumyl peroxide was also adopted as a compatibilisation technique .
• :. Prediction of blend miscibility based on dynamic mechanical analysis
and effect of compatibilisation on miscibility.
The dynamic mechanIcal analysis of PS/NBR blends provides valuable
information regarding the damping-characteristics. The viscoelastic properties like
storage modulus, loss modulus and tan 0 of various blends were determined with
special reference to the effect of blend ratio and compatibilisation.
52

Introduction
.:. Evaluation of the processability of binary and compatibilised blends
by rheological measurements
The study of the flow behaviour of toughened thermoplastics is essential
to optimise the processing conditions and also to improve the quality of the final
product. The effect of blend ratio, compatibiliser concentration and dynamic
wlcanisation on flow behaviour was investigated .
• :. Evaluation of thermal stability by thermogravimetry
Polymeric materials are SUbjected to various types of degradation ranging
from thermal degradation to biodegradation. Polymer degradation is undesirable as
it leads to deterioration of properties. One of the most accepted methods for
studying the thermal properties of polymeric materials is the thermogravimetry.
The integral (TGA) and derivative (DTG) thermogravimetric curves provide
information about nature and extent of degradation of polymeric materials.
Thermogravimetric analysis can be used for determining the thermal stability of
polymers and polymer blends. The effect of blend ratio, compatibilisation and
dynamic wlcanisation on the thermal pn~perties was evaluated.
References
1.
2.
3.
4.
5.
6.
7.
8.
R.J. Gaymans, Toughening of semicrystalline thermoplastics. Polymer
Blends, Vol. 2; ( D.R. Paul and C.B. Bucknall eds.), pp. 177-224,
Wiley-interscience, New York (2000)
S. Wu, J. Appl. Polym. Sci., 35, 549 (1988).
R.N. Haward, G.-Thackaray, Proc.Roy. Soc. Land. A, 302, 453 (1968)
C.B. Bucknall, Toughened Plastics, Applied Science, London, (1977).
AM. Donald, E.J. Kramer, Philos. Mag. A. Ser. 8,43,857 (1981).
P. Beahan, M. Bevis, D. Hull, J. Mater. Sci., 8, 162 (1974).
H.R. Brown, J. Polym. Sci., Polym. Phys., 17, 1431 (1979).
P. Beahan, M. Bevis, D. Hull,J. Mater. Sci., 8,162 (1974).
53

Chapter]
9. I.D. Moore, Polymer, 12,478 (1971).
10. J. Silberberg, C.D. Man, 1. Appl. Polym. Sci., 22, 599 (1978).
11. AM. Donald, E.l. Kramer, 1. Appl. Polym. Sci., 27, 3729 (1982).
12. AM. Donald, EJ. Kramer, 1. Mater. Sci., 17,2351 (1982).
13. S. Newman, S. Strella,1. Appl. Polym. Sd., 9, 2297 (1965).
14. R.J.M. Borggreve, R.J. Gaymans, H.M. Eichenwald, Polymer, 30, 79 (1989).
15. A.F. Yee, R.A. Pearson, J. Mater. Sci., 21, 2462 (1986).
16. RA Pearson, AF. Yee,1. Mater. Sci., 21, 2475 (1986).
17. D.S. Parker, HJ. Sue, J. Huang, AF. Yee, Polymer, 31, 2267 (1990).
18. A.F. Yee, RA. Pearson, 1. Mater. Sci., 21,2462 (1986).
19. C.B. Bucknall, I.e. Drinkwater, W.E. Keast, Polymer, 13,115 (1972).
20. W.D. Bascom, RL. Cottington, R.L. Jones, P. Peyser, 1. Appl. Polym. Sci.,
19,2545 (1975)
21. A.F. Yee, J. Du, M.D. Thouless, Toughening of epoxies. Polymer Blends,
Vol. 2; ( D.R Paul and c.B. Bucknall eds.), pp. 225-267,
Wiley-interscience, New York (2000).
22. A. Lazzeri, C.B. Bucknall, Polymer, 36, 2895 (1995).
23. A. Lazzeri, C.B. Bucknall,J. Mater. Sci. 28,6799 (1993).
24. C.B. Bucknall, D.S. Ayre, D.J. Dijkstra, Polymer, 41, 5937 (2000).
25. C.E. Locke, D.R. Paul, 1. Appl. Polym. Sci., 17,2597 (1973).
26. W. Bartensen, D. Heikens, P. Piet, Polymer, 15,119 (1974).
27. c.R. Lindsey, D.R. Paul, J.W. Barlow, 1. Appl. Polym. Sci., 26, 1 (1973).
28. S.D. Sjoerdsma, AC.A.M Bleijenberg , D. Dickens, Polymer, 22, 619
(1981).
29. P. Teyssie, Makromol. Chem., Macromol. Symp., 22, 83 (1988).
30. G.E. Molau, Colloidal and Morphological Behaviour of Block and Graft
Copolymers in Block Copolymers, S.L. Aggarwal (ed.), p.70, Plenum Press,
New York, (1970).
54

Introduction
31. G. Reiss, J. Kohler, C. Tournut, A. Brandert, Makromol. Chem.,101, 58
(1967).
32. F. Ide, A. Hasegawa, J. Appl. Polym. Sci., 18, 963 (1974).
33. L. Leibler, Makromol. Chem., Macromol. Symp., 16, 1 (1988).
34. K.A. Shull, E.J. Kramer, Macromolecule~, 23, 457 (1990).
35. K. Sondergaard, J. Lyngaae-Jorgensen, in Rheo-Physics of Mulfiphase
Systems: characterization by Rheo- optical techniques, K. Sondergaard,
J. Lyngaae-Jorgensen (eds.)Technomic Publishing Company, Lancaster, PA,
(1995).
36. J.H. Anastasiadis, J.Gancarz, J.T. Koberstein, Macromolecules, 22, 1449
(1989).
37. D.R Paul, J.W. Barlow, Multiphase polymers, S.L. Copper and G.M Ester,
(eds.) p. 315, ACS, Washington D.C., (1979).
38. O. Olabisi, L.M. Robeson, M.T. Shaw, Polymer-Polymer Miscibility,
p.277, Academic Press, New York, (1979).
- 39. O. Olabisi, L.M. Robeson, M.T. Shaw, Polymer-Polymer Miscibility,
p.321, Academic Press, New York, (1979).
40. R Fayt, R Jerome, P. Teyssie, J. Polym. Sci .. Polym. Chem., ed., 22, 1633
(1984)
41. T. Ouhadi, R Fayt, R Jerome, P. Teyslilie, Polym. Commun., 27, 212 (1986)
42. J. Heuschen,R Jerome, P. Teyssie, Polym. Phys., 27, 775 (1989)
43. D.R. Paul, S. Newman, ed., Polymer Blends, Ch.2, Vol. 1, Academic Press,
New York, (1978).
- .44. M. Aubin, Y. Bedard, M.F. Morrissette, RE. Prud'homme, J. Polym. Sci.,
Polym. Phy., 21, 233 (1983)
45. D. Allard, RE. Prud'homme, J. Appl. Polym. Sci., 27, 559 (1982).
46. G. Be1orgey, R.E. Prud'homme, J. Appl. Polym. Sci., 27,559 (1982).
47. J.M. Jonza, RS. Porter, Macromolecules, 19, 1946 (1986)

Chapter 1
48. lD. McKay, J Appl. Polym. Sci., 43, 1593 (1991).
49. Y. Gnanou, P. Rempp, Makromol. Chem., 188, 2111 (1987).
50. G.O. Schulz, J. Milkovich, J Polym. Sci.,Poiym. Chem Ed.,22, 1633 (1984).
51. C.E. Locke, D.R. Paul, J Appl. Polym. Sei., 13, 2957( 1973).
52. R. Fayt, Ph. Teyssie, Polym. Eng. Sei., 30, 937 (1990).
53. R. Fayt, R Jerome, Ph. Teyssie, J Polym. Sci.,Polym. Phys., 20, 2209
(1981).
54. D. Braun, M. Fisher, G.P. Hell man, Makromol. Chem., Macromol. Symp.,
83, 77, (1994).
55. H. Keskkula, D.R. Paul, J.W. Barlow, Polymer blends, in Kirk-Othmer
Encyclopaedia of Chemical Technology, 4th Ed., Vol. 19, John Wiley and
Sons, New York, (1996).
56. S. Dutta, D.J. Lohse, Polymeric Compatibilisers, Hanser Publishers, Munich,
(1996).
57. F. Ide, A. Hasegawa, J Appl. Polym. Sci., 18, 963 (1974).
58. L. Leibler, Makromol. Chem., Macromol. Symp., 16, 1 (1988).
59. R. Greco, M. Maliconico, E. Matruscelli, G. Rogosta, S. Scarzini, Polymer,
28, 1185 (1987).
60. B. Majumdar, H. Keskkula. D.R. Paul, N.G. Harvey, Polymer, 35, 4263
(1994).
61. B. Majumdar, H. Keskkula. D.R. Paul, Polymer, 35, 1386, 1399,3164,5453
and 5468 (1994).
62. B. Majumdar, H. Keskkula. n.R Paul, J Appl. Polym. Sci., 54, 339 (1974).
63. R.J.M. Borggreve, R.J. Gaymans, J. Scuijer, J.F. Ingen Houze, Polymer, 28,
1489 (1987).
64. RJ.M. Borggreve, R.J. Gaymans, Polymer, 30,63, 71, 78, (1989).
65. W.E. Baker, M. Saleem, Polym. Eng. Sci., 27,1634 (1987).
66. W.E. Baker, M. Saleem, Polymer, 28, 2057 (1987).
56

Introduction
67. N.C. Liu, W.E. Baker, Adv. Polym. Technol, 11, 249 (1992).
68. N.C. Liu, W.E. Baker, Polymer, 35, 998 (1994).
69. VJ. Triacca, S. Ziaee, I.W. Barlow, H. Keskkula, D.R. Paul, Polymer, 32,
1401 (1992).
70. AJ. Oshinski, H. Keskkula, D.R Paul, Polymer, 33,268,284 (1992).
71. Y. Takeda, H. Keskkula, D.R. Paul, Polymer, 33,3173 (1992).
72. AR Padwa, RE. Lavengood, ACS Symp. Ser.,33, 600 (I 992).
73. S. Wu, Polym. Eng. Sci., 27, 335 (1987).
74. G. Serpe, I. Jarrin, F. Dawans, Polym. Eng. Sci., 30,553 (1990).
75. M. Lu, H. Keskkula, D.R Paul, Polymer, 34,1874 (1993).
76. M. Lu, H. Keskkula, D.R. Paul, Polym. Eng. Sci. 34, 33 (1994).
77. M.I. Modie, L.A Pottick, Polym. Eng. Sci. 33, 819(1993).
78. K. Dijkstra, RJ. Gaymans, Polymer, 35, 323 (1994).
79. A Gonzalez-Montiel, H. Keskkula, D.R. Paul, Polymer, 36, 4587, 4605,
4621, (1995)
80. J. Rosch, R Malhaupt, Makromol. Chem. Rapid Commun., 14,503 (1993).
81. R. Malhaupt, T. Duschek, I. Rosch, Polym. Adv. Tech, 4, 465 (1993).
82. M. Lu, H. Keskkula, D.R Paul, Polymer, 37, 625(1996).
83. B. Majumdar, D.R. Paul, Al. Oshinski, Polymer, 38, 1787 (1997).
84. Al. Oshinski, H. Keskkula, D.R. Paul, J. Appl. Polym. Sei., 61, 623 (1996).
85. Al. Oshinski, H. Keskkula, D.R Paul, Polymer, 37, 4891, 4909, 4919
(1997).
86. A Padwa, Polym. Eng. Sci. 32, 1703(1992).
- - 87. I.C. Angola, Y. Fujita, T. Sakai, T. Inoue, J. Polym. Sci.,Po/ym. Phys. 26,
807 (1988).
88. M. Xanthos, Polym. Eng. Sci. 28, 1392 (1992).
89. C.T. Maa, F.C. Chang, J. Appf. Polym. Sei., 49,913 (1993).

90. M.E. Stewart, S.E. George, R.L. Miller, D.R. Paul, Polym. Eng. Sci. 33, 675
(1993).
91. N.C. Beck Tan, S.K. Tai, R.M. Briber, Polymer, 37, 3909 (1996).
92. E.A. Flexman, Polym. Eng. Sci. 19,564 (1979).
93. N. Dharmarajan, S. Datta, Polymer, 33, 3848 (1992).
94. S. Datta, N. Dharmarajan, G. Ver Strate, L. Ban, Polym. Eng. Sci. 33, 721
(1993).
95. S.Horiuchi, N. Matchariyakul, K. Yase, T. Kitano, H.K. Choi, Y.M. Lee,
Polymer, 37, 3065 (1996).
96. S.Horiuchi, N. Matchariyakul, K. Yase, T. Kitano, Macromolecules, 30,
3664 (1997).
97. A.M. Aerdts, G. Groeninckx, H.F. Zirkzee, H.A.M. van Aert, J.M. Geuts,
Polymer, 38, 4247 (1997).
98. H. Li, T. Chiba, N. Higashida, Y. Yang, T. Inoue, Polymer, 38,3921 (1997).
99. K. Yokioka, T. Inoue, Polymer, 35, 1182 (1994).
100. B. Deroover, J. Devaux, R. Legras, J. Polym. Sci.,Polym. Chem., 35, 901
(1997).
101, B.O. Shaughnessy, U. Sawhney, Macromolecules, 29, 7230 (1996).
102. G.F. Fredickson, S.T. Milner, Macromolecules, 29, 7386 (1996).
103. B.c. Trivedi, B.M. Culbrtson, Maleic Anhydride, p. 269 Plenum Press,
New York, (1982).
104. N.G. Gaylord, M.K. Mishra, J. Polym. Sci.,Polym. Left., 21, 23 (1986).
'105. N.G. Gaylord, R. Mehta, J. Polym. Sci.,Polym. Chem., 26, 1189 (1988).
106. N.G. Gaylord, M.Mehta, R. Mehta, J.App!. Polym. Sei .. 33, 2549 (1987).
107. W. Heinen, C.H. Rosenmoller, c.B. Wenzel, H.J.M. Degroot, J. Lgtenburg,
M. Van Duin, Macromolecules, 29, 1151 (1996).
108. J.M.G. Cowie (ed.) Alternating Copolymers, Plenum Press, New York,
(1985).
58

Introduction
109. I. Park, J.W. Barlow, D.R. Paul, J. Polym. Sci.,Polym. Chem. 29, 1329
(1991).
110. M. Ha1den-Abberton, Polym. Mater. Sci. Eng.,65, 361 (1991).
111. M.E. Fowler, D.R. Paul, L.A Cohen, W.T. Freed, J.Appl. Po/ym. Sci., 37,
513 (1989).
112. J.R. CampbeU, S.Y. Hobbs, T.J. Shea, V.H. Watkins, Polym. Eng. Sci.,30,
1056 (1990).
113. J.H. Glans, M.K. Akkapoddi, Macromolecules, 24,383 (1990).
114. C. Carrot, M. Jaziri, J. Guillet, J.F. May, Plast. Rubber Process Appl .. 14,
245 (1990).
115. D.F. Ferrari, W.E. Baker, J. Polym. Sci.,Poiym. Chem. 36, 1572 (1998).
116. S.V. Usachev, N.D. Zhakarov, V.N. Kuleznev, AB. Ventoshikin, Int. Polym.
Sci. Tech., 7 (2), T 48-T 51 (1980).
117. A.Y. Coran, S. Lee, Paper presented at a meeting of the Rubber Division,
ACS Nov. 3 - 6 (1992).
118. C. Koning, M. Van Duin, C. Pagnoulle, R. Jerome, Prog. Polym. Sd, 23, 707
(1998)
119. D. Romanini, E. Garagnani, E. Marchetti, New Polym. Mat., Proc. Int. Sem.,
56, (1987).
120. Y. Kikuchi, T. Fukui, T. Okada, T.lnoue, Polym. Eng. Sci.,31, 1029 (1991).
121. AY. Coran in Thermoplastic Elastomers, A Comprehensive Review, Ch.7,
N.R. Legge, G. Holden, H.E. Schroeder, eds., Hanser, New York, (1987).
122. A.M. Gessler, US patent 3,037, 954, June 5, (1962).
123. W.K. Fischer, US patent 3,758, 643, Sept. 11, (1973). /124. P.L. Ma, B.D. Favis, m.F. Champague, M.A. Huneault, F. Tofan, Po/ym.
Eng. Sci.,42, 1976 (2002).
125. X. Liu, H. Huang, Z.Y. Xie, Y. Zhang, K. Sun, L.N. Min, Polymer Testing,
22, 9 (2003).
59

126. X.F. Zhang, H. Hung, Y.X. Zhang, JAppl. Polym. Sei., 85,2862 (2002).
127. Z.J. Wang, X.F. Zhang, Y.X. Zhang, Polymer Testing, 21,577 (2002).
128. C.R. Kumar, 1. Fuhrmann, J. Karger Kocsis, J Hydrology, 261, 137 (2002).
129. D.K. Setua, C. Soman, AK. Bhowmick, G.N. Mathur, Polym. Eng. Sei.,42,
10 (2002).
130. Y. Coran, R. Patel, Rubber Chem. Technol., 53, 141 (1980).
131. H. J. Radusch, , E. Lammer, T. Liipke, L. Haussler, M. Sandring,
Kautschuk Gummi Kunstst., 44, 1125 (199
132. W.E. Baker, C.E. Scott, G.H. Hu, (eds.), Reactive Polymer Blending, Ch. 4,
Hanser, Munich, (2001).
133. Y.D. Lee, C.M. Chen,JAppl. Polym. Sei., 33, 1231 (1987).
134. W.E. Baker, C.E. Scott, G.H. Hu, (eds.), Reactive Polymer Blending, Ch. 4
Hanser, Munich, (2001).
135. C.E. Scott, C.W. Macosko, Polymer, 35, 5422 (1994).
136. C.M. Ro1and, G.G.A Bohm, J Polym. Sci.,Po/ym. Phys., 22, 79 (1984).
137. JJ. Elmendrop, A.K. Van derVegt, Polym. Eng. Sci.,26, 1332 (1986).
138. AK. Chester, Trans I Chem, 61, 259 (1991).
139. J.L. Jorgensen, A. Va1enza, Makromol. Chem., Makromol. Symp., 38, 43
(1990).
140. G.I. Taylor, Proc. R. Soc. London, A 138, 41 (1932).
141. G.I. Tay1or, Proc. R. Soc. London, A 146, 501 (1934).
142. W. Bartok, S.G. Manson, 1. Colloid Sci., 13, 393 (1958).
143. HJ. Karan, J.C. Bellingeer, Ind. Eng. Chem. Fundam., 167,241 (1986).
144. H.P. Grace, Chem. Eng. Commun, 14,225 (1982).
145. HJ. Van Oene, J Colloid Interface Sci., 40, 448 (1972).
146. S. Wu, Polym. Eng. Sci.,27, 335 (1987).
147. A.J. Oshinski, H. Keskkula, D.R. Paul,Po/ymer, 37, 4891 (1996).
148. M.A. Huneault, Z.H. Shi, L.A. Utracki, Polym. Eng. Sci., 35, 115 (1995).
60

Introduction
149. G. Serpe, J. Jarrin, F. Dawans, Po/ym. Eng. Sci., 30,553 (1990).
150. U. Sundararaj, C.W. Macosko, Macromolecules, 28,2647 (1995).
151. A.P. Plochocki, S.S. Dagli, R.D. Andrews, Polym. Eng. Sci., 30, (1990).
152. B. Majumdar, D,R, Paul, J. Oshinski, Polymer, 38, 1787 (1997).
153. G.H. Ru, L.J. Kadri, J Polym. Sci .. Polym. Phys., 36,2153 (1998).
154. S. Thomas, G. Groeninckx, Polymer, 40, 5799 (1999).
155. K. Dedecker, G. Groeninckx, Polymer, 39, 4985 (1998).
156. K. Dedecker, G. Groeninckx, Polymer, 39, 4993 (1998).
157. C. Pagnoulle, C. Koning, L. Leemans, R. Jerome, Macromolecules, 33,
6275 (2000).
158. C.A. Orr, A. Adedeji, A. Rirao, F.S. Bates, C.W. Macosko, Macromolecules.
30, 1243 (1997).
159. n. Broseta, G.H. Fredrickson, E. Helfand, L. Leibler, Macromolecules. 23,
132 (1990).
160. E. Helfand,J Chem. Phys., 62(3), 999 (1975).
161. E. Helfand, A.M. Sapse, J Chem. Phys., 62(4),1327 (1975).
162. J. Kressler, Macromolecules, 27, 2448 (1994).
163. S.K. Kumar, Macromolecules. 27,260 (1994).
164. J. Reiter, G. Zifferer, O.F. Olaj, Macromolecules, 23,224 (1990).
165. C.E. Koning, A. Jkker, R. Borgb'TeVe, L. Leemans, M. Moller, Polymer, 34,
4410 (1993).
166. J.L. White, K. Min, Mixing of Polymer in Comprehensive Polymer Science,
S.L. Aggarwal, ed., Pergamon, New York (1989).
167. S. Endo, K. Min, J.L. White, T. Kyu, Polym. Eng. Sei., 26, 4563 (1985).
168. C.C. Chen, F. Fontain, K. Min, J.L. White, Polym. Eng. Sci., 28, 69 (1988).
169. n.R. Paul, J.W. Barlow, J Macromol. Sei., Macromol. Chem., e18, 109
(1980).
61

Chapter 1
170. G.M. Jordhamo, J.A Manson, L.H. Sperling, Polym. Eng. Sci., 26, 517
(1986).
171. V.I. Metelkin, V.S. Blekht,J. Colloid, 46, 425 (1984).
172. L.A Utraki, Po lym. Ma ter. Sci. Eng., 65, 50 (1991).
173. P.T. Hietaoja, R.M. Holsti-Miettinen, J. Seppala, O.T. Jkkala, J.Appl. Polym.
Sci., 54, 1613 (1994).
174. B. De Roover, PhD Thesis, University Cotholique de Louvain (1994).
175. AA Collyer, Rubber Toughened Engineering Plastics, Chapman and Hall,
London, (1994).
176. A Echte, Rubber Toughened Plastics, pp 15-64, C.K. Riew, ed. ACS,
Wasington D.C. (1989).
177. E. Piorkowska, AS. Argon, R.E. Cohen, Macromolecules. 23, 3838 (1990)
178. AM.L. Magahaes, J.M. Borggreve, Macromolecules, 28, 5841 (1995).
179. S.G.Turley, H. Keskku1a. Polymer, 21,466 (1980).
180. D.G. Cook, A Plumtree, A Rudin, Plas!. Rubber Compos. Process Appl.,
20,219 (1993).
] 81. D.G. Cook, A Plumtree, A. Rudin, J. Appl. Polym. Sci., 48, 75 (1993).
182. G. Dagli, AS. Argon, R.E. Cohen, Polymer, 36,2173 (1995).
183. S.Y. Hobbs, Polym. Eng. Sci., 26, 74 (1986).
184. M. Schneider, T. Pith, M. Lambla, J. Appl. Polym. Sci., 62, 273 (1996).
185. M. Schneider, T. Pith, M. Lambla,J. Meter. Sci .. 32,6331 (1997).
186. M. Schneider, T. Pith, M. Lambla, Polym. Adv. Technol., 7, 577 (1996)
187. K.F. Gazeley, AD.T. Gorton, T.D. Pendle, Natural Rubber Science and
Technology, AD. Roberts, ed., pp. 63-97, Oxford Science Publications,
Oxford, (1988).
188. P. Tangboriboonrat, C. Tiyapiboonchaiya, J. Appl. Polym. Sci., 71, 1333
( 1999).
189. P. Tangboriboonrat,K. Suchiva, S. Kuhakam, Polymer, 35,3144 (1994)
62

Introduction
190. P. Tangboriboonrat,K. Suchiva, G. Riess, Polymer, 36,781 (1995)
191. P. Tangboriboonrat,K. Suchiva, S. Kuhakam, S. Thuchinda, J Nat. Rubb.
Res., 11,26 (1996).
192. M. Mathew, S. Thomas, Polymer, 44, 1295 (2003).
193. Z.P. Fang, Z.H. Guo, L. Zha, Macomol. Meter. Eng., 289, 743 (2004).
194. B.K. Kim, K.H. Shon, H.M. Jeong, J Appl. Polym. Sei., 92, 1672 (2004).
195. G.Z. Li, M.L. Ye, L.H. Shi, J Appf. Polym. Sei., 60, 1163 (1996).
196. B.G. Soares, R.V. Barbosa, J.c. Covas, J Appl. Polym. Sei., 65, 2141
(1997).
197. U. Crevecoeur, L. Nelissen, M.C.M. Vander Sanden, P.J. Limstra, Polymer,
36, 1295 (1995).
198. S. Shaw, R.P. Singh, J Appl. Polym. Sci., 40, 693 (1990).
199. S. Anandhan, P.P. De, S.K. De, AK. Bhowmick, J Appl. Polym. Sci., 88,
1976 (2003).
200. T.Y. Guo, G.L. Tang, G.J. Hao, M.D. Song, B.H. Zhang, J Appl. Polym.
Sci., 90, 1290 (2003).
201. Kevin S. Jack, Almeria Natansohn, Jiahu Wang, Basil D. Favis,
Cigana, Chem. Mater., 10, 1301 (1998).
202. Patrick Cigana, Basil D. Favis, Carolyne Albert, Toan Vu-Khanh,
Macromolecules, 30,4163 (1997).
203. AA. Higazy, H. Afifi, A.H. Khafagy, M.A EI-Shahawy,
A.M. Mansour, Ultrasonics, 44, 1439 (2006)
Patrick
63

Chapter 2
Experimental techniques
The materials used for the study, the experimental methods, procedures
used for blending, sample preparation and measurement of various properties are
discussed in this chapter.
1.1 Materials
1.1.1 Polymers
Polystyrene (PS) was supplied by Mls LG polymers, Mumbai, India.
Powdered nitrile rubber (NBR) was purchased from Mls Gujarat Apar polymers
Ltd, Mumbai, India.
Polystyrene
Density = 1.05g!cm3, Melt flow index =lOgllO min.
Uncrosslinked powdered NBR (P 6423)
Acrylonitrile content = 33%, density
~O+4) 100°C = 80.
Partially crosslinked powdered NBR (P 3383)
1.0 g/cm3. Mooney viscosity
Acrylonitrile content = 33%, density = 1.0 g/cm3 Mooney viscosity
(1+4) lOODe = 60.

cnapter~
2.1.2 Compatibilisers
Maleic anhydride modified polystyrene (MAPS) was prepared by melt
mixing PS (100g) with maleic anhydride (6g) and dicumyl peroxide (lg) in a
Haake Rheocord at 180°C and 60 rpm [1]. The sample was purified by extracting
with acetone and dried at 40"C in a vacuum oven for 6 h. The FTlR spectrum of
the sample was recorded on a Nicolet Avtar 360 ESP FTIR spectrophotometer at a
resolution of 2 cm-I with the spectral range of 4000 - 400 cm-I
Phenolic modified polystyrene (PhPS) was prepared usmg a Haake
Rheocord by melt mixing process [2-4]. PS (lOOg) and dimethylol phenolic resin
SP 1045 (4g) were mixed at180°C and 60 rpm for 3 min. Stannous chloride (0.8g)
was then added and mixing was continued for 2 min. The sample was purified by
extracting with acetone. The FTIR spectrum of the sample was recorded on a
Nicolet Avtar 360 ESP FTTR spectrophotometer with the spectral range of
4000-400 cm-I
Styrene-co-Acrylonitrile (SAN) was purchased from Anoopam plastics
India Ltd, New Delhi.
2.2 Experimental procedure
2.2.1 Blending
Blends were prepared by melt mixing in Haake Rheocord 600 for 10 min.,
at 40 rpm rotor speed and 180°C. PS was first melted for 4 min. followed by the
addition of powdered NBR. Mixing was continued for 6 min. In compatibilised
blends, compatibilisers were added 4 min. after the melting of PS and mixed for
another 2 min. followed by the addition of NBR. The compatibiliser concentration
was varied from I to 10 wt%.
66

Experimental .. ...
-1 2 2.2. Dynamic crosslinking
Dynamic vulcanisation was carried out with dicumyl peroxide
(40% active DCP). The concentration of the DCP was varied from 0.5 to 2 phr.
Representative sample codes with composition are given in table 2.1
2.3 Moulding
The hot mix was sheeted out using a two roll mill and granulated. The test
specimens were prepared using a semiautomatic plunger type injection moulding
machine at a barrel temperature of 180°C.
Table 2.1: Representative sample codes with composition
PlOD lOOPS
P95 95 PS/5 NBR
P90 90 PSIlO NBR
PX95 95 PS/5 XNBR
PX90 90 PSIIO XNBR
P9oD1.5 PyO vulcanised using 1.5 phr DCP
P90M2 PyO containing 2% MAPS
P90H2 PYU containing 2% PhPS
P9oS2 P90 containing 2% SAN
Scanning electron microscopy
Scanning electron microscopy is a very useful tool to gather information
about topography, morphology, composition and microstructural information of
materials. The image is formed by scanning a probe of focused electron beam
67

across the specimen. The electron beam interacts with a thin film surface layer of
the specimen resulting in back scattering of electrons of high energy, generation of
secondary electrons of low energy and X-rays. These signals are monitored by
detectors and magnified. An image of the investigated microscopic region of the
specimen is thus observed in cathode ray tube and photographed using
photographic film. SEM image has characteristic three dimensional appearance and
are useful in judging the surface structure of the sample.
In the present study, morphological characterisation of the fractured
surfaces of the tensile test specimens was carried out using scanning electron
microscope (Cambridge Stereoscan S 360) after sputter coating the surface with
gold/palladium alloy. The domain size was measured from the scanning electron
photomicrographs. Several micrographs were taken for each blend and about 100
domains were taken for number average domain diameter measurements. The
apparent domain diameter was obtained from the measurement of hole diameter.
2.5 Mechanical properties
Tensile testing was done using dumb-bell shaped samples at a cross-head
speed of 50mmlmin. with a Universal Testing Machine (UTM)-Shimadzu AG 1
according to the ASTM D-638 test method. One grip is attached to a fixed and the
other to a movable (power-driven) member so that they will move freely into
alignment as soon as any load is applied. Test specimen was held tight by the two
grips, the lower grip of which was fixed. The output data in the form of
stress-strain graph and elongation, modulus and energy absorbed at various stages
of the test directly appears on the console of the microprocessor and as a print out.
The area under the stress-strain curve provides an indication of the overall
toughness of the material at the particular temperature and rate of loading. The
energy absorbed by the sample is also a measure of the toughness.
68
Experimental .. ..•
:~
Izod impact strength was measured on a Zwick Impact Tester as per
ASTM D 256-88 specifications. Impact strength is the energy absorbed by the
specimen during the impact process and is given by the difference between the
potential energy of the hammer or striker before and after impact.
The specimens were tested on the impact tester having 4J capacity hammer
and striking velocity of 2.2 m/so A sample is clamped vertically in the base of the
machine. The pendulum is released. The impact resistance or strength is evaluated
from the impact values directly read from the tester.
The flexural properties were tested on a Shimadzu Autograph
(AG-l 50 kN) Universal Testing Machine (ASTM D 790) at a constant rate of
traverse of the moving grip of 1.3 mm/min. The cast specimens in the form of
rectangular bars were polished using emery paper prior to testing. The depth and
width of the specimen was measured nearest to 0.01 mm. The support span should
be 16 times the depth of the specimen. The specimen was centred on the supports
with the long axis of the specimen perpendicular to the loading nose and supports.
The load was applied to the specimen and flexural strength and modulus were
recorded. The load-deflection curve was also obtained. It is calculated at any point
on the stress strain curve by the following equation
3PL S=--
2bd 2
where S = stress in the outer fibres at midpoint (MPa), P = Load at any point on the
load-elongation curve (N), L = support span (mm), b = width of specimen tested
ynm), d = depth of specimen (mm).
Flexural modulus is the ratio of stress to corresponding strain and is
expressed in MPa. It is calculated by drawing a tangent to the steepest initial
straight line portion of the load- deflection curve and using the equation
69

T:1Iapter :t
where EB = modulus of elasticity in bending (MPa), L = support span (mm),
b = width of specimen tested (mm), d = depth of specimen (mm), m = slope of
the tangent to the initial straight line portion of the load - deflection curve
(N/mm of deflection)
2.6 Dynamic mechanical analysis
The dynamic mechanical analysis of the samples was carried out using a
dynamic mechanical analyzer (TA instrument Q 800). Rectangular 50x12x3 mm3
samples were subjected to a frequency of 1 Hz over a temperature range of 35 to
120°C at a heating rate of 3°C/ min.
2.7 Melt flow measurements
Rheological measurements were carried out using a capillary rheometer attached to
an Universal Testing Machine. A capillary of lcnboth 40 mm and diameter 1.0 mm
was used. The angle of entry was 90° so as to minimise end effects. Samples for
testing were cut into small pieces and packed inside the barrel of the extrusion
assembly without air entrapment. The melt height before extrusion was kept the
same in all the experiments. The material was extruded at 170, 180 and 190DC
through the capillary at six pre-selected cross-head speeds. The force
corresponding to different plunger speeds was recorded. The force and cross-head
speeds were converted into apparent shear stress (Lw) and shear rate (y w ) at the
wall respectively, using the following equations involving the geometry of the
capillary and plunger:
70

Experimental .. .••
where F the force applied at a particular shear rate, Ap the cross-sectional
area of the plunger, le the length of the capillary and de the diameter of the
capillary, Q the volume flow rate and n' the flow behaviour index.
The flow behaviour index n' was determined by regression analysis of the
values of 'Lw and 'Y w obtained from the experimental data. The shear viscosity,
11 was calculated from 'Lw and Yw using the relation
2.8 Die swell measurements
Extrudates emerging from the die of the capillary were collected for
die-swell measurements taking maximum care to avoid any further deformations.
The die swell ratio was calculated by measuring the diameter of the extrudate (de)
at several points using a travelling microscope. The swelling index is the diameter
of the extrudate to that of the capillary (de).
Die - swell ratio = de de
2.9 Determination of crosslink density
, The crosslink density (CLD) ofvuIcanised samples was determined by the
'eqUilibrium swelling method. To estimate the extent of cross linking, the volume
fraction, Vr, of the rubber in chloroform swollen specimens was determined after
48 hours using the relation [5]
71

C'hapter7
(D fT) ·1 Vr = - Pr (D-fT)P r-
1 + AOp;1
where D the weight of the sample after drying out, f the fraction of insoluble
components, T the weight of the sample, AD the weight of the absorbed solvent,
Pr the density of the rubber and Ps the density of the solvent.
2.10 Thermogravimetric analysis
Thennogravimetric analysis of the samples was carried out using a
thennogravimetric analyzer (TA instrument Q 50). A small amount (1-3 mg) of
sample was taken for the analysis and the samples heated from 30 to 800DC at a
heating rate of 20DC/min in nitrogen atmosphere. The TGA and DTG curves are
drawn for each sample.
2.11 Fourier transform infrared spectroscopy
Fourier transform infrared spectra (FTIR) are generated by the absorption
of electromagnetic radiation in the frequency range 400 to 4000 cm-I by organic
molecules. Different functional groups and structural features in the molecules
absorb energy at characteristic frequencies. The frequency and intensity of
absorption are the indication of the bond strength and structural geometry in the
molecule. The FTIR spectrum of the sample was recorded on a Nicolet A vtar 360
ESP FTIR spectrophotometer with the spectral range of 4000-400 cm l.
References
l. K. Dedecker, G. Groeninckx, Macromolecules, 32".2472 (1999)
2. AY. Coran, R. Patel, Rubber Chem. Technol., 56, 1045 (1983)
3. A.Y. Coran, R. Patel, US 4299931 (Nov. 10, 1981) (to Monsanto Co.)
4. A.Y. Coran, R. Patel, US 4355139 (Oct. 19, 1982) (to Monsanto Co.)
5. P.E. Cassidy, T.M. Aminabhavi, C.M. Thompson, Rubber Chem. Tech., 56,
594 (1983)
72

Chapter 3
Toughening of polystyrene with uncrosslinked
and partially crosslinked powdered NBR
Plastic/rubber blends have been commercialised as rubber toughened
plastics or as thermoplastic elastomers [1, 2]. Generally if a relatively large portion
of the hard plastic is used, the composition can be used as an impact resistant
plastic; whereas, if a relatively large amount of rubbery phase is used, the blend
will be soft and have at least some of the properties of an elastomer. Polymer
blends vary greatly in morphological complexity. Rubber toughened plastics are
typically two phase systems consisting of a rubbery impact modifier dispersed in a
thennoplastic matrix. Small changes in the size and arrangement of these dispersed
particles can produce large variation in the physical performance and aesthetic
qUalities of the blend.
The main physical factors that determine the final morphology of the
blends are composition, rheological and physical characteristics of the components,
relative compatibility, and rate of shearing during the melt mixing. Detailed
)nvestigations on phase morphology development, phase co-continuity and phase
stability of polymer blends [3, 4] have been undertaken. The correlations between
morphology and mechanical properties have been established [5, 6]. In fact, it is
well known that by using different mixers, andlor by varying the mixing
parameters, it becomes possible to control phase morphology [7-9].

C'hapter3
Morphology development is the evolution of the blend morphology from
pellet-sized or powder sized particles to the sub micrometer droplets, which exists
in the final blend. Final morphology has a controlling influence on the properties
and end use of the blend. Knowledge of mechanism of morphology development is
useful for design of intensive mixers with better dispersive mixing capabilities for
reactive blending and also to understand the kinetics of creation of interfacial area
during blending. The mechanism governing morphology developments are; fluid
drops stretching into threads, break-up of the threads into smaller droplets [9] and
coalescence of droplets into larger ones. Balance of these competing processes
determines the final particle size, which is formed upon solidification of the blend.
While drop break-up is not dependent on the content of the dispersed phase [10],
coalescence [9] is strongly influenced by the blend composition [8, 11, 12]. There
are several good reports depicting the relationship between morphologies and these
factors [13- I 8].
Thomas et al [19] studied the effect of processing conditions on the
morphology development of P A6/EPM blends. The dispersed phase morphology as
a function of mixing time was investigated for aromatic amorphous P A6/Zytel
(Zyte1 330)/EPM and PS/EPM by Scott and Macosko [20]. In this study most of
the reduction in the dispersed phase size was observed at shorter mixing times in
conjunction with the melting and softening process. At intermediate mixing time,
the morphology consisted of a large number of small particles along with a small
number of very large particles in the size distribution. The effect of subsequent
mixing reduced the size of the largest particles in the size distribution. Other
reports in the literature regarding the influence of mixing time on the dispersed
phase size include the studies of Karam and Bellinger [21), Karger-Kocsis et at
[22], Schreiber et al [23] and Laokijcharoen et al [24].
74

Toughening of polystyrene .. ...
-The influence of time of mixing in a Haake Rheocord on the size of
dispersed phase has been studied by a number of workers. Particle size reduction is
the fIrst step in morphology development for a poly blend. Favis [25] observed that
for polypropylene/polycarbonate (PP/PC) blends, the most significant particle size
defonnation and disintegration process took place within the first 2 min. of mixing.
After 2 min. very little reduction in the size of the dispersed phase was observed up
to 20 min. mixing time. Based on these results it was suggested that melting
process might be important in generating the final morphology of an immiscible
blend. Plochocki et al [26] studied the processing of PS/LDPE blends in several
industrial mixers and observed that the initial dispersion mechanism might be due
to abrasion of solid or partially softened pellets on the wall of the processing
equipment. Sundararaj et al [27] studied the processing of both polyamidelPS and
polypropylenelPS blend systems in a twin screw extruder and showed that major
reduction in domain size occurred during the melt softening step. Continued
mixing reduces the size of large particles and rounds off the particles. Morphology
of the dispersed phase is rapidly modified under dynamic conditions in the melt.
Numerous studies were carried out to investigate the toughening of PS by
the effects of dispersed rubber phase properties such as rubber concentration,
particle size, shape, spatial packing of the rubber particles and the degree of
functionalisation. However there were few studies concerned with crosslinking of
the rubber phase. Bucknall [1] reported that crosslinking of rubber particles is
desirable since during impact the rubber phase is subjected to a very large tensile
strain giving craze like structure. A moderate degree of crosslinking allows the
/fubber particles to reach high strain by fibrillation and at the same time renders
mechanical strength to the fibrils. Dao [28] found that crosslinked ethylene
propylene diene terpolymer (EPDM) is more effective as an impact modifier for
polypropylene than uncrosslinked EPDM. A moderate degree of crosslinking
allows the rubber to reach high strains by fibrillation and at the same time renders
75

mechanical strength to the fibrils. Crosslinking increases the rubber viscosity,
which will affect the blending process and particle size of rubber. The particle size,
in turn, strongly influences the impact behaviour of the blends [29]. Crosslinked
EPDM did not seem to have any effect on the impact properties of
polyamide6/EPDM blends (30). Mehrabzadeh et al [31] studied the effect of
crosslinking on the impact properties ofPA lllNBR blends. They found that static
and dynamic cross linking do not significantly improve the impact strength. Several
recent articles deal with the optimisation of processing parameters based on
morphology and mechanical properties [32-35].
Miscibility between two polymers is usually characterised by dynamic
mechanical analysis or viscoelastic data. The viscoelastic properties like storage
modulus, loss modulus and tan 0 of polymer depend on structure, crystallinity and
extent of cross linking [36]. The effect of polychloroprene content on the storage
modulus of ABS was reported by Kang et at [37]. They found that the storage
modulus of the blends increases with increase in rubber content. The effect of
blend ratio on the dynamic mechanical properties of PPINBR blends was
investigated by George et at [38]. Mas et at [39] studied the effect of blend ratio on
the dynamic mechanical properties of PCI ABS blends.
The usual processing techniques for polymeric materials are injection
moulding, extrusion etc. Therefore, it is very important to study their rheological
properties to optimise the processing conditions. The importance of rheological
studies in predicting the flow behaviour of polymer systems at high ~emperatures
and shear conditions of extrusion and injection moulding processes has been
described by several authors [40-42]. Danesi and Porter [43] have reported on the
rheological behaviour of polyp ropy le ne and ethylene propylene rubber blends.
76

Toughening of polystyrene .....
-_~ In order to develop durable industrial products it is necessary to investigate
the thennal stability of these blends. Thennogravimetric analysis can be used as a
way to measure the thenna! stability of polymer due to the simplicity of this weight
loss method [44, 45]. The thermal degradation of polymer blends was investigated
by various researchers using the thermogravimetric method [46]. The blending of a
polymer with other polymers has stabilising as well as destabilising effects.
Grassie et at [46] reviewed these stabilising effects of blending. The complete
degradation of PMMA into monomers on heating can be considerably reduced by
blending with other polymers. The destabilising effect of PVC on the degradation
of polymers was also investigated. Varughese et at [47] reported that, the blending
ofENR with PVC reduced the rate ofHel elimination in the first degradation step
of PVC. The thermal degradation behaviour of blends has been used to identify
SBRlBR blends from SBR based compounds by Amraee et al [48] from the ratio
of the peak heights ofDTG. The effect of miscibility of polymer blends on thermal
degradation behaviour was investigated by Lizymol et at [49].
This chapter focuses on the preparation of toughened thermoplastic
polymer by melt blending polystyrene with uncrosslinked and partially crosslinked
nitrile rubber powder (NBR and XNBR) and to evaluate mechanical properties,
morphology, dynamic mechanical properties, melt rheology and thermogravimetric
analysis of the resulting blends.
3.1 Processing characteristics
The processing characteristics of the blends have been studied from the
/lorque-time plots. Figure 3.1 shows the torque-time plots of PS/NBR and
PSIXNBR blends. All the blends show a higher mixing torque than PS and the
torque is found to increase with NBR content. This is due to higher melt viscosity
of NBR as compared to PS. The XNBR blends register higher torque than blends
77

Chapter 3
with uncrosslinked NBR. In these blends the crosslinked rubber particles exert
greater resistance to rotation.
9
8
7
-E ~6
Cl.> ::l
~ o I- 5
4
2
----+--- PlOO -- P'l5 ----+-- P 'Xl ~ PRS----'- P W
-+-1\5---'- ~)-'-1\5 ----+--1\0 ~ ~
4
---------.- . .--:-<t"'-~.4---<4t----<t. .-~~---+~.--+
6
lirre (rrin.)
T ... • •
8
T ..,.
" ... ------• •
10
l I
I
Fig.3.}: Variation of torque with time ofmix;ngfor various PSINBR blends
3.2 Effect of blend ratio on mechanical properties and morphology
Figures 3.2 and 3.3 show the variation of tensile strength and Young's
modulus as a function of weight percentage of NBR. From the figures it is clear
that for the two blend systems, tensile strength and Young's modulus decrease with
increase in NBR content.
78

I.
40
35 .-... ro n... ~ ~30
.c .... Cl C
~ 25 -U)
~ '00 c Q) 20 I-
15
0 5
Toughening of polystyrene .....
..--------~
c;- uncrosslinked I\I3R I ---+--- crossIinked !\BR
10 15
'/Vt% of !\BR
20
Fig. 3.2: Variation of tensile strength of PSINBR blends with wt% of NBR
The observed decrease in tensile strength and Young's modulus is due to
the presence of soft rubber phase and poor interfacial adhesion between the
non-polar PS and polar NBR phases which causes poor stress transfer between the
matrix and the dispersed phase, Blends with XNBR display higher values than
79

Chapter 3
blends with NBR. This is due to better interfacial adhesion between PS matrix and
XNBR.
2.0
1.5
ro a.. (!)
1.0 '-'
Cl) ~
~ -0 0 E 0.5
_Cl)
Cl C ~ 0 >- 0.0
5
._-_._. ._-- ... _._-
--uncross/inked N8R. --aossIinked NBR
10
W%ofNBR
15
----1
I
I
I
20
Fig. 3.3: Effect of blend ratio on Young's modulus of PSINBR blends
The variation of elongation at break with rubber content is shown in
figure 3.4. Blends with XNBR have higher elongation at break. This is because the
80

Toughening oJpolystyrene .....
craze fibrils are stabilised by molecular entanglements and can sustain high
stresses for long periods. In unvulcanized systems the molecular entanglement is
MU\ble to prevent rapid flow and fracture, in response to applied stress.
3.6
3.4
3.2
-~ 3.0 ~ ro !!? 2.8 .0 -~ 2.6 o
~ 2.4 c o [jj 2.2
20
---------.-.---- --"-'------1 I
- uncrosslinked NBR ----*- ausslinked NBR
1.8 '--_"--_.L...-_~_~_--'--_-'-_ _'_ _ __'__......J
o 5 10 15 20
W% of NBR
Fig. 3.4: Variation of elongation at break with wt% of NBR
The variation of tensile toughness and Izod impact stren~h (unnotched) of
the blends with NBR content is shown in figures 3.5 and 3.6 respectively. The
tensile toughness and impact strength of pure PS are very low. The failure is due to
the brittle fracture initiated by crazes. The mechanical behaviour of polymeric
system depends on viscoelastic and plastic deformation, which lead to macroscopic
failure of the specimen.
81

Chapter 3
150
140
130
.§ 120 2-~ 110 Q) c ~100 :J
.9 90 ~ 'in 80 c Q) I-
70
60
50 0 5 10
Wt.%ofNBR
15 20
Fig.3.5: Variation of tensile toughne.fOs with wt % of NBR
The two main mechanisms responsible for the plastic deformation are
crazing and shear yielding, which can operate separately or simultaneously, The
plastic deformation mechanism and material toughness will be predicted from
molecular parameters (chain flexibility and entanglement density) and from blend
morphology (rubber particle size and inter particle distance). In the plastic
deformation of brittle plastics like polystyrene, a craze is initiated as a precursor to
brittle fracture, This micro mechanism of brittle fracture is often highly localized
and confined to a very small volume of the material. Shear yielding consists of a
change in shape of the specimen at constant specimen volume. It was considered as
due to the molecular slip, flow or molecular motion of different types. A bulk shear
yielding mechanism leads to ductile fracture, The intrinsic brittleness or ductility of
82
Toughening of polystyrene .• •.•
polymeric systems is controlled by entanglement density and chain stiffuess.
Crazing is initiated by chain scission, which is not favoured in the case of high
entanglement density polymers [50]. Craze initiation and craze growth can be
reduced by increasing the matrix entanglement density. Shear yielding is directly
related to chain mobility and is temperature dependent. The competition between
crazing and shear yielding determines which mode of fracture will predominate.
Crazing occurs when crazing stress is lower than yield stress whereas shear
yielding occurs when yielding stress is lower than crazing stress. Both crazing and
yielding occurs when crazing stress and yielding stress are comparable.
200
200
240 --E 2.Z20 ~ .-~200 <I.l .... -rf) 180 t5 ca a. E 100
140
120
0
------·---··-------l
5
- uraosslinkoo !\BR -0-- aossIinked !\BR
10
W%off\BR
15
I
I
20
Fig.3.6: Variation of impact strength with wt % of NBR
83

Chapter 3
The tensile toughness and impact strength increases as the NBR content
increases from 5 to 10% in both blend systems. This is attributed to the fact that
rubber domains act as stress concentration sites for the dissipation of impact
energies by controlling and promoting matrix deformation. The addition of rubber
leads to relaxation of the stress concentration due to release of constrains of strain
by Poisson's contraction between voids at the PS-NBR interfaces. As a result
nucleation of catastrophic cracks at the sites of crazes is suppressed and impact
strength is improved.
The low impact strength for bends of PS with uncrosslinked NBR
compared with blends of PS with XNBR is due to the coalescence of rubber
domains during static cooling. This gives rise to irregularly sized rubber domains
which are larger than the critical size desired for impact toughening. The size
enlargement and shape irregularity results in a reduction of stress concentration
sites and interfacial adhesion. In the blends with XNBR, the crosslinked structure
of rubber particles inhibits the chance of rubber cohesion during cooling and also
the interfacial adhesion is increased by physical interlocking [51).
The flexural strength and flexural modulus results are given in figures 3.7
and 3.8. Flexural strength and flexural modulus show a decrease with increase in
rubber content. This is mainly caused by poor interfacial adhesion. The decrease in
flexural strength with increase in rubber content indicates an e1astomeric nature of
the blend. The blends with XNBR have higher flexural strength and flexural
modulus than the corresponding blends with NBR. The crosslinked structure
enhances the interfacial adhesion. This is accompanied by an increase in flexural
strength and flexural modulus.
84

r Toughening of polystyrene ••...
70
65
35
I -:- uncrosslinked NBR 1 - crosslinked NBR
• __ •·· __ V"· __
~~--~--~--~--~--~--~--~--~--~ o 5 10 15 20
Wt%ofNBR
Fig.3.7: Variation offlexural strength with wt% ofNBR
3.2
3.0
I :- uncrosslinked NBR I - crosslinked NBR
"v _ •
.--. ro a.. 2.8 ~ (J) ::J '3 2.6 '0 0 E ro 2.4 L.
::J >< Q)
u:: 2.2
2.0
0 5 10 15 20
Wt%ofNBR
Fig.3.8: Variation of flexural modulus with wt% of NBR
85

Chapler3
Figure 3.9-1 (a) is the scanning electron micrograph of the fracture surface
of pure PS. It contains plane areas with sharp brittle fracture in various planes. The
white stress stripes are traces of stress in a propagating process for unmodified PS.
The scanning electron micrographs of P90, PS5 and Pao are shown in
figures 3.9-1 (b) to (d). These micrographs show the irregular shapes of NBR
domains which are more pronounced in PIS and Pgo. The fracture surface
observation of blends with XNBR [figures 3.9-2 (a) to (c)] by SEM reveals that, in
Px90, the crosslinked rubber particles exist as spherical domains.
86
(a) (b)
(c) (d)
Fig. 3.9-1: Scanning electron micrographs offracture surfaces of PS/NBR
blends (a) P1I{/J (b) PH. (c) Pu and (d) P,{jJ

Toughening of polystyrene .....
As the rubber cootent increases the average size of the dispersed NBR
phase increases. This is attributed to the reagglomeration or coalescence of rubber
particles. The occurrence of coalescence at higher concentrations has been reported
by many authors [52, 53]. Heikens and Barentsen [53] have reported that in PFJPS
blends, the increase in particle dimension of PE at higher concentrations is caused
by coalescence
(a) (b)
(c)
Fig. 3.9-2: Scanning electron micrographs of fracture surfaces of PSlXNBR
blends (a) Px", (6) Pxu and (c) h,'1
87

Chapter 3
3.3 Dynamic mechanical analysis
The variation of storage modulus (E') of various blends as a function of
temperature is shown in figures3.1 0 and 3.11 respectively.
2500
200J ---- P100
-+-P95
..-.. ctl
~ 1500 '-' rn ~ :::I
-g 1<00 E Q) Cl ctl ....
500 0 ..... Cl)
0
20 40 ro 80 100 120
T~(°C)
Fig. 3.10: Effect of temperature on the storage modulus ofPSINBR blends
The value of E' signifies the stiffness of the materi.al. The curves for all
compositions have the following regions: a glassy region, a transition region and a
rubbery region. In the glassy region all the blends show a high modulus. At any
fixed rate of deformation, the temperature at which E' starts to decrease rapidly
corresponds to the glass transition temperature (T g), At the transition zone there is
drastic decrease in modulus with temperature. This is because at the transition zone
segmental mobility sets in followed by a corresponding decrease in the E' values.
88
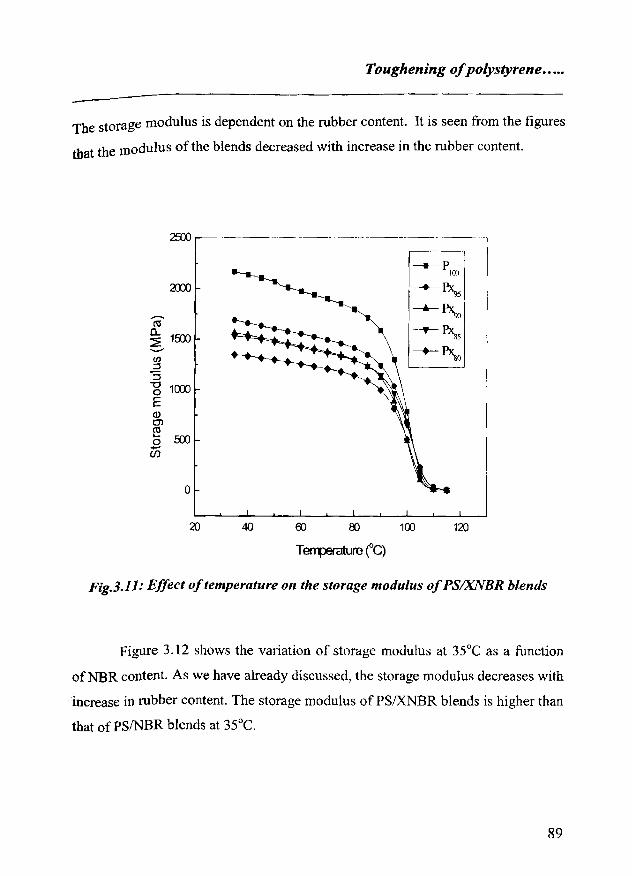
Toughening of polystyrene .. ...
The storage modulus is dependent on the rubber content. It is seen from the figures
that the modulus of the blends decreased with increase in the rubber content.
200J
o
20 40
T efllJ8IcIture rC)
-p 10'l
120
Fig.3.11: Effect of temperature on the storage modulus of PS/XNBR blends
Figure 3.12 shows the variation of storage modulus at 35°C as a function
ofNBR content. As we have already discussed, the storage modulus decreases with
increase in rubber content. The storage modulus of PSIXNBR blends is higher than
that ofPSINBR blends at 3SoC.
89

LnUp,erJ
2200
--.2OCO co
a.. 2 ........
~ 100> ~ u o E Q) 10c0 Cl ~ o
U; 1400
. __ ._-------
1~~--~--~--~--~--~--~--~--~--~ o 5
Fig.3.12: Variation of storage modulus of PSINBR and PSIXNBR blends with
wt% of NBR at 3S'C
The variation of loss modulus (E") and tan 0 with temperature of PlOD, P 90
and PX90 are shown respectively in figures 3.13and 3.14. In both figures, peaks
corresponding to the T g of polystyrene can be observed. It is evident from
figure 3.14 that in PX90 the temperature corresponding to the second order
transition of PS is unaffected. The tan 0 value of PX90 is less compared to P 90 is due
to the fact that the three dimensional network of the rubber phase restricts the
mobility of the chain segments. As a result, the system becomes more elastic and
the dissipation of energy as heat is minimised.
90

Toughening of polystyrene •. ••.
450
400
il 350 -PlOD ./ , ~-P90
i \ ~ 300 ··-Px90 ro ri'· \ 0... ~ 250 .. _-_ ..
i~\ Vl
.=! 200 :::J "0 0 E 150 jt I/J Vl 0 100 ...J
50 """HnI11t.-~ \ 0
20 40 60 80 100 120
Temperature CC)
Fig.3.]3: Variation of loss modulus ojP/Oo, P90 and Px90 with temperature
The main relaxation process in PS can also be detected in the damping
curves presented in figure 3.14. As temperature increases, damping goes through a
maximum, near T g. in the transition region and then a minimum in the rubbery
region. This type of behaviour can partially be explained on a molecular basis. The
damping is low below T g because the chain segments are frozen in. Below T g, the
deformations are thus primarily elastic and molec.ular slip resulting to viscous flow
is low. Above Tg, where rubbery region exists, the damping is also low because
molecular segments are very free to move about and there is little resistance to
their flow. Hence, when the segments are frozen in or are less free to move,
damping is low. In the transition region, a part of the segments are free to move
about and remainder are not so free.
91
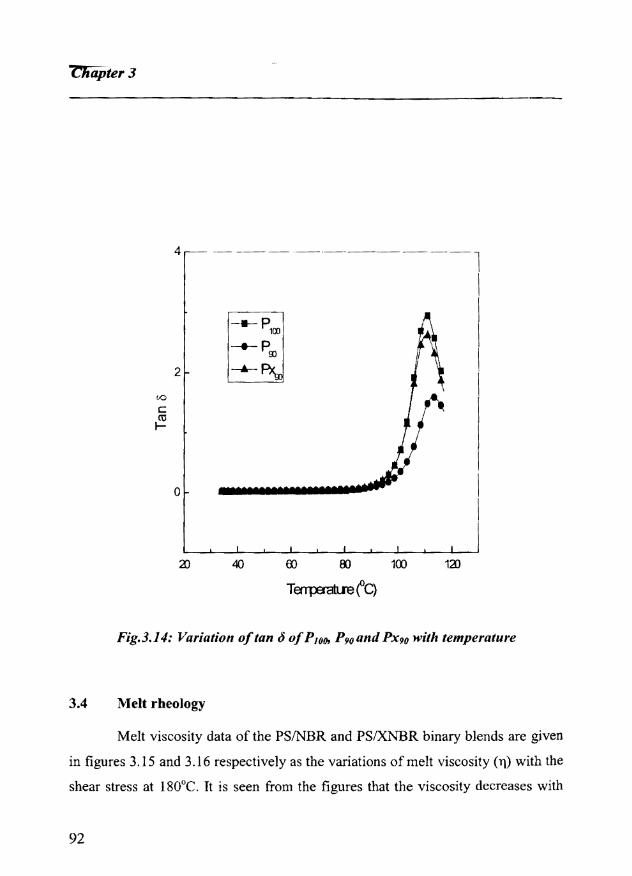
-cTiiijiter 3
4
2
o
Fig.3.14: Variation of tan J ofPlOo, P90 and Px90 with temperature
3.4 Melt rheology
Melt viscosity data of the PSINBR and PSIXNBR binary blends are given
in figures 3.15 and 3.16 respectively as the variations of melt viscosity (11) with the
shear stress at 180°C. It is seen from the figures that the viscosity decreases with
92

Toughening of polystyrene .•...
the increase in shear stress, showing a pseudoplastic behaviour of the blend
systems.
0.9 .--- ._---- .--.. ----... _-_ .. ----... ,
0.8
0.7 ,---'" E 0.6 E --If) ~ 0.5 >.
:t= en 0.4 0 t) If)
'S; 0.3 .... ro (]) L: 0.2 U)
0.1
0.0 0.0 0.1 0.2 0.3
Shear stress (rvPa)
- •. _p IW
-+--p 95
----4-- P 9()
~P85
-+-P80
0.4
!
0.5
Fig. 3.15: Effect of blend ratio on the shear viscosity/shear stress plots of
PSINBR blends
The pseudoplastic nature of polymers arises from the randomly oriented
and entangled nature of polymer chains which on application of higher shear rates,
become oriented and disentangled [40]. At any given shear stress, the melt
viscosity is lowest for PS. When NBR is added to the PS, viscosity increases with
NBR content at all shear rates. PSIXNBR blends have higher shear viscosity than
PSINBR blends
93

Chapter 3
1.2 --.--.. -----.
....-
1.1
1.0
0.9
) 0.8
~ 0.7
.c 0.6 'Vi 8 0.5 t/)
.;:; 0.4 .... ro Q) 0.3 .c
Cl) 0.2
0.1
0.0 0.0 0.1 0.2 0.3 0.4
Si"'ear stress (rvPa)
0.5 0.6
Fig. 3.16: Effect of blend ratio on the shear viscosity/shear stress plots of
PSIXNBR blends
Variations of melt viscosity as a function of blend composition at different
shear rates for PSINBR blends are shown in figure 3.17. As the rubber content in
the blend increases, the viscosity of the blend is increased. Such an increase in
viscosity on incorporation of rubber phase has been reported for several systems
[54-58]. In polymer blends, the viscosity depends on interfacial thickness and
interface adhesion in addition to the characteristics of the component polymers.
This is because, in polymer blends, there is interlayer slip along with orientation
and disentanglement on the application of shear stress. When a shear stress is
applied to a blend it undergoes an eiongational flow.
94

Toughening of polystyrene .. ...
0.85 r----------
0.80 Shearmte (s")
0.75 ~ 13.3-_133.~666.6 0.70 t'-_---T"--'----_13_33 __ +_2666-+-___ 6666=--"
0.65 ........ E 0.60
.§ 0.55 (J)
Z 0.50 -~ 0.45 -en 8 0.40 (J) 0.35 -> L. 0.30 ro (J)
.L: 0.25 (J)
0.20
0.15
0.10
0.05
----~~
--+ ........---
0 5 10
\Nt%ofNBR
~l I
I I
~ I ~
• --+
15 20
Fig. 3.17: Variation of shear v;sco ... ity with wt% of NBR in PSINBR blend ... at
different shear rates
When the interface is strong, deformation of the dispersed phase would be
effectively transferred to the continuous phase. However, in the case of weak
interface, interlayer slip occurs and, as a result, the viscosity of the system
decreases_ The extent of negative deviation is more prominent at the high-shear
rate region than at the low-sheaf-rate region_
From the figure it is clear that the increase of viscosity with rubber content
becomes prominent only at lower shear rates. At high shear rates, only a marginal
increase of the viscosity with rubber content occurs. This is also the case with
PS/XNBR blends (figure 3.18). This can be explained on the basis of relaxation
95

Chapter 3
1.2 ·-·--~:(~-------·--I
---- 13.}-- 133.3----A-- 666.6 -- I 1.0 --T- 1333---+-- 2666-+-- 6666 I
........ N
~ 0.8
--rJ)
z ---~ 0.6 .(i) o u rJ)
.~ 0.4 L~_---A------~ ro Q)
.s:::. (j)
I
Fig. 3.18: Variation o/shear viscosity with wt% o/XNBR in PSIXNBR blends at
different shear rates.
process and structure build up which are prominent only conditions of low shear.
Munstedt [59] had extensively studied on the flow behaviour of ABS with different
rubber contents and found that the yield stress increases with increase in rubber
content. His conclusion was that, in the range of low shear stresses where
relaxation process takes place, a remarkable influence of the rubber was observed
on the flow behaviour. Another reason for the observed behaviour is structure build
up occurring at regions of low shear. White [60] and Metzner [61] have reported
that particle-particle interactions begin to dominate at progressively lower
deformation rates. Lewis and Nielsen [62] have studied on particle agglomeration
96

Toughening of polystyrene .. ...
occurring at lower shear rates. They correlated the viscosity increase with reduced
packing fraction resulting from particle agglomeration. As the shear rate increases,
the agglomerated structure is broken down and the flow curves follow the
behaviour of virgin polymers.
In polymer blends, the viscosity depends on interfacial thickness and
interfacial adhesion in addition to the characteristics of the component polymers.
This is because in polymer blends there is interJayer slip along with the orientation
and disentanglement on application of shear stress. When a shear stress is applied
to a blend it undergoes an elongational flow. If the interface is strong, deformation
of the dispersed phase would be effectively transferred to the continuous phase.
However in the case of weak interface, interlayer slip occurs and as a result the
viscosity of the system decreases.
The melt elasticity of polymers leads to different phenomena like extrudate
swell, melt fracture, shark skin, etc. during flow through a capillary [56] In the
capillary the polymer molecules undergo orientation under the action of shear. On
emerging from the die, the oriented molecules have a tendency to recoil. As a
result, lateral expansion takes place which leads to extrudate swell. At low shear
rate, the deformation of the extrudates is less, whereas at high shear rate the
deformation is very prominent. This is associated with melt fracture which occurs
at high shear forces, where the shear stress exceeds the strength of the melt. As the
concentration of rubber increases, the surface of the blend exhibits more roughness
and the extrudates have a non-uniform diameter since the elastic response increases
with increase in concentration of the rubber phase
The die-swell ratio of the extrudates of PSINBR blends as a function of the
blend ratio is shown in figure 3.19. It is clear from the figure that the die-swell
increases with the shear rate. This is because at high shear rates, the polymer
molecules cannot respond to the rapidly changing stresses and the stored elastic
97

energy is greater. Once the material is extruded out from the die, the excess energy
is released and manifested as die swell. It is also evident from the figure that the
die-swell increases with NBR content at a particular shear rate.
2.0 -l ___ -4
1.9 _.- ....... - -- --____ .4---- --
--- - ..... -----1.8
i ....--------~
1.7 ----. , ---... -..-"" !
0 -.. -----
1.6 -----:;::; .. .. .--"
m .- ......... -- /~ ... ~- ,./// !
(j) 1.5 /"--
~ .-Cl) .-Q) 1.4 -...... -(5 --------------_. ~~ rate-(S~~
1.3 ....... .•. 1-13.3
//
- ........ 133.3 I // 1.2
. -& - 1333 l_. __ .... 1.1
0 5 10 15 20
Wt.% of NBR
Fig. 3.19: Effect of blend ratio and shear rate on the die swell values of PSINBR
blends
The effect of temperature on the melt viscosity of P IOO, P95, P90, PS5, PgO is
shown in figure 3.20. The viscosity reduction with increase in temperature in the
case of blends is lower compared with that of pure polystyrene. This may be due to
cross linking of the NBR phase in the blend. In fact, reactions take place during the
melt blending at higher temperatures are crosslinking of the NBR phase,
degradation of the PS phase and the formation of graft polymers.
98

Toughening of polystyrene .....
0.46 0.44 0.42 0.40 0.38
_____ 0.36 NE 0.34 .§ 0.32 ~ 0.30 ; 0.28
'en 0.26 8 0.24 .~ OZ2 .... 0.20 lE 0.18
- ~. .
-~--------~
t5 0.16 • _______________ 0.14 -~ _____________
0.12 .----
•
0.10 ~~ 0.08 L-_-'--_-'--_-'--_.L-_-'--_-'--_-'--_-'--_ ..... _---'
440 445 450 455 460 465
Temperature (K)
Fig.3.20: Effect of temperature on the melt viscosity of PlOo, P95, P 9o, PS5 and PS()o
The activation energy was calculated from the plot of log 11 versus Iff at
three different temperatures 170, 180 and 190"C and at a shear rate of 666.6/s
forP IOO, P95, P90, P85 and Pgo• The plots of log 11 versus liT for these blends are
shown in figure 3.21. The results are given in table 3.1. It is seen from the table
that the activation energy decreases on blending PS with NBR. The activation
energy values are useful in choosing the temperature to be used during processing
routes such as injection moulding, calendaring and extrusion.
99

Chapter 3
100
-----
0.65
0.00
0.55
O.f!l
(l 0.45
~ DAD
~ 0.35
£ O.~ I/)
8 0.25 I/)
.;; 0.20 0)
.Q 0.15
0.10
0.05
0.00 '----'----L._.L--'----"_-'-.....L.----'_-'----'---'_-'----'
214 216 218 2.22 224
Fig. 3.21: Arrhenius plots for PJOfh P95, P 9fh PS5 and PS(}o
Table 3.1: Activation energies of PSINBR blends
Sample E (KJ/mole)
PlO~ 13.47
P95 11.23
P90 10.71
PS5 6.35
Pso 4.72

Toughening of polystyrene •.•.•
The flow behaviour index (n') of polymers gives an idea about the nature
of flow, i.e., whether it is dilatent or pseudoplastic. Most polymers show
pseudoplastic behaviour with flow behaviour index (n') less than I. For Newtonian
liquids, n r is 1. The effect of blend ratio on the flow behaviour index is shown in
figure 3.22. The low values ofn' for PS, and PSINBR blends indicate pseudoplastic
behaviour. The incorporation of NBR shows only a slight increase in flow
behaviour index. Thus the addition of NBR to PS does not vary its processing
characteristics.
0.40 -'- --- -.-.. -- --- -- '-"-l
1
0.35 I ~ 0.30
>< (]) "0 0.25 c '-:J
0.20 0 .:;: en ..c
0.15 Cl) .0
~ 0 0.10
u::::
0.05
0.00
Fig.3.22: Effect of blend ratio on flow behaviour index (11 ')
3.5 Thermogravimetric analysis
The result obtained from the therrnogravimetric analysis of PS is given in
figure 3.23. In the case of polystyrene, deb'Tadation is observed in a single step. Up
101
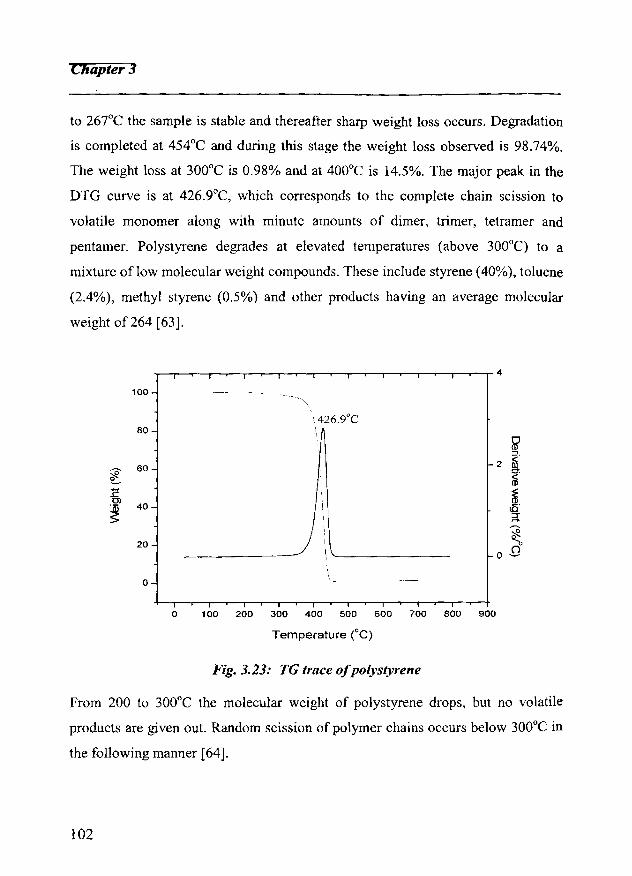
Chapter 3
to 267°C the sample is stable and thereafter sharp weight loss occurs. Degradation
is completed at 454°C and during this stage the weight loss observed is 98.74%.
The weight loss at 300°C is 0.98% and at 400°C is 14.5%. The major peak in the
DTG curve is at 426.9°C, which corresponds to the complete chain scission to
volatile monomer along with minute amounts of dimer, trimer, tetramer and
pentamer. Polystyrene degrades at elevated temperatures (above 300°C) to a
mixture oflow molecular weight compounds. These include styrene (40%), toluene
(2.4%), methyl styrene (0.5%) and other products having an average molecular
weight of264 [63].
4
100 -
80 -\,426.9°C
~ 60 2 ~ ~
~ (I)
E ~. Cl 40
~ co ;:; ~
20 ~ 0
0
o 100 200 300 400 500 600 700 800 900
Temperature (oC)
Fig. 3.23: TG trace ofpolystyrene
From 200 to 300°C the molecular weight of polystyrene drops, but no volatile
products are given out. Random scission of polymer chains occurs below 300°C in
the following manner [64].
102

Toughening of polystyrene •..••
~ (:Jh,,·(:}(.~.(;Br-tif-tH:r-- 4 ~-Cii;--tH. + i I I I'tI I'll I'h
lA)
.CH1-·CHc--t:Hr{;1I-~ -J-~'CUt--('t1! ~ CH1 , c·, Of!~~ I I
I'h Ph Ni Ph
Since below 300°C, no volatile products result, (A) and (B) undergo
disproportionation to give (C) and (D) which are stable up to 300°C.
100
80
60 ~ ~
tb ~
40
20
0
4
430_130C
2
0
o 100 200 300 400 500 600 700 800 900
Temperature CC)
Fig. 3.24: TG trace 0/90110 blend 0/ PSINBR
~ :<
~ ~ ---~ , [J
103

Cnaprer.:J
100
80
60 ~ e. ';0 ]1l
40 ~
20
0
2
~ :'-
~ ~ ,-., ~
" o [J
o 100 200 300 400 500 600 700 800 900
Temperalure CC)
Fig. 3.25: TG trace of9011O blend of PSIXNBR
The degradation behaviour of P90 is slightly different from polystyrene. In
the case of P90 the incorporation of NBR into PS is found to improve the thermal
stability of PS (figure 3.24). In P90 the degradation is in one step. This indicates the
better interaction between PS and NBR. The weight loss at 300°C is 0.72% and at
400°C is 8.22%. In the DTG curve, the major peak is observed at 430.13°C which
is slightly higher than that for PS.
The vulcanisation of rubbers, generally improve the degradation resistance,
since more energy is required to break the bonds formed during vulcanisation.
Figure 3.25 shows the TG and DTG plots of PX90. Here also the degradation is in
one step. The weight loss at 300°C is 1.26% and at 400°C is 7.07%. In the DTG
curve, the major peak is observed at 445.62°C. PX90 is thermally more stable than
P90.
104

Toughening o/polystyrene .....
3.6 Conclusion
The mechanical properties and morphology of powdered nitrile rubber
(uncrosslinked and crosslinked) toughened polystyrene have been studied with
reference to the effect of blend ratio. The torque-time graphs of various blends
showed that the viscosity of PS/NBR blends increases with increase in NBR
content and blends with crosslinked NBR registered higher torque than blends with
uncrosslinked NBR. The morphology of the blends indicates a two phase structure
in which the rubber phase is dispersed as domains in the continuous PS matrix. The
mechanical properties of the blends are found to be strongly inf1uenced by blend
ratio. The tensile strength, Young's modulus, f1exural strength and f1exural
modulus of the blends decreased with increase in rubber content. The elongation at
break and Izod impact strength increased up to 10 wt% NBR and after that no
considerable change. The mechanical properties of the blends with crosslinked
NBR showed higher values than blends with uncrosslinked NBR. This is attributed
to the presence of crosslinked rubber particles. The effect of blend ratio on the
dynamic mechanical properties was investigated in the temperature range 35 to
120°C. As the concentration of the rubber increases, storage modulus decreases.
Melt rheological studies revealed that the viscosity of the blends decreases with
shear stress indicating pseudoplastic nature of the mixes and also showed that the
blends are processable. Thermogravimetric analysis was carried out to study the
thermal behaviour of the blends. It was found that blending of PS with powdered
NBR improved the thermal stability of the blends.
References
1. C.B. Bucknall, Toughened PlastiCS, Applied Science, London, (1977).
2. A.Y. Coran, in Thermoplastic Elastomers, N.R. Legge, G. Holden,
H.E. Schroeder, Eds., Hanser Publishers, New York, (1987)
3. U. Sundararaj, C.W.Macosko, Polym. Eng. Sci.,32,1814 (1992)
105

Chapter 3
4. V. Bordereau, Z.H. Shi, L.A. Utracki, P. Sammut, M. Carrega Polym. Eng.
Sci., 32, 1846 (1992)
5. D.R. Paul, S. Newman, Polymer blends, Academic Press, New York, (1978).
6. L.A.Utracki, Two-phase polymer systems, Hanser Publishers, New York,
(1991).
7. U. Sundararaj, C.W. Macosko, Macromolecules, 28, 2647 (1995)
8. S. Wu, Polym. Eng. Sci., 27, 335 (1982)
9. L.A. Utracki, Z.H. Shi, Polym. Eng. Sci., 32, 1824 (1992)
10. G .I.Taylor, Proc. R. Soc. London A, 138(41), 501 (1932)
11. J.J. Elmendorp, A.K. Van der Vegt, Polym. Eng. Sci., 30, 553 (1986)
12. J .M. Willis, B.O. Favis, J Polym. Sci., Poiym Phys., 28, 1416 (1988)
13. H. Varghese, S.S. Bhagawan, S. Someswara Rao, S.Thomas Eur. Polym. J,
31,957 (1995)
14. R. Asaletha, M.G. Kumaran, S.Thomas, Eur. Polym. J, 35, 253, (1999)
15. I. George, K.T. Varughese, S. Thomas, Polymer, 57,449 (1995)
16. I. Fortelny, J. Kovar, Polym. Compos., 9, 119, (1998)
17. E. Martuscelli, F. Riva, C. Sellitti, C. Silvestre, Polymer, 26, 270 (1985)
18. B. Majumdar, H. Keskkula, J Appl. Polym. Sci., 54, 339 (1994)
19. S. Thomas, G. Groeninckx, J Appl. Polym. Sci., 71, 1405 (1999)
20. c.E. Scott, C.W. Macosko, Polymer, 35,5422 (1994)
21. HJ. Karam, I.C. Bellinger, Ind. Eng. Chem. Fundam. 7, 576 (1986)
22. J. Karger-Koscis, K. Csikai, Polym. Eng. Sci., 27, 24 (1987)
23. H.P. Schreiber, A. Olguin, Polym. Eng. Sci., 23,129 (1983)
24. P. Laokijcharoen, A.Y. Coran, Presented at the meeting of the rubber division.
Louisville, KY, 8-11 October 1996.
25. B.D. Favis, J Appl. Polym. Sci., 39, 285 (1990).
26. A.P. Plochocki, S.S. Dagli, R.D. Andrews, Polym. Eng. sa., 30,741 (1990).
106

Toughening of polystyrene .. ...
27. U. Sundararaj, C.W. Macosko, R.J. Rolando, H.T. Chan, Polym. Eng. Sci., 32,
1814 (1992).
28. K.C. Dao, J Appl.Polym. Sci., 27, 4799 (1982).
29. RI.M. Borggreve, RJ. Gaymans, J.Schuijer and J.F. Ingen Housz, Polymer,
28, 1489 (1987).
30. RJ.M. Borggreve and RJ. Gaymans, Polymer, 30, 63 (1989).
31. M. Mehrabzadeh and R.P. Buford, J Appl. Polym. Sci., 64, 1605 (1997).
32. S. Joseph, S. Thomas, Eur. Polym. J, 39, 115 (2003).
33. C. Serra, G. Schlatter, M. Bougquey, R Muller, J. Tenisse, Cunad. J Chem.
Eng., 80, 1036 (2002).
34. C.P. Fung, J Rein/ Plas!. Comp., 22, 51 (2003).
35. S.J. Liu, c.P. Chen, J Rein/ Plast. Comp., 21, 723 (2002).
36. T.M. Murayama, Ed., Dynamic Mechanical Analysis of Polymeric Materials,
Elsevier, New York, 1978.
37. D.L. Kang, C.S. Ha, W.l. Cho, Eur. Polym. J., 28, 565 (1992).
38. S. George, N.R. Neelakantan, K.T. Varughese, S. Thomas, J. Polym. SOd .• Part
B: Polym. Phys., 35, 2309 (1997).
39. J. Mas, A. Vidaurre, 1.M. Mesegner, F. Romero, M.M. Pardas, J.L.G. Ribelles,
M.L.L. Maspoch, 0.0. Santana, P. Pages, J.P. Folch, J. Appl. Polym. Sci., 83,
1507 (2002).
40. 1.A. Brydson, Flow properties of Polymer Melts, 2nd ed., George, Godwin:
London, (1981).
41. 1.L. White, Rubber Chem. Tech., 42, 257 (1969).
42. 1.L. White, Rubber Chem. Tech., 50, 163 (1977).
43. S. Danesi, RS. Porter, Polymer, 19,448(1978).
44. I.C. McNeill. In: G. Allen, editor, Thermal degradation in comprehensive
polymer science, ch. 15, New York, Pregamon Press, (1989).
107

Chapter 3
45. W. Schnabel, Polymer degradation principles and applications. New York,
Hanser, (I 981).
46. N. Grassie, editor, Developments in polymer degradation, Applied Science,
London, (1998).
47. K.T. Varughese, Kaustschuk Gummi Kunststoffe, 41, 114 (1988).
48. LA Amraee, AA Kathab, S.A Jollah, Rubber. Chem. Technol.,69, 130 (1995).
49. P.P. Lizymol, S. Thomas, Polym. Degrad. Stab. 41, 59 (1993).
50. S.M. Aharoni, Macromolecules, 18,2624 (1985)
51. AK. Jain, AK. Nagpal, R. Singhal, Neeraj. K. Gupta, J. Appl. Polym. Sci., 78,
2089 (2000).
52. K.C. Dao, Polymer, 25, 1527 (1984).
53. D. Heikens, W.M. Barentsen, Polymer, 18,69 (1977).
54. K.T. Varughese, P.P. De, G.B. Nando, S.K. De, J. Vinyl Technol., 9, 161
(1987).
55. K.T. Varughese, J. Appl. Polym. Sci., 39, 205( 1990).
56. S. Akhtar, B. Kuriakose, P.P. De, S.K. De, Plast. Rubber Process Applic., 7,
11 (1987).
57. B. Kuriakose, Kaustschuk Gummi Kunststoffe .. 37, 1044 (1984).
58. L. Duvdevani, P.K. Agarwal, R.D. Lundberg, Polym. Eng. Sci., 22, 499
(1982).
59. H. Munstedt, Polym. Eng. Sci., 21, 5 (1981).
60. J.L. White, L.Czarneck, H. Tanaka, Rubber Chem. Tech., 53,823 (1980).
61. AB. Metzner, J. Rheol., 29, 739 (1985).
62. T.B. Lewis, L.E. Nielsen, Trans. Soc. Rheol., 12,421 (1968).
63. R. Asaletha, M.G. Kumaran, S. Thomas, Polymer Degradation and Stability,
61,431 (l998).
64. M. Guaita, O. Chiantore, L. Costa, Polymer Degradation and Stability, 12,
315 (1985).
108

Chapter 4
Compatibilisation by dynamic crosslinking
Dynamic crosslinking is the process of vulcanizing the elastomer during its
melt mixing with a non-vulcanising thermoplastic polymer. The introduction of
crosslinks into one of the phases increases the viscosity of this phase leading to a
change in the morphology of the blend [I]. For blends with similar polarities a fine
morphology is seen during dynamic vulcanisation. However a coarse morphology
is developed in the case of incompatible blends [2]. Fischer [3] introduced the
method of dynamic crosslinking to vulcanise the rubber phase in a thermoplastic
elastomer blend while it is being mixed in the molten state. The dynamic
crosslinking of PVC/ENR was reported by Varughese et al [4]. The micro
heterogeneity between ENR and PVC was reduced due to the improved interfacial
adhesion. Both thermal stability and elastic deformation are improved upon
dynamic crosslinking. Several studies were carried out to investigate the
toughening of PS by the effects of dispersed phase properties such as the rubber
concentration, particle size, shape and packing of the rubber particles. However
few studies were concerned with the crosslinking of the rubber particles. Bucknall
[5] reported that crosslinking of rubber particles is desirable since during impact
the rubber phase is subjected to a very large tensile strain giving craze like
structure. A moderate degree of crosslinking allows the rubber particles to reach
high strain by fibrillation and at the same time renders mechanical strength to the

Chapter 4
fibrils. Dao [6] found that crosslinked ethylene - propylene - diene terpolymer
(EPOM) was more effective than uncrosslinked EPOM. The brittle - tough
transition depends on particle size and Wu [7] stated that a sharp brittle - tough
transition occurred at a critical rubber particle size. Because of the fixed
morphologies of dynamic vulcanized blends, they have improved property profiles.
Several articles are quoted in the literature on the dynamic crossJinking of
rubber/plastic blends. Pesneau [8] reported on the dynamically crosslinked blends
of PP/EPM prepared in a twin screw extruder. Mousa [9] studied the effect of
sulphur dosage on the dynamic crosslinking of plasticised
poly (vinyl chloride) / nitrile rubber blends. The influence of dynamic crosslinking
on the morphology-mechanical property relationship in poly (butylene
terphthalate)/poly (ethylen~o-glycidyl methacrylate) blends was studied by
Okamoto (10]. Inove and Suzuki [11] reported the influence of dynamic
crosslinking on PP/EPDM blends. It was found that EPDM particles were
crosslinked selectively without degradation of polypropylene. George [12] carried
out dynamic crosslinking on 50/50 blend of HDPE and NBR using DCP and
reported that DCP dosage has a significant effect on the extent of crosslinking.
The effect of dynamic crosslinking on the dynamic mechanical properties
of PPINR blends was reported by Kuriakose et at [13]. They found that the
increase in storage modulus and decrease in loss modulus becomes more
remarkable as the extent of cross linking increases. Thomas et at [14] investigated
the effect of dynamic crosslinking on the dynamic mechanical properties of
NRlEV A blends. The damping behaviour of dynamically crosslinked butyl
rubber/polypropylene blends was studied by Liao et at [15].
110

Compatibilisation by dynamic •....
Rheological properties of dynamically cured EPDMIPPIHDPE ternary
blends were studied by Ha [16]. He found that the curing agent has influence on
the melt viscosity especially in blends of EPDM rich compositions. The effect of
shear intensity on the melt viscosity of dynamically cured EPDM rich ternary
blends was also investigated. Akhtar et al [17] reported on the Rheological
behaviour and extrudate morphology of thermoplastic elastomers from NR and
HDPE with reference to blend ratio and dynamic crosslinking. The morphology
was found to depend on the blend ratio and shear rate.
This chapter discusses the effects of dynamic crosslinking on the
morphology, mechanical properties, flexural properties, dynamic mechanical
properties, melt rheology and thermal properties of powdered nitrile rubber
toughened polystyrene.
4.1 Processing characteristics
The torque- time graph of different mixes is shown in figure 4.1. From the
fih'1lre it is clear that the initial high mixing torque is due to introduction of cold
material into the mixing chamber. Once the material attains the set temperature and
gets melted, the torque comes down. Again it increases with the addition of NBR
and comes down upon melting and levelling off can be observed in the torque
values of the blend containing no crosslinking agent. However DCP containing
mixes show a small increase in torque with time and levelling off can be observed.
The increase in torque is due to the crosslinking of the rubber phase and thereby
exerting greater resistance to rotation.
111

Chapter 4
9 .
8
E Z -6 O,l ::l
e-O I- 5
4
2
--P I--~ . _ p90 D
90 0.5
-&---PD 90 1.0
... --.p D I 90 1.5
-+-- P D I 90 2.0 ____ .....J
•
•
4
•
6
Mixing time (min.)
8 10
Fig. 4.1: Torque-time plots 0/90110 blend o/PS and NBR (P9fJ containing
different amounts of DCP
The effect of DCP concentration on the final torque values of P90 is shown
in figure 4.2. Fonn the figure it is clear that the final torque values increase with
DCP content. The effect of DCP on polyolefines is detennined by the structure of
the base polymer. Peroxide initiated reactive extrusion of polyolefin may lead to
oxidative degradation, crosslinking or chain scission depending on the type of
polymer, compounding conditions and partial pressure of oxygen [18]. In the case
of polystyrene, the tertiary macroradical fonned will undergo chain scission even
under a Jow partial pressure of oxygen. At high oxygen pressure, oxidative
degradation predominates. In addition, the pendant phenyl groups provide
steric hindrance for the coupling of two macroradicaJs. These polystyrene
macroradicals combine with the NBR radicals formed by reaction with DCP,
results NBR-g-PS
112

Compatibilisation by dynamic .•.•.
6 r .---- .... ---
5
E'4 Z ID :::3 3 f!
{:?
~ 2 u:
1
0.5 1.0 1.5
OCP ooncentration (phr)
2.0
Fig. 4.2: Effect of DCP concentration on the final torque values of P90
4.2 Variation of crosslink density
The extent of crosslinking of the rubber phase in the blends containing
different levels of DCP can be studied by measuring Vr values. The variation of Vr
values with DCP concentration is shown in figure. 4.3. The Vr values increase with
113

Chapter 4
0.18
0.16
0.14
0.12 '->
0.10
0.00
0.00
0.04 1.---'-_
~.5 0.0 0.5 1.0 1.5 2.0
IXP CD re .. ;::fun (~)
Fig. 4.3: Variation of Vr with DCP concentration showing the effect of extent of
crosslinking on Vr values of P,I.
extent of cross linking as the restriction to swelling increases with increased
network fonnation. From the figure, it is clear that the crosslink density increases
with DCP content.
4.3 Effect of DCP content on the morphology and mechanical properties
The morphology of heterogeneous polymer blends depends on blend
composition, viscosity of individual components and processing history.
Danesi and Porter [19] have shown that for blends with the same processing
history, the morphology is determined by the melt viscosity ratio and composition.
The scanning electron micrographs of P90Do.5• P~1.o. P~I.5 and P~2.0 are
shown in figure 4.4 (a) to (d) respectively. The morphological changes
114

Compatibilisation by dynamic .•••.
accompanying the addition of OCP are evident from tbe figures. Dynamic
crosslinking results in crosslinking of the rubber phase. The crosslinked particles
exert more torque and leads to particle break-up. A more or less spherical
morphology can be seen in P90Du
(a) (b)
.' ,. < .• '. f •
.1 . ?, .. , \: •
. .. .. ,
• • ,'"
< .. "00 . ~~: 1 :',;, . '.>! ':", .,:'! 5
(c) (d)
Fig. 4.4: Scanning electron micrographs offraclured surface of (a) P,oDu
(b) P"DI.(I (c) P,oiJu and (d) P,oD1.O
liS

Chapter 4
The properties of plastic rubber blends are detennined by material
properties of plastic and rubber, plastic rubber proportions, the phase morphology
and the interaction at the interface [20]. The effect of DCP content on tensile
strength and Young's modulus ofP90 is shown in figures 4.5 and 4.6 respectively.
The tensile strength and Young's modulus increase continuously as the DCP
content increases up to 1.5 phr. This may be due to the increased crosslink density
at higher levels ofDCP and better interfacial adhesion.
32
24
0.0. 0.5 1.0. 1.5 2.0.
OCP rorrertration (j:i1r)
Fig. 4.5: Variation of tensile ~·trength with DCP concentration
116

Compatibilisation by dynamic .....
O.CID - - - -._ ... - --._- . __ . --- -- ----
--«l 0... o.cm <9 '--'
en :J :J "0 o E en __ --.--.----
"0> O.Cffi ---C :J
~
---~-.
o.ffit-'--....J...--....J...---'----'----'----'---..L-_-'------'
0.0 0.5 1.0 1.5 20
Fig. 4.6: Variation of Young's modulus with DCP concentration
The effect of DCP content on elongation at break is given in figure 4.7.
The elongation at break of Pqo is very low as the blend is incompatible and it
increases with increasing cross link density, as the crosslinked rubber particles can
be strained to very large extensions before failure.
117

Chapter 4
3.5 .-- ------,------
.. 3.4
3.3 ........ ~ 0
~ 3.2 CO ID ..... .0
3.1 ro c 0
3.0 :0 ct:l C) C 0 29 W
28
27 0.0 0.5 1.0 1.5 20
[XJJ <XJ"'a'JnIratim (plY)
Fig. 4.7: Effect of DCP concentration on elongation at break of 9011 0 blend of
PSandNBR
The variation of impact strength and toughness with DCP content on the
P90 are given in figures 4.8 and 4.9 respectively. The impact strength and toughness
increase with the addition of DCP up to 1.5 phr. The improvement in mechanical
118

Compatibilisation by dynamic ..•.•
properties with dynamic crosslinking can be explained on the basis of the
morphological changes accompanying dynamic crosslinking.
0.0 0.5 1.0 1.5 2.0
[XFro JOB Doom (rh)
Fig. 4.8: Effect of DCP concentration on impact strength of 9011 0 bhmd of PS
andNBR
In the SEM picture (figure 4.4 (c» of crosslinked PyO there is drastic
reduction in particle size and most of the dispersed particles are sphericaL Also in
cross linked P90 there is more effective mixing of the rubber particles with the
matrix as the dispersed domains are smalL
119

Chapter 4
100
160
E140 --2-(J) (J) Q.) 120 c ~ 0> ::I
.2 100 ~ 'en c ~ 80
60
/ /
/ ri
0.0
/
/
; ;
0.5 1.0 1.5 2.0
OCP concentration (phr)
Fig. 4.9: Effect of DCP concentration on impact strength of90l/O blend of PS
andNBR
The effect of DCP content on the flexural strength and flexural modulus is
shown in figures 4.10 and 4.11 respectively. The crosslinked blends have higher
flexural modulus and flexural strength than the uncrosslinked blend. This is an
effect of crosslinking that forms a network structure. The network structure
strengthens the interfacial adhesion and improves the mechanical properties.
120

Compatibilisation by dynamic .....
62
60
50
~~--~--~--~--~--~--~--~--~--~ 0.0 0.5 1.0 1.5 2.0
DCP concentration (phr)
Fig. 4.10: Variation of l<1exural strength with DCP concentration
3.2
3.0
ro-0.. (!) 2.8 -Cl)
~
S ] 2.6 E
~ ~
~ 2.4 u::
2.2
/ ./
0.0
/
/ /
0.5 1.0 1.5 2.0
DCP concentration (phr)
Fig. 4.11: Variation offlexural modulus with DCP concentration
121

Chapter 4
4.4 Dynamic mechanical analysis
The molecular level changes that occur in a polymer under the application
of a sinusoidal stress are reflected in dynamic mechanical measurements. The
variation of storage modulus (E') with temperature of dynamically vulcanised P90
with varying DCP content is shown in fib'1lre 4.12. Three distinct regions of
mechanical behaviour can be observed: (a) a glassy region; (b) a glass-rubber
transition region; and ( c) a flow region. In the glassy region at low temperatures
the chain confonnations are frozen into rigid network yielding high E' values and
low loss. Some limited movement either within the main chain or within side
groups attached to the chain is however possible giving rise to one or more
secondary transitions of low magnitude.
122
1600
1400
1200
;:. 1000 ~
'" 800 '" ::::I "0 0
E 600 <U bJ) Cj ... 400 .2
VJ
200
0
20 40 60 80 100 120
Temperature ("C)
Fig.4.12: Variation of storage modulus with temperature of dynamically
crosslinked 90110 blends of PS and NBR.

Compatibilisation by dynamic •..•.
The glass-rubber transition marks the onset of long range motions of
amorphous polymer chain segments and is characterised by a large drop in
modulus and a pronounced loss factor peak. The last region is the flow region,
where the amorphous chains undergo net translatory motions relative to each other
and a temlinal fall off in modulus is accompanied by a continuous increase in loss
factor. It can be seen from the figure that the initial storage modulus is highest for
P90D2.0 and it is due to the maximum crosslinking of the rubber particles.
The variations of loss modulus (En) of dynamically cross linked P90 as a
function of temperature are shown in fib'1lre 4.13. A distinct peak can be observed
250
200
~ 150 0...
~ '-'
'" ::l
~ 100 o E '" '" o
.....l 50
o
20
-. PqODOj
-.- PqPLO -A-- P90D'5
- T- P9P2U
40 60 80 100 120
Temperature ("C)
Fig. 4.13: Loss modulus- temperature plots of dynamically vulcanized 90110
blends of PS and NBR
123

Chapter 4
at the glass transition temperature (T J region of PS. Below the T g values the
polymer chains are in tact and stress transfer is possible. When the temperature is
approaching the T g, energy dissipation takes place and a corresponding peak is
observed in the E" values. P90D2.O registers maximum loss modulus which is
attributed to the increased extent of crosslinking.
The variation of tan 8 values of dynamically crosslinked P90 as a function
of temperature is shown in figure 4.14. The peak between 111 QC and 113°C
corresponds to the glass transition of polystyrene. The peak temperature values of
PS in both cross linked and uncrosslinked samples are more or less the same
indicating that the plastic phase is unaffected by dynamic crosslinking. From the
tan 8 values it is clear that the interfacial adhesion is better in P90DJ.() and P9oD1.5
2.0
1.8
1.6
1.4
1.2
1.0 <0
c: 0.8 ro
I-
0.6
0.4
0.2
0.0
-0.2 20
[
- :-l .. _p D'
00 0.5
---.- P ooDl0
~PooDl.5
l=""- PooD2,0
40 60 80
Temperature (QC)
100 120
Fig. 4.14: Tan l5-temperature plots of dynamically crosslinked 90/10 blends of PS
andNBR
124

Compatibilisation by dynamic .•...
4.5 Rheological studies
The usual processing techniques for toughened plastics are extrusion,
injection moulding, blow moulding and thermoforming. Hence a thorough
understanding of the flow behaviour of the polymer melts under high shearing
action is important to make articles having good finish and dimensional tolerances.
The melt elasticity and viscosity are two opposing factors that decide the overall
processability.
1.2
1.0
.,:;-'
~ 0.8
-er. Z b 0.6 0;;' o u '" .;; 0.4 ... 0: V ..c
r/J 0.2
0.0
0.0 0.1
I I·-~· P D
00 0.5
I-D·- P D . 00 1.0
! -*- P OOD15 1
l· +--~ ooD;o~
0.2 0.3 0.4 0.5
Shear l>tress (MPa)
Fig. 4.15: Shear rate-viscosity plots of P90 containing different levels of DCP
The effect of shear stress on shear viscosity of the mixes containing
different DCP concentration at 180°C is shown in figure 4.15. In all the cases the
viscosity decreases with shear stress indicating the pseudoplastic nature of the
mixes. The viscosity increases with increasing concentration of DCP over the
125

Chapter 4
entire range of shear stresses. The increase in viscosity with DCP content is more
pronounced at low shear regions than at high shear regions as observed from the
converging behaviour of the flow curves at high shear stresses. These results show
that the dynamically crosslinked samples can be processed like thermoplastics by
extrusion or injection moulding technique.
Figure 4.16 shows the effect of DCP dosage on the viscosity of the mixes
at different shear rates. At all shear rates there is a gradual increase of viscosity
with the concentration of DCP indicating increased extent of crosslinking at higher
levels of DCP. At a particular DCP content, the viscosity decreases as the shear
rate increases.
0.45
0.40
0.35
E ..§ 0.30 V>
;z:
~ 0.25 V> o o .~ 0.20 ;. ..... '" ~ 0.15
U)
0.10
-- --
Shear rate (s") ---.- 666-___ - 1333 __ -. _ -1.- 2666---T- 66?i-_~-- .----
.... --------.... -
-------. -------- ..... --
------_.-.. ----
.. -------......----____ A------ .•
.....-------- .... ------ .... --
" _____ ,......-__ ----'1,, ____ --.,, _.--0.05 L------''----'-_---L_-'-_....I...._-'-_-L--_.L--_L----I
0.0 O.S 1.0 1.5 2.0
DCP concentration (phr)
Fig. 4.16: Effect of DCP concentration on the shear viscosity of P90 at four
different shear rates.
126

Compatibilisatioll by dynamic .....
2.15
2.10
2.05
2.00
1.95 --." ~u 1.00 -0 1.85 '-'
.:2 1.80 E - 1.75 Qj :s 1.70 vo <l) 1.65 (5
HiO
1.55
1.50
1.45
0.0
" •
Shear mte (S·l)
--- 666- - 1333 -A- 2666--" 6666
.. _--.-._- --- -.- --.- - --.
----- ..... ---. -- --- -. 0.5 1.0 1.5 2.0
ocr ~ion (phr)
Fig. 4.17: Variation of die-swell with DCP concentration
The die-swell of the blend at four different shear rates is shown in figure
4.17. In all the cases the die-swell shows a substantial reduction even with 0.5%
DCP and thereafter a levelling olT is observed. The die swell occurs due to
molecular relaxation upon emergence of the extrudate from the capillary die. The
results of the present study reveal that crosslinking leads to network fonnation and
thereby restricting the relaxation process. In a crosslinked sample, the molecules
cannot slip past each other as in uncrosslinked material. As expected, the die swell
of vulcanized samples also increases with increase in shear rate.
4.6 Thermogravimetric analysis
Polymeric materials are subjected to various types of dCb'Tadation ranging
from thennal degradation to biodegradation. Polymer degradation is undesirable as
it leads to deterioration of properties. One of the most accepted methods for
1?7

Chapter 4
studying the thermal properties of polymeric materials is the thermogravimetry.
The integral (TGA) and derivative (DTG) thermogravimetric curves provide
information about nature and extent of degradation of polymeric materials.
The vulcanisation of rubbers, generally improve the degradation
tresistance, since more energy is required to break the bonds formed during
vulcanisation. The TG and DTG plots of different dynamically crosslinked P90
blends are given in figures 4.18 to 4.21. The weight loss and DTG peaks of
dynamically crosslinked blends are given in table 4.1. It can be seen that at 300°C
and 400°C, the weight loss P90DL5 is lower than other blends.
~ :a ~
128
100
80
60
40
20
0
440.2 1°C
o 100 200 300 400 500 600 700 800
Temperature (C)
3
2
G ~
1 :a ~ ;: ·c
0 ~
4.18: TG trace 0/90110 blend 0/ PS and NBR with 0.5 phr DCP
Fig.

Compatibilisation by dynamic .....
100
442.03"C
80 2
'0' 60 ~.
~ ~
40
,0 ~ '-'
~ .~
>
20 0 ~
0
+-.-~-r~-'~~r-~'-~-r~~--r-~~,--r-1'1
o 100 200 300 400 500 600 700 800 900
Temperature CC)
Fig. 4.19: TG trace 0/90110 blend 0/ PS and NBR with 1.0 phI' DCP
3
100
80 2
G
~ 60 ~
it 1 it
~ 40 ~
;.. ·c 20 0 8
0
L-L-~~~~~-L~~~~ __ ~L-~~~~~~_1
o 100 200 300 400 500 600 700 800 900
Temperature (C)
Fig. 4.20: TG trace 0/90110 blend of PS and NBR with 1.5 phr DCP
129

Chap'ET 4
130
100 446.96"C
80 2
G "0- 60 ~ e '-"
~ ~
~ 40 ~
;>
20 0 ~
0
0 100 200 300 400 500 600 700 800 900
Temperature (oC)
Fig. 4.21: TG trace of 9011 0 blend of PS and NBR with 2.0 phr DCP
Table 4.1. Weight loss and DTG peaks of dynamically crosslinked PS/NBR
blends
Sample Weight loss at Weight loss at Total weight DTG peak
300°C (%) 400°C (%) loss (%) (0C)
P90DO.5 1.46 7.40 96.72 440.21
P90D )O 1.20 7.21 97.19 442.03
P90D1.5 1.09 5.95 95.30 442.84
P 90D2.0 l.l0 5.98 95.12 446.96

Compatibi!isation by dynamic .....
4.7 Conclusion
Dynamic crosslinking of powdered nitrile rubber toughened polystyrene
(90/10 PSINBR blend) was carried out with dicumyl peroxide. As the DCP content
increases, the crosslink density also increases as observed from the increase in Vr
values. The morphology of the blend changed drastically as a result of dynamic
crossJinking. A large number of small crosslinkcd rubber particles could be
observed in vulcanised blend. The impact strength, tensile stren!,>th, Young's
modulus, elongation at break showed improvement upon dynamic crosslinking
with DCP which is due to the presence of crosslinked rubber particles. The
rheological studies revealed that the viscosity decreases with shear stress indicating
the pseudoplastic nature of the mixes. The viscosity increases with increasing
concentration of DCP over the entire range of shear stresses. The increase in
viscosity with DCP content is more pronounced at Jow shear regions than at high
shear regions as observed from the converging behaviour of the flow curves at high
shear stresses. These results showed that the dynamically crosslinked samples can
be processed like thermoplastics by extrusion or injection moulding technique.
Die-swell ratio decreases with increase in DCP concentration indicating better
dimensional stability of the extrudate. Dynamic mechanical studies indicated
separate transition for polystyrene in dynamically crosslinked blends. Although
miscibility cannot be brought about by dynamic cross linking, the overall
improvement in properties suggests that dynamic cross linking can be employed as
a means of compatibilisation of PSINBR blends. The thermal degradation
behaviour of dynamically crosslinked PSINBR blends .was studied as a function of
the concentration of DCP. The dynamically crosslinked blends were found to be
more thermally stable than uncrossIinked blends.
References
1. S.V. Usachev, N.D. Zakharov, V.N. Kuleznev, A.B. Ventoshkin, Int. polym.
Sci. Tech., 7, T48 (1980).
131

Chapter 4
2. C. Koning, M.V. Duin, C. Pagnoullie, R. Jerome, Prog. Polym. Sci., 23, 707
(1998).
3. W.K. Fischer, Rubber World, 167,49 (1973).
4. K.T. Varughese, P.P. De, S.K. SanyaJ, Angew. Makromol. Chem. 182, 73
(1990)
5. C.B. Bucknall, In: Polymer blend'), D. R. Paul and S. Newman (Ed).,
Academic press, New York, (1978)
6. K.C. Dao, J. Appl. Polym. Sd., 27, 4799, 1982.
7. S. Wu, Polymer, 26, 1855, 1985.
8. I. Pesneau, M.S. Champagne, M.A Huneault, Polym. Eng. Sei., 42, 2016
(2002).
9. A Mousa, U.S. lshiaku, Polym. 1nll., 52, 120 (2003).
10. M. Okamoto, K. Shioni, T. Inove, Polymer, 35, 4618 (1994).
11. T. Inove, T. Suzuki, J. Appl. Po/ym. Sei., 56, 1113 (1995).
12. J. George, K.T. Varughese, S. Thomas, Polymer, 41, 1507 (2000).
13. B. Kuriakose, S.K. De, S.S. Bhagawan, R. Sivaramakrishnan, S.K. Anithan, J.
Appl. Polym. Sei., 32, 5509 (1986).
14. A.T. Koshy, B. Kuriakose, S. Varghese, S. Thomas, Polymer, 34, 3428
(1993).
15. F.S. Liao, AC. Su, Tzu-Chien J. Hsu, Polymer, 35, 2579 (1994).
16. C.S. Ha, J. Appl. Polym. Sci., 35, 2211(1988).
17. S. Akhtar, B. Kuriakose, P.P. De, S.K. De, P/ast. Rubber Process Appl., 7, 11
(1987).
18. S. Al Malika, E.J. Amir, J. Nat. Rubb. Res., 1 (2), 104 (1986).
19. S. Danesi, R.S. Porter, Polymer, 19,448 (1978).
20. AY. Coran, Handbook of E/astomers- New Development and Technology.,
Bhowmick AK., Stephens H.L., eds., p. 249, Marcel Dekker, New York,
(1988).
132

Chapter 5
Compatibilisation by the addition of modified
polystyrene
Blending of polymers is a popular method of improving their end-use
properties [1]. However, most polymers are thermodynamically incompatible and
phase separation occur on blending. Compatibilisation of polymer blends is carried
out to reduce the scale of dispersion and to stabilise the morphology. This can be
achieved by addition of a premade block copolymer to the system or by carrying
out an in-situ reaction between the complementary groups of the blend
components. Both techniques promote dispersive mixing which leads to a reduced
particle size. There has been much interest in combining the attractive features of
incompatible polymers through interfacial reaction that is, adding reactive
polymers to fonn block or graft copolymers in-situ during blend processing. This
reactive compatibilisation has been demonstrated to be an effective and cost
efficient route for controlling the properties of various immiscible blend
systems [2-5].
Usually, reactive polymers can be generated by free-radical
copolyme11sation or by the melt grafting of functional groups onto chemically inert
polymer chains. Copolymers containing epoxy or oxazoline functional groups have
been widely investigated because of their high reactivity to low nucleophilic active
hydrogen such as those found in carboxyl, hydroxyl, and anhydride groups [6, 7].

Chapter 5
The efficiency of reactive compatibilization of immiscible polymers pairs
has already been studied in relation to the content of reactive groups of at least one
polymer. De Roover et at [8J have studied the effect of maleic anhydride (MA)
grafted polypropylene (PP-g-MA) on the average size of the pp phases dispersed in
nylon 6. The size decreases rapidly with increasing content of grafted anhydride.
However, beyond a critical content, the size levels off. Since maleic anhydride
reacts almost quantitatively with the amine end groups of PA 6, a direct
relationship between size of the dispersed pp phase and extent of the grafting
reaction has been proposed. A Monsanto patent by Lavengood [9] has reported on
the influence of the MA content of MA grafted SAN on the notched Izod impact
strength of acrylonitrile-butadiene-styrene terpolymer/PA 6 blends. When 6wt %
reactive SAN is used as compatibiliser, the impact strength is the highest in the
case of SAN containing approximately I wt% MA. At higher MA contents, the
P A6-g-SAN copolymer formed at the interface becomes rich enough in P A6 for
leaving the interface in favour of the PA6 phase. Baker et af [lOJ have studied the
compatibilisation capability of glycidyl methacrylate grafted polypropyJene
(PP-g-GMA) copolymers of different glycidyJ methacrylate (GMA) contents in
PP/poly(acrylonitrile-co-butadiene-co-acrylic acid) blends. Although the impact
energy depends on the total amount of the GMA groups in the blend, it appears that
this energy decreases when the average number of GMA groups per PP-g-GMA
chain is increased at constant total GMA content. This observation has been
discussed on the basis of both number and effectiveness of the interfacial
entanglements in relation to the molecular structure of the PP-g-MA
compatibiliser. Duvall et af [11] have compared the compatibilisation efficiency of
PP-g-MA of high and low anhydride content in PP/P A6 blends. Higher fracture
strain was observed for the compatibiliser with the low anhydride content. It thus
appears from these studies that there is an optimum degree of functionalisation,
beyond which the efficiency of the reactive compatibiliser decreases. There are
134

Compatibilisation by the .. ...
several reports on the grafting of MA on to PE in the presence of peroxide [12-14]
Coran and Patel [15] have functionalised polyolefin with dimethylol phenolic resin
(SP-I045) to enhance the compatibility of polyolefines with other polymers.
This chapter discusses the compatibilisation of powdered nitrile
rubber toughened polystyrene with maleic anhydride modified polystyrene
(MAPS) and phenolic modified polystyrene (PhPS). The effect of
compatibilisation on morphology, mechanical properties, dynamic mechanical
properties rheological characteristics and thennogravimetric analysis of nitrile
rubber toughened polystyrene is given in this chapter.
5.1 Morphology of compatibilised blends
The effect of MAPS and PhPS as compatibilisers on the morphology of
90/10 PSINBR blend is shown by figures 5.1 and 5.2 respectively. From the
scanning electron micrographs, it is seen that the size of the dispersed NBR phase
decreases with the addition of compatibilisers. This reduction in particle size with
the addition of compatibilisers is due to the reduction in interfacial tension between
dispersed NBR phase and the PS matrix.
The average domain size of the compatibilised blends as a function of the
compatibiliser concentration is shown in figure 5.3. The average particle size of the
unmodified blend is 4.03 J!m. In the case of MAPS compatibilised blends, addition
of 5% MAPS causes a reduction in domain size of 57%. Further addition of maleic
anhydride grafted PS does not change the domain size considerably, but a levelling
off is observed. In PhPS compatibilised blends, the average diameter of the
dispersed NBR phase decreases with the addition of up to 2 wt% PhPS. The
domain size of the uncompatibilised blend is reduced by 68.4% on the addition of
2 wt% PhPS. However further addition of the compatibiliser increases the domain
size. The equilibrium concentration at which the domain size levelled off can be
considered as the critical micelle concentration (CMC) [16]. The CMC was
135

Chapter 5
estimated by the intersection of the straight lines at the low and high concentration
regions [1 7, IS]
136
(a) (b)
(c)
Fig. 5.1: Scanning electron micrographs of the fractured surface of
compatihiUsed PH Hlilh (a) 2 KIt" (b) 5 HIt" and (c) }O wt% MAPS.

Compatibilisation by the ....•
(a) (b)
(c)
Fig. 5.2: Scanning electron micrographs of the fractured surface of
compaiibilised PH with (a) 1 wt% (6) 2 WI% and (c) 5 wt" PhPS
The CMC values for MAPS and PhPS are 3.0 and 2.0 % respectively. The
CMC value indicates the amount of compatibiliser required to saturate the unit
volume of the interface. The increase in domain size above CMC may be due to the
formation of micelles of the compatibiliser in the continuous PS matrix. As the
micelle fonnation starts, some of the compatibiliser already at the interface leaves
the interface. This leads to an increase in domain size. Several authors have
137

Chapter 5
reported on the interfacial adhesion of binary blends by the addition of
compatibilisers [19-21]. Noolandi and Hong [22, 23] theoretically predicted that
there is a critical concentration of the block copolymer at which micelles are
fonned in the homopolymer phases.
4.5
4.0
.-.3.5 E
-= '- 3.0 Cl) ..... Cl)
E (\l
2.5 '6 Cl) Ol (\l '- 2.0 Cl) > «
1.5
1.0
\ v\
'\ \ \
\ \ / \ \~ .\ ---w
\ . ------------'------/
• o 2 4 6 8 10
Wt % of compatibiliser
--,
Fig. 5.3: Variation of the average size of dispersed NBR domains as a function
of compatibiliser concentration.
These experimental observations and the present study suggest that there is
a critical concentration of compatibiliser required to saturate the interface of a
binary blend. The compatibiliser concentration above the critical value does not
improve the interfacial adhesion.
138
Compatibilisation by the .....
The interfacial saturation point can be further explained by Taylor's
theory. In Taylor's theory [24] of particle defonnation, the critical Weber number,
We, is given by the equation:
where 11m is the viscosity of the matrix, dn is the number average diameter of the
dispersed phase, y w is the shear rate and Tl2 is the interfacial tension. From the
equation it is clear that there is a critical value of Wc below which there is no
particle defonnation and no interfacial tension. At critical particle size, the
compatibiliser attains the maximum possible interfacial area and therefore there
must be a maximum quantity of compatibiliser available to saturate the interface.
The theories of Noolandi and Hong can be applied to these highly
incompatible PSINBR blends for concentrations less than CMC. According to
them the interfacial tension is expected to decrease linearly with the addition of
compatibiJiser below CMC, and above the CMC a levelling off is expected. The
expression for interfacial tension reduction (~r) in a binary blend NB upon the
addition of divalent copolymer A-b-B is given by [23]
/),r ~ x<DJ(l1 2X + 11 Zc) -1 Zc exp(Zcx/20)
where x is the width at half-height of the copolymer profile given by the Kuhn
statistical segment length, <1>c is the bulk vol.ume fraction of the copolymer in the
system, X is the Flory-Huggins interaction parameter between A and B segments of
the copolymer, and Zc is the degree of polymerisation of the copolymer. According
to this equation, the plot of interfacial tension reduction versus <Pc should give a
straight line. Since interfacial tension reduction is directly proportional to the
particle size reduction, as suggested by Wu [25], we can replace the interfacial
139

CWapter 5 ----
tension reduction term by the particle size reduction (f).d) term in Noolandi and
Hong's equation. Therefore
~d = Kd~J(1I2X + 11 Ze> -1 [Ze exp(ZcX 12)]
where K is a proportionality constant.
0.0 -
0.5
1.0
2.0
2.5
3.0 L---J.._~---'_-'-_.L.---L_-'-----''--.....L-_-'----' o 2 4 5
Fig. 5.4: Effect of volume fraction ofcompatibiliser on the particle size reduction
OfP90
The plot of particle size as a function of the volume percentage of
compatibiliser is shown in figure 5.4. It can be seen that at low copolymer
concentrations, below CMC, f).d decreases linearly with increase in copolymer
volume fraction.
140

Compatihi[isation hy the .••..
24
22
20
18
:g 16 (3
t 14 ro ~ 12 o lii 10 .0
E 8 ::J
Z 6
4
2
O~-r----.-----r----'r---~-----r--~
2 4
Domain size (J.lffi)
6
Fig. 5.5: EjJect of MAPS concentration on domain size distribution of P90.
32
30 28
26
24
Ul 22 0) (3 20
~ 18
.!:" 16 0 '- 14 0) .0 12 E
10 ::J Z
8
6
4
2
0 2 4
Domain size (mm)
6
Fig. 5. 6: Effect of PhPS concentration on domain size distribution of P90.
141

ChapterS
The domain size distribution curves for the MAPS and PhPS
compatibiJised blends are shown in figures 5.5 and 5.6 respectively. In the case of
unmodified blend, a high degree of polydispersity is evident by the large width of
the distribution curve. With increasing concentration of compatibiliser (MAPS and
PhPS), the polydispersity decreases, as evident by the decrease in the width of the
distribution curve. A narrow distribution is obtained by the addition of lO%
compatibiliser. Willis and Favis [26] have also shown that the addition of
compatibiliser to polyolefin/P A 6 system not only reduces the dimensions of the
minor phase, but also results in uniform distribution of the minor phase.
5.2 IR Spectra of modified polystyrenes
Figure 5.7 shows the FTIR spectrum of MAPS compared with FTIR
spectrum of polystyrene. The absorption bands at 1790 cm-J and 1855 cm- J can be
assigned to the grafted anhydride, which are due to symmetric and asymmetric
C=O stretching vibration of succinic anhydride rings grafted on the PS backbone
respectively.
Figure 5.8 shows the FTIR spectrum of phenolic modified polystyrene.
The absorption band at a wave number of 34 I 5 cm-J can be assigned to
symmetric -OH stretching of phenolic compound.
142

<0 u t: III .D ... 0 CIl
.D «
Q) 0 c ro -e 0 CIl .0 «
Compatibiiisation by the .. . ~ ..
0.15
0.10
1855 1790
0.05
0.00 1--..--..--..----r---r---.----.-----r----r-----r----r---1 4000
0035
0.030
0.025
0.020
0.015
0.010
0.005
0.000 4000
3500 3000 2500 2000 1500 1000
Wave num ber (cm -1)
Fig. 5.7: FTIR spectra of MAPS and PS
"------"-"-- -. -------,-,------,-_.,"-, -- '.---'~
3415
~~.J PhPS
3500 3000 2500 2000 1500
Wave number (cm-')
Fig. 5.8: FTlR spectrum of PhPS
I I I
J I I I
1000
143

ChapterS
5.3 Mechanism of grafting
The mechanism of the compatibilising action and the difference in
behaviour of MAPS and PhPS as compatibilisers in nitrile rubber toughened
polystyrene can be explained as follows. In MAPS, maleic anhydride groups are
grafted on PS back bone [27] as shown in figure 5.9. The compatibilising action of
MAPS is due to the dipolar interaction between the anhydride groups of MAPS
and NBR. This causes a reduction in interfacial tension, which reduces the domain
size of the dispersed phase.
DCP ..
PS
Fig. 5.9: Grafting reaction of MA onto PS during melt reactive process
In phenolic modified polystyrene, dimethylol groups are grafted on
polystyrene chain [27] as shown in figure 5.10. Here the compatibilising action is
due to the dipolar interaction between the phenolic groups PhPS and NBR and also
due to the emulsifying action of the graft copolymer between PS and NBR.
Figure 5.10 explains the mechanism of action of PhPS on PSINBR blend.
144

Dimethylol phenol
Polystyrene
OH
PS-- H C-l~'-. -CH OH 2 11, 2
',,:.. /"J
l R
PhPS
", CHI I
CII
11
+ rH CH1 I CII1
I CH-CN
NBR'
Compatibilisation by the ••.••
Quinone methide
OH
Phenolic modified polystyrene
OH I "-J, ,
PS- - H2c-r;/if -CH2- ICH
<'-::)/ ~H ii
R yH
~H2 I
Dimethylol phenolic linked CH PS-NBR block copolymer I 2
CH-eN
" Fig. 5.10: Reaction scheme for phenolic modification on PS and formation of
the block copolymer with NBR
145

5.4 Effect of compatibilisers on mechanical properties
Properties of immiscible polymer blends are affected by the addition of
compatibilisers. Figures 5.11 and 5.12 show the variation of tensile strength and
Young's modulus of the 9011 0 PSINBR blend with weight percentage of the two
compatibilisers MAPS and PhPS respectively. With increase in compatibiliser
concentration, the tensile strength and Young's modulus are found to increase up
to 5 wt% for MAPS and 2 wt% for PhPS and then levels off for both
compatibilisers.
.r=
48
46
44
42
(5,36 c ~34 t5 .!12 32
.~ 30 (J)
I- 28
rJ/
/ /
/
//-, " /1 1/
26 '/
24
1-----. --M\PSi 1-::>- PhPS t_._::....J
~~~ __ ~ __ L--L __ ~ __ ~~ __ ~ __ ~~~
o 2 4 6 8 10
Wt% of compatibiliser
Fig. 5.1 J: Variation on tensile strength with compatibiliser concentration of
90/10 polystyrene/nitrile rubber blend
The increase in tensile strength and Young's modulus is due to the increase
in interfacial adhesion between PS and NBR phases which is evident from the
146

Compatibilisation by the .. ...
scanning electron micrographs. It can be seen that addition of PhPS caused an
improvement in the tensile strength and Young's modulus. As a consequence, the
blend exhibits higher tensile strength and Young's modulus than those of the
uncompatibilised blend.
~
co c.. C9 CIl .2 ::J -0 0 E CIl
-Cl c ::J 0 >-
1.6
1-4
1.2
1.0
0.8
0.6
0.4
0.2
• I~· ~ --- - - -- e--- -- -- ___ _ If' / a • ------.. -=-~ /;
1/ i/ ,',
// :/
/; II ~ b
~,I
0.0 ~-...L_"""""'_-'----'_-'-_""""_~--'-_-'-_..L...---J o 2 4 6 8 10
Wt % of carpatibiliser
Fig. 5.12: Variation of Young's modulus with compatibiliser concentration of
90/10 polystyrene/nitrile rubber blend
In the case of MAPS compatibilised blends, the increase in tensile strenl:,>ih
and Young's modulus is due to the dipolar interaction between the maleated PS
and NBR phases, which causes an increase in interfacial adhesion between PS and
NBR, although there is no reduction in particle size with the increase in MAPS
147

concentration beyond 5 wt%. Similar results have been reported for the NylonIPP
system [28].
The effect of compatibiliser concentration on the elongation at break of
90/10 Polystyrene/nitrile rubber blend is shown in fib'llre 5.13. The elongation at
break values increases with the addition of compatibilisers up to 5 % for MAPS
and 2% for PhPS.
3.5
3.4
----3.3
~ ~ .lI<:
3.2 ro Q) L.-
oO
, /
ro 3.1 c
.Q
i 3.0 c 0 W
2.9
2.8
0
// I
2
/ -- --- - -~)------------. -----()
• .-- ._--.-._-- ..
4 6
I-'-:~l I-G~PhPSJ
8 10
VVt.% of oorl1Jatibilisa"
Fig. 5.13: Variation of elongation at break with compatibiliser concentration of
90110 blend of PSINBR
From figure 5.14 it is seen that the Izod impact strength of the blend
increases significantly by the addition of up to 5 wt% MAPS and 2 wt% PhPS, and
after that it decreases. This result is consistent with the literature reports on the
increase of impact strength with reduction in particle size of the dispersed phase.
148

Compatibilisat;on by the •. ...
The reduction in impact strength at higher compatibiliser concentrations is due to
the formation of compatibiliser micelles in the homopolymer phases. Similar
results have been reported for the low-density polyethylene/polydimethylsiloxane
system [29].
500
200
• ---e-__
• /. /----
/ / // // / /
• !
I " /; I. / !
if ,'/
1/ if ;/ t
o 2 468
VVt % of corrpatibiliser
---. - - 11
10
Fig. 5.14: Variation of impact strength with compatibiliser concentratiolt of
90110 blend of PSINBR
It is clear from the impact strength results that interfacial adhesion is an
important factor in rubber toughening. Shaw and Singh [30] have reported on the
impact strength of compatibilised PS/EPDM blends, where the observed increase
in impact strength is correlated with the improved interfacial adhesion.
149

5.5 Dynamic mechanical properties
The variation of storage modulus as a function of temperature of the 90/10
blend of PSINBR compatibiIised with different amounts of PhPS is shown in
figure S .IS. Below the glass transition temperature (T J of polystyrene all the
compatibilised blends have higher storage modulus than that of uncompatibilised
blend. The blend containing 2 and Swt% PhPS registered highest storage modulus.
The increase in storage modulus upon the addition of PhPS is due to the increase in
the interfacial adhesion caused by the emulsifying effect of the block copolymer
formed by the interaction between PhPS and nitrile rubber. The better interaction
between PS and NBR is evident from the morphology observed in scanning
electron micrographs.
---a- p~
a:x:.o ---Pg 90 •
- -+-- PwIi C1l
~ 15X) -A- Pw~o
'-"'
en :l
""5 -g 10c0 E ID Cl C1l ....
!ill 0 +-' (f)
0
2J 40 00 00 100 14)
T errc:erattre ('C)
Fig.5.15: Variation of storage modulus of PhPS compatibilised PSINBR blends
150

Compatibilisation by the .. ...
The lower value of storage modulus for the blend containing 10 wt% PhPS
may be due to the formation of micelles of the compatibiliser in the polystyrene
matrix. Similar behaviour has been reported Brahimi et al [31] in the
compatibilisation of PSIPE blends by HPB-b-PS copolymers. At higher
temperatures all blends showed approximately the same modulus.
Figure 5.16 depicts the variation of storage modulus (E') of the 90110 blend
of PSINBR compatibilised with MAPS. All the compatibilised blends except that
containing 5 wt% MAPS have lower storage modulus than uncompatibilised blend
at ambient temperature. This suggests that the interfacial adhesion is strong in it.
At a temperature above lOOoe all the blends show nearly the same values of E'. In
the compatibilisation of PSINBR blend with MAPS, the MAPS increases the
interfacial interaction between PS and NBR by the dipolar interaction between
polar maleic anhydride groups ofmaleated PS and polar NBR.
2200
2(XX)
11D.l
1 &Xl
8!. 1400 ~ ';;;1200 ~ ~ 1COO
"0 0 E OC()
ID Cl ro:> ctl .... 0 400 .U5
200
0
-200 20 40 60 00 100 120
T errperature (C)
Fig. 5.16: Variation of storage modulus of MAPS compatibilised PS/NBR blends
151

The variation of tan 0 as a function of temperature of PhPS compatibilised
blends is shown in figure 5.17. From the figure it is clear that in all blends the T g of
polystyrene is unaffected by compatibilisation. This indicates that the
compatibiJisation does not alter the level of miscibility or in other words, the
presence of compatibiliser does not promote molecular level miscibility. This is in
2.5
2.0 -.---er-. P 90
-a__ P'XIH2
. ......- P H 'Xl 5
1.5 -~P9IlH1O
Tanli 1.0
0.5
0.0
20 40 60 80 100 120
Temperature (QC)
Fig. 5.17: Variation of tan t5 of PhPS compatibilised PSINBR blends
agreement with the conclusions made by Paul [32] who suggested that if two
polymers are far from being miscible, and then no copolymer is likely to make a
one phase system. In a completely immiscible system, the main role of the
compatibiJiser is to act as an interfacial agent. At lower temperatures, below the Tg
of polystyrene, the tan 0 values of the compatibilised blends are slightly lower than
that of the uncompatibilised blend. All the compatibilised blends show higher
values of tan 0 at higher temperatures. This increase in tan 0 indicates that the
interfacial interaction caused by the presence of PhPS may be weakened at higher
152

Compatibilisation by the .....
temperatures. The decrease in interfacial interaction at higher temperatures will
decrease the interfacial adhesion and hence leads to increased segmental motion.
The variation of tan 0 of MAPS compatibilised P90 is shown in
figure 5.18. The tan (5 value of the blend containing 5 wt% MAPS is lower than
that of uncompatibilised blend and the T g of polystyrene is slightly shifted to a
higher temperature. In this case the decrease in tan 0 is due to the increase in
interfacial interaction.
2.4
2.2
2.0
1.8
1.6
1.4
1.2
Tan 8 1.0
0.8
0.6
0.4
0.2
0.0
'{).2 20
r~ __ p --1
I--p:~ I 1 -"-P9(l~ I .-fr- P9(lM.. .
I~~~~
40 60 00 100 120
T cmpernture ('q
Fig. 5.18: Variation of tan 0 of MAPS compatibilised PSINBR blend.\·
Fib'Ure 5.19 depicts the variation of loss modulus (E") as a function of
temperature of PhPS compatibilised blends. Distinct peaks can be observed at the
glass transition temperature (T J of ps. Below the tg of the polymer, the chains are
in tact and stress transfer is possible. When the temperature is approaching the T g,
energy dissipation takes place and a corresponding peak is observed in the E"
153

ChapterS
values. P90HS registers maximum loss modulus which is attributed to the increased
extent of interaction at the interface.
500
!t~\ 400 f~\11
. 11r: "2 300 _.y-- P90 i 1"
0-
6 --- P90H2 / '/\t\ '" '" __ --- P H
'" 200 90 5 "Cl
---A- P90H1O ~ ~ 0
E '-"
1 \ Vl 0
-.l 100
0
20 40 60 80 100 120
Temperature CC)
Fig. 5.19: Variation of loss modulus of PhPS compatibilised PSINBR blends.
154

Compatibi[isation by the .....
450
400
300
300 ........, «I ~
~250 '-' r/J ;J :g 200
0 S 1!i} 'JJ
'" 0 ......l 100
!i}
0
20 40 60 00 100 120
T~(C)
Fig. 5.20: Variation of loss modulus of MAPS compatibilised PSINBR blends.
The variation of loss modulus with temperature of MAPS compatibilised
blends is shown in figure 5.20. The loss modulus of the blend containing 5 wt%
MAPS has lower value than that of uncompatibiJised blend.
5.6 Rheological studies
The addition of block or graft copolymers or modified polymers to
immiscible blends is found to improve their physical and mechanical properties.
A suitably selected compatibiliser will locate at the interface between the two
phases leading to a reduction in interfacial tension and an improvement in
interfacial adhesion.
155

1.0
0.9
0.8
e-:-' 0.7 E E Vi 0.6
6 .f:' 0.5
'" 8 0.4 '"
~ 0.3 <1}
.c [/} 0.2
0.1
0.0 0.1 0.2 0.3 0.4
Shear stress (N/mm2
)
------ P 90
- .- P90H, 4--- P H
90 2
~-P90H5 ---+- -P
90H
10
0.5 0.6 0.7
Fig.5.2i: Effect o.lshear ,,,tress on the melt viscosity of PhPS compatibilised
PSINBR blends
The effect of shear stress on the melt viscosity of 90/10 blend of PSINBR
containing PhPS and MAPS is shown in figures 5.21 and 5.22 respectively. It is
seen from the figure that, at lower shear rates, the viscosity of the compatibilised
system is higher than that of the uncompatibilised system. At high shear rates the
viscosity seems to be unaffected by compatibilisation.
156

0.9
0.8
0.7 --"'8 8 0.6 ~
b 0.5 .0 ':;)
8 0.4
'" .;:: a 0.3 do)
..<: Vl 0.2
0.1
0.0 0.1
compattbi/tsatton by the .•. .•
0.2 0.3 0.4 0.5 0.6 0.7
Shear stress (NInnl)
Fig. 5.22: Effect ofshear stress on the melt viscosity of MA PS compatibilised
PS/NBR blends
Figures.5.23 and 5.24 depict the variation of viscosity as a function of
compatibiliser concentration. With the increase in compatibiliser loading the
viscosity initially increases, followed by a levelling-off at higher loading. The
variation in viscosity is more pronounced at lower shear rates. Such increase in
viscosity on compatibilisation of immiscible polymer blends has been reported by
several researchers [33-37]. Upon compatibilisation of an immiscible blend, the
compatibiliser will generally locate at the interface between the dispersed phase
and the matrix. This will lead to an increase in interfacial thickness.
157

Chapter 5
According to Okoroafar et al [38], the viscosity of the compatibilised
blend is given by:
where <1>' is the volume fraction, Y) the viscosity, and the subscripts m, d and i
denote matrix, dispersed phase and interface, respectively. Hence the viscosity of
these blends depends on the volume fraction of the interface and also on the
viscosity of the interface.
0.75
0.70 Shear rate (S·I) 0.65 - .--. 666.6-'- 1333 0.60 - ... - 2666 --.- - 6666 - -. 0.55
~ ----- -- -----
N
0.50 S ~ 0.45 '" 2S 0.40
-~~ 0.35 • ------. '" 0.30 0 u v:l 0.25 >
,-~-----~--........----.~--
--4 --~---- ---
.... 0.20 '" "-' -= 0.15 {/)
...... ------'--------y--.
0.10
0.05 .,.-------y---- . .----------T--.-------.~
0.00
·0.05 o 2 4 6 8 10
Wt% of compatibiliser
Fig. 5.23: Effect of compatibiliser concentration on the melt viscosity of PhPS
compafibilised PSINBR blends
158

0.46 0.44 0.42 OAO 0.38 0.36
.c;-' 0.34 E 0.32 -e 030 £. 0.28 ';:: 0.26 .~ 024 8 0.22 '" .; 0.20 ~ 0.18 ~ 0.16 C/l 0.14
0.12 0.10 0.08
Compatibi/isation by the .....
-_ .. ----. ----~--
-----------
-- ---.-------_.-.
-------
Shear rate (5') ·-.·666.6-"'-1333 *- 2666-~ 6666
0.06 L-......L._~--L_-'----'-_..L-.---'-_...L---'-_--'---'--' o 2 4 6 8 10
Wt% of compatibiliser
Fig. 5.24: Effect of compatibiliser concentration on the melt viscosity of MAPS
compatibilised PSINBR blends
From figures 5.23 and 5.24 it can be observed that the increase in melt
viscosity with concentration of the compatibiliser is negligible at higher shear
rates. So the processability of the PSINBR blends not affected by the addition of
compatibilisers
The effect of compatibilisation on the flow behaviour index is given in
figure 5.25. It is clear from the figure that flow behaviour index increases with the
addition of compatibiliser and even after compatibilisation, the polymer melt
exhibits a pseudoplastic behaviour.
159

Chapter 5
0.45
0.44
0.43
::;; ~ 0.42 cl)
'"0
05 0.41 ~ o .;; ro 0.40 ~ .n ~ 0.39 o
~/ *----
I / ~ I /_---a------O
0.38 1/ I
0.37
o 2
----- -----... ------ ---
4 6 8 10
Wt%of CCIIUJlibilio;er
Fig.5.25: Effect of compatibiliser concentration on the flow behaviour index of
PSINBR blends
In a capillary rheometry, several phenomena may be observed in the
extrusion characteristics, which are more intimately related to the polymer melt
elasticity than to the melt viscosity. These measurements are important in terms of
the commercial processing characteristics of the polymer blends. The first one is
the die-swell or elastic memory and which has great practical importance in
processing operations. The die-swell originates from the recoverable elastic
deformation of the flowing polymer at the entrance of the capillary, that partially
decays on relaxation during the flow through the capillary, but which causes
swelling of the extrudate once the die wall restriction is removed. The die-swell
behaviour of the compatibilised blends IS presented in figure 5.26.
160

Compatibilisation by the ••...
Compatibilisation of the blend decreases the die-swell and improves the melt
strer1gth.
2.10 2.05 2.00 1.95 1.90 1.85 1.80 1.75 1.70
(1) 1.65 ::: ':' 1.60 .~ 1.55 Cl
1.50 1.45 1.40 1.35 1.30 1.25 1.20 1.15
- .... , '" ''T .. ~~_. ___ ~._ .. _ .. __ .. __ .. ____ .,.
~-
o
-.0-A--- --_ -4--- _ . -·------A
..... --.- -- - --- --e-------.-_____ •
2
Shear rate (s-')
-.--- 13.3 ... - 666.6 --A-.- J333-Y-- 2666
-----. --- -
4 6
Wt% of compatibiJiser
8 10
Fig.5.26: Effect of compatibiliser MAPS concentration Oil the die-swell values of
PSINBR blends
5.7 Thermogravimetric analysis
The thennograms and derivative thermograms of 90/10 blends ofPSINBR
compatibilised with MAPS and PhPS are shown in figures 5.27 to 5.32. The peak
corresponding to the major weight loss in DTG curves are shifted to higher
temperatures upon compatibilisation using both MAPS and PhPS. Table 5.1 shows
the de.b'Tadation temperature and weight loss at different temperatures for the
compatibilised blends. It can be seen from the table that the degradation
temperature corresponding to the major weight loss increased on compatibilisation.
161

The percentage weight loss at different temperatures . decreased upon
compatibilisation. The improvement in degradation resistance on compatibilisation
may arise from the better interactions between PS and NBR.
'0' ~ '-'
~ ~
162
100
80
60
40
20
0
439.38
2
0
o 100 200 300 400 500 600 700 800 900
Temperature (,C)
~ :< ~. ~ ,-. ~ ~
fi
Fig. 5.27: TG trace of9fJI10 blend of PS and NBR with 2 wt% MAPS

Compatibilisation by the .. ...
441.26 100
80 2
60 ~ ~ :<
~ t 40 ~ ""' ;!( <>":c
20 0 D
0
o 100 200 300 400 500 600 700 800 900
Temperature CC)
Fig. 5.28: TG trace 0/90110 blend of PS and NBR with 5 wt% MAPS
4
100
444.74 80
2 g
60 ::1. -'0" ~ ~ '-' ~. ~ 40 ~ ~ ,....,
~ "-
20 d 0
. 0
0 100 200 300 400 500 600 700 800 900
Temperature CC)
Fig. 5.29: TG trace 0/90110 blend o/PS and NBR with 10 wt% MAPS
163

ChapterS
164
"Q' ~ ~ '0 ~
'C '0' '-'
~ $
100
80
60
40
20
0
434.04
2
0
o 100 200 300 400 500 600 700 800 900
Temperature ("C)
~ ~
~. ~ "" ~ d
Fig. 5.30: TG trace of90110 blend of PS and NBR with 1 wt% PhPS
100
80
60
40
20
0
435.41
o 100 200 300 400 500 600 700 800
Temperature CC)
2
Fig. 5.31: TG trace of 9011 0 blend of PS and NBR with 2 wt% PhPS

Compatibilisation by the •.•..
100 436.35
80 2
0
""" 60 ~ .. '-'
~. ~ ~
:c Ol)
40 ';U
<l> o:.:i' ~
::: ~ S<:"
20 0 D
0
o 100 200 300 400 500 600 700 600 900
Temperature CC)
Fig. 5.32: TG trace 0}90110 blend of PS and NBR with 5 wt% PhPS
Table 5.1. Weight lm.s and DTG peaks of compatibilised blends
Weight loss at Weight loss at Total weight DTG
Sample 300"C 400°C loss
peak (%) (%) (%)
P90M 2 1.08 7.41 98.63 439.38
P90Ms 1.46 7.21 98.13 441.26
P90M lO 1.63 7.01 98.00 444.74
P90H I 1.63 7.90 98.20 434.04
P90H2 1.43 7.34 98.10 435.41
P90HS 1.11 7.10 98.10 436.35
165

ChapterS
5.8 Conclusion
Compatibilisation with maleic anhydride modified polystyrene and
phenolic modified polystyrene resulted in an overall improvement in the
mechanical properties of powdered nitrile rubber toughened polystyrene due to
improved interfacial adhesion. There is significant reduction in the domain size of
the dispersed NBR phase till a critical micelle concentration is reached and
thereafter a levelling off in the domain dimensions is noticed. The addition of
phenolic modified polystyrene and maleic anhydride modified polystyrene is found
to increase the storage modulus at lower temperatures, indicating an increase in
interfacial adhesion on addition of these compatibilisers. At a higher concentration
of these compatibilisers, the storage modulus decreaseed due to interfacial
saturation. The compatibilisation of PSINBR blend with maleic anhydride
modified polystyrene and phenolic modified polystyrene was found to increase the
viscosity of the system indicating an increase in interfacial interaction. The
variation of viscosity was correlated with the morphology. As the compatibiliser
concentration increased the domain size decreased and showed a levelling-off at
high concentration. It is also observed that the increase in melt viscosity with
concentration of the compatibiliser is negligible at higher shear rates. So the
processability of the PSINBR blends is not affected by the addition of
compatibilisers. The effects of compatibiliser concentration on the thermal
behaviour of PS/NBR blend were analysed. It was found that the thermal stability
of the blends is improved by compatibilisation. The weight loss of the
compatibilised blends at various temperatures decreased on addition of the
compatibiliser.
166

Compatibilisation by the ....•
References
1. D. R. Paul, J. W. Barlow, H. Keskkula, In Encyclopedia of Polymer Science
and Engineering, J. I. Kroschwitz, Ed., Wiley, New York, (1988).
2. S.B. Brown, In Reactive Extrusion, Principle and Practice, M. Xanthos, Ed.,
p. 75, Hanser, New York, (1992).
3. N.C. Uu, W.E. Baker, Adv. Polym. Technol., 11,249 (1992)
4. M. Xanthos, S.S. Dagli, Polym. Eng. Sci., 31,929 (1991)
5. N.e. Beck Tan, S.K. Tai, RM. Briber, Polymer, 37, 3509 (1996)
6. P.e. Lee, W.F. Kuo, F.e. Chang, Polymer, 35,5641 (1994)
7. M.W. Fowler, W.E. Baker, Polym. Eng. ScL, 28, 1427 (1988)
8. B. De Roover, Ph.D. Thesis, Universite Catholique de Louvain, (1994).
9. R E.Lavengood, Eur. Patent, No. 202214, MonsantoCompany, (1986).
10. L Chen, B. Wong, W.E. Baker, Polym. Eng. Sci., 36, 1594 (1996).
11. J. Duvall, C. Selliti, C. Myers, A. Hiltner, E. Baer, J. Appl. Polym. Sci., 52, 195
( 1994).
12. W. Gabara, S. Porejko, J. Polym. Sci., Al 5, 1539 (1967).
13. S. Porejko, W. Gabara, 1. Kulesza, J. Polym. Sci., Al 5, 1563 (1967).
14. D. Braun, U. Eisenlohr, Angew. Makromol. Chem., 55, 43 (1976)
15. AY. Coran, R Patel, Rubber Chem. Technol., 56,1045 (1983).
16. S. George, N.R Neelakantan, K.T. Varughese, S. Thomas, J. Polym.
Sci.,Po/ym. Phy.'). Ed., 35, 2309 (1997).
17. R Asaletha, M.G. Kumaran, S. Thomas, Rubber Chem. Technol., 68, 671
(1995).
18. Z. Oommen, M.R. Gopinathan Nair, S. Thomas, Polym. Eng. Sei., 36, 1
( 1996).
19. H.A. Spiros, G. Irena, 1.T. Koberstein, Macromolecules, 22, 1449 (1989).
20. R Fayt, R leromc, P. Teyssie, Makromol chem., 187,837 (1986).
21. S. Thomas, R.E. Prud'homme, Polymer, 33, 4260 (1992).
167

Chapter 5
22. J. Noolandi, K.M. Hong, Macromolecules, 15,482 (1982).
23. J. Noolandi, K.M. Hong, Macromolecules, 17, 1531 (1984).
24. 1.M. Wills, B.D. Favis, Polym. Eng. Sci., 28, 1416 (1988).
25. S. Wu, Po/ym. Eng. Sci., 27, 335 (1987).
26. J.M. Willis, B.D. Favis, Po/ym. Eng. Sci., 30, 1073 (1990).
27. C. Nakason, K. Nuansomsri, A Kaesaman, S. Kiatkamjornwong, Polymer
Testing, 25, 782 (2006)
28. F. Ide, A Hasegawa,1. Appl. Polym. Sci., 18,963 (1974)
29. R.N. Santra, B.K. Samantaray, AK. Bhowmick, G.B. Nando,
1. Appl.Polym. Sci., 49,1145 (1993).
30. S. Shaw, R.P. Singh,1. Appl. Po/ym. Sci., 40, 685 (1990)
31. B. Brahimi, ,A Ait-kadi, A Ajji, R. Fayt, 1. Polym. Sci.,Polym. Phys. Ed., 29,
946 (1991).
32. D.R. Paul, S. Newman, Polymer blends, Academic Press, New York, (1978).
33. R.M.H. Miettinen, J.V. Seppala, O.T. Ikkala, LT. Reima. Polym.Eng.Sci
34(5), 395 (1994).
34. Y. Gennain, B. Ernst, O. Genelot, L. Dhamini, 1. Rheol., 38(3), 681
(1994).
35. A. Valenza, D. Acierno, Eur.Polym. J., 30(10),1121 (1994).
36. M. Joshi, S.N. Maiti, A. Misra, J.Appl.Polym. Sci., 15, 1837 (1992).
37. Z. Oommen, C.K. Premalatha, B. Kuriakose, S. Thomas, Polymer
38, 5611 (1997). 38. E.U. Okoroafar, 1.P. Villemuire, J.F. Agassant, Polymer, 33(24), 5264
(1992).
168

Chapter 6
Compatibilisation by the addition of styrene-co-acrylonitrile
Among the different types of polymer blends, rubber toughened
thermoplastics combine the excellent processing characteristics of the
thermoplastics at high temperatures with the resilience and flexibility associated
with elastomers at the service temperature [1, 2]. Even though blending is an easy
method for the preparation of rubber toughened thermoplastics, most of the blends
are immiscible and exhibH poor mechanical properties. In such heterogeneous
systems, the over-all properties depend on two structural parameters: a proper
interfacial tension leading to phase size small enough to allow the material to be
considered as macroscopically homogeneous and an interface adhesion strong
enough to assimilate stresses and strains without disruption of the established
morphology [3]. However the properties of these polymer blends can be improved
by the addition of compatibilisers [4]. A suitably chosen compatibiliser will locate
at the interface between the two components and thereby reduce the interfacial
tension and improve the interfacial adhesion and mechanical properties. The effects
of compatibilisation on the properties of polymer blends have been widely
investigated [5-10]. The thermodynamic theories concerning the emulsifying effect
of copolymer in heterogeneous polymer blends have been developed by Leibler for
semi compatible blends [11, 12], and Noolandi and Hong for immiscible blends
[13, 14]. According to the two theories, the localisation of the compatibiliser at the

t.-naprer 0
interface results in broadening of the interface between the homopolymers and
lowering of the interaction energy between the two immiscible homopolymers.
Thomas and co-workers [15-18] investigated the effect of compatibilisation using
copolymers and modified polymers in different polymer blends. They found that
the addition of natural rubber-graft-polymethyl methacrylate (NR-g-PMMA) and
natural rubber-g-polystyrene (NR-g-PS) as compatibilisers in PMMAINR and
PSINR blends, respectively, leads to fine and uniform distribution of the minor
phase in the major matrix polymer. Mathew and Thomas [19] studied the influence
of SAN as a compatibiliser on the morphology and mechanical properties of
PSINBR blends. They found that the incorporation of SAN is effective in reducing
the phase size of PSINBR blends. The domain size of the dispersed phase
decreases with the addition of small amount of the copolymer, followed by
levelling off at higher concentrations.
In this chapter, the effect of styrene-acrylonitrile copolymer (SAN) as a
compatibiliser for powdered nitrile rubber toughened polystyrene was investigated.
The effect of compatibilisation on the mechanical properties and morphology was
studied.
6.1 CompatibiIisation with r:andom SAN copolymer
An intermolecular interaction between SAN-PS and SAN-NBR is expected
due to their structural similarity. Hence, random SAN copolymer is a logical
choice as a compatibiliser in PSINBR blend. Due to the close affinity of the styrene
segments toward the PS phase and the acrylonitrile segments toward the NBR
phase, the localisation of SAN molecules at the interface is increasingly favoured.
This would facilitate the effective dissipation of stress from the matrix to dispersed
phase, thereby, increasing the interfacial strength of the blends.
170

Compatibilisation bJUne~;:.-:
6.2 Effect of compatibiliser concentration on mechanical properties and
morphology
Figures 6.1 and 6.2 show the effect of the addition of SAN on the tensile
strength and Young's modulus of90/10 blend of polystyrene/nitrile rubber.
50
-- . 45
Cil CL
~ 40
.c en c:
~ 35 11)
~ .(ij c: 30 ~
25
20 0 2 4 8 10
wt% of SAN
Fig. 6.1: Effect of SAN concentration on the tensile strength of90/10 blend of
polystyrene/nitrile rubber
co CL
16
1.4
1.2
~ 1.0
'" ::J :g 0.8
~ '" 0.6 h c :::J o 0.4 >-
0.2
~--------- ------ - - - -.
Wt% of SAN
Fig. 6.2: EjJ(!Ct of SAN concentl"ation on the Young's modulus of 90/1 0 blend of
polystyrene/nitrile rubber
171

Chapter 6
Addition of SAN improves the tensile strength and Young's modulus. This is due
to the enhancement in interfacial adhesion between PS and NBR phases. The
highest tensile strength and Young's modulus are obtained at 5 wt% SAN
concentration and thereafter no further increase. This may be explained as follows:
since SAN is a random copolymer, it cannot penetrate deep into the phases, rather
concentrates more at the interface. This leads to substantial increase in interfacial
thickness. In fact, the addition of SAN copolymer suppresses the coalescence of
the NBR phase. In the absence of the random copolymer, the coalescence may be
occurring in P90 because the rubber particles can undergo shear induced
aggregation in the low viscosity PS phase [19].
3.2
'""' 3.1 ~ ~ ~
'" <1.l ..... .&:l 3.0 ...... '" t::: .~ .....
o;j bO t::: 29 0
Ul
28
o 2 3 4 5 6 7 8 9 10 11
VvtOloofSAN
Fig. 6.3: Variation of elongation at break of 90/1 0 blend of polystyrene/nitrile
rubber with wt% of SAN
172

Compatibilisat;on by the .•.•.
The compatibilised blends are found to be more tough than the
uncompatibilised blend. The uncompatibilised 90/10 blend of PSINBR has an
elongation at break of 40%. Addition of 5 wt% SAN increases the elongation at
break to 60.5 % (figure 6.3). The increase in toughness of compatibilised blends is
due to the increased interfacial adhesion. An improvement in elongation at break
on compatibilisation of polymer blends has been reported in literature [20].
The effect compatibiliser concentration on the impact strength (unnotched)
is given figure 6.4. Addition of 5 wt% SAN increased the impact strength of P90
from 210 to 573 J/m. The effect of increasing the concentration of SAN beyond 5
wt% would only be to force away a portion of it from the blend interface, to form
micellar aggregates in the matrix. Majumdar et al reported [21,22] similar result on
addition of imidized acrylic compatibiliser beyond 10 wt% in nylon-61 ABS
system.
600
• ----- _ ... 550 ---
SOD // E 2. 450
( .r::
~ 400 (I) .... 1i) 350 .... u rn .§ 300
250
200
0 2 4 6 8 10
Wt% of SAN
Fig. 6.4: Variation o.fimpact strength of 90110 blend ofpolystyrenelnitrile rubber
with wt% of SAN
173

Figure 6.5 shows the scanning electron micrographs of the tensile fractured
surface of Pgo blends with 0,2,5 and lOwt % SAN respectively. The morphology
of the compatibilised blends shows that the addition of the copolymer results in
considerable change in the domain size of the rubber particles. As the
concentration of the compatibiliser increases rubber particles attain elongated
structure which is more pronounced in the blend containing 10 wt% SAN.
0.0
(.) (b)
(c) (d)
Fig. 6.5: Scanning electron micrographs o/the fracture sur/ace 0/90110 blend
o/polystyrene/nilrile rubber blend with (a) 0% SAlV.
(b) 2% SAN. (c) 5% SAN and (d) }O% SAN
174

Compatibilisation by the •..••
6.3 Dynamic mechanical properties
The variation of storage modulus as a function of temperature of the 90/10
blend of PSINBR compatibilised with different amounts of SAN is shown in
figure 6.6. Below the glass transition temperature (T g) of polystyrene, all the
compatibilised blends have higher storage modulus than that of uncompatibilised
blend. The blend containing 5wt% SAN has registered highest storage modulus.
The increase in storage modulus upon the addition of 5 wt% SAN is due to
the increase in the interfacial adhesion caused by the interaction of the random
copolymer with both phases. The lower value of storage modulus for the blend
containing 10 wt% SAN may be due to the fonnation of micelles of the
compatibiliser in the polystyrene matrix.
2400
zm am 1800 -co 100>
CL ~14OO (J)
::J 1200 :; -g 1CXX>
E 800 Q) O'l ~ 00>
l5 400
200
o
-1 ---- PooS,
---- POOS2
~POOS5
-T- PooS
-200L-~--L-~ __ ~~~-L __ ~~ __ ~~ __ ~
al 40 100 120
T errpercru-e rC) Fig.6.6: Variation of storage modulus of SAN compatibilised PSINBR blends
175

Clrapter 6
The variation of tan () as a function of temperature of SAN compatibilised
blends is shown in figure 6.7. From the figure it is clear that in all blends the Tg of
polystyrene is unaffected by compatibilisation except the blend containing 1 wt%
SAN. This indicates that the compatibilisation does not alter the level of miscibility
or in other words, the presence of compatibiliser does not promote molecular level
miscibility.
2.5 -- ------------------
2.0
1.5
00
~ f-< 1.0 ---PooS,
-----.- P OOS2
-0\- PooSs 0.5
--'t'- P ooS,c
0.0 2) 40 m 8) 100 12)
Ten-penm-e CC)
Fig. 6.7: Variation of tan J of SAN compatibilised PSlNBR blends
In a completely immiscible system, the main role of the compatibiliser is
to act as an interfacial agent. At lower temperatures, below the T g of polystyrene,
the tan () values of the compatibilised blends are slightly lower than that of the
uncompatibilised blend. All the cOlllpatibilised blends show higher values of tan b
176

Compatibilisation by the •..••
at higher temperatures. This increase in tan 0 indicates that the interfacial
interaction caused by the presence of SAN may be weakened at higher
temperatures. The decrease in interfacial interaction at a higher temperature will
decrease the interfacial adhesion and hence leads to increased segmental motion.
Figure 6.8 depicts the variation of loss modulus (E") as a function of
temperature of SAN compatibilised blends. The loss modulus curves show a
similar trend as that of tan 5 curves.
450
400
350
-8!.300 ---PIllS1 ::E -;;-250 --+- PIllS2 :J "5 200 -A---- P IllSS -0 0
----T- P IllS10 E 150 :z 0
....J 100
o
20 40 00 100 120
Fig. 6.8: Variation of loss modulus of SAN compatibilised PS/NBR blends.
6.4 Tbermogravimetric analysis
The thermograms and derivative thermograms of 90/1 0 blends of PSINBR
compatibilised with SAN are shown in figures 6.9 to 6.12. The peak corresponding
to the major weight loss in DTG curves are shifted to higher temperatures upon
177

Chapter 6
compatibilisation using SAN. Table 6.1 shows the degradation temperature and
weight loss at different temperatures for the compatibilised blends. It can be seen
from the table that the deb1l"adation temperature corresponding to the major weight
loss increased on compatibilisation. The percentage weight loss at different
temperatures decreased upon compatibilisation. The improvement in degradation
temperature on compatibiIisation may arise from the better interactions between PS
and NBR.
100
80
~ 60 ~
.:c tJ)
"w 40 3:
20
o
433.86°C
\ \
\ \_---- ----
o 100 200 300 400 500 600 700 800 900
Temperature (DC)
2
Fig. 6.9: TG trace 0/90110 blend ofp~lystyrenelnitrile rubber with 1 wt% SAN
178

100
80
60
40
20
o
436.63 DC
\ '.
Compatibilisation by the . ....
2
o 100 200 300 400 500 600 700 800 900
Temperature (oC)
Fig. 6.10: TG trace 0/90110 blend ofpoly.'.tyrenelnitrile rubber with
2 wt%SAN
>!2. ~
:c 0> 'v ~
100 439.29°C
\
80 \ 2
60
40
20
o
o 100 200 300 400 500 600 700 800 900
Temperature (OC)
Fig. 6.11: TG trace 0/90110 blend ofpolystyrenelllitrile rubber with
5 wt% SAN
179

Chapter 6
180
100
80
60 ~ e.... 1: 0>
40 ~
20
0
\
1
\------\_._-- --.. -------
2
0
o 100 200 300 400 500 600 700 800 900
Temperature rC)
0 (lJ
~.
~ (lJ
to' ~
~ '"0 g
Fig. 6.12: TG trace 0/90110 blend ofpolystyloenelnitrile rubber with
10wt%SAN
Table 6.1. Weight loss and DTG peaks of SAN compatibilsed blends
Sample Weight loss at Weight loss at Total weight DTG
300°C (%) 400°C (%) loss (%) peak(°C)
P90S1 1.47 7.80 98.2 433.86
P9oS2 1.35 7.61 98.5 436.63
P90S5 1.11 6.98 99.0 439.29
P90SlO 1.07 6.97 98.8 441.73

Compatibilisation by the .....
6. 5 Rheological studies
The effect of shear stress on the viscosity of 90/10 PSINBR blends
containing SAN is shown in figure 6.13. It is seen from the figure that, at lower
shear rates, the viscosity of the compatibilised system is higher than that of the
uncompatibilised system due to higher interfacial adhesion. At high shear rates the
viscosity seems to be unaffected by compatibilisation .
0.9
0.8
__ 0.7 N
E .€ 0.6 E Z >- 0.5 ..... 'Vi 8 0.4 Cl) .:; .... 0.3 ro Q) ..c (f) 0.2
0.1
.. _.--- ._. -_ .. - ----···---l ---+--- P ro ............ P roS1
---A- ProS2
--T- ProSs -+-ProS1
0.0 ~-'-_.l--"""""_-'---'-_-L----L_-'----''--'-_~--' 0.0 0.1 0.2 0.3 0.4 0.5
S"ear stress (1'vPa)
Fig. 6.13: Effect ofshear stress on the melt viscosity of SAN compatibilised
PSINBR blends
Figure 6.14 depicts the variation of shear viscosity as a function of
compatibiliser concentration. It can be seen that at higher shear rates the melt
viscosity of the PSINBR blend does not vary with the addition of SAN. So the
181

-Chapter 6
modified blend can be effectively melt processed by selecting the appropriate shear
rate.
0.5
0.1
----11
1-- ---·---1 . Shear rate (s·') I I - -- 666.6--* - 1333
1 1 -A - 2666 ---...- 6666 - .. - ----.---~ .. --------------
_--A _----A-----
,. __ .,.--,.-- .-----'f'-------.--..,.
o 2 4 6 8 10
Wt%ofSAN
Fig.6.J4: Effect of compatibiliser concentration on the melt viscosity of SAN
compatibilised PSINBR blends
The die-swell behaviour of the compatibilised blends is presented in
figure 6.15. Compatibilisation ofthe blend decreases the die-swell.
182

0
~ .... co ?:: If)
(])
0
Compatihilisation by the .....
--------------------l 2_1 ~
~_~r--------------.---~--T I 2.0
1.9
1.8
1.7
1.6
1.5
1.4
1.3
1.2
A--- A I - ... ,
------*----.----------------~ •
o 2 4
Shear rate (S-l) ---13.3----.- 666.6
6 8
Wt%ofSAN
10
I I
Fig. 6.15: Effect of compatibiliser (SAN) loading on tile die-swell values of
PSINBR blends
6.6 Conclusion
Owing to the poor interfacial adhesion and bigger particle size of the
dispersed phase, PS/NBR blends have poor mechanical properties. The effect of
compatibilisation with SAN on the mechanical properties, morphology, dynamic
mechanical properties, melt rheology and thermal properties of PSINBR blends
was studied. The incorporation of SAN is effective in changing the particle size of
NBR in PSINBR blends. The compatibiJised 90/10 blend of PSINBR containing
5wt% SAN showed an improvement in impact stren!,>th and is transformed into
super-tough material. Rheological studies revealed that at higher shear rates the
melt viscosity of the PSINBR blend does not vary with the addition of SAN. So the
183

Chapter 6
modified blend can be effectively melt processed by selecting the appropriate shear
rate. Thermogravimetric analysis showed that there was no appreciable increase
thermal stability of compatibilised blends. The overall improvement in properties
suggests that random SAN copolymer can be used as an effective compatibiliser in
nitrile rubber toughened polystyrene.
References
1. A.K. Bhowmick, H.L. Stephens, Handbook of Elastomers: New Developments
and Technology, Ch. 5, Marcel Dekker, New York, (1988).
2. B.M. Walker, Handbook of Thermoplastic Elastomers, Ch. 1, Van Nostrand
Reinhold, New York, (1979).
3. L.A. Utraki, Polymer Alloys and Blends, Munich, Hanser, (1989).
4. D.R. Paul and S. Newman, Eds., Polymer Blends, Academic press, New York,
(1978).
5. G.E. Molau, J Polym Sci., AJ, 4235 (1965).
6. G.E. Molau, J Polym Sci., B3, 1007 (1965).
7. G. Riess, J. Kohler, C. Turnout, A. Banderet, Makromol ehem., 101, 58 (1967).
8. R. Fayt, R. Jerome, P. Teyssie, Polym. Eng. Sci., 27, 328 (1987).
9. R. Fayt, R. Jerome, P. Teyssie, J. Polym. Sci., Polym. Phys. Ed., 20, 2209
(1982).
10. S. Thomas, R.E. Prud'homme, Polymer, 33, 4260 (1992).
11. L. Leibler, Makromol chem .. Macromol. Symp., 16, 17 (1985).
12. L. Leibler, Macromolecules, 15, 1283 (1982).
13. J. Noolandi, K.M. Hong, Macromolecules, 15,482 (1982).
14. J. Noolandi, K.M. Hong, Macromolecules, 17, 1531 (1984).
15. R. Asaletha, M.G. Kumaran, S. Thomas, Rubber Chem. Technol., 68, 671
(1995).
16. Z. Oommen, M.R. Gopinathan Nair, S. Thomas, Polym. Eng. Sei., 36, 1
(1996).
184

Compatibilisation by the .. ...
17. J. George, R. Joseph, K.T. Varughese, S. Thomas, J. Appl .Polym. Sci., 57,449
(1995).
18. S. George, R. Joseph, K.T. Varughese, S. Thomas, Polymer, 36, 4405 (1995).
19. M. Mathew, S. Thomas, Polymer, 44, 1295 (2003).
20. A.P. Plochocki, S.S. Dagli, R.D. Andrews, Polym. Eng. Sei., 30, 741 (1990).
21. B. Majumdar, H. Keskkula, D.R. Paul, Polymer, 35, 5453 (1994).
22. B. Majumdar, H. Keskkula, D.R. Paul, Polymer, 35, 5468 (1994).
185

Chapter 7
Conclusion
The blend system discussed in this thesis based on a commodity non polar
plastic polystyrene and a speciality polar rubber like NBR. Several methods for
incorporating rubber into PS matrix are known. This research work explores the
preparation of an ABS type toughened thennoplastic by melt blending polystyrene
with powdered NBR. In the present study, investigations on the various properties
of binary and compatibilised blends were carried out in a systematic manner.
The mechanical properties, morphology, dynamic mechanical properties,
melt rheology and thennogravimetric analysis of both uncrosslinked and partially
crossJinked powdered nitrile rubber toughened polystyrene have been studied with
reference to the effect of blend ratio. The optimum concentration of powdered
NBR required for maximum toughening of polystyrene was found to be 10 wt%.
The processability characteristics analysed from the torque-time graphs of various
blends showed that the viscosity ofPSINBR blends increases with increase in NBR
content and blends with crosslinked NBR registered higher torque than blends with
uncrosslinked NBR. The morphology of the blends indicated a two phase structure
in which the rubber phase is dispersed as discrete particles in the continuous PS
matrix and the size of the domains increases with increase in rubber content. The
mechanical properties of the blends are found to be strongly influenced by blend
ratio. The tensile streDb>1:h, Young's modulus, tlexural strength and flexural
modulus of the blends decreased with increase in rubber content. The elongation at

break and Izod impact strength (unnotched) increased with the addition of NBR
up to 10 wt% NBR and thereafter no considerable change was noticed. The
mechanical properties of the blends with crosslinked NBR showed higher values
than blends with uncrosslinked NBR. This is attributed to the presence of
crosslinked rubber particles.
Dynamic crosslinking of powdered nitrile rubber toughened polystyrene
was carried out with dicumyl peroxide as the crosslinking agent. Dynamic
cross linking results an increase in the mixing torque due to the crosslinking of the
dispersed domains. As the DCP content increases, the crosslink density also
increases as observed from the increase in Vr values. Significant morphology
transformation occurred as a result of dynamic crosslinking. In crosslinked blends,
particle size of the rubber decreases with increase in weight percentage of the DCP.
In the present study 1.5 phr DCP was found to be optimum, since it resulted in
large number of finely dispersed rubber particles. Mechanical properties such as
impact strength, tensile strength, Young's modulus, elongation at break show
enhancement on dynamic crosslinking.
The addition of maleic anhydride modified polystyrene and
phenolic modified polystyrene was shown to have compatibilising effects on nitrile
rubber toughened polystyrene. Thus fine dispersed domains with narrow domain
size distribution were obtained as a result of compatibilisation. The dispersed phase
size decreases up to 5% MAPS and 2% PhPS concentrations, followed by a
levelling off indicating that interfacial- saturation occurred at these levels of the
compatibilisers. The increase in tensile strength, impact strenhrth, elongation at
break and Young's modulus with compatibiliser concentration indicates the
effectiveness of the compatibiJiser.
Compatibility of polystyrene (PS) and acrylonitrile-butadiene
rubber (NBR) is poor. Hence compatibilisation with brittle styrene-co-acrylonitrile
188

Conclusion
(SAN) was studied. The interfacial activity of SAN was studied as a function of
compatibiliser concentration. Incorporation of SAN is effective in reducing the
interfacial tension of PSINBR blends as observed from the mechanical properties.
The domain size of the dispersed phase decreases with the addition of the SAN
followed by levelling off at higher concentration. The study revealed that 5% SAN
is sufficient to dIeeti ve\y saturate the PSINBR interface. In optimally
compatibilised system, the presence of the copolymer layer between the aggregated
domains inhibits coalescence and narrows the particle size distribution. The tensile
strength, Young's modulus, ultimate elongation and impact strength are improved
by the addition of SAN copolymer. The overall improvement in properties suggests
that SAN copolymer can be used as an effective compatibiliser in PSINBR blends.
The effect of the blend composition and compatibilisation on the dynamic
mechanical properties was investigated in the temperature range +35 to + 120 nC.
As the concentration of the rubber increases, the storage modulus of the system
decreases. The loss modulus and tan 0 of 90/10 blend of PSINBR and 90/10 blend
of PS/XNBR are lower than that of pure polystyrene. Compatibilisation with
maleic anhydride modified polystyrene, phenolic modified polystyrene, styrene co
acrylonitrile and by dynamic vulcanisation with DCP significantly reduced the
damping peak values indicating enhanced interaction between the constituents.
The melt rheological behaviour of PSINBR blends has been investigated.
The blends showed pseudoplastic nature which is indicated by the decrease in
viscosity with shear rate. The viscosity of these blends increased with increase in
NBR concentration. The compatibiJisation of these blends with maleic anhydride
modified polystyrene, phenolic modified polystyrene and by dynamic crosslinking
with DCP was found to increase the viscosity of the system indicating an increase
in interfacial adhesion. Flow curves of the compatibilised blends are basically
189

Chapter?
similar to that of PSINBR blends. The compatibilising action is evident from the
changes associated with compatibiliser incorporation. The important changes are
increase in mechanical properties, fineness of the morphology, slight increase in
blend viscosity and narrowing down of the particle size distribution. The
coalescence tendency of the blends is highly suppressed in compatibilised blends
which is a primary requirement for a good compatibiliser. It is seen that the
activation energy decreases on blending of PS with NBR. The activation energy
values are useful in choosing the temperature to be used during processing
operations such as injection moulding, calendaring and extrusion.
The thermal behaviour of PSINBR blends has been studied by
thermogravimetry. PSINBR blends are immiscible and incompatible. The
compatibility could be improved by the addition of suitable compatibilisers. The
effects of concentration of compatibiliser on the thermal properties were evaluated.
Addition of the compatibiliser improved the thermal stability. The initial
decomposition temperature increased with addition of compatibilisers. The weight
loss was found to decrease on the introduction of compatibilisers.
From the studies it can be concluded that by the addition of compatibilisers
in polystyrene/powdered NBR blends, an ABS equivalent material could be able to
prepare by melt blending technique.
Future scope of the work
);> Fabrication of useful proqucts.
~ Determination of compatibilising efficiency by interfacial characterisation
using methods like Small Angle X-ray Scattering (SAXS), Small Angle
Neutron Scattering (SANS) and ellipsometry.
~ Determination of extent of crosslinking using NMR spectroscopy.
~ Measurement of free volume to assess the compatibilising action. 190

ERRATA
(In the text pages only)
Page Line For Read
30 10 Yu-Der Lee et (If Lee and Chen
47 19 Tangboriboonrat et al Tangboriboonrat and
Tiypiboonchaiya
48 9 M.Mathcw et (If Mathew and Thomas
49 11 S.Shaw et at Shaw and Singh
68 25,26 toughness tensile toughness
74 15 Thomas et af Thomas and Groeninck'C
74 25 Karger-Koscis et al Karger-Koscis and Csibi
74 26 Schreiber et al Schreiber and Olguin
74 26 Laopkij charoen et al Laopkijcharoen and Coran
76 5 Mehrabzadeh et al Mehrabzadeh and Buford
77 7 Grassie et al Grassie
77 10 Varughese et al Varughcse
84 11 static cooling cooling
134 3 De Roover et at De Roover

ABS
ASTM
CMC
CPE
d
OCP
EPDM
EPM
ENR
EVA
FTIR
GMA
HDPE
HIPS
HPB
kton
LOPE
MA
MAPS
min.
MW
NBR
NMR
List of abbreviations
Acrylonitrile-Butadiene-Styrene
American Society for Testing and Materials
Critical Micelle Concentration
Chlorinated Polyethylene
Average Diameter of rubber particles
Dicumyl Peroxide
Ethylene Propylene Diene Rubber
Ethylene Propylene Rubber
Epoxidised Natural Rubber
Ethylene Vinyl Acetate
Fourier Transfonn Infrared Spectroscopy
Glycidyl Methacrylate
High Density Polyethylene
High Impact PolystYTene
Hydrogenated Polybutadiene
Kiloton
Low Density Polyethylene
Maleic Anhydride
Maleic Anhydride modified polystyrene
minutes
Molecular Weight
Acrylonitrile Butadiene Rubber (Nitrile rubber)
Nuclear Magnetic Resonance

NR Natural Rubber
OM Optical Microscopy
PA6 Nylon 6
PA66 Nylon 66
PA 11 Nylon 11
PAMXD Poly (m-xylene adipamide)
PB Polybutadiene
PBT Polybutylene Terephthalate
PC Polycarbonate
PCHMA Poly (cyclohexyl methacrylate)
PCL Polycaprolactone
PE Polyethylene
PEC Polyethylene Chlorinates
PECn Polyepichlorohydrin
PET Polyethylene Terephthalate
PhPS Phenolic modi tied polystyrene
phr parts per hundred rubber
PMMA PoJymethyl Methacrylate
PP Polypropylene
PPE Polyphenylene Ether
PPO Polyphenylene Oxide
PPSQ Polyphenyl silsesquioxane
PS Polystyrene
PS-Ox Oxazoline functionalised Polystyrene

PVC
PVDF
RT-PVC
RVNR
Saran
SAN
SANS
SAXS
SBR
SBS
SEBS
SEM
SEP
SMA
sPMMA
S
TEM
Tg
TMPTA
TPE
TPV
UTM
Vr
XNBR
Polyvinyl Chloride
Polyvinylidene Fluoride
Rubber Toughened Polyvinyl Chloride
Radiation Vulcanised Natural Rubber
Polyvinylidine chloride
Styrene-co-Acrylonitrile
Small Angle Neutron Scattering
Small Angle X-ray Scattering
Styrene Butadiene Rubber
Styrene-Butadiene-S tyrene
Styrene Ethylene Butylene Styrene
Scanning Electron Microscopy
Styrene Ethylene Propylene
Styrene Maleic Anhydride
Syndiotactic Polymethyl Methacrylate
Styrene
Transmission Electron Microscopy
Glass transition temperature
Trimethylol Propane Triacrylate
Thermoplastic Elastomer
Thermoplastic Vulcanisate
Universal Testing Machine
Extent of cross linking
Crosslinked Nitrile Rubber

Yw
tan 0
TJ
T]d
T]m
e
JlIl1
Pr
ps
a
IjI
X
List of symbols
shear rate
loss tangent
shear viscosity
dispersed phase viscosity
matrix viscosity
angle
micrometer
density of rubber
density of solvent
interfacial tension
shear stress
interfacial tension
mean stress
concentration of rubber
volume fraction
bulk volume fraction
void content
Flory-Huggins parameter

List of Publications
1. P.V. Sreenivasan and Philip Kurian, Mechanical properties and morphology
of powdered nitrile rubber toughened polystyrene. international Journal of
Polymeric Materials. Vol. 56, 2007, 1041·1050.
2. P.V. Sreenivasan and Philip Kurian, Effect of dynamic vulcanisation on the
mechanical properties and morphology of powdered nitrile rubber toughened
polystyrene. Polym. Plast. Technol. Eng. (In press)
3. P.V. Sreenivasan and Phi lip Kurian, Morphology, mechanical properties and
compatibilisation of rubber toughened plastics from polystyrene and powdered
nitrile rubber. J Appl. Polym. Sci. (communicated)
4. P.V. Sreenivasan and Philip Kurian, The effect of blend ratio, reactive
compatibilisation and dynamic crosslinking on the melt rheology and
morphology of powdered nitrile rubber toughened polystyrene. Polymer
(communicated)
5. P.V. Sreenivasan and Philip Kurian, Dynamic mechanical properties of
powdered nitrile rubber toughened polystyrene. The effect of blend ratio,
reactive compatibilisation and dynamic vulcanisation: international Journal of
Polymeric Materials. (communicated)
CONFERENCE PAPERS
1. P.V. Sreenivasan and Philip Kurian, Toughening of Polystyrene with
Powdered NBR presented at the International Conference on Advances in
Polymer blends, Composites, IPNs and Gels: Macro to Nanoscales ICBC
2005. School of Chemical Sciences, Mahatma Gandhi University, Kottayam,
21·23 March 2005

2. P.V. Sreenivasan and Phi1ip Kurian, Effect 0/ dynamic vulcanisation on the
mechanical properties and morphology 0/ powdered nitrile rubber
toughened polystyrene. 18th Kerala Science Congress, Thiruvananthapuram,
29-31 January 2006.
3. P.V. Sreenivasan and Philip Kurian, Reactive Compatibilisation o/Powdered
Nitrile Rubber Toughened Polystyrene with Dimethylol Phenolic Resin
presented at the National seminar on Frontiers in Organic Chemistry
(FOCY 2007) Dept of Chemistry, University of Calicut, Kozhikode, 11-12
January 2007
4. P.V. Sreenivasan and Philip Kurian, Effect of Compatibilisation on the
mechanical properties and morphology of nitrile rubber toughened
polystyrene: 19th Kerala Science Congress, Kannur, 29-31 January 2007.